from reef to table: social and ecological factors affecting coral reef fisheries, artisanal seafood...
TRANSCRIPT

RESEARCH ARTICLE
From Reef to Table: Social and EcologicalFactors Affecting Coral Reef Fisheries,Artisanal Seafood Supply Chains, andSeafood SecurityJohn N. Kittinger1,2*, Lida T. Teneva1, Haruko Koike3, Kostantinos A. Stamoulis3, DanielaS. Kittinger2, Kirsten L. L. Oleson4, Eric Conklin5, Mahana Gomes6, Bart Wilcox6, AlanM. Friedlander3,7
1 Conservation International, Betty and Gordon Moore Center for Science and Oceans, 7192 Kalaniana‘oleHwy, Honolulu, Hawaii, United States of America, 2 Center for Ocean Solutions, Stanford University,StanfordWoods Institute for the Environment, 99 Pacific Street, Monterey, California, United States ofAmerica, 3 Fisheries Ecology Research Lab, Department of Biology, University of Hawai‘i at Mānoa,Honolulu, Hawaii, United States of America, 4 Department of Natural Resources and EnvironmentalManagement, University of Hawai‘i at Mānoa, Honolulu, Hawaii, United States of America, 5 The NatureConservancy of Hawai‘i, 923 Nu‘uanu Avenue, Honolulu, Hawaii, United States of America, 6 Hui AlohaKīholo, Kīholo Bay, Hawaii, United States of America, 7 Pristine Seas, National Geographic Society,Washington, District of Columbia, United States of America
AbstractOcean and coastal ecosystems provide critical fisheries, coastal protection, and cultural
benefits to communities worldwide, but these services are diminishing due to local and
global threats. In response, place-based strategies involve communities and resource
users in management have proliferated. Here, we present a transferable community-based
approach to assess the social and ecological factors affecting resource sustainability and
food security in a small-scale, coral reef fishery. Our results show that this small-scale fish-
ery provides large-scale benefits to communities, including 7,353 ± 1547 kg yr-1 (mean ±
SE) of seafood per year, equating to >30,000 meals with an economic value of $78,432.
The vast majority of the catch is used for subsistence, contributing to community food secu-
rity: 58% is kept, 33.5% is given away, and 8.5% is sold. Our spatial analysis assesses the
geographic distribution of community beneficiaries from the fishery (the “food shed” for the
fishery), and we document that 20% of seafood procured from the fishery is used for socio-
cultural events that are important for social cohesion. This approach provides a method for
assessing social, economic, and cultural values provided by small-scale food systems, as
well as important contributions to food security, with significant implications for conservation
and management. This interdisciplinary effort aims to demonstrate a transferable participa-
tory research approach useful for resource-dependent communities as they cope with
socioeconomic, cultural, and environmental change.
PLOS ONE | DOI:10.1371/journal.pone.0123856 August 5, 2015 1 / 24
OPEN ACCESS
Citation: Kittinger JN, Teneva LT, Koike H, StamoulisKA, Kittinger DS, Oleson KLL, et al. (2015) FromReef to Table: Social and Ecological Factors AffectingCoral Reef Fisheries, Artisanal Seafood SupplyChains, and Seafood Security. PLoS ONE 10(8):e0123856. doi:10.1371/journal.pone.0123856
Editor: Konstantinos I Stergiou, Aristotle University ofThessaloniki, GREECE
Received: November 9, 2014
Accepted: May 29, 2015
Published: August 5, 2015
Copyright: © 2015 Kittinger et al. This is an openaccess article distributed under the terms of theCreative Commons Attribution License, which permitsunrestricted use, distribution, and reproduction in anymedium, provided the original author and source arecredited.
Data Availability Statement: The data are containedin the paper and supplementary materials.
Funding: Partial support for the work was providedby NSF grant OCE 1325874. In addition, thisresearch was supported by grants from ConservationInternational’s Hawai‘i program to the Hui AlohaKīholo program, and from the National Oceanic andAtmospheric Administration Coral Reef ConservationProgram, as administered by the Office of Ocean andCoastal Resource Management, to The NatureConservancy (NA14NOS4820095). The funders(Conservation International - Hawai‘i) had a role in
IntroductionCoral reef fisheries provide critical livelihoods and food that support coastal communities andeconomies for millions worldwide [1–3]. However, reefs continue to decline due to the com-bined impacts from pollution, overfishing, climate change, introduction of invasive species,and other stressors [4–6]. These threats undermine the economic, social, and cultural benefitsprovided by coral reef fisheries, including important food security functions, cultural practices,and livelihoods [7,8].
In the Asia-Pacific region, increased globalization and socioeconomic development is shift-ing the modes of resource use in traditional fisheries, with implications for human wellbeing,livelihoods, and conservation [9–12]. In reef fisheries, a complex and poorly understood set ofsocial, cultural, and economic factors affect the supply, value, and networks of trade that influ-ence subsistence use, as well as commercial harvest. The processes, markets, and actorsinvolved in seafood value and supply chains are gaining increased attention from scholars andpractitioners working in a wide variety of locations [13–16].
The complex dynamics of subsistence, commercial, and cultural use need to be understood,particularly as market-based solutions and supply chain interventions continue to gainmomentum in the conservation community. As conservation practitioners increasingly seek toimplement such strategies, data limitations can preclude the development of viable solutionsintended to increase environmental sustainability and secure social benefits [17–20]. For exam-ple, in most coral reefs little is known about the fishing effort and total production [20,21], thesupply chain actors and processes that influence markets [14,22], or the diverse values thatfisheries provide to local communities and economic markets [23–27]. Further, most tropicalcountries have limited capacity to monitor, assess, and manage coral reef fisheries [15,28–30].
These gaps in knowledge and capacity impede the development of viable managementapproaches that seek to promote effective governance and the sustainable flow of benefits fromfisheries to resource-dependent communities and markets. As such, there is an immediate needto develop practical approaches to assess both ecological and social dimensions of these fisheriesto support culturally appropriate conservation and sustainable development strategies. Here, wepresent a participatory, community-based method to assess the ecological and social dynamicsof a small-scale fishery, using a social-ecological systems approach. Our objectives for this studywere to assess the primary factors that influence community food security, including ecologicalfactors (standing stock biomass, habitat distribution) as well as social factors (fishery productionmodes, distribution of seafood, cultural drivers). We also sought to assess the diverse social, eco-nomic, and cultural values associated with this small-scale fishery in order to establish a baselineand targets for future management to sustain these benefits through community-based manage-ment. Our overarching goal is to develop a transferable community-based approach that can aidpractitioners, researchers, and managers to increase the effectiveness of natural resource man-agement in the face of socioeconomic, cultural, and environmental change.
MethodsOur research program was developed through a participatory process with community part-ners. Participatory research describes a suite of approaches that involve researchers, conserva-tion practitioners, and community members working collaboratively in the visioning, goal-setting, design, data-gathering, and assessment phases of research [31]. Such approaches havebeen shown to yield valid data that are useful for community planning and management [32–34]. In contexts where the research is directed towards a community-based planning effort,such approaches can ensure that research products directly address community needs andinform their planning and management efforts.
From Reef to Table: Seafood and a Coral Reef Fishery
PLOS ONE | DOI:10.1371/journal.pone.0123856 August 5, 2015 2 / 24
designing the study, collecting the data andperforming the data analysis.
Competing Interests: The authors have declaredthat no competing interests exist.

This research focuses on Kīholo Bay (19° 51’ 36.41” N, 155° 55’ 59.25”W), a 2.6 km2 coastalembayment on the arid leeward side of Hawai‘i Island, with most of the land fronting the bayencompassed in a state park (Fig 1). There is a single access point for vehicles to the state park,as well as a footpath for access from the main road. Kīholo Bay has a rich natural and culturalhistory, including a well-developed Hawaiian fishpond (loko i‘a) complex. The West Hawaiiregion encompasses the West Hawai‘i Regional Fishery Management Area (WHRFMA), whichis managed by the State of Hawai‘i’s Department of Land and Natural Resources (DLNR), Divi-sion of Aquatic Resources (DAR). The WHRFMA has specific rules that apply to the entireregion, including prohibitions on take of several species including rays and sharks, bans onspearfishing with scuba, restrictions on aquarium species harvest and collection permitrequirements, and specific gear restrictions for nets [35]. In addition to these rules, the regionalso has several marine managed area designations in which specific rules apply. These includeMarine Life Conservation Districts (MLCDs), which are marine protected areas that restrictmost harvesting activities, Fishing Replenishment Areas (FRAs), which restrict harvesting ofmost aquarium species, and Fisheries Management Areas (FMAs), which have specific rulesthat vary by place. Kīholo Bay is designated as a FMA, and in addition to the general rules thatapply under the WHRFMA, fish feeding and the use of gill nets are also prohibited [36].
This research presented here derives from a collaborative effort among Hui Aloha Kīholo, acommunity-based group dedicated to caring for Kīholo Bay, environmental non-profits (Con-servation International’s Hawai‘i program and The Nature Conservancy of Hawai‘i), and theUniversity of Hawai‘i at Mānoa. Below, we provide more detail on methods for specific researchactivities; additional information is available in the supporting online materials (SOM).
Fig 1. Kīholo Bay study area, including spatial delineation of sampling area for creel and fish flowsurveys (orange outline) and locations of transects for ecological surveys of reef fish. Backgroundimagery shows the spatial configuration of the bay and the reef complex, and inset shows the location in theHawaiian Islands.
doi:10.1371/journal.pone.0123856.g001
From Reef to Table: Seafood and a Coral Reef Fishery
PLOS ONE | DOI:10.1371/journal.pone.0123856 August 5, 2015 3 / 24

Ecological surveysReef fish assemblages were assessed in October 2012 at 112 locations within Kīholo Bay (Fig 1)using standard underwater visual belt transect survey methods [37–39]. Surveys were located onhard bottom habitat and were randomly stratified by benthic habitat (e.g., aggregated reef, pave-ment with sand channels, rock/boulder [40]), proportional to area present. Two divers swamparallel 25 x 5 m transects at a constant speed and identified to the lowest possible taxon all fishesvisible within 2.5 m to either side of the centerline (125-m2 transect area). Swimming durationvaried from 10–15 min, depending on habitat complexity and fish abundance. Total length (TL)of fishes was estimated to the nearest 5 cm and converted to weight using a length–mass relation-ship, W = aTLb, where the parameters a and b are constants for the allometric growth equation,TL is total length in cm, andW is mass in grams. Species-specific values for a and b constantswere obtained from fishbase.org and from additional sources from site-based research (A. Fried-lander, unpublished data). Paired transect values were averaged at each location.
Ecological surveys allowed us to characterize the reef fish assemblage in a spatial “seascape”approach, using data from in situ transects coupled with benthic habitat maps that delineatedhabitat structure and cover [40]. This approach allowed us to characterize fish biomass esti-mates across different habitat types that were surveyed. These results were developed specifi-cally for community use in management, and are considered proprietary information as theycontain sensitive information about the species assemblage, habitats, and locations of key fish-eries resources in Kīholo Bay.
An estimate of standing stock for fisheries resources, i.e., expanded biomass, was calculatedas the average biomass density for each habitat structure category multiplied by the total areaof that habitat in Kīholo Bay. We compared the average biomass of resource species (i.e., spe-cies targeted in the fishery) at Kīholo Bay with resource fish biomass at several reference sitesincluding: (1) the Northwestern Hawaiian Islands (NWHI)–a remote no-take marine reserveprotected as the Papahānaumokuākea Marine National Monument, which is considered anintact and healthy reef ecosystem [41]; (2) Kaho‘olawe—an unfished island in the main Hawai-ian Islands protected as part of the Kaho‘olawe Island Reserve (KIR); (3) a set of marine pro-tected areas in the West Hawai‘i region primarily comprised of well-managed Marine LifeConservation Districts (MLCDs), where fishing is restricted [35] (for a complete list of sitesincluded in this category, see S1 Table); and, (4) areas open to fishing in West Hawai‘i (i.e., out-side of the Kīholo FMA but subject to general rules and regulations under the WHRFMA). Ref-erence site data for resource fish biomass was calculated using the database of Hawai‘i reef fishsurveys compiled by the Fisheries Ecology Research Lab at University of Hawai‘i-Mānoa. Weused analysis of variance (ANOVA) followed by Tukey HSD multiple comparison test to deter-mine if differences in biomass between sites were statistically significant.
Creel and fish flow surveysWe developed a dual component creel and fish flow survey to estimate fishing effort, catch,and post-landings disposition and distribution of seafood (“fish flow”). Fisheries creel sur-veys (or ‘pakini’, in Hawaiian) are sampling surveys that target catch, gear type, and fishingeffort information from fishers. These data are used to estimate the total catch and effort forthat fishery (commercial and non-commercial) and help inform harvest management strate-gies [42]. Creel surveys are time- and labor-intensive [43,44], but are the most accuratemethod available for quantitative assessments for data-poor fisheries. Additionally, thismethod provides opportunities for surveyors to interact with the fishing community on apersonal basis, engaging in dialogue with fishers, and providing opportunities to educate thepublic on management issues [45].
From Reef to Table: Seafood and a Coral Reef Fishery
PLOS ONE | DOI:10.1371/journal.pone.0123856 August 5, 2015 4 / 24
Our creel survey used a temporally and spatially stratified random sample (see S2 and S3Tables for surveys forms), coupling remote visual observation of fishing activities (location,gear types, frequency) with intercept surveys of fishers to collect data on catch composition,size, and weight, following previously used methods [18,46]. For remote observations, commu-nity volunteers conducted dawn-to-dusk surveys for 2–3 weekdays and 2–3 weekend days permonth (4–6 total person-days per month) using a high-powered scope and binoculars torecord spatial and temporal fishing patterns and gear types used, which together comprise fish-ing effort.
The observation portion of the survey was paired with an intercept survey. Community sur-veyors approached fishers exiting the area and conducted intercept surveys to gather informa-tion from individual fishers on catch, gear, and fish flow. The fish flow (or ‘mahele’) surveycomponent targeted information on catch (size, number, total weight), as well as the disposi-tion or end use of seafood, including the geographical location of any recipient(s) of the catch,and disposition categories: 1) kept (for home consumption), 2) given away (for home con-sumption), 3) sold (or bartered), and 4) released. Additionally, respondents indicated if thecatch or some proportion of the catch were to be used specifically for social or cultural events(pā‘ina). Our complete creel and fish flow survey instrument are in S2 and S3 Tables.
The observations and intercept surveys were conducted for a 1-year period (1 May 2012–30April 2013), allowing us to assess the total annual catch and differentiate patterns in fishingintensity and activities [18]. This survey method captures shore-based fishing effort and catch,but records of boat-based activities are limited to effort only (see our section below on caveatsto this method).
Catch data were aggregated by trophic group (i.e., apex predators, secondary consumers,herbivores, planktivores, and ‘other’, which included invertebrates). Fish flow survey data wereanalyzed by disposition category (i.e., kept, given away, sold), weight, number of recordedevents, and geographical location. We also performed a spatial analysis to assess the spatialdynamics of seafood distribution in relation to the fishery, by estimating how much of the sea-food once caught stayed within a 25-, 50, and 75-km radius from Kīholo Bay.
Analytical methodsWe estimated total fishing effort for Kīholo Bay by quantifying the total daytime fishing hoursfor each gear type (e.g., spear, thrownet, line) observed in each survey, for each quarter of theyear. The total fishing effort was then calculated by multiplying the mean daily fishing effort bythe total number of days for each quarter (S4 and S5 Tables). Catch per unit effort (CPUE) foreach gear type was calculated by 1) summing (for all days in each quarter) the result of the divi-sion of catch for each fisher on a given day by the corresponding fishing effort by that fisherwith that gear type on that day, and then 2) dividing by the sum of the number of fishers whowere interviewed during that quarter. Using the quarterly CPUE then allowed us to estimatethe average catch per day per gear type for each quarter (S6 Table). Total catch was estimatedas a product of the total fishing effort and CPUE for each gear type by each quarter (S7 Table).To calculate the total expanded catch for the year, we then summed the catch for each quarter.For error estimation on the total expanded catch, refer to S1 Dataset).
Species level composition of catch for each gear type was calculated by multiplying the spe-cies’ proportion in the recorded catch to the corresponding gear’s expanded catch. We reportthe total expanded catch by fishing method and trophic level.
To estimate the total economic value of the fishery per year, we used the species-level esti-mate of total reconstructed catch along with species-specific price data collected from local fishmarkets on the island of O‘ahu. Fisheries markets were surveyed for 38 days (22 weekdays, 16
From Reef to Table: Seafood and a Coral Reef Fishery
PLOS ONE | DOI:10.1371/journal.pone.0123856 August 5, 2015 5 / 24
weekends including the major holidays—Thanksgiving, Christmas and New Year's Day) over14 months between November 2012 to December 2013 (The Nature Conservancy of Hawai‘i,unpublished data). Other research shows that market prices for reef species an vary slightlyfrom island to island [47], and there was a notable range, spanning more than $10 in per-pound prices for different species. Nonetheless, as these Oahu-based surveys recorded the listedprice for every reef fish species available in local markets, this database provided the most accu-rate information available to approximate the market value of the Kīholo fishery.
To estimate the food provisioning value provided by the fishery, we converted total weightfor whole fish to edible weight using species-specific estimates provided by local fishermen (S8Table). We then used an average portion size of 6 ounces (0.17 kg; or the amount typicallyserved in a restaurant) and the total edible weight of the fishery to derive the total number ofmeals provided by the fishery. We also estimated the nutritional benefit of fish-derived omega-3 fatty acid consumption via this fishery by using an American Heart Association’s (AHA) rec-ommended 6 ounces of fish per week [48]. All data for figures and tables in this study is publi-cally available at S2 Dataset.
Caveats of this MethodWe developed this participatory method in order to create an adaptable and transferableapproach that other conservation practitioners, managers, or resource users could apply tolocal food systems. We highlight several caveats of this method, which may prove useful bothin interpreting our results, as well as adapting this approach to other geographies and contexts.First, we did not include substantial surveying at night, and because our survey design targetedshore-based fisheries, we also were unable to assess catch associated with boat-based fishingactivities. In our system, most of the effort in our coral reef and near-shore fishery derivedfrom shore-based activities, but in adapting this approach to other geographies the design andsampling strategy may need to be adjusted accordingly. Also, our survey probably underesti-mates commercial activities, because it relies on fishers voluntarily reporting and the interceptsurvey method may create social pressure to not report all sold catch as this can be perceived asless culturally acceptable than subsistence-oriented fishing.
Second, our method requires significant effort by community surveyors (multiple patroldays per month, over a 1-year period) as well as for the aggregation, quality control, and analy-sis of fishery data. Community surveyors dedicated significant time in the initiation of the proj-ect to socialize the project concept, intent, and design with the fishing community, andremained diligent in surveying activities, which was key to the project success. Similarly, a dedi-cated interdisciplinary team worked hand-in-hand with community members to analyze thedata at scales that were meaningful for the fishing community, and established protocols tosafeguard the dataset, which remains the intellectual property of the community organization.In order to reduce the effort required for data collection, quality control, and analysis, we arepiloting a mobile data portal and waterproof digital tablet for our survey forms (CI Hawai‘i’s#TEK+TECH project), which if successful will allow this approach to be less resource-intensiveand more scalable.
Results
Ecological profile of Kīholo BayKīholo Bay benthic habitats consists of rock/boulder (1.15 km2, 45%), followed by pavementwith sand channels (0.44 km2, 17%), aggregate reef (0.25 km2, 10%), and sand (0.71 km2, 28%)(Table 1). Rock/boulder had the highest expanded biomass due to its larger area (Table 1).Total standing stock of resource fishes in Kīholo Bay, calculated using benthic structure, was
From Reef to Table: Seafood and a Coral Reef Fishery
PLOS ONE | DOI:10.1371/journal.pone.0123856 August 5, 2015 6 / 24
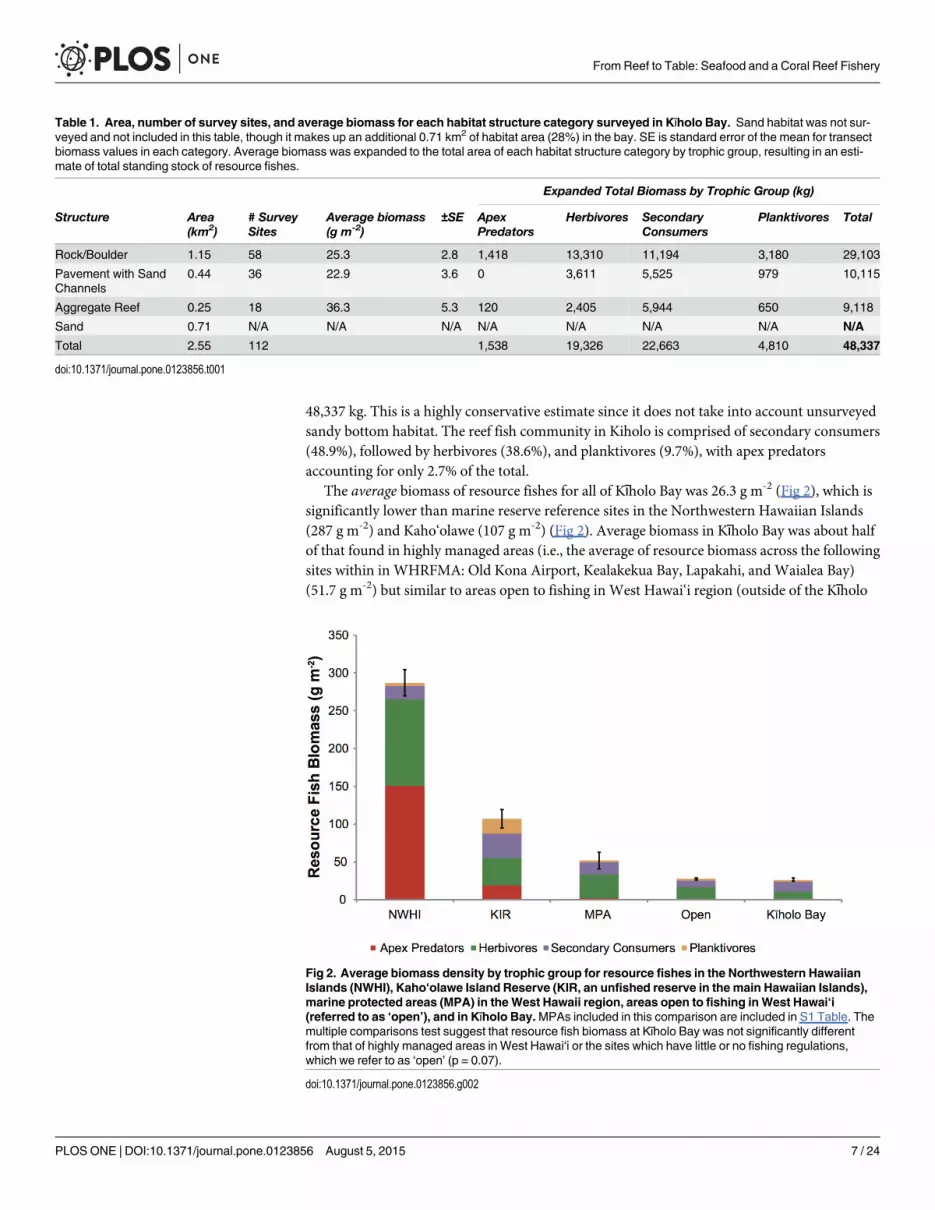
48,337 kg. This is a highly conservative estimate since it does not take into account unsurveyedsandy bottom habitat. The reef fish community in Kiholo is comprised of secondary consumers(48.9%), followed by herbivores (38.6%), and planktivores (9.7%), with apex predatorsaccounting for only 2.7% of the total.
The average biomass of resource fishes for all of Kīholo Bay was 26.3 g m-2 (Fig 2), which issignificantly lower than marine reserve reference sites in the Northwestern Hawaiian Islands(287 g m-2) and Kaho‘olawe (107 g m-2) (Fig 2). Average biomass in Kīholo Bay was about halfof that found in highly managed areas (i.e., the average of resource biomass across the followingsites within in WHRFMA: Old Kona Airport, Kealakekua Bay, Lapakahi, and Waialea Bay)(51.7 g m-2) but similar to areas open to fishing in West Hawai‘i region (outside of the Kīholo
Table 1. Area, number of survey sites, and average biomass for each habitat structure category surveyed in Kīholo Bay. Sand habitat was not sur-veyed and not included in this table, though it makes up an additional 0.71 km2 of habitat area (28%) in the bay. SE is standard error of the mean for transectbiomass values in each category. Average biomass was expanded to the total area of each habitat structure category by trophic group, resulting in an esti-mate of total standing stock of resource fishes.
Expanded Total Biomass by Trophic Group (kg)
Structure Area(km2)
# SurveySites
Average biomass(g m-2)
±SE ApexPredators
Herbivores SecondaryConsumers
Planktivores Total
Rock/Boulder 1.15 58 25.3 2.8 1,418 13,310 11,194 3,180 29,103
Pavement with SandChannels
0.44 36 22.9 3.6 0 3,611 5,525 979 10,115
Aggregate Reef 0.25 18 36.3 5.3 120 2,405 5,944 650 9,118
Sand 0.71 N/A N/A N/A N/A N/A N/A N/A N/A
Total 2.55 112 1,538 19,326 22,663 4,810 48,337
doi:10.1371/journal.pone.0123856.t001
Fig 2. Average biomass density by trophic group for resource fishes in the Northwestern HawaiianIslands (NWHI), Kaho‘olawe Island Reserve (KIR, an unfished reserve in the main Hawaiian Islands),marine protected areas (MPA) in theWest Hawaii region, areas open to fishing in West Hawai‘i(referred to as ‘open’), and in Kīholo Bay.MPAs included in this comparison are included in S1 Table. Themultiple comparisons test suggest that resource fish biomass at Kīholo Bay was not significantly differentfrom that of highly managed areas in West Hawai‘i or the sites which have little or no fishing regulations,which we refer to as ‘open’ (p = 0.07).
doi:10.1371/journal.pone.0123856.g002
From Reef to Table: Seafood and a Coral Reef Fishery
PLOS ONE | DOI:10.1371/journal.pone.0123856 August 5, 2015 7 / 24
FMA and the mentioned managed areas) (27.6 g m-2). The multiple comparisons test suggestthat resource fish biomass at Kīholo Bay was not significantly different from that of highlymanaged areas in West Hawai‘i or the sites which have little or no fishing regulations, whichwe refer to as ‘open’ (p = 0.07, Fig 2).
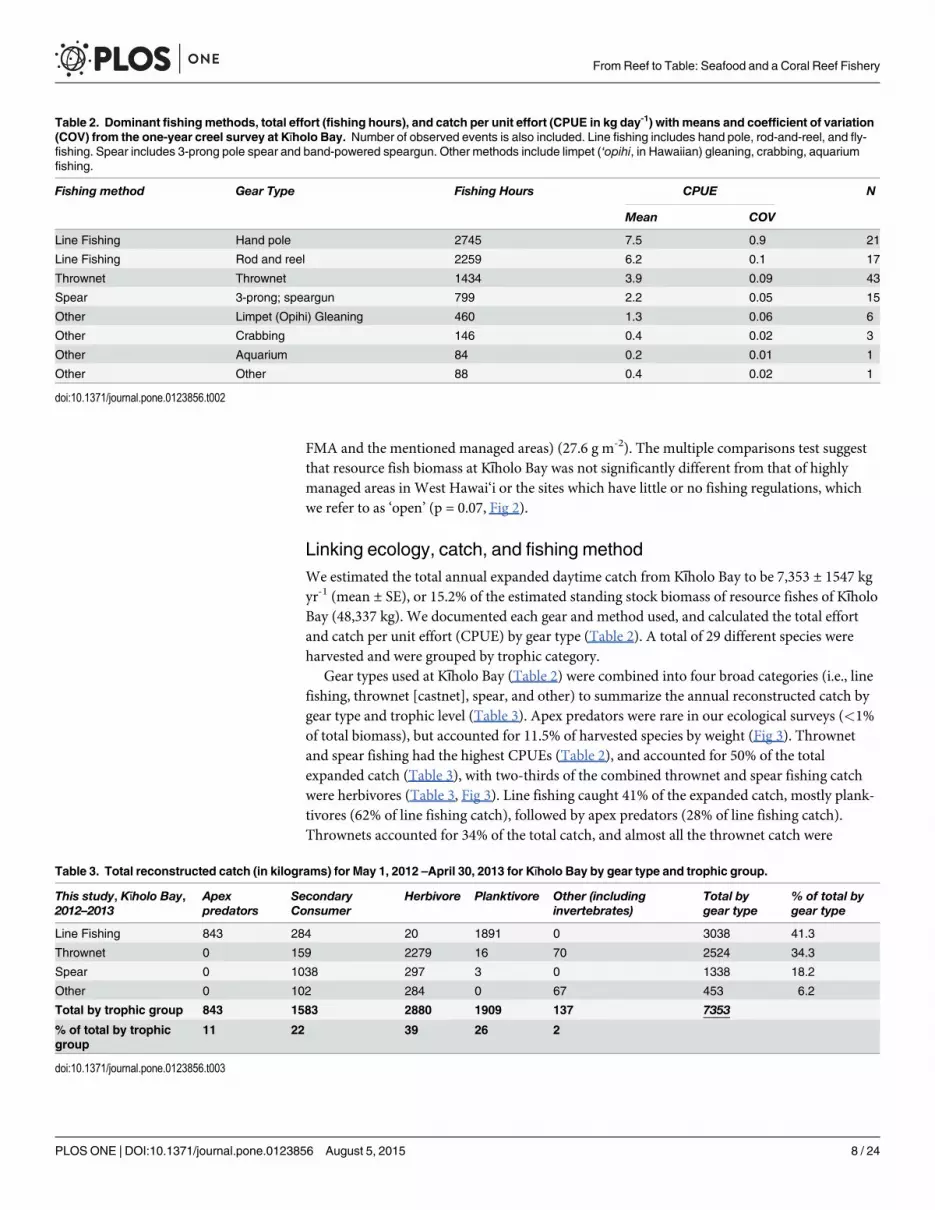
Linking ecology, catch, and fishing methodWe estimated the total annual expanded daytime catch from Kīholo Bay to be 7,353 ± 1547 kgyr-1 (mean ± SE), or 15.2% of the estimated standing stock biomass of resource fishes of KīholoBay (48,337 kg). We documented each gear and method used, and calculated the total effortand catch per unit effort (CPUE) by gear type (Table 2). A total of 29 different species wereharvested and were grouped by trophic category.
Gear types used at Kīholo Bay (Table 2) were combined into four broad categories (i.e., linefishing, thrownet [castnet], spear, and other) to summarize the annual reconstructed catch bygear type and trophic level (Table 3). Apex predators were rare in our ecological surveys (<1%of total biomass), but accounted for 11.5% of harvested species by weight (Fig 3). Thrownetand spear fishing had the highest CPUEs (Table 2), and accounted for 50% of the totalexpanded catch (Table 3), with two-thirds of the combined thrownet and spear fishing catchwere herbivores (Table 3, Fig 3). Line fishing caught 41% of the expanded catch, mostly plank-tivores (62% of line fishing catch), followed by apex predators (28% of line fishing catch).Thrownets accounted for 34% of the total catch, and almost all the thrownet catch were
Table 2. Dominant fishingmethods, total effort (fishing hours), and catch per unit effort (CPUE in kg day-1) with means and coefficient of variation(COV) from the one-year creel survey at Kīholo Bay. Number of observed events is also included. Line fishing includes hand pole, rod-and-reel, and fly-fishing. Spear includes 3-prong pole spear and band-powered speargun. Other methods include limpet (‘opihi, in Hawaiian) gleaning, crabbing, aquariumfishing.
Fishing method Gear Type Fishing Hours CPUE N
Mean COV
Line Fishing Hand pole 2745 7.5 0.9 21
Line Fishing Rod and reel 2259 6.2 0.1 17
Thrownet Thrownet 1434 3.9 0.09 43
Spear 3-prong; speargun 799 2.2 0.05 15
Other Limpet (Opihi) Gleaning 460 1.3 0.06 6
Other Crabbing 146 0.4 0.02 3
Other Aquarium 84 0.2 0.01 1
Other Other 88 0.4 0.02 1
doi:10.1371/journal.pone.0123856.t002
Table 3. Total reconstructed catch (in kilograms) for May 1, 2012 –April 30, 2013 for Kīholo Bay by gear type and trophic group.
This study, Kīholo Bay,2012–2013
Apexpredators
SecondaryConsumer
Herbivore Planktivore Other (includinginvertebrates)
Total bygear type
% of total bygear type
Line Fishing 843 284 20 1891 0 3038 41.3
Thrownet 0 159 2279 16 70 2524 34.3
Spear 0 1038 297 3 0 1338 18.2
Other 0 102 284 0 67 453 6.2
Total by trophic group 843 1583 2880 1909 137 7353
% of total by trophicgroup
11 22 39 26 2
doi:10.1371/journal.pone.0123856.t003
From Reef to Table: Seafood and a Coral Reef Fishery
PLOS ONE | DOI:10.1371/journal.pone.0123856 August 5, 2015 8 / 24

herbivores (90%). Secondary consumers represented 49% of the estimated standing stock andcomprised 22% of catch landed. Most of the secondary consumers were taken by spearing(66% of the expanded secondary consumer catch, and 14% of the total expanded catch), fol-lowed by thrownets (10% of the expanded secondary consumer catch) (Fig 3). Invertebrates(e.g., limpets [‘opihi], crab, etc.) accounted for 5% of the total expanded catch and were caughtby gleaning.
Total expanded catch from Kīholo Bay (7,353 ± 1547 kg yr-1), comes from an area of ca. 2.6km2. This area is roughly 78 times smaller than the corresponding State of Hawai‘i commercialfishing reporting area (204 km2) for this region. However, the catch from Kīholo Bay is 17%higher than the 5-year average (6,218 ± 712 kg yr-1, 2009–13) of commercial catch reported toHawai‘i’s Department of Land and Natural Resources’ (DLNR) Division of Aquatic Resources(DAR) for the entire 204 km2 commercial fishing reporting block (Table 4; S9 and S10 Tables)(Fig 4A, S10 Table). This flags that total catches (commercial and non-commercial) in coastalfisheries in the region are significantly unestimated if only traditional data reporting is consid-ered. The reported commercial catch consists primarily of coastal pelagics (e.g., ‘ōpelu, mack-erel scad, Decapterus spp., and akule, big-eye scad, Selar crumenophthalmus), thus there is verylittle overlap between species composition of the reported commercial catch and the generallynon-commercial catch obtained from our survey (Fig 4B). Table 4 summarizes the reportedcommercial catch in the region for 2009–2013, and singles out the ‘opelu in fraction of totalvolume of catch as well as total market value. Although the commercial catch and the KīholoBay catch represent very different spatial scales, the total annual catches are not significantlydifferent (t-test: t = 1.5934, DF = 4, p = 0.1863). Line fishing represents the highest percentageof the reported commercial catch (58% and 41%, respectively). Only 5% of the reported
Fig 3. Fish flow from reef to table for Kīholo Bay, with variation in composition of key trophic groups throughout these artisanal supply chains. Thefirst pie chart shows the total biomass, by tropic group, of reef fish in Kīholo Bay, as determined from in-water ecological surveys. Next, the harvest by geartype is depicted, showing how different gear types target different mixes of trophic groups; the total % of total harvest by each gear type is included in thecenter of each pie chart. The total expanded catch is approximately 15.2% of the standing stock biomass, and the proportions of the catch vary in comparisonto the standing stock trophic composition. Finally, the last three pie charts show which trophic groups are distributed to which end use (disposition);percentages indicate the proportion of the total catch directed toward each end use (given away, kept, sold).
doi:10.1371/journal.pone.0123856.g003
From Reef to Table: Seafood and a Coral Reef Fishery
PLOS ONE | DOI:10.1371/journal.pone.0123856 August 5, 2015 9 / 24

commercial catch came from spearing and no commercial catch was reported from gleaning.This differs from the catch in the Kīholo creel survey, in which spearing accounted for 18% andgleaning for 6% of the total. Nets in the reported commercial catch and the Kīholo catchaccounted for 37% and 34% of the catch, respectively; there are no distinctions made betweennet types used commercially, while the Kīholo creel survey captures thrownets specifically.
Fish flow and seafood supply chainsWe focus our analysis (Table 5) on the 76% of total catch data where the creel survey recordedinformation on disposition (end use of the seafood). The remaining catch did not have disposi-tion information (24%) and consisted predominantly of herbivores (44%) and secondary
Table 4. Commercial catch (kg) reported to DAR 2009–2013 for the commercial reporting block surrounding Kīholo, with mean and standard error(SE). Total value was computed based on species-level market prices obtained by The Nature Conservancy through market surveys (unpubl.). ‘Opelu(mackerel scad, Decapterus spp) fraction of volume and value is also listed.
Year Total catch (kg) Total value ($) ‘ōpelu (Decapterus spp) fraction of catch (%) ‘ōpelu (Decapterus spp) fraction of value (%)
2009 4,246 48,483 51 44
2010 6,859 78,794 56 49
2011 8,380 100,538 48 40
2012 6,448 75,992 62 53
2013 5,159 54,054 71 68
Mean 6,218 71,572 58 51
± SE ± 712 ± 4,184 ± 2 ± 2
doi:10.1371/journal.pone.0123856.t004
Fig 4. Coastal fisheries catch from creel surveying efforts in Kīholo Bay and the State of Hawai‘i commercial reporting block. (A) Total reconstructedannual catch (in kg) by gear type from a one-year creel survey at Kīholo Bay, Hawai‘i (red) compared to a 5-year annual mean of commercial marine landingsby gear type (2009–2013, red) reported to the State of Hawai‘i’s Department of Land and Natural Resources for the entirety of reporting area 102. (B) Size ofKīholo Bay in reference to the DLNR reporting area 102 for commercial catches. The DAR reporting block is approximately 78 times larger than the reportingarea for the Kīholo creel survey. Although the commercial catch and the Kīholo Bay catch represent very different spatial scales, the total annual catches arenot significantly different (t-test: t = 1.5934, DF = 4, p = 0.1863). The category “other” includes gleaning for Kīholo Bay and trolling for commercial data. Linefishing includes handpole and rod-and-reel (which includes whipping, dunking and slide-baiting). Gleaning includes invertebrate collection.
doi:10.1371/journal.pone.0123856.g004
From Reef to Table: Seafood and a Coral Reef Fishery
PLOS ONE | DOI:10.1371/journal.pone.0123856 August 5, 2015 10 / 24

consumers (43%). It is not certain why disposition information was not provided in somecases, but it is possible that fishers from outside of the community of Kīholo may have withheldthis information because they did not want to disclose it to the surveyor.
Using data from our fish flow surveys, we mapped the geographic location, amount (byweight and number of recorded events), and disposition (end use) for seafood obtained from
Table 5. Weight of total reported catch and reported catch with post-landings disposition information, by trophic group, from Kīholo Bay surveys.
Total Reported Catch (kg) Total Catch with Reported End-use Information (kg)
Trophic Group Weight(kg)
Fraction of totalreported Catch (%)
Weight(kg)
Fraction of total reported catch thatcontain end use data (%)
Given Away(kg)
Kept(kg)
Sold(kg)
Apex Predators 21.1 4.0 6.6 1.6 0 1.1 0.5
SecondaryConsumers
415.3 35.6 114.6 33.5 19.4 8.4 0
Herbivores 404.7 34.7 155.1 32.0 5.1 30.1 2.5
Planktivores 284.7 24.4 128.5 31.2 8.2 17.5 5.5
Other 15.1 1.3 6.8 1.7 0.8 0.8 0
Breakdown by end-use: 33.5% 58% 8.5%
doi:10.1371/journal.pone.0123856.t005
Fig 5. Mapping artisanal seafood supply chains as “fish flow” from the Kīholo Bay coral reef fishery.Arrows indicate locations where seafood from Kīholo is consumed. Exact locations are indicated as place-names; some destinations were only available at coarser district (moku) levels (these are indicated withasterisks). Post-landings disposition is distinguished for kept (red), given away (blue), and sold (green)seafood. Pie charts are scaled to the total catch (kg) for each destination. The numbers in each pie are thenumber of distribution events recorded for each destination and represent only survey-recorded end-use, notthe annual expanded catch. The district boundaries, Digital Elevation Model (DEM), and transportation lineswere acquired from the Hawai‘i state GIS portal [http://planning.hawaii.gov/gis/download-gis-data/].
doi:10.1371/journal.pone.0123856.g005
From Reef to Table: Seafood and a Coral Reef Fishery
PLOS ONE | DOI:10.1371/journal.pone.0123856 August 5, 2015 11 / 24
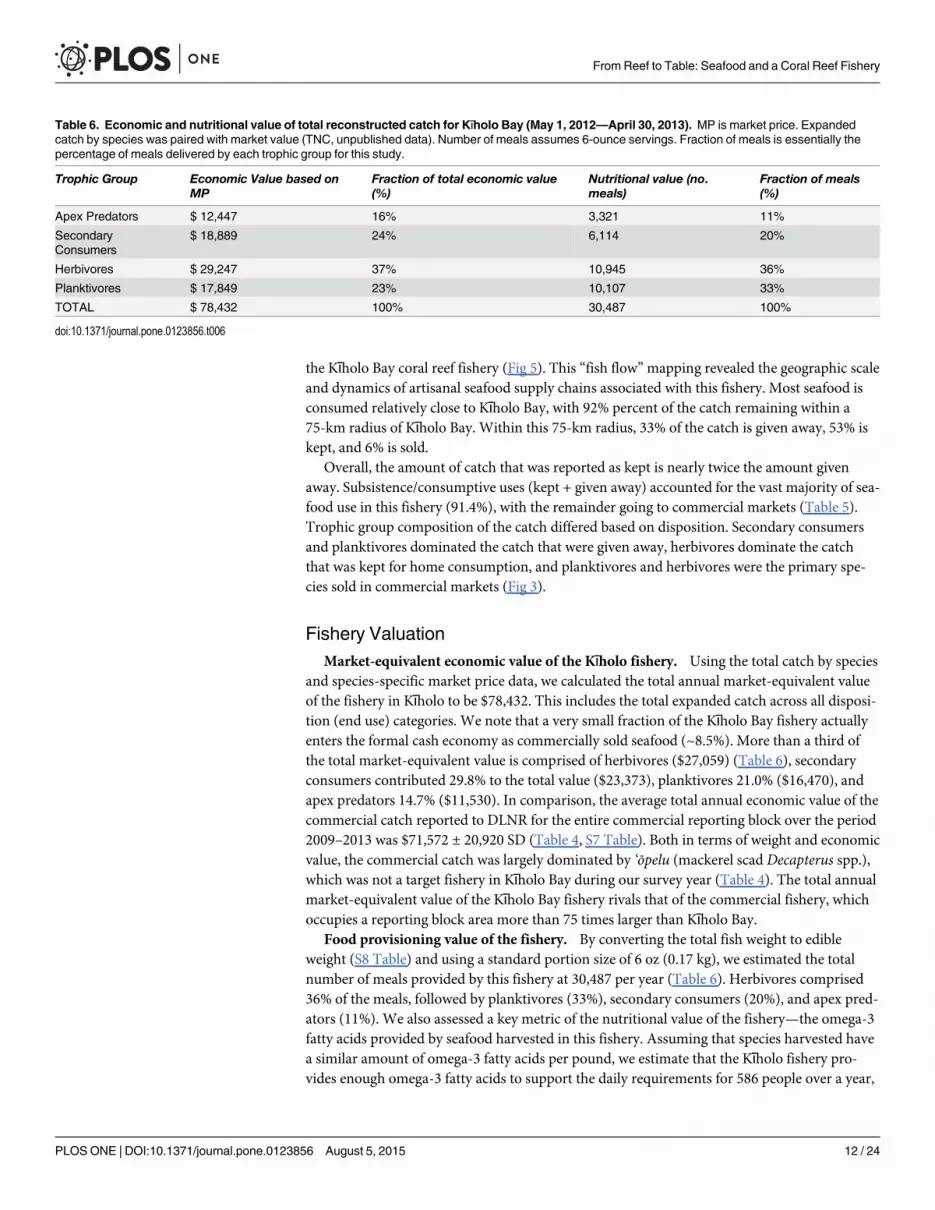
the Kīholo Bay coral reef fishery (Fig 5). This “fish flow”mapping revealed the geographic scaleand dynamics of artisanal seafood supply chains associated with this fishery. Most seafood isconsumed relatively close to Kīholo Bay, with 92% percent of the catch remaining within a75-km radius of Kīholo Bay. Within this 75-km radius, 33% of the catch is given away, 53% iskept, and 6% is sold.
Overall, the amount of catch that was reported as kept is nearly twice the amount givenaway. Subsistence/consumptive uses (kept + given away) accounted for the vast majority of sea-food use in this fishery (91.4%), with the remainder going to commercial markets (Table 5).Trophic group composition of the catch differed based on disposition. Secondary consumersand planktivores dominated the catch that were given away, herbivores dominate the catchthat was kept for home consumption, and planktivores and herbivores were the primary spe-cies sold in commercial markets (Fig 3).
Fishery ValuationMarket-equivalent economic value of the Kīholo fishery. Using the total catch by species
and species-specific market price data, we calculated the total annual market-equivalent valueof the fishery in Kīholo to be $78,432. This includes the total expanded catch across all disposi-tion (end use) categories. We note that a very small fraction of the Kīholo Bay fishery actuallyenters the formal cash economy as commercially sold seafood (~8.5%). More than a third ofthe total market-equivalent value is comprised of herbivores ($27,059) (Table 6), secondaryconsumers contributed 29.8% to the total value ($23,373), planktivores 21.0% ($16,470), andapex predators 14.7% ($11,530). In comparison, the average total annual economic value of thecommercial catch reported to DLNR for the entire commercial reporting block over the period2009–2013 was $71,572 ± 20,920 SD (Table 4, S7 Table). Both in terms of weight and economicvalue, the commercial catch was largely dominated by ‘ōpelu (mackerel scad Decapterus spp.),which was not a target fishery in Kīholo Bay during our survey year (Table 4). The total annualmarket-equivalent value of the Kīholo Bay fishery rivals that of the commercial fishery, whichoccupies a reporting block area more than 75 times larger than Kīholo Bay.
Food provisioning value of the fishery. By converting the total fish weight to edibleweight (S8 Table) and using a standard portion size of 6 oz (0.17 kg), we estimated the totalnumber of meals provided by this fishery at 30,487 per year (Table 6). Herbivores comprised36% of the meals, followed by planktivores (33%), secondary consumers (20%), and apex pred-ators (11%). We also assessed a key metric of the nutritional value of the fishery—the omega-3fatty acids provided by seafood harvested in this fishery. Assuming that species harvested havea similar amount of omega-3 fatty acids per pound, we estimate that the Kīholo fishery pro-vides enough omega-3 fatty acids to support the daily requirements for 586 people over a year,
Table 6. Economic and nutritional value of total reconstructed catch for Kīholo Bay (May 1, 2012—April 30, 2013). MP is market price. Expandedcatch by species was paired with market value (TNC, unpublished data). Number of meals assumes 6-ounce servings. Fraction of meals is essentially thepercentage of meals delivered by each trophic group for this study.
Trophic Group Economic Value based onMP
Fraction of total economic value(%)
Nutritional value (no.meals)
Fraction of meals(%)
Apex Predators $ 12,447 16% 3,321 11%
SecondaryConsumers
$ 18,889 24% 6,114 20%
Herbivores $ 29,247 37% 10,945 36%
Planktivores $ 17,849 23% 10,107 33%
TOTAL $ 78,432 100% 30,487 100%
doi:10.1371/journal.pone.0123856.t006
From Reef to Table: Seafood and a Coral Reef Fishery
PLOS ONE | DOI:10.1371/journal.pone.0123856 August 5, 2015 12 / 24

based on guidelines from the American Heart Association [48]. This demonstrates that theKīholo fishery has significant nutritional value and may play an important role in sustainablefoods and diets in this region.
Cultural values of the fishery. To obtain indicators of the cultural value of the fishery, weassessed the prevalence of two key practices: (1) The fraction of catch that fishers indicated wasto be used for social gatherings (pā‘ina); and, (2) The giving of seafood away to friends,extended family, and community members. Fishers often provide seafood for community cul-tural events such as birthdays, weddings, or funerals [49]. Additionally, giving seafood tofriends and family is part of cultural practice in Hawai‘i and the Pacific Islands region, and isan indicator of the cultural value of the fishery [50]. In total, 21.4% of the catch, which equatesto ~6,500 meals yr-1, was reported as used for cultural functions (pā‘ina). Additionally, 33% ofthe total catch is given away, comprising up to ~2,150 kg of seafood annually from Kīholo Bay,or ~10,000 meals.
Discussion
Food security, social networks, and artisanal supply chainsWe documented the important food provisioning functions associated with this small-scalecoral reef fishery, where over 90% of the catch is directed toward household consumption (Fig4, Fig 5). While much research has been directed toward the role of fisheries in food security[51–53], the food provisioning functions of small-scale fisheries have remained poorly quanti-fied, particularly at local scales [3,54,55]. Studies rarely document food provisioning over sig-nificant spatial or temporal scales with accurate, site-based data. They also rarely engage localcommunities in a truly participatory research approach.
By mapping the distribution of the catch and estimating the magnitude of the benefits pro-vided by this fishery, our research uncovered three important characteristics of the food provi-sioning function provided by this resource system. First, our map shows the geographiclocation of resource users and households that benefit from the fishery. In essence, thisapproach shows how the reef feeds the community—a benefit that is often paramount forresource-dependent communities.
Second, this approach reveals the social network for this small-scale fishery. Resource usersfor fisheries in pre-contact Hawaii (< 1778 AD) were located in the same watershed or districtas the resource base [56], but through a long history of land dispossession, development, andother factors [57], the network of resource users that access this fishery and others like it hasbecome more broadly distributed. This history of displacement and diaspora can make it diffi-cult for resource managers to define the extent of the community of resource users that interactwith the target ecosystem—this research illuminates these spatial patterns of social relationships.
Third, this approach reveals the different supply chains that exist in this artisanal fishery,illuminating various supply chain ‘sectors,’ including direct reliance (kept), cultural exchange(given away), and commercial sale market sectors (sold). Understanding these supply chains isimportant because they reveal that an interacting set of social, cultural, and economic factorsthat affect the distribution of seafood from reef to table in a small-scale fishery. For example,fishers are economically reliant on the fishery to subsidize their household food budgetsdirectly with harvested catch. This fishery provided ~30,500 meals, with a market value of$78,432 annually (for 7,353 kg of seafood catch), which offsets food budgets for communitymembers. The large seafood harvest that is given away or caught specifically for cultural eventsalso reveals the importance of sociocultural values in motivating fishing activities, a commonoccurrence in the Asia-Pacific region [49,50,58]. The mixed mode of reliance (subsistence, live-lihood, cultural) has been observed in other similar systems with communities highly
From Reef to Table: Seafood and a Coral Reef Fishery
PLOS ONE | DOI:10.1371/journal.pone.0123856 August 5, 2015 13 / 24

dependent on local natural resources for food security [13,16,59]. There are several studies thathave shown that fishing can carry multiple end-uses, including both food, income, and liveli-hoods, and can be driven by multiple motivations beyond economic drivers, particularly inlocations where historical traditions and socioeconomic factors such as cultural attachmentand heritage affect fishing activities [60–62]. Conservation practitioners are increasingly work-ing together with local leaders and resource users to assess the benefits and manage for thelong-term food provisioning and cultural functions associated with these fisheries [63–65].
Similar to studies on agro-ecosystems [66–68], our research uncovers the geography of the“food shed” for small-scale fisheries. These findings carry important implications for emergingresearch in small-scale fisheries focused on the role of markets in structuring human-environ-mental relationships in these systems. As researchers begin to disentangle the complexity ofdifferent market sectors and supply chains for small-scale fisheries, there is a pressing need toidentify the interventions that could improve the sustainability of these supply chains and thevalue they bring to communities, businesses, and environmental sustainability efforts. Forexample, conservation practitioners are already developing a variety of market-basedapproaches to create incentives for sustainable harvesting, including eco-labeling and certifica-tion schemes, fisheries improvement projects, and other approaches [69–72]. Over the pastdecade, these types of supply chain interventions have largely been directed toward large-scaleindustrial fisheries [73–75], but there is significant interest in adapting these approaches tosmall-scale fishery systems. However, small-scale resource systems carry different environmen-tal, social, and economic attributes, and elucidating how small-scale, artisanal supply chainsoperate will be critical in developing market-based approaches for small-scale, data-poor fish-eries and other similar resource systems. The integration of community-based and market-based approaches, together with local food movements, holds much promise for transitioningsmall-scale fisheries to sustainability.
Assessing the ecological sustainability of harvestingDefining the sustainable limits for resource use is central to any management or conservationplan, but can often be difficult to assess, particularly in small-scale fisheries, where multiplegear types are often used to harvest a multi-stock assemblage of target species [76]. Muchrecent attention focuses on the use of thresholds for coral reef fisheries management, based onliterature that shows most critical ecological functions in coral reefs are preserved if harvestingstays within an envelope of 0.25–0.5 of virgin stock biomass (B0) [77,78]. Key to this method isthe selection of sites that can serve as reasonable proxies for virgin stock biomass; typicallythese sites are older, and preferably larger, marine reserves. Selection of these reference sites iscritical because they in turn determine the putative sustainability of comparison sites, as deter-mined through thresholds. If these estimates of upper and lower bounds are accurate, thismethod holds much promise as a management tool by providing clear targets for either stockrecovery or maintenance, as well as early warning signs for management.
We compared the average biomass of resource fishes at Kīholo Bay with other sites aroundthe Hawaiian Islands (Fig 2). The archipelago has two potential reference sites, which varygreatly in terms of their biomass: the Northwestern Hawaiian Islands (managed as the Papahā-naumokuākea Marine National Monument), and Kaho‘olawe, an island that was off-limits tofishing for more than 50 years when it was used as a target range by the US military and is nowmanaged by the Kaho‘olawe Island Reserve Commission, which restricts almost all fishingactivity on reefs. Even though both sites are essentially unfished, Kaho‘olawe and Papahānau-mokuākea differ substantially in terms of average biomass, owing primarily to the much higherabundances of apex predators and herbivores in the Northwestern Hawaiian Islands (Fig 2).
From Reef to Table: Seafood and a Coral Reef Fishery
PLOS ONE | DOI:10.1371/journal.pone.0123856 August 5, 2015 14 / 24

As a result of these differences, the interpretation of a threshold-based assessment of thesustainability of Kīholo’s fishery varies significantly depending on the reference site chosen.Kīholo Bay’s average biomass for resource fishes is estimated at 26.3 g m-2 and represents 9.2%of the Papahānaumokuākea resource fish biomass, i.e., it is below 0.1xB0 (where B0 is the refer-ence biomass), and well below the 0.25xB0 threshold of sustainability as defined by McClana-han et al. [77]. If Kaho‘olawe is used as a reference site, Kīholo’s biomass is 24.6% of thereference biomass, i.e., roughly equivalent to the 0.25xB0 threshold, which indicates that thestate of the fishery is at the lower limits for sustainability and that local action is needed toimprove the fishery.
These biomass reference comparisons also illustrate a key dilemma for conservation—areappropriate reference sites for conservation those sites that are more pristine or ones that aremore realistic (i.e., achievable) [79]? Papahānaumokuākea and remote reefs are often used asan ecological baseline for “pristine” reefs [80,81], and fish community structure in these sys-tems are dominated by a high proportion of apex predators [41]. However, it is unlikely thatany marine managed area in the main Hawaiian Islands can achieve these levels of predatorbiomass, particularly since these areas are under continual human use and have a long histori-cal legacy of human impacts [82,83]. Kaho‘olawe may be a more realistic reference for Kīholobecause it has a similar assemblage structure in terms of relative proportion of trophic groups(Fig 2) and represents an achievable level of biomass for a well-managed site that exists in awider seascape where fishing is prevalent. However, regardless of which site is used as a refer-ence, this analysis indicates that the resource fish biomass of Kīholo Bay is well below keythresholds for sustainability. Like many sites across Hawai‘i and the Pacific region, resourcefish biomass and other ecological functions could be compromised if management isineffective.
Understanding changes in harvesting pressure and biomass over longer time scales will helpdetermine if the standing stock is stable with current levels of use, or if additional managementactions are needed to ensure long-term sustainability, particularly given longer-term socioeco-nomic, demographic, and policy changes in the region. In surveys at various sites aroundHawai‘i, fishers often comment on a long-term decline in catch abundance (e.g., [84]). Com-munity elders in Kīholo have suggested that the declines they have seen in marine resources inthe bay may be related to increased fishing effort due to the increased shoreline access in recentyears (The Nature Conservancy, unpublished data) [56]. There is increased focus on fisheryco-management in Hawai‘i and the Asia-Pacific region, and while interest is high, there are stillonly a few sites statewide where these approaches have been successfully implemented [85,86].Despite this implementation gap, there is much promise in collaborative management agree-ments for coral reef fisheries in coastal communities across the globe [87–89]. In sites likeHawai‘i, where place-based management is more congruent with traditional management,these approaches achieve a higher level of social legitimacy. Recent research suggests that co-managed sites are more likely to sustain positive social and ecological benefits if the governancesystems take into account key enabling conditions, costs, timelines, community building, andprocess legitimacy within the planning and implementation effort [85,90,91]. Use of participa-tory research approaches like the one described in this paper can help communities, research-ers, and managers develop successful co-management arrangements.
Diverse fisheries carry diverse valuesOur research highlights a diversity of values associated with this small-scale fishery. First, thefishery carries a significant food provisioning value, providing ~30,500 meals per year tohouseholds across the region and beyond (Fig 5), representing an important source of food and
From Reef to Table: Seafood and a Coral Reef Fishery
PLOS ONE | DOI:10.1371/journal.pone.0123856 August 5, 2015 15 / 24

nutrition, including omega-3 fatty acids. These meals offset household food budgets for peoplein the community of resource users and their social networks, with the vast majority of the$78,432 in total annual economic value of the Kīholo fishery directed toward subsistence andconsumptive uses. This may be an important function for community members, particularlythose in economically disadvantaged households in Hawaii, as it has been shown in other reef-dependent regions [13,14]. Hawai‘i County has a median annual household income of about$65,000, and 9.5% of people live in households below the federal poverty line [92]. The USDAestimates that a family of four requires a monthly food budget of at least $1,088 [93]. Hypothet-ically, the contribution from this small-scale fishery could offset the food budget costs by 10%for 60 households [94]. Income data were not available for the fishers who participated in theKīholo Bay fishery, precluding deeper insight into the potential effect of income inequality onfishing effort for consumptive or commercial purposes. More research is needed on the nexusof poverty, governance, food commodity markets, and resource dependence in the Asia-Pacificregion, particularly as environmental changes and globalization continue to drive shifts in pat-terns of subsistence need and market forces that affect livelihoods [15,95,96].
Beyond market-equivalent economic value, this small-scale fishery also carries importantsocial and cultural values for the community. Harvesting and gathering food remains a centralaspect of lifestyles in Hawai‘i, driven by a longstanding historical connection to place and prac-tice among Hawaiian communities [97,98]. This fishery, like other resource systems in Hawai‘iand elsewhere, provides a diverse set of cultural ecosystem services for communities, whichoften are difficult to disentangle from other services (such as food provisioning) and difficultor inappropriate to quantify. We report two indicators of cultural values associated with thisfishery, including the fish that are shared or given away as part of cultural practice and the fishthat are directly used for social events or functions (pā‘ina, literally “meal” or “dinner”). Over-all, more than 2,150 kg of seafood were reported as given away, comprising 33.5% of the catch.Approximately 6,500 meals over the course of a year were sourced directly for cultural func-tions, pointing to important motivations or what is sometimes referred to as “triggers” for fish-ing events [49]. These community events play a key role in social cohesion, and theprovisioning of food for these events draws on important relationships that maintain socialand kinship ties among community members and families [49,50,99]. While these indicatorsonly reveal a limited set of the cultural values associated with this fishery, they do suggest that asubstantial proportion of fishing events and catch use are associated with cultural practices,providing quantitative metrics for relationships between this resource system and communitywellbeing. Our results illustrate the important connections between land and natural resources(‘āina), community, and family (‘ohana) [100,101] which operate through distribution net-works that are influenced by social kinship ties and networks. These relationships have deephistorical roots in sociocultural institutions and practices, common not only to Hawai‘i but tothe wider Asia-Pacific region as well as other coastal areas globally.
Implications for management and conservationThere are decades of literature pointing to the benefits of participatory assessment and moni-toring, including building cross-sectoral knowledge, engaging community members in the co-production of knowledge, and developing baselines for community planning and management[65,87,102–105]. Beyond these benefits, we uncovered a set of ancillary benefits to this effortthat are less commonly reported but have had positive benefits for the community. Theseinclude opportunities for outreach directly with fishers as a result of their participation andengagement in monitoring efforts. Participatory research approaches that put community con-cerns at the forefront of the research design, implementation, and assessment have much
From Reef to Table: Seafood and a Coral Reef Fishery
PLOS ONE | DOI:10.1371/journal.pone.0123856 August 5, 2015 16 / 24
greater potential to inform community actions. In the case of Kīholo, the community’s princi-pal objective was to understand how the fishery provides for the fishers and families associatedwith this site, and to more deeply understand fishing activities as they relate to community-based collective action to steward the resource. Through the survey, community members builtrelationships with resource users that accessed the area, and as a result were able to learn whowas fishing and why, and where they were from, providing important information on thediverse community of stakeholders that interact with the fishery. By engaging with the fishingcommunity to create baselines and datasets on these key community priorities, resource usershave begun to change their attitudes and perceptions, and the community is engaging fishersto build trust and the foundation for collective action. Developing an understanding of thepool of resource users and their motivations is a critical precursor to organizing users to engagein collective action for effective management of the resource. These types of “step zero” pro-cesses are an understudied aspect of community-based management, as they often help shapethe path forward for future engagements and actions [62,106,107]. Further, these place-basedapproaches are ultimately necessary to support management at geographically relevant scalesto ensure the perpetuation of key ecosystem services and benefits that support communitywell-being [108,109].
Second, we have anecdotal evidence that the presence of community surveyors served todecrease instances of overharvesting and potentially illegal fishing. Notes taken on the surveyforms indicated that some individuals stopped fishing in the area after initiation of surveyingactivities. Surveyors may have been perceived as being “eyes on the reef” and this alone mayhave provided enough of an incentive for the cessation of fishing by some individuals, whoeither did not want to participate, or were engaged in fishing activities that would have beenperceived as unsustainable by their peers. These results point to the value of community effortsin increasing compliance with formal rules and regulations, as well as informal social moresthat govern interactions with other community members and natural resources. Understand-ing the social, cultural, economic, and ecological determinants of compliance is critical asenforcement is a key determinant of long-term durability of conservation actions [110,111].
Third, our research also has implications for management by governmental agencies, asthey relate to data reporting, the total value of coastal fisheries, and developing place-basedrules and regulations governing harvest. Our creel surveys revealed a substantially higher levelof catch than the state commercial and marine recreational surveys, which largely target differ-ent users (Fig 3). The catch recorded through the creel survey in Kīholo Bay (7,353 kg) washigher than the average reported commercial catch (6,218 ± 1593 kg yr-1, 2009–13), despite thefact that the area covered by the creel survey was 1/78th of the commercial reporting block (Fig3B). These findings are consistent with other creel surveys around the state, which stronglysuggest that the non-commercial and non-reported reef fishing effort may be far greater thanreported commercial landings [18,46,84]. Beyond differences in the amount of catch, the creelsurvey effort reveals a higher diversity of fishing methods and gear types than those reportedcommercially. As state statistics are often used as the basis for management decisions, thisstudy reveals the need for more accurate statewide estimates of effort and production in orderto better inform coastal fisheries management and planning efforts. As the spatial coverage ofcreel survey efforts increases, management can increasingly engage these catch baselines,together with ecological surveys and social data on the social, economic, cultural, and nutri-tional value of the fishery to better inform the development of rules and regulations. Engagingfishers in the production of this information can also take pressure off of overburdened govern-mental agencies as resource users become more engaged in fishery assessment and sustainablemanagement [30,112].
From Reef to Table: Seafood and a Coral Reef Fishery
PLOS ONE | DOI:10.1371/journal.pone.0123856 August 5, 2015 17 / 24
ConclusionInterdisciplinary, social-ecological systems approaches are necessary to understand the fullsuite of factors that influence the connections between people and nature. In this study, we doc-umented the large-scale benefits that this small-scale fishery provides to communities througha participatory approach that is transferable to other geographies. As this resource-dependentcommunity copes with socioeconomic, cultural, and environmental changes, the interdisciplin-ary partnership supporting this assessment will continue to generate accurate information andestablish trusting relationships with resource users, which are both necessary for successfulstewardship. This participatory research uncovers several important factors that influence thelinked health of this community and the environment in this small-scale fishery. Just as theecological health of the fishery affects the ability of harvesters to access and benefit from theresources, social attributes of resource users, including their social networks, motivations, andharvesting method, mediate how the broader community benefits from the resource. Ulti-mately, this approach and other similar community-based conservation programs need toidentify and implement interventions that can increase the flow of benefits to communitymembers, while protecting the key ecological processes that are necessary to support thesesocial, cultural, and economic services in the long-term.
Supporting InformationS1 Dataset. Analytical methods for catch and effort calculations.(PDF)
S2 Dataset. All data used in tables and figures for this study. This file serves as the officialpublic data repository for this publication.(PDF)
S1 Table. Hawaii MPA Biomass. Biomass at different marine protected areas (MPA) withinthe West Hawaii Regional Fishery Management Area (WHRFMA). Apex_bio stands for apexpredator biomass (without sharks), H_bio stands for herbivore biomass, P_bio stands for pisci-vores biomass, S_bio stands for secondary consumer biomass, Z_bio stands for planktivores,and SHRK_bio stands for shark biomass. The units here are grams per meter squared.(PDF)
S2 Table. Fishing Effort Survey.(PDF)
S3 Table. Fish Flow Survey.(PDF)
S4 Table. Daily Fishing Effort. Average daily fishing effort (gear-hour/day) and number ofsurvey days and days for each quarter.(PDF)
S5 Table. Total Fishing Effort. Expanded fishing effort (in gear-hour) and total fishing effortfor each gear type.(PDF)
S6 Table. CPUE Summary. Summary of CPUE (kg/gear-hour) for each gear type betweenMay 2012 –April 2013.(PDF)
From Reef to Table: Seafood and a Coral Reef Fishery
PLOS ONE | DOI:10.1371/journal.pone.0123856 August 5, 2015 18 / 24

S7 Table. Annual Expanded Catch. Annual expected catch (kg) for each gear type.(PDF)
S8 Table. Species Edible Weight. Species-specific estimates for edible weight conversionsfrom live weight, provided by local fishermen’s traditional ecological knowledge.(PDF)
S9 Table. Kīholo Bay Catch and Commercial Reported Catch. Creel survey and expandedcatch from Kīholo Bay, by gear type and trophic group, compared to DLNR reported catch for2009–2013 for reporting block 102, where Kīholo is contained. All values reported in kilo-grams. These gear types are grouped by fishing methods in manuscript figures (line fishingincludes rod and reel as well as handpole for Kiholo Bay; handline is grouped under line fishingfor DLNR commercial data).(PDF)
S10 Table. Commercial Reported Catch in West Hawai‘i. DLNR reported catch for 2009–2013 for reporting block 102, with catch value, and fraction of annual catch and annual valuerepresented by each species.(PDF)
AcknowledgmentsThe authors thank first and foremost the fishers and community members of Kīholo. We alsothank The Nature Conservancy of Hawai‘i’s Chad Wiggins, Kydd Pollock and Rebecca Mostfor providing survey data from Kīholo and for helping with data collection; additionallyManuel Mejia and TNC’s Marine Fellows program provided price data. We thank Luka Moss-man and Jason Chow for providing expert knowledge on conversion rates from whole fishweight to edible weight. Any omissions or errors belong to the authors alone.
Author ContributionsConceived and designed the experiments: JNK AMF KLLO HK KAS MG BW LTT. Performedthe experiments: BWMG KAS HK AMF LTT. Analyzed the data: KAS HK LTT KLLO DSK.Contributed reagents/materials/analysis tools: AMF HK. Wrote the paper: JNK LTT AMFKAS KLLO EC HK.
References1. Teh LSL, Teh LCL, Sumaila UR (2013) A Global Estimate of the Number of Coral Reef Fishers. PLoS
ONE 8: e65397. PMID: 23840327
2. Loper C, Pomeroy R, Hoon V, McConney P, Pena M, et al. (2008) Socioeconomic conditions alongthe world’s tropical coasts: 2008. [online] http://www.socmon.org/download.ashx?docid=13074:NOAA, Global Coral Reef Monitoring Network & Conservation International.
3. Bell JD, Kronen M, Vunisea A, NashWJ, Keeble G, et al. (2009) Planning the use of fish for food secu-rity in the Pacific. Marine Policy 33: 64–76.
4. Bell JD, Johnson JE, Hobday AJ, editors (2011) Vulnerability of Tropical Pacific Fisheries and Aqua-culture to Climate Change. Noumea, New Caledonia. [online] http://cdn.spc.int/climate-change/fisheries/assessment/e-book/indexcdn.html: Secretariat of the Pacific Community.
5. Sadovy Y (2005) Trouble on the reef: the imperative for managing vulnerable and valuable fisheries.Fish and Fisheries 6: 167–185.
6. Hoegh-Guldberg O, Mumby PJ, Hooten AJ, Steneck RS, Greenfield P, et al. (2007) Coral reefs underrapid climate change and ocean acidification. Science 318: 1737–1742. PMID: 18079392
7. Hicks CC, McClanahan TR, Cinner JE, Hills JM (2009) Trade-offs in values assigned to ecologicalgoods and services associated with different coral reef management strategies. Ecology and Society14: 10. [online] URL: http://www.ecologyandsociety.org/vol14/iss11/art10/.
From Reef to Table: Seafood and a Coral Reef Fishery
PLOS ONE | DOI:10.1371/journal.pone.0123856 August 5, 2015 19 / 24

8. Johannes RE (2002) The renaissance of community-based marine resource management in Ocea-nia. Annual Reviews in Ecology and Systematics 33: 317–340.
9. Cinner JE, Huchery C, Graham N, MacNeil MA (2012) Global effects of local human population den-sity and distance to markets on the condition of coral reef fisheries. Conservation Biology In press:doi: 10.1111/j.1523-1739.2012.01933.x
10. Berkes F, Hughes TP, Steneck RS, Wilson JA, Bellwood DR, et al. (2006) Globalization, roving ban-dits, and marine resources. Science 311: 1557–1558. PMID: 16543444
11. Brewer TD, Cinner JE, Fisher R, Green A, Wilson SK (2012) Market access, population density, andsocioeconomic development explain diversity and functional group biomass of coral reef fish assem-blages. Global Environmental Change 22: 399–406.
12. Schmitt KM, Kramer DB (2009) Road development and market access on Nicaragua's Atlantic coast:implications for household fishing and farming practices. Environmental Conservation 36: 289–300.
13. Brewer TD (2011) Coral reef fish value chains in Solomon Islands: Market opportunities and marketeffects on fish stocks. Townsville, AU: Report to Solomon Islands Ministry of Fisheries and MarineResources and Secretariat of the Pacific Community. ARC Centre of Excellence for Coral ReefStudies.
14. Thyresson M, Crona B, NystromM, de la Torre-Castro M, Jiddawi N (2012) Tracing value chains tounderstand effects of trade on coral reef fish in Zanzibar, Tanzania. Marine Policy 38: 246–256.
15. Fabinyi M, Knudsen M, Segi S (2010) Social complexity, ethnography and coastal resource manage-ment in the Philippines. Coastal Management 38: 617–632.
16. Wamukota A, Brewer TD, Crona B (2014) Market integration and its relation to income distributionand inequality among fishers and traders: The case of two small-scale Kenyan reef fisheries. MarinePolicy 48: 93–101.
17. McClanahan T, Mangi S (2004) Gear—based management of a tropical artisanal fishery based onspecies selectivity and capture size. Fisheries Management and Ecology 11: 51–60.
18. Friedlander AM, Parrish JD (1997) Fisheries harvest and standing stock in a Hawaiian Bay. FisheriesResearch 32: 33–50.
19. Jennings S, Polunin N (1996) Effects of fishing effort and catch rate upon the structure and biomass ofFijian reef fish communities. Journal of Applied Ecology 33: 400–412.
20. Jacquet J, Fox H, Motta H, Ngusaru A, Zeller D (2010) Few data but many fish: marine small-scalefisheries catches for Mozambique and Tanzania. African Journal of Marine Science 32: 197–206.
21. Zeller D, Booth S, Craig P, Pauly D (2006) Reconstruction of coral reef fisheries catches in AmericanSamoa, 1950–2002. Coral Reefs 25: 144–152.
22. Crona B, NyströmM, Folke C, Jiddawi N (2010) Middlemen, a critical social-ecological link in coastalcommunities of Kenya and Zanzibar. Marine Policy 34: 761–771.
23. Teh LS, Teh LC, Sumaila UR (2011) Quantifying the overlooked socio-economic contribution ofsmall-scale fisheries in Sabah, Malaysia. Fisheries Research 110: 450–458.
24. Barnes-Mauthe M, Oleson KLL, Zafindrasilivonona B (2013) The total economic value of small-scalefisheries with a characterization of post-landing trends: An application in Madagascar With global rele-vance. Fisheries Research 147: 175–185.
25. Cesar H, Burke L, Pet-Soede L (2003) The Economics of Worldwide Coral Reef Degradation. Arn-hem, The Netherlands. [online] http://pdf.wri.org/cesardegradationreport100203.pdf: Cesar Environ-mental Economics Consulting, Arnhem, andWWF-Netherlands.
26. Moberg F, Folke C (1999) Ecological goods and services of coral reef ecosystems. Ecological Eco-nomics 29: 215–233.
27. Moberg F, Rönnbäck P (2003) Ecosystem services of the tropical seascape: interactions, substitu-tions and restoration. Ocean & Coastal Management 46: 27–46.
28. Kittinger JN (2013) Human Dimensions of Small-Scale and Traditional Fisheries in the Asia-PacificRegion. Pacific Science 67: 315–325.
29. Pauly D, Zeller D (2014) Accurate catches and the sustainability of coral reef fisheries. Current Opin-ion in Environmental Sustainability 7: 44–51.
30. Johannes RE (1998) The case for data-less marine resource management: examples from tropicalnearshore finfisheries. Trends in Ecology & Evolution 13: 243–246.
31. WhyteWF, Greenwood DJ, Lazes P (1989) Participatory action research: Through practice to sciencein social research. American Behavioral Scientist 32: 513–551.
32. van Asselt Marjolein BA, Rijkens-Klomp N (2002) A look in the mirror: reflection on participation in inte-grated assessment from a methodological perspective. Global Environmental Change 12: 167–184.
From Reef to Table: Seafood and a Coral Reef Fishery
PLOS ONE | DOI:10.1371/journal.pone.0123856 August 5, 2015 20 / 24
33. Scholz A, Bonzon K, Fujita R, Benjamin N, Woodling N, et al. (2004) Participatory socioeconomicanalysis: drawing on fishermen's knowledge for marine protected area planning in California. MarinePolicy 28: 335–349.
34. Aswani S, Lauer M (2006) Incorporating fishermen's local knowledge and behavior into geographicalinformation systems (GIS) for designing marine protected areas in Oceania. Human Organization 65:81–102.
35. State of Hawai‘i (2014) West Hawaii Regional Fishery Management Area HAR 13–60.4. [online]http://dlnr.hawaii.gov/dar/fishing/fishing-regulations/regulated-areas/regulated-fishing-areas-on-hawaii/-west-hawaii-regional-fishery-management-area: State of Hawai‘i, Hawaii AdministrativeRules (HAR) 13–60.4.
36. State of Hawai‘i (2014) Hawaii Administrative Rules, Title 13, Department of Land and NaturalResources, Subtitle 4 Fisheries, Part II Marine Fisheries Management Areas, Chapter 60, Kīholo Bay,Hawaii. Honolulu. [online] http://dlnr.hawaii.gov/dar/files/2014/05/ch60.pdf: State of Hawai‘i, Depart-ment of Land and Natural Resources.
37. Cheal AJ, Thompson AA (1997) Comparing visual counts of coral reef fish: implications of transectwidth and species selection. Marine Ecology Progress Series 158: 241–248.
38. Brock VE (1954) A preliminary report on a method of estimating reef fish populations. The Journal ofWildlife Management 18: 297–308.
39. Brock RE (1982) A critique of the visual census method for assessing coral reef fish populations. Bul-letin of Marine Science 32: 269–276.
40. Battista TA, Costa BM, Anderson SM (2007) Shallow-water benthic habitats of the main eight Hawai-ian Islands (DVD). Silver Spring, MD: NOAA Technical Memorandum NOS NCCOS 61, Biogeogra-phy Branch.
41. Friedlander AM, DeMartini EE (2002) Contrasts in density, size, and biomass of reef fishes betweenthe northwestern and the main Hawaiian Islands: the effects of fishing down apex predators. MarineEcology Progress Series 230: 253–264.
42. Jones C (2006) Creel Surveys. Encyclopedia of Environmetrics: JohnWiley & Sons, Ltd.
43. Malvestuto SP (1983) Sampling the recreational fishery. In: Nielsen LA, Johnson D.L., editors. Fisher-ies Techniques. Bethesda, MD: American Fisheries Society. pp. 397–419.
44. Malvestuto SP, DaviesWD, SheltonWL (1978) An evaluation of the roving creel survey with nonuni-form probability sampling. Transactions of the American Fisheries Society 107: 255–262.
45. Malvestuto S (1996) Sampling the recreational creel. In: Murphy BR, Willis DW, editors. Fisheriestechniques, 2nd edition Bethesda, MD: American Fisheries Society. pp. 591–623.
46. Friedlander AM, Koike H, Kekoa L, Sparks R (2012) Design, development, and implementation of asurvey of the fisheries of Kahekili Herbivore Fisheries Management Area. Final Report submitted toState of Hawaii, Department of Land and Natural Resources, Division of Aquatic Resources.
47. Milne NA (2012) Coral reef fish dealer study (CRFDS) for the Hawaiian Islands. Honoka‘a, Hawai‘i: Areport to the Western Pacific Regional Fishery Management Council. Okupukupu Consulting, LLC.
48. Kris-Etherton PM, Harris WS, Appel LJ (2002) Fish consumption, fish oil, omega-3 fatty acids, andcardiovascular disease. The Nutrition Committee AHA scientific statement; Circulation 106: 2747–2757. PMID: 12438303
49. Severance C, Franco R, Hamnett M, Anderson C, Aitaoto F (2013) Effort Triggers, Fish Flow, andCustomary Exchange in American Samoa and the Northern Marianas: Critical Human Dimensions ofWestern Pacific Fisheries. Pacific Science 67: 383–393.
50. Vaughan MB, Vitousek PM (2013) Mahele: Sustaining Communities through Small-Scale InshoreFishery Catch and Sharing Networks. Pacific Science 67: 329–344.
51. Pauly D, Watson R, Alder J (2005) Global trends in world fisheries: impacts on marine ecosystemsand food security. Philosophical Transactions of the Royal Society B: Biological Sciences 360: 5–12.
52. Garcia SM, Rosenberg AA (2010) Food security and marine capture fisheries: characteristics, trends,drivers and future perspectives. Philosophical Transactions of the Royal Society B: Biological Sci-ences 365: 2869–2880.
53. Srinivasan UT, CheungWWL, Watson R, Sumaila UR (2010) Food security implications of globalmarine catch losses due to overfishing. Journal of Bioeconomics 12: 183–200.
54. Newton K, Côté IM, Pilling GM, Jennings S, Dulvy NK (2007) Current and future sustainability of islandcoral reef fisheries. Current Biology 17: 655–658. PMID: 17382547
55. Béné C, Macfadyen G, Allison EH (2007) Increasing the contribution of small-scale fisheries to pov-erty alleviation and food security. Rome: FAO Fisheries Technical Paper 481. United Nations Food &Agriculture Organization (FAO).
From Reef to Table: Seafood and a Coral Reef Fishery
PLOS ONE | DOI:10.1371/journal.pone.0123856 August 5, 2015 21 / 24

56. Friedlander AM, Shackeroff JM, Kittinger JN (2013) Customary Marine Resource Knowledge and Usein Contemporary Hawai‘i. Pacific Science 67: 441–460.
57. Osorio JK (2002) Dismembering Lāhui: A History of the Hawaiian Nation to 1887. Honolulu: Universityof Hawaii Press.
58. Glazier EW (2007) Hawaiian fishermen. In: Spindler G, Stockard J, editors. Case Studies in CulturalAnthropology: Thomson/Wadsworth. pp. 1–145.
59. Turner R, Cakacaka A, Graham N, Polunin N, Pratchett M, et al. (2007) Declining reliance on marineresources in remote South Pacific societies: ecological versus socio-economic drivers. Coral Reefs26: 997–1008.
60. Loring P, Gerlach SC, Harrison H (2013) Seafood as local food: Food security and locally caught sea-food on Alaska’s Kenai Peninsula. Journal of Agriculture, Food Systems, and Community Develop-ment 3: 13–30.
61. Lowitt K (2013) Examining fisheries contributions to community food security: Findings from a house-hold seafood consumption survey on the west coast of Newfoundland. Journal of Hunger & Environ-mental Nutrition 8: 221–241.
62. Abernethy KE, Allison EH, Molloy PP, Côté IM (2007) Why do fishers fish where they fish? Using theideal free distribution to understand the behaviour of artisanal reef fishers. Canadian Journal of Fisher-ies and Aquatic Sciences 64: 1595–1604.
63. Hicks CC (2011) How do we value our reefs? Risks and tradeoffs across scales in biomass-basedeconomies. Coastal Management 39: 358–376.
64. White AT, Hale LZ, Renard Y, Cortesi L (1994) Collaborative and community-based management ofcoral reefs: lessons from experience. Sterling, VA, USA: Kumarian Press.
65. Pomeroy RS, Berkes F (1997) Two to tango: the role of government in fisheries co-management.Marine Policy 21: 465–480.
66. Feagan R (2007) The place of food: mapping out the ‘local’ in local food systems. Progress in HumanGeography 31: 23–42.
67. Peters CJ, Bills NL, Wilkins JL, Fick GW (2009) Foodshed analysis and its relevance to sustainability.Renewable Agriculture and Food Systems 24: 1–7.
68. Thompson E, Harper AM, Kraus S (2008) Think Globally—Eat Locally: San Francisco FoodshedAssessment. Autumn Press, Berkeley, CA: American Farmland Trust.
69. California Environmental Associates (2012) Charting a Course to Sustainable Fisheries. [online]http://www.chartingacourse.org/.
70. Van Barneveld W, Sary Z, Woodley J, Miller M, Picou-Gill M (1996) Towards the co-operative man-agement of fishing in Discovery Bay, Jamaica: the role of the Fisheries Improvement Project. ProcGulf & Caribbean Fisheries Institute (1991) 44: 195–210.
71. Sustainable Fisheries Partnership (2014) Fisheries Improvement Project toolkit. Sustainable Fisher-ies Partnership. [online] http://www.sustainablefish.org/fisheries-improvement/fip-toolkit/fip-toolkit-overview.
72. Conservation Alliance for Sustainable Seafood (2014) Guidelines for Supporting Fishery Improve-ment Projects. online: http://www.solutionsforseafood.org/sites/default/files/documents/FIP-Guidelines.pdf.
73. O’Rourke D (2014) The science of sustainable supply chains. Science 344: 1124–1127. doi: 10.1126/science.1248526 PMID: 24904157
74. Iles A (2007) Making the seafood industry more sustainable: creating production chain transparencyand accountability. Journal of Cleaner Production 15: 577–589.
75. Smith BG (2008) Developing sustainable food supply chains. Philosophical Transactions of the RoyalSociety B: Biological Sciences 363: 849–861.
76. Aguilera S, Cole J, Finkbeiner EM, Cornu EL, Ban NC, et al. (In press) Managing small-scale commer-cial fisheries for adaptive capacity: Insights from dynamic social-ecological drivers of change in Mon-terey Bay. PLoS ONE.
77. McClanahan TR, Graham NAJ, MacNeil MA, Muthiga NA, Cinner JE, et al. (2011) Critical thresholdsand tangible targets for ecosystem-based management of coral reef fisheries. Proceedings of theNational Academy of Sciences 108: 17230–17233.
78. Karr KA, Fujita R, Halpern BS, Kappel CV, Crowder L, et al. (2015) Thresholds in Caribbean coralreefs: implications for ecosystem-based fishery management. Journal of Applied Ecology in press:doi: 10.1111/1365-2664.12388
From Reef to Table: Seafood and a Coral Reef Fishery
PLOS ONE | DOI:10.1371/journal.pone.0123856 August 5, 2015 22 / 24
79. Babcock EA, MacCall AD (2011) How useful is the ratio of fish density outside versus inside no-takemarine reserves as a metric for fishery management control rules? Canadian Journal of Fisheries andAquatic Sciences 68: 343–359.
80. Pandolfi JM, Jackson JBC, Baron N, Bradbury RH, Guzman HM, et al. (2005) Are U.S. coral reefs onthe slippery slope to slime? Science 307: 1725–1726. PMID: 15774744
81. Sandin SA, Smith JE, DeMartini EE, Dinsdale EA, Donner SD, et al. (2008) Baselines and degrada-tion of coral reefs in the Northern Line Islands. PLoS ONE 3: e1548. doi: 10.1371/journal.pone.0001548 PMID: 18301734
82. Kittinger JN, Pandolfi JM, Blodgett JH, Hunt TL, Jiang H, et al. (2011) Historical reconstruction revealsrecovery in Hawaiian coral reefs. PLoS ONE 6: e25460. doi: 10.1371/journal.pone.0025460 PMID:21991311
83. Nowlis J, Friedlander AM, DeMartini EE, Brown EK (In prep) A novel technique to simultaneouslyevaluate the status of many previously unassessed fish stocks.
84. Kittinger JN (2013) Participatory Fishing Community Assessments to Support Coral Reef FisheriesComanagement. Pacific Science 67: 361–381.
85. Ayers AL, Kittinger JN (2014) Emergence of co-management governance for Hawai‘i coral reef fisher-ies. Global Environmental Change 28: 251–262.
86. Levine AS, Richmond LS (2014) Examining Enabling Conditions for Community-Based FisheriesComanagement: Comparing Efforts in Hawai‘i and American Samoa. Ecology and Society 19.
87. Cinner JE, McClanahan TR, MacNeil MA, Graham NAJ, Daw TM, et al. (2012) Comanagement ofcoral reef social-ecological systems. Proceedings of the National Academy of Sciences 109: 5219–5222.
88. Berkes F (2010) Devolution of environment and resources governance: trends and future. Environ-mental Conservation 37: 489–500.
89. Finkbeiner EM, Basurto X (2015) Re-defining co-management to facilitate small-scale fisheriesreform: An illustration from northwest Mexico. Marine Policy 51: 433–441.
90. Basurto X, Cinti A, Bourillón L, Rojo M, Torre J, et al. (2012) The emergence of access controls insmall-scale fishing commons: A comparative analysis of individual licenses and common property-rights in two Mexican communities. Human Ecology 40: 597–609.
91. Gelcich S, Edwards-Jones G, Kaiser M (2005) Importance of attitudinal differences among artisanalfishers toward co-management and conservation of marine resources. Conservation Biology 19:865–875.
92. U.S. Census Bureau (2014) Small Area Income and Poverty Estimates, Model-based small areaincome and poverty estimates for school districts, counties, and states, various years. Accessed at:http://uhfamily.hawaii.edu/.
93. USDA (2014) Center for Nutrition, Policy, and Promotion:. http://www.cnpp.usda.gov/sites/default/files/usda_food_plans_cost_of_food/CostofFoodAKandHI2014firsthalf.pdf: US Department ofAgriculture.
94. Glazier EW, Kittinger JN (2012) Fishing, Seafood, and Community Research in the Main HawaiianIslands: A Case Study of Hanalei Bay, Kaua‘i. Honolulu: Impact Assessment, Inc. (IAI). Final ReportPrepared for State of Hawai‘i, Department of Land and Natural Resources, Division of AquaticResources.
95. Béné C, Lawton R, Allison EH (2010) “Trade matters in the fight against poverty”: Narratives, percep-tions, and (lack of) evidence in the case of fish trade in Africa. World Development 38: 933–954.
96. Allison EH, Ellis F (2001) The livelihoods approach and management of small-scale fisheries. MarinePolicy 25: 377–388.
97. McGregor D (2007) Nā Kua‘āina: Living Hawaiian Culture. Honolulu: Bishop Museum Press.
98. Matsuoka J, McGregor D, Minerbi L, AkutagawaM (1994) Governor's Moloka'i Subsistence TaskForce Final Report. Honolulu, Hawaii, USA: University of Hawaii, and Ke Kua'Aina Hanauna Hou. Pre-pared for the Moloka'i Subsistence Task Force and the State of Hawai'i, Department of Business, Eco-nomic Development, and Tourism.
99. Glazier E, Carothers C, Milne N, Iwamoto M (2013) Seafood and Society on O‘ahu in the Main Hawai-ian Islands. Pacific Science 67: 345–359.
100. McGregor D, Minerbi L, Matsuoka J (1998) A holistic assessment method of health and well-being forNative Hawaiian communities. Pacific Health Dialogue: Journal of Community Health and ClinicalMedicine for the Pacific 51: 361–369.
101. McGregor DP, Morelli PT, Matsuoka JK, Rodenhurst R, Kong N, et al. (2003) An ecological model ofNative Hawaiian well-being. Pacific Health Dialog 10: 106–128.
From Reef to Table: Seafood and a Coral Reef Fishery
PLOS ONE | DOI:10.1371/journal.pone.0123856 August 5, 2015 23 / 24
102. Berkes F (2009) Evolution of co-management: Role of knowledge generation, bridging organizationsand social learning. Journal of Environmental Management 90: 1692–1702. doi: 10.1016/j.jenvman.2008.12.001 PMID: 19110363
103. Pinkerton E (1989) Co-operative management of local fisheries: new directions for improved manage-ment and community development: UBC Press.
104. Jentoft S (1989) Fisheries co-management: delegating government responsibility to fishermen's orga-nizations. Marine Policy 13.
105. Gutiérrez NL, Hilborn R, Defeo O (2011) Leadership, social capital and incentives promote successfulfisheries. Nature 470: 386–389. doi: 10.1038/nature09689 PMID: 21209616
106. Chuenpagdee R, Jentoft S (2007) Step zero for fisheries co-management: What precedes implemen-tation. Marine Policy 31: 657–668.
107. Vaughan MB, Caldwell MR (In prep) Hana pa’a: challenges and lessons for early phases of co-man-agement. Marine Policy.
108. McClanahan T, Allison EH, Cinner JE (2013) Managing fisheries for human and food security. Fishand Fisheries.
109. Weeratunge N, Béné C, Siriwardane R, Charles A, Johnson D, et al. (2013) Small-scale fisheriesthrough the wellbeing lens. Fish and Fisheries.
110. Bergseth BJ, Russ GR, Cinner JE (2013) Measuring and monitoring compliance in no-take marinereserves. Fish and Fisheries in press.
111. Lundquist CJ, Granek EF (2005) Strategies for successful marine conservation: integrating socioeco-nomic, political, and scientific factors. Conservation Biology 19: 1771–1778.
112. Friedlander AM, Nowlis JS, Koike H (2014) Improving Fisheries Assessments Using Historical Data:Stock Status and Catch Limits. In: Kittinger JN, McClenachan L, Gedan KB, Blight LK, editors. MarineHistorical Ecology in Conservation: Applying the Past to Manage for the Future. Berkeley, CA: Uni-versity of California Press.
From Reef to Table: Seafood and a Coral Reef Fishery
PLOS ONE | DOI:10.1371/journal.pone.0123856 August 5, 2015 24 / 24