from phonemes to articulatory codes: an fmri study of the role of broca's area in speech...
TRANSCRIPT

Cerebral Cortex September 2009;19:2156--2165
doi:10.1093/cercor/bhn239
Advance Access publication January 29, 2009
From Phonemes to Articulatory Codes: AnfMRI Study of the Role of Broca’s Area inSpeech Production
Marina Papoutsi1,2, Jacco A. de Zwart3, J. Martijn Jansma4,
Martin J. Pickering5, James A. Bednar1 and Barry Horwitz2
1Institute for Adaptive and Neural Computation, University of
Edinburgh, UK, 2Brain Imaging Modeling Section, Voice, Speech
and Language Branch, National Institute on Deafness and Other
Communication Disorders, National Institutes of Health,
Bethesda, MD, USA, 3Advanced MRI Section, Laboratory of
Functional and Molecular Imaging, National Institute of
Neurological Disorders and Stroke, National Institutes of
Health, Bethesda, MD, USA, 4Neuroimaging Section, Mood and
Anxiety Disorders Program, National Institute of Mental Health,
National Institutes of Health, Bethesda, MD, USA and5Department of Psychology, University of Edinburgh, UK
We used event-related functional magnetic resonance imaging toinvestigate the neuroanatomical substrates of phonetic encodingand the generation of articulatory codes from phonologicalrepresentations. Our focus was on the role of the left inferiorfrontal gyrus (LIFG) and in particular whether the LIFG plays a rolein sublexical phonological processing such as syllabification orwhether it is directly involved in phonetic encoding and thegeneration of articulatory codes. To answer this question, wecontrasted the brain activation patterns elicited by pseudowordswith high-- or low--sublexical frequency components, which weexpected would reveal areas related to the generation ofarticulatory codes but not areas related to phonological encoding.We found significant activation of a premotor network consisting ofthe dorsal precentral gyrus, the inferior frontal gyrus bilaterally, andthe supplementary motor area for low-- versus high--sublexicalfrequency pseudowords. Based on our hypothesis, we concludedthat these areas and in particular the LIFG are involved in phoneticand not phonological encoding. We further discuss our findingswith respect to the mechanisms of phonetic encoding and provideevidence in support of a functional segregation of the posterior partof Broca’s area, the pars opercularis.
Keywords: articulation, fMRI, left inferior frontal gyrus, pars opercularis,phonological processing
Introduction
Even though Broca’s area has been associated with speech and
articulation since the 19th century, the exact role that it plays
in the process is still a matter of debate. Characteristically, in
recent models on the neuroanatomy of language, Broca’s area
has been associated with quite different processes. In one
viewpoint, Indefrey and Levelt (2004) hypothesized that
Broca’s area was engaged at the level of phonological
processing and was particularly associated with the process
of syllabification. In contrast, in a model proposed by Hickok
and Poeppel (2004), Broca’s area was assigned to phonetic
encoding and implementing the mechanism of retrieving or
generating the articulatory codes. In the present study, we try
to address this issue and examine whether the left inferior
frontal gyrus (LIFG) is involved in the phonological or the
phonetic level of language processing. We used event-related
functional magnetic resonance imaging (fMRI) and manipu-
lated the phonological properties of pseudowords in a way that
separates the processes of phonological and phonetic encod-
ing. This manipulation allowed us to identify the key areas
involved in the 2 levels of encoding and to disambiguate the
function of Broca’s area with respect to these 2 levels.
The processes that lead to the generation of an articulatory-
motor plan are a matter of debate amongst researchers
(Goldrick and Rapp 2007). However, it is commonly accepted
that syllabic, metrical, and featural information is specified in
a phonological representation prior to the generation of the
motor plan (Levelt 1999). In extended reviews of studies on
word production by Indefrey and Levelt (2000, 2004), it was
suggested that in the final stages prior to phonetic encoding
and the generation of the articulatory representation, the
phonological code of a given word is spelled out into its
different phonemic segments, incrementally clustered into
syllables, and assigned a metrical structure. As syllables are
created, they are then rapidly turned into sequences of motor
gestures, also known as gestural scores (Browman and
Goldstein 1988).
In this account of word production, it is assumed that there
is a different mechanism for dealing with high- and low-
frequency syllables. Based on the notion that speakers tend to
reuse only a small number of syllables and on evidence that
pseudowords with high-frequency syllables are faster to pro-
duce than their low-frequency counterparts (Cholin et al.
2006), it was proposed that the articulatory scores for frequent
syllables are precompiled and stored in a repository called the
‘‘mental syllabary’’ (Levelt and Wheeldon 1994). In contrast, the
articulatory representations for less-frequent syllables are
compiled online (Levelt et al. 1999).
Neuroanatomically, the processes of generating lexical
phonological representations have been associated with 2
regions: the middle and posterior superior temporal gyrus
(STG), also known as Wernicke’s area (Fiez et al. 1999; Indefrey
and Levelt 2000; Hickok and Poeppel 2004), and Broca’s area,
specifically the pars opercularis, roughly corresponding to
Brodmann area (BA) 44 (Poldrack et al. 1999; Burton et al.
2000; Indefrey and Levelt 2000). The latter region in particular
has been shown to facilitate sublexical processes that require
explicit segmentation, such as tasks where subjects perform
phonological decisions like phoneme monitoring, phoneme
discrimination, or phoneme sequencing (Zatorre et al. 1992,
1996; Demonet et al. 1996; Poldrack et al. 1999; Burton et al.
2000). In the proposed model by Indefrey and Levelt (2004), the
LIFG is part of a network related to syllabification, whereas the
premotor cortex (BA6) is responsible for compiling and storing
the motor codes for the individual syllables, that is, it is the
location of the mental syllabary (Levelt and Wheeldon 2004).
Published by Oxford University Press 2009.

In recent review papers, Hickok and Poeppel (2004, 2007)
proposed a different model for understanding linguistic
processing and the role of the LIFG. Inspired by the theory of
the ‘‘mirror neuron system’’ and the idea of sensory--motor
integration (di Pellegrino et al. 1992; Rizzolatti and Arbib 1998;
Rizzolatti and Craighero 2004), they hypothesized that there is
a common interface between speech perception and pro-
duction. This interface also facilitates phonemic-to-articulatory
code translation and supports a ‘‘motor theory of speech
perception’’ (Liberman and Mattingly 1985). Broca’s area is part
of the sensory--motor integration interface, and in this sense, it
is directly involved in the generation or retrieval of the
articulatory codes. Following a computational model of speech
production, the proposed role of the posterior Broca’s area
(along with the ventral premotor cortex) is to hold a ‘‘speech
sound map,’’ that is, representations of phonemes or frequent
syllables and their associated motor programs (Guenther et al.
2006).
The concept of the speech sound map is similar to that of
the mental syllabary presented by Indefrey and Levelt (2004).
Where the 2 theories differ is the role of the posterior part of
Broca’s area. According to Hickok and Poeppel (2000, 2004,
2007), Broca’s area is involved in phonetic encoding and the
generation of the articulatory scores because it serves as a store
for articulatory representations. On the other hand, according
to Indefrey and Levelt, the role of Broca’s area is to support
syllabification and postlexical phonological processing, that is,
processes that are a step before the retrieval or compilation of
the articulatory codes.
In this study, we investigated the role of Broca’s area in
generating an articulatory-motor plan. We specifically wanted
to address whether the posterior part of Broca’s area (pars
opercularis) is involved in phonological processes, such as
syllabification, or in directly retrieving or compiling the
articulatory gestures. To do this, we used event-related fMRI
to monitor the changes in blood oxygenation while subjects
performed a delayed pseudoword repetition task. The pre-
sented stimuli differed in length (4 vs. 2 syllables) and
sublexical frequency of segments and syllables (low vs. high
sublexical frequency). We anticipated that we would be able to
identify 1) the regions involved in phonetic encoding and
2) disambiguate the role of the pars opercularis in single-word
production. Specifically, if Broca’s area is involved in syllabifi-
cation and phonological processing prior to the encoding of
the articulatory scores, it would only show a strong effect of
length, but not sublexical frequency. On the other hand, if
Broca’s area is the site of the mental syllabary, we expected
to see significant effects of both length and frequency
manipulations.
Materials and Methods
SubjectsFifteen healthy, monolingual native speakers of American English were
chosen to participate in the study (8 males and 7 females) with mean
age of 26 years (range = 20--35). Two subjects (1 male and 1 female)
were excluded from analysis because of excessive head motion. All the
volunteers reported that they were right handed, with normal hearing
and with no history of previous neurological or psychiatric disease.
Volunteers were paid for their participation in the 2-h scanning session,
in compliance with the institutional guidelines. Prior to testing,
volunteers provided written informed consent as approved by the
National Institute on Deafness and Other Communication Disorders--
National Institute of Neurological Disorders and Stroke Institutional
Review Board (protocol NIH 92-DC-0178).
Stimulus MaterialsFour sets of 36 pseudowords were created (a total of 144 items) varying
in length and sublexical frequency: 4-syllable low frequency, 4-syllable
high frequency, 2-syllable low frequency, and 2-syllable high frequency.
The 4 sets of stimuli consisted of alternating consonant--vowel (CV)
biphones plus a final consonant, that is, CVCVC and CVCVCVCVC for 2-
and 4-syllable pseudowords, respectively. The 4-syllable pseudowords
contained 2 stresses (a primary and a secondary stress). However, the
position of the stressed syllables within the pseudowords varied to
allow greater flexibility in the creation of the data set and avoiding the
creation of ungrammatical syllables. Examples of the stimuli are
presented in Table 1 (audio files of the examples are provided online
as Supplementary Material). As a measure of length, we chose number
of syllables and phonemes, with 2 syllables as the minimum length.
Two-syllable pseudowords were preferred over monosyllabic ones to
allow better control of phonological neighborhood density, which
decreases as the word length increases (Pisoni et al. 1985). As a measure
of sublexical frequency, we chose the phonotactic probability (PP) of
phonemes and biphones. Phonotactic probability refers to the
frequency with which legal phonological segments and sequences of
segments (i.e., biphones) occur in a given language (Jusczyk et al.
1994). As observed in the syllable frequency effect, low PP pseudo-
words have slower response time than high PP ones, reflecting the load
in the phonetic encoding process (Vitevitch et al. 1997, 1999; Vitevitch
and Luce 1998).
All the syllables, with the exception of 2, that were used to construct
the pseudowords were chosen from a corpus of previous linguistic
studies on the effects of PP (Vitevitch et al. 1997; Frisch et al. 2000)
such that they were rare, but not illegal (in the case of low-frequency
items), and that they satisfied our criteria for frequency. The 2
additional syllables that we included were /how/ and . Both of these
syllables had a biphone probability greater than zero and were included
to increase the variability of the generated data set. The PP for each
biphone and phoneme was calculated (Vitevitch and Luce 2004), and
pseudowords were created such that each pseudoword consisted
entirely of high- or low-probability segments (depending on its
category).
To reduce the amount of similarity between the stimuli, no 2
syllables occurred in the same pseudoword more than once and no
pseudoword appeared as a contiguous part within another pseudo-
word. All items were further checked for immediate phonological
neighbors using a ‘‘one phoneme change’’ rule, that is, no stimulus
could be turned into a word by 1) changing one phoneme into another,
2) deleting one phoneme, or 3) adding one phoneme. Even though
phonological neighborhood density and PP are correlated, we expected
that by controlling for immediate neighbors, the differences in
neighborhood density between items with different PP would not be
emphasized. Effects related to PP would then be related to phonetic
encoding and not phonological word retrieval, which would arise by
manipulating phonological neighborhood density (Okada and Hickok
2006). As a result, low-- and high--sublexical frequency items differed
systematically only with respect to the positional frequency of their
phonemes and syllables. Finally, to avoid morphological confounds, any
Table 1Stimulus features
Condition Bigram PP Phoneme PP
4 Syllables, high PP, for example 0.0251 (±0.0093) 0.4888 (±0.0681)4 Syllables, low PP, for example 0.0013 (±0.0012) 0.1251 (±0.025)2 Syllables, high PP, for example 0.0181 (±0.007) 0.2965 (±0.0427)2 Syllables, low PP, for example 0.0004 (±0.0004) 0.061(±0.0194)
Note: table with examples of the stimuli used in each category (phonetic transcription) and their
features. For each category, we include the mean (±SD) PP measures for both biphones and
phonemes. Audio samples of the stimuli examples are provided online as Supplementary
Material.
Cerebral Cortex September 2009, V 19 N 9 2157

sequences that ended with a high-probability final rime, for example,
/-æs/ and /-æd/, which could be interpreted as inflectional suffixes,
were also omitted from the data set.
To record the stimuli, we recruited a female, monolingual American
English volunteer. Prior to the recording, the volunteer was trained to
pronounce the data set correctly and rehearsed the items a number of
times to familiarize herself with the data set. The stimuli were read
from a laptop screen and spoken in isolation as naturally and as clearly
as possible. All stimuli were recorded in a single session in a nonechoic,
sound-attenuated booth. They were digitally recorded using a Shure
SM58 vocal microphone at 44.1-kHz sampling rate and were saved at
16-bit resolution. Two or three recordings were made for every
stimulus, which were then edited into individual files and screened for
accuracy and fluency. The most accurate recording of each item was
chosen for the stimulus list. The chosen stimuli were then transcribed,
and their segment and biphone PP was recalculated to take into
account the cases where there were some differences in the
pronunciation. In the resulting lists, the differences between the
average segment and the biphone probabilities over both 4- and 2-
syllable pseudowords were statistically significant (phonemes: F1,286 =920.2, P < 0.001; biphones: F1,286 = 763.9, P < 0.001). Higher frequency
pseudowords had higher PP scores than lower frequency pseudowords
(see Table 1 for more details on the category PP).
Experimental Design and ProcedureThirty-six items per condition were presented over the course of 2
experimental fMRI runs. Each item was presented to the subject
auditorily using an fMRI compatible (pneumatic) system for auditory
delivery (Avotec SS-3100, Silent Scan system). After a delay of 6 s,
a probe (1 of 2 versions of a bell sound) was heard instructing the
subject to repeat the presented pseudoword either overtly or covertly
(depending on the type of probe). During the delay period, the subjects
were given specific instructions to rehearse the presented stimulus
covertly. They did not know prior to the presentation of the relevant
probe whether they would be asked to respond overtly or covertly, and
so we expected that they would fully retrieve the articulatory scores
for the presented pseudoword. Each trial lasted 8 s (Fig. 1A).
Stimulus presentation was in a pseudorandom, fast event-related
fashion, whereby the order of occurrence for the conditions was
controlled by a combination of 3 binary shifted versions of an m-
sequence (one shifted by 9 bins and the other by 18 bins with respect
to the first one; see, e.g., Fig. 1B). The use of m-sequences (Buracas and
Boynton 2002; Kellman et al. 2003) to control stimulus delivery allowed
for a simple and efficient way to increase design efficiency and
minimize the chance of significant correlation between the regressors,
even in case of post hoc exclusion of incorrect trials. The binary m-
sequence used in the study had a length of 63 bins (corresponding to
the number of trials per run) and was padded in the beginning with 9
more trials, which were not analyzed for the purposes of this study. The
purpose of these onset trials was to allow for the subject to get
comfortable with the task and the noisy environment in the scanner.
Prior to the onset of the experiment, all subjects performed a 150-
min practice session outside the scanner to allow them to become
familiar with the structure of the task and its demands. The material
used as the training set (10 items per category) contained pseudowords
with features similar to the ones presented during the experimental
runs but from an unrelated set (built from different syllables) to avoid
habituation and familiarity.
Because of the concern that, during the scanning session, the
scanner noise would mask out some of the stimuli, a quality check run
was performed prior to the onset of the experimental runs. During this
run, a set of pseudowords (not used for the experimental set but
recorded in the same session as the experimental set, i.e., with the same
amplitude and recording characteristics) was presented to the subject.
The volume of the headset was then adjusted based on the subject’s
feedback to ensure protection from exposure to a noisy environment,
comfort, and clear stimulus delivery. Images acquired during this test
run were also submitted to a quality check to make sure that they were
free from artifacts.
During the scanning session, subject responses were recorded using
a dual-channel, noise canceling, fiber optic microphone (Dual-Channel
Phone-Or by Optoacoustics Ltd, Or-Yehuda, Israel). This system is
specifically designed for use in magnetic resonance imaging (MRI)
environments and offers real-time adaptive elimination of the MRI
acoustic noise from the signal. This allowed us to record both the
subject responses and the timing of their responses. However, due to
concerns that the filtering algorithm introduced a small, random delay
in the recording of the responses, we did not consider the estimates of
the subject response timing reliable. Thus, as a behavioral measure-
ment, we only used subject response accuracy.
fMRI Data AcquisitionImaging was performed on a 3.0-T MRI system (General Electric,
Milwaukee, WI), equipped with Cardiac Resonance Module whole-body
gradients. For improved signal-to-noise ratio (SNR) and higher spatial
resolution, we used a custom-built 16-channel MRI receive array (Nova
Medical, Wilmington, MA; de Zwart et al. 2004) connected to a custom-
built 16-channel MRI receiver. For the functional scans, we used single-
shot, rate-2, sensitivity-encoded (SENSE), gradient-echo, echo-planar
imaging (EPI) (de Zwart et al. 2002). A total of 32 axial slices were
acquired interleaved (time echo [TE] = 31 ms, flip angle of 90 degrees,
time repetition [TR] = 2 s, and acquisition bandwidth 250 kHz) with an
in-plane resolution of 2.3 3 2.3 mm2 (96 3 72 matrix, 22.4 3 16.8 cm2
field of view [FOV]) and slice thickness = 2 mm (gap = 0.3 mm). Four
volumes were acquired during each trial. The combination of the
dedicated receive array with SENSE EPI allowed a 2- to 4-fold
improvement in SNR and a 50% reduction in geometric distortions
relative to a conventional setup with a birdcage head coil (de Zwart et al.
2004). The reduced geometrical distortions of SENSE EPI are due to its
use of a shortened data acquisitionwindowcomparedwith conventional
EPI at the same spatial resolution.
Figure 1. During the experiment, subjects were asked to listen to pseudowords andto repeat them either overtly or covertly after a 6-s delay. The structure of each trial isshown in (A). The stimulus is presented auditorily at 0 s and then subjects wait forthe response probe. During the delay period, they are instructed to covertly rehearsethe stimulus and are not aware of the type of response (overt or covert) before theyhear the probe. The type of stimulus that will be presented in each trial is determinedpseudorandomly by a combination of 3 m-sequences. In (B), we present an exampleof 3 binary sequences that resemble those used in the experiment. Each sequence isassociated with an experimental factor. In the example provided, the top sequencecontrols the length of the stimulus (1 for 4 syllables and 0 for 2 syllables), the middlesequence controls sublexical frequency (1 for high and 0 for low), and the bottomsequence controls response type (1 for overt and 0 for covert). For example, thecombination 0 1 0 would retrieve a 2-syllable, high-frequency pseudoword and thecovert response probe.
2158 From Phonemes to Articulatory Codes d Papoutsi et al.

To increase the efficiency of subject motion correction, we acquired
isotropic voxels (2.3 mm cube side). However, the resulting smaller-
than-usual thickness of the slices put a constraint on the brain volume
that could be imaged. We did not have a hypothesis about the
involvement of any areas below the superior temporal sulcus (STS), and
we therefore acquired images in a slightly oblique position, covering an
area from below the STS to the top of the head. By avoiding the lower
parts of the cortex (e.g., the inferior temporal areas), we also avoided
geometrical distortions and artifacts that are caused by articulatory
muscle movement (Birn et al. 2004). To facilitate slice selection,
a sagittal 2-dimensional anatomical image was acquired prior to the
onset of the functional runs. This image was inspected for specific
anatomical landmarks such as the anterior commissure and the STS and
was used to make the slice selection. At the end of the scanning session,
high-resolution spin-echo T1 anatomical images were acquired at the
same location as the functional EPI scans. The scanning parameters for
the anatomical image were as follows: TR = 700 ms, TE = 13 ms, 256 3
192 data matrix with a 22.43 16.8 cm2 FOV, resulting in 0.863 0.86mm2
in-plane resolution, and 2 mm slice thickness (with 0.3 mm gap).
To minimize head movement during the scanning sessions, we used
head padding and a velcro strap, mounted on each side of the head coil
and positioned on the subject’s forehead at the line just above the
eyebrows. The purpose of the strap was to act as a motion reference
point for the subject. Head movement, especially in the z (head--foot)
direction, would cause a strain on the strap, make the subject aware of
the movement and cause him/her to restrict it and return to the
original position. Prior to the onset of the scanning session, the subjects
were given instructions about how to restrict their head movement and
about the function of the velcro strap. Tests were also performed to
ensure that the strap was properly placed, and the subjects could feel it
when moving during speech.
Image PreprocessingAll analyses and image preprocessing were carried out using the SPM5
software package and associated toolboxes (http://www.fil.ion.ucl.
ac.uk/spm/software/spm5). Preprocessing included slice-timing cor-
rection and an optimized motion correction routine to ensure good
quality registration (Oakes et al. 2005). Images were then registered to
the Montreal Neurological Institute (MNI) anatomical template and
transformed into MNI stereotactic space to allow for group compar-
isons. The functional data were then smoothed with an isotropic
Gaussian filter kernel of 6 mm (full width at half maximum) to improve
SNR.
To quantify the effect of subject movement on the quality of our data,
we inspected the data using the ArtRepair toolbox for SPM5 (Mazaika
et al. 2007) and examined the realignment parameters provided by
the SPM5 motion correction procedure. We were particularly in-
terested in scan-to-scan (incremental) motion during the task, that is,
the change in position between the image acquired during the subject
response and its immediate preceding image. In previous studies on
speech-related motion (Barch et al. 1999), it was shown that speech-
related motion is mainly scan-to-scan motion affecting the first scan
acquired after the response probe. To assess the effects of speech-
related motion on our data, we performed a 3-factor analysis of variance
(ANOVA) with within-subject factors response type, stimulus length,
and sublexical frequency and dependent variable the 6 motion
estimates for incremental (scan-to-scan) movement. The analysis
revealed a significant main effect of response type in all directions
(F1,12 > 26, P < 0.004 for all directions). In agreement with other
studies (Barch et al. 1999; Shuster and Lemieux 2005), the incremental
movement was overall quite small and greater for overt response trials
(mean ± standard deviation [SD] displacement was 0.039 ± 0.014 mm
for translations and 0.034 ± 0.012� for rotations) than covert response
ones (mean ± SD was 0.02 ± 0.008 mm for translations and 0.017 ±0.006� for rotations).Additional significant effects were present for length in the pitch
rotation and for both the main effect (F1,12 = 5.9, P < 0.04) and the
interaction between length and response type (F1,12 = 19, P < 0.001).
Four-syllable pseudowords (mean ± SD pitch displacement was 0.038 ±0.020�) produced greater movement than 2-syllable pseudowords
(mean was 0.034 ± 0.016�) especially during overt responses. Finally,
in the y direction, there was a significant main effect of sublexical
frequency (F1,12 = 6.3, P < 0.03) and interaction between sublexical
frequency and response type (F1,12 = 10.8, P < 0.01). Low-frequency
items caused greater movement (mean ± SD 0.021 ± 0.013 mm) than
high-frequency items (0.019 ± 0.010 mm), especially during overt
response trials. To remove effects related to subject movement, we
included the realignment parameters in the design matrix as effects of
no interest. Finally, we also inspected the movement parameters
for extreme movement. We took into account both incremental
movement and absolute movement (the displacement of a scan with
respect to the realignment reference scan of the time series, i.e., in our
case, the first image in the time series). Our criteria for inclusion in the
study were that a subject would not show absolute motion greater than
the voxel size and incremental motion greater than 1 mm in
translations and 1� in rotations. All subjects met the absolute motion
inclusion criteria, but not the incremental motion. Two subjects
showed movement greater than our criteria and were consequently
excluded from the analysis.
Further examination using the ArtRepair toolbox revealed that in
a few cases, incremental movement even as low as 0.5 mm induced
global signal changes greater than 1.5% of the mean and ‘‘stripe-like’’
artifacts on the image. To ensure the quality of our data and to
completely remove their effect from the analysis, we also added an
additional regressor for images that showed changes in the global signal
greater than 1.5% of the mean followed by a greater than 0.5 mm
incremental movement (Mazaika et al. 2007).
Behavioral Data AnalysisIn order to get an estimate of subject performance and ensure that the
subjects were performing the task as instructed, we estimated the
subject response accuracy. To calculate it, we monitored and
phonologically transcribed all subject responses. However, because of
the low quality of the recording, resulting from the noise reduction
filtering, a precise phonetic transcription of the subject response was
not always possible and the nearest phonological transcription was
used. Cases where the recording was unintelligible because of noise
were not included in the analysis. The resulting transcriptions were
compared with the target stimulus phoneme-by-phoneme, and a score
was calculated based on the number of correct phonemes (token
count). If a phoneme was omitted in the subject response, it was scored
as a mismatch, for example, if the target was and the response
was /keb/, the first 2 phonemes were counted as a mismatch and the
final phonemes were counted as a match. To determine a match
between the target and the response, we used broad phonemic criteria
and ignored differences between allophones (Vitevitch and Luce 2005).
The scores were then submitted to a 2-way ANOVA with factors length
and sublexical frequency.
Even though we were not able to extract a very detailed phonetic
transcription, our interpretation of the data does not dependent on the
subtle phonetic details of the subjects’ performance, for example,
distinguishing between 2 allophones. The primary reasons for analyzing
the behavioral results were to identify incorrect trials, to ensure that
the subjects were performing the task as instructed, and that the
difference between low-- and high--sublexical frequency items was
retained in the subject response. For this purpose, we also estimated
the PP of the subjects’ overt responses in the same way as we did for
the stimuli (Vitevitch and Luce 2004). To determine whether there is
a significant difference between the 2 conditions, we performed
a paired t-test. Finally, we also examined the subject recordings to
identify trials that were incorrectly answered (i.e., responses on covert
trials or no response on overt trials). These trials were included to
a regressor of no interest and excluded from the fMRI data analysis.
fMRI Data AnalysisStatistical analysis of the factorial event-related experiment was
performed using SPM5. The hemodynamic response function (HRF)
for each trial was modeled using a finite impulse response function
(FIR) with 12 bins (duration of 2 s) to capture the temporal
components of a delayed response task. Stimulus presentation was
modeled as a delta function. A 2-way, random-effects, within-subject
Cerebral Cortex September 2009, V 19 N 9 2159

ANOVA with factors length (4- vs. 2-syllable pseudowords) and
sublexical frequency (low vs. high) was performed. Each of the 4
different resulting types of trials, for example, 4-syllable and low
sublexical frequency, was modeled by separate regressors, and the main
effects and interactions were evaluated by contrasting within or across
(interactions) the levels of each factor. To perform group statistics, the
contrast images for each effect and for all subjects were submitted to
a 1-way ANOVA (with 12 levels). T-contrasts testing for the predicted
shape of the HRF (a canonical, 2 gamma function; Friston et al. 1998)
were performed to produce maximum intensity projections and reveal
voxels whose differential activity pattern conforms to the shape of the
HRF. SPMs were thresholded at P < 0.001 uncorrected at the voxel
level and P < 0.05 corrected for familywise error (FWE) at the cluster
level (Hayasaka and Nichols 2003). For our study, significant clusters
had on average more than 85 voxels.
In order to analyze the contrast estimates for the LIFG, we used the
cytoarchitectonic probability map for left hemisphere BA44 (Eickhoff
et al. 2005). For each of the main effects of interest (length, frequency,
and response type), we identified the voxels within the activated
clusters that were part of BA44. We then extracted the average beta
weights (over cluster voxels) for each of the 4 conditions of interest in
the design (4-syllable low frequency, 4-syllable high frequency, 2-
syllable low frequency, and 2-syllable high frequency) and for all
subjects. A single value corresponding to the weighted sum of the
estimates across the FIR (weighted by the HRF) was then extracted
for each of the 4 conditions and subjects and used in multiple 2-sided
t-tests testing for effects of frequency, length, or the difference be-
tween the 2 conditions within each region. This approach followed
the implementation of random-effects analyses in the Marsbar SPM
toolbox (Brett et al. 2002). Significance was determined using a
threshold of P <0.05. Where appropriate (more than 1 region of in-
terest [ROI]), the P values were adjusted to correct for multiple com-
parisons (Bonferroni correction).
To ensure that the significant activations observed during the delay
period for both the whole-brain and the LIFG analyses were not related
to subject motion, we extracted and inspected the parameter estimates
for each significantly activated cluster over the window of the FIR (24 s).
The time course of movement-related activations is very different from
that of blood oxygen level--dependent (BOLD) related activations.
Whereas motion-related signal changes appear as large spikes in the
signal intensity for the first few images at the time of the subject
movement, BOLD-related signal changes follow a curve similar to the
HRF (Birn et al. 1999). It should also be noted that significant effects for
length and frequency were estimated over both covert and overt
responses, and so we expected that the contribution of motion-related
artifacts to the significant activations observed would be minimal, if any.
Results
Behavioral Results
To test for effects of length or frequency on subject
performance, we measured subject response accuracy. Based
on previous results, we expected to find a decrease in response
accuracy for low-frequency pseudowords, but we did not
expect to find an effect of length. We performed a 2-way
ANOVA with within-subject factors: length and sublexical
frequency. As expected, we found that there was a significant
main effect only for frequency (F1,12 = 14.6, P < 0.003). No
other main effects or interactions were significant. Mean (±SD)accuracy rates were 64.5% (±15) for low-frequency pseudo-
words and 75% (±13) for high. The relatively low accuracy
scores were expected, considering the nature of the task
(pseudoword repetition) and the noisy environment. All
subjects’ performance accuracy was within 3 SDs of the group
mean (70%, SD = 13).
Finally, to verify that there is a significant difference in
sublexical frequency between the responses, we calculated the
phoneme and biphone PP of the subjects’ overt responses and
performed a 2-sided t-test to compare high- versus low-
frequency responses. For both biphone and phoneme measure-
ments, the differences were significant (t12 = 14.66, P < 0.001,
for biphones and t12 = 15.74, P < 0.001, for phonemes). Mean
(±standard error [SE]) PP scores for high-frequency responses
were 0.0193 (±0.0009) for biphones and 0.3656 (±0.0145) forphonemes. Low-frequency PP scores were 0.0025 (±0.0006)for biphones and 0.1187 (±0.0091) for phonemes. From the
above results, we can conclude that the subjects perceived the
differences between low- and high-frequency targets and
performed the task according to the instructions.
fMRI Results
Phonological Encoding
To map the areas involved in phonological encoding, we
compared the activation levels invoked for processing 4- versus
2-syllable pseudowords (over both low- and high-frequency
syllables). A significant main effect of length (4- greater than
2-syllable stimuli) was observed in a large perisylvian network
extending bilaterally across the STG, the precentral gyrus
(PrCG), and the supplementary motor area (SMA), as well as
the LIFG (cf., Fig. 2A for whole-brain results and Fig. 2C
for significantly activated voxels within the LIFG). The largest
activations were observed in the left hemisphere for a
cluster that covered both the PrCG and STG. In particular
for the STG, the cluster covered a large portion of the middle
and posterior STG including the upper banks of the STS and an
area in the junction between the parietal and the temporal lobe
also referred to as the Sylvian parietotemporal area (SPT; cf.,
Table 2 for the coordinates of the significantly activated areas).
The left STG (LSTG) has been previously implicated in
phonological processing (Indefrey and Levelt 2000, 2004;
Graves et al. 2007), whereas the left PrCG is a known premotor
area and as such it has been associated with phonetic encoding.
A similar effect could also be observed for the LIFG. The
activated area was located on pars opercularis and ran along
the inferior frontal sulcus (IFS). In accordance to our
hypothesis, we expected that both phonological and phonetic
encoding processes would show an effect of length. What
distinguishes the 2 processes is their sensitivity to sublexical
frequency. If a region is involved in phonological processing,
we would not expect it to show significant sublexical
frequency effects. On the other hand, if it is, we would expect
it to show significant effects for both conditions, length and
sublexical frequency.
Phonetic Encoding
Comparing pseudowords with low versus high PP syllables and
segments revealed regions that showed an effect for sublexical
frequency. Based on our hypothesis, areas that showed
a frequency effect reflect the process of phonetic encoding,
that is, articulatory code generation (Indefrey and Levelt 2000).
Four regions showed significant main effects of frequency: the
left hemisphere dorsal PrCG, the left hemisphere SMA (LSMA),
and the inferior frontal gyrus (IFG) bilaterally (cf., Table 2 for
a detailed list of the activated regions and Fig. 2B for a map of
the significantly activated areas). Activity in the LSTG did not
reach significance (P < 0.2 cluster size, FWE corrected).
We also tested for the opposite contrast, high- versus low-
frequency pseudowords in order to see whether the areas
2160 From Phonemes to Articulatory Codes d Papoutsi et al.

associated with retrieving high-frequency, precompiled sylla-
bles from the mental syllabary are different from the ones
associated with online generation of articulatory scores. No
areas showed higher activation for high- versus low-frequency
syllables. There were also no significant interaction effects
between length and sublexical frequency.
Left IFG
To further test our hypothesis about the involvement of Broca’s
area in phonetic processing, we performed an ROI analysis. A
region corresponding to left hemisphere BA44 (center of mass
x = –53, y = 12, z = 19, size = 1160 voxels) was defined using
a cytoarchitectonic probability map of area BA44 (Eickhoff
et al. 2005). In a random-effects 2-way ANOVA with factors
length (4 vs. 2 syllables) and sublexical frequency (low vs.
high), the LIFG showed a main effect for both factors (t12 =1.97, P < 0.04, and t12 = 2.56, P < 0.02, for length and
frequency, respectively).
Because the LIFG showed effects for both length and
frequency, we further investigated whether there were any
signs of functional segregation within the IFG and in particular
the pars opercularis, as had been observed in other studies
(Molnar-Szakacs et al. 2005). For the 2 conditions, length and
frequency, we observed 2 clusters within the LIFG, which were
only partly overlapping (9 voxels out of 82 and 79, respectively,
for the 2 clusters; Fig. 3). The distance between their center of
mass was 9 mm, that is, a factor of 1.5 greater than the
smoothing kernel (6 mm), with the cluster showing a greater
effect of length following the anterior banks of the IFS and
extending more lateral, posterior, and dorsal to the cluster
showing a greater effect of frequency. We will refer to the
cluster identified during the length condition as dorsal pars
opercularis (dPOp) and the cluster identified for the frequency
condition as ventral pars opercularis (vPOp) because of their
anatomical differences and in agreement with previous
evidence.
Both the dPOp and the vPOp exhibited effects of frequency
and length, though the frequency effect for dPOp was just
Figure 2. Surface renderings of significant activations in the whole-brain group analysis for length (A) and sublexical frequency (B). In (A), an extended perisylvian and premotoractivation including the LIFG showed significantly higher activation for 4 versus 2 syllables. In (B), premotor areas including the dorsal PrCG and the IFG bilaterally showedsignificantly higher activation for low- versus high-frequency pseudowords. In (C), we show the main effect of length within left BA44 (significantly activated voxels appear inmagenta) using a small volume correction approach (SVC). BA44 (shaded area) was defined using a cytoarchitectonic probability map of the area (Eickhoff et al. 2005). Maps arethresholded voxelwise at P\0.001 uncorrected and clusterwise at P\0.05 FWE corrected. Color grading in (A) and (B) reflects depth, with brighter voxels on the surface. Themaximum depth of the projected voxels is 20 mm. L, sagittal view of the left hemisphere.
Table 2Brain regions modulated by length and frequency
Contrast Region Coordinates T No. of voxels
x y z
4[ 2 Syllables Left PrCG �56 �4 44 7.87 2097LSTGa �60 �12 4 6.76Left SPT junctiona �56 �38 20 5.82LIFGa �60 4 20 4.63LSMA �4 10 68 7.21 388Right STG 50 �22 8 5.45 393Right SPT junctiona 64 �32 10 5.24Right PrCG 50 �4 40 5.30 176
Low[ high frequency Left PrCG �52 2 40 4.77 138LSMA �4 14 58 4.51 122LIFG �54 12 12 4.01 119Right IFG 50 18 4 4.23 97
Note: regions significantly activated in the group analysis (t144[ 3.1, P\0.05 FWE corrected for
cluster size). Displayed are the contrasts, the coordinates for the voxels of greatest activity within
the activated clusters in MNI stereotaxic space, an anatomical description of the region, the T
value, and the number of significantly activated voxels.aIn the case of very large clusters, multiple peak voxels are reported. They are clustered together
with the last entry to include number of voxels.
Cerebral Cortex September 2009, V 19 N 9 2161

slightly above significance (dPOp frequency: t12 = 2.5, P < 0.06;
vPOp length: t12 = 3.2, P < 0.02 corrected for 2 ROIs). This
difference already suggests that there might be a functional
segregation within the pars opercularis of the LIFG. To further
examine whether there is a functional difference in the
activation between the 2 clusters, we examined the region
(dPOp vs. vPOp) by experimental condition (length vs.
frequency) interaction (Friederici et al. 2006). We performed
a 2-sided paired t-test on the region-specific differences
between the length and the frequency conditions and found
a significant region-by-condition interaction (t12 = 3.1, P <
0.01), indicating that there is a robust difference between the 2
clusters in terms of their response to length and sublexical
frequency effects. DPOp shows greater activation for length
rather than sublexical frequency (mean ± SE length over
frequency difference is 0.093 ± 0.051), whereas in vPOp, there
is almost no difference between the levels of activation for the
2 conditions (mean ± SE length over frequency difference is
0.002 ± 0.026).
Discussion
In this study, we were able to delineate the cortical areas
involved in the phonemic-to-articulatory translation that is
necessary for the generation of articulatory codes. By directly
contrasting targets with varying length, we manipulated the
load on the system of postlexical articulatory-motor production
and were able to identify a number of key regions underlying
articulation and the overall process of transforming phonolog-
ical word forms to articulatory codes. In summary, these
regions included bilateral (although strongly left lateralized)
mid and posterior superior temporal and frontal regions, the
premotor cortex, and the SMA. These results are in agreement
with current models on word production that describe a left-
lateralized, perisylvian network (Indefrey and Levelt 2000,
2004; Hickok and Poeppel 2004, 2007).
To further identify the roles of the different components of
the network and in particular to resolve the conflict on the role
of the LIFG, we probed the network by manipulating sublexical
frequency. Our hypothesis was that only regions that are
directly involved in phonemic-to-articulatory translation would
show an effect for frequency manipulation. Targets with
components of different sublexical frequency (high vs. low)
are processed differently (Guenther et al. 2006). High-
frequency clusters are precompiled and their articulatory
codes are retrieved, as suggested by the fact that they are
processed faster than the ones with less-frequent components
(Vitevitch and Luce 1998, 2005). The latter are thought to be
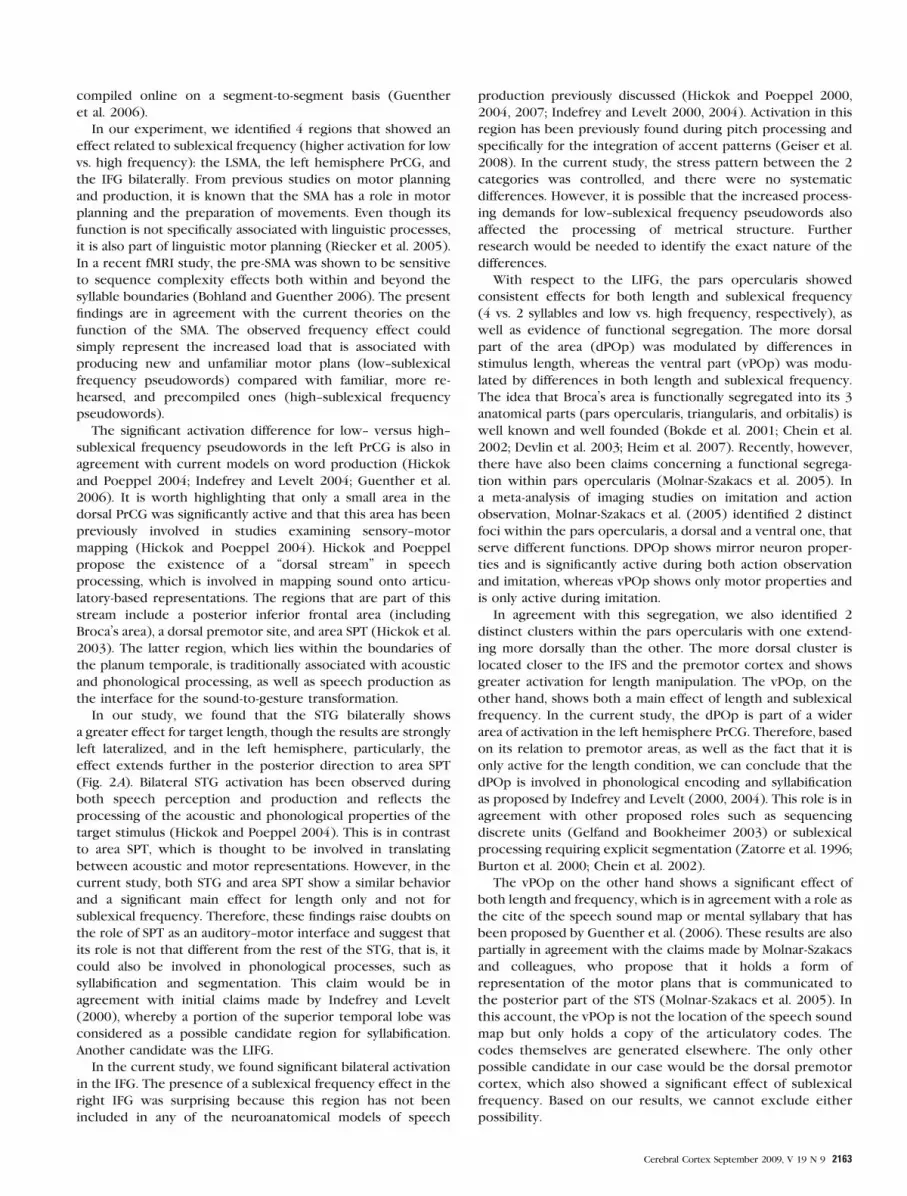
Figure 3. Significant activations within left hemisphere BA44 as defined by a cytoarchitectonic probability map of the area (Eickhoff et al. 2005). Shown in red are voxelssignificantly more activated for 4 versus 2 syllables. This cluster extends from z5 �2 (slice not shown) to z5 28. The largest effect for length is located dorsally, at [�60 4 20].Shown in blue are voxels significantly more activated for low versus high sublexical frequency. The largest effect for frequency is located at [�54 12 12]. Finally, shown in greenare voxels that are overlapping for both conditions (size of overlap 5 9 voxels). Activations are thresholded at P\0.001 uncorrected voxelwise and P\0.05 FWE correctedclusterwise. Z coordinates are in MNI space.
2162 From Phonemes to Articulatory Codes d Papoutsi et al.
compiled online on a segment-to-segment basis (Guenther
et al. 2006).
In our experiment, we identified 4 regions that showed an
effect related to sublexical frequency (higher activation for low
vs. high frequency): the LSMA, the left hemisphere PrCG, and
the IFG bilaterally. From previous studies on motor planning
and production, it is known that the SMA has a role in motor
planning and the preparation of movements. Even though its
function is not specifically associated with linguistic processes,
it is also part of linguistic motor planning (Riecker et al. 2005).
In a recent fMRI study, the pre-SMA was shown to be sensitive
to sequence complexity effects both within and beyond the
syllable boundaries (Bohland and Guenther 2006). The present
findings are in agreement with the current theories on the
function of the SMA. The observed frequency effect could
simply represent the increased load that is associated with
producing new and unfamiliar motor plans (low--sublexical
frequency pseudowords) compared with familiar, more re-
hearsed, and precompiled ones (high--sublexical frequency
pseudowords).
The significant activation difference for low-- versus high--
sublexical frequency pseudowords in the left PrCG is also in
agreement with current models on word production (Hickok
and Poeppel 2004; Indefrey and Levelt 2004; Guenther et al.
2006). It is worth highlighting that only a small area in the
dorsal PrCG was significantly active and that this area has been
previously involved in studies examining sensory--motor
mapping (Hickok and Poeppel 2004). Hickok and Poeppel
propose the existence of a ‘‘dorsal stream’’ in speech
processing, which is involved in mapping sound onto articu-
latory-based representations. The regions that are part of this
stream include a posterior inferior frontal area (including
Broca’s area), a dorsal premotor site, and area SPT (Hickok et al.
2003). The latter region, which lies within the boundaries of
the planum temporale, is traditionally associated with acoustic
and phonological processing, as well as speech production as
the interface for the sound-to-gesture transformation.
In our study, we found that the STG bilaterally shows
a greater effect for target length, though the results are strongly
left lateralized, and in the left hemisphere, particularly, the
effect extends further in the posterior direction to area SPT
(Fig. 2A). Bilateral STG activation has been observed during
both speech perception and production and reflects the
processing of the acoustic and phonological properties of the
target stimulus (Hickok and Poeppel 2004). This is in contrast
to area SPT, which is thought to be involved in translating
between acoustic and motor representations. However, in the
current study, both STG and area SPT show a similar behavior
and a significant main effect for length only and not for
sublexical frequency. Therefore, these findings raise doubts on
the role of SPT as an auditory--motor interface and suggest that
its role is not that different from the rest of the STG, that is, it
could also be involved in phonological processes, such as
syllabification and segmentation. This claim would be in
agreement with initial claims made by Indefrey and Levelt
(2000), whereby a portion of the superior temporal lobe was
considered as a possible candidate region for syllabification.
Another candidate was the LIFG.
In the current study, we found significant bilateral activation
in the IFG. The presence of a sublexical frequency effect in the
right IFG was surprising because this region has not been
included in any of the neuroanatomical models of speech
production previously discussed (Hickok and Poeppel 2000,
2004, 2007; Indefrey and Levelt 2000, 2004). Activation in this
region has been previously found during pitch processing and
specifically for the integration of accent patterns (Geiser et al.
2008). In the current study, the stress pattern between the 2
categories was controlled, and there were no systematic
differences. However, it is possible that the increased process-
ing demands for low--sublexical frequency pseudowords also
affected the processing of metrical structure. Further
research would be needed to identify the exact nature of the
differences.
With respect to the LIFG, the pars opercularis showed
consistent effects for both length and sublexical frequency
(4 vs. 2 syllables and low vs. high frequency, respectively), as
well as evidence of functional segregation. The more dorsal
part of the area (dPOp) was modulated by differences in
stimulus length, whereas the ventral part (vPOp) was modu-
lated by differences in both length and sublexical frequency.
The idea that Broca’s area is functionally segregated into its 3
anatomical parts (pars opercularis, triangularis, and orbitalis) is
well known and well founded (Bokde et al. 2001; Chein et al.
2002; Devlin et al. 2003; Heim et al. 2007). Recently, however,
there have also been claims concerning a functional segrega-
tion within pars opercularis (Molnar-Szakacs et al. 2005). In
a meta-analysis of imaging studies on imitation and action
observation, Molnar-Szakacs et al. (2005) identified 2 distinct
foci within the pars opercularis, a dorsal and a ventral one, that
serve different functions. DPOp shows mirror neuron proper-
ties and is significantly active during both action observation
and imitation, whereas vPOp shows only motor properties and
is only active during imitation.
In agreement with this segregation, we also identified 2
distinct clusters within the pars opercularis with one extend-
ing more dorsally than the other. The more dorsal cluster is
located closer to the IFS and the premotor cortex and shows
greater activation for length manipulation. The vPOp, on the
other hand, shows both a main effect of length and sublexical
frequency. In the current study, the dPOp is part of a wider
area of activation in the left hemisphere PrCG. Therefore, based
on its relation to premotor areas, as well as the fact that it is
only active for the length condition, we can conclude that the
dPOp is involved in phonological encoding and syllabification
as proposed by Indefrey and Levelt (2000, 2004). This role is in
agreement with other proposed roles such as sequencing
discrete units (Gelfand and Bookheimer 2003) or sublexical
processing requiring explicit segmentation (Zatorre et al. 1996;
Burton et al. 2000; Chein et al. 2002).
The vPOp on the other hand shows a significant effect of
both length and frequency, which is in agreement with a role as
the cite of the speech sound map or mental syllabary that has
been proposed by Guenther et al. (2006). These results are also
partially in agreement with the claims made by Molnar-Szakacs
and colleagues, who propose that it holds a form of
representation of the motor plans that is communicated to
the posterior part of the STS (Molnar-Szakacs et al. 2005). In
this account, the vPOp is not the location of the speech sound
map but only holds a copy of the articulatory codes. The
codes themselves are generated elsewhere. The only other
possible candidate in our case would be the dorsal premotor
cortex, which also showed a significant effect of sublexical
frequency. Based on our results, we cannot exclude either
possibility.
Cerebral Cortex September 2009, V 19 N 9 2163

Research into the functional segregation of the pars
opercularis is still in a preliminary phase. The anatomy of the
LIFG is highly variable across subjects (Amunts et al. 1999),
which makes it difficult to draw any precise conclusions about
the exact anatomical borders of the hypothesized segregation
of the pars opercularis based on group-averaged results. For the
purposes of this study, we have also described the functional
segregation of the region using gross anatomical terms such as
ventral and dorsal and only in terms of the group tendency.
Future research using higher spatial resolution at the single-
subject level will be needed to further verify and specify the
exact anatomical features of this functional segregation.
Finally, we also note that we did not find any regions
showing significant effects for the inverse contrast high-- versus
low--sublexical frequency. Based on our hypothesis, we would
expect that a significant activation for this contrast would
reveal the location of the mental syllabary versus the network
underlying articulatory code generation. However, based on
the computational model proposed by Guenther et al. (2006),
the speech sound map (the equivalent of the mental syllabary)
does not just contain precompiled frequent syllables but also
motor representations for phonemes, common words, phrases,
etc. The speech sound map is therefore involved in both
processes, though the online compilation of articulatory codes
would be computationally more demanding than the retrieval
of precompiled gestural scores. This would explain why we do
not see increased activity for high- versus low-frequency
stimuli because it would be the same network that is
underlying both processes.
To conclude, in this fMRI study, we investigated the process
of phonological-to-articulatory translation and the role of the
LIFG. Based on our findings, we conclude that the LIFG, BA44
in particular, is functionally segregated into 2 subregions
following a dorsal--ventral gradient. The dorsal part seems to
be involved at the level of phonological encoding as suggested
by Indefrey and Levelt (2000, 2004), whereas the ventral part
seems to be involved at the level of phonetic encoding and
possibly in the translation between phonemic and articulatory
representations as proposed by Hickok and Poeppel (2000,
2004, 2007). This finding is in agreement with recent
observations on the functional segregation of the pars
opercularis and further clarifies the role of the LIFG in
language production.
Supplementary Material
Supplementary material can be found at http://www.cercor.
oxfordjournals.org/.
Funding
Neuroinformatics Doctoral Training Centre studentship; UK
Engineering and Physical Sciences Research Council; Greek
Bakalas Bros Foundation to MP; Intramural Research Program of
the National Institute on Deafness and Other Communication
Disorders of the US National Institutes of Health; Intramural
Research Program of the National Institute of Neurological
Disorders and Stroke of the US National Institutes of Health to
JAdZ and JMJ.
Notes
We would also like to thank Drs Jason Smith, Jieun Kim, Fatima Husain,
David McGonigle, Allen Braun, and Jeff Duyn for their support and
helpful comments during the design and execution of the study. This
work has made use of the resources provided by the Edinburgh
Compute and Data Facility (ECDF) (http://www.ecdf.ed.ac.uk). The
ECDF is partially supported by the e-Science Data, Information and
Knowledge Transformation (eDIKT) initiative. Conflict of Interest :
None declared.
Address correspondence to Marina Papoutsi, Centre for Speech,
Language, and the Brain, University of Cambridge, Downing Street,
Cambridge CB2 3EB, UK. Email: [email protected].
References
Amunts K, Schleicher A, Burgel U, Mohlberg H, Uylings HB, Zilles K.
1999. Broca’s region revisited: cytoarchitecture and intersubject
variability. J Comp Neurol. 412(2):319--341.
Barch DM, Sabb FW, Carter CS, Braver TS, Noll DC, Cohen JD. 1999.
Overt verbal responding during fMRI scanning: empirical inves-
tigations of problems and potential solutions. Neuroimage.
10(6):642--657.
Birn RM, Bandettini PA, Cox RW, Shaker R. 1999. Event-related fMRI of
tasks involving brief motion. Hum Brain Mapp. 7(2):106--114.
Birn RM, Cox RW, Bandettini PA. 2004. Experimental designs and
processing strategies for fMRI studies involving overt verbal
responses. Neuroimage. 23(3):1046--1058.
Bohland JW, Guenther FH. 2006. An fMRI investigation of syllable
sequence production. Neuroimage. 32(2):821--841.
Bokde AL, Tagamets MA, Friedman RB, Horwitz B. 2001. Functional
interactions of the inferior frontal cortex during the processing of
words and word-like stimuli. Neuron. 30(2):609--617.
Brett M, Anton J, Valabregue R, Poline J. 2002. Region of interest
analysis using an SPM toolbox. Proceedings of the 8th International
Conference on Functional Mapping of the Human Brain in Sendai,
Japan. Vol. 16. Available on CD-ROM in Neuroimage.
Browman CP, Goldstein L. 1988. Some notes on syllable structure in
articulatory phonology. Phonetica. 45(2--4):140--155.
Buracas GT, Boynton GM. 2002. Efficient design of event-related fMRI
experiments using M-sequences. Neuroimage. 16:801--813.
Burton MW, Small SL, Blumstein SE. 2000. The role of segmentation in
phonological processing: an fMRI investigation. J Cogn Neurosci.
12(4):679--690.
Chein JM, Fissell K, Jacobs S, Fiez JA. 2002. Functional heterogeneity
within Broca’s area during verbal working memory. Physiol Behav.
77(4--5):635--639.
Cholin J, Levelt WJ, Schiller NO. 2006. Effects of syllable frequency in
speech production. Cognition. 99:205--235.
de Zwart JA, Ledden PJ, van Gelderen P, Bodurka J, Chu R, Duyn JH.
2004. Signal-to-noise ratio and parallel imaging performance of a 16-
channel receive-only brain coil array at 3.0 Tesla. Magn Reson Med.
51(1):22--26.
de Zwart JA, van Gelderen P, Kellman P, Duyn JH. 2002. Reduction of
gradient acoustic noise in MRI using SENSE-EPI. Neuroimage.
16(4):1151--1155.
Demonet JF, Fiez JA, Paulesu E, Petersen SE, Zatorre RJ. 1996. PET
studies of phonological processing: a critical reply to Poeppel. Brain
Lang. 55(3):352--379.
Devlin JT, Matthews PM, Rushworth MFS. 2003. Semantic processing in
the left inferior prefrontal cortex: a combined functional magnetic
resonance imaging and transcranial magnetic stimulation study.
J Cogn Neurosci. 15(1):71--84.
di Pellegrino G, Fadiga L, Fogassi L, Gallese V, Rizzolatti G. 1992.
Understanding motor events: a neurophysiological study. Exp Brain
Res. 91(1):176--180.
Eickhoff SB, Stephan KE, Mohlberg H, Grefkes C, Fink GR, Amunts K,
Zilles K. 2005. A new SPM toolbox for combining probabilistic
cytoarchitectonic maps and functional imaging data. Neuroimage.
25(4):1325--1335.
Fiez JA, Balota DA, Raichle ME, Petersen SE. 1999. Effects of lexicality,
frequency, and spelling-to-sound consistency on the functional
anatomy of reading. Neuron. 24(1):205--218.
2164 From Phonemes to Articulatory Codes d Papoutsi et al.

Friederici AD, Fiebach CJ, Schlesewsky M, Bornkessel ID, von
Cramon DY. 2006. Processing linguistic complexity and grammat-
icality in the left frontal cortex. Cereb Cortex. 16(12):1709--1717.
Frisch SA, Large NR, Pisoni DB. 2000. Perception of wordlikeness:
effects of segment probability and length on the processing of
nonwords. J Mem Lang. 42:481--496.
Friston KJ, Fletcher P, Josephs O, Holmes A, Rugg MD, Turner R. 1998.
Event-related fMRI: characterizing differential responses. Neuro-
image. 7(1):30--40.
Geiser E, Zaehle T, Jancke L, Meyer M. 2008. The neural correlate of
speech rhythm as evidenced by metrical speech processing. J Cogn
Neurosci. 20(3):541--552.
Gelfand JR, Bookheimer SY. 2003. Dissociating neural mechanisms of
temporal sequencing and processing phonemes. Neuron. 38(5):
831--842.
Goldrick M, Rapp B. 2007. Lexical and post-lexical phonol-
ogical representations in spoken production. Cognition. 102(2):
219--260.
Graves WW, Grabowski TJ, Mehta S, Gordon JK. 2007. A neural
signature of phonological access: distinguishing the effects of word
frequency from familiarity and length in overt picture naming.
J Cogn Neurosci. 19(4):617--631.
Guenther FH, Ghosh SS, Tourville JA. 2006. Neural modeling and
imaging of the cortical interactions underlying syllable production.
Brain Lang. 96(3):280--301.
Hayasaka S, Nichols TE. 2003. Validating cluster size inference:
random field and permutation methods. Neuroimage. 20(4):
2343--2356.
Heim S, Eickhoff SB, Ischebeck AK, Friederici AD, Stephan KE,
Amunts K. 2007. Effective connectivity of the left BA 44, BA 45,
and inferior temporal gyrus during lexical and phonological
decisions identified with DCM [Internet]. Hum Brain Mapp. Avail-
able from: URL http://dx.doi.org/10.1002/hbm.20512. Accessed 6
January 2009.
Hickok G, Buchsbaum B, Humphries C, Muftuler T. 2003. Auditory-
motor interaction revealed by fMRI: speech, music, and working
memory in area Spt. J Cogn Neurosci. 15(5):673--682.
Hickok G, Poeppel D. 2000. Towards a functional neuroanatomy of
speech perception. Trends in Cognitive Science. 4(4):131--138.
Hickok G, Poeppel D. 2004. Dorsal and ventral streams: a framework for
understanding aspects of the functional anatomy of language.
Cognition. 92(1--2):67--99.
Hickok G, Poeppel D. 2007. The cortical organization of speech
processing. Nat Rev Neurosci. 8(5):393--402.
Indefrey P, Levelt W. 2000. The neural correlates of language
production. In: Gazzaniga M, editor. The new cognitive neuro-
sciences. Cambridge (MA): MIT Press. p. 845--865.
Indefrey P, Levelt WJM. 2004. The spatial and temporal signatures of
word production components. Cognition. 92(1--2):101--144.
Jusczyk P, Luce P, Charles-Luce J. 1994. Infants’ sensitivity to phonotactic
patterns in the native language. J Mem Lang. 33:630--645.
Kellman P, van Gelderen P, de Zwart JA, Duyn JH. 2003. Method for
functional MRI mapping of nonlinear response. Neuroimage.
19(1):190--199.
Levelt WJM. 1999. Models of word production. Trends Cogn Sci.
3(6):223--232.
Levelt WJM, Roelofs A, Meyer AS. 1999. A theory of lexical access in
speech production. Behav Brain Sci. 22(1):1--38.
Levelt WJM, Wheeldon L. 1994. Do speakers have access to a mental
syllabary? Cognition. 50(1--3):239--269.
Liberman AM, Mattingly IG. 1985. The motor theory of speech
perception revised. Cognition. 21(1):1--36.
Mazaika P, Whitfield-Gabrieli S, Reiss A. 2007. Artifact repair for fMRI
data from high motion clinical subjects. Poster presented at: 13th
Annual Meeting of the Organization for Human Brain Mapping;
Chicago, IL. Hum Brain Mapp Conf.
Molnar-Szakacs I, Iacoboni M, Koski L, Mazziotta JC. 2005. Functional
segregation within pars opercularis of the inferior frontal gyrus:
evidence from fMRI studies of imitation and action observation.
Cereb Cortex. 15(7):986--994.
Oakes TR, Johnstone T, Walsh KSO, Greischar LL, Alexander AL, Fox AS,
Davidson RJ. 2005. Comparison of fMRI motion correction software
tools. Neuroimage. 28(3):529--543.
Okada K, Hickok G. 2006. Identification of lexical-phonological
networks in the superior temporal sulcus using functional magnetic
resonance imaging. Neuroreport. 17(12):1293--1296.
Pisoni DB, Nusbaum HC, Luce PA, Slowiaczek LM. 1985. Speech
perception, word recognition and the structure of the lexicon.
Speech Commun. 4(1--3):75--95.
Poldrack RA, Wagner AD, Prull MW, Desmond JE, Glover GH,
Gabrieli JD. 1999. Functional specialization for semantic and
phonological processing in the left inferior prefrontal cortex.
Neuroimage. 10(1):15--35.
Riecker A, Mathiak K, Wildgruber D, Erb M, Hertrich I, Grodd W,
Ackermann H. 2005. fMRI reveals two distinct cerebral networks
subserving speech motor control. Neurology. 64(4):700--706.
Rizzolatti G, Arbib MA. 1998. Language within our grasp. Trends
Neurosci. 21(5):188--194.
Rizzolatti G, Craighero L. 2004. The mirror-neuron system. Annu Rev
Neurosci. 27:169--192.
Shuster LI, Lemieux SK. 2005. An fMRI investigation of covertly and
overtly produced mono- and multisyllabic words. Brain Lang.
93(1):20--31.
Vitevitch M, Luce P. 1998. When words compete: levels of processing in
perception of spoken words. Psychol Sci. 9(4):325--329.
Vitevitch MS, Luce PA. 2004. A web-based interface to calculate
phonotactic probability for words and nonwords in English. Behav
Res Methods Instrum Comput. 36(3):481--487.
Vitevitch MS, Luce PA. 2005. Increases in phonotactic probability
facilitate spoken nonword repetition. J Mem Lang. 52(2):193--204.
Vitevitch MS, Luce PA, Charles-Luce J, Kemmerer D. 1997. Phonotactics
and syllable stress: implications for the processing of spoken
nonsense words. Lang Speech. 40(Pt 1):47--62.
Vitevitch MS, Luce PA, Pisoni DB, Auer ET. 1999. Phonotactics,
neighborhood activation, and lexical access for spoken words.
Brain Lang. 68(1--2):306--311.
Zatorre RJ, Evans AC, Meyer E, Gjedde A. 1992. Lateralization of
phonetic and pitch discrimination in speech processing. Science.
256(5058):846--849.
Zatorre RJ, Meyer E, Gjedde A, Evans AC. 1996. PET studies of phonetic
processing of speech: review, replication, and reanalysis. Cereb
Cortex. 6(1):21--30.
Cerebral Cortex September 2009, V 19 N 9 2165