from global village to urban globe. urbanisation and poverty in africa: implications for norwegian...
TRANSCRIPT

From Global Village to Urban GlobeUrbanisation and poverty in Africa:
Implications for Norwegian aid policy
BY:Amin Y. KameteArne Tostensen
Inge Tvedten
Draft final reportJanuary 2001

Urbanisation and Poverty in Africa
1
1 Urbanisation in developing countries,with special reference to Africa
The formation of towns and cities is not an altogether new phenomenon in Africa. One ofAfrica’s present-day megacities, Cairo, can trace its origins back to 3,114 B.C. when the firstknown pharaoh, Menes, founded Memphis where Cairo is located today (Chandler 1994a).Other ancient African towns included Carthage, Aksum, Alexandria, and Meroe. Sub-SaharanAfrica remained predominantly rural up until the ninth century. As from around the year 1000 anumber of cities were founded in the Niger Basin: Kano, Zaria, Timbuktu, Ife, and Oyo. InEastern and Southern Africa the old coastal trading towns of Kilwa and Sofala are well known,and above all Great Zimbabwe in the interior (Chandler 1994b). In general, the pace ofurbanisation in pre-colonial Africa was slow.
The circumnavigation of Africa by Portuguese navigators and the subsequent colonialisation ofthe interior provided a strong impetus for the urbanisation of the continent. The colonial powersfounded new ‘European’ cities and connected them to the hinterland with railways and roads.The main initial functions of the colonial cities were trade and administration (and armygarrisons). Later, mining and manufacturing provided the growth momentum (Christopher andTarver 1994).
The main challenge facing African towns and cities today, however, is the achievement ofeconomic growth and its equitable distribution, so that urban economies can contributeappropriately to national economic development and provide sufficient labour marketopportunities (World Bank 1999). More specifically, the following issues are often beinghighlighted:
• Poverty is increasingly an attribute of urbanisation, and urban poverty exhibits specificfeatures which need to be understood better;
• The environmental problems facing developing countries are increasingly associated withcities and urban centres;
• The proportion of women in migration flows to cities is increasing, and the urbanisationprocess impacts significantly on the status and roles of women;
• Urban areas play a significant role in the democratisation process, through politicalmobilisation as well as local government;
• There is an unequivocal correlation between urbanisation and economic development andgrowth;
• There is a close link between urban and rural development, both in macro-economic termsand through migration and urban-rural links.
Urban areas have until recently received less explicit attention than the countryside in terms ofnational development priorities and development aid. The underlying rationale for this neglectcan be traced to two pervasive perspectives:• That urban areas have always been favoured – by design or default – in development policy
and in the allocation of resources – the ‘urban bias’ thesis (Lipton 1988)• That they are home to only a small proportion of the national population in the developing
world (United Nations 2000)

Urbanisation and Poverty in Africa
2
These ‘anti-urban’ perspectives seem to be changing, however. Sida (1995:10) captures theprospects for and implications of urbanisation by stating that rapid growth in the South is“unprecedented”, arguing that this growth “…constitutes a major transformation … with far-reaching economic, social, cultural and political consequences.” This view is shared by theUnited Nations Centre on Human Settlements (Habitat) which predicts that urban areas will“…be the place where compelling social issues such as poverty, homelessness, crime andunemployment will take on a dimension far bigger and more complex than ever seen before”(Habitat, 1994). Habitat goes on to point out that cities will be the home and workplace for mostof the world’s population, centres of economic activity as well as areas of major pollution andconsumption.
Such a “major transformation” has important ramifications. The urbanisation process bearsdecisively on (i) poverty generation and reproduction; (ii) livelihoods; (iii) gender relations; and(iv) governance.
Considerable emphasis has first of all been given to the role of urban areas in the coping orlivelihood strategies of populations in the developing world (de Haan 1999; Jones and Nelson1999). Indeed, most traditional explanations of urbanisation dwell on economically motivatedmigration geared towards improving or maintaining livelihoods. Urban areas still maintain thisrole in the survival strategies of a substantial section of the rural and urban populations of anyAfrican country.
Linked to survival is the rising phenomenon of poverty. The concentration of poor people inurban areas, themselves being run by impoverished administrations in poverty-strickencountries, has obvious negative implications. In this vein, Nelson (1999:1) bemoans the rapidurban growth “…which has made it next to impossible for urban authorities to provide …services or sufficient employment.” Special social groups, such as the unemployed, women, andthe homeless, are often affected particularly hard. These implications transcend urban borders,linking rural well-being closely to urban well-being.
The management of urban settlements is also important, raising the crucial issue of democraticgovernance. Democratisation goes beyond urban management, however, into transparency,accountability, the rule of law, participation, reciprocity, and trust. What makes democratisationparticularly relevant is the fact that by virtue of various forms of decentralisation, urban centreshave obtained increasing formal authority over their areas of jurisdiction, although oftenstopping short of a genuine devolution of decision-making power.
Linked to decentralisation efforts is the critical issue of local government finance. Centralgovernments in the developing world have, since the adoption of structural adjustmentprogrammes, been decentralising responsibilities without allocating the necessary resources todischarge of them (Wekwete 1992 and 1997). Local authorities are often left with no option butto rely on user charges, fees and rates, in addition to the grants they receive from the centrallevel of the nation-state and foreign donors.
The above picture, to which we will return in more detail later, calls for a re-assessment ofdevelopment assistance policies to urban areas. It indicates that urban areas are becomingincreasingly important, and that they should be considered an integral part of any aid policy anddeemed legitimate targets of aid in much the same way rural areas are. The linkages betweenrural and urban areas entail that, if unattended, the problems of urban areas may spill over into

Urbanisation and Poverty in Africa
3
rural areas. Likewise, development assistance directed exclusively at rural areas cannot beeffective unless the problems and opportunities of the surrounding urban areas are attended to.
Based on the above discussion, it can be argued that the process leading to the development andgrowth of urban areas should be re-examined. An understanding of this process affords us thechance to grasp the dynamics and develop workable intervention strategies (Datta 1990).Urbanisation has implications for economic development and occupies a critical position insustainable development, but this all depends on how well managed the process is (Sida 1995:2;World Bank 1990, 1999 and 2000a).
Intervention in urban areas by way of development assistance is by no means anti-rural.However, while urban areas are indeed linked to rural areas in more ways than one, they dohave their own dynamics and characteristics, and, hence, need their own intervention strategies.Thus, rather than taking an anti-rural stand, this report intends to highlight the specifics of theurban condition, with special reference to the urbanisation of poverty. Nor does this report callfor a complete shift of policy emphasis and allocation of funds. It merely argues for increasingattention to the urban agenda, within a comprehensive development framework where bothurban and rural areas have their legitimate roles to play.
1.1 Urbanisation: a conceptual framework
1.1.1. What is urbanisation?Traditionally, urbanisation has always been perceived in demographic terms, that is, as theincrease in the number of people living in the urban areas. Most commentaries on urbanisationare based on this demographic perspective (Devas and Rakodi 1993; World Bank 2000; UnitedNations 2000).
BOX 1. CONCEPTUALISING ‘URBAN’ AND ‘URBANISATION’
“Urban means city or town … Among the most common definitions [of urbanisation] we found thefollowing:1a. The proportion of the total population living in urban centres;1b. The number of people living there;2a. The growth in the proportion (in per cent) of the population living in urban centres;2.b The growth in the number of people living there;3. The social process by which a population adjusts to the urban way of life;4. The physical spread of built-up land.
[U]rban growth …[means] the net increment of the urban population.”
Source: Sida 1995:64.
While the demographic strand is dominant, it is not the only one. Other strands focus on socio-cultural, economic, administrative and spatial issues. Table 1 captures the essence of thesealternative definitions, which, as noted by Kamete (1999), tend to be biased towards particulardisciplines and professions.

Urbanisation and Poverty in Africa
4
Table 1. Perspectives on urbanisation
Strand DescriptionSocio-cultural Changes in life styles
The adoption of an urban way of life that is consumerist, diverse, sophisticated,etc.
Demographic Describes a certain threshold of population for a settlementEconomic Structural change from an agricultural to a predominantly manufacturing
economySimilar change of occupation for the majority of the working population
Spatial The spreading of ‘urban’ functions into agricultural landThe concentration of people in limited spaces
Legal-administrative
Designated as urban according to the laws and policies of the land
1.1.2. What is urban ?
As with ‘urbanisation’, the term ‘urban’ has also been conceptualised variously. Functionally, acentre becomes urban because most of its economic activities are in the non-extractive sector.Thus, a centre of settlement that relies heavily on manufacturing and service sectors is urban. Aplace may also become urban because its population size has surpassed a certain threshold.Most countries put this at a minimum of 2,500 people (World Bank 1999:127). Thisclassification is often qualified by other criteria, such as compactness and density (see Box 2).A place only becomes urban if this threshold population is adequately concentrated in a limitedarea, defined by, for example, administrative boundaries.
Again, it should be emphasised that the alternative classifications based on socio-cultural,economic, administrative and spatial criteria are difficult to establish and not likely to generateconsensus. Demographic criteria carry the day when it comes to real decision-making, eventhough the economic criterion sometimes enters as an important additional factor.
BOX 2. DESIGNATING ‘URBAN’ AREAS IN ZIMBABWE
The Central Statistical Office (CSO) (1993) of Zimbabwe has adopted a multidimensional approachto the demarcation of urban areas. To pass the urban test an area should:Have been administratively declared as an urban areaHave a population of at least 2,500Have a compact population patternHave the ‘majority’ of its workforce engaged in non-agricultural activities
1.2 What causes urbanisation?
1.2.1 The standard explanationsTraditional geographical and economic explanations of urbanisation tend to focus on populationgrowth induced by internal rural-urban migration (see, for example, Todaro 1989; Devas andRakodi 1993; World Bank 1995). Until recently, policies and strategies were almost silent onthe role of natural increase in urban growth.
In Africa, most of the factors causing rural-urban migration have been seen to be economic(Todaro 1989), reduced to the standard ‘push-pull’ factors. People are ‘pushed’ out of poverty-stricken rural areas which depend on low-yielding rural subsistence agriculture, and ‘pulled’ tothe urban areas by the perceived higher wages and better opportunities in these centres (Todaro

Urbanisation and Poverty in Africa
5
1989). Such economic theories have not gone unchallenged (Tolley and Thomas 1987), but theystill tend to dominate the debate.
In addition to the push of rural poverty and the pull of a perceived better life in urban areas,socio-political upheavals (civil strife, civil wars or international wars – see Box 4) and naturaldisasters (principally droughts and floods) in the countryside often result in people seekingrefuge in relatively secure urban areas. The continuation of these inflows and the length of therefugees’ sojourn in the urban areas depend on the persistence of the original stimuli. Continuedurban residence also depends on how well the refugees or internally displaced persons fit intothe urban ways of life and adopt an urban lifestyle (Gmelch and Zenner 1996). Some neverreturn to the rural areas, while others adapt to a quasi-urban existence by splitting householdsand ‘straddling’ urban and rural areas.
BOX 3. POST-INDEPENDENCE URBANISATION IN ANGOLA
“Rural urban migration constitutes one of the most serious problems of Angola. … The migration tocities is not generally brought about by the search for employment. … Migration occurs due to thesearch for basic services which can only be found in cities. … [A]n extremely important componentof internal migration is the forced migration of people motivated by civil war that attracted migrantsto cities. … The urbanisation process has been extended by severely deficient living conditions.Besides Luanda, the private economic and administrative centres of Malange, Huambo, Benguela,and Lobito are the main urban agglomerations whose populations range from 150 to 300 thousandinhabitants.”
Source: Amado et al. 1994:1122–1123
1.2.2 The importance of natural increaseNotwithstanding the importance of rural-urban migration in urban growth, the contribution ofthe “natural growth of the existing urban population” (Devas and Rakodi 1993:22) tourbanisation is increasingly being acknowledged. For example, less than half of Harare’s urbanpopulation growth between 1982 and 1992 was due to migration (CSO 1993). Indeed, thegrowth of cities can no longer be regarded simply as a problem of migration (Devas and Rakodi1993:23). It is suggested that the young age of most migrants contributes to higher naturalincreases. According to Rakodi and Devas (1993:24) over 54 per cent of the urban growth inKenya is attributable to natural increase. It is now generally agreed that migration is mainlyimportant in the early stages of urbanisation. Thereafter, natural population growth takes over asthe dominant contributory factor in urban growth. (IIED in Sida 1995:13).
BOX 4. URBANISATION IN AFRICA: CAUSE AND EFFECT?
“The high rate of urbanisation poses developmental problems for governments and people concerned.… (It) is mainly due to rural-urban migration, high urban natural increase, and to an expansion ofurban boundaries as well as to interethnic wars. Also non-spatial factors have significant impacts …such as non-spatial policies which include fiscal, industrial, defence, equalisation, and agriculturaland immigration policies.”
Source: Obudho and Obudho 1994:53
Sida (1995:17) maintains that more than 50 per cent of the urban growth of the developingworld stem from natural population growth within the urban areas. Migration (35–40 per cent)and boundary changes (10–15 per cent) account for the remainder. Table 2 provides the globalpicture for the developing regions.

Urbanisation and Poverty in Africa
6
Table 2. The contribution of natural increase to urban population growth in developing regions
Region Contribution of natural increase (per cent)Africa 61Latin America 73Asia 44
Source: Adapted from Sida (1995:17).
1.2.3 The urban sprawlThe spatial expansion of urban areas has not been looked at as an urbanisation issue proper(Kasarda and Crenshaw 1991:470). Rather, analysts chose to call it urban sprawl (Lim, 1987).However, the fact remains that as urban areas expand outwards and incorporate surroundingnon-urban land to make way for industrial or housing development, urbanisation is taking place(Obudho and Obudho1994:53; see Box 4). The size of the urban population increases, and theproportion of rural land and rural population goes down. For example, Zimbabwe’s secondlargest city, Bulawayo, started off as a small urban settlement of less than one square kilometrein surface area. Slightly over a century later, the city is a sprawling settlement of about 600 km2.The city still continues to grow as it encroaches on surrounding rural land (Kamete 2000).
1.3 Urbanisation trends in Africa
1.3.1 Global and continental picturesTable 3 gives figures on urban population as a proportion of total population in the world.1
Between 1950 and 1975 Africa was the least urbanised continent. The table shows that Africahas began outpacing Asia in terms of urbanisation, but that the percentage of the populationcurrently residing in urban areas still remains below half. It is expected to pass the halfwaymark between 2020 and 2025, by which time 52 per cent of the population in Africa will beurbanised. Considering the relatively low proportion of urban population in Africa, the potentialfor urbanisation is still high (Wekwete 1990).
This perhaps explains the high annual growth rates in urban populations depicted in Table 4. Itis shown here that Africa consistently registered the highest annual urban growth rates duringthe period in question. Indications are that it will continue to have the highest growth rate, atleast for the next 30 years. Within fifty years from 1950, the proportion of urban populationincreased more than two and a half times, and by 2025 it will have increased by three and a halftimes.
While the pace of urbanisation is slowing down (see Table 4), the fact remains that in absoluteterms the level and rapidity of urbanisation in Africa is significant. In absolute terms, between1950 and 1975 the African urban population rose by 70 million; between 1975 and 2000 it rose
1 It is important to note that the figures used throughout this report are official statistics from the countriesconcerned or international agencies. Apart from the confusion arising from the various definitions of urban andadministrative boundaries, figures about the future are based on extrapolations of past trends. Some of thesepast trends are themselves extrapolations; hence the periodic revisions by some agencies such as the UnitedNations. In any case the extrapolations do not take into account important changes in, say, the economic,administrative or political landscape (Sida 1995:11). Nevertheless, these numbers are useful for comparisonand analysis.

Urbanisation and Poverty in Africa
7
by a further 195 million. The next 30 years will see the figure rise by 469 million, an increase15 times the 1950 urban population figure.2
Table 3. Urban population as a percentage of total population by region
Geographic region Year1950 1975 2000 2025
Africa 15 25 38 52Asia 17 25 37 51Latin America and the Caribbean 41 61 75 82Europe 52 67 75 81North America 64 74 77 83World 30 38 47 58
Source: Adapted from United Nations (2000)
Table 4. Average annual growth rate of urban populations by region
Geographic region Year1950–1955 1975–1980 2000–2005 2025–2030
Africa 4.5 4.4 3.7 2.6Asia 3.7 3.5 2.5 1.7Latin America and the Caribbean 4.5 3.5 1.9 1.1Europe 2.0 1.1 0.3 -0.03North America 2.7 1.0 1.0 0.7World 3.0 2.6 2.0 1.5
Source: Adapted from United Nations (2000)
1.3.2 Regional and country picturesThis section discusses urbanisation trends in different regions of Africa. Eastern Africa with 18countries (see Table 6) is the least urbanised of the five regions. It will maintain this positionbeyond 2025. In this region Djibouti (at 83 per cent) is the most urbanised, while Rwanda (atabout 6 per cent) is the least urbanised.
Table 5. Urban population as a percentage of total population by African region
Geographic region Year1950 1975 2000 2025
World 30 38 47 58Africa 15 25 38 52Eastern Africa 5 12 26 41Middle Africa 14 27 35 50Northern Africa 25 39 51 64Southern Africa 38 44 48 60Western Africa 10 23 40 56
2 Put differently, this increase alone is about 1,470 per cent of the total 1950 population figure.

Urbanisation and Poverty in Africa
8
Source: Adapted from United Nations (2000)
Northern Africa has over half its population living in urban areas, up from 39 per cent in 1975.Southern Africa is second at 48 per cent, followed by Western Africa at about 40 per cent.Currently the most urbanised country in Africa is Libya at 87 per cent, followed by Djibouti (83per cent) and Reunion at 71 per cent.

Urbanisation and Poverty in Africa
9
Table 6. Current urbanisation indicators in all African countries
Country Total urbanpopulation
(thousands) (2000)
Percentageresiding in urban
areas (2000)
Annual urbanpopulation growthrate (2000 2005)
World 2,245,049 38 2.0Africa 297,239 47 3.7
Eastern Africa 64,576 26 4.6Burundi 600 9 5.9Comoros 231 33 4.3Djibouti 531 83 2.3Eritrea 722 19 4.6Ethiopia 11,042 18 5.0Kenya 9,957 33 4.1Madagascar 4,721 30 4.8Malawi 2,723 25 7.3Mauritius 478 40 1.6Mozambique 7,917 40 4.1Reunion 496 71 1.9Rwanda 476 6 4.2Seychelles 49 64 2.2Somalia 2,776 28 5.2Uganda 3,083 14 5.7Tanzania 11,021 33 5.4Zambia 3,632 40 2.6Zimbabwe 4,121 35 2.9
Middle Africa 33,859 35 4.3Angola 4,404 34 4.9Cameroon 7,379 49 4.0Central African Republic 1,489 41 3.0Chad 1,820 24 4.2Congo 1,841 63 3.7Democratic Republic of theCongo
15,641 30 4.5
Equatorial Guinea 218 48 4.5Gabon 998 81 3.1Sao Tome and Principe 69 47 3.3
Northern Africa 87,949 51 3.0Algeria 18,969 60 3.1Egypt 30,954 45 2.3Libya 4,911 88 2.6Morocco 15,902 56 2.8Sudan 10,652 36 4.5Tunisia 6,281 66 2.3Western Sahara 220 95 3.3
Southern Africa 22,546 48 1.5Botswana 815 50 2.22

Urbanisation and Poverty in Africa
10
Lesotho 602 28 4.6Namibia 533 31 2.8South Africa 20,330 50 1.3Swaziland 266 26 4.0
Western Africa 88,210 40 4.2Benin 2,577 42 4.4Burkina Faso 2,204 19 5.6Cape Verde 266 62 4.0Côte d’Ivoire 6,854 46 3.4Gambia 424 33 4.5Ghana 7,753 38 4.2Guinea 2,435 33 4.6Guinea Bissau 288 24 4.0Liberia 1,416 45 4.9Mali 3,375 30 4.6Mauritania 1,541 58 4.3Niger 2,207 21 5.5Nigeria 49,050 44 4.1Saint Helena 4 71 2.3Senegal 4,498 48 4.0Sierra Leone 1,779 37 4.0Togo 1,540 33 4.2
Source: United Nations (2000)
Table 7. Projected annual urban growth rates in Africa (2000 2005)
Country Growth rate(2000 2005)
Region
Malawi 7.2 EasternUganda 5.7 EasternBurkina Faso 5.6 WesternNiger 5.5 WesternTanzania 5.4 EasternSomalia 5.2 EasternEthiopia 5.0 EasternZimbabwe 2.9 EasternMorocco 2.8 NorthernLibya 2.6 NorthernDjibouti 2.4 EasternAlgeria 2.3 NorthernTunisia 2.3 NorthernSeychelles 2.2 EasternReunion 1.9 EasternMauritius 1.6 EasternSouth Africa 1.3 Southern
Source: United Nations 2000:60

Urbanisation and Poverty in Africa
11
As Tables 5 and 6 indicate, there seems to be no clear relationship between regional locationand national levels of urbanisation. Currently, Eastern Africa, which has the lowest overallurbanisation level, has some of the most highly urbanised economies, like Djibouti (83 percent), Reunion (71 per cent) and the Seychelles (64 per cent). These levels exceed somecountries in Northern Africa, which at 51 per cent, is the most urbanised region in Africa.Examples are Egypt (45 per cent) and the Sudan (36 per cent).
BOX 5. URBAN GROWTH AND ECONOMIC TRENDS IN URBANISATION IN ZAMBIA
“In the post-independence period rapid growth in urban population occurred, in response partly to theremoval of restriction on freedom of movement, partly to the failure of development policies toequalise urban and rural income opportunities, and partly to the growth in employment opportunitiesin urban areas.
[R]apid national economic growth in the years following independence … based on high copperprices on the world market and increased government investment was accompanied by an increase inurban jobs. [B]y the early 1970s Zambia was a relatively prosperous middle income country.However its economy was heavily dependent on copper which accounted for 90 per cent of itsexports. In 1971 and again in 1974 copper prices fell drastically. … Its economy was furtherdamaged by oil price increases of the early and late 1970s. [T]he volume of migration was reduceddue to the decline in economic opportunities and an increasing proportion of urban growth could beattributed to natural increase.”
Source: Rakodi 1994:346–348
The annual urban growth rate is equally difficult to explain by region. Table 8 depicts no clearpattern. Eastern Africa again dominates the list, not only of the fastest growth but also of theslowest. Of the seven countries with rates of at least five per cent, five are in Eastern Africa.The other two are in Western Africa. Of the ten countries with urban growth rates below threeper cent, half are in Eastern Africa. Northern Africa contributes four countries to this list, andSouthern Africa a single case. It can be concluded that the evidence at hand suggests no clearregional pattern. In view of this inconclusive picture, the process of urbanisation is perhaps bestexplained by reference to country-specific conditions.
1.3.3 Is urbanisation correlated with national prosperity?In Africa, there is no apparent correlation between the level of urbanisation and nationaleconomic well-being. The figures on the Human Development Index (HDI)3, HDI rank and theGross Domestic Product (GDP) per capita, as shown in Table 7, do not validate the argumentthat the most urbanised nations are also the richest. In other words, the table implies that usingthe level of urbanisation as a proxy indicator of wealth or poverty is unjustified. With referenceto the less developed countries of Africa, therefore, the kind of positive relationship betweenurbanisation and economic development asserted by the World Bank (2000a:36) and cautiouslytreated by Simon (1997) is not borne out by the available evidence.
3 The HDI is based on three indicators: longevity, as measured by life expectancy at birth; educationalattainment as measured by a combination of literacy rate (two-thirds weight) and the combined gross ofprimary, secondary and tertiary enrolment (one-third weight); and standard of living, as measured by GDP percapita (PPP US$) (UNDP 2000:269).

Urbanisation and Poverty in Africa
12
Table 8. Comparing the level of urbanisation and the Human Development Index (HDI) and Gross DomesticProduct (GDP) per capita for the most and least developed countries in Africa
HDI rank value (1998)Country Urbanisationlevel (per
cent) Value Rank
GDP per capita 1998(1995 US$)
MOST URBANISEDDjibouti 83 0.447 149 742Gabon 81 0.592 123 4,360Tunisia 66 0.703 101 2,283Seychelles 64 0.786 53 7,192Congo 63 0.507 139 821
LEAST URBANISEDRwanda 6 164 227Burundi 9 0.321 170 147Uganda 14 0.409 158 332Ethiopia 18 0.309 171 110Eritrea 19 0.408 159 175Sudan 26 0.477 143 296
OTHER DEVELOPMENT AID RECIPIENTSSouth Africa 50 0.697 103 3,918Zambia 40 0.420 153 388Mozambique 40 0.341 168 188Zimbabwe 35 0.555 130 703Angola 34 0.405 160 527Tanzania 33 0.415 156 173Malawi 25 0.385 163 166
Source: Adapted from United Nations (2000); UNDP (2000); World Bank (1999)
Interestingly, the World Bank (1999:130) now admits that while it is true that “urbanisation istypically associated with rising per capita income” … in Europe, Latin America, and … muchof Asia” … Africa has been the exception.” In a more recent publication the Bank boldlyreiterates this observation, pointing out that “…sub-Saharan Africa has been a notable exceptionto …(the) rule…” where “national economic growth is closely correlated with urbanisation”(World Bank 2000a: 36). Box 7 gives further details on Africa’s unique situation in this regard.

Urbanisation and Poverty in Africa
13
BOX 6. LINKING URBANISATION AND ECONOMIC PROSPERITY:IS AFRICA THE ODD ONE OUT?
“Africa has been the exception,” says the World Bank (1999:130). In the 25 years from 1970 to 1995Africa experienced an average annual urban population growth rate of about 4.7 percent. GrossDomestic Product per capita dropped by 0.7 percent. The World Bank maintains that this is a uniquephenomenon “…even among poor countries.” In view of this, the Bank concludes that African cities“are not serving as engines of growth and structural transformation.”
Diagnosing the problem, the Bank traces the causes to “distorted incentives” whose effect is drawingpeople to cities, not for opportunities, but primarily to benefit from state subsidies. This analysisconfirms the urban bias thesis, claiming as it does that urban consumers are favoured “over ruralproducers” due to biased pricing and trade policies.
1.3.4 A closer look at Norway s development aid recipientsThe discussion below will focus on Norway’s most important development aid recipients inAfrica: Angola, Eritrea, Ethiopia, Malawi, Mozambique, South Africa, Sudan, Tanzania,Uganda, Zambia and Zimbabwe. Tables 9 and 10 provide insights into the trends in thecountries regarding levels of urbanisation and annual urban growth rates.
Table 9. Proportion of population residing in urban areas in Norway sdevelopment aid recipients in Africa 1950 2025. Per cent.
Country Year1950 1975 2000 2025
World 30 38 47 58Africa 15 25 38 52Angola 8 18 34 51Eritrea 6 12 19 33Ethiopia 5 10 18 32Malawi 4 8 25 52Mozambique 2 9 40 57South Africa 43 48 50 62Sudan 6 19 36 55Tanzania 4 10 33 52Uganda 3 8 14 26Zambia 9 35 40 52Zimbabwe 11 20 35 52
Source: Adapted from United Nations (2000).
Currently, the most urbanised country in this group is South Africa, with exactly half of itspopulation living in urban areas. Zambia and Mozambique come second with 40 per cent.4 Witha level of only 14 per cent Uganda is the least urbanised.
4 In fact, Mozambique is slightly more urbanised at 40.2 per cent compared to Zambia’s level of 39.6. The ‘tie’results from the rounding of figures.

Urbanisation and Poverty in Africa
14
Four of the countries – Mozambique, Sudan, Zambia and South Africa – have levels ofurbanisation at more than 40 per cent. The levels in another three – Eritrea, Ethiopia andUganda – are below 20 per cent. The remaining four are in the 25–35 per cent range. By 2025all but three of the countries (Malawi, Uganda and Ethiopia) will have more than half of theirpeople residing in urban areas. All 11 will have a quarter of their population urbanised. Theaverage level will then be just above 48 per cent.
On average the urban growth rate now stands at 4.4 percent (see Table 10), expected to drop tothree per cent between 2025 and 2030. With 6.1 per cent Mozambique has the highest averageannual urban growth rate over the period of analysis. South Africa has the lowest with 2.1 percent. Ten of the eleven recipients registered an average annual urban growth rate of at least fourper cent.
Malawi’s current urban growth rate of 7.3 per cent is the highest for the 2000–2005 period.Apart from increasing natural growth, this may be a result of people leaving the congested ruralagricultural lands of this tiny country for the towns and cities. The highest rate (11.2 per cent)ever recorded was that for Mozambique in the 1975–1980 period. This can in part be accountedfor by the urban influx generated by the intense civil war that followed independence fromPortugal in 1975. Even though official statistics are unavailable, Angola’s pace of urbanisationhas been similarly rapid; the capital city, Luanda, is estimated to have grown from about 1.5million to 3.5 million in the past eight years.
Table 10. Average annual growth rate of urban population in Norway smain development aid recipients in Africa 1950 2030. Per cent.
Country Year1950–1955 1975–1980 2000–2005 2025–2030 Average
Africa 4.5 4.4 3.7 2.6 3.8World 3.0 2.6 2.0 1.5 2.3Angola 4.7 6.0 4.9 3.2 4.7Eritrea 5.4 4.6 4.6 3.4 4.5Ethiopia 5.4 4.4 5.0 4.0 4.7Malawi 4.1 6.8 7.3 3.2 5.4Mozambique 6.1 11.2 4.1 2.8 6.1South Africa 3.1 2.3 1.3 1.5 2.1Sudan 7 4.1 4.5 2.2 4.5Tanzania 4.6 10.7 5.4 2.8 5.9Uganda 8.1 4.3 5.7 4.3 5.6Zambia 9.2 6.1 2.6 2.6 5.1Zimbabwe 5.2 5.6 2.9 2.1 4.0AVERAGE 5.4 5.6 4.2 2.8 4.8
Source: Adapted from United Nations (2000)
In absolute terms South Africa has the largest urban population of just over 20 million. Three ofthe remaining Norwegian aid recipients (the Sudan, Ethiopia and Tanzania) have urbanpopulations of more than 10 million each. Mozambique, Zimbabwe and Angola all registerurban population of more than 4 million respectively. Malawi, Uganda and Zambia each have

Urbanisation and Poverty in Africa
15
more than 2 million people resident in their respective urban areas. Eritrea is a solitary case atless than one million urban residents. The potential for further urban growth is considerable,especially in view of the fact that there is still a lot of ‘room’ in urban areas, because densities“in terms of persons per hectare” in the towns and cities are relatively low (Sida 1995:13).
In economic terms three of the aid recipients – Malawi, Tanzania and Eritrea – had in 1998 aGDP per capita of less than US$ 200. Only Zimbabwe (US$ 703) and South Africa (US$ 3,918)had GDP per capita levels of more than US$ 700. The levels for the rest range from slightlyabove US$ 225 to a little less than US$ 400. In terms of economic performance three of thecountries (Zambia, Zimbabwe and Eritrea) had negative GNP growth rates for the period 1997–98. Table 11 captures the picture. It shows Mozambique’s huge economic growth rate of 11.3per cent compared to an urban population growth rate of 4.1 per cent. Angola (7.9 per cent) alsoperformed well, as did Uganda (5.8 per cent). Incidentally, these are the only countries withGNP growth rates exceeding their annual urban growth rates. The remaining countries – whoseGNP growth rates range between less than one per cent and just above three per cent – haveannual urban growth rates which exceed their GNP growth rates.
While the urban growth rates can be explained it is more difficult to provide a simpleexplanation of the economic performance presented above. International conditions are a factorto consider but they do not have the same effect on these countries. A case in point is the rise inoil prices (see Box 6). Whereas most countries suffered economic setbacks as a result of the oilshocks, Angola, by virtue of being an oil producer benefited from soaring oil revenue. Differentnational contexts and global forces thus offer a possible explanation for the plight of Norway’sdevelopment aid recipients (see Simon 1997). For example, Zambia’s reliance on copper in asituation of tumbling copper prices on the world market offers a possible explanation (Rakodi1994:346, see Box 6). Zimbabwe’s strained relations with its major creditors and donors,coupled with adverse socio-political and economic environments, may shed light on its badperformance.

Urbanisation and Poverty in Africa
16
However, these explanations are inadequate and a conclusive diagnosis in the context of thisreport would be too ambitious. It remains clear, however, that the situation in the urban centresof the countries in question is not attractive and not conducive for the well-being of theresidents (see Box 9). It is particularly disturbing that the urban populations are growing. Someanalysts (Jones and Nelson 1999) have pointed out that this may mean the urbanisation ofpoverty, resulting from “urbanisation without growth” (World Bank 1999:130).
Table 11. Urbanisation and economic growth indicators in Norway smain development aid recipients in Africa
Country Total urbanpopulation(thousands)
(2000)
Percentageresiding in urban
areas (2000)
Urban populationgrowth rate(2000 2005)
GNP growth rate(Average annual
percentage)(1997 1998)
World 2,245,049 38 2.0Africa 297,239 47 3.7Angola 4,404 34 4.9 7.9Eritrea 722 19 4.6 -4.0Ethiopia 11,042 18 5.0 -0.8Malawi 2,723 25 7.3 1.8Mozambique 7,917 40 4.1 11.3South Africa 20,330 50 1.3 0.6Sudan 10,652 36 4.5 -Tanzania 11,021 33 5.4 3.2Uganda 3,083 14 5.7 5.8Zambia 3,632 40 2.6 -1.8Zimbabwe 4,121 35 2.9 -0.4
Source: Adapted from United Nations (2000); World Bank (1999)
It is evident from the scenario depicted above that Norway’s main partners in Africa are not anexception to the phenomenon of rapid urbanisation, albeit perhaps a latecomer compared toother regions of the world. While explanations may differ in emphasis on economic, politicaland cultural factors, there is one indisputable conclusion: the growth of the economies is notable to match urban growth, let alone handle it. This prospect is particularly disconcerting inview of the fact that urban growth in these countries, like elsewhere in Africa, is not showingappreciable signs of slowing down.
The symptoms of the situation depicted in the tables and figures above manifest themselves indeplorable living conditions in the urban centres: urban poverty, inadequate or unavailable basicservices, increasing vulnerability, marginalisation and exclusion (Potts 1997). For furtherdiscussion see next chapter.

Urbanisation and Poverty in Africa
17
1.4 Why do cities continue to grow?As noted above, urbanisation has been rapid in Africa. This trend, though perhaps tapering offsomewhat and varying from one country to another, is still phenomenal. There has to be anexplanation why urban areas continue to grow, despite polices designed to reverse the trend insome countries (de Haan 1999). Figure 2 addresses this issue.
From purely economic and geographical perspectives, internal mechanisms in urban areaspromote sustained growth, linked to their position as production zones. It is acknowledged thaturban centres produce a substantial proportion of the national income in most countries.Globally, urban areas account for some 55, 73, and 85 per cent of the GNP in low-income,middle-income and high-income countries, respectively (World Bank 1999:126). This isexplained by the fact that the “…growth sectors of the economy – manufacturing and services –are concentrated in cities where they benefit from agglomeration economies, ample markets forinputs, outputs, and labour and where ideas and knowledge are rapidly diffused” (World Bank1999:126). In urban areas the proximity of all production factors makes economic activitypossible and productive. Because of these locational advantages and agglomeration economiesurban centres continue to grow as they attract outsiders and retain and help to expand thoseeconomic players who are already in. It is a truism that labour is attracted to and retained inareas where economic activities are concentrated (Todaro 1994). Hence, urban areas continue togrow by virtue of the inherent economic growth dynamic created.
FIG. 1. WHY CITIES CONTINUE TO GROW
Another, complementary explanation is that towns and cities, despite all their negative features(see below), provide a much better option for livelihood than their rural hinterland. In the latter,farms are increasingly becoming smaller, sub-economical and eventually unable to feed thefarmers’ households. Similarly, mining operations located in rural areas are being adverselyaffected by low commodity prices on the world market (Box 6; Rakodi 1994:346; Sida 1995:18;
Continuedurban
growth
Economicsecurity
Livelihoodtrack record
Young urbanpopulations
Permanenturban residents
Portfoliodiversification
Cities Work
Agglomerativeforces
Locationaladvantages

Urbanisation and Poverty in Africa
18
Kamete 1999). Left with no better option for their livelihood, the struggling rural-based peoplemove to or remain in the cities, inhospitable though they may be.
In addition, urban areas seem to have established a livelihood track record. The World Bankmaintains that people move to the city in expectation of a better life and that the evidence athand proves that these expectations have largely been met (World Bank 1995:1). This fact iswell known by people in the rural and urban areas alike. As a result, those already in the city optto remain there, and those in the rural areas choose to join the ranks of the urbanites. As aconsequence, urban growth continues relentlessly.
Furthermore, for some poor households (both rural and urban) the opportunities offered byurban areas continue to form part of their livelihood strategies. These people straddle the rural-urban divide (Beall et al. 1999). They have learned to rely on both systems (rural and urban) tosurvive. This, as de Haan (1999:13) proposes, is “…a form of portfolio diversification byfamilies.” As long as this strategy is a workable option cities and towns will continue toexperience the impact of such strategic considerations at the household level. Urban growth willcontinue as new families diversify and those in the towns and cities remain there for life.5
The age structure of the urban population explains the boom in natural increase (Devas andRakodi 1993; World Bank 1999). Urbanites are predominantly young, in reproductive age witha wish to have children. In the case of Anglophone Southern Africa, the erstwhilepreponderance of single men in the town and cities has giving way to urban families. This,again, bolsters natural population increase.
Linked to the above, as well as to the question of livelihood strategy, is the current situation thatinduce some people to remain urbanites for life. In colonial South Africa and Zimbabwe blackswere temporary sojourners in urban areas, controlled by means of strict influx controllegislation (Levi 1982; van Onselen 1976). They only remained in the cities as long as theywere useful as gainfully employed workers. When losing one’s job or becoming old, returningto the rural areas to die was the only option available, or to wait until another job was found(Mafico 1990; Kamete 1998). However, with the coming of independence, the repeal ofcolonial influx control laws and mounting economic pressures, the majority of urban residentshas opted to remain in the cities and towns for life; their rural homeland only feature in theirplans as a burial ground.
The foregoing analysis seems to suggest that urban areas have an in-built mechanism to initiateand sustain growth. This analysis is perhaps a befitting summary of all the reasons cited aboveand the World Banks firm conviction that “cities work” (World Bank 1991:18).
1.5 Urban settlements in contextUrban centres can be classified according to various criteria as applied in Southern Africa inTable 12 below. Kamete (1999:5) cautions, however, that the classifications adopted “are notexclusive, neither are they foolproof.” For example, some mining towns can also be agriculturaltowns; border towns can also double as manufacturing towns and/or as agricultural servicecentres. Similarly, size, local authority type and economic function can ‘stand in each other’sway’ as a definitive category for a given centre is being sought. Thus, it is important to note that
5 Based on evidence from Zimbabwe Potts (1995) argues that due to deepening urban poverty some urbanitesare retracing their steps back to the rural areas.

Urbanisation and Poverty in Africa
19
urban centres are not viewed as uniform entities in terms of size, function and conditions. Theydiffer, sometimes quite significantly, even within the same national borders. What makes thiseven more intricate is the fact that the same urban centres may have boundaries that are vieweddifferently by different stakeholders and for different purposes. In this way administrativeboundaries may not be coterminous with electoral constituency boundaries; and functionalboundaries for health, education and rating purposes may not agree with electoral,administrative boundaries, let alone other functional divisions (Kamete 2000). In addition, thereis no guarantee that these will be the same for census purposes.
The World Bank (1999:128) stresses that small and medium-sized centres (however defined)will be home to “most of the world’s population” in the future. These centres are growing fasterthan the larger cities – a manifest feature since 1970. The very definition of what is a smallurban centre and what is a medium-sized one is not conclusive as it differs across regions andcountries. In 1998 the United Nations specified some criteria for defining cities according tosize. Table 13 captures these criteria. The 1999 revision of population projections (UnitedNations 2000:7) seems to have adjusted the threshold criteria upwards, as reflected in Box 8.
Table 12. Classifications of urban centres
CLASSIFICATIONTYPE
DESCRIPTION EXAMPLES
Size According to population Centres classified as small, medium(intermediate) and large based mainly onpopulation thresholds
Local authority type According to the localauthority type in chargeof the area
City Council (Zambia, Zimbabwe), municipality(Zimbabwe), transitional local council,metropolitan council (South Africa) LocalBoard, Growth Point (Zimbabwe)
Economic function Functional characteristicsof urban centres
Agricultural, industrial, mining, tourist towns
Location Based on location ofcentre within the country
Boarder, inland, coastal, tribal towns
If the ‘new’ criteria are adopted, Africa would only have two cities in the largest category:Lagos (13.4 million) and Cairo (10.6 million). The scenario for the developing world ispresented in Table 13. What is the relevance of this categorisation to urbanisation and urbandevelopment? It all has to do with the role urban areas is supposed to play and how varioustypes of urban centres relate to the surrounding rural hinterland.
Table 13. Defining cities by size
Identity Population sizeMegacity Over 5 millionLarge city Between 1 and 5 millionMedium–sized city 0.5 to 1 millionSmall city Less than 0.5 million
Source: Adapted from figures and definitions from United Nations 2000:6; World Bank 1999:128

Urbanisation and Poverty in Africa
20
BOX 7. REDEFINING URBAN AREAS BY SIZE?
Though not explicitly stating that it has adopted a new classification system for the world’s cities,based on population thresholds, the United Nations does seem to have done so or may be in theprocess of doing so compared to Table 14. The grouping of cities below (United Nations 2000:7)surely underpins this impression:• Cities of 10 million or more• Cities of 5 to 10 million• Cities of 1 to 5 million• Cities of less than 1 million
There have been many commentaries on the role of intermediate and small centres in nationaldevelopment as well their part in the development and underdevelopment of the surroundingareas (Hardoy and Satterthwaite 1986; Southall 1988; Kamete 1998). Usually it is the smallerand intermediate centres that are at the doorstep of the rural areas. Therefore, they form the firstencounter rural folks have with urban forces. The economies of these centres are normallyshaped by the rural hinterland because they serve these outlying areas. It is thus not surprisingto find agricultural and mining towns (Kamete 1999) in Southern Africa.
Table 14. Population of urban centres with more than 10 million inhabitantsin developing countries
Urban agglomeration Population (millions)1975 1999 2000 2015
Mexico City 11.2 17.9 18.1 19.2Bombay 6.9 17.5 18.1 26.1Sao Paulo 10 17.5 17.8 20.4Lagos 3.3 12.8 13.4 23.2Calcutta 7.9 12.7 12.9 17.3Buenos Aires 9.1 12.4 12.6 14.1Dhaka 2.2 11.7 12.3 21.4Karachi 4.0 11.4 11.8 19.2Delhi 4.4 11.3 11.7 16.8Jakarta 4.8 10.6 11.0 11.0Metro Manila 5.0 10.5 10.9 14.8Rio de Janeiro 7.9 10.5 11.9 1.2Cairo 6.1 10.3 10.6 13.8
Source: United Nations 2000:9.
1.6 Rural-urban linkages: an overviewAs noted in the previous section on the classification of urban centres, cities and towns do notexist in a vacuum. They function in a context shaped by economic, spatial, social andadministrative forces at work. In most cases, the main determinant of this context is the natureof the surrounding rural area. This section seeks to describe the types of relationship urban areashave with their rural counterpart – adjacent or distant. Table 15 highlights some of the keyrelationships.
Urbanisation and Poverty in Africa
21
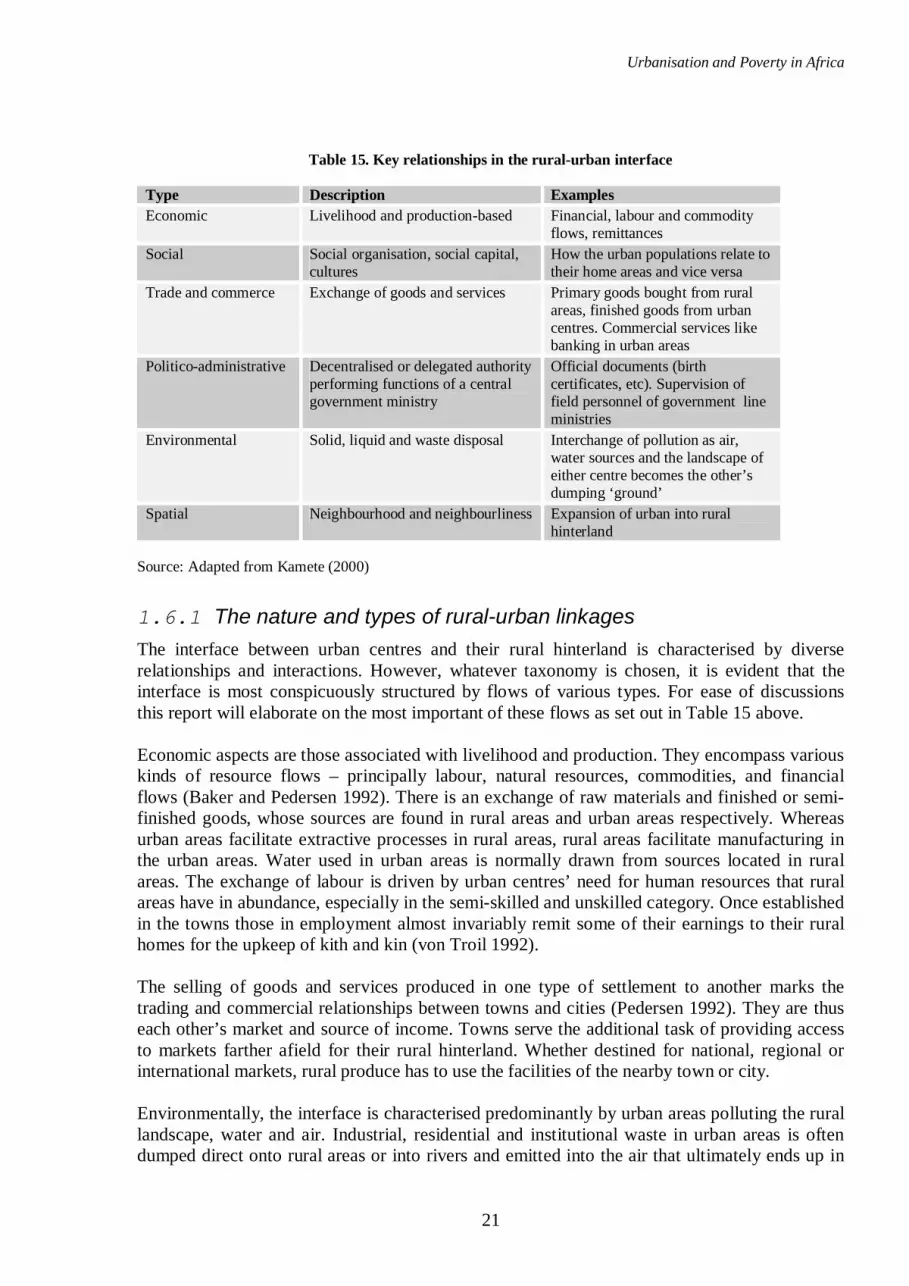
Table 15. Key relationships in the rural-urban interface
Type Description ExamplesEconomic Livelihood and production-based Financial, labour and commodity
flows, remittancesSocial Social organisation, social capital,
culturesHow the urban populations relate totheir home areas and vice versa
Trade and commerce Exchange of goods and services Primary goods bought from ruralareas, finished goods from urbancentres. Commercial services likebanking in urban areas
Politico-administrative Decentralised or delegated authorityperforming functions of a centralgovernment ministry
Official documents (birthcertificates, etc). Supervision offield personnel of government lineministries
Environmental Solid, liquid and waste disposal Interchange of pollution as air,water sources and the landscape ofeither centre becomes the other’sdumping ‘ground’
Spatial Neighbourhood and neighbourliness Expansion of urban into ruralhinterland
Source: Adapted from Kamete (2000)
1.6.1 The nature and types of rural-urban linkagesThe interface between urban centres and their rural hinterland is characterised by diverserelationships and interactions. However, whatever taxonomy is chosen, it is evident that theinterface is most conspicuously structured by flows of various types. For ease of discussionsthis report will elaborate on the most important of these flows as set out in Table 15 above.
Economic aspects are those associated with livelihood and production. They encompass variouskinds of resource flows – principally labour, natural resources, commodities, and financialflows (Baker and Pedersen 1992). There is an exchange of raw materials and finished or semi-finished goods, whose sources are found in rural areas and urban areas respectively. Whereasurban areas facilitate extractive processes in rural areas, rural areas facilitate manufacturing inthe urban areas. Water used in urban areas is normally drawn from sources located in ruralareas. The exchange of labour is driven by urban centres’ need for human resources that ruralareas have in abundance, especially in the semi-skilled and unskilled category. Once establishedin the towns those in employment almost invariably remit some of their earnings to their ruralhomes for the upkeep of kith and kin (von Troil 1992).
The selling of goods and services produced in one type of settlement to another marks thetrading and commercial relationships between towns and cities (Pedersen 1992). They are thuseach other’s market and source of income. Towns serve the additional task of providing accessto markets farther afield for their rural hinterland. Whether destined for national, regional orinternational markets, rural produce has to use the facilities of the nearby town or city.
Environmentally, the interface is characterised predominantly by urban areas polluting the rurallandscape, water and air. Industrial, residential and institutional waste in urban areas is oftendumped direct onto rural areas or into rivers and emitted into the air that ultimately ends up in

Urbanisation and Poverty in Africa
22
rural areas (Kamete 2000; Abdel-Ati 1992). Rural areas pollute the urban environment, forexample, by chemically affecting sources of drinking water or the atmosphere through the useof agricultural chemicals such as pesticides (Kamete 2000). A lot of the solid waste, especiallyin urban market places, can be traced to rural produce.
Spatial relations take the form of urban areas taking over and incorporating rural territory tomake way for housing, industrial or institutional development. This sometimes results in urbanareas compromising the revenue base of rural areas as they lose not only rateable land but alsothe natural, capital and human resources that go with it.
Urban areas serve as administrative centres for specific jurisdictional districts that are mostlyrural. These towns host the state-appointed administrators and local governments. Centralgovernment ministries also have sub-offices in towns. These urban centres serve an importantadministrative function in terms of licences, registry, reporting, as well as other services, dutiesand obligations.
The social interactions in the rural-urban interface range from mere social, individual,household or clan to larger organisational issues. Most importantly, in terms of social capital,rural-urban linkages form a crucial element in coping strategy for the poor.
It should be stressed that the conventional view of urban centres exerting an exploitativeinfluence on the rural areas – thereby leading to rural underdevelopment – is being replaced byan appreciation that the relationship is mutually beneficial and should remain so. Rural andurban areas do need each other. They can be good for each other’s growth and prosperity(World Bank 1999:128). The outcome of this relationship is ultimately a function of policy andmanagement, not only at the local level but also, perhaps primarily, at the national level.

Urbanisation and Poverty in Africa
23
1.7 Judging urbanisation: virtue or vice?Urban centres have had varied impacts on society and space. How good or bad urbanisation isjudged to be depends ultimately on the specific effect of the process and the resultant urbansettlements, especially on the well-being of its inhabitants and society at large. This well-beingmay be expressed in various forms: socio-cultural, economic, political and environmental.Figures 3 and 4 reflect some of the important judgements.
1.7.1 The virtuesUrban areas have been described in various terms as generators of economic development(Kamete 1999) due to their role as ‘engines of growth’ (World Bank 1999:125). The fact thatmanufacturing and services sectors (which are predominantly ‘urban’ functions) are the keygrowth sectors of most economies bears testimony to the role of cities in initiating andsustaining national economic growth (Beavon 1997). There is some truth in the claim that citiesand town are the causes as well as consequences of economic development.
Urban centres are a response to stimuli for economic development. If properly managed theyalso promote it. Economic progress requires specialisation, diversification and division oflabour. It requires transport and distribution networks; it needs a large market, as well as theconcentration and location of this market in accessible areas. In addition, economicdevelopment requires labour as well as inputs in the form of goods and services. Becauseproductive enterprises need inputs and have to dispose of their products, they concernthemselves with strong forward and backward linkages, resulting in the grouping of relatedindustries and services – referred to as agglomeration by economic geographers. Wherever andwhenever urbanisation has occurred – be it in Asia, the Americas or Europe – these are theingredients of economic development. And Africa is no exception (Bairoch 1988; World Bank1999). The emergence of urban centres is thus a response to need and Africa therefore needsthem.
Based on the above analysis it can be said justifiably that urban areas promote ruraldevelopment, however defined. Urban areas are essential markets for rural produce.6 Thesurplus of the rural hinterland finds its way to urban markets and consumers such ashouseholds, institutions and industries. Furthermore, these centres are sources of some goodsand services that contribute to making the rural areas work. Rural inhabitants need inputs fortheir extractive processes and agricultural production; they need finished goods for theiroperations and households; they also require essential services, be they technical, financial,professional or social (Kamete 2000). All of these are readily available from urban areas.Because of this input-output relationship created by urbanisation, urban and rural areas developbackward and forward linkages on a wider scale, from which they both benefit. In terms oflivelihood urban centres are the source of remittances to rural kinfolk (de Haan 1999). Theseremittances are used not only for consumption purposes but to promote rural development aswell.
Through their transport and telecommunications networks – however rudimentary – urbancentres link their rural neighbours to the rest of the country and the world at large. In a world
6 In rare cases the preference for imported goods by the urban population may result in rural farmers finding itdifficult to penetrate the urban market.

Urbanisation and Poverty in Africa
24
increasingly becoming one huge global village, the importance of this ‘window’ to the worldcannot be overemphasised (see Box 9).
FIG. 2. JUDGING URBANISATION AND URBAN AREAS: THE VIRTUES
A notable impact of urbanisation is the decongestion of the rural areas. As people move tourban areas and establish homes there, the pressure on rural land is relieved. This is whathappened historically in the developed world.7 Relieving pressure on rural agricultural land iscomplemented by the reduction of pressure on the natural environment as the sole source oflivelihood. These twin processes imply a shift from extractive to manufacturing and servicesectors. In this way urban centres may be seen as safety valves.
BOX 8. URBANISATION IN JOHANNESBURG: THE VERDICT
“A little over a century ago … the site of Johannesburg was no more than anunwanted south sloping remnant of ground. … There was little to commendthe property for agricultural purposes and it offered precious little prospectas a suitable place for a village … [Y]et within a mere 40 years of beingfounded on such an unlikely site Johannesburg was being hailed as a ‘worldcity’… The financial importance of the city is reflected by the fact that it isthe home of the Johannesburg Stock Exchange … [which] is ranked 12th inthe world on the basis of its market capitalisation. The … CBD contributes12 percent of South Africa’s GNP.
[N]otwithstanding the glitzy wonders of Johannesburg … there is also a lessattractive, deprived and deeply disturbing side. … [A]djacent to this, themost opulent city south of the Sahara, there are hundreds of thousands ofpeople living in deprived communities or townships. In addition there are
7 This should be considered within specific cultural contexts. Some urbanites do not let go of their rurallandholdings, preferring instead to straddle (Beall et al. 1999).
URBANISATIONis GOOD
Decongestingrural areas
Agents for ruraldevelopment
Enhancingservice provision
Enhancinglivelihood options
Promotinggrowth
Islands ofdemocratisation
Relieving pressureon naturalresources
Facilitatingadministration

Urbanisation and Poverty in Africa
25
also tens of thousands living in informal settlements of shacks recentlyerected in the veld.”
Source: Beavon 1997:153–161
Urban centres are seedbeds of democratisation. In urban areas key components of democracy –diversity, knowledge and information – reach a critical mass large enough to trigger and sustaindemocratic processes. The proximity to the main political institutions reinforces the politicalimportance of urban centres. Being home to many pressure and interest groups, institutions ofhigher learning and most supportive (or disruptive) international organisations, urban areas havebeen known to be springboards of democratic movements that have spread throughout thewhole country and given birth to new democratic dispensations. Links to the outside worldthrough various media and telecommunications expose urban centres to international impulsesof democratisation.
1.7.2 The vicesThere are some sour sides as well to urbanisation and the resultant urban agglomerations. Thesehave become more easily discernible and more pronounced than the positive aspects because ofmedia exposure, thus creating a perception of urban areas as cesspools of human misery andenvironmental damage. In fact, these vices have been the source of calls for policies andstrategies to reduce or halt urbanisation.
Urbanisation in most African countries is not matched by economic growth. As a result, theurban centres have failed to deliver in terms of improved social conditions for the bulk of thepopulation, especially for the low-income category (World Bank 1995). As reflected in Figure4, urbanisation may mean misery for urban residents whose quest for a better life is met withdisappointment (compare Box 9; see also Beavon 1997:161). Unavailable, inadequate and/ordecaying infrastructure and community services are now a common feature of developing worldcities (Box 11; see also Rakodi and Devas 1993:8–9), manifested in poor housing, squattersettlements and slums, homelessness, declining social indicators and lack of mobility. Someeconomic policies in developing countries have worsened the plight of the hapless urbanresidents. Noting this, Potts draws attention to “… the devastation of urban living standardswrought by structural adjustment policies...” which have “…served further to immiserise mosturban households…” (Potts 1997:451, emphasis in the original).

Urbanisation and Poverty in Africa
26
FIG. 3. JUDGING URBANISATION AND URBAN AREAS: THE VICES
In terms of the livelihood strategies of poor households, it can be argued that urban areas havedelivered (World Bank 1995:1). But delivery has not been at the required scale and volume, andat a cost in both human and environmental terms. Although the application of the urbanunemployment concept is problematic and controversial there is no doubt that unemployment isrampant in urban Africa (Potts 2000). Zimbabwe’s unemployment rate of over 60 per cent is byno means unique. Unable to find a job in the formal sector, the urbanites do not go back to therural areas (Beall 1999; de Haan 1999). They devise their own means of livelihood, hence thegrowth of the informal sector, most of it unregulated by any kind of labour, public health,environmental and sanitation laws (Kasarda and Crenshaw 1991:477; Kamete 2000b).
The natural environment is not spared by urbanisation (see Box 11). Environmental damagestems largely from poor waste management practices. Industry, households and the informalsector have been rightly blamed for polluting the environment. A large share of the blame hascorrectly been apportioned to urban local authorities and central governments for failing toadopt sound and practicable environmental management policies and strategies.
URBANISATIONis BAD
Consumesdisproportionateshare of national
resourcesInadequate
services
Bad socialconditions
Urbanisationwithout growth
Short-changingrural areas
Tension andupheavals
Environmentaldamage
Killing localculture

Urbanisation and Poverty in Africa
27
BOX 9. URBANISATION AND HUMAN MISERY IN AFRICA
“The combined impact of the debt crisis and structural adjustment policiesreduced urban workers to astonishing levels of poverty, evidence of which,as incomes from wages, slipped completely out of line with the minimumrequired to keep a family (or in may cases even an individual) fed, let alonesheltered, clothed abounds in the literature. … As a consequence of themassive falls in most urban incomes, sometimes combined withimprovements in rural incomes accruing from better agricultural prices, the‘new’ urban poor of Africa are often poorer than rural households in crudeincome terms. … The fact that urban poverty may now surpass rural povertyis of particular significance to any study of the nature of urbanisation inAfrica. … It is particularly important that policy makers recognise this, nowlongstanding, situation so that urban poverty can be tackled and furtherdeliberate reduction in living standards prevented. That this is necessary isindicated by Amis and Rakodi (1994:632) who point out that in sub-SaharanAfrica “a view that urban areas are well-off and that all the poverty is ruralhas proved remarkably robust”.
Source: Potts 1997:451
With reference to socio-cultural and political indicators, urban areas have not performed well.The cultural concerns are compounded by perennial political conflicts stemming frominstability, protest and tension. Urban areas are hotbeds of pluralism, dissent and even upheaval.Because of the diversity of backgrounds and the prevalence of problems in a situation whereknowledge and information flow freely, urban areas sometimes turn into a battleground, in bothintellectual and physical terms.
BOX 10. … AND STILL MORE MISERY
“In many cities of the developing world 40–50 per cent of the populationlive in slums and informal settlements – as much as 85 per cent in the caseof Addis Ababa, 59 per cent for Bogota and 51 per cent for Ankara …[W]hile not all informal settlements provide unsatisfactory living conditions,they are usually inadequately served with essential infrastructure. Extremelyhigh population densities and room occupancy rates … indicate aninadequate supply of housing. Other services are generally quite inadequateto meet the rapidly growing needs. UNCHS estimates that, for most cities inthe developing world, only a quarter to a half of solid waste is collected bymunicipal authorities (UNCHS, 1987:2) … with obvious consequences forpublic health. Inadequate road networks … [and] provision of social serviceslag far behind the needs. While the health facilities for high-income groupsmay be very good, those of the poor are so inadequate that their healthconditions are as bad as those of the rural population.
Source: Devas and Rakodi 1993:8–9
It is true that urban areas promote rural development. Sometimes though, urban centres doshort-change their rural counterparts by for example, under-pricing rural produce, overpricingfinished commodities, drawing cheap and mostly young labour from rural areas and spewingtonnes of solid, liquid and gaseous waste onto rural areas. Added to all this is the fact that urbanareas seem to consume a disproportionately larger share of the national wealth compared totheir share of national population. This is part of the famous thesis on urban bias (Lipton 1988).

Urbanisation and Poverty in Africa
28
1.8 Conclusion: emerging issuesThe preceding discussion on urbanisation in the developing world, particularly in Africa, has anumber of implications for development and development co-operation.
The discourse has noted that:
1. Urbanisation is an irreversible phenomenon in African countries;2. The urbanisation trend is set to continue;3. Urban areas are gaining in influence;4. Urbanisation and the growth of urban areas have multiple repercussions, among them
economic, socio-cultural and political changes;5. The most important national and local issues will in the future be played out in urban areas;6. Most of the urbanisation occurring in Africa is not accompanied by economic growth;7. Urban areas have an in-built thrust to continue to grow;8. It is not tenable to separate urban and rural areas as discrete spheres because their fate is
inextricably linked;9. Urban areas vary widely not only in location and size but also in functions and substance;10. There are both good and bad sides to urbanisation.