free education in rwanda: just one step towards reducing gender and sibling inequalities
TRANSCRIPT
Hindawi Publishing CorporationEducation Research InternationalVolume 2012, Article ID 396019, 11 pagesdoi:10.1155/2012/396019
Research Article
Free Education in Rwanda: Just One Step towards ReducingGender and Sibling Inequalities
Joseph Nkurunziza,1 Annelet Broekhuis,2 and Pieter Hooimeijer2
1 Department of Applied Statistics, Faculty of Economics and Management, National University of Rwanda,P.O. Box 124, Butare, Rwanda
2 Department of Human Geography and Urban and Regional Planning, Faculty of Geosciences, Utrecht University,Heidelberglaan 2, 3584 CS Utrecht, The Netherlands
Correspondence should be addressed to Joseph Nkurunziza, [email protected]
Received 1 August 2012; Accepted 4 October 2012
Academic Editor: David Neumann
Copyright © 2012 Joseph Nkurunziza et al. This is an open access article distributed under the Creative Commons AttributionLicense, which permits unrestricted use, distribution, and reproduction in any medium, provided the original work is properlycited.
In 2003, Rwanda introduced free education as part of government policy to improve school enrolment in general and theattendance of deprived children in particular. However, in addition to school fees, other factors hamper school careers of children.Shifts in attendance were analysed using binary logistic regression on data from the 2000 and 2005 Integrated Household LivingConditions Surveys. The results show that although the policy has been very successful, the objective has not been achieved. Wefind a strong effect of the sibling position of the child in the household and its relation to the household head. Substantial numbersof orphans/foster children in Rwanda do not profit from the free education policy and part of the children leave before completingschool, in particular girls. Free education is only one step towards a more equitable distribution of educational opportunities.
“Education is the most powerful weapon which you can use to change the world”Nelson Mandela
1. Introduction
Most developing countries will probably achieve universalenrolment in primary education for boys and girls in 2015and will thus meet Millennium Development Goal 2. This,however, does not apply to countries in sub-Saharan Africa.Although they are making impressive progress, there is stilla long way to go (see [1]) as they started off farthest fromthe desired target (see [2]). Rwanda is one of the few sub-Saharan countries where the gap between objective and resultis very small (see [3]). In Rwanda, the enrolment rateshave been historically high; at 90 percent, the challenge isto identify and help the last 10 percent of the school-agechildren that is yet to be enroled in primary school (see[4]). The Rwandan government targeted achieving universalprimary education in 2010, and nine years of basic educationfor all children in 2015. As stated in its Vision 2020 policy
document (see [5]), the government aims to transformRwanda’s agricultural-based economy into a knowledge-based economy, for which human resource development is ofvital importance. The government emphasises gender equityin all segments of society and the economy, meaning thatboys and girls should equally enrol in education.
Several measures have been taken to implement thispolicy. One was the abolition in 2003 of fees for primaryeducation, which removed one of the obstacles to accessingeducation. According to Grogan [6], the elimination ofschool fees is a recent phenomenon in Africa because Malawieliminated fees in 1994, Uganda in 1997, Tanzania in 2000,and Cameroon, Burundi, Ghana, Rwanda, and Kenya in2003. In all countries in which UPE (Universal PrimaryEducation) was instituted, the elimination of the direct costsof schooling created an instantaneous large increase in schoolenrolment (see [6, 7]). The aggregate increases in enrolment
2 Education Research International
after the elimination of fees reflect both increases in schoolattendance among the primary school-age population andamong adults and teenagers attending school for the firsttime (see [6]). In opposite to these results, Bold et al. [8]recently found that the nationwide abolition of public schoolfees in Kenya in 2003 did not lead to an increase in net publicenrolment rates, but rather led to a dramatic shift towardprivate schooling.
Our contribution to the debate on achieving universalprimary school attendance has three objectives: to investigatewho have profited from the free education policy in Rwanda,to discover remaining barriers to school attendance inprimary education, and to determine which groups ofchildren still fall by the wayside and should be targeted byfuture policies. We therefore constructed two datasets ofindividual, household, and community characteristics takenfrom the 2000-2001 and the 2005-2006 Enquete Integralesur les Conditions de Vie des menages (EICV; IntegratedHousehold Living Conditions Survey), which allowed usto compare the situation before and after the abolition ofprimary school fees established in September 2003. (Theobjectives of the EICV are to provide information onpoverty and living conditions in Rwanda and to monitorchanges over time as part of the ongoing monitoringof the Poverty Reduction Strategy and other governmentpolicies. In Rwanda, the EICV is a nationally representativehousehold survey and is carried out once every five years,with EICV1 having been carried out over twelve-monthperiod in 2000/2001 (6420 households) and was repeatedwith slight modifications in 2005/2006 (6900 households).The content of the EICV2 questionnaire is broadly similarto that of the previous survey.) This period also marksthe return of political stability in Rwanda and of positivesocioeconomic performance, factors that are important for asuccessful implementation of education policies (see [9, 10]).We first present a theoretical elaboration of the constrainingand enabling factors for the school attendance of girls andboys in primary education. This is followed by a briefintroduction to the reconstruction of the educational systemin Rwanda, as well as subsections on data, methodology, andselected variables. We then present and discuss the results ofthe modelling. We end the paper with our conclusions andseveral policy implications.
2. Barriers to and Inducements for PrimarySchool Attendance
The assumption that poor parents/child caretakers areresponsive to reductions in school costs can be linked tovarious socio-economic theories. Departing from the homeeconomics model and the human capital framework (see[11–13]), it can be argued that poor parents/caretakers makea tradeoff between the direct and indirect costs of schoolingand the benefits of child labour for the child and thefamily. (We refer to all reproductive and productive workof children.) Admassie [14] highlighted that uninterruptedschool attendance reduces the time the child has for work athome or in the labour market.
Even moderately poor parents with land to work or abusiness to run keep their children at home instead of hiringexternal labour (see [15]). In such cases, the opportunitycosts of time spent at school are high. In this approach,poverty and a lack of financial resources are seen as barriersto school enrolment and ongoing attendance. The number ofhours that children work determines their school attendance:children who work long days on tea plantations or in brickfactories cannot attend school (estimate for Rwanda: 400,000child workers, of whom 120,000 were involved in the worstforms of child labour and 60,000 were domestic workers (see[16])), while children who do domestic or productive workfor only a short time each day, or who work seasonally or onlywhen needed, can. (ILO defines child labour by the effectit has on the child. In brief, the work or activities done bychildren should not interfere with their education or harmtheir physical or mental health (see [17]).) Besides, parentsin subsistence-oriented rural communities often think that itis more important to involve children in economic activitiesand equip them with the basic life skills for future survivalthan send them to school for formal education (see [14, 18]).
The absence of a demand for skilled labour, particularlyin rural areas, contributes to this and has been identifiedas a contextual labour market condition that influences theeducational decisions of parents (see [12, 19, 20]).
The assumption that poor parents need to be encouragedto send their daughters to school is related to the gendereddivision of labour within the household and to adversecultural practices in society and the labour market (see[12, 19, 21]). Girls are given domestic chores because theirparents want to train them to become good future wivesand mothers. Persistent discrimination against girls may alsomean that parents, particularly in rural areas, do not attachthe same value to educating their daughters as they do totheir sons (see [21, 22]). Girls leave the family earlier thanboys to marry, after which the fruits of their labour go totheir families-in-law. Investments in the education of girlsalso give lower returns in a labour market where womenearn less than men (see [20]). Thus, besides poverty, labourmarket conditions, gender roles, and cultural practices canalso be barriers to enrolment and attendance.
The number of siblings and the sibling position of achild within the household can also inhibit ongoing schoolattendance, as a result of resource dilution (see [12]) andsibling complementarity (see [15]). Unless there is increasedincome, the addition of another child results in less realincome per household member: the share for basic needssuch as food and clothes in the available income per childincreases at the expense of the financial means availablefor education (see [23, 24]). This can imply that one ormore children have to drop out or are kept away fromschool to enable a brother or sister to enrol. Instead of goingto school, these children do domestic chores, work in thefamily business, or are sent out to work. The larger thenumber of siblings, the higher the probability that a childenrols later, repeats classes, and/or drops out earlier (see[23]). The presence of young children in households has anegative effect on attendance of older children. Conversely,attendance of school-age children is higher if the household
Education Research International 3
has members between 14 and 18 years of age (see [12, 25]).It also turned out that especially girls suffer from siblingcomplementarity. The presence of older sisters in one’ssibling group has a particularly strong positive effect onschooling, indicating that these older girls are withheld fromschool to free up or generate resources for their youngersiblings’ education (see [26]).
Another barrier is the lack of parental support: childrenliving in households without their natural parents are moreoften deprived of this support (see [27]). There is evidencethat orphans and foster children are less likely to be enrolledin school than children who live with their biological parents(see [28, 29]). Thomas [30] confirms this finding for Rwandaand also reports that the extent of schooling deprivation oforphans depends on their family relation to the caretakers,the household type (single or double headed), and thegender of the household head. These relationships are rathercomplex. Orphans, for instance, are more disadvantaged ina household headed by a couple than in a single-headedhousehold, contrary to the situation of children who livewith natural parents. Taking care of children below primaryschool age is supposed to be an impediment to the schoolenrolment of particularly full and maternal orphans (see[30]). Case and Ardington [31], Evans and Miguel [32]also concluded that there is a substantial decrease in schoolparticipation after the death of a parent and that thedeath of the mother is more detrimental than that of afather, as male-headed household will more often rely onchildren for household chores. The impact of household typeand gender of the household head on children’s educationachievements is again partly linked to poverty, as female-managed households have less resources than householdsmanaged by a couple or male head (see [33, 34]).
However, it can also be linked to effects of inter-gene-rational education concern (transmission of resources) andthe gender aspect therein. Educated parents understand theimportance of schooling and are more willing to allocateresources for the education of their children. According toGlick and Sahn [35], mother’s education has a positiveimpact on the education of daughters, while father’s edu-cation favours the education of both sons and daughters.Thus, the presence of both parents in the household as well ashaving educated parents promotes the school attendance ofthe children.
The poverty index may not be a sufficient indicator ofthe purchasing power of a household, as in many Africansocieties transfers between relatives frequently help poorfamilies to overcome their financial problems. In sub-Saharan Africa, fosterage and the extended-family systemredistribute resources across families in ways that buffereducational inequality (see [23, 36]).
School attendance is also linked to other factors, such asplace of residence, availability and accessibility of schools,and quality of education. Parents consider low-qualityeducation a waste of time (see [13]), while large distancesto school can be a constraint particularly for very youngchildren and girls (see [4, 37, 38]). There are differencesin school attendance between rural and urban children(see [1]). These effects, however, relate to wider rural and
urban differences, such as educational level of parents, labourmarket conditions, and household income (see [20, 39]).To get a clear picture of the barriers to primary schoolattendance, to explore those who profited of free educationand to identify deprived groups of children, geographical andcommunity variables as well as socio-economic and culturalvariables at household level must be taken into account.
3. Reconstruction of the Educational System
Rwanda’s achievements in the field of enrolment in primaryeducation are remarkable. Years of unrest and civil war,which culminated in the 1994 genocide and massive popu-lation movements, left Rwandan society disrupted and thecountry’s infrastructure destroyed or heavily damaged (see[40, 41]). The people, and particularly the children, wereseverely traumatised (see [42]).
After 1994 the new government immediately decided tomake the reconstruction of the educational system a spear-head of policy. Schools had to be built or rebuilt (only 648of the country’s 1836 schools were still operational) andteachers had to be trained and reintegrated, as many teachershad been killed, were now living abroad as refugees, or weredisplaced within the country. It was estimated that more thanhalf of all qualified primary school teachers were unavailable(see [43]). In addition, the population had to be convincedthat schools were safe places again. A large number ofRwandan schools, although financed by the government,are linked to religious institutions, in particular the RomanCatholic Church (see [4, 41]). During the massacres, peoplehad believed that schools and churches were safe havens, butmass killings had occurred in those places.
Finally, special attention had to be paid to the manyvulnerable children who had lost one or both parents.(Prevalence of HIV/AIDS also added to this situation.)Rwanda has one of the world’s highest rates of orphanhood(see [30, 44]). It was estimated that 85,000 households wereheaded by a child, 90% of them girls, when the hostilitiescame to an end (see [43, 45]). As more men than womenwere killed, fled the country, or became prisoners accused ofparticipating in the killings, the number of female-headedhouseholds increased. For the children in such households,going to school was often not an option, given the financialconstraints and household chores they had to do, whichincluded regular trips to prison to feed their confined parents(see [46]). In 2000, of all children of primary school age (7–13 years), slightly less than 40% had only one or no parentsat home (see [4]).
By gradually increasing the budget for education to25.6% of total spending in 2001 (however, the share allocatedfor primary education decreased from 70% to 45 % infavour of tertiary education during the same period), thegovernment was able to reconstruct the educational sectorso well that it has been praised by international institutionssuch as the World Bank and UNESCO. Net enrolment inprimary education exceeded 90%, gender equity in thisenrolment was nearly accomplished, and the deprivation oforphans was drastically reduced (see [4, 43]). With regard
4 Education Research International
to survival to the end of the cycle, Rwanda’s performanceis respectable: its estimated 73 percent compares well withthe rate in other low-income countries and with its ownrecord of 44 percent in 1990-1991. Yet this rosy situation isunlikely to persist, given the exceptionally high rate of graderepetition in the system—about 34 percent in 2000-2001, ormore than three times that of a decade earlier (see [4]).Over2000 schools were operational, although only half of themcould be called “permanent structures.” The percentage ofqualified teachers was expanded substantially, but doubleshifting at schools was necessary to meet the demand foreducation; consequently, the teacher pupil/ratio was highand increasing.
The Rwandan government and its principal developmentpartners in the education sector (UK, USA, Netherlands,Belgium, Sweden, and Germany) concluded that extra effortswere necessary to achieve MDG 2 and to improve the qualityof education. According to the Poverty Reduction StrategyPaper (2002), 27% of children of primary school age werenot attending classes regularly. Completion rates for primaryeducation were below 50% and considerably fewer girls thanboys took the final examinations (see [22, 43]).
To improve access to education, the New Constitution(which was adopted in 2003) made education at the primarylevel free and mandatory for all children. Primary school feesof RWF 300 (RWF 300 per term is just less than $2 per year($1 = RWF 537 in Oct. 2003), a small sum compared to thecost of a school uniform and educational material (RWF =Rwandan Francs)) per term were abolished and replacedby a capitalisation grant to the schools, and several pilotschemes started to provide school lunches and run schoolfarming programmes to encourage households to enroltheir children. In 2002, the UN World Food Programme(WFP) launched a school canteen and food-for-educationprogramme in food-insecure districts in the southern andeastern provinces. In collaboration with the government andseveral donors, this programme provided meals to 160,000pupils for 4 years and gave 28,800 girls in grades 4 through 6a monthly take-home ration of vegetable oil. The sale of thisoil was expected to cover school costs and increase schoolattendance by girls (see [47]).
Several ministries set about tackling the issue of theinequality of girls and orphans in school attendance. Forexample, the Ministry of Local Government, Informationand Social Affairs, together with UNICEF and the Ministry ofEducation, formulated the National Policy for Orphans andOther Vulnerable Children (NP-OVC), which emphasisedthe integration of OVCs and gender issues as importantpolicy targets in development programmes, the nationalbudget, and poverty reduction strategies (see [48]). Specialfunds for genocide victims made it possible to improve theliving conditions of this section of the population.
Despite the progress, the quality of the primary schoolsystem was far from perfect. According to the IMF [49] in its2003 country annual report, the quality of primary educationin Rwanda suffered from a shortage of qualified teachers,a heavy curriculum, and a lack of appropriate educationalmaterial. The availability of schools also allowed room forimprovement (see [4]).
4. Data and Methodology
The 2000 and the 2005 Integrated Household Living Con-ditions Surveys (hereafter EICV) conducted by the NationalInstitute of Statistics for Rwanda provide sociodemographicdata on the members of 13,320 households (a householdgenerally consists of a group of people living in the sameaccommodation and recognising one person as its head;it may include related and unrelated members and rangefrom a single individual to multiple families) and on thehouseholds’ services and amenities. According to Megil [50],the EICV is approximately self-weighting within a stratum.The basic weight for each sample household was equal tothe inverse of its probability of selection (calculated bymultiplying the probabilities at each sampling stage).
The sampling frame of cells within each stratum hadbeen ordered geographically in a serpentine manner beforethe segments were selected systematically with probabilityproportional to size (PPS) where the measure of size foreach segment/cellule was based on the number of householdsfrom the sampling frame; sample households are selected atthe second stage within each segment/cell (see [51]).
The dependent variable in our analysis (children inthe age category 8–14 years who had not yet completedprimary education at the time of the survey) was takenfrom these two datasets. (The official entrance age for lowestlevel education in Rwanda is 7 years. The structure ofRwandan education system is 6-year primary cycle, a 3-yearcommon basic program (TC-lower secondary) cycle, a 3-year upper secondary cycle, and a 4-year higher educationcycle in most fields. As the question regarding attendancewas asked on previous 12 months, during the survey, the 7-year-old children for primary enrolment were 8 years andthe 13-year-old children for grade 6 of primary level were14 years old during the surveys period. ILO [16] reportedthat the minimum age for apprenticeship is 14 years inRwanda.) The children were identified by “age,” “highestlevel of education attained” and “having or not attendedschool during the 12 months preceding the survey.” (We didnot exclude children who had missed only some classes.)Of the 11,199 cases appropriate for our study, 50.4% werecollected during the 2000 survey and 49.6% during the 2005survey. Only 2% (228) of the target children had alreadycompleted primary school (the 2% (119 cases in 2000/01and 109 cases in 2005/06) who completed primary schoolwere excluded in our analysis because some of them wereattending secondary school (when our analysis focused onprimary or dropped out after completing primary school).The decline in completion from 119 in 2000 to 109 in 2005is maybe due to a strong increase in enrolment because thisis similar to the Boockmann [17] estimates for Tanzania),89.9% (10,268) were still attending primary school, and8.1% (931) had not attended school during the 12 monthspreceding the survey.
As the objective was to explore who profited from the freeeducation policy introduced in September 2003, a separateanalysis was made for 2000/01 and 2005/06, respectivelybefore and after the free education policy. Besides thecombined set was used to check if the changes between
Education Research International 5
the two years were significant by including interaction effectswith the variable year of the survey.
A logistic regression analysis was carried out to verifythe underlying reasons for not attending school. The modeldescribes the log odds that a child aged 8–14 had attendedschool in the year preceding the EICV of 2000 or 2005. Itpresents the relative influence of the independent variableson the odds of being attending primary school: a negativeβ coefficient means that the odds are reduced. The dataavailable for our analysis did not allow the inclusion ofquality of the school in terms of educational materials orquality of the teaching staff (only data on the quality ofthe school premises were available) as a barrier to schoolattendance, but distance to school was taken into account asa geographic factor. Place of residence was used as anindicator of school facilities and the returns (labour marketconditions) on education costs. To measure the differentialcrowding-out effect of having younger siblings for boys andgirls we constructed a combined variable of gender and sib-ling position, bearing in mind that children without siblingscould be a mixed group of foster children, afterthoughts, theonly child or the only surviving child.
Although the data also contains information on thenumber of hours spent at household chores, we did notinclude that variable in the model to avoid endogeneity. Itis plausible that to keep a child away from school and puttingthem to work for several hours a day is basically one decisionmade by the parent.
5. Descriptive Analysis ofthe Research Population
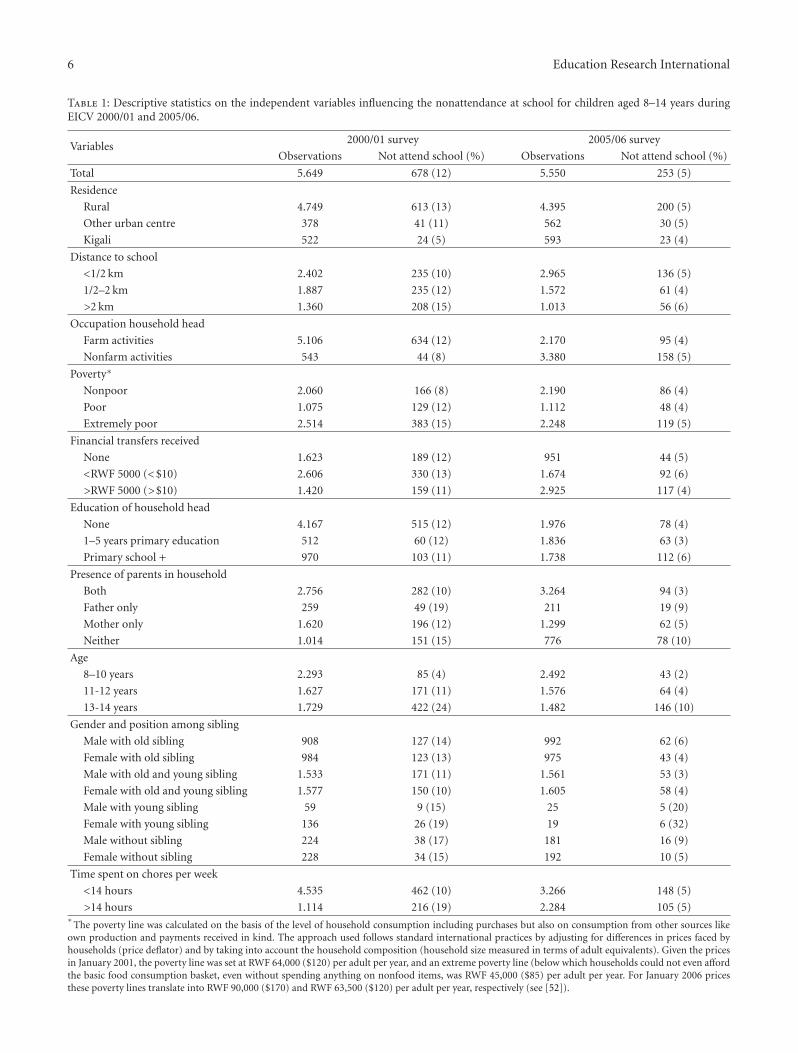
Table 1 reports the descriptive statistics of the independentvariables which start with the variables at community level(place of residence and distance to school), followed byvariables at the household level and then variables at theindividual level. Table 1 presents children who have or havenot been to school during the 12 months preceding thesurveys according to year of the survey. Rwanda is apredominantly poor, rural society: most people live inscattered homesteads in the hills and agriculture is their mainactivity. These features are reflected in the characteristics ofthe children in the datasets: four out of five live in thecountryside, and two out of three are member of a householdof cultivators, fisher folk, or cattle keepers. Thirteen percentof school-age children from rural areas were out of schoolin 2000 and 12% of those coming from a farm. Between2000 and 2005, however, these percentages decreased partlyas a result of the abolishment of fees and a massiveprogram of poverty reduction. Children in urban centresare privileged compared to children in rural areas in termsof the availability (particularly concerning secondary, highereducation and diversity of primary education) and quality ofschools and diversified future job opportunities. The betterendowed schools are in the capital. According to the WorldBank [4] Report on Education in Rwanda, children in halfof the rural households have to walk for more than 30minutes to get to school; in urban centres, this applies to only
20% of households. The bank experts emphasised that thedifferences are even more pronounced within provinces.
We divided distance to school into three groups: nearlyhalf of the children in the total survey sample lived incommunities (a community generally means a “cell” in theRwandan administrative structure, because the question ondistance to school was put to the coordinator of the cell. A cell(Akagari in Kinyarwanda) is the smallest administrative unitin Rwanda and hence closest to the people) with at leastone primary school (distance 0.5 km or less), a secondlived in communities with at least one primary school in aneighbouring community (0.5–2 km distance), and a thirdhad more than a 30-minute walk to school (<2 km). Thenonattendance of children living at a distance to school ofmore than 2 km was 15% in 2000 and 6% in 2005.
Rwanda is a low-income country: it had a per capita GDPof $200 at the beginning of the millennium. More than halfof the population lived on an income below the poverty line;according to the Ministry of Finance and Economic Planning(see [53, 54]), these Rwandans consumed less than RWF 250(<$50 cents) per adult equivalent per day. The extremelypoor had to get by on less than RWF 125 (<$25 cents) in2000 and RWF 175 ($30 cents) in 2005 per day. In thesepoor households, over 70% of total consumption is spenton food, which illustrates the lack of means left for clothes,housing, school fees, and uniforms (up to RWF 11, 000 =$21) or health insurance cards (RWF 1000 approximately less$2 per family member). School attendance has gone up ineach category between 2000 and 2005, but particularly in thecategory of extremely poor.
Solidarity between family members in Rwanda is high, asshown by the large number of households that had receivedtransfers in cash or kind during the 12 months precedingthe surveys. For the two periods, the households of 70%of the children had received assistance from outside. Nearlyhalf of the households had received transfers (transfershave three components: transfers in cash, in food, in othergoods, and miscellaneous. The transfers are coming fromparents, son/daughter, brother/sisters, spouse/wife, in-laws,other family, or not related persons. The senders are livingin the same countryside, Kigali Capital, other centers, othercountryside, adjacent countries and few of them are livingin other African country or in rest of the world. Most of thetransfers are annually or monthly and only few of them areon a daily or weekly basis) amounting to more than RWF5000 (less $10) per year. (RWF 5000 is just less $10 peryear ($1 = RWF 537 in Oct. 2003).) Remarkably, nonpoorhouseholds received assistance more often than extremelypoor households, and the value of rural to urban flowswas on average less than a quarter of those in the oppositedirection.
The impact of the genocide and the prevalence ofHIV/AIDS among the adult population are reflected in thelarge number of children with no parents (16%). Siaens et al.[29] stated in 2003 that as the country has emerged out ofconflict, the AIDS pandemic has begun to take a heavy tollof human lives, contributing significantly to adult mortality.The children with no parents were either full orphans orlived with relatives for reasons other than the death of their
6 Education Research International
Table 1: Descriptive statistics on the independent variables influencing the nonattendance at school for children aged 8–14 years duringEICV 2000/01 and 2005/06.
Variables2000/01 survey 2005/06 survey
Observations Not attend school (%) Observations Not attend school (%)
Total 5.649 678 (12) 5.550 253 (5)
Residence
Rural 4.749 613 (13) 4.395 200 (5)
Other urban centre 378 41 (11) 562 30 (5)
Kigali 522 24 (5) 593 23 (4)
Distance to school
<1/2 km 2.402 235 (10) 2.965 136 (5)
1/2–2 km 1.887 235 (12) 1.572 61 (4)
>2 km 1.360 208 (15) 1.013 56 (6)
Occupation household head
Farm activities 5.106 634 (12) 2.170 95 (4)
Nonfarm activities 543 44 (8) 3.380 158 (5)
Poverty∗
Nonpoor 2.060 166 (8) 2.190 86 (4)
Poor 1.075 129 (12) 1.112 48 (4)
Extremely poor 2.514 383 (15) 2.248 119 (5)
Financial transfers received
None 1.623 189 (12) 951 44 (5)
<RWF 5000 (<$10) 2.606 330 (13) 1.674 92 (6)
>RWF 5000 (>$10) 1.420 159 (11) 2.925 117 (4)
Education of household head
None 4.167 515 (12) 1.976 78 (4)
1–5 years primary education 512 60 (12) 1.836 63 (3)
Primary school + 970 103 (11) 1.738 112 (6)
Presence of parents in household
Both 2.756 282 (10) 3.264 94 (3)
Father only 259 49 (19) 211 19 (9)
Mother only 1.620 196 (12) 1.299 62 (5)
Neither 1.014 151 (15) 776 78 (10)
Age
8–10 years 2.293 85 (4) 2.492 43 (2)
11-12 years 1.627 171 (11) 1.576 64 (4)
13-14 years 1.729 422 (24) 1.482 146 (10)
Gender and position among sibling
Male with old sibling 908 127 (14) 992 62 (6)
Female with old sibling 984 123 (13) 975 43 (4)
Male with old and young sibling 1.533 171 (11) 1.561 53 (3)
Female with old and young sibling 1.577 150 (10) 1.605 58 (4)
Male with young sibling 59 9 (15) 25 5 (20)
Female with young sibling 136 26 (19) 19 6 (32)
Male without sibling 224 38 (17) 181 16 (9)
Female without sibling 228 34 (15) 192 10 (5)
Time spent on chores per week
<14 hours 4.535 462 (10) 3.266 148 (5)
>14 hours 1.114 216 (19) 2.284 105 (5)∗
The poverty line was calculated on the basis of the level of household consumption including purchases but also on consumption from other sources likeown production and payments received in kind. The approach used follows standard international practices by adjusting for differences in prices faced byhouseholds (price deflator) and by taking into account the household composition (household size measured in terms of adult equivalents). Given the pricesin January 2001, the poverty line was set at RWF 64,000 ($120) per adult per year, and an extreme poverty line (below which households could not even affordthe basic food consumption basket, even without spending anything on nonfood items, was RWF 45,000 ($85) per adult per year. For January 2006 pricesthese poverty lines translate into RWF 90,000 ($170) and RWF 63,500 ($120) per adult per year, respectively (see [52]).
Education Research International 7
parent(s). Fostering out children in order to enable them togo to primary school is not a common practice in Rwanda,like in some countries in West Africa, and most of them willbe orphans. They are expected to be more deprived fromeducation than children in other households. The variablepresence of parents in the household together with theeducational level of the head of the household was used totest whether girls and boys benefit differently from educatedparents/caretakers. More than half of the children came fromhouseholds with an uneducated head. In a quarter of thecases, the head had at least completed primary school. Fifteenpercent and ten percent of double orphans were not at schoolfor 2000 and 2005 while the dropout was 10% and 3% fornonorphans in the same years. Finally, the older the child,the higher the probability to drop out, as is clearly illustratedin the distribution according to three age groups.
6. Results
We built separate models for the 2000/01 and 2005/06datasets, because the two years characterised the periodsbefore and after the introduction of the free education policyin Rwanda. To find out whether children with or withoutsiblings had gained significantly higher chances of attendanceover time, we combined gender and the position amongsiblings in the household as one independent variable. Thishelped to establish whether the position among siblings hasa differential impact on attendance for boys and girls.
An evaluation of other attendance constraining factorsduring the period 2000–2005 allowed us to identify groups ofchildren who profited from the free education and those whoneed specific attention of the government to fully achieveMDG 2. We expected negative effects of the presence ofyounger siblings, living on a farm and of a large distanceto school. Positive effects on education—according to theliterature—could be, living in urban areas, educational levelof the household head, and income transfers from relatives.However, some of the constraining and enabling factorsturned out not to be significant in their contribution to theschool attendance and were dropped from our final modelpresented in Table 2. The factors that did not show upare, residence area, education level of the household headand his/her occupational status. Even after controlling fordistance to school, we expected a positive effect of living inurban areas (and especially in the capital) rather than ruralareas, because urban labour markets are more diversifiedand offer a better return on investments in educating one’schildren. However the models show that children living inKigali do not have higher odds ratios than children fromrural areas. The same holds for the educational level of thehead of the household, or his/her economic activities. Weexpected that people with a better education would be keenerto send their children to school, like parents who do not workin the agricultural sector. However, the results of all theseanalyses turned out not to be statistically significant.
The idea that income transfers between family memberspromote school attendance is not confirmed by our analysis.The results are not significant and the odds ratios in both
2000/01 and 2005/06 are close to 1. We checked whetherhouseholds with school-aged children received more trans-fers than others, but again the effects were very limited.Transfers help to alleviate the worst poverty in general, butwere not used specifically to have children attending primaryschool.
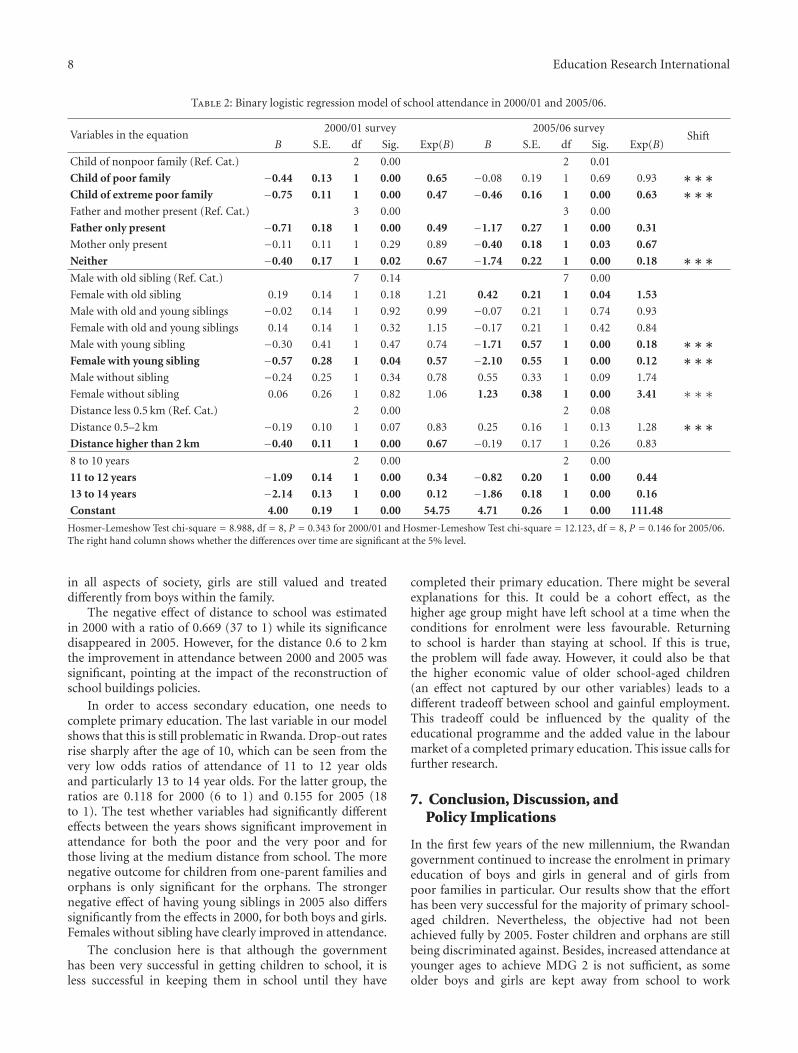
To investigate the robustness of the final model withrespect to possible interaction effects, we tested the inter-action effects of gender and presence of parents, genderand poverty, and gender and distance to school. None ofthese showed up as significant in the model. To test thehypothesis that the introduction of free education in 2003in Rwanda did lead to improved school attendance of thepoor in particular, the right hand column of Table 2 showswhether the parameters are significantly different betweenthe years.
The constant in each model reflects the starting point forthe 2000/01 and 2005/06 surveys in our reference category ofnondeprived boys aged 8–10 years from nonpoor, completefamilies, with older sibling(s) and living at a distance toschool of less than 0.5 km away. The Exp(B) of the constantgives this category’s odds of attending primary school. Theodds of attending school for boys in this group are 112 to 1in 2005. Also in 2000, most of the boys in this group went toschool, although their odds were lower (55 to 1) comparedto 2005.
The other variable’s Exp(B) give the odds ratios forcategories that deviate from the reference category. Multi-plying these by the constant gives an idea of their odds ofattendance. Table 2 shows that in 2000 compared to thereference category, coming from a poor or an extremely poorfamily reduced the odds of attending school, the ratios are0.646 and 0.471, respectively, for children from poor andextremely poor families making their odds 36 to 1 and 26to 1. In 2005 (Table 2) the odds for children of poor familiesare equal to those from non-poor families. The odds for thechildren from extremely poor families were also better in2005; their odds ratio in that year is of the same magnitudeas the ratio for children from poor families 5 years before.
School attendance of the poor and very poor clearlyimproved in the period 2000–2005. Despite the policy topay specific attention to vulnerable children and particularlyorphans, the models show that the attendance of childrenwho had lost both parents did not improve between 2000and 2005. The odds ratios are smaller in 2005. Orphans evenlagged significantly further behind other children in 2005than in 2000.
The gender of the child combined with its siblingposition did have a significant impact on school attendance,and again these effects are stronger in 2005 than in 2000.
Being the youngest in the household has the expectedpositive effect at least for girls, although the odds ratio is notsignificant in 2000, but it is in 2005. Being the oldest has theexpected negative effect on school attendance for both boysand girls but more so for girls than for boys. The effect ismuch stronger in 2005, the odds of attending school being172 to 1 for girls that are the youngest and 14 to 1 for thosebeing the oldest in the family. Despite the successful effortsof the Rwandan administration to promote gender equality
8 Education Research International
Table 2: Binary logistic regression model of school attendance in 2000/01 and 2005/06.
Variables in the equation2000/01 survey 2005/06 survey
ShiftB S.E. df Sig. Exp(B) B S.E. df Sig. Exp(B)
Child of nonpoor family (Ref. Cat.) 2 0.00 2 0.01
Child of poor family −0.44 0.13 1 0.00 0.65 −0.08 0.19 1 0.69 0.93 ∗∗∗Child of extreme poor family −0.75 0.11 1 0.00 0.47 −0.46 0.16 1 0.00 0.63 ∗∗∗Father and mother present (Ref. Cat.) 3 0.00 3 0.00
Father only present −0.71 0.18 1 0.00 0.49 −1.17 0.27 1 0.00 0.31
Mother only present −0.11 0.11 1 0.29 0.89 −0.40 0.18 1 0.03 0.67
Neither −0.40 0.17 1 0.02 0.67 −1.74 0.22 1 0.00 0.18 ∗∗∗Male with old sibling (Ref. Cat.) 7 0.14 7 0.00
Female with old sibling 0.19 0.14 1 0.18 1.21 0.42 0.21 1 0.04 1.53
Male with old and young siblings −0.02 0.14 1 0.92 0.99 −0.07 0.21 1 0.74 0.93
Female with old and young siblings 0.14 0.14 1 0.32 1.15 −0.17 0.21 1 0.42 0.84
Male with young sibling −0.30 0.41 1 0.47 0.74 −1.71 0.57 1 0.00 0.18 ∗∗∗Female with young sibling −0.57 0.28 1 0.04 0.57 −2.10 0.55 1 0.00 0.12 ∗∗∗Male without sibling −0.24 0.25 1 0.34 0.78 0.55 0.33 1 0.09 1.74
Female without sibling 0.06 0.26 1 0.82 1.06 1.23 0.38 1 0.00 3.41 ∗∗∗Distance less 0.5 km (Ref. Cat.) 2 0.00 2 0.08
Distance 0.5–2 km −0.19 0.10 1 0.07 0.83 0.25 0.16 1 0.13 1.28 ∗∗∗Distance higher than 2 km −0.40 0.11 1 0.00 0.67 −0.19 0.17 1 0.26 0.83
8 to 10 years 2 0.00 2 0.00
11 to 12 years −1.09 0.14 1 0.00 0.34 −0.82 0.20 1 0.00 0.44
13 to 14 years −2.14 0.13 1 0.00 0.12 −1.86 0.18 1 0.00 0.16
Constant 4.00 0.19 1 0.00 54.75 4.71 0.26 1 0.00 111.48
Hosmer-Lemeshow Test chi-square = 8.988, df = 8, P = 0.343 for 2000/01 and Hosmer-Lemeshow Test chi-square = 12.123, df = 8, P = 0.146 for 2005/06.The right hand column shows whether the differences over time are significant at the 5% level.
in all aspects of society, girls are still valued and treateddifferently from boys within the family.
The negative effect of distance to school was estimatedin 2000 with a ratio of 0.669 (37 to 1) while its significancedisappeared in 2005. However, for the distance 0.6 to 2 kmthe improvement in attendance between 2000 and 2005 wassignificant, pointing at the impact of the reconstruction ofschool buildings policies.
In order to access secondary education, one needs tocomplete primary education. The last variable in our modelshows that this is still problematic in Rwanda. Drop-out ratesrise sharply after the age of 10, which can be seen from thevery low odds ratios of attendance of 11 to 12 year oldsand particularly 13 to 14 year olds. For the latter group, theratios are 0.118 for 2000 (6 to 1) and 0.155 for 2005 (18to 1). The test whether variables had significantly differenteffects between the years shows significant improvement inattendance for both the poor and the very poor and forthose living at the medium distance from school. The morenegative outcome for children from one-parent families andorphans is only significant for the orphans. The strongernegative effect of having young siblings in 2005 also differssignificantly from the effects in 2000, for both boys and girls.Females without sibling have clearly improved in attendance.
The conclusion here is that although the governmenthas been very successful in getting children to school, it isless successful in keeping them in school until they have
completed their primary education. There might be severalexplanations for this. It could be a cohort effect, as thehigher age group might have left school at a time when theconditions for enrolment were less favourable. Returningto school is harder than staying at school. If this is true,the problem will fade away. However, it could also be thatthe higher economic value of older school-aged children(an effect not captured by our other variables) leads to adifferent tradeoff between school and gainful employment.This tradeoff could be influenced by the quality of theeducational programme and the added value in the labourmarket of a completed primary education. This issue calls forfurther research.
7. Conclusion, Discussion, andPolicy Implications
In the first few years of the new millennium, the Rwandangovernment continued to increase the enrolment in primaryeducation of boys and girls in general and of girls frompoor families in particular. Our results show that the efforthas been very successful for the majority of primary school-aged children. Nevertheless, the objective had not beenachieved fully by 2005. Foster children and orphans are stillbeing discriminated against. Besides, increased attendance atyounger ages to achieve MDG 2 is not sufficient, as someolder boys and girls are kept away from school to work
Education Research International 9
in or outside the homestead. Extra policy measures andprogrammes are necessary to facilitate the completion ofprimary education by children above the age of 10, withspecific attention paid to the oldest girls in the family andfoster children.
Poverty leading to resource dilution when family sizeincreases and sibling complementarity are probable causesfor keeping children away from school and making themwork. The elimination of school fees was a first step,but clearly not a big enough one. The estimated costs(2002) of RWF 11,000 ($21) per child per year were stilla great deterrent to enrolling a child in school. Even theMinistry of Education (see [55]) recognised that the mainfinancial support at that time for children attending schoolis the family (90.6%), followed by the state (4.5%) andthen other organisations. Subsidies for school uniforms forchildren from extremely poor and incomplete families couldbe a policy option. Experiments in Kenya illustrated thatgiving school uniforms to poor children reduced schoolabsenteeism (see [32]). School uniforms could perhaps bebought by schools and loaned to families for a nominal fee.It should be discussed whether the advantages of compulsoryschool uniforms are more important than achieving fullschool enrolment and completion in a country that has somany poor parents/caretakers. The World Food Program(WFP) started the school feeding program (SFP) in Rwandain 2001. In 2005, the Rwanda SFP was targeted to 12 drought-prone, food-insecure districts. Attendance rates in WFP-assisted schools increased from 73 percent to 95 percentin 2006 (see [56]). From January 2008 to December 2012,WFP extended its program targeting 290,000 students in 300schools, at a cost of $4.5 million per year. In response togovernment’s policy shift to include free education to nineyears of basic education (9YBE), WFP has raised its target to350,000 across the country. Nutritious food is provided as adaily cooked meal in primary schools, and starting in 2010WFP also provided a monthly take-home ration of vegetableoil for host families of orphans and vulnerable children(OVC) (see [57]). The Rwandan government aims at theimplementation of a general school feeding programme by2012, when the WFP support (the government partner infeeding school children) will be phased out. The assessmentof local production for school meals in Rwanda is thefirst step towards having parents and local communitiestaking over WFP school-feeding programmes (see [58]).The latest news on this topic, however, is that—after theending of the WFP program—schools will ask parents topay RWF 4700 (around $8) for a period of 3 months orthe authorities will ask a support from residents for themeals distributed at school if the program is to continue(see [59]). As our analyses showed that the very poorhave lower odds of attendance, requesting a contributionof parents might introduce a new barrier for this group inparticular, and finding ways of exempting them from chargesmight be called for. Enforcing the laws on compulsoryprimary education and the prohibition of child labourand apprenticeships by children under the age of 15 whohave not completed primary education could possibly alsocontribute to achieving MDG 2. The education situation
of orphans has deteriorated in Rwanda. This is a problemthat will not disappear when the victims of the disturbingevents of the 1990s have grown up as long as peoplecontinue to fall victim to HIV/AIDS. Particularly orphans ofparents who died of this disease are stigmatised and receiveless community support (see [27]). A grant given to theorphan him- or herself to cover the cost of uniforms andbooks or as reward for actually attending school would bepreferable to providing the orphan’s household with generalfinancial support. There are also clear limits to what policiesmight achieve. Several authors have concluded that whenenrolment in primary education is close to universal, as itis in Rwanda, the enabling factors hardly contribute to evenhigher attendance rates, although they might play a role inthe completion of primary school and therefore also in theenrolment in secondary education. Bold et al. [8], Behrmanand Skoufias [60] found this to be the case for Kenya andMexico. In the evaluation of PROGRESA (PROGRESA isa Mexican government program introduced in August1997as a key component of its poverty alleviation strategy.PROGRESA is an acronym for “Programa de Education,Salud y Alimentacion” or the “Education, Health andNutrition Program” [61]) in Mexico, Coady [61] found thatthis programme increased the enrolment rates by 0.74–1.07percentage points for boys and 0.96–1.45 percentage pointsfor girls. However, our analyses showed that constrainingfactors are of importance to specific groups and policies maybe devised to target these groups in particular to increasetheir efficiency. Yet we are aware that achieving universalcompletion of primary education depends on more thaneducational policies. We agree with Buchmann [12] that alack of added value in the labour market of a completededucation might negatively affect the tradeoff between thecosts and returns related to older pupils. Education is not justan instrument, but also an outcome of poverty reduction andeconomic development. Further research into the drivingfactors for completion rather than just attendance is needed.
Acknowledgments
The authors would like to express their appreciation toHewlett Foundation and Netherlands Organisation for Sci-entific Research for their financial support (Grant no. W0740 202 00), to the anonymous reviewers for their stimulatingcomments, and to Jeremy Raynor for language editing.
References
[1] UN (United Nations), The Millennium Development GoalsReport 2010, United Nations, New York, NY, USA, 2010.
[2] W. Easterly, “How the millennium development goals areunfair to Africa,” World Development, vol. 37, no. 1, pp. 26–35, 2009.
[3] UNDP (United Nations Development Programme), HumanDevelopment Report 2010. The Real Wealth of Nations. Path-ways to Human Development, UNDP, New York, NY, USA,2010.
[4] WB (World Bank), Education in Rwanda. RebalancingResources to Accelerate Post-Conflict Development and Poverty
10 Education Research International
Reduction, A World Bank, Country Study, Washington, DC,USA, 2004.
[5] MINECOFIN (Ministry of Finance Economic Planning),Vision 2020, MINECOFIN, Kigali, Rwanda, 2000.
[6] L. Grogan, “Universal primary education and school entry inUganda,” Journal of African Economies, vol. 18, no. 2, pp. 183–211, 2009.
[7] K. Deininger, “Does cost of schooling affect enrollment by thepoor? Universal primary education in Uganda,” Economics ofEducation Review, vol. 22, no. 3, pp. 291–305, 2003.
[8] T. Bold, M. Kimenga, G. Mwabu, and J. Sandefur, “Whydid abolishing fees not increase public school enrolment inKenya?” Working Paper 271, Center for Global Development,Washington, DC, USA, 2011.
[9] K. Banya and J. Elu, “Implementing basic education: anAfrican experience,” International Review of Education, vol. 43,no. 5-6, pp. 481–496, 1997.
[10] E.O. Mukudi and E. J. Keller, “Public funding and budgetarychallenges to providing universal access to primary educationin sub-Saharan Africa,” International Review of Education, vol.56, no. 1, pp. 5–31, 2010.
[11] G. S. Becker, A Treatise on Family, Harvard University Press,Cambridge, Mass, USA, 1991.
[12] C. Buchmann, “Family structure, parental perceptions, andchild labor in Kenya: what factors determine who is enrolledin school?” Social Forces, vol. 78, no. 4, pp. 1349–1378, 2000.
[13] P. Jensen and H. S. Nielsen, “Child labour or schoolattendance? Evidence from Zambia,” Journal of PopulationEconomics, vol. 10, no. 4, pp. 407–424, 1997.
[14] A. Admassie, “Child labour and schooling in the contextof a subsistence rural economy: can they be compatible?”International Journal of Educational Development, vol. 23, no.2, pp. 167–185, 2003.
[15] K. Basu and Z. Tzannatos, “The global child labor problem:what do we know and what can we do?” World Bank EconomicReview, vol. 17, no. 2, pp. 147–173, 2003.
[16] ILO (International labour Organisation), Child Labour inAfrica, Cornell University/International Labour Organisation,Ithaca, NY, USA, 2005.
[17] R. Ravinder, “The child labour in developing countries: achallenge to millennium development goals,” Indus Journal ofManagement & Social Sciencesno, vol. 3, no. 1, pp. 1–8, 2009.
[18] C. Y. Kim, “Is combining child labour and school educationthe right approach? Investigating the Cambodian case,” Inter-national Journal of Educational Development, vol. 29, no. 1, pp.30–38, 2009.
[19] C. Colclough, P. Rose, and M. Tembon, “Gender inequalitiesin primary schooling: the roles of poverty and adverse culturalpractice,” International Journal of Educational Development,vol. 20, no. 1, pp. 5–27, 2000.
[20] L. Ersado, “Child labor and schooling decisions in urbanand rural areas: comparative evidence from Nepal, Peru, andZimbabwe,” World Development, vol. 33, no. 3, pp. 455–480,2005.
[21] M. Q. Dao, “Gender gaps in human capital in developingcountries: an empirical assessment,” Economics Research Inter-national, vol. 2012, Article ID 715419, 8 pages, 2012.
[22] A. Huggins and S. K. Randell, “Gender equality in edu-cation in Rwanda: what is happening to our girls?” inSouth African Association of Women Graduates Conferenceon “Drop-Outs from School and Tertiary Studies: What IsHappening to Our Girls?”, Cape Town, South Africa, 2007,http://www.ifuw.org/rwanda/media/art-education.pdf.
[23] P. M. Eloundou-Enyegue and L. B. Williams, “Family size andschooling in sub-Saharan African settings: a reexamination,”Demography, vol. 43, no. 1, pp. 25–52, 2006.
[24] T. O. Owuamanam and O. Alowolodu, “Education pursuit andIncome as correlates of Family size in Ondo State, Nigeria,”Journal of Social Sciencesno, vol. 23, no. 2, pp. 123–127, 2010.
[25] B. Boockmann, “The effect of ILO minimum age conventionson child labor and school attendance: Evidence from aggregateand individual-level data,” World Development, vol. 38, no. 5,pp. 679–692, 2010.
[26] R. Salem, Is Gender Bias in Education in Education Mediatedby Sibling Configuration?: evidence from Egypt, Office ofPopulation Research, Princeton University, Princeton, NJ,USA, 2007.
[27] T. R. Thurman, L. A. Snider, N. W. Boris, E. Kalisa, L.Nyirazinyoye, and L. Brown, “Barriers to the communitysupport of orphans and vulnerable youth in Rwanda,” SocialScience and Medicine, vol. 66, no. 7, pp. 1557–1567, 2008.
[28] S. Bhalotra, “Child labour in Africa,” OECD Social, Employ-ment and Migration Working Paper no. 4, OECD, 2003.
[29] C. Siaens, K. Subbarao, and Q. Wodon, Are Orphans EspeciallyVulnerable? Evidence from Rwanda, World Bank, Washington,DC, USA, 2003.
[30] K. J. A. Thomas, “Family contexts and schooling disrup-tion among orphans in post-genocide Rwanda,” PopulationResearch and Policy Review, vol. 29, no. 6, pp. 819–842, 2010.
[31] A. Case and C. Ardington, “The impact of parental death onschool outcomes: longitudinal evidence from South Africa,”Demography, vol. 43, no. 3, pp. 401–420, 2006.
[32] D. K. Evans and E. Miguel, “Orphans and schooling in Africa:a longitudinal analysis,” Demography, vol. 44, no. 1, pp. 35–57,2007.
[33] P. Vinck, Rwanda: Comprehensive Food Security andVulnerability Analysis, WFP and NISR in StrengtheningEmergency Needs Assessment Capacity (SENAC), Kigali,Rwanda, 2006, http://zunia.org/uploads/media/knowledge/Rwanda%20CFSVA%20Final%20Feb 07.pdf.
[34] K. Musick and R. D. Mare, “Recent trends in the inheritanceof poverty and family structure,” Social Science Research, vol.35, no. 2, pp. 471–499, 2006.
[35] P. Glick and D. E. Sahn, “Schooling of girls and boys in a WestAfrican country: the effects of parental education, income, andhousehold structure,” Economics of Education Review, vol. 19,no. 1, pp. 63–87, 1999.
[36] J. F. Kobiane, A. E. Calves, and R. Marcoux, “Parentaldeath and children’s schooling in Burkina Faso,” ComparativeEducation Review, vol. 49, no. 4, pp. 468–489, 2005.
[37] A. Bommier and S. Lambert, “Education demand and age atschool enrollment in Tanzania,” Journal of Human Resources,vol. 35, no. 1, pp. 177–203, 2000.
[38] Y. Nonoyama-Tarumi, E. Loaiza, and P. L. Engle, “Late Entryinto primary school in developing societies: findings fromcross-national household surveys,” International Review ofEducation, vol. 56, no. 1, pp. 103–125, 2010.
[39] S. Al-Samarrai and B. Reillya, “Urban and rural differences inprimary school attendance: an empirical study of Tanzania,”Journal of African Economies, vol. 9, no. 4, pp. 430–474, 2000.
[40] P. Uvin, “Reading the Rwandan genocide,” InternationalStudies Review, vol. 3, no. 3, pp. 75–99, 2001.
[41] J. Bridgeland, S. Wulsin, and M. McNaught, RebuildingRwanda. From Genocide to Prosperity through Education,Hudson Institute, New York, NY, USA, 2009.
[42] A. Dyregrov, L. Gupta, R. Gjestad, and E. Mukanoheli,“Trauma exposure and psychological reactions to genocide
Education Research International 11
among Rwandan children,” Journal of Traumatic Stress, vol. 13,no. 1, pp. 3–21, 2000.
[43] A. Obura, Never Again: Educational Reconstruction in Rwanda,UNESCO/International Institute for Education Planning,Paris, France, 2003.
[44] D. De Walque, “Parental education and children’s schoolingoutcomes: evidence from recomposed families in Rwanda,”Economic Development and Cultural Change, vol. 57, no. 4, pp.723–746, 2009.
[45] A. Okech and R. M. Torres, Rwanda: Study of Literacy Needsand Programmes for Youth and Adults, Ministry of Education,Science, Technology and Scientific Research, Final Report,Kigali, Rwanda, 2005.
[46] SCF (Save the Children Fund), Learning From Experience:Children and Violence, SCI, London, UK, 1999.
[47] WFP (World Food Program), Report of the Evaluation ofthe WFP’s Portfolio of Activities in Rwanda, WFP EvaluationOffice, OEDE, Rome, Italy, 2004.
[48] MINALOC (Ministry of Local Government, Information andSocial Affairs), National Policy for Orphans and VulnerableChildren, MINALOC, Kigali, Rwanda, 2003.
[49] IMF (International Monetary Fund), Rwanda: Poverty Reduc-tion Strategy, Annual Progress Report 2003, IMF, Washington,DC, USA, 2005.
[50] D. J. Megil, Recommandations on Sample Design and Esti-mation Methodology for the Rwanda Enquete Integrale sur lesConditions de vie des Menages 2005, OPM, Kigali, Rwanda,2005.
[51] NISR, Enquete Integrale sur les Conditions de vie des Menages2005-2006, Study Documentation, NISR, Kigali, Rwanda, 2007.
[52] A. McKay and G. Greenwell, “Methods used for povertyanalysis in Rwanda poverty update note,” First draft,2007 http://196.44.242.24/eicv/survey0/data/docs/studies/rwanda poverty analysis methodological note first draft.pdf.
[53] MINECOFIN, Preliminary Poverty Update Report, IntegratedLiving Conditions Survey 2005/06, Rwanda Development Indi-cators, National Institute of Statistics, Kigali, Rwanda, 7thedition, 2006.
[54] MINECOFIN, EICV Poverty Analysis for Rwanda’s EconomicDevelopment and Poverty Strategy, National Institute of Statis-tics, Kigali, Rwanda, 2007.
[55] MINEDUC (Ministry of Education, Science, Technologyand Scientific Research), Education for All: Plan of Action,MINEDUC, Kigali, Rwanda, 2003.
[56] W. Lamberts, “Hunger: school feeding in Rwanda,” 2009,http://voices.yahoo.com/ending-child-hunger-school-feeding-rwanda-2473805.html.
[57] A. Gelli, U. Meir, and F. Espejo, “Does provision of food inschool increase girls’ enrollment? Evidence from schools insub-Saharan Africa,” Food and Nutrition Bulletin, vol. 28, no.2, pp. 149–155, 2007.
[58] USDA (United States Department of Agriculture), Assessmentof Local Production for School Feeding in Rwanda, Bill andMelinda Gates Foundation with assistance from the WFP,Washington, DC, USA, 2009, http://www.sign-schoolfeeding.org/ dynamic/downloads/Assessment%20of%20Local%20-Production%20for%20School%20Feeding%20in%20Rwanda.pdf.
[59] A. V. Dusabemungu, Pupils Abandon School Due to Lackof Food, IGIHE.Com-Newspaper, 2012, http://en.igihe.com/news/pupils-abandon-school-due-to-lack-of-food.html.
[60] J. R. Behrman and E. Skoufias, “Mitigating myths aboutpolicy effectiveness: evaluation of Mexico’s antipoverty andhuman resource investment program,” Annals of the American
Academy of Political and Social Science, vol. 606, no. 1, pp. 244–275, 2006.
[61] D. Coady, Alleviation Structural Poverty in Developing Coun-tries: The Approach of PROGRESA in Mexico, Research FellowFood Consumption Nutrition Division International FoodPolicy Research Institute, 2003.

Submit your manuscripts athttp://www.hindawi.com
Child Development Research
Hindawi Publishing Corporationhttp://www.hindawi.com Volume 2014
Education Research International
Hindawi Publishing Corporationhttp://www.hindawi.com Volume 2014
Biomedical EducationJournal of
Hindawi Publishing Corporationhttp://www.hindawi.com Volume 2014
Hindawi Publishing Corporationhttp://www.hindawi.com Volume 2014
Psychiatry Journal
ArchaeologyJournal of
Hindawi Publishing Corporationhttp://www.hindawi.com Volume 2014
Hindawi Publishing Corporationhttp://www.hindawi.com Volume 2014
AnthropologyJournal of
Hindawi Publishing Corporationhttp://www.hindawi.com Volume 2014
Research and TreatmentSchizophrenia
Hindawi Publishing Corporationhttp://www.hindawi.com Volume 2014
Urban Studies Research
Population ResearchInternational Journal of
Hindawi Publishing Corporationhttp://www.hindawi.com Volume 2014
CriminologyJournal of
Hindawi Publishing Corporationhttp://www.hindawi.com Volume 2014
Aging ResearchJournal of
Hindawi Publishing Corporationhttp://www.hindawi.com Volume 2014
Hindawi Publishing Corporationhttp://www.hindawi.com Volume 2014
NursingResearch and Practice
Current Gerontology& Geriatrics Research
Hindawi Publishing Corporationhttp://www.hindawi.com
Volume 2014
Sleep DisordersHindawi Publishing Corporationhttp://www.hindawi.com Volume 2014
AddictionJournal of
Hindawi Publishing Corporationhttp://www.hindawi.com Volume 2014
Depression Research and TreatmentHindawi Publishing Corporationhttp://www.hindawi.com Volume 2014
Hindawi Publishing Corporationhttp://www.hindawi.com Volume 2014
Geography Journal
Hindawi Publishing Corporationhttp://www.hindawi.com Volume 2014
Research and TreatmentAutism
Hindawi Publishing Corporationhttp://www.hindawi.com Volume 2014
Economics Research International