formulation of aquafeeds
TRANSCRIPT
CHAPTER
4Formulation of AquafeedsMAE R. CATACUTAN
Introduction
The development of a feed that is both effective and economical for an aquaculture species in all its life stages is a continuous effort. Aquafeed developm ent started when natural food sources in culture systems became inadequate and had to be supplemented with prepared feed. As fish stocking densities in culture increase, supplemental feeding is no longer sufficient. A complete feed that contains all the necessary nutrients in su ffic ien t am ounts to bring about good growth, survival, and reproduction is needed. Feed ingredients generally come from animal or plant sources and some are by-products of the food industry. There is no single feed ingredient or feedstu ff that contains all the nutrients in adequate amounts. Thus, different feed ingredients are combined to make a feed that has the desired composition and nutrient levels. In combining various feed ingredients, it is important to know how much of each feed ingredient should be used to produce a cost-effective aquafeed.
With the growth and expansion of aquaculture into a major industry, several fish species are being cultured; thus, the development of more efficient aquafeed formulations should continue. In developing cost- effective formulated diets, many important factors have to be considered. This chapter discusses these factors and the mathematical calculations in formulating a feed. It aims to enable students to formulate diets using purified and practical feed ingredients, and also to formulate effective supplemental and complete diets for aquaculture species.
Feed Ingredients for Aquaculture
Feed ingredients or feedstuffs for aquaculture come from many different sources and are used because oftentimes they are not utilized for human consumption. The choice o f a feed ingredient in aquafeed formulation depends on: con ten t o f essen tia l nu trien ts; d iges tib ility and bioavailability; absence of antinutritional factors and toxic substances; commercial availability; and cost.
Animal and plant materials are the most common feed ingredients. Some wastes and by-products of the food industry are also utilized. There
100 C H A PTER 4 NUTRITION IN TROPICAL AQUACULTURE
Table 4.1 Some sources of protein, lipid, and carbohydrate in aquaculture feeds
P ro te in Lipid C a rb o h y d ra te
B lo o d m ea l B e e f ta llo w B rea d flo u rC o p ra m ea l C o rn o il C a s s a v a s ta rchD e fa tte d s o y b e a n m ea l C o d liv e r o il C o rn m ea lF ish m ea l C o c o n u t o il C o rn s ta rchM e a t a n d b o n e m ea l C o tto n s e e d o il F ine rice b ranS h rim p he ad m ea l M e n h a d e n o il S a g o pa lm s ta rchS h rim p m ea l P o lla ck live r oil S e a w e e d sS q u id m ea l Tuna live r oilT rash fish S q u id live r o ilYeast S o y b e a n o il
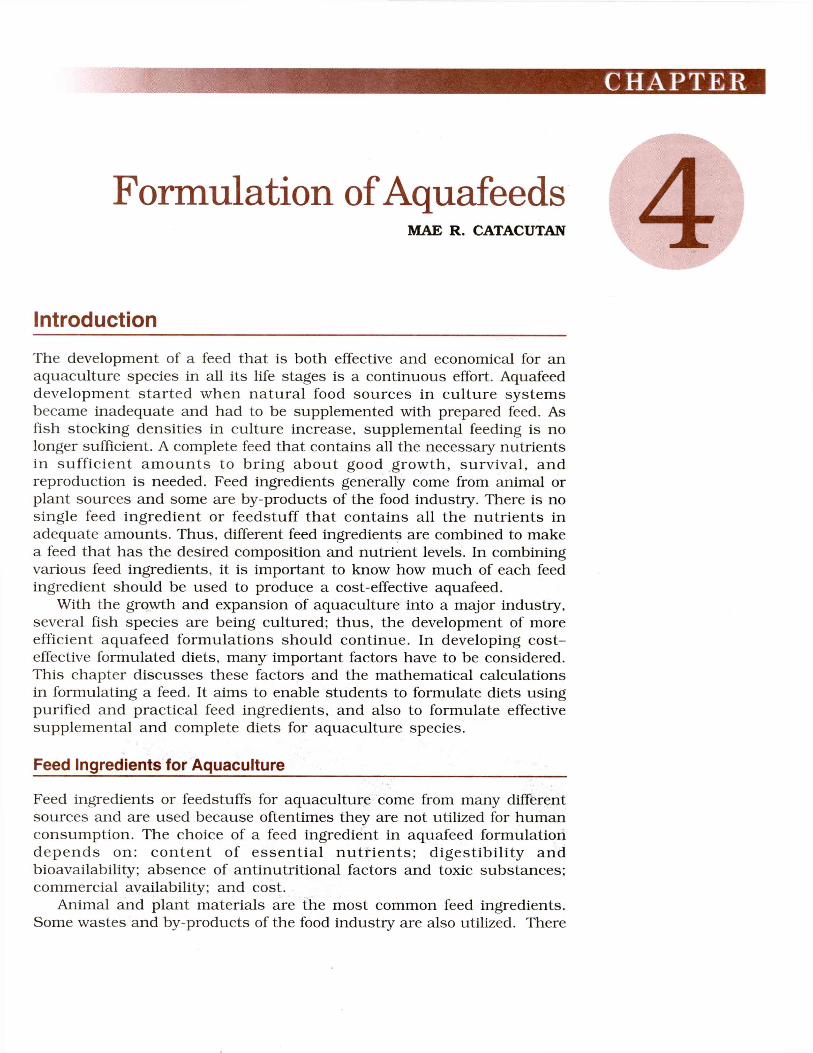
are feed ingredients that are indigenous in some areas and may not be availab le in commercial quantities. Some feed ingredients for aquaculture feeds are listed in Table 4.1 and shown in Figure 4.1.
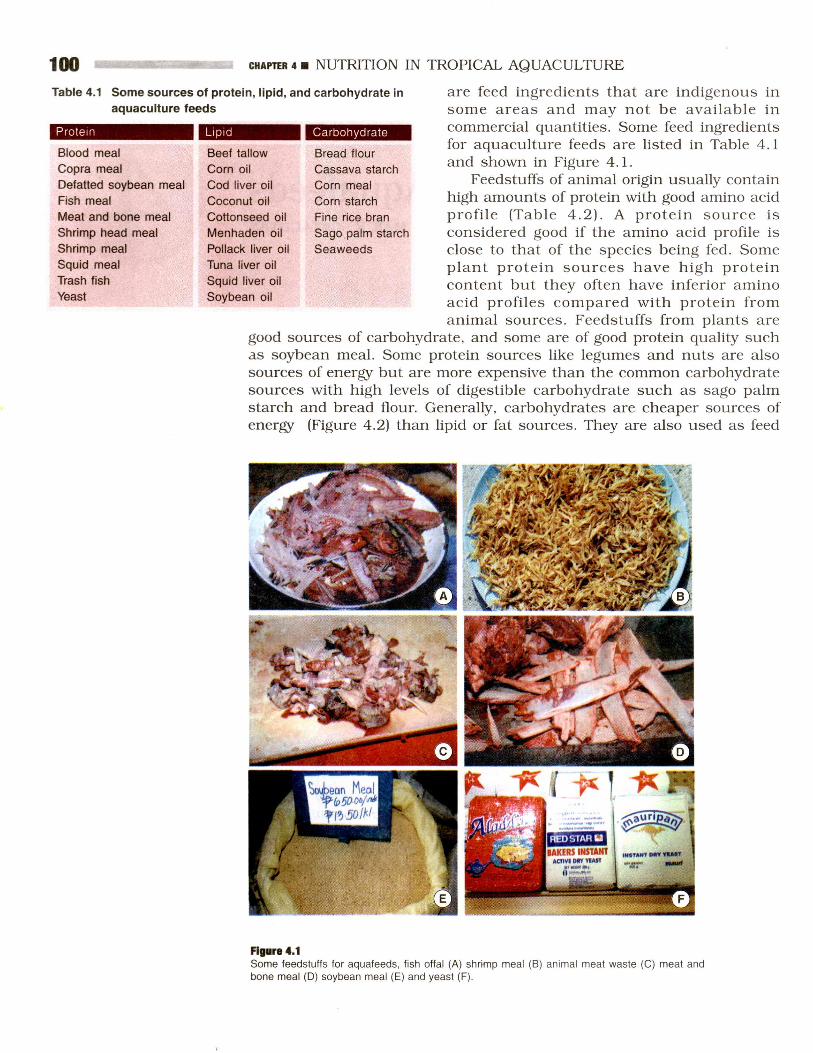
Feedstuffs of animal origin usually contain high amounts of protein with good amino acid p rofile (Table 4.2). A prote in source is considered good if the amino acid profile is close to that of the species being fed. Some plant protein sources have high protein content but they often have inferior amino acid profiles com pared with protein from animal sources. Feedstuffs from plants are
good sources of carbohydrate, and some are of good protein quality such as soybean meal. Some protein sources like legumes and nuts are also sources of energy but are more expensive than the common carbohydrate sources with high levels of digestible carbohydrate such as sago palm starch and bread flour. Generally, carbohydrates are cheaper sources of energy (Figure 4.2) than lipid or fat sources. They are also used as feed
F ig u re 4 .1Some feedstuffs for aquafeeds, fish offal (A) shrimp meal (B) animal meat waste (C) meat and bone meal (D) soybean meal (E) and yeast (F).
CHAPTER 4 Formulation of Aquafeeds 101Table 4.2 Amino acid composition of some fish meals (FM), leaf meals (LM) and other protein sources
Amount (g/100 g protein)
Am ino acid W hiteFM
PeruvianFM
S apsapFM
TunaFM
TabagakFM
S hrim pm eal
S qu idm eal
S oybeanm eal
KangkongLM
C am oteLM
Ipil-ip ilLM
AcaciaLM Tamarind LM
A la n in e 6 .0 6.1 6 .7 5 .0 5 .5 5 .5 5 .8 4 .0 5 .0 5 .2 6 .2 3 .2 3 .6A rg in in e 6 .2 5 .5 4 .0 5 .4 4 .7 7.1 7 .5 6 .0 3 .3 3 .7 5.2 2 .2 2 .4A s p a rtic ac id 9 .4 8 .7 9 .5 8 .5 8.1 8 .3 10.1 11.1 8 .7 10 .2 11 .4 6 .3 7 .6C y s tin e 0 .7 0 .9 0 .8 0 .7 0 .9 0 .6 0 .9 1.2 0 .5 0 .3 0 .6 0 .5 0 .5G lu ta m ic ac id 13 .8 13 .2 14 .9 11 .2 11 .3 12 .4 15 .8 18 .7 8 .8 10 .2 11 .2 6 .6 7 .6G ly c in e 7 .0 5 .4 6 .4 5 .2 5 .3 4 .9 5 .7 4 .0 4 .3 4 .7 6 .0 3.2 4 .0H is tid in e 2 .2 1.8 3 .9 5 .6 2 .3 2.1 2 .2 3 .2 2 .7 2 .8 1.4 3 .9 4 .0Is o le u c in e 3 .9 4.1 4 .5 3 .9 4 .2 3 .8 4 .2 4 .5 3 .4 3 .7 6 .6 2 .4 3 .0L e u c in e 7 .4 7.1 7 .5 6 .5 6 .6 6.7 7 .7 7 .2 6 .5 7 .9 6 .6 4 .8 5 .7L y s in e 7 .7 7 .4 7 .3 6 .2 7 .3 6 .3 7 .8 5 .8 4 .6 4 .4 6.1 2 .9 3 .4M e th io n in e 3 .0 2 .8 2 .9 2 .3 2 .8 2 .4 2 .8 1.4 1.5 1.8 1.2 0 .9 0 .9P h e n y la la n in e 4 .3 3 .8 3 .8 3 .8 3 .5 3 .8 3 .4 5 .2 5 .7 6 .5 3 .9 3 .8 4 .2P ro lin e 4 .3 4 .2 3 .5 3 .7 3 .0 3 .2 3 .8 5 .5 3 .9 3.8 5 .5 3 .6 3 .8S e r in e 4 .4 3 .6 3 .4 3 .3 3.1 3.1 3 .9 5 .2 3 .7 4 .3 4 .4 3 .2 3 .8T h re o n in e 4 .2 3 .9 3 .9 3 .6 3 .7 3 .6 4.1 3 .8 3 .9 4 .4 5.1 2 .7 3 .6T ry p to p h a n 1.0 0 .7 1.2 0 .8 0 .8 1.1 1.0 0 .4 N A N A N A N A N AT y ro s in e 3 .8 3 .2 4 .4 2 .6 3 .3 3 .3 3.1 2 .7 4.1 6 .5 3 .4 3 .5 3 .0V a lin e 5.1 5 .2 5 .2 4 .5 4 .9 4 .3 4 .3 4 .4 5 .3 5 .8 6 .3 3 .5 3 .9% P ro te in 7 0 .5 7 0 .5 6 6 .0 7 7 .2 7 8 .4 71 .8 7 8 .7 4 3 .8 31 .9 3 0 .8 2 7 .8 2 5 .3 15.1
Values given are means; NA, not analyzedSource: Peñaflorida 1989
Figure 4.2Some sources of dietary energy are corn (A), rice bran (B), cassava (C).
binders. Aside from carbohydrates, lipids are also used as sources of energy. They also provide essential fatty acids in fish diets. Examples of commonly used dietary lipid sources are fish liver oils and plant oils such as soybean oil and com oil.
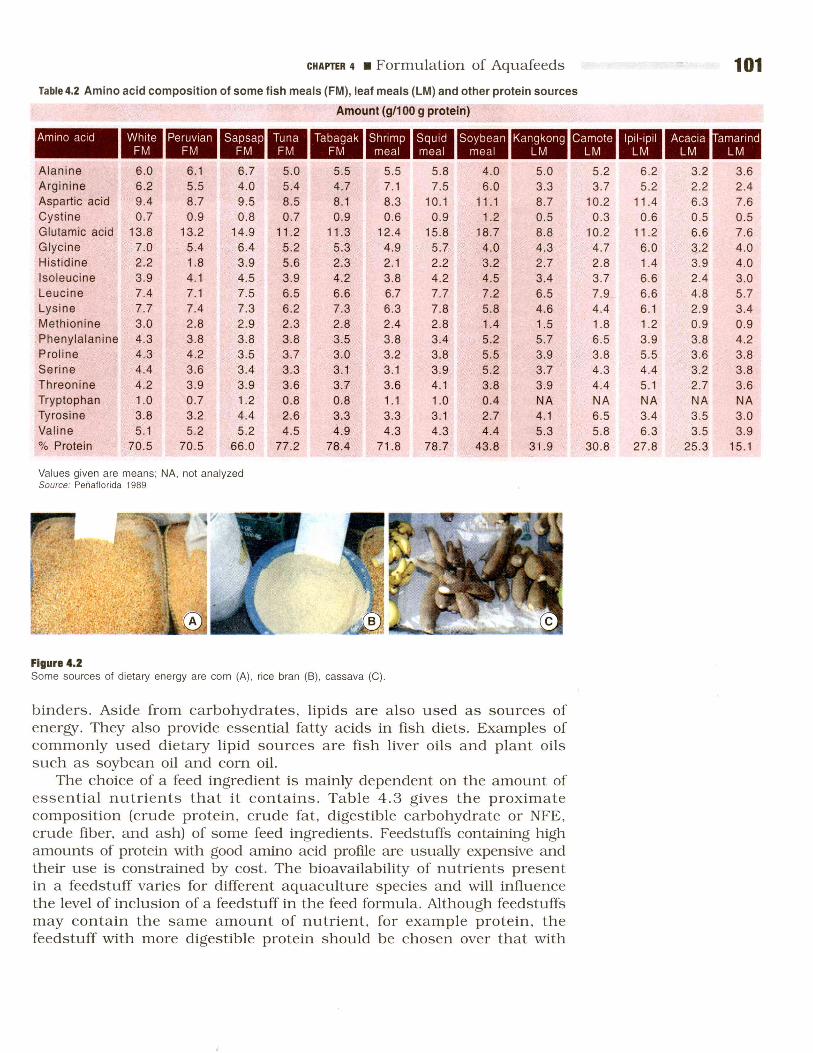
The choice of a feed ingredient is mainly dependent on the amount of essential nutrients that it contains. Table 4.3 gives the proximate composition (crude protein, crude fat, digestible carbohydrate or NFE, crude fiber, and ash) of some feed ingredients. Feedstuffs containing high amounts of protein with good amino acid profile are usually expensive and their use is constrained by cost. The bioavailability of nutrients present in a feedstuff varies for different aquaculture species and will influence the level of inclusion of a feedstuff in the feed formula. Although feedstuffs may contain the same amount o f nutrient, for example protein, the feedstuff with more digestible protein should be chosen over that with
102 CHAPTER 4 NUTRITION IN TROPICAL AQUACULTURE
Table 4.3 Proximate composition of some feed ingredients analyzed by the Centralized Analytical Laboratory at Southeast Asian Fisheries Development Center, Aquaculture Department *
A m o u n t (% d ry m a tte r)
M o is tu re C ru d e P ro te in
C ru d e
Fat
Crude Fiber N F E * ** A sh
A n im a l:F ish m ea l (FM , lo ca l) (6) 10 .3 64.1 6.5 0 .8 8 .5 20.1FM , C h ile a n (27) 8 .4 70.1 8.5 0.5 4.1 16 .8FM , D a n ish (2) 9.5 7 3 .9 9.4 0 .3 2 .4 14 .0FM , P e ru v ia n (30) 8 .3 6 8 .3 5.9 0.8 7 .7 17 .3FM , P e ru v ia n (26) 7.1 6 7 .9 10 .0 1.3 4.1 16 .7FM , tu n a (9) 9.4 6 5 .4 8 .0 0.8 8.8 17 .0FM , w h ite (11) 7.2 6 9 .0 7.6 0.6 4 .8 18 .0P raw n head m ea l (35) 6 .5 51 .2 5.2 13 .3 5.3 2 5 .0S h rim p m ea l, A c e te s sp. (60) 8 .2 6 8 .6 3.9 3 .6 7.6 16 .3S q u id m ea l (60) 6.9 7 8 .5 5.5 1.3 6 .7 8.0S qu id m ea l, s c ra p (4) 5 .5 74.1 7.1 0 .9 8.1 9.8F rog m ea l (2) 7 .6 62 .5 1.7 1.2 4 .7 2 9 .9B lo od m ea l (2) 6 .3 8 7 .7 3 .0 0 .4 3 .3 5 .6M e a t a n d b o n e m ea l (19) 5 .6 4 6 .8 9 .6 2.0 7.5 34.1Plant:A c a c ia Le a f M ea l (LM ) (2) 4 .4 2 5 .7 5 .6 2 1 .2 4 1 .7 5.8A lfa lfa LM 7.2 17 .2 3 .0 2 7 .7 4 2 .9 9.2C a m o te LM , (7) 4 .5 2 9 .7 4 .9 10 .0 43 .2 12 .2C a s s a v a LM , (8) 5 .9 22.1 9.3 12 .4 49 .2 7 .0Ip il- ip il LM , g ia n t (14) 7 .8 25.1 6.8 10 .6 4 4 .0 13 .5Ip il- ip il LM , n a tive (6) 10 .3 2 9 .3 8 .8 11 .5 4 3 .5 6 .9K a n g -ko n g LM (6) 5 .7 2 8 .5 5.4 10 .5 4 3 .6 12 .0M a lu n g g a y LM (7) 3 .5 3 0 .4 8.4 8 .3 4 3 .7 9.2P a p a ya LM (10) 5.4 2 0 .7 11 .6 11 .2 4 2 .6 13 .9C o p ra m ea l (10) 7 .9 2 2 .0 6 .7 17 .3 4 4 .3 9 .7C o w p e a (7) 8 .0 2 3 .0 1.3 4.1 6 7 .5 4.1C o w p e a , d e h u lle d (2) 7 .7 2 5 .4 0 .9 1.4 6 8 .3 4 .0M u n g b e a n , g re e n (5) 7.1 23 .2 1.2 3.1 6 8 .7 3.8M u n g b e a n , y e llo w (5) 7 .7 24.1 1.1 3 .8 67.1 3 .9R ice be an (2) 5 .0 2 6 .5 0 .8 4 .0 6 4 .6 4.1C o rn m ea l (10) 8 .4 7 .8 4 .7 2.6 83.1 1.8C o rn s ta rc h (5) 11.9 0 .4 0.2 1.1 98 .2 0.1F lour, b re a d (40) 12.1 12 .9 1.2 0.3 8 4 .9 0 .7F lour, w h o le w h e a t (15) 11 .3 15 .3 1.7 0.8 81.1 1.1W h e a t, P o lla rd (4) 9.5 15 .4 4 .5 10 .3 6 4 .0 5 .8G erm , w h e a t (2) 6 .0 2 7 .8 4 .3 3 .4 5 9 .6 4 .9G lu te n , co rn (5) 7 .3 6 2 .6 7.7 2 .2 2 5 .9 1.6G lu te n , w h e a t (6) 8 .9 8 0 .7 1.4 0 .4 16 .4 1.1R ice b ra n (78) 9 .2 13 .3 14.1 8.5 5 3 .4 10 .7R ice b ra n , tik i- t ik i (5) 10 .7 18 .0 2 .0 8.0 6 2 .4 9 .6R ice hu ll (7) 7 .0 3 .3 2 .0 3 2 .4 4 1 .6 2 0 .7S o yb e a n m ea l, as is (21) 5 .6 35 .8 19 .8 4 .9 3 3 .9 5.6S o yb e a n m ea l, d e fa tte d (108 ) 8.4 4 3 .6 1.5 5.5 4 1 .7 7 .7O th e r s o u rce s :C a s e in (11) 7 .2 8 9 .7 0.1 0.3 8 .9 1.0C ra b m ea l (2) 4 .2 3 7 .9 4.1 10 .7 8 .9 3 8 .4G e la tin (6) 7 .9 9 4 .4 0 .0 0.1 5.1 0 .4M usse l m ea l, g re e n (30) 5 .9 6 4 .6 8 .6 3 .0 12 .5 11 .8O y s te r m ea l (6) 4 .4 5 4 .6 9.4 4 .0 20.1 11 .9S ca llo p m ea l (2) 7 .3 6 5 .2 10 .9 1.4 8 .8 13 .7S na il m ea l, kuh o l (5) 4 .0 52.1 1.8 2.1 15 .7 2 8 .3Yeast, B re w e rs (2) 7 .2 4 9 .4 1.6 2 .4 3 4 .5 12.1
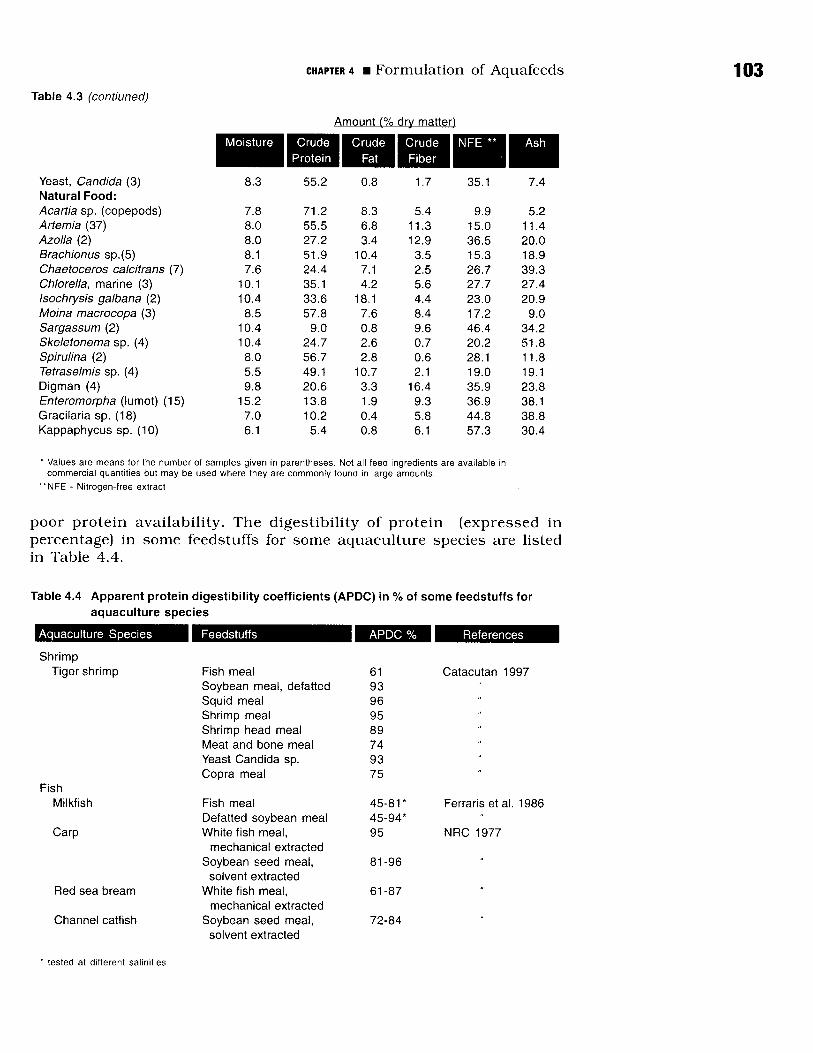
CHAPTER 4 Formulation of Aquafeeds 103Table 4.3 (continued)
A m o u n t (% d ry m a tte r)
M o is tu re C ru d eP ro te in
C ru d e
FatN F E *** A sh
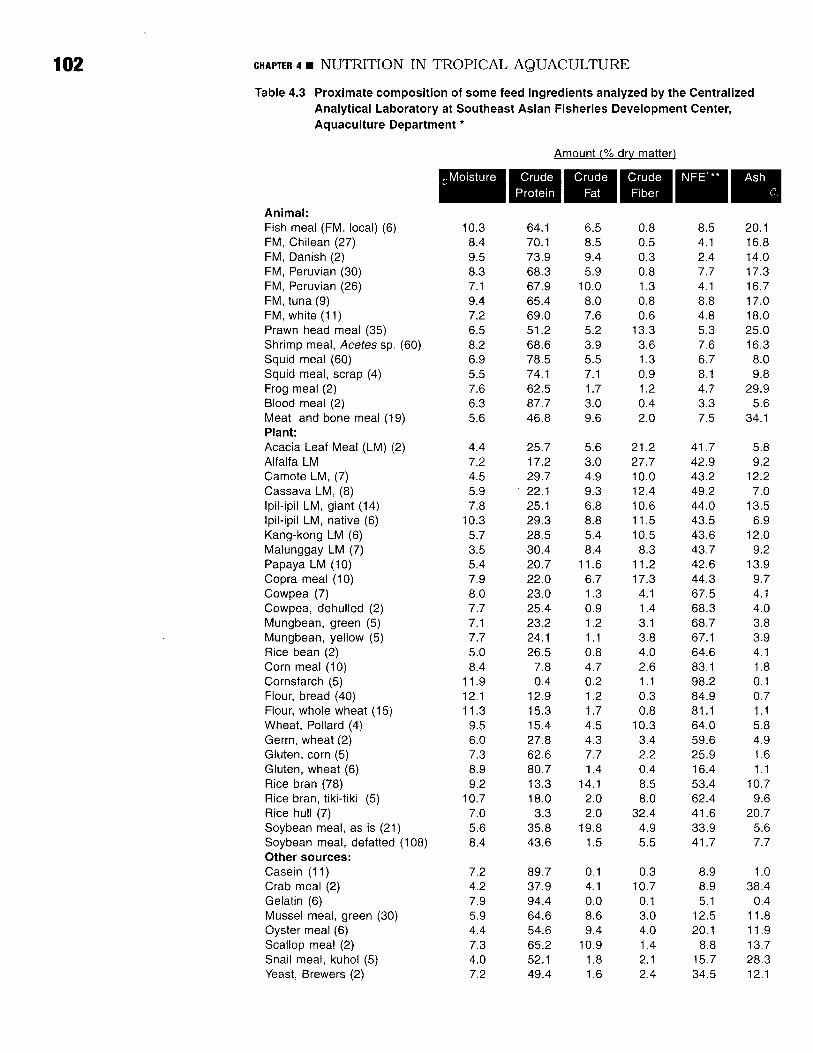
Yeast, C a n d id a (3) 8 .3 55 .2 0.8 1.7 35.1 7 .4N a tu ra l F o o d :A c a rtia sp. (co p e p o d s ) 7 .8 7 1 .2 8.3 5.4 9.9 5.2A rte m ia (37) 8 .0 5 5 .5 6.8 11 .3 15 .0 11.4A z o lla (2) 8 .0 2 7 .2 3.4 12 .9 3 6 .5 20 .0B ra c h io n u s s p . (5) 8.1 5 1 .9 10 .4 3 .5 15 .3 18 .9C h a e to c e ro s c a lc itra n s (7) 7 .6 2 4 .4 7.1 2 .5 2 6 .7 3 9 .3C h lo re lla , m a rin e (3) 10.1 35.1 4.2 5.6 2 7 .7 2 7 .4Is o c h ry s is g a lb a n a (2) 10 .4 3 3 .6 18.1 4 .4 2 3 .0 2 0 .9M o in a m a c ro c o p a (3) 8 .5 57 .8 7 .6 8 .4 17.2 9.0S a rg a s s u m (2) 10 .4 9 .0 0 .8 9.6 4 6 .4 34 .2S k e le to n e m a sp . (4) 10 .4 2 4 .7 2 .6 0 .7 2 0 .2 5 1 .8S p iru lin a (2) 8 .0 56 .7 2.8 0 .6 28.1 11 .8T e trase lm is sp. (4) 5 .5 49.1 10 .7 2.1 19 .0 19.1D ig m a n (4) 9 .8 2 0 .6 3.3 16 .4 35 .9 2 3 .8E n te ro m o rp h a ( lu m o t) (15) 15 .2 13 .8 1.9 9 .3 36 .9 38.1G ra c ila r ia sp. (18) 7 .0 10 .2 0.4 5.8 4 4 .8 3 8 .8K a p p a p h y c u s sp. (10) 6.1 5 .4 0.8 6.1 5 7 .3 3 0 .4
* Values are means for the number of samples given in parentheses. Not all feed ingredients are available in commercial quantities but may be used where they are commonly found in large amounts.
**NFE - Nitrogen-free extract
poor protein availability. The digestib ility o f protein (expressed in percentage) in some feedstuffs for some aquaculture species are listed in Table 4.4.
Table 4.4 Apparent protein digestibility coefficients (APDC) in % of some feedstuffs for aquaculture species
A q u a c u ltu re S p e c ie s F eed s tu ffs A P D C % R e fe re n ce s
S h rim pT ig e r s h rim p F ish m ea l 61 C a ta cu ta n 1997
S oyb e a n m ea l, d e fa tte d 93S q u id m ea l 96S h rim p m ea l 95S h rim p head m ea l 89M ea t and bo ne m ea l 7 4Yeast C a n d id a sp. 93C o p ra m ea l 75
F ishM ilk fish F ish m eal 4 5 -8 1 * F erra ris e t al. 1986
D e fa tte d so yb e a n m eal 4 5 -9 4 *C a rp W h ite fish m ea l,
m e ch a n ica l ex tra c te d95 N R C 1977
S oyb e a n see d m ea l, so lve n t ex tra c te d
8 1 -9 6
R ed sea b ream W h ite fish m ea l, m e ch a n ica l ex tra c te d
6 1 -8 7
C h a n n e l ca tfish S oyb e a n see d m ea l, so lve n t ex tra c te d
7 2 -8 4
* tested at different salinities
104 C H A PTER 4 NUTRITION IN TROPICAL AQUACULTURE
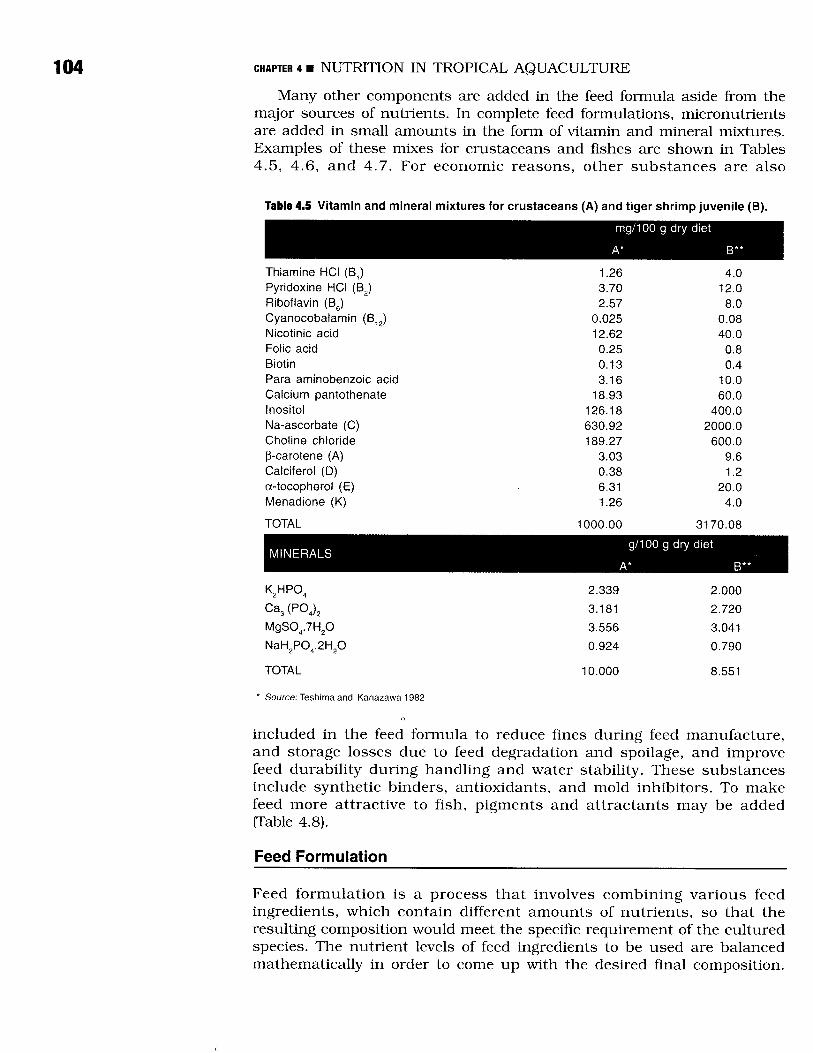
Many other components are added in the feed formula aside from the major sources of nutrients. In complete feed formulations, micronutrients are added in small amounts in the form of vitamin and mineral mixtures. Examples of these mixes for crustaceans and fishes are shown in Tables 4.5, 4.6, and 4.7. For economic reasons, other substances are also
Table 4.5 Vitamin and mineral mixtures for crustaceans (A) and tiger shrimp juvenile (B).
m g /1 0 0 g d ry d ie t
A * B * *
T h ia m in e H C l (B 1) 1 .26 4 .0P y rid o x in e H C l (B 2) 3 .7 0 12 .0R ib o fla v in (B 6) 2 .5 7 8 .0C y a n o c o b a la m in (B 12) 0 .0 2 5 0 .0 8N ic o tin ic ac id 12 .6 2 4 0 .0F o lic ac id 0 .2 5 0 .8B io tin 0 .1 3 0 .4P ara a m in o b e n z o ic ac id 3 .1 6 10 .0C a lc iu m p a n to th e n a te 18 .93 6 0 .0In o s ito l 1 2 6 .1 8 4 0 0 .0N a -a s c o rb a te (C ) 6 3 0 .9 2 2 0 0 0 .0C h o lin e c h lo r id e 1 8 9 .2 7 6 0 0 .0β -c a ro te n e (A) 3 .0 3 9 .6C a lc ife ro l (D) 0 .3 8 1.2α -to c o p h e ro l (E ) 6.31 2 0 .0M e n a d io n e (K ) 1 .26 4 .0
TO TA L 1 0 0 0 .0 0 3 1 7 0 .0 8
M IN E R A L Sg /1 0 0 g d ry d ie t
A* B **
K2H P O 4 2 .3 3 9 2 .0 0 0
C a 3 (P O 4)2 3.181 2 .7 2 0
M g S O 4.7H 2O 3 .5 5 6 3.041
N a H 2P O 4.2H 2O 0 .9 2 4 0 .7 9 0
TO TAL 1 0 .0 0 0 8.551
* Source: Teshima and Kanazawa 1982
included in the feed formula to reduce fines during feed manufacture, and storage losses due to feed degradation and spoilage, and improve feed durability during handling and water stability. These substances include synthetic binders, antioxidants, and mold inhibitors. To make feed more attractive to fish, pigments and attractants may be added (Table 4.8).
Feed Formulation
Feed formulation is a process that involves combining various feed ingredients, which contain different amounts o f nutrients, so that the resulting composition would meet the specific requirement of the cultured species. The nutrient levels of feed ingredients to be used are balanced mathematically in order to come up with the desired final composition.
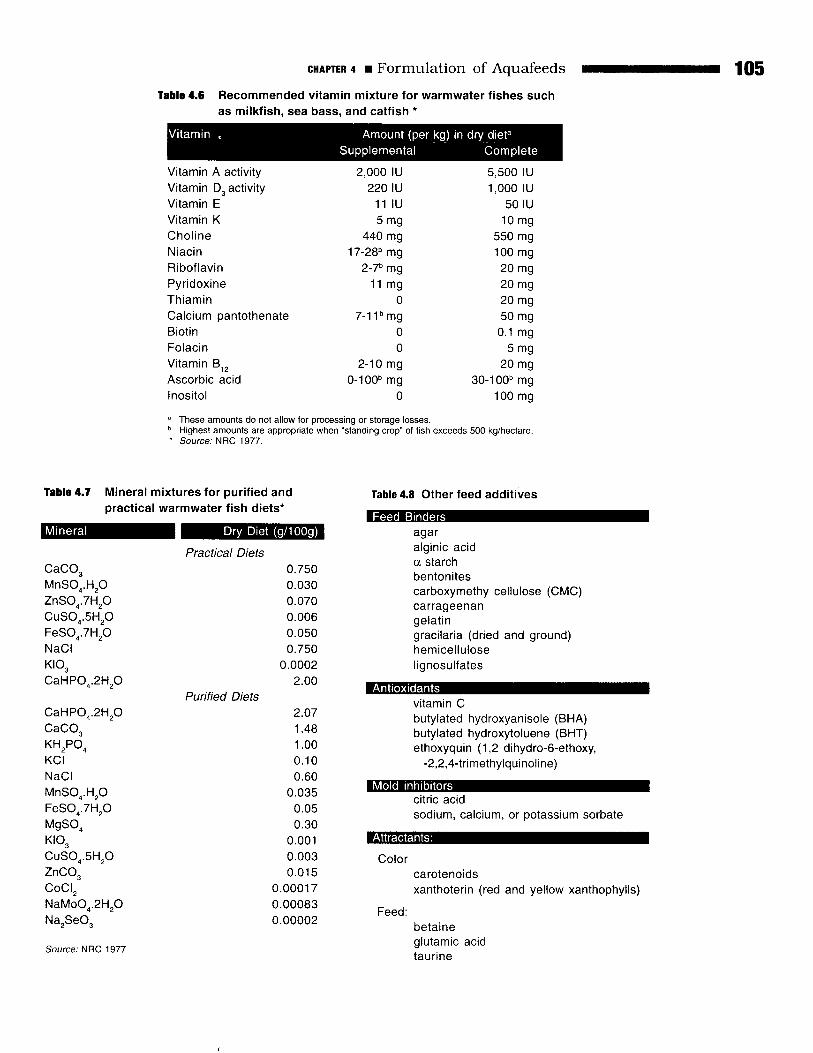
CHAPTER 4 Formulation of Aquafeeds 105Table 4 .6 Recommended vitamin mixture for warmwater fishes such
as milkfish, sea bass, and catfish *
V ita m in A m o u n t (p e r kg) in d ry d ie ta
S u p p le m e n ta l C o m p le te
V ita m in A a c tiv ity 2 ,0 0 0 IU 5 ,5 0 0 IUV ita m in D3 a c tiv ity 2 2 0 IU 1,000 IUV ita m in E 11 IU 50 IUV ita m in K 5 m g 10 mgC h o lin e 4 4 0 m g 5 5 0 m gN ia c in 17 -2 8 b m g 100 m gR ib o fla v in 2 -7 b m g 20 m gP y r id o x in e 11 m g 20 m gT h ia m in 0 20 m gC a lc iu m p a n to th e n a te 7 -1 1b m g 50 m gB io tin 0 0.1 m gF o la c in 0 5 m gV ita m in B 12 2 -1 0 m g 20 m gA s c o rb ic ac id 0 -1 0 0 b m g 3 0 -1 0 0 b m gIn o s ito l 0 100 m g
a These amounts do not allow for processing or storage losses. b Highest amounts are appropriate when “standing crop” of fish exceeds 500 kg/hectare. * Source: NRC 1977.
Table 4.7 Mineral mixtures for purified and practical warmwater fish diets*
M in e ra l D ry D ie t (g /1 0 0 g )
P ra c tic a l D ie ts
C a C O 3 0 .7 5 0M n S O 4.H 2O 0 .0 3 0
Z n S O 4.7 H 2O 0 .0 7 0
C u S O 4.5 H 2O 0 .0 0 6
F e S O 4.7 H 2O 0 .0 5 0N a C l 0 .7 5 0K IO 3 0 .0 0 0 2
C a H P O 4.2 H 2O 2 .0 0P u rifie d D ie ts
C a H P O 4.2 H 2O 2 .0 7
C a C O 3 1.48K H 2P O 4 1.00K C l 0 .1 0
N a C l 0 .6 0
M n S O 4.H 2O 0 .0 3 5F e S O 4.7H 2O 0 .0 5
M g S O 4 0 .3 0K IO 3 0.001C u S O 4.5H 2O 0 .0 0 3Z n C O 3 0 .0 1 5C o C l2 0 .0 0 0 1 7
N a M o O 4.2 H 2O 0 .0 0 0 8 3
N a 2S e O 3 0 .0 0 0 0 2
Source: NRC 1977
Table 4.8 Other feed additives
F eed B in d e rsa g a ra lg in ic ac id a s ta rch b e n to n ite sc a rb o x y m e th y ce llu lo s e (C M C )c a rra g e e n a ng e la ting ra c ila r ia (d rie d an d g ro u n d )h e m ic e llu lo s elig n o s u lfa te s
A n tio x id a n tsv ita m in Cb u ty la te d h y d ro x y a n is o le (B H A ) b u ty la te d h y d ro x y to lu e n e (B H T ) e th o x y q u in (1 ,2 d ih yd ro -6 -e th o xy ,
-2 ,2 ,4 - tr im e th y lq u in o lin e )
M o ld in h ib ito rsc itr ic ac idso d iu m , ca lc iu m , o r p o ta ss iu m so rb a te
A ttra c ta n ts :
C o lo rc a ro te n o id sxa n th o te r in (red and y e llo w x a n th o p h y lls )
Feed :b e ta in e g lu ta m ic ac id ta u r in e

106 C H A PTER 4 NUTRITION IN TROPICAL AQUACULTURE
It also takes into account the cost of materials, acceptability, and ease o f preparation.
The two most important factors to consider in formulating a feed for any aquaculture species are nutrient requirements and feeding behavior. Other factors to consider are the stages in the life cycle (larval, grow-out or broodstock) and the type of culture system. Like any other animal, fish and crustaceans need enough protein, lipid, energy, vitamins, and minerals. These nutrients should be present in the formulated feed in adequate amounts. Excessive amounts of nutrients is wasteful, while insufficient levels will result in slow growth. An allowance is made in the formula for nutrient losses during feed manufacture.
The feeding habit and behavior of the animal is also an important aspect to consider in feed formulation. For example, crustaceans such as shrimps and crabs are slow eaters and they take some time to consume the pelleted feed. In contrast, fish consume the feed immediately and, oftentimes, the feed is eaten before it touches the pond bottom. Thus, crustaceans require a more water stable feed than fish. A feed binder, usually a carbohydrate source, is added to the formulation to make the pelleted feed stay intact much longer in the water. Seaweed extracts such as kappa-carrageenan and alginates are commonly used as binders in microbound larval diet preparation. Larval diets may be prepared in suspension form, colloid form, in solution, or in dry form enclosed within a microcapsule or microcoated with a binder. Sometimes an attractant is added to the feed so that the pellet can easily be located and quickly consumed by the fish. Most aquatic species in the larval stage stay in the water column and gradually become bottom dwellers. Thus, the preferred feed at the early life stages is a feed that does not settle in the tank bottom but stays in the water column for a long time. Some aquatic species may prefer a specific feed form, type, or size that should be considered in feed formulation.
The requirement for nutrients and energy varies for broodstock, grow out, and larval stages; therefore, feed formulation would also vary in nutrient content depending on the growth stages. Although feed has been formulated and tested for all the life stages of milkfish, tilapia, and shrimp and for various stages in some species (see Chapter 7), these are continuously being refined based on recent research findings. Recent data on nutrient requirements, and availability of new, cheap but good protein sources are important information in refining a feed formula.
The processed feed is influenced by the quality of the feed ingredients. Some feedstuffs show wide fluctuations in their nutrient content due to seasonal and geographical variations. Feedstuffs should first be analyzed for their proximate composition, but if this is not possible, feed composition tables (FCT) can be used as guide in formulating feeds. In some FCTs, the moisture content is included and the amounts of nutrients are expressed either on a dry matter basis or on as received basis. In formulating feeds, a uniform set of values should be consistently used. Values are expressed either on a dry matter basis, or as received basis. To convert the amount of nutrients from dry matter basis to as received basis, use the formula:
% nutrient (as received) = % nutrient (dry matter basis ) x (100 - % moisture)100
CHAPTER 4 Formulation of Aquafeeds 107There is no definite feed formula for any species because of the many
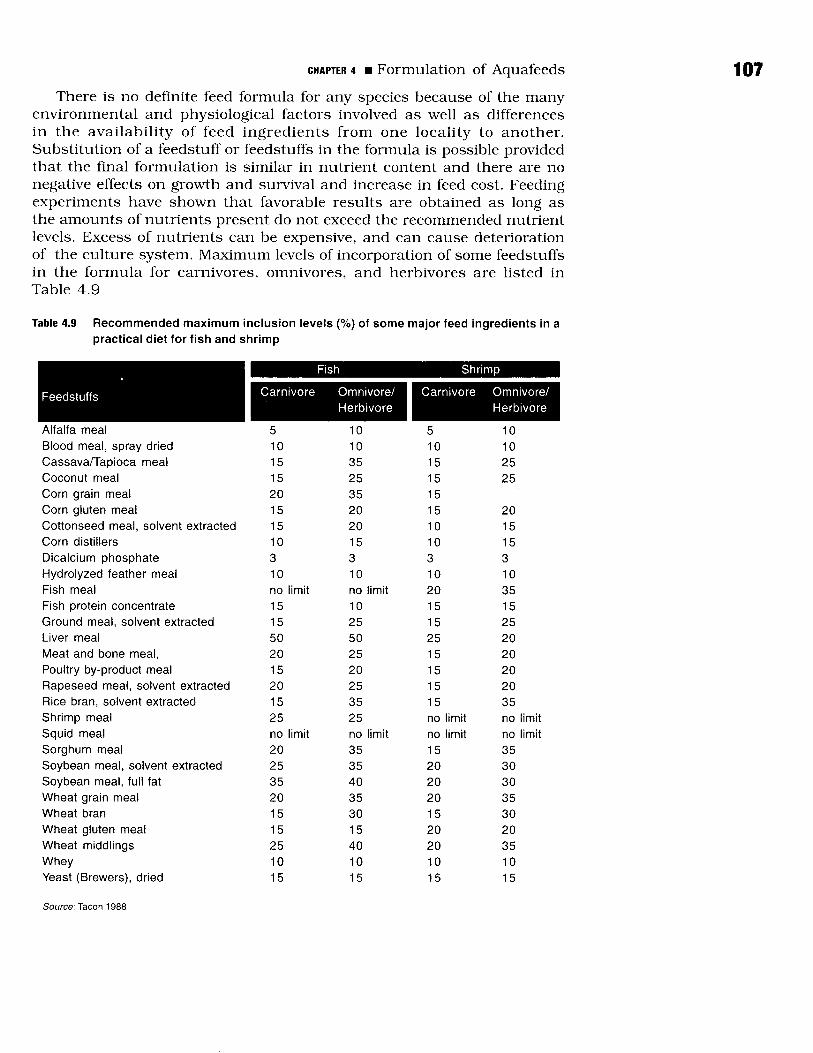
environmental and physiological factors involved as well as differences in the availability o f feed ingredients from one locality to another. Substitution of a feedstuff or feedstuffs in the formula is possible provided that the final formulation is similar in nutrient content and there are no negative effects on growth and survival and increase in feed cost. Feeding experiments have shown that favorable results are obtained as long as the amounts of nutrients present do not exceed the recommended nutrient levels. Excess of nutrients can be expensive, and can cause deterioration of the culture system. Maximum levels of incorporation of some feedstuffs in the formula for carnivores, omnivores, and herbivores are listed in Table 4.9
Table 4.9 Recommended maximum inclusion levels (%) of some major feed ingredients in a practical diet for fish and shrimp
F e e d s tu ffs
| F ish S h rim p
C a rn iv o re O m n iv o re / H e rb iv o re
C a rn iv o re O m n iv o re /
H e rb iv o re
A lfa lfa m ea l 5 10 5 10B lo o d m ea l, s p ra y d ried 10 10 10 10C a s s a v a /T a p io c a m ea l 15 3 5 15 2 5C o c o n u t m ea l 15 25 15 2 5C o rn g ra in m ea l 2 0 3 5 15C o rn g lu te n m ea l 15 2 0 15 2 0C o tto n s e e d m ea l, s o lv e n t e x tra c te d 15 2 0 10 15C o rn d is tille rs 10 15 10 15D ic a lc iu m p h o s p h a te 3 3 3 3H y d ro ly z e d fe a th e r m ea l 10 10 10 10F ish m ea l no lim it no lim it 2 0 3 5F ish p ro te in c o n c e n tra te 15 10 15 15G ro u n d m ea l, s o lv e n t e x tra c te d 15 25 15 2 5L iv e r m ea l 5 0 5 0 25 2 0M e a t a n d b o n e m ea l, 2 0 2 5 15 2 0P o u ltry b y -p ro d u c t m ea l 15 2 0 15 2 0R a p e s e e d m ea l, so lv e n t e x tra c te d 2 0 2 5 15 2 0R ice b ran , s o lv e n t e x tra c te d 15 35 15 35S h rim p m ea l 2 5 2 5 no lim it no lim itS q u id m ea l no lim it no lim it no lim it no lim itS o rg h u m m ea l 2 0 3 5 15 35S o y b e a n m ea l, s o lv e n t e x tra c te d 2 5 3 5 2 0 30S o y b e a n m ea l, fu ll fa t 35 4 0 2 0 30W h e a t g ra in m ea l 2 0 3 5 2 0 35W h e a t b ran 15 3 0 15 3 0W h e a t g lu te n m ea l 15 15 2 0 20W h e a t m id d lin g s 2 5 4 0 2 0 35W h e y 10 10 10 10Y east (B re w e rs ), d rie d 15 15 15 15
Source: Tacon 1988
108 CHAPTER 4 NUTRITION IN TROPICAL AQUACULTURE
There are several methods of formulating feeds. These are Pearson’s Square Method, A lgebra ic Equation, T ria l and Error, and Linear Program m ing. The Pearson ’s Square m ethod is recom m ended in formulating a supplemental feed with only two to four ingredients. The Trial and Error method is generally used in calculating a formula for a complete diet with many ingredients. In commercial feed production where cost is a p rinc ipa l consideration , a com puter program (L inear Programming) is used to combine feed ingredients that w ill give an effective formulation with the lowest cost.
Mathematical calculations using these methods, except for Linear Programming, are given in the following examples.
I. Pearson’s Square and Algebraic Equation Methods
E xam ple 1. W hen on ly two feed ingred ients are to be com bined.
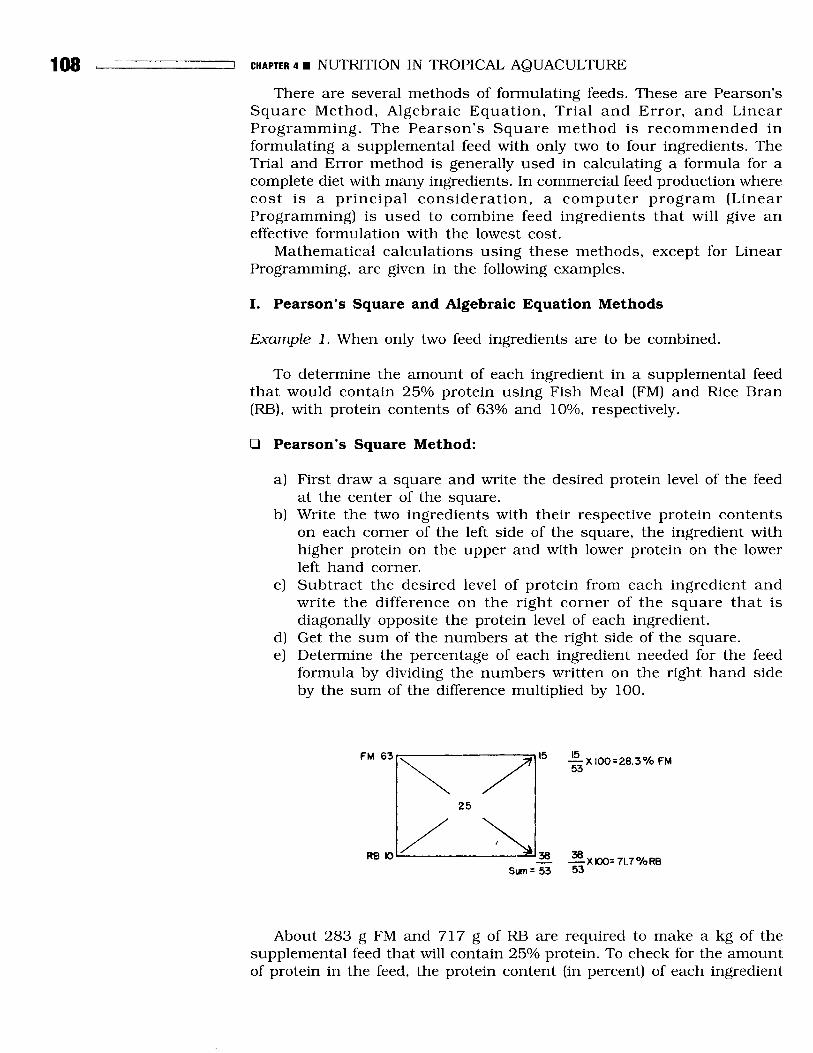
To determ ine the am ount o f each ingred ien t in a supp lem enta l feed th a t w ou ld con ta in 25% p ro te in u s in g F ish M ea l (FM ) and R ice B ran (RB), w ith protein con tents o f 63% and 10%, respectively.
□ Pearson’s Square Method:
a) First draw a square and write the desired protein level of the feed at the center of the square.
b) Write the two ingredients with their respective protein contents on each comer of the left side of the square, the ingredient with higher protein on the upper and with lower protein on the lower left hand corner.
c) Subtract the desired level o f protein from each ingredient and write the difference on the right corner o f the square that is diagonally opposite the protein level of each ingredient.
d) Get the sum of the numbers at the right side of the square.e) Determine the percentage of each ingredient needed for the feed
formula by dividing the numbers written on the right hand side by the sum of the difference multiplied by 100.
About 283 g FM and 717 g of RB are required to make a kg of the supplemental feed that will contain 25% protein. To check for the amount of protein in the feed, the protein content (in percent) of each ingredient

CHAPTER 4 Formulation of Aquafeeds 109is multiplied by the amount of FM and RB (283 g and 717 g respectively) to be combined. The amount of protein coming from each ingredient is added to get the total amount. The total amount is divided by 1000 and multiplied by 100 to give 25% protein.
FM = 283 g x 63% = 178.3 g proteinRB = 717 g x 10% = 71.7 g protein
Total protein 250.0 g /kg or 25% protein
or (250 / 1000) x 100 = 25%
□ Algebraic Equation Method:
Let: x = g FM/ kg feed y = g RB/ kg feed
so that :x + y = 1000 g feed (Equation I)
0.63 x + 0.10 y = 250 g protein/1000 g feed (Equation II)
Multiply Equation I by 0.10:0.10 x + 0.10 y = 100 g (Equation III)
Subtract Equation III from Equation II:0.63 x + 0.10 y = 250 g protein/1000 g feed
- (0.10 x + 0 .10 y = 100 g )0.53 x + 0 = 150
X = 150/0.53 = 283 g FM
Substitute in Equation I:283 + y = 1000
y = 1000 - 283 = 717 g RB
Example 2: When three or more feed ingredients are available for use.
Form ulate a fish diet to contain 35% protein by com bining the following ingredients with their respective protein content:
FM - 60% proteinSoybean Meal (SBM) - 45% proteinRB 8% proteinCom Meal (CM) 12% protein
Assume the proportion of 1 part FM to 2 parts SBM or 1:2 and equal parts of RB and CM or 1:1. FM and SBM are the main sources of protein while RB and CM are the main sources of carbohydrate or energy but also contain protein.

110 CHAPTER 4 NUTRITION IN TROPICAL AQUACULTURE
□ Pearson’s Square Method:
a) Draw a square and write at the center the desired protein level as in the first example.
b) Calculate the protein level from the protein sources FM and SBM. according to the specified ratio: 1:2
FM : 1 x 60 = 60SBM : 2 x 45 = 90
Average : 150 / 3 = 50
c) Calculate the energy sources, RB and CM also according to the ratio 1:1
RB : 1 x 8 = 8CM : 1 x 12 = 12
Average : 20 / 2 = 10
d) Write the calculated average protein content on the upper left hand corner for the protein sources and the protein content of the energy sources on the lower left corner of the square.
e) Write the desired protein level at the center and su b trac t this value from the protein content of FM and SBM and protein content of RB and CM. Write the number diagonally opposite the ingredients or on the lower right hand corner for protein sources and upper right hand corner for energy sources. Proceed as in d) and e) of Example 1.
f) Multiply the final percentage derived for the protein sources by 1/3 for FM and 2/3 for SBM. For the energy sources, multiply by 1/2 each of the RB and CM to find out the exact amount of each ingredient to be used in the formula with the desired level of 35% protein.
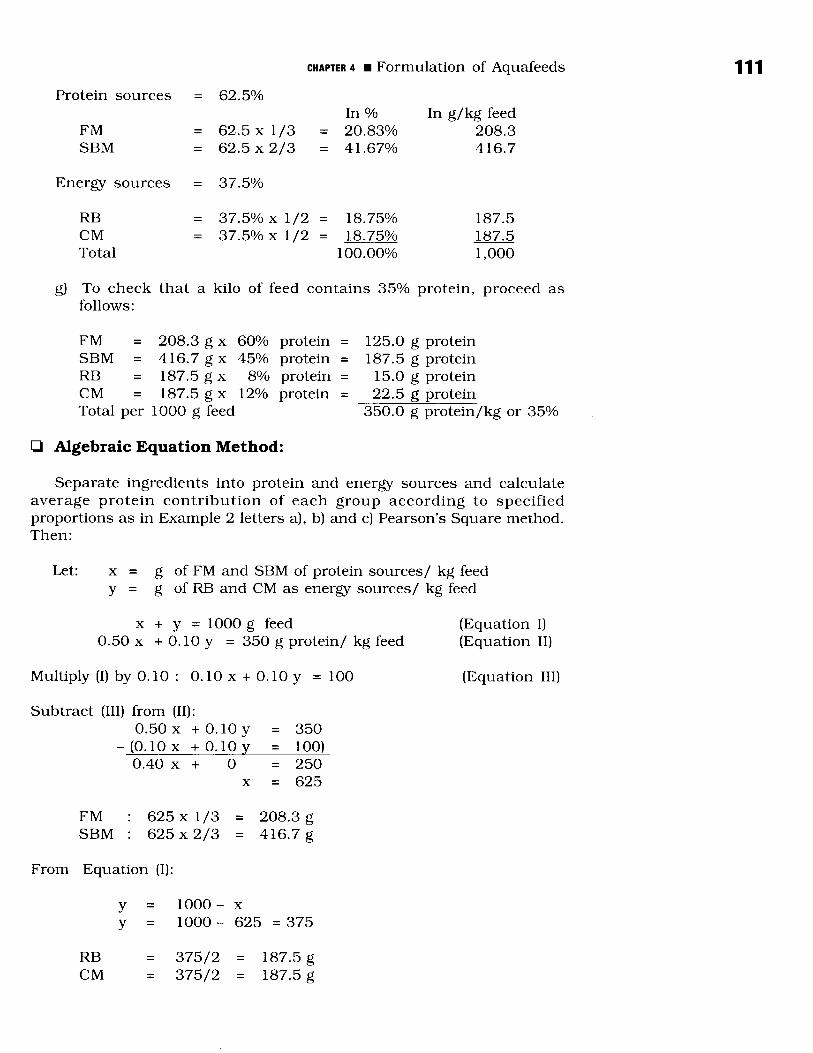
CHAPTER 4 Formulation of Aquafeeds 111Protein sources = 62.5%
In % In g/kg feedFM = 62 .5 x 1/3 = 20.83% 208.3SBM = 62.5 x 2/3 = 41.67% 416.7
Energy sources = 37.5%
RB = 37.5% x 1/2 = 18.75% 187.5CM = 37.5% x 1/2 = 18.75% 187.5Total 100.00% 1,000
g) To check that a kilo o f feed contains 35% protein, proceed as follows:
FM 208.3 g x 60% protein = 125.0 g proteinSBM = 416.7 g x 45% protein = 187.5 g proteinRB 187.5 g x 8% protein = 15.0 g proteinCM 187.5 g x 12% protein = 22.5 g proteinTotal per 1000 g feed 350.0 g protein/kg or 35%
□ Algebraic Equation Method:
Separate ingredients into protein and energy sources and calculate average protein contribution o f each group according to specified proportions as in Example 2 letters a), b) and c) Pearson’s Square method. Then:
Let: x = g of FM and SBM of protein sources/ kg feedy = g of RB and CM as energy sources/ kg feed
X + y = 1000 g feed (Equation I)0.50 x + 0.10 y = 350 g protein/ kg feed (Equation II)
Multiply (I) by 0.10 : 0.10 x + 0.10 y = 100 (Equation III)
Subtract (III) from (II):0.50 x + 0.10 y = 350
- (0.10 x + 0.10 y = 100)0.40 x + 0 = 250
X = 625
FM : 625 x 1/3 = 208.3 gSBM : 625 x 2/3 = 416.7 g
From Equation (I)
y = 1000 - Xy = 1000 - 625 = 375
RB = 375/2 = 187.5 gCM = 375/2 = 187.5 g
112 CHAPTER 4 NUTRITION IN TROPICAL AQUACULTURE
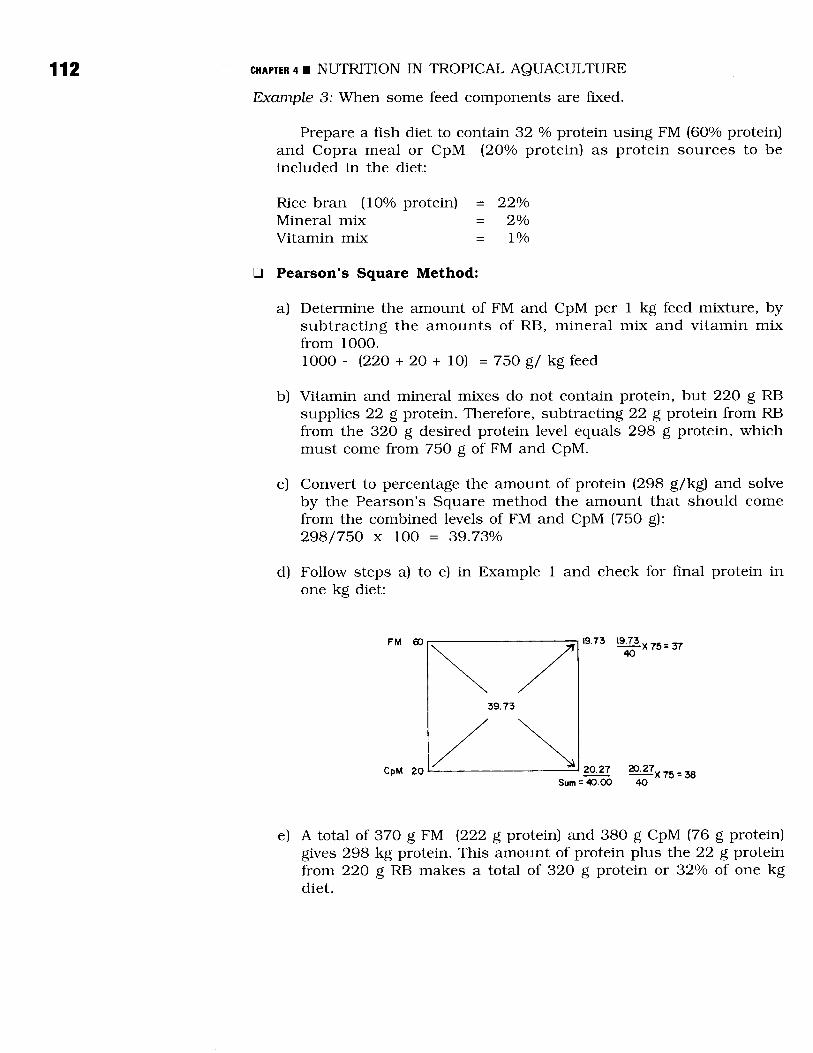
E xam ple 3: W hen som e feed com ponents are fixed.
Prepare a fish d iet to contain 32 % protein using FM (60% protein) and C op ra m ea l or CpM (20% p ro te in ) as p ro te in sou rces to be included in the diet:
R ice bran (10% protein) = 22%M inera l m ix = 2%V itam in m ix = 1%
□ Pearson’s Square Method:
a) Determine the amount of FM and CpM per 1 kg feed mixture, by subtracting the amounts o f RB, mineral mix and vitamin mix from 1000.1000 - (220 + 20 + 10) = 750 g/ kg feed
b) Vitamin and mineral mixes do not contain protein, but 220 g RB supplies 22 g protein. Therefore, subtracting 22 g protein from RB from the 320 g desired protein level equals 298 g protein, which must come from 750 g of FM and CpM.
c) Convert to percentage the amount of protein (298 g/kg) and solve by the Pearson’s Square method the amount that should come from the combined levels of FM and CpM (750 g):298/750 x 100 = 39.73%
d) Follow steps a) to e) in Example 1 and check for final protein in one kg diet:
e) A total of 370 g FM (222 g protein) and 380 g CpM (76 g protein) gives 298 kg protein. This amount of protein plus the 22 g protein from 220 g RB makes a total of 320 g protein or 32% of one kg diet.
CHAPTER 4 Formulation of Aquafeeds 113□ Algebraic Equation Method:
Before proceeding to formulate the necessary equations, first do steps a) and b) described in the Pearson’s Square method.
Let : x = g of FM requiredy = g of CpM required
x + y = 750 g (Equation I)0.60 x + 0.20 y = 298 g protein (Equation II)
Multiply (I) by 0.2 :0.20 x + 0.2 y = 150 (Equation III)
Subtract (III) from (II):0.60 x + 0.20 y = 298
- (0.20 x + 0.2 y = 150)0.40 x + 0 = 148
x = 148 / 0.4 = 370g FM
Substitute (I):370 + y = 750 g
y = 380 g CpM
II. Trial and Error Method
For the Trial and Error method, a worksheet and a table of proximate composition are necessary.
Example 1: Formulate a diet that will contain fish meal (FM), defatted soybean meal (DSBM), meat and bone meal (MBM), rice bran (RB), and vitamin and mineral mixes. Cod liver oil (CLO) is the lipid source, bread flour (BF) is the source of carbohydrate and binder, and lime is used as filler. The finished diet should contain 35% crude protein, 12% crude fat, with a dietary energy of 340 to 400 kcal/100 g diet.
The proximate composition of these feed ingredients are:
Ingredients g/100 gProtein Fat Fiber Ash NFE
FM 66.70 9.11 0.59 13.36 10.24DSBM 50.34 1.45 8.59 7.64 31.98MBM 46.91 10.90 1.11 36.10 4.98RB 14.80 12.66 4.17 8.92 59.45BF 14.17 1.54 0.56 0.68 83.05
114 CHAPTER 4 NUTRITION IN TROPICAL AQUACULTURE
The following ingredients are incorporated in fixed amounts:
FM = 10%SBM = 18%BF = 5%Vit/min mix = 3%
Total = 36%
The remaining percentage, which is 64%, will be supplied by MBM, RB, CLO, and the filler (lime). About 58 g will come from MBM and RB and 6 g from lipid and filler. The closest estimates to the required values are obtained by trial and error.
1. Fill in the required ingredients and the corresponding amounts in Columns 1 and 2 in the Worksheet (Appendix A).
2. F ill in the respective nutrient content based on the proxim ate composition of each ingredient on the upper left hand comer of each box (Worksheet 1).
3. Calculate the amount of nutrient from each ingredient by multiplying the specified amount of the ingredient (column 2) by the percentages of the nutrient (column 3) to obtain the amount in grams. Start with the protein sources.
For example, 10 g FM with 66.7% protein contributes 6.67 g protein to the diet. Add up the protein from FM, SBM, and BF (Worksheet 1, column 3). Do the same for the rest.
4. Calculate the amount of protein that should come from MBM and RB by subtracting the known protein contribution of the other ingredients (FM+DSBM+BF) from the total protein required (35%).
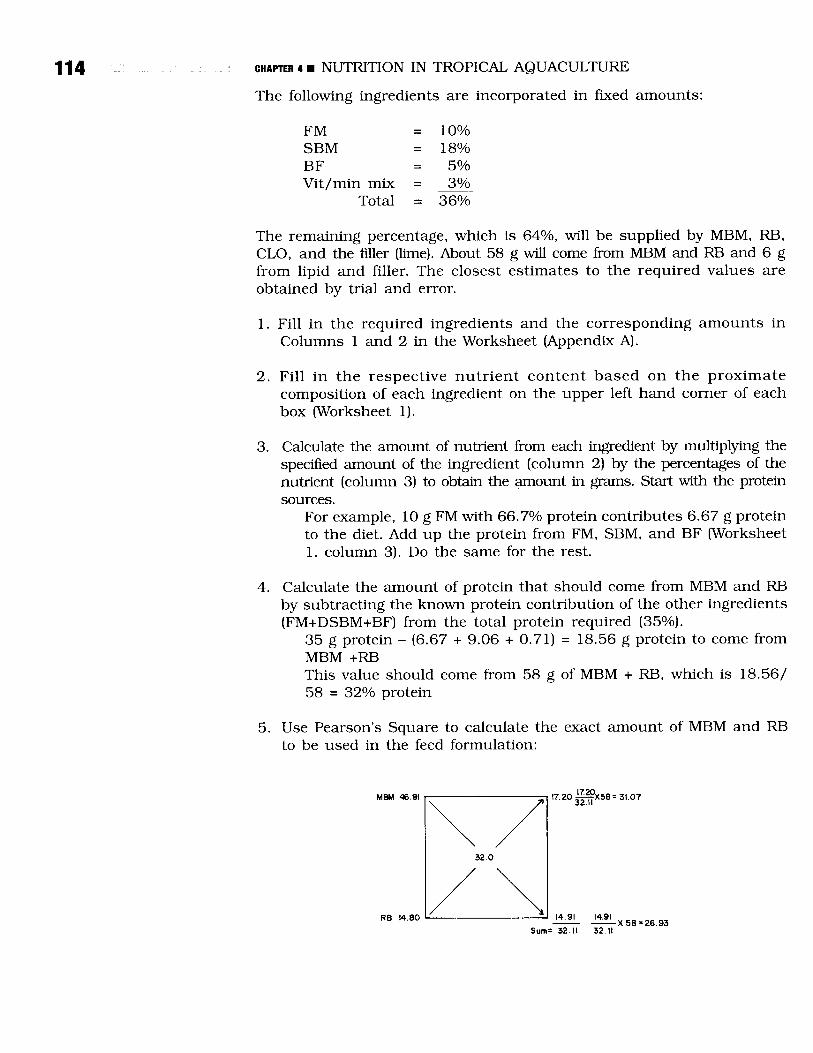
35 g protein - (6.67 + 9.06 + 0.71) = 18.56 g protein to come from MBM +RBThis value should come from 58 g of MBM + RB, which is 18.56/ 58 = 32% protein
5. Use Pearson’s Square to calculate the exact amount of MBM and RB to be used in the feed formulation:
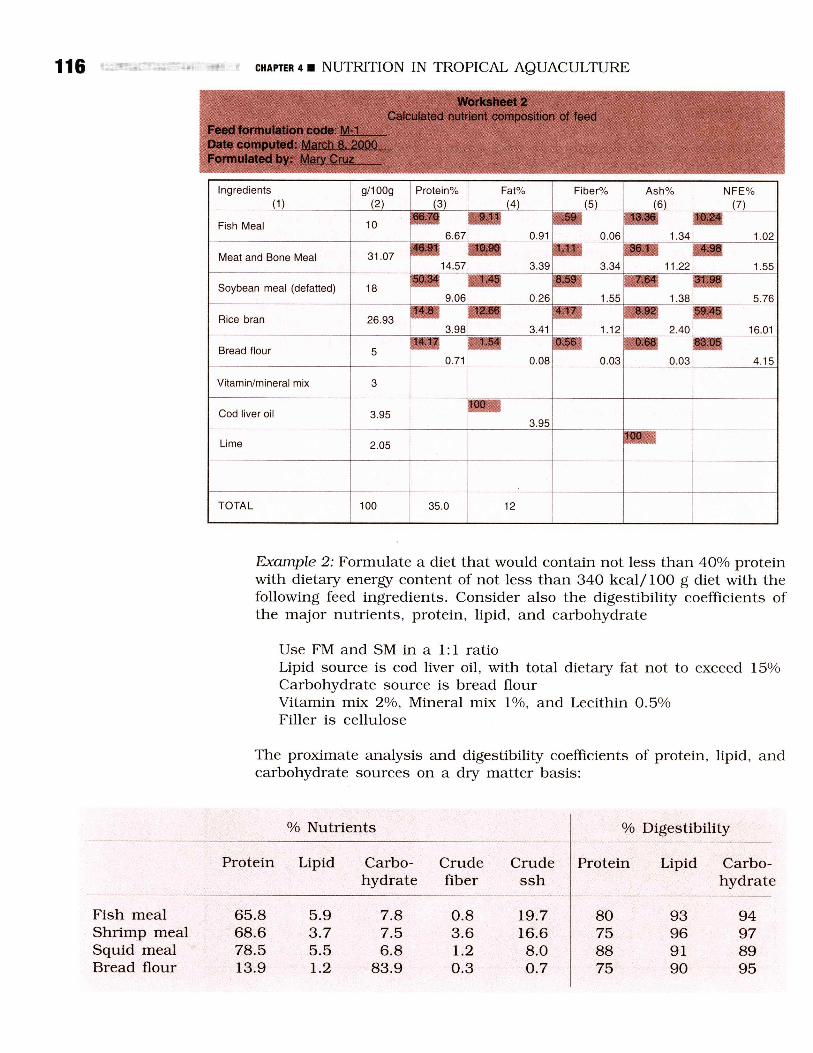
C H A PTER 4 Formulation of Aquafeeds 1156. Fill-up Worksheet 2 with calculated amounts of MBM (31.07 g) and
RB (26.93 g).
7. Calculate nutrient contribution from each feed ingredient. After the amounts of protein sources have been calculated, proceed to calculate the lipid sources and lipid levels.
For lipids, the partial amount from other ingredients is equal to 8.05%, therefore, to meet the requirement of 12%, CLO will be added at 3.95% (column 4). To make the formulation 100%, calculate all the other nutrients and determine how much filler or lime to add by subtracting 97.95 from 100 equals 2.05.
8. Calculate the sum of fiber, ash and NFE to have a complete record of the major nutrients. Indicate these values in columns 5, 6, and 7, respectively. These can be compared to the analyzed proximate composition of processed feed.
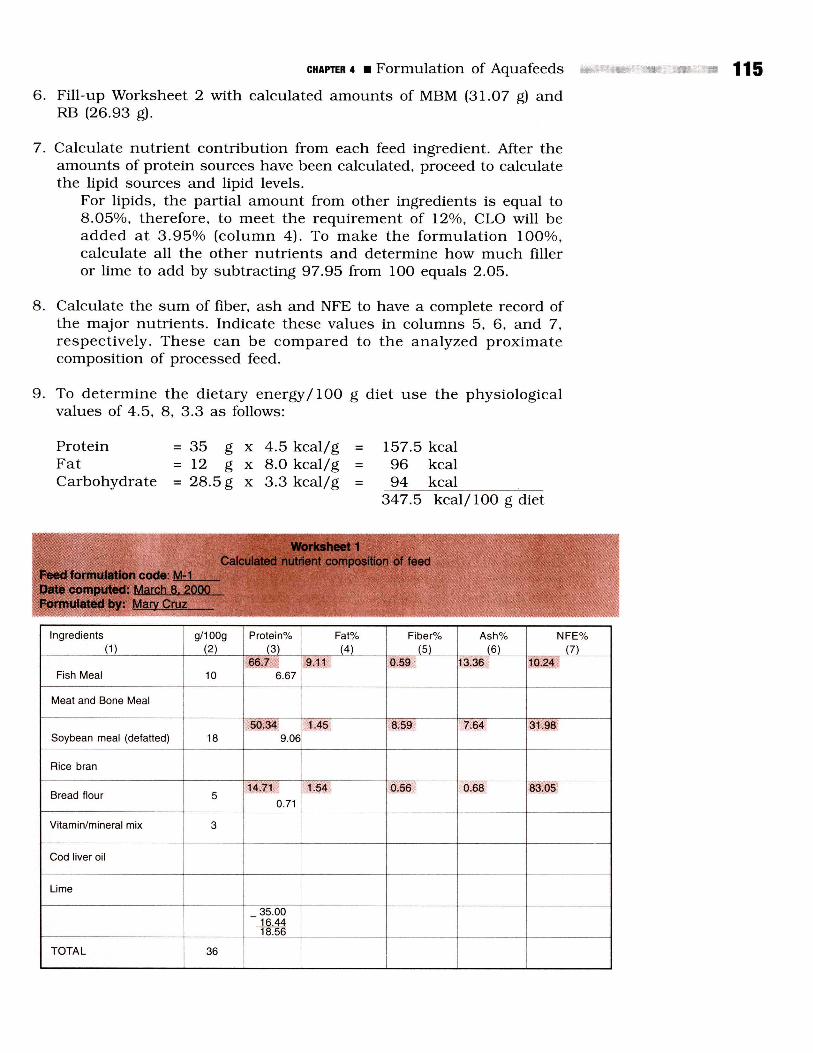
9. To determine the dietary energy/100 g diet use the physiological values of 4.5, 8, 3.3 as follows:
Protein = 35 g x 4.5 kcal/g = 157.5 kcalFat = 12 g x 8.0 kcal/g = 96 kcalCarbohydrate = 28.5 g x 3.3 kcal/g = 94 kcal
347.5 kcal/100 g diet
Worksheet 1C a lcu la te d n u trie n t co m p o s itio n o f fee d
Feed formulation code: M-1Date computed: March 8, 2000Formulated by: Mary Cruz
Ingredients(1)
g/100g(2)
Protein%(3)
Fat%(4)
Fiber%(5)
Ash%(6)
NFE%(7)
Fish Meal 1066.7
6.679.11 0.59 13.36 10.24
Meat and Bone Meal
Soybean meal (defatted) 1850.34
9.061.45 8.59 7.64 31.98
Rice bran
Bread flour 514.71
0.711.54 0.56 0.68 83.05
Vitamin/mineral mix 3
Cod liver oil
Lime
35.0016.4418.56
TOTAL 36
116 C H A PTER 4 NUTRITION IN TROPICAL AQUACULTURE
Worksheet 2C a lcu la ted nu trien t co m p o s itio n o f feed
Feed formulation code: M-1Date computed: M arch 8. 2000Formulated by: M a ry C ru z
Ingredients(1)
g/100g(2)
Protein%(3)
Fat%(4)
Fiber%(5)
Ash%(6)
NFE%(7)
Fish Meal 10911 .59 13 36 1 0 . 2 4
6.67 0.91 0.06 1.34 1.02
Meat and Bone Meal 31.07 46.91 10.90 1.11 36.1 4.9814.57 3.39 3.34 11.22 1.55
Soybean meal (defatted) 1850.34 1.45 8.59 7.64 31.98
9.06 0.26 1.55 1.38 5.76
Rice bran 26.9314.8 12.66 4.17 8.92 59.45
3.98 3.41 1.12 2.40 16.01
Bread flour 514.17 1 . 5 4 0.56 0.68 83.05
0.71 0.08 0.03 0.03 4.15
Vitamin/mineral mix 3
Cod liver oil 3.95100
3.95
Lime 2.05100
TOTAL 100 35.0 12
Exam ple 2: Form ulate a d iet that would contain not less than 40% protein w ith d ietary energy content o f not less than 340 kcal/100 g d iet w ith the fo llow ing feed ingred ients. Consider also the d igestib ility coeffic ien ts o f the m ajor nutrients, protein, lipid, and carbohydrate
Use FM and SM in a 1:1 ratioLipid source is cod liver oil, w ith total d ietary fat not to exceed 15%Carbohydrate source is bread flourV itam in m ix 2%, M ineral m ix 1%, and Lecith in 0.5%F iller is ce llu lose
The proxim ate analysis and digestib ility coefficients o f protein, lipid, and carbohydrate sources on a dry m atter basis:
% Nutrients % Digestibility
Protein Lipid Carbohydrate
Crude fiber
Crude ssh
Protein Lipid Carbohydrate
Fish meal 65.8 5.9 7.8 0.8 19.7 80 93 94Shrimp meal 68.6 3.7 7.5 3.6 16.6 75 96 97Squid meal 78.5 5.5 6.8 1.2 8.0 88 91 89Bread flour 13.9 1.2 83.9 0.3 0.7 75 90 95
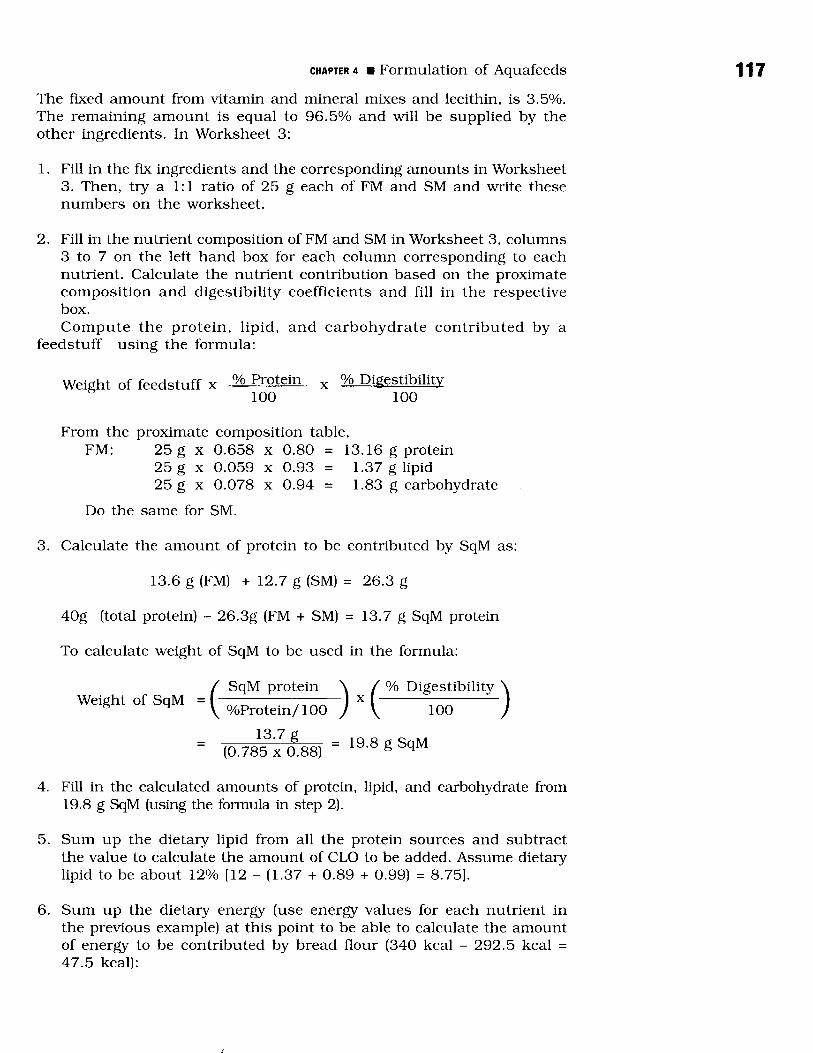
C H A P TE R 4 Formulation of Aquafeeds 117The fixed amount from vitamin and mineral mixes and lecithin, is 3.5%. The remaining amount is equal to 96.5% and will be supplied by the other ingredients. In Worksheet 3:
1. Fill in the fix ingredients and the corresponding amounts in Worksheet 3. Then, try a 1:1 ratio of 25 g each of FM and SM and write these numbers on the worksheet.
2. Fill in the nutrient composition of FM and SM in Worksheet 3, columns 3 to 7 on the left hand box for each column corresponding to each nutrient. Calculate the nutrient contribution based on the proximate composition and digestibility coefficients and fill in the respective box.Compute the protein, lipid, and carbohydrate contributed by a
feedstuff using the formula:
Weight of feedstuff x % Protein X % Digestibility100 100
From the proximate composition table,FM: 25 g x 0.658 x 0.80 = 13.16 g protein
25 g x 0.059 x 0.93 = 1.37 g lipid 25 g x 0.078 x 0.94 = 1.83 g carbohydrate
Do the same for SM.
3. Calculate the amount of protein to be contributed by SqM as:
13.6 g (FM) + 12.7 g (SM) = 26.3 g
40g (total protein) - 26.3g (FM + SM) = 13.7 g SqM protein
To calculate weight of SqM to be used in the formula:
Weight of SqM = ( SqM protein
) x (% Digestibility )
%Protein/100 100
= 13.7 g= 19.8 g SqM
(0.785 x 0.88)
4. Fill in the calculated amounts of protein, lipid, and carbohydrate from 19.8 g SqM (using the formula in step 2).
5. Sum up the dietary lipid from all the protein sources and subtract the value to calculate the amount of CLO to be added. Assume dietary lipid to be about 12% [12 - (1.37 + 0.89 + 0.99) = 8.75].
6. Sum up the dietary energy (use energy values for each nutrient in the previous example) at this point to be able to calculate the amount of energy to be contributed by bread flour (340 kcal - 292.5 kcal = 47.5 kcal):

118 CHAPTER 4 NUTRITION IN TROPICAL AQUACULTURE
Protein : 40 g x 4.5 kcal/g = 180Lipid : 12 g x 8.0 kcal/g = 96NFE : 5g x 3.3 kcal/g = 16.3
292.5 kcal
7. Bread flour is about 90% carbohydrate with a digestibility of about 95%, so that 47.5 kcal divided be 3.3 is about 14.4 g. Since the digestibility is less than 100%, the amount o f bread flour maybe increased to 16 g. Calculate the nutrients contributed by 16 g bread flour (as in step 2).
8. Determine the sum of ingredients used (25+25+19.8+16+3+0.5+8.75 = 98.05) and subtract the value from 100. The difference is the amount of the filler, cellulose (1.95) to make the total equal to 100.
9. Add up the nutrients and calculate the total dietary energy /100g diet.
Protein : 41.5 g x 4.5 kcal/g = 186.8Lipid : 12.67 g x 8.0 kcal/g = 101.4Carbohydrate : 17.83 g x 3.3 kcal/g = 58.8
347.8 kcal/lOOg
10. Compute the total ash and fiber content in the feed formula (column 5 and 6). The minimum dietary level for ash or fiber is about 10% because higher levels can cause poor growth and survival. Compare the computed values to the actual results o f the chem ical analysis to detect discrepancies.
Worksheet 3Calculated nutrient composition of feed
Feed formulation code: M-1 Date computed: March 10. 2001 Formulated by: Marv Cruz
Ingredients(D
g/100g(2)
Protein%(3)
Fat%(4)
Fiber%(5)
Ash%(6)
NFE%(7)
Fish Meal 2565.8 5.9 0.8 19.7 7.8
13.2 1.37 0.20 4.92 1.83
Shrimp meal 2568.6 3.7 3.6 16.6 n \5 “
12.9 0.89 0.90 4.15 2.0
Squid meal 19.878.5 5.5 1.2 8.0 6.8
13.7 0.99 0.24 1.58 1.2
Bread flour 16.013.9 1.2 0.3 0.7 83.9
1.7 0.17 0.05 0.11 12.8
Vitamin/mineral mix 3.0
Lecithin 0.5100
0.5
Cod liver oil 8.75100
7.5Cellulose 1.95
TOTAL 100 41.5 12.67 1.39 10.76 17.83
C H A P TE R 4 Formulation of Aquafeeds 119III. Linear Program for Least-Cost Formulation
Linear programming is used when many ingredients are to be combined for a least cost feed form ula. This method is especia lly useful in commercial feed manufacture wherein large quantities of feed ingredients are used. A computer is necessary in this type of formulation. When one or more ingredients are not available, other feed ingredients are utilized as substitutes in order to come up with the same feed quality. The quantities o f substitute ingredients are determined using the linear programming method. Information on the amounts of nutrients in each of the feed ingredients to be used is essential in this method. This can be obtained from a feed com position table or chemical analysis. A computer program will list several combinations to come up with almost similar feed quality at a lesser cost. Examples of computer program for least cost formulation are the simple linear programming spreadsheet and the sophisticated Brill Formulation Package.
Purified Diet Formulation
In nutritional requirement studies, purified ingredients are used in the formulation of diets. This is necessary to study the optimum level of one specific nutrient, e.g. essential amino acid. The use of purified ingredients enables one to vary the level of the nutrient whose dietary requirement is being studied while keeping the other nutrient levels constant. Examples o f purified ingredients include casein and gelatin as protein sources, dextrin and sucrose as carbohydrate sources, and cellulose for the nonnutritive filler.
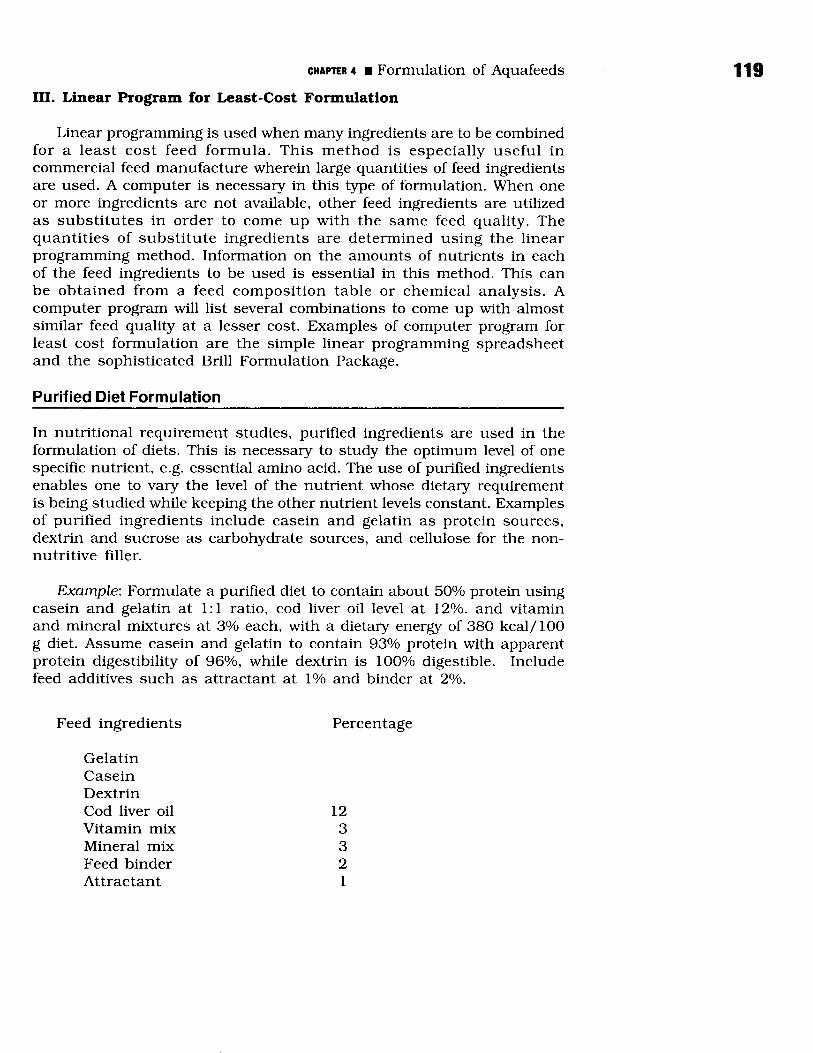
E xa m p le : Form ulate a purified diet to contain about 50% protein using case in and gela tin at 1:1 ratio, cod liver o il level at 12%. and v itam in and m inera l m ixtures at 3% each, w ith a d ietary energy o f 380 kcal/100 g diet. A ssum e casein and gelatin to contain 93% protein w ith apparent p ro te in d iges tib ility o f 96% , w h ile dextrin is 100% d igestib le. Include feed add itives such as attractant at 1% and b inder at 2%.
Feed ingredients Percentage
Gelatin Casein Dextrin Cod liver oil 12Vitamin mix 3Mineral mix 3Feed binder 2Attractant 1
120 CHAPTER 4 NUTRITION IN TROPICAL AQUACULTURE
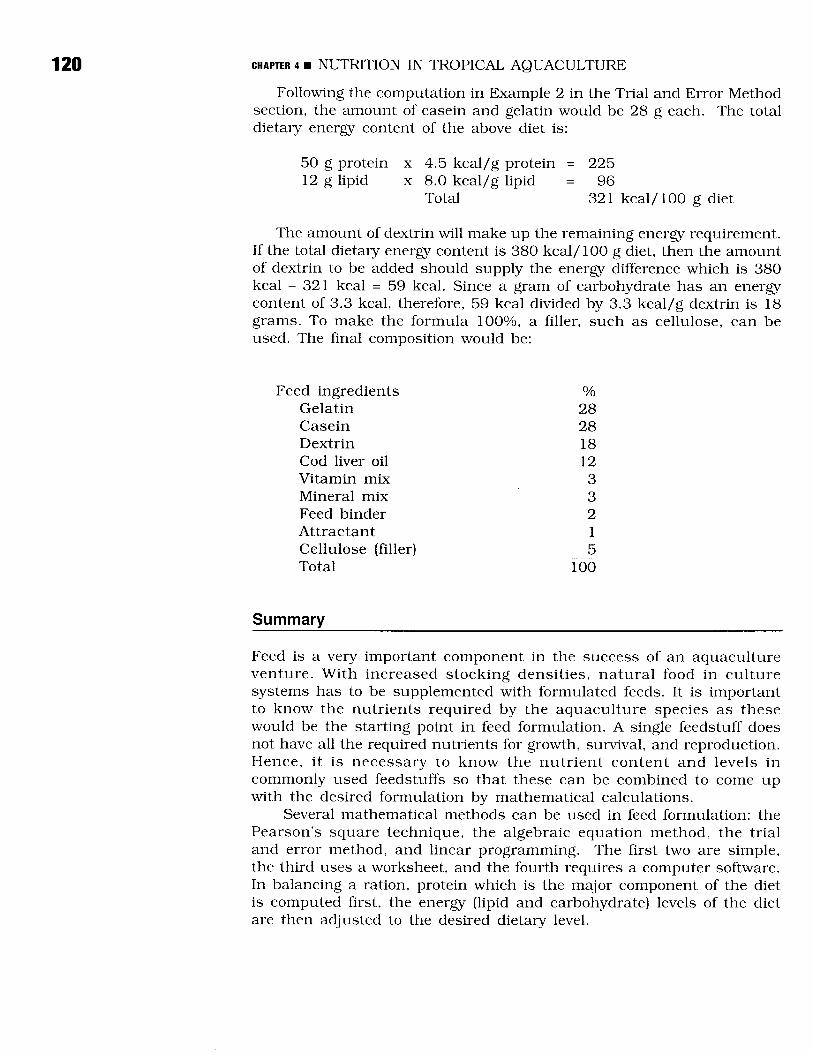
Following the computation in Example 2 in the Trial and Error Method section, the amount of casein and gelatin would be 28 g each. The total dietary energy content of the above diet is:
50 g protein x 4.5 kcal/g protein = 22512 g lipid x 8.0 kcal/g lipid = 96
Total 321 kcal/100 g diet
The amount of dextrin will make up the remaining energy requirement. If the total dietary energy content is 380 kcal/100 g diet, then the amount of dextrin to be added should supply the energy difference which is 380 kcal - 321 kcal = 59 kcal. Since a gram of carbohydrate has an energy content of 3.3 kcal, therefore. 59 kcal divided by 3.3 kcal/g dextrin is 18 grams. To make the formula 100%, a filler, such as cellulose, can be used. The final composition would be:
Feed ingredients %Gelatin 28Casein 28Dextrin 18Cod liver oil 12Vitamin mix 3Mineral mix 3Feed binder 2Attractant 1Cellulose (filler) 5Total 100
Summary
Feed is a very important component in the success of an aquaculture venture. With increased stocking densities, natural food in culture systems has to be supplemented with formulated feeds. It is important to know the nutrients required by the aquaculture species as these would be the starting point in feed formulation. A single feedstuff does not have all the required nutrients for growth, survival, and reproduction. Hence, it is necessary to know the nutrient content and levels in commonly used feedstuffs so that these can be combined to come up with the desired formulation by mathematical calculations.
Several mathematical methods can be used in feed formulation: the Pearson's square technique, the algebraic equation method, the trial and error method, and linear programming. The first two are simple, the third uses a worksheet, and the fourth requires a computer software. In balancing a ration, protein which is the major component of the diet is computed first, the energy (lipid and carbohydrate) levels of the diet are then adjusted to the desired dietary level.
C H A PTER 4 Formulation of Aquafeeds 121Guide Questions
1. Name some methods in formulating diets. Give the advantages and disadvantages of each method.
2. Why is it important to know the nutrient content of feedstuffs and their levels before one can start formulating a feed?
3. Why is protein the first nutrient to be considered in formulating a diet?
4. Discuss factors to be considered and their importance in formulating a feed for a specific species.
5. Give at least 3 feedstuffs that are good sources of:a) proteinb) lipidsc) carbohydrate
6. Calculate the amount of fish meal and rice bran in a diet that contains 30% protein. The protein contents of fish meal and rice bran are, 60% and 15%, respectively.
7. Use the ingredients in Example 1 in the Trial and Error Method section in formulating a diet that will contain not less than 35% protein, dietary lipid of not more than 10% and dietary energy not less than 350 kcal/ 100g diet.
Suggested Readings
B autista MN, M illam ena OM, Kanazawa A. 1989. Use o f kappa- carrageenan microbound diet (C-MBD) as feed for Penaeus monodon larvae. Mar. Biol. 102:169-174.
Borlongan IG, Marte CL, Nocillado JN. 2000. Development of larval diets for milkfish (Chanos chanos). J. Appl. Ichthyol. 16:68-72.
Catacutan MR. Coloso RM. 1995. Effect of dietary protein to energy ratios on growth, survival, and body composition of juvenile Asian sea bass, Lates calcarifer. Aquaculture 131:125-133.
Catacutan MR. 1997. Protein and dry matter digestibility of feedstuffs in complete diets for Penaeus monodon. In: Zhou Y, Zhou H, Yao C, Lu Y, Hu F, Cui H and Din F (eds). Proceedings of The Fourth Asian Fisheries Forum, Beijing, China, 16-20 October. 754 p.
Cuzon G, Guillaume J. 1991. Recom m endations for practical feed formulation. In: Castell JD and Corpron KE (eds). The Crustacean Newsletter, Louisiana, World Aquaculture Society. p 52-53.
Eusebio PS. 1991. Effect o f dehulling on the nutritive value of some leguminous seeds as protein sources for tiger prawn, Penaeus monodon juveniles. Aquaculture 99:297-308.
122 CHAPTER 4 NUTRITION IN TROPICAL AQUACULTURE
Eusebio JS, Eusebio PS. 1984. Effect of processing on the protein quality of mungbean (Vigna radiata). Kimika 3:1-9.
Feed Development Section. 1994. Feeds and feeding of milkfish, Nile tilapia, Asian sea bass and tiger shrimp. SEAFDEC Aquaculture Department, Tigbauan, Iloilo, Philippines. 97 p.
Feed Technology and Nutrition Workshop. 2001. In: RA Swick and D Ghazalay-Delaine (eds). Malaysia, May 27-30. 2001. American Soybean Association. p 30.
Ferraris RP, Catacutan MR, Mabeline RL, Jazul AP. 1986. Digestibility in milkfish, Chanos chanos (Forsskal): effect of protein source, fish size, and salinity. Aquaculture 59:93-105.
Halver J. 1976. The nutritional requirements of cultivated warmwater and co ldw ater fish species. Paper No. 31, FAO Techn ica l Conference on Aquaculture, Kyoto, 26 May-2 June 1976. 9 p.
Hertramp JW, Pascual FP. 2000. Handbook on Ingredients for Aquaculture Feeds. Kluwer Academic Publishers, The Netherlands, 624 p.
Lall S. 1991. Concepts in the formulation and preparation of a complete fish diet. In: De Silva SS. (ed). Fish Nutrition Research in Asia. Proceedings of the Fourth Asian Fish Nutrition Workshop. Asian Fisheries Society Special Publication 5. Asian Fisheries Society, Manila, Philippines. p 1-12.
Liener IE. 1962. Toxic factors in edible legumes and their elimination. Amer. J. Clin. Nutr. 11:281-298.
Liener IE. 1980. Toxic constituents of plant foodstuffs. Academic Press, New York, 171 p.
McEllhiney, RR (ed). 1994. Feed manufacturing technology IV. American Feed Industry Association, Inc. Arlington, Virginia.
Millamena OM, Primavera JH, Pudadera RA, Caballero RV. 1986. The effect of diet on reproductive performance of pond-reared Penaeus monodon Fabricius broodstock. In: Maclean JL, Dizon LB, and Hosillos LV (eds). The First Asian Fisheries Forum Manila, Philippines. Asian Fisheries Society. p 593-596.
Millamena OM, Triño AT. 1997. Low-cost feed for Penaeus monodon reared in tanks and under semi-intensive and intensive conditions in brackishwater ponds. Aquaculture 154:69-87.
National Research Council. 1977. Nutrient requirements of warmwater fishes. National Academy of Sciences, Washington DC. 78 p.

CHAPTER 4 Formulation of Aquafeeds 123New MB. 1987. Feeds and feeding of fish and shrimp. A manual on the
preparation and presentation of compound feed for shrimps and fish in aquaculture ADCP/REP/87/26, UNDP/FAO. 275 p.
Penafl orida VD. 1989. An evaluation of indigenous protein sources as potential component in the diet formulation for tiger prawn, Penaeus m onodon , using essential amino acid index (EAAI). Aquaculture 83:319-330.
Santiago CB, Aldaba MB, Laron MA. 1983. Effect of varying dietary crude protein levels on spawning frequency and growth of Sarotherodon niloticus breeders. Fish. Res. J. Philipp. 8:9-18.
Santiago CB, Aldaba MB, Abuan EF, Laron MA. 1985. Effects of artificial diets on fry production and growth o f Oreochrom is niloticus breeders. Aquaculture 47:193-203.
Santiago CB, Reyes OS, Aldaba MB, Laron MA. 1986. An evaluation of formulated diets for Nile tilapia fingerlings. Fish. Res. J. Philipp. 11:5-12.
Sumagaysay NS, Borlongan IG. 1994. Growth and production of milkfish (Chanos chanos) in brackishwater ponds: effects of dietary protein and feeding levels. Aquaculture 132:273-283.
Tacon A. 1988. The nutrition and feeding of farmed fish and shrimp - Training manual 3. Feeding Methods. Field Document No. 7/E., FAO-Italy. 208 p.
Teshima S, Kanazawa A. 1983. Effects of several factors on growth and survival of the prawn larvae reared with microparticulate diets. Bull. Jpn. Soc. Sci. Fish. 49(12):1893-1896.