form 10-k - annualreports.com
TRANSCRIPT


18MAR201400595322
UNITED STATESSECURITIES AND EXCHANGE COMMISSION
Washington, D.C. 20549
FORM 10-K� ANNUAL REPORT PURSUANT TO SECTION 13 OR 15(d) OF THE
SECURITIES EXCHANGE ACT OF 1934For the fiscal year ended
December 31, 2018or
� TRANSITION REPORT PURSUANT TO SECTION 13 or 15(d) OF THE SECURITIESEXCHANGE ACT OF 1934
For the transition period from to . Commission file Number 1-34242
(Exact Name of registrant as specified in its charter)Pennsylvania 23-2222567
(State or other jurisdiction of (I.R.S. Employer Identification No.)incorporation or organization)
4 Brandywine Avenue, Downingtown, Pennsylvania 19335(Address of principal executive offices) (Zip Code)
Registrant’s telephone number, including area code: (610) 269-1040Securities registered pursuant to Section 12(b) of the Act:
Title of each class Name of each exchange on which registeredCommon stock, par value $1.00 per share The Nasdaq Stock Market LLC
Securities registered pursuant to Section 12(g) of the Act: None
Indicate by check mark whether the registrant is a well-known seasoned issuer, as defined in Rule 405 of the SecuritiesAct. � Yes � NoIndicate by check mark if the registrant is not required to file reports pursuant to Section 13 or Section 15(d) of theAct. � Yes � NoIndicate by check mark whether the Registrant: (1) has filed all reports required to be filed by Section 13 or 15(d) of the SecuritiesExchange Act of 1934 during the preceding 12 months (or for such shorter period that the Registrant was required to file suchreports), and (2) has been subject to such filing requirements for the past 90 days. � Yes � NoIndicate by check mark whether the registrant has submitted electronically every Interactive Data File required to be submittedpursuant to Rule 405 of Regulation S-T (§ 232.405 of this chapter) during the preceding 12 months (or for such shorter period thatthe registrant was required to submit such files). � Yes � NoIndicate by check mark if disclosure of delinquent filers pursuant to Item 405 of Regulation S-K is not contained herein, and will notbe contained, to the best of registrant’s knowledge, in definitive proxy or information statements incorporated by reference inPart III of this Form 10-K or any amendment to this Form 10-K. �Indicate by check mark whether the registrant is a large accelerated filer, an accelerated filer, a non-accelerated filer, smallerreporting company, or an emerging growth company. See the definitions of ‘‘large accelerated filer’’, ‘‘accelerated filer’’, ‘‘smallerreporting company,’’ and ‘‘emerging growth company’’ in Rule 12b-2 of the Exchange Act.
Large accelerated filer � Accelerated filer � Non-accelerated filer � Smaller reporting company �Emerging growth company �
If an emerging growth company, indicate by check mark if the registrant has elected not to use the extended transition period forcomplying with any new or revised financial accounting standards provide pursuant to Section 13(a) of the Exchange Act. �Indicate by check mark whether the registrant is a shell company (as defined in Rule 12b-2 of the Act). � Yes � NoThe aggregate market value of the shares of common stock of the Registrant issued and outstanding on June 30, 2018, whichexcludes 504,000 shares held by all directors, officers and affiliates of the Registrant as a group, was approximately $133.1 million.This figure is based on the closing price of $35.05 per share of the Registrant’s common stock on June 30, 2018, the last business dayof the Registrant’s second fiscal quarter.As of March 14, 2019, the Registrant had outstanding 4,327,415 shares of Common Stock, $1 par value per share.
DOCUMENTS INCORPORATED BY REFERENCEPortions of the Registrant’s definitive Proxy Statement relating to the 2019 Annual Meeting of Shareholders are incorporated byreference into Part III of this Form 10-K.
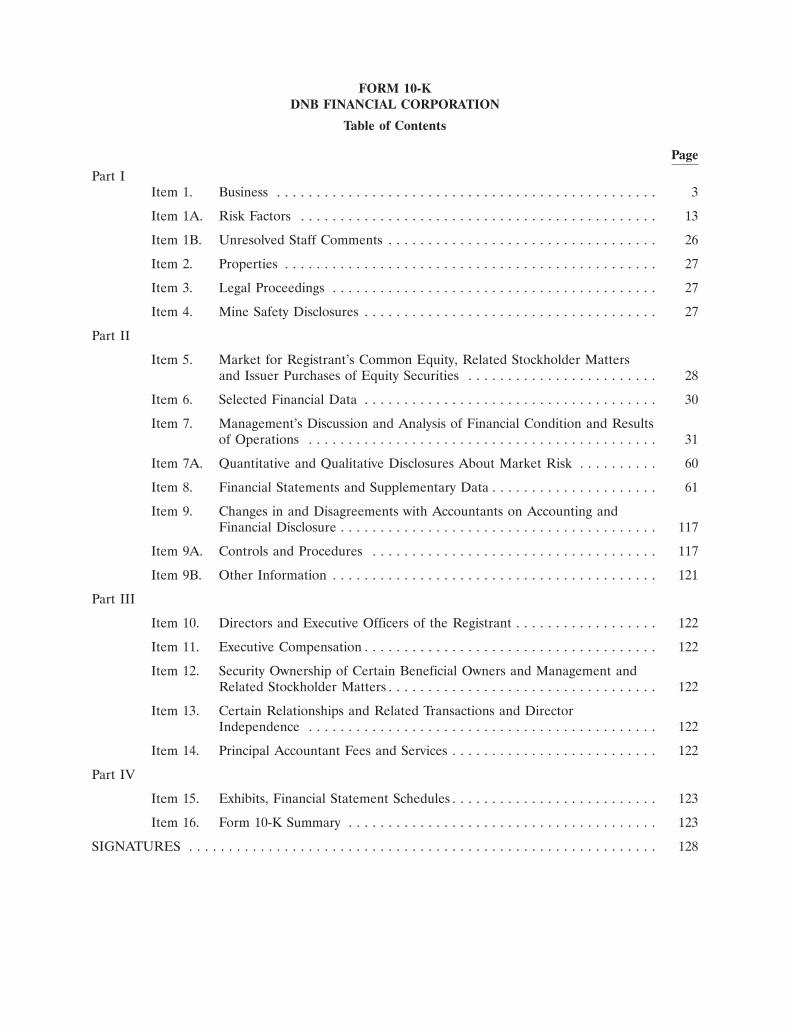
FORM 10-KDNB FINANCIAL CORPORATION
Table of Contents
Page
Part IItem 1. Business . . . . . . . . . . . . . . . . . . . . . . . . . . . . . . . . . . . . . . . . . . . . . . . . 3
Item 1A. Risk Factors . . . . . . . . . . . . . . . . . . . . . . . . . . . . . . . . . . . . . . . . . . . . . 13
Item 1B. Unresolved Staff Comments . . . . . . . . . . . . . . . . . . . . . . . . . . . . . . . . . . 26
Item 2. Properties . . . . . . . . . . . . . . . . . . . . . . . . . . . . . . . . . . . . . . . . . . . . . . . 27
Item 3. Legal Proceedings . . . . . . . . . . . . . . . . . . . . . . . . . . . . . . . . . . . . . . . . . 27
Item 4. Mine Safety Disclosures . . . . . . . . . . . . . . . . . . . . . . . . . . . . . . . . . . . . . 27
Part II
Item 5. Market for Registrant’s Common Equity, Related Stockholder Mattersand Issuer Purchases of Equity Securities . . . . . . . . . . . . . . . . . . . . . . . . 28
Item 6. Selected Financial Data . . . . . . . . . . . . . . . . . . . . . . . . . . . . . . . . . . . . . 30
Item 7. Management’s Discussion and Analysis of Financial Condition and Resultsof Operations . . . . . . . . . . . . . . . . . . . . . . . . . . . . . . . . . . . . . . . . . . . . 31
Item 7A. Quantitative and Qualitative Disclosures About Market Risk . . . . . . . . . . 60
Item 8. Financial Statements and Supplementary Data . . . . . . . . . . . . . . . . . . . . . 61
Item 9. Changes in and Disagreements with Accountants on Accounting andFinancial Disclosure . . . . . . . . . . . . . . . . . . . . . . . . . . . . . . . . . . . . . . . . 117
Item 9A. Controls and Procedures . . . . . . . . . . . . . . . . . . . . . . . . . . . . . . . . . . . . 117
Item 9B. Other Information . . . . . . . . . . . . . . . . . . . . . . . . . . . . . . . . . . . . . . . . . 121
Part III
Item 10. Directors and Executive Officers of the Registrant . . . . . . . . . . . . . . . . . . 122
Item 11. Executive Compensation . . . . . . . . . . . . . . . . . . . . . . . . . . . . . . . . . . . . . 122
Item 12. Security Ownership of Certain Beneficial Owners and Management andRelated Stockholder Matters . . . . . . . . . . . . . . . . . . . . . . . . . . . . . . . . . . 122
Item 13. Certain Relationships and Related Transactions and DirectorIndependence . . . . . . . . . . . . . . . . . . . . . . . . . . . . . . . . . . . . . . . . . . . . 122
Item 14. Principal Accountant Fees and Services . . . . . . . . . . . . . . . . . . . . . . . . . . 122
Part IV
Item 15. Exhibits, Financial Statement Schedules . . . . . . . . . . . . . . . . . . . . . . . . . . 123
Item 16. Form 10-K Summary . . . . . . . . . . . . . . . . . . . . . . . . . . . . . . . . . . . . . . . 123
SIGNATURES . . . . . . . . . . . . . . . . . . . . . . . . . . . . . . . . . . . . . . . . . . . . . . . . . . . . . . . . . . . 128
DNB FINANCIAL CORPORATIONFORM 10-K
Forward-Looking Statements
This Annual Report on Form 10-K, as well as other written or oral communications made from timeto time by us, contains forward-looking information within the meaning of the safe harbor provisions of theU.S. Private Securities Litigation Reform Act of 1995. These statements relate to future events or futurepredictions, including events or predictions relating to future financial performance, and are generallyidentifiable by the use of forward-looking terminology such as ‘‘believe,’’ ‘‘expect,’’ ‘‘may,’’ ‘‘will,’’‘‘should,’’ ‘‘plan,’’ ‘‘intend,’’ or ‘‘anticipate’’ or the negative thereof or comparable terminology. Forward-looking statements reflect numerous assumptions, estimates and forecasts as to future events. Noassurance can be given that the assumptions, estimates and forecasts underlying such forward-lookingstatements will accurately reflect future conditions, or that any guidance, goals, targets or projected resultswill be realized. The assumptions, estimates and forecasts underlying such forward-looking statementsinvolve judgments with respect to, among other things, future economic, competitive, regulatory andfinancial market conditions and future business decisions, which may not be realized and which areinherently subject to significant business, economic, competitive and regulatory uncertainties and knownand unknown risks, including the risks described under ‘‘Risk Factors’’ in this Annual Report onForm 10-K, as such factors may be updated from time to time in our filings with the SEC, including ourQuarterly Reports on Form 10-Q. Our actual results may differ materially from those reflected in theforward-looking statements.
In addition to the risks described in the ‘‘Risk Factors’’ section of this Annual Report on Form 10-Kand the other reports we file with the SEC, important factors to consider and evaluate with respect to suchforward-looking statements include:
• Changes in external competitive market factors that might impact our results of operations;
• Changes in laws and regulations, including without limitation changes in capital requirements underBasel III;
• The impact of the federal Tax Cuts and Jobs Act of 2017, including, but not limited to, the effect ofa lower federal corporate income tax rate, including on the valuation of our tax assets and liabilities;
• Changes in our business strategy or an inability to execute our strategy due to the occurrence ofunanticipated events;
• Local, regional and national economic conditions and events, including real estate values, and theimpact they may have on us and our customers;
• Costs and effects of regulatory and legal developments, including official and unofficialinterpretations by regulatory agencies of laws and regulations, the results of regulatoryexaminations and the outcome of regulatory or other governmental inquiries and proceedings, suchas fines or restrictions on our business activities;
• Our ability to attract deposits and other sources of liquidity;
• Changes in the financial performance and/or condition of our borrowers;
• Our ability to access the capital markets to fund our operations and future growth;
• Changes in the level of non-performing and classified assets and charge-offs;
• Changes in estimates of future loan loss reserve requirements based upon the periodic reviewthereof under relevant regulatory and accounting requirements;
• Inflation, interest rate, securities market and monetary fluctuations;
1
• Timely development and acceptance of new banking products and services and perceived overallvalue of these products and services by users;
• Changes in consumer spending, borrowing and saving habits;
• Technological changes;
• Significant disruption in the technology platforms on which we rely, including security failures,cyberattacks or other breaches of our systems or those of our customers, partners or serviceproviders;
• Continued volatility in the credit and equity markets and its effect on the general economy;
• Effects of changes in accounting policies and practices, as may be adopted by the regulatoryagencies, as well as the Public Company Accounting Oversight Board, the Financial AccountingStandards Board and other accounting standard setters;
• Our ability to identify potential candidates for, and consummate, acquisition or investmenttransactions;
• The timing of acquisition, investment, or disposition transactions;
• Constraints on our ability to consummate an attractive acquisition or investment transactionbecause of significant competition for these opportunities;
• The businesses of DNB and any acquisition targets or merger partners and subsidiaries notintegrating successfully or such integration being more difficult, time-consuming or costly thanexpected;
• Material differences in the actual financial results of merger and acquisition activities comparedwith expectations, such as with respect to the full realization of anticipated cost savings and revenueenhancements within the expected time frame;
• Our ability to successfully implement our growth strategy, increase market share, control expensesand maintain liquidity; and
• DNB First’s ability to pay dividends to DNB Financial Corporation.
You are cautioned not to place undue reliance on any forward-looking statements we make, whichspeak only as of the date they are made. We do not undertake any obligation to release publicly orotherwise provide any revisions to any forward-looking statements we may make, including any forward-looking financial information, to reflect events or circumstances occurring after the date hereof or toreflect the occurrence of unanticipated events, except as may be required under applicable law.
2
Part I
Item 1. Business
General Description of Registrant’s Business and Its Development
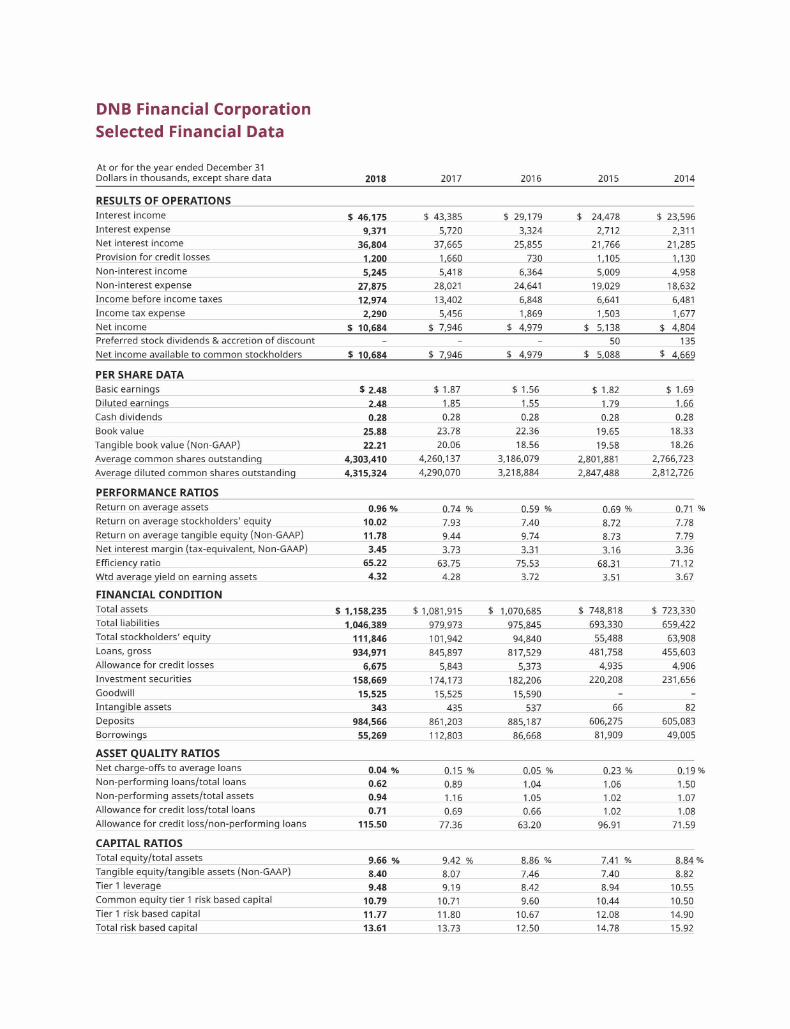
DNB Financial Corporation (the ‘‘Registrant’’ or ‘‘DNB’’), a Pennsylvania business corporation, is abank holding company registered with and supervised by the Board of Governors of the Federal ReserveSystem (Federal Reserve Board). The Registrant was incorporated on October 28, 1982 and commencedoperations on July 1, 1983 upon consummation of the acquisition of all of the outstanding stock ofDowningtown National Bank, now known as DNB First, National Association (the ‘‘Bank’’). Sincecommencing operations, DNB’s business has consisted primarily of managing and supervising the Bank,and its principal source of income has been derived from the Bank. At December 31, 2018, DNB had totalconsolidated assets, total liabilities and stockholders’ equity of $1.2 billion, $1.0 billion, and $111.8 million,respectively.
The Bank was organized in 1860. The Bank is a national banking association that is a member of theFederal Reserve System, the deposits of which are insured by the Federal Deposit Insurance Corporation(‘‘FDIC’’). The Bank is a full service commercial bank providing a wide range of services to individuals andsmall to medium sized businesses in the southeastern Pennsylvania market area, including accepting time,demand, and savings deposits and making secured and unsecured commercial, real estate and consumerloans. In addition, the Bank has fifteen (15) full service branches and a full-service wealth managementgroup known as ‘‘DNB First Wealth Management.’’ The Bank’s financial subsidiary, DNB FinancialServices, Inc., (also known as ‘‘DNB Investments & Insurance’’) is a Pennsylvania licensed insuranceagency, which, through a third party marketing agreement with Cetera Investment Services, LLC, sells abroad variety of insurance and investment products. The Bank’s other subsidiaries are Downco, Inc. andDN Acquisition Company, Inc. which were incorporated in December 1995 and December 2008,respectively, for the purpose of acquiring and holding Other Real Estate Owned acquired throughforeclosure or deed in-lieu-of foreclosure, as well as Bank-occupied real estate.
The Bank’s headquarters is located at 4 Brandywine Avenue, Downingtown, Pennsylvania. As ofDecember 31, 2018, the Bank had total assets of $1.2 billion, total deposits of $984.8 million and totalstockholders’ equity of $130.0 million. The Bank’s business is not seasonal in nature. The FDIC, to theextent provided by law, insures its deposits. On December 31, 2018, the Bank had 156 full-time employeesand 18 part-time employees.
The Bank derives its income principally from interest charged on loans and, to a lesser extent, interestearned on investments, fees received in connection with the origination of loans, wealth management andother services. The Bank’s principal expenses are interest expense on deposits and borrowings andoperating expenses. Funds for activities are provided principally by operating revenues, deposit growth andthe repayment of outstanding loans and investments.
The Bank encounters vigorous competition from a number of sources, including other commercialbanks, thrift institutions, other financial institutions and financial intermediaries. In addition tocommercial banks, Federal and state savings and loan associations, savings banks, credit unions andindustrial savings banks actively compete in the Bank’s market area to provide a wide variety of bankingservices. Mortgage banking firms, real estate investment trusts, finance companies, insurance companies,leasing companies and brokerage companies, financial affiliates of industrial companies and certaingovernment agencies provide additional competition for loans and for certain financial services. The Bankalso competes for interest-bearing funds with a number of other financial intermediaries, which offer adiverse range of investment alternatives, including brokerage firms and mutual fund companies.
DNB’s internet website address is www.dnbfirst.com. Information on DNB’s website is not part of thisAnnual Report on Form 10-K. Investors can obtain copies of DNB’s annual report on Form 10-K,quarterly reports on Form 10-Q, current reports on Form 8-K, and any amendments to those reports filed
3
or furnished pursuant to Section 13(a) or 15(d) of the Securities Exchange Act of 1934, as amended, onDNB’s website (accessible under ‘‘Investor Relations’’ — ‘‘SEC Filings’’) as soon as reasonably practicableafter DNB has filed such materials with, or furnished them to, the Securities and Exchange Commission(‘‘SEC’’). DNB will also furnish a paper copy of such filings free of charge upon request. DNB’s filings canalso be accessed at the SEC’s internet website: https://www.sec.gov/cgi-bin/browse-edgar?CIK=713671.
Supervision and Regulation — Registrant
Federal Banking Laws
The Registrant is subject to a number of complex Federal banking laws, most notably the provisions ofthe Bank Holding Company Act of 1956, as amended (‘‘Bank Holding Company Act’’) and the Change inBank Control Act of 1978 (‘‘Change in Control Act’’), and to supervision by the Federal Reserve Board.
Bank Holding Company Act — Financial Holding Companies
The Bank Holding Company Act requires a ‘‘company’’ (including the Registrant) to secure the priorapproval of the Federal Reserve Board before it owns or controls, directly or indirectly, more than fivepercent (5%) of the voting shares or substantially all of the assets of any bank. It also prohibits acquisitionby any ‘‘company’’ (including the Registrant) of more than five percent (5%) of the voting shares of, orinterest in, or all or substantially all of the assets of, any bank located outside of the state in which a currentbank subsidiary is located unless such acquisition is specifically authorized by laws of the state in whichsuch bank is located. A ‘‘bank holding company’’ (including the Registrant) is prohibited from engaging inor acquiring direct or indirect control of more than five percent (5%) of the voting shares of any companyengaged in non-banking activities unless the Federal Reserve Board, by order or regulation, has found suchactivities to be so closely related to banking or managing or controlling banks as to be a proper incidentthereto. In making this determination, the Federal Reserve Board considers whether the performance ofthese activities by a bank holding company would offer benefits to the public that outweigh possibleadverse effects. Applications under the Bank Holding Company Act and the Change in Control Act aresubject to review, based upon the record of compliance of the applicant with the Community ReinvestmentAct of 1977 (‘‘CRA’’). See further discussion below.
The Registrant is required to file an annual report with the Federal Reserve Board and any additionalinformation that the Federal Reserve Board may require pursuant to the Bank Holding Company Act. TheFederal Reserve Board may also make examinations of the Registrant and any or all of its subsidiaries.Further, under Section 106 of the 1970 amendments to the Bank Holding Company Act and the FederalReserve Board’s regulations, a bank holding company and its subsidiaries are prohibited from engaging incertain tie-in arrangements in connection with any extension of credit or provision of credit or provision ofany property or services. The so-called ‘‘anti-tie-in’’ provisions state generally that a bank may not extendcredit, lease, sell property or furnish any service to a customer on the condition that the customer provideadditional credit or service to the bank, to its bank holding company or to any other subsidiary of its bankholding company or on the condition that the customer not obtain other credit or service from acompetitor of the bank, its bank holding company or any subsidiary of its bank holding company.
Permitted Non-Banking Activities. The Federal Reserve Board permits bank holding companies toengage in non-banking activities so closely related to banking or managing or controlling banks as to be aproper incident thereto. A number of activities are authorized by Federal Reserve Board regulation, whileother activities require prior Federal Reserve Board approval. The types of permissible activities aresubject to change by the Federal Reserve Board. Revisions to the Bank Holding Company Act contained inthe Gramm-Leach Bliley Act of 1999 permit certain eligible bank holding companies to qualify as‘‘financial holding companies’’ and thereupon engage in a wider variety of financial services such assecurities and insurance activities, and subject such companies to increased competition from a widervariety of non-banking competitors as well as banks.
4
Gramm-Leach Bliley Act of 1999 (‘‘GLB’’). This law repealed certain restrictions on bank and securitiesfirm affiliations, and allows bank holding companies to elect to be treated as a ‘‘financial holdingcompany’’ that can engage in approved ‘‘financial activities,’’ including insurance, securities underwritingand merchant banking. Banks without holding companies can engage in many of these financial activitiesthrough a ‘‘financial subsidiary.’’ The law also mandates functional regulation of bank securities activities.Banks’ exemption from broker-dealer regulation is limited to, for example, trust, safekeeping, custodian,shareholder and employee benefit plans, sweep accounts, private placements (under certain conditions),self-directed IRAs, third party networking arrangements to offer brokerage services to bank customers,and the like. It also requires banks that advise mutual funds to register as investment advisers. Thelegislation provides for state regulation of insurance, subject to certain specified state preemptionstandards. It establishes which insurance products banks and bank subsidiaries may provide as principal orunderwriter, and prohibits bank underwriting of title insurance, but also preempts state laws interferingwith affiliations. GLB prohibits approval of new de novo thrift charter applications by commercial entitiesand limits sales of existing so-called ‘‘unitary’’ thrifts to commercial entities. The law bars banks, savingsand loans, credit unions, securities firms and insurance companies, as well as other ‘‘financial institutions,’’from disclosing customer account numbers or access codes to unaffiliated third parties for telemarketing orother direct marketing purposes, and enables customers of financial institutions to ‘‘opt out’’ of havingtheir personal financial information shared with unaffiliated third parties, subject to exceptions related tothe processing of customer transactions and joint financial services marketing arrangements with thirdparties, as long as the institution discloses the activity to its customers and requires the third party to keepthe information confidential. It requires policies on privacy and disclosure of information to be disclosedannually, requires federal regulators to adopt comprehensive regulations for ensuring the security andconfidentiality of consumers’ personal information, and allows state laws to give consumers greater privacyprotections. The GLB has increased the competition the Bank faces from a wider variety of non-bankingcompetitors as well as banks.
Change in Bank Control Act
Under the Change in Control Act, no person, acting directly or indirectly or through or in concert withone or more other persons, may acquire ‘‘control’’ of any Federally insured depository institution unlessthe appropriate Federal banking agency has been given 60 days prior written notice of the proposedacquisition and within that period has not issued a notice disapproving of the proposed acquisition or hasissued written notice of its intent not to disapprove the action. The period for the agency’s disapproval maybe extended by the agency. Upon receiving such notice, the Federal agency is required to provide a copy tothe appropriate state regulatory agency, if the institution of which control is to be acquired is statechartered, and the Federal agency is obligated to give due consideration to the views and recommendationsof the state agency. Upon receiving a notice, the Federal agency is also required to conduct aninvestigation of each person involved in the proposed acquisition. Notice of such proposal is to bepublished and public comment solicited thereon. A proposal may be disapproved by the Federal agency ifthe proposal would have anticompetitive effects, if the proposal would jeopardize the financial stability ofthe institution to be acquired or prejudice the interests of its depositors, if the competence, experience orintegrity of any acquiring person or proposed management personnel indicates that it would not be in theinterest of depositors or the public to permit such person to control the institution, if any acquiring personfails to furnish the Federal agency with all information required by the agency, or if the Federal agencydetermines that the proposed transaction would result in an adverse effect on a deposit insurance fund. Inaddition, the Change in Control Act requires that, whenever any Federally insured depository institutionmakes a loan or loans secured, or to be secured, by 25% or more of the outstanding voting stock of aFederally insured depository institution, the president or chief executive officer of the lending bank mustpromptly report such fact to the appropriate Federal banking agency regulating the institution whose stocksecures the loan or loans.
5
Dodd-Frank Wall Street Reform and Consumer Protection Act. The federal government is consideringa variety of reforms related to banking and the financial industry including, without limitation, theDodd-Frank Act. The Dodd-Frank Act is intended to promote financial stability in the U.S., reduce therisk of bailouts and protect against abusive financial services practices by improving accountability andtransparency in the financial system and ending ‘‘too big to fail’’ institutions. It is the broadest overhaul ofthe U.S. financial system since the Great Depression, and much of its impact will be determined by thescope and substance of many regulations that will need to be adopted by various regulatory agencies toimplement its provisions. For these reasons, the overall impact on DNB and its subsidiaries is unknown atthis time.
The Dodd-Frank Act delegates to various federal agencies the task of implementing its manyprovisions through regulation. Hundreds of new federal regulations, studies and reports addressing all ofthe major areas of the new law, including the regulation of banks and their holding companies, will berequired, ensuring that federal rules and policies in this area will be further developing for months andyears to come. Based on the provisions of the Dodd-Frank Act and anticipated implementing regulations,it is highly likely that banks and thrifts as well as their holding companies will be subject to significantlyincreased regulation and compliance obligations.
The Dodd-Frank Act could require us to make material expenditures, in particular personnel trainingcosts and additional compliance expenses, or otherwise adversely affect our business or financial results. Itcould also require us to change certain of our business practices, adversely affect our ability to pursuebusiness opportunities we might otherwise consider engaging in, cause business disruptions and/or haveother impacts that are as-of-yet unknown to DNB and the Bank. Failure to comply with these laws orregulations, even if inadvertent, could result in negative publicity, fines or additional licensing expenses,any of which could have an adverse effect on our cash flow and results of operations. For example, aprovision of the Dodd-Frank Act is intended to preclude bank holding companies from treating futuretrust preferred securities issuances as Tier 1 capital for regulatory capital adequacy purposes. Thisprovision may narrow the number of possible capital raising opportunities DNB and other bank holdingcompanies might have in the future. As another example, the new law establishes the Consumer FinancialProtection Bureau, which has been given substantive rule-making authority under most of the consumerprotection regulations affecting the Bank and its customers. The Bureau and new rules it will issue maymaterially affect the methods and costs of compliance by the Bank in connection with future consumerrelated transactions.
Pennsylvania Banking Laws
Under the Pennsylvania Banking Code of 1965, as amended (‘‘PA Code’’), the Registrant is permittedto control an unlimited number of banks, subject to prior approval of the Federal Reserve Board as morefully described above. The PA Code authorizes reciprocal interstate banking without any geographiclimitation. Reciprocity between states exists when a foreign state’s law authorizes Pennsylvania bankholding companies to acquire banks or bank holding companies located in that state on terms andconditions substantially no more restrictive than those applicable to such an acquisition by a bank holdingcompany located in that state. Interstate ownership of banks in Pennsylvania with banks in Delaware,Maryland, New Jersey, Ohio, New York and other states is currently authorized. Some state laws stillrestrict de novo formations of branches in other states, but restrictions on interstate de novo banking havebeen relaxed by the Dodd-Frank Act. Pennsylvania law also provides Pennsylvania state charteredinstitutions elective parity with the power of national banks, federal thrifts, and state-chartered institutionsin other states as authorized by the Federal Deposit Insurance Corporation (‘‘Competing Institutions’’). Insome cases, this may give state chartered institutions broader powers than national banks such as the Bank,and may increase competition the Bank faces from other banking institutions.
6
Supervision and Regulation — Bank
The operations of the Bank are subject to Federal and State statutes applicable to banks charteredunder the banking laws of the United States, to members of the Federal Reserve System and to bankswhose deposits are insured by the FDIC. Bank operations are also subject to regulations of the Office ofthe Comptroller of the Currency (‘‘OCC’’), the Federal Reserve Board and the FDIC.
The primary supervisory authority of the Bank is the OCC, who regularly examines the Bank. TheOCC has the authority to prevent a national bank from engaging in an unsafe or unsound practice inconducting its business.
Federal and state banking laws and regulations govern, among other things, the scope of a bank’sbusiness, the investments a bank may make, the reserves against deposits a bank must maintain, loans abank makes and collateral it takes, the activities of a bank with respect to mergers and consolidations andthe establishment of branches. All nationally and state-chartered banks in Pennsylvania are permitted tomaintain branch offices in any county of the state. National bank branches may be established only afterapproval by the OCC. It is the general policy of the OCC to approve applications to establish and operatedomestic branches, including ATMs and other automated devices that take deposits, provided thatapproval would not violate applicable Federal or state laws regarding the establishment of such branches.The OCC reserves the right to deny an application or grant approval subject to conditions if (1) there aresignificant supervisory concerns with respect to the applicant or affiliated organizations, (2) in accordancewith CRA, the applicant’s record of helping meet the credit needs of its entire community, including lowand moderate income neighborhoods, consistent with safe and sound operation, is less than satisfactory, or(3) any financial or other business arrangement, direct or indirect, involving the proposed branch or deviceand bank ‘‘insiders’’ (directors, officers, employees and 10% or greater shareholders) involves terms andconditions more favorable to the insiders than would be available in a comparable transaction withunrelated parties.
The Bank, as a subsidiary of a bank holding company, is subject to certain restrictions imposed by theFederal Reserve Act on any extensions of credit to the bank holding company or its subsidiaries, oninvestments in the stock or other securities of the bank holding company or its subsidiaries and on takingsuch stock or securities as collateral for loans. The Federal Reserve Act and Federal Reserve Boardregulations also place certain limitations and reporting requirements on extensions of credit by a bank toprincipal shareholders of its parent holding company, among others, and to related interests of suchprincipal shareholders. In addition, such legislation and regulations may affect the terms upon which anyperson becoming a principal shareholder of a holding company may obtain credit from banks with whichthe subsidiary bank maintains a correspondent relationship.
Capital Adequacy
Federal banking laws impose on banks certain minimum requirements for capital adequacy. Federalbanking agencies have issued certain ‘‘risk-based capital’’ guidelines, and certain ‘‘leverage’’ requirementson member banks such as the Bank. Banking regulators have authority to require higher minimum capitalratios for an individual bank or bank holding company in view of its circumstances.
New Capital Rules. On July 2, 2013, the Federal Reserve approved final rules that substantially amendthe regulatory risk-based capital rules applicable to the Corporation and the Bank. The FDIC and theOCC have subsequently approved these rules. The final rules were adopted following the issuance ofproposed rules by the Federal Reserve in June 2012, and implement the ‘‘Basel III’’ regulatory capitalreforms and changes required by the Dodd-Frank Act. ‘‘Basel III’’ refers to two consultative documentsreleased by the Basel Committee on Banking Supervision in December 2009, the rules text released inDecember 2010, and loss absorbency rules issued in January 2011, which include significant changes tobank capital, leverage and liquidity requirements.
7
The rules include new risk-based capital and leverage ratios, which will be phased in from 2015 to2019, and refine the definition of what constitutes ‘‘capital’’ for purposes of calculating those ratios. Thenew minimum capital level requirements applicable to the Corporation and the Bank under the final ruleseffective as of January 1, 2015: (i) a new common equity Tier 1 capital ratio of 4.5%; (ii) a Tier 1 capitalratio of 6% (increased from 4%); (iii) a total capital ratio of 8% (unchanged from current rules); and (iv) aTier 1 leverage ratio of 4% for all institutions. The final rules also establish a ‘‘capital conservation buffer’’above the new regulatory minimum capital requirements, which must consist entirely of common equityTier 1 capital. The capital conservation buffer will be phased-in over four years beginning on January 1,2016, as follows: the maximum buffer will be 0.625% of risk-weighted assets for 2016, 1.25% for 2017,1.875% for 2018, and 2.5% for 2019 and thereafter. This will result in the following minimum ratiosbeginning in 2019: (i) a common equity Tier 1 capital ratio of 7.0%, (ii) a Tier 1 capital ratio of 8.5%, and(iii) a total capital ratio of 10.5%. Under the final rules, institutions are subject to limitations on payingdividends, engaging in share repurchases, and paying discretionary bonuses if its capital level falls belowthe buffer amount. These limitations establish a maximum percentage of eligible retained income thatcould be utilized for such actions.
The final rules implement revisions and clarifications consistent with Basel III regarding the variouscomponents of Tier 1 capital, including common equity, unrealized gains and losses, as well as certaininstruments that will no longer qualify as Tier 1 capital, some of which will be phased out over time.However, the final rules provide that small depository institution holding companies with less than$15 billion in total assets as of December 31, 2009 (which includes the Corporation) will be able topermanently include non-qualifying instruments that were issued and included in Tier 1 or Tier 2 capitalprior to May 19, 2010 in additional Tier 1 or Tier 2 capital until they redeem such instruments or until theinstruments mature.
The final rules also contain revisions to the prompt corrective action framework, which is designed toplace restrictions on insured depository institutions, including the Bank, if their capital levels begin to showsigns of weakness. These revisions took effect January 1, 2015. Under the prompt corrective actionrequirements, which are designed to complement the capital conservation buffer, insured depositoryinstitutions are required to meet the following increased capital level requirements in order to qualify as‘‘well capitalized:’’ (i) a new common equity Tier 1 capital ratio of 6.5%; (ii) a Tier 1 capital ratio of 8%(increased from 6%); (iii) a total capital ratio of 10% (unchanged from current rules); and (iv) a Tier 1leverage ratio of 5% (increased from 4%).
The final rules set forth certain changes for the calculation of risk-weighted assets, which have beenrequired to utilize since January 1, 2015. The standardized approach final rule utilizes an increasednumber of credit risk exposure categories and risk weights, and also addresses: (i) an alternative standardof creditworthiness consistent with Section 939A of the Dodd-Frank Act; (ii) revisions to recognition ofcredit risk mitigation; (iii) rules for risk weighting of equity exposures and past due loans; (iv) revisedcapital treatment for derivatives and repo-style transactions; and (v) disclosure requirements for top-tierbanking organizations with $50 billion or more in total assets that are not subject to the ‘‘advance approachrules’’ that apply to banks with greater than $250 billion in consolidated assets. Based on our currentcapital composition and levels, we believe that we are in compliance with the requirements as set forth inthe final rules presently in effect.
Minimum Capital Ratios. The risk-based guidelines require all banks to maintain two ‘‘risk-weightedassets’’ ratios. The first is a minimum ratio of total capital (‘‘Tier 1’’ and ‘‘Tier 2’’ capital) to risk-weightedassets equal to 8.00%; the second is a minimum ratio of ‘‘Tier 1’’ capital to risk-weighted assets equal to4.00%. Assets are assigned to five risk categories, with higher levels of capital being required for thecategories perceived as representing greater risk. In making the calculation, certain intangible assets mustbe deducted from the capital base. The risk-based capital rules are designed to make regulatory capitalrequirements more sensitive to differences in risk profiles among banks and bank holding companies andto minimize disincentives for holding liquid assets.
8

The risk-based capital rules also account for interest rate risk. Institutions with interest rate riskexposure above a normal level would be required to hold extra capital in proportion to that risk. A bank’sexposure to declines in the economic value of its capital due to changes in interest rates is a factor that thebanking agencies will consider in evaluating a bank’s capital adequacy. The rule does not codify an explicitminimum capital charge for interest rate risk. The Bank currently monitors and manages its assets andliabilities for interest rate risk, and management believes that the interest rate risk rules which have beenimplemented and proposed will not materially adversely affect our operations.
The ‘‘leverage’’ ratio rules require banks which are rated the highest in the composite areas of capital,asset quality, management, earnings, liquidity and sensitivity to market risk to maintain a ratio of ‘‘Tier 1’’capital to ‘‘adjusted total assets’’ (equal to the bank’s average total assets as stated in its most recentquarterly Call Report filed with its primary federal banking regulator, minus end-of-quarter intangibleassets that are deducted from Tier 1 capital) of not less than 3.00%. For banks which are not the mosthighly rated, the minimum ‘‘leverage’’ ratio will range from 4.00% to 5.00%, or higher at the discretion ofthe bank’s primary federal regulator, and is required to be at a level commensurate with the nature of thelevel of risk of the bank’s condition and activities.
For purposes of the capital requirements, ‘‘Tier 1’’ or ‘‘core’’ capital is defined to include commonstockholders’ equity and certain non-cumulative perpetual preferred stock and related surplus. ‘‘Tier 2’’ or‘‘qualifying supplementary’’ capital is defined to include a bank’s allowance for loan and lease losses up to1.25% of risk-weighted assets, plus certain types of preferred stock and related surplus, certain ‘‘hybridcapital instruments’’ and certain term subordinated debt instruments.
Prompt Corrective Action. Federal banking law mandates certain ‘‘prompt corrective actions,’’ whichFederal banking agencies are required to take, and certain actions which they have discretion to take,based upon the capital category into which a Federally regulated depository institution falls. Regulationshave been adopted by the Federal bank regulatory agencies setting forth detailed procedures and criteriafor implementing prompt corrective action in the case of any institution that is not adequately capitalized.Under the rules, an institution will be deemed to be ‘‘adequately capitalized’’ or better if it exceeds theminimum Federal regulatory capital requirements. However, it will be deemed ‘‘undercapitalized’’ if it failsto meet the minimum capital requirements, ‘‘significantly undercapitalized’’ if it has a total risk-basedcapital ratio that is less than 6.0%, a Tier 1 risk-based capital ratio that is less than 3.0%, or a leverage ratiothat is less than 3.0%, and ‘‘critically undercapitalized’’ if the institution has a ratio of tangible equity tototal assets that is equal to or less than 2.0%. The rules require an undercapitalized institution to file awritten capital restoration plan, along with a performance guaranty by its holding company or a third party.In addition, an undercapitalized institution becomes subject to certain automatic restrictions including aprohibition on the payment of dividends, a limitation on asset growth and expansion, and in certain cases, alimitation on the payment of bonuses or raises to senior executive officers, and a prohibition on thepayment of certain ‘‘management fees’’ to any ‘‘controlling person’’. Institutions that are classified asundercapitalized are also subject to certain additional supervisory actions, including increased reportingburdens and regulatory monitoring, a limitation on the institution’s ability to make acquisitions, open newbranch offices, or engage in new lines of business, obligations to raise additional capital, restrictions ontransactions with affiliates, and restrictions on interest rates paid by the institution on deposits. In certaincases, bank regulatory agencies may require replacement of senior executive officers or directors, or sale ofthe institution to a willing purchaser. If an institution is deemed to be ‘‘critically undercapitalized’’ andcontinues in that category for four quarters, the statute requires, with certain narrowly limited exceptions,that the institution be placed in receivership.
Based on management’s assessment, the Bank is ‘‘well capitalized’’ for regulatory capital purposes.Please see the table detailing the Bank’s compliance with minimum capital ratios, in Note 17 (‘‘RegulatoryMatters’’) to DNB’s audited financial statements in this Form 10-K.
9
Under the Federal Deposit Insurance Act, the OCC possesses the power to prohibit institutionsregulated by it, such as the Bank, from engaging in any activity that would be an unsafe and unsoundbanking practice and in violation of the law. Moreover, Federal law enactments have expanded thecircumstances under which officers or directors of a bank may be removed by the institution’s Federalsupervisory agency; unvested and further regulated lending by a bank to its executive officers, directors,principal shareholders or related interests thereof; and unvested management personnel of a bank fromserving as directors or in other management positions with certain depository institutions whose assetsexceed a specified amount or which have an office within a specified geographic area; and unvestedmanagement personnel from borrowing from another institution that has a correspondent relationshipwith their bank.
Interstate Banking. Federal law permits interstate bank mergers and acquisitions. Limited branchpurchases are still subject to state laws. Pennsylvania law permits out-of-state banking institutions toestablish branches in Pennsylvania with the approval of the Pennsylvania Department of Banking andSecurities, provided the law of the state where the banking institution is located would permit aPennsylvania banking institution to establish and maintain a branch in that state on substantially similarterms and conditions. It also permits Pennsylvania banking institutions to maintain branches in otherstates. The Dodd-Frank Act created a more permissive interstate branching regime by permitting banks toestablish branches de novo in any state if a bank chartered by such state would have been permitted toestablish the branch. Bank management anticipates that interstate banking will continue to increasecompetitive pressures in the Bank’s market by permitting entry of additional competitors, but managementis of the opinion that this will not have a material impact upon the anticipated results of operations of theBank.
Bank Secrecy Act and OFAC. Under the Bank Secrecy Act (‘‘BSA’’), the Bank is required to report tothe Internal Revenue Service, currency transactions of more than $10,000 or multiple transactions of whichthe Bank is aware in any one day that aggregate in excess of $10,000. Civil and criminal penalties areprovided under the BSA for failure to file a required report, for failure to supply information required bythe BSA or for filing a false or fraudulent report. The Department of the Treasury’s Office of ForeignAsset Control (‘‘OFAC’’) administers and enforces economic and trade sanctions against targeted foreigncountries, terrorism-sponsoring jurisdictions and organizations, and international narcotics traffickersbased on U.S. foreign policy and national security goals. OFAC acts under presidential wartime andnational emergency powers and authority granted by specific legislation to impose controls on transactionsand freeze foreign assets under U.S. jurisdiction. Acting under authority delegated from the Secretary ofthe Treasury, OFAC promulgates, develops, and administers the sanctions under its statutes and executiveorders. OFAC requirements are separate and distinct from the BSA, but both OFAC requirements and theBSA share a common national security goal. Because institutions and regulators view compliance withOFAC sanctions as related to BSA compliance obligations, supervisory examination for OFAC complianceis typically connected to examination of an institution’s BSA compliance. Examiners focus on a bankingorganization’s compliance processes and evaluate the sufficiency of a banking organization’simplementation of policies, procedures and systems to ensure compliance with OFAC regulations.
USA PATRIOT Act. The Uniting and Strengthening America by Providing Appropriate Tools Requiredto Intercept and Obstruct Terrorism Act of 2001 (together with its implementing regulations, the ‘‘PatriotAct’’), designed to deny terrorists and others the ability to obtain access to the United States financialsystem, has significant implications for banks and other financial institutions. It required DNB and itssubsidiary to implement new policies and procedures or amend existing policies and procedures withrespect to, anti-money laundering, compliance, suspicious activity and currency transaction reporting anddue diligence on customers, as well as related matters. The Patriot Act permits and in some cases requiresinformation sharing for counter-terrorist purposes between federal law enforcement agencies and financialinstitutions, as well as among financial institutions, and it requires federal banking agencies to evaluate theeffectiveness of an institution in combating money laundering activities, both in ongoing examinations andin connection with applications for regulatory approval.
10

FDIC Insurance and Assessments. The Bank’s deposits are insured to applicable limits by the FDIC.Under the Dodd-Frank Act, the maximum deposit insurance amount was permanently increased from$100,000 to $250,000.
The FDIC has adopted a risk-based premium system that provides for quarterly assessments based onan insured institution’s ranking in one of four risk categories based on their examination ratings and capitalratios. Within its risk category, an institution is assigned an initial base assessment which is then adjusted todetermine its final assessment rate based on its level of brokered deposits, secured liabilities and unsecureddebt.
The FDIC may take action to increase insurance premiums if the deposit insurance fund is not fundedto its regulatory mandated Designated Reserve Ratio (DRR). Currently, the FDIC is required to achieve aDRR of 1.35% by September 30, 2020, and has established a target DRR of 2.0%. Under the Dodd-FrankAct, the FDIC assesses premiums from each institution based on its average consolidated total assetsminus its average tangible equity, while utilizing a scorecard method to determine each institution’s risk tothe deposit insurance fund. The Dodd-Frank Act also requires the FDIC, in setting assessments, to offsetthe effect of increasing its reserve for the deposit insurance fund on institutions with consolidated totalassets of less than $10 billion. To achieve the mandated DRR consistent with these provisions of theDodd-Frank Act, the FDIC implemented a rule in 2016 imposing a surcharge of 4.5 basis points on allinsured depository institutions with consolidated total assets of $10 billion or more in addition to theirregular assessments. Under the rule, the surcharge would cease once a DRR of 1.35% had been achievedor on December 31, 2018, whichever came first. On September 30, 2018, the DRR reached 1.36%, and thesurcharge was eliminated.
Pursuant to these requirements, the FDIC adopted new assessment regulations effective April 1, 2011that redefined the assessment base as average consolidated assets less average tangible equity. Insuredbanks with more than $1.0 billion in assets must calculate quarterly average assets based on daily balanceswhile smaller banks and newly chartered banks may use weekly averages. Average assets would be reducedby goodwill and other intangibles. Average tangible equity equals Tier 1 capital. For institutions with morethan $1.0 billion in assets, average tangible equity is calculated on a weekly basis while smaller institutionsmay use the quarter-end balance. The base assessment rate for insured institutions in Risk Category I willrange between 5 to 9 basis points and for institutions in Risk Categories II, III, and IV will be 14, 23 and 35basis points, respectively. An institution’s assessment rate will be reduced based on the amount of itsoutstanding unsecured long-term debt and for institutions in Risk Categories II, III and IV may beincreased based on their brokered deposits.
In addition to deposit insurance assessments, banks are subject to assessments to pay the interest onFinancing Corporation bonds. The Financing Corporation was created by Congress to issue bonds tofinance the resolution of failed thrift institutions. The FDIC sets the Financing Corporation assessmentrate every quarter. The current annual Financing Corporation assessment rate is 14 basis points on thedeposit insurance assessment base, as defined above, which we anticipate will result in an aggregateestimated FICO assessment payment by the Bank of $14,000 in 2019.
Other Laws and Regulations. The Bank is subject to a variety of consumer protection laws, includingthe Truth in Lending Act, the Truth in Savings Act adopted as part of the Federal Deposit InsuranceCorporation Improvement Act of 1991 (‘‘FDICIA’’), the Equal Credit Opportunity Act, the HomeMortgage Disclosure Act, the Electronic Funds Transfer Act, the Real Estate Settlement Procedures Actand the regulations adopted thereunder. In the aggregate, compliance with these consumer protection lawsand regulations involves substantial expense and administrative time on the part of the Bank and DNB.
Regulatory Reform and Legislation. From time to time, various legislative and regulatory initiatives areintroduced in Congress and state legislatures, as well as by regulatory agencies. Such initiatives may includeproposals to expand or contract the powers of bank holding companies and depository institutions orproposals to substantially change the financial institution regulatory system. Such legislation could change
11
banking statutes and the operating environment of DNB in substantial and unpredictable ways. If enacted,such legislation could increase or decrease the cost of doing business, limit or expand permissible activitiesor affect the competitive balance among banks, savings associations, credit unions, and other financialinstitutions. DNB cannot predict whether any such legislation will be enacted, and, if enacted, the effectthat it, or any implementing regulations, would have on its financial condition or results of operations. Achange in statutes, regulations or regulatory policies applicable to DNB or our subsidiaries could have amaterial effect on our business, financial condition and results of operations.
Effect of Government Monetary Policies. The earnings of DNB are and will be affected by domesticeconomic conditions and the monetary and fiscal policies of the United States Government and itsagencies (particularly the Federal Reserve Board). The monetary policies of the Federal Reserve Boardhave had and will likely continue to have, an important impact on the operating results of commercialbanks through its power to implement national monetary policy in order, among other things, to curbinflation or combat a recession. The Federal Reserve Board has a major effect upon the levels of bankloans, investments and deposits through its open market operations in United States Governmentsecurities and through its regulation of, among other things, the discount rate on borrowing of memberbanks and the reserve requirements against member bank deposits. It is not possible to predict the natureand impact of future changes in monetary and fiscal policies.
Incentive Compensation. In June 2010, the Federal Reserve Board, OCC and FDIC issuedcomprehensive final guidance on incentive compensation policies intended to ensure that the incentivecompensation policies of banking organizations do not undermine the safety and soundness of suchorganizations by encouraging excessive risk-taking. The guidance, which covers all employees that have theability to materially affect the risk profile of an organization, either individually or as part of a group, isbased upon the key principles that a banking organization’s incentive compensation arrangements should(i) provide incentives that do not encourage risk-taking beyond the organization’s ability to effectivelyidentify and manage risks, (ii) be compatible with effective internal controls and risk management, and(iii) be supported by strong corporate governance, including active and effective oversight by theorganization’s board of directors.
The Federal Reserve Board will review, as part of the regular, risk-focused examination process, theincentive compensation arrangements of banking organizations, such as DNB, that are not ‘‘large, complexbanking organizations.’’ These reviews will be tailored to each organization based on the scope andcomplexity of the organization’s activities and the prevalence of incentive compensation arrangements.The findings of the supervisory initiatives will be included in reports of examination. Deficiencies will beincorporated into the organization’s supervisory ratings, which can affect the organization’s ability to makeacquisitions and take other actions. Enforcement actions may be taken against a banking organization if itsincentive compensation arrangements, or related risk-management control or governance processes, posea risk to the organization’s safety and soundness and the organization is not taking prompt and effectivemeasures to correct the deficiencies.
In addition, Section 956 of the Dodd-Frank Act required certain regulators (including the FDIC, SECand Federal Reserve Board) to adopt requirements or guidelines prohibiting excessive compensation. InApril and May 2016, the Federal Reserve, jointly with five other federal regulators, published a proposedrule in response to Section 956 of the Dodd-Frank Act, which requires implementation of regulations orguidelines to: (1) prohibit incentive-based payment arrangements that encourage inappropriate risks bycertain financial institutions by providing excessive compensation or that could lead to material financialloss, and (2) require those financial institutions to disclose information concerning incentive-basedcompensation arrangements to the appropriate federal regulator.
The proposed rule identifies three categories of institutions that would be covered by theseregulations based on average total consolidated assets, applying less prescriptive incentive-basedcompensation program requirements to the smallest covered institutions (Level 3) and progressively more
12

rigorous requirements to the larger covered institutions (Level 1). Under the proposed rule, we would fallinto the smallest category (Level 3), which applies to financial institutions with average total consolidatedassets greater than $1 billion and less than $50 billion. The proposed rules would establish generalqualitative requirements applicable to all covered entities, which would include (i) prohibiting incentivearrangements that encourage inappropriate risks by providing excessive compensation; (ii) prohibitingincentive arrangements that encourage inappropriate risks that could lead to a material financial loss;(iii) establishing requirements for performance measures to appropriately balance risk and reward;(iv) requiring board of director oversight of incentive arrangements; and (v) mandating appropriate recordkeeping. Under the proposed rule, larger financial institutions with total consolidated assets of at least$50 billion would also be subject to additional requirements applicable to such institutions’ ‘‘seniorexecutive officers’’ and ‘‘significant risk- takers.’’ These additional requirements would not be applicable tous because we currently have less than $50 billion in total consolidated assets. Comments on the proposedrule were due by July 22, 2016. As of the date of this document, the final rule has not yet been published bythese regulators.
All of DNB’s revenues are attributable to customers located in the United States, and primarily fromcustomers located in Southeastern Pennsylvania. All of Registrant’s assets are located in the United Statesand in Southeastern Pennsylvania. Registrant has no activities in foreign countries and hence no risksattendant to foreign operations.
Item 1A. Risk Factors
Investment in DNB’s Common Stock involves risk and the market price of DNB’s Common Stock mayfluctuate significantly in response to a number of factors, including those that follow. The following listcontains certain risks that may be unique to DNB and to the banking industry. The following list of risksshould not be viewed as an all-inclusive list.
Changes in interest rates could reduce DNB’s net interest margin, net interest income, fee income and netincome. — Interest and fees on loans and securities, net of interest paid on deposits and borrowings,account for a significant part of DNB’s net income. Interest rates are key drivers of DNB’s net interestmargin and subject to many factors beyond DNB’s control. As interest rates change, DNB’s net interestincome is affected. Increased interest rates in the future could result in DNB’s interest expense increasingfaster than interest income because of divergence in financial instrument maturities and/or competitivepressures. Because different types of assets and liabilities may react differently and at different times tomarket interest rate changes, changes in interest rates can increase or decrease DNB’s net interest income.When interest-bearing liabilities mature or re-price more quickly than interest earning assets in a period,an increase in interest rates would reduce net interest income. Similarly, when interest earning assetsmature or re-price more quickly, and because the magnitude of repricing of interest earning assets is oftengreater than interest bearing liabilities, falling interest rates would reduce net interest income. In addition,substantially higher interest rates generally reduce loan demand and may result in slower loan growth.Decreases or increases in interest rates could have a negative effect on the spreads between the interestrates earned on assets and the rates of interest paid on liabilities, and therefore decrease DNB’s netinterest income. Also, changes in interest rates might also impact the values of equity and debt securitiesunder management and administration by DNB’s wealth management business, which may have a negativeimpact on fee income.
If DNB’s allowance for credit losses is insufficient to absorb losses in its loan portfolio, DNB’s earnings coulddecrease. — All borrowers carry the potential to default, and DNB’s remedies to recover upon a defaultmay not fully satisfy amounts previously loaned by DNB. DNB maintains an allowance for credit losses,which is a reserve established through a provision for credit losses charged to expense, which representsDNB’s best estimate of probable credit losses that have been incurred within the existing portfolio of loans.
13
The allowance, in DNB’s judgment, is necessary to reserve for estimated credit losses and risks inherent inthe loan portfolio. Those risks are affected by, among other things:
• the financial condition and cash flows of the borrowers and/or the projects being financed;
• the changes and uncertainties as to the future value of the collateral, in the case of collateralizedloans;
• the duration of the loans in the portfolio;
• the credit history of the particular borrowers; and
• changes in economic and industry conditions.
The determination of the appropriate level of the allowance for credit losses inherently involves a highdegree of subjectivity and requires us to make significant estimates of current credit risks using existingqualitative and quantitative information, including those identified above, all of which may undergomaterial changes. If DNB’s assumptions and estimates are incorrect, its allowance for credit losses may notbe sufficient to cover losses inherent in its loan portfolio, resulting in additions to the allowance. Inaddition, changes in economic conditions affecting borrowers generally or certain borrowers in particular,new information regarding existing loans, identification of additional problem loans and other factors, bothwithin and outside of DNB’s control, may require an increase in the allowance for credit losses. Bankregulatory authorities periodically review DNB’s allowance for credit losses and also may require us toincrease the provision for credit losses or recognize additional loan charge-offs based on judgmentsdifferent than DNB’s. An increase in the allowance for credit losses results in a decrease in net income andmay have a material adverse effect on DNB’s financial condition and results of operations.
ASU 2016-13 will result in a significant change in how we recognize credit losses and may have a materialimpact on our financial condition or results of operations. — In June 2016, the Financial Accounting StandardsBoard, or FASB, issued Accounting Standards Update, or ASU, 2016-13, ‘‘Financial Instruments — CreditLosses (Topic 326), Measurement of Credit Losses on Financial Instruments,’’ which replaces the current‘‘incurred loss’’ model for recognizing credit losses with an ‘‘expected loss’’ model referred to as theCurrent Expected Credit Loss model, or CECL. Under the CECL model, we will be required to presentcertain financial assets carried at amortized cost, such as loans held for investment and held-to-maturitydebt securities, at the net amount expected to be collected. The measurement of expected credit losses is tobe based on information about past events, including historical experience, current conditions, andreasonable and supportable forecasts that affect the collectability of the reported amount. Thismeasurement will take place at the time the financial asset is first added to the balance sheet andperiodically thereafter. This differs significantly from the ‘‘incurred loss’’ model required under currentGAAP, which delays recognition until it is probable a loss has been incurred. Accordingly, we expect thatthe adoption of the CECL model will materially affect how we determine our allowance for loan losses andcould require us to significantly increase our allowance. Moreover, the CECL model may create morevolatility in the level of our allowance for loan losses. If we are required to materially increase our level ofallowance for loan and lease losses for any reason, such increase could adversely affect our business,financial condition and results of operations.
The new CECL standard will become effective for the Corporation for fiscal years beginning afterDecember 15, 2019 and for interim periods within those fiscal years. We are currently evaluating theimpact the CECL model will have on our accounting, but we expect to recognize a one-time cumulative-effect adjustment to our allowance for credit losses as of the beginning of the first reporting period inwhich the new standard is effective. We cannot yet determine the magnitude of any such one-timecumulative adjustment or of the overall impact of the new standard on our financial condition or results ofoperations.
14
Downgrades in U.S. Government and federal agency securities could adversely affect us. — In addition tocausing economic and financial markets disruptions, any downgrades of U.S. Government and federalagency securities and/or failures to raise the U.S. debt limit if necessary in the future, could, among otherthings, materially adversely affect the market value of the U.S. and other government and governmentalagency securities DNB owns, the availability of those securities for use as collateral for borrowing, and itsability to access capital markets on favorable terms, as well as have other material adverse effects on theoperation of its business and financial results and condition. In particular, the impact of these events couldinvolve increases in interest rates and disruption in payment systems, money markets and long-term orshort-term fixed income markets, which could adversely affect the cost and availability of funding to us.Adverse consequences as a result of any downgrades also could extend to borrowers and, as a result, couldadversely affect the borrowers’ ability to repay their loans.
DNB’s financial condition and results of operations may be adversely affected by regional economic conditionsand real estate values. — DNB’s loan and deposit activities are largely based in eastern Pennsylvania. As aresult, DNB’s financial performance is closely tied to economic conditions in this region. While the regionexperienced generally strong local economic conditions during the past several years, and a downturn inthe regional real estate market may adversely affect us because DNB’s loans are concentrated in thisregional area and a large percentage of its loans are secured by real property, and further declines in realestate values reduce the value of that loan collateral. This may limit the amount DNB may recover ondefaulted loans by selling the underlying real estate collateral, which would adversely affect DNB’s resultsof operations. In addition, a significant portion of DNB’s loan portfolio consists of commercial real estateloans. The ability of these borrowers to repay their loans is often dependent on the borrower receivingsufficient rental payments. Economic conditions may affect the ability of tenants to make rental paymentson a timely basis and/or may cause some tenants not to renew their leases, which may adversely affect aborrower’s ability to make loan payments. In addition, if operating expenses, taxes and other expensesassociated with commercial real estate properties increase materially, the tenant’s ability to repay, andtherefore the borrower’s ability to make timely loan payments to us, could be adversely affected. Any ofthese factors could increase the amount of DNB’s non-performing loans, increase its provision for creditlosses and reduce its net income.
General economic conditions and other events may adversely affect DNB’s wealth management businessrevenues. — A general economic slowdown, disruptions in the financial markets, and other events andoccurrences that impact the economy could decrease the value of the assets under management andadministration by DNB’s wealth management business, which would result in lower fee income and couldcause clients to seek alternative investment opportunities with other wealth management or financialservices providers, which could result in reduced revenue.
Decreased residential mortgage origination or changes to DNB’s residential mortgage related revenues andexpenses as a result of actions taken by competitors and regulators could adversely affect DNB’s results ofoperations. — DNB originates and sells residential mortgage loans. Changes in interest rates and pricingdecisions by DNB’s competitors in this market affect demand for DNB’s mortgage loan products andrevenue DNB realizes on the sale of mortgage loans, all of which impact DNB’s net income. Newregulations, increased regulatory scrutiny, changes in the structure of the secondary mortgage markets andother factors also affect DNB’s mortgage loan business, and make it more difficult or costly to operate thisbusiness.
DNB may not be able to effectively manage its growth. — DNB’s future operating results and financialcondition depend to a large extent on its ability to successfully manage its growth. DNB’s growth hasplaced, and will continue to place, significant demands on DNB’s management and operating systems and
15
resources. Whether through acquisitions, organic growth or a combination thereof, DNB’s ability toexpand its business is dependent upon its ability to:
• continue to implement and improve its processes and systems, including credit underwriting,financial, accounting and enterprise risk management;
• comply with an increasing number of new laws, rules and regulations governing its business, andchanges to existing laws, rules and regulations;
• scale its information technology systems; and
• maintain appropriate staffing levels.
Addressing issues relating to DNB’s growth may divert management from DNB’s existing businessand may require us to incur additional expenditures to expand DNB’s administrative and operationalinfrastructure and, if DNB is unable to effectively manage and grow its banking franchise, including to thesatisfaction of DNB’s regulators, DNB’s business could be materially and adversely affected. In addition, ifDNB is unable to manage its current and future expansion in its operations, DNB may experiencecompliance, operational and regulatory problems and delays, have to slow its pace of growth or even stopits market and product expansion, or have to incur additional expenditures beyond current projections tosupport such growth, any one of which could materially and adversely affect us. If DNB experiencesdifficulties with the development of new business activities or the integration process of acquiredbusinesses, the anticipated benefits of any particular acquisition may not be realized fully, or at all, or maytake longer to realize than expected. Additionally, DNB may be unable to recognize synergies, operatingefficiencies and/or expected benefits within expected timeframes and cost projections, or at all. DNB alsomay not be able to preserve the goodwill of an acquired financial institution. DNB’s growth could lead toincreases in its legal, audit, administrative and financial compliance costs, which could materially andadversely affect us.
DNB may need to raise additional capital in the future and such capital may not be available when needed or atall. — DNB may need to raise additional capital in the future to provide us with sufficient capital resourcesand liquidity to meet its commitments and business needs. DNB’s ability to raise additional capital, ifneeded, will depend on, among other things, conditions in the capital markets at that time, which areoutside of DNB’s control, and its financial performance. DNB’s customary sources of liquidity include, butare not limited to, deposits, inter-bank borrowings and borrowings from the Federal Home Loan Bank ofPittsburgh. Any occurrence that may limit DNB’s access to the capital markets, such as a decline in theconfidence of debt purchasers, depositors or counterparties participating in the capital markets mayadversely affect DNB’s capital costs and ability to raise capital and, in turn, DNB’s liquidity. An inability toraise additional capital on acceptable terms when needed could have a material adverse effect on DNB’sbusiness, financial condition and results of operations.
DNB faces strong competition for clients and this competition could affect DNB’s operating results. — DNBoperates in a highly competitive market and experiences competition in DNB’s market from both banksand a variety of other financial institutions. DNB competes with commercial banks, credit unions, savingsand loan associations, mortgage banking firms, consumer finance companies, securities brokerage firms,insurance companies, money market funds, and other mutual funds, as well as other community, super-regional, national, and international financial institutions that operate offices in DNB’s primary marketareas and elsewhere. DNB competes with these institutions both in attracting deposits and in makingloans. Many financial service providers believe DNB’s primary market is an attractive market because of itsstrong economic growth. As a result, DNB is experiencing particularly intense competition in DNB’sprimary marketplace. While DNB’s strategy is to attract customers by providing personalized services andmaking use of the business and personal ties of DNB’s management, there is no assurance DNB will keepor increase market acceptance and be able to operate profitably. Many of DNB’s competitors arewell-established, larger financial institutions. These institutions offer some services, such as extensive and
16

established branch networks, that DNB does not provide. There are also a number of other communitybanks in its market that share its general marketing focus. There is a risk that DNB will not be able tocompete successfully with other financial institutions in its market, and that DNB may have to pay higherinterest rates to attract deposits, which could result in reduced profitability. In addition, competitors thatare not depository institutions are generally not subject to the extensive regulations that apply to us. All ofthese factors may adversely impact DNB’s ability to maintain or increase profitability.
DNB depends on its executive officers and key personnel, and DNB’s ability to operate its business andimplement its strategy depends significantly on DNB’s ability to attract and retain individuals with experience andrelationships in the markets in which DNB operates and intends to expand. — DNB believes that its futuresuccess, including the implementation of its strategy, will depend in large part on the skills of its executivemanagement team and ability to motivate and retain these and other key personnel and attract and retainnew personnel with expertise and relationships in the markets DNB now serves and intends to serve. Theloss of service of one or more of DNB’s executive officers or key personnel, its inability to replacedeparting personnel and/or its ability to hire new personnel to implement DNB’s strategy could limitDNB’s growth and could materially adversely affect DNB’s business, financial condition, and results ofoperations. Competition for qualified candidates is intense, and DNB cannot assure you that DNB will beable to retain and recruit management and other key personnel to meet its needs.
Potential limitations on incentive compensation contained in proposed federal agency rulemaking mayadversely affect our ability to attract and retain our highest performing team members. — In April 2011 and May2016, the Federal Reserve, other federal banking agencies and the SEC jointly published proposed rulesdesigned to implement provisions of the Dodd-Frank Act prohibiting incentive compensationarrangements that would encourage inappropriate risk taking at covered financial institutions, whichincludes a bank or bank holding company with $1 billion or more in assets, such as DNB. It cannot bedetermined at this time whether or when a final rule will be adopted and whether compliance with such afinal rule will substantially affect the manner in which we structure compensation for our executives andother employees. Depending on the nature and application of the final rules, we may not be able tosuccessfully compete with certain financial institutions and other companies that are not subject to some orall of the rules to retain and attract executives and other high performing employees. If this were to occur,relationships that we have established with our clients may be impaired and our business, financialcondition and results of operations could be adversely affected, perhaps materially.
New lines of business or new products and services may subject us to additional risk. — From time to time,DNB may implement new lines of business or offer new products and services within its existing lines ofbusiness. There may be substantial risks and uncertainties associated with these efforts, particularly ininstances where the markets for those new lines of business or new products or services are not yet fullydeveloped. DNB may invest significant time and resources in developing and marketing new lines ofbusiness and/or new products and services. DNB’s anticipated timetables for the development andintroduction of new lines of business and/or new products or services may not be achieved, and DNB’sprice and profitability targets may not prove feasible. In addition, external factors, such as compliance withregulations, competitive alternatives, and shifting market preferences, may also impact development andimplementation of a new line of business and/or a new product or service. Any new line of business and/ornew product or service also could have a significant impact on the effectiveness of DNB’s system ofinternal controls. If DNB fails to successfully manage these risks in the development and implementationof new lines of business and/or new products or services, DNB’s business, financial condition and results ofoperations could be materially adversely affected.
The fair value of DNB’s investment securities can fluctuate due to market conditions which, under somecircumstances can lead to other-than-temporary impairment. — As of December 31, 2018, the fair value ofDNB’s investment securities portfolio was approximately $157.8 million. Factors beyond DNB’s controlcan significantly influence the fair value of DNB’s investment securities and can result in adverse changes
17
to their fair value. These factors include, but are not limited to, rating agency actions with respect to thesecurities, defaults by the issuer or with respect to any underlying securities, and changes in market interestrates and instability in the capital markets. These and other factors could cause other-than-temporaryimpairments and realized and/or unrealized losses in future periods and declines in other comprehensiveincome, which could have a material adverse effect on us. The process for determining whetherimpairment of a security is other-than-temporary typically requires complex, subjective judgments aboutthe future financial performance and liquidity of the issuer and any collateral underlying the security inorder to assess the probability of receiving all contractual principal and interest payments on the security.
Changes to estimates and assumptions DNB makes in preparing its financial statements could adversely affectits operating results, reported assets and liabilities, financial condition and capital levels. — The preparation ofDNB’s financial statements requires management to make certain critical accounting estimates andassumptions that could affect DNB’s reported amounts of assets and liabilities and income and expenseduring the reporting periods. Changes to those estimates or assumptions could materially affect itsoperating results, reported assets and liabilities, financial condition and capital levels.
If DNB lost a significant portion of its low-cost deposits, it would negatively impact its liquidity andprofitability. — DNB’s profitability depends in part on DNB’s success in attracting and retaining a stablebase of low-cost deposits. The competition for these deposits in DNB’s markets is strong and customersare increasingly seeking investments that are safe, including the purchase of U.S. Treasury securities andother government-guaranteed obligations, as well as the establishment of accounts at the largest, most-wellcapitalized banks. If DNB were to lose a significant portion of its low-cost deposits, it would negativelyimpact its liquidity and profitability.
Changes in accounting standards and policies can be difficult to predict and can materially affect how DNBrecords and reports its financial results. — DNB’s accounting policies and methods are fundamental to howDNB records and reports its financial condition and results of operations. The regulatory bodies thatestablish accounting standards, including, among others, the Financial Accounting, or FASB, and the SEC,periodically revise or issue new financial accounting and reporting standards that govern the preparation ofits financial statements. These changes, and the effects of these changes, can be difficult to predict and canmaterially impact how DNB records and reports its financial condition and results of operations. DNBcould be required to apply new or revised guidance retrospectively, which may result in the revision ofprior period financial statements by material amounts. The implementation of new or revised accountingguidance could have a material adverse effect on its reported financial results.
In addition, DNB must exercise judgment in appropriately applying many of its accounting policiesand methods so they comply with generally accepted accounting principles. In some cases, DNB may haveto select a particular accounting policy or method from two or more alternatives. In some cases, theaccounting policy or method chosen might be reasonable under the circumstances and yet might result inits reporting materially different amounts than would have been reported if DNB had selected a differentpolicy or method. Accounting policies are critical to fairly presenting DNB’s financial condition and resultsof operations and may require us to make difficult, subjective or complex judgments about matters that areuncertain.
If DNB fails to maintain an effective system of internal controls, its business could be adversely affected. —DNB is dependent upon maintaining an effective system of internal controls to provide reasonable
assurance that transactions and activities are conducted in accordance with established policies andprocedures and are all captured and reported in the financial statements. Any system of internal controls,however well designed and operated, is based in part on certain assumptions and expectations of employeeconduct and can only provide reasonable, not absolute, assurance that the objectives of the system are met.Any failure to maintain an effective system of internal controls, any failure to adhere to those internalcontrols, or any circumvention of DNB’s controls could have a material adverse effect on its operations,net income, financial condition, reputation and compliance with laws and regulations. Any failure to
18
maintain an effective internal control environment could impact our ability to report our financial resultson an accurate and timely basis, which could result in regulatory actions, loss of investor confidence, andan adverse impact on our business operations and stock price.
Technological systems failures, interruptions and security breaches could negatively impact DNB’soperations. — Communications and information systems are essential to the conduct of DNB’s business, asDNB uses such systems to manage its customer relationships, its general ledger, its deposits, and its loans.While DNB has established policies and procedures to prevent or limit the impact of systems failures,interruptions, and security breaches, DNB cannot assure you that such events will not occur or that theywill be adequately addressed if they do occur. In addition, any compromise of DNB’s security systemscould deter customers from using DNB’s website and DNB’s online banking service, which involve thetransmission of confidential information. Although DNB relies on commonly-used security and processingsystems to provide the security and authentication necessary to effect the secure transmission of data, theseprecautions may not protect its systems from compromises or breaches of security. In addition, DNBoutsources certain of its data processing to third-party providers. If DNB’s third-party providers encounterdifficulties, or if DNB has difficulty in communicating with them, DNB’s ability to adequately process andaccount for customer transactions could be affected, and DNB’s business operations could be adverselyimpacted. Threats to information security also exist in the processing of customer information throughvarious other vendors and their personnel. The occurrence of any systems failure, interruption, or breachof security could damage DNB’s reputation and result in a loss of customers and business, could subject usto additional regulatory scrutiny, or could expose us to civil litigation and possible financial liability. Any ofthese occurrences could have a material adverse effect on DNB’s financial condition and results ofoperations.
Additionally, financial products and services have become increasingly technology-driven. DNB’sability to meet the needs of its customers competitively, and in a cost-efficient manner, is dependent onDNB’s ability to keep pace with technological advances and to invest in new technology as it becomesavailable. Many of DNB’s competitors have greater resources to invest in technology than DNB does andmay be better equipped to market new technology-driven products and services. If DNB fails to keep pacewith technological change, it could have a material adverse impact on DNB’s business.
Loss of, or failure to adequately safeguard, confidential or proprietary information may adversely affect DNB’soperations, financial performance or reputation. — DNB regularly collects, processes, transmits and storessignificant amounts of confidential information regarding its customers, employees and others. Thisinformation is necessary for DNB to conduct its business activities, including the ongoing maintenance ofdeposit, loan, investment management and other account relationships for DNB’s customers, and receivinginstructions and completing transactions for DNB’s customers and other users of DNB’s products andservices. In addition, DNB compiles, processes, transmits and stores proprietary, non-public informationconcerning its business, operations, plans and strategies. In some cases, this confidential or proprietaryinformation is collected, compiled, processed, transmitted or stored by third parties on DNB’s behalf.Information security risks have generally increased in recent years because of the proliferation of newtechnologies and the increased sophistication and activities of perpetrators of cyber-attacks. A failure in orbreach of DNB’s operational or information security systems, or those of DNB’s service providers, as aresult of cyber-attacks, information security breaches or otherwise could adversely affect its business, resultin the disclosure or misuse of confidential or proprietary information, damage DNB’s reputation, increaseDNB’s costs and/or cause losses. If this confidential or proprietary information were to be mishandled,misused, improperly disclosed or lost, DNB could be exposed to significant regulatory consequences,reputational damage, civil litigation and financial loss. Although DNB employs a variety of safeguards toprotect this confidential and proprietary information from mishandling, misuse, improper disclosure orloss, DNB cannot assure you that these safeguards will be effective in every instance, or that if mishandling,misuse, improper disclosure or loss of the information did occur, those events would be promptly detectedand addressed. Additionally, as information security risks and cyber threats continue to evolve, DNB may
19

be required to expend additional resources to continue to enhance its information security measuresand/or to investigate and remediate any information security vulnerabilities.
Employee errors or misconduct could subject us to financial losses or regulatory sanctions and seriously harmDNB’s reputation. — Errors or misconduct by DNB’s employees could adversely impact DNB’s business.Employee misconduct could include hiding unauthorized activities from us, improper or unauthorizedactivities on behalf of customers or improper use of confidential information. It is not always possible toprevent employee errors and misconduct, and the precautions DNB takes to prevent and detect thisactivity may not be effective in all cases. Employee errors could also subject us to financial claims fornegligence. Although DNB maintains a system of internal controls and insurance coverage to mitigateoperational risks, including employee errors and customer or employee fraud, should those internalcontrols fail to prevent or detect errors or improper actions, or if any resulting loss is not insured orexceeds applicable insurance limits, DNB’s business and reputation could be adversely affected.
Environmental risks associated with DNB’s lending activities could adversely affect its financial condition andresults of operations. — A significant portion of DNB’s loan portfolio is secured by real property. In thecourse of its business, DNB may own or foreclose on and take title to real estate, which could result inDNB’s being subject to environmental liabilities with respect to these properties. DNB may becomeresponsible to a governmental agency or third parties for property damage, personal injury, investigationand clean-up costs incurred by those parties in connection with environmental contamination, or DNB maybe required to investigate or clean-up hazardous or toxic substances, or chemical releases at a property.The costs associated with environmental investigation or remediation activities could be substantial. IfDNB were to become subject to significant environmental liabilities, it could have a material adverse effecton DNB’s financial condition and results of operations.
Severe weather, natural disasters, acts of war or terrorism and other external events could adversely affectDNB’s business. — A variety of events over which DNB has no control, including severe weather, naturaldisasters, acts of war or terrorism and others could have a significant adverse effect on its business. Eventssuch as these could affect the stability of its deposit base, impair the ability of borrowers to repayoutstanding loans, impair the value of collateral securing loans, cause significant damage to propertiesfunded by DNB’s loans, result in loss of revenue and/or cause us to incur additional expenses.
Potential additional acquisitions in the future may disrupt DNB’s business and dilute shareholder value. —DNB may pursue additional acquisitions of other financial institutions in the future as part of its growth
strategy. As a result, DNB may engage in negotiations or discussions that, if they were to result in atransaction, could have a material effect on its business, operating results and financial condition. In anyacquisition, DNB may pay for the acquisition through the payment of cash, the issuance of its commonstock or other securities, or a combination thereof. Depending on the size of the acquisition, the amountDNB pays may be material. Using cash in connection with any acquisition could materially affect DNB’scash resources or require us to incur indebtedness. Using shares of common stock as payment could dilutethe ownership interest of current shareholders. In addition, the required accounting treatment for certainacquisitions could result in us having to recognize a charge against earnings, which could materially andadversely affect DNB’s results of operations during the period in which the charge is recognized. Inaddition, if goodwill recorded in connection with our prior or potential future acquisitions weredetermined to be impaired, then we would be required to recognize a charge against our earnings, whichcould materially and adversely affect our results of operations during the period in which the impairmentwas recognized. Any potential charges for impairment related to goodwill would not directly impact cashflow or tangible capital.
20
Acquisition activities generally involve a number of additional risks and potential effects on us andDNB’s business, including:
• the time and expense associated with identifying and evaluating potential acquisitions andnegotiating potential transactions, including the diversion of management resources from theoperation of DNB’s existing business;
• the time and expense necessary to integrate the operations and personnel of the acquired company;and
• difficulties relating to the conversion of operational, financial, accounting and customer data of theacquired company onto its systems.
DNB may not be successful in addressing the risks and inherent challenges in completing acquisitions.DNB may lose key employees, experience disruption of DNB’s business and customer relationships, incurunexpected costs and face a variety of other unanticipated challenges, any of which could result in notachieving the anticipated benefits of an acquisition. If DNB is not able to successfully identify and addressthe risks and challenges associated with acquisitions, its business may be harmed and its financial positionand results of operations could be materially and adversely affected.
Attractive acquisition opportunities may not be available to us in the future, which could limit the growth ofDNB’s business. — DNB’s future growth may depend, in part, on its ability to expand its business throughadditional acquisitions of other financial institutions in the future. DNB expects that other banking andfinancial service companies, many of which have significantly greater resources than us, will compete withus in seeking to complete such acquisitions. This could decrease out chances of growing throughacquisitions and increase prices for potential acquisition opportunities that DNB believes are attractive.Also, DNB’s acquisitions are subject to various regulatory approvals. If DNB fails to receive theappropriate regulatory approvals for a proposed acquisition, DNB will not be able to complete atransaction which DNB believes to be in its best interests. DNB’s regulators consider its capital, liquidity,profitability, regulatory compliance and levels of goodwill and intangibles, among other factors, whenconsidering DNB’s acquisition and expansion proposals. If DNB is unable to pursue and completeacquisitions, its ability to grow its business could be adversely affected.
DNB operates in a highly regulated environment, and the laws and regulations that govern its operations,changes in those laws and regulations, or its failure to comply with applicable laws and regulations, could materiallyand adversely affect us. — DNB is subject to extensive regulation, supervision, and legislation that governalmost all aspects of its operations. These are intended to protect customers, depositors and the FDIC’sDeposit Insurance Fund and not shareholders. Among other things, these laws and regulations prescribeminimum capital requirements, impose limitations on its business activities, limit the dividends ordistributions that DNB can pay, restrict the ability of DNB First to engage in transactions with DNB, andimpose certain specific accounting requirements on us that may be more restrictive and may result ingreater or earlier charges to earnings or reductions in its capital than GAAP. Compliance with laws andregulations can be difficult and costly, and changes to laws and regulations often impose additionalcompliance costs, and may make certain business practices or products impermissible or uneconomic.DNB’s failure to comply with these laws and regulations, even if the failure follows good faith effort orreflects a difference in interpretation, could subject us to restrictions on its business activities, reputationalharm, fines and other penalties, any of which could materially and adversely affect us. Further, any newlaws, rules and regulations could make compliance more difficult or expensive and also materially andadversely affect us.
Our business, financial condition, results of operations and future prospects could be adversely affected by thehighly regulated environment in which we operate. — As a bank holding company, we are subject to federalsupervision and regulation. Federal regulation of the banking industry, along with tax and accounting laws,regulations, rules and standards, may limit our operations significantly and control the methods by which
21

we conduct business, just as they limit those of other banking organizations. In addition, compliance withlaws and regulations can be difficult and costly, and changes to laws and regulations can impose additionalcompliance costs. The Dodd-Frank Wall Street Reform and Consumer Protection Act (the ‘‘Dodd-FrankAct’’), which imposes significant regulatory and compliance changes on financial institutions, is an exampleof this type of federal regulation. Many of these regulations are intended to protect depositors, customers,the public, the banking system as a whole, or the FDIC insurance funds, not stockholders. Regulatoryrequirements and discretion affect our lending practices, capital structure, investment practices, dividendpolicy and many other aspects of our business. There are laws and regulations which restrict transactionsbetween us and our subsidiaries. These requirements may constrain our operations, and the adoption ofnew laws and changes to or repeal of existing laws may have a further impact on our business, financialcondition, results of operations and future prospects. Also, the burden imposed by those federal and stateregulations may place banks in general, including our Bank in particular, at a competitive disadvantagecompared to their non-banking competitors. We are also subject to requirements with respect to theconfidentiality of information obtained from clients concerning their identities, business and personalfinancial information, employment, and other matters. We require our personnel to agree to keep all suchinformation confidential and we monitor compliance. Failure to comply with confidentiality requirementscould result in material liability and adversely affect our business, financial condition, results of operationsand future prospects.
Bank holding companies and financial institutions are extensively regulated and currently face anuncertain regulatory environment. Applicable laws, regulations, interpretations, enforcement policies andaccounting principles have been subject to significant changes in recent years, and may be subject tosignificant future changes. Future changes may have a material adverse effect on our business, financialcondition and results of operations.
Federal and state regulatory agencies may adopt changes to their regulations or change the manner inwhich existing regulations are applied. We cannot predict the substance or effect of pending or futurelegislation or regulation or the application of laws and regulations to DNB. Compliance with current andpotential regulation, as well as regulatory scrutiny, may significantly increase our costs, impede theefficiency of our internal business processes, require us to increase our regulatory capital, and limit ourability to pursue business opportunities in an efficient manner by requiring us to expend significant time,effort and resources to ensure compliance and respond to any regulatory inquiries or investigations. Inaddition, press coverage and other public statements that assert some form of wrongdoing by financialservices companies (including press coverage and public statements that do not involve us) may result inregulatory inquiries or investigations, which, independent of the outcome, may be time-consuming andexpensive and may divert time, effort and resources from our business. Evolving regulations and guidanceconcerning executive compensation may also impose limitations on us that affect our ability to competesuccessfully for executive and management talent.
In addition, given the current economic and financial environment, regulators may elect to alterstandards or the interpretation of the standards used to measure regulatory compliance or to determinethe adequacy of liquidity, certain risk management or other operational practices for financial servicescompanies in a manner that impacts our ability to implement our strategy and could affect us in substantialand unpredictable ways, and could have a material adverse effect on our business, financial condition andresults of operations. Furthermore, the regulatory agencies have extremely broad direction in theirinterpretation of the regulations and laws and their interpretation of the quality of our loan portfolio,securities portfolio and other assets. If any regulatory agency’s assessment of the quality of our assets,operations, lending practices, investment practices, capital structure or other assets of our business differsfrom our assessment, we may be required to take additional charges or undertake or refrain from takingactions that would have the effect of materially reducing our earning, capital ratios and share price.
22
New capital rules that were recently issued generally require insured depository institutions and certain holdingcompanies to hold more capital. The impact of the new rules on DNB’s financial condition and operations isuncertain. — In July 2013, U.S. federal bank regulatory agencies issued final rules that substantially amendedthe regulatory risk-based capital rules applicable to DNB and DNB First. The new rules revise, amongother things, risk-based capital requirements and the method for calculating risk weighted assets to makethose standards consistent with agreements that were reached by Basel III and certain provisions of theDodd-Frank Act. Certain requirements of the rule began to phase in on January 1, 2015 and therequirements of the rule were fully implemented as of January 1, 2019. The new rules include certain newand higher risk-based capital and leverage requirements than those currently in place. In addition, in orderto avoid restrictions on capital distributions (including dividends) or discretionary bonus payments toexecutives, a covered banking organization must maintain a ‘‘capital conservation buffer’’ on top of itsminimum risk-based capital requirements. Furthermore, in the current economic and regulatoryenvironment, bank regulators may impose capital requirements that are more stringent than thoserequired by applicable existing regulations. The application of more stringent capital requirements for uscould, among other things, result in lower returns on equity, require the raising of additional capital, andresult in regulatory actions if DNB were to be unable to comply with such requirements. Implementationof changes to asset risk weightings for risk based capital calculations, items included or deducted incalculating regulatory capital or additional capital conservation buffers, could result in modifications to itsbusiness strategy and could limit its ability to make distributions, including paying dividends orrepurchasing its shares. In December 2017, the Basel Committee on Banking Supervision publishedstandards that it described as the finalization of the Basel III regulatory framework (commonly referred toas Basel IV). Among other things, these standards revise the Basel Committee’s standardized approach forcredit risk and provide a new standardized approach for operational risk capital. Under the Baselframework, these standards will generally be effective on January 1, 2022, with an aggregate output floorphasing in through January 1, 2027. Under the current U.S. capital rules, operational risk capitalrequirements and a capital floor apply only to advanced approaches institutions, and not to DNB or theBank. The impact of Basel IV on us will depend on the manner in which it is implemented by the federalbank regulators.
The FDIC’s restoration plan and the related increased assessment rate could materially and adversely affectus. — The FDIC insures deposits at FDIC-insured depository institutions, including DNB First, up toapplicable limits. The amount of a particular institution’s deposit insurance assessment is based on thatinstitution’s risk classification under an FDIC risk-based assessment system. An institution’s riskclassification is assigned based on certain factors, including capital levels and the level of supervisoryconcern regulators believe the institution poses. Market developments have significantly depleted theFDIC Deposit Insurance Fund, or DIF, and reduced the ratio of reserves to insured deposits. As a result ofrecent economic conditions and the enactment of the Dodd-Frank Act, the FDIC has increased the depositinsurance assessment rates and thus raised deposit insurance premiums for insured depository institutions.If these increases are insufficient for the DIF to meet its funding requirements, there may need to befurther special assessments or increases in deposit insurance premiums. DNB is generally unable to controlthe amount of premiums that DNB is required to pay for FDIC insurance. If there are additional bank orfinancial institution failures, DNB may be required to pay even higher FDIC premiums than the recentlyincreased levels. Any future additional assessments, increases or required prepayments in FDIC insurancepremiums may materially and adversely affect us, including by reducing DNB’s profitability or limiting itsability to pursue certain business opportunities.
The Consumer Financial Protection Bureau may reshape consumer financial laws through rulemaking andenforcement of unfair, deceptive or abusive practices, which may directly impact DNB’s business practices relatingto consumer financial products or services. — The Consumer Financial Protection Bureau, or CFPB, has broadrulemaking authority to administer and carry out the purposes and objectives of the ‘‘Federal consumerfinancial laws, and to prevent evasions thereof,’’ with respect to all financial institutions that offer financialproducts and services to consumers. The CFPB is also authorized to prescribe rules applicable to any
23
covered person or service provider identifying and prohibiting acts or practices that are ‘‘unfair, deceptive,or abusive’’ in connection with any transaction with a consumer for a consumer financial product orservice, or the offering of a consumer financial product or service (‘‘UDAP authority’’). The potentialreach of the CFPB’s broad new rulemaking powers and UDAP authority on the operations of financialinstitutions offering consumer financial products or services, including us, is currently unknown.
DNB First is subject to federal and state and fair lending laws and failure to comply with these laws could leadto material penalties. — Federal and state fair lending laws and regulations, such as the Equal CreditOpportunity Act and the Fair Housing Act, impose nondiscriminatory lending requirements on financialinstitutions. The Department of Justice, CFPB, and other federal and state agencies are responsible forenforcing these laws and regulations. Private parties may also have the ability to challenge an institution’sperformance under fair lending laws in private class action litigation. A successful challenge to DNB First’sperformance under the fair lending laws and regulations could adversely impact DNB First’s rating underthe Community Reinvestment Act and result in a wide variety of sanctions, including the required paymentof damages and civil money penalties, injunctive relief, imposition of restrictions on merger and acquisitionactivity and restrictions on expansion activity, which could negatively impact DNB’s reputation, business,financial condition and results of operations.
DNB faces a risk of noncompliance and enforcement action with the Bank Secrecy Act and other anti-moneylaundering statutes and regulations. — The Bank Secrecy Act, the Uniting and Strengthening America byProviding Appropriate Tools Required to Intercept and Obstruct Terrorism Act of 2001 (the ‘‘PATRIOTAct’’) and other laws and regulations require financial institutions, including us, to institute and maintainan effective anti-money laundering program and file suspicious activity and currency transaction reports asappropriate. The federal Financial Crimes Enforcement Network, established by the Treasury Departmentto administer the Bank Secrecy Act, is authorized to impose significant civil money penalties for violationsof those requirements, and has recently engaged in coordinated enforcement efforts with the individualfederal banking regulators, as well as the Justice Department, Drug Enforcement Administration andInternal Revenue Service. There is also increased scrutiny of compliance with the rules enforced by theOffice of Foreign Assets Control (the ‘‘OFAC’’). If its policies, procedures and systems are deemeddeficient, DNB would be subject to liability, including fines and regulatory actions, including possiblerestrictions on DNB’s ability to pay dividends and the necessity to obtain regulatory approvals to proceedwith certain aspects of its business plan, which could materially and adversely affect us. Failure to maintainand implement adequate programs to combat money laundering and terrorist financing could also haveserious reputational consequences for us.
DNB’s share price may change for a variety of reasons, some of which are beyond DNB’s control. — DNB’sshare price can fluctuate in response to a variety of factors, some of which are not under DNB’s control.These factors could cause the share price to decrease regardless of DNB’s operating results. These factorsinclude:
• DNB’s financial condition, performance, creditworthiness and prospects;
• DNB’s past and future dividend practice;
• operating results that vary from the expectations of management, securities analysts and investors;
• quarterly variations in DNB’s operating results or in the quality of DNB’s assets;
• operating results and securities price performance of companies that investors believe arecomparable to us;
• the credit, mortgage and housing markets, the markets for securities relating to mortgages orhousing, and developments with respect to financial institutions generally;
• future sales of DNB’s equity or equity-related securities;
24

• changes in global financial markets and global economies and general market conditions, such asinterest or foreign exchange rates, stock, commodity or real estate valuations or volatility and othergeopolitical, regulatory or judicial events; and
• ineffective internal controls over financial reporting
In addition, DNB’s share price can be affected by the level of trading in its common stock. The tradingvolume for the common stock has historically been less than that of larger financial services companies. Inlight of the relatively low trading volume, significant sales of its common stock in the public market, or theperception that those sales may occur, could cause the trading price of the common stock to decline or tobe lower than it otherwise might be in the absence of those sales or perceptions.
DNB may sell additional shares of its common stock or other securities that are convertible into orexchangeable for its common stock, which may adversely affect the market price of DNB’s common stock. — DNBis not restricted from issuing additional shares of common stock or other securities, including securitiesthat may be convertible into or exchangeable for shares of its common stock. Some of these securities mayhave distribution rights in connection with liquidation or other rights, including dividend and voting rights,senior to the rights of DNB’s common stock. The future issuance of shares of common stock or othersecurities could have a dilutive effect on the holders of DNB’s common stock. Additionally, the marketvalue of DNB’s common stock could decline as a result of sales by us of a large number of shares ofcommon stock or other securities or the perception that such sales could occur.
Provisions in DNB’s articles of incorporation and bylaws may inhibit a takeover of us, which could discouragetransactions that would otherwise be in the best interests of DNB’s shareholders and could entrenchmanagement. — Provisions of DNB’s amended and restated articles of incorporation and amended andrestated bylaws, and applicable provisions of Pennsylvania law may delay, inhibit or prevent someone fromgaining control of its business through a tender offer, business combination, proxy contest or some othermethod even though some shareholders might believe a change in control is desirable.
DNB relies on dividends from DNB First for most of DNB’s revenue. — DNB is a bank holding companyand its operations are conducted by DNB’s subsidiaries from which DNB receives dividends. The ability ofDNB’s subsidiaries to pay dividends is subject to legal and regulatory limitations, profitability, financialcondition, capital expenditures and other cash flow requirements. The ability of DNB First to pay cashdividends to DNB is limited by its obligation to maintain sufficient capital and by other restrictions on itscash dividends that are applicable to banks. If DNB First is not permitted to pay cash dividends to DNB, itis unlikely that DNB would be able to pay cash dividends on its common stock.
Goodwill Impairment may adversely impact our results of operations. — Impairment of goodwill or otherintangible assets could require charges to earnings, which could result in a negative impact on our resultsof operations. Under current accounting standards, goodwill and certain other intangible assets withindeterminate lives are no longer amortized but, instead, are evaluated for impairment periodically orwhen impairment indicators are present. Evaluation of goodwill and such other intangible assets couldresult in circumstances where the applicable intangible asset is deemed to be impaired for accountingpurposes. Under such circumstances, the intangible asset’s impairment would be reflected as a charge toearnings in the period during which such impairment is identified. Management reviewed the requirementsof the qualitative assessments listed in ASC 350-20-35-3C, and resultantly identified nine qualitativeassessments that are relevant to the general banking industry and specifically to DNB. These qualitativeassessments were intended to isolate change factors which would contribute to the increased risk ofimpairment of goodwill. The qualitative factors were then used to compare base year levels with currentlevels to identify potential change factors which could contribute to the increased risk of impairment ofgoodwill. Based on the results of this analysis, it is more likely than not that the fair value of reporting unitas of the date of this report is higher than its book value and, therefore, goodwill is considered notimpaired and no further testing is required pursuant to ASC Topic 350-20.
25
There is no assurance that we will be successful in overcoming these risks or any other problemsencountered in connection with pending or potential acquisitions. Our inability to overcome these riskscould have an adverse effect on our levels of reported net income, ROE and ROA, and our ability toachieve our business strategy and maintain our market value.
Uncertainty about the future of the London Interbank Offer Rate (LIBOR) may adversely affect our businessand financial results. — LIBOR meaningfully influences market interest rates around the globe. In July 2017,the Chief Executive of the United Kingdom Financial Conduct Authority, which regulates LIBOR,announced its intent to stop persuading or compelling banks to submit rates for the calculation of LIBORto the administrator of LIBOR after 2021. This announcement indicates that the continuation of LIBORas currently constructed is not guaranteed after 2021. It is impossible to predict whether and to what extentbanks will continue to provide LIBOR submissions to the administrator of LIBOR, whether any additionalreforms to LIBOR may be enacted in the United Kingdom or elsewhere, and whether other rate or ratesmay become accepted alternatives to LIBOR.
In 2014, the FRB and the Federal Reserve Bank of New York convened the Alternative ReferenceRates Committee (ARRC) to identify best practices for alternative reference rates, identify best practicesfor contract robustness, develop an adoption plan, and create an implementation plan with metrics ofsuccess and a timeline. The ARRC accomplished its first set of objectives and has identified the SecuredOvernight Financing Rate (SOFR) as the rate that represents best practice for use in certain new U.S.dollar derivatives and other financial contracts. The ARRC also published its Paced Transition Plan, withspecific steps and timelines designed to encourage adoption of the SOFR. The ARRC was reconstituted in2018 to help to ensure the successful implementation of the Paced Transition Plan and serve as a forum tocoordinate and track planning across cash and derivatives products and market participants currently usingLIBOR.
No assurance can be provided that the uncertainties around LIBOR or their resolution will notadversely affect the use, level, and volatility of LIBOR or other interest rates or the value of LIBOR-basedsecurities or other securities or financial arrangements. Further, the viability of SOFR as an alternativereference rate and the availability and acceptance of other alternative reference rates are unclear and alsomay have adverse effects on market rates of interest and the value of securities and other financialarrangements. These uncertainties, proposals and actions to resolve them, and their ultimate resolutionalso could negatively impact our funding costs, loan and other asset values, asset-liability managementstrategies, and other aspects of our business and financial results.
Item 1B. Unresolved Staff Comments
None.
26

Item 2. Properties
As of December 31, 2018, DNB owns or leases 15 full-service branch locations, two of whichadditionally serve as other administrative offices. The following tables detail DNB’s properties as ofDecember 31, 2018:
Banking Office Office Location Owned/Leased
Boothwyn 3915 Chichester Avenue, Boothwyn, PA 19061 OwnedCaln 1835 East Lincoln Highway, Coatesville, PA 19320 OwnedChadds Ford 300 Oakland Road, West Chester, PA 19382 LeasedDowningtown 4 Brandywine Avenue, Downingtown, PA 19335 OwnedEast End 701 East Lancaster Avenue, Downingtown, PA 19335 OwnedEast Falls 4341 Ridge Avenue, Philadelphia, PA 19129 LeasedExton* 410 Exton Square Parkway, Exton, PA 19341 LeasedKennett Square 215 East Cypress Street, Kennett Square, PA 19348 OwnedLionville 891 Pottstown Pike, Exton, PA 19341 OwnedLittle Washington 104 Culbertson Run Road, Downingtown, PA 19335 OwnedLudwig’s Corner 1030 North Pottstown Pike, Chester Springs, PA 19425 OwnedOld City 36 North 3rd Street, Philadelphia, PA 19106 LeasedRoxborough 6137 Ridge Avenue, Philadelphia, PA 19128 LeasedWest Chester* 124 West Market Street, West Chester, PA 19380 LeasedWest Goshen 1115 West Chester Pike, West Chester, PA 19380 Leased
Other Administrative OfficesDowningtown 4 Brandywine Avenue, Downingtown, PA 19335 OwnedDowningtown 104 Brandywine Avenue, Downingtown, PA 19335 LeasedWest Chester 124 West Market Street, West Chester, PA 19380 Leased
* Wealth Management Office
Item 3. Legal Proceedings
Neither the Corporation nor any of its subsidiaries is a party to, nor is any of their property the subjectof, any material pending legal proceedings other than ordinary routine litigation incidental to theirbusiness.
Item 4. Mine Safety Disclosures
Not Applicable.
27
Part II
Item 5. Market for Registrant’s Common Equity, Related Stockholder Matters and IssuerPurchases of Equity Securities
(a) Market Price of and Dividends on Registrant’s Common Equity
DNB Financial Corporation’s common stock, par value $1.00 per share, is listed for trading onNASDAQ’s Capital Market under the symbol DNBF. Current price information is available from accountexecutives at most brokerage firms as well as the firms listed at the back of this report who are marketmakers of DNB’s common stock. There were approximately 550 holders of record who owned 4.3 millionshares of common stock outstanding at March 12, 2019. The information required with respect to securitiesauthorized for issuance under DNB’s equity compensation plans is set forth in ‘‘Item 12 — SecurityOwnership of Certain Beneficial Owners and Management and Related Stockholder Matters’’, andincorporated herein by reference.
(b) Recent Sales of Unregistered Securities
None.
(c) Purchases of Equity Securities by DNB and Affiliated Purchasers
The following table provides information on repurchases by or on behalf of DNB or any ‘‘affiliatedpurchaser’’ (as defined in Regulation 10b-18(a) (3)) of its common stock in each month of the quarterended December 31, 2018.
Total Number of Maximum NumberShares Purchased of Shares that May
Total Number Average as Part of Publicly Yet Be PurchasedOf Shares Price Paid Announced Plans Under the Plans or
Period Purchased Per Share or Programs Programs
October 1, 2018 – October 31, 2018 — $— — 63,016November 1, 2018 – November 30, 2018 — — — 63,016December 1, 2018 – December 31, 2018 — — — 63,016
Total — $— — 63,016
On July 25, 2001, DNB authorized the buyback of up to 175,000 shares of its common stock over anindefinite period. On August 27, 2004, DNB increased the buyback from 175,000 to 325,000 shares of itscommon stock over an indefinite period.
28
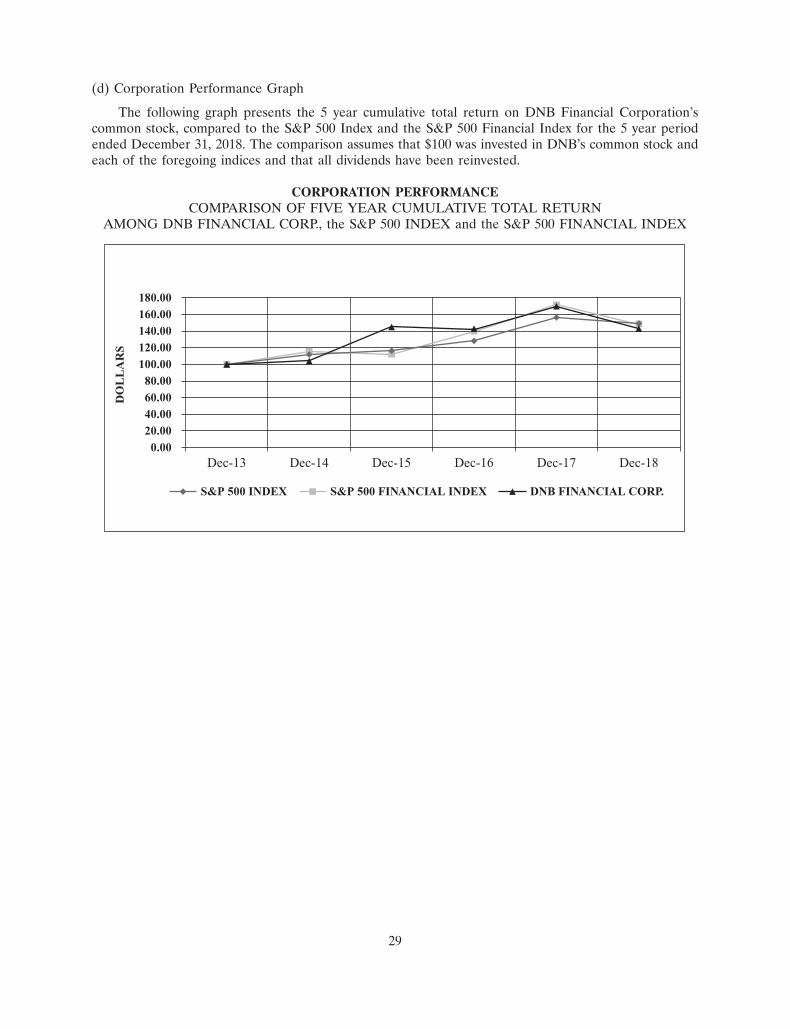
10MAR201912203327
(d) Corporation Performance Graph
The following graph presents the 5 year cumulative total return on DNB Financial Corporation’scommon stock, compared to the S&P 500 Index and the S&P 500 Financial Index for the 5 year periodended December 31, 2018. The comparison assumes that $100 was invested in DNB’s common stock andeach of the foregoing indices and that all dividends have been reinvested.
CORPORATION PERFORMANCECOMPARISON OF FIVE YEAR CUMULATIVE TOTAL RETURN
AMONG DNB FINANCIAL CORP., the S&P 500 INDEX and the S&P 500 FINANCIAL INDEX
180.00160.00140.00120.00100.0080.0060.0040.0020.000.00
Dec-13
DO
LL
AR
S
Dec-14 Dec-15 Dec-16 Dec-17 Dec-18
DNB FINANCIAL CORP.S&P 500 FINANCIAL INDEXS&P 500 INDEX
29

Item 6. Selected Financial Data
The selected financial data set forth below is derived in part from, and should be read in conjunctionwith, the Consolidated Financial Statements and Notes thereto, contained elsewhere herein.
At or For the Year Ended December 31(Dollars in thousands, except share data)
2018 2017 2016 2015 2014
RESULTS OF OPERATIONSInterest income $ 46,175 $ 43,385 $ 29,179 $ 24,478 $ 23,596Interest expense 9,371 5,720 3,324 2,712 2,311
Net interest income 36,804 37,665 25,855 21,766 21,285
Provision for credit losses 1,200 1,660 730 1,105 1,130
Non-interest income 5,245 5,418 6,364 5,009 4,958
Non-interest expense 27,875 28,021 24,641 19,029 18,632
Income before income taxes 12,974 13,402 6,848 6,641 6,481
Income tax expense 2,290 5,456 1,869 1,503 1,677
Net income $ 10,684 $ 7,946 $ 4,979 $ 5,138 $ 4,804
Preferred stock dividends & accretion of discount — — — 50 135
Net income available to common stockholders $ 10,684 $ 7,946 $ 4,979 $ 5,088 $ 4,669
PER SHARE DATABasic earnings $ 2.48 $ 1.87 $ 1.56 $ 1.82 $ 1.69Diluted earnings 2.48 1.85 1.55 1.79 1.66Cash dividends 0.28 0.28 0.28 0.28 0.28Book value 25.88 23.78 22.36 19.65 18.33Tangible book value (Non-GAAP) 22.21 20.06 18.56 19.58 18.26Average common shares outstanding 4,303,410 4,260,137 3,186,079 2,801,881 2,766,723Average diluted common shares outstanding 4,315,324 4,290,070 3,218,884 2,847,488 2,812,726
PERFORMANCE RATIOSReturn on average assets 0.96% 0.74% 0.59% 0.69% 0.71%Return on average stockholders’ equity 10.02 7.93 7.40 8.72 7.78Return on average tangible equity (Non-GAAP) 11.78 9.44 9.74 8.73 7.79Net interest margin (tax equivalent, Non-GAAP) 3.45 3.73 3.31 3.16 3.36Efficiency ratio 65.22 63.75 75.53 68.31 71.12Wtd average yield on earning assets 4.32 4.28 3.72 3.51 3.67
FINANCIAL CONDITIONTotal assets $1,158,235 $1,081,915 $1,070,685 $ 748,818 $ 723,330Total liabilities 1,046,389 979,973 975,845 693,330 659,422Total stockholders’ equity 111,846 101,942 94,840 55,488 63,908Loans, gross 934,971 845,897 817,529 481,758 455,603Allowance for credit losses 6,675 5,843 5,373 4,935 4,906Investment securities 158,669 174,173 182,206 220,208 231,656Goodwill 15,525 15,525 15,590 — —Intangible assets 343 435 537 66 82Deposits 984,566 861,203 885,187 606,275 605,083Borrowings 55,269 112,803 86,668 81,909 49,005
ASSET QUALITY RATIOSNet charge-offs to average loans 0.04% 0.15% 0.05% 0.23% 0.19%Non-performing loans/total loans 0.62 0.89 1.04 1.06 1.50Non-performing assets/total assets 0.94 1.16 1.05 1.02 1.07Allowance for credit loss/total loans 0.71 0.69 0.66 1.02 1.08Allowance for credit loss/non-performing loans 115.50 77.36 63.20 96.91 71.59
CAPITAL RATIOSTotal equity/total assets 9.66% 9.42% 8.86% 7.41% 8.84%Tangible equity/tangible assets (Non-GAAP) 8.40 8.07 7.46 7.40 8.82Tier 1 leverage 9.48 9.19 8.42 8.94 10.55Common equity tier 1 risk based capital 10.79 10.71 9.60 10.44 10.50Tier 1 risk based capital 11.77 11.80 10.67 12.08 14.90Total risk based capital 13.61 13.73 12.50 14.78 15.92
30
Item 7. Management’s Discussion and Analysis of Financial Condition and Results of Operations
I. Introductory Overview
DNB is a bank holding company whose bank subsidiary, the Bank, is a nationally charteredcommercial bank with trust powers, and a member of the FDIC. DNB provides a broad range of bankingservices to individual and corporate customers through its fifteen community offices located throughoutChester, Delaware, and Philadelphia Counties, Pennsylvania. DNB is a community banking organizationthat focuses its lending and other services on businesses and consumers in the local market area. DNBfunds all these activities with retail and business deposits and borrowings. Through its Wealth ManagementGroup, the Bank provides wealth management and trust services to individuals, businesses and non-profitorganizations. The Bank and its subsidiary, DNB Investments and Insurance, make available certainnon-depository products and services, such as securities brokerage, mutual funds, life insurance andannuities.
DNB earns revenues and generates cash flows by lending funds to commercial and consumercustomers in its marketplace. DNB generates its largest source of interest income through its lendingfunction. A secondary source of interest income is DNB’s investment portfolio, which provides liquidityand cash flows for future lending needs.
In addition to interest earned on loans and investments, DNB earns revenues from fees it chargescustomers for non-lending services. These services include wealth management and trust services;brokerage and investment services; cash management services; banking and ATM services; as well assafekeeping and other depository services.
To ensure we remain well positioned to meet the growing needs of our customers and communitiesand to meet the challenges of the 21st century, we’ve worked to build awareness of our full-servicecapabilities and ability to meet the needs of a wide range of customers. This served to not only retain ourexisting customer base, but to position ourselves as an attractive financial institution on which youngerindividuals and families can build their dreams. To that end, DNB continues to make appropriateinvestments in all areas of our business, including people, technology, facilities and marketing.
Non-GAAP Based Financial Measures
Our selected financial data contains non-GAAP financial measures calculated using non-GAAPamounts. These measures are tangible book value per common share and return on average tangibleequity. Tangible book value per share adjusts the numerator by the amount of Goodwill and OtherIntangible Assets (reduction of Shareholders’ Equity). Return on average tangible equity adjusts thedenominator by the amount of Goodwill and Other Intangible Assets (reduction of Shareholders’ Equity).Management uses non-GAAP measures to present historical periods comparable to the current periodpresentation. In addition, management believes the use of non-GAAP measures provides additional claritywhen assessing our financial results and use of equity. Disclosures of this type should not be viewed assubstitutes for results determined to be in accordance with U.S. GAAP, nor are they necessarilycomparable to non-GAAP performance measures that may be presented by other entities.
31
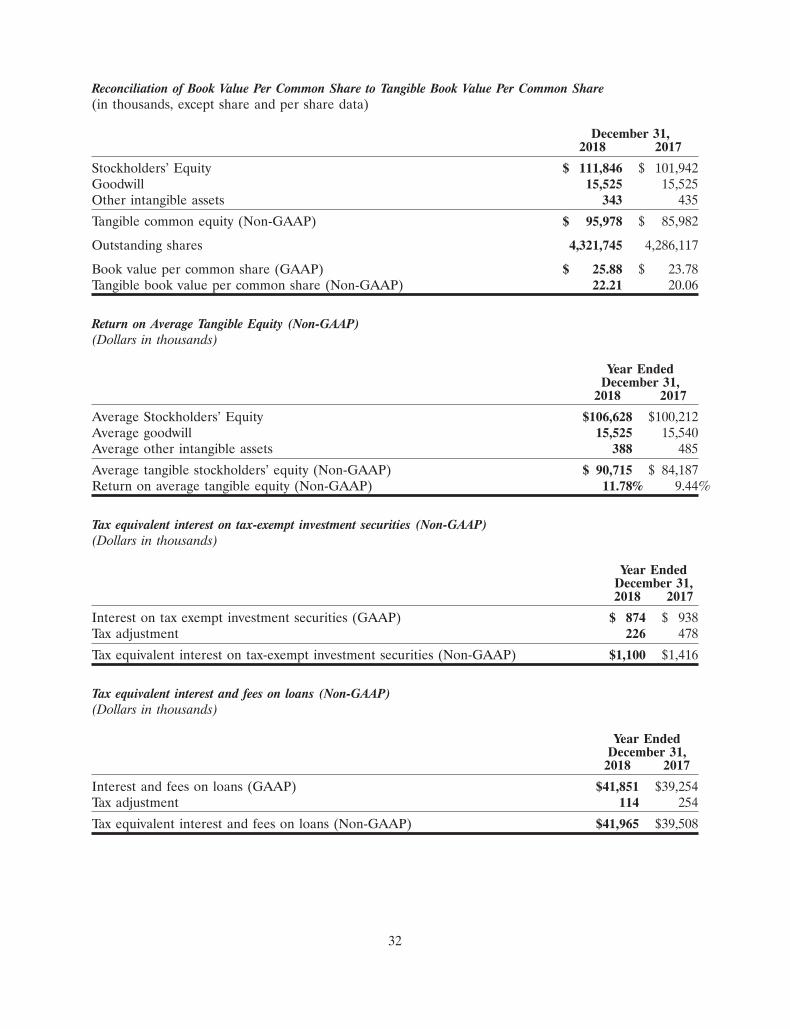
Reconciliation of Book Value Per Common Share to Tangible Book Value Per Common Share(in thousands, except share and per share data)
December 31,2018 2017
Stockholders’ Equity $ 111,846 $ 101,942Goodwill 15,525 15,525Other intangible assets 343 435
Tangible common equity (Non-GAAP) $ 95,978 $ 85,982
Outstanding shares 4,321,745 4,286,117
Book value per common share (GAAP) $ 25.88 $ 23.78Tangible book value per common share (Non-GAAP) 22.21 20.06
Return on Average Tangible Equity (Non-GAAP)(Dollars in thousands)
Year EndedDecember 31,
2018 2017
Average Stockholders’ Equity $106,628 $100,212Average goodwill 15,525 15,540Average other intangible assets 388 485
Average tangible stockholders’ equity (Non-GAAP) $ 90,715 $ 84,187Return on average tangible equity (Non-GAAP) 11.78% 9.44%
Tax equivalent interest on tax-exempt investment securities (Non-GAAP)(Dollars in thousands)
Year EndedDecember 31,2018 2017
Interest on tax exempt investment securities (GAAP) $ 874 $ 938Tax adjustment 226 478
Tax equivalent interest on tax-exempt investment securities (Non-GAAP) $1,100 $1,416
Tax equivalent interest and fees on loans (Non-GAAP)(Dollars in thousands)
Year EndedDecember 31,
2018 2017
Interest and fees on loans (GAAP) $41,851 $39,254Tax adjustment 114 254
Tax equivalent interest and fees on loans (Non-GAAP) $41,965 $39,508
32

Highlights of DNB’s results for the year-end December 31, 2018 include:
• For the year ending December 31, 2018, net income was $10.7 million, or $2.48 per diluted share,compared with $7.9 million, or $1.85 per diluted share, for the same period last year. Net income of$10.7 million for 2018, generated a return on average assets (‘‘ROAA’’), return on average equity(‘‘ROE’’) and return on average tangible equity (‘‘ROTE’’) (a non-GAAP measure) of 0.96%,10.02% and 11.78%, respectively. Full year 2017 results were impacted by a $1.8 million charge, or$0.43 per diluted share, to adjust deferred taxes due to the enactment of the Tax Cuts and Jobs Act(the ‘‘Tax Act’’) in December 2017.
• Asset quality remained strong as net charge-offs were 0.04% of total average loans for the yearending December 31, 2018. Total non-performing assets, including loans and other real estateproperty, were $10.8 million as of December 31, 2018, compared with $12.6 million as ofDecember 31, 2017. The ratio of non-performing loans to total loans was 0.62% as of December 31,2018, versus 0.89% as of December 31, 2017.
• Capital ratios continue to exceed all regulatory guidelines. As of December 31, 2018, the Tier 1leverage ratio was 9.48%, the Tier 1 risk-based capital ratio was 11.77%, the common equity Tier 1risk-based capital ratio was 10.79% and the total risk based capital ratio was 13.61%.
DNB is particularly exposed to downturns in the greater Philadelphia region as well as the global andU.S. economies. While certain economic conditions in the U.S. have shown improvement, high levels ofU.S. government debt, higher interest rates, as well as economic and political conditions in the globalmarkets may impact DNB’s borrowers negatively. Unfavorable general economic trends, reducedavailability of commercial credit and a sustained low Labor Force Participation rate, can negatively impactthe credit performance of both consumer and commercial credits, resulting in increased write-downs. Aworsening of these conditions, such as an economic slowdown or recession, would likely worsen theadverse effects of these difficult market conditions on DNB and other financial institutions.
In addition, DNB’s net interest margin has been impacted by these changes in the economy.Management has been aggressive in managing DNB’s cost of funds during the year by implementingcarefully planned pricing strategies, designed to offset the effects of a flattening yield curve, while matchingliquidity needs. Our composite cost of funds for 2018 was 1.12%, compared to 0.73% in 2017. DNB’s netinterest margin decreased to 3.45% in 2018 from 3.73% in 2017. The decreased net interest margin wasprimarily caused by the higher volume and higher cost of interest-bearing liabilities in 2018, over 2017.
II. Overview of Financial Condition — Major Changes and Trends
At December 31, 2018, DNB had consolidated assets of $1.2 billion and a Tier I/Leverage CapitalRatio of 9.48%. Loans comprise 83.7% of earning assets, while investments and overnight funds constitutethe remainder. Assets increased $76.3 million or 7.1% to $1.16 billion at December 31, 2018, compared to$1.08 billion at December 31, 2017. During the same period, investment securities decreased $15.5 millionor 8.9% to $158.7 million, while the loan portfolio increased $89.1 million, or 10.53%, to $935.0 million. AtDecember 31, 2018, commercial loans, a key strategic emphasis, totaled $778.4 million and represented83.3% of total loans. Total commercial loans increased $89.0 million, or 12.9% since December 31, 2017.Loan originations have been prudent and conservative underwriting standards have been maintained.Deposits increased $123.4 million to $984.6 million at December 31, 2018. DNB’s liabilities are comprisedof a high level of core deposits with a low cost of funds, in addition to a moderate level of brokereddeposits and borrowings with costs that are more volatile than core deposits.
Strategic Plan. During the fourth quarter of 2018, DNB updated its strategic plan, focusing oninitiatives to increase core earnings and shareholder value. Key strategies include:
• Maintain our focus on increasing core deposits.
33
• Continue to grow our commercial loan portfolio, while ensuring stable credit quality.
• Leverage treasury management services to deepen relationships with commercial customers andgenerate incremental fee revenue.
• Strengthen our emphasis on relationship-based banking, through development of consumerproducts that encourage and reward customer loyalty.
• Increase digital banking adoption rates and introduce emerging technology solutions to enhancecustomer experience and improve operating efficiency.
• Maintain strong capital ratios to ensure continued, sustainable growth and innovation.
• Intensify focus on expense control and improved operating leverage.
For the year ending December 31, 2018, net income was $10.7 million, or $2.48 per diluted share,compared with $7.9 million, or $1.85 per diluted share, for the same period last year. Fourth quarter andfull year 2017 results were impacted by a $1.8 million charge, or $0.43 per diluted share, to adjust deferredtaxes due to the enactment of the Tax Cuts and Jobs Act (the ‘‘Tax Act’’) in December 2017.
Net interest income for the year ended December 31, 2018 was $36.8 million, which represented an$861,000 decrease from the year ended December 31, 2017. The net interest margin declined 0.28% to3.45% for the year ended December 31, 2018 from 3.73% for the year ended December 31, 2017 primarilydue to a decrease in interest income recognized on prepayment of acquired loans and the higher cost ofinterest-bearing liabilities, which was offset by increased volume of interest-earning assets. Interest incomefor the year ended December 31, 2018 was $46.2 million, which represented a $2.8 million increase fromthe year ended December 31, 2017. The increase in interest income was primarily due to higher volume ofinterest-earning assets in 2018 compared to 2017. Interest expense for the year ended December 31, 2018was $9.4 million, which represented a $3.7 million increase from the year ended December 31, 2017. Theincrease in interest expense was primarily due to higher volume and higher market interest rates ofinterest-bearing liabilities.
Asset quality remained strong as net charge-offs were 0.04% of total average loans for the year endingDecember 31, 2018. Total non-performing assets, including loans and other real estate property, were$10.8 million as of December 31, 2018, compared with $12.6 million as of December 31, 2017. The ratio ofnon-performing loans to total loans was 0.62% as of December 31, 2018, versus 0.89% as of December 31,2017.
Total core deposits increased $34.9 million, or 5.1% since December 31, 2017, and were 72.5% of totaldeposits as of December 31, 2018. As of the same date, non-interest bearing deposits were 16.7% of totaldeposits. Time and brokered deposits increased $88.4 million, or 48.5%, throughout 2018. The Companyused these deposits to help fund loan growth due to their more favorable rates and maturities, comparedwith other funding sources. As of December 31, 2018, the loan-to-deposit ratio was 95.0%. Over the pastyear, borrowed funds decreased $57.5 million, or 51%, to $55.3 million as of December 31, 2018.
DNB’s most significant revenue source continues to be net interest income, defined as total interestincome less total interest expense, which in 2018 accounted for approximately 87.53% of total revenue. Toproduce net interest income and consistent earnings growth over the long-term, DNB must generate loanand deposit growth at acceptable economic spreads within its market area. To generate and grow loans anddeposits, DNB must focus on a number of areas including, but not limited to, the economy, branchexpansion, sales practices, customer satisfaction and retention, competition, customer behavior,technology, product innovation and credit performance of its customers.
Management has made a concerted effort to improve the measurement and tracking of business linesand overall corporate performance levels. Improved information systems have increased DNB’s ability totrack key indicators and enhance corporate performance levels. Better measurement against goals and
34
objectives and increased accountability will be integral in attaining desired loan, deposit and fee incomeproduction.
III. DNB’s Principal Products and Services
Loans and Lending Services. DNB’s primary source of earnings and cash flows is derived from itslending function. The commercial loan portfolio amounted to $778.4 million or 83.25% of total loans as ofDecember 31, 2018. DNB focuses on providing these products to small to mid-size businesses throughoutChester, Delaware, and Philadelphia Counties. In keeping with DNB’s goal to match customer businessinitiatives with products designed to meet their needs, DNB offers a wide variety of fixed and variable rateloans that are priced competitively. DNB serves this market by providing funds for the purchase ofbusiness property or ventures, working capital lines, Small Business Administration loans, lease financingfor equipment and for a variety of other purposes.
As a community bank, DNB also serves consumers by providing home equity and home mortgages, aswell as term loans for the purchase of consumer goods. Residential mortgage and consumer loansincreased $119,000 in 2018 compared to 2017, primarily in the residential mortgage portfolio. In additionto providing funds to customers, DNB also provides a variety of services to its commercial customers.These services, such as cash management, remote capture, commercial sweep accounts, internet banking,letters of credit and other lending services are designed to meet our customer needs and help thembecome successful. DNB provides these services to assist its customers in obtaining financing, securingbusiness opportunities, providing access to new resources and managing cash flows.
Deposit Products and Services. DNB’s primary source of funds is derived from customer deposits,which are typically generated by DNB’s fifteen banking offices. DNB’s deposit base, while highlyconcentrated in central Chester County, extends to southern Chester County and into parts of Delaware,Lancaster, and Philadelphia Counties. In addition, a growing amount of new deposits are being generatedthrough expanded government service offerings and as a part of comprehensive loan or wealthmanagement relationships. DNB also has access to wholesale brokered deposits which amounted to$108.7 million at December 31, 2018.
The majority of DNB’s deposit mix consists of low costing deposits, (demand, NOW and savingsaccounts). The remaining deposits are comprised of rate-sensitive money market and time products. DNBoffers tiered savings and money market accounts, designed to attract high dollar, less volatile funds.Certificates of deposit and IRAs are traditionally offered with interest rates commensurate with theirterms.
Non-Deposit Products and Services. DNB offers non-deposit products and services under the names‘‘DNB Investments & Insurance’’ and ‘‘DNB First Investment Management & Trust.’’ Revenues fromthese entities were $2.0 million and $1.7 million for 2018 and 2017, respectively.
35
DNB Investments & Insurance. Through a third party marketing agreement with Cetera InvestmentServices, LLC, DNB Investments & Insurance offers a complete line of investment and insurance products,which include the following:
• Fixed & Variable Annuities • 401(k) plans
• 401(k) Rollovers • Stocks
• Self-Directed and Managed IRAs • Bonds
• Mutual Funds • Full Services Brokerage/Cash Management
• Long Term Care Insurance • 529 College Savings Plans
• Life Insurance • Separately Managed Investment Accounts (SMA)
• Disability Insurance • Self Employed Pension (SEP)
DNB First Investment Management & Trust. DNB First Investment Management & Trust offers a fullline of investment and fiduciary services, which includes the following:
• Investment Management • Investment Advisory
• Estate Settlement • Client Bill Paying
• Custody Services • Financial Planning
• Corporate Trustee / Trust • Power of Attorney and Guardian of the EstateAdministration Capacities
IV. Material Challenges, Risks and Opportunities
A. Interest Rate Risk Management.
Interest rate risk is the exposure to adverse changes in net interest income due to changes in interestrates. DNB considers interest rate risk a predominant risk in terms of its potential impact on earnings.Interest rate risk can occur for any one or more of the following reasons: (a) assets and liabilities maymature or re-price at different times; (b) short-term or long-term market rates may change by differentamounts; or (c) the remaining maturity of various assets or liabilities may shorten or lengthen as interestrates change.
The principal objective of DNB’s interest rate risk management is to evaluate the interest rate riskincluded in certain on and off balance sheet accounts, determine the level of risk appropriate given DNB’sbusiness strategy, operating environment, capital and liquidity requirements and performance objectives,and manage the risk consistent with approved guidelines. Through such management, DNB seeks toreduce the vulnerability of its operations to changes in interest rates. DNB’s Asset Liability Committee(the ‘‘ALCO’’) is responsible for reviewing DNB’s asset/liability policies and interest rate risk position andmaking decisions involving asset liability considerations. The ALCO meets on a monthly basis and reportstrends and DNB’s interest rate risk position to the Board of Directors on a quarterly basis. The extent ofthe movement of interest rates is an uncertainty that could have a negative impact on DNB’s earnings. (Seeadditional discussion in Item 7a. Quantitative and Qualitative Disclosures About Market Risk of thisForm 10-K.)
1. Net Interest Margin
DNB’s net interest margin is the ratio of net interest income to average interest-earning assets (taxeffected). Unlike the interest rate spread, which measures the difference between the rates on earningassets and interest paying liabilities, the net interest margin measures that spread plus the effect of net free
36
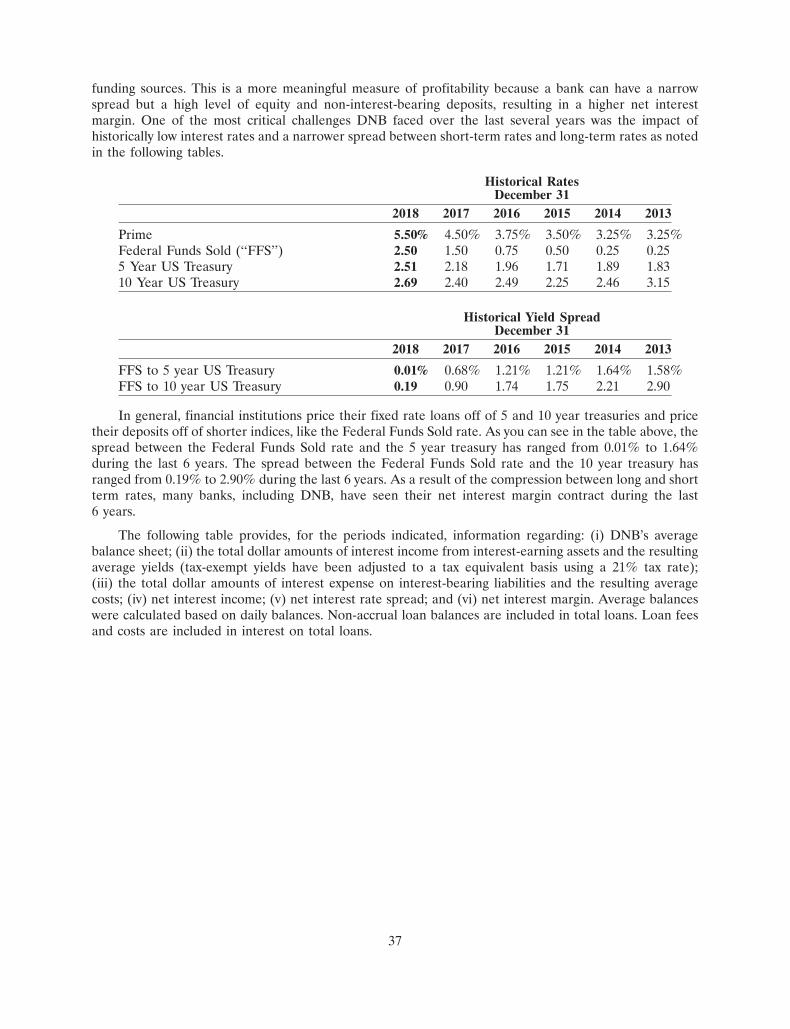
funding sources. This is a more meaningful measure of profitability because a bank can have a narrowspread but a high level of equity and non-interest-bearing deposits, resulting in a higher net interestmargin. One of the most critical challenges DNB faced over the last several years was the impact ofhistorically low interest rates and a narrower spread between short-term rates and long-term rates as notedin the following tables.
Historical RatesDecember 31
2018 2017 2016 2015 2014 2013
Prime 5.50% 4.50% 3.75% 3.50% 3.25% 3.25%Federal Funds Sold (‘‘FFS’’) 2.50 1.50 0.75 0.50 0.25 0.255 Year US Treasury 2.51 2.18 1.96 1.71 1.89 1.8310 Year US Treasury 2.69 2.40 2.49 2.25 2.46 3.15
Historical Yield SpreadDecember 31
2018 2017 2016 2015 2014 2013
FFS to 5 year US Treasury 0.01% 0.68% 1.21% 1.21% 1.64% 1.58%FFS to 10 year US Treasury 0.19 0.90 1.74 1.75 2.21 2.90
In general, financial institutions price their fixed rate loans off of 5 and 10 year treasuries and pricetheir deposits off of shorter indices, like the Federal Funds Sold rate. As you can see in the table above, thespread between the Federal Funds Sold rate and the 5 year treasury has ranged from 0.01% to 1.64%during the last 6 years. The spread between the Federal Funds Sold rate and the 10 year treasury hasranged from 0.19% to 2.90% during the last 6 years. As a result of the compression between long and shortterm rates, many banks, including DNB, have seen their net interest margin contract during the last6 years.
The following table provides, for the periods indicated, information regarding: (i) DNB’s averagebalance sheet; (ii) the total dollar amounts of interest income from interest-earning assets and the resultingaverage yields (tax-exempt yields have been adjusted to a tax equivalent basis using a 21% tax rate);(iii) the total dollar amounts of interest expense on interest-bearing liabilities and the resulting averagecosts; (iv) net interest income; (v) net interest rate spread; and (vi) net interest margin. Average balanceswere calculated based on daily balances. Non-accrual loan balances are included in total loans. Loan feesand costs are included in interest on total loans.
37

Average Balances, Rates, and Interest Income and Expense(Dollars in thousands)
Year Ended December 312018 2017 2016
Average Yield/ Average Yield/ Average Yield/Balance Interest* Rate Balance Interest* Rate Balance Interest* Rate
ASSETSInterest-earning assets:Investment securities:
Taxable $ 136,198 $ 3,220 2.36% $ 140,400 $ 2,983 2.13%$154,827 $ 2,896 1.87%Tax-exempt 39,508 1,100 2.78 43,810 1,416 3.23 53,430 1,825 3.42
Total securities 175,706 4,320 2.46 184,210 4,399 2.39 208,257 4,721 2.27Cash and cash equivalents 18,376 230 1.25 26,884 210 0.78 30,391 129 0.42Total loans 882,677 41,965 4.75 819,594 39,508 4.82 571,432 25,310 4.43
Total interest-earning assets 1,076,759 46,515 4.32 1,030,688 44,117 4.28 810,080 30,160 3.72Non-interest-earning assets 41,177 45,035 28,427
Total assets $1,117,936 $1,075,723 $838,507
LIABILITIES ANDSTOCKHOLDERS’ EQUITY
Interest-bearing liabilities:NOW, money market and
savings $ 534,466 $ 3,862 0.72% $ 507,006 $ 2,289 0.45%$428,143 $ 1,004 0.23%Time 136,845 1,982 1.45 157,954 1,257 0.80 101,268 706 0.70Brokered 79,320 1,662 2.09 33,124 538 1.62 22,491 301 1.34
Total interest-bearing deposits 750,631 7,506 1.00 698,084 4,084 0.59 551,902 2,011 0.36Federal funds purchased 1,106 21 1.92 143 2 1.22 442 3 0.72Repurchase agreements 7,516 15 0.20 14,229 28 0.20 19,878 40 0.20Subordinated debt 9,750 414 4.25 9,750 414 4.25 9,750 414 4.25FHLBP advances 52,572 887 1.69 54,066 752 1.39 31,965 451 1.41Other interest-bearing
borrowings 11,461 528 4.60 9,673 440 4.54 9,722 405 4.16
Total interest-bearing liabilities 833,036 9,371 1.12 785,945 5,720 0.73 623,659 3,324 0.53Demand deposits 172,042 184,520 142,569Other liabilities 6,230 5,046 5,179Stockholders’ equity 106,628 100,212 67,100
Total liabilities andstockholders’ equity $1,117,936 $1,075,723 $838,507
Net interest income $37,144 $38,397 $26,836
Interest rate spread 3.20% 3.55% 3.19%
Net interest margin 3.45% 3.73% 3.31%
* All amounts are reported on a tax equivalent basis, a non-GAAP measure, computed using the statutory federalincome tax rate, exclusive of the alternative minimum tax rate and nondeductible interest expense. The tax equivalentadjustment amounts used in the above table to compute yields aggregated $340,000 in 2018, $732,000 in 2017, and$981,000 in 2016. The tax equivalent net interest margin is calculated by dividing tax equivalent net interest income byaverage total interest earning assets.
2. Rate / Volume Analysis
During 2018, DNB recognized purchase accounting accretion and amortization related to theacquisition of ERB which totaled $1.0 million in additional net interest income, affecting interest incomeon loans, and interest expense on time deposits and borrowings, compared to $2.3 million in 2017. During2018, net interest income decreased $1.3 million or 3.26% on a tax equivalent basis. As shown in thefollowing Rate/Volume Analysis table, DNB had $3.0 million in unfavorable rate changes, offset by$1.8 million in favorable volume changes.
38
The unfavorable impact of increased rates on interest-bearing liabilities combined with theunfavorable impact of changes in yields on interest-earning assets resulted in a $3.0 million unfavorabledifference. The unfavorable change due to rate on interest-bearing deposits was $2.6 million (an averagerate paid of 1.00% in 2018, compared to 0.59% in 2017). The unfavorable change due to rate earned onloans was $542,000 (an average rate earned of 4.75% in 2018, compared to 4.82% in 2017). Theunfavorable change due to rate on FHLBP advances was $160,000 (an average rate paid of 1.69% in 2018,compared to 1.39% in 2017). The unfavorable change due to rate on other interest-bearing accounts was$6,000 (an average rate paid of 4.60% in 2018, compared to 4.54% in 2017). These unfavorable changesdue to higher rates paid on interest-bearing liabilities and lower rates earned on loans (primarily due to adecline in purchase accounting accretion year over year) were partially offset by favorable changes due tohigher rates earned on investment securities and cash and cash equivalents. The favorable change due torate earned on investments was $140,000 (an average rate earned of 2.46% in 2018, compared to 2.39% in2017). The favorable change due to rate earned on cash and cash equivalents was $126,000 (an averagerate earned of 1.25% in 2018, compared to 0.78% in 2017). DNB’s composite cost of funds was 1.12% in2018, compared to 0.73% in 2017.
The favorable impact of increased volume of interest-earning assets outweighed the unfavorableimpact of increased volume of interest-bearing liabilities, resulting in a $1.8 million favorable difference.The favorable change in net interest income due to volume changes is mostly attributable to increasedaverage balances of loans of $63.1 million (affecting net interest income favorably by $3.0 million),decreased average balances of FHLBP advances of $1.5 million (favorably change of $25,000), anddecreased average balances of repurchase agreements of $6.7 million (favorable change of $13,000), offsetby increased average balances of interest-bearing deposits of $52.5 million (unfavorable change of$860,000), decreased average balances of investment securities of $8.5 million (unfavorable change of$219,000), decreased average balances of cash and cash equivalents of $8.5 million (unfavorable change of$106,000), increased average balances of other interest-bearing accounts of $1.8 million (unfavorablechange of $82,000), and increased average balances of Federal funds purchased of $963,000 (unfavorablechange of $18,000).
The following table sets forth, among other things, the extent to which changes in interest rates andchanges in the average balances of interest-earning assets and interest-bearing liabilities have affectedinterest income and expense for the periods noted (tax-exempt yields have been adjusted to a taxequivalent basis using a 21% tax rate in 2018 and a 34% tax rate in years prior to 2018). For each categoryof interest-earning assets and interest-bearing liabilities, information is provided with respect to changesattributable to (i) changes in rate (change in rate multiplied by old volume) and (ii) changes in volume(change in volume multiplied by new rate). The net change attributable to the combined impact of rate andvolume has been allocated proportionately to the change due to rate and the change due to volume.
39
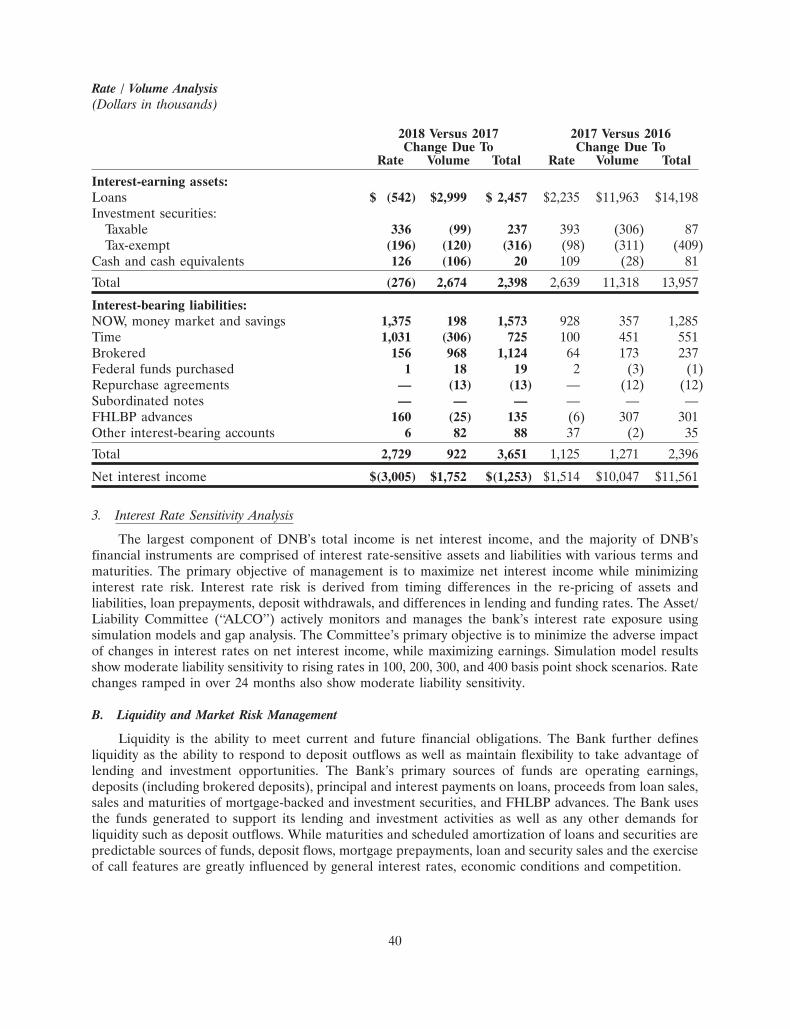
Rate / Volume Analysis(Dollars in thousands)
2018 Versus 2017 2017 Versus 2016Change Due To Change Due To
Rate Volume Total Rate Volume Total
Interest-earning assets:Loans $ (542) $2,999 $ 2,457 $2,235 $11,963 $14,198Investment securities:
Taxable 336 (99) 237 393 (306) 87Tax-exempt (196) (120) (316) (98) (311) (409)
Cash and cash equivalents 126 (106) 20 109 (28) 81
Total (276) 2,674 2,398 2,639 11,318 13,957
Interest-bearing liabilities:NOW, money market and savings 1,375 198 1,573 928 357 1,285Time 1,031 (306) 725 100 451 551Brokered 156 968 1,124 64 173 237Federal funds purchased 1 18 19 2 (3) (1)Repurchase agreements — (13) (13) — (12) (12)Subordinated notes — — — — — —FHLBP advances 160 (25) 135 (6) 307 301Other interest-bearing accounts 6 82 88 37 (2) 35
Total 2,729 922 3,651 1,125 1,271 2,396
Net interest income $(3,005) $1,752 $(1,253) $1,514 $10,047 $11,561
3. Interest Rate Sensitivity Analysis
The largest component of DNB’s total income is net interest income, and the majority of DNB’sfinancial instruments are comprised of interest rate-sensitive assets and liabilities with various terms andmaturities. The primary objective of management is to maximize net interest income while minimizinginterest rate risk. Interest rate risk is derived from timing differences in the re-pricing of assets andliabilities, loan prepayments, deposit withdrawals, and differences in lending and funding rates. The Asset/Liability Committee (‘‘ALCO’’) actively monitors and manages the bank’s interest rate exposure usingsimulation models and gap analysis. The Committee’s primary objective is to minimize the adverse impactof changes in interest rates on net interest income, while maximizing earnings. Simulation model resultsshow moderate liability sensitivity to rising rates in 100, 200, 300, and 400 basis point shock scenarios. Ratechanges ramped in over 24 months also show moderate liability sensitivity.
B. Liquidity and Market Risk Management
Liquidity is the ability to meet current and future financial obligations. The Bank further definesliquidity as the ability to respond to deposit outflows as well as maintain flexibility to take advantage oflending and investment opportunities. The Bank’s primary sources of funds are operating earnings,deposits (including brokered deposits), principal and interest payments on loans, proceeds from loan sales,sales and maturities of mortgage-backed and investment securities, and FHLBP advances. The Bank usesthe funds generated to support its lending and investment activities as well as any other demands forliquidity such as deposit outflows. While maturities and scheduled amortization of loans and securities arepredictable sources of funds, deposit flows, mortgage prepayments, loan and security sales and the exerciseof call features are greatly influenced by general interest rates, economic conditions and competition.
40
The objective of DNB’s asset/liability management function is to maintain consistent growth in netinterest income within DNB’s policy limits. This objective is accomplished through the management ofliquidity and interest rate risk, as well as customer offerings of various loan and deposit products. DNBmaintains adequate liquidity to meet daily funding requirements, anticipated deposit withdrawals, or assetopportunities in a timely manner. Liquidity is also necessary to meet obligations during unusual,extraordinary or adverse operating circumstances, while avoiding a significant loss or cost. DNB’sfoundation for liquidity is a stable deposit base as well as a marketable investment portfolio that providescash flow through regular maturities or that can be used for collateral to secure funding in an emergency.As part of its liquidity management, DNB maintains assets, which comprise its liquidity (Federal fundssold, investments and interest-bearing cash balances, less pledged securities).
C. Credit Risk Management
DNB defines credit risk as the risk of default by a customer or counter-party. The objective of DNB’scredit risk management strategy is to quantify and manage credit risk on an aggregate portfolio basis aswell as to limit the risk of loss resulting from an individual customer default. Credit risk is managedthrough a combination of underwriting, documentation and collection standards. DNB’s credit riskmanagement strategy calls for regular credit examinations and quarterly management reviews of largecredit exposures and credits experiencing credit quality deterioration. DNB’s loan review proceduresprovide objective assessments of the quality of underwriting, documentation, risk grading and charge-offprocedures, as well as an assessment of the allowance for credit loss reserve analysis process. As the U.S.economy moves through a period of recession, it is possible that delinquencies and non-performing assetsmay rise as the value of homes decline and DNB’s borrowers experience financial difficulty due tocorporate downsizing, reduced sales and income levels, or other negative events which will impact theirability to meet their contractual loan payments. To minimize the impact on DNB’s earnings and maintainsound credit quality, management continues to aggressively monitor credit and credit relationships thatmay be impacted by such adverse factors.
D. Competition
In addition to the challenges related to the interest rate environment, community banks in Chester,Philadelphia and Delaware Counties have been experiencing increased competition from large regionaland international banks entering DNB’s marketplace through mergers and acquisitions. Competition forloans and deposits has negatively affected DNB’s net interest margin. To compensate for the increasedcompetition, DNB, along with other area community banks, has aggressively sought and marketedcustomers who have been disenfranchised by these mergers.
To attract these customers, DNB offers deposit products and services, such as Choice Checkingrelationship products, and Online Banking with bill payment, external transfer and account aggregationfunctionality. DNB also offers a complete package of cash management services including automatedclearing house services, remote deposit, payroll services, and merchant services and account paymentsolutions. Our broad range of Business Checking products provides solutions to meet the needs of a varietyof businesses and non-profit organizations.
V. Critical Accounting Policies and Estimates
The following discussion and analysis of financial condition and results of operations is based uponour consolidated financial statements, which have been prepared in accordance with U.S. generallyaccepted accounting principles. Generally accepted accounting principles are complex and requiremanagement to apply significant judgment to various accounting, reporting and disclosure matters.Management must use assumptions and estimates to apply these principles where actual measurement is
41

not possible or practical. Actual results may differ from these estimates under different assumptions orconditions.
In management’s opinion, the most critical accounting policies and estimates impacting DNB’sconsolidated financial statements are in Note 1 to the Consolidated Financial Statements. These policiesare critical because they are highly dependent upon subjective or complex judgments, assumptions andestimates. Changes in such estimates may have a significant impact on the financial statements. For acomplete discussion of DNB’s significant accounting policies, see the Notes to the Consolidated FinancialStatements and discussion throughout this Form 10-K.
VI. 2018 Financial Results
A. Liquidity
Management maintains liquidity to meet depositors’ needs for funds, to satisfy or fund loancommitments, and for other operating purposes. DNB’s foundation for liquidity is a stable and loyalcustomer deposit base, cash and cash equivalents, and a marketable investment portfolio that providesperiodic cash flow through regular maturities and amortization, or that can be used as collateral to securefunding. Primary liquidity includes investments, Federal funds sold, and interest-bearing cash balances, lesspledged securities. DNB also anticipates scheduled payments and prepayments on its loan and mortgage-backed securities portfolios. In addition, DNB maintains borrowing arrangements with variouscorrespondent banks, the Federal Home Loan Bank of Pittsburgh and the Federal Reserve Bank ofPhiladelphia to meet short-term liquidity needs. Through these relationships, DNB has available credit ofapproximately $568.6 million at December 31, 2018. At December 31, 2018 DNB also had $507.0 million ofavailable short or long term funding through several agreements and programs with brokers. Managementbelieves that DNB has adequate resources to meet its short-term and long-term funding requirements.
As of December 31, 2018, deposits totaled $984.6 million, up $123.4 million from $861.2 million atDecember 31, 2017. There are $142.6 million in certificates of deposit (including IRAs and brokered timedeposits) scheduled to mature during 2019. Management believes that the majority of the non-brokeredtime deposits will be reinvested with DNB and that certificates that are not renewed will be funded by areduction in cash and cash equivalents or by pay-downs and maturities of loans and investments. AtDecember 31, 2018, DNB had $190.8 million in un-funded loan commitments. In addition, there were$2.3 million in un-funded letters of credit. Management anticipates the majority of these commitments willbe funded by means of normal cash flows. Included in interest bearing deposits are time and brokereddeposits issued in amounts of $100,000 or more and their remaining maturities at December 31, 2018 wereas follows:
Time and Brokered Deposits Greater Than or Equal to $100,000(Dollars in thousands)
December 31, 2018Brokered
Time Deposits Time Deposits Total
Three months or less $10,800 $1,494 $ 12,294Over three through six months 17,991 — 17,991Over six through twelve months 35,909 — 35,909Over one year through two years 30,149 — 30,149Over two years 4,368 — 4,368
Total $99,217 $1,494 $100,711
42
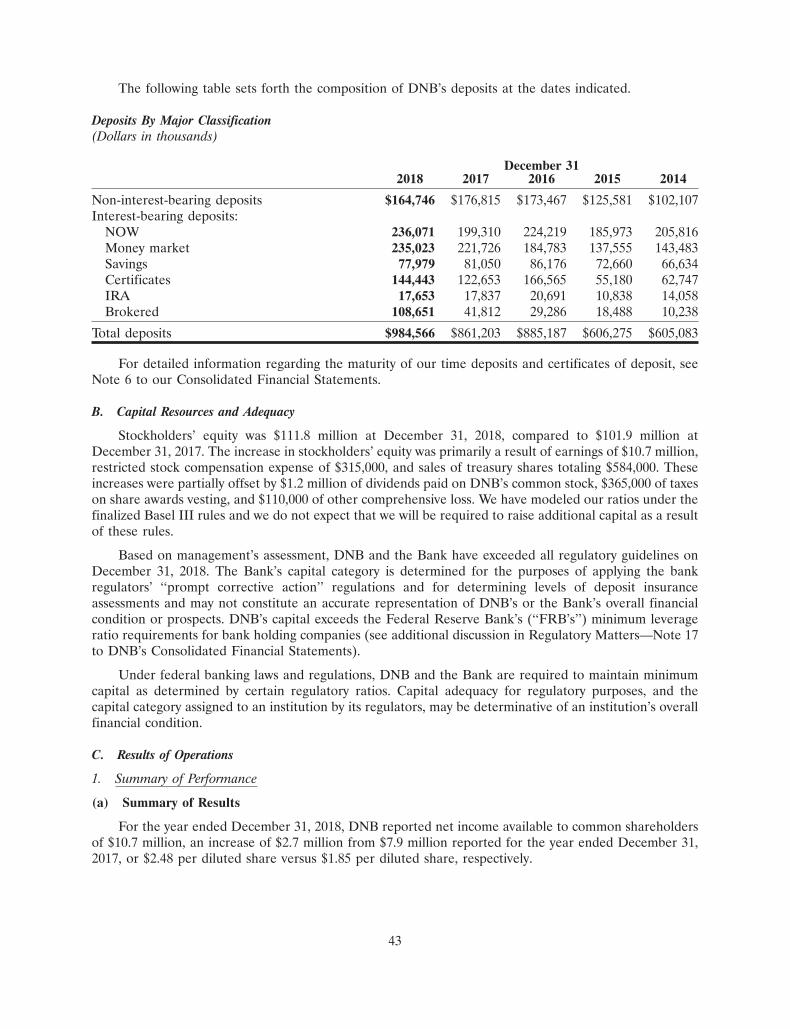
The following table sets forth the composition of DNB’s deposits at the dates indicated.
Deposits By Major Classification(Dollars in thousands)
December 312018 2017 2016 2015 2014
Non-interest-bearing deposits $164,746 $176,815 $173,467 $125,581 $102,107Interest-bearing deposits:
NOW 236,071 199,310 224,219 185,973 205,816Money market 235,023 221,726 184,783 137,555 143,483Savings 77,979 81,050 86,176 72,660 66,634Certificates 144,443 122,653 166,565 55,180 62,747IRA 17,653 17,837 20,691 10,838 14,058Brokered 108,651 41,812 29,286 18,488 10,238
Total deposits $984,566 $861,203 $885,187 $606,275 $605,083
For detailed information regarding the maturity of our time deposits and certificates of deposit, seeNote 6 to our Consolidated Financial Statements.
B. Capital Resources and Adequacy
Stockholders’ equity was $111.8 million at December 31, 2018, compared to $101.9 million atDecember 31, 2017. The increase in stockholders’ equity was primarily a result of earnings of $10.7 million,restricted stock compensation expense of $315,000, and sales of treasury shares totaling $584,000. Theseincreases were partially offset by $1.2 million of dividends paid on DNB’s common stock, $365,000 of taxeson share awards vesting, and $110,000 of other comprehensive loss. We have modeled our ratios under thefinalized Basel III rules and we do not expect that we will be required to raise additional capital as a resultof these rules.
Based on management’s assessment, DNB and the Bank have exceeded all regulatory guidelines onDecember 31, 2018. The Bank’s capital category is determined for the purposes of applying the bankregulators’ ‘‘prompt corrective action’’ regulations and for determining levels of deposit insuranceassessments and may not constitute an accurate representation of DNB’s or the Bank’s overall financialcondition or prospects. DNB’s capital exceeds the Federal Reserve Bank’s (‘‘FRB’s’’) minimum leverageratio requirements for bank holding companies (see additional discussion in Regulatory Matters—Note 17to DNB’s Consolidated Financial Statements).
Under federal banking laws and regulations, DNB and the Bank are required to maintain minimumcapital as determined by certain regulatory ratios. Capital adequacy for regulatory purposes, and thecapital category assigned to an institution by its regulators, may be determinative of an institution’s overallfinancial condition.
C. Results of Operations
1. Summary of Performance
(a) Summary of Results
For the year ended December 31, 2018, DNB reported net income available to common shareholdersof $10.7 million, an increase of $2.7 million from $7.9 million reported for the year ended December 31,2017, or $2.48 per diluted share versus $1.85 per diluted share, respectively.
43
There are many aspects of the economy and the Federal Reserve’s monetary policy that influenceDNB’s ability to grow revenues and net income. In general, the U.S. economy is growing at a moderatepace. According to the most recent forecast released at the Federal Open Market Committee meeting onDecember 19, 2018, the U.S. GDP growth will slow to 2.3 percent in 2019 from 3 percent in 2018. Theunemployment rate ends the year at 3.7 percent in 2018 and will fall to 3.5 percent in 2019. Inflation wasforecast to be 1.9 percent in 2018 and 2019. Employment growth remains robust which, coupled withbuoyant asset prices and strong consumer confidence, is sustaining income and consumption growth.Business investment is projected to strengthen as a result of major tax reform and supportive financialconditions. A pick-up in the world economy is underpinning export growth, although tensions haveemerged on how best to reduce barriers to trade.
Although the national and international economies influence DNB’s results, economic conditions insoutheastern Pennsylvania are more germane, as the majority of DNB’s loan and deposits relationships arewith businesses and individuals within the Third Federal Reserve District. The Federal Reserve’sJanuary 16, 2019 Beige Book summarizes the economic climate which impacts DNB’s operatingenvironment.
The January 16, 2019 Beige Book indicated that, on balance, aggregate business activity in the ThirdDistrict maintained a modest pace of growth, although slowing occurred among service sectors and somereal estate activity declined. The labor market remains tight, which continued to constrain hiring at amodest pace and to apply moderate upward wage pressures. Price pressures remained modest and eased abit for service sectors. Nonfinancial services eased back to a modest pace of growth, while manufacturingand non-auto retail sales maintained a modest pace. Auto sales were essentially unchanged, and tourismactivity continued to grow slightly. Residential real estate sectors tended to decline, while commercial realestate tended to be flat or down slightly. The growth outlook over the next six months remained positive,with half of the nonmanufacturing firms and over 40 percent of the manufacturers anticipating increases ingeneral activity.
Overall, Third District homebuilders continued to report that activity appears to have fallen modestly.Existing home sales continued to decline moderately across most local markets—hampered by extremelylow inventories. However, recent sales and an inventory drawdown have strengthened the Poconos market,which has labored with an excess of foreclosed properties since the Great Recession.
The Federal Reserve’s non-residential real estate contacts reported that, on balance, commercial realestate construction continued to decline slightly off high levels. The Federal Reserve’s contacts notedongoing strength in industrial/warehouse properties, except in areas with an insufficient labor supply.While architects and engineers remain busy, the pipeline is thinning for new office, retail, and high-riseresidential projects. Contractors are preparing for a slight decline in 2019 activity. Commercial leasingactivity has held steady, but analysts note an abundance of caution among market participants.
Third District financial firms continued to report modest growth on a year-over-year basis in creditcard lending and in overall loan volumes (excluding credit cards). During the January 16, 2019 Beige BookPeriod, volumes grew moderately in mortgages, commercial and industrial lending; grew modestly incommercial real estate; and declined somewhat in home equity lines, auto loans, and other consumerloans. The Federal Reserve’s contacts continued to cite strong competition for deposits and quality loansbut noted little concern over credit quality deterioration.
During the January 16, 2019 Beige Book Period, Third District manufacturing firms reported thatactivity continued at a modest pace of growth—typical for the Third District. The percentage of firms thatreported increased shipments fell somewhat, while the percentage reporting an increase in new ordersedged up. The makers of paper products, primary metal products, and electronic equipment tended tonote gains in new orders and shipments; the makers of lumber products, chemicals, fabricated metalproducts, and industrial equipment reported mixed results. The Federal Reserve’s contacts often citedlabor supply issues as a deterrent to growth, in addition to supply chain problems, rising commodity prices,
44

and uncertainty surrounding tariffs. Demand for equipment to supply the oil and gas producing sectors hasslackened again. On balance, manufacturers continued to expect general activity to increase over the nextsix months. Expectations of future increases in new orders, shipments, employment, and capital spendingremained nearly the same as the December 5, 2018 Beige Book period.
Although DNB’s earnings have been impacted by the general economic conditions, the impact has notbeen as severe as it has been in many parts of the nation, largely due to a relatively healthier economicclimate in the Third Federal Reserve District, compared to other areas of the country. DNB’s franchisespans Chester, Philadelphia and Delaware counties in southeastern Pennsylvania and the majority of loansand deposits relationships are with businesses and individuals within the Third Federal Reserve District.
These and other factors have impacted our operations. We continue to focus on the consistency andstability of core earnings and balance sheet strength which are critical success factors in today’s challengingeconomic environment.
(b) Significant Events, Transactions and Economic Changes Affecting Results
Some of DNB’s significant events during 2018 include:
• DNB benefited from a reduced federal tax rate during 2018 as a result of the passage of the TaxCuts and Jobs Act of 2017. Federal tax rates declined from 34% to 21%, effective January 1, 2018.As a result of the rate reduction, DNB was required to re-measure, through income tax expense inthe period of enactment, its deferred tax assets and liabilities using the enacted rate at which DNBexpects them to be recovered or settled. The re-measurement of the net deferred tax asset resultedin additional income tax expense of $1.8 million in 2017.
• Significant loan growth of $89.1 million or 10.5%, contributed to record earnings in 2018 of$10.7 million, or $2.48 per diluted share, compared with $7.9 million, or $1.85 per diluted share, in2017. At December 31, 2018, commercial loans, a key strategic emphasis for DNB, totaled$778.4 million and represented 83.3% of total loans.
• DNB’s composite cost of funds increased from 0.73% in 2017, to 1.12% in 2018. Our higher fundingcost was precipitated by the Federal Reserve’s four quarter-point increases in the FF target ratethroughout 2018, coupled with significant competition for available funds in the DNB marketplace.
(c) Trends and Uncertainties
Please refer to Item 7. Management’s Discussion and Analysis of Financial Condition and Results ofOperations-Introductory Overview in this Form 10-K.
(d) Material Changes in Results
Please refer to the discussion above in the section titled ‘‘Significant Events, Transactions andEconomic Changes Affecting Results.’’
(e) Effect of Inflation and Changing Rates
For detailed discussion of the effects of inflation and changes in rates on DNB’s results, refer to thefollowing discussion on ‘‘Net Interest Income.’’
2. Net Interest Income
DNB’s earnings performance is primarily dependent upon its level of net interest income, which is theexcess of interest income over interest expense. Interest income includes interest earned on loans (net ofinterest reversals on non-performing loans), investments and Federal funds sold, as well as net loan feeamortization and dividend income. Interest expense includes the interest cost for deposits, FHLBPadvances, repurchase agreements, corporate debentures, Federal funds purchased and other borrowings.
45
During the year ended December 31, 2018, management focused on growing the loan portfolio. Totalloans increased $89.1 million or 10.53% on a year-over year basis. The net interest margin for the yearended December 31, 2018 was 3.45% compared to 3.73% in 2017. The decreased net interest margin wasprimarily caused by the higher volume and higher cost of interest-bearing liabilities in 2018, over 2017.DNB also recognized purchase accounting accretion and amortization related to the acquisition of ERBwhich totaled $1.0 million in additional net interest income, affecting interest income on loans, and interestexpense on time deposits and borrowings, compared to $2.3 million in 2017.
Interest on loans was $41.9 million for 2018, compared to $39.3 million for 2017, a $2.6 millionincrease. The average balance of loans was $882.7 million with an average tax equivalent yield, anon-GAAP measure, of 4.75% in 2018, compared to $819.6 million with an average tax equivalent yield of4.82% in 2017.
Interest and dividends on investment securities was $4.1 million for 2018, compared to $3.9 million for2017, a $173,000 increase. The average balance of investment securities was $175.7 million with an averagetax equivalent yield, a non-GAAP measure, of 2.46% in 2018, compared to $184.2 million with an averagetax equivalent yield of 2.39% in 2017.
Interest on deposits was $7.5 million for 2018, compared to $4.1 million for 2017, a $3.4 millionincrease. The average balance of interest-bearing deposits was $750.6 million with an average rate of1.00% for 2018, compared to $698.1 million with an average rate of 0.59% for 2017.
Interest on FHLBP advances was $887,000 for 2018, compared to $752,000 for 2017. The averagebalance on FHLBP advances was $52.6 million with an average rate of 1.69% for 2018, compared to$54.1 million with an average rate of 1.39% for 2017.
Interest on other interest bearing accounts was $528,000 for 2018, compared to $440,000 for 2017. Theaverage balance on other interest bearing accounts was $11.5 million with an average rate of 4.60% for2018 compared to $9.7 million with an average rate of 4.54% for 2017.
Interest on subordinated debt was $414,000 for both 2018 and 2017. The average balance onsubordinated debt was $9.8 million with an average rate of 4.25% for both 2018 and 2017.
3. Provision for Credit Losses
To provide for known and inherent losses in the loan and lease portfolio, DNB maintains an allowancefor credit losses. There was a $1.2 million provision made in 2018 compared to $1.7 million in 2017. For adetailed discussion on DNB’s reserve methodology, refer to ‘‘Item 1—Determination of the allowance forcredit losses’’ which can be found under ‘‘Critical Accounting Policies and Estimates’’.
4. Non-Interest Income
Non-interest income includes service charges on deposit products; fees received in connection withthe sale of non-depository products and services, including fiduciary and investment advisory servicesoffered through DNB First Investment Management and Trust; non-depository securities brokerageproducts and services and insurance products and services offered through DNB Investments & Insurance;and other sources of income such as increases in the cash surrender value of Bank Owned Life Insurance(‘‘BOLI’’), net gains on sales of investment securities and loans. In addition, DNB receives fees for cashmanagement, remote capture, merchant services, debit cards, safe deposit box rentals and similar activities.
Non-interest income was $5.2 million for 2018 compared to $5.4 million for 2017. The $173,000decrease was primarily due to decreases of $195,000 in gains from insurance proceeds, $115,000 in gains onsale of loans, $104,000 in service charges on deposits (mostly NSF fees and STAR income), $50,000 ingains on sale of investment securities, $39,000 in other fees (mostly servicing fee income), and $7,000 in
46
increase in cash surrender value of BOLI. These decreases were offset by increases of $242,000 in WealthManagement and $95,000 in mortgage banking.
5. Non-Interest Expense
Non-interest expense includes salaries & employee benefits, furniture & equipment, occupancy,professional & consulting fees as well as marketing, printing & supplies, FDIC insurance, PA shares tax,telecommunications, write-downs on other real estate owned (‘‘OREO’’) and other repossessed propertyand other less significant expense items.
Salary and employee benefits. Salary and employee benefits were $15.5 million for 2018 compared to$15.2 million for 2017. The $348,000 increase was primarily attributable to higher level of full-timeequivalent employees year over year.
Furniture and equipment. Furniture and equipment expense was $2.2 million for 2018 compared to$2.1 million for 2017. The $101,000 increase was mainly attributable to an increase in maintenanceagreements.
Occupancy. Occupancy expense was $2.6 million for 2018 compared to $2.7 million for 2017. The$50,000 decrease was mainly attributable to a decrease in office building repairs and maintenance.
Professional and Consulting. Professional and consulting expense was $1.7 million for 2018 comparedto $1.9 million for 2017. The $183,000 decrease was mainly attributable to decreases in consulting expensesof $117,000 related to high levels of recruitment and placement fees for new employees in 2017, and auditand accounting fees of $89,000, offset by increases in loan expenses of $20,000 and legal expenses of$4,000.
Loss on sale or write-down of OREO and other repossessed property. During 2018, DNB had $171,000of net loss on the sale/write-downs of OREO properties compared to $121,000 in 2017. At December 31,2018, DNB held $5.1 million of such assets, compared to $5.0 million at December 31, 2017.
Due diligence and merger expense. DNB had no due diligence and merger expense in 2018. Mergerand acquisition expenses in connection with the October 1, 2016 acquisition of East River totaled $77,000for 2017.
Other expenses. Other expenses were $2.9 million for 2018 compared to $3.1 million for 2017. The$236,000 decrease was primarily due to decreases in OREO expenses, officer and employee expenses, anddebit card charge-offs.
6. Income Taxes
Income tax expense was $2.3 million and $5.5 million for the years ended December 31, 2018 and2017, respectively. The effective tax rates for 2018 and 2017 were 17.65% and 40.71%, respectively. Incometax expense for each period primarily differs from the amount determined at the statutory rate of 21% in2018 and 34% in 2017 due to tax-exempt income on loans and investment securities, DNB’s ownership ofBOLI policies and tax credits recognized on the exercise of stock options and the vesting of restrictedshares. The significant increase in the effective tax rate for 2017 was caused by a $1.8 million charge toadjust deferred taxes, due to the enactment of the Tax Cuts and Jobs Act. This Act reduced corporateincome tax rates from 34% to 21%, leading management to revalue its net Deferred Tax Assets, effectiveas of December 22, 2017. For more information related to income taxes, refer to Note 11 in the Notes toConsolidated Financial Statements.
47

D. Financial Condition Analysis
1. Investment Securities
DNB’s investment portfolio consists of U.S. agency securities, mortgage-backed securities andcollateralized mortgage obligations issued by U.S. Government agencies, state and municipal securities,bank stocks, and other bonds and notes. In addition to generating revenue, DNB maintains the investmentportfolio to manage interest rate risk, provide liquidity, provide collateral for borrowings and to diversifythe credit risk of earning assets. The portfolio is structured to maximize DNB’s net interest income givenchanges in the economic environment, liquidity position and balance sheet mix.
Given the nature of the portfolio, and its generally high credit quality, management expects to realizeall of its investment upon the maturity of such instruments. Management determines the appropriateclassification of securities at the time of purchase. Investment securities are classified as: (a) securities heldto maturity (‘‘HTM’’) based on management’s intent and ability to hold them to maturity; (b) tradingaccount (‘‘TA’’) securities that are bought and held principally for the purpose of selling them in the nearterm; and (c) securities available for sale (‘‘AFS’’). DNB does not currently maintain a trading accountportfolio.
Securities classified as AFS include securities that may be sold in response to changes in interest rates,changes in prepayment assumptions, the need to increase regulatory capital or other similar requirements.DNB does not necessarily intend to sell such securities, but has classified them as AFS to provide flexibilityto respond to liquidity needs.
DNB’s investment portfolio (HTM and AFS securities) totaled $158.7 million at December 31, 2018,down $15.5 million or 8.90% from $174.2 million at December 31, 2017. The $15.5 million decrease ininvestment securities was primarily due to $25.0 million in principal pay-downs, calls and maturities, and achange in unrealized loss of $350,000, offset by $10.0 million in purchases.
At December 31, 2018, approximately 61% of DNB’s investments were in the AFS portfolio and 39%were in the HTM portfolio. Investments consist mainly of mortgage-backed securities and Agency notesbacked by government sponsored enterprises, such as FHLMC, FNMA and FHLB. Management regularlyreviews its investment portfolio to determine whether any securities are other than temporarily impaired.At December 31, 2018, the combined AFS and HTM portfolios had an unrealized pretax gains of $184,000and an unrealized pretax losses of $3.2 million. At December 31, 2017, the combined AFS and HTMportfolios had an unrealized pretax gain of $486,000 and an unrealized pretax loss of $2.2 million. Therewere no other than temporarily impaired securities.
The following tables set forth information regarding the composition, stated maturity and averageyield of DNB’s investment security portfolio as of the dates indicated (tax-exempt yields have beenadjusted to a tax equivalent basis using a 21% tax rate for 2018 and a 34% tax rate for 2017). The first twotables do not include amortization or anticipated prepayments on mortgage-backed securities. Callablesecurities are included at their stated maturity dates.
48
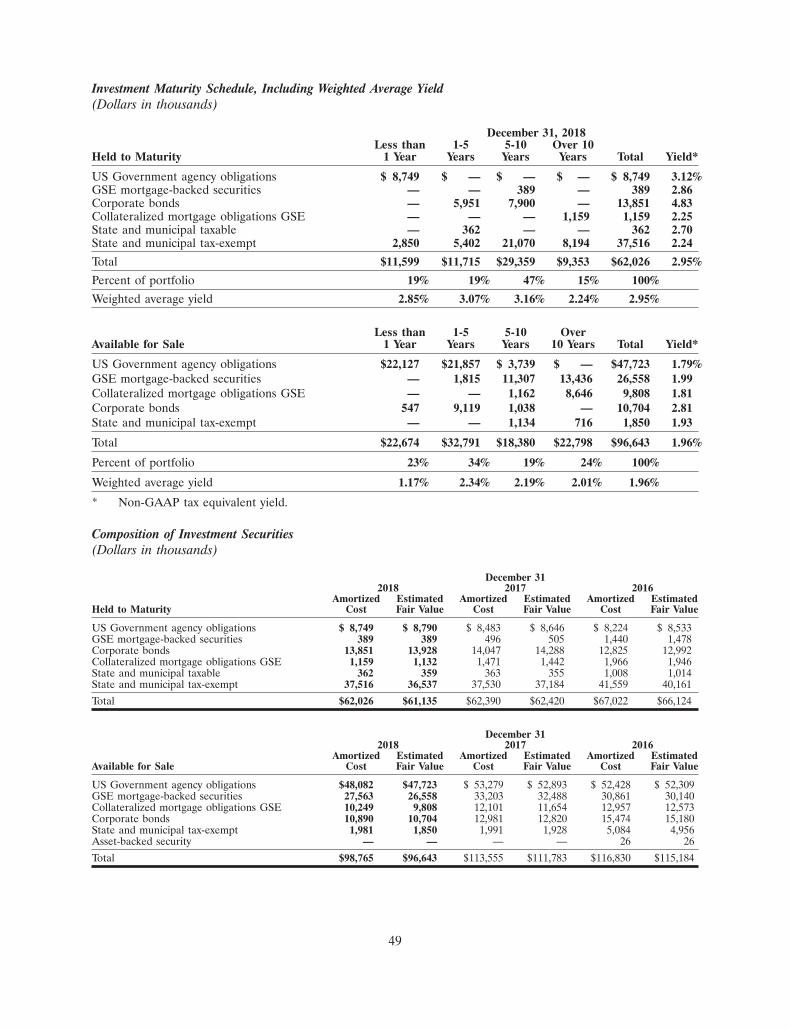
Investment Maturity Schedule, Including Weighted Average Yield(Dollars in thousands)
December 31, 2018Less than 1-5 5-10 Over 10
Held to Maturity 1 Year Years Years Years Total Yield*
US Government agency obligations $ 8,749 $ — $ — $ — $ 8,749 3.12%GSE mortgage-backed securities — — 389 — 389 2.86Corporate bonds — 5,951 7,900 — 13,851 4.83Collateralized mortgage obligations GSE — — — 1,159 1,159 2.25State and municipal taxable — 362 — — 362 2.70State and municipal tax-exempt 2,850 5,402 21,070 8,194 37,516 2.24
Total $11,599 $11,715 $29,359 $9,353 $62,026 2.95%
Percent of portfolio 19% 19% 47% 15% 100%
Weighted average yield 2.85% 3.07% 3.16% 2.24% 2.95%
Less than 1-5 5-10 OverAvailable for Sale 1 Year Years Years 10 Years Total Yield*
US Government agency obligations $22,127 $21,857 $ 3,739 $ — $47,723 1.79%GSE mortgage-backed securities — 1,815 11,307 13,436 26,558 1.99Collateralized mortgage obligations GSE — — 1,162 8,646 9,808 1.81Corporate bonds 547 9,119 1,038 — 10,704 2.81State and municipal tax-exempt — — 1,134 716 1,850 1.93
Total $22,674 $32,791 $18,380 $22,798 $96,643 1.96%
Percent of portfolio 23% 34% 19% 24% 100%
Weighted average yield 1.17% 2.34% 2.19% 2.01% 1.96%
* Non-GAAP tax equivalent yield.
Composition of Investment Securities(Dollars in thousands)
December 312018 2017 2016
Amortized Estimated Amortized Estimated Amortized EstimatedHeld to Maturity Cost Fair Value Cost Fair Value Cost Fair Value
US Government agency obligations $ 8,749 $ 8,790 $ 8,483 $ 8,646 $ 8,224 $ 8,533GSE mortgage-backed securities 389 389 496 505 1,440 1,478Corporate bonds 13,851 13,928 14,047 14,288 12,825 12,992Collateralized mortgage obligations GSE 1,159 1,132 1,471 1,442 1,966 1,946State and municipal taxable 362 359 363 355 1,008 1,014State and municipal tax-exempt 37,516 36,537 37,530 37,184 41,559 40,161
Total $62,026 $61,135 $62,390 $62,420 $67,022 $66,124
December 312018 2017 2016
Amortized Estimated Amortized Estimated Amortized EstimatedAvailable for Sale Cost Fair Value Cost Fair Value Cost Fair Value
US Government agency obligations $48,082 $47,723 $ 53,279 $ 52,893 $ 52,428 $ 52,309GSE mortgage-backed securities 27,563 26,558 33,203 32,488 30,861 30,140Collateralized mortgage obligations GSE 10,249 9,808 12,101 11,654 12,957 12,573Corporate bonds 10,890 10,704 12,981 12,820 15,474 15,180State and municipal tax-exempt 1,981 1,850 1,991 1,928 5,084 4,956Asset-backed security — — — — 26 26
Total $98,765 $96,643 $113,555 $111,783 $116,830 $115,184
49
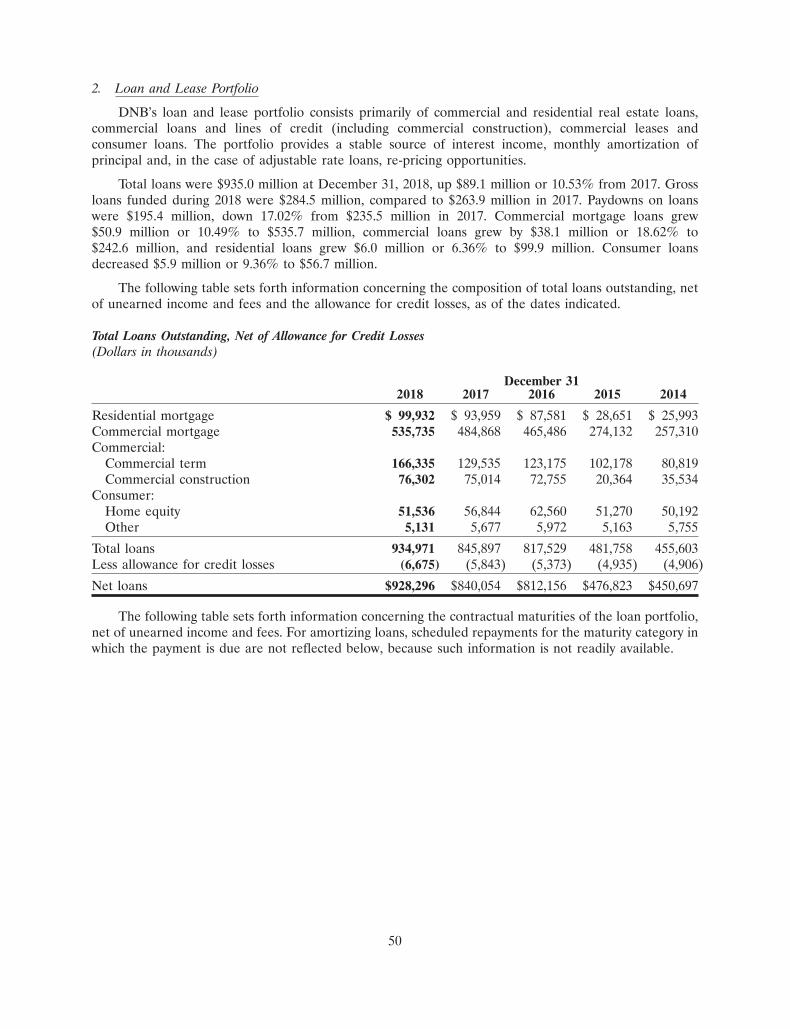
2. Loan and Lease Portfolio
DNB’s loan and lease portfolio consists primarily of commercial and residential real estate loans,commercial loans and lines of credit (including commercial construction), commercial leases andconsumer loans. The portfolio provides a stable source of interest income, monthly amortization ofprincipal and, in the case of adjustable rate loans, re-pricing opportunities.
Total loans were $935.0 million at December 31, 2018, up $89.1 million or 10.53% from 2017. Grossloans funded during 2018 were $284.5 million, compared to $263.9 million in 2017. Paydowns on loanswere $195.4 million, down 17.02% from $235.5 million in 2017. Commercial mortgage loans grew$50.9 million or 10.49% to $535.7 million, commercial loans grew by $38.1 million or 18.62% to$242.6 million, and residential loans grew $6.0 million or 6.36% to $99.9 million. Consumer loansdecreased $5.9 million or 9.36% to $56.7 million.
The following table sets forth information concerning the composition of total loans outstanding, netof unearned income and fees and the allowance for credit losses, as of the dates indicated.
Total Loans Outstanding, Net of Allowance for Credit Losses(Dollars in thousands)
December 312018 2017 2016 2015 2014
Residential mortgage $ 99,932 $ 93,959 $ 87,581 $ 28,651 $ 25,993Commercial mortgage 535,735 484,868 465,486 274,132 257,310Commercial:
Commercial term 166,335 129,535 123,175 102,178 80,819Commercial construction 76,302 75,014 72,755 20,364 35,534
Consumer:Home equity 51,536 56,844 62,560 51,270 50,192Other 5,131 5,677 5,972 5,163 5,755
Total loans 934,971 845,897 817,529 481,758 455,603Less allowance for credit losses (6,675) (5,843) (5,373) (4,935) (4,906)
Net loans $928,296 $840,054 $812,156 $476,823 $450,697
The following table sets forth information concerning the contractual maturities of the loan portfolio,net of unearned income and fees. For amortizing loans, scheduled repayments for the maturity category inwhich the payment is due are not reflected below, because such information is not readily available.
50
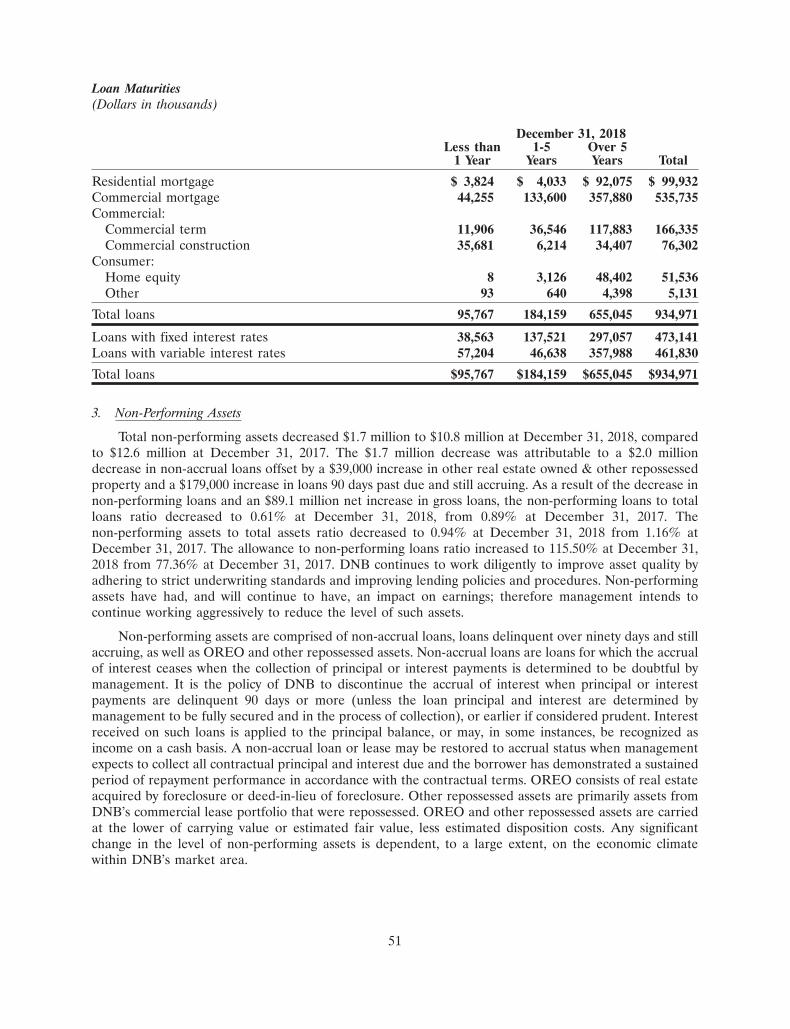
Loan Maturities(Dollars in thousands)
December 31, 2018Less than 1-5 Over 5
1 Year Years Years Total
Residential mortgage $ 3,824 $ 4,033 $ 92,075 $ 99,932Commercial mortgage 44,255 133,600 357,880 535,735Commercial:
Commercial term 11,906 36,546 117,883 166,335Commercial construction 35,681 6,214 34,407 76,302
Consumer:Home equity 8 3,126 48,402 51,536Other 93 640 4,398 5,131
Total loans 95,767 184,159 655,045 934,971
Loans with fixed interest rates 38,563 137,521 297,057 473,141Loans with variable interest rates 57,204 46,638 357,988 461,830
Total loans $95,767 $184,159 $655,045 $934,971
3. Non-Performing Assets
Total non-performing assets decreased $1.7 million to $10.8 million at December 31, 2018, comparedto $12.6 million at December 31, 2017. The $1.7 million decrease was attributable to a $2.0 milliondecrease in non-accrual loans offset by a $39,000 increase in other real estate owned & other repossessedproperty and a $179,000 increase in loans 90 days past due and still accruing. As a result of the decrease innon-performing loans and an $89.1 million net increase in gross loans, the non-performing loans to totalloans ratio decreased to 0.61% at December 31, 2018, from 0.89% at December 31, 2017. Thenon-performing assets to total assets ratio decreased to 0.94% at December 31, 2018 from 1.16% atDecember 31, 2017. The allowance to non-performing loans ratio increased to 115.50% at December 31,2018 from 77.36% at December 31, 2017. DNB continues to work diligently to improve asset quality byadhering to strict underwriting standards and improving lending policies and procedures. Non-performingassets have had, and will continue to have, an impact on earnings; therefore management intends tocontinue working aggressively to reduce the level of such assets.
Non-performing assets are comprised of non-accrual loans, loans delinquent over ninety days and stillaccruing, as well as OREO and other repossessed assets. Non-accrual loans are loans for which the accrualof interest ceases when the collection of principal or interest payments is determined to be doubtful bymanagement. It is the policy of DNB to discontinue the accrual of interest when principal or interestpayments are delinquent 90 days or more (unless the loan principal and interest are determined bymanagement to be fully secured and in the process of collection), or earlier if considered prudent. Interestreceived on such loans is applied to the principal balance, or may, in some instances, be recognized asincome on a cash basis. A non-accrual loan or lease may be restored to accrual status when managementexpects to collect all contractual principal and interest due and the borrower has demonstrated a sustainedperiod of repayment performance in accordance with the contractual terms. OREO consists of real estateacquired by foreclosure or deed-in-lieu of foreclosure. Other repossessed assets are primarily assets fromDNB’s commercial lease portfolio that were repossessed. OREO and other repossessed assets are carriedat the lower of carrying value or estimated fair value, less estimated disposition costs. Any significantchange in the level of non-performing assets is dependent, to a large extent, on the economic climatewithin DNB’s market area.
51

DNB’s Credit Policy Committee monitors the performance of the loan and lease portfolio to identifypotential problem assets on a timely basis. Committee members meet to design, implement and reviewasset recovery strategies, which serve to maximize the recovery of each troubled asset. Of the $12.4 millionloans classified as substandard as of December 31, 2018, $6.3 million are performing and are believed torequire increased supervision and review; and may, depending on the economic environment and otherfactors, become non-performing assets in future periods. The majority of these loans are secured bycommercial real estate, with lesser amounts being secured by residential real estate, inventory andreceivables. The amount of performing substandard loans at December 31, 2017 was $4.5 million.
The following table sets forth those assets that are: (i) placed on non-accrual status, (ii) contractuallydelinquent by 90 days or more and still accruing, and (iii) OREO as a result of foreclosure or voluntarytransfer to DNB as well as other repossessed assets. In addition, the table sets forth DNB’s asset qualityand allowance coverage ratios at the dates indicated:
Non-Performing Assets(Dollars in thousands)
December 312018 2017 2016 2015 2014
Non-accrual loans:Residential mortgage $ 905 $ 1,915 $ 1,770 $1,619 $2,457Commercial mortgage 1,307 2,259 4,593 1,048 1,294Commercial:
Commercial term 2,300 2,100 198 188 198Commercial construction 476 514 1,242 1,028 2,043
Consumer:Home equity 391 466 442 563 432Other 167 245 256 189 95
Total non-accrual loans 5,546 7,499 8,501 4,635 6,519Loans 90 days past due and still accruing 233 54 — 457 334Total non-performing loans 5,779 7,553 8,501 5,092 6,853Other real estate owned & other repossessed property 5,051 5,012 2,767 2,581 901Total non-performing assets $10,830 $12,565 $11,268 $7,673 $7,754
Asset quality ratios:Non-performing loans to total loans 0.62% 0.89% 1.04% 1.06% 1.50%Non-performing assets to total assets 0.94 1.16 1.05 1.02 1.07
Allowance for credit losses to:Total loans 0.71 0.69 0.66 1.02 1.08Non-performing loans 115.50 77.36 63.20 96.91 71.59
52
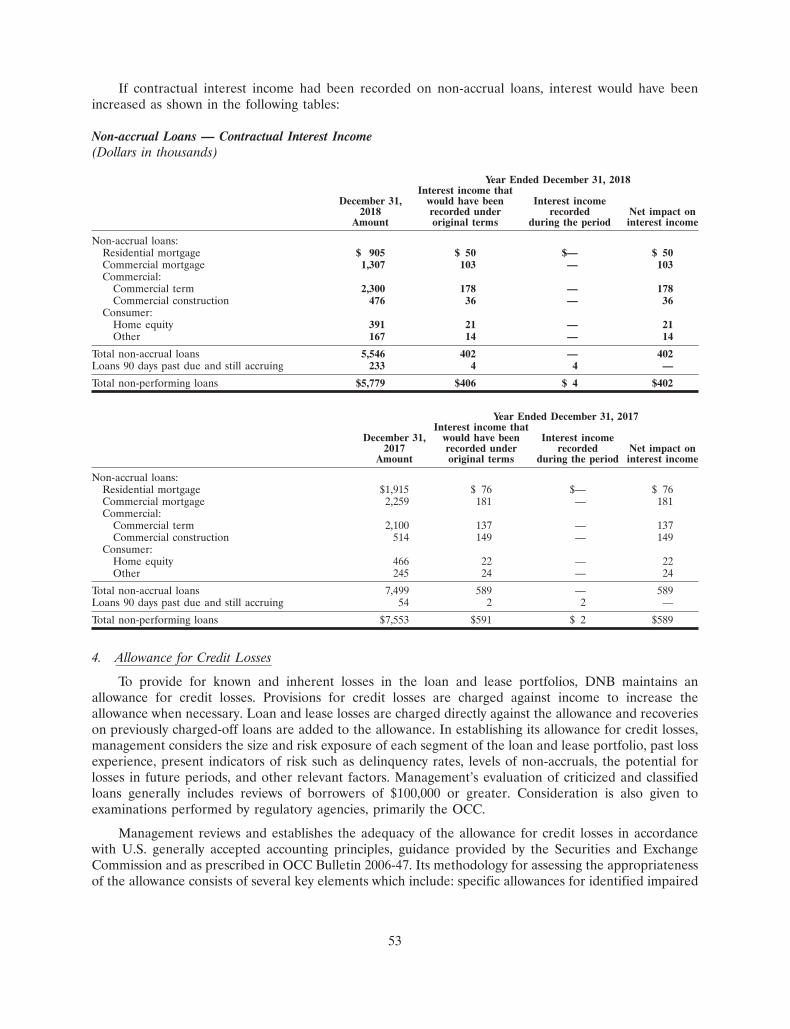
If contractual interest income had been recorded on non-accrual loans, interest would have beenincreased as shown in the following tables:
Non-accrual Loans — Contractual Interest Income(Dollars in thousands)
Year Ended December 31, 2018Interest income that
December 31, would have been Interest income2018 recorded under recorded Net impact on
Amount original terms during the period interest income
Non-accrual loans:Residential mortgage $ 905 $ 50 $— $ 50Commercial mortgage 1,307 103 — 103Commercial:
Commercial term 2,300 178 — 178Commercial construction 476 36 — 36
Consumer:Home equity 391 21 — 21Other 167 14 — 14
Total non-accrual loans 5,546 402 — 402Loans 90 days past due and still accruing 233 4 4 —
Total non-performing loans $5,779 $406 $ 4 $402
Year Ended December 31, 2017Interest income that
December 31, would have been Interest income2017 recorded under recorded Net impact on
Amount original terms during the period interest income
Non-accrual loans:Residential mortgage $1,915 $ 76 $— $ 76Commercial mortgage 2,259 181 — 181Commercial:
Commercial term 2,100 137 — 137Commercial construction 514 149 — 149
Consumer:Home equity 466 22 — 22Other 245 24 — 24
Total non-accrual loans 7,499 589 — 589Loans 90 days past due and still accruing 54 2 2 —
Total non-performing loans $7,553 $591 $ 2 $589
4. Allowance for Credit Losses
To provide for known and inherent losses in the loan and lease portfolios, DNB maintains anallowance for credit losses. Provisions for credit losses are charged against income to increase theallowance when necessary. Loan and lease losses are charged directly against the allowance and recoverieson previously charged-off loans are added to the allowance. In establishing its allowance for credit losses,management considers the size and risk exposure of each segment of the loan and lease portfolio, past lossexperience, present indicators of risk such as delinquency rates, levels of non-accruals, the potential forlosses in future periods, and other relevant factors. Management’s evaluation of criticized and classifiedloans generally includes reviews of borrowers of $100,000 or greater. Consideration is also given toexaminations performed by regulatory agencies, primarily the OCC.
Management reviews and establishes the adequacy of the allowance for credit losses in accordancewith U.S. generally accepted accounting principles, guidance provided by the Securities and ExchangeCommission and as prescribed in OCC Bulletin 2006-47. Its methodology for assessing the appropriatenessof the allowance consists of several key elements which include: specific allowances for identified impaired
53
loans; and allowances by loan type for pooled homogenous loans. In considering national and localeconomic trends, we review a variety of information including Federal Reserve publications, generaleconomic statistics, foreclosure rates and housing statistics published by third parties. We believe thisimproves the measure of inherent loss over a complete economic cycle and reduces the impact forqualitative adjustments. An unallocated portion of the allowance is intended to provide for probable lossesnot otherwise accounted for in management’s other elements of its overall estimate. An unallocatedcomponent is maintained to cover uncertainties such as changes in the national and local economy,concentrations of credit, expansion into new markets and other factors that could affect management’sestimate of probable losses. The unallocated component of the allowance also reflects the margin ofimprecision inherent in the underlying assumptions used in the methodologies for estimating specific andgeneral losses in the portfolio.
In addition, DNB reviews historical loss experience for the commercial real estate, commercial,residential real estate, home equity and consumer installment loan pools to determine historical lossfactors. The historical loss factors are then applied to the current portfolio balances to determine therequired reserve percentage for each loan pool based on risk rating. Historical losses are segregated intorisk-similar groups and a loss ratio is determined for each group over a five year period. The five yearaverage loss ratio by type is then used to calculate the estimated loss based on the current balance of eachgroup. This five year time period is appropriate given DNB’s historical level of losses and, moreimportantly, represents the current economic environment.
This analysis is intended to assess the potential for loss within the loan portfolio and to substantiatethe adequacy of the allowance. Should the analysis indicate that the allowance is not adequate,management will recommend a provision expense be made in an amount equal to the shortfall derived. Inestablishing and reviewing the allowance for adequacy, emphasis has been placed on utilizing themethodology prescribed in OCC Bulletin 2006-47. Management believes that the following factors create acomprehensive system of controls in which management can monitor the quality of the loan portfolio.Consideration has been given to the following factors and variables which may influence the risk of losswithin the loan portfolio:
• Changes in the nature and volume of the portfolio and in the terms of loans
• Changes in the volume and severity of past due loans, the volume of non-accrual loans, and thevolume and severity of adversely classified or graded loans
• The existence and effect of any concentrations of credit, and changes in the level of suchconcentrations
• Changes in lending policies and procedures, including changes in underwriting standards andcollection, charge-off, and recovery practices not considered elsewhere in estimating credit losses
• Changes in the experience, ability, and depth of lending management and other relevant staff
• Changes in the Loan Review Methodology and Degree of Oversight by Bank’s Board of Directors.
• Changes in international, national, regional, and local economic and business conditions anddevelopments that affect the collectability of the portfolio, including the condition of variousmarket segments
• The effect of other external factors such as competition and legal and regulatory requirements onthe level of estimated credit losses in the institution’s existing portfolio
• Changes in the value of underlying collateral for collateral-dependent loans
Portfolio risk includes the levels and trends in delinquencies, impaired loans, changes in the loanrating matrix and trends in volume and terms of loans. Management is satisfied with the stability of thepast due and non-performing loans and believes there has been no decline in the quality of the loan
54
portfolio due to any trend in delinquent or adversely classified loans. In determining the adequacy of theallowance, management considers any deterioration of asset quality in DNB’s commercial mortgage andresidential first mortgage portfolios. New appraisal values we have obtained for existing loans havegenerally been consistent with trends indicated by Case-Schiller and other indices.
DNB closely monitors the loan to value ratios of all classified assets and requires periodic currentappraisals to monitor underlying collateral values. Management also reviews borrower, sponsorship andguarantor’s financial strength along with their ability and willingness to provide financial support of theirobligations on an immediate and continuing basis.
The provision for credit losses decreased to $1.2 million in 2018, compared to $1.7 million in 2017.DNB’s percentage of allowance for credit losses to total loans was 0.71% at December 31, 2018 comparedto 0.69% as of December 31, 2017. Loans acquired in connection with the purchase of ERB in 2016 havebeen recorded at fair value, in accordance with GAAP, and are based on an initial estimate of the expectedcash flows, including a reduction for estimated credit losses, and without carryover of the respectiveportfolio’s historical allowance for credit losses. DNB will continually evaluate the loans acquired fromERB for additional impairment as part of our normal allowance review process. Net charge-offs were$368,000 in 2018, compared to $1.2 million in 2017. The percentage of net charge-offs to total averageloans was 0.04% in 2018, compared to 0.15% in 2017. Management is not aware of any potential problemloans, which were accruing and current at December 31, 2018, where serious doubt exists as to the abilityof the borrower to comply with the present repayment terms and that would result in a significant loss toDNB.
We typically establish a general valuation allowance on classified loans which are not impaired. Inestablishing the general valuation allowance, we segregate these loans by loan type. For commercial andconstruction loans, the determination of the category for each loan is based on periodic reviews of eachloan by our lending and credit officers as well as an independent, third-party consultant. The reviewsinclude a consideration of such factors as recent payment history, current financial data, cash flow,financial projections, collateral evaluations, guarantor or sponsorship financial strength and currenteconomic and business conditions. Categories for mortgage and consumer loans are determined through asimilar review. Classification of a loan within a category is based on identified weaknesses that increase thecredit risk of loss on the loan. The allowance percentage, is determined based on inherent losses associatedwith each type of lending as determined through consideration of our loss history with each type of loan,trends in credit quality and collateral values, and an evaluation of current economic and businessconditions.
We establish a general allowance on non-classified loans to recognize the inherent losses associatedwith lending activities, but which, unlike specific allowances, have not been allocated to particular problemloans. This general valuation allowance is determined by segregating the loans by loan category andassigning allowance percentages to each category. An evaluation of each category is made to determine theneed to further segregate the loans within each category by type. For our residential mortgage andconsumer loan portfolios, we treat them as homogeneous pools. For our commercial real estate andconstruction loan portfolios, a further analysis is made in which we segregated the loans by type based onthe purpose of the loan and the collateral properties securing the loan. Various risk factors for each type ofloan are considered, including the impact of general economic and business conditions, collateral valuetrends, credit quality trends and historical loss experience.
As of December 31, 2018, DNB had $10.8 million of non-performing assets, which included$5.8 million of non-performing loans and $5.1 million of OREO and other repossessed property. Loans arereviewed for impairment in accordance with FASB ASC 310-10-35. Impaired loans can either be secured orunsecured, not including large groups of smaller balance loans that are collectively evaluated. Impairmentis measured by the difference between the loan amount and the present value of the future cash flowdiscounted at the loan’s effective interest rate. Management measures loans for impairment by using the
55
fair value of collateral for collateral dependent loans. In general, management reduces the amount of theappraisal by the estimated cost of acquisition and disposition of the underlying collateral and comparesthat adjusted value with DNB’s carrying value. DNB establishes a specific valuation allowance on impairedloans that have a collateral shortfall, including estimated costs to sell in comparison to the carrying value ofthe loan. Of the $7.8 million of impaired loans ($5.5 million of non-performing loans, $1.8 million ofperforming TDRs, and a $514,000 performing ASC 310-30 loan) at December 31, 2018, $1.8 million had avaluation allowance of $285,000 and $6.0 million had no specific allowance. For those impaired loans thatmanagement determined that no specific valuation allowance was necessary, management has reviewed theappraisal for each loan and determined that there is no shortfall in the collateral. During the year endedDecember 31, 2018, DNB recognized $742,000 in total charge-offs, $685,000 of which related to impairedloans.
We typically order new third-party appraisals or collateral valuations when a loan becomes impairedor is transferred to OREO. This is done within two weeks of a loan becoming impaired or a loan moving toOREO. It generally takes two to eight weeks to receive the appraisals, depending on the type of propertybeing appraised. We recognize any provision or related charge-off within two weeks of receiving theappraisal after the appraisal has been reviewed by DNB. We generally order a new appraisal for allimpaired real estate loans having a balance of $100,000 or higher, every twelve months, unlessmanagement determines more frequent appraisals are necessary. We use updated valuations when timeconstraints do not permit a full appraisal process, to reflect rapidly changing market conditions. Becauseappraisals and updated valuations utilize historical data in reaching valuation conclusions, the appraised orupdated value may or may not reflect the actual sales price that we will receive at the time of sale.
Real estate appraisals typically include up to three approaches to value: the sales comparisonapproach, the income approach (for income-producing property) and the cost approach. Not all appraisalsutilize all three approaches to value. Depending on the nature of the collateral and market conditions, theappraiser may emphasize one approach over another in determining the fair value of collateral.
Appraisals may also contain different estimates of value based on the level of occupancy or futureimprovements. ‘‘As-is’’ valuations represent an estimate of value based on current market conditions withno changes to the collateral’s use or condition. ‘‘As-stabilized’’ or ‘‘as-completed’’ valuations assume thatthe collateral is improved to a stated standard or achieves its highest and best use in terms of occupancy.‘‘As-stabilized’’ valuations may be subject to a present value adjustment for market conditions or theschedule for improvements.
In connection with the valuation process, we will typically develop an exit strategy for the collateral byassessing overall market conditions, the current condition and use of the asset and its highest and best use.For most income- producing real estate, investors value most highly a stable income stream from the asset;consequently, we conduct a comparative evaluation to determine whether conducting a sale on an ‘‘as-is’’basis or on an ‘‘as-stabilized’’ basis is most likely to produce the highest net realizable value and comparethese values with the costs incurred and the holding period necessary to achieve the ‘‘as stabilized’’ value.
Our estimates of the net realizable value of collateral include a deduction for the expected costs to sellthe collateral or such other deductions as deemed appropriate. For most real estate collateral, we apply aseven to ten percent deduction to the value of real estate collateral to determine its expected costs to sellthe asset. This estimate generally includes real estate commissions, one year of real estate taxes andmiscellaneous repair and closing costs. If we receive a purchase offer that requires unbudgeted repairs, orif the expected holding period for the asset exceeds one year, then we include the additional real estatetaxes and repairs or other holding costs in the expected costs to sell the collateral on a case-by-case basis.
56
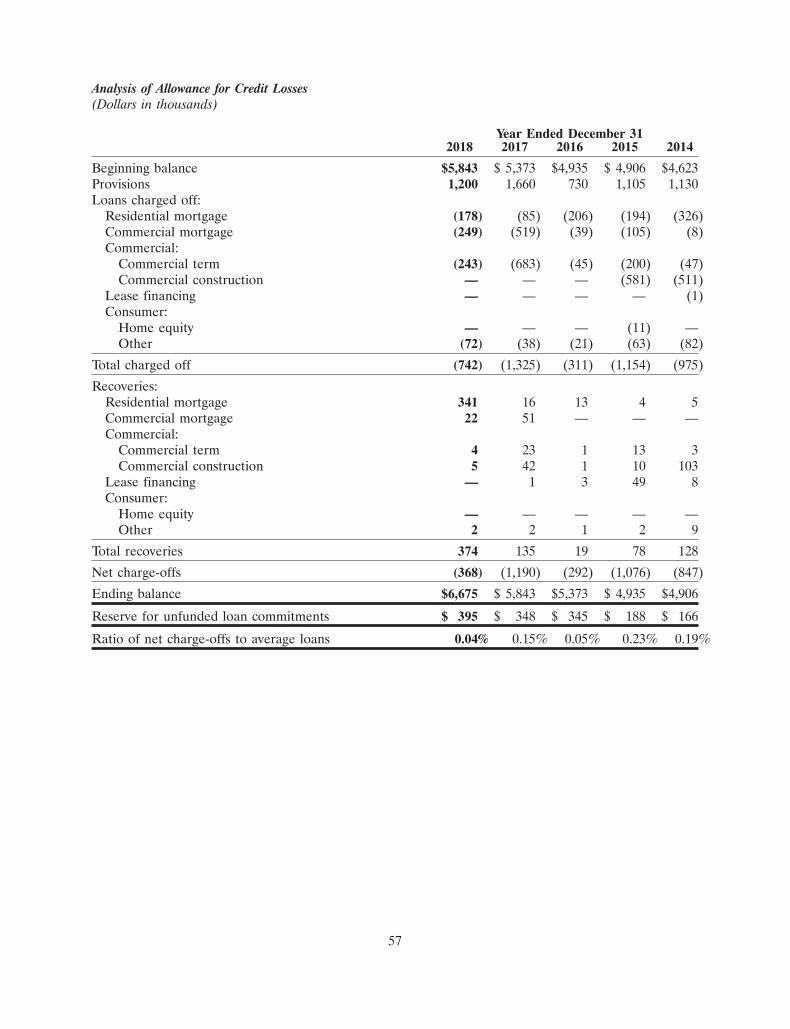
Analysis of Allowance for Credit Losses(Dollars in thousands)
Year Ended December 312018 2017 2016 2015 2014
Beginning balance $5,843 $ 5,373 $4,935 $ 4,906 $4,623Provisions 1,200 1,660 730 1,105 1,130Loans charged off:
Residential mortgage (178) (85) (206) (194) (326)Commercial mortgage (249) (519) (39) (105) (8)Commercial:
Commercial term (243) (683) (45) (200) (47)Commercial construction — — — (581) (511)
Lease financing — — — — (1)Consumer:
Home equity — — — (11) —Other (72) (38) (21) (63) (82)
Total charged off (742) (1,325) (311) (1,154) (975)
Recoveries:Residential mortgage 341 16 13 4 5Commercial mortgage 22 51 — — —Commercial:
Commercial term 4 23 1 13 3Commercial construction 5 42 1 10 103
Lease financing — 1 3 49 8Consumer:
Home equity — — — — —Other 2 2 1 2 9
Total recoveries 374 135 19 78 128
Net charge-offs (368) (1,190) (292) (1,076) (847)
Ending balance $6,675 $ 5,843 $5,373 $ 4,935 $4,906
Reserve for unfunded loan commitments $ 395 $ 348 $ 345 $ 188 $ 166
Ratio of net charge-offs to average loans 0.04% 0.15% 0.05% 0.23% 0.19%
57
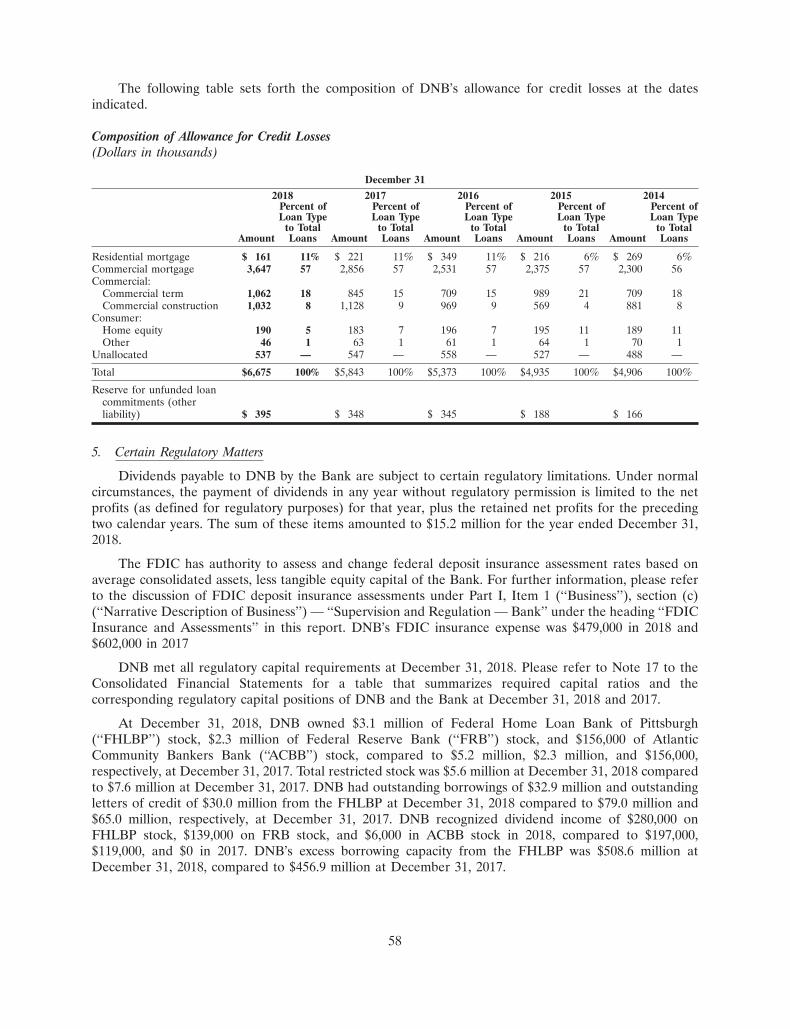
The following table sets forth the composition of DNB’s allowance for credit losses at the datesindicated.
Composition of Allowance for Credit Losses(Dollars in thousands)
December 31
2018 2017 2016 2015 2014Percent of Percent of Percent of Percent of Percent ofLoan Type Loan Type Loan Type Loan Type Loan Type
to Total to Total to Total to Total to TotalAmount Loans Amount Loans Amount Loans Amount Loans Amount Loans
Residential mortgage $ 161 11% $ 221 11% $ 349 11% $ 216 6% $ 269 6%Commercial mortgage 3,647 57 2,856 57 2,531 57 2,375 57 2,300 56Commercial:
Commercial term 1,062 18 845 15 709 15 989 21 709 18Commercial construction 1,032 8 1,128 9 969 9 569 4 881 8
Consumer:Home equity 190 5 183 7 196 7 195 11 189 11Other 46 1 63 1 61 1 64 1 70 1
Unallocated 537 — 547 — 558 — 527 — 488 —
Total $6,675 100% $5,843 100% $5,373 100% $4,935 100% $4,906 100%
Reserve for unfunded loancommitments (otherliability) $ 395 $ 348 $ 345 $ 188 $ 166
5. Certain Regulatory Matters
Dividends payable to DNB by the Bank are subject to certain regulatory limitations. Under normalcircumstances, the payment of dividends in any year without regulatory permission is limited to the netprofits (as defined for regulatory purposes) for that year, plus the retained net profits for the precedingtwo calendar years. The sum of these items amounted to $15.2 million for the year ended December 31,2018.
The FDIC has authority to assess and change federal deposit insurance assessment rates based onaverage consolidated assets, less tangible equity capital of the Bank. For further information, please referto the discussion of FDIC deposit insurance assessments under Part I, Item 1 (‘‘Business’’), section (c)(‘‘Narrative Description of Business’’) — ‘‘Supervision and Regulation — Bank’’ under the heading ‘‘FDICInsurance and Assessments’’ in this report. DNB’s FDIC insurance expense was $479,000 in 2018 and$602,000 in 2017
DNB met all regulatory capital requirements at December 31, 2018. Please refer to Note 17 to theConsolidated Financial Statements for a table that summarizes required capital ratios and thecorresponding regulatory capital positions of DNB and the Bank at December 31, 2018 and 2017.
At December 31, 2018, DNB owned $3.1 million of Federal Home Loan Bank of Pittsburgh(‘‘FHLBP’’) stock, $2.3 million of Federal Reserve Bank (‘‘FRB’’) stock, and $156,000 of AtlanticCommunity Bankers Bank (‘‘ACBB’’) stock, compared to $5.2 million, $2.3 million, and $156,000,respectively, at December 31, 2017. Total restricted stock was $5.6 million at December 31, 2018 comparedto $7.6 million at December 31, 2017. DNB had outstanding borrowings of $32.9 million and outstandingletters of credit of $30.0 million from the FHLBP at December 31, 2018 compared to $79.0 million and$65.0 million, respectively, at December 31, 2017. DNB recognized dividend income of $280,000 onFHLBP stock, $139,000 on FRB stock, and $6,000 in ACBB stock in 2018, compared to $197,000,$119,000, and $0 in 2017. DNB’s excess borrowing capacity from the FHLBP was $508.6 million atDecember 31, 2018, compared to $456.9 million at December 31, 2017.
58
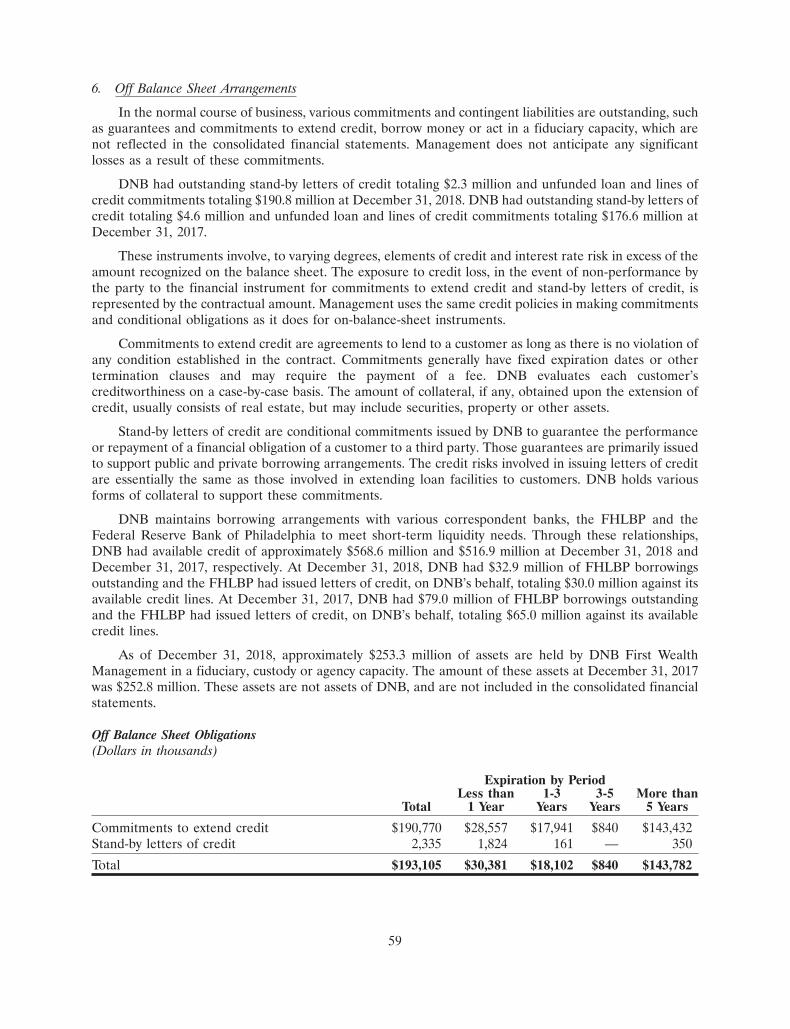
6. Off Balance Sheet Arrangements
In the normal course of business, various commitments and contingent liabilities are outstanding, suchas guarantees and commitments to extend credit, borrow money or act in a fiduciary capacity, which arenot reflected in the consolidated financial statements. Management does not anticipate any significantlosses as a result of these commitments.
DNB had outstanding stand-by letters of credit totaling $2.3 million and unfunded loan and lines ofcredit commitments totaling $190.8 million at December 31, 2018. DNB had outstanding stand-by letters ofcredit totaling $4.6 million and unfunded loan and lines of credit commitments totaling $176.6 million atDecember 31, 2017.
These instruments involve, to varying degrees, elements of credit and interest rate risk in excess of theamount recognized on the balance sheet. The exposure to credit loss, in the event of non-performance bythe party to the financial instrument for commitments to extend credit and stand-by letters of credit, isrepresented by the contractual amount. Management uses the same credit policies in making commitmentsand conditional obligations as it does for on-balance-sheet instruments.
Commitments to extend credit are agreements to lend to a customer as long as there is no violation ofany condition established in the contract. Commitments generally have fixed expiration dates or othertermination clauses and may require the payment of a fee. DNB evaluates each customer’screditworthiness on a case-by-case basis. The amount of collateral, if any, obtained upon the extension ofcredit, usually consists of real estate, but may include securities, property or other assets.
Stand-by letters of credit are conditional commitments issued by DNB to guarantee the performanceor repayment of a financial obligation of a customer to a third party. Those guarantees are primarily issuedto support public and private borrowing arrangements. The credit risks involved in issuing letters of creditare essentially the same as those involved in extending loan facilities to customers. DNB holds variousforms of collateral to support these commitments.
DNB maintains borrowing arrangements with various correspondent banks, the FHLBP and theFederal Reserve Bank of Philadelphia to meet short-term liquidity needs. Through these relationships,DNB had available credit of approximately $568.6 million and $516.9 million at December 31, 2018 andDecember 31, 2017, respectively. At December 31, 2018, DNB had $32.9 million of FHLBP borrowingsoutstanding and the FHLBP had issued letters of credit, on DNB’s behalf, totaling $30.0 million against itsavailable credit lines. At December 31, 2017, DNB had $79.0 million of FHLBP borrowings outstandingand the FHLBP had issued letters of credit, on DNB’s behalf, totaling $65.0 million against its availablecredit lines.
As of December 31, 2018, approximately $253.3 million of assets are held by DNB First WealthManagement in a fiduciary, custody or agency capacity. The amount of these assets at December 31, 2017was $252.8 million. These assets are not assets of DNB, and are not included in the consolidated financialstatements.
Off Balance Sheet Obligations(Dollars in thousands)
Expiration by PeriodLess than 1-3 3-5 More than
Total 1 Year Years Years 5 Years
Commitments to extend credit $190,770 $28,557 $17,941 $840 $143,432Stand-by letters of credit 2,335 1,824 161 — 350
Total $193,105 $30,381 $18,102 $840 $143,782
59
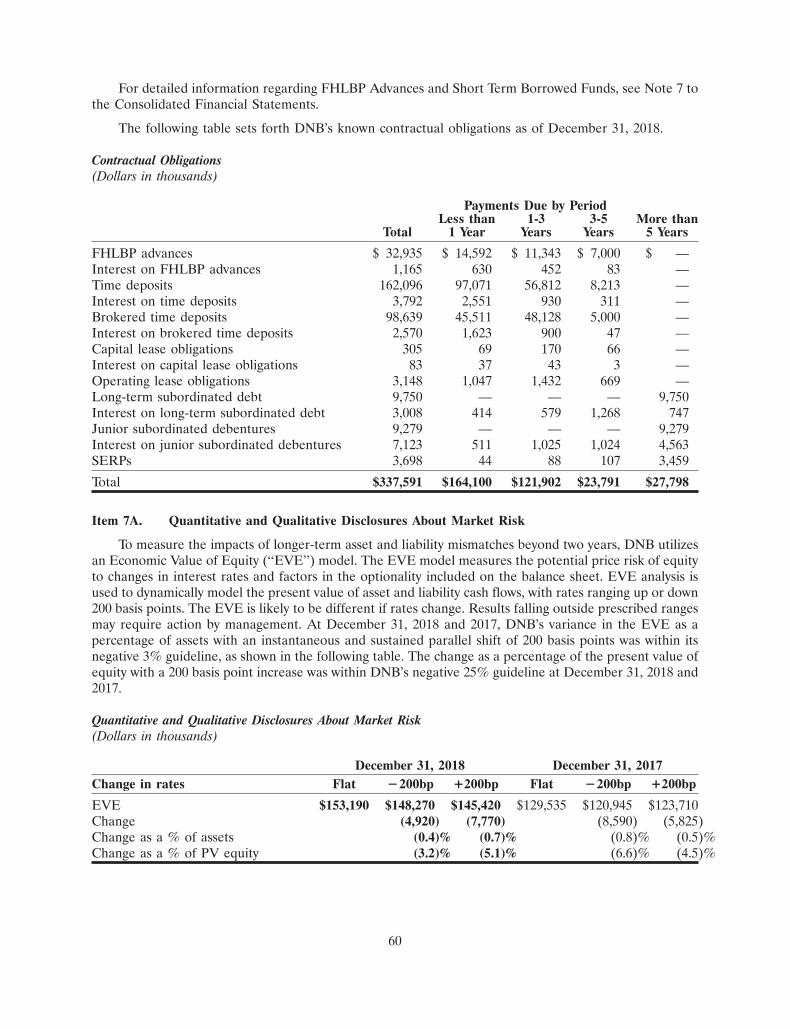
For detailed information regarding FHLBP Advances and Short Term Borrowed Funds, see Note 7 tothe Consolidated Financial Statements.
The following table sets forth DNB’s known contractual obligations as of December 31, 2018.
Contractual Obligations(Dollars in thousands)
Payments Due by PeriodLess than 1-3 3-5 More than
Total 1 Year Years Years 5 Years
FHLBP advances $ 32,935 $ 14,592 $ 11,343 $ 7,000 $ —Interest on FHLBP advances 1,165 630 452 83 —Time deposits 162,096 97,071 56,812 8,213 —Interest on time deposits 3,792 2,551 930 311 —Brokered time deposits 98,639 45,511 48,128 5,000 —Interest on brokered time deposits 2,570 1,623 900 47 —Capital lease obligations 305 69 170 66 —Interest on capital lease obligations 83 37 43 3 —Operating lease obligations 3,148 1,047 1,432 669 —Long-term subordinated debt 9,750 — — — 9,750Interest on long-term subordinated debt 3,008 414 579 1,268 747Junior subordinated debentures 9,279 — — — 9,279Interest on junior subordinated debentures 7,123 511 1,025 1,024 4,563SERPs 3,698 44 88 107 3,459
Total $337,591 $164,100 $121,902 $23,791 $27,798
Item 7A. Quantitative and Qualitative Disclosures About Market Risk
To measure the impacts of longer-term asset and liability mismatches beyond two years, DNB utilizesan Economic Value of Equity (‘‘EVE’’) model. The EVE model measures the potential price risk of equityto changes in interest rates and factors in the optionality included on the balance sheet. EVE analysis isused to dynamically model the present value of asset and liability cash flows, with rates ranging up or down200 basis points. The EVE is likely to be different if rates change. Results falling outside prescribed rangesmay require action by management. At December 31, 2018 and 2017, DNB’s variance in the EVE as apercentage of assets with an instantaneous and sustained parallel shift of 200 basis points was within itsnegative 3% guideline, as shown in the following table. The change as a percentage of the present value ofequity with a 200 basis point increase was within DNB’s negative 25% guideline at December 31, 2018 and2017.
Quantitative and Qualitative Disclosures About Market Risk(Dollars in thousands)
December 31, 2018 December 31, 2017Change in rates Flat �200bp +200bp Flat �200bp +200bp
EVE $153,190 $148,270 $145,420 $129,535 $120,945 $123,710Change (4,920) (7,770) (8,590) (5,825)Change as a % of assets (0.4)% (0.7)% (0.8)% (0.5)%Change as a % of PV equity (3.2)% (5.1)% (6.6)% (4.5)%
60
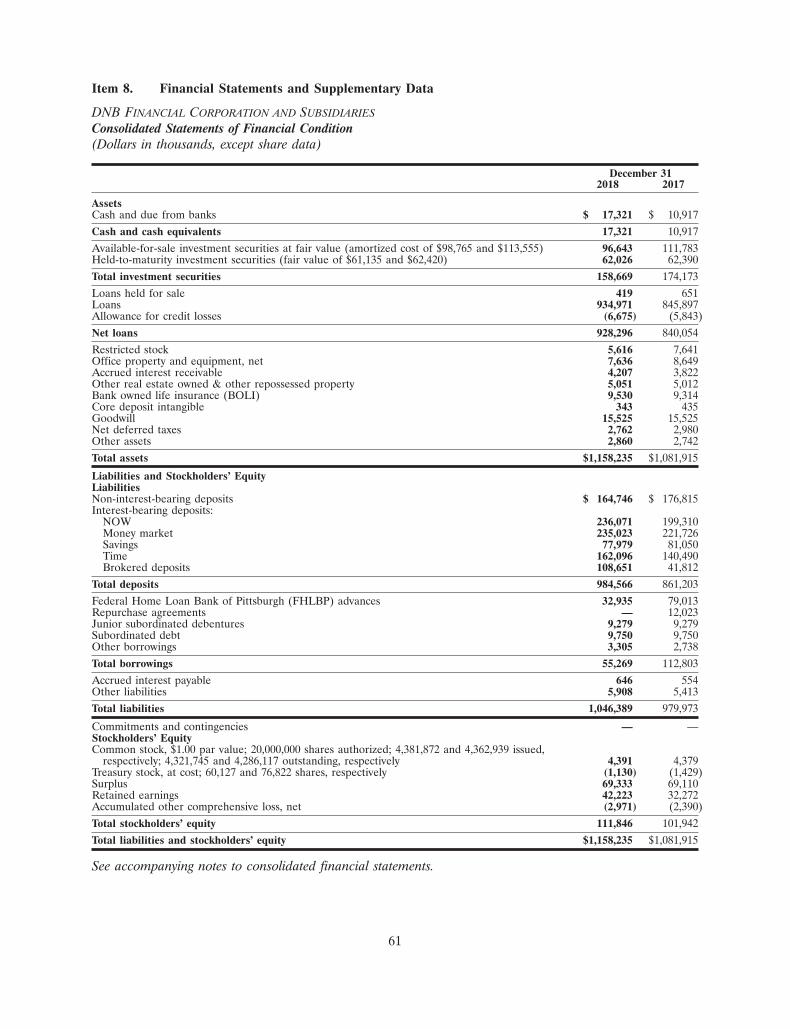
Item 8. Financial Statements and Supplementary Data
DNB FINANCIAL CORPORATION AND SUBSIDIARIES
Consolidated Statements of Financial Condition(Dollars in thousands, except share data)
December 312018 2017
AssetsCash and due from banks $ 17,321 $ 10,917Cash and cash equivalents 17,321 10,917Available-for-sale investment securities at fair value (amortized cost of $98,765 and $113,555) 96,643 111,783Held-to-maturity investment securities (fair value of $61,135 and $62,420) 62,026 62,390Total investment securities 158,669 174,173Loans held for sale 419 651Loans 934,971 845,897Allowance for credit losses (6,675) (5,843)Net loans 928,296 840,054Restricted stock 5,616 7,641Office property and equipment, net 7,636 8,649Accrued interest receivable 4,207 3,822Other real estate owned & other repossessed property 5,051 5,012Bank owned life insurance (BOLI) 9,530 9,314Core deposit intangible 343 435Goodwill 15,525 15,525Net deferred taxes 2,762 2,980Other assets 2,860 2,742Total assets $1,158,235 $1,081,915
Liabilities and Stockholders’ EquityLiabilitiesNon-interest-bearing deposits $ 164,746 $ 176,815Interest-bearing deposits:
NOW 236,071 199,310Money market 235,023 221,726Savings 77,979 81,050Time 162,096 140,490Brokered deposits 108,651 41,812
Total deposits 984,566 861,203Federal Home Loan Bank of Pittsburgh (FHLBP) advances 32,935 79,013Repurchase agreements — 12,023Junior subordinated debentures 9,279 9,279Subordinated debt 9,750 9,750Other borrowings 3,305 2,738Total borrowings 55,269 112,803Accrued interest payable 646 554Other liabilities 5,908 5,413Total liabilities 1,046,389 979,973
Commitments and contingencies — —Stockholders’ EquityCommon stock, $1.00 par value; 20,000,000 shares authorized; 4,381,872 and 4,362,939 issued,
respectively; 4,321,745 and 4,286,117 outstanding, respectively 4,391 4,379Treasury stock, at cost; 60,127 and 76,822 shares, respectively (1,130) (1,429)Surplus 69,333 69,110Retained earnings 42,223 32,272Accumulated other comprehensive loss, net (2,971) (2,390)Total stockholders’ equity 111,846 101,942Total liabilities and stockholders’ equity $1,158,235 $1,081,915
See accompanying notes to consolidated financial statements.
61
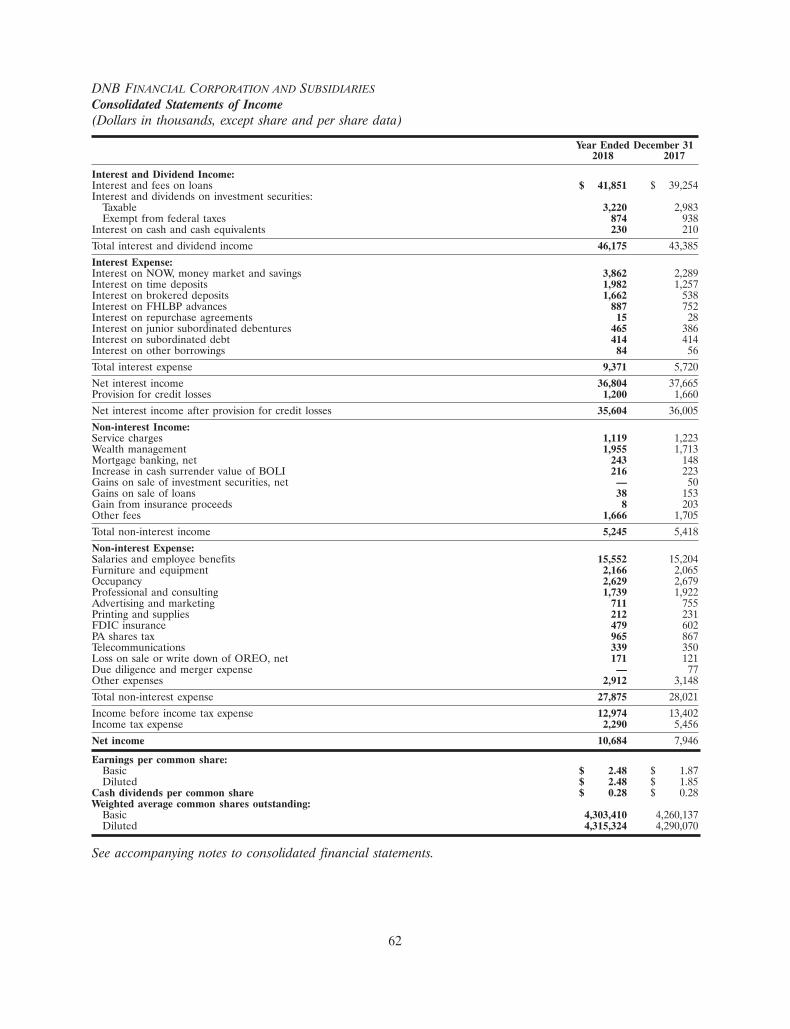
DNB FINANCIAL CORPORATION AND SUBSIDIARIES
Consolidated Statements of Income(Dollars in thousands, except share and per share data)
Year Ended December 312018 2017
Interest and Dividend Income:Interest and fees on loans $ 41,851 $ 39,254Interest and dividends on investment securities:
Taxable 3,220 2,983Exempt from federal taxes 874 938
Interest on cash and cash equivalents 230 210
Total interest and dividend income 46,175 43,385
Interest Expense:Interest on NOW, money market and savings 3,862 2,289Interest on time deposits 1,982 1,257Interest on brokered deposits 1,662 538Interest on FHLBP advances 887 752Interest on repurchase agreements 15 28Interest on junior subordinated debentures 465 386Interest on subordinated debt 414 414Interest on other borrowings 84 56
Total interest expense 9,371 5,720
Net interest income 36,804 37,665Provision for credit losses 1,200 1,660
Net interest income after provision for credit losses 35,604 36,005
Non-interest Income:Service charges 1,119 1,223Wealth management 1,955 1,713Mortgage banking, net 243 148Increase in cash surrender value of BOLI 216 223Gains on sale of investment securities, net — 50Gains on sale of loans 38 153Gain from insurance proceeds 8 203Other fees 1,666 1,705
Total non-interest income 5,245 5,418
Non-interest Expense:Salaries and employee benefits 15,552 15,204Furniture and equipment 2,166 2,065Occupancy 2,629 2,679Professional and consulting 1,739 1,922Advertising and marketing 711 755Printing and supplies 212 231FDIC insurance 479 602PA shares tax 965 867Telecommunications 339 350Loss on sale or write down of OREO, net 171 121Due diligence and merger expense — 77Other expenses 2,912 3,148
Total non-interest expense 27,875 28,021
Income before income tax expense 12,974 13,402Income tax expense 2,290 5,456
Net income 10,684 7,946
Earnings per common share:Basic $ 2.48 $ 1.87Diluted $ 2.48 $ 1.85
Cash dividends per common share $ 0.28 $ 0.28Weighted average common shares outstanding:
Basic 4,303,410 4,260,137Diluted 4,315,324 4,290,070
See accompanying notes to consolidated financial statements.
62
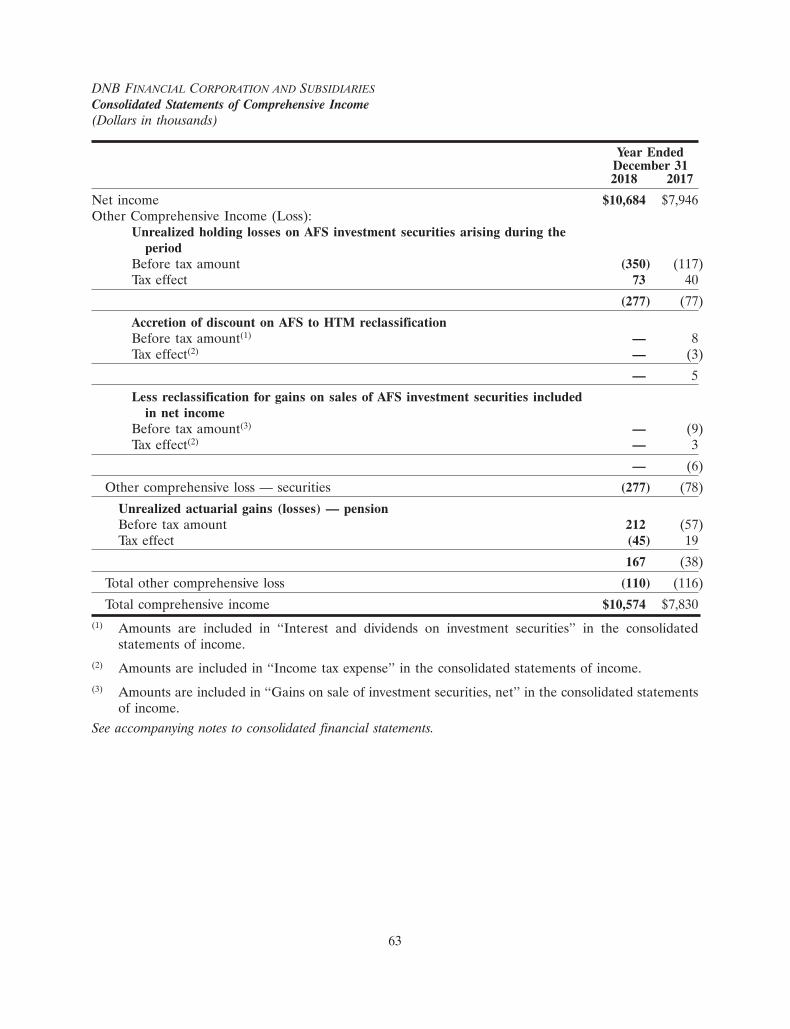
DNB FINANCIAL CORPORATION AND SUBSIDIARIES
Consolidated Statements of Comprehensive Income(Dollars in thousands)
Year EndedDecember 312018 2017
Net income $10,684 $7,946Other Comprehensive Income (Loss):
Unrealized holding losses on AFS investment securities arising during theperiod
Before tax amount (350) (117)Tax effect 73 40
(277) (77)
Accretion of discount on AFS to HTM reclassificationBefore tax amount(1) — 8Tax effect(2) — (3)
— 5
Less reclassification for gains on sales of AFS investment securities includedin net income
Before tax amount(3) — (9)Tax effect(2) — 3
— (6)
Other comprehensive loss — securities (277) (78)
Unrealized actuarial gains (losses) — pensionBefore tax amount 212 (57)Tax effect (45) 19
167 (38)
Total other comprehensive loss (110) (116)
Total comprehensive income $10,574 $7,830(1) Amounts are included in ‘‘Interest and dividends on investment securities’’ in the consolidated
statements of income.(2) Amounts are included in ‘‘Income tax expense’’ in the consolidated statements of income.(3) Amounts are included in ‘‘Gains on sale of investment securities, net’’ in the consolidated statements
of income.See accompanying notes to consolidated financial statements.
63
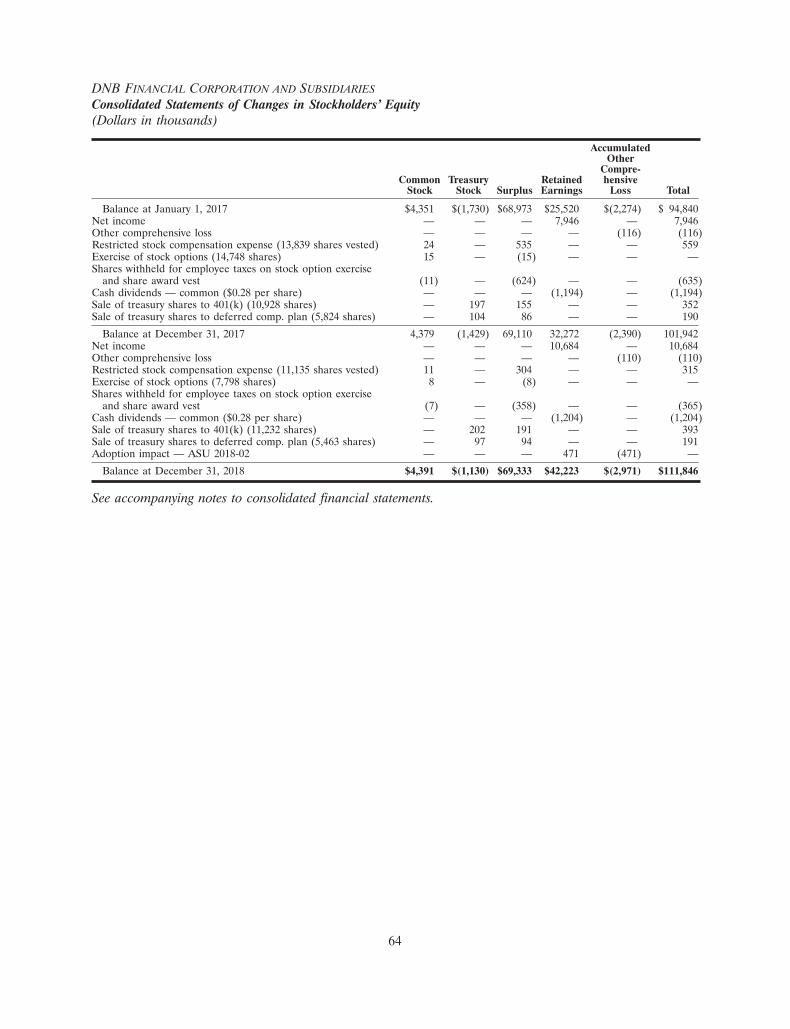
DNB FINANCIAL CORPORATION AND SUBSIDIARIES
Consolidated Statements of Changes in Stockholders’ Equity(Dollars in thousands)
AccumulatedOther
Compre-Common Treasury Retained hensive
Stock Stock Surplus Earnings Loss Total
Balance at January 1, 2017 $4,351 $(1,730) $68,973 $25,520 $(2,274) $ 94,840Net income — — — 7,946 — 7,946Other comprehensive loss — — — — (116) (116)Restricted stock compensation expense (13,839 shares vested) 24 — 535 — — 559Exercise of stock options (14,748 shares) 15 — (15) — — —Shares withheld for employee taxes on stock option exercise
and share award vest (11) — (624) — — (635)Cash dividends — common ($0.28 per share) — — — (1,194) — (1,194)Sale of treasury shares to 401(k) (10,928 shares) — 197 155 — — 352Sale of treasury shares to deferred comp. plan (5,824 shares) — 104 86 — — 190
Balance at December 31, 2017 4,379 (1,429) 69,110 32,272 (2,390) 101,942Net income — — — 10,684 — 10,684Other comprehensive loss — — — — (110) (110)Restricted stock compensation expense (11,135 shares vested) 11 — 304 — — 315Exercise of stock options (7,798 shares) 8 — (8) — — —Shares withheld for employee taxes on stock option exercise
and share award vest (7) — (358) — — (365)Cash dividends — common ($0.28 per share) — — — (1,204) — (1,204)Sale of treasury shares to 401(k) (11,232 shares) — 202 191 — — 393Sale of treasury shares to deferred comp. plan (5,463 shares) — 97 94 — — 191Adoption impact — ASU 2018-02 — — — 471 (471) —
Balance at December 31, 2018 $4,391 $(1,130) $69,333 $42,223 $(2,971) $111,846
See accompanying notes to consolidated financial statements.
64

DNB FINANCIAL CORPORATION AND SUBSIDIARIESConsolidated Statements of Cash Flows(Dollars in thousands)
Year EndedDecember 31
2018 2017
Cash Flows From Operating Activities:Net income $ 10,684 $ 7,946Adjustments to reconcile net income to net cash provided by operating activities:
Depreciation, amortization and accretion 1,499 1,649Provision for credit losses 1,200 1,660Stock based compensation 315 559Non-cash funding of retirement plans 584 542Net gain on sale of securities — (50)Net loss on sale and write down of OREO and other repossessed property 171 121Gain on insurance proceeds (8) (203)Earnings from investment in BOLI (216) (223)Deferred tax expense 247 2,329Proceeds from sales of mortgage loans 14,170 5,710Mortgage loans originated for sale (13,695) (6,213)Gain on sale of mortgage loans (243) (148)Proceeds from sales of loans 806 2,403Loans originated for sale (768) (2,250)Gain on sale of loans (38) (153)Increase in accrued interest receivable (385) (255)Increase in other assets (118) (405)Increase in accrued interest payable 92 20Increase in other liabilities 706 1,899
Net Cash Provided By Operating Activities 15,003 14,938Cash Flows From Investing Activities:Activity in available-for-sale securities:
Sales — 3,030Maturities, repayments and calls 24,490 30,201Purchases (10,000) (30,352)
Activity in held-to-maturity securities:Sales — 737Maturities, repayments and calls 489 5,442Purchases — (1,407)
Net decrease (increase) in restricted stock 2,025 (2,260)Net increase in loans (86,914) (32,453)Death benefit proceeds 8 664Purchases of office property and equipment (219) (642)Expenses capitalized in OREO — (15)Proceeds from sale of OREO and other repossessed property 262 609Net Cash Used in Investing Activities (69,859) (26,446)Cash Flows From Financing Activities:Net increase (decrease) in deposits 123,363 (23,984)Repayment of FHLBP advances (240,678) (46,167)Funding of FHLBP advances 194,600 69,848Net (decrease) increase in repurchase agreements (12,023) 134(Decrease) increase in other borrowings (2,433) 2,320Dividends paid (1,204) (1,194)Payment of employee taxes on stock option exercise and share award vest (365) (635)Net Cash Provided by Financing Activities 61,260 322Net Change in Cash and Cash Equivalents 6,404 (11,186)Cash and Cash Equivalents at Beginning of Period 10,917 22,103Cash and Cash Equivalents at End of Period $ 17,321 $ 10,917Supplemental Disclosure of Cash Flow Information:Cash paid during the period for:Interest $ 9,279 $ 5,700Income taxes 1,400 3,511Supplemental Disclosure of Non-cash Flow Information:Net decrease in goodwill — 65Transfers from loans to other real estate owned and other repossessed property 472 2,960Purchased loans not yet funded 3,000 —
See accompanying notes to consolidated financial statements.
65
Notes to Consolidated Financial Statements
(1) SUMMARY OF SIGNIFICANT ACCOUNTING POLICIES
DNB Financial Corporation (the ‘‘Corporation’’ or ‘‘DNB’’) through its wholly owned subsidiary,DNB First, National Association (the ‘‘Bank’’), formerly Downingtown National Bank, has been servingindividuals and small to medium sized businesses of southeastern Pennsylvania since 1860. DNB CapitalTrust I and II are special purpose Delaware business trusts, which are not consolidated as they areconsidered variable interest entities and the Corporation is not the primary beneficiary (see additionaldiscussion in Junior Subordinated Debentures — Note 9). The Bank is a locally managed commercial bankproviding personal and commercial loans and deposit products, in addition to investment and trust servicesfrom fifteen community offices. The Bank encounters vigorous competition for market share fromcommercial banks, thrift institutions, credit unions and other financial intermediaries.
The consolidated financial statements of DNB and its subsidiary, the Bank, which together aremanaged as a single operating segment (‘‘Community Banking’’), are prepared in accordance with U.S.generally accepted accounting principles applicable to the banking industry.
In preparing the consolidated financial statements, management is required to make estimates andassumptions that affect the reported amounts of assets and liabilities, the disclosure of contingent assetsand liabilities at the date of the Consolidated Statements of Financial Condition, and the reportedamounts of revenues and expenses during the reporting period. Actual results could differ from theseestimates. Amounts subject to significant estimates are items such as the allowance for credit losses andlending related commitments, the fair value of repossessed assets, pension and post-retirement obligations,the fair value of financial instruments, other-than-temporary impairments of investment securities, thevaluation of assets acquired and liabilities assumed in business combinations, and the valuations ofgoodwill for impairment. Among other effects, such changes could result in future impairments ofinvestment securities, and establishment of allowances for credit losses and lending related commitmentsas well as increased benefit plans’ expenses.
Reclassifications Certain reclassifications have been made to prior years’ balances to conform to theclassifications used in 2018. These reclassifications had no impact on DNB’s consolidated financialposition, results of income or net change in cash and cash equivalents. The 2017 statement of cash flowsincludes the presentation of $542,000 as non-cash funding of retirement plans, included in net cashprovided by operating activities. This amount was previously reported as sale of treasury stock, included innet cash provided by financing activities, in the 2017 financial statements.
Accounting Developments Affecting DNB In May 2014, the FASB issued ASU No. 2014-09, ‘‘Revenuefrom Contracts with Customers (Topic 606).’’ The updated standard is a new comprehensive revenuerecognition model that requires revenue to be recognized in a manner that depicts the transfer of goods orservices to a customer at an amount that reflects the consideration expected to be received in exchange forthose goods or services. In August 2015, the FASB issued ASU 2015-14 which deferred the effective date ofASU 2014-09 by one year. During 2016 and 2017, the FASB issued ASU Nos. 2016-10, 2016-12, 2016-20,and 2017-13 that provides additional guidance related to the identification of performance obligationswithin a contract, assessing collectability, contract costs, and other technical corrections and improvements.
DNB adopted the new standards effective January 1, 2018 using the modified retrospective approach.A significant majority of DNB’s revenues are explicitly excluded from the scope of the new guidanceincluding interest, dividend income, BOLI, gain/loss on sale of loans and investments on the ConsolidatedStatements of Income. The adoption of ASU 2014-09 did not require a cumulative adjustment to theopening balance of retained earnings as of January 1, 2018 and does not have a material impact on DNB’sConsolidated Statements of Financial Condition, Comprehensive Income, Stockholders’ Equity or CashFlows for the year ended December 31, 2018. Non-interest income components in the scope of Topic 606continue to be recognized when DNB’s performance obligations are complete or at the time of sale after a
66
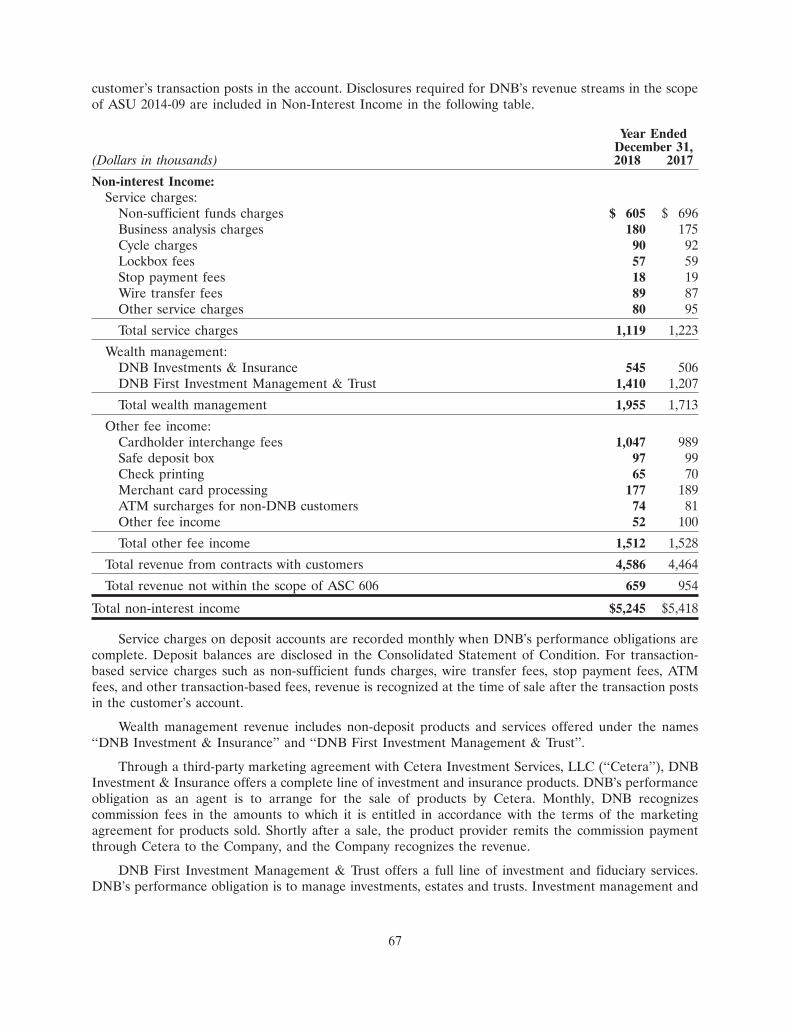
customer’s transaction posts in the account. Disclosures required for DNB’s revenue streams in the scopeof ASU 2014-09 are included in Non-Interest Income in the following table.
Year EndedDecember 31,
(Dollars in thousands) 2018 2017
Non-interest Income:Service charges:
Non-sufficient funds charges $ 605 $ 696Business analysis charges 180 175Cycle charges 90 92Lockbox fees 57 59Stop payment fees 18 19Wire transfer fees 89 87Other service charges 80 95
Total service charges 1,119 1,223
Wealth management:DNB Investments & Insurance 545 506DNB First Investment Management & Trust 1,410 1,207
Total wealth management 1,955 1,713
Other fee income:Cardholder interchange fees 1,047 989Safe deposit box 97 99Check printing 65 70Merchant card processing 177 189ATM surcharges for non-DNB customers 74 81Other fee income 52 100
Total other fee income 1,512 1,528
Total revenue from contracts with customers 4,586 4,464
Total revenue not within the scope of ASC 606 659 954
Total non-interest income $5,245 $5,418
Service charges on deposit accounts are recorded monthly when DNB’s performance obligations arecomplete. Deposit balances are disclosed in the Consolidated Statement of Condition. For transaction-based service charges such as non-sufficient funds charges, wire transfer fees, stop payment fees, ATMfees, and other transaction-based fees, revenue is recognized at the time of sale after the transaction postsin the customer’s account.
Wealth management revenue includes non-deposit products and services offered under the names‘‘DNB Investment & Insurance’’ and ‘‘DNB First Investment Management & Trust’’.
Through a third-party marketing agreement with Cetera Investment Services, LLC (‘‘Cetera’’), DNBInvestment & Insurance offers a complete line of investment and insurance products. DNB’s performanceobligation as an agent is to arrange for the sale of products by Cetera. Monthly, DNB recognizescommission fees in the amounts to which it is entitled in accordance with the terms of the marketingagreement for products sold. Shortly after a sale, the product provider remits the commission paymentthrough Cetera to the Company, and the Company recognizes the revenue.
DNB First Investment Management & Trust offers a full line of investment and fiduciary services.DNB’s performance obligation is to manage investments, estates and trusts. Investment management and
67

trust income is primarily comprised of fees earned from the management and administration of trusts,estates and investment agency portfolios. The Company’s performance obligation is generally satisfied overtime and the resulting fees are recognized quarterly, based upon the quarter-end market value of the assetsunder management and the applicable fee rate. Payment is generally received a few days after quarter endthrough a direct charge to customers’ accounts. While managing estates and trusts, DNB contracts with athird-party tax preparation service. For tax preparation services, DNB’s obligation as an agent is to arrangefor the performance of services by the third party. As tax services are rendered, DNB records revenue netof the cost of the services.
Cardholder interchange fees consist of revenue DNB is entitled per agreements with third party debitand credit card providers. DNB’s performance obligation as an agent is to arrange for cardholder serviceswith its customers in accordance with fees and terms offered by the third-party service providers. Based oncardholder transactions reported by third party service providers, DNB recognizes fees for the amount it iscontractually entitled.
DNB also contracts with third party providers for check printing, merchant card services, and ATMservices. DNB’s performance obligation as an agent is to arrange for the services with its customers inaccordance with fees and terms offered by the third-party service providers. Monthly, DNB recognizes feesfor the amount it is contractually entitled.
DNB adopted ASU 2015-16, Business Combinations (Topic 805), in 2016: Simplifying the Accountingfor Measurement Period Adjustments on a prospective basis. This amendment eliminates the requirementto account for adjustments to provisional amounts recognized in a business combination retrospectively.Instead, the acquirer will recognize the adjustments to provisional amounts during the period in which theadjustments are determined, including the effect on earnings of any amounts the acquirer would haverecorded in previous periods if the accounting had been completed at the acquisition date. DNB evaluatedthe impact of this guidance and it does not have a material impact to the consolidated financial statements.
In January 2016, the FASB issued ASU No. 2016-01, Financial Instruments — Overall(Subtopic 825-10) — Recognition and Measurement of Financial Assets and Financial Liabilities. Theguidance addresses certain aspects of recognition, measurement, presentation and disclosure of financialinstruments. In particular, the guidance revises an entity’s accounting related to (1) the classification andmeasurement of investments in equity securities and (2) the presentation of certain fair value changes forfinancial liabilities measured at fair value. The guidance also amends certain disclosure requirementsassociated with fair value of financial instruments. For public business entities, the guidance is effective forfiscal years beginning after December 15, 2017, including interim periods within those fiscal years. Entitiesshould apply the amendments by means of a cumulative-effect adjustment to the balance sheet as of thebeginning of the fiscal year of adoption. As of January 1, 2018, DNB did not hold any equity investments(excluding restricted investments in bank stocks). DNB does not expect to make significant purchases ofequity investments; therefore, the adoption of this ASU is not material to DNB’s consolidated financialstatements. Adoption of the standard on January 1, 2018 also resulted in the use of an exit price ratherthan an entrance price to determine the fair value of loans not measured at fair value on a non-recurringbasis in the consolidated balance sheets.
In February 2016, the FASB issued Accounting Standards Update No. 2016-02, Leases. The newstandard establishes a right-of-use (ROU) model that requires a lessee to record a ROU asset and a leaseliability on the balance sheet for all leases with terms longer than 12 months. Leases will be classified aseither finance or operating, with classification affecting the pattern of expense recognition in the incomestatement. The new standard is effective for fiscal years beginning after December 15, 2018, includinginterim periods within those fiscal years. A modified retrospective transition approach is required forlessees for capital and operating leases existing at, or entered into after, the beginning of the earliestcomparative period presented in the financial statements, with certain practical expedients available. DNBhas determined that upon the adoption of ASU 2016-02 we will be required to recognize a right-of-use
68

asset and a corresponding liability based on the then present value of such obligation. DNB expects thatthe adoption of ASU 2016-02 will result in the recognition of lease liabilities and right-of-use asset totalingapproximately $1.5 million. DNB does not expect that the adoption of the new standard will have amaterial impact on its Consolidated Statements of Income. Update 2018-11 — Leases (topic 842):Targeted Improvements provided an additional/optional transition method to adopt the new leasesstandard. Prior to this ASU issuance, a modified retrospective transition approach was required. Theadoption of this ASU will not materially impact our Consolidated Statement of Financial Condition andConsolidated Statements of Changes in Stockholders’ Equity. Update 2018-20 — Leases (topic 842):Narrow-Scope Improvements for Lessors was released to better clarify the treatment of sales taxes andother similar taxes related to Lessor and Lessees costs and payments. The amendments in this updatepermit lessors, as an accounting policy election, to not evaluate whether certain sales taxes and othersimilar taxes are lessor costs or lessee costs. Instead, those lessors will account for those costs as if they arelessee costs. Also, certain lessor costs require lessors to exclude from variable payments, and thereforerevenue, lessor costs paid by lessees directly to third parties. DNB’s lessor income is immaterial; as such,this ASU will not materially impact our Consolidated Statement of Financial Condition or ConsolidatedStatements of Comprehensive Income. DNB did not adopt the use-of-hindsight practical expedient.
In June 2016, the FASB issued ASU No. 2016-13, ‘‘Financial Instruments — Credit Losses(Topic 326): Measurement of Credit Losses on Financial Instruments,’’ (ASU 2016-13), which addressesconcerns regarding the perceived delay in recognition of credit losses under the existing incurred lossmodel. The amendment introduces a new, single model for recognizing credit losses on all financialinstruments presented on cost basis. Under the new model, entities must estimate current expected creditlosses by considering all available relevant information, including historical and current information, aswell as reasonable and supportable forecasts of future events. The update also requires additionalqualitative and quantitative information to allow users to better understand the credit risk within theportfolio and the methodologies for determining allowance. ASU 2016-13 is effective for DNB onJanuary 1, 2020 and must be applied using the modified retrospective approach with limited exceptions.Early adoption is permitted. Although early adoption is permitted for fiscal years beginning afterDecember 15, 2018, DNB does not plan to early adopt. DNB has established a CECL ImplementationTeam to assess the impact of this ASU on its consolidated financial position, results of operations, and cashflows. DNB has been preserving certain historical loan information from its core processing system inanticipation of adopting the standard and will be evaluating control and process framework, data, model,and resource requirements and areas where modifications will be required. DNB has selected a third partyvendor to process and review various calculation methodologies and the approximate impact on DNB’sfinancial position, results of operations and cash flows. The team continues to assess the impact of thestandard; however, DNB expects adopting this ASU will result in an increase in its allowance for creditlosses. The amount of the increase in the allowance for credit losses upon adoption will be dependent uponthe characteristics of the portfolio at the adoption date, as well as macroeconomic conditions and forecastsat that date. A cumulative effect adjustment will be made to retained earnings for the impact of thestandard at the beginning of the period the standard is adopted.
In August 2016, the FASB issued ASU No. 2016-15, Statement of Cash Flows (Topic 230). Theamendments in this update provide guidance for eight specific cash flow classification issues for whichcurrent guidance is unclear or does not exist, thereby reducing diversity in practice. For public companies,the update is effective for annual periods beginning after December 15, 2017. Accordingly, effectiveJanuary 1, 2018, DNB adopted the pronouncement and it does not have a material impact to DNB’sconsolidated financial statements.
In January 2017, the FASB issued ASU No. 2017-01, Business Combinations (Topic 805), Clarifyingthe Definition of a Business. The new guidance narrows the existing definition of a business and provides aframework for evaluating whether a transaction should be accounted for as an acquisition (or disposal) ofassets or a business. The guidance requires an entity to evaluate if substantially all of the fair value of the
69

gross assets acquired is concentrated in a single identifiable asset or a group of similar identifiable assets; ifso, the set of transferred assets and activities (collectively, the set) is not a business. To be considered abusiness, the set would need to include an input and a substantive process that together significantlycontribute to the ability to create outputs, as defined by the ASU. The guidance is effective for annualreporting periods beginning after December 15, 2017, including interim periods within those annualreporting periods, and should be applied prospectively. Early adoption is permitted. DNB will apply thisguidance to applicable transactions after the adoption date.
In January 2017, the Financial Accounting Standards Board (‘‘FASB’’) issued ASU 2017-04,Intangibles — Goodwill and Other (Topic 350): Simplifying the Test for Goodwill Impairment. The ASUsimplifies the subsequent measurement of goodwill by eliminating Step 2 from the goodwill impairmenttest. Instead, under the amendments, an entity should perform its annual, or interim, goodwill impairmenttest by comparing the fair value with its carrying amount. Additionally, an entity should consider incometax effects from any tax deductible goodwill on the carrying amount when measuring the goodwillimpairment loss, if applicable. The update also eliminated the requirements for zero or negative carryingamount to perform a qualitative assessment and, if it fails that qualitative test, to perform Step 2 of thegoodwill impairment test. The amendments are effective for public business entities for its annual or anyinterim goodwill impairment tests in fiscal years beginning after December 15, 2019. Early adoption ispermitted for interim or annual goodwill impairment tests performed on testing dates after January 1,2017. DNB will not early adopt this ASU for its annual goodwill impairment test, and has conducted aqualitative test (step zero) as of October 1, 2018 and determined that its Goodwill has not been impaired.The adoption of this ASU is not expected to have a material impact on DNB’s consolidated financialstatements.
In March 2017, the FASB issued ASU No. 2017-07, ‘‘Improving the Presentation of Net Periodic PensionCost and Net Periodic Postretirement Benefit Cost.’’ Under the new guidance, employers will present theservice cost component of the net periodic benefit cost in the same income statement line item(e.g., Salaries and Benefits) as other employee compensation costs arising from services rendered duringthe period. In addition, only the service cost component will be eligible for capitalization in assets.Employers will present the other components separately (e.g., Other Noninterest Expense) from the lineitem that includes the service cost. ASU No. 2017-07 is effective for interim and annual reporting periodsbeginning after December 15, 2017. Early adoption is permitted, however, DNB has decided not to earlyadopt. Employers will apply the guidance on the presentation of the components of net periodic benefitcost in the income statement retrospectively. ASU No. 2017-07 does not have a material impact on DNBConsolidated Financial Statements because the Pension plan has been frozen to new accruals sinceDecember 31, 2003, and thus, generated no service cost in any subsequent year.
In May 2017, the FASB issued ASU No. 2017-09, Compensation-Stock Compensation (Topic 718):Scope of Modification Accounting; (‘‘ASU 2017-09’’). ASU 2017-09 provides clarity by offering guidanceon the scope of modification accounting for share-based payment awards and gives direction on whichchanges to the terms or conditions of these awards require an entity to apply modification accounting.Under the new guidance, modification accounting is required only if the fair value, the vesting conditions,or the classification of the award (as equity or liability) changes as a result of the change in terms orconditions. The guidance is effective prospectively for all companies for annual periods beginning on orafter December 15, 2017. Early adoption was permitted. DNB adopted the ASU on January 1, 2018 andthe effects were immaterial.
In February 2018, the FASB issued ASU No. 2018-02, Income Statement-Reporting ComprehensiveIncome (Topic 220): Reclassification of Certain Tax Effects from Accumulated Other ComprehensiveIncome; (‘‘ASU 2018-02’’). This ASU allows a reclassification from accumulated other comprehensiveincome (‘‘AOCI’’) to retained earnings for certain income tax effects stranded in AOCI as a result of theTax Act. Consequently, the reclassification eliminates the stranded tax effects resulting from the Tax Actand is intended to improve the usefulness of information reported to financial statement users. However,
70

because the ASU only relates to the reclassification of the income tax effects of the Tax Act, the underlyingguidance that requires the effect of a change in tax laws or rates to be included in income from continuingoperations is not affected. The amendments in this update are effective for all entities for fiscal yearsbeginning after December 15, 2018, and interim periods within those fiscal years. DNB adopted this ASUon January 1, 2018. The amount of this reclassification is $471,000.
Principles of Consolidation The accompanying consolidated financial statements include the accountsof DNB and its wholly owned subsidiary, the Bank. All significant inter-company transactions have beeneliminated.
Cash and Due From Banks For purposes of the consolidated statement of cash flows, cash and duefrom banks, and federal funds sold are considered to be cash equivalents. Generally, federal funds are soldfor one-day periods.
Investment Securities Investment securities are classified at the time of purchase and accounted for asfollows:
Held-To-Maturity (‘‘HTM’’) Includes debt securities that DNB has the positive intent and ability tohold to maturity. Debt securities are reported at cost, adjusted for amortization of premiums and accretionof discounts. DNB may sell HTM securities when DNB collects greater than 85% of the original recordedinvestment on the HTM securities prior to the sale.
Available-For-Sale (‘‘AFS’’) Includes debt and equity securities not classified as HTM securities.Securities classified as AFS are securities that DNB intends to hold for an indefinite period of time, butnot necessarily to maturity. Such securities are reported at fair value, with unrealized holding gains andlosses excluded from earnings and reported, net of tax (if applicable), as a separate component ofstockholders’ equity. Realized gains and losses on the sale of AFS securities are computed on the basis ofspecific identification of the adjusted cost of each security. Amortization of premiums and accretion ofdiscounts for all types of securities are computed using a level-yield basis.
Other Than Temporary Impairment (‘‘OTTI’’) Analysis Securities are evaluated on a quarterly basis,and more frequently when market conditions warrant such an evaluation, to determine whether declines intheir value are other-than-temporary. To determine whether a loss in value is other-than-temporary,management utilizes criteria such as the reasons underlying the decline, the magnitude and duration of thedecline, and whether or not management intends to sell or expects that it is more likely than not that it willbe required to sell the security prior to an anticipated recovery of the fair value. Once a decline in value fora debt security is determined to be other-than-temporary, the other-than-temporary impairment isseparated into (a) the amount of the total other-than-temporary impairment related to a decrease in cashflows expected to be collected from the debt security (the credit loss) and (b) the amount of the totalother-than-temporary impairment related to all other factors. The amount of the total impairment relatedto credit losses is included in earnings. The amount of the total impairment related to all other factors isincluded in other comprehensive income. DNB recorded no impairment charges in 2018 or 2017.
Restricted Stock Restricted investment in bank stocks consist of Philadelphia Federal Reserve Bank(‘‘FRB’’) stock, Pittsburgh Federal Home Loan Bank (‘‘FHLBP’’) stock, and Atlantic Community BankersBank (‘‘ACBB’’) stock. Federal law requires a member institution of the district FRB and FHLB to holdstock according to predetermined formulas. ACBB requires its correspondent banking institutions to holdstock as a condition of membership. The restricted investment in bank stock is carried at cost. Quarterly,the Corporation evaluates the bank stocks for impairment. DNB evaluates recent and long-term operatingperformance, liquidity, funding and capital positions, stock repurchase history, dividend history, andimpact of legislative and regulatory changes. At December 31, 2018, DNB owned $3.1 million of stock ofthe FHLBP, $2.3 million of stock of the FRB and $156,000 of stock of ACBB. At December 31, 2017, DNBowned $5.2 million of stock of the FHLBP, $2.3 million of stock of the FRB and $156,000 of stock ofACBB.
71

Loans Loans receivable that management has the intent and ability to hold for the foreseeablefuture or until maturity or payoff are stated at their outstanding unpaid principal balances, net of anallowance for credit losses and any deferred fees or costs. Interest income is accrued on the unpaidprincipal balance. Loan origination fees, net of certain direct origination costs, are deferred andrecognized as an adjustment of the yield (interest income) of the related loans. DNB is generallyamortizing these amounts over the contractual life of the loan. Premiums and discounts on purchasedloans are amortized as adjustments to interest income using the effective yield method.
The loans receivable portfolio is segmented into residential mortgage loans, commercial mortgageloans, commercial loans (which consist of commercial term loans and commercial construction loans),leases, and consumer loans (which consist of home equity loans and other consumer loans.)
For all classes of loans receivable, the accrual of interest is generally discontinued when thecontractual payment of principal or interest has become 90 days past due or management has seriousdoubts about further collectability of principal or interest, even though the loan is currently performing. Aloan may remain on accrual status if it is in the process of collection and is either guaranteed or wellsecured. When a loan or lease is placed on non-accrual, interest accruals cease and uncollected accruedinterest is reversed and charged against current income. Interest received on nonaccrual loans, includingimpaired loans, generally is either applied against principal or reported as interest income, according tomanagement’s judgment as to the collectability of principal. Generally, loans are restored to accrual statuswhen the obligation is brought current, has performed in accordance with the contractual terms for areasonable period of time (generally six months) and the ultimate collectability of the total contractualprincipal and interest is no longer in doubt. The past due status of all classes of loans receivable isdetermined based on contractual due dates for loan payments.
Loans acquired in business combinations Loans that DNB acquires in connection with businesscombinations are recorded at fair value with no carryover of the existing related allowance for credit losses.Fair value of the loans involves estimating the amount and timing of principal and interest cash flowsexpected to be collected on the loans and discounting those cash flows at a market rate of interest.
For loans acquired with credit deterioration, the excess of cash flows expected at acquisition over theestimated fair value is referred to as the accretable discount and is recognized into interest income over theremaining life of the loan. The difference between contractually required payments at acquisition and thecash flows expected to be collected at acquisition is referred to as the nonaccretable discount. These loansare accounted for under the Accounting Standard Codification (‘‘ASC’’) 310-30, Loans and Debt SecuritiesAcquired with Deteriorated Credit Quality. The nonaccretable discount includes estimated future creditlosses expected to be incurred over the life of the loan. Subsequent decreases to the expected cash flowswill require DNB to evaluate the need for an additional allowance for credit losses. Subsequentimprovement in expected cash flows will result in the reversal of a corresponding amount of thenonaccretable discount which DNB will then reclassify as accretable discount that will be recognized intointerest income over the remaining life of the loan.
Loans acquired through business combinations that do meet the specific criteria of ASC 310-30 areindividually evaluated each period to analyze expected cash flows. To the extent that the expected cashflows of a loan have decreased due to credit deterioration, DNB establishes an allowance.
Loans acquired through business combinations that do not meet the specific criteria of ASC 310-30are accounted for under ASC 310-20. These loans are initially recorded at fair value, and include creditand interest rate marks associated with acquisition accounting adjustments. Purchase premiums ordiscounts are subsequently amortized as an adjustment to yield over the estimated contractual lives of theloans. There is no allowance for credit losses established at the acquisition date for acquired performingloans. An allowance for credit losses is recorded for any credit deterioration in these loans subsequent toacquisition.
72
Acquired loans that met the criteria for impaired or nonaccrual of interest prior to the acquisition maybe considered performing upon acquisition, regardless of whether the customer is contractually delinquentif DNB expects to fully collect the new carrying value (i.e. fair value) of the loans. As such, DNB may nolonger consider the loan to be nonaccrual or nonperforming and may accrue interest on these loans,including the impact of any accretable discount. In addition, charge-offs on such loans would be firstapplied to the nonaccretable difference portion of the fair value adjustment.
Deferred Loan Fees and Costs Loan origination and commitment fees and related direct-loanorigination costs of completed loans are deferred and accreted to income as a yield adjustment over thelife of the loan using the level-yield method. The accretion to income is discontinued when a loan is placedon non-accrual status. When a loan is paid off, any unamortized net deferred fee balance is credited toincome. When a loan is sold, any unamortized net deferred fee balance is considered in the calculation ofgain or loss.
Allowance for Credit Losses The allowance for credit losses represents management’s estimate of lossesinherent in the loan portfolio as of the balance sheet date and is recorded as a reduction to loans. Theallowance for credit losses is increased by the provision for loan losses, and decreased by charge-offs, net ofrecoveries. Loans deemed to be uncollectible are charged against the allowance for credit losses, andsubsequent recoveries, if any, are credited to the allowance. All, or part, of the principal balance of loansreceivable are charged off to the allowance as soon as it is determined that the repayment of all, or part, ofthe principal balance is highly unlikely. Non-residential consumer loans are generally charged off no laterthan 120 days past due on a contractual basis, earlier in the event of Bankruptcy, or if there is an amountdeemed uncollectible. No portion of the allowance for credit losses is restricted to any individual loan orgroups of loans, and the entire allowance is available to absorb any and all loan losses.
The allowance for credit losses is maintained at a level considered adequate to provide for losses thatcan be reasonably anticipated. Management performs a quarterly evaluation of the adequacy of theallowance. The allowance is based on DNB’s past loan loss experience, known and inherent risks in theportfolio, adverse situations that may affect the borrower’s ability to repay, the estimated value of anyunderlying collateral, composition of the loan portfolio, current economic conditions and other relevantfactors. This evaluation is inherently subjective as it requires material estimates that may be susceptible tosignificant revision as more information becomes available.
The allowance consists of specific, general and unallocated components. The specific componentrelates to loans that are classified as impaired. For loans that are classified as impaired, an allowance isestablished when the discounted cash flows (or collateral value or observable market price) of the impairedloan is lower than the carrying value of that loan. The general component covers pools of loans by loanclass including commercial loans not considered impaired, as well as smaller balance homogeneous loans,such as residential real estate, home equity and other consumer loans. These pools of loans are evaluatedfor loss exposure, based upon historical loss rates for each of these categories of loans, adjusted forqualitative factors. These qualitative risk factors include:
1. Lending policies and procedures, including underwriting standards and collection, charge-off andrecovery practices
2. National, regional, and local economic and business conditions as well as the condition of variousmarket segments, including the value of underlying collateral for collateral dependent loans
3. Nature and volume of the portfolio and terms of loans
4. Experience, ability, and depth of lending management and staff
5. Volume and severity of past due, classified and nonaccrual loans as well as other loan modifications
6. Quality of DNB’s loan review system, and the degree of oversight by DNB’s Board of Directors
73
7. Existence and effect of any concentrations of credit and changes in the level of such concentrations
8. Effect of external factors, such as competition and legal and regulatory requirements
9. Changes in the value of underlying collateral for collateral-dependent loans
Each factor is assigned a value to reflect improving, stable or declining conditions based onmanagement’s best judgment using relevant information available at the time of the evaluation.Adjustments to the factors are supported through documentation of changes in conditions in a narrativeaccompanying the allowance for credit loss calculation.
Residential mortgage loans involve certain risks such as interest rate risk and risk of non-repayment.Adjustable-rate single family real estate loans decreases the interest rate risk to the Company that isassociated with changes in interest rates but involve other risks, primarily because as interest rates rise, thepayment by the borrower rises to the extent permitted by the terms of the loan, thereby increasing thepotential for default. At the same time, the marketability of the underlying property may be adverselyaffected by higher interest rates. Repayment risk can be affected by job loss, divorce, illness and personalbankruptcy or the borrower.
Commercial real estate lending entails significant additional risks as compared with single-familyresidential property lending. Such loans typically involve large loan balances to single borrowers or groupsof related borrowers. The payment experience on such loans is typically dependent on the successfuloperation of the real estate project. The success of such projects is sensitive to changes in supply anddemand conditions in the market for commercial real estate as well as economic conditions generally.
Commercial loans, which are also referred to as commercial and industrial loans (‘‘C & I loans’’),include advances to businesses for general commercial purposes and include permanent and short-termworking capital, machinery and equipment financing, and may be either in the form of lines of credit orterm loans. Although C & I loans may be unsecured to our highest rated borrowers, the majority of theseloans are secured by the borrower’s accounts receivable, inventory and machinery and equipment. In asignificant number of these loans, the collateral also includes the business real estate or the businessowner’s personal real estate or assets. C & I loans present credit exposure to DNB, as they are moresusceptible to risk of loss during a downturn in the economy, as borrowers may have greater difficulty inmeeting their debt service requirements and the value of the collateral may decline. DNB attempts tomitigate this risk through its underwriting standards, including evaluating the credit worthiness of theborrower and to the extent available, credit ratings on the business. Additionally, monitoring of the loansthrough annual renewals and meetings with the borrowers are typical. However, these procedures cannoteliminate the risk of loss associated with this type of lending.
Construction lending is generally considered to involve a higher level of risk as compared to single-family residential lending, due to the concentration of principal in a limited number of loans and borrowersand the effects of general economic conditions on developers and builders. Moreover, a construction loancan involve additional risks because of the inherent difficulty in estimating both a property’s value atcompletion of the project and the estimated cost (including interest) of the project. The nature of theseloans is such that they are generally more difficult to evaluate and monitor. DNB has attempted tominimize the foregoing risks by, among other things, limiting the extent of its construction lending and hasadopted underwriting guidelines which impose stringent loan-to-value, debt service and otherrequirements for loans which are believed to involve higher elements of credit risk, by limiting thegeographic area in which DNB will do business and by working with builders with whom it has establishedrelationships.
Consumer loans generally have shorter terms and higher interest rates than mortgage loans butgenerally involve more credit risk than mortgage loans because of the type and nature of the collateral and,in certain cases, the absence of collateral. In addition, consumer lending collections are dependent on theborrower’s continuing financial stability, and thus are more likely to be adversely effected by job loss,
74
divorce, illness and personal bankruptcy. In most cases, any repossessed collateral for a defaultedconsumer loan will not provide an adequate source of repayment of the outstanding loan balance becauseof improper repair and maintenance of the underlying security. The remaining deficiency often does notwarrant further substantial collection efforts against the borrower. DNB believes that the generally higheryields earned on consumer loans compensate for the increased credit risk associated with such loans andthat consumer loans are important to its efforts to provide a full range of services to its customers.
An unallocated component is maintained to cover uncertainties that could affect management’sestimate of probable losses. The unallocated component of the allowance reflects the margin ofimprecision inherent in the underlying assumptions used in the methodologies for estimating specific andgeneral losses in the portfolio.
A loan is considered impaired when, based on current information and events, it is probable that DNBwill be unable to collect the scheduled payments of principal or interest when due according to thecontractual terms of the loan agreement. Factors considered by management in determining impairmentinclude payment status, collateral value and the probability of collecting scheduled principal and interestpayments when due. Loans that experience insignificant payment delays and payment shortfalls generallyare not classified as impaired. Management determines the significance of payment delays and paymentshortfalls on a case-by-case basis, taking into consideration all of the circumstances surrounding the loanand the borrower, including the length of the delay, the reasons for the delay, the borrower’s prior paymentrecord and the amount of the shortfall in relation to the principal and interest owed. Impairment ismeasured on a loan by loan basis for commercial and industrial loans, commercial real estate loans andcommercial construction loans by either the present value of expected future cash flows discounted at theloan’s effective interest rate or the fair value of the collateral if the loan is collateral dependent. Anallowance for credit losses is established for an impaired loan if its carrying value exceeds its estimated fairvalue. The estimated fair values of substantially all of DNB’s impaired loans are measured based on theestimated fair value of the loan’s collateral.
For commercial loans secured by real estate, estimated fair values are determined primarily throughthird-party appraisals. When a real estate secured loan becomes impaired, a decision is made regardingwhether an updated certified appraisal of the real estate is necessary. This decision is based on variousconsiderations, including the age of the most recent appraisal, the loan-to-value ratio based on the originalappraisal and the condition of the property. Appraised values are discounted to arrive at the estimatedselling price of the collateral, which is considered to be the estimated fair value. The discounts also includeestimated costs to sell the property.
For commercial loans secured by non-real estate collateral, such as accounts receivable, inventory andequipment, estimated fair values are determined based on the borrower’s financial statements, inventoryreports, accounts receivable agings or equipment appraisals or invoices. Indications of value from thesesources are generally discounted based on the age of the financial information or the quality of the assets.
We perform separate impairment analyses once residential or consumer loans become significantlydelinquent. This is essentially the same process for all loan types. Once on non-accrual or at 90 daysdelinquent (if not before), we generally get updated valuations (appraisals, etc.) and then perform theimpairment analysis. So, the general reserve is used to cover the performing loans until we pull out theproblem accounts.
The allowance calculation methodology includes further segregation of loan classes into risk ratingcategories. The borrower’s overall financial condition, repayment sources, guarantors and value ofcollateral, if appropriate, are evaluated annually for commercial loans or when credit deficiencies arise,such as delinquent loan payments, for commercial and consumer loans. Credit quality risk ratings includeregulatory classifications of special mention, substandard, doubtful and loss. Loans criticized specialmention have potential weaknesses that deserve management’s close attention. If uncorrected, thepotential weaknesses may result in deterioration of the repayment prospects. Loans classified substandard
75
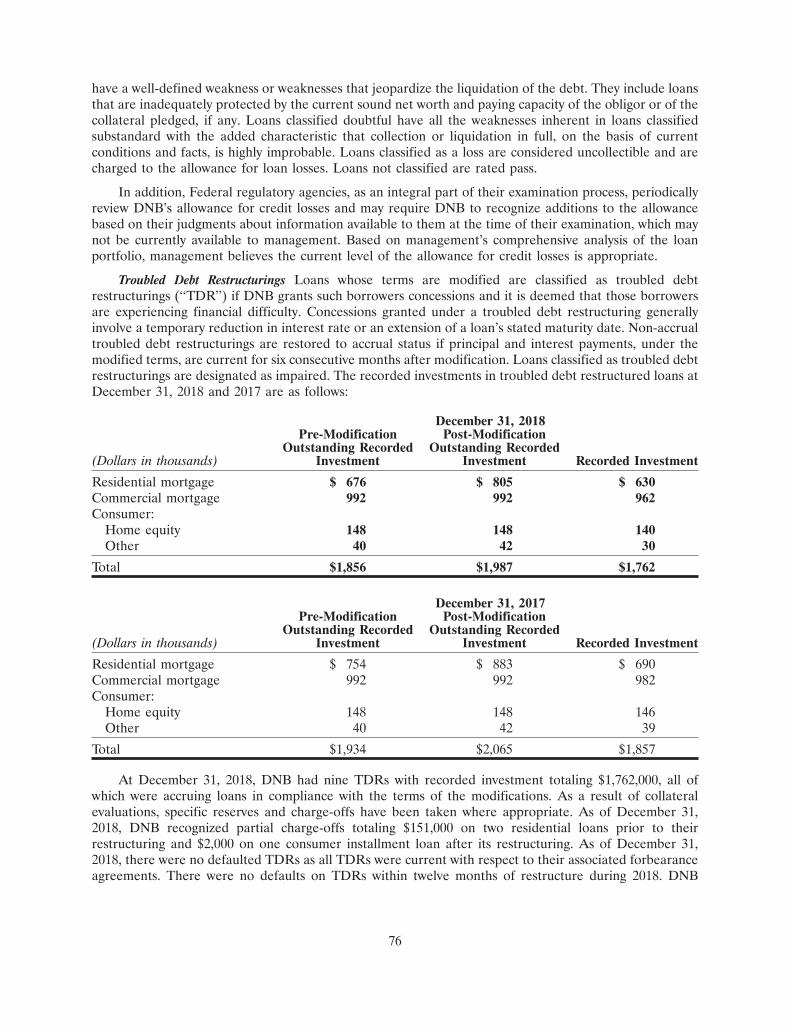
have a well-defined weakness or weaknesses that jeopardize the liquidation of the debt. They include loansthat are inadequately protected by the current sound net worth and paying capacity of the obligor or of thecollateral pledged, if any. Loans classified doubtful have all the weaknesses inherent in loans classifiedsubstandard with the added characteristic that collection or liquidation in full, on the basis of currentconditions and facts, is highly improbable. Loans classified as a loss are considered uncollectible and arecharged to the allowance for loan losses. Loans not classified are rated pass.
In addition, Federal regulatory agencies, as an integral part of their examination process, periodicallyreview DNB’s allowance for credit losses and may require DNB to recognize additions to the allowancebased on their judgments about information available to them at the time of their examination, which maynot be currently available to management. Based on management’s comprehensive analysis of the loanportfolio, management believes the current level of the allowance for credit losses is appropriate.
Troubled Debt Restructurings Loans whose terms are modified are classified as troubled debtrestructurings (‘‘TDR’’) if DNB grants such borrowers concessions and it is deemed that those borrowersare experiencing financial difficulty. Concessions granted under a troubled debt restructuring generallyinvolve a temporary reduction in interest rate or an extension of a loan’s stated maturity date. Non-accrualtroubled debt restructurings are restored to accrual status if principal and interest payments, under themodified terms, are current for six consecutive months after modification. Loans classified as troubled debtrestructurings are designated as impaired. The recorded investments in troubled debt restructured loans atDecember 31, 2018 and 2017 are as follows:
December 31, 2018Pre-Modification Post-Modification
Outstanding Recorded Outstanding Recorded(Dollars in thousands) Investment Investment Recorded Investment
Residential mortgage $ 676 $ 805 $ 630Commercial mortgage 992 992 962Consumer:
Home equity 148 148 140Other 40 42 30
Total $1,856 $1,987 $1,762
December 31, 2017Pre-Modification Post-Modification
Outstanding Recorded Outstanding Recorded(Dollars in thousands) Investment Investment Recorded Investment
Residential mortgage $ 754 $ 883 $ 690Commercial mortgage 992 992 982Consumer:
Home equity 148 148 146Other 40 42 39
Total $1,934 $2,065 $1,857
At December 31, 2018, DNB had nine TDRs with recorded investment totaling $1,762,000, all ofwhich were accruing loans in compliance with the terms of the modifications. As a result of collateralevaluations, specific reserves and charge-offs have been taken where appropriate. As of December 31,2018, DNB recognized partial charge-offs totaling $151,000 on two residential loans prior to theirrestructuring and $2,000 on one consumer installment loan after its restructuring. As of December 31,2018, there were no defaulted TDRs as all TDRs were current with respect to their associated forbearanceagreements. There were no defaults on TDRs within twelve months of restructure during 2018. DNB
76
classified one residential mortgage loan totaling $73,000 as TDRs during the year ended December 31,2018.
At December 31, 2017, DNB had eight TDRs with recorded investment totaling $1,857,000, five ofwhich, totaling $1,128,000, were accruing loans in compliance with the terms of the modifications. Theremaining $729,000 represents three loans that were nonaccrual impaired loans and resulted in collateralevaluations. As a result of the evaluations, specific reserves and charge-offs have been taken whereappropriate. As of December 31, 2017, DNB recognized partial charge-offs totaling $151,000 on tworesidential loans prior to their restructuring and $2,000 on one consumer installment loan after itsrestructuring. As of December 31, 2017, there were no defaulted TDRs as all TDRs were current withrespect to their associated forbearance agreements. There were no defaults on TDRs within twelve monthsof restructure during 2017. DNB classified three commercial mortgage loans totaling $992,000 as TDRsduring the year ended December 31, 2017.
Reserve for unfunded loan commitments The reserve for unfunded loan commitments representsmanagement’s estimate of losses inherent in off-balance sheet items related to the loan portfolio whichconsist of commitments to extend credit and letters of credit. The same risk and loss factors are applied toboth funded and unfunded commitments. However, the bank calculates reserves required to supportunfunded commitments in each loan category based only on the estimated likelihood (the probability) thatDNB would advance funds into a known troubled situation, and then sustain a loss on the newly advancedfunds. The amount of reserve for unfunded loan commitments, which is included in ‘‘Other liabilities’’ onthe statement of financial condition, was $395,000 and $348,000 at December 31, 2018 and December 31,2017, respectively.
Other Real Estate Owned & Other Repossessed Property Other real estate owned (‘‘OREO’’) and otherrepossessed property consists of properties acquired as a result of, or in-lieu-of, foreclosure as well as otherrepossessed property. Properties classified as OREO are initially recorded at fair value less cost to sell atthe date of foreclosure, establishing a new cost basis. Subsequent to foreclosure, valuations are periodicallyperformed by management and the assets are carried at the lower of carrying value or fair value, lessestimated costs to sell. Costs relating to the development or improvement of the properties are capitalizedand costs relating to holding the properties are charged to expense. DNB had $58,000 and $416,000 ofcommercial mortgage loans in the process of foreclosure at December 31, 2018 and December 31, 2017,respectively.
Office Properties and Equipment Office properties and equipment are recorded at cost. Depreciation iscomputed using the straight-line method over the expected useful lives of the assets. The costs ofmaintenance and repairs are expensed as they are incurred; renewals and betterments are capitalized. Alllong-lived assets are reviewed for impairment when conditions indicate that impairment may haveoccurred, based on the fair value of the asset. In addition, long-lived assets to be disposed of are generallyreported at the lower of carrying amount or fair value, less cost to sell. Gains or losses on disposition ofproperties and equipment are reflected in operations.
Goodwill and Intangible Assets DNB accounts for goodwill and intangible assets in accordance withASC 350, ‘‘Intangibles — Goodwill and Other.’’ Goodwill is the excess of the purchase price over the fairvalue of the net assets acquired in connection with the 2016 acquisition of East River Bank. If certainevents occur, which indicate goodwill might be impaired between annual tests, goodwill must be testedwhen such events occur. In making this assessment, DNB considers a number of factors includingoperating results, business plans, economic projections, anticipated future cash flows, current market data,stock price, etc. There are inherent uncertainties related to these factors and management’s judgment inapplying them to the analysis of goodwill impairment. Changes in economic and operating conditionscould result in goodwill impairment in future periods. DNB did not identify any impairment during 2018.The annual test date is October 1st. DNB has conducted a qualitative test (step zero) as of October 1, 2018and determined that its Goodwill has not been impaired.
77

Income Taxes DNB accounts for income taxes in accordance with the income tax accounting guidanceset forth in FASB ASC Topic 740, Income Taxes.
The income tax accounting guidance results in two components of income tax expense: current anddeferred. Current income tax expense reflects taxes to be paid or refunded for the current period byapplying the provisions of the enacted tax law to the taxable income or excess of deductions over revenues.DNB determines deferred income taxes using the liability (or balance sheet) method. Under this method,the net deferred tax asset or liability is based on the tax effects of the differences between the book and taxbases of assets and liabilities, and enacted changes in tax rates and laws are recognized in the period inwhich they occur.
DNB recognizes interest and penalties on income taxes as a component of income tax expense. DNBis no longer subject to examinations by taxing authorities for the years before January 1, 2015. DNB had nounrecognized tax positions as of December 31, 2018.
Pension Plan The Bank maintains a noncontributory defined benefit pension plan coveringsubstantially all employees over the age of 21 with one year of service. Plan benefits are based on years ofservice and the employee’s monthly average compensation for the highest five consecutive years of theirlast ten years of service (see Note 13 — Benefit Plans). The Bank recognizes the overfunded orunderfunded status of pension and other post retirement benefit plans on the balance sheet. Gains andlosses, prior service costs and credits, and any remaining transition amounts that have not yet beenrecognized through net periodic benefit cost will be recognized in accumulated other comprehensiveincome, net of tax effects, until they are amortized as a component of net periodic cost.
Stock Based Compensation Stock compensation accounting guidance (FASB ASC Topic 718,Compensation — Stock Compensation) requires that the compensation cost relating to share-basedpayment transactions be recognized in financial statements. That cost will be measured based on the grantdate fair value of the equity or liability instruments issued. The stock compensation accounting guidancecovers a wide range of share-based compensation arrangements including stock options, restricted shareplans, performance-based awards, share appreciation rights, and employee share purchase plans.
The stock compensation accounting guidance requires that compensation cost for all stock awards becalculated and recognized over the employees’ service period, generally defined as the vesting period. Forawards with graded-vesting, compensation cost is recognized on a straight-line basis over the requisiteservice period for the entire award. A Black Sholes model is used to estimate the fair value of stockoptions. The market price of DNB’s common stock at the date of grant is used for restricted stock awards.
Earnings Per Common Share (EPS) Basic EPS is computed based on the weighted average number ofcommon shares outstanding during the year. Diluted EPS reflects the potential dilution that could occurfrom unvested stock awards and the exercise of stock options and award vests computed using the treasurystock method. Stock options and awards for which the exercise price exceeds the average market price overthe period have an anti-dilutive effect on EPS and, accordingly, are excluded from the EPS calculation.Treasury shares are not deemed outstanding for earnings per share calculations.
Comprehensive Income Comprehensive income consists of net income and other comprehensiveincome (loss). Other comprehensive income (loss) includes unrealized gains and losses on securitiesavailable for sale, accretion of discount on securities transferred from available-for-sale to
78
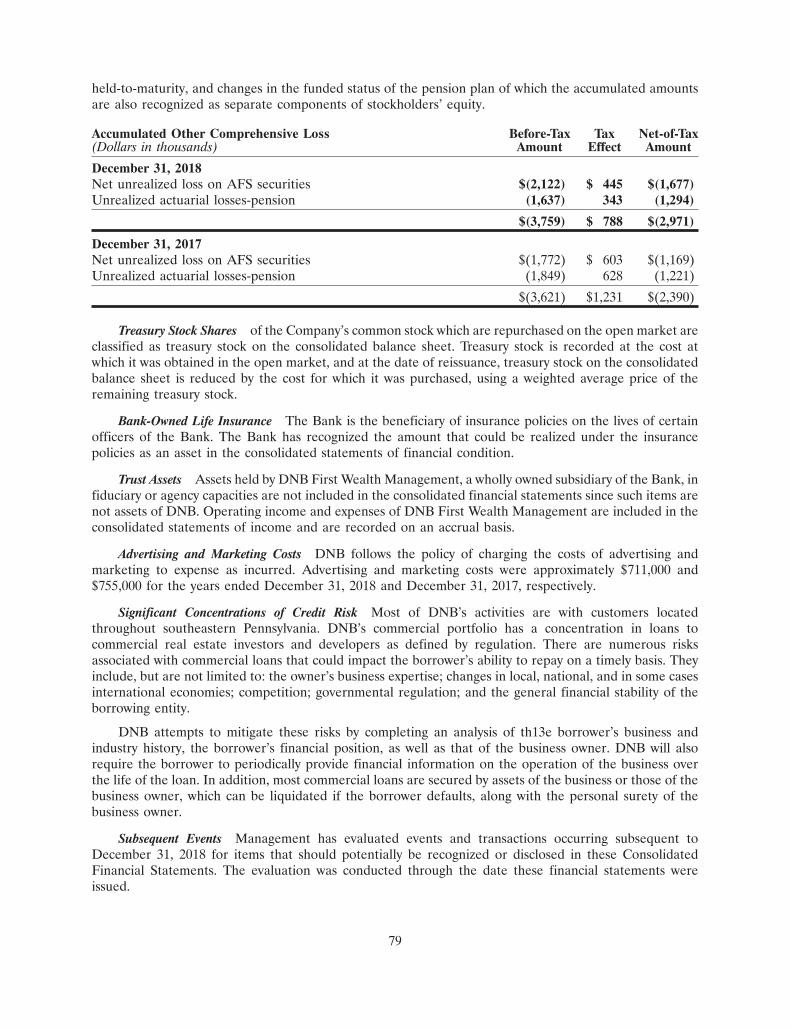
held-to-maturity, and changes in the funded status of the pension plan of which the accumulated amountsare also recognized as separate components of stockholders’ equity.
Accumulated Other Comprehensive Loss Before-Tax Tax Net-of-Tax(Dollars in thousands) Amount Effect Amount
December 31, 2018Net unrealized loss on AFS securities $(2,122) $ 445 $(1,677)Unrealized actuarial losses-pension (1,637) 343 (1,294)
$(3,759) $ 788 $(2,971)
December 31, 2017Net unrealized loss on AFS securities $(1,772) $ 603 $(1,169)Unrealized actuarial losses-pension (1,849) 628 (1,221)
$(3,621) $1,231 $(2,390)
Treasury Stock Shares of the Company’s common stock which are repurchased on the open market areclassified as treasury stock on the consolidated balance sheet. Treasury stock is recorded at the cost atwhich it was obtained in the open market, and at the date of reissuance, treasury stock on the consolidatedbalance sheet is reduced by the cost for which it was purchased, using a weighted average price of theremaining treasury stock.
Bank-Owned Life Insurance The Bank is the beneficiary of insurance policies on the lives of certainofficers of the Bank. The Bank has recognized the amount that could be realized under the insurancepolicies as an asset in the consolidated statements of financial condition.
Trust Assets Assets held by DNB First Wealth Management, a wholly owned subsidiary of the Bank, infiduciary or agency capacities are not included in the consolidated financial statements since such items arenot assets of DNB. Operating income and expenses of DNB First Wealth Management are included in theconsolidated statements of income and are recorded on an accrual basis.
Advertising and Marketing Costs DNB follows the policy of charging the costs of advertising andmarketing to expense as incurred. Advertising and marketing costs were approximately $711,000 and$755,000 for the years ended December 31, 2018 and December 31, 2017, respectively.
Significant Concentrations of Credit Risk Most of DNB’s activities are with customers locatedthroughout southeastern Pennsylvania. DNB’s commercial portfolio has a concentration in loans tocommercial real estate investors and developers as defined by regulation. There are numerous risksassociated with commercial loans that could impact the borrower’s ability to repay on a timely basis. Theyinclude, but are not limited to: the owner’s business expertise; changes in local, national, and in some casesinternational economies; competition; governmental regulation; and the general financial stability of theborrowing entity.
DNB attempts to mitigate these risks by completing an analysis of th13e borrower’s business andindustry history, the borrower’s financial position, as well as that of the business owner. DNB will alsorequire the borrower to periodically provide financial information on the operation of the business overthe life of the loan. In addition, most commercial loans are secured by assets of the business or those of thebusiness owner, which can be liquidated if the borrower defaults, along with the personal surety of thebusiness owner.
Subsequent Events Management has evaluated events and transactions occurring subsequent toDecember 31, 2018 for items that should potentially be recognized or disclosed in these ConsolidatedFinancial Statements. The evaluation was conducted through the date these financial statements wereissued.
79

(2) INVESTMENT SECURITIES
The amortized cost and estimated fair values of investment securities, as of the dates indicated, aresummarized as follows:
December 31, 2018Amortized Unrealized Unrealized Estimated
(Dollars in thousands) Cost Gains Losses Fair Value
Held To MaturityUS Government agency obligations $ 8,749 $ 41 $ — $ 8,790Government Sponsored Entities (GSE) mortgage-
backed securities 389 — — 389Corporate bonds 13,851 124 (47) 13,928Collateralized mortgage obligations GSE 1,159 — (27) 1,132State and municipal taxable 362 — (3) 359State and municipal tax-exempt 37,516 19 (998) 36,537
Total $62,026 $184 $(1,075) $61,135
Available For SaleUS Government agency obligations $48,082 $ — $ (359) $47,723GSE mortgage-backed securities 27,563 — (1,005) 26,558Collateralized mortgage obligations GSE 10,249 — (441) 9,808Corporate bonds 10,890 — (186) 10,704State and municipal tax-exempt 1,981 — (131) 1,850
Total $98,765 $ — $(2,122) $96,643
December 31, 2017Amortized Unrealized Unrealized Estimated
(Dollars in thousands) Cost Gains Losses Fair Value
Held To MaturityUS Government agency obligations $ 8,483 $163 $ — $ 8,646Government Sponsored Entities (GSE) mortgage-
backed securities 496 9 — 505Corporate bonds 14,047 243 (2) 14,288Collateralized mortgage obligations GSE 1,471 — (29) 1,442State and municipal taxable 363 — (8) 355State and municipal tax-exempt 37,530 59 (405) 37,184
Total $ 62,390 $474 $ (444) $ 62,420
Available For SaleUS Government agency obligations $ 53,279 $ — $ (386) $ 52,893GSE mortgage-backed securities 33,203 — (715) 32,488Collateralized mortgage obligations GSE 12,101 — (447) 11,654Corporate bonds 12,981 12 (173) 12,820State and municipal tax-exempt 1,991 — (63) 1,928
Total $113,555 $ 12 $(1,784) $111,783
Included in unrealized losses are market losses on securities that have been in a continuous unrealizedloss position for twelve months or more and those securities that have been in a continuous unrealized lossposition for less than twelve months. The table below details the aggregate unrealized losses and aggregate
80
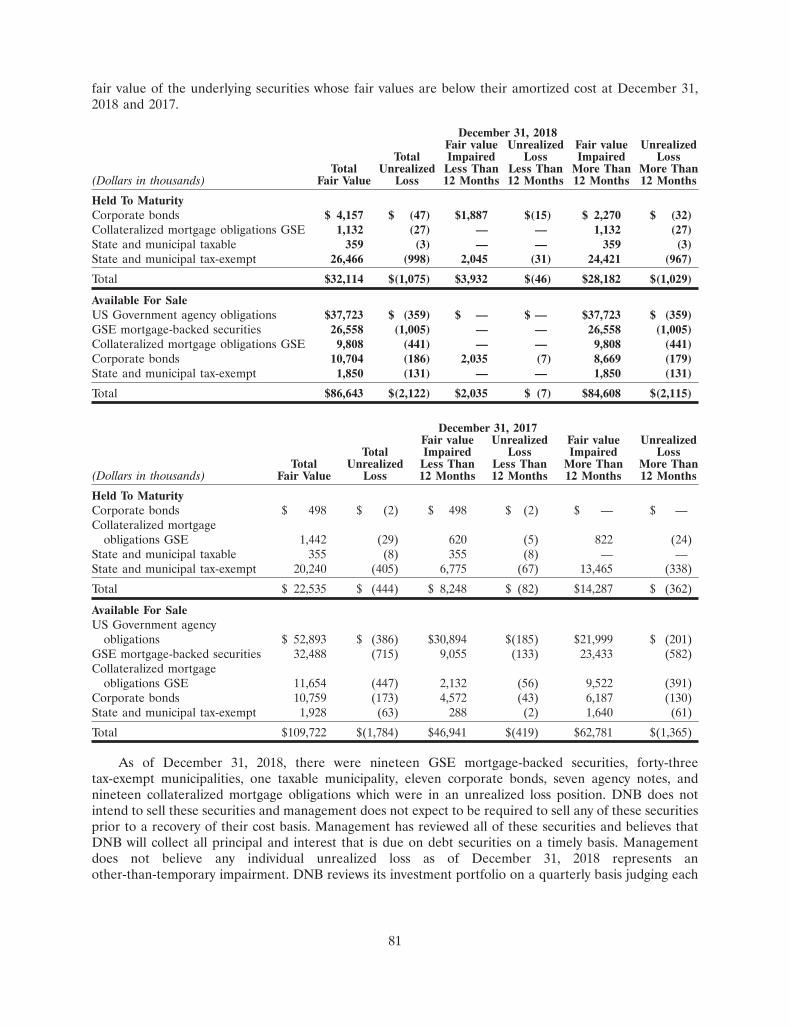
fair value of the underlying securities whose fair values are below their amortized cost at December 31,2018 and 2017.
December 31, 2018Fair value Unrealized Fair value Unrealized
Total Impaired Loss Impaired LossTotal Unrealized Less Than Less Than More Than More Than
(Dollars in thousands) Fair Value Loss 12 Months 12 Months 12 Months 12 Months
Held To MaturityCorporate bonds $ 4,157 $ (47) $1,887 $(15) $ 2,270 $ (32)Collateralized mortgage obligations GSE 1,132 (27) — — 1,132 (27)State and municipal taxable 359 (3) — — 359 (3)State and municipal tax-exempt 26,466 (998) 2,045 (31) 24,421 (967)
Total $32,114 $(1,075) $3,932 $(46) $28,182 $(1,029)
Available For SaleUS Government agency obligations $37,723 $ (359) $ — $ — $37,723 $ (359)GSE mortgage-backed securities 26,558 (1,005) — — 26,558 (1,005)Collateralized mortgage obligations GSE 9,808 (441) — — 9,808 (441)Corporate bonds 10,704 (186) 2,035 (7) 8,669 (179)State and municipal tax-exempt 1,850 (131) — — 1,850 (131)
Total $86,643 $(2,122) $2,035 $ (7) $84,608 $(2,115)
December 31, 2017Fair value Unrealized Fair value Unrealized
Total Impaired Loss Impaired LossTotal Unrealized Less Than Less Than More Than More Than
(Dollars in thousands) Fair Value Loss 12 Months 12 Months 12 Months 12 Months
Held To MaturityCorporate bonds $ 498 $ (2) $ 498 $ (2) $ — $ —Collateralized mortgage
obligations GSE 1,442 (29) 620 (5) 822 (24)State and municipal taxable 355 (8) 355 (8) — —State and municipal tax-exempt 20,240 (405) 6,775 (67) 13,465 (338)
Total $ 22,535 $ (444) $ 8,248 $ (82) $14,287 $ (362)
Available For SaleUS Government agency
obligations $ 52,893 $ (386) $30,894 $(185) $21,999 $ (201)GSE mortgage-backed securities 32,488 (715) 9,055 (133) 23,433 (582)Collateralized mortgage
obligations GSE 11,654 (447) 2,132 (56) 9,522 (391)Corporate bonds 10,759 (173) 4,572 (43) 6,187 (130)State and municipal tax-exempt 1,928 (63) 288 (2) 1,640 (61)
Total $109,722 $(1,784) $46,941 $(419) $62,781 $(1,365)
As of December 31, 2018, there were nineteen GSE mortgage-backed securities, forty-threetax-exempt municipalities, one taxable municipality, eleven corporate bonds, seven agency notes, andnineteen collateralized mortgage obligations which were in an unrealized loss position. DNB does notintend to sell these securities and management does not expect to be required to sell any of these securitiesprior to a recovery of their cost basis. Management has reviewed all of these securities and believes thatDNB will collect all principal and interest that is due on debt securities on a timely basis. Managementdoes not believe any individual unrealized loss as of December 31, 2018 represents another-than-temporary impairment. DNB reviews its investment portfolio on a quarterly basis judging each
81
investment for OTTI. The OTTI analysis focuses on the duration and the amount a particular security isbelow book value.
Factors affecting the market price include credit risk, market risk, interest rates, economic cycles, andliquidity risk. The magnitude of any unrealized loss may be affected by the relative concentration of DNB’sinvestment in any one issuer or industry. DNB has established policies to reduce exposure throughdiversification of concentration of the investment portfolio including limits on concentrations to any oneissuer and as such, management believes the investment portfolio is prudently diversified.
The declines in value are related to a change in interest rates and/or subsequent change in creditspreads required for these issues affecting market price. All issues are performing and are expected tocontinue to perform in accordance with their respective contractual terms and conditions. Short tointermediate average durations and in certain cases monthly principal payments should reduce furthermarket value exposure to increases in rates.
Collateralized mortgage obligations GSE There are nineteen impaired securities classified ascollateralized mortgage obligations, all of which were impaired for more than 12 months. The largestunrealized loss of a security in this group is 7.13% of its carrying value. All of these securities were issuedand insured by FNMA, FHLMC or GNMA. DNB receives monthly principal and interest payments on allof these securities on a timely basis and none of these agencies has ever defaulted on mortgage-backedprincipal or interest. DNB anticipates a recovery in the market value as the securities approach theirmaturity dates or if interest rates decline from December 31, 2018 levels. Management concluded thatthese securities were not other-than-temporarily impaired at December 31, 2018.
State and municipal tax-exempt There are forty-three impaired securities in this category, which arecomprised of intermediate to long-term municipal bonds, forty of which were impaired for more than12 months. The largest unrealized loss of a security in this group is 10.18% of its carrying value. All of theissues carry a ‘‘BBB�’’ or better underlying credit support and were evaluated on the basis on theirunderlying fundamentals; included but not limited to annual financial reports, geographic location,population, and debt ratios. In certain cases, options for calls reduce the effective duration and in turn thefuture market value fluctuations. All issues are performing and are expected to continue to perform inaccordance with their respective contractual terms and conditions. There have not been disruptions of anypayments, associated with any of these municipal securities. These bonds are conservative in nature andthe value decline is related to the changes in interest rates that occurred since the time of purchase andsubsequent changes in spreads affecting the market prices. Twenty-eight of the impaired municipals areschool districts that have state school district credit enhancement programs and twenty of those also haveadditional insurance. The remaining fifteen are two insured school districts, two uninsured school districts,four insured townships and seven uninsured townships, all of which have strong underlying ratings.Management concluded that these securities were not other-than-temporarily impaired at December 31,2018.
State and municipal taxable There is one impaired security in this category, which has been impairedfor more than 12 months. The unrealized loss of this security is 0.97% of its carrying value. This security isan insured township and carries a ‘‘BBB+’’ underlying credit. It is performing and is expected to continueto perform in accordance with its contractual terms and conditions. There have not been disruptions of anypayments associated with this municipal security. Management concluded that this security was notother-than-temporarily impaired at December 31, 2018.
US Government agency obligations There are seven impaired securities classified as agencies, all ofwhich were impaired for more than 12 months. The largest unrealized loss of a security in this group is4.18% of its carrying value. All of these securities were issued and insured by FHLB, FNMA, or FHLMC.DNB has received timely interest payments on all of these securities and none of these agencies has everdefaulted on their bonds. DNB anticipates a recovery in the market value as the securities approach their
82
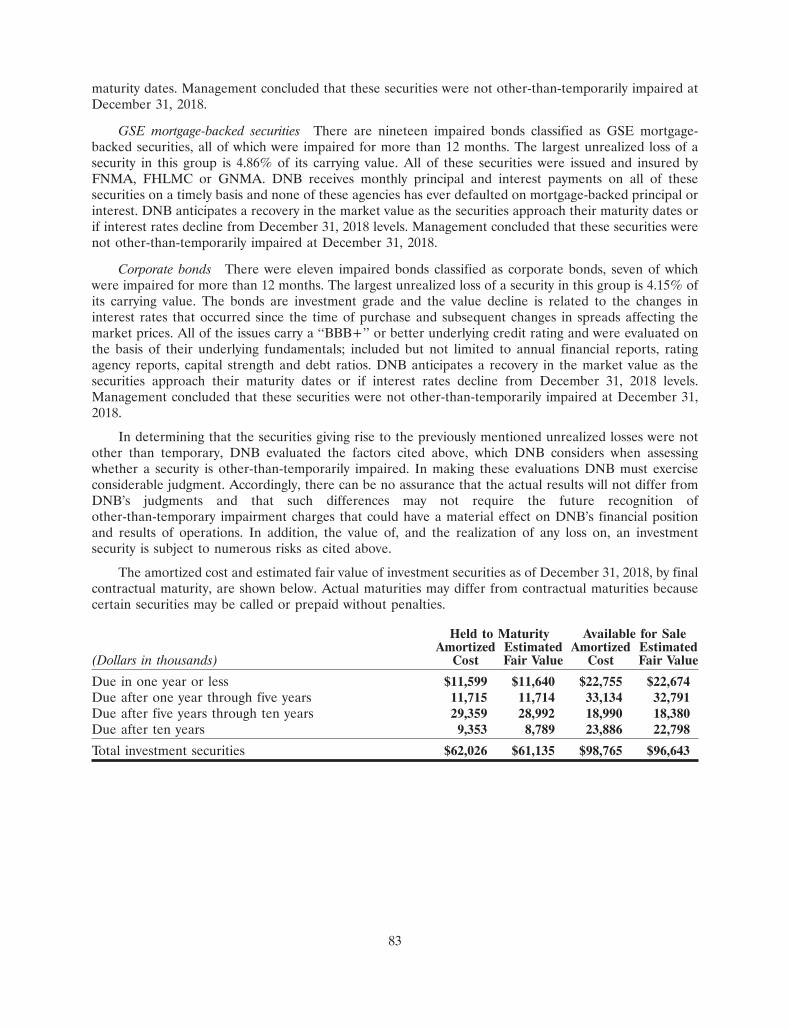
maturity dates. Management concluded that these securities were not other-than-temporarily impaired atDecember 31, 2018.
GSE mortgage-backed securities There are nineteen impaired bonds classified as GSE mortgage-backed securities, all of which were impaired for more than 12 months. The largest unrealized loss of asecurity in this group is 4.86% of its carrying value. All of these securities were issued and insured byFNMA, FHLMC or GNMA. DNB receives monthly principal and interest payments on all of thesesecurities on a timely basis and none of these agencies has ever defaulted on mortgage-backed principal orinterest. DNB anticipates a recovery in the market value as the securities approach their maturity dates orif interest rates decline from December 31, 2018 levels. Management concluded that these securities werenot other-than-temporarily impaired at December 31, 2018.
Corporate bonds There were eleven impaired bonds classified as corporate bonds, seven of whichwere impaired for more than 12 months. The largest unrealized loss of a security in this group is 4.15% ofits carrying value. The bonds are investment grade and the value decline is related to the changes ininterest rates that occurred since the time of purchase and subsequent changes in spreads affecting themarket prices. All of the issues carry a ‘‘BBB+’’ or better underlying credit rating and were evaluated onthe basis of their underlying fundamentals; included but not limited to annual financial reports, ratingagency reports, capital strength and debt ratios. DNB anticipates a recovery in the market value as thesecurities approach their maturity dates or if interest rates decline from December 31, 2018 levels.Management concluded that these securities were not other-than-temporarily impaired at December 31,2018.
In determining that the securities giving rise to the previously mentioned unrealized losses were notother than temporary, DNB evaluated the factors cited above, which DNB considers when assessingwhether a security is other-than-temporarily impaired. In making these evaluations DNB must exerciseconsiderable judgment. Accordingly, there can be no assurance that the actual results will not differ fromDNB’s judgments and that such differences may not require the future recognition ofother-than-temporary impairment charges that could have a material effect on DNB’s financial positionand results of operations. In addition, the value of, and the realization of any loss on, an investmentsecurity is subject to numerous risks as cited above.
The amortized cost and estimated fair value of investment securities as of December 31, 2018, by finalcontractual maturity, are shown below. Actual maturities may differ from contractual maturities becausecertain securities may be called or prepaid without penalties.
Held to Maturity Available for SaleAmortized Estimated Amortized Estimated
(Dollars in thousands) Cost Fair Value Cost Fair Value
Due in one year or less $11,599 $11,640 $22,755 $22,674Due after one year through five years 11,715 11,714 33,134 32,791Due after five years through ten years 29,359 28,992 18,990 18,380Due after ten years 9,353 8,789 23,886 22,798
Total investment securities $62,026 $61,135 $98,765 $96,643
83

The principal values of investment securities sold as of the dates indicated are shown below. TheHTM securities sold during 2017 were sold in accordance with GAAP, as DNB collected greater than 85%of the original recorded investment on the HTM securities prior to the sale. As a result, it is appropriate tocontinue to carry the remaining HTM portfolio as currently classified.
Year EndedDecember 31
(Dollars in thousands) 2018 2017
Available for sale securities sold $— $3,030Held to maturity securities sold — 737
Total sold securities $— $3,767
Gains and losses resulting from investment sales, redemptions or calls were as follows:
Year EndedDecember 31
(Dollars in thousands) 2018 2017
Gross realized gains-AFS $— $10Gross realized gains-HTM — 41Gross realized losses-AFS — (1)
Net realized gain $— $50
At December 31, 2018 and 2017, investment securities with a carrying value of approximately$95.8 million and $105.9 million, respectively, were pledged to secure public funds, repurchase agreements,FHLBP advances, and for other purposes as required by law. See Note 7 regarding the use of certainsecurities as collateral.
(3) LOANS
The major classifications of loans outstanding, net of fair value marks and deferred loan originationfees and costs are summarized as follows.
December 31(Dollars in thousands) 2018 2017
Residential mortgage $ 99,932 $ 93,959Commercial mortgage 535,735 484,868Commercial:
Commercial term 166,335 129,535Commercial construction 76,302 75,014
Consumer:Home equity 51,536 56,844Other 5,131 5,677
Total loans $934,971 $845,897Less allowance for credit losses (6,675) (5,843)
Net loans $928,296 $840,054
84
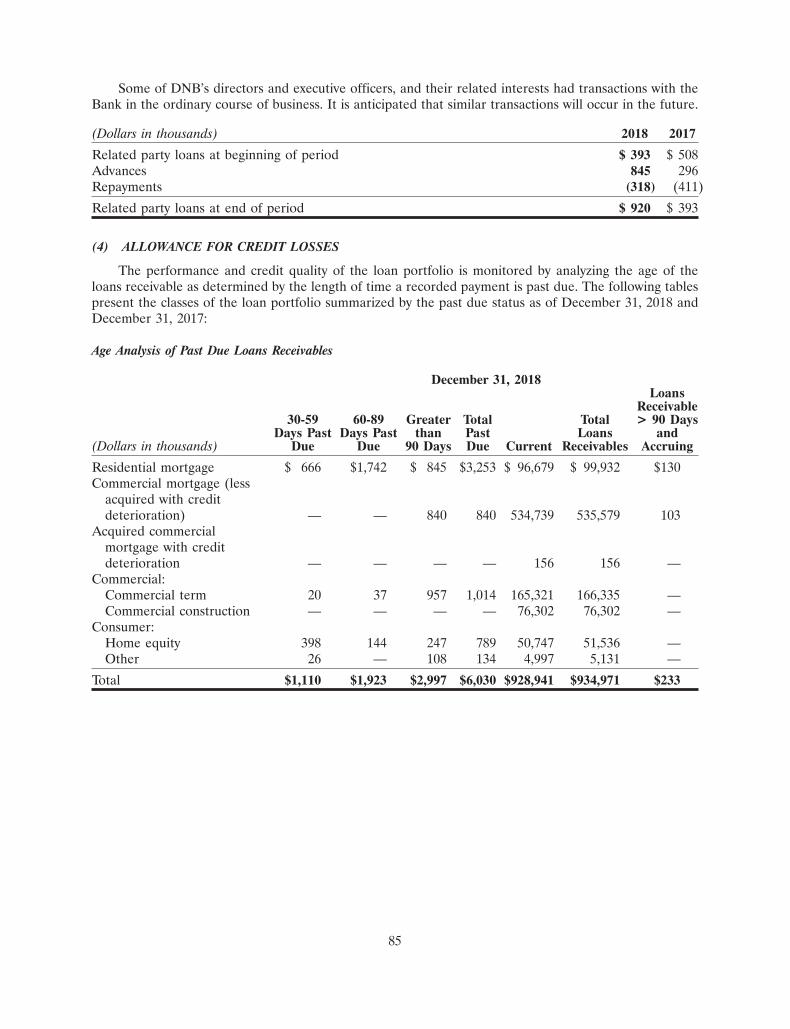
Some of DNB’s directors and executive officers, and their related interests had transactions with theBank in the ordinary course of business. It is anticipated that similar transactions will occur in the future.
(Dollars in thousands) 2018 2017
Related party loans at beginning of period $ 393 $ 508Advances 845 296Repayments (318) (411)
Related party loans at end of period $ 920 $ 393
(4) ALLOWANCE FOR CREDIT LOSSES
The performance and credit quality of the loan portfolio is monitored by analyzing the age of theloans receivable as determined by the length of time a recorded payment is past due. The following tablespresent the classes of the loan portfolio summarized by the past due status as of December 31, 2018 andDecember 31, 2017:
Age Analysis of Past Due Loans Receivables
December 31, 2018Loans
Receivable30-59 60-89 Greater Total Total > 90 Days
Days Past Days Past than Past Loans and(Dollars in thousands) Due Due 90 Days Due Current Receivables Accruing
Residential mortgage $ 666 $1,742 $ 845 $3,253 $ 96,679 $ 99,932 $130Commercial mortgage (less
acquired with creditdeterioration) — — 840 840 534,739 535,579 103
Acquired commercialmortgage with creditdeterioration — — — — 156 156 —
Commercial:Commercial term 20 37 957 1,014 165,321 166,335 —Commercial construction — — — — 76,302 76,302 —
Consumer:Home equity 398 144 247 789 50,747 51,536 —Other 26 — 108 134 4,997 5,131 —
Total $1,110 $1,923 $2,997 $6,030 $928,941 $934,971 $233
85
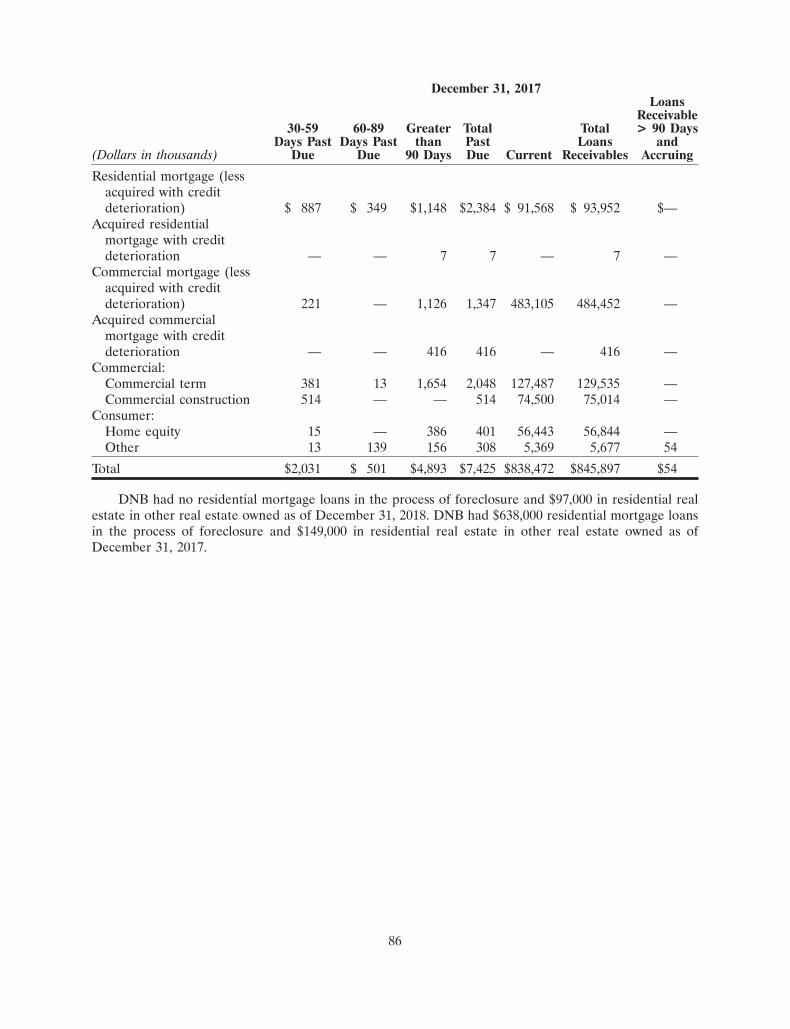
December 31, 2017Loans
Receivable30-59 60-89 Greater Total Total > 90 Days
Days Past Days Past than Past Loans and(Dollars in thousands) Due Due 90 Days Due Current Receivables Accruing
Residential mortgage (lessacquired with creditdeterioration) $ 887 $ 349 $1,148 $2,384 $ 91,568 $ 93,952 $—
Acquired residentialmortgage with creditdeterioration — — 7 7 — 7 —
Commercial mortgage (lessacquired with creditdeterioration) 221 — 1,126 1,347 483,105 484,452 —
Acquired commercialmortgage with creditdeterioration — — 416 416 — 416 —
Commercial:Commercial term 381 13 1,654 2,048 127,487 129,535 —Commercial construction 514 — — 514 74,500 75,014 —
Consumer:Home equity 15 — 386 401 56,443 56,844 —Other 13 139 156 308 5,369 5,677 54
Total $2,031 $ 501 $4,893 $7,425 $838,472 $845,897 $54
DNB had no residential mortgage loans in the process of foreclosure and $97,000 in residential realestate in other real estate owned as of December 31, 2018. DNB had $638,000 residential mortgage loansin the process of foreclosure and $149,000 in residential real estate in other real estate owned as ofDecember 31, 2017.
86
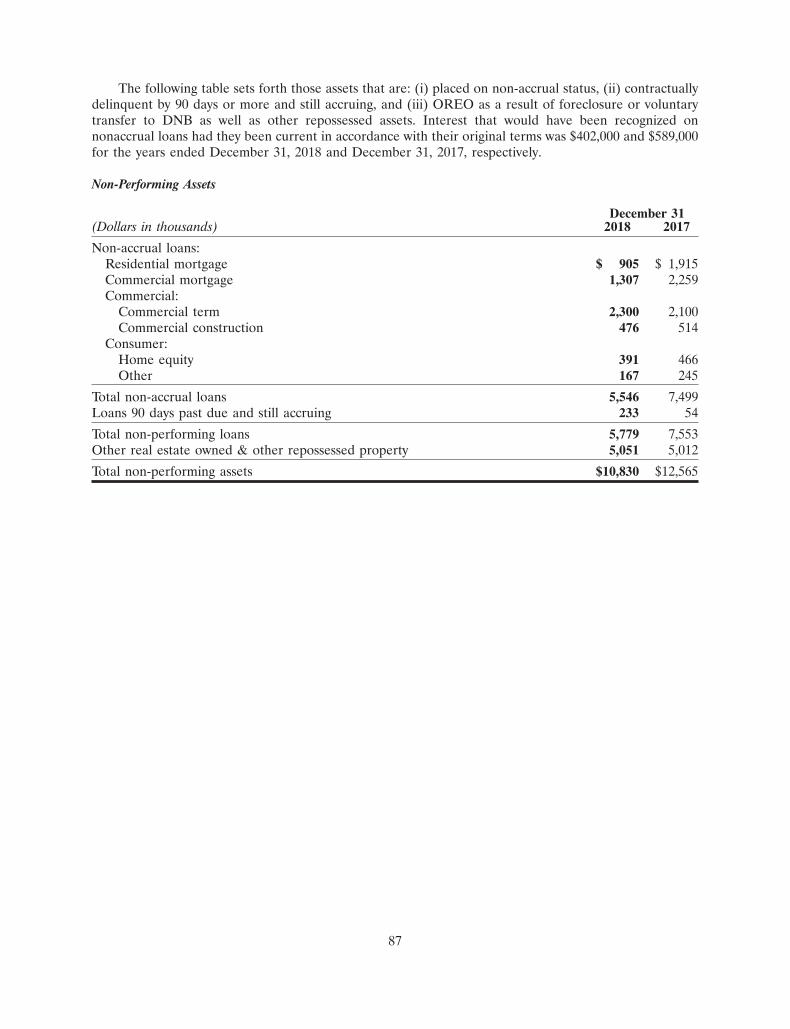
The following table sets forth those assets that are: (i) placed on non-accrual status, (ii) contractuallydelinquent by 90 days or more and still accruing, and (iii) OREO as a result of foreclosure or voluntarytransfer to DNB as well as other repossessed assets. Interest that would have been recognized onnonaccrual loans had they been current in accordance with their original terms was $402,000 and $589,000for the years ended December 31, 2018 and December 31, 2017, respectively.
Non-Performing Assets
December 31(Dollars in thousands) 2018 2017
Non-accrual loans:Residential mortgage $ 905 $ 1,915Commercial mortgage 1,307 2,259Commercial:
Commercial term 2,300 2,100Commercial construction 476 514
Consumer:Home equity 391 466Other 167 245
Total non-accrual loans 5,546 7,499Loans 90 days past due and still accruing 233 54
Total non-performing loans 5,779 7,553Other real estate owned & other repossessed property 5,051 5,012
Total non-performing assets $10,830 $12,565
87
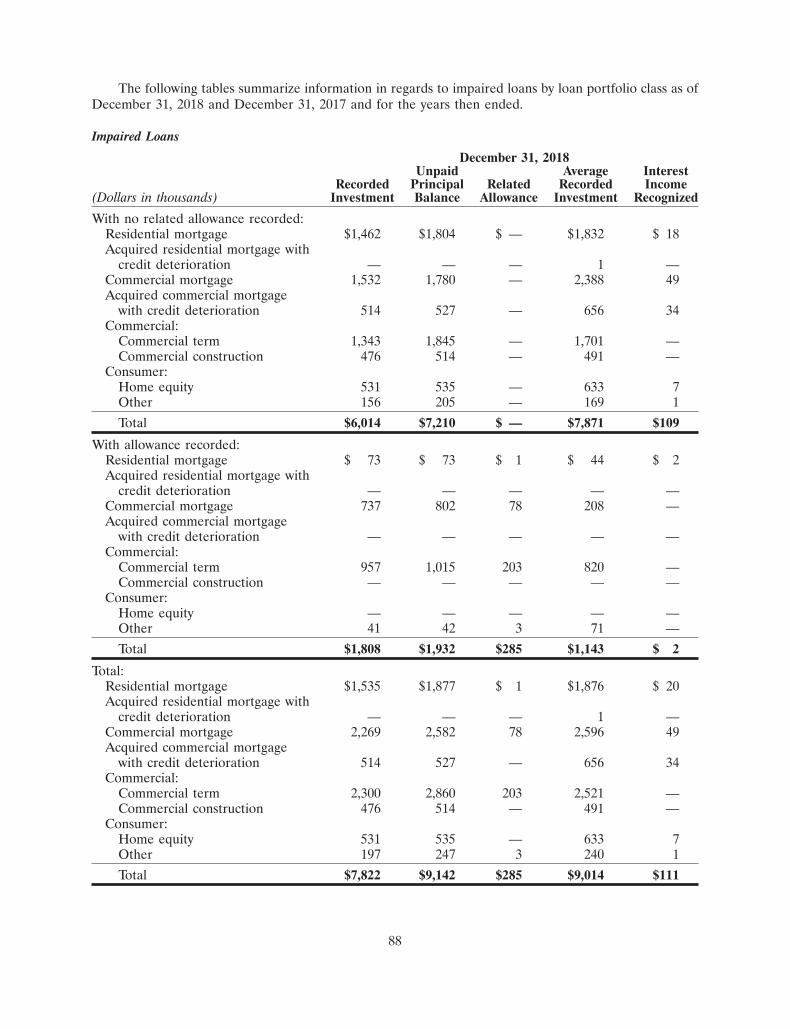
The following tables summarize information in regards to impaired loans by loan portfolio class as ofDecember 31, 2018 and December 31, 2017 and for the years then ended.
Impaired Loans
December 31, 2018Unpaid Average Interest
Recorded Principal Related Recorded Income(Dollars in thousands) Investment Balance Allowance Investment Recognized
With no related allowance recorded:Residential mortgage $1,462 $1,804 $ — $1,832 $ 18Acquired residential mortgage with
credit deterioration — — — 1 —Commercial mortgage 1,532 1,780 — 2,388 49Acquired commercial mortgage
with credit deterioration 514 527 — 656 34Commercial:
Commercial term 1,343 1,845 — 1,701 —Commercial construction 476 514 — 491 —
Consumer:Home equity 531 535 — 633 7Other 156 205 — 169 1
Total $6,014 $7,210 $ — $7,871 $109
With allowance recorded:Residential mortgage $ 73 $ 73 $ 1 $ 44 $ 2Acquired residential mortgage with
credit deterioration — — — — —Commercial mortgage 737 802 78 208 —Acquired commercial mortgage
with credit deterioration — — — — —Commercial:
Commercial term 957 1,015 203 820 —Commercial construction — — — — —
Consumer:Home equity — — — — —Other 41 42 3 71 —
Total $1,808 $1,932 $285 $1,143 $ 2
Total:Residential mortgage $1,535 $1,877 $ 1 $1,876 $ 20Acquired residential mortgage with
credit deterioration — — — 1 —Commercial mortgage 2,269 2,582 78 2,596 49Acquired commercial mortgage
with credit deterioration 514 527 — 656 34Commercial:
Commercial term 2,300 2,860 203 2,521 —Commercial construction 476 514 — 491 —
Consumer:Home equity 531 535 — 633 7Other 197 247 3 240 1
Total $7,822 $9,142 $285 $9,014 $111
88

December 31, 2017Unpaid Average Interest
Recorded Principal Related Recorded Income(Dollars in thousands) Investment Balance Allowance Investment Recognized
With no related allowance recorded:Residential mortgage $1,908 $ 2,210 $ — $1,540 $—Acquired residential mortgage with
credit deterioration — — — 7 —Commercial mortgage 2,809 3,207 — 2,180 15Acquired commercial mortgage
with credit deterioration 936 950 — 1,205 —Commercial:
Commercial term 1,743 2,253 — 1,131 —Commercial construction 514 514 — 690 —
Consumer:Home equity 612 632 — 586 9Other 117 117 — 106 —
Total $8,639 $ 9,883 $ — $7,445 $24
With allowance recorded:Residential mortgage $ — $ — $ — $ 333 $—Acquired residential mortgage with
credit deterioration 7 26 3 4 —Commercial mortgage 19 93 19 8 —Acquired commercial mortgage
with credit deterioration — — — — —Commercial:
Commercial term 337 343 123 325 —Commercial construction — — — 89 —
Consumer:Home equity — — — — —Other 128 129 12 169 —
Total $ 491 $ 591 $157 $ 928 $—
Total:Residential mortgage $1,908 $ 2,210 $ — $1,873 $—Acquired residential mortgage with
credit deterioration 7 26 3 11 —Commercial mortgage 2,828 3,300 19 2,188 15Acquired commercial mortgage
with credit deterioration 936 950 — 1,205 —Commercial:
Commercial term 2,080 2,596 123 1,456 —Commercial construction 514 514 — 779 —
Consumer:Home equity 612 632 — 586 9Other 245 246 12 275 —
Total $9,130 $10,474 $157 $8,373 $24
89
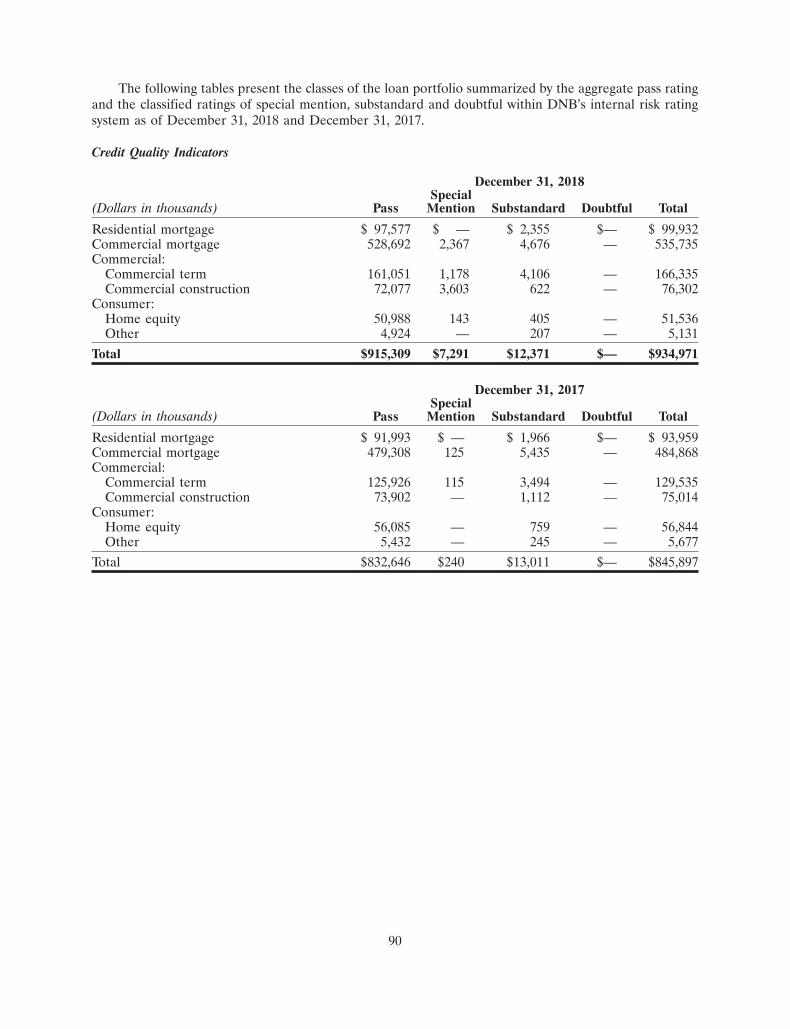
The following tables present the classes of the loan portfolio summarized by the aggregate pass ratingand the classified ratings of special mention, substandard and doubtful within DNB’s internal risk ratingsystem as of December 31, 2018 and December 31, 2017.
Credit Quality Indicators
December 31, 2018Special
(Dollars in thousands) Pass Mention Substandard Doubtful Total
Residential mortgage $ 97,577 $ — $ 2,355 $— $ 99,932Commercial mortgage 528,692 2,367 4,676 — 535,735Commercial:
Commercial term 161,051 1,178 4,106 — 166,335Commercial construction 72,077 3,603 622 — 76,302
Consumer:Home equity 50,988 143 405 — 51,536Other 4,924 — 207 — 5,131
Total $915,309 $7,291 $12,371 $— $934,971
December 31, 2017Special
(Dollars in thousands) Pass Mention Substandard Doubtful Total
Residential mortgage $ 91,993 $ — $ 1,966 $— $ 93,959Commercial mortgage 479,308 125 5,435 — 484,868Commercial:
Commercial term 125,926 115 3,494 — 129,535Commercial construction 73,902 — 1,112 — 75,014
Consumer:Home equity 56,085 — 759 — 56,844Other 5,432 — 245 — 5,677
Total $832,646 $240 $13,011 $— $845,897
90

Allowance for Credit Losses and Recorded Investment in Related Loans
The following tables set forth the activity and composition of DNB’s allowance for credit losses at thedates and periods indicated.
2018Residential Commercial Commercial Commercial Lease Consumer Consumer
(Dollars in thousands) Mortgage Mortgage Term Construction Financing Home Equity Other Unallocated Total
Allowance for credit losses:Beginning balance —
January 1, 2018 $ 221 $ 2,856 $ 845 $ 1,128 $— $ 183 $ 63 $547 $ 5,843Charge-offs (178) (249) (243) — — — (72) — (742)Recoveries 341 22 4 5 — — 2 — 374Provisions (223) 1,018 456 (101) — 7 53 (10) 1,200
Ending balance —December 31, 2018 $ 161 $ 3,647 $ 1,062 $ 1,032 $— $ 190 $ 46 $537 $ 6,675
Ending balance: individuallyevaluated for impairment $ 1 $ 78 $ 203 $ — $— $ — $ 3 $ — $ 285
Ending balance: collectivelyevaluated for impairment $ 160 $ 3,569 $ 859 $ 1,032 $— $ 190 $ 43 $537 $ 6,390
Ending balance: Loanreceivables $99,932 $535,735 $166,335 $76,302 $— $51,536 $5,131 $934,971
Ending balance: individuallyevaluated for impairment $ 1,535 $ 2,269 $ 2,300 $ 476 $— $ 531 $ 197 $ 7,308
Ending balance: acquiredwith credit deterioration $ — $ 514 $ — $ — $— $ — $ — $ 514
Ending balance: collectivelyevaluated for impairment $98,397 $532,952 $164,035 $75,826 $— $51,005 $4,934 $927,149
2017Residential Commercial Commercial Commercial Lease Consumer Consumer
(Dollars in thousands) Mortgage Mortgage Term Construction Financing Home Equity Other Unallocated Total
Allowance for credit losses:Beginning balance —
January 1, 2017 $ 349 $ 2,531 $ 709 $ 969 $— $ 196 $ 61 $558 $ 5,373Charge-offs (85) (519) (683) — — — (38) — (1,325)Recoveries 16 51 23 42 1 — 2 — 135Provisions (59) 793 796 117 (1) (13) 38 (11) 1,660
Ending balance —December 31, 2017 $ 221 $ 2,856 $ 845 $ 1,128 $— $ 183 $ 63 $547 $ 5,843
Ending balance: individuallyevaluated for impairment $ 3 $ 19 $ 123 $ — $— $ — $ 12 $ — $ 157
Ending balance: collectivelyevaluated for impairment $ 218 $ 2,837 $ 722 $ 1,128 $— $ 183 $ 51 $547 $ 5,686
Ending balance: Loanreceivables $93,959 $484,868 $129,535 $75,014 $— $56,844 $5,677 $845,897
Ending balance: individuallyevaluated for impairment $ 1,908 $ 2,828 $ 2,080 $ 514 $— $ 612 $ 245 $ 8,187
Ending balance: acquiredwith credit deterioration $ 7 $ 936 $ — $ — $— $ — $ — $ 943
Ending balance: collectivelyevaluated for impairment $92,044 $481,104 $127,455 $74,500 $— $56,232 $5,432 $836,767
91

The changes in the accretable yield of acquired loans accounted for under ASC 310-30 for the yearsended December 31, 2018 and 2017 were as follows:
(Dollars in thousands) 2018 2017
Beginning balance, January 1 $196 $ 314Reclassification of non-accretable discount — 92Accretion (51) (97)Payments — (113)
Ending balance, December 31 $145 $ 196
(5) OFFICE PROPERTY AND EQUIPMENT
Estimated December 31(Dollars in thousands) Useful Lives 2018 2017
Land $ 840 $ 840Buildings and leasehold improvements 5-31.5 years 13,129 13,063Furniture, fixtures and equipment 2-20 years 16,811 16,658
Total cost 30,780 30,561Less accumulated depreciation (23,144) (21,912)
Office property and equipment, net $ 7,636 $ 8,649
Amounts charged to furniture and equipment for depreciation amounted to $1.2 million for bothyears ended December 31, 2018 and 2017.
The Bank leases office space from Headwaters Associates (‘‘Headwaters’’), a Pennsylvania generalpartnership for which Mary D. Latoff (a director of DNB and the sole beneficiary of the Marital Trustcreated under Will of William S. Latoff), has been one of two general partners since January 1, 2017.Pursuant to the terms of the Lease, the Bank paid Headwaters an aggregate of $496,000 in 2018, and$530,000 in 2017. As a general partner of Headwaters, Mary Latoff received $248,000 and $265,000 in 2018and 2017, respectively, as a result of the lease.
(6) DEPOSITS
Included in interest bearing time deposits are time and brokered time deposit issued in amounts of$250,000 or more totaling $48.3 million and $59.5 million at December 31, 2018 and 2017, respectively.These certificates and their remaining maturities at December 31, 2018 were as follows:
December 31, 2018Brokered
Time Time(Dollars in thousands) Deposits Deposits Total
Three months or less $ 5,054 $— $ 5,054Over three through six months 14,244 — 14,244Over six through twelve months 18,514 — 18,514Over one year through two years 9,321 — 9,321Over two years 1,166 — 1,166
Total $48,299 $— $48,299
92

Time and brokered deposit scheduled to mature have the following remaining maturities:
December 31, 2018Brokered
Time Time(Dollars in thousands) Deposits Deposits Total
One year or less $ 97,071 $45,511 $142,582Over one year through two years 54,531 34,904 89,435Over two years through three years 2,281 13,224 15,505Over three years through four years 1,935 5,000 6,935Over four years through five years 6,278 — 6,278Over five years — — —
Total $162,096 $98,639 $260,735
At December 31, 2018 and 2017, deposits of related parties amounted to $5.6 million and $7.6 million,respectively. The aggregate amount of demand deposit overdrafts that were reclassified as loans was$217,000 at December 31, 2018, compared to $265,000 at December 31, 2017.
(7) FHLBP ADVANCES AND SHORT-TERM BORROWED FUNDS
The schedule below provides a summary of short-term borrowings that consist of securities sold underagreements to repurchase, federal funds purchased with Atlantic Community Bankers Bank and otherborrowings. Securities sold under agreements to repurchase are overnight borrowings between DNB andits commercial depositors and are subject to daily repricing. Federal Funds purchased from correspondentbanks mature in one business day and reprice daily based on the Federal Funds rate. As of December 31,2018, DNB’s total availability under Federal Funds lines was $60.0 million. Other short-term borrowingsconsist of credit available through the Federal Home Loan Bank of Pittsburgh (FHLBP) and the FederalReserve Discount Window. DNB maintains a line-of-credit (Open Repo Plus) with the FHLBP which is arevolving term commitment used on an overnight basis. The term of this commitment may not exceed364 days and it reprices daily at market rates. Under terms of a blanket collateral agreement with theFHLBP, the line-of-credit and long term advances are secured by FHLBP stock and qualifying loanreceivables, principally real estate secured loans. As of December 31, 2018 DNB’s total availability was$508.6 million with the FHLBP and availability at the Federal Reserve Discount Window is dependentupon the market value of the collateral delivered to the Federal Reserve at the time funds are borrowed.
The following table presents a summary of aggregate short-term borrowings as of and for the yearsended December 31, 2018 and 2017.
2018 2017Federal Federal
Repurchase Funds Repurchase Funds(Dollars in thousands) Agreements Purchased Agreements Purchased
Amount outstanding at end of year $ — $ — $12,023 $2,372Weighted average interest rate at end of year —% —% 0.20% 1.75%Maximum amount outstanding at any month-end $14,160 $5,233 $17,028 $2,372Daily average amount outstanding $ 7,516 $1,106 $14,229 $ 143Weighted average interest rate for the year 0.20% 1.92% 0.20% 1.22%
Total other borrowings at December 31, 2018 and 2017 consist of amounts described above and thecapital lease obligation in Note 8. At December 31, 2018, total other borrowings also included $3.0 millionrepresenting purchased loans not yet funded.
93
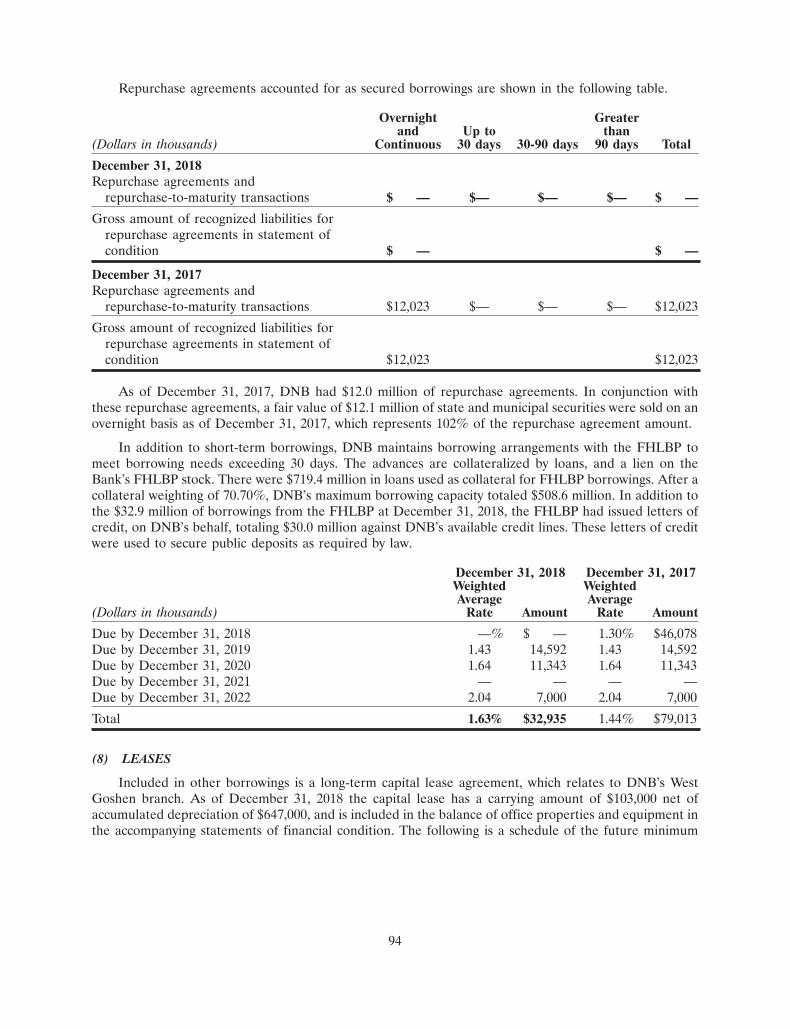
Repurchase agreements accounted for as secured borrowings are shown in the following table.
Overnight Greaterand Up to than
(Dollars in thousands) Continuous 30 days 30-90 days 90 days Total
December 31, 2018Repurchase agreements and
repurchase-to-maturity transactions $ — $— $— $— $ —
Gross amount of recognized liabilities forrepurchase agreements in statement ofcondition $ — $ —
December 31, 2017Repurchase agreements and
repurchase-to-maturity transactions $12,023 $— $— $— $12,023
Gross amount of recognized liabilities forrepurchase agreements in statement ofcondition $12,023 $12,023
As of December 31, 2017, DNB had $12.0 million of repurchase agreements. In conjunction withthese repurchase agreements, a fair value of $12.1 million of state and municipal securities were sold on anovernight basis as of December 31, 2017, which represents 102% of the repurchase agreement amount.
In addition to short-term borrowings, DNB maintains borrowing arrangements with the FHLBP tomeet borrowing needs exceeding 30 days. The advances are collateralized by loans, and a lien on theBank’s FHLBP stock. There were $719.4 million in loans used as collateral for FHLBP borrowings. After acollateral weighting of 70.70%, DNB’s maximum borrowing capacity totaled $508.6 million. In addition tothe $32.9 million of borrowings from the FHLBP at December 31, 2018, the FHLBP had issued letters ofcredit, on DNB’s behalf, totaling $30.0 million against DNB’s available credit lines. These letters of creditwere used to secure public deposits as required by law.
December 31, 2018 December 31, 2017Weighted WeightedAverage Average
(Dollars in thousands) Rate Amount Rate Amount
Due by December 31, 2018 —% $ — 1.30% $46,078Due by December 31, 2019 1.43 14,592 1.43 14,592Due by December 31, 2020 1.64 11,343 1.64 11,343Due by December 31, 2021 — — — —Due by December 31, 2022 2.04 7,000 2.04 7,000
Total 1.63% $32,935 1.44% $79,013
(8) LEASES
Included in other borrowings is a long-term capital lease agreement, which relates to DNB’s WestGoshen branch. As of December 31, 2018 the capital lease has a carrying amount of $103,000 net ofaccumulated depreciation of $647,000, and is included in the balance of office properties and equipment inthe accompanying statements of financial condition. The following is a schedule of the future minimum
94

capital lease payments, together with the present value of the net minimum lease payments, as ofDecember 31, 2018:
Year ended(Dollars in thousands) December 31
2019 $1072020 1062021 1072022 692023 —Thereafter —
Total minimum lease payments 389Less amount representing interest (84)
Present value of net minimum lease payments $305
DNB recognized rent expense of $1.1 million and $1.2 million for the years ended December 31, 2018and 2017, respectively. The following is a schedule of the future minimum non-cancelable operating leasepayments for the Operations Center in Downingtown and leased branches as of December 31, 2018.
Year ended(Dollars in thousands) December 31
2019 $1,0472020 7992021 6332022 4722023 197Thereafter —
Total minimum lease payments $3,148
(9) SUBORDINATED DEBENTURES AND NOTES
DNB has two issuances of junior subordinated debentures (the ‘‘debentures’’) as follows. The majorityof the proceeds of each issuance were invested in DNB’s subsidiary, to increase the Bank’s capital levels.The junior subordinated debentures issued in each case qualify as a component of capital for regulatorypurposes. DNB Capital Trust I and II are special purpose Delaware business trusts, which are notconsolidated.
DNB Capital Trust I
DNB’s first issuance of junior subordinated debentures was on July 20, 2001. This issuance ofdebentures are at floating rates and were issued to DNB Capital Trust I, a Delaware business trust in whichDNB owns all of the common equity. DNB Capital Trust I issued $5 million of floating rate (6 month Liborplus 3.75%, with a cap of 12%) capital preferred securities to a qualified institutional buyer. The proceedsof these securities were used by the Trust, along with DNB’s capital contribution, to purchase $5,155,000principal amount of DNB’s floating rate junior subordinated debentures. The preferred securities havebeen redeemable since July 25, 2006 and must be redeemed upon maturity of the debentures on July 25,2031.
95
DNB Capital Trust II
DNB’s second issuance of junior subordinated debentures was on March 30, 2005. This issuance ofdebentures are at floating rates and were issued to DNB Capital Trust II, a Delaware business trust inwhich DNB owns all of the common equity. DNB Capital Trust II issued $4.0 million of floating rate (therate was fixed at 6.56% for the first 5 years and is now adjusting at a rate of 3-month LIBOR plus 1.77%)capital preferred securities. The proceeds of these securities were used by the Trust, along with DNB’scapital contribution, to purchase $4,124,000 principal amount of DNB’s floating rate junior subordinateddebentures. The preferred securities have been redeemable since May 23, 2010. The preferred securitiesmust be redeemed upon maturity of the debentures on May 23, 2035.
Subordinated Note
On March 5, 2015, DNB Financial Corporation entered into a Subordinated Note PurchaseAgreement (the ‘‘Agreement’’) with an accredited investor under which the Company issued a$9.75 million subordinated note (the ‘‘Note’’) to the investor. The Note has a maturity date of March 6,2025, and bears interest at a fixed rate of 4.25% per annum for the first 5 years and then will float at theWall Street Journal Prime rate plus 1.00%, provided that the interest rate applicable to the outstandingprincipal balance will at no time be less than 3.0% or greater than 5.75% per annum.
DNB may, at its option, beginning with the first interest payment date after March 6, 2019, and on anyinterest payment date thereafter, redeem the Note, in whole or in part, at par plus accrued and unpaidinterest to the date of redemption. The Note is not subject to repayment at the option of the noteholder.
The Note is unsecured and ranks junior in right of payment to DNB’s senior indebtedness and toDNB’s obligations to its general creditors and qualifies as Tier 2 capital for regulatory purposes.
(10) FAIR VALUES
FASB ASC Topic 820, Fair Value Measurements and Disclosures, establishes a fair value hierarchybased on the nature of data inputs for fair value determinations, under which DNB is required to valueeach asset within its scope using assumptions that market participations would utilize to value that asset.When DNB uses its own assumptions, it is required to disclose additional information about theassumptions used and the effect of the measurement on earnings or the net change in assets for the period.
The three levels of the fair value hierarchy under FASB ASC Topic 820 are as follows:
Level 1 — Quoted prices in active markets for identical securities.
Level 2 — Quoted prices for similar instruments in active markets; quoted prices for identical orsimilar instruments in markets that are not active and model derived valuations whose inputs areobservable or whose significant value drivers are observable.
Level 3 — Instruments whose significant value drivers are unobservable.
A description of the valuation methodologies used for assets measured at fair value is set forth below:
DNB’s available-for-sale investment securities, which generally include U.S. government agencies andmortgage backed securities, collateralized mortgage obligations, corporate bonds, asset-backed securities,and state and municipal tax-exempt securities are reported at fair value. These securities are valued by anindependent third party (‘‘preparer’’). The preparer’s evaluations are based on market data. They utilizeevaluated pricing models that vary by asset and incorporate available trade, bid and other marketinformation. For securities that do not trade on a daily basis, their evaluated pricing applications applyavailable information such as benchmarking and matrix pricing. The market inputs normally sought in theevaluation of securities include benchmark yields, reported trades, broker/dealer quotes (only obtainedfrom market makers or broker/dealers recognized as market participants), issuer spreads, two-sided
96
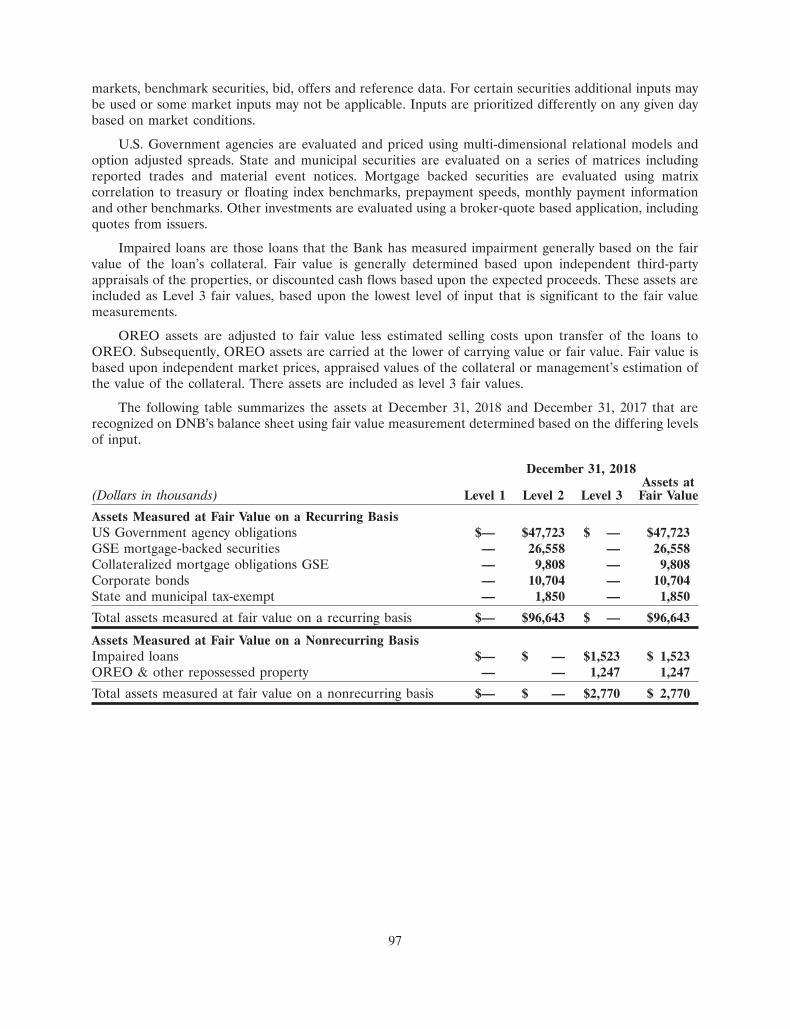
markets, benchmark securities, bid, offers and reference data. For certain securities additional inputs maybe used or some market inputs may not be applicable. Inputs are prioritized differently on any given daybased on market conditions.
U.S. Government agencies are evaluated and priced using multi-dimensional relational models andoption adjusted spreads. State and municipal securities are evaluated on a series of matrices includingreported trades and material event notices. Mortgage backed securities are evaluated using matrixcorrelation to treasury or floating index benchmarks, prepayment speeds, monthly payment informationand other benchmarks. Other investments are evaluated using a broker-quote based application, includingquotes from issuers.
Impaired loans are those loans that the Bank has measured impairment generally based on the fairvalue of the loan’s collateral. Fair value is generally determined based upon independent third-partyappraisals of the properties, or discounted cash flows based upon the expected proceeds. These assets areincluded as Level 3 fair values, based upon the lowest level of input that is significant to the fair valuemeasurements.
OREO assets are adjusted to fair value less estimated selling costs upon transfer of the loans toOREO. Subsequently, OREO assets are carried at the lower of carrying value or fair value. Fair value isbased upon independent market prices, appraised values of the collateral or management’s estimation ofthe value of the collateral. There assets are included as level 3 fair values.
The following table summarizes the assets at December 31, 2018 and December 31, 2017 that arerecognized on DNB’s balance sheet using fair value measurement determined based on the differing levelsof input.
December 31, 2018Assets at
(Dollars in thousands) Level 1 Level 2 Level 3 Fair Value
Assets Measured at Fair Value on a Recurring BasisUS Government agency obligations $— $47,723 $ — $47,723GSE mortgage-backed securities — 26,558 — 26,558Collateralized mortgage obligations GSE — 9,808 — 9,808Corporate bonds — 10,704 — 10,704State and municipal tax-exempt — 1,850 — 1,850
Total assets measured at fair value on a recurring basis $— $96,643 $ — $96,643
Assets Measured at Fair Value on a Nonrecurring BasisImpaired loans $— $ — $1,523 $ 1,523OREO & other repossessed property — — 1,247 1,247
Total assets measured at fair value on a nonrecurring basis $— $ — $2,770 $ 2,770
97

December 31, 2017Assets at
(Dollars in thousands) Level 1 Level 2 Level 3 Fair Value
Assets Measured at Fair Value on a Recurring BasisUS Government agency obligations $— $ 52,893 $ — $ 52,893GSE mortgage-backed securities — 32,488 — 32,488Collateralized mortgage obligations GSE — 11,654 — 11,654Corporate bonds — 12,820 — 12,820State and municipal tax-exempt — 1,928 — 1,928
Total assets measured at fair value on a recurring basis $— $111,783 $ — $111,783
Assets Measured at Fair Value on a Nonrecurring BasisImpaired loans $— $ — $1,814 $ 1,814OREO & other repossessed property — — 817 817
Total assets measured at fair value on a nonrecurring basis $— $ — $2,631 $ 2,631
The following table presents additional information about assets measured at fair value on anonrecurring basis and for which DNB has utilized Level 3 inputs to determine fair value:
Quantitative Information about Level 3 Fair Value MeasurementDecember 31, 2018
Fair Value Valuation Unobservable Range(Dollars in thousands) Estimate Techniques Input (Weighted Average)
Impaired loans —Residential mortgage $ 72 Appraisal of collateral(1) Disposal costs(2) �8% to �8% (�8%)
Impaired loans —Commercial mortgage 659 Appraisal of collateral(1) Disposal costs(2) �14% to �14% (�14%)
Impaired loans —Commercial term 754 Appraisal of collateral(1) Disposal costs(2) 0% to �16% (�11%)
Impaired loans —Consumer other 38 Appraisal of collateral(1) Disposal costs(2) �8% to �8% (�8%)
Impaired loan total $1,523
Other real estate owned $1,247 Disposal costs(2) �8% to �8% (�8%)
98

Quantitative Information about Level 3 Fair Value MeasurementDecember 31, 2017
Fair Value Valuation Unobservable Range(Dollars in thousands) Estimate Techniques Input (Weighted Average)
Impaired loans —Residential mortgage $ 4 Appraisal of collateral(1) Disposal costs(2) �8% to �8% (�8%)
Impaired loans —Commercial mortgage 46 Appraisal of collateral(1) Disposal costs(2) �8% to �8% (�8%)
Impaired loans —Commercial term 1,648 Appraisal of collateral(1) Disposal costs(2) 0% to �9% (�8%)
Impaired loans —Consumer other 116 Appraisal of collateral(1) Disposal costs(2) �8% to �8% (�8%)
Impaired loan total $1,814
Other real estate owned $ 817 Disposal costs(2) �8% to �8% (�8%)(1) Fair value is generally determined through independent appraisals or sales contracts of the underlying collateral,
which generally include various level 3 inputs which are not identifiable.
(2) Appraisals are adjusted by management for qualitative factors, such as economic conditions and estimateddisposal costs.
Impaired loans. Impaired loans, which are measured for impairment using the fair value of thecollateral for collateral dependent loans, had a carrying amount of $7.8 million at December 31, 2018. Ofthis, $1.8 million had specific valuation allowances of $285,000, leaving a fair value of $1.5 million as ofDecember 31, 2018. DNB did not have any impaired loans that were partially charged down that didn’talready have a specific reserve during the year ended December 31, 2018. The total fair value of impairedloans at December 31, 2018 was $1.5 million.
Impaired loans had a carrying amount of $9.1 million at December 31, 2017. Of this, $491,000 hadspecific valuation allowances of $157,000, leaving a fair value of $334,000 at December 31, 2017. Inaddition, DNB had $1.9 million in impaired loans that were partially charged down by $442,000, leaving$1.5 million at fair value as of December 31, 2017. The total fair value of impaired loans at December 31,2017 was $1.8 million.
Other Real Estate Owned & other repossessed property Other real estate owned (‘‘OREO’’) consists ofproperties acquired as a result of, or in-lieu-of, foreclosure. Properties or other assets are classified asOREO and other repossessed property are initially recorded at fair value less cost to sell at the date offoreclosure, establishing a new cost basis. Subsequent to foreclosure, valuations are periodically performedby management and the assets are carried at the lower of carrying value or fair value, less estimated coststo sell. Costs relating to the development or improvement of the assets are capitalized and costs relating toholding the assets are charged to expense. DNB had $5.1 million of such assets at December 31, 2018,which consisted of $4.9 million in OREO and $142,000 in other repossessed property. DNB had$5.0 million of such assets at December 31, 2017, which consisted of $4.8 million in OREO and $177,000 inother repossessed property. Subsequent to the repossession of these assets, DNB wrote down the carryingvalues of certain assets totaling $1.6 million by $355,000 to $1.2 million in OREO during the year endedDecember 31, 2018. DNB wrote down the carrying values of certain assets totaling $956,000 by $139,000 to$817,000 in OREO during the year ended December 31, 2017.
99
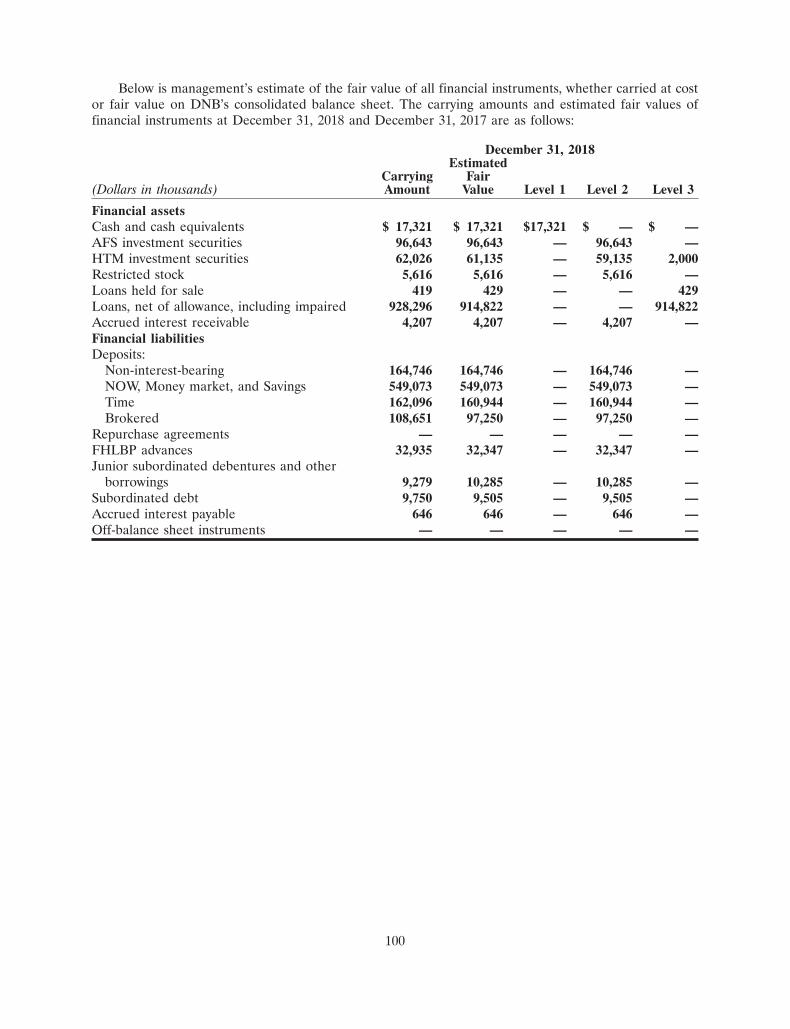
Below is management’s estimate of the fair value of all financial instruments, whether carried at costor fair value on DNB’s consolidated balance sheet. The carrying amounts and estimated fair values offinancial instruments at December 31, 2018 and December 31, 2017 are as follows:
December 31, 2018Estimated
Carrying Fair(Dollars in thousands) Amount Value Level 1 Level 2 Level 3
Financial assetsCash and cash equivalents $ 17,321 $ 17,321 $17,321 $ — $ —AFS investment securities 96,643 96,643 — 96,643 —HTM investment securities 62,026 61,135 — 59,135 2,000Restricted stock 5,616 5,616 — 5,616 —Loans held for sale 419 429 — — 429Loans, net of allowance, including impaired 928,296 914,822 — — 914,822Accrued interest receivable 4,207 4,207 — 4,207 —Financial liabilitiesDeposits:
Non-interest-bearing 164,746 164,746 — 164,746 —NOW, Money market, and Savings 549,073 549,073 — 549,073 —Time 162,096 160,944 — 160,944 —Brokered 108,651 97,250 — 97,250 —
Repurchase agreements — — — — —FHLBP advances 32,935 32,347 — 32,347 —Junior subordinated debentures and other
borrowings 9,279 10,285 — 10,285 —Subordinated debt 9,750 9,505 — 9,505 —Accrued interest payable 646 646 — 646 —Off-balance sheet instruments — — — — —
100
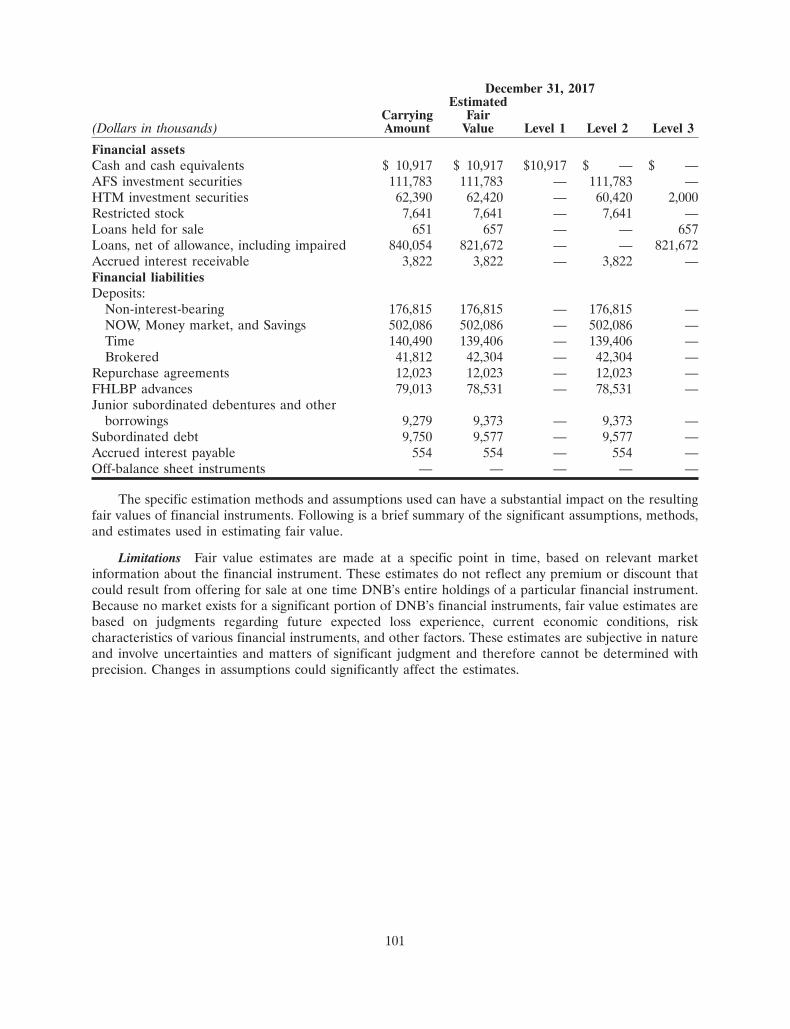
December 31, 2017Estimated
Carrying Fair(Dollars in thousands) Amount Value Level 1 Level 2 Level 3
Financial assetsCash and cash equivalents $ 10,917 $ 10,917 $10,917 $ — $ —AFS investment securities 111,783 111,783 — 111,783 —HTM investment securities 62,390 62,420 — 60,420 2,000Restricted stock 7,641 7,641 — 7,641 —Loans held for sale 651 657 — — 657Loans, net of allowance, including impaired 840,054 821,672 — — 821,672Accrued interest receivable 3,822 3,822 — 3,822 —Financial liabilitiesDeposits:
Non-interest-bearing 176,815 176,815 — 176,815 —NOW, Money market, and Savings 502,086 502,086 — 502,086 —Time 140,490 139,406 — 139,406 —Brokered 41,812 42,304 — 42,304 —
Repurchase agreements 12,023 12,023 — 12,023 —FHLBP advances 79,013 78,531 — 78,531 —Junior subordinated debentures and other
borrowings 9,279 9,373 — 9,373 —Subordinated debt 9,750 9,577 — 9,577 —Accrued interest payable 554 554 — 554 —Off-balance sheet instruments — — — — —
The specific estimation methods and assumptions used can have a substantial impact on the resultingfair values of financial instruments. Following is a brief summary of the significant assumptions, methods,and estimates used in estimating fair value.
Limitations Fair value estimates are made at a specific point in time, based on relevant marketinformation about the financial instrument. These estimates do not reflect any premium or discount thatcould result from offering for sale at one time DNB’s entire holdings of a particular financial instrument.Because no market exists for a significant portion of DNB’s financial instruments, fair value estimates arebased on judgments regarding future expected loss experience, current economic conditions, riskcharacteristics of various financial instruments, and other factors. These estimates are subjective in natureand involve uncertainties and matters of significant judgment and therefore cannot be determined withprecision. Changes in assumptions could significantly affect the estimates.
101
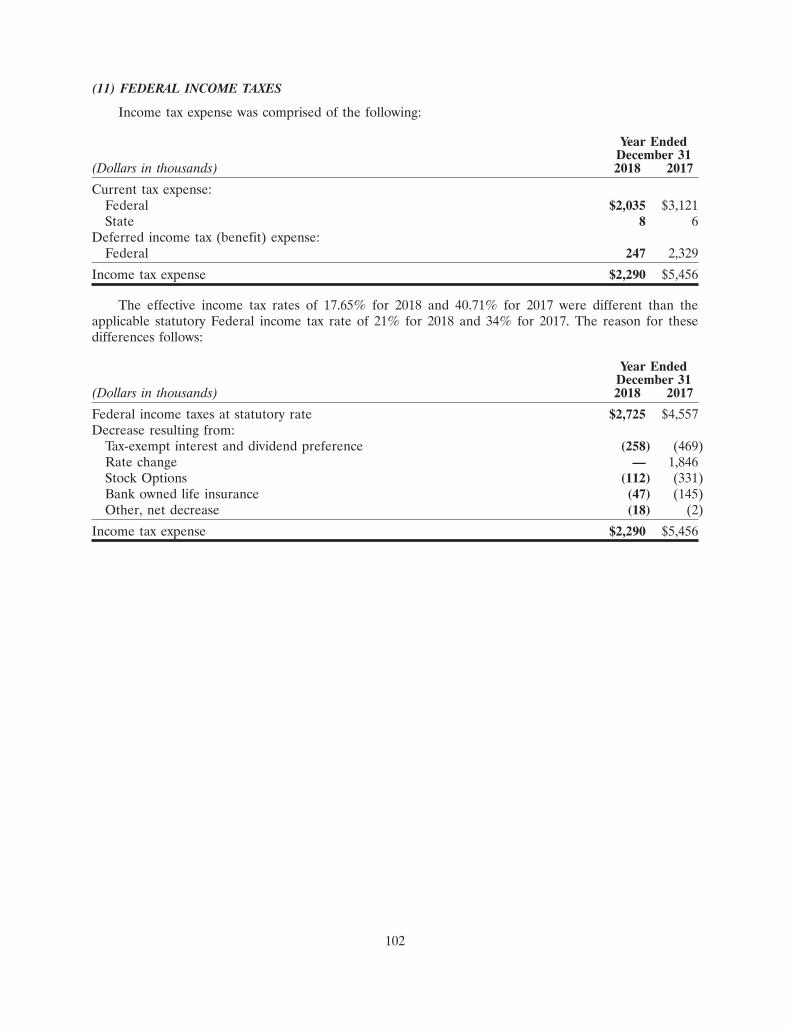
(11) FEDERAL INCOME TAXES
Income tax expense was comprised of the following:
Year EndedDecember 31
(Dollars in thousands) 2018 2017
Current tax expense:Federal $2,035 $3,121State 8 6
Deferred income tax (benefit) expense:Federal 247 2,329
Income tax expense $2,290 $5,456
The effective income tax rates of 17.65% for 2018 and 40.71% for 2017 were different than theapplicable statutory Federal income tax rate of 21% for 2018 and 34% for 2017. The reason for thesedifferences follows:
Year EndedDecember 31
(Dollars in thousands) 2018 2017
Federal income taxes at statutory rate $2,725 $4,557Decrease resulting from:
Tax-exempt interest and dividend preference (258) (469)Rate change — 1,846Stock Options (112) (331)Bank owned life insurance (47) (145)Other, net decrease (18) (2)
Income tax expense $2,290 $5,456
102
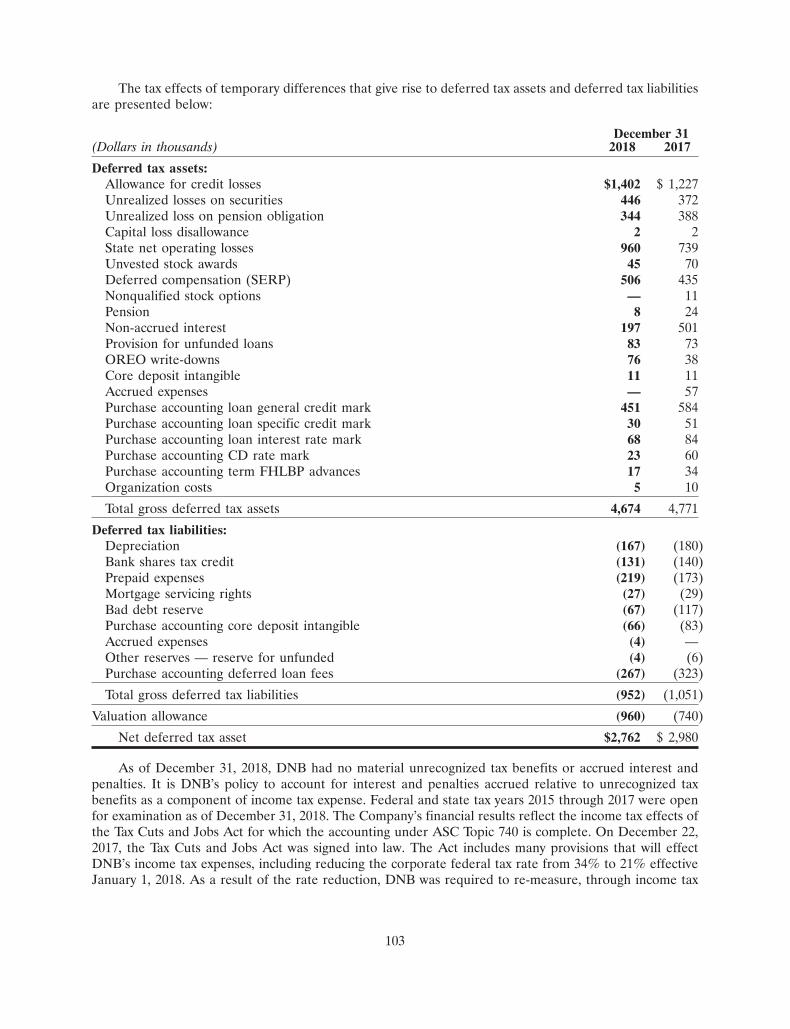
The tax effects of temporary differences that give rise to deferred tax assets and deferred tax liabilitiesare presented below:
December 31(Dollars in thousands) 2018 2017
Deferred tax assets:Allowance for credit losses $1,402 $ 1,227Unrealized losses on securities 446 372Unrealized loss on pension obligation 344 388Capital loss disallowance 2 2State net operating losses 960 739Unvested stock awards 45 70Deferred compensation (SERP) 506 435Nonqualified stock options — 11Pension 8 24Non-accrued interest 197 501Provision for unfunded loans 83 73OREO write-downs 76 38Core deposit intangible 11 11Accrued expenses — 57Purchase accounting loan general credit mark 451 584Purchase accounting loan specific credit mark 30 51Purchase accounting loan interest rate mark 68 84Purchase accounting CD rate mark 23 60Purchase accounting term FHLBP advances 17 34Organization costs 5 10
Total gross deferred tax assets 4,674 4,771
Deferred tax liabilities:Depreciation (167) (180)Bank shares tax credit (131) (140)Prepaid expenses (219) (173)Mortgage servicing rights (27) (29)Bad debt reserve (67) (117)Purchase accounting core deposit intangible (66) (83)Accrued expenses (4) —Other reserves — reserve for unfunded (4) (6)Purchase accounting deferred loan fees (267) (323)
Total gross deferred tax liabilities (952) (1,051)
Valuation allowance (960) (740)
Net deferred tax asset $2,762 $ 2,980
As of December 31, 2018, DNB had no material unrecognized tax benefits or accrued interest andpenalties. It is DNB’s policy to account for interest and penalties accrued relative to unrecognized taxbenefits as a component of income tax expense. Federal and state tax years 2015 through 2017 were openfor examination as of December 31, 2018. The Company’s financial results reflect the income tax effects ofthe Tax Cuts and Jobs Act for which the accounting under ASC Topic 740 is complete. On December 22,2017, the Tax Cuts and Jobs Act was signed into law. The Act includes many provisions that will effectDNB’s income tax expenses, including reducing the corporate federal tax rate from 34% to 21% effectiveJanuary 1, 2018. As a result of the rate reduction, DNB was required to re-measure, through income tax
103

expense in the period of enactment, its deferred tax assets and liabilities using the enacted rate at whichDNB expects them to be recovered or settled. The re-measurement of the net deferred tax asset resulted inadditional income tax expense of $1.8 million.
DNB had net state operating loss carryovers with the Commonwealth of Pennsylvania of $11.4 millionand $10.5 million at December 31, 2018 and 2017, respectively for which a full valuation allowance hasbeen established. These carryovers will begin to expire in 2021.
(12) EARNINGS PER COMMON SHARE
Basic earnings per share (‘‘EPS’’) is computed based on the weighted average number of commonshares outstanding during the period. Diluted EPS is computed using the treasury stock method andreflects the potential dilution that could occur from the exercise of stock options and the amortized portionof unvested stock awards. Stock options and unvested stock awards for which the exercise or the grantprice exceeds the average market price over the period have an anti-dilutive effect on EPS and,accordingly, are excluded from the calculation. Treasury shares are not deemed outstanding for earningsper share calculations. There were no anti-dilutive stock options outstanding, and 9,200 anti-dilutive stockawards at December 31, 2018. There were no anti-dilutive stock options outstanding, and no anti-dilutivestock awards at December 31, 2017. The following table sets forth the computation of basic and dilutedearnings per share:
Year Ended December 31(In thousands,except per share data) 2018 2017
Income Shares Amount Income Shares Amount
Basic EPSNet income available to common
stockholders $10,684 4,303 $2.48 $7,946 4,260 $ 1.87
Effect of potential dilutive common stockequivalents — stock options andrestricted shares — 12 — — 30 (0.02)
Diluted EPSIncome available to common stockholders
after assumed exercises $10,684 4,315 $2.48 $7,946 4,290 $ 1.85
(13) BENEFIT PLANS
Pension Plan The Bank maintains a defined benefit pension plan (the ‘‘Plan’’) covering all employees,including officers, who have been employed for one year and have attained 21 years of age. Prior to May 1,1985, an individual must have attained the age of 25 and accrued one year of service. The Plan providespension benefits to eligible retired employees at 65 years of age equal to 1.5% of their average monthly paymultiplied by their years of accredited service (maximum 40 years). The accrued benefit is based on themonthly average of their highest five consecutive years of their last ten years of service. The Plan generallycovers only full-time employees.
Effective December 31, 2003, DNB amended its Plan to curtail future eligibility and so that noparticipants will earn additional benefits under the Plan after December 31, 2003. As a result of thisamendment, no further service or compensation was credited under the Plan after December 31, 2003. ThePlan, although frozen, will continue to provide benefit payments and eligible employees can still earnvesting credits until retirement.
104

The following table summarizes the changes in the fair value of plan assets, changes in the projectedbenefit obligation (PBO), the funded status of both the accumulated benefit obligation (ABO) and thePBO, and the weighted-average assumptions used to determine benefit obligations for the pension plan atDecember 31, 2018 and 2017. Amounts recognized at December 31, 2018 and 2017 are reflected in otherassets, and in accrued expenses and other liabilities on the Consolidated Statements of FinancialCondition. The estimation of DNB’s PBO associated with these plans considers various actuarialassumptions for mortality rates and discount rates.
The following table sets forth the Plan’s funded status, as of the measurement dates of December 31,2018 and 2017 and amounts recognized in DNB’s consolidated financial statements at December 31, 2018and 2017:
December 31(Dollars in thousands) 2018 2017
Projected benefit obligation $(6,133) $(6,925)
Accumulated benefit obligation (6,133) (6,925)Fair value of plan assets 4,457 4,960
Amounts recognized in the statement of financial condition consist of:Other liabilities $(1,676) $(1,965)
Funded status $(1,676) $(1,965)
Amounts recognized in accumulated other comprehensive loss consist of:Net loss $ 1,637 $ 1,849
Total $ 1,637 $ 1,849
The amounts and changes in DNB’s pension benefit obligation and fair value of plan assets for theyears ended December 31, 2018 and 2017 are as follows:
Year ended December 31(Dollars in thousands) 2018 2017
Change in benefit obligationBenefit obligation at beginning of year $6,925 $6,695Interest cost 241 262Actuarial (gain) loss (567) 603Benefits paid (466) (635)
Benefit obligation at end of year $6,133 $6,925
Change in plan assetsFair value of assets at beginning of year $4,960 $4,887Actual return on plan assets (226) 575Employer contribution 267 211Benefits paid (466) (635)Estimated expenses (78) (78)
Fair value of assets at end of year $4,457 $4,960
105

The Plan’s assets are invested using an asset allocation strategy in units of certain equity, bond, realestate and money market funds. The following table summarizes the weighted average asset allocations asof the dates indicated:
December 312018 2017
Cash and cash equivalents 4.9% 3.3%Equity securities 48.3 53.1Fixed income securities 46.8 43.6Total 100.0% 100.0%
Equity securities consist mainly of equity common trust funds and mutual funds. Fixed incomesecurities consist mainly of fixed income common trust funds. Pension plan assets are invested with amoderate growth objective, with target asset allocations of approximately 50 - 60% bonds and cash andapproximately 40 - 50% in stocks. As of December 31, 2018, the plan held 51.7% of its assets in bonds andcash.
Net periodic pension costs for the years indicated include the following components:
Year Ended December 31(Dollars in thousands) 2018 2017
Service cost $ 80 $ 65Interest cost 241 262Expected return on plan assets (267) (257)Recognized net actuarial loss* 136 133Recognized actuarial loss due to settlements — 106Net periodic cost $ 190 $ 309
Assumptions used:Discount rate:
Obligation 4.22% 3.61%Expense 3.61 4.09
Rate of increase in compensation level N/A N/AExpected long-term rate of return on assets 5.50 5.50
* Amounts are included in ‘‘Salaries and employee benefits’’ in the consolidated statements of income.
In selecting the expected long-term rate of return on assets used for the Plan, DNB considered theaverage rate of earnings expected on the funds invested or to be invested to provide for the benefits of thePlan. This included considering the asset allocation and the expected returns likely to be earned over thelife of the plan. This basis is consistent with the prior year. The discount rate is the rate used to determinethe present value of DNB’s future benefit obligations for its pension. The projected benefit obligation atDecember 31, 2018 and 2017 was determined using a variation of the RP-2014 mortality tables publishedby the Society of Actuaries.
106
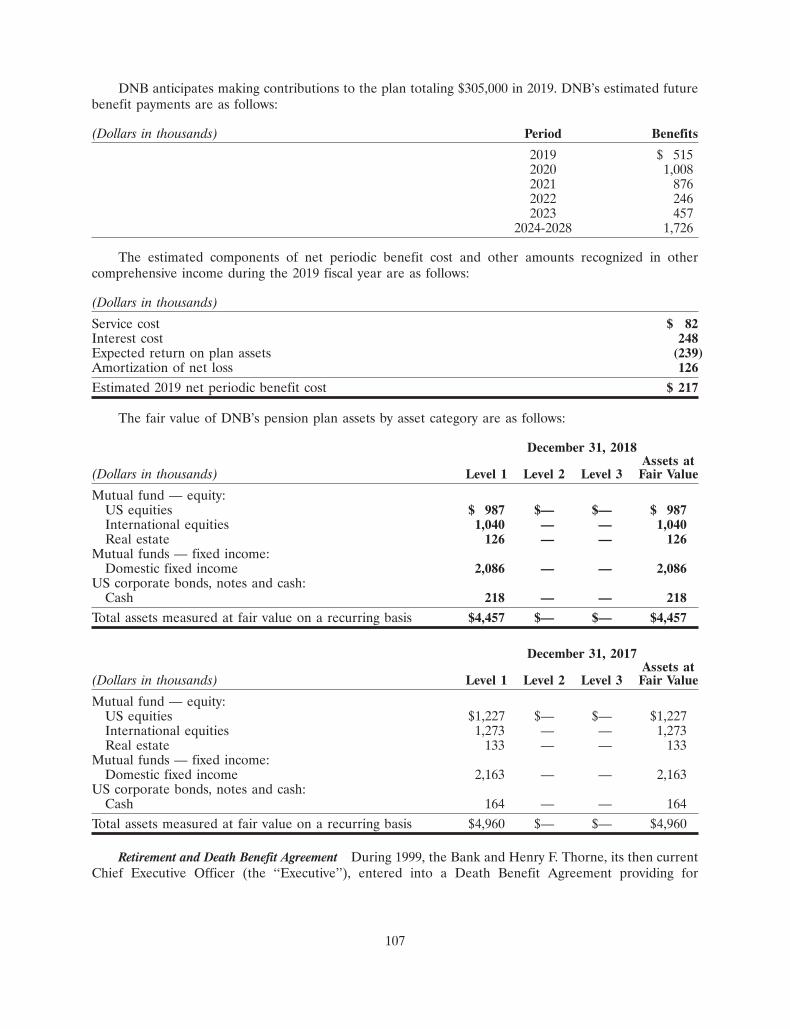
DNB anticipates making contributions to the plan totaling $305,000 in 2019. DNB’s estimated futurebenefit payments are as follows:
(Dollars in thousands) Period Benefits
2019 $ 5152020 1,0082021 8762022 2462023 457
2024-2028 1,726
The estimated components of net periodic benefit cost and other amounts recognized in othercomprehensive income during the 2019 fiscal year are as follows:
(Dollars in thousands)
Service cost $ 82Interest cost 248Expected return on plan assets (239)Amortization of net loss 126
Estimated 2019 net periodic benefit cost $ 217
The fair value of DNB’s pension plan assets by asset category are as follows:
December 31, 2018Assets at
(Dollars in thousands) Level 1 Level 2 Level 3 Fair Value
Mutual fund — equity:US equities $ 987 $— $— $ 987International equities 1,040 — — 1,040Real estate 126 — — 126
Mutual funds — fixed income:Domestic fixed income 2,086 — — 2,086
US corporate bonds, notes and cash:Cash 218 — — 218
Total assets measured at fair value on a recurring basis $4,457 $— $— $4,457
December 31, 2017Assets at
(Dollars in thousands) Level 1 Level 2 Level 3 Fair Value
Mutual fund — equity:US equities $1,227 $— $— $1,227International equities 1,273 — — 1,273Real estate 133 — — 133
Mutual funds — fixed income:Domestic fixed income 2,163 — — 2,163
US corporate bonds, notes and cash:Cash 164 — — 164
Total assets measured at fair value on a recurring basis $4,960 $— $— $4,960
Retirement and Death Benefit Agreement During 1999, the Bank and Henry F. Thorne, its then currentChief Executive Officer (the ‘‘Executive’’), entered into a Death Benefit Agreement providing for
107
supplemental death and retirement benefits for him (the ‘‘Supplemental Plan’’). In 2003, the SupplementalPlan was replaced by a Retirement and Death Benefit Agreement (the ‘‘Replacement Plan’’).
The Replacement Plan provides that the Bank and the Executive share in the rights to the cashsurrender value and death benefits of a split-dollar life insurance policy (the ‘‘Policy’’). The policy isdesigned to provide the Executive, upon attaining age 65, with projected annual after-tax payments ofapproximately $35,000. In addition, the Policy is intended to provide the Executive with a projected deathbenefit of $750,000.
In July 2008, DNB commenced making monthly payments of $3,658 to the Executive. The remainingliability under the plan was $737,000 and $738,000 as of December 31, 2018 and 2017, respectively. Theannual expense for the same respective periods was $58,000 and $57,000.
Supplemental Executive Retirement Plan for Chairman and Chief Executive Officer (William S. Latoffpassed away on January 11, 2016) DNB has an unfunded Supplemental Executive Retirement Plan (alsoknown as a SERP) for its former Chairman and Chief Executive Officer, William S. Latoff. The purpose ofthe SERP was to provide Mr. Latoff a pension supplement beginning at age 70 to compensate him for theloss of retirement plan funding opportunities from his other business interests because of his commitmentsto DNB as Chairman and CEO. The liability based on the contract, which is included in ‘‘Other liabilities’’on the statement of financial condition, is $1.3 million at December 31, 2018. This amount will be paid outin 2019.
Supplemental Executive Retirement Plan for President & Chief Executive Officer and Chief Financial OfficerDNB has an unfunded Supplemental Executive Retirement Plan (also known as a SERP) for William J.Hieb, DNB’s President and Chief Executive Officer, and Gerald F. Sopp, DNB’s Executive Vice President,Chief Financial Officer and Corporate Secretary (each, a ‘‘SERP,’’ and collectively, the ‘‘SERPs’’). TheSERPs contain identical terms. Accordingly, each of Mr. Hieb and Mr. Sopp shall be referred to as the‘‘Executive’’ below. Pursuant to the SERP, in the event that the Executive remains continuously employedby DNB until his 67th birthday, DNB shall pay to him a monthly retirement benefit for 180 monthscommencing on the first day of the first month following his 67th birthday. The monthly retirement benefitwill be 2.5% of the average of the sum of the Executive’s base salary and cash bonuses paid to him duringthe three calendar years ending immediately prior to his 67th birthday, except that the base salary for anyyear shall never be less than the base salary in effect on October 25, 2017. DNB’s liability to Mr. Hieb’s andMr. Sopp’s SERP was $228,000 and $183,000, respectively at December 31, 2018, compared to $39,000 and$32,000, respectively at December 31, 2017.
401(k) Retirement Savings Plan The Bank has adopted a retirement savings 401(k) plan. Participantsare permitted to authorize pre-tax savings contributions to a separate trust established under the 401(k)plan, subject to limitations on deductibility of contributions imposed by the Internal Revenue Code. Theplan allows after-tax contributions to be made as well. The contributions are subject to the samelimitations. Management evaluates discretionary matching contributions each quarter based upon DNB’sfinancial performance. DNB made no matching contributions to the 401(k) plan in 2018 and 2017.
Profit Sharing Plan The Bank maintains a Profit Sharing Plan for eligible employees. The planprovides that the Bank make contributions equal to 3% of the eligible participant’s W-2 wages. DNB’srelated expense associated with the Profit Sharing Plan was $392,000 and $376,000 in 2018 and 2017,respectively.
Stock Option Plan DNB has a Stock Option Plan for employees and directors. Under the plan, options(both qualified and non-qualified) to purchase a maximum of 793,368 (as adjusted for subsequent stockdividends) shares of DNB’s common stock could be issued to employees and directors.
Under the plan, option exercise prices must equal the fair market value of the shares on the date ofoption grant and the option exercise period may not exceed ten years. Vesting of options under the plan is
108

determined by the Plan Committee. There were 354,090 shares available for grant at December 31, 2018and 2017. All options currently outstanding are immediately exercisable. DNB fully recorded all stockoption expense by the end of 2014. DNB had no stock option expense in 2018 or 2017.
The award agreement provides that, upon issuance of the plan shares, the grantee may elect to payfederal withholding taxes on the award in cash or by electing to apply some of the awarded shares at theirfair market value, or both. Under the Stock Option Plan, 16,450 shares were exercised in 2018. The sharesawarded from the non-qualified cashless exercises resulted in an increase in shares outstanding of 7,798.There was a cash equivalent of 8,652 shares used to pay all applicable taxes on the transactions. Under theStock Option Plan, 33,250 shares were exercised in 2017. The shares awarded from the non-qualifiedcashless exercises resulted in an increase in shares outstanding of 14,748. There was a cash equivalent of18,502 shares used to pay all applicable taxes on the transactions. Stock option activity is indicated in thefollowing table:
Number Weighted AverageOutstanding Exercise Price
Outstanding January 1, 2017 49,700 $ 9.18Issued — —Exercised (33,250) 8.63Forfeited — —Expired — —
Outstanding December 31, 2017 16,450 $10.31Issued — —Exercised (16,450) 10.31Forfeited — —Expired — —
Outstanding December 31, 2018 — $ —
The weighted-average price and weighted average remaining contractual life for the outstandingoptions are listed below for the dates indicated.
December 31, 2017Weighted AverageRange of
Exercise Number Number Exercise Remaining IntrinsicPrices Outstanding Exercisable Price Contractual Life Value
$6.93-10.99 16,450 16,450 $10.31 0.95 years $385,000
Other Stock-Based Compensation DNB maintains an Incentive Equity and Deferred CompensationPlan. The plan provides that up to 493,101 shares of common stock may be granted, at the discretion of theBoard, to individuals of DNB. Shares already granted are issuable on the earlier of three years or fouryears after the date of the grant or a change in control of DNB if the recipients are then employed by DNB(‘‘Vest Date’’). For awards granted prior to December 2016, upon issuance of the shares, resale of theshares is restricted for an additional one year, during which the shares may not be sold, pledged orotherwise disposed of. Prior to the Vest Date and in the event the recipient terminates association withDNB for reasons other than death, disability or change in control, the recipient forfeits all rights to theshares that would otherwise be issued under the grant.
Share awards granted by the plan were recorded at the date of award based on the fair market valueof shares. Awards are being amortized to expense over a three or four-year cliff-vesting period. Restrictedstock awards are non-participating shares.
109
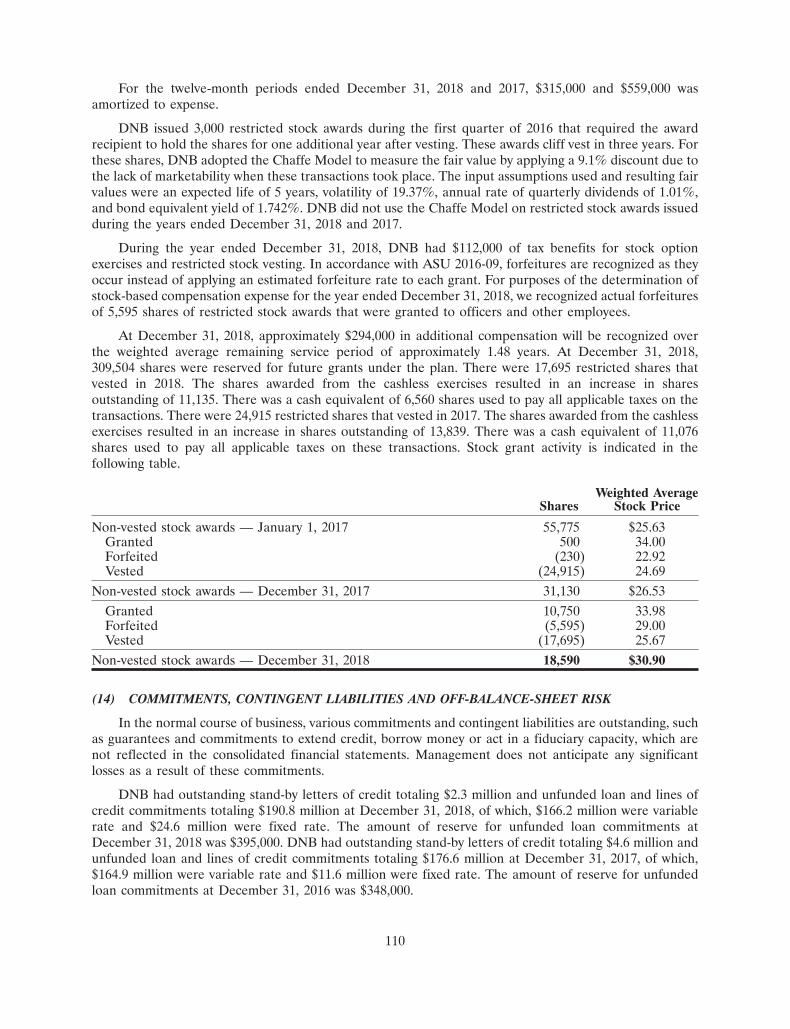
For the twelve-month periods ended December 31, 2018 and 2017, $315,000 and $559,000 wasamortized to expense.
DNB issued 3,000 restricted stock awards during the first quarter of 2016 that required the awardrecipient to hold the shares for one additional year after vesting. These awards cliff vest in three years. Forthese shares, DNB adopted the Chaffe Model to measure the fair value by applying a 9.1% discount due tothe lack of marketability when these transactions took place. The input assumptions used and resulting fairvalues were an expected life of 5 years, volatility of 19.37%, annual rate of quarterly dividends of 1.01%,and bond equivalent yield of 1.742%. DNB did not use the Chaffe Model on restricted stock awards issuedduring the years ended December 31, 2018 and 2017.
During the year ended December 31, 2018, DNB had $112,000 of tax benefits for stock optionexercises and restricted stock vesting. In accordance with ASU 2016-09, forfeitures are recognized as theyoccur instead of applying an estimated forfeiture rate to each grant. For purposes of the determination ofstock-based compensation expense for the year ended December 31, 2018, we recognized actual forfeituresof 5,595 shares of restricted stock awards that were granted to officers and other employees.
At December 31, 2018, approximately $294,000 in additional compensation will be recognized overthe weighted average remaining service period of approximately 1.48 years. At December 31, 2018,309,504 shares were reserved for future grants under the plan. There were 17,695 restricted shares thatvested in 2018. The shares awarded from the cashless exercises resulted in an increase in sharesoutstanding of 11,135. There was a cash equivalent of 6,560 shares used to pay all applicable taxes on thetransactions. There were 24,915 restricted shares that vested in 2017. The shares awarded from the cashlessexercises resulted in an increase in shares outstanding of 13,839. There was a cash equivalent of 11,076shares used to pay all applicable taxes on these transactions. Stock grant activity is indicated in thefollowing table.
Weighted AverageShares Stock Price
Non-vested stock awards — January 1, 2017 55,775 $25.63Granted 500 34.00Forfeited (230) 22.92Vested (24,915) 24.69
Non-vested stock awards — December 31, 2017 31,130 $26.53Granted 10,750 33.98Forfeited (5,595) 29.00Vested (17,695) 25.67
Non-vested stock awards — December 31, 2018 18,590 $30.90
(14) COMMITMENTS, CONTINGENT LIABILITIES AND OFF-BALANCE-SHEET RISK
In the normal course of business, various commitments and contingent liabilities are outstanding, suchas guarantees and commitments to extend credit, borrow money or act in a fiduciary capacity, which arenot reflected in the consolidated financial statements. Management does not anticipate any significantlosses as a result of these commitments.
DNB had outstanding stand-by letters of credit totaling $2.3 million and unfunded loan and lines ofcredit commitments totaling $190.8 million at December 31, 2018, of which, $166.2 million were variablerate and $24.6 million were fixed rate. The amount of reserve for unfunded loan commitments atDecember 31, 2018 was $395,000. DNB had outstanding stand-by letters of credit totaling $4.6 million andunfunded loan and lines of credit commitments totaling $176.6 million at December 31, 2017, of which,$164.9 million were variable rate and $11.6 million were fixed rate. The amount of reserve for unfundedloan commitments at December 31, 2016 was $348,000.
110

These instruments involve, to varying degrees, elements of credit and interest rate risk in excess of theamount recognized on the balance sheet. The exposure to credit loss in the event of non-performance bythe party to the financial instrument for commitments to extend credit and stand-by letters of credit isrepresented by the contractual amount. Management uses the same credit policies in making commitmentsand conditional obligations as it does for on-balance-sheet instruments.
Stand-by letters of credit are conditional commitments issued by DNB to guarantee the performanceor repayment of a financial obligation of a customer to a third party. Those guarantees are primarily issuedto support public and private borrowing arrangements. The credit risks involved in issuing letters of creditare essentially the same as those involved in extending loan facilities to customers. DNB holds variousforms of collateral to support these commitments.
Commitments to extend credit are agreements to lend to a customer as long as there is no violation ofany condition established in the contract. Commitments generally have fixed expiration dates or othertermination clauses and may require payment of a fee. DNB evaluates each customer’s creditworthiness ona case-by-case basis. The amount of collateral, if any, obtained upon the extension of credit, usuallyconsists of real estate, but may include securities, property or other assets.
DNB maintains borrowing arrangements with correspondent banks and the FHLBP, as well as accessto the discount window at the Federal Reserve Bank of Philadelphia to meet short-term liquidity needs.Through these relationships, DNB has available credit of approximately $568.6 million.
Assets held by DNB First Wealth Management in a fiduciary, custody or agency capacity atDecember 31, 2018 totaled $253.3 million. These assets are not assets of DNB, and are not included in theconsolidated financial statements.
DNB is a party to a number of lawsuits arising in the ordinary course of business. While any litigationcauses an element of uncertainty, management is of the opinion that the liability, if any, resulting from theactions, will not have a material effect on the accompanying financial statements.
(15) PARENT COMPANY FINANCIAL INFORMATION
Condensed financial information of DNB Financial Corporation follows:
Condensed Statements of Financial Condition December 31(Dollars in thousands) 2018 2017
AssetsCash $ 229 $ 114Investment in subsidiary 130,333 120,530Other assets 473 457Total assets $131,035 $121,101
Liabilities and Stockholders’ EquityLiabilities
Junior subordinated debentures $ 9,279 $ 9,279Subordinated debt 9,750 9,750Other liabilities 160 130Total liabilities 19,189 19,159
Stockholders’ equity 111,846 101,942Total liabilities and stockholders’ equity $131,035 $121,101
111
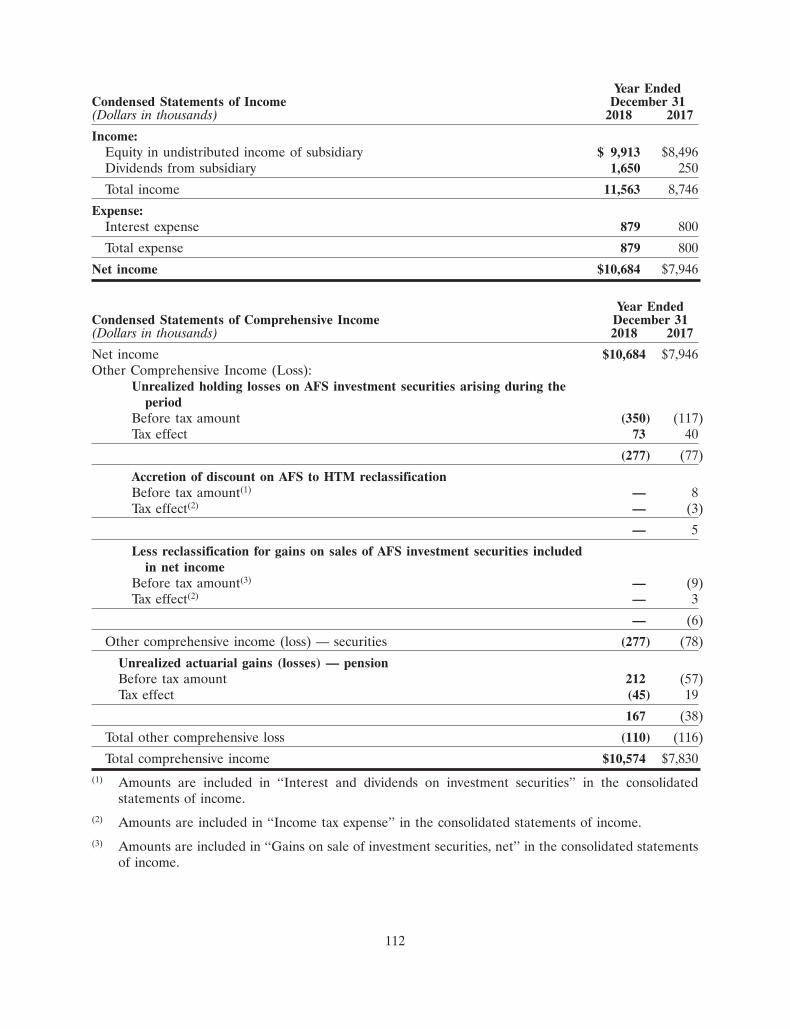
Year EndedCondensed Statements of Income December 31(Dollars in thousands) 2018 2017
Income:Equity in undistributed income of subsidiary $ 9,913 $8,496Dividends from subsidiary 1,650 250
Total income 11,563 8,746
Expense:Interest expense 879 800
Total expense 879 800
Net income $10,684 $7,946
Year EndedCondensed Statements of Comprehensive Income December 31(Dollars in thousands) 2018 2017
Net income $10,684 $7,946Other Comprehensive Income (Loss):
Unrealized holding losses on AFS investment securities arising during theperiod
Before tax amount (350) (117)Tax effect 73 40
(277) (77)
Accretion of discount on AFS to HTM reclassificationBefore tax amount(1) — 8Tax effect(2) — (3)
— 5
Less reclassification for gains on sales of AFS investment securities includedin net income
Before tax amount(3) — (9)Tax effect(2) — 3
— (6)
Other comprehensive income (loss) — securities (277) (78)
Unrealized actuarial gains (losses) — pensionBefore tax amount 212 (57)Tax effect (45) 19
167 (38)
Total other comprehensive loss (110) (116)
Total comprehensive income $10,574 $7,830(1) Amounts are included in ‘‘Interest and dividends on investment securities’’ in the consolidated
statements of income.(2) Amounts are included in ‘‘Income tax expense’’ in the consolidated statements of income.(3) Amounts are included in ‘‘Gains on sale of investment securities, net’’ in the consolidated statements
of income.
112

Year EndedCondensed Statements of Cash Flows December 31(Dollars in thousands) 2018 2017
Cash Flows From Operating Activities:Net income $ 10,684 $ 7,946Adjustments to reconcile net income to net cash used inoperating activities:
Equity in income of subsidiary and dividends (11,563) (8,746)Stock based compensation 315 559Non-cash funding of retirement plans 584 542Dividends to holding company 1,650 250Net change in other liabilities 30 11Net change in other assets (16) 27
Net Cash Provided by Operating Activities 1,684 589
Cash Flows From Financing Activities:Taxes on exercise of stock options (365) (635)Dividends paid (1,204) (1,194)
Net Cash Used in Financing Activities (1,569) (1,829)
Net Change in Cash and Cash Equivalents 115 (1,240)
Cash and cash equivalents at Beginning of Period 114 1,354
Cash and cash equivalents at End of Period $ 229 $ 114
(16) SELECTED QUARTERLY FINANCIAL DATA (Unaudited)
2018 2017
1st 2nd 3rd 4th 1st 2nd 3rd 4th
(Dollars in thousands, except share data) Quarter Quarter Quarter Quarter Quarter Quarter Quarter Quarter
RESULTS OF OPERATIONSInterest income $10,913 $11,289 $11,635 $12,338 $10,494 $10,661 $10,989 $11,241Interest expense 1,886 2,221 2,484 2,780 1,262 1,382 1,483 1,593
Net interest income 9,027 9,068 9,151 9,558 9,232 9,279 9,506 9,648
Provision for credit losses 375 375 100 350 325 585 375 375
Non-interest income 1,273 1,332 1,371 1,269 1,306 1,422 1,271 1,419
Non-interest expense 6,730 7,540 6,773 6,832 6,745 7,084 6,990 7,202
Income before income taxes 3,195 2,485 3,649 3,645 3,468 3,032 3,412 3,490
Income tax expense 582 436 629 643 1,027 746 1,001 2,682
Net income $ 2,613 $ 2,049 $ 3,020 $ 3,002 $ 2,441 $ 2,286 $ 2,411 $ 808
PER SHARE DATABasic earnings* $ 0.61 $ 0.48 $ 0.70 $ 0.70 $ 0.57 $ 0.54 $ 0.57 $ 0.19Diluted earnings* 0.61 0.47 0.70 0.69 0.57 0.53 0.56 0.19Cash dividends 0.07 0.07 0.07 0.07 0.07 0.07 0.07 0.07
* Earnings per share is computed independently for each period shown. As a result, the sum of the quarters may not equal thetotal earnings per share for the year.
113

(17) REGULATORY MATTERS
Under the Federal Reserve’s Regulation H, the Bank may not, without regulatory approval, declare orpay a dividend to DNB if the total of all dividends declared in a calendar year exceeds the total of (a) theBank’s net income for that year and (b) its retained net income for the preceding two calendar years, lessany required transfers to additional paid-in capital or to a fund for the retirement of preferred stock.
In July of 2013, the respective U.S. federal banking agencies issued final rules implementing Basel IIIand the Dodd-Frank Act capital requirements that were fully phased in on a global basis on January 1,2019. The new regulations establish a new tangible common equity capital requirement, increase theminimum requirement for the current Tier 1 risk-weighted asset (‘‘RWA’’) ratio, phase out certain kinds ofintangibles treated as capital and certain types of instruments and change the risk weightings of certainassets used to determine required capital ratios. The new common equity Tier 1 capital componentrequires capital of the highest quality — predominantly composed of retained earnings and common stockinstruments. For community banks such as DNB First, National Association, a common equity Tier 1capital ratio 4.5% became effective on January 1, 2015. The new capital rules also increased the currentminimum Tier 1 capital ratio from 4.0% to 6.0% beginning on January 1, 2015. In addition, in order tomake capital distributions and pay discretionary bonuses to executive officers without restriction, aninstitution must also maintain greater than 2.5% in common equity attributable to a capital conservationbuffer to be phased in by 0.625% per year from January 1, 2016 until January 1, 2019. The new rules alsoincrease the risk weights for several categories of assets, including an increase from 100% to 150% forcertain acquisition, development and construction loans and more than 90-day past due exposures. Thenew capital rules maintain the general structure of the prompt corrective action rules, but incorporate thenew common equity Tier 1 capital requirement and the increased Tier 1 RWA requirement into theprompt corrective action framework.
The Bank remains well capitalized under the implementation of Basel III, which was effectiveJanuary 1, 2015. In assessing a bank’s capital adequacy, regulators also consider other factors such asinterest rate risk exposure; liquidity, funding and market risks; quality and level of earnings; concentrationsof credit, quality of loans and investments; risks of any nontraditional activities; effectiveness of bankpolicies; and management’s overall ability to monitor and control risks.
Quantitative measures established by regulation to ensure capital adequacy require DNB to maintaincertain minimum amounts and ratios as set forth below. Based on management’s assessment, DNB and theBank meet all capital adequacy requirements to which they are subject. The Bank is considered ‘‘WellCapitalized’’ under the regulatory framework for prompt corrective action. To be categorized as WellCapitalized, the Bank must maintain minimum ratios as set forth below. There are no conditions or events
114

since the most recent regulatory notification that management believes would have changed the Bank’scategory. Actual capital amounts and ratios are presented in the following table.
To Be WellCapitalized
Under PromptFor Capital CorrectiveAdequacy Action
Actual Purposes* Provisions*(Dollars in thousands) Amount Ratio Amount Ratio Amount Ratio
DNB Financial CorporationDecember 31, 2018:
Total risk-based capital $124,769 13.61% $73,538 8.00% N/A N/ACommon equity tier 1 capital 98,949 10.79 41,365 4.50 N/A N/ATier 1 risk-based capital 107,949 11.77 55,153 6.00 N/A N/ATier 1 (leverage) capital 107,949 9.48 45,557 4.00 N/A N/A
December 31, 2017:Total risk-based capital $113,400 13.73% $66,083 8.00% N/A N/ACommon equity tier 1 capital 88,459 10.71 37,172 4.50 N/A N/ATier 1 risk-based capital 97,459 11.80 49,562 6.00 N/A N/ATier 1 (leverage) capital 97,459 9.19 42,426 4.00 N/A N/A
DNB First, N.A.December 31, 2018:
Total risk-based capital $123,239 13.46% $73,399 8.00% $91,748 10.00%Common equity tier 1 capital 116,169 12.69 41,287 4.50 59,636 6.50Tier 1 risk-based capital 116,169 12.69 55,049 6.00 73,399 8.00Tier 1 (leverage) capital 116,169 10.21 45,503 4.00 56,879 5.00
December 31, 2017:Total risk-based capital $112,050 13.59% $65,953 8.00% $82,441 10.00%Common equity tier 1 capital 105,859 12.84 37,098 4.50 53,587 6.50Tier 1 risk-based capital 105,859 12.84 49,465 6.00 65,953 8.00Tier 1 (leverage) capital 105,859 9.99 42,378 4.00 52,972 5.00
* Does not include capital conservation buffer of 1.250% for 2017 and 1.875% for 2018.
115
8MAR201913215598
13MAR201915491815
8MAR201913212786
Tel: 215-564-1900Fax: 215-564-3940www.bdo.com
Ten Penn Center1801 Market Street, Suite 1700Philadelphia, PA 19103
Report of Independent Registered Public Accounting Firm
To the Board of Directors and StockholdersDNB Financial CorporationDowningtown, Pennsylvania
Opinion on the Consolidated Financial Statements
We have audited the accompanying consolidated statements of financial condition for DNB FinancialCorporation and its subsidiaries (the ‘‘Corporation’’) as of December 31, 2018 and 2017, the relatedconsolidated statements of income, comprehensive income, changes in stockholders’ equity, and cash flowsfor each of the two years in the period ended December 31, 2018 and the related notes (collectivelyreferred to as the ‘‘consolidated financial statements’’). In our opinion, the consolidated financialstatements present fairly, in all material respects, the financial position of the Corporation and subsidiariesat December 31, 2018 and 2017, and the results of their operations and their cash flows for each of the twoyears in the period ended December 31, 2018, in conformity with accounting principles generally acceptedin the United States of America.
We also have audited, in accordance with the standards of the Public Company Accounting OversightBoard (United States) (‘‘PCAOB’’), the Company’s internal control over financial reporting as ofDecember 31, 2018, based on criteria established in Internal Control — Integrated Framework (2013) issuedby the Committee of Sponsoring Organizations of the Treadway Commission (‘‘COSO’’) and our reportdated March 14, 2019 expressed an unqualified opinion thereon.
Basis for Opinion
These consolidated financial statements are the responsibility of the Corporation’s management. Ourresponsibility is to express an opinion on the Corporation’s consolidated financial statements based on ouraudits. We are a public accounting firm registered with the Public Company Accounting Oversight Board(United States) (‘‘PCAOB’’) and are required to be independent with respect to the Company inaccordance with the U.S. federal securities laws and the applicable rules and regulations of the Securitiesand Exchange Commission and the PCAOB.
We conducted our audits in accordance with the standards of the PCAOB. Those standards requirethat we plan and perform the audit to obtain reasonable assurance about whether the consolidatedfinancial statements are free of material misstatement, whether due to error or fraud.
Our audits included performing procedures to assess the risks of material misstatement of theconsolidated financial statements, whether due to error or fraud, and performing procedures that respondto those risks. Such procedures included examining, on a test basis, evidence regarding the amounts anddisclosures in the consolidated financial statements. Our audits also included evaluating the accountingprinciples used and significant estimates made by management, as well as evaluating the overallpresentation of the consolidated financial statements. We believe that our audits provide a reasonablebasis for our opinion.
We have served as the Company’s auditor since 2013.Philadelphia, PennsylvaniaMarch 14, 2019
BDO USA, LLP, a Delaware limited liability partnership, is the U.S. member of BDO International Limited, a UK company limited by guarantee, and forms part of theinternational BDO network of independent member firms.
BDO is the brand name for the BDO network and for each of the BDO Member Firms.
116
Item 9. Changes in and Disagreements with Accountants on Accounting and Financial Disclosure
None
Item 9A. Controls and Procedures
• Evaluation of Disclosure Controls and Procedures
The Corporation carried out an evaluation, under the supervision and with the participation of theCorporation’s management, including the Corporation’s Chief Executive Officer, William J. Hieb, andChief Financial Officer, Gerald F. Sopp, of the effectiveness of the Corporation’s disclosure controls andprocedures (as such term is defined in Rules 13a-15(e) and 15d-15(e) under the Exchange Act) as ofDecember 31, 2018 pursuant to Exchange Act Rule 13a-15. Based upon that evaluation, the ChiefExecutive Officer and Chief Financial Officer concluded that the Corporation’s disclosure controls andprocedures as of December 31, 2018 are effective.
• Changes in Internal Control over Financial Reporting
There were no changes in the Corporation’s internal control over financial reporting during the fourthquarter of 2018 that have materially affected, or are reasonably likely to materially affect, theCorporation’s internal control over financial reporting.
• Design and Evaluation of Internal Control Over Financial Reporting
Pursuant to Section 404 of Sarbanes-Oxley, the following is a report of management’s assessment ofthe design and effectiveness of our internal controls for the fiscal year ended December 31, 2018, and areport from our independent registered public accounting firm attesting to the effectiveness of our internalcontrols:
Management’s Report on Internal Control Over Financial Reporting
The Corporation is responsible for the preparation, integrity, and fair presentation of the consolidatedfinancial statements included in this Annual Report on Form 10-K. The consolidated financial statementsand notes included in this Annual Report on Form 10-K have been prepared in conformity with UnitedStates generally accepted accounting principles and necessarily include some amounts that are based onManagement’s best estimates and judgments.
The Corporation’s Management is responsible for establishing and maintaining effective internalcontrol over financial reporting that is designed to produce reliable financial statements in conformity withUnited States generally accepted accounting principles. Internal control over financial reporting includesthose policies and procedures that pertain to the maintenance of records that in reasonable detailaccurately and fairly reflect the transactions and dispositions of the assets of the Corporation; providereasonable assurance that the transactions are recorded as necessary to permit preparation of financialstatements in accordance with generally accepted accounting principles; provide a reasonable assurancethat receipts and expenditures of the Corporation are only being made in accordance with authorizationsof Management and directors of the Corporation; and provide a reasonable assurance regardingprevention or timely detection of unauthorized acquisition, use, or disposition of the Corporation’s assetsthat could have a material effect on the financial statements. The system of internal control over financialreporting as it relates to the financial statements is evaluated for effectiveness by Management and testedfor reliability through a program of internal audits. Actions are taken to correct potential deficiencies asthey are noted.
Any system of internal control, no matter how well designed, has inherent limitations, including thepossibility that a control can be circumvented or overridden and misstatements due to error or fraud mayoccur and not be detected. Also, because of changes in conditions, internal control effectiveness may vary
117
over time. Accordingly, even an effective system of internal control will provide only reasonable assurancewith respect to financial statement preparation.
The Corporation’s management is responsible for establishing and maintaining adequate internalcontrol over financial reporting, as such term is defined in Exchange Act Rule 13a-15(f). Management,including the Corporation’s Chief Executive Officer and Chief Financial Officer, assessed theCorporation’s system of internal control over financial reporting as of December 31, 2018, in relation tothe criteria for effective control over financial reporting as described in ‘‘Internal Control — IntegratedFramework,’’ issued by the Committee of Sponsoring Organizations of the Treadway Commission (2013).Based on this assessment, Management concludes that, as of December 31, 2018, the Corporation’s systemof internal control over financial reporting is effective.
BDO USA, LLP, which is the independent registered public accounting firm that audited the financialstatements for the year ended December 31, 2018 in this Annual Report on Form 10-K, has issued anattestation report on the Corporation’s internal control over financial reporting, which can be found underthe heading ‘‘Report of Independent Registered Public Accounting Firm’’, and is included herein.
118
8MAR201913215598
8MAR201913212786
Tel: 215-564-1900Fax: 215-564-3940www.bdo.com
Ten Penn Center1801 Market Street, Suite 1700Philadelphia, PA 19103
Report of Independent Registered Public Accounting Firm
To the Board of Directors and StockholdersDNB Financial CorporationDowningtown, Pennsylvania
Opinion on Internal Control over Financial Reporting
We have audited DNB Financial Corporation and its subsidiaries (the ‘‘Corporation’s’’) internalcontrol over financial reporting as of December 31, 2018, based on criteria established in InternalControl — Integrated Framework (2013) issued by the Committee of Sponsoring Organizations of theTreadway Commission (the ‘‘COSO criteria’’). In our opinion, the Corporation maintained, in all materialrespects, effective internal control over financial reporting as of December 31, 2018, based on the COSOcriteria.
We also have audited, in accordance with the standards of the Public Company Accounting OversightBoard (United States) (‘‘PCAOB’’), the consolidated statements of financial condition of the Corporationas of December 31, 2018 and 2017, the related consolidated statements of income, comprehensive income,changes in stockholders’ equity, and cash flows for each of the two years in the period ended December 31,2018, and the related notes and our report dated March 14, 2019 expressed an unqualified opinionthereon.
Basis for Opinion
The Corporation’s management is responsible for maintaining effective internal control over financialreporting and for its assessment of the effectiveness of internal control over financial reporting, included inthe accompanying Item 9A, Management’s Report on Internal Control over Financial Reporting. Ourresponsibility is to express an opinion on the Corporation’s internal control over financial reporting basedon our audit. We are a public accounting firm registered with the PCAOB and are required to beindependent with respect to the Corporation in accordance with U.S. federal securities laws and theapplicable rules and regulations of the Securities and Exchange Commission and the PCAOB.
We conducted our audit of internal control over financial reporting in accordance with the standardsof the PCAOB. Those standards require that we plan and perform the audit to obtain reasonableassurance about whether effective internal control over financial reporting was maintained in all materialrespects. Our audit included obtaining an understanding of internal control over financial reporting,assessing the risk that a material weakness exists, and testing and evaluating the design and operatingeffectiveness of internal control based on the assessed risk. Our audit also included performing such otherprocedures as we considered necessary in the circumstances. We believe that our audit provides areasonable basis for our opinion.
Definition and Limitations of Internal Control over Financial Reporting
A company’s internal control over financial reporting is a process designed to provide reasonableassurance regarding the reliability of financial reporting and the preparation of financial statements forexternal purposes in accordance with generally accepted accounting principles.
BDO USA, LLP, a Delaware limited liability partnership, is the U.S. member of BDO International Limited, a UK company limited by guarantee, and forms part of theinternational BDO network of independent member firms.
BDO is the brand name for the BDO network and for each of the BDO Member Firms.
119
19MAR201815221100
13MAR201915491815
A company’s internal control over financial reporting includes those policies and procedures that(1) pertain to the maintenance of records that, in reasonable detail, accurately and fairly reflect thetransactions and dispositions of the assets of the company; (2) provide reasonable assurance thattransactions are recorded as necessary to permit preparation of financial statements in accordance withgenerally accepted accounting principles, and that receipts and expenditures of the company are beingmade only in accordance with authorizations of management and directors of the company; and(3) provide reasonable assurance regarding prevention or timely detection of unauthorized acquisition,use, or disposition of the company’s assets that could have a material effect on the financial statements.
Because of its inherent limitations, internal control over financial reporting may not prevent or detectmisstatements. Also, projections of any evaluation of effectiveness to future periods are subject to the riskthat controls may become inadequate because of changes in conditions, or that the degree of compliancewith the policies or procedures may deteriorate.
Philadelphia, Pennsylvania
March 14, 2019
120

Item 9B. Other Information
None
121
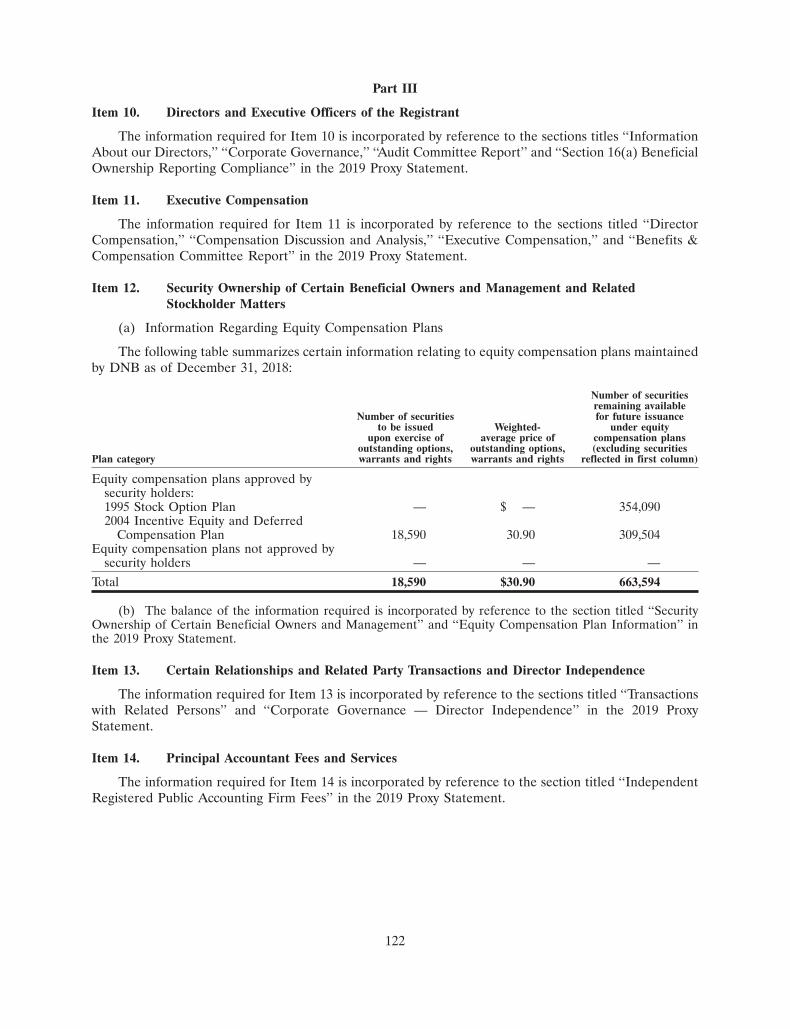
Part III
Item 10. Directors and Executive Officers of the Registrant
The information required for Item 10 is incorporated by reference to the sections titles ‘‘InformationAbout our Directors,’’ ‘‘Corporate Governance,’’ ‘‘Audit Committee Report’’ and ‘‘Section 16(a) BeneficialOwnership Reporting Compliance’’ in the 2019 Proxy Statement.
Item 11. Executive Compensation
The information required for Item 11 is incorporated by reference to the sections titled ‘‘DirectorCompensation,’’ ‘‘Compensation Discussion and Analysis,’’ ‘‘Executive Compensation,’’ and ‘‘Benefits &Compensation Committee Report’’ in the 2019 Proxy Statement.
Item 12. Security Ownership of Certain Beneficial Owners and Management and RelatedStockholder Matters
(a) Information Regarding Equity Compensation Plans
The following table summarizes certain information relating to equity compensation plans maintainedby DNB as of December 31, 2018:
Number of securitiesremaining available
Number of securities for future issuanceto be issued Weighted- under equity
upon exercise of average price of compensation plansoutstanding options, outstanding options, (excluding securities
Plan category warrants and rights warrants and rights reflected in first column)
Equity compensation plans approved bysecurity holders:1995 Stock Option Plan — $ — 354,0902004 Incentive Equity and Deferred
Compensation Plan 18,590 30.90 309,504Equity compensation plans not approved by
security holders — — —
Total 18,590 $30.90 663,594
(b) The balance of the information required is incorporated by reference to the section titled ‘‘SecurityOwnership of Certain Beneficial Owners and Management’’ and ‘‘Equity Compensation Plan Information’’ inthe 2019 Proxy Statement.
Item 13. Certain Relationships and Related Party Transactions and Director Independence
The information required for Item 13 is incorporated by reference to the sections titled ‘‘Transactionswith Related Persons’’ and ‘‘Corporate Governance — Director Independence’’ in the 2019 ProxyStatement.
Item 14. Principal Accountant Fees and Services
The information required for Item 14 is incorporated by reference to the section titled ‘‘IndependentRegistered Public Accounting Firm Fees’’ in the 2019 Proxy Statement.
122
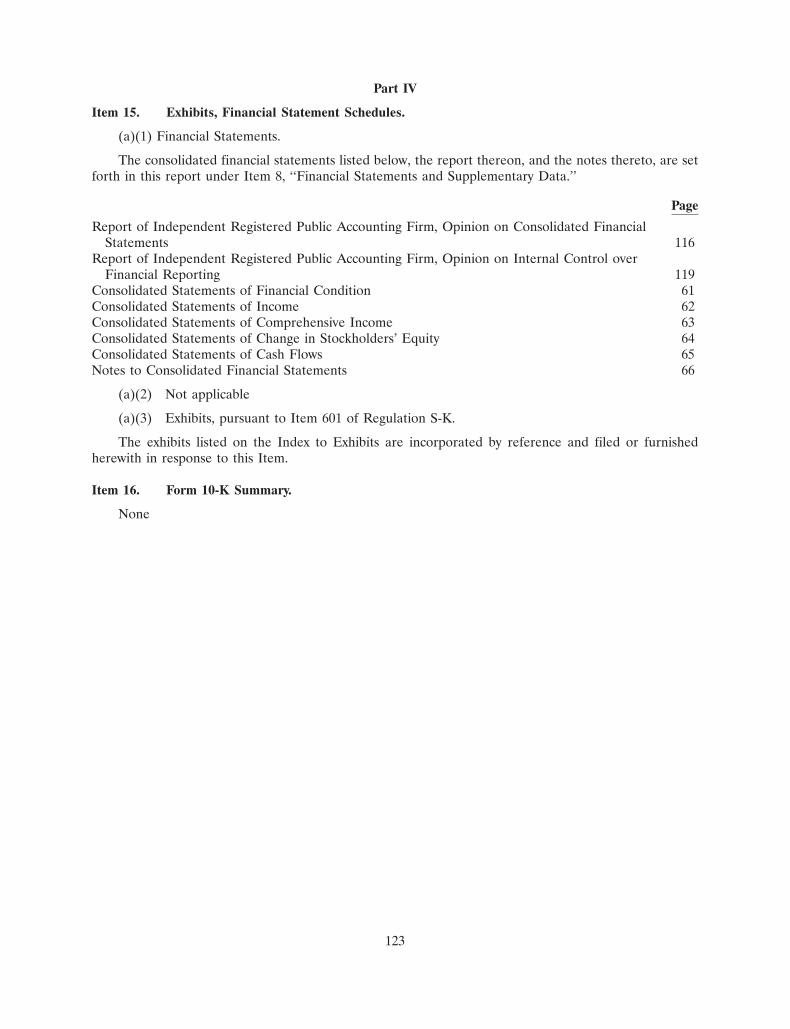
Part IV
Item 15. Exhibits, Financial Statement Schedules.
(a)(1) Financial Statements.
The consolidated financial statements listed below, the report thereon, and the notes thereto, are setforth in this report under Item 8, ‘‘Financial Statements and Supplementary Data.’’
Page
Report of Independent Registered Public Accounting Firm, Opinion on Consolidated FinancialStatements 116
Report of Independent Registered Public Accounting Firm, Opinion on Internal Control overFinancial Reporting 119
Consolidated Statements of Financial Condition 61Consolidated Statements of Income 62Consolidated Statements of Comprehensive Income 63Consolidated Statements of Change in Stockholders’ Equity 64Consolidated Statements of Cash Flows 65Notes to Consolidated Financial Statements 66
(a)(2) Not applicable
(a)(3) Exhibits, pursuant to Item 601 of Regulation S-K.
The exhibits listed on the Index to Exhibits are incorporated by reference and filed or furnishedherewith in response to this Item.
Item 16. Form 10-K Summary.
None
123
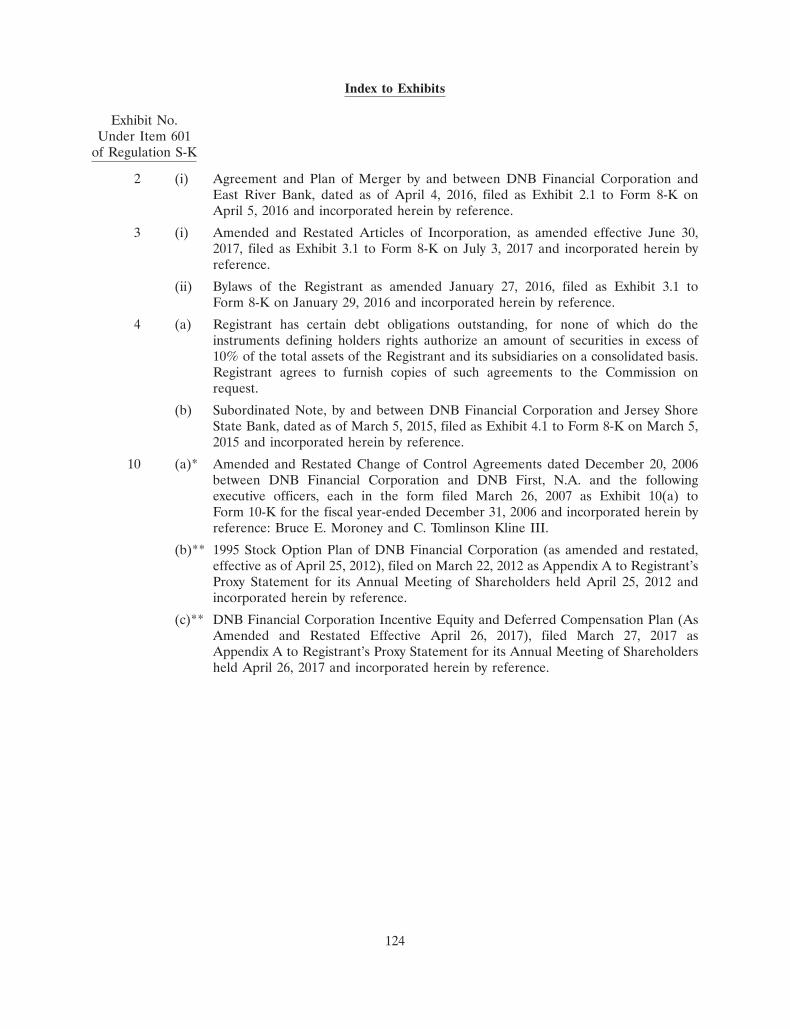
Index to Exhibits
Exhibit No.Under Item 601
of Regulation S-K
2 (i) Agreement and Plan of Merger by and between DNB Financial Corporation andEast River Bank, dated as of April 4, 2016, filed as Exhibit 2.1 to Form 8-K onApril 5, 2016 and incorporated herein by reference.
3 (i) Amended and Restated Articles of Incorporation, as amended effective June 30,2017, filed as Exhibit 3.1 to Form 8-K on July 3, 2017 and incorporated herein byreference.
(ii) Bylaws of the Registrant as amended January 27, 2016, filed as Exhibit 3.1 toForm 8-K on January 29, 2016 and incorporated herein by reference.
4 (a) Registrant has certain debt obligations outstanding, for none of which do theinstruments defining holders rights authorize an amount of securities in excess of10% of the total assets of the Registrant and its subsidiaries on a consolidated basis.Registrant agrees to furnish copies of such agreements to the Commission onrequest.
(b) Subordinated Note, by and between DNB Financial Corporation and Jersey ShoreState Bank, dated as of March 5, 2015, filed as Exhibit 4.1 to Form 8-K on March 5,2015 and incorporated herein by reference.
10 (a)* Amended and Restated Change of Control Agreements dated December 20, 2006between DNB Financial Corporation and DNB First, N.A. and the followingexecutive officers, each in the form filed March 26, 2007 as Exhibit 10(a) toForm 10-K for the fiscal year-ended December 31, 2006 and incorporated herein byreference: Bruce E. Moroney and C. Tomlinson Kline III.
(b)** 1995 Stock Option Plan of DNB Financial Corporation (as amended and restated,effective as of April 25, 2012), filed on March 22, 2012 as Appendix A to Registrant’sProxy Statement for its Annual Meeting of Shareholders held April 25, 2012 andincorporated herein by reference.
(c)** DNB Financial Corporation Incentive Equity and Deferred Compensation Plan (AsAmended and Restated Effective April 26, 2017), filed March 27, 2017 asAppendix A to Registrant’s Proxy Statement for its Annual Meeting of Shareholdersheld April 26, 2017 and incorporated herein by reference.
124
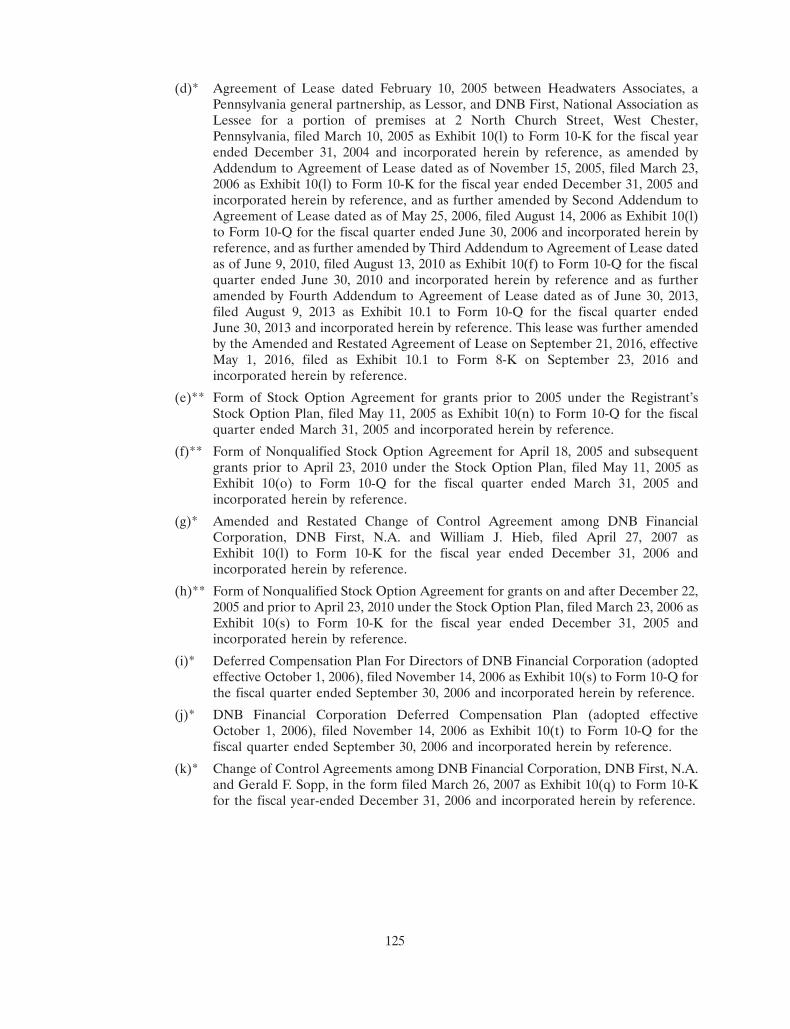
(d)* Agreement of Lease dated February 10, 2005 between Headwaters Associates, aPennsylvania general partnership, as Lessor, and DNB First, National Association asLessee for a portion of premises at 2 North Church Street, West Chester,Pennsylvania, filed March 10, 2005 as Exhibit 10(l) to Form 10-K for the fiscal yearended December 31, 2004 and incorporated herein by reference, as amended byAddendum to Agreement of Lease dated as of November 15, 2005, filed March 23,2006 as Exhibit 10(l) to Form 10-K for the fiscal year ended December 31, 2005 andincorporated herein by reference, and as further amended by Second Addendum toAgreement of Lease dated as of May 25, 2006, filed August 14, 2006 as Exhibit 10(l)to Form 10-Q for the fiscal quarter ended June 30, 2006 and incorporated herein byreference, and as further amended by Third Addendum to Agreement of Lease datedas of June 9, 2010, filed August 13, 2010 as Exhibit 10(f) to Form 10-Q for the fiscalquarter ended June 30, 2010 and incorporated herein by reference and as furtheramended by Fourth Addendum to Agreement of Lease dated as of June 30, 2013,filed August 9, 2013 as Exhibit 10.1 to Form 10-Q for the fiscal quarter endedJune 30, 2013 and incorporated herein by reference. This lease was further amendedby the Amended and Restated Agreement of Lease on September 21, 2016, effectiveMay 1, 2016, filed as Exhibit 10.1 to Form 8-K on September 23, 2016 andincorporated herein by reference.
(e)** Form of Stock Option Agreement for grants prior to 2005 under the Registrant’sStock Option Plan, filed May 11, 2005 as Exhibit 10(n) to Form 10-Q for the fiscalquarter ended March 31, 2005 and incorporated herein by reference.
(f)** Form of Nonqualified Stock Option Agreement for April 18, 2005 and subsequentgrants prior to April 23, 2010 under the Stock Option Plan, filed May 11, 2005 asExhibit 10(o) to Form 10-Q for the fiscal quarter ended March 31, 2005 andincorporated herein by reference.
(g)* Amended and Restated Change of Control Agreement among DNB FinancialCorporation, DNB First, N.A. and William J. Hieb, filed April 27, 2007 asExhibit 10(l) to Form 10-K for the fiscal year ended December 31, 2006 andincorporated herein by reference.
(h)** Form of Nonqualified Stock Option Agreement for grants on and after December 22,2005 and prior to April 23, 2010 under the Stock Option Plan, filed March 23, 2006 asExhibit 10(s) to Form 10-K for the fiscal year ended December 31, 2005 andincorporated herein by reference.
(i)* Deferred Compensation Plan For Directors of DNB Financial Corporation (adoptedeffective October 1, 2006), filed November 14, 2006 as Exhibit 10(s) to Form 10-Q forthe fiscal quarter ended September 30, 2006 and incorporated herein by reference.
(j)* DNB Financial Corporation Deferred Compensation Plan (adopted effectiveOctober 1, 2006), filed November 14, 2006 as Exhibit 10(t) to Form 10-Q for thefiscal quarter ended September 30, 2006 and incorporated herein by reference.
(k)* Change of Control Agreements among DNB Financial Corporation, DNB First, N.A.and Gerald F. Sopp, in the form filed March 26, 2007 as Exhibit 10(q) to Form 10-Kfor the fiscal year-ended December 31, 2006 and incorporated herein by reference.
125

(l)* DNB Financial Corporation Supplemental Executive Retirement Plan for William S.Latoff as amended and restated effective April 1, 2007, filed May 15, 2007 asExhibit 10(r) to Form 10-Q for the fiscal quarter ended March 31, 2007 andincorporated herein by reference, as further amended by Amendment datedDecember 8, 2008, filed March 31, 2009 as Exhibit 3(r) to Form 10-K for the fiscalyear-ended December 31, 2008 and incorporated herein by reference.
(m)* DNB Offer Letter to Gerald F. Sopp, dated December 20, 2006, filed March 26, 2007as Exhibit 10(u) to Form 10-K for the fiscal year-ended December 31, 2006 andincorporated herein by reference.
(n)** Form of Restricted Stock Award Agreement dated November, 28, 2007, filedMarch 28, 2008 as Exhibit 10(v) to Form 10-K for the fiscal year-ended December 31,2007 and incorporated herein by reference.
(o)** Form of Restricted Stock Option Agreement for non-employee directors for awardsmade on and after April 23, 2010 pursuant to the 1995 Stock Option Plan of DNBFinancial Corporation (as amended and restated, effective as of April 27, 2004), filedAugust 13, 2010 as Exhibit 10(y) to Form 10-Q for the fiscal quarter ended June 30,2010 and incorporated herein by reference.
(p)** Form of Restricted Stock Option Agreement for employees for awards made on andafter April 23, 2010 pursuant to the 1995 Stock Option Plan of DNB FinancialCorporation (as amended and restated, effective as of April 27, 2004), filedAugust 13, 2010 as Exhibit 10(z) to Form 10-Q for the fiscal quarter ended June 30,2010 and incorporated herein by reference.
(q)** Form of Amendment effective April 23, 2010, to the Restricted Stock Awardagreements made between James H. Thornton, James J. Koegel, Mildred C. Joynerand Thomas A. Fillippo, non-employee Directors of the registrant, and the registranton November 28, 2007 and December 17, 2008, filed August 13, 2010 asExhibit 10(aa) to Form 10-Q for the fiscal quarter ended June 30, 2010 andincorporated herein by reference.
(r)** Form of Amendment effective April 23, 2010, to the Restricted Stock Awardagreements made between William J. Hieb, Gerald F. Sopp and Bruce E. Moroney,officers of the registrant, and the registrant on November 28, 2007 and December 17,2008, filed August 13, 2010 as Exhibit 10(cc) to Form 10-Q for the fiscal quarterended June 30, 2010 and incorporated herein by reference.
(s)* Form of Amendment to Change of Control Agreement For Named ExecutiveOfficers, filed as Exhibit 99.1 to Form 8-K on October 28, 2011 and incorporatedherein by reference.
(t)** Form of Restricted Stock Award Agreement for Directors, filed as Exhibit 99.1 toForm 8-K on December 21, 2012 and incorporated herein by reference.
(u)** Form of Restricted Stock Award Agreement for employees, filed as Exhibit 99.2 toForm 8-K on December 21, 2012 and incorporated herein by reference.
(v)* Amended Change of Control Agreement among DNB Financial Corporation, DNBFirst, N.A. and Gerald F. Sopp, filed as Exhibit 99.3 to Form 8-K on December 21,2012 and incorporated herein by reference.
(w)* Change of Control Agreement among DNB Financial Corporation, DNB First, N.A.and Vincent Liuzzi, filed August 11, 2014 as Exhibit 10.1 to Form 10-Q for the fiscalquarter ended June 30, 2014 and incorporated herein by reference.
126
(x) Subordinated Note Purchase Agreement, by and between DNB FinancialCorporation and Jersey Shore State Bank, dated as of March 5, 2015, filed asExhibit 10.1 to Form 8-K on March 5, 2015 and incorporated herein by reference.
(y)* Amendment to Change of Control Agreement for William J. Hieb, filed asExhibit 10.1 to Form 8-K on November 17, 2017 and incorporated herein byreference.
(z)** Amendment to Restricted Stock Award Agreements for William J. Hieb, filed asExhibit 10.2 to Form 8-K on November 17, 2017 and incorporated herein byreference.
(aa)* Amendment to Change of Control Agreement for Gerald F. Sopp, filed asExhibit 10.3 to Form 8-K on November 17, 2017 and incorporated herein byreference.
(bb)**Amendment to Restricted Stock Award Agreements for Gerald F. Sopp, filed asExhibit 10.4 to Form 8-K on November 17, 2017 and incorporated herein byreference.
(cc)* DNB Financial Corporation Supplemental Executive Retirement Plan for William J.Hieb, filed as Exhibit 99.1 to Form 8-K on October 30, 2017 and incorporated hereinby reference.
(dd)* DNB Financial Corporation Supplemental Executive Retirement Plan for Gerald F.Sopp, filed as Exhibit 99.2 to Form 8-K on October 30, 2017 and incorporated hereinby reference.
10 Change of Control Agreement among DNB Financial Corporation, DNB First, N.A.and James A. Malloy, filed herewith.
14 Code of Ethics as amended and restated effective October 25, 2017, filed March 15,2018 as Exhibit 14 to Form 10-K for the fiscal year ended December 31, 2017 andincorporated herein by reference.
21 List of Subsidiaries, filed herewith.
23 Consent of BDO USA, LLP, filed herewith.
31.1 Rule 13a-14(a)/15d-14 (a) Certification of Chief Executive Officer, filed herewith.
31.2 Rule 13a-14(a)/15d-14 (a) Certification of Chief Financial Officer, filed herewith.
32.1 Section 1350 Certification of Chief Executive Officer, filed herewith.
32.2 Section 1350 Certification of Chief Financial Officer, filed herewith.
101.INS XBRL Instance Document
101 SCH XBRL Taxonomy Extension Schema Document
101.CAL XBRL Taxonomy Extension Calculation Linkbase Document
101.LAB XBRL Taxonomy Extension Label Linkbase Document
101.PRE XBRL Taxonomy Extension Presentation Linkbase Document
101.DEF XBRL Taxonomy Extension Definition Linkbase Document
* Management contract or compensatory plan arrangement.
** Stockholder approved compensatory plan pursuant to which DNB’s Common Stock may be issued toemployees of DNB
127
SIGNATURES
Pursuant to the requirements of Section 13 or 15(d) of the Securities Exchange Act of 1934, theRegistrant has duly caused this report to be signed on its behalf by the undersigned, thereunto dulyauthorized.
DNB FINANCIAL CORPORATION
March 14, 2019
BY: /s/ William J. Hieb
William J. Hieb, Chief Executive Officer,President and Director (Principal ExecutiveOfficer)
Pursuant to the requirements of the Securities Exchange Act of 1934, this Report has been signedbelow by the following persons on behalf of the Registrant and in the capacities and on the dates indicated.
/s/ James H. ThorntonMarch 14, 2019James H. Thornton, Chairman of the
Board
/s/ William J. Hieb
William J. Hieb, Chief Executive Officer, March 14, 2019President and Director (PrincipalExecutive Officer)
/s/ Gerald F. Sopp
Gerald F. Sopp,March 14, 2019Chief Financial Officer (Principal
Financial Officer and AccountingOfficer)
/s/ John F. McGill, Jr.March 14, 2019John F. McGill, Jr.,
Vice Chairman of the Board
/s/ Peter R. BarszMarch 14, 2019Peter R. Barsz,
Director
/s/ James R. BieryMarch 14, 2019James R. Biery,
Director
/s/ Thomas A. FillippoMarch 14, 2019Thomas A. Fillippo,
Director
128
/s/ Gerard F. GriesserMarch 14, 2019Gerard F. Griesser,
Director
/s/ Mildred C. JoynerMarch 14, 2019Mildred C. Joyner,
Director
/s/ Mary D. LatoffMarch 14, 2019Mary D. Latoff,
Director
/s/ Charles A. MurrayMarch 14, 2019Charles A. Murray,
Director
/s/ G. Daniel O’DonnellMarch 14, 2019G. Daniel O’Donnell,
Director
129