for inclusive and dynamic development in sub-saharan africa
TRANSCRIPT
For Inclusive and Dynamic Development in Sub-Saharan Africa
For Inclusive and Dynamic Developm
ent in Sub-Saharan Africa
JICA Research Institute
For Inclusive andDynamic Development
in Sub-Saharan Africa
June 2013JICA Research Institute

Cover Photos:Kenshiro Imamura, Minako Mochida-Matsukawa (first row from top, from left to right)Kenshiro Imamura (second row)Akio Iizuka (third row)Akio Iizuka, Atsushi Shibuya (forth row, from left to right)Shinichi Kuno (bottom row)
JICA Research Institute10-5 Ichigaya Honmura-cho Shinjuku-ku Tokyo 162-8433, JAPANTEL: +81-3-3269-3374 FAX: +81-3-3269-2054Copyright ©2013 Japan International Cooperation Agency Research InstituteAll rights reserved.
i
For Inclusive and Dynamic Development in Sub-Saharan Africa
ContentsList of Contributors ..............................................................................................................ⅲ
Foreword .....................................................................................................................................ⅳ
Acknowledgements ...............................................................................................................ⅵ
Executive Summary For Inclusive and Dynamic Development in Sub-Saharan
Africa: Challenges and Responses................................................. 1
Hiroshi Kato
Introduction and Overview Chapter 1: Achieving Economic Transformation for Inclusive and
Sustained Growth in Africa: Prospects and Challenges ..... 21 Kei YoshizawaPart Ⅰ: Rural Development and Food Security Chapter 2: Boosting Sustainable Agricultural Growth in Sub-
Saharan Africa ........................................................................................ 73
Koji Makino Chapter 3: How Promising Is the Rice Green Revolution in Sub-
Saharan Africa? - Evidence from case studies in Mozambique, Tanzania, Uganda, and Ghana ............................................................................. 99
Keijiro Otsuka Chapter 4: The Inclusive Development Approach among Farmers,
Private Partners and Government through the Promotion of Responsible Investment for Agricultural Development ........................................................................................................................119
Koji Makino Chapter 5: Initiatives of SHEP and SHEP UP
- Capacity development of small-scale farmers for increased responsiveness to market needs .......................... 143
Jiro Aikawa
ii
Part Ⅱ: Economic and Social Transformation Chapter 6: Industrial Development of Africa
– JICA’s commitment at TICAD IV and its follow-up ..... 173
Go Shimada, Toru Homma and Hiromichi Murakami Chapter 7: Policy Challenges for Infrastructure Development in
Africa - The way forward for Japan’s Official Development Assistance (ODA) .............................................................................. 195
Yasuo Fujita, Ippei Tsuruga, and Asami Takeda Chapter 8: Cross Border Transport Infrastructure (CBTI) ................... 225
Kaori Matsushita Chapter 9: Toward Universal Health Coverage in Africa
- Achieving MDGs with equity, and beyond ........................ 247
Ikuo Takizawa Chapter 10: Challenges in Educational Development in Africa and
JICA’s Approach .................................................................................. 267
Kazuro ShibuyaPart Ⅲ: Resilience for Inclusive and Dynamic Development Chapter 11: Countermeasures against Climate Change in Africa ...... 301
Tomonori Sudo Chapter 12: State-building and Conflict Prevention in Africa .............. 329
Ryutaro MurotaniPart Ⅳ: South-South Cooperation for Knowledge Exchange Chapter 13: South-South and Triangular Cooperation for Sub-
Saharan Africa’s Development - With special emphasis on knowledge exchange and co-creation .............................................................................................. 351
Shunichiro Honda, Hiroshi Kato, and Yukimi ShimodaAppendices Appendix 1: The TICAD Process and Japan .................................................... 391
Kei Yoshizawa Appendix 2: Japan’s Official Development Assistance to Africa 2000-
2011 ............................................................................................................ 402
Index .......................................................................................................................................... 415
iii
List of Contributors:
Jiro Aikawa Senior Advisor, JICA
Yasuo Fujita Executive Advisor to the Director General, Credit Risk Analysis and Environmental Review Department, JICA
Toru Homma Senior Advisor, JICA
Shunichiro Honda Research Associate, JICA Research Institute
Hiroshi Kato Director, JICA Research Institute
Koji Makino Deputy Director General, Rural Development Department, JICA
Kaori Matsushita Deputy Director, Planning and TICAD Process Division, Africa Department, JICA
Hiromichi Murakami Deputy Director General, Industrial Development and Public Policy Department, JICA
Ryutaro Murotani Research Associate, JICA Research Institute
Keijiro Otsuka Professor, National Graduate Institute for Policy Studies
Kazuro Shibuya Senior Education Specialist, Human Development Network, World Bank
Go Shimada Research Fellow, JICA Research Institute
Yukimi Shimoda Research Associate, JICA Research Institute
Tomonori Sudo Research Fellow, JICA Research Institute
Asami Takeda Research Assistant, JICA Research Institute
Ikuo Takizawa Director, Health Division 1, Human Development Department, JICA
Ippei Tsuruga Research Officer, Research Program Division, JICA Research Institute
Kei Yoshizawa Advisor to the Director General, Africa Department, JICA
iv
Foreword:
It is with great pleasure that I bring this volume to publication, a report summarizing JICA’s experience with, and knowledge of, sub-Saharan African development. Drawing on literature surveys, empirical research and/or practical cases from JICA’s on-the-ground experiences, the volume contains chapters that address, collectively, a range of issues of special pertinence to Sub-Saharan Africa’s development. It starts with discussions on how to transform the agricultural and rural sector. It then discusses the need to diversify the economic structure, which should be buttressed by infrastructure and human resource development. Two chapters discuss how to prepare for and respond to shocks and threats, such as climate change and political instability. Finally, the volume also contains a chapter on mutual learning through South-South and triangular cooperation, along with a historical overview of the TICAD process.
Sub-Saharan Africa is much richer than it was twenty years ago, when the TICAD process began in 1993, and the continent is likely to continue its remarkable growth in the coming years and decades. We must acknowledge, however, that there remain cautious observers who point to the precarious sides of its development, such as sluggish poverty reduction, a declining manufacturing sector, a weak job market, and increasing inequalities among various segments of society. These obstacles must, and in my view can, be overcome with careful policies by the leaders and peoples of Africa, with continued support from the international community.
If this is the challenge that is facing Africa’s development today, the issue to be discussed at TICAD V and beyond is how to sustain robust development over the long term, such that the benefits are shared widely both within and across countries. That is the view underpinning the current volume, which we titled For Inclusive and Dynamic Development in Sub-Saharan Africa. “Inclusive and dynamic development” has been part of JICA’s corporate mission statement since its organizational rebirth in 2008, and we believe it is an important prerequisite for human security.
Japan has been a consistent supporter of African development, and JICA, as chief implementing agency of Japan’s development cooperation, has been devoting considerable effort to that cause. We
v
have compiled this report in the hope that it will help us share our views, noteworthy cases, and practical knowledge, with a wide range of decision makers and practitioners involved in the development of Sub-Saharan Africa. I hope you will enjoy reading it.
Akihiko TanakaPresident
JICA
vi
Acknowledgements:
This Report has been prepared by a team organized at the JICA Research Institute and comprises the members whose names are on the list of contributors. The team benefited greatly from a wide range of consultations, chiefly done through occasional workshops. The team wishes to thank the participants in these workshops, which included academics, policy researchers, and government officials at the Ministry of Foreign Affairs and JICA’s staff members both in Tokyo Headquarters and elsewhere.
Our special thanks go to John Page, Homi Kharas and Laurence Chandy, all at the Brookings Institution, who kindly took the time to review the whole manuscript and provided the team with enormously useful and insightful suggestions and comments, without which this volume would not have taken this shape. Our thanks also go to Professor Keijiro Otsuka of the National Graduate Institute for Policy Studies (GRIPS), who not only provided the team with useful comments on the chapters on agriculture but also contributed a chapter of his own.
We are grateful also for the professionals who provided us with comments by participating in our workshops as commentators and in writing. They are, in alphabetical order: Mitsugi Endo (University of Tokyo), Katsumi Hirano (Institute of Developing Economies, JETRO), Norichika Kanie (Tokyo Institute of Technology), Izumi Ohno (GRIPS), Kenichi Ohno (GRIPS), Tetsushi Sonobe (GRIPS), Motoki Takahashi (Kobe University), Kenji Shibuya (University of Tokyo) and Kazuhiro Yoshida (Hiroshima University). We have also received insightful views from development partners at the African Development Bank, the United Nations Office of South-South Cooperation, and the World Bank. Last but not least, I would like to thank all the authors, the editorial team and the other staff of the JICA Research Institute, comprising Ippei Tsuruga, Yasuhiko Sato and Yoshiko Isozaki, for the tireless effort they have dedicated to this project.
While we truly appreciate the contributions from these collaborators, and have done our best to incorporate their suggestions and comments, we, the authors of the essays, are solely responsible for any errors, omissions and deficiencies that may remain. I hasten to add that the views and opinions expressed in this volume are those of the authors and do not necessarily represent the official views of the organizations they belong to or are affiliated with.
Hiroshi KatoDirector
JICA Research Institute


1
Executive Summary: For Inclusive and Dynamic Development in Sub-Saharan Africa: Challenges and Responses
Hiroshi Kato
1. What Is This Volume and What Is Its Purpose?
This volume is a compilation of JICA staff members’ views on Sub-Saharan African development1, as well as the views of the lead researcher of a research project being conducted at the JICA Research Institute.2
The chapters vary in their approaches and frameworks. In terms of methodology, some rely primarily on literature reviews, others on case analyses, and the rest on empirical research. In terms of message, some offer recommendations to all the stakeholders of African development, while others offer recommendations for consideration by the Japanese government. Though varied, however, the common thread running through them is the desire to share JICA’s experiences on the ground and/or its research findings with various stakeholders, in order to enrich the international debates on African development.
The plan of this volume has been formulated keeping in mind the ongoing discussion on TICAD V. Specifically, the chapters have been prepared so that collectively they would address the major themes of the conference, which are, as of March 2013, as follows: (1) Robust and Sustainable Economy, (2) Inclusive and Resilient Society, and (3) Peace
1. This volume chiefly addresses the developmental challenges of Sub-Saharan African countries, based on the understanding that firstly, although they are much wealthier and are dynamically developing, they still need strong international attention; and that secondly, even though they do share certain development challenges with their North African peers, SSA countries are faced with substantially different and serious developmental challenges.2. As such, the views expressed herein do not necessarily represent the official views of the Japan International Cooperation Agency (JICA.), though the authors have been encouraged to incorporate comments they have received during the internal peer review.
2
Executive Summary
and Stability.3 This report could also contribute to the discussion on the post 2015 agenda since Africa will be the major target region.
2. Africa’s Challenge: Inclusive and Dynamic Development
Africa today is much wealthier and is developing much more dynamically than it was twenty years ago, when the TICAD process started in 1993. Currently, more than 23 Sub-Saharan African countries (including Sudan) have become categorized as middle-income countries with per capita GDP greater than $1,000. If seen as a single country, Africa is already a middle income country with per capita GDP circa $1500. And given the high price of food and natural resources likely to remain into the foreseeable future, it is not at all too ambitious to predict a high growth rate of the African economy in the coming years or decades. The African Development Bank predicts that, on certain assumptions, per capita GDP of Africa will be close to $4,000 in 2040, an income level comparable to Indonesia today.
The progress is not limited to income growth measured in terms of GDP. As the overview chapter (Ch. 1) summarizes, over the past decades, the continent has claimed a number of successes. These include, among others:
✓ Modest but symbolic progress in poverty reduction, with the poverty rate falling below 50% for the first time, and Africa’s poverty headcount falling for the first time since the start of official records keeping in 1981.
✓ Large reductions in infant and maternal mortality. ✓ Large gains in enrollment of primary education. ✓ Improved macroeconomic stability (low inflation, rising domestic
resource mobilization, good fiscal health), and, ✓ A reduced incidence of conflict.
The question is how to sustain such robust African growth of Africa for the long term; let us be reminded quickly that the long term prediction cited above by the African Development Bank is based on the assumption that a growth rate of close to 5% is maintained for 30 years
3. Important issues such as financial markets, urbanization, demographic changes and natural resource management have had to be left out; we will try to address them at another time.
3
For Inclusive and Dynamic Development in Sub-Saharan Africa: Challenges and Responses
between 2010 and 2040, which can actually be quite a bold assumption. Past experience shows that the economic growth rate of SSA has not been very stable. Skeptics point to the lack of improvement in governance indicators, insufficient good job opportunities, falling levels of manufacturing, little productivity growth in agriculture, sluggish progress in learning achievement in schools, and inadequate service delivery systems, including health, increasing vulnerability against climate change; and the list goes on.
In view of this, one cannot agree more with the organizers of the TICAD for choosing the themes of the upcoming conference: (1) Robust and Sustainable Economy, (2) Inclusive and Resilient Society, and (3) Peace and Stability. These three agenda items are intricately linked, and failure in achieving one of them will inevitably affect the performance of Africa in the other two.
It is based on the above that we have titled this small volume “For Inclusive and Dynamic Development in Sub-Saharan Africa.” This summarizes a widely shared conviction at JICA (and perhaps elsewhere) that Africa must continue developing dynamically by reducing the vulnerability of its economic structure (hence “Dynamic Development” is indispensable), while at the same time such dynamic development must be realized in such a way that disparities between the rich and poor do not expand beyond a tolerable threshold; and that everybody in society is given opportunities to take part in the productive process (hence “Inclusive Development” is also imperative).4
The phrase “Inclusive and Dynamic Development” has been JICA’s mission statement since its rebirth as a new JICA in 2008, coinciding with TICAD IV. Ever since, we have been working hard in Africa to realize this ideal with our partners around the world, and today we are ready to work harder than ever before with our African and international partners to achieve this same ideal.
3.Emerging Challenges
The biggest news at TICAD V is that in the period since 2008 Africa has
4. Our view shares perspectives with the debate which has been described in terms of a contrast between “Big development” and “Small development (Woolcock 2012).
4
Executive Summary
continued to maintain its good track record of economic growth, despite the worst global financial crisis in half a century. This in itself is cause for celebration, but should not be a source of complacency. As the essay contained in Chapter 1 makes clear, the sources of Africa’s sustained growth remain quite limited, and Africa’s growth appears vulnerable.
The three major challenges identified below share a common underlying cause. Seen from an Asian perspective, structural change in Africa since its growth “turn around” in 1995 has been very limited. Agricultural productivity has been largely stagnant. The region’s share of manufacturing in GDP is less than one half of the average for all developing countries, and it is declining; and FDI remains almost wholly in natural resources. Three significant risks appear to threaten the region’s sustained progress for 2013-2018.
Jobs and povertyAfrica is not creating enough jobs to absorb the 10-12 million young people entering its labor markets each year. Today, according to the African Development Bank, less than one fifth of Africa’s young workers find wage employment. Unemployment in Sub-Saharan Africa seems low. In 2009 it was about six percent. This is not because Africa is doing well at generating wage-paying jobs. Eighty percent of job seekers find themselves in informal employment, self-employment or family labor. These are not good jobs. In 2011, eighty-two percent of African workers were classified by the ILO as working poor. The sources of Africa’s recent growth – improved economic management, strong commodity prices and new discoveries of natural resources – are not job creators.
The region’s lack of “good” jobs – those capable of paying good wages and offering the potential to acquire skills – has also meant that compared with other developing regions, especially East Asia, growth has not resulted in rapid poverty reduction. Africa has the lowest elasticity of head count poverty to growth of any developing region. Jobs and poverty are closely linked, and will need to be urgently addressed.
New discoveries of natural resourcesIronically, one of the main drivers of Africa’s current economic success may prove its long term undoing. New resource discoveries since 2008 have redrawn the map of natural resource rich economies across the continent. Ghana, Kenya, Mozambique, Tanzania and Uganda have all
5
For Inclusive and Dynamic Development in Sub-Saharan Africa: Challenges and Responses
recently had major discoveries of hydrocarbons, and newly resource rich economies are likely to increase in the future. Africa is richly endowed with metal and non-metal minerals, as well as energy resources. Although precise data are not available – principally because much of the continent is under-explored – it is likely that Africa hosts about 30 per cent of the world’s mineral reserves.
In Africa, countries dependent on oil, gas, and mining have tended to have weaker long run growth, higher rates of poverty, and higher inequality than non- mineral dependent economies at similar levels of income. But geology is not destiny. Some societies have succeeded in harnessing natural resources for sustained increases in production, while others have not. The long run success or failure of resource rich economies depends on the choices made as to how resource riches will be used. Making the right choices with respect to public financial management and strategies for economic diversification will become increasingly important for a growing number of countries and their development partners.
Lack of export dynamismFor poor Asian countries the export has been the main source of rapid growth. There is persuasive evidence that what an economy makes matters for its long-term development. More diversified economies tend to have higher levels of income, and economies that produce and export more sophisticated goods tend to grow faster. Africa has had little export success: manufactured exports per person are less than 10 per cent of the average for low income countries. Industry in Africa has declined as a share of both global production and trade since the 1980s. Africa as a whole has become a net importer of food and of agricultural products (FAO 2012).
While manufacturing is most closely associated with rapid export growth, there are also “industries without smokestacks” in agriculture and services that can create export dynamism. Investors in these industries, however, do not see Africa as an attractive location. Domestic private investment has remained at about 11 percent of GDP since 1990. This is well below the level needed for rapid export growth. Diversification into new products and markets will be a daunting challenge for both resource poor and resource rich economies alike. Breaking into non-traditional export markets will demand a coordinated
6
Executive Summary
set of public investments, policy reforms and institutional innovations more characteristic of Asian than African economies.
4. Appropriate Responses
The essays contained in the volume offer insights into a wide range of JICA’s operational engagements in Africa. From these, three areas of activity have been selected to demonstrate Japan’s distinctive role as a development partner, and offer the potential to address the three challenges described above.
Transforming agricultureGiven Africa’s projected increase in food requirements and the limits to extensive agricultural growth, progress in agricultural yields is vital. Increasing yields and adapting to climate change will require African farmers to have access to new varieties of crops that are better adapted to the changing agro-climatic conditions. Chapter 3 makes a persuasive case that existing improved varieties in rice – originally developed for Asia – offer the potential for significant yield increases in Africa, if coupled with appropriate farming technologies and inputs. Japan should continue to take a leadership role both in the dissemination of existing technologies and in the development of new technologies.
Agricultural innovations alone will not be sufficient to transform African agriculture. A large number of complementary institutional and policy reforms will be needed. Agricultural innovation systems will need to adapt to cover a range of activities from development of new, appropriate agricultural technologies to the dissemination of good practices, and to the development of value chains. Investments in irrigation and a shift from dry land to irrigated agriculture will also be required. The essays in this volume show how Japan is responding to those challenges; Chapter 4 introduces a farming as business approach for value chain development through the empowerment of small scale farmers commonly called SHEP; Chapter 5 explains agricultural inclusive development by encouraging private responsible investment; and Chapter 11 describes how to make agriculture more resilient to climate change.
Entering these value chains will require public actions to improve
7
For Inclusive and Dynamic Development in Sub-Saharan Africa: Challenges and Responses
logistics capability. Physical infrastructure is particularly important at points of export (airports and seaports) and in connecting production centres to ports (roads and railways). The two essays that cover the Nacala corridor in Mozambique (Ch. 5 and 8) illustrate one approach to this problem.
Building capabilities in industry and service delivery in education and health“Firm capabilities” – the know-how and working practices used in production – largely determine quality and productivity. Globally firms compete in capabilities. As the essay on industrial development (Ch. 6) argues, Africa needs higher capability firms to join the global game. Value chain relationships between local firms and foreign investors (FDI) are a good way to learn global best practice. Thus, policies and institutions for attracting FDI are a key capability building tool. Capabilities can also be taught through management training.
Despite substantial increases in budget commitments, the essays on education and health (Ch. 9 and 10) show that there have not been commensurate improvements in social sector outcomes. Service delivery remains poor. Educational quality and health service coverage are a particular concern. While better service delivery has a direct relevance to attainment of the MDGs, it can also – as illustrated by the East Asian Miracle countries – be an important component of a “shared growth” strategy to address poverty.
Strengthening infrastructureJapan has been a consistent – and often lonely – advocate for the need to focus development assistance on infrastructure. As Chapter 7 reports, firm level studies in Africa highlight infrastructure deficiencies as a significant barrier to greater competitiveness. Sub-Saharan Africa lags at least 20 percentage points behind the average for low income countries on almost all major infrastructure measures. In addition, the quality of service is low, supplies are unreliable, and disruptions are frequent and unpredictable.
As the essays illustrate, infrastructure directly affecting the competitiveness of traded goods producing activities has been neglected. Road infrastructure has received only inadequate attention. While increasing investments in the power sector must be emphasized,
8
Executive Summary
for improved industrial and export performance, investment in infrastructure in the area of trade logistics must also be promoted. Japan’s efforts to improve connectivity through physical infrastructure and institutional reform – such as one stop border posts – represent major contributions to improving trade logistics (Ch. 8).
The Nacala project – and to some extent the Mombasa corridor – go even further. These have the potential to become regional Special Economic Zones5 – often called “growth corridors” – developed around key natural resource investments and associated infrastructure (ports, roads, power projects). Developing growth corridors is attractive for three reasons. First, they emphasize the complementarities between transport infrastructure and resource- or agriculture-based projects within a region, and highlight the possible complementarities between investment projects (for example, agriculture and agro-processing). Second, the approach can help to solve coordination problems between investments in related projects, increasing the prospect of rapid private sector responses to infrastructure improvements. Third, it is possible that in resource concentrated zones, the bulk of capital spending on infrastructure (both transport and power) can be financed by the resource projects themselves.
5. The Features of Japan’s Cooperation
The chapters that deal with JICA’s specific projects and programs capture some of the salient features of JICA’s approach to giving aid and supporting transformation. Three features seem to stand out.
The first is an emphasis on scaling up, which could take a variety of routes and methods. The programs in agriculture (CARD initiative, SHEP, and Win-Win-Win approach) all illustrate attempts to scale up desirable actions. Projects of School Based Management and Teachers’ training (Ch.9), as well as the introduction of Kaizen to hospital management (Ch.10) are examples of gradual expansion of activities proven effective initially in one country. Also, the emphasis on the use of south-south cooperation (Ch.13) as an instrument for propagating and
5. While traditionally defined special economic zones (SEZs) are reported to have a mixed record (WDR 2013: p.221), regional SEZs or regional development corridors as advocated here are based on a different concept.
9
For Inclusive and Dynamic Development in Sub-Saharan Africa: Challenges and Responses
institutionalizing successful interventions embodies horizontal scaling up
The second feature is the emphasis on learning and continuous improvement, the importance of which Japan has learned through its own history of development. Chapter 3 argues for the applicability of the Asian rice cultivation techniques to Africa; the chapters on industrial development (Ch. 6) and health (Ch. 9) illustrate the attempt to impart successful Japanese management practices – such as Kaizen and total quality control – to firms of all sizes, and to adapt them to service providers in health. The efforts to promote FDI described in Chapter 6, speaking to the need to develop effective institutions to attract FDI to Africa, are an example of sharing experiences of Asia and Japan; and again, various and developing practices of South-South and triangular cooperation are instruments of knowledge sharing and co-creation.
And thirdly, though perhaps not unique to Japan’s cooperation, many projects and programs have attempted to combine financial resources and knowledge transfer, in view of realizing comprehensive cooperation. This feature is particularly salient in infrastructure (Ch. 7 and 8), but is also highlighted in projects in other areas such as agricultural development (Ch. 5) and climate change (Ch. 11).
6. General Chapter Summary
Following the overview chapter (Ch.1), the essays in the volume can roughly be divided into two categories. There are analytical chapters which examine various aspects of the transformation process that are pivotal for Africa. Second, there are more programmatic chapters which describe JICA’s approaches to supporting transformation in partner countries
The analytical chapters, respectively, ask how agricultural productivity can be enhanced (Ch. 2 and 3), look at the challenges in infrastructure development (7); explore what it would take to achieve universal access to health care (9), discuss how to improve quality of education (10), assess the challenges of building resilience to climate change (11), and explore how the capacity and legitimacy of the state can be strengthened to mitigate potential conflict risks (12).
10
Executive Summary
The more programmatic chapters share JICA’s experiences in agriculture (Ch.4 and 5), industrialization (6), infrastructure (8), and South-South and triangular cooperation (13).
Chapter 1: Achieving Economic Transformation for Inclusive and Sustained Growth in Africa: Prospects and Challenges (Kei Yoshizawa)
This chapter attempts to give an overview of recent development in Africa as a prologue to the subsequent chapters.
The basic view of the chapter on Africa is that while the recent high economic growth in Africa is appreciated, an economic transformation is called for. A transformation is needed to break away from the current dependence on primary products, from inadequate and uneven progress in poverty reduction, and from the alarming trend of the increase in the working age population and unemployment, with a transformation toward a more diversified economic structure that enables inclusive and sustained economic growth.
In terms of development strategies, the author argues for what he calls a “diversified and customized approach for development.” He means that now as different countries are starting to follow different development paths, differentiated approaches should be applied to countries with different needs. He also emphasizes the importance of a regional approach, which has consistently been an important agenda issue throughout the TICAD process.
Chapter 2: Boosting Sustainable Agricultural Growth in Sub-Saharan Africa (Koji Makino)
This chapter serves as a stage setter for the following three chapters (3 through 5) on agriculture. It argues that JICA/Japan has been cooperating and will continue to cooperate with its African partners using four approaches. The first one is productivity increase on specific commodities of strategic importance in Africa, exemplified by the CARD initiative launched at the time of TICAD IV in 2008. The third is an approach that attempts to take advantage of the private sector in agricultural development, while at the same time increasing the productivity and hence the earnings of small scale famers. An example of this approach is the Mozambique-Brazil-Japan tripartite cooperation titled ProSAVANA. And the third is an attempt to encourage small
11
For Inclusive and Dynamic Development in Sub-Saharan Africa: Challenges and Responses
farmers to be more sensitive and responsive to market signals, the effectiveness of which has been proven by JICA’s experience in Kenya. Finally, he states that JICA will continue to build up resilience of African agriculture against risks such as climate change and food price hikes.
Chapter 3: How Promising Is the Rice Green Revolution in Sub-Saharan Africa? - Evidence from case studies in Mozambique, Tanzania, Uganda, and Ghana (Keijiro Otsuka)
This chapter is written by Professor Keijiro Otsuka of the National Graduate Research Institute for Policy Studies (GRIPS) of Japan, and leader of an empirical investigation by the JICA Research Institute on the possibility of rice production expansion in the countries participating in the CARD initiative.
Starting with his premise that Sub Sahara Africa (SSA) needs a Green Revolution, the author argues that the most promising path for achieving a Green Revolution in SSA is through the development of lowland rice production. To support this claim, he presents two sources. The first is a macro level analysis: comparing SSA and Asia, he argues that there remains ample room for productivity improvement in rice. And second, he argues that the research conducted in Mozambique, Tanzania, Uganda and Ghana demonstrates that a significant increase in per hectare yield is possible both in irrigated and rain-fed areas by combining certain rice production techniques, which the author calls “Asian type production techniques” like bunding and leveling, together with the use of high yielding modern variety seeds and the application of fertilizer.
Chapter 4: The Inclusive Development Approach among Farmers, Private Partners and Government through the Promotion of Responsible Investment for Agricultural Development (Koji Makino)
This chapter starts by recognizing that investments both by the private sector and by farmers are essential for agricultural development, and argues that the issue is how countries can manage to secure “responsible investment” in agriculture. Specifically, the author argues that appropriate measures to promote responsible investment should be designed and put into practice in accordance with internationally agreed norms.
12
Executive Summary
The chapter then introduces the case of the project entitled “ProSAVANA.” A project of national priority for Mozambique, it aims to contribute to the improvement of income among inhabitants in the Nacala Corridor, suited to agricultural production but inhabited by many small scale farmers. The project intends to build up agricultural inclusive development models through dialogues with farmers and civil societies under the government’s ownership.
Chapter 5: Initiatives of SHEP and SHEP UP - Capacity development of small-scale farmers for increased responsiveness to market needs (Jiro Aikawa)
This chapter reports an encouraging outcomes being observed in a JICA supported project called SHEP and SHEP UP in Kenya, on developing the capacities of small-scale farmers. The idea is to help them be more responsive to the signals from the market and, at the same time, capable of strategically planning their production, and putting such plans into implementation. To that end, the project has devised a carefully designed model to motivate the farmers and provide appropriate assistance to help them overcome the information asymmetry and to upgrade their production and marketing techniques.
The achievements so far have been very encouraging: the unit yield and income of the farmers participating in the project increased dramatically. Encouraged by the success of the project, the model is being scaled up nationwide.
Chapter 6: Industrial Development of Africa – JICA’s commitment at TICAD IV and its follow-up (Go Shimada, Toru Homma and Hiromichi Murakami)
To address the de-industrialization issue in SSA, this chapter argues for measures of promoting industry for the creation employment and added value, for private sector development, and for promotion of foreign direct investment.
The paper then looks at the history of three cases of cooperation projects that have been developing since TICAD IV in 2008. The idea underpinning these projects is that state has a role to play in promoting economic growth while maintaining equity, an idea that was stressed at the symposium held in 2008 as a side event to TICAD IV, participated in by African leaders as well as Prof. Stiglitz of Columbia University.
13
For Inclusive and Dynamic Development in Sub-Saharan Africa: Challenges and Responses
Presented in the paper are two projects in Ethiopia, one concerning industrial policy dialogue and productivity improvement, and the other quality and productivity improvement (Kaizen), as well as a project in Zambia for investment promotion and diversification entitled “Triangle of Hope.”
Chapter 7: Policy Challenges for Infrastructure Development in Africa - The way forward for Japan’s Official Development Assistance (ODA) (Yasuo Fujita, Ippei Tsuruga, and Asami Takeda)
This chapter proposes three recommendations for the government of Japan, based on an analysis of data provided by the Infrastructure Consortium for Africa (ICA) and JICA’s internal information.
First, it argues that reallocation of resources to needier sectors, particularly to the power sector, is a high priority. Secondly, the chapter argues that the Japanese government may wish to expand its financial support for the operation and maintenance of infrastructure, which is at present left as the responsibility of recipient governments. And thirdly, the authors recommend more support for governance and management reform of public utilities; especially, the paper calls for intensified efforts to create effective organizations, like government agencies and public utilities in which, with appropriate external support, positive and immediate achievements can be expected in their organizational reforms.
Chapter 8: Cross Border Transport Infrastructure (CBTI) (Kaori Matsushita)
This chapter begins with a summary of the current situation of transport of goods in Africa and an overview of the CBTI development in the continent, and then introduces the three approaches that Japan has been pursuing for the development of CBTI, with specific examples.
The first is corridor development, one example of which is the project in an area connecting the Mombasa Port (Kenya) and inland countries of Uganda, Rwanda, and Burundi. It aims to upgrade the functions of the Port of Mombasa along with the development of roads connecting the port with the three countries, thereby encouraging the transport of goods as well as economic activities in the region. Another example of this approach is the Nacala Corridor in Mozambique, aiming to develop an area connecting the Nacala Port and the inland countries of Malawi
14
Executive Summary
and Zambia. The second approach is pursuing border formalities facilitation, through the introduction of One Stop Border Posts (OSBP), a system that neighboring countries jointly conduct immigration, control customs clearance and quarantine. And the third approach aims to harmonize the transport rules and regulations across the borders, to alleviate problems arising from different regulations on road traffic on both sides of the borders.
Chapter 9: Toward Universal Health Coverage in Africa - Achieving MDGs with equity, and beyond (Ikuo Takizawa)
While noting that SSA has experienced quite impressive strides in improving a number of health indicators, this paper warns that there is a considerable disparity in the pace of progress within and among countries, and we cannot be complacent with the status quo.
Now that equity in terms of essential health service coverage is becoming a major issue, the paper argues that it is increasingly necessary to focus on health system issues, and especially equity in access and financial protection, which, together, call for concerted efforts toward universal health coverage (UHC). As well, in making efforts toward UHC, the chapter calls for a paradigm shift in the usage of development assistance for health (DAH). Specifically, it is argued that DAH should be provided more strategically and catalytically in a way to increase the allocation of domestic resources for health. Secondly, DAH should also be provided in a way to improve the management of health systems and programs.
Chapter 10: Challenges in Educational Development in Africa and JICA’s Approach (Kazuro Shibuya)
While acknowledging significant advancement in education in Africa, the author states that challenges remain, first in the persistent disparity among and within countries, and second in the quality of education. The paper points out as well that higher education in the African continent is also inadequate.
Taking note of the shifts in the international education agendas from those of “Education for All” to “Learning for All,” the author discusses the validity of approaches that Japan has developed that are consistent with such globally shared trends in education and different needs of partner countries. These include those for the improvement of school
15
For Inclusive and Dynamic Development in Sub-Saharan Africa: Challenges and Responses
management and strengthening of teacher training. The author also emphasizes that JICA could play a role in facilitating feedback from the good practices on the ground to education policymakers in the central government, with its comparative advantage as a donor covering a wide spectrum of activities from the ministry level to local governments and communities levels.
Chapter 11: Countermeasures against Climate Change in Africa (Tomonori Sudo)
This chapter discusses the challenges and potentials of Africa in terms of climate change. The paper argues, on the mitigation side, that though Africa is a region where the level of greenhouse gas emissions is the lowest in the world, ample possibilities for mitigating the climate change effect exist, especially in view of the robust economic growth foreseen for the continent in the coming decades. Such possibilities lie in energy and transportation, and forest management.
On the adaptation side, the author lists, among others, three major challenges. First, measures to reduce the agricultural sector’s vulnerability must be strengthened because of its high dependency on rainwater and the inadequate product distribution system. Equally serious risks that warrant attention are those associated with natural disasters such as floods, droughts, coastal erosion, and mudslides. And third, water resources management is also a huge challenge in view of an unstable and insufficient water supply, the expansion of agriculture, industry and other sectors. The presence of international rivers in the continent also calls for effective cross border water resource management systems.
Chapter 12: State-building and Conflict Prevention in Africa (Ryutaro Murotani)
This chapter argues that post-conflict state-building processes must focus not only on public safety but also on assuring people’s livelihood; livelihood improvement is necessary in order for people to perceive the dividend of peace and to accept the state as legitimate. In dealing with humanitarian crises, these perspectives for long-term institution building have to be introduced in the early stages of emergency responses to humanitarian crises.
The chapter then shares some research findings to identify important
16
Executive Summary
factors of building up the state’s legitimacy, as well as some examples of JICA’s projects helping to improve people’s livelihood, states’ capacities, and eventually the people’s trust of government institutions, contributing to improved state legitimacy.
Chapter 13: South-South and Triangular Cooperation for Sub-Saharan Africa’s Development - With special emphasis on knowledge exchange and co-creation (Shunichiro Honda, Hiroshi Kato and Yukimi Shimoda)
This chapter looks at South-South cooperation (SSC) and Triangular Cooperation (TrC) for SSA development. SSC has a long history starting in the 1950s. Since its genesis, Africa, along with Asia, has played a leading role in its promotion. The TICAD process has played an important role since 1993 in promoting the momentum of SSC.
The paper pays special attention to knowledge exchange and co-creation through SSC and TrC. Drawing on the cases of TrC supported by JICA, the paper demonstrates that there are a number of possible ways of encouraging knowledge exchange and co-creation, from highly institutional models to more flexible ones, where institutional arrangements develop over time as the network among the participants develops. The paper also argues that knowledge sharing and co-creation should not be monopolized by a small number of actors but is a possibility to all aspiring countries and organizations.
Appendix: The TICAD Process and Japan (Kei Yoshizawa)This essay looks back at the 20 years since the first TICAD in 1993. It traces how the TICAD process has contributed to ever-changing development issues in Africa, with each of the quinquennial meetings focusing on different issues and the priorities of the time. It also gives attention to the institutional development of the process, including result-focused orientation demanding action plans with numerical targets, and its follow-up mechanism. The author finds the significance of the whole process in its development as an open international forum, through which ideas and concepts such as the respect of African ownership, human security, and south-south cooperation have been incorporated into the debate on African development.
17
For Inclusive and Dynamic Development in Sub-Saharan Africa: Challenges and Responses
References
FAO [Rakotoarisoa, M. A., M. Iafrate, and M. Paschali]. 2012. Why has Africa become a net food importer? Explaining Africa agricultural and food trade deficits. Rome: Trade and Markets Division, FAO.
Woolcock, M. 2012. Dueling development visions: Shaping the World Bank for the future. Let’s talk development: A blog hosted by the World Bank’s chief economist, April 13. http://blogs.worldbank.org/developmenttalk/dueling-development-visions-shaping- the-world-bank-for-the-future.
World Bank. 2012. World development report 2013: Jobs. Washington, DC: World Bank.


Introduction and Overview

21
Chapter 1: Achieving Economic Transformation for Inclusive and Sustained Growth in Africa: Prospects and Challenges
Kei Yoshizawa
Summary<Current status of development in Africa> • The economic growth rate in Africa since 2000 has generally been
good, driven in many countries by commodity exports, mainly energy and mineral resources, and helped by the progress in economic reforms and generally stable political conditions. However, poverty reduction is slow, unemployment, especially among youths, is serious, and progress is steady but slow in many MDGs.
• Under such circumstances, achieving economic transformation – transformation from dependency on the export of energy and natural resources into a more diversified economic structure – is imperative, so that economic growth becomes more robust and the benefits are widely shared by the poor, and most notably the young. In other words, a transformation of the economic structure is needed to enable inclusive and sustained economic growth in Africa.
<For achieving economic transformation and inclusive, sustained growth in Africa> • Productivity improvement in agriculture, Africa’s major production
sector, is urgently needed; this should be promoted by the public sector as well as by the increased participation of the private sector in both agriculture and its related agro-industries.
• A slump in manufacturing has continued for many years. Efforts to promote industrial development should be intensified, learning from a number of successful cases in Africa as well as from experiences from other continents, particularly Asia.
• Africa has a rich human capital to be developed and mobilized in the coming decades to achieve inclusive and sustained growth. Investing in effective education and healthcare system is imperative to increase
22
Chapter 1
labor productivity and per-capita income. Creating sufficient and decent employment is critial to mobilize the increasing working-age population to growth.
<Toward a differentiated and customized approach for development>The continent-wide regional integration perspective, which has been one of the principles underpinning the TICAD process, is important and must be further promoted. Along with this, however, the widening diversity of situations and stages of development among countries must be taken into consideration. Therefore, in working out its Action Plan for TICAD V, African leaders and their partners must make sure that each country is encouraged to seek differentiated and customized development strategies to meet its specific needs, while strongly upholding the perspective of regional integration and cooperation.
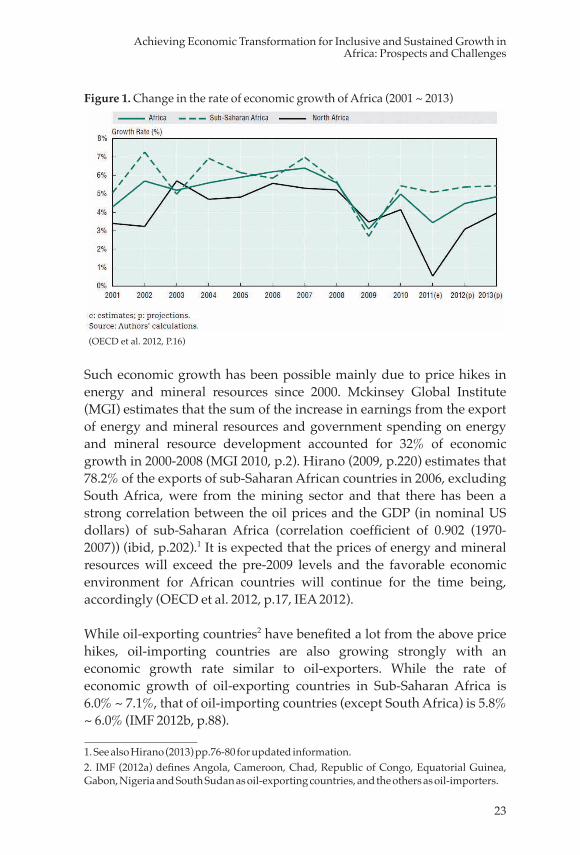
1. Current Status of Development in Africa 1.1 Rate of economic growth In recent years, the growth of African economies has received increasing attention. Between 2003 and 2008, the rate of economic growth in Africa, including North Africa, was maintained at a high level, between 5.3% ~ 6.2%. With a small variation, it has continued to grow at a stable pace: 3.1% (2009) → 5.0% (2010) → 3.4% (2011) → 4.5% (2012 – estimate) → 4.8% (2013 – estimate) (OECD et al 2012, p.243). The growth in 2009 was affected by the global recession and the financial crisis in 2008. Unlike the long slump after the oil shocks of the 1970s, however, the African economy showed a rapid recovery in 2010, a remarkable shift away from its dependence on the economies of developed countries in the past. It is also worthwhile noting that while the growth rate in sub-Saharan Africa was 5.1% (IMF 2012b, p.88), that of North Africa was 0.5% (OECD et al. 2012, p.24), which shows a remarkable slowdown in growth in North African countries, generally due to the area’s political turmoil.
23
Achieving Economic Transformation for Inclusive and Sustained Growth in Africa: Prospects and Challenges
Figure 1. Change in the rate of economic growth of Africa (2001 ~ 2013)
(OECD et al. 2012, P.16)
Such economic growth has been possible mainly due to price hikes in energy and mineral resources since 2000. Mckinsey Global Institute (MGI) estimates that the sum of the increase in earnings from the export of energy and mineral resources and government spending on energy and mineral resource development accounted for 32% of economic growth in 2000-2008 (MGI 2010, p.2). Hirano (2009, p.220) estimates that 78.2% of the exports of sub-Saharan African countries in 2006, excluding South Africa, were from the mining sector and that there has been a strong correlation between the oil prices and the GDP (in nominal US dollars) of sub-Saharan Africa (correlation coefficient of 0.902 (1970-2007)) (ibid, p.202).1 It is expected that the prices of energy and mineral resources will exceed the pre-2009 levels and the favorable economic environment for African countries will continue for the time being, accordingly (OECD et al. 2012, p.17, IEA 2012).
While oil-exporting countries2 have benefited a lot from the above price hikes, oil-importing countries are also growing strongly with an economic growth rate similar to oil-exporters. While the rate of economic growth of oil-exporting countries in Sub-Saharan Africa is 6.0% ~ 7.1%, that of oil-importing countries (except South Africa) is 5.8% ~ 6.0% (IMF 2012b, p.88).
1. See also Hirano (2013) pp.76-80 for updated information.2. IMF (2012a) defines Angola, Cameroon, Chad, Republic of Congo, Equatorial Guinea, Gabon, Nigeria and South Sudan as oil-exporting countries, and the others as oil-importers.
24
Chapter 1
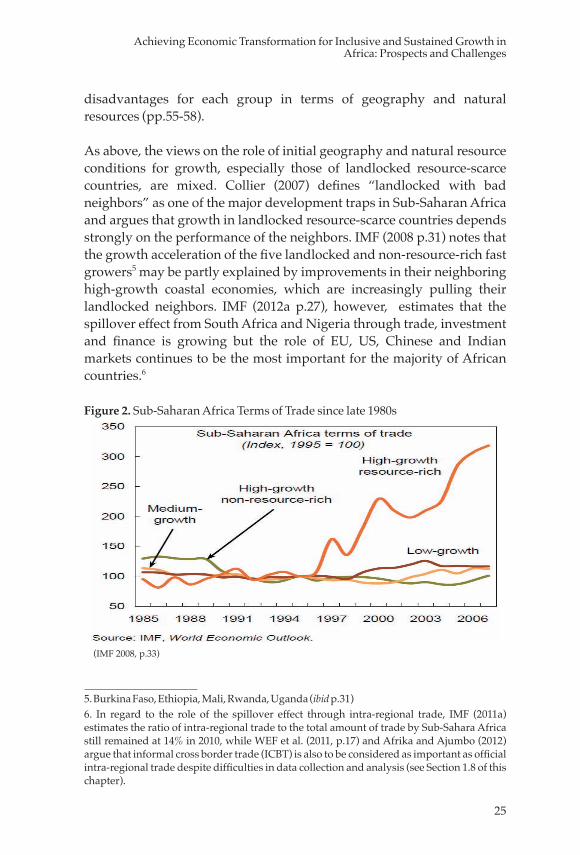
The prices of agricultural commodities also have been on a strong upward trend since the early 2000s (IMF 2013). However, a number of the oil-importing countries, which have been growing strongly, as mentioned above, have not benefited from these favorable external conditions, as the terms of trade of the non-resource-rich fast growers3 had been remaining stable or declining since the early 1990s (Figure 2). This trend has been continuing despite strong and sustained growth except in Mali (IMF 2012 pp.99). Hirano (2009, pp.205-213) also suggests that the impact of the price hikes in agricultural raw materials and edibles on growth rates have been important but much weaker than those of energy and metals since the 1990s.
IMF (2008) notes that, while the fast growers4 have had a variety of experiences with their terms of trade as in Figure 2, the most important factor for the fast growers has been a significant increase in total factor productivity, and that this underscores the role of strong policies and broad reforms by the fast growers, especially non-resource-rich countries (pp.26-27, p.30, pp.41-42). IMF (ibid p.31) also suggests that growth opportunities based on geography and endowments are not necessary conditions for fast growth based on recent experiences among fast growers in Africa.
Benno Ndulu et al. (2007 p.16) and Jorge Arbache et al. (2007 p.41, 2008 pp.27-28) also argue that the role of policy reforms undertaken in Africa since the 1990s was the most important growth factor since the late 1990s. They also suggest that the quality of policy and governance matter a great deal for growth, rather than initial conditions of geography and natural resources, which matter mostly for income levels, not for growth.
Collier and O’Connell (2007), however, propose a classification of Sub-Sahara African countries into three groups reflecting their initial geography and natural resource conditions: resource-rich, coastal resource-scarce, and landlocked resource-scarce (p.8) and suggest that a different policy choice for growth is required to overcome the
3. See footnote 4. 4. IMF (2008) defines “fast growers” as countries which had average annual real per capita GDP growth above 2.25% for 1995-2007. The group includes 4 oil exporters (Angola, Chad, Equatorial Guinea, Nigeria), 2 resource-rich countries (Botswana, Sao Tome and Principe), and 11 non-resource-rich countries (Burkina Faso, Cape Verde, Ethiopia, Ghana, Mali, Mauritius, Mozambique, Rwanda, South Africa, Tanzania, Uganda) (pp.26-27, p.53).
25
Achieving Economic Transformation for Inclusive and Sustained Growth in Africa: Prospects and Challenges
disadvantages for each group in terms of geography and natural resources (pp.55-58).
As above, the views on the role of initial geography and natural resource conditions for growth, especially those of landlocked resource-scarce countries, are mixed. Collier (2007) defines “landlocked with bad neighbors” as one of the major development traps in Sub-Saharan Africa and argues that growth in landlocked resource-scarce countries depends strongly on the performance of the neighbors. IMF (2008 p.31) notes that the growth acceleration of the five landlocked and non-resource-rich fast growers5 may be partly explained by improvements in their neighboring high-growth coastal economies, which are increasingly pulling their landlocked neighbors. IMF (2012a p.27), however, estimates that the spillover effect from South Africa and Nigeria through trade, investment and finance is growing but the role of EU, US, Chinese and Indian markets continues to be the most important for the majority of African countries.6
Figure 2. Sub-Saharan Africa Terms of Trade since late 1980s
(IMF 2008, p.33)
5. Burkina Faso, Ethiopia, Mali, Rwanda, Uganda (ibid p.31)6. In regard to the role of the spillover effect through intra-regional trade, IMF (2011a) estimates the ratio of intra-regional trade to the total amount of trade by Sub-Sahara Africa still remained at 14% in 2010, while WEF et al. (2011, p.17) and Afrika and Ajumbo (2012) argue that informal cross border trade (ICBT) is also to be considered as important as official intra-regional trade despite difficulties in data collection and analysis (see Section 1.8 of this chapter).
26
Chapter 1
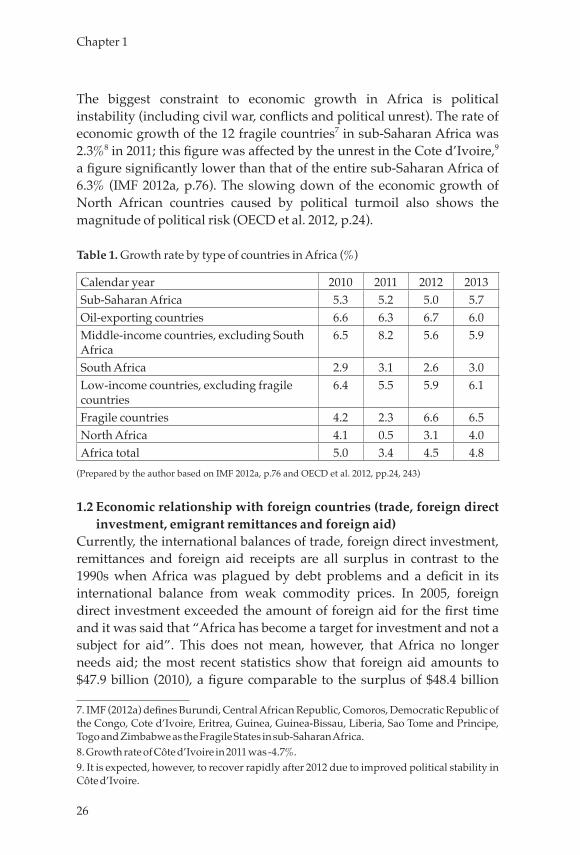
The biggest constraint to economic growth in Africa is political instability (including civil war, conflicts and political unrest). The rate of economic growth of the 12 fragile countries7 in sub-Saharan Africa was 2.3%8 in 2011; this figure was affected by the unrest in the Cote d’Ivoire,9 a figure significantly lower than that of the entire sub-Saharan Africa of 6.3% (IMF 2012a, p.76). The slowing down of the economic growth of North African countries caused by political turmoil also shows the magnitude of political risk (OECD et al. 2012, p.24).
Table 1. Growth rate by type of countries in Africa (%)
Calendar year 2010 2011 2012 2013Sub-Saharan Africa 5.3 5.2 5.0 5.7Oil-exporting countries 6.6 6.3 6.7 6.0Middle-income countries, excluding South Africa
6.5 8.2 5.6 5.9
South Africa 2.9 3.1 2.6 3.0Low-income countries, excluding fragile countries
6.4 5.5 5.9 6.1
Fragile countries 4.2 2.3 6.6 6.5North Africa 4.1 0.5 3.1 4.0Africa total 5.0 3.4 4.5 4.8
(Prepared by the author based on IMF 2012a, p.76 and OECD et al. 2012, pp.24, 243)
1.2 Economic relationship with foreign countries (trade, foreign direct investment, emigrant remittances and foreign aid)
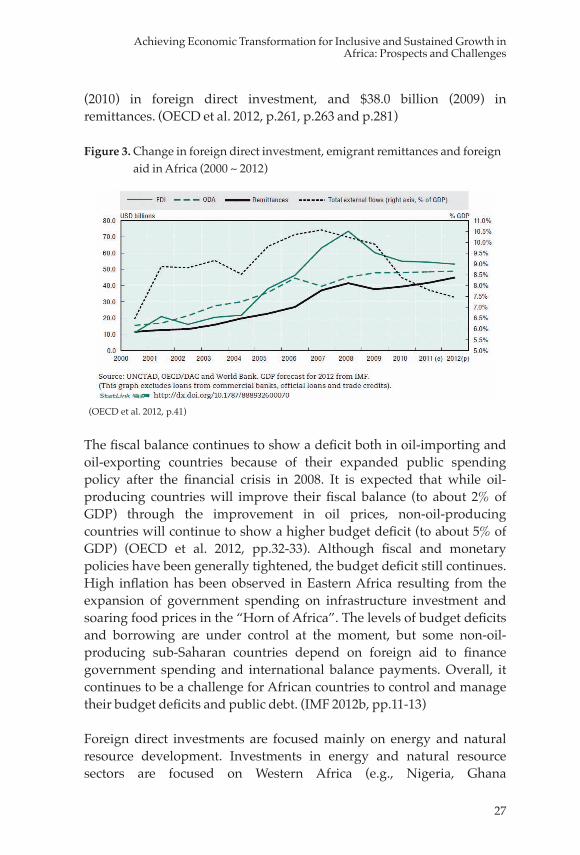
Currently, the international balances of trade, foreign direct investment, remittances and foreign aid receipts are all surplus in contrast to the 1990s when Africa was plagued by debt problems and a deficit in its international balance from weak commodity prices. In 2005, foreign direct investment exceeded the amount of foreign aid for the first time and it was said that “Africa has become a target for investment and not a subject for aid”. This does not mean, however, that Africa no longer needs aid; the most recent statistics show that foreign aid amounts to $47.9 billion (2010), a figure comparable to the surplus of $48.4 billion
7. IMF (2012a) defines Burundi, Central African Republic, Comoros, Democratic Republic of the Congo, Cote d’Ivoire, Eritrea, Guinea, Guinea-Bissau, Liberia, Sao Tome and Principe, Togo and Zimbabwe as the Fragile States in sub-Saharan Africa.8. Growth rate of Côte d’Ivoire in 2011 was -4.7%.9. It is expected, however, to recover rapidly after 2012 due to improved political stability in Côte d’Ivoire.
27
Achieving Economic Transformation for Inclusive and Sustained Growth in Africa: Prospects and Challenges
(2010) in foreign direct investment, and $38.0 billion (2009) in remittances. (OECD et al. 2012, p.261, p.263 and p.281)
Figure 3. Change in foreign direct investment, emigrant remittances and foreign aid in Africa (2000 ~ 2012)
(OECD et al. 2012, p.41)
The fiscal balance continues to show a deficit both in oil-importing and oil-exporting countries because of their expanded public spending policy after the financial crisis in 2008. It is expected that while oil-producing countries will improve their fiscal balance (to about 2% of GDP) through the improvement in oil prices, non-oil-producing countries will continue to show a higher budget deficit (to about 5% of GDP) (OECD et al. 2012, pp.32-33). Although fiscal and monetary policies have been generally tightened, the budget deficit still continues. High inflation has been observed in Eastern Africa resulting from the expansion of government spending on infrastructure investment and soaring food prices in the “Horn of Africa”. The levels of budget deficits and borrowing are under control at the moment, but some non-oil-producing sub-Saharan countries depend on foreign aid to finance government spending and international balance payments. Overall, it continues to be a challenge for African countries to control and manage their budget deficits and public debt. (IMF 2012b, pp.11-13)
Foreign direct investments are focused mainly on energy and natural resource development. Investments in energy and natural resource sectors are focused on Western Africa (e.g., Nigeria, Ghana
28
Chapter 1
(development of new oil fields)), in Southern Africa (e.g., Angola), and in Central Africa (e.g., Democratic Republic of the Congo, Republic of the Congo), while investments in Northern Africa have dropped by 42% over the previous year ($9.48 billion in 2011) due to the political turmoil. However, there are signs of diversification in foreign direct investment,10 such as growing investments in the ICT sector since the 2000s, and strong investment in non- oil-producing countries like Morocco ($3.44 billion, 2011) (OECD et al. 2012, p. 44).11 Ernst & Young (2012) also suggests a growing share of manufacturing and service sectors in FDI into Africa12 as an important lead indicator of a broader process of economic diversification from dependence on natural resources and commodity prices.
1.3 Progress of economic reform Economic reform in African countries is progressing. Although the average CPIA13 score for 38 IDA-eligible countries in sub-Saharan Africa (= 3.2) is a bit lower than that of countries in other areas (= 3.4), the level of economic reforms in African countries, excluding fragile countries (=3.514), is mostly similar to that of developing countries in other areas (=3.615). The trend for improvement in CPIA scores in fragile countries is also remarkable16 and economic reforms in Africa as a whole are
10. Nishiura and Fukunishi (2008) reports the following six industries as major areas of foreign direct investment in Africa other than energy and mining: Automobile (South Africa), Horticulture (Kenya, Ethiopia, Zambia), Garment (Lesotho, Swaziland, Kenya, Madagascar), Aluminum (Mozambique), Retail Trading (South Africa, Zambia, Malawi), Mobile Phone. 11. Morocco was nominated as the “Top Investment Destination for 2012” by the Financial Times. (OECD et al. 2012, p.44). World Bank’s Doing Business 2012 introduced Morocco as the country that most improved its ranking (ranked 115 ⇒ 94) (World Bank 2012d, p.13).12. Ernst & Young (2012, pp.27-28) suggests the following key findings on the FDI into Africa during 2003-2011: i) The share of the FDI capital that has gone into the extractive sector is 27.6%, ii) Over 50% of the FDI projects have been in the service sector, iii) 70% of the FDI capital has gone into manufacturing and infrastructure sectors, iv) the manufacturing sector alone accounts for 40% of all new FDI-related job, v) 64% of the FDI capital invested in the manufacturing sector has gone into processing and beneficiation-type activities in the extractive sectors. 13. Country Policy and Institutional Assessment (CPIA) rates countries against a set of 16 criteria grouped in four clusters: (a) economic management, (b) structural policies, (c) policies for social inclusion and equity, (d) public sector management and institutions. 14. The average CPIA score of non-fragile countries (21 countries).15. The average CPIA score of non-fragile countries in other areas.16. When compared between 2009 and 2011, the number of countries that showed an improvement in CPIA scores was 8 out of 21 Non-Fragile States in 2009, and 10 out of 17 Fragile States in 2011.
29
Achieving Economic Transformation for Inclusive and Sustained Growth in Africa: Prospects and Challenges
progressing. (World Bank 2012c. p.5)
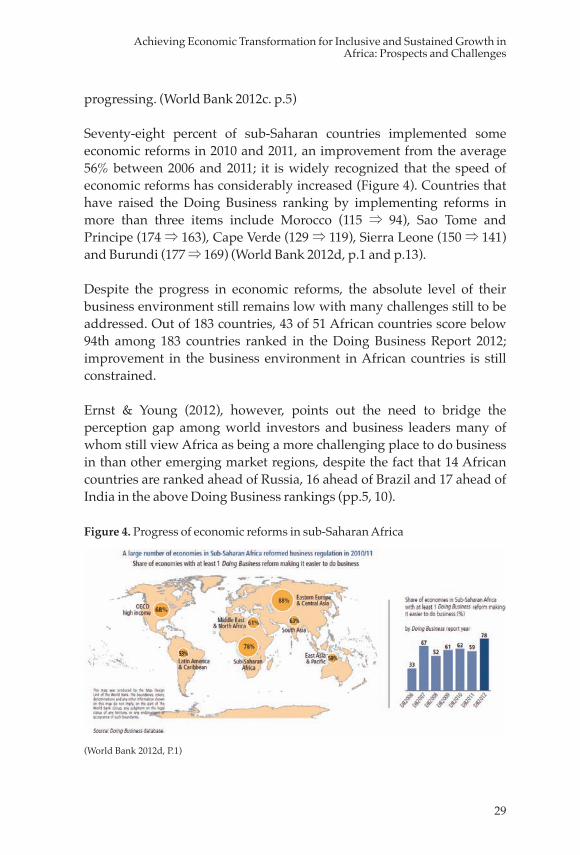
Seventy-eight percent of sub-Saharan countries implemented some economic reforms in 2010 and 2011, an improvement from the average 56% between 2006 and 2011; it is widely recognized that the speed of economic reforms has considerably increased (Figure 4). Countries that have raised the Doing Business ranking by implementing reforms in more than three items include Morocco (115 ⇒ 94), Sao Tome and Principe (174 ⇒ 163), Cape Verde (129 ⇒ 119), Sierra Leone (150 ⇒ 141) and Burundi (177 ⇒ 169) (World Bank 2012d, p.1 and p.13).
Despite the progress in economic reforms, the absolute level of their business environment still remains low with many challenges still to be addressed. Out of 183 countries, 43 of 51 African countries score below 94th among 183 countries ranked in the Doing Business Report 2012; improvement in the business environment in African countries is still constrained.
Ernst & Young (2012), however, points out the need to bridge the perception gap among world investors and business leaders many of whom still view Africa as being a more challenging place to do business in than other emerging market regions, despite the fact that 14 African countries are ranked ahead of Russia, 16 ahead of Brazil and 17 ahead of India in the above Doing Business rankings (pp.5, 10).
Figure 4. Progress of economic reforms in sub-Saharan Africa
(World Bank 2012d, P.1)

30
Chapter 1
1.4 Good governance and anti-corruptionUNECA (2009, p.1 and p.12) measures the progress on governance in Africa by using the benchmarks of the first edition of the Africa Governance Report in 2005. It concludes that economic management, pro-investment policies and efficiency of the tax system have made some notable progress; however, corruption has made no progress or a marginal decline of the corruption control index. This shows that corruption remains the most important challenge to the eradication of poverty, the creation of a predictable and favorable investment environment and in general, socio-economic development in Africa.UNECA and AU (2011, p.4) reports that the socio-economic and political cost of corruption in Africa was estimated at over $148 billion per year in 2004, which is equivalent to three times the amount of the current foreign direct investment into Africa in 2010, and that 50% of tax revenue, 25% of the continent’s GDP and that $30 billion in aid for Africa are eaten up by corruption. World business leaders raise corruption as the second most problematic factor for doing business in Africa, following lack of access to financing (WEF 2011, p.12). Out of all the 53 countries in the African continent except South Sudan, 48 countries17 are ranked below 50 in the Corruption Perception Index (CPI) 2012, which shows that public institutions need to be more transparent and powerful officials more accountable in these countries (Transparency International 2012).
Many experts suggest a variety of measures to combat corruption in Africa; however, their views are mixed, as follows:
➢ UNECA (2009, p.235) proposes three priority areas for African countries: 1) strong institutions including parliament, judiciary, office of auditor-general, public procurement system, anti-corruption bodies, etc., ii) powerful anti-corruption constituency with civil society and media, and iii) better remuneration for public servants to reduce petty and grand corruption undermining all the development and anti-corruption efforts.
➢ Hanson (2009, pp.5-6) of the US Council on Foreign Relations is suspicious about the effects on African governments brought by donor intervention in an anti-corruption context, while reserving evaluation on some anti-corruption practices such as Millennium Challenge Corporation (MCC), and Extractive Industries
17. Five countries ranked over 50 in the CPI 2012 are Botswana, Cape Verde, Mauritius, Rwanda, and Seychelles.
31
Achieving Economic Transformation for Inclusive and Sustained Growth in Africa: Prospects and Challenges
Transparency Initiatives (EITI). ➢ Global Integrity (2011) suggests that the “implementation gap” between progress in anti-corruption frameworks and results should be addressed more since the implementation gap in many countries, including those in Africa, is widening. It also notes that the establishment of an anti-corruption agency is relatively ineffective in strengthening transparency and accountability.
➢ Some academics are very pessimistic about combatting corruption; Collier (2007) raises “Bad Governance in a Small Country” as one of the four major Development Traps that African countries suffer from. Moyo (2009) insists on cutting off foreign aid which, she argues, has brought corruption rather than development to Africa.
Across these discussions, the following could be noted as a broad and minimum consensus on corruption in Africa: i) corruption is undoubtedly the most pressing governance and development challenge that Africa is confronted with today (UNECA and AU 2011, p.3), ii) the progress of anti-corruption is quite slow or making no progress (UNECA 2009, p.1), iii) effective measures and actions are urgently needed.
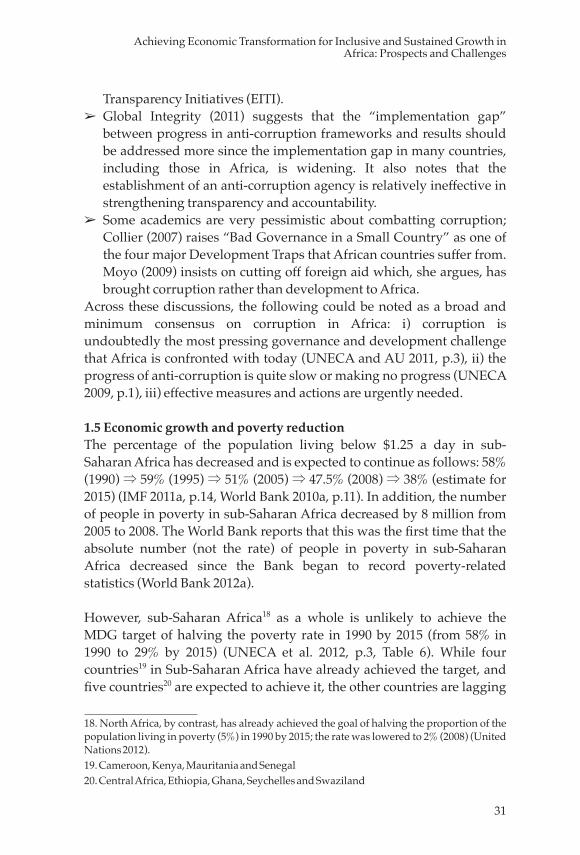
1.5 Economic growth and poverty reductionThe percentage of the population living below $1.25 a day in sub-Saharan Africa has decreased and is expected to continue as follows: 58% (1990) ⇒ 59% (1995) ⇒ 51% (2005) ⇒ 47.5% (2008) ⇒ 38% (estimate for 2015) (IMF 2011a, p.14, World Bank 2010a, p.11). In addition, the number of people in poverty in sub-Saharan Africa decreased by 8 million from 2005 to 2008. The World Bank reports that this was the first time that the absolute number (not the rate) of people in poverty in sub-Saharan Africa decreased since the Bank began to record poverty-related statistics (World Bank 2012a).
However, sub-Saharan Africa18 as a whole is unlikely to achieve the MDG target of halving the poverty rate in 1990 by 2015 (from 58% in 1990 to 29% by 2015) (UNECA et al. 2012, p.3, Table 6). While four countries19 in Sub-Saharan Africa have already achieved the target, and five countries20 are expected to achieve it, the other countries are lagging
18. North Africa, by contrast, has already achieved the goal of halving the proportion of the population living in poverty (5%) in 1990 by 2015; the rate was lowered to 2% (2008) (United Nations 2012).19. Cameroon, Kenya, Mauritania and Senegal20. Central Africa, Ethiopia, Ghana, Seychelles and Swaziland
32
Chapter 1
behind (World Bank 2010a).
Figure 5. Proportion of Population Living in Poverty in sub-Saharan Africa and other regions (1990-2008)
(UNECA et al. 2012 p.3)
IMF (2011a) suggests that in sub-Saharan Africa the relationship between per capita GDP growth and poverty reduction is weak, and that it is imperative to realize economic growth in such a way to further accelerate poverty reduction. IMF (2011a) also notes that in high-growth sub-Saharan countries,21 an increase by 1% in the growth rate corresponds to a decrease by about 1% in the poverty reduction rate, showing a clear relationship between economic growth and poverty reduction. And according to case studies on some of the high-growth sub-Saharan countries, job creation in the agricultural sector has a high impact on poverty reduction.
However, it is reported that no such relationship between economic growth and poverty reduction was observed in low-growth sub-Saharan countries.
When compared with Asia, the poverty reduction effect of economic
21. IMF (2011a) defines high-growth countries as countries with an average annual growth rate of real GDP per capita of over 2.25% during 1995 and 2010. Low-growth Sub-Saharan countries are those other than the high-growth countries.
33
Achieving Economic Transformation for Inclusive and Sustained Growth in Africa: Prospects and Challenges
growth is modest in sub-Saharan countries; in high-growth Asian countries, an increase by 1% in the growth rate corresponds to a decrease by 2.3% in the poverty reduction rate.
This shows that more efforts are required in Sub-Saharan Africa to make growth more inclusive and to enable more people to enjoy the fruits of growth.
1.6 Demographics, employment and urbanizationIt is expected that the population and working-age population will increase in the coming decades in Africa. As of 2008, the youth population (aged 15-24) and that of working-age people were 200 million and 550 million, respectively. The working-age population is increasing by 2.7% every year and is expected to reach 1.7 billion and overtake that of China and India by 2040 (OECD et al. 2012, p.99).22 In most African countries, unemployed youths account for 60% of all the unemployed, and the youth unemployment rate is double the adult unemployment rate (ibid. p.100). As 72% of youths have an income of less than $2 a day (ibid. pp.99-100), it is imperative to reduce poverty among youths through job creation. In addition to unemployment, underemployment and working poverty are also to be addressed as low-skilled and low-wage employment are so broad in Africa especially in the informal sector.
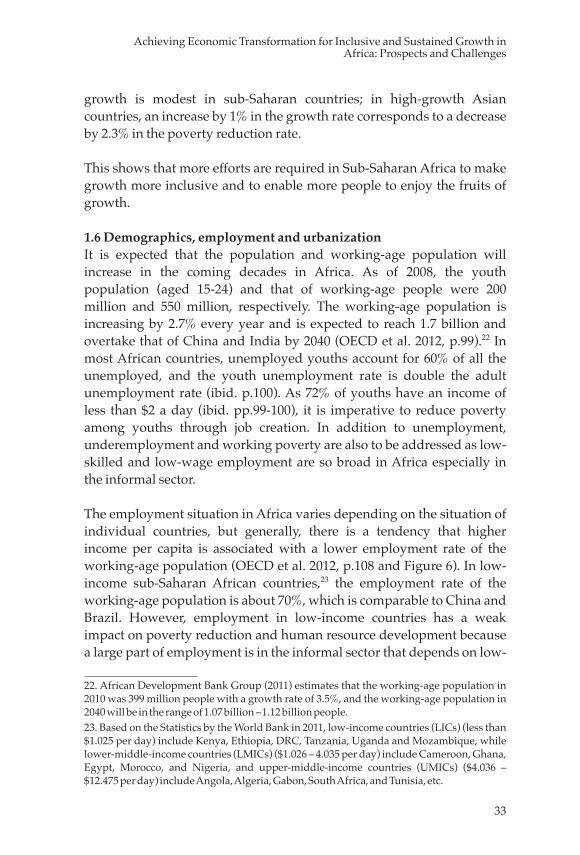
The employment situation in Africa varies depending on the situation of individual countries, but generally, there is a tendency that higher income per capita is associated with a lower employment rate of the working-age population (OECD et al. 2012, p.108 and Figure 6). In low-income sub-Saharan African countries,23 the employment rate of the working-age population is about 70%, which is comparable to China and Brazil. However, employment in low-income countries has a weak impact on poverty reduction and human resource development because a large part of employment is in the informal sector that depends on low-
22. African Development Bank Group (2011) estimates that the working-age population in 2010 was 399 million people with a growth rate of 3.5%, and the working-age population in 2040 will be in the range of 1.07 billion ~1.12 billion people.23. Based on the Statistics by the World Bank in 2011, low-income countries (LICs) (less than $1.025 per day) include Kenya, Ethiopia, DRC, Tanzania, Uganda and Mozambique, while lower-middle-income countries (LMICs) ($1.026 – 4.035 per day) include Cameroon, Ghana, Egypt, Morocco, and Nigeria, and upper-middle-income countries (UMICs) ($4.036 – $12.475 per day) include Angola, Algeria, Gabon, South Africa, and Tunisia, etc.
34
Chapter 1
skilled, low-wage labor. On the other hand, in middle-income sub-Saharan African countries,24 the employment rate of the working-age population is much lower, below 50%, and therefore, a quantitative improvement of employment is strongly needed rather than quality improvement. As the youth unemployment rate is quite high,25 it is imperative to promote youth employment for new entrants in the labor market. (OECD et al. 2012, p.100).
Figure 6. Comparison of the employment rate of the working-age population by country income groups in Africa and others
(OECD et al. 2012, P.108)
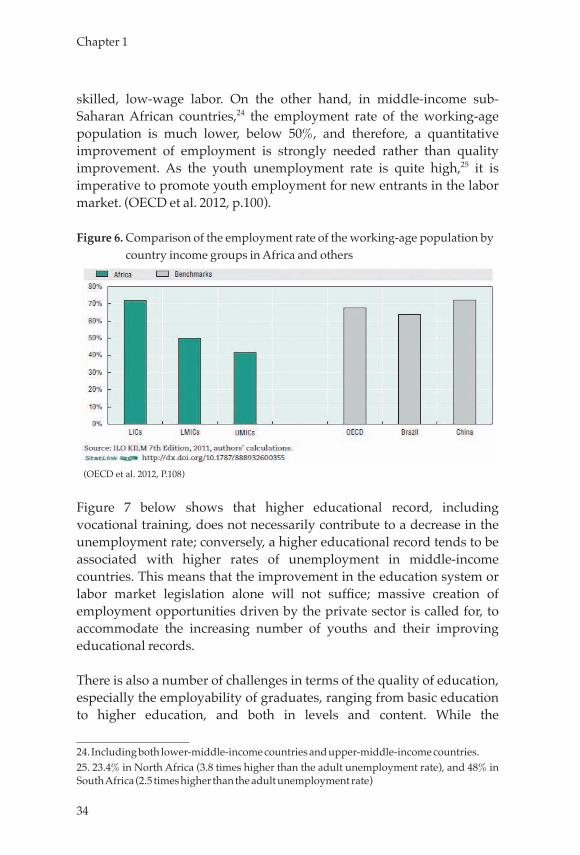
Figure 7 below shows that higher educational record, including vocational training, does not necessarily contribute to a decrease in the unemployment rate; conversely, a higher educational record tends to be associated with higher rates of unemployment in middle-income countries. This means that the improvement in the education system or labor market legislation alone will not suffice; massive creation of employment opportunities driven by the private sector is called for, to accommodate the increasing number of youths and their improving educational records.
There is also a number of challenges in terms of the quality of education, especially the employability of graduates, ranging from basic education to higher education, and both in levels and content. While the
24. Including both lower-middle-income countries and upper-middle-income countries.25. 23.4% in North Africa (3.8 times higher than the adult unemployment rate), and 48% in South Africa (2.5 times higher than the adult unemployment rate)
35
Achieving Economic Transformation for Inclusive and Sustained Growth in Africa: Prospects and Challenges
enrollment rate for primary and secondary education has been remarkably improved, the low quality of education, or a decline in quality in some countries, has been growing as a major challenge. It is reported that the average academic achievement of sixth-grade children in sub-Saharan Africa is at the same level as that of second-grade children in OECD countries.26 In addition to the lack of basic literacy and numeracy, the achievement test scores of students in some African countries have dropped when compared to those in the 1990s (MGI 2010, pp.20-21). Also pointed out is the lack of practical skills and knowledge in school education curriculum, as well as a mismatch between the educational content and employment needs (OECD et al. 2012, pp.141-144).
Figure 7. Comparison of the employment rate by education and country income groups in Africa
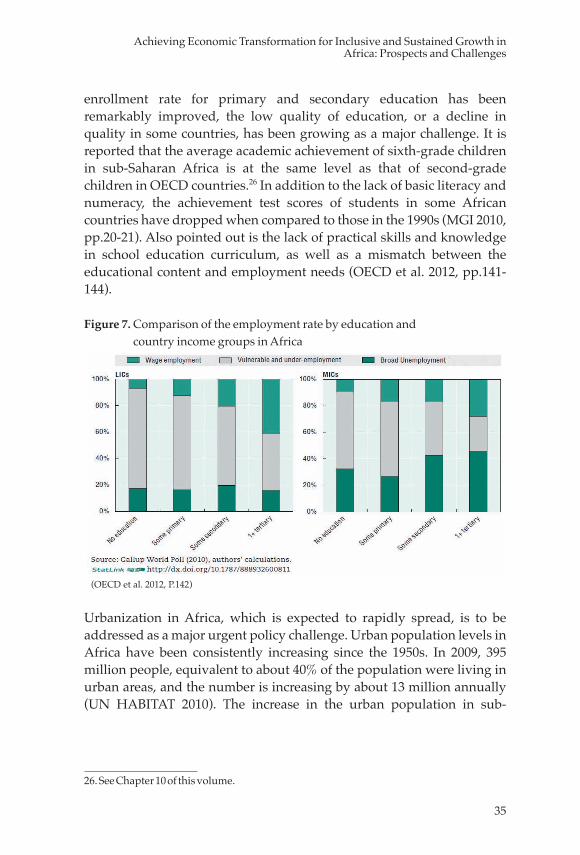
(OECD et al. 2012, P.142)
Urbanization in Africa, which is expected to rapidly spread, is to be addressed as a major urgent policy challenge. Urban population levels in Africa have been consistently increasing since the 1950s. In 2009, 395 million people, equivalent to about 40% of the population were living in urban areas, and the number is increasing by about 13 million annually (UN HABITAT 2010). The increase in the urban population in sub-
26. See Chapter 10 of this volume.
36
Chapter 1
Saharan Africa is consistent even during low growth periods,27 as shown in Figure 8. The insufficient government measures to address urbanization have been exacerbating difficulties such as urban poverty, prevalence of slums, and informalization of the urban economy, which are becoming more critical issues to be tackled by African governments and the international community.28
Figure 8. Urban demographics in Africa (1950-2050)
(UN HABITAT 2010 P.1)
The presence of the informal sector has been a buffer to absorb the increase in the urban population and working-age population. So far, however, the response of the international community and African countries to the increase of the informal sector has been insufficient. The dependence on the informal sector may deepen difficulties in urban areas, lead to the further expansion of low wages, low-skilled labor and vulnerable employees.
27. In Africa, from 1970 to 1995, GDP per capita fell by 0.7% annually, but the urban population increased by 4.7% annually. This is reported as “urbanization without economic growth” (Watanabe 2010). As will be mentioned in Chapter 2, although the cropland per capita of the agricultural population in Africa has been decreasing, the increase of the rural population cannot be absorbed in agriculture, resulting in the above continuous population shift to urban areas. In addition, though experts’ views are varied, it is also possible that modernization in agriculture could accelerate the increase in the urban population, since, as some argue, that the improvement in agricultural productivity produces a surplus in the agricultural labor force rather than an increase in employment in the non-agricultural sectors in rural areas (Ranis and Gollin 2012).28. In the case of Kenya, 60% of the urban population of Nairobi (3.36 million (2007)) live in slums and the informal sector accounts for 60% of overall employment in the country. The unemployment rate in the slums of Nairobi is 26% and that of youths (15-24 years) and women is even higher, reaching 49%; this situation is reported to have contributed to the riots after the presidential election in early 2008 (Watanabe 2010, p.137).
37
Achieving Economic Transformation for Inclusive and Sustained Growth in Africa: Prospects and Challenges
The creation of sufficient formal sector employment is an imperative for Africa in order to achieve sustained economic growth, reduce poverty, and develop and make use of human resources to support its future. Employment is to be created by improving the business environment, i.e., management of local small to medium-sized businesses, development of infrastructure (particularly, stable power supply), improvement of access to finance, promotion of capital investment, improvement of labor productivity, promotion of human resource development, and employment creation that can result in an increase in per capita income. (OECD et al. 2012, pp.135-140)
The informal sector, where most Africans work and will continue to work, plays an important role in poverty reduction and equitable growth. The World Bank (2011c, pp.9-14) argues that even rapid growth of the formal sector is unlikely to keep pace with the growing number of new entrants to the labor market since private wage employment in the formal sector has a very limited share in the labor market of low-income African countries.29 The cross country analysis (Figure 9) suggests that the ratio of household enterprise employment to total employment increases rapidly with growth of GDP per capita and surpasses the increase of wage employment, by absorbing employment shifting out of family farming, the most dominant type of employment in most low-income African countries. Against this background, World Bank (2011c) suggests that raising productivity and income in the informal sector, notably household enterprises,30 should be recognized as an important challenge of employment in low-income African countries.
29. In the case of Uganda in 2003-2006, although wage employment grew at 13% per annum, it only accounted for 20% of the new jobs created. In the case of Tanzania in 2000-2005, private wage employment grew at 11.2% per annum, which was surpassed by household enterprise employment growth at 12.9% per annum. 30. World Bank (2011c, p.14) also notes that more “formality” of household enterprise may not be the answer when the cost and benefits of more regulation are carefully considered. It also notes that legal regulations on household enterprises, as well as local taxes imposed on them, exist in many African countries.
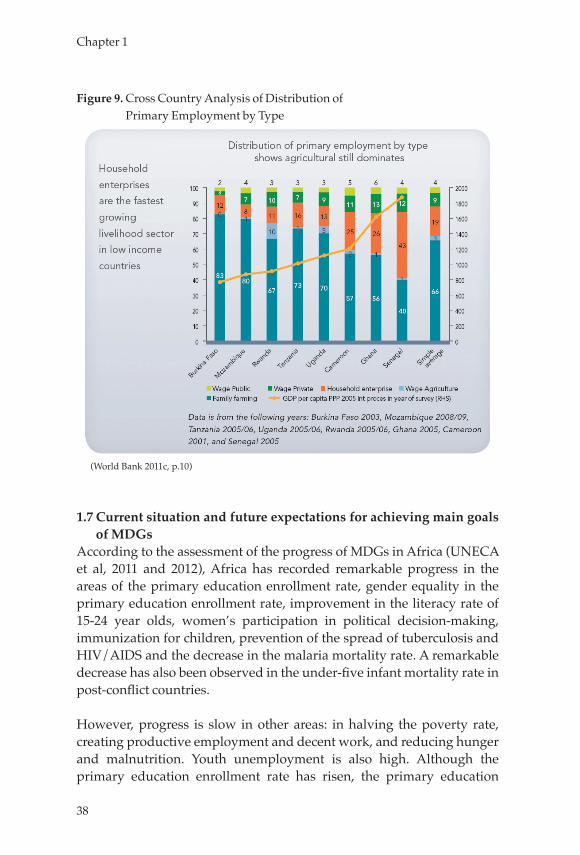
38
Chapter 1
Figure 9. Cross Country Analysis of Distribution of Primary Employment by Type
(World Bank 2011c, p.10)
1.7 Current situation and future expectations for achieving main goals of MDGs
According to the assessment of the progress of MDGs in Africa (UNECA et al, 2011 and 2012), Africa has recorded remarkable progress in the areas of the primary education enrollment rate, gender equality in the primary education enrollment rate, improvement in the literacy rate of 15-24 year olds, women’s participation in political decision-making, immunization for children, prevention of the spread of tuberculosis and HIV/AIDS and the decrease in the malaria mortality rate. A remarkable decrease has also been observed in the under-five infant mortality rate in post-conflict countries.
However, progress is slow in other areas: in halving the poverty rate, creating productive employment and decent work, and reducing hunger and malnutrition. Youth unemployment is also high. Although the primary education enrollment rate has risen, the primary education
39
Achieving Economic Transformation for Inclusive and Sustained Growth in Africa: Prospects and Challenges
completion rate has not risen enough to match the enrollment rate progress. The gender equality in secondary education and higher education is off track. Despite a substantial improvement, the access to safe drinking water target is unlikely to be achieved by 2015. The progress in improving access to sanitation is extremely slow.
The MDGs 2012 Progress Chart (United Nations 2012) shows that sub-Saharan Africa has only two goals that it is likely to achieve by 2015: “Equal girl’s enrollment in primary education” and “Halt and begin to reverse the spread of HIV/AIDS”. The other 14 goals are assessed as “Progress insufficient to reach the target if prevailing trends persist.” With respect to the “Reduce maternal mortality by three quarters,” though, the prospects are improving.31 In North Africa, 9 of the 16 goals are within the “Target already met or expected to be met”, but the “Halt and begin to reverse the spread of HIV/AIDS” is classified as “No progress or deterioration”.
As shown above, the progress of MDGs varies by goal and by country, and it is difficult to make sweeping statements about the development goals and policies for Africa beyond 2015. The following, however, are common and major challenges remaining in the post-2015 era:
➢ Acceleration of poverty-reducing policies or implementation of adequate policies (job creation, agriculture and rural development) toward inclusive growth.
➢ Initiatives to address the quality of education to upgrade and enhance the curriculum to meet society’s needs, while maintaining momentum toward the quantitative improvement toward universal basic education.
➢ Expansion of access to health services in the field of infectious disease control and maternal and child health, and further expansion of access to safe drinking water and sanitation facilities.
➢ Continuation of support for achieving MDGs beyond 2015 in countries which will not have achieved them, with diversification of programs and approaches to adapt to conditions of different countries and regions.
31. The progress on this goal was assessed as “No progress or deterioration” in Progress Chart 2011, while the assessment in the 2012 edition improved to “Progress insufficient to reach the target if prevailing trends persist.”
40
Chapter 1
1.8 Diversification of trade partners and the progress of intra-regional integration
Until the 1990s, the African economy used to be heavily dependent on the European market; however, since the 2000s, economic ties have been strengthened with emerging countries (particularly, China, India and Brazil). As a result, the trade with these emerging countries and intra-regional trade have come to account for 50% of exports and over 60% of imports (IMF 2011a, p.39).
Intra-regional trade has come to account for about 14% due to the development in intra-regional economic integration (ibid p.41). Advancements in this respect are facilitated by development of regional infrastructure, promotion of a customs union and common market by regional economic communities (RECs) and elimination of non-tariff barriers. The advancement of intra-region trade is making some African economies less vulnerable to external shocks. For example, EAC countries, which are more dependent on intra-regional trade and are diversified in terms of trade partners compared to countries in other sub-regions, are considered to be more resilient to external economic shocks than countries in other sub-regions; EAC countries experienced a relatively moderate slowdown of economic growth following the financial crisis in 2008, with their growth rate reaching 4.7% in 2009. (WEF et al. 2011, p.16-17)
Despite difficulties in data collection and analysis, informal cross border trade (ICBT) is also quite extensive within Africa. For example, in Uganda, informal exports in 2009 ($1.56 billion, all of which is for neighboring countries) were equivalent to formal exports ($1.57 billion, 44% of which is for neighboring countries) (WEF et al. 2011, p.17). Afrika and Ajumbo (2012) estimates that ICBT is a source of income for 43% of Africa’s population, and stands at $17.6 billion per year in the Southern African Development Community (SADC) region, accounting for 20% of GDP in Nigeria and 75% in Benin.
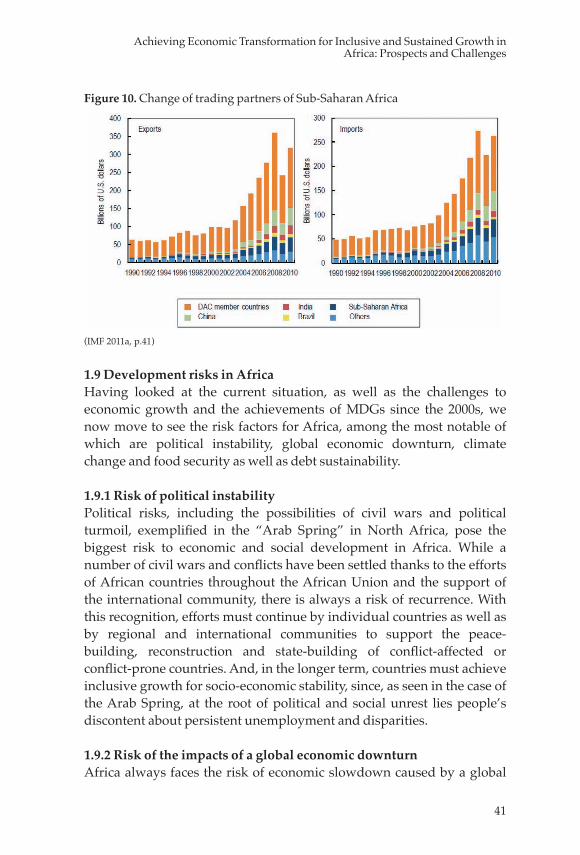
41
Achieving Economic Transformation for Inclusive and Sustained Growth in Africa: Prospects and Challenges
Figure 10. Change of trading partners of Sub-Saharan Africa
(IMF 2011a, p.41)
1.9 Development risks in AfricaHaving looked at the current situation, as well as the challenges to economic growth and the achievements of MDGs since the 2000s, we now move to see the risk factors for Africa, among the most notable of which are political instability, global economic downturn, climate change and food security as well as debt sustainability.
1.9.1 Risk of political instability Political risks, including the possibilities of civil wars and political turmoil, exemplified in the “Arab Spring” in North Africa, pose the biggest risk to economic and social development in Africa. While a number of civil wars and conflicts have been settled thanks to the efforts of African countries throughout the African Union and the support of the international community, there is always a risk of recurrence. With this recognition, efforts must continue by individual countries as well as by regional and international communities to support the peace-building, reconstruction and state-building of conflict-affected or conflict-prone countries. And, in the longer term, countries must achieve inclusive growth for socio-economic stability, since, as seen in the case of the Arab Spring, at the root of political and social unrest lies people’s discontent about persistent unemployment and disparities.
1.9.2 Risk of the impacts of a global economic downturnAfrica always faces the risk of economic slowdown caused by a global
42
Chapter 1
economic downturn such as the financial crisis in 2008, and the recent Euro crisis. Countries with close links to the global economy tend to be strongly affected by such external shocks. South Africa, for example, which has close economic ties with Europe, recorded a considerable slowdown in its growth rate following the financial crisis in 200832 and there is similar concern in countries in North Africa where export and tourism revenue strongly depends on Europe.33 Also, as we saw in the previous section, Africa is coming to have closer ties with emerging countries like China, India and Brazil. Any economic downturn in these economies will inevitably affect Africa’s economy.
1.9.3 Risk of climate change and food insecurityWhile Africa is the region with the least amount of GHG emissions, it is the region most vulnerable to climate change. The risk of climate change in Africa was widely recognized in COP17, which was held in Johannesburg in 2011, and owing to the drought in the Sahel region and the Horn of Africa during 2011-2012. At the Camp David Summit in May 2012, G8 and African Leaders agreed upon forming a New Alliance for Food Security and Nutrition in Africa.
UNFCCC (2007 pp.18-20) highlights some impacts of climate change in Africa on key sectors including: increasing risk of drought, flooding, and inundation due to sea-level rise in the coastal areas; increasing water scarcity and stress; loss of agricultural land and declining production of subsistence crops; increasing infectious diseases such as malaria, tuberculosis and diarrhea; malnutrition for both adults and children; loss of biodiversity; and damage to coastal infrastructure.
The annual cost of adaptation in Sub-Saharan Africa is estimated at $16.9-18.9 billion (2010-15),34 which is lower than those of East Asia and Pacific ($19.5-28.7 billion) and Latin America and the Caribbean ($16.8-22.5 billion); however, in terms of share of GDP, Sub-Saharan Africa
32. South Africa’s average growth rate was 4.9% during the 5-year period between 2004-2008. It dropped to -1.5% in 2009, and is expected to recover only to 3.0% in 2013. (IMF 2012a, p.76).33. OECD et al. (2012 p.33) reports that a 1% decline in the economic growth rate in OECD countries will cause a 0.5% decrease in economic growth in Africa and a 10% drop in export revenue in Africa.34. In sector analysis, water supply and flood protection ($6.2-6.6 billion), coastal zone ($4.0 billion) and agriculture ($3.3 billion) are the important sectors in Sub-Saharan Africa. The cost of infrastructure is forecast to increase significantly from $1.1 billion (2010-19) to $6.0 billion (2040-49).
43
Achieving Economic Transformation for Inclusive and Sustained Growth in Africa: Prospects and Challenges
(0.70%) is much higher those of East Asia and Pacific (0.20%) and Latin America and Caribbean (0.30%) (World Bank (2010b)).35
The Copenhagen Accord, which was agreed in COP15 in December 2009, recognizes Africa as the most vulnerable developing region for which enhanced action and international cooperation on adaptation is urgently required, and also funding for adaptation will be prioritized in the future climate change financing mechanism, which aims at mobilizing $100 billion per year by 2020 (para 3, 8). The High-Level Advisory Group on Climate Change Financing (2010), established by the UN Secretary-General in February 2010, also suggests that grants and highly concessional loans are crucial for adaptation in the most vulnerable countries including those in Africa (pp.5, 10). Against this background, the African Development Bank Group (2011) proposes to establish the African Green Fund to complement existing instruments and enhance the ability of African countries to respond to Climate Finance challenges.
Africa has the potential for mitigating the negative impact of climate change. It is endowed with a variety of abundant natural renewable energy resources such as hydro, geothermal, solar and wind power, though much of this potential remains to be developed. Climate change mitigation will increasingly be a challenge for the continent, for it will have to expand its energy production to meet the continent’s ever-increasing demand coming from growing economies and increasing populations.
Africa could improve its energy efficiency by taking such measures as the development of renewable energies, installation of high-efficiency natural gas and coal-fired power plants, and reduction of power-transmission loss. Outside the power sector, Africa can also contribute to the mitigation of climate change by conserving the tropical rainforests of the Congo Basin and in other areas, and by developing energy-efficient urban transportation networks.
1.9.4 Debt sustainability Sub-Saharan countries are employing cautious debt management policies, and debt sustainability has continuously improved. The ratio of
35. World Bank (2010b pp.1, 13) also notes that flexible policies and more research are needed due to the imprecision of existing studies and models providing a wide range of estimates.
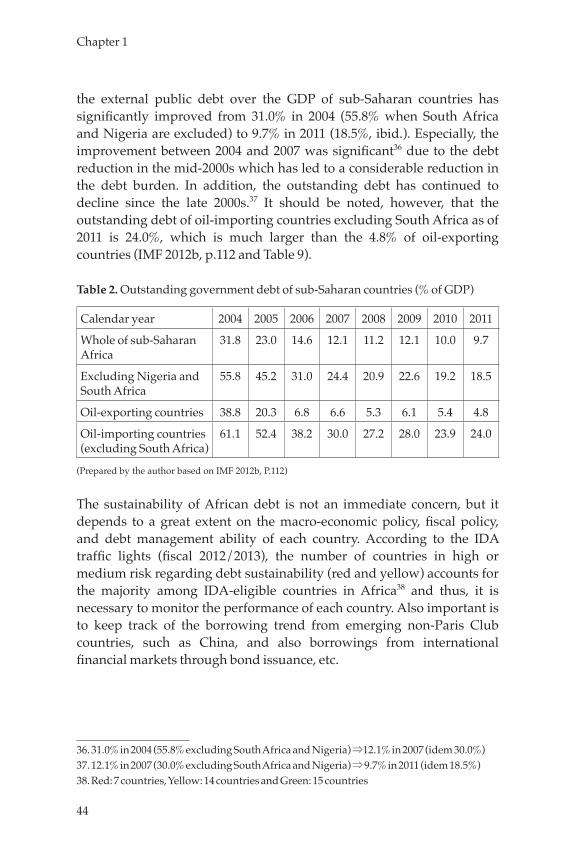
44
Chapter 1
the external public debt over the GDP of sub-Saharan countries has significantly improved from 31.0% in 2004 (55.8% when South Africa and Nigeria are excluded) to 9.7% in 2011 (18.5%, ibid.). Especially, the improvement between 2004 and 2007 was significant36 due to the debt reduction in the mid-2000s which has led to a considerable reduction in the debt burden. In addition, the outstanding debt has continued to decline since the late 2000s.37 It should be noted, however, that the outstanding debt of oil-importing countries excluding South Africa as of 2011 is 24.0%, which is much larger than the 4.8% of oil-exporting countries (IMF 2012b, p.112 and Table 9).
Table 2. Outstanding government debt of sub-Saharan countries (% of GDP)
Calendar year 2004 2005 2006 2007 2008 2009 2010 2011
Whole of sub-Saharan Africa
31.8 23.0 14.6 12.1 11.2 12.1 10.0 9.7
Excluding Nigeria and South Africa
55.8 45.2 31.0 24.4 20.9 22.6 19.2 18.5
Oil-exporting countries 38.8 20.3 6.8 6.6 5.3 6.1 5.4 4.8
Oil-importing countries (excluding South Africa)
61.1 52.4 38.2 30.0 27.2 28.0 23.9 24.0
(Prepared by the author based on IMF 2012b, P.112)
The sustainability of African debt is not an immediate concern, but it depends to a great extent on the macro-economic policy, fiscal policy, and debt management ability of each country. According to the IDA traffic lights (fiscal 2012/2013), the number of countries in high or medium risk regarding debt sustainability (red and yellow) accounts for the majority among IDA-eligible countries in Africa38 and thus, it is necessary to monitor the performance of each country. Also important is to keep track of the borrowing trend from emerging non-Paris Club countries, such as China, and also borrowings from international financial markets through bond issuance, etc.
36. 31.0% in 2004 (55.8% excluding South Africa and Nigeria) ⇒12.1% in 2007 (idem 30.0%)37. 12.1% in 2007 (30.0% excluding South Africa and Nigeria) ⇒ 9.7% in 2011 (idem 18.5%)38. Red: 7 countries, Yellow: 14 countries and Green: 15 countries
45
Achieving Economic Transformation for Inclusive and Sustained Growth in Africa: Prospects and Challenges
2. Toward the Structural Transformation of African Economies and the Achievement of Inclusive and Sustained Growth
2.1 Medium to long-term prospects of African economies Since the 2000s, while maintaining economic growth primarily led by the export of energy and mineral resources, Africa has also diversified trading partners and regions, deepened intra-continent regional economic integration, expanded the internal market, increased middle class consumers, and improved fiscal and monetary policies as well as debt management. These structural changes seem to have made the African economy more resilient to external shocks, such as sharp declines in energy and resource prices.39 Based on the assumption that the current economic growth will continue, the African Development Bank Group (2011a) envisions the African economy and society in the year 2040 as follows:40
➢ Assuming an economic growth rate of 4.9% to 5.5%, its GDP will grow from $1.7 trillion in 2010 to $5.9 trillion in 2040, while the GDP per capita will grow from $1,667 in 2010 to $3,733 in 2040, reaching the range between today’s Indonesia ($2,974) and China ($4,328).
➢ The population growth rate will drop from 2.27% in 2010 to 1.37% in 2040, but the total population will increase from 1.03 billion in 2010 to 1.59 billion in 2040, which will exceed the prospective population of both China and India in 2040 (estimated to be around 1.5 billion).
➢ The working-age population (aged 15-64) will increase from 400 million in 2010 to 1.07 billion in 2040, and the ratio of the working-age population over the total population will increase from 40% (2010) to 67% (2040). This is comparable to the current rate of the working-age population of Asian countries which are thought to enjoy a demographic dividend (JICA 2008, p.26).
➢ The number of middle class people41 whose daily income ranges from $4 to $20 (equivalent to an annual income of $1,460 to $7,300)
39. IMF (2011a p.7) remarks “the region’s recent sustained strong growth represents a sharp break with the past, when the region lagged far behind other parts of the developing world.”40. The forecast is a 50-year forecast until 2060. Here, we are presenting the estimate in 2040. There are 2 types of simulations, i.e., High-Case Scenario and Low-Case Scenario and the following is all based on Low-Case Scenario.41. Mckinsey Global Institute defines the middle class in a more precise manner: as a household with an annual income of more than $5,000, which is a threshold where expenditure other than the necessities of daily life such as food increases, and forecasts that the number of middle class households will increase from 85 million in 2010 to 128 million in 2020 (MGI 2010, pp.3-4).
46
Chapter 1
will increase from 360 million in 2010 to 620 million in 2040; and the ratio of middle class people over the total population will increase from 34% (2010) to 38% (2040). However, the percentage of the population with daily income of less than $1.25 will only decrease from 44.15% in 2010 to 37.77% in 2040; if this forecast comes true, the poverty reduction target of MDGs (to halve the poverty population rate of 1990 (58%) to (29%) in 2015) will not be achieved even in 2040 (African Development Bank Group 2011a, p.70).42
2.2 Prospects for the transformation of African economiesAs shown above, even with the assumption of 30-year, continuous economic growth of 5%, in 2040, as much as 37.77% of the total population in Africa will still be living on a daily income of less than $1.25. Given this kind of gloomy prediction on the one hand, and the brighter-looking forecast of GDP per capita close to $4,000 on the other, it will be critically important for the African economy to realize “sustained growth” and “inclusive growth,” which will allow the broader population as well as the poor and vulnerable to enjoy the fruits of economic growth in the next few decades.
In order to make such economic development a reality, Africa needs to realize the following:
➢ Transformation from an economy dependent on energy and mineral resources into an economy led by new leading sectors such as i) agricultural sector revitalized through agricultural productivity improvement resulting in increased agricultural production and growth of agro-industries and agro-business, ii) labor-intensive manufacturing industries, especially local industries that respond to increasing demand from the emerging middle class consumers and regionally integrated market, and iii) modernized and private-sector-led service sector combined with highly educated human capital, innovative technology and better quality of service delivery.
➢ Provision of employment for a rapidly growing, working-age
42. The African Development Bank Group states that it is necessary to achieve economic growth of over 7% on average in order to produce rapid poverty reduction. In this redar (note: what does ‘redar’?), the growth rate of this forecast is insufficient (African Development Bank Group 2011, p.12).
47
Achieving Economic Transformation for Inclusive and Sustained Growth in Africa: Prospects and Challenges
population, especially for youths, through fostering of the manufacturing and service sectors.
➢ Equitable income distribution: through job creation, and increase in per capita income through improving labor productivity and agricultural productivity. This must be accompanied by the development and effective use of human capital and the strengthening of social services and a social safety net for the poor and vulnerable.
➢ Infrastructure development: to support increasing demand for transport, energy and water driven by long-term economic growth, population growth and improvement in living standards. The necessary amount of investment is to be mobilized to fulfill the estimated funding gap of $40 to $50 billion per annum (World Bank 2008).
In the following sections, the term “transformation” is used to mean a change in economic structure, which, as described above, will simultaneously bring about the shift from the dependence on energy and mineral resources through the diversification of growth sectors and trading partners (hereafter termed as “sustained growth”), and the enjoyment of the fruits of growth by a broader population through employment and social services (hereafter termed as “inclusive growth”).43
We will now discuss the diversification of sources of wealth (i.e., agriculture, manufacturing and service sector) in sections 2.2.1 through 2.2.3, and the investment in human capital and its use (i.e., education, employment and labor productivity) in section 2.2.4.
2.2.1 Potential of African agricultureUnlike agriculture in Asia and Latin America, African agriculture has not gone through the transition process to modern agriculture and adoption of agricultural technology through the Green Revolution, and agricultural land productivity improvement has been stagnant. The increase in food demand due to population growth has been met so far by the expansion of cultivated land and increased food imports. As
43. IMF (2012a), based on the definition that the Structural Transformation is the shift of workers from low to high average productivity activities and sectors, P.51), analyzes the structural transformation of sub-Saharan Africa by taking the labor mobility between sectors as the main indicator. IMF (2012a) also indicates some good examples of structural transformation such as: Burkina Faso (agriculture), Tanzania (manufacturing), Namibia (manufacturing), Mauritius (service industry) and Kenya (service industry) (idem, P67-71).
48
Chapter 1
African governments have not tended to prioritize agricultural modernization since their independence, farmers have returned to stable cultivation of subsistence crops since the economic slump in the 1970s (Hirano 2009, pp.109-102), and the cropland per capita of the agricultural population decreased by 40% between 1960 and 2003. However, as agriculture is still the main sector in Africa, accounting for 32% of the GDP, it is critical to improve productivity through the introduction of modern agricultural technology for achieving sustained growth in the African economy.44
MGI (2010) estimates that, with 60% (590 million ha) of the world’s uncultivated arable farmland (970 million ha in total),45 Africa has the potential to increase its current agricultural production from $280 billion (2010) to $500-880 billion in 2030, through enhancing agricultural land development, increasing agricultural productivity and transitioning to high-value-added crops. The Coalition for African Rice Development (CARD),46 which aims at doubling rice production in sub-Saharan Africa from 14 million tons in 2008 to 28 million tons by 2018, shows good progress toward the achievement of the above goal with the production of 18.4 million tons in 2010.47
In recent years, investment in agriculture by the private sector is growing, which has the potential to bring productivity improvement, new technology, agricultural land expansion, supply chain and value chain development, etc., resulting in comprehensive development of agricultural production and creation of added-value. One example of efforts to take advantage of private sector investment is a regional development program in Mozambique supported by the Japanese government (JICA) to promote agriculture in the Nacala Corridor in the north of the country. In a similar context, the G8 Summit held in Camp David in May 2012 announced a joint action plan, “New Alliance for Food Security and Nutrition”, backed by G8 and African countries for
44. See also Hirano (2013), pp.123-127, Takahashi (2010), pp.145-203, and chapters 2 and 3 of this volume.45. Sudan (72 million ha), Democratic Republic of Congo (66 million ha), Angola (53 million ha), Zambia (53 million ha), Mozambique (49 million ha), Central African Republic (45 million ha), etc. (MGI 2010).46. Joint initiative of 23 African countries and 11 institutions centered on JICA and AGRA (Alliance for a Green Revolution in Africa) a private organization formed by African farming experts, following TICAD IV Yokohama Action Plan for doubling rice production in 10 years.47. For more detailed discussions on the CARD initiative, see chapters 2 and 3.
49
Achieving Economic Transformation for Inclusive and Sustained Growth in Africa: Prospects and Challenges
the purpose of promoting private investment in African agriculture and dissemination of agricultural technology.
On the other hand, large farmland acquisition by the private sector may cause conflicts over land and water resources with local populations and farmers. To prevent such risks, a framework for the protection of the rights of local populations and farmers is needed to create an environment benefitting both private investors and local populations and farmers.48 Government should play an important role in creating such investment climate, in addition to its traditional roles such as in the provision of economic and technical assistance to local farmers and in agricultural technology development and dissemination.
Agriculture can boost the African economy. Despite the low performance of exports (cocoa, coffee, and tea) since the 1990s,49 encouraging cases are emerging in export promotion through developing new products with new technology, such as horticultural products in Eastern and Southern African countries. Also encouraging is the expansion of the intra-African market50 due to economic growth; this can bring a huge business opportunity for exports within the continent. The expansion of agricultural production could boost the development of the agro-industry and agro-business such as agro-processing, food processing, distribution, transportation, and finance, leading to rural employment and improvement of the livelihood of the non-farming population, which accounts for half of the total population in rural areas. It could also lead to foreign currency savings through reducing food
48. As an example of such an initiative, a set of Principles for Responsible Agricultural Investment (PRAI) was proposed by the Japanese government and adopted at L’Aquila G8 Summit in April 2009.49. The share of agricultural exports from Sub-Saharan Africa in world agricultural trade decreased from 5.4% (1995-97) to 2.7% (2006-08). Such sluggish development may be attributable not only to the stagnation of agricultural productivity, but also to high indirect costs such as transportation costs, underdeveloped infrastructure and business environment (WEF et al. 2011, pp.18-19).50. For example, MGI (2010) reports that food products and beverages markets are expected to grow from $369 billion in 2008 to $544 billion in 2020 (p.39). CAADP Pillar II Experts Reference Group (2009) notes that demand in local and regional urban food markets across Africa is expected to increase from US$50 billion to US$150 billion in 2000-2030, while foreign demand for agricultural commodities and high-value exports is projected to grow from US$11 billion to US$20 billion in the same period (p.21).
50
Chapter 1
imports, which exceed that of Japan.51
African agriculture has significant potential but faces various development challenges. To summarize, it should be remembered that the vision of the original Comprehensive Africa Agriculture Development Programme (CAADP) in 200352 remains relevant to the current major challenges of African agriculture. It is also to be noted that the market-oriented approach and the small-scale farmers’ approach, which are discussed in the following chapters 4 and 5, respectively, are both to be addressed in a balanced and integrated manner as described in the original CAADP.
2.2.2 Potential of African manufacturing industry Manufacturing is important for the African economy due to the following reasons: for the diversification of its economy, reduction of external vulnerability, job creation for the working-age population (especially for youths), improvement in the trade balance, notably for non-oil-producing countries with trade deficits, etc. The potential for manufacturing in Africa stems mostly from the prospective market expansion due to economic growth, increasing population, growing middle class consumers, increasing working-age population and effect of the future demographic dividend.53 The MGI (2010) states that the consumption markets within Africa have already reached $860 billion (2008), which are equivalent to those of India and Russia. It also estimates that they will grow to $1.38 trillion in 2020, and the number of middle class households with an annual income of over $5,000 is expected to increase from 85 million in 2008 to 128 million in 202054
51. According to FAO data, agricultural exports from Africa amount to $34.2 billion (2009), agricultural imports to Africa amount to $53.2 billion (2009), and with a deficit amounting to $19.0 billion. Agricultural imports exceed that of Japan ($35.7 billion). 45% of rice and 85% of wheat consumed in Africa are imported in 2009 (WEF et al. 2011, p.19).52. The vision for agriculture is that the continent should, by 2015: attain food security (in terms of both availability and affordability and ensuring access of the poor to adequate food and nutrition); improve the productivity of agriculture to attain an average annual growth rate of 6%, with particular attention to small-scale farmers; especially focusing on women, have dynamic agricultural markets between nations and regions; have integrated farmers into the market economy; including better access to markets, with Africa to become a net exporter of agricultural products, achieve the more equitable distribution of wealth; be a strategic player in agricultural science and technology development; and practice environmentally sound production methods. (NEPAD 2003 p.9)53. Please see MGI (2010), IMF (2011b)54. IMF (2011b) also features an article on the expansion of the internal market and the middle class in Africa.
51
Achieving Economic Transformation for Inclusive and Sustained Growth in Africa: Prospects and Challenges
(ibid).
In fact, in recent years, manufacturing exports in Africa are increasing to neighboring countries in the continent. For example, the value of exports of eight African countries55 increased from $1.5 billion in 2000 to $10 billion in 2008, and the proportion of manufactured exports in total exports increased as follows: Kenya: 21% (2000) → 37% (2008), Uganda: 6% (2000) → 30% (2008), and Senegal: 27% (2000) → 30% (2008). The main export items are processed fuels, food, chemical products, clothing and cosmetics (MGI 2010).
However, manufacturing in Africa has not emerged from the 1980s slump and it accounts for less than 10% of GDP in many African countries.56 In terms of the share of world exports for developing countries and regions, East Asia showed rapid growth of 3.3% (1980) ⇒ 8% (1995) ⇒ 14% (2008), and other regions are also generally in the process of expansion. By contrast, Africa has experienced a modest expansion of 1.3% (1990s)⇒1.6% (2000s) and moreover, it is due mainly to the export of primary products (WEF et al. 2011, pp.3-4). The share of industrial products of sub-Saharan countries in world trade is declining, where light industrial products showed a decline of 1.2% (1980) ⇒ 0.9% (2008) and heavy industrial products showed a marginal increase of 0.3% (1995-97) ⇒ 0.4% (2000-2008) (WEF et al. 2011, p.15-20).
The slump in manufacturing in Africa is attributed to various factors: underdeveloped infrastructure (especially, power and transportation), inadequate business environment, relatively high labor cost (excluding the informal sector), low education, health and sanitation levels, insufficient financial access, high socio-political risks, and so on. It is important to comprehensively address these issues; particularly in sub-Saharan countries, high indirect costs due to the underdevelopment of infrastructure, business environment and financial systems are reported to be the main causes of high manufacturing costs, although the issue of human capital such as insufficient education and relatively high labor costs are also raised. (WEF et al. 2011, p.12, OECD et al. 2012, p.21)
55. Cameroon, Côte d’Ivoire, Ghana, Kenya, Mozambique, Senegal, Tanzania, Uganda, Zambia56. In the following 11 countries, the manufacturing industry accounts for 15-20% of GDP: Cameroon, Côte d’Ivoire, Egypt, Lesotho, Madagascar, Mauritius, Morocco, Namibia, South Africa, Tunisia and Zimbabwe. (OECD et al. 2012).
52
Chapter 1
In 1980s’ Asia, having overcome these constraints (except labor costs), economic growth through the development of labor-intensive industry, poverty reduction through job creation and increases in per capita labor productivity and income were achieved simultaneously. The Asian experience in development provides rich experience and lessons to be referred to for African development. Africa may take advantage of the increasing working-age population and improving education levels, while addressing issues such as high cost in manufacturing, service reliability in logistics and energy supply. Consistent investment is needed in infrastructure and human resource development and in creating an enabling business environment to meet the needs of industry. However, Africa now finds itself in a quite different environment from what it was in the 1980s and 1990s, when Asia began to rapidly grow. Today, as low-wage, labor-intensive export industries have developed nearly all over the world except Africa, Africa has some disadvantages in the international business environment for promoting labor-intensive industries.57 As Noman and Stiglitz (2012) states, there is no policy package that fits all countries, so adopting one specific development strategy in Africa, such as low-wage, labor-intensive export industrial development, is to be avoided.58 While the Asian experience might be a useful reference, African countries must be flexible and selective in policy formulation to fully take advantage of their respective comparative advantage and resource endowments, such as the availability of raw materials and the level of local labor costs.
2.2.3 Potential of the service sector in Africa (Trade, transportation, telecommunications, finance)
The service sector’s59 share of total GDP in Africa has increased from 44.4% in 1980 to 53.1% in 2009. (World Bank 2011a). This is in sharp contrast to other sectors: the share of agriculture, forestry and fisheries60 in total GDP in Africa has decreased from 17.2% in 1980 to 13.1% in 2009,
57. IMF (2012a) p.62-6358. Noman and Stiglitz (2012) p.4059. Including wholesale and retail trade (including hotels and restaurants), transport, and government, financial, professional, and personal services, such as education, health care, real estate, and all other branches of economic activities that are not included in agriculture, forestry and fisheries and industry sectors (World Bank 2011a, p.136).60. Including forestry, hunting, and fishing, as well as crop cultivation and livestock production. (World Bank 2011a, p.135)
53
Achieving Economic Transformation for Inclusive and Sustained Growth in Africa: Prospects and Challenges
and that of the industrial sectors61 likewise has decreased from 38.4% to 33.8%, and the manufacturing sector from 10.7% in the 1980s to 8.5% in the 2000s (ibid).
While the service sector’s increasing share in GDP is helped by the relative slump in other sectors, the sector is expanding thanks to growing private sector participation facilitated by deregulation and cost reduction through technology innovation. A typical example is the mobile phone service, which is expanding rapidly, as the telecommunications sector is a “high growth sector” comparable to energy and resource sectors. Demand in the trade and transport sectors is also expanding, presumably due to the increase in logistics caused by economic growth, rapid increase in final consumption expenditure62 and the expansion of the intra-African market.
IMF (2012a) refers to Kenya as a good example of the development of the service sector. In Kenya, the contribution of the service sector to GDP was strong, ranging between 2 and 5% in 2005-2011, while that of agriculture and manufacturing stagnated, with less than 2% or negative growth rates. This was made possible by, along with the country’s relatively high education standards, the increasing demand for transport, telecommunications and financial services against the backdrop of Eastern African regional integration and strong ICT service exports; ICT accounted for over 10% of the service exports of the country during 2007-2011.
Within the service sector, lagging behind is the financial sector, except in South Africa, Mauritius,Tunisia,Morocco,Cape Verde,Namibia, Nigeria, Egypt, and Kenya;63 the importance of developing the financial sector in Africa is to be emphasized for the mobilization of domestic capital for investment, particularly in view of a substantial expansion in national savings that is expected to occur thanks to the demographic
61. Including mining, manufacturing, construction, electricity, gas, and water (World Bank 2011a, p.136).62. Final consumption expenditure per capita in Africa increased as follows (US dollars: nominal): 541 (1980s) ⇒ 586 (1990s) and ⇒756 (2000s), in particular it soared in the late 2000s (600 (2003) ⇒ 1,082 (2009)). This trend is seen both in Sub-Saharan countries (487 (2003) ⇒ 864 (2009)) and in North Africa (1,179 (2003) ⇒ 2,240 (2009)). (World Bank 2011a)63. In these countries, the ratio of domestic credit to private sector to GDP, a proxy of financial market development, exceeded 30% in 2009 (World Bank 2011a p.65).
54
Chapter 1
dividend in the coming decades.64
Transformation of the service sector will have far-reaching impacts on other sectors: it will not only help facilitate the modernization of traditional services through encouraging technological innovation and market integration and deregulation, but it will also improve productivity, strengthen competitiveness and encourage investment and reduce costs in agricultural and industrial sectors. To make this happen, however, African countries need to enhance the supply of highly skilled human capital through higher education in science and engineering. They also need to take measures to address the sector’s current over-dependence on the informal sector65, which contributes little to human resource development.
2.2.4 Investment in human capital (education, employment, labor productivity)66
Africa needs to develop education not only in quantity but also – and more importantly – in quality. Quantity-wise, many African countries have made substantial strides in basic education; many have introduced a policy of free primary education since the 1990s, resulting in the improved net enrollment rates in primary and secondary education rising from 58% (1999) to 76% (2009), and from 19% (1999) to 29% (2009), respectively. Quality-wise, however, much remains to be done, for the academic performance of children is still quite low in Africa. This needs to be urgently addressed given the plausible correlation between the rate of economic growth of a country and academic achievement of school children.67
Higher education and vocational technical education in Africa are undergoing rapid development. However, here again, a lot of challenges still remain; they include: the improvement of the basic quality of education and research, securing employment of graduates (refer to Figure 7 in Section 1.6), and the issue of the ‘brain drain’. Added to these is the need to satisfy the changing and growing demand for highly
64. Currently, the national savings rate is around 15% over the GDP.65. According to Watanabe (2010), the informal service sector accounted for 34% of employment in Nairobi in 2002 and the formal service sector 4%. The informal sector accounts for nearly 90% of employment for the whole of the service sector, including formal and informal sectors.66. For discussions on physical infrastructure development, see Chapter 7 of this volume. 67. See Chapter 10 of this volume.
55
Achieving Economic Transformation for Inclusive and Sustained Growth in Africa: Prospects and Challenges
skilled labor from the newly growing service sector including ICT, and to cope with the needs of the globalizing environment. The current system of higher education and vocational training, including the stock of teaching faculties, seems incapable of satisfying these changing demands of society, and needs to be systematically reviewed and improved upon.
There are indeed mounting expectations and needs for improved human resources in Africa on the one hand and, on the other, there has been a steady improvement in the supply of better-educated human resources. Under these circumstances, the most critical issue is to provide sufficient employment to young people who possess improved academic capabilities. This is becoming a huge challenge both in low- and middle-income countries. Low-income countries, where the informal sector accounts for the majority of employment, are often unable to provide appropriate job opportunities that are on a par with the skill levels of better-educated youths; the informal sector is also weak in providing the workers with opportunities to further upgrade their skills. In middle-income countries, by contrast, unemployment of highly educated youths is a serious problem, resulting from the mismatch between the needs of industry and the qualifications of graduates coming from higher education and vocational/technical education. (See Figure 7 in Section 1.6).
These immense challenges appear to require comprehensive approaches that look simultaneously at the supply and demand sides of human resources, for the above-mentioned puzzle can be solved only by the coordination of investment in human capital (education) and its effective use (employment). World Bank (2012e) cites an example of a comprehensive promotion program of employment and labor productivity in Ethiopia; it reports that policies that address the labor market (like deregulation and vocational training), private sector productivity (like company managers’ training), and the industry as a whole (like industrial promotion measures) are called for.
Also encouraging might be to look at the effects of various human capital development measures on the academic ability and employability of children and youth. Such measures include, for example, promotion of pre-primary education, incentivizing of parents to educate children (e.g., conditional cash transfers, meal provision
56
Chapter 1
schemes, and scholarships), childhood nutrition and health support (e.g., parasite control), and prevention of sexually transmitted infections (e.g., provision of contraceptives and promotion of family planning). The effectiveness of these interventions on education and employment are being clarified with massive empirical studies, providing useful insights on policy.68 Policy debate on human resource development and employment may have a lot to gain from learning from the achievements of such studies.
3. African Development beyond TICAD V: Toward a Differentiated and Customized Approach for Development
The approach based on intra-regional integration responding to geographical proximity and common interests of neighboring African countries has been attempted in various ways.69 Since the 2000s, its importance has been newly highlighted in New Partnership for Africa’s Development (NEPAD 2001), and the African Union and Regional Economic Communities (RECs)70 are promoting a variety of regional integration programs and initiatives including cross-border infrastructure development and promotion of intra-regional trade. This development perspective through regional integration and cooperation must be the central thrust in African development.
However, countries are quite varied; as seen above, since the 2000s, some countries have achieved steady economic growth and social development, while others are still in need of continued assistance on their way towards achieving MDGs and/or post-conflict state-building. Thus, the needs for development have come to be increasingly diversified and complicated. Given these variances, it is important that African countries adopt policies best suited to their different needs. The
68. See, for example, Bertrand and Crepon (2012).69. Many of the regional economic communities (RECs) include regional cooperation mechanisms founded in the early 1960s to 1970.70. The African Union Commission established close cooperation with the following 8 Regional Economic Communities (RECs) as one of the pillars of the basic strategies of 2009-2012: Community of Sahel Saharan States (CEN SAD), Common Market for Eastern and Southern Africa (COMESA), East African Community (EAC), Economic Community of Central African States (ECCAS), Economic Community of West African States (ECOWAS) Intergovernment Authority for Development (IGAD), Southern African Development Community (SADC) and Union du Maghreb Arabe (UMA). (African Union Commission 2009)
57
Achieving Economic Transformation for Inclusive and Sustained Growth in Africa: Prospects and Challenges
international development community must make sure that individual countries are given sufficient policy space to pursue their developmental goals, recalling that their policy recommendations since the days of structural adjustments in the 1980s have often been criticized as being too rigid with no policy space for African governments. Actually, similar arguments calling for customized or differentiated approaches for countries at different stages are emerging with respect to the discussions on the post-2015 development agendas; the argument goes that different targets must be provided for countries and areas that are likely to achieve MDGs by 2015 and those which are not (UNECA et al. 2011).
It is expected that the action plans to be adopted at TICAD V will incorporate these diversified and complicated development needs. In working out these plans, African countries and their partners, while upholding the perspective of regional integration and cooperation, must make sure that African countries are encouraged to seek differentiated and customized development strategies to meet their specific needs. These two approaches, i.e., the regional integration approach and the “differentiated and customized approach” must be the central philosophy underpinning the upcoming new TICAD V Action Plan.
3.1. Regional integration approach The regional integration approach comprises a variety of programs, including cross-border infrastructure development, corridor development, intra-regional trade promotion, support to regional economic communities (RECs), and rural infrastructure development. African Union, NEPAD and RECs are positioned as central promoters of the most important initiatives for regional integration, such as the Program of Infrastructure Development in Africa (PIDA), and Action Plan for Boosting Intra-African Trade. The importance of regional integration was also highlighted in the TICAD IV Yokohama Action Plan.71 Various partners of Africa have been supporting moves along the lines of this approach. Japan and JICA have been providing support to regional infrastructure development and “one stop border posts (OSBP)” as their flagship projects listed in the Action Plan;72 the African Development Bank Group considers regional
71. See the section of “accelerated growth” and “infrastructure” of TICAD IV Yokohama Action Plan 72. For more details of the OSBP, see Chapter 8.
58
Chapter 1
integration as a strategic priority at the regional level in its mid-term business strategy 2008-2012 (African Development Bank Group 2008, p.11); the World Bank considers regional integration as a key instrument to implement its African regional strategy, in addition to responses to middle-income countries and fragile states (World Bank 2011b, pp.29-31).
The perspective of regional integration must also be incorporated in individual countries’ development planning. In other words, governments and donors must make sure that their development strategies are worked out so that they promote the interests not only of the country but also of neighboring countries in the region. Formulation, prioritization and sequencing of development projects must take into consideration their regional integration effects; for example, Kuchiki (2010, p.121) is proposing the formation of industrial clusters in Mozambique and its neighboring region based on the experience in the industrial cluster policy in Northern Vietnam and in the Eastern Seaboard Development Plan in Thailand.
Rural areas are also to be incorporated into the regional integration approach to enhance urban-rural connectivity and to develop agricultural potential, by investing in rural infrastructure such as transport, telecommunication and irrigation, strengthening access to market, finance and technology, and creating employment in agricultural and non-agricultural sectors in rural areas. Only one-third of Africans living in rural areas are within two kilometers of an all-season road, compared with two-thirds of the population in other developing regions (World Bank 2011d). In this context, the Comprehensive Africa Agriculture Development Program (CAADP) proposes the Framework for the Improvement of Rural Infrastructure and Trade-Related Capacities for Market Access (FIMA) as the second pillar of CAADP.
3.2. Differentiated and customized approach While maintaining the regional integration perspective, countries must pursue customized strategies to meet their specific needs. Though not exhaustive, the following are proposed for countries under different circumstances:
59
Achieving Economic Transformation for Inclusive and Sustained Growth in Africa: Prospects and Challenges
3.2.1. Development challenges in fragile states While many African countries are starting to show high economic growth rates, some other countries lag behind, and some are still on their way to post-conflict state building. Many of these countries are called “fragile states.” Though there is no single effective prescription for the development of such countries, several points are worthy of consideration. First, short-term humanitarian assistance in the immediate aftermath of conflict and long-term development assistance for state building must be coordinated to avoid any gap between the two. Second, states must have the capacity to provide their citizens with basic services such as food, health, and education, along with the ability to secure law and order; the former is very important for the state to be regarded as legitimate by its people. With this in mind, support for countries in fragile situations must incorporate not only assistance for improved governance such as the restoration of political stability and strengthening of security sectors, but also a well-balanced economic and social assistance program in the fields of infrastructure development, job creation and food security as well as healthcare.73
3.2.2. Development challenges in resource-rich countries As IMF (2012b) defines 20 Sub-Saharan countries as Resource Intensive Countries74 and notes that several countries75 are expected to soon join the ranks of significant natural resource exporters, given recent discoveries and exploration results, “Mineral Governance” (World Bank 2012b) is newly focused as a major development challenge of Africa.
The debate on the “resource curse” is still going on. Paul Collier (2007) cites a natural resource trap or resource curse as one of the four development traps76 preventing Africa from escaping poverty. World Bank (2012b), on the other hand, maintains that there is hardly any 73. For more detailed discussions on state-building in fragile states, see Chapter 12 of this volume. 74. 7 countries (Angola, Cameroon, Chad, Republic of Congo, Equatorial Guinea, Gabon, Nigeria) as oil-exporters, and 13 countries (Botswana, DRC, Guinea, Central African Republic, Ghana, Mali, Namibia, Niger, Sierra Leone, South Africa, Tanzania, Zambia, Zimbabwe) as other-resource intensive countries (IMF2012b, p.62). In North Africa, Algeria and Libya are traditional oil-exporters and Morocco is a phosphate-exporter. 75. Cote d’Ivoire, Kenya, Liberia, Mauritania, Mozambique, South Sudan, Sudan, and Uganda etc. are expected to be new resource-exporters in the IMF ranking. 76. The other three development traps are: conflict trap, landlocked with bad neighbors, and bad governance in a small country.
60
Chapter 1
empirical data that endorses the resource curse theory77 and calls for policy initiatives directed at sustained development by making use of abundant resource-derived revenue in order to achieve the economic development and growth of resource-rich countries.
Even supposing, as Paul Collier (2007) indicates, a negative impact of some degree of natural resource exports on economic development and growth, it should be possible to promote economic development and growth through a combination of effective policies.78 Such policies can include: effective use of resource revenues generated from natural resources for productive investment in infrastructure and human capital; strengthening of transparency and accountability for resource revenue spending and prevention of corruption; and robust fiscal policy and prudent public investment policy. Thus, there must be strong needs for assistance for resource-rich countries for their policy system reforms, strengthening of governance, and diversification of economic structure.
In addition, the private sector is greatly interested in resource-rich countries and they, too, have a strong interest in the improvement of the investment climate, comprising, most importantly, of well-developed infrastructure and capable human resources, stable macroeconomic management, and accessible long-term development financing. Thus, there is strong demand in the private sector for increased public support measures for resource-rich countries, which could be promoted either through official development assistance (ODA) or through public-private partnership arrangements. Such support measures could contribute directly to business environment improvement, or, as a long-term initiative, could help reduce investment risks through improved socio-economic stability through social development and diminished social disparities.
77. Lederman and Maloney (2008) reviewed the past empirical analysis on the resource curse that regarded the indicators such as the ratio of resource exports to GDP or to the total exports as a proxy of the degree of resource dependence. As a result of reviewing the analysis method and using the net resource exports per head of the working population, they reported that there was a positive correlation between the degree of resource dependence and GDP per capita and that the per capita resource exports have a positive impact on GDP per capita.78. The Commission on Growth and Development (2008, p.80) argues that the problem is not the resources themselves, but how the proceeds (or “rents”) are handled. It also suggests the Extractive Industries Transparency Initiative (EITI) as a successful initiative jointly managed by a broad coalition of governments, companies, industry associations, investors, the World Bank, and non-governmental organizations like Transparency International and Global Witness (p.81).
61
Achieving Economic Transformation for Inclusive and Sustained Growth in Africa: Prospects and Challenges
3.2.3. Comprehensive yet differentiated approach for countries with varying performances with respect to MDGs79
Since MDGs were agreed on in 2000, a lot of effort has been made toward their achievement, receiving broad international support. Overall, these efforts have resulted in significant advancement in many countries and are to be highly appreciated. However, these efforts toward MDGs inevitably tended to concentrate on the achievement of indicators and numerical goals itemized in the MDGs, resulting in insufficient resource mobilization for objectives not explicitly included in the MDG framework, such as income disparity, quality of primary education, health systems improvement, climate change and governance. Also, there was a tendency for policymakers’ attention to be focused on the overall achievement of the targets, resulting in insufficient attention being paid to disparities among and within countries.
The upcoming post-2015 development agenda should be agreed on in such a way that individual countries are encouraged to pursue their development goals. Such country-wise development goals should be based primarily on the country’s achievement of the goals in 2015. In the post-2015 era, countries must be guided by a comprehensive yet simple and easy-to-understand framework of development norms like the current MDGs. They must, at the same time, be allowed to flexibly pursue their development agenda, employing development policies most appropriate for their needs.
Though quite challenging, the international community must seek a developmental framework that has this comprehensiveness and flexibility to allow development policies to be selected to meet differing and complicated needs and to incorporate the country’s various developmental conditions.
As the post-2015 development agenda will be so broad including inclusiveness, equity and sustainability of economic growth, quality of education and health services, addressing climate change challenges and environmental sustainability, peace and security for development, transparency and accountability of governance, Human Security is expected to be an overarching principle to lead and promote the post-
79. The discussion in this clause is mainly based on preliminary discussions on the post-2015 agenda in UN System Task Team on the Post-2015 UN Development Agenda (2012) and UNECA et al (2012).
62
Chapter 1
2015 development agenda across the broad needs and areas of the post-2015 agenda, by focusing on empowering people, managing downside risks and addressing vulnerability and resilience in a comprehensive manner.80
Concluding Remarks
We have broadly looked at the current situation and future challenges of African development, with the focus on “inclusive and sustained growth.” More detailed discussions will follow in the subsequent chapters on agriculture, industry, infrastructure, health, education, the environment, state-building and South-South cooperation.
The needs and challenges of African development are increasingly becoming more diversified and complicated. Despite this, TICAD V must come up with a simple, clear, forward-looking proposal, as well as a powerful message establishing a path for collective and individual actions for African development, and provide policy makers and aid practitioners with guidance so that they can respond appropriately and effectively to such diversified and complicated challenges and needs for African development.
80. In regard to the concept and action agenda of Human Security, please see the final report by Commission on Human Security (2003), co-chaired by Ms. Sadako Ogata and Mr. Amartya Sen.
63
Achieving Economic Transformation for Inclusive and Sustained Growth in Africa: Prospects and Challenges
References
Africa, J.-G. K., and G. Ajumbo. 2012. Informal cross border trade in Africa: Implications and policy recommendations. Africa Economic Brief, Volume 3, Issue 10, African Development Bank, Chief Economist Complex.
African Development Bank Group. 2008. Medium-term strategy 2008-2012. Tunis, Tunisia: African Development Bank.
African Development Bank Group. 2011a. Africa in 50 years’ time: The road towards inclusive growth. Tunis, Tunisia: African Development Bank.
African Development Bank Group. 2011b. Framework document on the proposed African Green Fund. Tunis, Tunisia: African Development Bank.
African Union Commission, African Development Bank, and Economic Commission for Africa. 2012. Programme for Infrastructure Development in Africa (PIDA). Addis Ababa, Ethiopia: African Union Commission.
African Union Commission. 2009. Strategic plan 2009–2012. Addis Ababa, Ethiopia: African Union Commission.
Arbache, J. S., and J. Page. 2007. Patterns of long-term growth in Sub-Saharan Africa. Policy Research Working Paper 3498, World Bank.
Arbache, J., D. S. Go, and J. Page. 2008. Is Africa’s economy at a turning point? Policy Research Working Paper 4519, World Bank, Africa Region, Office of the Chief Economist.
Bertrand, M., and B. Crepon. 2012. Youth unemployment in Africa: Challenges, policies, and projects. Microeconomics paper prepared for the Japan International Cooperation Agency.
CAADP Pillar II Experts Reference Group. 2009. The Comprehensive Africa Agriculture Development Program (CAADP), Pillar 2: Framework for the improvement of rural infrastructure and trade-related capacities for market access (FIMA). n.p.
CUTS International Geneva African Resource Centre. [Ogalo, V.] 2010. Informal cross-border trade in EAC: Implications for regional integration and development. Research Paper, CUTS African Resource Centre, Nairobi.
Collier, P. 2007. The bottom billion: Why the poorest countries are failing and what can be done about it. Trans. K. Nakaya. [In Japanese.] Tokyo: Nikkei Business Publications.
Collier, P., and S. A. O’Connell. 2007. Opportunities and Choices. Draft
64
Chapter 1
chapter 2 of the synthesis volume of the African Economic Research Consortium’s Explaining African Economic Growth Project, African Economic Research Consortium, Nairobi, Kenya.
Commission on Growth and Development. 2008. The growth report: Strategies for sustained growth and inclusive development. Washington, DC: World Bank.
Commission on Human Security. 2003. Human security now. Trans. Human Security Secretariat. [In Japanese.] Tokyo: Asahi Shinbun.
Elasha, B. O., M. Medany, I. Niang-Diop, T. Nyong, R. Tabo, and C. Vogel. 2006. Impacts, vulnerability and adaptation to climate change in Africa. Background paper for the African Workshop on Adaptation Implementation of Decision 1/CP.10 of the UNFCCC Convention.
Ernst & Young. 2012. Building bridges: Ernst & Young’s 2012 Africa attractiveness survey. Report in collaboration with Oxford Economics, Ernst & Young Global Limited.
Foundation for Advanced Studies on International Development. 2003. Review on the New Partnership for African Development (NEPAD). [In Japanese.] Tokyo: Foundation for Advanced Studies on International Development.
G20, Development Working Group. 2011. 2011 report of the development working group. Report prepared for the 2011 G20 Cannes Summit, November.
Global Integrity. 2011. The global integrity report 2011: Key findings 2011. Washington, DC and Cape Town: Global Integrity.
Hanson, S. 2009. Corruption in Sub-Saharan Africa. Background paper, Council on Foreign Relations, August 6.
High Level Advisory Group on Climate Change Financing (AGF). 2010. Report of the Secretary-General’s High-Level Advisory Group on Climate Change Financing. New York: United Nations.
High Level Panel on Infrastructure. 2011. Recommendations to G20. Report prepared for the 2011 G20 Cannes Summit, October.
Hirano, K. 2009. African problems: World history of development and assistance. [In Japanese.] Tokyo: Nippon Hyoron Sha.
Hirano, K. 2013. Economic continent of Africa: From resources and food to development policies. [In Japanese.] Tokyo: Chuokoron-Shinsha.
Horiuchi, S, and S. Kataoka. 2012. Actual Africa: Past, present, and future. [In Japanese.] Kamakura, Japan: Ekoha Shuppan.
Horiuchi, S. 2004. Ten years of the footprint of the Tokyo International Conference on African Development (TICAD). [In Japanese.] n.p.
65
Achieving Economic Transformation for Inclusive and Sustained Growth in Africa: Prospects and Challenges
Infrastructure Consortium for Africa (ICA) Secretariat. 2012. Annual report 2011: Financial commitments and disbursements for infrastructure in Africa. Tunis, Tunisia: The Infrastructure Consortium for Africa Secretariat, c/o African Development Bank.
International Energy Agency (IEA). 2011. World energy outlook 2011. Paris: International Energy Agency.
International Monetary Fund (IMF). 2008. Regional economic outlook: Sub-Saharan Africa, October 2008. Regional Economic and Financial Surveys, International Monetary Fund.
International Monetary Fund (IMF). 2011a. Regional economic outlook: Sub-Saharan Africa, sustaining the expansion, October 2011. Regional Economic and Financial Surveys, International Monetary Fund.
International Monetary Fund (IMF). 2011b. Finance and Development 48 (4), December 2011.
International Monetary Fund (IMF). 2012a. Regional economic outlook: Sub-Saharan Africa, maintaining growth in an uncertain world, October 2012. Regional Economic and Financial Surveys, International Monetary Fund.
International Monetary Fund (IMF). 2012b. Regional Economic Outlook: Sub-Saharan Africa, sustaining growth amid global uncertainty, April 2012. Regional Economic and Financial Surveys, International Monetary Fund.
International Monetary Fund (IMF). 2012c. Regional economic outlook: Middle East and Central Asia, November 2012. Regional Economic and Financial Surveys, International Monetary Fund.International Monetary Fund (IMF). 2013. IMF primary commodity prices. Data updated on April 4, 2013. http://www.imf.org/external/np/res/commod/index.aspx.
Japan International Cooperation Agency, Padeco Co., Ltd., and Mitsubishi UFJ Research and Consulting. 2010. Final report on preparatory research on Southern Africa regional growth belt. [In Japanese.] Tokyo: Japan International Cooperation Agency.
Japan International Cooperation Agency, and Mitsubishi UFJ Research and Consulting. 2007. Project study on the TICAD process: Review of the past achievements and implications for future success, final report. [In Japanese.] Tokyo: Japan International Cooperation Agency.
Japan International Cooperation Agency. 2008a. Report on African development and economic growth in Asia. [In Japanese.] Tokyo:
66
Chapter 1
Japan International Cooperation Agency.Japan International Cooperation Agency. 2008b. TICAD IV International
Symposium: Economic Development in Africa and Asian Growth Experience. [In Japanese.] Tokyo: Japan International Cooperation Agency.
Kuchiki, A. 2010. Flowchart approach for the industrial cluster policy: Application to Africa. In Globalization and international development, “African development strategy,” A research report commissioned by the Ministry of Foreign Affairs, 2009, chapter 4. [In Japanese.] Tokyo: Foundation for Advanced Studies on International Development.
Lederman, D., and W. F. Maloney. 2008. In search of the missing resource curse. Policy Research Working Paper 4766, World Bank.
Lesser, C., and E. Moise-Leeman. 2009. Informal cross-border trade and trade facilitation reform in Sub-Saharan Africa. OECD Trade Policy Working Papers, No. 86, OECD.
MDG Working Group on Infrastructure. 2011. Infrastructure action plan. Submission to the G20 by the MDG Working Group on Infrastructure, October.
McKinsey Global Institute (MGI). 2010. Lions on the move: The progress and potential of African economies. Washington, DC: McKinsey Global Institute.
Ministry of Foreign Affairs of Japan. 2004. 2003 white paper on official development assistance (ODA). [In Japanese.] Tokyo: National Printing Bureau of Japan.
Ministry of Foreign Affairs of Japan. 2008. TICAD IV Yokohama action plan, 2008. [In Japanese.] http://www.mofa.go.jp/mofaj/area/ticad/tc4_sb/yokohama_kk.html#02_01.
Moyo, D. 2009. Dead aid: Why aid is not working and how there is another way for Africa. Trans. H. Kohama, et al. [In Japanese.] Tokyo: Toyo Keizai.
Ndulu, B., with L. Chakraborti, L. Lijiane, V. Ramachandra, and J. Wolgin. 2007. Challenges of African growth: Opportunities, constraints and strategic directions. Washington, DC: World Bank.
New Partnership for Africa’s Development (NEPAD). 2001. New partnership for Africa’s development. http://www.un.org/africa/osaa/reports/nepadEngversion.pdf.
New Partnership for Africa’s Development (NEPAD). 2003. Comprehensive Africa Agriculture Development Programme (CAADP). Midrand, South Africa: New Partnership for Africa’s
67
Achieving Economic Transformation for Inclusive and Sustained Growth in Africa: Prospects and Challenges
Development (NEPAD).Nishiura, A, and T. Fukunishi. 2008. Emerging challenges for industrial
development policy in Africa. In Emerging challenges of development assistance to Africa, ed. E. Yoshida, chapter 6. [In Japanese.] Chiba, Japan: Institute of Development Economies of Japan.
Noman, A., and J. E. Stiglitz. 2012. Strategies for African development. In Good growth and governance in Africa: Rethinking development strategies, ed. A. Noman, K. Botchwey, H. Stein, and J. E. Stiglitz. New York: Oxford University Press.
ODA Evaluation Committee, Ministry of Foreign Affairs of Japan. 2008. Evaluation report on assistance to Africa through TICAD Process. [In Japanese.] http://www.mofa.go.jp/mofaj/ gaiko/oda/shiryo/hyouka/kunibetu/gai/ticad/pdfs/jk07_01_0001.pdf.
OECD Development Centre, African Development Bank Group, United Nations Development Programme, and United Nations Economic Commission for Africa. 2012. African economic outlook 2012: Promoting youth employment. Paris: OECD.
OECD Development Co-operation Directorate, Directorate for Financial and Enterprise Affairs, Development Assistance Committee, Investment Committee. 2011. Mapping support for Africa’s infrastructure investment. Report from the Aid for Investment in Africa’s Infrastructure project.
OECD-DAC International Network on Conflict and Fragility. 2012. Fragile states 2013: Resource flows and trends in a shifting world. Paris: OECD.
Ranis, G., and D. Gollin. 2012. Youth underemployment in Africa: Challenges and policies and macroeconomic perspectives. Paper prepared for the Japan International Cooperation Agency.
TICAD Civil Society Forum (TCSF) [Y. Ishida, and M. Obayashi, eds.] 2008. 2007 citizen’s white paper on policy for Africa. [In Japanese.] Kyoto: Koyo Shobo.
Takahashi, M. 2010. Development and the state: Towards a renewal of political economy of Africa. [In Japanese.] Tokyo: Keiso Shobo.
Tanaka, A. 1996. The new middle ages: A new world system in the 21st century. [In Japanese.] Tokyo: Nikkei.
The White House. 2012. Fact sheet: G–8 action on food security and nutrition, May 18. http://www.whitehouse.gov/the-press-office/2012/05/18/fact-sheet-g-8-action-food- security-and-nutrition.
68
Chapter 1
Transparency International. 2012. Corruption Perceptions Index 2012. Berlin: Transparency International.
UN System Task Team on the Post-2015 UN Development Agenda. 2012. Realizing the future we want for all: Report to the Secretary-General. Report by the UN System Task Team.
United Nations Economic Commission for Africa (UNECA), African Union, African Development Bank, and United Nations Development Programme (UNDP). 2011. Assessing progress in Africa toward the Millennium Development Goals: MDG report 2011. New York: United Nations.
United Nations Economic Commission for Africa (UNECA), African Union, African Development Bank, and United Nations Development Programme (UNDP). 2012. Assessing progress in Africa toward the Millennium Development Goals: MDG report 2012. New York: United Nations.
United Nations Economic Commission for Africa (UNECA), Governance and Public Administration Division (GPAD), in collaboration with the African Union Advisory Board on Corruption (AUABC). 2011. Combating corruption, improving governance in Africa: Regional anti-corruption programme for Africa (2011–2016). New York: United Nations Economic Commission for Africa.
United Nations Economic Commission for Africa (UNECA). 2005. Striving for good governance in Africa. Synopsis of the 2005 African Governance Report prepared for the African Development Forum IV.
United Nations Economic Commission for Africa (UNECA). 2009. African governance report II 2009. Oxford: Oxford University Press.
United Nations Framework Convention on Climate Change. 2007. Climate change: Impacts, vulnerabilities and adaptation in developing countries. Bonn: Climate Change Secretariat (UNFCCC).
United Nations Framework Convention on Climate Change. 2009. Report of the Conference of the Parties on its fifteenth session, held in Copenhagen from 7 to 19 December 2009 (including Copenhagen Accord). http://unfccc.int/resource/docs/2009/cop15/ eng/11a01.pdf.
United Nations Human Settlements Programme (UN-HABITAT). 2010. The state of African cities 2010: Governance, inequality and urban
69
Achieving Economic Transformation for Inclusive and Sustained Growth in Africa: Prospects and Challenges
land markets. Nairobi: United Nations Human Settlements Programme (UN-HABITAT).
United Nations. 2010. Millennium Development Goals: 2010 progress chart. New York: United Nations.
United Nations. 2011a. Millennium Development Goals: 2011 progress chart. New York: United Nations.
United Nations. 2011b. Sustainable energy for all: A vision statement by Ban Ki-moon, Secretary-General of the United Nations. New York: United Nations.
United Nations. 2012. Millennium Development Goals: 2012 progress chart. New York: United Nations.
Watanabe, K. 2010. Significance of cities in economic development: Approaches to urbanization in Kenya. In Globalization and international development, “African development strategy,” A research report commissioned by the Ministry of Foreign Affairs, 2009, chapter 5. [In Japanese.] Tokyo: Foundation for Advanced Studies on International Development.
World Bank. 2008. Africa infrastructure country diagnostic. Washington, DC: World Bank.
World Bank. 2010a. Africa’s pulse, Vol. 2. Office of the Chief Economist for the Africa Region, World Bank, October.
World Bank. 2010b. The costs to developing countries of adapting to climate change, new methods and estimates: The global report of the Economics of Adaptation to Climate Change Study, Consultation Draft. Washington, DC: World Bank.
World Bank. 2011a. Africa development indicators 2011. Washington, DC: World Bank.
World Bank. 2011b. Africa’s future and the World Bank’s support to it. Report by World Bank, Africa Region, March.
World Bank. 2011c. Africa’s pulse, Vol. 4. Office of the Chief Economist for the Africa Region, World Bank, October.
World Bank. 2011d. World Bank fact sheet: Infrastructure in Sub-Saharan Africa. http://web.worldbank.org/WBSITE/EXTERNAL/COUNTRIES/AFRICAEXT/ 0,,contentMDK:21951811~pagePK:146736~piPK:146830~theSitePK:258644,00.html.
World Bank. 2012a. Africa’s pulse, Vol. 5. Office of the Chief Economist for the Africa Region, World Bank, April.
World Bank. 2012b. Africa’s pulse, Vol. 6. Office of the Chief Economist for the Africa Region, World Bank, October.
World Bank. 2012c. Country Policy and Institutional Assessment (CPIA)
70
Chapter 1
Africa: Assessing Africa’s policies and institutions. World Bank, Office of the Chief Economist for the Africa Region.
World Bank. 2012d. Doing business 2012. Washington, DC: World Bank.World Bank. 2012f. Country partnership strategy for the Federal
Democratic Republic of Ethiopia. World Bank, Ethiopia Country Management Unit, Africa Region, August 29.
World Bank. [H. T. Dinh, V. Palmade, V. Chandra, and F. Cossar.] 2012e. Light manufacturing in Africa: Targeted policies to enhance private investment and create jobs. Let’s talk development: A blog hosted by the World Bank’s chief economist, January 11. http://blogs.worldbank.org/developmenttalk/light-manufacturing-in-africa-targeted- policies-to-enhance-private-investment-and-create-jobs.
World Economic Forum (WEF), World Bank, and African Development Bank. 2011. The Africa competitiveness report 2011. Geneva: World Economic Forum.
Part Ⅰ: Rural Development and Food Security

73
Chapter 2: Boosting Sustainable Agricultural Growth in Sub-Saharan Africa
Koji Makino
In transformation of the global food security, agriculture in Africa is dynamically and rapidly developing. This chapter tries to review African Agriculture, to identify its challenges, and then shares recent topics of agricultural development such as investments, resilience issue and CAADP. Finally it discusses JICA’s support for African agricultural development with an eye toward TICAD V. This chapter provides a general overview for subsequent three chapters as an introduction.
1. Overview of African Agriculture1.1 Global food security surrounding AfricaIn recent years, agricultural and food issues have been attracting much more attention in the international arena. The G20 meeting held in France in June 2011 placed these issues at the top of its agenda, and adopted the Action Plan on Food Price Volatility and Agriculture. Meanwhile at the G8 meeting held in the United States in 2012, agricultural development in sub-Saharan Africa was discussed, it being the region most susceptible to food crisis. These issues have been frequently brought up in the media in the past. But why are they drawing so much of the international community’s attention now? It is primarily due to the record-breaking rise in international food prices and concerns over food security (Figure 1).
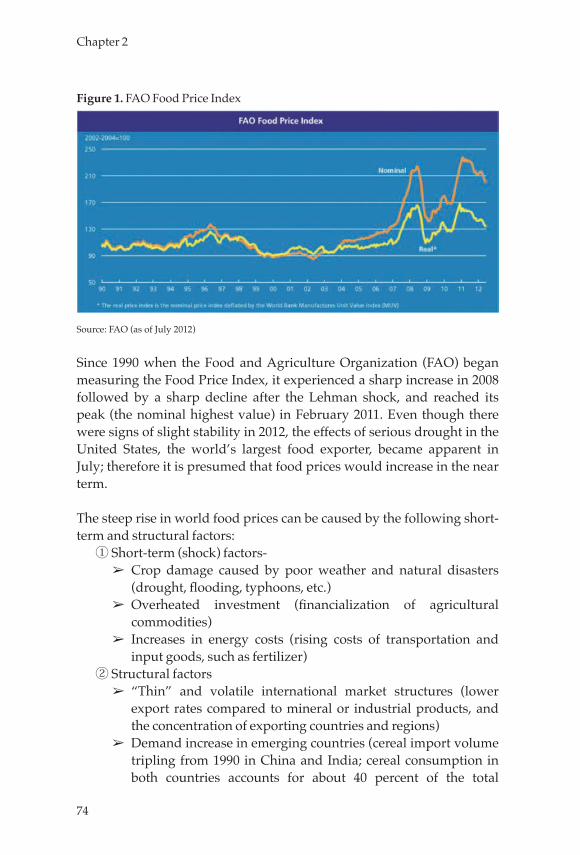
74
Chapter 2
Figure 1. FAO Food Price Index
Source: FAO (as of July 2012)
Since 1990 when the Food and Agriculture Organization (FAO) began measuring the Food Price Index, it experienced a sharp increase in 2008 followed by a sharp decline after the Lehman shock, and reached its peak (the nominal highest value) in February 2011. Even though there were signs of slight stability in 2012, the effects of serious drought in the United States, the world’s largest food exporter, became apparent in July; therefore it is presumed that food prices would increase in the near term.
The steep rise in world food prices can be caused by the following short-term and structural factors:
① Short-term (shock) factors- ➢ Crop damage caused by poor weather and natural disasters (drought, flooding, typhoons, etc.)
➢ Overheated investment (financialization of agricultural commodities)
➢ Increases in energy costs (rising costs of transportation and input goods, such as fertilizer)
② Structural factors ➢ “Thin” and volatile international market structures (lower export rates compared to mineral or industrial products, and the concentration of exporting countries and regions)
➢ Demand increase in emerging countries (cereal import volume tripling from 1990 in China and India; cereal consumption in both countries accounts for about 40 percent of the total
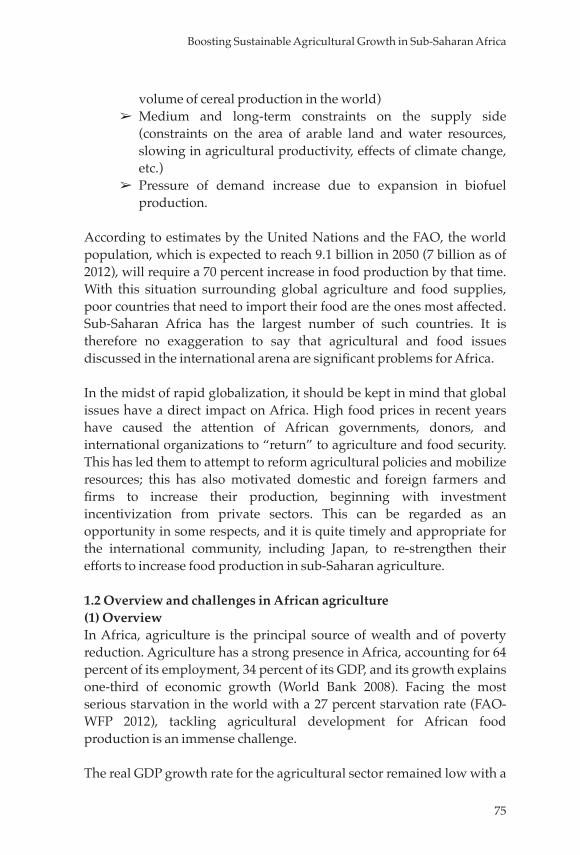
75
Boosting Sustainable Agricultural Growth in Sub-Saharan Africa
volume of cereal production in the world) ➢ Medium and long-term constraints on the supply side (constraints on the area of arable land and water resources, slowing in agricultural productivity, effects of climate change, etc.)
➢ Pressure of demand increase due to expansion in biofuel production.
According to estimates by the United Nations and the FAO, the world population, which is expected to reach 9.1 billion in 2050 (7 billion as of 2012), will require a 70 percent increase in food production by that time. With this situation surrounding global agriculture and food supplies, poor countries that need to import their food are the ones most affected. Sub-Saharan Africa has the largest number of such countries. It is therefore no exaggeration to say that agricultural and food issues discussed in the international arena are significant problems for Africa.
In the midst of rapid globalization, it should be kept in mind that global issues have a direct impact on Africa. High food prices in recent years have caused the attention of African governments, donors, and international organizations to “return” to agriculture and food security. This has led them to attempt to reform agricultural policies and mobilize resources; this has also motivated domestic and foreign farmers and firms to increase their production, beginning with investment incentivization from private sectors. This can be regarded as an opportunity in some respects, and it is quite timely and appropriate for the international community, including Japan, to re-strengthen their efforts to increase food production in sub-Saharan agriculture.
1.2 Overview and challenges in African agriculture (1) OverviewIn Africa, agriculture is the principal source of wealth and of poverty reduction. Agriculture has a strong presence in Africa, accounting for 64 percent of its employment, 34 percent of its GDP, and its growth explains one-third of economic growth (World Bank 2008). Facing the most serious starvation in the world with a 27 percent starvation rate (FAO-WFP 2012), tackling agricultural development for African food production is an immense challenge.
The real GDP growth rate for the agricultural sector remained low with a
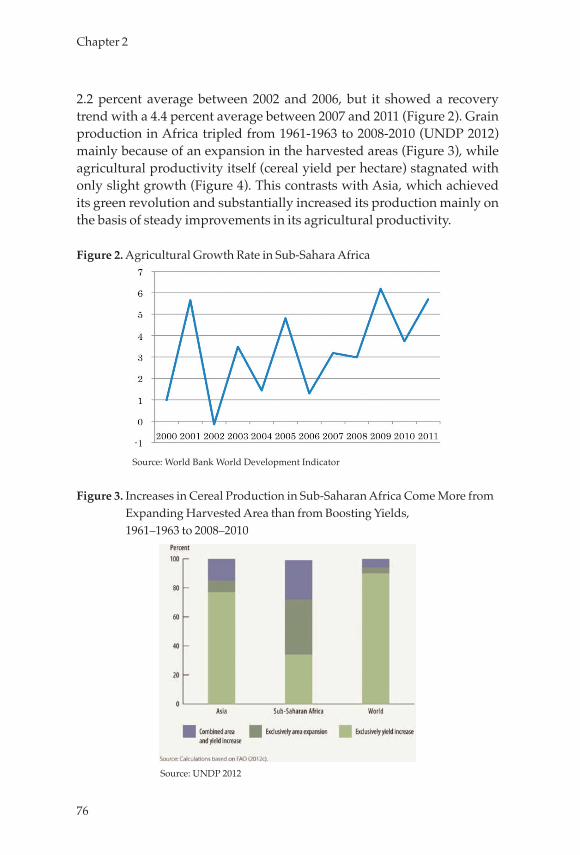
76
Chapter 2
2.2 percent average between 2002 and 2006, but it showed a recovery trend with a 4.4 percent average between 2007 and 2011 (Figure 2). Grain production in Africa tripled from 1961-1963 to 2008-2010 (UNDP 2012) mainly because of an expansion in the harvested areas (Figure 3), while agricultural productivity itself (cereal yield per hectare) stagnated with only slight growth (Figure 4). This contrasts with Asia, which achieved its green revolution and substantially increased its production mainly on the basis of steady improvements in its agricultural productivity.
Figure 2. Agricultural Growth Rate in Sub-Sahara Africa
Source: World Bank World Development Indicator
Figure 3. Increases in Cereal Production in Sub-Saharan Africa Come More from Expanding Harvested Area than from Boosting Yields, 1961–1963 to 2008–2010
Source: UNDP 2012
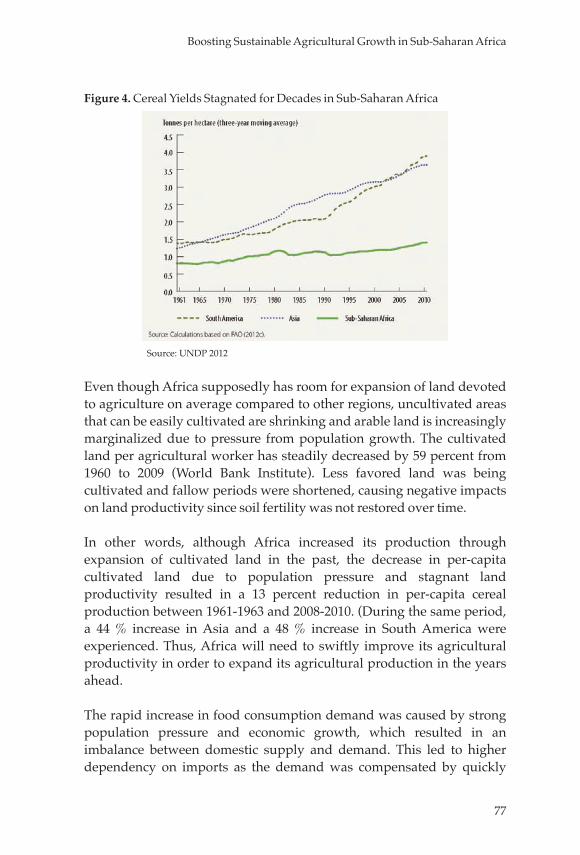
77
Boosting Sustainable Agricultural Growth in Sub-Saharan Africa
Figure 4. Cereal Yields Stagnated for Decades in Sub-Saharan Africa
Source: UNDP 2012
Even though Africa supposedly has room for expansion of land devoted to agriculture on average compared to other regions, uncultivated areas that can be easily cultivated are shrinking and arable land is increasingly marginalized due to pressure from population growth. The cultivated land per agricultural worker has steadily decreased by 59 percent from 1960 to 2009 (World Bank Institute). Less favored land was being cultivated and fallow periods were shortened, causing negative impacts on land productivity since soil fertility was not restored over time.
In other words, although Africa increased its production through expansion of cultivated land in the past, the decrease in per-capita cultivated land due to population pressure and stagnant land productivity resulted in a 13 percent reduction in per-capita cereal production between 1961-1963 and 2008-2010. (During the same period, a 44 % increase in Asia and a 48 % increase in South America were experienced. Thus, Africa will need to swiftly improve its agricultural productivity in order to expand its agricultural production in the years ahead.
The rapid increase in food consumption demand was caused by strong population pressure and economic growth, which resulted in an imbalance between domestic supply and demand. This led to higher dependency on imports as the demand was compensated by quickly
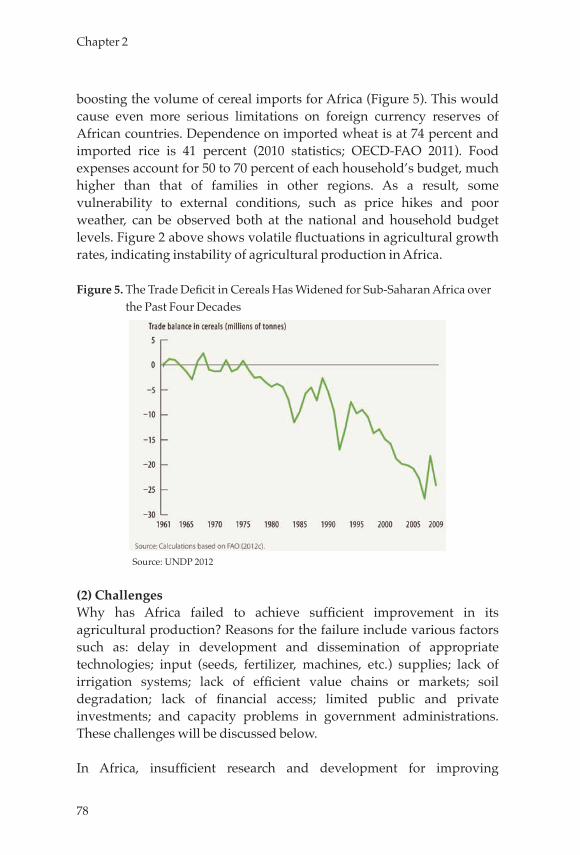
78
Chapter 2
boosting the volume of cereal imports for Africa (Figure 5). This would cause even more serious limitations on foreign currency reserves of African countries. Dependence on imported wheat is at 74 percent and imported rice is 41 percent (2010 statistics; OECD-FAO 2011). Food expenses account for 50 to 70 percent of each household’s budget, much higher than that of families in other regions. As a result, some vulnerability to external conditions, such as price hikes and poor weather, can be observed both at the national and household budget levels. Figure 2 above shows volatile fluctuations in agricultural growth rates, indicating instability of agricultural production in Africa.
Figure 5. The Trade Deficit in Cereals Has Widened for Sub-Saharan Africa over the Past Four Decades
Source: UNDP 2012
(2) ChallengesWhy has Africa failed to achieve sufficient improvement in its agricultural production? Reasons for the failure include various factors such as: delay in development and dissemination of appropriate technologies; input (seeds, fertilizer, machines, etc.) supplies; lack of irrigation systems; lack of efficient value chains or markets; soil degradation; lack of financial access; limited public and private investments; and capacity problems in government administrations. These challenges will be discussed below.
In Africa, insufficient research and development for improving

79
Boosting Sustainable Agricultural Growth in Sub-Saharan Africa
agricultural productivity and quality persist due to constraints on budgets, organizations, personnel, and so on. Also the connection between research institutes at the central level and regional organizations is weak, resulting in an insufficient application of research results to conditions of different regions, translating them into technologies usable on site. It is also necessary to widely disseminate appropriate new technologies among farmers via agricultural extension workers and through other channels. However, in Africa, there are issues of budget constraints, the limited number and quality of the extension workers, underdeveloped dissemination systems, and a lack of appropriate curriculum and teaching materials.
Since water sources (precipitation) are regionally concentrated with large seasonal and annual variations and are affected by climate changes, irrigation plays a significant role in enabling stable use of water and improving productivity. However, African agriculture depends largely on rainwater, and only 4 % of its cultivated land is provided with irrigation systems. (A significantly lower level when compared to the Middle East and North Africa with 33 % and Asia with approximately 30 to 40 %). As well, the rate of fertilizer usage is low, with 13 kilograms per hectare, compared to other regions which use between 73 and 190 kilograms. The usage rate of improved varieties of cereal in Africa remains at 24 percent, despite a sign of increase, and is still low in comparison with the rate of 45 to 85 percent in other regions (World Bank 2008).
A series of value chain processes needs to function smoothly and dynamically in agriculture- that is: “input → production → processing (post-harvest handling) → transportation and storage → sale and distribution.” Promotion of improved seeds and the use of fertilization in regions other than Africa were accompanied by the development of a value chain, including building irrigation systems, rural roads, sales infrastructure, financial services and markets, leading to the improvement of productivity and increases in production.
In Africa, however, this process is being hampered by various obstacles, such as inadequate infrastructure, enormous losses due to insufficient post-harvest technologies, lack of financial access, undeveloped market facilities and functions, and delays in governmental regulatory reforms.
80
Chapter 2
Take infrastructure as an example; the paved road ratio in Africa is only 18 percent (33 to 59 percent in other regions), and the electrification ratio remains at 33 percent (62 to 93 percent in other regions) (UNDP 2012). Two-thirds of the African rural population is living in areas that have low potential for agriculture, or poor market access, or both, while the corresponding number for South Asia is only 25 % (World Bank 2008).
As a result of the structural adjustments in the 1980s, the system of public agencies providing farmers with access to land, credit, insurance, inputs, and cooperative organizations was dismantled (World Bank 2008). It was expected that once excess government intervention was gone, private-sector-led market mechanisms would become more active and effectively function in place of the previous system. In Africa, however, this was not fully accomplished. Governments should play an important role together with private sectors in agriculture. In this context let us recall that Asian governments allocated 20 percent or more of their public expenditure when promoting the green revolution, whereas Africa spent only 5.6 percent (2005-2009 average) (UNDP 2012). Thus, Africa needs to devote more effort to increasing allocation of its public investment towards agriculture.
2. Recent Topics on Agriculture in Africa2.1. Agricultural investmentsIt has been observed that foreign agricultural investments in Africa are on the rise, being stimulated by high food prices in recent years. As more data on land investments is becoming available lately, we will present an overview of agricultural investments in recent years as well as issues relating to them.1
Throughout developing countries, it is estimated that land investments covering a total of 70.9 million hectares in 1,155 projects have been approved or were in the process of approval by the governments of those countries over the 10 years from 2000 to 2010. Africa accounts for 48 % of the total investments followed by 40 % in Asia and 9 % in Latin America. Much of the investment in Africa (36 %) comes from Asia.1. The discussions in the following paragraphs rely on data from the Land Matrix Project, the world’s largest scale database of international land transactions. The Project is run by a group of organizations, including the Agricultural Research for Development (CIRAD), a French agricultural research center, the University of Bern, and the International Land Coalition (ILC), with support from the European Union and other parties.
81
Boosting Sustainable Agricultural Growth in Sub-Saharan Africa
Investments in Africa (based on the area size) can be broken down into the following purposes: 55 % for biofuel, 13 % for food crops, and 6 % for forests; thus agriculture-related investment accounts for 74 % of the entire investment in Africa. The large area-wise share of investment for biofuel can be explained by the interest of developed countries in measures against climate change, and by the fact that these investments tend to employ extensive farming resulting in a large area-per-investment. In comparison, investments for food crops, though perhaps more numerous, tend to have smaller area-per-investment figures.
In terms of investment trends over the past 10 years, investments had been on the rise since 2005, peaked in 2009 triggered by the food price hikes in 2008, and rapidly slowed due to the Lehman shock in 2010. It is expected that investment will continue to rise in the future.
Several factors must be behind the growth of agricultural investments. On the investors’ side, the reasons include: concern for food security and the need for an alternative area for biofuel production; the appreciation of the value of African land as an investment target after the financial crisis; and the increasing potential of its forest resources, including that of emissions trading. In this kind of environment, African countries have the opportunity to attract more investments and welcome investors in general.
Agricultural investments can have both advantages and disadvantages. Some important ones can include the following:
(1) Possible Advantages ➢ As a result of the introduction of new agricultural technologies, productivity and quality improve. Acquisition of foreign currency, and an increase in tax revenues can be expected.
➢ Development of value chains, such as improvement in the agricultural infrastructure as well as social services (construction of schools, clinics, etc.) and improved market access can be expected.
(2) Possible Disadvantages ➢ Disputes over land and water resources may occur between investors and local residents. There is a possibility that local residents who originally used the land, etc. may lose their rights due to a weak legal system. In particular, women tend to be
82
Chapter 2
affected negatively. ➢ The use of mechanized farming has a low job creation effect; moreover the use of imported inputs has only a limited ripple effect on relevant local industries.
➢ Profits generated by investments are not equally distributed.
As an international response to these agricultural investments, the Committee on World Food Security (CFS), a standing committee of the FAO, has compiled the Voluntary Guidelines on the Responsible Governance of Tenure of Land, Fisheries and Forests (VGGT), with a focus on securing the rights of small-scale farmers, endorsed in May 2012. Japan has also led the effort to establish guidelines for promoting responsible international agricultural investments ensuring that no forced displacement takes place, and that the process is transparent. A draft of the Principles for Responsible Agricultural Investment (PRAI) has been prepared while more discussions are held for finalizing the draft proposals.
83
Boosting Sustainable Agricultural Growth in Sub-Saharan Africa
The important point is to establish a win-win relationship advantageous to both investing firms/individuals and small farmers through agricultural investments; and it is crucial to incorporate such a mutually benefitting structure into the programs and project designs. Various measures must be taken to assure such development, including that of government regulatory reform, the strengthening of farmer support systems, and continued support from the international community.
2.2. Vulnerability/resilienceFrom 2010 to 2011, the Horn of Africa region was affected by a serious drought, leaving approximately 10 million people in severe food insecurity. The Sahel region in West Africa still suffers from the impact of drought today. Due to its dependency on rainwater and underdeveloped distribution systems, Africa is traditionally vulnerable to shocks, such as drought and floods. It has periodically suffered a great deal of damage, and the cycle has been more irregular in recent years, while precipitation itself is in decline (Figure 6).
Principles for Responsible Agricultural Investment (PRAI)
Principle 1: Existing rights to land and associated natural resources are recognized and respected.
Principle 2: Investments do not jeopardize food security but rather strengthen it
Principle 3: Processes relating to investment in agriculture are transparent, monitored, and ensure accountability by all stakeholders, within a proper business, legal, and regulatory environment.
Principle 4: All those materially affected are consulted, and agreements resulting from consultations are recorded and enforced.
Principle 5: Investors ensure that projects respect the rule of law, reflect industry best practice, are economically viable, and result in durable shared value.
Principle 6: Investments generate desirable social and distributional impacts and do not increase vulnerability.
Principle 7: Environmental impacts of projects are quantified and measures are taken to encourage sustainable resource use, while minimizing the risk/magnitude of negative impacts and mitigating them.
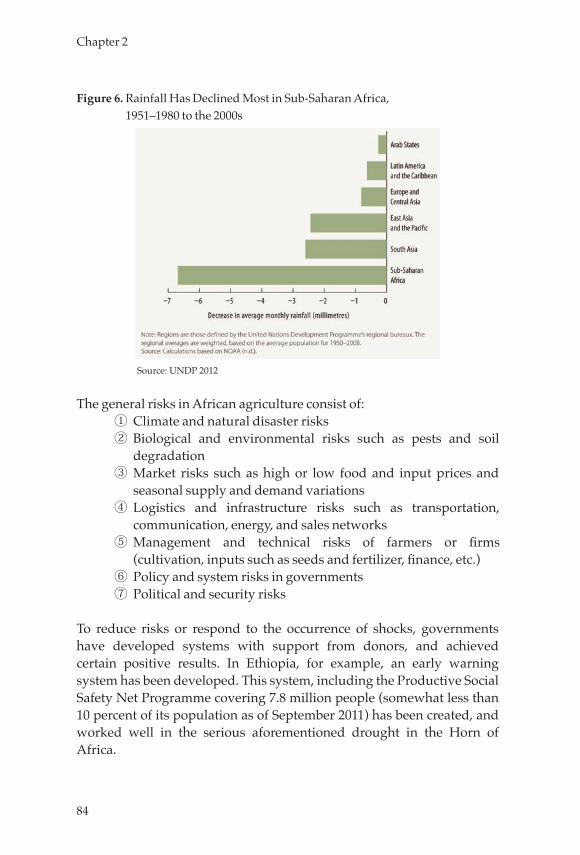
84
Chapter 2
Figure 6. Rainfall Has Declined Most in Sub-Saharan Africa, 1951–1980 to the 2000s
Source: UNDP 2012
The general risks in African agriculture consist of:① Climate and natural disaster risks② Biological and environmental risks such as pests and soil
degradation③ Market risks such as high or low food and input prices and
seasonal supply and demand variations④ Logistics and infrastructure risks such as transportation,
communication, energy, and sales networks⑤ Management and technical risks of farmers or firms
(cultivation, inputs such as seeds and fertilizer, finance, etc.)⑥ Policy and system risks in governments⑦ Political and security risks
To reduce risks or respond to the occurrence of shocks, governments have developed systems with support from donors, and achieved certain positive results. In Ethiopia, for example, an early warning system has been developed. This system, including the Productive Social Safety Net Programme covering 7.8 million people (somewhat less than 10 percent of its population as of September 2011) has been created, and worked well in the serious aforementioned drought in the Horn of Africa.
85
Boosting Sustainable Agricultural Growth in Sub-Saharan Africa
In addition to such direct and expedient approaches, it is essential over the medium and long terms to build up the society’s capability - that is the society’s “resilience”- to withstand such shocks and, once they occur, to minimize their damage. Such medium and long term measures may also include increasing production in highly productive areas in order to quickly distribute food to affected areas via a distribution network when shocks occur; securing water at the community level; and the introduction of crops and cultivation methods that are resistant to natural disasters.
Unfortunately, the emergency humanitarian support and medium and long-term approaches tend to be planned and carried out independently of one another by government departments and donors, sometimes with avoidable overlaps. To overcome this tendency, there have been some attempts to coordinate all parties to create efficiency and synergistic effects, such as the Nairobi Declaration from the Summit on the Horn of Africa held in September 2011.
2.3. International frameworks for African agricultural developmentStarting with the 2008 G8 Toyako Summit and the 2009 G8 L’Aquila Summit, global leaders expressed alarm at the effects of food price spikes and agreed on taking decisive action for ensuring food security, while recognizing the importance of providing support to Africa, considered to be the most vulnerable region. Various efforts have been made on a global scale since then to promote food security and sustainable agricultural production while taking into account actions primarily for Africa. However, lack of sufficient policy coordination among them still remains a challenge which needs to be strategically addressed. Here are some of the strategies taken by the international community:
(1) The Action Plan on Food Price Volatility and Agriculture from the 2011 G20 Summit in France.
In 2011 several working groups on agricultural and food security were set up within the G20 framework including member countries, international agencies, and governments of developing countries, some from Africa. As a result of their active discussions, a ministerial declaration entitled “The Action Plan on Food Price Volatility and Agriculture,” consisting of the following points, was adopted prior to the G8 Summit in Cannes:
① Improve short and long-term agricultural production and
86
Chapter 2
productivity to respond to increasing demands for agricultural commodities
② Improve market information and transparency to respond further to the needs of governments and economic operators
③ Increase confidence in international markets, prevent food market crises more efficiently, and strengthen international policy coordination for responding to the crises
④ Especially in the poorest countries, improve and develop risk management tools to be used by governments, firms, and farmers for establishing the capability to manage and ease risks accompanying food price volatility
⑤ Improve functioning of agricultural commodity derivatives markets
This declaration was a major milestone in the sense that it reviewed all of the existing efforts, and then adjusted them according to their mutual consistency and level of strategy, simultaneously clarifying insufficient points and suggested actions, and identifying monitoring methods and implementing agencies in a comprehensive manner. Many of the specific projects and initiatives supported or suggested in the declaration are currently in progress or under preparation. The importance of rice in Africa and the Coalition for African Rice Development (CARD), supported by Japan (the Japan International Cooperation Agency, JICA), are included in the Action Plan and both are recognized as significant initiatives.
(2) The New Alliance for Food Security and Nutrition from the 2012 G8 held in the United States
In May 2012, the G-8 Action on Food Security and Nutrition was announced at the G8 Camp David Summit held in the United States, and a commitment was made with the announcement of the New Alliance for Food Security and Nutrition in support of Africa. This is a framework aiming to pull 50 million people out of poverty over the next 10 years through promoting private and public investments; advancing technical innovations, risk management, and other tasks; and promoting agricultural development in Africa. Six countries, Tanzania, Ethiopia, Ghana, Mozambique, Cote d’Ivoire, and Burkina Faso were selected as pilot countries.
Since 2011, the Grow Africa Agricultural Investment Forum has been
87
Boosting Sustainable Agricultural Growth in Sub-Saharan Africa
held (in November 2011 and May 2012) under the leadership of the World Economic Forum (the Davos conference) for the promotion of private investments in agricultural fields as a major pillar of African development. The New Alliance incorporates actions of Grow Africa and is a positive step towards strengthening the promotion of private investments.
It can be said that the New Alliance reinforces the weaker part of actions taken by the Comprehensive Africa Agricultural Development Programme (CAADP), to promote private investment. Cooperation frameworks (agreements) to be created for execution at the level of each country will include government commitments for improving investment environments, prospects for donor funding for relevant fields, and detailed statements of intent from the private sector for investments. As such, it is drawing attention as the first attempt for governments, donors, and the private sector to share cooperative frameworks.
(3) CAADPThe Comprehensive Africa Agricultural Development Programme (CAADP) is an African initiative and framework aimed at revitalizing African agriculture. It is specified as a program to achieve growth in food security, nutrition, and rural income, in the Maputo Declaration adopted at the Assembly of the African Union (AU) held in Maputo in July 2003. The Maputo Declaration consists of goals for African countries to: achieve economic growth, end hunger, reduce poverty, and work on agricultural reforms pertinent to policy and capability issues in African agriculture, targeting an annual average growth rate of 6 % in agricultural fields by 2015. It also includes a decision to allocate 10 % of the national budget in each country to agricultural programs.
Specifically, the goals are to be accomplished by achieving the following four pillars:
① Improve land and water management (expanding the area of farmland under a sustainable land and water resource management system)
② Improve market access (expansion of market access through development of rural infrastructure and improvement in trade and transaction related measures)
③ Fight hunger through expansion of food production (increase
88
Chapter 2
food supplies and reduce hunger by improving productivity of small-scale farmers and improve responses to food crises)
④ Promote agricultural research and dissemination (improve agricultural research systems for disseminating appropriate new technologies and strengthen support enabling farmers to employ the technologies)
The main process entails: holding a roundtable meeting in each country first; signing a strategic agreement called a compact between the government and donors for comprehensive agricultural development; and then creating an investment plan laying out detailed actions and costs. (As of November 2012, 40 countries have been involved in the CAADP process, and 30 of them have signed compacts while 27 of them have developed investment plans.)In Africa, there have been some attempts at creating agricultural sector programs to be managed within the framework of the Sector Wide Approaches (SWAPS), accomplishing certain positive results. However, some of these did not necessarily match with the actions taken under a government’s own budget and had weak ties with investments in related fields such as rural infrastructure development. In view of these experiences, CAADP can be regarded as a comprehensive strategic framework for organizing and integrating existing policies, programs, and cooperation frameworks in each country. Nonetheless, compacts and investment plans that have been already shared tend to look more like shopping lists itemizing necessary policies and actions, without due consideration for such factors as investment environment. To make them truly useful for strategic planning, more work is deemed necessary in order to narrow down the measures, assign priorities, improve the accuracy of cost accumulation, sort out timeframes and steps, and strengthen the collaboration with private investors.
3. Direction of Support in TICAD VHaving looked at the global circumstances surrounding Africa as well as some recent topics in African agriculture, we turn now to a discussion of JICA’s support for African agricultural development with an eye towards TICAD V.
3.1 Direction of JICA’s support (overview)The share of agricultural support in the total amount of official
89
Boosting Sustainable Agricultural Growth in Sub-Saharan Africa
development assistance by all donors in Africa kept shrinking until 2004 when it was reversed; then the average share was 6 %. Meanwhile, Japan was consistent in its support for African agriculture, devoting an average 11 % of its budget for agriculture during the same period.
As we saw earlier, agriculture still has a strong presence in Africa, where 64 percent of households depend on it and it accounts for 34 percent of Africa’s GDP. Agriculturral growth has a high poverty reduction effect by its effects (more than twice as much as that of other sectors (World Bank 2008)) and the continent has a comparative advantage in it. Overall, it can be thought of as an excellent source of increasing wealth and of poverty reduction.
Now that the possibility of production increase by land expansion has become limited, every possible attempt must be made to improve agricultural productivity. As before, JICA will place the improvement of agricultural productivity and support for production expansion at the center of its support program at TICAD V and beyond. Also emphasized in JICA’s support is the development of value chains, covering both upstream (such as inputs production) and downstream (such as post-harvest and distribution) activities, for achieving improved productivity and expanded production. JICA will provide support while strengthening its partnerships with private firms as agents. It is also important that small farmers themselves make efforts in marketing and building highly profitable farming systems. Agricultural investments in Africa are on the rise in recent years, and by leveraging this trend, a win-win relationship between firms and small farmers should be developed so that it leads to their production expansion and income improvement.
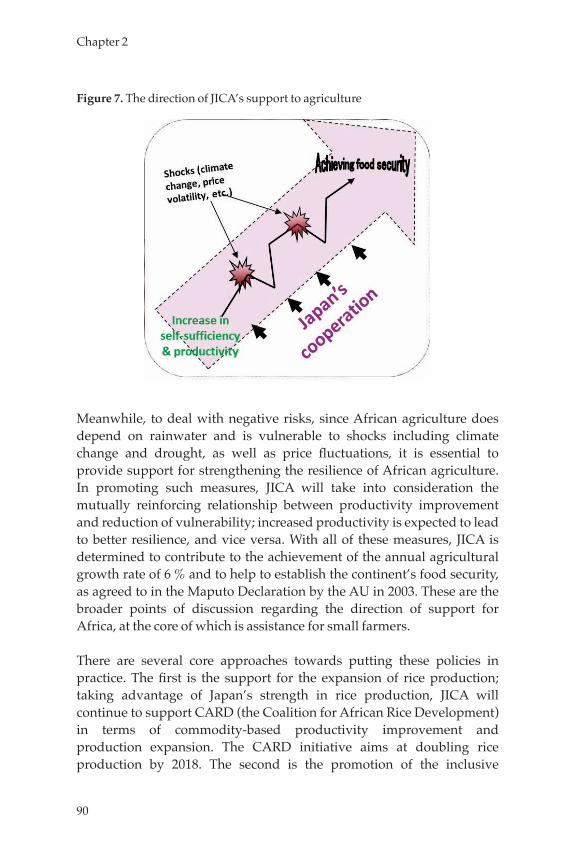
90
Chapter 2
Figure 7. The direction of JICA’s support to agriculture
Meanwhile, to deal with negative risks, since African agriculture does depend on rainwater and is vulnerable to shocks including climate change and drought, as well as price fluctuations, it is essential to provide support for strengthening the resilience of African agriculture. In promoting such measures, JICA will take into consideration the mutually reinforcing relationship between productivity improvement and reduction of vulnerability; increased productivity is expected to lead to better resilience, and vice versa. With all of these measures, JICA is determined to contribute to the achievement of the annual agricultural growth rate of 6 % and to help to establish the continent’s food security, as agreed to in the Maputo Declaration by the AU in 2003. These are the broader points of discussion regarding the direction of support for Africa, at the core of which is assistance for small farmers.
There are several core approaches towards putting these policies in practice. The first is the support for the expansion of rice production; taking advantage of Japan’s strength in rice production, JICA will continue to support CARD (the Coalition for African Rice Development) in terms of commodity-based productivity improvement and production expansion. The CARD initiative aims at doubling rice production by 2018. The second is the promotion of the inclusive
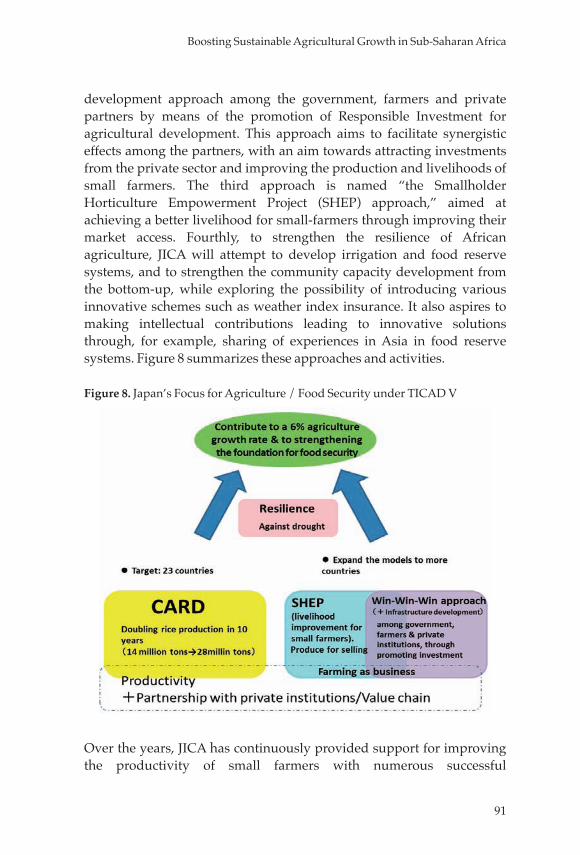
91
Boosting Sustainable Agricultural Growth in Sub-Saharan Africa
development approach among the government, farmers and private partners by means of the promotion of Responsible Investment for agricultural development. This approach aims to facilitate synergistic effects among the partners, with an aim towards attracting investments from the private sector and improving the production and livelihoods of small farmers. The third approach is named “the Smallholder Horticulture Empowerment Project (SHEP) approach,” aimed at achieving a better livelihood for small-farmers through improving their market access. Fourthly, to strengthen the resilience of African agriculture, JICA will attempt to develop irrigation and food reserve systems, and to strengthen the community capacity development from the bottom-up, while exploring the possibility of introducing various innovative schemes such as weather index insurance. It also aspires to making intellectual contributions leading to innovative solutions through, for example, sharing of experiences in Asia in food reserve systems. Figure 8 summarizes these approaches and activities.
Figure 8. Japan’s Focus for Agriculture / Food Security under TICAD V
Over the years, JICA has continuously provided support for improving the productivity of small farmers with numerous successful
92
Chapter 2
achievements, and a substantial body of knowledge and know-how has now been accumulated. This emphasis on productivity improvement, JICA’s consistently-held principle, seems to be being re-evaluated in the development community; those donors who used to prioritize the development of value chains by leveraging market mechanisms over the support for production, seem to be increasing their support for production and productivity improvement, especially after the food price spike of 2008. Arguably, JICA’s approaches and past achievements are gaining renewed recognition.
In the sections that follow, we will have a closer look at the four approaches outlined above.
3.2 Coalition for African rice development (CARD) (doubling rice production)
Rice consumption has rapidly increased in Africa, and its import has risen accordingly, bringing more pressure for foreign currency constraints. (The share of rice in the total amount of cereal imports in 2010 was about 40 percent (OECD-FAO 2011).) Rice is one of the few cereals among major cereals in Africa that have a high potential for expansion of its production in the region. In TICAD IV held in 2008, JICA and the Alliance for a Green Revolution in Africa (AGRA) jointly announced the launch of the Coalition for African Rice Development (CARD), with a goal of doubling rice production in Africa in the 10 years ending in 2018. This is an international platform for promoting rice development, comprising international organizations and donors such as the World Bank and the International Fund for Agricultural Development (IFAD); research institutes such as the International Rice Research Institute (IRRI), the Africa Rice Center (AfricaRice), the Japan International Research Center for Agricultural Sciences (JIRCAS); non-governmental organizations, and South-South cooperation countries (such as Vietnam).2 CARD countries consist of a total of 23 African countries that are divided into a first group of 12 countries with relatively high importance of rice in the country/region, and a second group of 11 countries catching up with the first.
Within the CARD framework, each country has set up a task force for rice cultivation development and drawn up its National Rice
2. For the discussion of the CARD initiative as an example of South-South cooperation, see Chapter 13.
93
Boosting Sustainable Agricultural Growth in Sub-Saharan Africa
Development Strategies (NRDS), with relevant agencies providing support on the basis of the NRDS. JICA has mainly provided support for productivity improvement, including dissemination and expansion of appropriate cultivation technologies and seeds (such as the New Rice for Africa (NERICA)) among farmers and dissemination staff; JICA is carrying out about 60 projects as of August 2012 (including training in Japan). Rice production is steadily making progress from a baseline of 14 million tons prior to CARD to 18.41 million tons as of 2010.
JICA plans to steadily cooperate with the first group of participating countries as well as to increase support for the second group, expanding comprehensive support covering the development of value chains, and strengthening cooperation with private firms and other partners (the Unites States, South Korea, the Bill and Melinda Gates Foundation, and BRAC).
3.3 Inclusive development approach among Governments, farmers and private partners through the promotion of responsible investment for agricultural development
The Mozambique agricultural development program of triangular cooperation between Japan, Brazil and Mozambique (ProSAVANA) offers an agricultural development program with an aim of achieving a better livelihood for small farmers and the promotion of agricultural investments by the private sector, and to create their synergistic effects. Along with specific policy suggestions made at a national level in the draft of the Principles for Responsible Agricultural Investment (PRAI) led by Japan, attempts towards realizing synergistic effects of agricultural development and distribution infrastructure development hold unique additional values in Africa.
For increasing the agricultural productivity of small farmers and their earnings, not only the refining of their technologies but also the improving and reforming of value chains both upstream (inputs such as seeds and fertilizer) and downstream (post-harvest handling, distribution, etc.) are essential. Private firms play a great role as main players in this effort, and their investments must be increased. JICA will attempt to expand its approach for similar development in countries with potentials for future agricultural investments.
94
Chapter 2
3.4 Smallholder horticulture empowerment project (SHEP) approach: reform in small farmer’s approach from “selling after harvesting” to “harvesting to sell”
Currently, the second phase of SHEP (SHEP UP) is in progress in Kenya with the goal of carrying it out nationwide. It has achieved doubled earnings for farmers by inducing a change in their management model - a change from one based on the mindset of “selling crops after harvesting” to the one based on “harvesting to sell,” and has been well-received by the Kenyan government and other donors. This is a market-oriented type approach that encourages small-scale farmers to perform their own market research to select crops to be sold and learn market-competitive cultivation technologies, instead of harvesting crops first and then looking for a place to sell. As a result of promoting women’s active involvement in farming with this approach, men and women have worked together to achieve more efficient farming. This case was presented in the meeting of the DAC Network on Gender Equality in 2011, receiving high praise from its participants.
Using this success as a foothold, JICA will seek to further generalize and consolidate the approach to be expanded as a regional program with SHEP in Kenya as a base, supplemented by training in Japan.
3.5 Toward strengthening resilienceIn recent years, African agriculture has been exposed to increasing risks, such as climate change and food price hikes, and the resilience of countries and communities, i.e., their response capabilities against these risks must be strengthened. Since the severe drought in the Horn of Africa in 2011, JICA has been administering regional programs, which attempt to resolve the gap between humanitarian support and medium-term development to assure human security of the people. The idea of the programs is to help people to be “independent players in the economy” rather than “subjects of social protection.” Specifically, programs are offered to pastoralists and others for strengthening their resilience (response capability) against drought in their communities in Kenya, Ethiopia, and Djibouti. A similar project is underway in West Africa.
JICA hopes to implement similar projects and, at the same time, provide support in building irrigation facilities and develop capacity for operating and maintaining them for the effective management and use
95
Boosting Sustainable Agricultural Growth in Sub-Saharan Africa
of water. It also hopes to provide more support in establishing networks of small-scale food reserves with high mobility. Furthermore, it may be possible for JICA to contribute to food reserve system development (at the regional level), such as the Economic Community of West African States (ECOWAS) on the basis of experiences in the ASEAN Plus Three Emergency Rice Reserve (APTERR). JICA intends to consider support for innovative systems such as weather index insurances. As stated, JICA will take into consideration the mutually reinforcing relationship between productivity improvement and the reduction of vulnerability. Increased productivity is expected to lead to better resilience, and vice versa.
96
Chapter 2
References
Anseeuw, W., L. Alden Wily, L. Cotula, and M. Taylor (International Land Coalition). 2012. Land rights and the rush for land: Findings of the Global Commercial Pressures on Land Research Project. Rome: International Land Commission.
FAO, and WFP. 2012. The state of food insecurity in the world 2012. Rome: FAO.
FAO, IFAD, IMF, OECD, UNCTAD, WFP, World Bank, WTO, IFPRI, and UN HLTF. 2011. Price volatility in food and agricultural markets: Policy responses. Policy report prepared for November 2010 G20 leaders summit meeting.
Hirano, K., ed. 2003. Afurika keizai-gaku sengen [Toward the economics of Sub-Saharan Africa]. Tokyo: JETRO.
Humphrey, J. 2003. Commodities, diversification and poverty reduction. Paper presented to FAO Symposium on the state of agricultural commodity market research, Rome, December 15–16.
Jaffee, S., P. Siegel, and C. Andrews. 2008. Rapid agricultural supply chain risk assessment. Commodity Risk Management Group, Agriculture and Rural Development Department, World Bank.
JICA Rural Development Department. 2011. Kadaibetsu shishin: nōgyo kaihatsu, nōson kaihatsu [Thematic guidelines on agricultural development and rural development]. Tokyo: Japan International Cooperation Agency.
Kitagawa, K., and M. Takahashi, eds. 2004. Afurika keizai-ron [Economics for Africa]. Tokyo: Minerva Shobo.
OECD, and FAO. 2011. OECD-FAO agricultural outlook 2011–2020. Paris: OECD; Rome: FAO.
Oxfam. 2010. Horn of Africa risk transfer for adaptation. HARITA quarterly report: October 2010–December 2010.
Sonobe, T., and M. Fujita. 2010. Ricchi to keizai hatten [Location and economic development]. Tokyo: Toyo Keizai.
Takahashi, M. 2005. Afurika no nōgyō teitai to seifu no yakuwari [African agricultural stagnation and roles of government]. In Afurika keizai jisshō bunseki [Empirical studies on the African economy], ed. K. Hirano. Tokyo: JETRO.
UNDP. 2012. Africa human development report 2012: Toward a food secure future. New York: UNDP, Regional Bureau for Africa.
United States Department of Agriculture. 2012. World agricultural supply and demand estimates.
97
Boosting Sustainable Agricultural Growth in Sub-Saharan Africa
Vermeulen, S., and L. Cotula. 2010. Making the most of agricultural investment: A survey of business that provide opportunities for smallholders. Rome: FAO; London: International Institute for Environment and Development.
Webber, C. M., and P. Labaste. 2009. Building competitiveness in Africa’s agriculture: A guide to value chain concepts and applications. Washington, DC: World Bank.
World Bank. 2008. World development report 2008: Agriculture for development. Washington, DC: World Bank.
World Bank. [Deininger, K., and D. Byerlee, with J. Lindsay, A. Norton, H. Selod, and M. Stickler.] 2011. Rising global interest in farmland: Can it yield sustainable and equitable benefits? Washington, DC: World Bank.

99
Chapter 3: How Promising Is the Rice Green Revolution in Sub-Saharan Africa? - Evidence from case studies in Mozambique, Tanzania, Uganda, and Ghana1
Keijiro Otsuka
1. Introduction
While the population continues to grow rapidly, the pace of area expansion has slowed down considerably in sub-Saharan Africa (SSA) due to the gradual exhaustion of uncultivated areas. On average, cultivated land per farming population has declined by about 40% since the 1960s and value added per worker now averages around 12% below 1980 levels. Investments in the development of new technologies have declined in recent years even though their adoption rates are low compared to other regions. In order to reduce widespread and persistent rural poverty in SSA, it is imperative to increase food production by increasing the productivity per unit of land.
We believe that what is urgently needed in SSA is a Green Revolution, which has successfully increased rice and wheat yields in tropical Asia over the last several decades. In Asia, small farmers actively adopted new improved technologies (David and Otsuka 1994), and there is no reason to assume that small farmers in SSA will not adopt new profitable technologies (Otsuka 2006; Otsuka and Kijima 2010). Yet the appropriate strategies to realize a Green Revolution in SSA are still unclear. Recent studies edited by Otsuka and Larson (2013), which compare the experience of the Asian Green Revolution with current grain farming in SSA, suggest that lowland rice is the most promising grain. This is
1. This is a result of a research project being conducted at JICA Research Institute to empirically analyze how best the CARD initiative (See Chapter 2, Section 3) can serve to increase rice productivity and reduce poverty. I am heavily indebted to its members, namely Yoko Kijima, Kei Kajisa, Yuko Nakano, and Takeshi Sakurai. I would also like to thank JICA Research Institute for the intellectual and financial support it provided for this project.
100
Chapter 3
essentially because high-yielding rice technology can be directly transferable from tropical Asia to SSA (Estudillo and Otsuka 2012; Nakano et al. 2012).
This is illustrated by Figure 1, which compares changes in grain yields over time in India and SSA and their differences between the two regions. India is chosen for comparison because among Asian countries India is agro-climatically similar to SSA and, hence, cropping patterns are not so different (Tsusaka and Otsuka 2013a, 2013b).2 Several important observations can be made. Firstly, grain yields were generally similar between India and SSA in the early 1960s before the Green Revolution began, which indicates that the difference in agro-climatic conditions alone cannot explain the large yield difference between the two regions at present. Secondly, the yields of sorghum and millet did not increase much even in India and the yield gap between the two regions is nil, which suggests that the potential of a Green Revolution in these crops is limited in SSA. Thirdly, the current yield gap is substantial in the case of wheat and rice, even though their yields increased appreciably in SSA. Since wheat can be produced primarily in a temperate zone, its potential production area is more limited than rice in SSA due to the dominance of a tropical climate. Thus, rice is likely to be critically important for the expansion of grain production in SSA. Furthermore, rice consumption has been increasing dramatically in this region in the past few decades. Lastly, the yield gap is only modest in maize, even though maize is the most important crop in SSA in both production and consumption. It is likely that the productivity gain in the maize sector in SSA from a technology transfer from Asia will not be large.
Although rice looks a promising crop from the aggregate data, micro-level evidence is needed to substantiate the argument that rice is the most promising crop in SSA. The first purpose of this study is to analyze the potential of a rice Green Revolution in SSA based on recently completed cases studies of rice-growing households in Mozambique,
2. For example, sorghum and millet are grown in many countries in SSA but primarily in India in Asia. Analytically, however, a comparison between tropical Asia as a whole and SSA does not lead to major changes in our discussion (Estudillo and Otsuka 2012).
101
How Promising Is the Rice Green Revolution in Sub-Saharan Africa?- Evidence from case studies in Mozambique, Tanzania, Uganda, and Ghana
Tanzania, Uganda, and Ghana.3 The second purpose is to draw up the implications of an effective strategy for a rice Green Revolution in SSA. We believe that, if successful, a rice Green Revolution can be a role model for Green Revolutions in other grains, particularly in maize production.
2. Is Asian Rice Technology Transferable to SSA?
Asian rice technology. Although the rice yield is still low in SSA, we should not overlook the fact that it has increased from 1.25 tons per hectare in the early 1960s to 1.8 tons per hectare in the late 2000s. In tropical Asia where lowland rice production dominates, the rice yield before the Green Revolution was 1.5 tons per hectare (see Figure 1).4 Also, note that half of the rice area in SSA is upland, where the yield is substantially lower than in lowland paddy fields (Balasubramanian et al. 2007). Thus, it seems reasonable to assume that if new technology is not introduced and production is carried out under rain-fed conditions, the lowland paddy yield will range from 1.0 to 1.5 tons per hectare. We also hypothesize that the average rice yield has increased in SSA primarily due to the introduction of Asian-type improved rice technology.5
We focus on lowland rice, not upland rice, primarily because the prospect for a large improvement of the yield is much greater for lowland rice than upland rice. We also did not encounter upland rice, such as NERICA (new rice for Africa), in our study sites except in Uganda. Kijima et al. (2006, 2008, 2011) found that NERICA is potentially high-yielding but sensitive to rainfall and that the rate of discontinuation of NERICA adoption is also high, indicating that NERICA was grown in unsuitable areas or that sustainable management was not well understood by farmers. Also, the NERICA yield is exceptionally high in Uganda compared with other countries in SSA (Otsuka and Larson 2013). The tentative conclusion of this study is that upland rice is not particularly promising, even though there were great expectations for
3. Senegal is also included in this project but the data collection has been delayed, so its analytical results will be reported later. Note, however, that according to our preliminary survey, the average irrigated rice yield in the Senegal River basin exceeds 5 tons per hectare, which is comparable to the irrigated yields in Asia.4. Nearly half of the paddy fields were irrigated in Asia but the difference in yield between rain-fed and irrigated areas was not large before the advent of MVs.5. This is consistent with the results of a review of rice farming in SSA by Balasubramanian et al. (2007).
102
Chapter 3
the impact of NERICA on the upland rice yield.
The Green Revolution in Asia is alternatively called the seed-fertilizer revolution because the engine of growth was the development and diffusion of fertilizer-responsive, high-yielding modern varieties (MVs) of lowland rice (David and Otsuka 1994). It is also important to realize that paddy fields were bunded and leveled almost without exception in Asia when the rice Green Revolution began.6 Bunding is needed to store water in the paddy fields to reduce weed growth, whereas leveling is necessary for even growth of rice plants and germination of directly broadcasted seeds. In other words, these production practices are essential for water and weed control and healthy growth of lowland rice plants. Draft animals or tractors are usually used for bunding and leveling, but they are often not used in SSA, as will be shown shortly. No less important than these production practices is straight-row transplanting, which provides space for weeding. Instead of transplanting, direct seeding can be adopted without sacrificing yield if paddy fields are bunded and leveled well and if herbicide is used. Herbicide, however, may not be available or may be too expensive, even if available in SSA. In the African setting, direct seeding is not generally recommended and transplanting is the generally preferred option. A major contribution of this study is to establish that these improved production practices are highly complementary to improved seed-fertilizer technology.
The case of Mozambique. Table 1 compares yields and production practices across rain-fed and irrigated areas in Mozambique (Kajisa and Payongayong 2011a, 2011b). Thirty-three villages in 9 districts in Zambezia and Sofara provinces in the Central region are chosen as representative rain-fed areas in this country, whereas the Chokwe irrigation scheme in the southern region is chosen as the irrigated study site. As in other countries in SSA, the irrigated area accounts for a small proportion of paddy area in this country. Furthermore, MVs are seldom adopted, chemical fertilizer is not used, and animal and tractor use is nil in rain-fed areas. Under such conditions, the rice yield is very low and unstable with the average being a mere 1.1 tons per hectare, which is consistent with our expectations. The yield per hectare is not very high
6. There is no clear evidence on the prevalence of bunding and leveling in paddy fields in Asia in the 1960s and 1970s. My argument is based on interviews with rice scientists who worked in Asia in the 1970s.
103
How Promising Is the Rice Green Revolution in Sub-Saharan Africa?- Evidence from case studies in Mozambique, Tanzania, Uganda, and Ghana
in the Chokwe irrigation scheme either, mainly because the irrigation facilities are not well maintained. In fact, the top 20% of farmers, who receive adequate water, adopt MVs, and apply fertilizer, achieve a rate as high as 3.9 tons per hectare. Note that popular MVs are old MVs developed in Nigeria (ITA312) in the late 1970s by crossing Asian MVs and African local varieties.7 This clearly shows that there has been no attempt to transfer new Asian-type varieties to Mozambique. The yield could be higher if more modern improved MVs had been disseminated in Chokwe.
The case of Tanzania. The case of Tanzania is more revealing (Table 2). The three major rice growing districts with distinctly different production environments were chosen for this study. First, the average yield in rain-fed areas ranges from 1.6 tons per hectare in the Shinyanga region to 2.0 tons per hectare in the Morogoro region, which is much higher than in rain-fed areas in Mozambique. This relatively high yield in rain-fed areas in Tanzania can be attributed, at least partly, to some adoption of MVs, some chemical fertilizer application, and the adoption of some improved production practices. Second, the yields are considerably higher in irrigated areas. The adoption rate of MVs is very high in the Morogoro region, whereas chemical fertilizer use is high in the Morogoro and Mbeya regions. Note that there is no tradition of rice production in Tanzania, so even “traditional varieties” are imported improved varieties from abroad. This would explain why the yield is as high as 4.6 tons per hectare under irrigated conditions in the Shinyanga region, even though the adoption rate of MVs is very low. Third, the adoption rates of bunding and leveling are close to 100% in irrigated areas, which seems to help explain the considerably high yields in irrigated areas in Tanzania. Thus, it is clear that a combination of improved seeds, improved production practices, and irrigation leads to significantly high yields, resulting in a “mini” Green Revolution in this country.
The case of Uganda. The importance of improved production practices can also be clearly seen from the case study of basically rain-fed areas in the Eastern Region in Uganda (see Table 3), as reported by Kijima, Ito, and Otsuka (2011, 2012). Note that Bugiri and Mayuge were sites of a participatory rice training program offered by JICA, whereas no such
7. To our surprise, C4, which was developed in the early 1960s by the University of the Philippines, Los Banos, was adopted in 22% of the paddy fields in Chokwe.
104
Chapter 3
training was offered in Bukedea and Pallisa. Also note that the demonstration of a simple irrigation scheme was implemented only in Bugiri. Roughly speaking, the difference between Bugiri and Mayuge is due primarily to the presence of irrigation in the former, whereas a major part of the difference between Burigi-cum-Mayuge and Bekedea-cum-Palissa is due mainly to the implementation of a rice training program in the former areas, even though some yield differences can be attributed to differences in agro-climate. In Bugiri, where Asian-type MVs are adopted in more than 40% of paddy fields, the yield and the number of improved production practices adopted are positively correlated, indicating that MVs and improved production practices are complementary. Considering that chemical fertilizer is not applied in Uganda, the yield of more than 4 tons per hectare is impressively high, indicating the high potential of rice yields in this country due to relatively high precipitation and fertile soil. It is likely, however, that such high yield is unsustainable, unless fertilizer is applied to maintain soil fertility.8 The yield in Mayuge is reasonably high if all four improved production practices are adopted. In contrast, the yields are much lower and variable regardless of the adoption of improved practices in Bekedea and Palissa. Even if improved production practices are adopted, whether they are adopted properly can be questioned, as these areas were not covered by the training program. The average yield in these two sites is 1.8 tons per hectare, which is not low compared with other rain-fed areas in SSA. A critically important finding of the Uganda case study is that the rice training program encouraged the adoption of improved production practices and improved the profitability of rice farming (Kijima, Ito, and Otsuka 2012).
It must be pointed out that the rain-fed area in Uganda is located at the bottom of a valley. Although it is rain-fed, its production environment is favorable for lowland rice production, because the soil is fertile and moist. In my observations, such production environments are abundant in SSA, and most have been unused until recently. Probably for rice production such rain-fed area is more favorable than rain-fed areas in Asia, most of which are located in flat areas. The Northern Region in Ghana is another example of a rain-fed area at the bottom of a valley with mild slopes, which has huge potential to increase rice production.
8. In the Doho irrigation scheme located in the Easter Region, the rice yield is about 3 tons per hectare, even though double cropping of rice has been practiced for a few decades without chemical fertilizer (Nakano and Otsuka 2011).
105
How Promising Is the Rice Green Revolution in Sub-Saharan Africa?- Evidence from case studies in Mozambique, Tanzania, Uganda, and Ghana
The case of Ghana. The case study in Northern Ghana is unique in that it compares the rice farming performance between villages where the Lowland Rice Development Project (LRDP) was implemented and villages where no such project was implemented (deGraft-Johnson et al. 2012). Twenty project villages and 40 non-project villages were selected randomly for this study and in each village 20 rice-farming households were surveyed.9 Out of 40 non-project villages, 20 are located within a 20-kilometer radius of any of the project villages and the other 20 are located beyond the 20-kilometer radius. The former are called “nearby villages” and the latter “remote villages.” The LRDP, which was implemented from 1998 to 2003, was designed to promote the dissemination of MVs, chemical fertilizer use, bunding, leveling, and dibbling.10 Aside from the practice of dibbling, the four technologies are essential components of Asian Green Revolution technology. Thus, in a sense, the purpose of LRDP was to transfer Asian Green Revolution technology to SSA. Transplanting was not recommended because this area suffers from floods and seedlings cannot survive under submerged conditions.
According to Figure 2, improved technologies were seldom adopted before the implementation of the LRDP. During the LRDP implementation period they were adopted primarily in the project villages, whereas they were diffused to nearby villages after the LRDP period, suggesting technology spillovers from the project to other villages. The adoption rates of new technologies are generally low in remote villages.11 It is clear that the adoption rates of both MVs and chemical fertilizer are equally high, which indicates the strong complementarity between fertilizer-responsive MVs and fertilizer. Leveling is adopted by about half of the sample farmers at present, whereas bunding and dibbling are not widely adopted. Another important observation is that the rate of dis-adoption, i.e., adoption in the past but discontinuation later, is high for dibbling. According to our respondents, dibbling is highly labor-intensive, and this is the major reason for dis-adoption. Thus, we suspect that dibbling may not be appropriate technology in this region.9. Reliable data were obtained from 545 households. 10. Dibbling is a crop establishment method in which seeds are planted in holes created by sticks. Dibbling is not needed, if paddy fields are well bunded and leveled so that broadcasted seeds are germinated well. 11. Socio-economic conditions are very similar between the project and nearby villages, whereas the remote villages are far from the capital city and endowed with large land areas.
106
Chapter 3
Table 4 summarizes the technology adoption, paddy yield, labor use, and the factor share of labor. It is clear that the rice yield is lowest among non-adopters of new technology, which is 1.5 tons per hectare and falls in the expected range under rain-fed conditions without new technologies. The yield becomes higher as larger amounts of new technologies are adopted. It is interesting to observe that an average yield of 2.6 tons per hectare among full-package technology adopters is almost identical to the average lowland rice yield under rain-fed conditions in Asia in the late 1980s reported by David and Otsuka (1994). This indicates that the yield potential under rain-fed condition in SSA is not inferior to that in tropical Asia. While it is true that labor use per hectare becomes larger with increases in the adoption of new technologies, the factor share of labor tends to decline, which indicates that new technologies are not labor-using.
In sum, our case studies demonstrate large potentials to increase rice yields in SSA by disseminating Asian Green Revolution technology. Although we did not discuss in detail in this article, our case studies indicate that new technologies are not only productive but also profitable. In short, Asian rice Green Revolution technology is directly transferable to SSA.
3. Key Questions
Before recommending further dissemination of new technologies, we must ask a few key questions. The first question is whether the benefit of new technologies accrues to small farmers. If these new technologies are adopted primarily by large farmers, their contribution to poverty reduction is limited, because it is small farmers who suffer from poverty (Yamano, Otsuka, and Place 2011). The second question is what the major constraints are on the adoption of new technologies. In order to disseminate new technologies to wide areas, we have to remove such constraints.
Commonly our case studies do not find any significantly positive effect of farm size on technology adoption. In the case of Ghana, it has a negative and significant effect on the adoption of dibbling, which is highly labor-intensive. In both irrigated and rain-fed areas in Mozambique (Kajisa and Payongayong 2011a, 2011b) and Uganda
107
How Promising Is the Rice Green Revolution in Sub-Saharan Africa?- Evidence from case studies in Mozambique, Tanzania, Uganda, and Ghana
(Kijima, Ito, and Otsuka 2011), the effects of farm size on paddy yields are found to be negative, implying that the yield per hectare is higher on smaller farms. These findings are consistent with the negative correlation between farm size and yield widely observed in SSA recently (Larson et al. 2012), which can be explained by the higher intensity of family labor on smaller farms.12 While the effect of farm size on rice income per hectare is negative and significant in Tanzania (Nakano and Kajisa 2012), no effect on profit is found in Uganda and Ghana (Kijima, Ito, and Otsuka 2012; deGraft-Johnson et al. 2012). Thus, there is no evidence that new rice technologies particularly favor large farms. On the contrary, they seem to be conducive to equitable distribution of income in rural communities in SSA by offering expanded work opportunities for family labor, which is a major resource of poor small farmers. This is consistent with the observations in Asia that the impacts of the rice Green Revolution technology are neutral with respect to farm size (David and Otsuka 1994).
While irrigation is found to be an important determinant of rice yield, there is no evidence that it is necessary for the adoption of new technology. Considering that rain-fed areas dominate in SSA, a critically significant finding of this study is that the improved rice technologies have significant impacts on the rice yields under rain-fed conditions. Judging from the results of studies in the rain-fed areas of Uganda and Ghana (Tables 3 and 4), it seems possible to increase rice yield by 50 to 100% by adopting the improved technologies. In order to increase the rice yield much further, irrigation is needed. Whether irrigation investment pays is an important issue to be examined carefully.
The finding that training activities with demonstration plots are effective in the dissemination of the new rice technologies in Uganda and Ghana suggests that a major constraint on the wider adoption of the new technologies is the farmers’ lack of knowledge on new technologies. According to the case study in Ghana (deGraft-Johnson et al. 2012), the spillover effects of new technology adoption in the project villages on the adoption in non-project villages are significant in the case of bunding and leveling but not in the case of MVs and fertilizer applications. The authors argue that this is due to the fact that while the bunding and
12. Monitoring of hired labor in a spatially wide environment in agriculture is costly, so that the endowment of family labor relative to farm size is the critical determinant of crop yield (Hayami and Otsuka 1993).
108
Chapter 3
leveling are visible and imitable, the know-how on appropriate cultivation of MVs with fertilizer cannot be easily copied. If this is true, it may be a good idea to set up a relatively small number of demonstration plots compared with the number of locations where training programs are offered.
Kijima et al. (2011) find that the dis-adoption rate of NERICA is very high (i.e., in the vicinity of 50%). This is either because NERICA was disseminated to unsuitable areas for production or because sustainable management was not well understood by farmers. Indeed, there is the indication that yields of NERICA decline over time due to the deterioration of self-produced seeds or soil quality. In either case, the major problem is that appropriate production knowledge of NERICA was not disseminated to rice farmers.
It is clear that the absence of an effective extension system is a major constraint on the rice Green Revolution in SSA. In Ghana, even though the LRDP was an effective program, similar programs have not been implemented for nearly 10 years. In Uganda, the geographical coverage of the training program is very small. It is worse in Mozambique where no extension program for rice farming has been carried out. Actually, there are a very small number of agricultural extension workers in SSA. Furthermore, only a few of them are knowledgeable about rice farming. Unless we invest in the capacity building of extension workers, the target of CARD (Coalition for African Rice Development), that is the doubling of rice production in ten years from 2008, may not be achieved.
Another possible constraint on technology adoption is the lack of credit. Kajisa and Payongayong (2011) argue that the lack of credit access leads to the insufficient application of chemical fertilizer as well as hired labor use in the Chokwe irrigation scheme in Mozambique. Similarly, Nakano and Kajisa (2011) report that the access to formal credit is an important determinant of fertilizer use, but not MV adoption in Tanzania. MV seeds can be self-produced and, hence, credit access is unlikely to be important in MV adoption. While improving access to credit is likely to be important to increase fertilizer application, it is also remarkable to realize that considerably high rice yields are achieved without functioning credit markets in our four study sites. Therefore, it seems fair to conclude that improved credit access is desirable but not essential for the improvement of rice yields in SSA. Furthermore, according to our
109
How Promising Is the Rice Green Revolution in Sub-Saharan Africa?- Evidence from case studies in Mozambique, Tanzania, Uganda, and Ghana
ongoing research in the Mwea irrigation scheme in Kenya, which is a large irrigation scheme consisting of 12,000 hectares with well-maintained facilities, rice yields are as high as 5 to 7 tons per hectare and credits are supplied not only by agricultural cooperatives but also by rice traders, as in many rice growing areas in Asia. It may well be that large demand for fertilizer induces the development of informal credit markets, where standing crops serve as the role of credit.
4. Concluding Remarks
The four case studies we have reviewed in this article clearly demonstrate that in order to realize the rice Green Revolution in SSA, high-yielding MV seeds, application of fertilizer, and the adoption of bunding and leveling are essential. We found that very high yields are realized in some irrigated areas in Tanzania and Uganda and reasonably high yields are achieved in some rain-fed areas in Tanzania, Uganda, and Ghana. Commonly in these areas, Asian type-MVs as well as bunding and leveling practices are adopted. These findings indicate that Asian rice technology can be directly transferable to SSA.13 On the other hand, there are many areas in SSA where unimproved varieties are adopted, chemical fertilizer is not used, and paddy fields are not bunded and leveled. In such areas, the rice yield is low and ranges from 1.0 to 1.5 tons per hectare, which is close to rice yields in Asia before the Green Revolution. These observations strongly indicate that a strategic priority on the capacity building of extension specialists on rice and strengthening extension activities for rice production will be warranted, in order to realize a rice Green Revolution in SSA.
So far, however, inadequate resources have been allocated to the capacity building and extension. Unless more resources are allocated to these activities, the efforts to realize a rice Green Revolution in SSA are bound to fail.
Since MVs are fertilizer-responsive, once they are adopted, demand for fertilizer will increase, which, in turn, will increase the demand for credit. Similarly, since MVs are more productive under irrigated conditions, adoption of MVs will increase the demand for irrigation
13. Asian varieties, however, are susceptible to yellow mottle virus, which is unique to SSA. Thus, MVs tolerant to this virus must be developed urgently (Balasubramanian et al. 2007).
110
Chapter 3
water. Thus, the benefit and cost of credit programs and irrigation projects must be carefully reassessed, while considering the large expected gains in productivity and profitability of rice farming in SSA.
We have been conducting research on lowland rice production partly because it is the most promising crop and partly because the success of the developing rice sector in SSA can provide a model for a successful Green Revolution in SSA. According to Otsuka and Larson (2013), profitable and productive maize technology is yet to be established. Indeed, although maize is the single most important crop in SSA, we seldom observed impressively high maize yields anywhere in SSA. It seems to us that the prerequisite for a maize Green Revolution is the development of truly profitable and productive maize seeds and farming practices for this crop. Once such technology is developed, it will trigger the change towards the maize Green Revolution in SSA. It is our hope that successful development of the rice sector can be a role model of the Green Revolution in other crops in this region.
111
How Promising Is the Rice Green Revolution in Sub-Saharan Africa?- Evidence from case studies in Mozambique, Tanzania, Uganda, and Ghana
References
Balasubramanian, V., M. Sie, R. J. Hijmans, and K. Otsuka. 2007. Increasing rice production in Sub-Saharan Africa: Challenges and opportunities. Advances in Agronomy 94 (1): 55–133.
David, C. C., and K. Otsuka. 1994. Modern rice technology and income distribution in Asia. Boulder: Lynne Rienner.
deGraft-Johnson, M., A. Suzuki, T. Sakurai, and K. Otsuka. 2012. On the transferability of the Asian Rice Green Revolution to rain-fed areas in Sub-Saharan Africa: An assessment of technology intervention in Northern Ghana. Mimeo, National Graduate Institute for Policy Studies.
Estudillo, J. P., and K. Otsuka. 2012. Lessons from the Asian Green Revolution in Rice. In Otsuka and Larson 2013.
Hayami, Y., and K. Otsuka. 1993. The economics of contract choice: An agrarian perspective. Oxford: Clarendon Press.
Kajisa, K., and E. Payongayong. 2011a. Potential of and constraints to the rice Green Revolution in Mozambique: A case study of the Chokwe irrigation scheme. Food Policy 36 (5): 614–25.
Kajisa, K., and E. Payongayong. 2011b. Potential of and constraints on rain-fed lowland rice farming in Mozambique. Mimeo, International Rice Research Institute.
Kijima, Y. n.d. Expansion of lowland rice production and constraints for Rice Green Revolution: Evidence from Uganda. Mimeo, University of Tsukuba.
Kijima, Y., N. Ito, and K. Otsuka. 2011. On the possibility of a lowland Rice Green Revolution in Sub-Saharan Africa: Evidence from Eastern Uganda. In Emerging development of agriculture in East Africa, ed. T. Yamano, K. Otsuka, and F. Place. Dordrecht: Springer.
Kijima, Y., N. Ito, and K. Otsuka. 2012. Assessing the impact of training on lowland rice productivity in an African setting: Evidence from Uganda. World Development 40 (8): 1619–33.
Kijima, Y., D. Sserunkuuma, and K. Otsuka. 2006. How revolutionary is the “NERICA revolution”? Evidence from Uganda. Developing Economies 44 (2): 232–51.
Kijima, Y., D. Sserunkuuma, and K. Otsuka. 2008. Assessing the impact of NERICA on income and poverty in Central and Western Uganda. Agricultural Economics 38 (3): 327–37.
Kijima, Y., D. Sserunkuuma, and K. Otsuka. 2011. An inquiry into constraints on a Green Revolution in Sub-Saharan Africa: The case
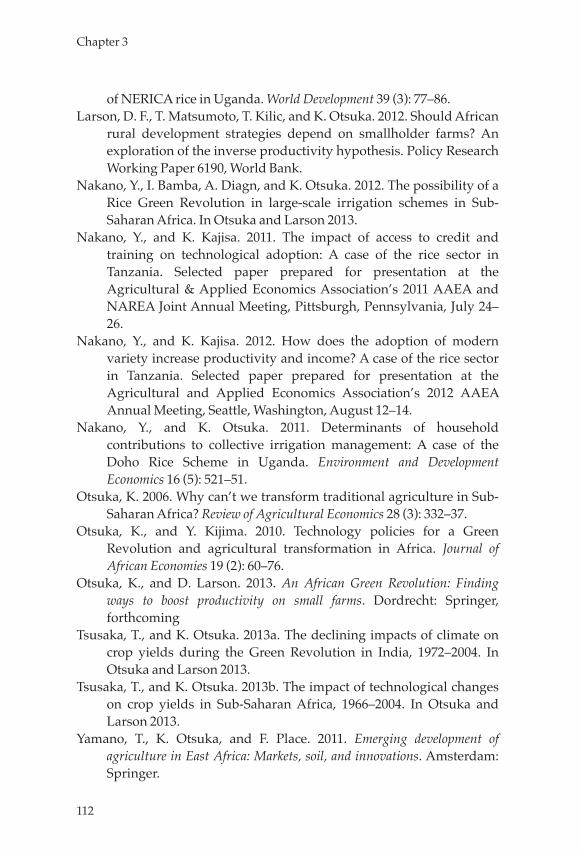
112
Chapter 3
of NERICA rice in Uganda. World Development 39 (3): 77–86.Larson, D. F., T. Matsumoto, T. Kilic, and K. Otsuka. 2012. Should African
rural development strategies depend on smallholder farms? An exploration of the inverse productivity hypothesis. Policy Research Working Paper 6190, World Bank.
Nakano, Y., I. Bamba, A. Diagn, and K. Otsuka. 2012. The possibility of a Rice Green Revolution in large-scale irrigation schemes in Sub-Saharan Africa. In Otsuka and Larson 2013.
Nakano, Y., and K. Kajisa. 2011. The impact of access to credit and training on technological adoption: A case of the rice sector in Tanzania. Selected paper prepared for presentation at the Agricultural & Applied Economics Association’s 2011 AAEA and NAREA Joint Annual Meeting, Pittsburgh, Pennsylvania, July 24–26.
Nakano, Y., and K. Kajisa. 2012. How does the adoption of modern variety increase productivity and income? A case of the rice sector in Tanzania. Selected paper prepared for presentation at the Agricultural and Applied Economics Association’s 2012 AAEA Annual Meeting, Seattle, Washington, August 12–14.
Nakano, Y., and K. Otsuka. 2011. Determinants of household contributions to collective irrigation management: A case of the Doho Rice Scheme in Uganda. Environment and Development Economics 16 (5): 521–51.
Otsuka, K. 2006. Why can’t we transform traditional agriculture in Sub-Saharan Africa? Review of Agricultural Economics 28 (3): 332–37.
Otsuka, K., and Y. Kijima. 2010. Technology policies for a Green Revolution and agricultural transformation in Africa. Journal of African Economies 19 (2): 60–76.
Otsuka, K., and D. Larson. 2013. An African Green Revolution: Finding ways to boost productivity on small farms. Dordrecht: Springer, forthcoming
Tsusaka, T., and K. Otsuka. 2013a. The declining impacts of climate on crop yields during the Green Revolution in India, 1972–2004. In Otsuka and Larson 2013.
Tsusaka, T., and K. Otsuka. 2013b. The impact of technological changes on crop yields in Sub-Saharan Africa, 1966–2004. In Otsuka and Larson 2013.
Yamano, T., K. Otsuka, and F. Place. 2011. Emerging development of agriculture in East Africa: Markets, soil, and innovations. Amsterdam: Springer.
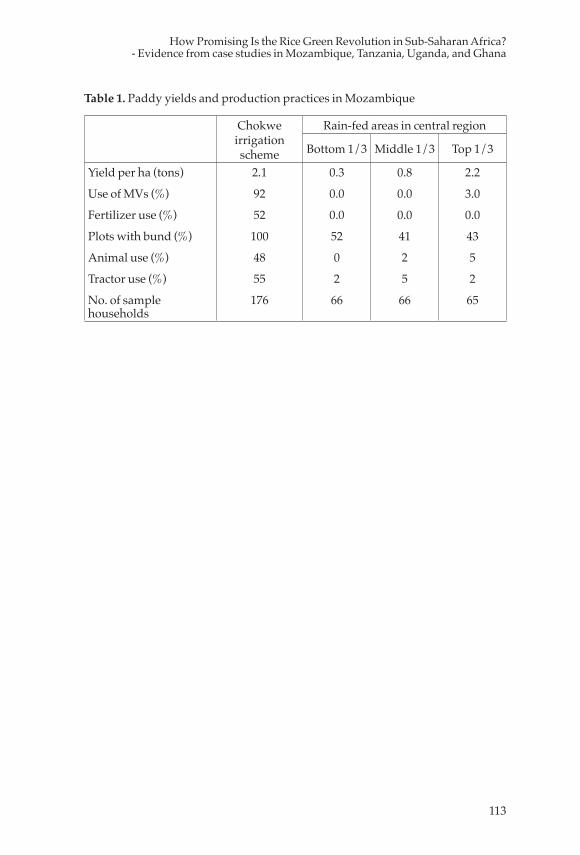
113
How Promising Is the Rice Green Revolution in Sub-Saharan Africa?- Evidence from case studies in Mozambique, Tanzania, Uganda, and Ghana
Table 1. Paddy yields and production practices in Mozambique
Chokwe irrigation scheme
Rain-fed areas in central region
Bottom 1/3 Middle 1/3 Top 1/3
Yield per ha (tons)
Use of MVs (%)
Fertilizer use (%)
Plots with bund (%)
Animal use (%)
Tractor use (%)
No. of sample households
2.1
92
52
100
48
55
176
0.3
0.0
0.0
52
0
2
66
0.8
0.0
0.0
41
2
5
66
2.2
3.0
0.0
43
5
2
65
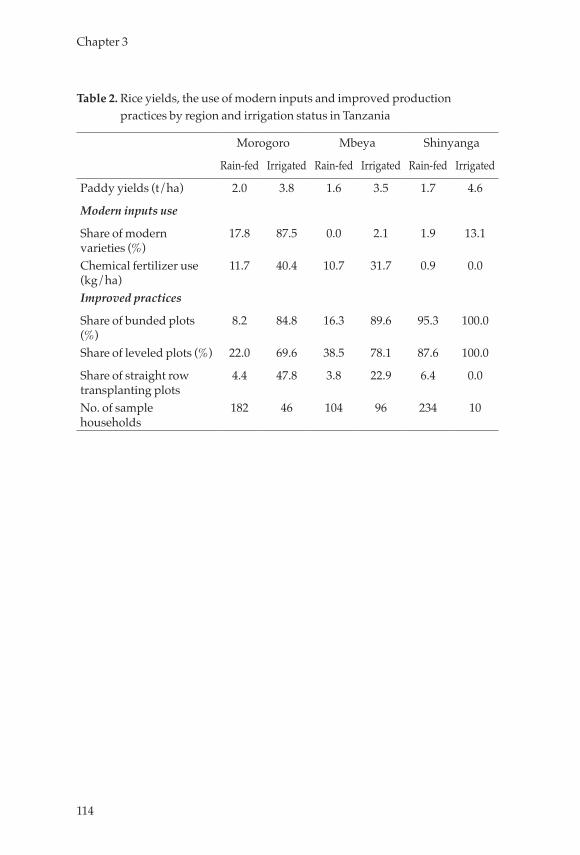
114
Chapter 3
Table 2. Rice yields, the use of modern inputs and improved production practices by region and irrigation status in Tanzania
Morogoro Mbeya Shinyanga
Rain-fed Irrigated Rain-fed Irrigated Rain-fed Irrigated
Paddy yields (t/ha) 2.0 3.8 1.6 3.5 1.7 4.6
Modern inputs use
Share of modern varieties (%)
17.8 87.5 0.0 2.1 1.9 13.1
Chemical fertilizer use (kg/ha)
11.7 40.4 10.7 31.7 0.9 0.0
Improved practices
Share of bunded plots (%)
8.2 84.8 16.3 89.6 95.3 100.0
Share of leveled plots (%) 22.0 69.6 38.5 78.1 87.6 100.0
Share of straight row transplanting plots
4.4 47.8 3.8 22.9 6.4 0.0
No. of sample households
182 46 104 96 234 10
115
How Promising Is the Rice Green Revolution in Sub-Saharan Africa?- Evidence from case studies in Mozambique, Tanzania, Uganda, and Ghana
Table 3. Rice yields (ton/ha) according to the cultivation practices adopted in September 2008 – August 2009 in Uganda a
All Bugiri Mayuge Bukedea Pallisa4 practices 4.13 4.47 2.89 1.22 0.37
3 practices 3.20 4.15 1.89 --- 1.54
2 practices 2.25 3.07 2.00 3.95 2.26
1 practice 1.81 2.30 1.91 1.89 1.38
Non-adopters 1.33 --- 0.79 b 1.42 0.66 c
Fertilizer use 7.55c 7.55 d --- --- ---
Adoption of MVs (%) 19.6 43.8 40.0 5.0 1.6
No. of sample households 300 75 75 75 75
a. The numbers show the means for the rice yield in tons per hectare. The adoption of 4 practices means bunding, leveling, proper timing of transplanting, and straight-row planting.
b. Only 1 observation. c. Only 3 observations. d. Only 4 observations.
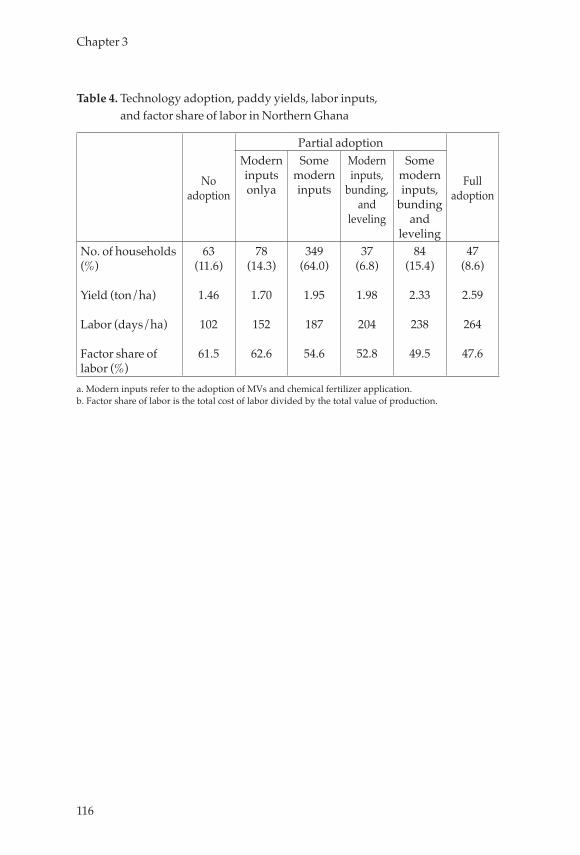
116
Chapter 3
Table 4. Technology adoption, paddy yields, labor inputs, and factor share of labor in Northern Ghana
No adoption
Partial adoption
Full adoption
Modern inputs onlya
Some modern inputs
Modern inputs,
bunding, and
leveling
Some modern inputs,
bunding and
levelingNo. of households(%)
Yield (ton/ha)
Labor (days/ha)
Factor share of labor (%)
63(11.6)
1.46
102
61.5
78(14.3)
1.70
152
62.6
349(64.0)
1.95
187
54.6
37(6.8)
1.98
204
52.8
84(15.4)
2.33
238
49.5
47(8.6)
2.59
264
47.6
a. Modern inputs refer to the adoption of MVs and chemical fertilizer application.b. Factor share of labor is the total cost of labor divided by the total value of production.
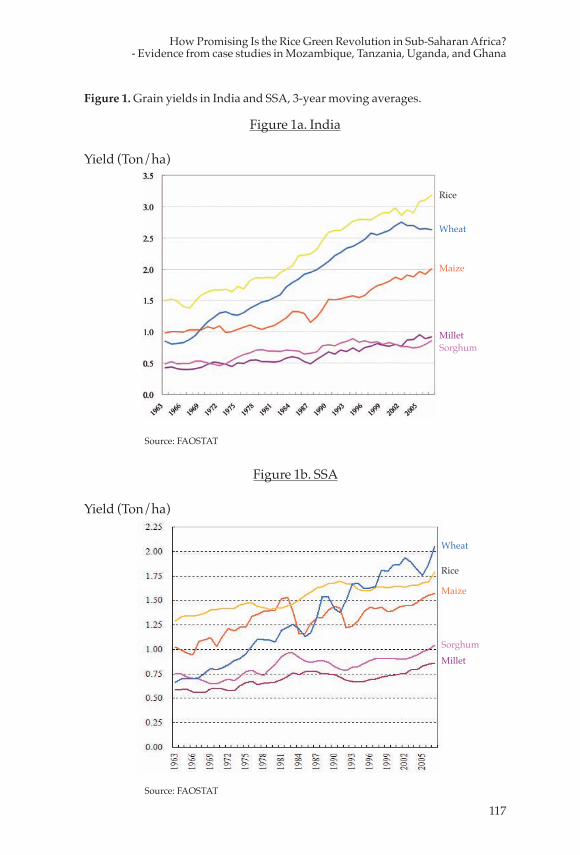
117
How Promising Is the Rice Green Revolution in Sub-Saharan Africa?- Evidence from case studies in Mozambique, Tanzania, Uganda, and Ghana
Figure 1. Grain yields in India and SSA, 3-year moving averages.
Figure 1a. India
Yield (Ton/ha)
Source: FAOSTAT
Figure 1b. SSA
Yield (Ton/ha)
Source: FAOSTAT
Rice
Wheat
Maize
MilletSorghum
Wheat
Rice
Maize
SorghumMillet
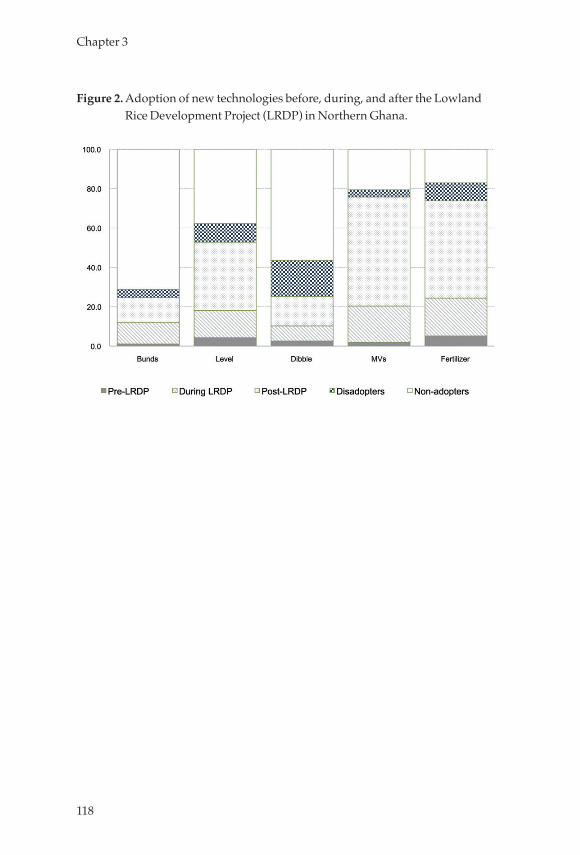
118
Chapter 3
Figure 2. Adoption of new technologies before, during, and after the Lowland Rice Development Project (LRDP) in Northern Ghana.
119
Chapter 4: The Inclusive Development Approach among Farmers, Private Partners and Government through the Promotion of Responsible Investment for Agricultural Development
Koji Makino
1. Investment in Agriculture by the Private Sector 1.1 The role of the private sector in agricultureFor robust development, the agricultural sector needs to have well functioning value chain systems consisting of input (seed, fertilizer, machinery, etc.) → production → processing and shipment → transportation and storage → sales and distribution. Such value chain development has been behind the development of agriculture in Asia and other areas, where the widespread use of improved seeds and fertilizers was subsequently accompanied by the development of value chains stretching from production to distribution, resulting in productivity improvement and production expansion. Such systems, however, are seriously underdeveloped in Africa.
For example, the use of improved seeds and fertilizers as input goods is not widespread among many of the small scale farmers in Africa because they are either too expensive or simply unavailable locally and also fertilizer responding seeds have not yet been well developed except for rice and wheat. Low productivity persists due at least partly to lagging mechanization, although the dependence on family labor does contribute to employment. The post-harvest processing of agricultural produce also poses a problem. A significant amount of crops is lost or wasted, for example, in rice production, due to farmers’ poor grain threshing and drying techniques as well to the poor techniques of rice millers, who in many cases are equipped with inadequate milling machines.
Another problem is distribution. Some farmers are placed in a weak position as sellers of their own products. Though they do have a desire
120
Chapter 4
to market their products at the highest possible price, without adequate storage facilities, they have difficulty to adjust the timing of the sales, nor do they have marketing channels to rely on other than a small number of brokers or intermediaries that come to them to buy up their produce. It is observed in fields, thus, they sometimes end up selling the products to brokers at less than optimal prices.
In developing such value chains, the private sector could play a critical role in Africa, as in many other areas. While the government could facilitate the process by providing incentives through subsidies and by developing financial systems, it is primarily the role of the private sector to supply improved seeds and fertilizers, and to provide post-harvest processing and distribution services. One cannot overemphasize the importance of the roles of the private sector in the reduction of poverty by means of productivity improvement and livelihood betterment of farmers, including small scale farmers.
1.2 Investments in agriculture The promotion of private sector activities in agriculture requires investment, and for that, investment both by the private sector as well as by farmers needs to be encouraged. Investment in agriculture could have a high socio-economic spillover effect, as growth in agriculture is said to have a poverty reduction effect twice that of other sectors (World Bank 2008).
The government will continue to play an important role in fulfilling functions that the private sector or the market cannot fully provide. These include, for example, development of improved seeds and dissemination of agricultural technologies, development of infrastructure, and the development of an enabling environment for investment, as well as the promotion of land reform. When a ‘green revolution’ was achieved in Asia, the governments in Asia allocated more than 20 % of government spending to agriculture (UNDP2012). In Africa, however, the allocation to agriculture is only 5.6 % (average between 2005 and 2009) and it is only about half of the targeted 10 % of the CAADP (Comprehensive Africa Agriculture Development Programme). In this context the need for efforts to promote private investment is apparent, along with more efforts to increase government spending on African agriculture.
121
The Inclusive Development Approach among Farmers, Private Partners and Government through the Promotion of Responsible Investment for
Agricultural Development
Despite its importance, however, agricultural investment must be promoted with caution. Particularly those investments in the productive sectors such as crop production, fuel crop production or forestry development often require the acquisition of extensive farmlands, and such acquisition of land can lead to conflicts over land and water resources between private companies and local inhabitants. In extreme cases, situations (often dubbed as ‘land grabbing’) arise where small farmers are removed from the lands they traditionally owned. There are many reports of such cases: in one case, an area of land stretching over tens of thousands of hectares was leased to a private company for growing plants and planting trees for biofuels without local people’s prior knowledge, who, according to the plan, were to be obliged to relocate. In other reported cases, land lease contracts have become effective with an authorization by the government, but the land has been left unused for a long period of time without actual development.
This is indeed a difficult issue, but the author is of the view that it is not an all or nothing type of question on which there are only two alternatives, i.e., whether private investment in agriculture in Africa is to be promoted or not. Rather, what is important is to promote appropriate investment and restrain inappropriate investments in line with the Voluntary Guidelines on the Responsible Governance of Tenure of Land, Fisheries and Forests in the Context of National Food Security and the Principles of Responsible Agricultural Investment (PRAI) both of which are touched on later. This middle ground approach must be pursued because, as mentioned earlier, the private sector plays the primary role in providing input goods and post-harvest processing as well as distribution.
Interviews conducted recently with government officials of African countries generally indicate that they believe they must promote those investments that will benefit local communities and agricultural growth, while excluding inappropriate ones. They also say that for this purpose, they are prepared to make efforts for the establishment and registration of ownership of farmers’ lands and for the improvement in land management capacity. If that is the African governments’ policy, donors should actively help governments in pursuing their efforts to improve their capacity for agricultural investment administration, land management, and agricultural investment programs formulation, as well as for system and/or regulatory reforms.
122
Chapter 4
In promoting private sector participation in agriculture, one interesting business model is what is called the “Inclusive business model” (FAO 2012). It has been drawing attention in the agricultural production sector, where private companies become engaged in production by actively involving small farmers, while providing them with various services and inputs; these are meant to improve the productivity and livelihood of the contracted small farmers, while increasing production and corporate profits. One example is the case of a company that operates a chicken farm where the company makes a contract with farmers and provides them with well-bred chicks, gauges (cages for rearing) and feed, in addition to providing training on breeding technology. Another example is a case where beer factories (companies) commission groups of farmers to produce raw materials such as barley and corn and at the same time provide them with various services and supports: input goods such as seeds and fertilizers, extension services by their staff, and the installation of small-scale warehouses. These cases illustrate that this kind of partnership between private firms and farmers can not only help farmers to improve productivity and obtain benefits (surplus) even when the input cost is deducted from the sales, but also help the company to increase production and profits. In the future, this and other kinds of business models that involve farmers’ participation in an inclusive manner will be worth supporting.
1.3 Formulation of international rules on investments in agriculture(1) Voluntary Guidelines on the Responsible Governance of Land,
Fisheries and ForestsCountries with weak land governance tend to be targeted for global land investment, and in such countries the rights to land and livelihood of local residents are likely to be threatened. The need for the establishment of an international guideline for supporting governance of natural resources of each country, including lands, has been voiced and the Committee on World Food Security (CFS), a standing committee of the FAO, has led the formulation of Voluntary Guidelines on the Responsible Governance of Tenure of Land, Fisheries and Forests in the Context of National Food Security (hereinafter guidelines).
These guidelines are positioned as a practical and comprehensive guide for the governance of land and other natural resources, to be used by governments, communities and the private sector for complementing similar existing international or regional initiatives and policies of each
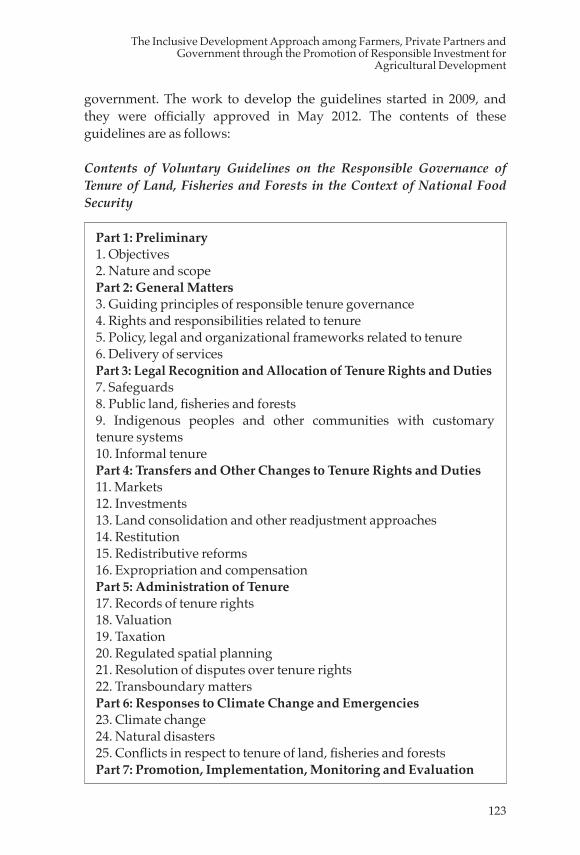
123
The Inclusive Development Approach among Farmers, Private Partners and Government through the Promotion of Responsible Investment for
Agricultural Development
government. The work to develop the guidelines started in 2009, and they were officially approved in May 2012. The contents of these guidelines are as follows:
Contents of Voluntary Guidelines on the Responsible Governance of Tenure of Land, Fisheries and Forests in the Context of National Food Security
Part 1: Preliminary 1. Objectives 2. Nature and scope Part 2: General Matters 3. Guiding principles of responsible tenure governance 4. Rights and responsibilities related to tenure 5. Policy, legal and organizational frameworks related to tenure 6. Delivery of services Part 3: Legal Recognition and Allocation of Tenure Rights and Duties 7. Safeguards 8. Public land, fisheries and forests 9. Indigenous peoples and other communities with customary tenure systems 10. Informal tenure Part 4: Transfers and Other Changes to Tenure Rights and Duties 11. Markets 12. Investments 13. Land consolidation and other readjustment approaches14. Restitution15. Redistributive reforms 16. Expropriation and compensation Part 5: Administration of Tenure17. Records of tenure rights 18. Valuation 19. Taxation20. Regulated spatial planning21. Resolution of disputes over tenure rights22. Transboundary mattersPart 6: Responses to Climate Change and Emergencies 23. Climate change24. Natural disasters25. Conflicts in respect to tenure of land, fisheries and forests Part 7: Promotion, Implementation, Monitoring and Evaluation
124
Chapter 4
(2) Principles of Responsible Agricultural Investment (PRAI)At the G8 L’Aquila Summit in July 2009, Japan proposed the establishment of a platform for discussing the development of a guideline to promote transparent and responsible international investment in agriculture that does not involve land confiscation. In order to develop a joint proposal on principles and best practices for international agricultural investment, the summit declaration contained the commitment by the G8 countries to address the issue with each partner country and world organization.Based on the senior officials meeting (roundtable) on the promotion of responsible international investment in agriculture, which was organized as a side event to the United Nations General Assembly by Japan and co-sponsored by the World Bank, FAO, IFAD and UNCTAD in September 2009, the World Bank, FAO, IFAD and UNCTAD jointly announced the draft of “Principles of Responsible Agricultural Investment (PRAI)” (refer to the box in Chapter 2 for the draft contents of Principles) in February 2010. Currently, discussions are under way to approve the draft in the Committee on World Food Security (CFS). At the same time, a pilot project to substantiate the draft is being implemented through Japan’s funding to the World Bank.
1.4 The inclusive development approach among farmers, private partners and government through the promotion of responsible investment for agricultural development
1.4.1 Direction of the ApproachJICA considers it important to help promote responsible investments and restrain inappropriate investments in line with the Voluntary Guidelines on the Responsible Governance of Tenure of Land, Fisheries and Forests in the Context of National Food Security and the Principles of Responsible Agricultural Investment (PRAI). The following are concrete measures that JICA is prepared to promote, which can be taken as a single intervention or in combination.
(1) Support for the formulation of agricultural development programs and institutional reforms aiming at benefiting both farmers and private companies and which protect the interests of small farmers
Support for the formulation of agricultural development programs targeted at specific areas. Such programs will, as a matter of course, be based on the analysis of both the natural environment and the economic potential of the area, but at the same time will aim at nurturing core
125
The Inclusive Development Approach among Farmers, Private Partners and Government through the Promotion of Responsible Investment for
Agricultural Development
farmers, increasing employment of small scale farmers and introducing appropriate sustainable technologies. Typically such programs will include recommendations of crops to be cultivated in the area and agronomical technologies to be introduced, the details of which will be planned through dialogue with farmers’ organizations and NGOs. JICA will also provide support at the policy level for the improvement of the land tenure system and of the administration’s capacity to manage investment and land. JICA will also support governments with such policy measures as deregulation of investment and protection of intellectual property.
(2) Support for the development of technology infrastructure in target areas
Technical support including the introduction of appropriate seeds and the development and diffusion of cultivation and soil conservation technologies based on the careful analysis of the natural environment, social and economic situation and administrative systems of target areas. This will allow farmers and companies to enhance productivity and reduce risks in technology adoption and investment. These supports should also be designed to help improve the administrative capacity of the public sector and regulatory systems to enhance the environment for productivity improvement.
(3) Support for the promotion of investments by agriculture related companies (such as suppliers of seeds, fertilizers, agricultural machinery, and distributors, etc.) for the development of value chains.
Support for potential investors - both local and foreign companies - in obtaining information regarding the agricultural potential and agriculture related investment opportunities in the country through workshops and other means. When an investment plan prepared by any interested company is judged as having potential benefit such as for poverty reduction of farmers, it will be supported with research and project cost subsidies. Further, if judged useful, support will be provided for value-chain-related research on specific agricultural products and/or agriculture related industries, the findings of which will be published for reference by a wide range of potential investors.
126
Chapter 4
(4) Development of infrastructure for transportation and distributionSupport for the development of transportation and distribution networks to smoothly and efficiently distribute agricultural products from producers to consumers or between markets. These include, for transportation: trunk roads, rural roads, ports, etc., and for distribution: facilities of wholesale and retail markets, storage and refrigeration and product delivery/collection facilities. This support could also include the development of a system of agriculture-related information - such as market information – accessible to farmers. Support in the operation and maintenance of these infrastructures may also be included.
(5) Demonstration and application of inclusive models that will benefit both farmers and companies
Support for the demonstration and application of “win-win” business models that will contribute both to an increase in farmers’ income and in private firms’ corporate income. This support can take a variety of forms, in which farmers can collaborate with companies either on their own or as a group. Specifically, support for this purpose could include the provision of input goods such as improved seed varieties and fertilizers as well as technical support and diffusion services using pilot farms. With these, the support aims at the improvement of farmers’ productivity and an increase in corporate production. This support can be accompanied by assistance of the government in developing regulatory frameworks on the incentive (or penalty) system, and contract formats for promoting the inclusive business model.
1.4.2 Points to Consider in the Implementation of the ApproachBelow is a summary of various points to be considered in the implementation of the above approach, including those mentioned earlier.
• For livelihood improvement in and poverty reduction among farmers in Africa, and particularly small scale farmers, the role of the private sector and private investment is indispensable. The problem, however, is that there are actually cases of inappropriate investments, to which reality we must not turn a blind eye. Thus, the course of action for Africa is to promote responsible investment and restrain inappropriate investment in conformity with principles such as the PRAI.

127
The Inclusive Development Approach among Farmers, Private Partners and Government through the Promotion of Responsible Investment for
Agricultural Development
• It is essential to have a dialogue with the local people and the civil society in the target areas who know their areas and their own needs, and to reflect their needs in the project design and its implementation. The government, for its part, has an important role to play with respect to research and development, system reforms, and development of infrastructure. With these in mind, the farmers, residents of the area, and civil society and the government must sit together for a balanced discussion.
• Infrastructure development is essential for the development of value chains. Its physical development must be accompanied by the institutional and management capacity development needed to support it, which tends to lag behind. Thus, efforts to synchronize these components are important.
• Investment in agriculture in developing countries tends to fluctuate: it has increased rapidly, pushed by a sharp rise in food prices; dropped temporarily following the Lehman shock in 2008, and now it is coming back. In view of this volatility, some measures for its stabilization should be considered, such as through public finance systems for mid- and long-term investment stability.
• While it is important to invite investments of international private companies, what is more important is to foster the local private sector, including small and medium sized companies.
• As a prerequisite for effective program implementation, it is essential to develop human resources both in the public and private sectors, which are in short supply in Africa.
• Agricultural development, especially that which is supported by the inclusive development approach, can help to reduce poverty and improve the health of mothers and children; and hence contribute to the gender issues. It is important and useful to incorporate such points of view and components in order to address such needs.
2. The Triangular Cooperation Program for Tropical Savannah Agricultural Development among Japan, Brazil and Mozambique (ProSAVANA-JBM)
This section discusses the ProSAVANA-JBM program in Mozambique as a concrete example of the inclusive development approach among
128
Chapter 4
farmers, private partners and government through the promotion of responsible investment for agricultural development.
2.1 Background of the programThe Nacala Corridor situated in the northern part of Mozambique originates from the port of Nacala on the Indian Ocean coast and traverses from east to west leading to Kuanba and Mandimba in the province of Niassa via Nampula, the capital of the province with the same name. The corridor is connected with inland Malawi and Zambia. In recent years, the corridor has been positioned as one of the region’s most important development corridors by the Government of Mozambique, the Southern African Development Community (SADC) and the New Partnership for Africa’s Development (NEPAD) of the African Union.
The tropical savanna zone that spreads through this corridor receives a certain amount of rainfall and has extensive arable land for agriculture. Its potential for increasing agricultural production, therefore, is very high. Approximately 720,000 farming families (2.56 million people), who account for about one quarter of all the farmers in the country, are distributed throughout the area. The average land area per household in the tropical savanna zone, however, is 1.0 hectare, which is below the national average of 1.3 hectares, and the poverty rate is higher than other areas. The number of small farmers who own less than 1.0 hectare of land accounts for about 60 percent of all the farmers in the area and those who own less than 2.0 hectares of land account for about 90 %.
Many farmers engage in traditional farming methods, which result in poor productivity both for subsistence and commercial crop production. Even for medium to large scale farmers, their agricultural technologies are not advanced and productivity is not high. Naturally, the question arises as to why the area, which is said to have such high potential, cannot sufficiently realize this potential. As a matter of fact, there are numerous and diverse problems in agriculture in the area, which are also common to other areas in the country and other countries in Africa. The summary of these problems is as follows:
1 There is no comprehensive agricultural program covering the whole of the Nacala Corridor and there is no strategic coordination among individual development programs, which
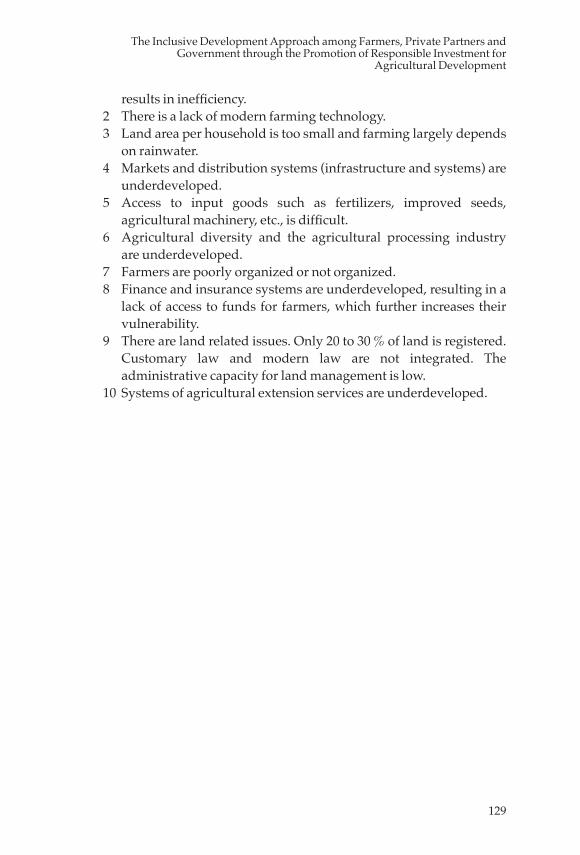
129
The Inclusive Development Approach among Farmers, Private Partners and Government through the Promotion of Responsible Investment for
Agricultural Development
results in inefficiency.2 There is a lack of modern farming technology.3 Land area per household is too small and farming largely depends
on rainwater. 4 Markets and distribution systems (infrastructure and systems) are
underdeveloped.5 Access to input goods such as fertilizers, improved seeds,
agricultural machinery, etc., is difficult. 6 Agricultural diversity and the agricultural processing industry
are underdeveloped.7 Farmers are poorly organized or not organized. 8 Finance and insurance systems are underdeveloped, resulting in a
lack of access to funds for farmers, which further increases their vulnerability.
9 There are land related issues. Only 20 to 30 % of land is registered. Customary law and modern law are not integrated. The administrative capacity for land management is low.
10 Systems of agricultural extension services are underdeveloped.
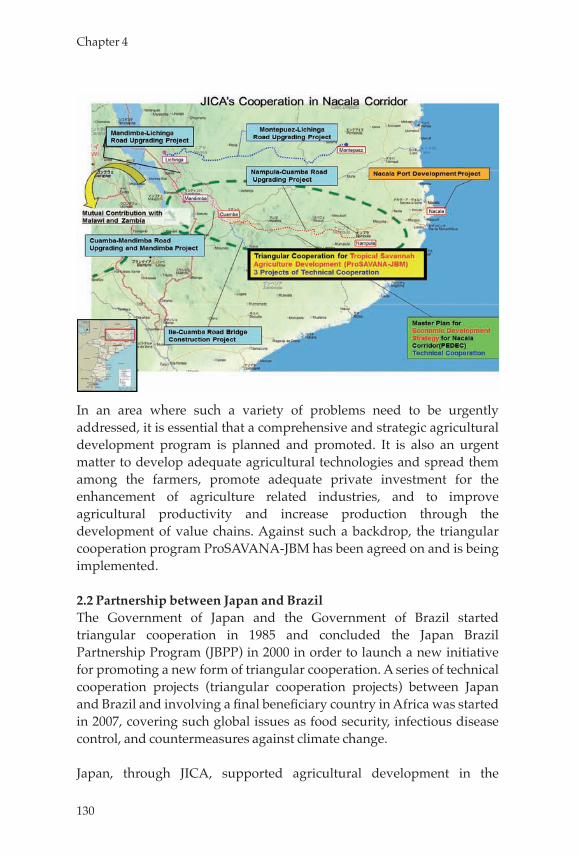
130
Chapter 4
In an area where such a variety of problems need to be urgently addressed, it is essential that a comprehensive and strategic agricultural development program is planned and promoted. It is also an urgent matter to develop adequate agricultural technologies and spread them among the farmers, promote adequate private investment for the enhancement of agriculture related industries, and to improve agricultural productivity and increase production through the development of value chains. Against such a backdrop, the triangular cooperation program ProSAVANA-JBM has been agreed on and is being implemented.
2.2 Partnership between Japan and BrazilThe Government of Japan and the Government of Brazil started triangular cooperation in 1985 and concluded the Japan Brazil Partnership Program (JBPP) in 2000 in order to launch a new initiative for promoting a new form of triangular cooperation. A series of technical cooperation projects (triangular cooperation projects) between Japan and Brazil and involving a final beneficiary country in Africa was started in 2007, covering such global issues as food security, infectious disease control, and countermeasures against climate change.
Japan, through JICA, supported agricultural development in the
131
The Inclusive Development Approach among Farmers, Private Partners and Government through the Promotion of Responsible Investment for
Agricultural Development
Cerrado (region) of Brazil for over 20 years from the late 1970s and contributed to the transformation of the area once called a “barren land” into one of the world’s leading agricultural areas. The basic cooperation framework for ProSAVANA-JBM, targeted at the Nacala Corridor, was agreed upon by JICA, the Brazilian Agency for International Cooperation (ABC) and the Ministry of Agriculture of Mozambique in September 2009, taking advantage of the experience and knowledge regarding agricultural development in tropical savanna acquired in the development of the Cerrado of Brazil.
There are some similarities in terms of agronomy between the savannah zone of Mozambique and the Cerrado of Brazil. For this reason, some individual technologies and know-how acquired in the Cerrado, such as tropical varieties of major temperate grains and cultivation systems, are considered applicable in Mozambique. As another possibility, the technology developed to improve acidic soils in Brazil could also be effective for the improvement of the salt (crop nutrients) leached soils in some parts of Nacala. Other helpful experiences acquired in the Cerrado include: the process of technological innovations at the initial stages of development; organizational reforms; development of value chains; and environmental conservation measures.
Notwithstanding all these, it is impossible to simple-mindedly apply the agricultural development model of the Cerrado as it was developed in Brazil to the Mozambican savannah zone; there are many differences in the natural environment, such as water, geography, soils, and vegetation, and the social, economic and administrative systems. The project does not in any way attempt such mechanical transfer of technology or experiences.
Rather, under these circumstances, what is attempted is to build a new development model for the Nacala Corridor of Mozambique utilizing the know-how and technologies of Brazilian people and organizations that have experienced many trials and errors in the development of the Cerrado, and Japan’s many years of experience gained in supporting the process. In the process, the project will certainly take advantage of a number of individual technologies developed in the Cerrado, exemplified above.
In fact the project has abundant resources of technologies and
132
Chapter 4
experiences at its disposal: EMBRAPA (Brazilian Agricultural Research Corporation), one of the world’s leading agricultural research institutes; JIRCAS (Japan International Research Center for Agricultural Sciences), which has supported the Cerrado process over many years; FGV (Getulio Vargas Foundation), a world-renowned think tank; MDA (the Ministry of Agricultural Development) and EMATER (the Institute of Technical Assistance and rural Extension of Brazil) with ample experience in program coordination for the promotion of family farming and farmer participatory systems; the SENAR (National Service of Rural Learning) with abundant resources in vocational training modules and teaching methods in farming villages; and JICA with the accumulated experience and know-how of support to Africa over many years, that can also mobilize technologies and the international expertise of Japanese development consultants.
2.3 Objectives and characteristics of the program The objectives of the ProSAVANA-JBM are to contribute to the poverty reduction of farmers, improve food security, and enhance economic development. This consists of promoting agricultural development by improving productivity and developing value chains through the promotion of adequate private investment in the Nacala Corridor, which is making poor development progress despite its high potential for development and increased agricultural production. The target area is situated from 13 degrees to 17 degrees latitude south in the northern part of Mozambique. At present, 19 districts in the three provinces of Nampula, Niassa and Zambezia in the Nacala Corridor are considered as target areas for development.
For successful agricultural development in the area, well-functioning value chains must be in place, including supplies of input goods, post-harvest processing, and distribution both on the upstream and downstream of production, which, in itself, must be upgraded through the improvement of farmers’ technology and farming methods. For this purpose, JICA will support the introduction of crop varieties suitable to the Nacala Corridor, as well as the development and diffusion of cultivation and soil conservation technologies. At the same time, it will support the Government of Mozambique in developing a comprehensive master plan for agricultural development focused on the development of a value chain including adequate investment planning and land use as well as system reforms targeted at the whole of the
133
The Inclusive Development Approach among Farmers, Private Partners and Government through the Promotion of Responsible Investment for
Agricultural Development
Nacala Corridor. It is the aim of the master plan to propose system reforms to promote responsible investment and restrain inappropriate investment.
The “Nacala Corridor Development Program” is the key Japanese aid program in Mozambique. In combination with support for building an agricultural development model through ProSAVANA-JBM, Japan provides technological and financial support that will contribute to the development of infrastructure such as trunk roads for distribution and ports for export and import. At the same time, with a view to achieving inclusive growth, the development of educational infrastructure and health infrastructure, as well as improvement in water access will be supported. In other words, the “Nacala Corridor Development Program” and ProSAVANA-JBM are characterized by (1) triangular cooperation between Japan, Brazil and Mozambique based on accumulated past experience, (2) comprehensive support for the whole of the value chain including not only production but also distribution, (3) cross sectoral support including agriculture and infrastructure, and (4) a synergistic WIN-WIN effect among farmers and companies. These characteristics correspond to all the issues included in the inclusive development approach among farmers, private partners and government through the promotion of responsible investment for agricultural development referred to in Section 1.4. In addition, the programs will be able to deal with many of the agriculture problems in the Nacala Corridor mentioned in Section 2.1.
As mentioned earlier, this program presupposes the participation of private investment in the future and, bearing this in mind, many activities have already been carried out such as international seminars and public and private joint missions comprising members from Japan, Brazil and Mozambique. With these activities, the program expects to work out more specific and realistic development programs beyond a simple blueprint plan.
2.4 Description of the projectsIn its first stage, ProSAVANA-JBM aims to consolidate the technologies and administrative capacity bases for the whole program. This stage will comprise three main technological cooperation projects: Improving Research and Technology Transfer Capacity for Nacala Corridor Agriculture Development, Support for Agricultural Development
134
Chapter 4
Master Plan for the Nacala Corridor, and Establishment of a Development Model at the Community Level through Nacala Corridor Agricultural Development.
In its second stage, the program’s aim shifts to the implementation of the technologies, development models and/or projects that have been developed, demonstrated and/or proposed in the first stage in cooperation with the private sector. Financial assistance is also envisaged at this stage. This second stage will be initiated even before the completion of the first stage. Activities for the development of infrastructure, such as the construction of trunk roads, will be carried out throughout the two stages. As a matter of fact, the term “stage” simply indicates the gradual shifts of focus of activities, and individual work will be performed flexibly. The ProSAVANA-JBM program will be put into practice with full coordination among the government, farmers, private sector, NGOs and other parties involved in the development, as well as international development organizations.
A summary of individual projects is outlined below:• First stage
[Improving Research and Technology Transfer Capacity for Nacala Corridor Agriculture Development] – Period of cooperation: 2011-2016 (5 years)This project aims to build a technical foundation. It aims at strengthening research systems at the agricultural experiment station for the northeast in the province of Nampula, and that of the northwest in the province of Niassa. It is also aimed at transferring to the pilot farmers around the stations adequate soil improvement as well as cultivation technologies that will have been developed based on prior investigations and evaluation of the natural resources and social and economic situation of the Corridor.
[Support for Agricultural Development Master Plan for Nacala Corridor] – Period of cooperation: 2012-2013 (1.5 years)This is a project aimed at formulating a master plan for agricultural development that will contribute to social and economic development in the Nacala Corridor area with a view to promoting a sustainable agricultural production system (value chain) and reducing the poverty of small scale farmers. In a context where a number of foreign and domestic companies have already expressed
135
The Inclusive Development Approach among Farmers, Private Partners and Government through the Promotion of Responsible Investment for
Agricultural Development
interest in investing in agriculture in the area, the project allows the planning of an adequate development project based on the Principles of Responsible Agricultural Investment (PRAI) and takes the initiative in institutional reforms for land use and social environment consideration, which will eventually restrain inappropriate investment. It is the aim of the project to urge the private sector, government and donors to swiftly invest in projects with high social and economic effects.
[Establishment of a Development Model at the Community Level through Nacala Corridor Agricultural Development] – Period of cooperation: 2013 – 2018 (6 years)This is a project aimed at establishing an inclusive agricultural development model according to the various scales of farming. It also aims at helping such farmers and farmers’ organizations that have adopted the inclusive model to actually increase production through the intensification of the agricultural extension service. It is the aim of the project not only to help the government improve the currently inadequate agricultural extension service, but also to foster core farmers, and to demonstrate and disseminate business models with high social benefits led by companies and farmers’ groups.
• Second stageThe second stage is basically the application and expansion stage of the developed technologies, verified development models, or proposed development programs in cooperation with farmers’ groups, the private sector (promotion of investment) and the government, with enhanced capacity to manage and support the programs. JICA will provide support for the scaling up of funds and support for capacity building for project coordination.
• Common projects between the first stage and second stage (development of infrastructure)
· Support Project for the Formulation of an Economic Development Strategy for the Nacala Corridor
· Nampula-Cuamba Road Upgrading Project · Montepuez-Lichinga Road Upgrading Project · Cuamba-Lichinga Road Upgrading Project · Ile-Cuamba Road Bridge Construction Project · Urgent Rehabilitation Project of Nacala Port
136
Chapter 4
· Nacala Port Development Project · Construction of Secondary Schools in the Nampula Monapo
Primary Teachers Training School Project · Construction of the Nacala Health Science Institute
2.5 Points to considerAs mentioned earlier, though there are many similarities in terms of agronomy between the savannah zone of Mozambique and the Cerrado of Brazil, there are a lot of differences in the natural environments and social, economic and administrative systems. This makes it impossible to simply transfer the agricultural development model of the Cerrado as it was developed in Brazil to the Nacala Corridor area. What needs to be achieved is to provide support for the building up of a new agricultural development model that will meet the needs of Nacala under the ownership of the government and the farmers and for this, the capacity and individual technologies acquired in the development of the Cerrado can be taken advantage of. In implementing the program, it is very important to maintain sufficient dialogue with local farmers who know best about their land and at the same time are the biggest beneficiaries of ProSAVANA-JBM, in order to reflect their views and opinions in the project implementation.
Another point of caution is that support for agricultural development programs like the one in the Nacala Corridor must be placed in the perspective of national policy, for there are institutional and policy matters that affect individual projects. A simple example is that land tenancy of up to 1,000 hectares is granted by the provincial governor, but if the area is larger than that up to 10,000 hectares, the grant must be made by the Minister of Agriculture, and beyond that, the grant must be made by the Council of Ministers. Thus, the central government must be appropriately involved.
The New Alliance for Food Security and Nutrition, which was agreed upon at the G8 meeting in the US in May 2012, is a framework whereby agricultural development in Africa is enhanced through the promotion of private investment in compliance with the principles of responsible agricultural investment and voluntary guidelines, and Mozambique is one of the six target countries. The cooperation framework created for the execution of this New Alliance (agreement) includes land policy, institutional reforms on investment, and considerations for small
137
The Inclusive Development Approach among Farmers, Private Partners and Government through the Promotion of Responsible Investment for
Agricultural Development
farmers. Acting as a co-chair with the US, Japan has supported the formulation of this cooperation framework; JICA is prepared to be continuously involved in supporting such reforms at the central government level.
3. Conclusion
This chapter has argued for the usefulness of the inclusive development approach among farmers, private partners and government through the promotion of responsible investment for agricultural development, based on the discussion in Section 1, which stressed the importance of the private sector and its investment in agriculture. Section 2 discussed the ProSAVANA-JBM program in Mozambique as a concrete case of this approach including a detailed explanation, meaning and points to consider.
In recent years, JICA has been accumulating a wide range of experience in similar cases such as in the Philippines where stakeholders, including distributors, formed a banana industry cluster around a core groups of farmers; a case in Pakistan where a project aimed to improve the productivity of small livestock farmers and include them in a value chain; cases in Nigeria and Uganda where projects aimed to improve the post-harvest processing of rice millers; and a case in Burkina Faso where a project aimed to formulate a market oriented agricultural master plan. As mentioned in section 1.4, the inclusive development approach can encompass a wide range of variations, and they could be applied to different needs flexibly, either as a single intervention measure or used in combination, and drawing on actual experiences accumulated in many countries. .
Recently in the international arena, research and discussions related to the problems and effectiveness of investment in agricultural development, and in particular, related to inclusive models (often called win-win business models), are becoming active, and a number of practical projects have come to be conducted. To contribute to such intellectual exercises, Japan has provided funding to the World Bank and is supporting empirical studies on the usefulness of the principles of responsible agricultural investment. JICA must learn from the findings of this and other research and cases for its own support projects in the
138
Chapter 4
future. JICA must also contribute to policy development and system reforms by actively participating in international initiatives such as the New Alliance for Food Security and Nutrition and Grow Africa while learning from the knowledge and experience of its international partners.
The discussions so far have been focused on the field of agriculture. If we look at international cooperation in a broader perspective, the relative presence of ODA (Official Development Assistance) has declined over the years as a result of a rapid expansion of overseas direct investment and flows of private funds such as from the Bill & Melinda Gates Foundation, or aid other than ODA provided by emerging countries such as China and Brazil (Kharas, Makino and Jung 2011). So, what is the role to be played by ODA? The answer may be that it could play the role of a catalyst, going beyond simple aid, towards bringing together diverse players and developing countries and actively urging the players to get involved in these countries in an appropriate manner.
Consistent with this orientation, there have been operational and organizational changes within JICA to promote collaboration with the private sector; for example, JICA now has the Private Sector Partnership and Finance Department, which provides support for research expenses for overseas investment and investment promotion. JICA is also deepening cooperation with emerging countries such as China, Brazil and Indonesia. Given these movements, perhaps the business model and project we have been discussing- the inclusive development approach and the ProSAVANA-JBM project – must be understood in that larger perspective.
Finally, I would like to reiterate the critical role of the private sector in agricultural development as an engine for economic growth and reducing poverty, through the improvement of productivity and betterment of the farmers’ (and especially small farmers’) livelihood. For it to happen, I have argued that private investment in agriculture must be promoted. True, private investment in the agricultural sector can take a variety of forms, and some of them can cause negative impacts on local residents and farmers. Under such circumstances, the appropriate and realistic course of action for African governments must be to promote responsible investments and restrain inappropriate investments in line with the Voluntary Guidelines on the Responsible Governance of Tenure
139
The Inclusive Development Approach among Farmers, Private Partners and Government through the Promotion of Responsible Investment for
Agricultural Development
of Land, Fisheries and Forests in the Context of National Food Security and the Principles of Responsible Agricultural Investment (PRAI). They could employ a variety of policies to achieve an improvement in investment quality; for example, they could adopt measures such as the provision of incentives such as tax cuts and credits. Putting into practice these steps is an urgent matter for African countries, and their international partners, including bilateral donors like Japan, and international organizations, should provide adequate support. The challenge is enormous, and while fully recognizing the difficulty of the tasks at hand, we, Africa’s partners, must listen carefully to the voices of African governments and local farmers, and proceed with our support activities in an open manner.
140
Chapter 4
References
Anseeuw, W., L. Alden Wily, L. Cotula, and M. Taylor (International Land Coalition). 2012. Land rights and the rush for land: Findings of the Global Commercial Pressures on Land Research Project. Rome: International Land Commission.
Cotula, L., Vermeulen, S., Leonard, R., and Keeley, J. 2009. Land grab or development opportunity? Agricultural investment and international land deals in Africa. Rome: FAO; London: IIED; Rome: IFAD.
FAO. 2012. Trends and impacts of foreign investment in developing country agriculture: Evidence from case studies. Rome: FAO.
FAO, and WFP. 2012. The state of food insecurity in the world 2012. Rome: FAO.
Government of Mozambique. 2010. Strategic plan for agricultural development 2010–2019 (PEDSA 2010–2019). Maputo: Ministry of Agriculture, Government of Mozambique.
Humphrey, J. 2003. Commodities, diversification and poverty reduction. Rome: FAO.
Jaffee S., P. Siegel, and C. Andrews. 2008. Rapid agricultural supply chain risk assessment. Draft framework and guidelines, Commodity Risk Management Group, Agriculture and Rural Development Department, World Bank, June 13.
JICA, and MAPA. 2002. Japan-Brazil agricultural development cooperation programs in the Cerrado region of Brazil: Joint evaluation study, general report. Tokyo: JICA; Brasília: MAPA.
JICA. 2010. Preparatory study on triangular cooperation programme for agricultural development of the African tropical savannah among Japan, Brazil and Mozambique (ProSABANA-JBM). Tokyo: JICA.
JICA Research Institute. 2012a. Cerrado agriculture: A model of sustainable and inclusive development. Tokyo: JICA-RI.
JICA Research Institute. 2012b. Scaling up South South and triangular cooperation. Tokyo: JICA-RI.
Ministry of Agriculture, Forestry and Fisheries of Japan. 2009. Roundtable (meeting) on the “Promotion of responsible international investment in agriculture” held at the time of the UN General Assembly. [In Japanese.] http://www.maff.go.jp/j/kokusai/kokkyo/ round_table/index.html.
Ministry of Foreign Affairs of Japan. 2009a. Senior officials meeting on the promotion of responsible international investment in agriculture: Overview and Evaluation. [In Japanese.] http://www.
141
The Inclusive Development Approach among Farmers, Private Partners and Government through the Promotion of Responsible Investment for
Agricultural Development
mofa.go.jp/mofaj/gaiko/food_security/090926_gh.html.Ministry of Foreign Affairs of Japan. 2009b. Senior officials meeting on
the promotion of responsible international investment in agriculture: Chairman’s summary. [In Japanese.] http://www.mofa.go.jp/mofaj/gaiko/food_security/pdfs/090926_gs.pdf.
OECD, and FAO. 2011. OECD-FAO agricultural outlook 2011–2020. Paris: OECD; Rome: FAO.
UNDP. 2012. Africa human development report 2012: Toward a food secure future. New York: UNDP, Regional Bureau for Africa.
Vermeulen, S., and L. Cotula. 2010. Making the most of agricultural investment: A survey of businesses that provide opportunities for smallholders. Rome: FAO; London: International Institute for Environment and Development.
Webber C.M., and P. Labaste. 2009. Building competitiveness in Africa’s agriculture: A guide to value chain concepts and applications. Washington, DC: World Bank.
World Bank. 2008. World development report 2008: Agriculture for development. Washington, DC: World Bank.
World Bank. [Deininger, K., and D. Byerlee, with J. Lindsay, A. Norton, H. Selod, and M. Stickler.] 2011. Rising global interest in farmland: Can it yield sustainable and equitable benefits? Washington, DC: World Bank.

143
Chapter 5: Initiatives of SHEP and SHEP UP - Capacity development of small-scale farmers1 for increased responsiveness to market needs
Jiro Aikawa2
1. Background Leading to A Market-oriented Approach
According to the World Development Report 2008, the poverty rate among farmers is affected by access to market, along with other factors such as climate. The Report features improvement in market access and promotion of market participation by small-scale farmers as important poverty reduction measures. To realize these, the Report called for measures to improve farming techniques, sustained water and soil management, improvement in public extension services, capacity development of human resources, and infrastructure development.
Governments and development partners are realizing that group marketing, rather than individual marketing by small-scale farmers, encourages market participation. A hurdle discouraging farmers’ participation in the market is the information gap between the marketers and farmers. These market players have abundant information about product supply and demand – information many small-scale farmers don’t have access to.
Supply of and demand for horticultural products tend to increase with economic growth. Kenya’s GDP has grown more than other African
1. The term “small-scale farmers” as used in this chapter refers to farmers with a farmland ownership of less than 2 hectares following the term’s usage in Kenya. In the projects that will be discussed in the chapter, the average area of farmland owned by the target small-scale farmers and dedicated exclusively to horticultural crops was less than 0.4 hectares.2. I would like to thank Ms. Etsuko Ikeda and Ms. Fumie Saijo of OPC as well as Ms. Hiromi Ikeda of HANDS for the data for the tables and figures for this report. Mr. Naoki Hashimoto, Ms. Harue Kitajima and Mr. Mitsuhiro Kato, JICA experts of the SHEP UP, contributed to the paper by providing the author with a variety of information. I would like to take this opportunity to thank them.
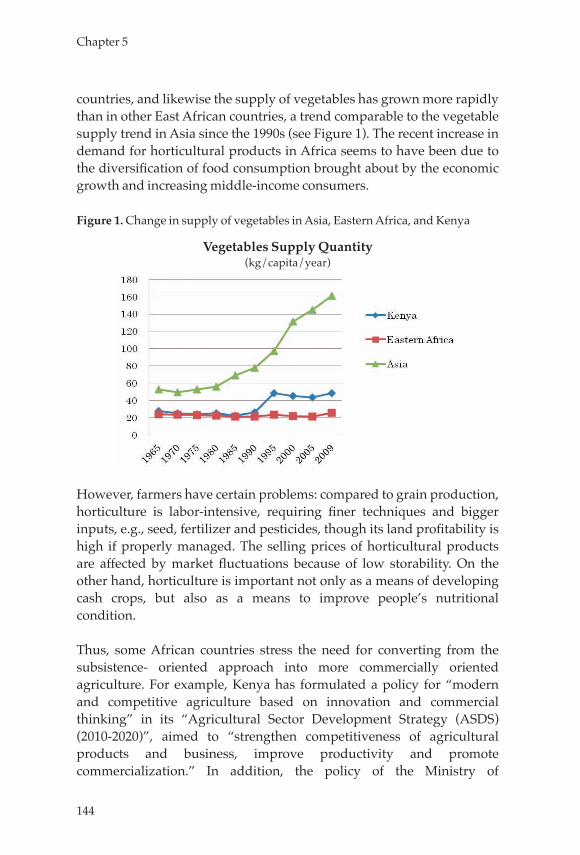
144
Chapter 5
countries, and likewise the supply of vegetables has grown more rapidly than in other East African countries, a trend comparable to the vegetable supply trend in Asia since the 1990s (see Figure 1). The recent increase in demand for horticultural products in Africa seems to have been due to the diversification of food consumption brought about by the economic growth and increasing middle-income consumers.
Figure 1. Change in supply of vegetables in Asia, Eastern Africa, and Kenya
Vegetables Supply Quantity(kg/capita/year)
However, farmers have certain problems: compared to grain production, horticulture is labor-intensive, requiring finer techniques and bigger inputs, e.g., seed, fertilizer and pesticides, though its land profitability is high if properly managed. The selling prices of horticultural products are affected by market fluctuations because of low storability. On the other hand, horticulture is important not only as a means of developing cash crops, but also as a means to improve people’s nutritional condition.
Thus, some African countries stress the need for converting from the subsistence- oriented approach into more commercially oriented agriculture. For example, Kenya has formulated a policy for “modern and competitive agriculture based on innovation and commercial thinking” in its “Agricultural Sector Development Strategy (ASDS) (2010-2020)”, aimed to “strengthen competitiveness of agricultural products and business, improve productivity and promote commercialization.” In addition, the policy of the Ministry of
145
Initiatives of SHEP and SHEP UP - Capacity development of small-scale farmers for increased responsiveness
to market needs
Agriculture of Kenya advocates “Farming as Business”. Among the various challenges in improving small-scale farmers’ market access, their capacity development (discussed in the subsequent sections) is an important factor.
2. Overview of SHEP and SHEP UPBackground for the implementation of the projectsHorticulture is a promising sub-sector of Kenya because of the country’s favorable environment. According to data from the Horticultural Crops Development Authority in Kenya, the sector has achieved an average annual growth rate of 20% since the 2000s.
However, the producers, and particularly small-scale farmers, who produce more than 60% of horticultural products traded in the country, are facing problems: weak organizations, low production, limited marketing channels, unstable selling prices, and underdeveloped production infrastructure, so their income remains low (Dolan 2010).
In order to improve the situation, the Kenyan Government conceived the idea of a project to address these challenges, and requested the Government of Japan to implement a technical cooperation project aimed at strengthening the organizational management capacity of small-scale farmers. Thus, the “Smallholder Horticulture Empowerment Project” (SHEP) was launched in November 2006.
Overall, the SHEP has been successful, doubling the income of targeted small-scale farmers through activities such as market surveys by farmers, strategic selection of crops to plant, development of action plans by farmers’ groups, and technical assistance.
Encouraged by the effectiveness of the project’s model, the Kenyan Ministry of Agriculture set up the “Smallholder Horticulture Empowerment and Promotion Unit” (SHEP Unit). The objective was to support small-scale horticulture farmers using the SHEP project model. In support, Japan, through JICA, has been implementing a five-year technical cooperation project: “Smallholder Horticulture Empowerment and Promotion Unit Project” (known as SHEP UP3), since 2010. This
3. The initiatives and outcome of the SHEP and SHEP UP were presented in the Camp David Accountability Report of the G8 held at Camp David in 2012.
146
Chapter 5
project aims at the organizational development and capacity development of the SHEP Unit.
Activities of SHEPThe SHEP project was implemented for three years from November 2006 and covered areas from the western and central part of Kenya: the counties of Bungoma (Western Province), Kisii (Nyanza Province), Nyandarua (Central Province) and Trans-Nzoia (Rift Valley Province), chosen because of the widespread poverty therein despite their high potential for horticulture cultivation. The Kenyan organizations responsible for the project were the Horticulture Division under the Ministry of Agriculture, and the Horticultural Crops Development Authority.
The project aimed at developing the capacity of smallholder horticulture farmer groups and verify if it actually brought about the net income increase of the members of the smallholder horticulture farmer groups supported by the project.
The initial step of the project was to sensitize the stakeholders to the project’s idea and familiarize them with the market-oriented approach (the SHEP approach). To do so, the project organized “Sensitization Workshops,” where briefings were given to the participants, including ministerial officials, provincial, district and divisional staff, extension officers, and targeted farmers.
Next was to survey the condition of the horticultural production of the area as well as the farmers’ capacities. The survey collected data on horticultural crop production,4 production techniques,5 and the farmers’ groups’ capacity as an organization.6 This survey provided data for the project and an opportunity for the farmers to be better acquainted with their own farming and for the groups to understand their current status. Secondly, the project organized opportunities where the model farmers’ groups and stakeholders related to horticulture could meet in the “FABLIST Forum: Farm Business Linkage Stakeholder Forum.” The 4. Such as on cultivation area, yields, production costs, sales prices, and income by crop planted in the previous year.5. This covered various aspects of production techniques being used by the farmers.6. This measured the current level of organizations, using Group Empowerment Indicators (GEIs), which allows the evaluation of organizational capacity in terms of leadership, cooperation among members, and gender structure.

147
Initiatives of SHEP and SHEP UP - Capacity development of small-scale farmers for increased responsiveness
to market needs
stakeholder participants included suppliers (seed, fertilizer and agro-chemical and agricultural equipment companies), agro-processing companies, financial institutions, agricultural research institutes, retail lenders, government agencies and NGOs. Each of them displayed products and provided information. The farmers’ group representatives and extension officers visited the booths to hold business talks and understand the horticulture market environment. Stakeholders were provided with profiles of the participating farmers’ groups7 and vice versa. This was intended to facilitate exchange and interaction among the participants.
After the forum, the project held a “Joint Extension Staff and Farmers Dual (2) Gender Training” (JEF2G Training) targeted at the representatives from model farmers’ groups and extension officers. Since women were responsible for about 70% of the farming activities, the same number of men and women were to be invited from the model farmers’ groups. The program mainly focused on training comprising modules such as market survey, crop selection, problem analysis and gender awareness training.After the training, “Group Exercises” were held to put into practice the lessons learned. These group exercises consisted of performing a market survey led by the farmers’ representatives who had taken part in the training with the assistance of an extension officer. Based on the survey results, the participants selected what crops to produce, and formulated an action plan for marketing them at reasonable, profitable prices. Subsequently, the project organized the “Facilitators’ Training for Farmers’ Demand-Driven Extension” to provide extension officers with the knowledge and techniques needed to support the model farmers’ groups in putting into practice the action plans. The training even contained modules on road maintenance using sand bag technology: it was included because the participators had to know how to maintain roads, which often deteriorate during the rainy season. Implementation of road maintenance was positioned as part of the project outcome, and thus it was encouraged as a village-wide activity involving local communities led by the model farmers’ groups. In this manner, capacity building of extension officers was performed through demand-driven technical training to meet the needs of the farmers’ groups.
7. The data included the name of the group, location, number of farmer members, contact information, cultivation items, yields, income, all collected from the Baseline Survey.
148
Chapter 5
After the training, the trained extension officers began teaching the techniques learnt to the model farmers’ groups to help them materialize their action plans. This was done through “In-field Training,” allowing the farmers to acquire the knowledge and techniques needed for the production of the crops selected.
Taking nearly a year, the activities were implemented in two periods, dividing the farmers’ groups in the 4 target counties into two groups of 42 and 80. The number of farmers of each group ranged between 15 and 50, with the average being 24. The project monitored the status of production and cultivation technique of horticultural crops of the model farmers’ groups in a manner similar to the baseline survey. Activities of SHEP UPThe SHEP Unit supports small-scale horticulture farmers through activities developed in the SHEP. JICA has been supporting the SHEP Unit since its establishment with a project called SHEP UP.
Activities developed in the SHEP are now being implemented in the country’s 8 provinces in 4 cycles, with 2 provinces being covered per year. In each province, the activities cover 10 districts. These districts were selected based on the scores they got on the submitted proposals. Each district had five target farmers’ groups.8 To promote the replication of the SHEP approach, the project envisaged that the district staff would implement activities on their own, using the resources of the district and provide support for other farmers’ groups, and by working together with the SHEP Unit.
Two new practices have been introduced since the implementation of the SHEP UP. One had to do with the selection of the target districts. Before, they were selected by the central government on certain criteria without involving district staff. Since the SHEP UP, however, a new system was introduced whereby interested districts must submit a proposal to the Provincial Director of Agriculture. The proposals were evaluated by the SHEP UP in accordance with criteria including the interest and motivation of district staff, depth of understanding of the SHEP approach, and the district’s horticultural cultivation potential. The final
8. This seemingly small number of farmer’s groups per district is due to the size of each district being reduced through the country’s administrative reform.
149
Initiatives of SHEP and SHEP UP - Capacity development of small-scale farmers for increased responsiveness
to market needs
selection decision was made by the Selection Committee in the Provincial Agricultural Office.
The second new practice was the “Organizers’ Training on the Basic SHEP Approach,” aimed at the staff of the selected districts. It is mainly intended to provide training on the SHEP Approach planning and implementation of the activities, and the development of a work plan and budget for the continuous implementation of the activities. As part of the training, district staff visited high-performing model farmers’ groups. On the final day of training, the participants took the “Examination on the Basic SHEP Approach.”
While there has been no fundamental change in the structure of activities developed by the SHEP, the contents have been revised on-site. By the end of 2012, around 460 farmers’ groups have taken part in the project in 60 districts and 6 provinces.
The table below shows a summary of the SHEP and SHEP UP.
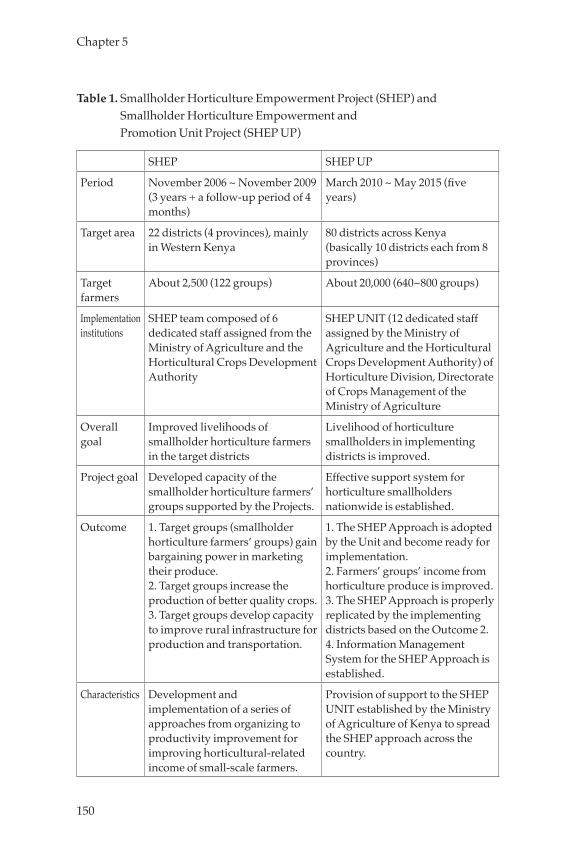
150
Chapter 5
Table 1. Smallholder Horticulture Empowerment Project (SHEP) and Smallholder Horticulture Empowerment and Promotion Unit Project (SHEP UP)
SHEP SHEP UP
Period November 2006 ~ November 2009(3 years + a follow-up period of 4 months)
March 2010 ~ May 2015 (five years)
Target area 22 districts (4 provinces), mainly in Western Kenya
80 districts across Kenya (basically 10 districts each from 8 provinces)
Target farmers
About 2,500 (122 groups) About 20,000 (640~800 groups)
Implementation institutions
SHEP team composed of 6 dedicated staff assigned from the Ministry of Agriculture and the Horticultural Crops Development Authority
SHEP UNIT (12 dedicated staff assigned by the Ministry of Agriculture and the Horticultural Crops Development Authority) of Horticulture Division, Directorate of Crops Management of the Ministry of Agriculture
Overall goal
Improved livelihoods of smallholder horticulture farmers in the target districts
Livelihood of horticulture smallholders in implementing districts is improved.
Project goal Developed capacity of the smallholder horticulture farmers’ groups supported by the Projects.
Effective support system for horticulture smallholders nationwide is established.
Outcome 1. Target groups (smallholder horticulture farmers’ groups) gain bargaining power in marketing their produce.2. Target groups increase the production of better quality crops.3. Target groups develop capacity to improve rural infrastructure for production and transportation.
1. The SHEP Approach is adopted by the Unit and become ready for implementation.2. Farmers’ groups’ income from horticulture produce is improved.3. The SHEP Approach is properly replicated by the implementing districts based on the Outcome 2.4. Information Management System for the SHEP Approach is established.
Characteristics Development and implementation of a series of approaches from organizing to productivity improvement for improving horticultural-related income of small-scale farmers.
Provision of support to the SHEP UNIT established by the Ministry of Agriculture of Kenya to spread the SHEP approach across the country.
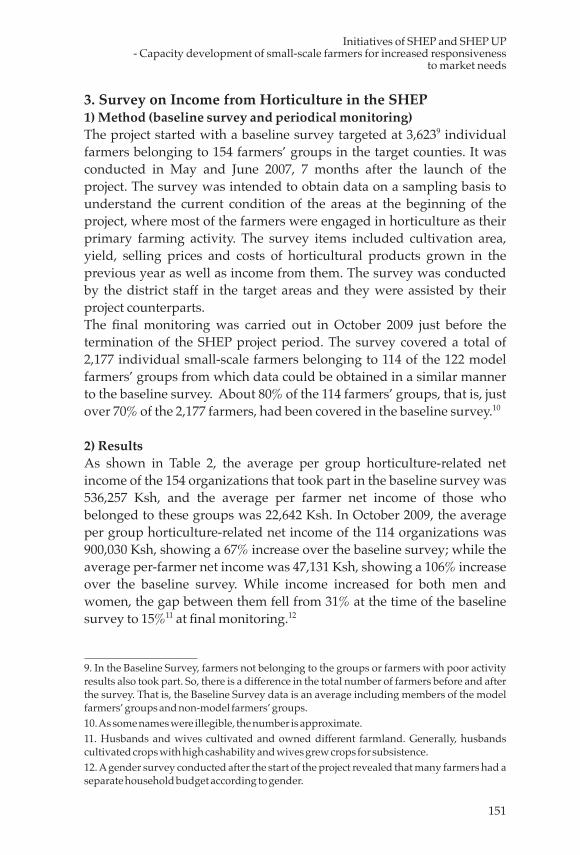
151
Initiatives of SHEP and SHEP UP - Capacity development of small-scale farmers for increased responsiveness
to market needs
3. Survey on Income from Horticulture in the SHEP 1) Method (baseline survey and periodical monitoring)The project started with a baseline survey targeted at 3,6239 individual farmers belonging to 154 farmers’ groups in the target counties. It was conducted in May and June 2007, 7 months after the launch of the project. The survey was intended to obtain data on a sampling basis to understand the current condition of the areas at the beginning of the project, where most of the farmers were engaged in horticulture as their primary farming activity. The survey items included cultivation area, yield, selling prices and costs of horticultural products grown in the previous year as well as income from them. The survey was conducted by the district staff in the target areas and they were assisted by their project counterparts. The final monitoring was carried out in October 2009 just before the termination of the SHEP project period. The survey covered a total of 2,177 individual small-scale farmers belonging to 114 of the 122 model farmers’ groups from which data could be obtained in a similar manner to the baseline survey. About 80% of the 114 farmers’ groups, that is, just over 70% of the 2,177 farmers, had been covered in the baseline survey.10
2) ResultsAs shown in Table 2, the average per group horticulture-related net income of the 154 organizations that took part in the baseline survey was 536,257 Ksh, and the average per farmer net income of those who belonged to these groups was 22,642 Ksh. In October 2009, the average per group horticulture-related net income of the 114 organizations was 900,030 Ksh, showing a 67% increase over the baseline survey; while the average per-farmer net income was 47,131 Ksh, showing a 106% increase over the baseline survey. While income increased for both men and women, the gap between them fell from 31% at the time of the baseline survey to 15%11 at final monitoring.12
9. In the Baseline Survey, farmers not belonging to the groups or farmers with poor activity results also took part. So, there is a difference in the total number of farmers before and after the survey. That is, the Baseline Survey data is an average including members of the model farmers’ groups and non-model farmers’ groups.10. As some names were illegible, the number is approximate. 11. Husbands and wives cultivated and owned different farmland. Generally, husbands cultivated crops with high cashability and wives grew crops for subsistence. 12. A gender survey conducted after the start of the project revealed that many farmers had a separate household budget according to gender.
152
Chapter 5
Table 2. Horticulture-related net income: per farmers’ group and per farmer (men and women) (Ksh*1)
Farmers’ Groups
Farming households
Men Women
Baseline Survey(May and June 2007)
536,257(154)*2
22,794 (3,623)
26,642 (1,940)
18,359 (1,683)
Final Monitoring(October 2009)
900,030 (114)
47,131(2,177)
50,221(1,111)
42,711(1,066)
*1 Exchange rate as of January 2013 (1USD = 84.5Ksh)*2 The numbers in parentheses shows the number of farmers’ groups and that of
farming households
4. Essence of Success of the SHEP
Though incomplete in the absence of control groups, the simple analysis above indicates the likelihood that the SHEP has been useful in improving the net income of farmers who participated in the project. Based on that assumption, the following sections will try to identify the factors that may have been behind the performance of the farmers practicing the SHEP approach; they are: the introduction of market- oriented agriculture, improvement of farming efficiency, introduction of appropriate techniques, and the utilization of existing administrative structures.
1) Introduction of market-oriented agricultureFirst and foremost, it was the introduction of market-oriented agriculture that seems to have been very effective in improving the net income of the farmers. The most fundamental change was observed in the farmers’ mindset. With the project, the farmers’ attitude toward marketing was transformed from passive to more positive, or from the one based on the mindset of “harvest (crops) first and then sell”, to the one based on the mindset of “harvest (strategically) to sell.” To nurture such attitudes, the project encouraged the farmers to conduct market surveys and problem analysis as well as to create action plans by themselves. To that end, the project encouraged the farmers, for example, to consult on their own such materials as “A Market Facilitator’s Guide to Participatory Agro-enterprise Development”
153
Initiatives of SHEP and SHEP UP - Capacity development of small-scale farmers for increased responsiveness
to market needs
(Ferris, et al. 2006) of the CIAT (The International Centre for Tropical Agriculture), rather than directly feeding them with periodical market information.
Especially, the market survey was found quite instrumental in helping the farmers. According to the final evaluation report prepared at the end of the SHEP, 56% of 276 farmers and 70% of 40 extension staff responded that they found the market survey important as a technique to help increase income (JICA 2012). Actually, the market survey received the highest evaluation score among the 15 training contents evaluated by the respondents. The market survey enabled the target farmers to know what crops are selling best, how prices fluctuate by season and how much of their products of what quality can be marketed at what timing. Through market surveys, farmers also became acquainted with multiple buyers to deal with. Based on such knowledge, farmers started to select crops that they believed would yield greater profits and to decide when to produce them. In other words, they were now able to visualize potential buyers and expected profits when they start sowing. Being able to negotiate with multiple buyers, their position in relation to them also strengthened, and they became more organized, once they realized that collective marketing works to their advantage. There were cases where some groups of farmers, though unsuccessful at their initial attempts, eventually succeeded in increasing income through market surveys and cultivation of adequate crops. All this indicates that the introduction of market-oriented agriculture played a significant role in increasing the farmers’ income. 2) Improvement in farming efficiency: an effective approach to gender
and useThe SHEP emphasized gender-related activities, and at its initial stage, the project devised plans for gender-related activities.13 The project not only provided training opportunities to women who were responsible for more than 70% of horticultural work, but also encouraged men (husbands) who still had the upper hand in the household to understand the role of women in farming. That is, explanations with illustrations were provided to men about gender consideration and code of conduct that would benefit all the family members. In both the SHEP and SHEP UP, as part of gender-related activities, the project performed a series of awareness-enhancing exercises that included the introduction of a daily
13. This job was facilitated by Japanese short-term gender experts.
154
Chapter 5
activity calendar and a list of gender–based division of labor in horticulture, and an analysis of access to and control of resources by gender. In order to overcome gender-related obstacles for increasing income, the project also encouraged the farmers’ groups to develop their gender action plans. By providing training on family budgeting, the project also emphasized the importance for the husbands and wives to have talks about domestic finance. This helped the farmers to save money necessary for the next season such as fertilizer and seeds, and contributed significantly to their horticulture production.
According to the evaluation at the end of the SHEP, 40% of 276 farmers who responded to the questionnaire found gender-related activities as having contributed to the increase in production and income, giving it third place among the 15 training contents in terms of importance. The gender-related activities encouraged husbands, who used to be farm managers, and wives, who used to be laborers, to become management partners, and contributed to a fairer division of household labor among them leading to efficient farming (JICA 2012).
3) Introduction of appropriate techniquesVarious techniques were introduced in the project. They were simple and applicable, using materials easily available to the farmers. In fact, in Kenya, a country where they have reached a certain level of technological know-how at the research station, the issue was not how to develop new technologies, but how to validate existing technologies from the farmers’ perspective and put them to practical use. Based on this understanding, the project focused on the introduction of techniques that were “immediately usable the moment they were learned,” such as the technique for correct planting using twine. The guidance on these techniques was provided jointly by Kenyan experts with abundant experience in horticulture-related guidance and Japanese experts who could provide advice from an outsider’s point of view. Even when introducing technologies quite new to the farmers, the project made sure that they would be applicable with the materials and techniques already existing locally; such technologies included road maintenance using sand bags (“Do-no,”), fermented organic manure (“BOKASHI”), and easy-to-handle weeding tools.
In both projects, the policy was never to force the use of specific techniques from outside but to inspire the farmers to be motivated into
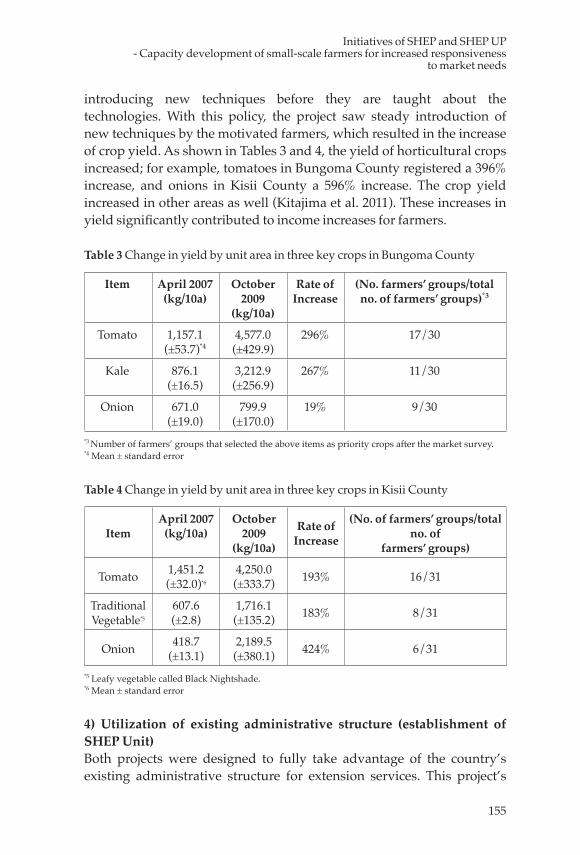
155
Initiatives of SHEP and SHEP UP - Capacity development of small-scale farmers for increased responsiveness
to market needs
introducing new techniques before they are taught about the technologies. With this policy, the project saw steady introduction of new techniques by the motivated farmers, which resulted in the increase of crop yield. As shown in Tables 3 and 4, the yield of horticultural crops increased; for example, tomatoes in Bungoma County registered a 396% increase, and onions in Kisii County a 596% increase. The crop yield increased in other areas as well (Kitajima et al. 2011). These increases in yield significantly contributed to income increases for farmers.
Table 3 Change in yield by unit area in three key crops in Bungoma County
Item April 2007(kg/10a)
October2009
(kg/10a)
Rate of Increase
(No. farmers’ groups/total no. of farmers’ groups)*3
Tomato 1,157.1(±53.7)*4
4,577.0(±429.9)
296% 17/30
Kale 876.1(±16.5)
3,212.9(±256.9)
267% 11/30
Onion 671.0(±19.0)
799.9(±170.0)
19% 9/30
*3 Number of farmers’ groups that selected the above items as priority crops after the market survey.*4 Mean ± standard error
Table 4 Change in yield by unit area in three key crops in Kisii County
ItemApril 2007
(kg/10a)October
2009 (kg/10a)
Rate of Increase
(No. of farmers’ groups/total no. of
farmers’ groups)
Tomato 1,451.2(±32.0)*6
4,250.0(±333.7) 193% 16/31
TraditionalVegetable*5
607.6(±2.8)
1,716.1(±135.2) 183% 8/31
Onion 418.7(±13.1)
2,189.5(±380.1) 424% 6/31
*5 Leafy vegetable called Black Nightshade.*6 Mean ± standard error
4) Utilization of existing administrative structure (establishment of SHEP Unit)Both projects were designed to fully take advantage of the country’s existing administrative structure for extension services. This project’s
156
Chapter 5
architecture was chosen on the obvious assumption that the activities introduced by the projects would continue after the end of the project. By adding nothing new and complicated to the existing routines, this structure helped local administrators to continue pursuing their activities. At the time of the start of SHEP (2006), the flow of extension services consisted, from top to bottom, of the Ministry of Agriculture, Provincial Office of Agriculture, District Agricultural Office, Divisional Agricultural Office and frontline extension officers. The roles of each of these actors in the project were determined so that the project activities may not deviate from their respective day-to-day responsibilities.
In the SHEP, however, the project team was established as a special unit for the project made up of Japanese experts and full-time staff assigned from the Ministry of Agriculture. Just before the completion of the SHEP, the “SHEP Unit” or the “Smallholder Horticulture Empowerment and Promotion Unit” was established at the Ministry of Agriculture of Kenya. The mandate of the Unit is to support small-scale farmers across the country using the SHEP approach. The Unit will continue the project after the end of JICA’s involvement.
5. Philosophy behind the SHEP Approach Use and application of the motivation theoryThe basic concept behind the SHEP approach is the motivation theory. By applying it, the projects introduced a mechanism in which the roles and responsibilities of the different actors (from the Ministry of Agriculture at the top down to the farmers) are clarified, and to allow each of the actors to spontaneously undertake actions. This mechanism is consistent with the discussion going on in the international arena in recent years about ownership and capacity development.
The structure of the project activities has been based on the motivation theory of Deci et al. (1995) in order to guarantee that the project activities will continue and expand with increasing creativity, moving toward the achievement of the ultimate goal. Deci classified motivation into intrinsic motivation and extrinsic motivation and concluded that intrinsically motivated activities are sustainable. Amabile (1996) argued that while extrinsic motivation deprives people of creativity, intrinsic motivation leads to creativity.
157
Initiatives of SHEP and SHEP UP - Capacity development of small-scale farmers for increased responsiveness
to market needs
In projects like SHEP, external actors like project staff and Japanese experts have no choice but to start by providing the people they work with with extrinsic motivation. Thus, assuming the arguments of Deci and Amable to be correct, the critical question was how to start with the provision of extrinsic motivation and shift to a situation where the targeted actors become intrinsically motivated and keep up their own creativity. To that end, the projects incorporated a variety of measures for each activity to encourage the smooth transition to intrinsic motivation. In the process, the following motivating factors were used: (1) self-determination: self-determination easily encourages subsequent development of ownership; (2) affinity motivation: creation of a mutual relationship encourages positive actions; (3) sense of achievement and feeling of competence: the sense of achievement that one feels after spontaneously solving a problem, and the feeling of competence that one feels when recognized by others when contributing to the continuation and further development of actions. It often happens that when an intrinsically motivated person receives an excessive reward from outside, the reward becomes his/her objective and the intrinsic motivation decreases (this is called the undermining effect). The project carefully planned its activities in such a way that the participants’ intrinsic motivation would not be adversely affected; for example, material inputs were limited only to those cases where they were absolutely needed, like in the demonstration of technologies.
In this manner, the project’s approach is based on the motivation theory and it was intended and designed so that an activity causes changes in a stakeholder’s mind and behavior, and a chain of such changes will eventually make him/her intrinsically motivated. This transition of stakeholders from being extrinsically motivated to intrinsically motivated does not only contribute to the attainment of the project goal, but also to the securing of the sustainability of activities after the end of the project. Intrinsically motivated stakeholders, including the farmers and those who support them, will be able to tap their potential to the fullest, and to pursue their activities with creativity.
Design of activities in logical sequencesHaving the motivation theory as its conceptual base, the project’s activities were designed such that the individual activities form a clear and firmly connected chain of achievements and subsequent steps; in other words, the activities are sequenced so that once a participant
158
Chapter 5
completes an activity, he/she is expected to have reached a certain level, based on which he/she will be facing a next activity step. Broadly, this consists of two steps. In the first step, a project participant is provided with an opportunity to raise his/her awareness. Such opportunities included, for farmers, for example, a match-making forum for stakeholders involved in the horticulture industry; the opportunity of conducting a market survey by farmers’ groups itself constituted an opportunity to enhance their awareness of the outside world; and activities related to different gender-based roles in the household mentioned above also provided an opportunity.
The second step was for the participants to work out, based on enhanced awareness, a plan of action for improving the current situation and implement the plan. The project participants got assistance from the project in their plan-making and implementation of such plans. Through this series of events, including awareness building, planning of actions and their implementation, participants’ capabilities were gradually strengthened (JICA 2012).
To make sure that this kind of sequence happens, SHEP and SHEP UP projects instituted a detailed work procedure that leaves no logical gaps between the individual activities or outcomes. For example, a farmer is presented with a visible goal such as an increase in his/her profit through the sale of horticultural crops. He/she will then be encouraged to steadily go forward by taking the steps to achieve the goal. Further, they were enabled to envision how, when and where their own crops will be traded through the match-making forum and market surveys. The project visibly displayed the steps to follow for achieving such goals, and provided the farmers with the necessary skills in taking such steps.
Using this kind of mechanism, overall, the projects provided the farmers both with the motivation and necessary skills to realize their targets. And that kind of steady support for farmers through the project was made possible by designing the activities in a sequence where the steps are logically connected with one another, as will be explained in the next section.
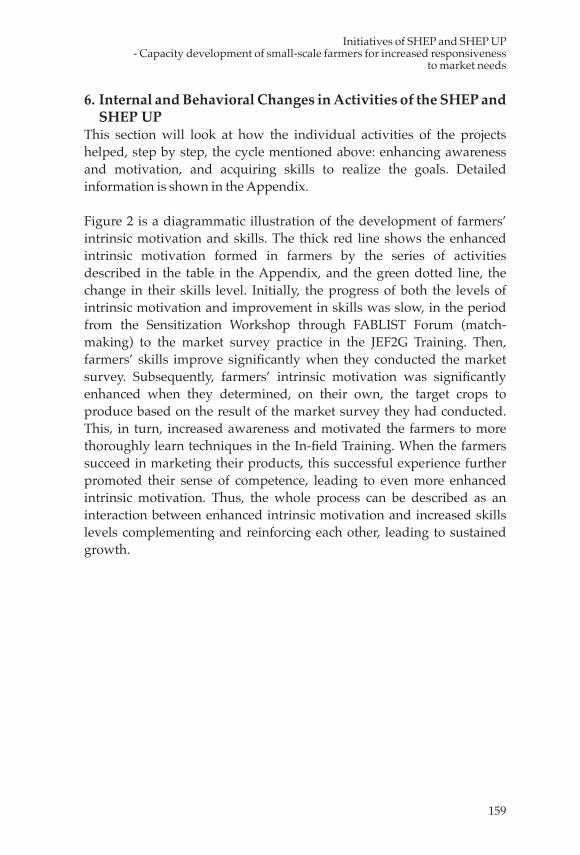
159
Initiatives of SHEP and SHEP UP - Capacity development of small-scale farmers for increased responsiveness
to market needs
6. Internal and Behavioral Changes in Activities of the SHEP and SHEP UP
This section will look at how the individual activities of the projects helped, step by step, the cycle mentioned above: enhancing awareness and motivation, and acquiring skills to realize the goals. Detailed information is shown in the Appendix.
Figure 2 is a diagrammatic illustration of the development of farmers’ intrinsic motivation and skills. The thick red line shows the enhanced intrinsic motivation formed in farmers by the series of activities described in the table in the Appendix, and the green dotted line, the change in their skills level. Initially, the progress of both the levels of intrinsic motivation and improvement in skills was slow, in the period from the Sensitization Workshop through FABLIST Forum (match-making) to the market survey practice in the JEF2G Training. Then, farmers’ skills improve significantly when they conducted the market survey. Subsequently, farmers’ intrinsic motivation was significantly enhanced when they determined, on their own, the target crops to produce based on the result of the market survey they had conducted. This, in turn, increased awareness and motivated the farmers to more thoroughly learn techniques in the In-field Training. When the farmers succeed in marketing their products, this successful experience further promoted their sense of competence, leading to even more enhanced intrinsic motivation. Thus, the whole process can be described as an interaction between enhanced intrinsic motivation and increased skills levels complementing and reinforcing each other, leading to sustained growth.
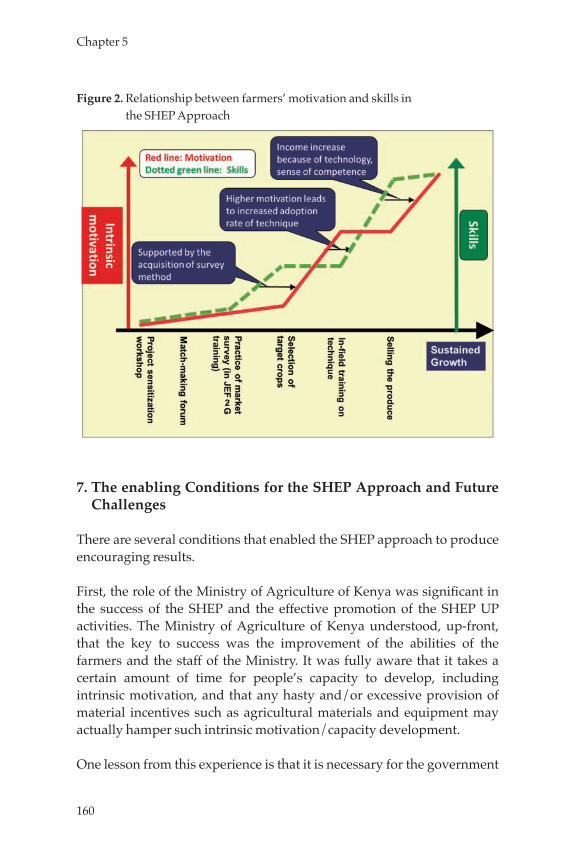
160
Chapter 5
Figure 2. Relationship between farmers’ motivation and skills in the SHEP Approach
7. The enabling Conditions for the SHEP Approach and Future Challenges
There are several conditions that enabled the SHEP approach to produce encouraging results.
First, the role of the Ministry of Agriculture of Kenya was significant in the success of the SHEP and the effective promotion of the SHEP UP activities. The Ministry of Agriculture of Kenya understood, up-front, that the key to success was the improvement of the abilities of the farmers and the staff of the Ministry. It was fully aware that it takes a certain amount of time for people’s capacity to develop, including intrinsic motivation, and that any hasty and/or excessive provision of material incentives such as agricultural materials and equipment may actually hamper such intrinsic motivation/capacity development.
One lesson from this experience is that it is necessary for the government
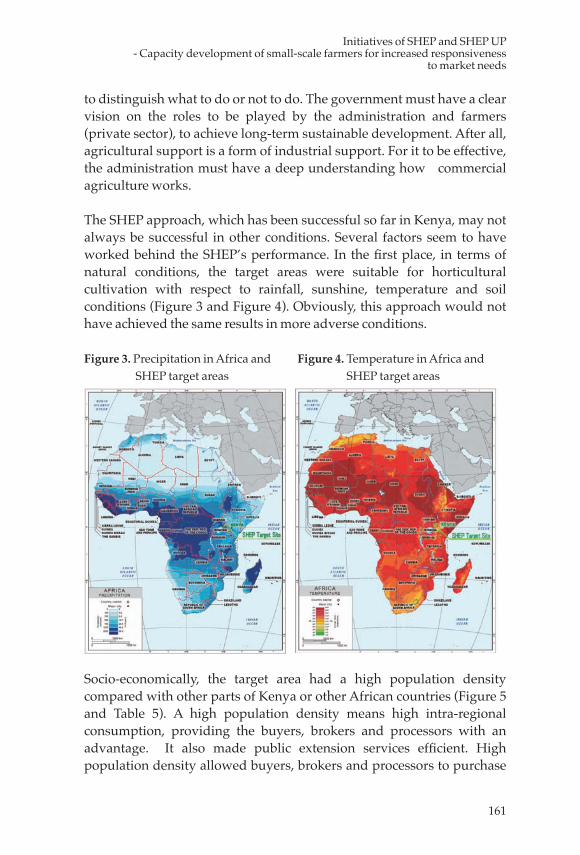
161
Initiatives of SHEP and SHEP UP - Capacity development of small-scale farmers for increased responsiveness
to market needs
to distinguish what to do or not to do. The government must have a clear vision on the roles to be played by the administration and farmers (private sector), to achieve long-term sustainable development. After all, agricultural support is a form of industrial support. For it to be effective, the administration must have a deep understanding how commercial agriculture works.
The SHEP approach, which has been successful so far in Kenya, may not always be successful in other conditions. Several factors seem to have worked behind the SHEP’s performance. In the first place, in terms of natural conditions, the target areas were suitable for horticultural cultivation with respect to rainfall, sunshine, temperature and soil conditions (Figure 3 and Figure 4). Obviously, this approach would not have achieved the same results in more adverse conditions.
Figure 3. Precipitation in Africa and SHEP target areas
Socio-economically, the target area had a high population density compared with other parts of Kenya or other African countries (Figure 5 and Table 5). A high population density means high intra-regional consumption, providing the buyers, brokers and processors with an advantage. It also made public extension services efficient. High population density allowed buyers, brokers and processors to purchase
Figure 4. Temperature in Africa and SHEP target areas
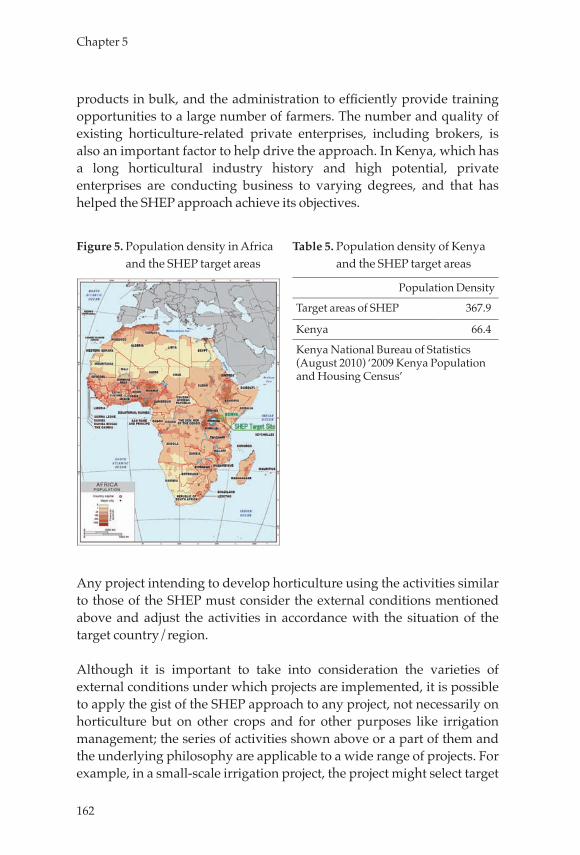
162
Chapter 5
products in bulk, and the administration to efficiently provide training opportunities to a large number of farmers. The number and quality of existing horticulture-related private enterprises, including brokers, is also an important factor to help drive the approach. In Kenya, which has a long horticultural industry history and high potential, private enterprises are conducting business to varying degrees, and that has helped the SHEP approach achieve its objectives.
Any project intending to develop horticulture using the activities similar to those of the SHEP must consider the external conditions mentioned above and adjust the activities in accordance with the situation of the target country/region.
Although it is important to take into consideration the varieties of external conditions under which projects are implemented, it is possible to apply the gist of the SHEP approach to any project, not necessarily on horticulture but on other crops and for other purposes like irrigation management; the series of activities shown above or a part of them and the underlying philosophy are applicable to a wide range of projects. For example, in a small-scale irrigation project, the project might select target
Population Density
Target areas of SHEP 367.9
Kenya 66.4
Kenya National Bureau of Statistics (August 2010) ‘2009 Kenya Population and Housing Census’
Table 5. Population density of Kenya and the SHEP target areas
Figure 5. Population density in Africa and the SHEP target areas
163
Initiatives of SHEP and SHEP UP - Capacity development of small-scale farmers for increased responsiveness
to market needs
counties for small-scale development, using the proposal system used for the selection of districts implementing the SHEP UP. This process would ensure that the selected counties will be willing to manage the facility voluntarily after their initial development.
There are a number of examples of actual agricultural development that support the validity of the SHEP approach. In Japan, for example, the role of advanced farmers and agricultural cooperatives was significant in developing clusters of producers to meet the market needs. And generally, it seems that for a business to succeed there should be a proper relationship between the state and the private sector including farmers. Such cases of productive collaboration between the state and the private sector could be used as a reference for the implementation of the SHEP. The SHEP UP activities are currently being scaled-up across the country. They are also expanding across national boundaries: the personnel who have been trained and qualified in the SHEP and SHEP UP would assist other African countries as experts. In addition, interested parties in African countries could be invited to Kenya for field visits and training.
8. Summary and Conclusion
The SHEP and SHEP UP are good cases highlighting the importance of capacity development of stakeholders, including small-scale farmers, in improving the market access of small-scale farmers in Africa. The projects helped the farmers to improve their situation by encouraging them to do various activities including their own market survey. The projects also bridged the gap between market-related personnel and farmers, which brought about benefits to both parties: market-related personnel became able to buy products that met their standards at an appropriate time, and farmers to obtain profits by supplying such products. In the process, farmers were supported by the administration. Overall, the project was an attempt to comprehensively address the issues facing horticultural farmers in Kenya. The project helped the farmers acquire the habit of securing the marketability of the products before starting to grow a crop, which was a necessary undertaking for them in view of the low storability of horticultural crops. The project also introduced gender-related activities, which also significantly contributed to the improvement in their farming methods. The SHEP and SHEP UP started with the premise that horticultural
164
Chapter 5
farming is an industry, no matter how small the scale of the market as a whole or the farming of individual farmers. Based on that premise, the projects developed a series of activities to encourage the farmers to develop behavior to respond to the needs of the market, using it both as the starting point of their strategy as well as their ultimate goal.
As mentioned earlier, many African countries are encouraging their farmers to transform their current subsistence-oriented agriculture into a more commercially-oriented venture. However, small-scale farmers in Africa did not know how to achieve it, though they had been conducting farming as a business unit based on rational decision making. The project filled this gap. A remark by the District Agricultural Officer in the SHEP UP accurately describes the characteristics and effects of the initiatives of the project: “Although the philosophy of ‘Farming as Business’ had been repeatedly stated by the Ministry, we did not know what we could do about it. The SHEP UP, however, has taught us how to implement it at the field level.”
Since the 1990s, many donors have been providing support for value chain development. Their support had tended to focus on the downstream part of the supply chain from production through to sales, or the portion close to post-harvest processing and sales. By contrast, the SHEP and SHEP UP provided support to small-scale farmers with every step from production through to sales, covering various aspects of the activities in ways that are adoptable by the farmers.
In doing so, the project always put the farmers at the center in designing its activities and refining its methods. “Does it move the people?” – this was the question that was repeatedly asked all through the project. From this perspective, and referring to the motivation theory, the project designed its activities in sequences of steps firmly connected with one another by causal relations and logic. This “people-centered” perspective has been applied to all activities. For example, when choosing a technology to recommend to farmers, the project thoroughly examined its desirability from the farmers’ point of view: in terms of their merits, contribution to income gains, and technical sustainability.14
14. One reason why this perspective could be uncompromisingly applied may have been the business model of JICA’s technical cooperation that emphasizes interaction and joint work among people. In this case, it was the interaction among farmers, Kenyan administrators and Japanese experts that made the “people-centered” approach possible.
165
Initiatives of SHEP and SHEP UP - Capacity development of small-scale farmers for increased responsiveness
to market needs
However, one may say that in essence there is nothing new in the activities and approaches established in the SHEP and SHEP UP: for example, the importance of capacity development through enhanced motivation had long been emphasized as an essential component of technical cooperation; logically coherent project structure is an ABC of development project design. It was perhaps the combination of these basics that made the SHEP successful in helping small-scale horticultural farmers to double their income, and the SHEP UP be adopted as an authorized administrative mechanism.
A combination of existing knowledge can sometimes create something new. Take, for example, the “iPhone” and “iPod” of Apple Inc. It is said that the materials and technologies used in these new gadgets were not newly invented by Apple Inc. or Steve Jobs (Kitani 2012). They have, however, achieved great success by combining existing materials and technologies, and anticipating the needs of the times. In an interview, Steve Jobs said that an innovation does not necessarily mean inventing a new thing or new technology, but it comes about by transforming a combination of existing technologies and ideas into a new technology, a product or a service (Gallo 2011). In the same vein, probably, the secret of the success of the SHEP and SHEP UP lies in the fact that it combined the concept of capacity development, which is the basic premise of Japanese technical cooperation, with careful planning of activities based on the firm logical sequence of activities and the motivation theory.
166
Chapter 5
References
Amabile, T. M. 1996. Creativity in context. Boulder: Westview Press.Deci, E. L., and R. Flaste. 1995. Why we do what we do: Understanding self-
motivation. New York: Putnam’s Sons.Dolan, C. S., and K. Sutherland. 2010. Gender and Employment in the
Kenya horticulture value chain. Globalisation and Poverty, Discussion Paper 8.
Ferris, S., et al. 2006. A market facilitator’s guide to participatory agro-enterprise development. Kampala, Uganda: CIAT (The International Centre for Tropical Agriculture).
Gallo, C. 2011. The innovation secrets of Steve Jobs. [In Japanese.] Tokyo: Nikkei BP.
Japan International Cooperation Agency. [Harada, K.] 2007. Short-term gender specialist job completion report on the Smallholder Horticulture Empowerment Project in the Republic of Kenya. Tokyo: JICA.
Japan International Cooperation Agency. 2012. Project completion and evaluation report on Smallholder Horticulture Empowerment Project in the Republic of Kenya. Tokyo: JICA.
Kitajima, H., and J. Aikawa. 2011. Project trial compliant with marketing in Kenya (2). Japanese Society of Tropical Medicine supp. vol. 109: 95–96.
Kiya, T. 2012. All success begins with a concept. [In Japanese.] Tokyo: Diamond.
Republic of Ghana. 2006. Food and Agriculture Sector Development Policy: FASDEP II (2007–2012).
Republic of Ghana. 2011. Medium-Term Agriculture Sector Investment Plan: METASIP (2011–2015).
Republic of Kenya. 2009. Agricultural Sector Development Strategy: ASDS (2010–2020).
Republic of Rwanda. 2009. Strategic Plan for Agricultural Transformation: SPAT (2009–2012).
USAID, and Republic of Kenya [Development and Training Services, Inc.]. 2012. Multi-stakeholder evaluation of agriculture and livestock value chain activities in Kenya. Arlington, VA: Development and Training Services.
World Bank. 2008. World development report 2008. Washington, D.C.: World Bank.
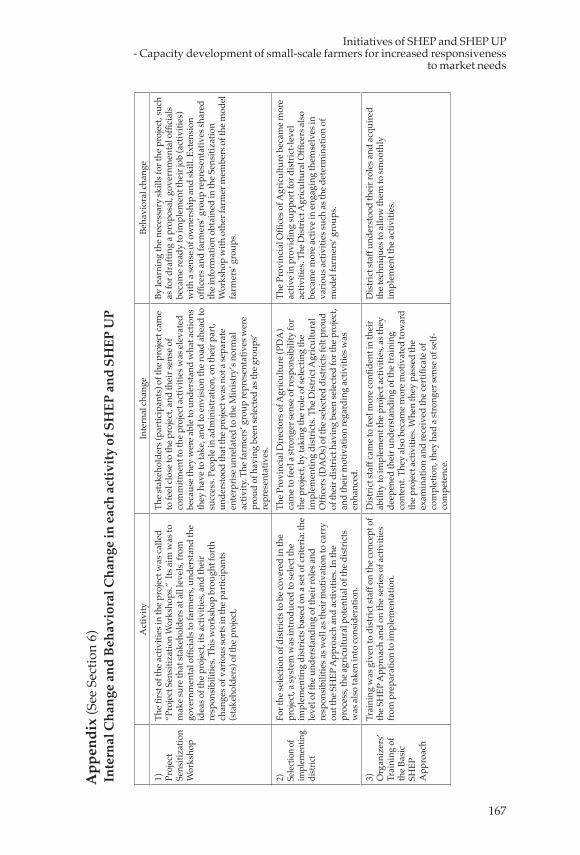
167
Initiatives of SHEP and SHEP UP - Capacity development of small-scale farmers for increased responsiveness
to market needs
App
endi
x (S
ee S
ectio
n 6)
In
tern
al C
hang
e an
d Be
havi
oral
Cha
nge
in e
ach
activ
ity o
f SH
EP a
nd S
HEP
UP
Act
ivity
Inte
rnal
chan
geBe
havi
oral
chan
ge1) Pr
ojec
t Se
nsiti
zatio
n W
orks
hop
The fi
rst o
f the
act
iviti
es in
the p
roje
ct w
as ca
lled
“Pro
ject
Sen
sitiz
atio
n W
orks
hops
.” I
ts a
im w
as to
m
ake s
ure t
hat s
take
hold
ers a
t all
leve
ls, f
rom
go
vern
men
tal o
ffici
als t
o fa
rmer
s, un
ders
tand
the
idea
s of t
he p
roje
ct, i
ts a
ctiv
ities
, and
thei
r re
spon
sibi
litie
s. Th
is w
orks
hop
brou
ght f
orth
ch
ange
s of v
ario
us so
rts i
n th
e par
ticip
ants
(s
take
hold
ers)
of t
he p
roje
ct,
The s
take
hold
ers (
part
icip
ants
) of t
he p
roje
ct ca
me
to fe
el cl
ose t
o th
e pro
ject
, and
thei
r sen
se o
f co
mm
itmen
t to
the p
roje
ct a
ctiv
ities
was
elev
ated
be
caus
e the
y w
ere a
ble t
o un
ders
tand
wha
t act
ions
th
ey h
ave t
o ta
ke, a
nd to
envi
sion
the r
oad
ahea
d to
su
cces
s. Pe
ople
in a
dmin
istr
atio
n, o
n th
eir p
art,
unde
rsto
od th
at th
e pro
ject
was
not
a se
para
te
ente
rpris
e unr
elat
ed to
the M
inis
try’
s nor
mal
ac
tivity
. The
farm
ers’
gro
up re
pres
enta
tives
wer
e pr
oud
of h
avin
g be
en se
lect
ed a
s the
gro
ups’
re
pres
enta
tives
.
By le
arni
ng th
e nec
essa
ry sk
ills f
or th
e pro
ject
, suc
h as
for d
rafti
ng a
pro
posa
l, go
vern
men
tal o
ffici
als
beca
me r
eady
to im
plem
ent t
heir
job
(act
iviti
es)
with
a se
nse o
f ow
ners
hip
and
skill
. Ext
ensi
on
offic
ers a
nd fa
rmer
s’ g
roup
repr
esen
tativ
es sh
ared
th
e inf
orm
atio
n ob
tain
ed in
the S
ensi
tizat
ion
Wor
ksho
p w
ith o
ther
farm
er m
embe
rs o
f the
mod
el
farm
ers’
gro
ups.
2) Selec
tion
of
impl
emen
ting
distr
ict
For t
he se
lect
ion
of d
istr
icts
to b
e cov
ered
in th
e pr
ojec
t, a
syst
em w
as in
trod
uced
to se
lect
the
impl
emen
ting
dist
ricts
bas
ed o
n a
set o
f crit
eria
: the
le
vel o
f the
und
erst
andi
ng o
f the
ir ro
les a
nd
resp
onsi
bilit
ies a
s wel
l as t
heir
mot
ivat
ion
to ca
rry
out t
he S
HEP
App
roac
h an
d ac
tiviti
es. I
n th
e pr
oces
s, th
e agr
icul
tura
l pot
entia
l of t
he d
istr
icts
w
as a
lso
take
n in
to co
nsid
erat
ion.
The P
rovi
ncia
l Dire
ctor
s of A
gric
ultu
re (P
DA
) ca
me t
o fe
el a
stro
nger
sens
e of r
espo
nsib
ility
for
the p
roje
ct, b
y ta
king
the r
ole o
f sel
ectin
g th
e im
plem
entin
g di
stric
ts. T
he D
istr
ict A
gric
ultu
ral
Offi
cers
(DA
Os)
of t
he se
lect
ed d
istr
icts
felt
prou
d of
thei
r dis
tric
t hav
ing
been
sele
cted
for t
he p
roje
ct,
and
thei
r mot
ivat
ion
rega
rdin
g ac
tiviti
es w
as
enha
nced
.
The P
rovi
ncia
l Offi
ces o
f Agr
icul
ture
bec
ame m
ore
activ
e in
prov
idin
g su
ppor
t for
dis
tric
t-lev
el
activ
ities
. The
Dis
tric
t Agr
icul
tura
l Offi
cers
als
o be
cam
e mor
e act
ive i
n en
gagi
ng th
emse
lves
in
vario
us a
ctiv
ities
such
as t
he d
eter
min
atio
n of
m
odel
farm
ers’
gro
ups.
3) Org
aniz
ers’
Tr
aini
ng o
f th
e Bas
ic
SHEP
A
ppro
ach
Trai
ning
was
giv
en to
dis
tric
t sta
ff on
the c
once
pt o
f th
e SH
EP A
ppro
ach
and
on th
e ser
ies o
f act
iviti
es
from
pre
para
tion
to im
plem
enta
tion.
Dis
tric
t sta
ff ca
me t
o fe
el m
ore c
onfid
ent i
n th
eir
abili
ty to
impl
emen
t the
pro
ject
act
iviti
es, a
s the
y de
epen
ed th
eir u
nder
stan
ding
of t
he tr
aini
ng
cont
ent.
They
als
o be
cam
e mor
e mot
ivat
ed to
war
d th
e pro
ject
act
iviti
es. W
hen
they
pas
sed
the
exam
inat
ion
and
rece
ived
the c
ertifi
cate
of
com
plet
ion,
they
had
a st
rong
er se
nse o
f sel
f-co
mpe
tenc
e.
Dis
tric
t sta
ff un
ders
tood
thei
r rol
es a
nd a
cqui
red
the t
echn
ique
s to
allo
w th
em to
smoo
thly
im
plem
ent t
he a
ctiv
ities
.
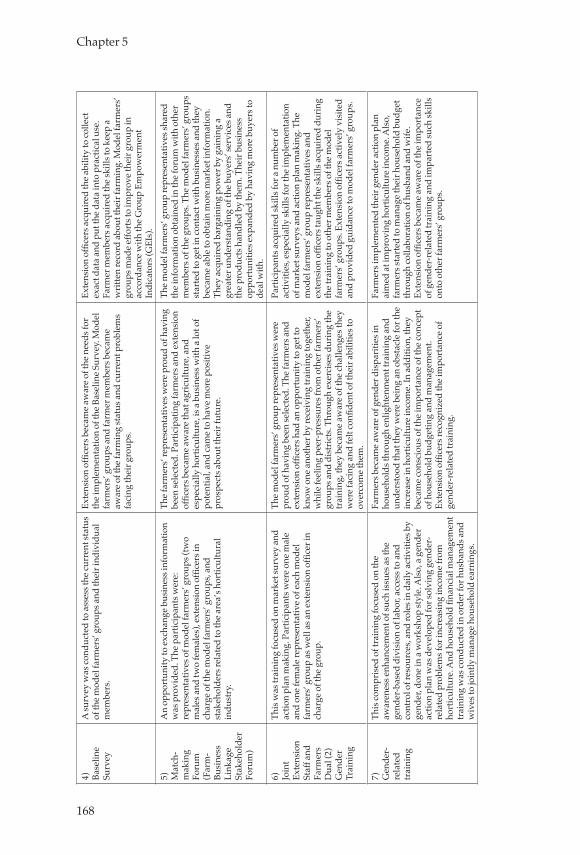
168
Chapter 5
4) Base
line
Surv
ey
A su
rvey
was
cond
ucte
d to
ass
ess t
he cu
rren
t sta
tus
of th
e mod
el fa
rmer
s’ g
roup
s and
thei
r ind
ivid
ual
mem
bers
.
Exte
nsio
n of
ficer
s bec
ame a
war
e of t
he n
eeds
for
the i
mpl
emen
tatio
n of
the B
asel
ine S
urve
y. M
odel
fa
rmer
s’ g
roup
s and
farm
er m
embe
rs b
ecam
e aw
are o
f the
farm
ing
stat
us a
nd cu
rren
t pro
blem
s fa
cing
thei
r gro
ups.
Exte
nsio
n of
ficer
s acq
uire
d th
e abi
lity
to co
llect
ex
act d
ata
and
put t
he d
ata
into
pra
ctic
al u
se.
Farm
er m
embe
rs a
cqui
red
the s
kills
to k
eep
a w
ritte
n re
cord
abo
ut th
eir f
arm
ing.
Mod
el fa
rmer
s’
grou
ps m
ade e
ffort
s to
impr
ove t
heir
grou
p in
ac
cord
ance
with
the G
roup
Em
pow
erm
ent
Indi
cato
rs (G
EIs)
.5) M
atch
-m
akin
g Fo
rum
(F
arm
-Bu
sine
ss
Link
age
Stak
ehol
der
Foru
m)
An
oppo
rtun
ity to
exch
ange
bus
ines
s inf
orm
atio
n w
as p
rovi
ded.
The
par
ticip
ants
wer
e:
repr
esen
tativ
es o
f mod
el fa
rmer
s’ g
roup
s (tw
o m
ales
and
two
fem
ales
), ex
tens
ion
offic
ers i
n ch
arge
of t
he m
odel
farm
ers’
gro
ups,
and
stak
ehol
ders
rela
ted
to th
e are
a’s h
ortic
ultu
ral
indu
stry
.
The f
arm
ers’
repr
esen
tativ
es w
ere p
roud
of h
avin
g be
en se
lect
ed. P
artic
ipat
ing
farm
ers a
nd ex
tens
ion
offic
ers b
ecam
e aw
are t
hat a
gric
ultu
re, a
nd
espe
cial
ly h
ortic
ultu
re, i
s a b
usin
ess w
ith a
lot o
f po
tent
ial,
and
cam
e to
have
mor
e pos
itive
pr
ospe
cts a
bout
thei
r fut
ure.
The m
odel
farm
ers’
gro
up re
pres
enta
tives
shar
ed
the i
nfor
mat
ion
obta
ined
in th
e for
um w
ith o
ther
m
embe
rs o
f the
gro
ups.
The m
odel
farm
ers’
gro
ups
star
ted
to g
et in
cont
act w
ith b
usin
esse
s and
they
be
cam
e abl
e to
obta
in m
ore m
arke
t inf
orm
atio
n.
They
acq
uire
d ba
rgai
ning
pow
er b
y ga
inin
g a
grea
ter u
nder
stan
ding
of t
he b
uyer
s’ se
rvic
es a
nd
the p
rodu
cts h
andl
ed b
y th
em. T
heir
busi
ness
op
port
uniti
es ex
pand
ed b
y ha
ving
mor
e buy
ers t
o de
al w
ith.
6) Join
t Ex
tens
ion
Staf
f and
Fa
rmer
s D
ual (
2)
Gen
der
Trai
ning
This
was
trai
ning
focu
sed
on m
arke
t sur
vey
and
actio
n pl
an m
akin
g. P
artic
ipan
ts w
ere o
ne m
ale
and
one f
emal
e rep
rese
ntat
ive o
f eac
h m
odel
fa
rmer
s’ g
roup
as w
ell a
s an
exte
nsio
n of
ficer
in
char
ge o
f the
gro
up.
The m
odel
farm
ers’
gro
up re
pres
enta
tives
wer
e pr
oud
of h
avin
g be
en se
lect
ed. T
he fa
rmer
s and
ex
tens
ion
offic
ers h
ad a
n op
port
unity
to g
et to
kn
ow o
ne a
noth
er b
y re
ceiv
ing
trai
ning
toge
ther
, w
hile
feel
ing
peer
-pre
ssur
es fr
om o
ther
farm
ers’
gr
oups
and
dis
tric
ts. T
hrou
gh ex
erci
ses d
urin
g th
e tr
aini
ng, t
hey
beca
me a
war
e of t
he ch
alle
nges
they
w
ere f
acin
g an
d fe
lt co
nfide
nt o
f the
ir ab
ilitie
s to
over
com
e the
m.
Part
icip
ants
acq
uire
d sk
ills f
or a
num
ber o
f ac
tiviti
es, e
spec
ially
skill
s for
the i
mpl
emen
tatio
n of
mar
ket s
urve
ys a
nd a
ctio
n pl
an m
akin
g. T
he
mod
el fa
rmer
s’ g
roup
repr
esen
tativ
es a
nd
exte
nsio
n of
ficer
s tau
ght t
he sk
ills a
cqui
red
durin
g th
e tra
inin
g to
oth
er m
embe
rs o
f the
mod
el
farm
ers’
gro
ups.
Exte
nsio
n of
ficer
s act
ivel
y vi
site
d an
d pr
ovid
ed g
uida
nce t
o m
odel
farm
ers’
gro
ups.
7) Gen
der-
rela
ted
trai
ning
This
com
pris
ed o
f tra
inin
g fo
cuse
d on
the
awar
enes
s enh
ance
men
t of s
uch
issu
es a
s the
ge
nder
-bas
ed d
ivis
ion
of la
bor,
acce
ss to
and
co
ntro
l of r
esou
rces
, and
role
s in
daily
act
iviti
es b
y ge
nder
, don
e in
a w
orks
hop
styl
e. A
lso,
a g
ende
r ac
tion
plan
was
dev
elop
ed fo
r sol
ving
gen
der-
rela
ted
prob
lem
s for
incr
easi
ng in
com
e fro
m
hort
icul
ture
. And
hou
seho
ld fi
nanc
ial m
anag
emen
t tr
aini
ng w
as co
nduc
ted
in o
rder
for h
usba
nds a
nd
wiv
es to
join
tly m
anag
e hou
seho
ld ea
rnin
gs.
Farm
ers b
ecam
e aw
are o
f gen
der d
ispa
ritie
s in
hous
ehol
ds th
roug
h en
light
enm
ent t
rain
ing
and
unde
rsto
od th
at th
ey w
ere b
eing
an
obst
acle
for t
he
incr
ease
in h
ortic
ultu
re in
com
e. In
add
ition
, the
y be
cam
e con
scio
us o
f the
impo
rtan
ce o
f the
conc
ept
of h
ouse
hold
bud
getin
g an
d m
anag
emen
t. Ex
tens
ion
offic
ers r
ecog
nize
d th
e im
port
ance
of
gend
er-r
elat
ed tr
aini
ng.
Farm
ers i
mpl
emen
ted
thei
r gen
der a
ctio
n pl
an
aim
ed a
t im
prov
ing
hort
icul
ture
inco
me.
Als
o,
farm
ers s
tart
ed to
man
age t
heir
hous
ehol
d bu
dget
th
roug
h co
llabo
ratio
n of
hus
band
and
wife
. Ex
tens
ion
offic
ers b
ecam
e aw
are o
f the
impo
rtan
ce
of g
ende
r-re
late
d tr
aini
ng a
nd im
part
ed su
ch sk
ills
onto
oth
er fa
rmer
s’ g
roup
s.
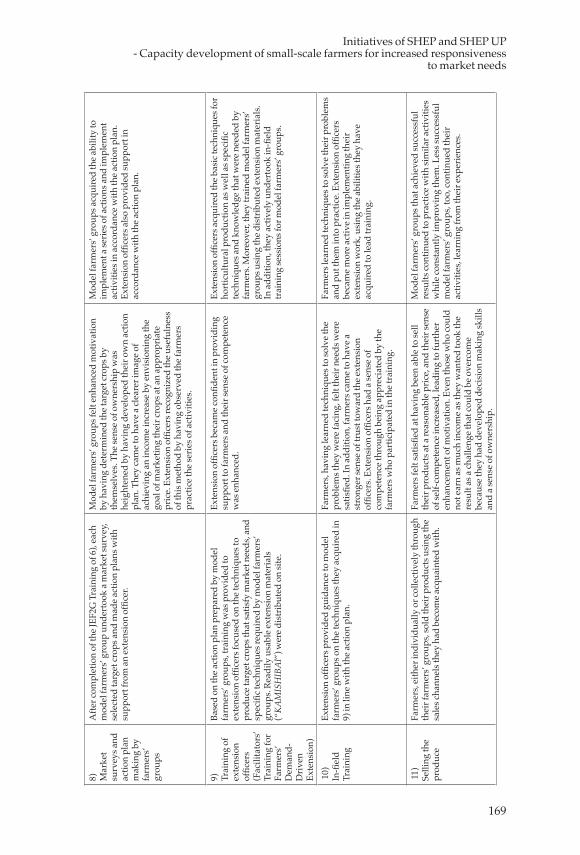
169
Initiatives of SHEP and SHEP UP - Capacity development of small-scale farmers for increased responsiveness
to market needs
8) Mar
ket
surv
eys a
nd
actio
n pl
an
mak
ing
by
farm
ers’
gr
oups
Afte
r com
plet
ion
of th
e JEF
2G T
rain
ing
of 6
), ea
ch
mod
el fa
rmer
s’ g
roup
und
erto
ok a
mar
ket s
urve
y,
sele
cted
targ
et cr
ops a
nd m
ade a
ctio
n pl
ans w
ith
supp
ort f
rom
an
exte
nsio
n of
ficer
.
Mod
el fa
rmer
s’ g
roup
s fel
t enh
ance
d m
otiv
atio
n by
hav
ing
dete
rmin
ed th
e tar
get c
rops
by
them
selv
es. T
he se
nse o
f ow
ners
hip
was
he
ight
ened
by
havi
ng d
evel
oped
thei
r ow
n ac
tion
plan
. The
y ca
me t
o ha
ve a
clea
rer i
mag
e of
achi
evin
g an
inco
me i
ncre
ase b
y en
visi
onin
g th
e go
al o
f mar
ketin
g th
eir c
rops
at a
n ap
prop
riate
pr
ice.
Ext
ensi
on o
ffice
rs re
cogn
ized
the u
sefu
lnes
s of
this
met
hod
by h
avin
g ob
serv
ed th
e far
mer
s pr
actic
e the
serie
s of a
ctiv
ities
.
Mod
el fa
rmer
s’ g
roup
s acq
uire
d th
e abi
lity
to
impl
emen
t a se
ries o
f act
ions
and
impl
emen
t ac
tiviti
es in
acc
orda
nce w
ith th
e act
ion
plan
. Ex
tens
ion
offic
ers a
lso
prov
ided
supp
ort i
n ac
cord
ance
with
the a
ctio
n pl
an.
9) Trai
ning
of
exte
nsio
n of
ficer
s (F
acili
tato
rs’
Trai
ning
for
Farm
ers’
D
eman
d-
Driv
en
Exte
nsio
n)
Base
d on
the a
ctio
n pl
an p
repa
red
by m
odel
fa
rmer
s’ g
roup
s, tr
aini
ng w
as p
rovi
ded
to
exte
nsio
n of
ficer
s foc
used
on
the t
echn
ique
s to
prod
uce t
arge
t cro
ps th
at sa
tisfy
mar
ket n
eeds
, and
sp
ecifi
c tec
hniq
ues r
equi
red
by m
odel
farm
ers’
gr
oups
. Rea
dily
usa
ble e
xten
sion
mat
eria
ls
(“KA
MIS
HIB
AI”
) wer
e dis
trib
uted
on
site
.
Exte
nsio
n of
ficer
s bec
ame c
onfid
ent i
n pr
ovid
ing
supp
ort t
o fa
rmer
s and
thei
r sen
se o
f com
pete
nce
was
enha
nced
.
Exte
nsio
n of
ficer
s acq
uire
d th
e bas
ic te
chni
ques
for
hort
icul
tura
l pro
duct
ion
as w
ell a
s spe
cific
te
chni
ques
and
kno
wle
dge t
hat w
ere n
eede
d by
fa
rmer
s. M
oreo
ver,
they
trai
ned
mod
el fa
rmer
s’
grou
ps u
sing
the d
istr
ibut
ed ex
tens
ion
mat
eria
ls.
In a
dditi
on, t
hey
activ
ely
unde
rtoo
k in
-fiel
d tr
aini
ng se
ssio
ns fo
r mod
el fa
rmer
s’ g
roup
s.
10)
In-fi
eld
Trai
ning
Exte
nsio
n of
ficer
s pro
vide
d gu
idan
ce to
mod
el
farm
ers’
gro
ups o
n th
e tec
hniq
ues t
hey
acqu
ired
in
9) in
line
with
the a
ctio
n pl
an.
Farm
ers,
havi
ng le
arne
d te
chni
ques
to so
lve t
he
prob
lem
s the
y w
ere f
acin
g, fe
lt th
eir n
eeds
wer
e sa
tisfie
d. In
add
ition
, far
mer
s cam
e to
have
a
stro
nger
sens
e of t
rust
tow
ard
the e
xten
sion
of
ficer
s. Ex
tens
ion
offic
ers h
ad a
sens
e of
com
pete
nce t
hrou
gh b
eing
app
reci
ated
by
the
farm
ers w
ho p
artic
ipat
ed in
the t
rain
ing.
Farm
ers l
earn
ed te
chni
ques
to so
lve t
heir
prob
lem
s an
d pu
t the
m in
to p
ract
ice.
Ext
ensi
on o
ffice
rs
beca
me m
ore a
ctiv
e in
impl
emen
ting
thei
r ex
tens
ion
wor
k, u
sing
the a
bilit
ies t
hey
have
ac
quire
d to
lead
trai
ning
.
11)
Selli
ng th
e pr
oduc
e
Farm
ers,
eith
er in
divi
dual
ly o
r col
lect
ivel
y th
roug
h th
eir f
arm
ers’
gro
ups,
sold
thei
r pro
duct
s usi
ng th
e sa
les c
hann
els t
hey
had
beco
me a
cqua
inte
d w
ith.
Farm
ers f
elt s
atis
fied
at h
avin
g be
en a
ble t
o se
ll th
eir p
rodu
cts a
t a re
ason
able
pric
e, a
nd th
eir s
ense
of
self-
com
pete
nce i
ncre
ased
, lea
ding
to fu
rthe
r en
hanc
emen
t of m
otiv
atio
n. E
ven
thos
e who
coul
d no
t ear
n as
muc
h in
com
e as t
hey
wan
ted
took
the
resu
lt as
a ch
alle
nge t
hat c
ould
be o
verc
ome
beca
use t
hey
had
deve
lope
d de
cisi
on m
akin
g sk
ills
and
a se
nse o
f ow
ners
hip.
Mod
el fa
rmer
s’ g
roup
s tha
t ach
ieve
d su
cces
sful
re
sults
cont
inue
d to
pra
ctic
e with
sim
ilar a
ctiv
ities
w
hile
cons
tant
ly im
prov
ing
them
. Les
s suc
cess
ful
mod
el fa
rmer
s’ g
roup
s, to
o, co
ntin
ued
thei
r ac
tiviti
es, l
earn
ing
from
thei
r exp
erie
nces
.

Part Ⅱ: Economic and Social Transformation

173
Chapter 6: Industrial Development of Africa – JICA’s commitment at TICAD IV and its follow-up
Go Shimada, Toru Homma, and Hiromichi Murakami
1. Introduction
In the 1960s, there were high hopes for newly independent Sub-Saharan African countries. At that time, Africa was economically better off than Asia. In 1970, Zambia’s GNI per capita was $432 and that of Malaysia, $392 (at current prices), indicating that the Zambian economy was doing better than Malaysia’s. In 1968, Gunnar Myrdal published Asian Drama, which was very pessimistic about the development prospects of South and South East Asia.
Almost a half century later, however, the situation has reversed and Asian economies have surpassed African economies. In 2011, GNI per capita was $9,656 for Malaysia and $1,425 for Zambia. This leads to a question: What were the reasons for this divergence between the two regions? This question was one of the issues heavily discussed at TICAD IV.
After TICAD IV, building on its analytical work concerning the Asian growth experience and African development, JICA enhanced support of industrial development to follow up the meeting. JICA has launched a comprehensive approach to support African industrial development, i.e., combining policy-level support with concrete project assistance to private sector development. Such initiative has matched the challenges and priorities of African development today, as well as the political commitment of African leaders, and has developed into tangible actions in Ethiopia and Zambia, among others.
This chapter will first discuss the need for the industrial development of
174
Chapter 6
Africa in order to achieve its sustainable economic growth, touching upon issues such as youth unemployment, de-industrialization processes, diversification of economic structure, and investment climate improvement. It will then examine strategies to tackle these challenges and the strong determination of African leaders to industrialize. These will be followed by three cases of JICA’s cooperation for Africa since TICAD IV, which include (1) research of the Asian experience and African development, (2) industrial policy dialogue and quality and productivity improvement (kaizen) in Ethiopia, and (3) support for investment promotion and economic diversification (“Triangle of Hope” approach) in Zambia.
2. Possibilities and Challenges – Necessity of Industrial Development of Africa
Africa’s long-term prospects for growth are good. The Economist Intelligence Unit (EIU) (2012) has forecast that average growth of the regional economy in 2013-16 will be around 5% a year. The economic performance of Sub-Saharan Africa, as Figure 1 shows, has been better than that of most developed countries. There are challenges, however, to sustain this economic growth. First, the youth population in Africa (including North Africa) is rapidly expanding, with close to 200 million people aged between 15 and 24. Although the expansion means a demographic bonus in the future and will make Africa a huge market by 2050, it also means that creating jobs for the younger generation will be a critically important issue. Otherwise, the dividend could become a curse. This has an important bearing on political stability as well as inclusive growth in the region.
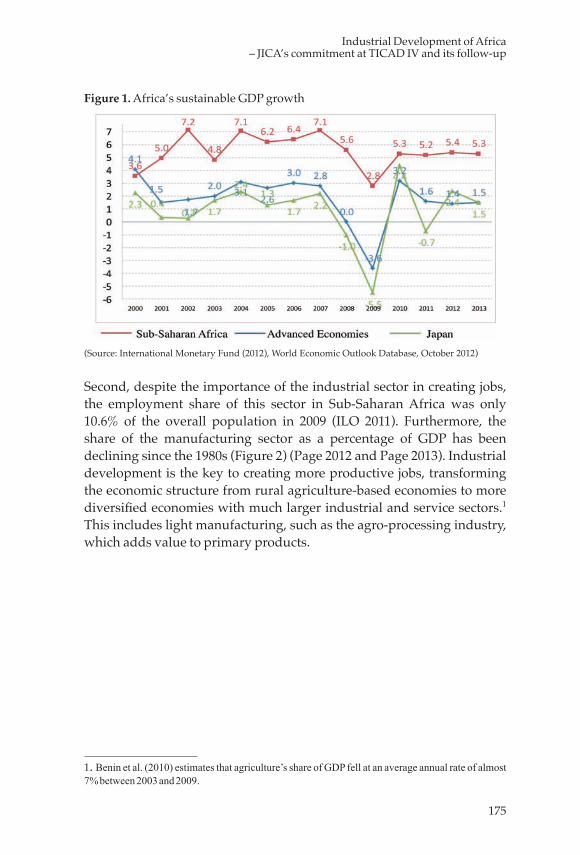
175
Industrial Development of Africa – JICA’s commitment at TICAD IV and its follow-up
Figure 1. Africa’s sustainable GDP growth
(Source: International Monetary Fund (2012), World Economic Outlook Database, October 2012)
Second, despite the importance of the industrial sector in creating jobs, the employment share of this sector in Sub-Saharan Africa was only 10.6% of the overall population in 2009 (ILO 2011). Furthermore, the share of the manufacturing sector as a percentage of GDP has been declining since the 1980s (Figure 2) (Page 2012 and Page 2013). Industrial development is the key to creating more productive jobs, transforming the economic structure from rural agriculture-based economies to more diversified economies with much larger industrial and service sectors.1 This includes light manufacturing, such as the agro-processing industry, which adds value to primary products.
1. Benin et al. (2010) estimates that agriculture’s share of GDP fell at an average annual rate of almost 7% between 2003 and 2009.
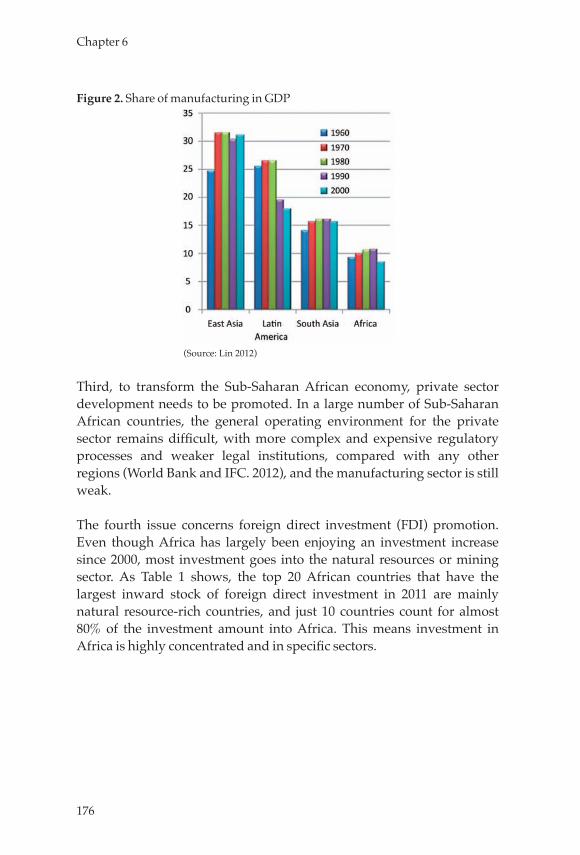
176
Chapter 6
Figure 2. Share of manufacturing in GDP
(Source: Lin 2012)
Third, to transform the Sub-Saharan African economy, private sector development needs to be promoted. In a large number of Sub-Saharan African countries, the general operating environment for the private sector remains difficult, with more complex and expensive regulatory processes and weaker legal institutions, compared with any other regions (World Bank and IFC. 2012), and the manufacturing sector is still weak.
The fourth issue concerns foreign direct investment (FDI) promotion. Even though Africa has largely been enjoying an investment increase since 2000, most investment goes into the natural resources or mining sector. As Table 1 shows, the top 20 African countries that have the largest inward stock of foreign direct investment in 2011 are mainly natural resource-rich countries, and just 10 countries count for almost 80% of the investment amount into Africa. This means investment in Africa is highly concentrated and in specific sectors.
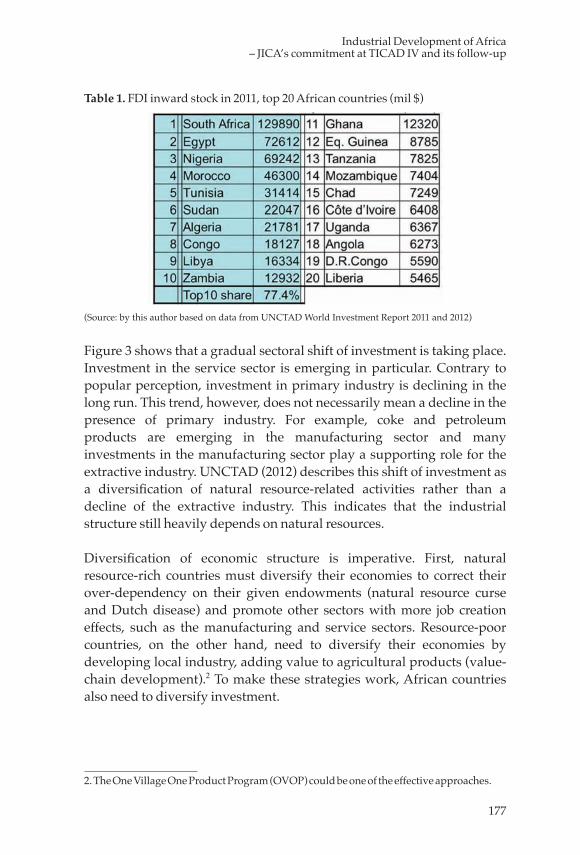
177
Industrial Development of Africa – JICA’s commitment at TICAD IV and its follow-up
Table 1. FDI inward stock in 2011, top 20 African countries (mil $)
(Source: by this author based on data from UNCTAD World Investment Report 2011 and 2012)
Figure 3 shows that a gradual sectoral shift of investment is taking place. Investment in the service sector is emerging in particular. Contrary to popular perception, investment in primary industry is declining in the long run. This trend, however, does not necessarily mean a decline in the presence of primary industry. For example, coke and petroleum products are emerging in the manufacturing sector and many investments in the manufacturing sector play a supporting role for the extractive industry. UNCTAD (2012) describes this shift of investment as a diversification of natural resource-related activities rather than a decline of the extractive industry. This indicates that the industrial structure still heavily depends on natural resources.
Diversification of economic structure is imperative. First, natural resource-rich countries must diversify their economies to correct their over-dependency on their given endowments (natural resource curse and Dutch disease) and promote other sectors with more job creation effects, such as the manufacturing and service sectors. Resource-poor countries, on the other hand, need to diversify their economies by developing local industry, adding value to agricultural products (value-chain development).2 To make these strategies work, African countries also need to diversify investment.
2. The One Village One Product Program (OVOP) could be one of the effective approaches.
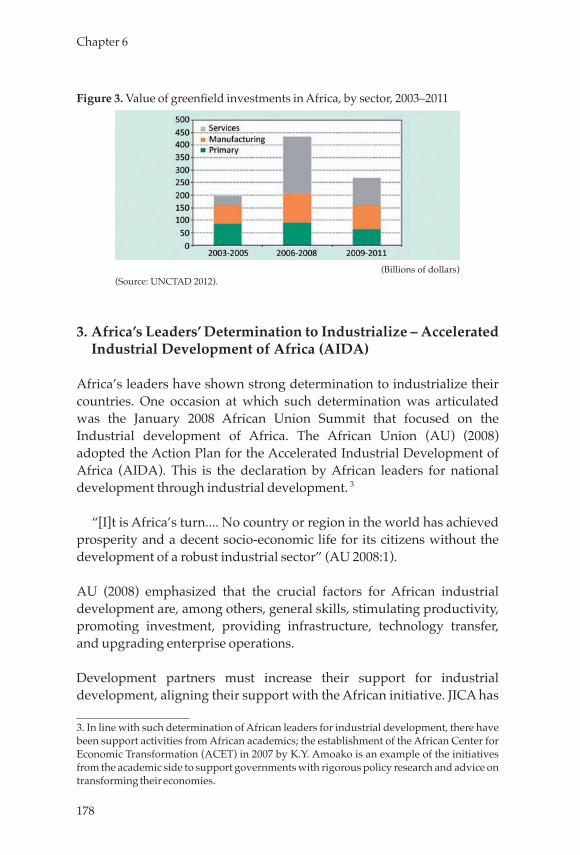
178
Chapter 6
Figure 3. Value of greenfield investments in Africa, by sector, 2003–2011
(Billions of dollars) (Source: UNCTAD 2012).
3. Africa’s Leaders’ Determination to Industrialize – Accelerated Industrial Development of Africa (AIDA)
Africa’s leaders have shown strong determination to industrialize their countries. One occasion at which such determination was articulated was the January 2008 African Union Summit that focused on the Industrial development of Africa. The African Union (AU) (2008) adopted the Action Plan for the Accelerated Industrial Development of Africa (AIDA). This is the declaration by African leaders for national development through industrial development. 3
“[I]t is Africa’s turn.... No country or region in the world has achieved prosperity and a decent socio-economic life for its citizens without the development of a robust industrial sector” (AU 2008:1).
AU (2008) emphasized that the crucial factors for African industrial development are, among others, general skills, stimulating productivity, promoting investment, providing infrastructure, technology transfer, and upgrading enterprise operations.
Development partners must increase their support for industrial development, aligning their support with the African initiative. JICA has
3. In line with such determination of African leaders for industrial development, there have been support activities from African academics; the establishment of the African Center for Economic Transformation (ACET) in 2007 by K.Y. Amoako is an example of the initiatives from the academic side to support governments with rigorous policy research and advice on transforming their economies.
179
Industrial Development of Africa – JICA’s commitment at TICAD IV and its follow-up
been aligning its assistance to AIDA, and as a part of the AIDA monitoring process, in 2010, JICA and its partner, the National Graduate Institute for Policy Studies (GRIPS), were invited to make presentations in the Addis Ababa meeting organized by the AU and the Economic Commission for Africa (ECA) to introduce Japan’s SME development policy (ECA 2010; Shimada 2010). This illustrates the growing interest in Asia’s development experience on the part of Africa, especially in terms of Asia’s industrial development.
There are numerous constraints for industrial development, ranging from lack of basic education to infrastructure. In the next two sections, we will focus on two aspects. One is how to make realistic strategies for industrial development. The other is how to promote more FDI, especially for non-resource-based sectors.
4. Development Strategies toward Industrial Development
At TICAD IV, held when there was a growing interest among African leaders in the Asian development experience, the JICA Research Institute organized a symposium on “Economic Development in Africa and the Asian Growth Experience.”4 The symposium aimed to hear African leaders’ insights on the relevance of the Asian experience in accelerating economic growth in Africa. The symposium particularly highlighted the role of the state in promoting economic growth while maintaining equity through appropriate public policy.5 Professor Stiglitz emphasized the relevance of the Asian lessons to strike a good balance between the state and the market (JICA 2008a).
Following TICAD IV and the G8 Hokkaido Toyako Summit, held in
4 . The symposium featured several eminent African leaders as panelists: H.E. Jakaya Mrisho Kikwete, President of the United Republic of Tanzania and Chairman of the African Union; H.E. Meles Zenawi, the late Prime Minister of the Federal Democratic Republic of Ethiopia; H.E. Joachim Alberto Chissano, former president of the Republic of Mozambique; and Dr. Donald Kaberuka, President of the African Development Bank Group. Professor Joseph Stiglitz of Columbia University also joined the discussion via a video link. Mrs. Sadako Ogata, then President of JICA, served as Chairperson.5 . The main points of the discussion in the symposium were as follows. It was noted that Africa is certainly growing; but the challenge is how to sustain accelerated growth. For this purpose, Africa needs to have an appropriate development strategy in which government is given more policy space to design a practical strategy that suits the unique situations in respective African countries.
180
Chapter 6
Japan just one month after TICAD IV, JICA started several initiatives to follow up on Japan’s commitment to Africa at the two meetings. One of them is research collaboration between the JICA Research Institute and Professor Stiglitz’s Initiative for Policy Dialogue (IPD) with the late Prime Minister Meles of Ethiopia participating. The research aimed to open a debate on facilitating economic growth and poverty reduction in Africa by applying Asia’s development lessons, and also to promote a more active role of governments in economic policies. The published results of the research called for fresh approaches to learn the lessons from successes both within and outside Africa, particularly drawing on the experiences of Asia.6 While they maintain there is no policy package that fits all sizes, they argued that at the center of the policy misstep in Africa was a failure to get the balance right between the state and the market.7
After a JICA-IDP meeting in Addis Ababa, Ethiopia, the then Prime Minister Meles made two requests to JICA (Ohno 2011; Shimada 2010; Kuwajima 2011). One of these requests was to help formulate industrial development policy. The other proposal was to support and nurture private companies. In response to these requests by the Prime Minister, JICA has taken a comprehensive approach to the issue of industrial development in Ethiopia. JICA’s comprehensive approach is based on the assumption that as the following figure shows, industrial development needs a multifaceted policy and actions (Shimada 2013).
6. The research resulted in the publishing of a book, which was brought out by Oxford University Press (Noman et al. 2012), titled “Good Growth and Governance in Africa: Rethinking Development Strategies.”7. This book addressed the following important questions: Why has the overall economic growth performance of Africa been disappointing during the past 50 years? More importantly, what are the policy options for reversing that trend? What are the possibilities and policies for Africa?
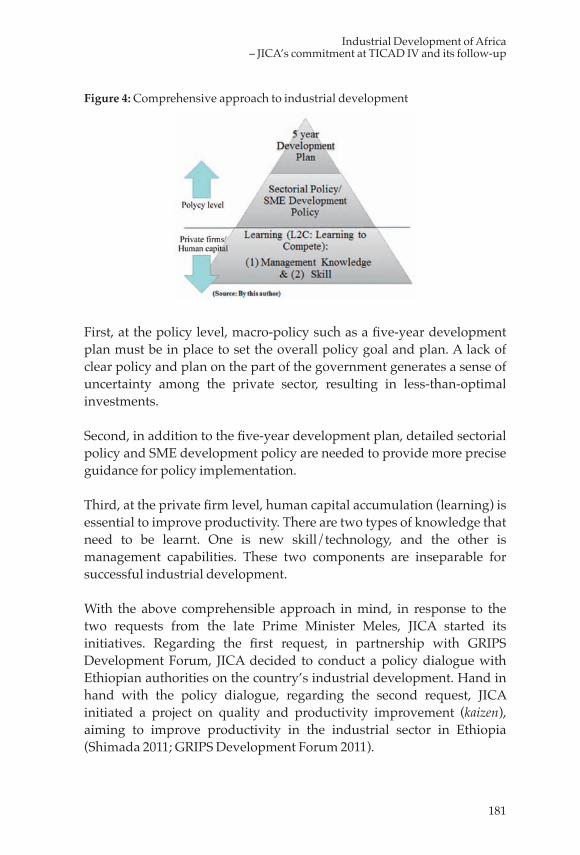
181
Industrial Development of Africa – JICA’s commitment at TICAD IV and its follow-up
Figure 4: Comprehensive approach to industrial development
First, at the policy level, macro-policy such as a five-year development plan must be in place to set the overall policy goal and plan. A lack of clear policy and plan on the part of the government generates a sense of uncertainty among the private sector, resulting in less-than-optimal investments.
Second, in addition to the five-year development plan, detailed sectorial policy and SME development policy are needed to provide more precise guidance for policy implementation.
Third, at the private firm level, human capital accumulation (learning) is essential to improve productivity. There are two types of knowledge that need to be learnt. One is new skill/technology, and the other is management capabilities. These two components are inseparable for successful industrial development.
With the above comprehensible approach in mind, in response to the two requests from the late Prime Minister Meles, JICA started its initiatives. Regarding the first request, in partnership with GRIPS Development Forum, JICA decided to conduct a policy dialogue with Ethiopian authorities on the country’s industrial development. Hand in hand with the policy dialogue, regarding the second request, JICA initiated a project on quality and productivity improvement (kaizen), aiming to improve productivity in the industrial sector in Ethiopia (Shimada 2011; GRIPS Development Forum 2011).
182
Chapter 6
4.1 Industrial policy dialogue and productivity improvement in Ethiopia
The policy dialogue with Ethiopian authorities, headed by the Prime Minister, covered issues from the policy level to actual implementation on the ground. The dialogue started with “policy visions,” which is an overall long-term policy guidance. The visions included Agricultural Development Led Industrialization (ADLI) and Democratic Developmentalism (DD), which are the guiding principles that the Ethiopian government has been adhering to. Discussions then moved toward the five-year development plan, “the Plan for Accelerated and Sustained Development to End Poverty (PASDEP) (2005-2009),” and culminated in a debate over the new five-year plan, “the Growth and Transformation Plan (GTP) 2010/11-2014/15.” Also discussed were sector policies such as those for basic metals and engineering industries. The sector survey provided a useful reference in the design of an industrial master plan.
The dialogue tried to fill in the gap in terms of the mindset and methodology of industrial policy making, mostly based on international comparison of good practices in Asia such as Japan, the Asian Tigers, and ASEAN. It was pointed out that self-study, learning from neighbors, and trial and error are the factors commonly found in the Asian experience. Further, it was argued that simply copying specific policies of an Asian country would not be a solution. The understanding was that there is a set of policy menus for industrial policy, and specific policies should be selected and adjusted to the unique conditions of each country, creating a climate of collaboration for Private-Public Partnership (PPP) (Ohno, K. 2011 and 2012).
Another factor emphasized as important was the coordination among government ministries in formulating industrial policy (Ohno, I. 2011). This coordination was the key to the success of Asian countries. In Asia, the functioning coordination mechanism among the government bureaucracy as well as with the private sector helped to make development policy making transparent and accountable, and to avoid the politicization of the process.
Based on the policy dialogue, the GTP expanded the policy scope to include the promotion of import-substitution industries. The new Micro and Small Enterprise (MSE) Development Strategy also encourages the
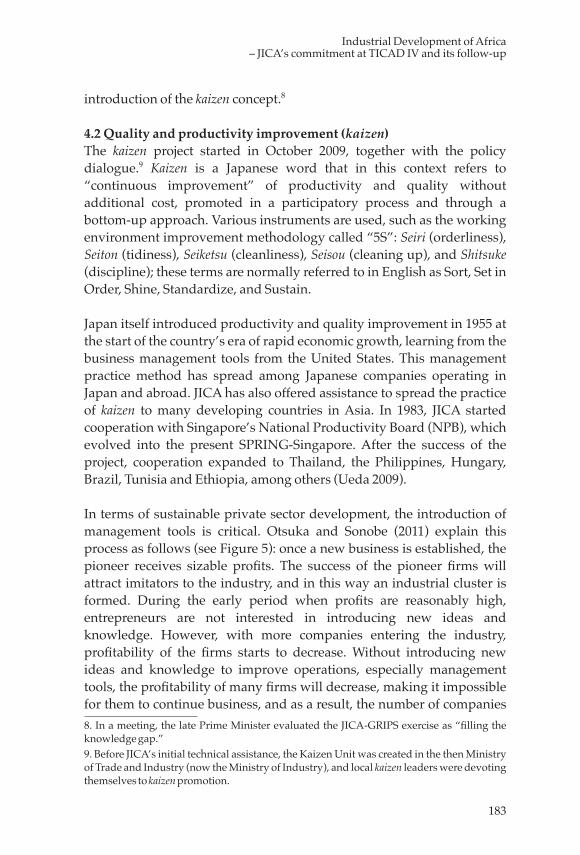
183
Industrial Development of Africa – JICA’s commitment at TICAD IV and its follow-up
introduction of the kaizen concept.8
4.2 Quality and productivity improvement (kaizen)The kaizen project started in October 2009, together with the policy dialogue.9 Kaizen is a Japanese word that in this context refers to “continuous improvement” of productivity and quality without additional cost, promoted in a participatory process and through a bottom-up approach. Various instruments are used, such as the working environment improvement methodology called “5S”: Seiri (orderliness), Seiton (tidiness), Seiketsu (cleanliness), Seisou (cleaning up), and Shitsuke (discipline); these terms are normally referred to in English as Sort, Set in Order, Shine, Standardize, and Sustain.
Japan itself introduced productivity and quality improvement in 1955 at the start of the country’s era of rapid economic growth, learning from the business management tools from the United States. This management practice method has spread among Japanese companies operating in Japan and abroad. JICA has also offered assistance to spread the practice of kaizen to many developing countries in Asia. In 1983, JICA started cooperation with Singapore’s National Productivity Board (NPB), which evolved into the present SPRING-Singapore. After the success of the project, cooperation expanded to Thailand, the Philippines, Hungary, Brazil, Tunisia and Ethiopia, among others (Ueda 2009).
In terms of sustainable private sector development, the introduction of management tools is critical. Otsuka and Sonobe (2011) explain this process as follows (see Figure 5): once a new business is established, the pioneer receives sizable profits. The success of the pioneer firms will attract imitators to the industry, and in this way an industrial cluster is formed. During the early period when profits are reasonably high, entrepreneurs are not interested in introducing new ideas and knowledge. However, with more companies entering the industry, profitability of the firms starts to decrease. Without introducing new ideas and knowledge to improve operations, especially management tools, the profitability of many firms will decrease, making it impossible for them to continue business, and as a result, the number of companies 8. In a meeting, the late Prime Minister evaluated the JICA-GRIPS exercise as “filling the knowledge gap.”9. Before JICA’s initial technical assistance, the Kaizen Unit was created in the then Ministry of Trade and Industry (now the Ministry of Industry), and local kaizen leaders were devoting themselves to kaizen promotion.
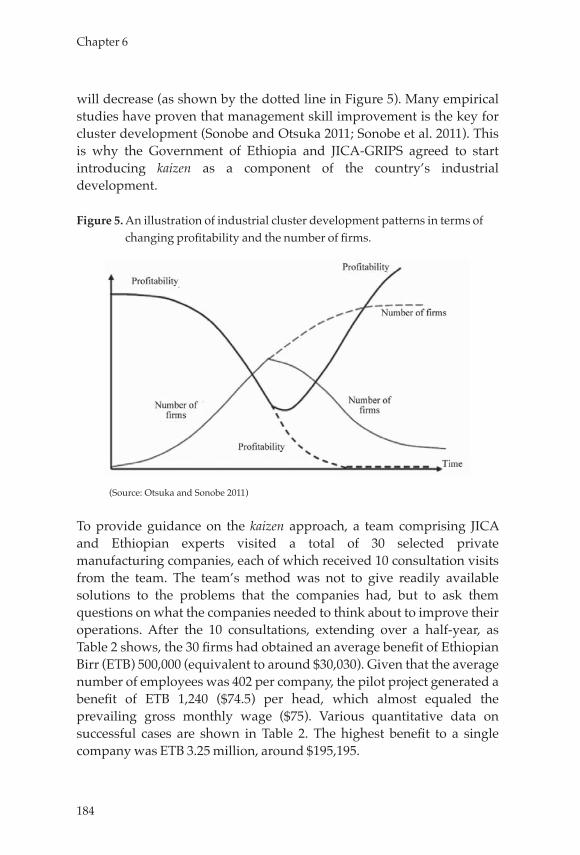
184
Chapter 6
will decrease (as shown by the dotted line in Figure 5). Many empirical studies have proven that management skill improvement is the key for cluster development (Sonobe and Otsuka 2011; Sonobe et al. 2011). This is why the Government of Ethiopia and JICA-GRIPS agreed to start introducing kaizen as a component of the country’s industrial development.
Figure 5. An illustration of industrial cluster development patterns in terms of changing profitability and the number of firms.
(Source: Otsuka and Sonobe 2011)
To provide guidance on the kaizen approach, a team comprising JICA and Ethiopian experts visited a total of 30 selected private manufacturing companies, each of which received 10 consultation visits from the team. The team’s method was not to give readily available solutions to the problems that the companies had, but to ask them questions on what the companies needed to think about to improve their operations. After the 10 consultations, extending over a half-year, as Table 2 shows, the 30 firms had obtained an average benefit of Ethiopian Birr (ETB) 500,000 (equivalent to around $30,030). Given that the average number of employees was 402 per company, the pilot project generated a benefit of ETB 1,240 ($74.5) per head, which almost equaled the prevailing gross monthly wage ($75). Various quantitative data on successful cases are shown in Table 2. The highest benefit to a single company was ETB 3.25 million, around $195,195.
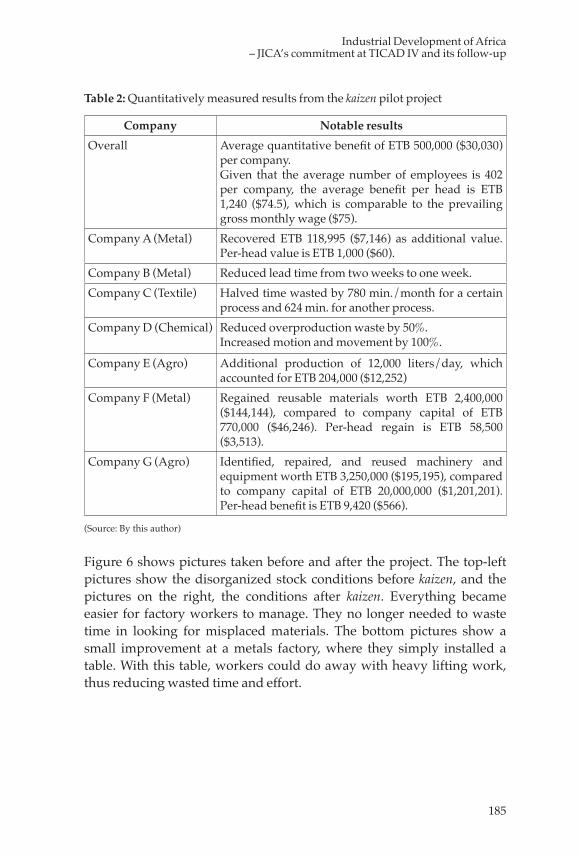
185
Industrial Development of Africa – JICA’s commitment at TICAD IV and its follow-up
Table 2: Quantitatively measured results from the kaizen pilot project
Company Notable resultsOverall Average quantitative benefit of ETB 500,000 ($30,030)
per company.Given that the average number of employees is 402 per company, the average benefit per head is ETB 1,240 ($74.5), which is comparable to the prevailing gross monthly wage ($75).
Company A (Metal) Recovered ETB 118,995 ($7,146) as additional value. Per-head value is ETB 1,000 ($60).
Company B (Metal) Reduced lead time from two weeks to one week.Company C (Textile) Halved time wasted by 780 min./month for a certain
process and 624 min. for another process.Company D (Chemical) Reduced overproduction waste by 50%.
Increased motion and movement by 100%.
Company E (Agro) Additional production of 12,000 liters/day, which accounted for ETB 204,000 ($12,252)
Company F (Metal) Regained reusable materials worth ETB 2,400,000 ($144,144), compared to company capital of ETB 770,000 ($46,246). Per-head regain is ETB 58,500 ($3,513).
Company G (Agro) Identified, repaired, and reused machinery and equipment worth ETB 3,250,000 ($195,195), compared to company capital of ETB 20,000,000 ($1,201,201). Per-head benefit is ETB 9,420 ($566).
(Source: By this author)
Figure 6 shows pictures taken before and after the project. The top-left pictures show the disorganized stock conditions before kaizen, and the pictures on the right, the conditions after kaizen. Everything became easier for factory workers to manage. They no longer needed to waste time in looking for misplaced materials. The bottom pictures show a small improvement at a metals factory, where they simply installed a table. With this table, workers could do away with heavy lifting work, thus reducing wasted time and effort.
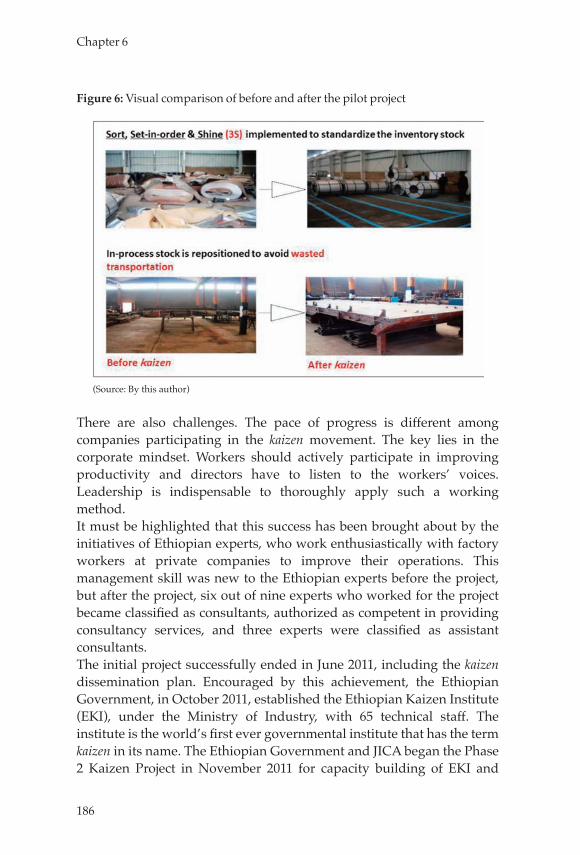
186
Chapter 6
Figure 6: Visual comparison of before and after the pilot project
(Source: By this author)
There are also challenges. The pace of progress is different among companies participating in the kaizen movement. The key lies in the corporate mindset. Workers should actively participate in improving productivity and directors have to listen to the workers’ voices. Leadership is indispensable to thoroughly apply such a working method.It must be highlighted that this success has been brought about by the initiatives of Ethiopian experts, who work enthusiastically with factory workers at private companies to improve their operations. This management skill was new to the Ethiopian experts before the project, but after the project, six out of nine experts who worked for the project became classified as consultants, authorized as competent in providing consultancy services, and three experts were classified as assistant consultants. The initial project successfully ended in June 2011, including the kaizen dissemination plan. Encouraged by this achievement, the Ethiopian Government, in October 2011, established the Ethiopian Kaizen Institute (EKI), under the Ministry of Industry, with 65 technical staff. The institute is the world’s first ever governmental institute that has the term kaizen in its name. The Ethiopian Government and JICA began the Phase 2 Kaizen Project in November 2011 for capacity building of EKI and
187
Industrial Development of Africa – JICA’s commitment at TICAD IV and its follow-up
related organizations in order to disseminate kaizen throughout the country. This project is expected to contribute to establishing a system to disseminate kaizen in Ethiopia in a sustainable manner.JICA’s cooperation to support kaizen in Ethiopia was the first case of its kind in Sub-Saharan Africa. The experience and the results of this project will form a useful basis for further projects in other African countries in the future.Though not a magic wand, kaizen could be a useful method that will contribute to private sector development in Africa; if appropriately introduced, it will bring about changes in motivation and consciousness and help the acquisition and/or creation of knowledge and skills in the process for effective production and quality management. To support the kaizen approach in other countries in Africa, it is crucial to secure an empirical base to provide a rationale for the conditions under which the approach will be functional and effective, and to identify what constraints should be overcome. From such a point of view, a greater emphasis on scientific analysis of individual projects with appropriate data is warranted.
5. Investment Promotion and Diversification through “Triangle of Hope” Approach in Zambia
Turning now to investment promotion and diversification, which are other important factors for economic transformation, we would like to present a case study from Zambia. Zambia has been struggling to put an end to its over-reliance on mineral resources and to diversify its economy, as suggested in the Sixth National Development Plan (SNDP) formulated in 2011. The promotion of FDI in various sectors is considered one of its solutions. Zambia has been addressing this issue, and JICA has been supporting the comprehensive approach towards investment promotion, through the project called “Triangle of Hope (TOH),” that contributes to economic diversification.10 The “triangle” represents a tripartite combination of (1) government will, (2) streamlining public administration, and (3) private sector participation. The idea was devised by Dato’ J. Jegathesan, who was the former
10. JICA’s assistance was first initiated as the “Project for Triangle of Hope, Strategic Action Initiative for Economic Development (TOH-SAIED)” (referred to as the Phase 1 Project) implemented from 2006 to 2009. Then the Phase 2 Project called the “Zambia Investment Promotion Project – Triangle of Hope – (ZIPP –ToH)” followed from 2009 until 2012.
188
Chapter 6
Deputy Head of the Malaysian Industrial Development Agency (MIDA) and JICA consultant for the project.11
Impacts and contributions of the project are summarized as follows (JICA 2012b; Homma 2013). First, the project successfully brought 9 investment projects to Zambia. (One of the investments is worth over $200 million. These investments include Africa’s first mobile phone factory; a large-scale university invested in by Malaysian investors; and a hospital project invested in by an Indian medical enterprise group.) Second, the project diversified investment from the mining sector towards non-traditional sectors such as education and health. Third, the project contributed to improvement of the Doing Business environment. For example, Zambia was identified as the world’s 7th top reformer in Doing Business 2011 (World Bank and IFC 2010). Fourth, the project contributed to a dramatic increase of FDI inflow (FDI inflow for 2011 became 4 times larger than that of 2006). Last but not least, the project enhanced the capacity of the Zambia Development Agency (ZDA) as an investment promotion agency and improved services for investors.12
To achieve these results, a strong government will was initiated by the late President Dr. Levy Patrick Mwanawasa. Under his direction, 12 taskforces were formulated and 12 Action Agendas were prepared for development of 12 diversified areas.13
Throughout its cooperation period, the project focused on capacity building by the Zambian Government, in particular ZDA. The capacity building streamlined public administration on investment approval by reforming the investment application process, preparing manuals/guidelines, establishing one-stop shops, monitoring processes by tracer studies and others. It also aimed at promotional activities such as
11. MIDA was renamed as the Malaysian Investment Development Authority in 2011.12. ZDA was established under Zambia’s Ministry of Commerce, Trade and Industry by merging five governmental agencies, namely Zambia Privatisation Agency, Zambia Investment Centre, Export Board of Zambia, Zambia Export Processing Zones Authority and the Small Enterprises Development Board. Although the ZDA has multiple functions, the basic function to promote inward FDI as the investment promotion agency (IPA) does not significantly differ from other countries’ IPAs which are exclusively established for investment promotion purposes.13. The twelve areas are as follows: education, medical and health, tourism, agriculture, cotton, banking and finance, air cargo hubs and inland ports, government streamlining, information and communication technology (ICT), Multi Facility Economic Zone (MFEZ), mining and micro, small and medium enterprises (MSME).
189
Industrial Development of Africa – JICA’s commitment at TICAD IV and its follow-up
dispatching targeted investment promotion missions for Malaysia, India, South Africa and Japan and preparing promotional materials such as guidebooks, websites and sector/project profiles. The missions were sometimes implemented in the form of public-private joint missions. These activities contributed to further private sector participation in investment in Zambia even in the sectors which were not traditionally considered to be associated with private investment.
The TOH approach shows the importance of integrated efforts at the policy making level and implementation level to promote investments. This is an innovative approach and the difference from prior efforts in this area. It is also suggested that the TOH approach, including investment diversification, could serve as one of the solutions for African natural resource-rich countries which need economic diversification.
6. Ways forward
As we have seen, the keys to sustainable economic growth in Africa are industrial development (job creation), doing business improvement, and investment diversification. This chapter examined strategies to tackle these challenges and African initiatives for industrial development, AIDA, taking up cases of JICA’s cooperation for Africa, which include (1) the analytical work of the Asian experience and African development, (2) industrial policy dialogue and quality and productivity improvement (kaizen) in Ethiopia, and (3) support for investment promotion and economic diversification (“Triangle of Hope” approach) in Zambia. These results of the projects designed and implemented as follow-up activities after TICAD IV imply that these approaches should be scaled up after TICAD V in accordance with AIDA. The international community is expected to support this African initiative.
The subsequent chapters will discuss the role of infrastructure. Without soft and hard infrastructure, such as Special Economic Zones (SEZ), roads, bridges, electricity and operational systems for industrial promotion, it is impossible to industrialize. Infrastructure is also very important to encourage the private sector, including Japanese companies, to invest more in Africa. In the process of the development of
190
Chapter 6
Asia, this ODA-FDI linkage worked very well in countries such as Thailand and Vietnam.
191
Industrial Development of Africa – JICA’s commitment at TICAD IV and its follow-up
References
AU. 2008. Strategy for the implementation of the Plan of Action for the Accelerated Industrial Development of Africa. Addis Ababa, Ethiopia: AU.
Benin, S., A. Kennedy, M. Lambert, L. McBride. 2010. Monitoring African agricultural development processes and performance: A comparative analysis. ReSAKSS annual trends and outlook report 2010. Washington, DC: IFPRI.
Cimoli, M., G. Dosi, J. E. Stiglitz, eds. 2009. Industrial policy and development: The political economy of capabilities accumulation. New York: Oxford University Press.
Commission on Growth and Development. 2008. The growth report: Strategies for sustained growth and inclusive development. Washington, DC: World Bank.
ECA. 2010. Joint ECA/AUC/UNIDO experts group meeting on the implementation strategy for the Accelerated Industrial Development of Africa. Report on a meeting held in Addis Ababa, Ethiopia.
EIU. 2012. Middle East and Sub-Saharan Africa economy: EIU’s latest assumptions. Economist Intelligence Unit. http://www.eiu.com.
GDI. 2009. Industrial Policy in Developing Countries. International workshop held in Bonn, Germany, November. http://www.die-gdi.de/CMS-Homepage/openwebcms3.nsf/(ynDK_contentByKey)/MPHG-7T3AJY/$FILE/Programm%20Workshop%20Industrial%20Policy_Final.pdf.
GRIPS Development Forum. 2011. Japan’s approach to African development during TICAD IV: The case of Ethiopia. GRIPS Development Forum Policy Minutes No. 24. http://www.grips.ac.jp/forum/pdf12/merged_PM24.pdf.
GRIPS Development Forum, and JICA. 2011a. Intellectual partnership for Africa: Industrial policy dialogue between Japan and Ethiopia. Tokyo: GRIPS.
GRIPS Development Forum, and JICA. 2011b. Kaizen national movement: A study of quality and productivity improvement in Asia and Africa. Tokyo: GRIPS.
Hausmann, R., D. Rodrik, and A. Velasco. 2005. Growth diagnosis. Boston: The John Kennedy School of Government, Harvard University.
Homma, T. 2013. Investment Promotion: Practical implications from JICA’s experience in Zambia and others. Paper presented at the
192
Chapter 6
third High Level Forum for Phase II of Policy Dialogue of Industrial Development, Ethiopia, January 16.
International Labour Office. 2011. Global employment trends 2011. Geneva: ILO.
International Monetary Fund. 2012. World economic outlook database, October 2012 edition. http://www.imf.org/external/pubs/ft/weo/2012/02/weodata/index.aspx.
Jegathesan, D. J., and M. Ono. 2008. Strategic action initiatives for economic development: Trade and investment promotion in Zambia. In Diversity and complementarity in development aid: East Asian lessons for African growth, ed. GRIPS Development Forum. Tokyo: GRIPS Development Forum.
JICA. 2007. Making globalization work for developing countries: Report on a special seminar by Prof. J. Stiglitz. Seminar report, JICA. http://jica-ri. jica.go.jp/IFIC_and_JBICI-Studies/jica-ri/publication/archives/jica/field/pdf/200707_aid_01.pdf.
JICA. 2008a. Report of the stocktaking work on economic development in Africa and the Asian growth experience. Tokyo: JICA. http://jica-ri.jica.go.jp/IFIC_and_JBICI-Studies/english/publications/reports/study/topical/aid/aid_01.pdf
JICA. 2008b. Nannankyoryoku wo tsujita toshi sokushin kankyo seibi purojekuto shuryoji hyoka hokokusho [Report on the terminal evaluation survey on the triangle of hope, Strategic action initiative for economic development]. [In Japanese.] Project report, JICA Zambia Office, Lusaka, Zambia.
JICA. 2011a. Study on industrial policy dialogue in the Federal Democratic Republic of Ethiopia: Final report. Project report, JICA.
JICA. 2011b. Handbook of national movements for quality and productivity improvement (kaizen). Report prepared for JICA.
JICA. 2011c. Chukan rebyu chosa hokokusho: Zanbia toshi sokushin purojekuto: Toraianguru obu hopu [Report on the mid-term review survey on the Zambia Investment Promotion Project: Triangle of hope]. [In Japanese.] Project report, JICA, Tokyo.
JICA. 2012a Review: For the next on Human Development Report, JICA-RI held a joint consultation with UNDP. JICA Research Institute Newsletter 34, April 2012: 4–5. http://jica-ri.jica.go.jp/mailmagazine/assets/NL34_April_EN.pdf.
JICA. 2012b. Kikoku hokokukai shiryo: Zanbia toshi sokushin
193
Industrial Development of Africa – JICA’s commitment at TICAD IV and its follow-up
purojekuto shuryoji hyoka chosa [Report on the terminal evaluation survey on the Zambia investment promotion project, Triangle of Hope]. [In Japanese.] Project report, JICA, Tokyo.
Kuwajima, K. 2011. JICA’s assistance for industrial development in Ethiopia. In GRIPS 2011.
Lin, J. 2012. Industrial policy and African development. Paper presented at the IPD (Initiative Policy Dialogue)-JICA meeting, November 2011.
Myrdal, K. Gunnar. 1968. Asian drama: An inquiry into the poverty of nations. New York: Pantheon.
Noman, A., K. Botchwey, H. Stein, and J. Stiglitz, eds. 2012. Good growth and governance in Africa: Rethinking development strategies. Oxford: Oxford University Press.
Ohno, I., and K. Ohno. 2012. Dynamic capacity development: What Africa can learn from industrial formulation in East Asia. In Norman et al. 2012.
Ohno, I. 2011. Sharing East Asian experiences with Africa. In GRIPS 2011.Ohno, K. 2011. Industrial policy dialogue in Ethiopia. In GRIPS 2011. Ohno, K. 2012. Learning to Industrialize. Abingdon, Oxon: Routledge Otsuka, K., and T. Sonobe. 2011. A cluster-based industrial development
policy for low-income countries. Policy Research Working Paper 5703, World Bank.
Page, J. 2013. Industrial policy for Africa: Why, what and how? Keynote presentation at JICA Research Institute Seminar on Industrial Policy, JICA Research Institute, Tokyo, 22 March.
Page, J. 2012. Can Africa industrialize? Journal of African Economies 21, no. suppl. 2: ii86–ii124.
Rodrik, D. 2011. The return of industrial policy. Project Syndicate, April 12. http:// www.project-syndicate.org/commentary/the-return-of-industrial-policy.
Rodrik, D. 2007. Normalizing industrial policy. Cambridge, MA: Harvard University.
Shimada G. 2009. Industrial policy in developing countries. Presentation at the International Workshop on Industrial Policy in Developing Countries, GDI (German Development Institute), Bonn, November 18–19.
Shimada, G. 2010. Strategies for industrial SME development. Presentation at the Joint ECA/AUC/UNIDO Experts Group Meeting on the Implementation Strategy for the Accelerated
194
Chapter 6
Industrial Development of Africa, Addis Ababa, Ethiopia, November 22–26.
Shimada, G. 2011. Achievements in the Kaizen Project. In GRIPS 2011.Shimada, G. 2013. The Economic Implications of Comprehensive
Approach to Learning on Industrialization (Policy and Managerial Capability Learning): A Case of Ethiopia. Discussion paper for the IPD (Institute of Policy Dialogue), Columbia University, and JICA Research Institute, Tokyo.
Sonobe, T., et al. 2011. Kaizen for management skills improvement in small and medium enterprises: An impact evaluation study. Japan PHRD Trust Fund. No. TF096317, World Bank.
Sonobe, T., and K. Otsuka. 2011. Cluster-based industrial development: A comparative study of Asia and Africa. Basingstoke: Palgrave Macmillan.
The Economist. 2010. Picking Winners, Saving Losers. August 5.Ueda, T. 2009. Productivity and quality improvement: JICA’s assistance
in kaizen. In Introducing kaizen in Africa, ed. GRIPS Development Forum. Tokyo: GRIPS.
Watanabe, M., and A. Hanatani. 2012. Issues in Africa’s industrial policy process. In Norman et al. 2012.
World Bank, and International Finance Corporation. 2011. Doing business 2012 http://www.doingbusiness.org/reports/global-reports/doing-business-2012.
World Bank, and International Finance Corporation. 2012. Doing business 2013. http://www.doingbusiness.org/reports/global-reports/doing-business-2013.
World Bank. 1993. The East Asian miracle: Economic growth and public policy. Washington, DC: World Bank.
UNCTAD. 2011. World investment report 2011. http://unctad.org/en/Pages/DIAE/World%20Investment%20Report/WIR2011_WebFlyer.aspx.
UNCTAD. 2012. World investment report 2012. http://unctad.org/en/pages/ PublicationArchive.aspx?publicatio nid=753.
195
Chapter 7: Policy Challenges for Infrastructure Development in Africa - The way forward for Japan’s Official Development Assistance (ODA)
Yasuo Fujita, Ippei Tsuruga and Asami Takeda
This chapter examines how Japan’s ODA can more effectively assist Africa’s infrastructure development in consideration of a comprehensive study by the donor consortium. It recommends that Japan should consider, as short-term measures, sectoral reallocation of its assistance, financial assistance for maintenance, and management reform of public utilities, while supporting various reforms from a long-term perspective.
1. Introduction
Infrastructure1 development in Africa is generally lagging behind other parts of the world, though there are variations between countries and sectors (see Section 2), hampering economic growth2 and poverty reduction (for example, Calderón and Servén 2010). One of the serious problems was that the real picture of infrastructure in African countries could not be seen due to lack of data, preventing policy interventions and investment.The Infrastructure Consortium for Africa (ICA)3 conducted Africa infrastructure country diagnostic studies and published a flagship report titled Africa’s Infrastructure: A Time for Transformation in late 2009
1. In this chapter, infrastructure includes: power; transport (roads, seaports, airports, and railways; water supply and sanitation; information and communication technology (ICT); and irrigation.2. As pointed out in Chapter 6, infrastructure development would promote economic growth through industrial development while removing the cost penalties of economic activities.3. ICA was established in 2005, following the G8 Gleneagles summit at which assistance for Africa was one of the main agenda topics. For details of ICA, see http://www.icafrica.org/en/
196
Chapter 7
(hereinafter referred to as AFD-WB 2009). The values of this report include that current status and problems are analyzed through quantitative data; that infrastructure needs and funding gaps are estimated by sector and country type; and that policy interventions are prioritized through cost-benefit analyses. At the same time, however, it reveals that Africa’s infrastructure challenges are overwhelming and complex, and require sustained and concerted efforts by African countries, regional organizations, and development partners.4
This chapter aims to discuss what Japan’s ODA should place its emphasis among recommendations of AFD-WB 2009 in donor community’s concerted efforts, in order to effectively contribute to address Africa’s infrastructure challenges.5 This exercise is useful because infrastructure has always been one of the priority areas for Japan’s assistance for Africa to boost the region’s economic growth as in the TICAD IV Yokohama Action Plan 2008, and Japan has provided financial resources and technical assistance.
This chapter is organized as follows: Section 2 summarizes the current status of infrastructure development through available statistics; Section 3 reviews Japan’s recent ODA for infrastructure in Africa; Section 4 discusses the future direction of Japan’s ODA; and Section 5 is the conclusion.
2. Overview of Infrastructure Development in Africa2.1 Current infrastructure in AfricaTable 1 shows the current status of infrastructure development in Africa based on available statistics such as World Development Indicators (WDI) of the World Bank, and the Global Competitive Index (GCI) of the World Economic Forum (WEF). The countries are categorized into five groups6 – North Africa, middle income countries, oil exporting
4. Development partners here include non-traditional funders such as China, Korea. Figure 2 shows their great contribution to infrastructure development.5. Therefore, this chapter focuses only on how Japan’s ODA can better meet Africa’s infrastructure development needs; and does not directly consider the interests of Japanese industries in infrastructure business in Africa.6. This chapter adopts the categorization of countries of IMF 2011, 80, which is a little different from AFD-WB 2009, 51. Fragile countries are low-income countries that face particularly severe development challenges, such as weak governance, limited administrative capacity, violence, or the legacy of conflict (AFD-WB 2009, 51).
197
Policy Challenges for Infrastructure Development in Africa - The way forward for Japan’s Official Development Assistance (ODA)
countries, low-income nonfragile countries, and low-income fragile countries7 - because they are different in infrastructure development and challenges. This section basically focuses on sub-Saharan African (SSA) countries because the quality and quantity of infrastructure in North Africa and small, middle-income island countries, including Mauritius and Seychelles, are relatively higher in almost all the sectors. As shown in Figures A1 to A6, there is generally a positive correlation between infrastructure development and GDP per capita, but, the degree of correlations is different across infrastructure sectors.8 This suggests that the countries can improve some infrastructure regardless their income levels. The current situation of Africa’s infrastructure by sector is as follows:
Power: Power is by far Africa’s largest infrastructure challenge, with 30 countries facing regular power shortages (AFD-WB 2009, 5) and more than half of the population having no access to electricity except in North Africa, Mauritius and South Africa. SSA countries have low rates of electrification – the average rate for SSA countries is only 32%, compared to the average of low and middle income countries (LMIC) throughout the world, which is 74%. As for electricity consumption per capita, the average of SSA countries is only 517kWh, which is substantially lower than the world LMIC average (1,527kWh), with the exception of South Africa (4,532kWh) and Libya (4,170kWh). Furthermore, SSA countries’ rate of electric power transmission and distribution loss9 (11.2%) is almost the same as the world LMIC average (11.1%). The loss is higher in the whole of the African region particularly in middle-income (35%) and oil-exporting countries (24%), indicating operating inefficiency of power utilities.
Transport: The average roads pavement ratio in SSA countries is only 19% compared with the world LMIC average of 45%. The road pavement ratio in oil-exporting countries is very low. In addition, regarding road density (total road length per land area), the figures in many African countries are lower than the world LIMC average (21.5 km/100km2). It is urgent that African governments should address the poor condition 7. Sub-Saharan African (SSA) countries are subdivided to the latter four groups.8. The road pavement ratio and the electricity power consumption per capita are more correlated with per capita income. The electricity power consumption and distribution losses, improved access to water sources, agriculture irrigation land, and mobile subscription per 100 are less correlated with per capita income. (Figures A1 to A6)9. Measured in percentage of electricity power output (World Bank.2012a)
198
Chapter 7
and low density of their road networks. In addition, to keep the road network in good condition, maintenance is another challenging task in Africa since it requires huge investment. Infrastructure development of other transport modes such as airports, seaports and railways in Africa face same challenges and ineffective linkage between different transport modes, declining air connectivity, poorly equipped ports and aging rail networks are key problems facing Africa’s transport system (AFD-WB 2009, 233).
Water supply and sanitation (WSS): Only 61% of SSA countries’ population has access to safe drinking water, which is below the world LMIC average of 86% and MDG’s target rate of 75% by 2015. The rates are below 50% in Somalia, Ethiopia, the Democratic Republic of the Congo, Madagascar, Mozambique and Niger. Urban and rural disparities are also prominent – more than half of the rural population has no access to safe water in SSA countries. Access to adequate sanitation is even worse. Only 30% of the population in SSA countries lives in households with access to adequate sanitation and the rate is lower in rural areas. There are 12 low-income countries where more than 90% of the population has no access to adequate sanitation in rural areas. Irrigation: While more than two-thirds of Africans rely on agriculture for a living, the average amount of arable land developed for irrigation is only 6% for a selected 28 African countries, compared with 39% in Asia and nearly 30% in Latin American countries (Bluffstone and Kohlin 2011, 6). Low levels of irrigation mean that few SSA countries can sustain yield increases, even with abundant rainfall (UNDP 2012). The amount in Egypt is exceptionally high (99.7%) since Egypt’s agriculture depends entirely on irrigation. Further improvement is an urgent requirement for sustainable food production in Africa.
Information and communication technology (ICT): Approximately three-quarters of the world’s inhabitants have access to mobile phones (World Bank 2012b, 23). The number of mobile subscriptions in use worldwide has grown from 1 billion in 2000 to over 6 billion in 2012, of which nearly 5 billion are in developing countries (ibid.). This trend is also true for some African countries. The number of mobile subscriptions per 100 people has increased dramatically since 2000; in 2010, North Africa (111 subscriptions) and some middle-income countries exceeded the world average (78 subscriptions). As for the penetration of telephone lines and the Internet, Africa still has low rates
199
Policy Challenges for Infrastructure Development in Africa - The way forward for Japan’s Official Development Assistance (ODA)
especially in oil-exporting countries and low-income countries, suggesting the digital divide is a critical issue. It is still essential for African governments to develop the telecommunications sector.
2.2 Infrastructure by country groupsThe infrastructure challenge differs among country type (Table 1). North Africa showed the highest level of infrastructure in quality and quantity in all the sectors. However, its electricity consumption per capita is still insufficient (average 1,751kWh per capita) compared with the world average (2,807kWh), though it exceeds the world LMIC average (1,527 kWh). As for the middle income countries in Africa, further improvement in both quality and quantity in the energy sector is necessary; and particularly, the rate of electric power transmission and loss is the highest among all the country groups (35%), due to the high figure for Botswana (79%).
Recent economic growth in Africa is attributed to price hike in energy and mineral resources10 and oil exporting countries play a great role in economic growth of Africa. However, infrastructure development in oil exporting countries is stagnant, despite their higher GDP per capita and abundant natural resources revenue.11 In particular, the level of infrastructure stock and quality in the transport sector are lower than low income countries. In addition, oil-exporting countries significantly lag in terms of quantity and quality in electricity services. Therefore, considering how to allocate additional fiscal resources from natural resources to infrastructure effectively (particularly in transport and energy sector) is urgent. The low income African countries are facing a severe situation in all the sectors of infrastructure. The available data shows that there is no significant difference in infrastructure between fragile and non-fragile countries. In particular, power is the largest infrastructure challenge, especially in non-fragile countries (average rate of access to electricity is only 23% and electricity consumption per capita is the lowest, 240kWh), and both quantity expansion and quality improvement are urgent requirements.
10. Refer to Introduction of this report.11. This is because they used most of their revenue from oil exports for debt repayment (AFD-WB 2009, 76).
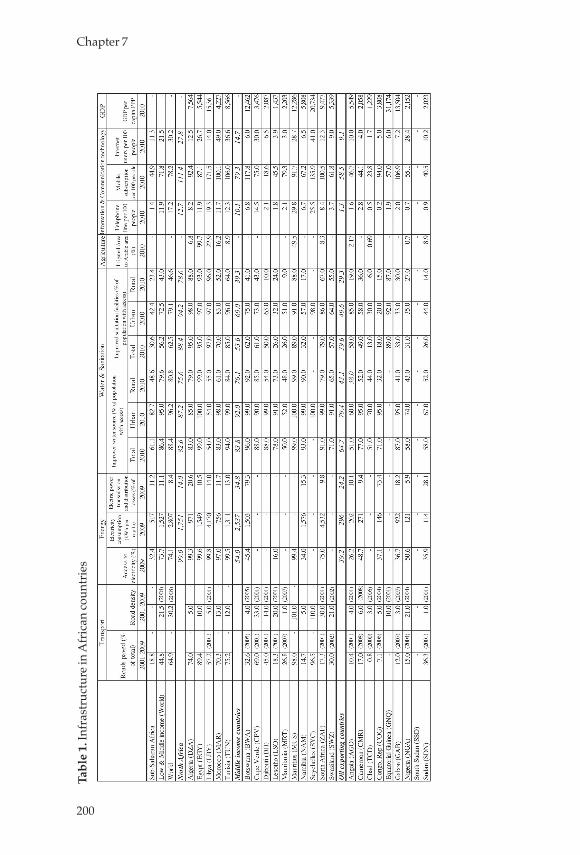
200
Chapter 7
Tabl
e 1.
Infr
astr
uctu
re in
Afr
ican
coun
trie
s
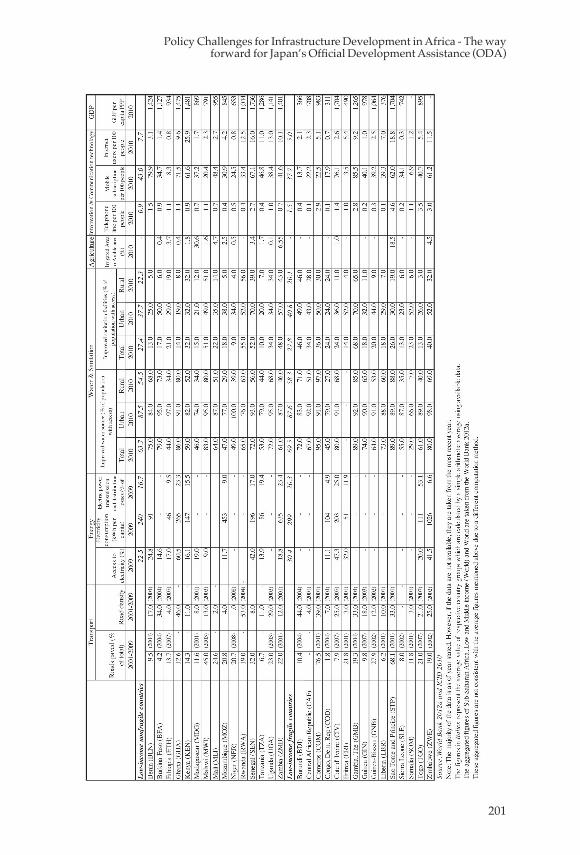
201
Policy Challenges for Infrastructure Development in Africa - The way forward for Japan’s Official Development Assistance (ODA)
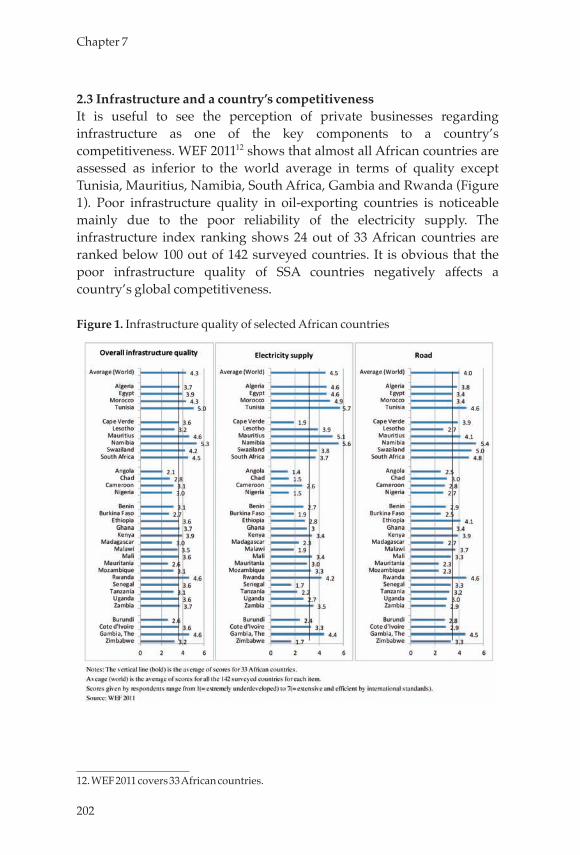
202
Chapter 7
2.3 Infrastructure and a country’s competitivenessIt is useful to see the perception of private businesses regarding infrastructure as one of the key components to a country’s competitiveness. WEF 201112 shows that almost all African countries are assessed as inferior to the world average in terms of quality except Tunisia, Mauritius, Namibia, South Africa, Gambia and Rwanda (Figure 1). Poor infrastructure quality in oil-exporting countries is noticeable mainly due to the poor reliability of the electricity supply. The infrastructure index ranking shows 24 out of 33 African countries are ranked below 100 out of 142 surveyed countries. It is obvious that the poor infrastructure quality of SSA countries negatively affects a country’s global competitiveness.
Figure 1. Infrastructure quality of selected African countries
12. WEF 2011 covers 33 African countries.
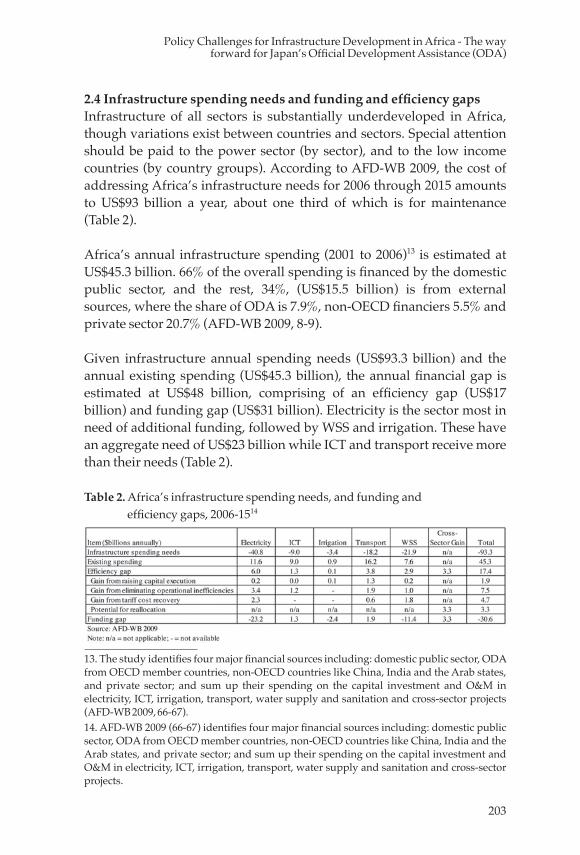
203
Policy Challenges for Infrastructure Development in Africa - The way forward for Japan’s Official Development Assistance (ODA)
2.4 Infrastructure spending needs and funding and efficiency gapsInfrastructure of all sectors is substantially underdeveloped in Africa, though variations exist between countries and sectors. Special attention should be paid to the power sector (by sector), and to the low income countries (by country groups). According to AFD-WB 2009, the cost of addressing Africa’s infrastructure needs for 2006 through 2015 amounts to US$93 billion a year, about one third of which is for maintenance (Table 2).
Africa’s annual infrastructure spending (2001 to 2006)13 is estimated at US$45.3 billion. 66% of the overall spending is financed by the domestic public sector, and the rest, 34%, (US$15.5 billion) is from external sources, where the share of ODA is 7.9%, non-OECD financiers 5.5% and private sector 20.7% (AFD-WB 2009, 8-9).
Given infrastructure annual spending needs (US$93.3 billion) and the annual existing spending (US$45.3 billion), the annual financial gap is estimated at US$48 billion, comprising of an efficiency gap (US$17 billion) and funding gap (US$31 billion). Electricity is the sector most in need of additional funding, followed by WSS and irrigation. These have an aggregate need of US$23 billion while ICT and transport receive more than their needs (Table 2).
Table 2. Africa’s infrastructure spending needs, and funding and efficiency gaps, 2006-1514
13. The study identifies four major financial sources including: domestic public sector, ODA from OECD member countries, non-OECD countries like China, India and the Arab states, and private sector; and sum up their spending on the capital investment and O&M in electricity, ICT, irrigation, transport, water supply and sanitation and cross-sector projects (AFD-WB 2009, 66-67).14. AFD-WB 2009 (66-67) identifies four major financial sources including: domestic public sector, ODA from OECD member countries, non-OECD countries like China, India and the Arab states, and private sector; and sum up their spending on the capital investment and O&M in electricity, ICT, irrigation, transport, water supply and sanitation and cross-sector projects.
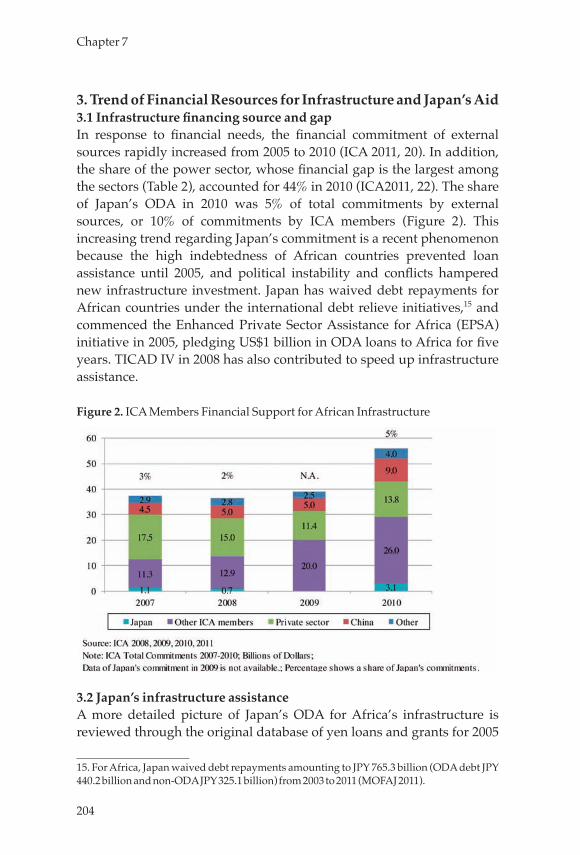
204
Chapter 7
3. Trend of Financial Resources for Infrastructure and Japan’s Aid3.1 Infrastructure financing source and gapIn response to financial needs, the financial commitment of external sources rapidly increased from 2005 to 2010 (ICA 2011, 20). In addition, the share of the power sector, whose financial gap is the largest among the sectors (Table 2), accounted for 44% in 2010 (ICA2011, 22). The share of Japan’s ODA in 2010 was 5% of total commitments by external sources, or 10% of commitments by ICA members (Figure 2). This increasing trend regarding Japan’s commitment is a recent phenomenon because the high indebtedness of African countries prevented loan assistance until 2005, and political instability and conflicts hampered new infrastructure investment. Japan has waived debt repayments for African countries under the international debt relieve initiatives,15 and commenced the Enhanced Private Sector Assistance for Africa (EPSA) initiative in 2005, pledging US$1 billion in ODA loans to Africa for five years. TICAD IV in 2008 has also contributed to speed up infrastructure assistance.
Figure 2. ICA Members Financial Support for African Infrastructure
3.2 Japan’s infrastructure assistanceA more detailed picture of Japan’s ODA for Africa’s infrastructure is reviewed through the original database of yen loans and grants for 2005
15. For Africa, Japan waived debt repayments amounting to JPY 765.3 billion (ODA debt JPY 440.2 billion and non-ODA JPY 325.1 billion) from 2003 to 2011 (MOFAJ 2011).
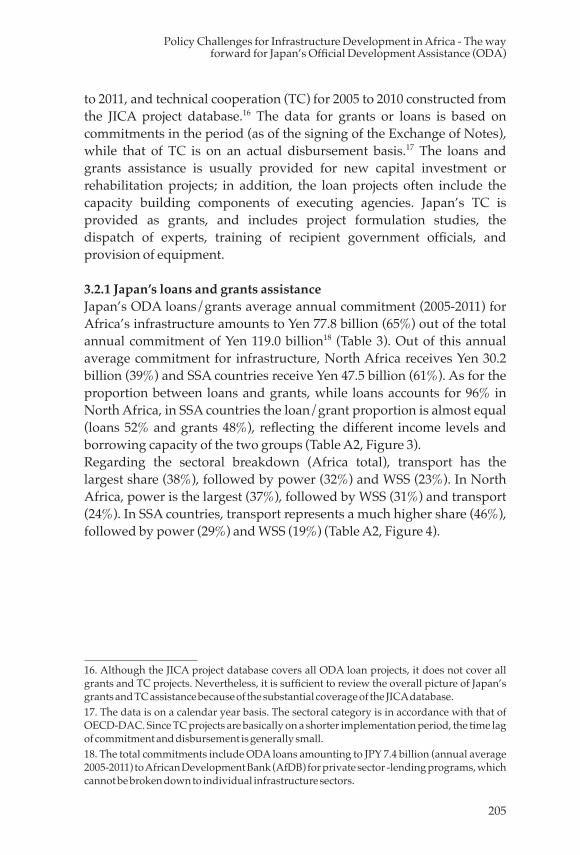
205
Policy Challenges for Infrastructure Development in Africa - The way forward for Japan’s Official Development Assistance (ODA)
to 2011, and technical cooperation (TC) for 2005 to 2010 constructed from the JICA project database.16 The data for grants or loans is based on commitments in the period (as of the signing of the Exchange of Notes), while that of TC is on an actual disbursement basis.17 The loans and grants assistance is usually provided for new capital investment or rehabilitation projects; in addition, the loan projects often include the capacity building components of executing agencies. Japan’s TC is provided as grants, and includes project formulation studies, the dispatch of experts, training of recipient government officials, and provision of equipment.
3.2.1 Japan’s loans and grants assistanceJapan’s ODA loans/grants average annual commitment (2005-2011) for Africa’s infrastructure amounts to Yen 77.8 billion (65%) out of the total annual commitment of Yen 119.0 billion18 (Table 3). Out of this annual average commitment for infrastructure, North Africa receives Yen 30.2 billion (39%) and SSA countries receive Yen 47.5 billion (61%). As for the proportion between loans and grants, while loans accounts for 96% in North Africa, in SSA countries the loan/grant proportion is almost equal (loans 52% and grants 48%), reflecting the different income levels and borrowing capacity of the two groups (Table A2, Figure 3).Regarding the sectoral breakdown (Africa total), transport has the largest share (38%), followed by power (32%) and WSS (23%). In North Africa, power is the largest (37%), followed by WSS (31%) and transport (24%). In SSA countries, transport represents a much higher share (46%), followed by power (29%) and WSS (19%) (Table A2, Figure 4).
16. Although the JICA project database covers all ODA loan projects, it does not cover all grants and TC projects. Nevertheless, it is sufficient to review the overall picture of Japan’s grants and TC assistance because of the substantial coverage of the JICA database.17. The data is on a calendar year basis. The sectoral category is in accordance with that of OECD-DAC. Since TC projects are basically on a shorter implementation period, the time lag of commitment and disbursement is generally small.18. The total commitments include ODA loans amounting to JPY 7.4 billion (annual average 2005-2011) to African Development Bank (AfDB) for private sector -lending programs, which cannot be broken down to individual infrastructure sectors.
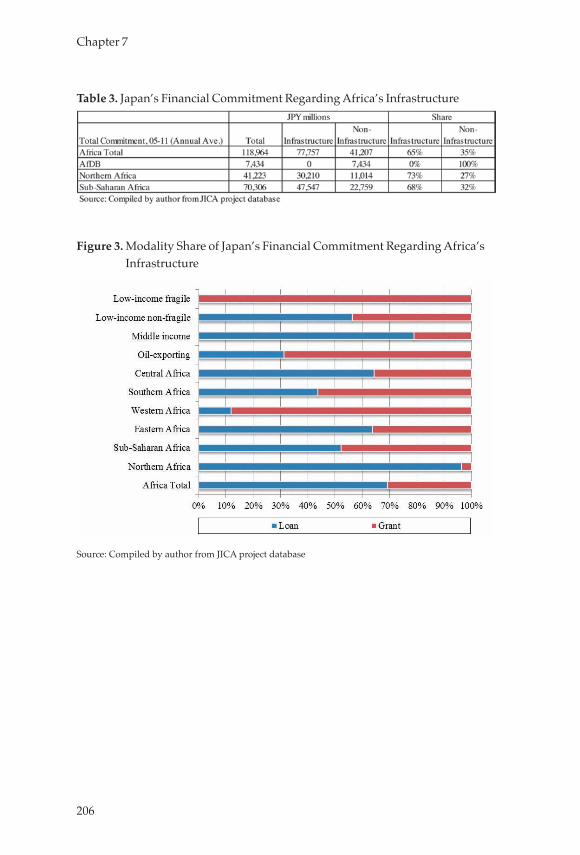
206
Chapter 7
Table 3. Japan’s Financial Commitment Regarding Africa’s Infrastructure
Figure 3. Modality Share of Japan’s Financial Commitment Regarding Africa’s Infrastructure
Source: Compiled by author from JICA project database
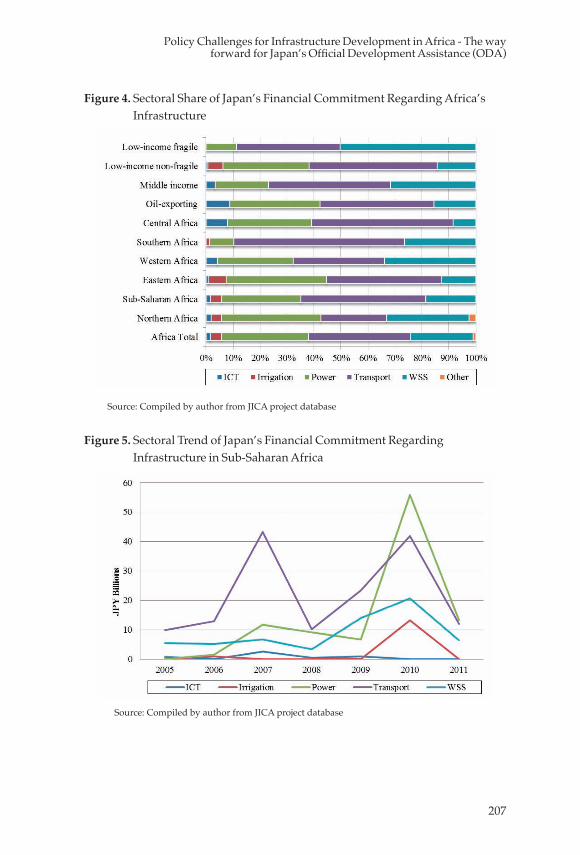
207
Policy Challenges for Infrastructure Development in Africa - The way forward for Japan’s Official Development Assistance (ODA)
Figure 4. Sectoral Share of Japan’s Financial Commitment Regarding Africa’s Infrastructure
Source: Compiled by author from JICA project database
Figure 5. Sectoral Trend of Japan’s Financial Commitment Regarding Infrastructure in Sub-Saharan Africa
Source: Compiled by author from JICA project database
208
Chapter 7
We will review Japan’s ODA loans/grants regarding infrastructure in SSA countries in more detail. While the annual commitments of loans/grants noticeably fluctuate, the commitment to the power sector in 2010 was quite high (Figure 5). This increase was because several project loans, which had been under preparation, were provided in this single year. Within the transport sector, road and bridge projects account for 75%, while seaports receive 25%. As for the proportion of loans and grants, it is almost equal in transport; 77% of the commitment in power is by loans; and WSS is mostly funded by grants (89%). This difference of loan/grant proportion by sector is mainly due to the different economic and financial returns of these sectors because both African countries and Japan prefer using grants to lower return projects.
Within SSA countries, the eastern Africa region (11 countries) accounts for 61%, followed by the southern African region comprising 15 countries (22%). This is because the western and central African countries include more fragile states and oil producing countries. As to the country’s income categories, the low-income non-fragile countries (15 countries) received 77%, and the shares of the other three categories are between 7% and 8%. The low income non-fragile states are the main target of infrastructure assistance because of their income levels and absorption capacity. Low-income fragile states received a small share of infrastructure assistance (7%), which is for transport and WSS funded only by grants, because of serious constraints owing to peace and order issues, debt sustainability, and aid absorption capacity.
3.2.2 Japan’s technical cooperation (TC)The annual average disbursement of TC (2005-2010) amounts to Yen 30.4 billion, of which 20% is for infrastructure, and 80% is for non-infrastructure (Table 4). This is in sharp contrast to the loan/grant assistance which is used for upfront infrastructure investment. The sectoral breakdown of TC for infrastructure shows another contrast with the loan/grant assistance. WSS has the largest share (36%), followed by transport (27%) and irrigation (18%); and far less input into power (9%). Geographically, 84% of TC goes to SSA countries, so, the sectoral breakdown of SSA countries is almost the same as that of the African total as mentioned above. Within SSA countries, the share for western Africa is higher in TC (21%) than in loans/grants (14%) (Table A3). Distribution among the income groups is dominated by the low income non-fragile states (75%), and the other groups’ shares are between 6 and
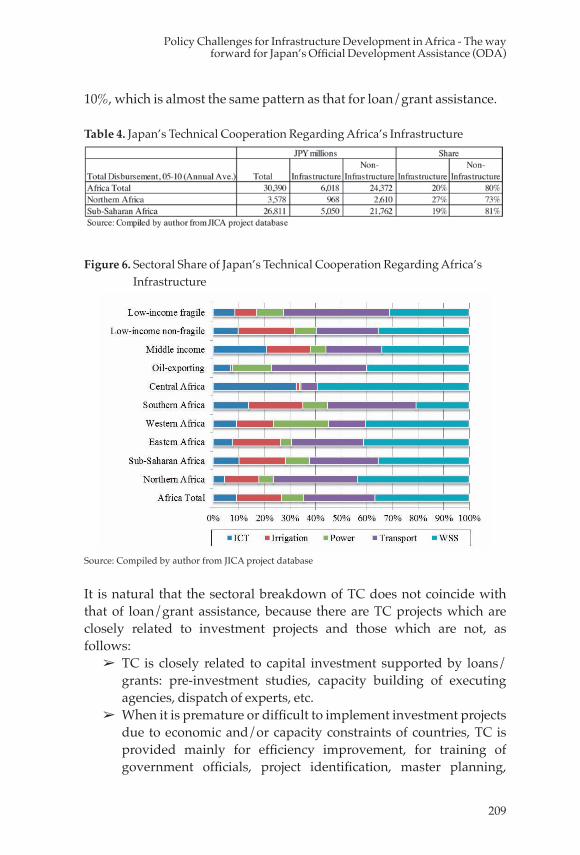
209
Policy Challenges for Infrastructure Development in Africa - The way forward for Japan’s Official Development Assistance (ODA)
10%, which is almost the same pattern as that for loan/grant assistance.
Table 4. Japan’s Technical Cooperation Regarding Africa’s Infrastructure
Figure 6. Sectoral Share of Japan’s Technical Cooperation Regarding Africa’s Infrastructure
Source: Compiled by author from JICA project database
It is natural that the sectoral breakdown of TC does not coincide with that of loan/grant assistance, because there are TC projects which are closely related to investment projects and those which are not, as follows:
➢ TC is closely related to capital investment supported by loans/grants: pre-investment studies, capacity building of executing agencies, dispatch of experts, etc.
➢ When it is premature or difficult to implement investment projects due to economic and/or capacity constraints of countries, TC is provided mainly for efficiency improvement, for training of government officials, project identification, master planning,
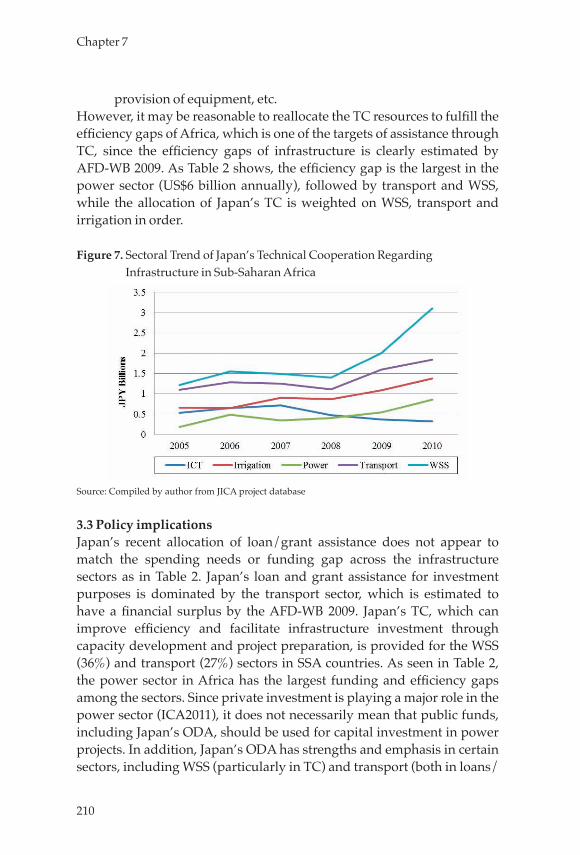
210
Chapter 7
provision of equipment, etc.However, it may be reasonable to reallocate the TC resources to fulfill the efficiency gaps of Africa, which is one of the targets of assistance through TC, since the efficiency gaps of infrastructure is clearly estimated by AFD-WB 2009. As Table 2 shows, the efficiency gap is the largest in the power sector (US$6 billion annually), followed by transport and WSS, while the allocation of Japan’s TC is weighted on WSS, transport and irrigation in order.
Figure 7. Sectoral Trend of Japan’s Technical Cooperation Regarding Infrastructure in Sub-Saharan Africa
Source: Compiled by author from JICA project database
3.3 Policy implicationsJapan’s recent allocation of loan/grant assistance does not appear to match the spending needs or funding gap across the infrastructure sectors as in Table 2. Japan’s loan and grant assistance for investment purposes is dominated by the transport sector, which is estimated to have a financial surplus by the AFD-WB 2009. Japan’s TC, which can improve efficiency and facilitate infrastructure investment through capacity development and project preparation, is provided for the WSS (36%) and transport (27%) sectors in SSA countries. As seen in Table 2, the power sector in Africa has the largest funding and efficiency gaps among the sectors. Since private investment is playing a major role in the power sector (ICA2011), it does not necessarily mean that public funds, including Japan’s ODA, should be used for capital investment in power projects. In addition, Japan’s ODA has strengths and emphasis in certain sectors, including WSS (particularly in TC) and transport (both in loans/
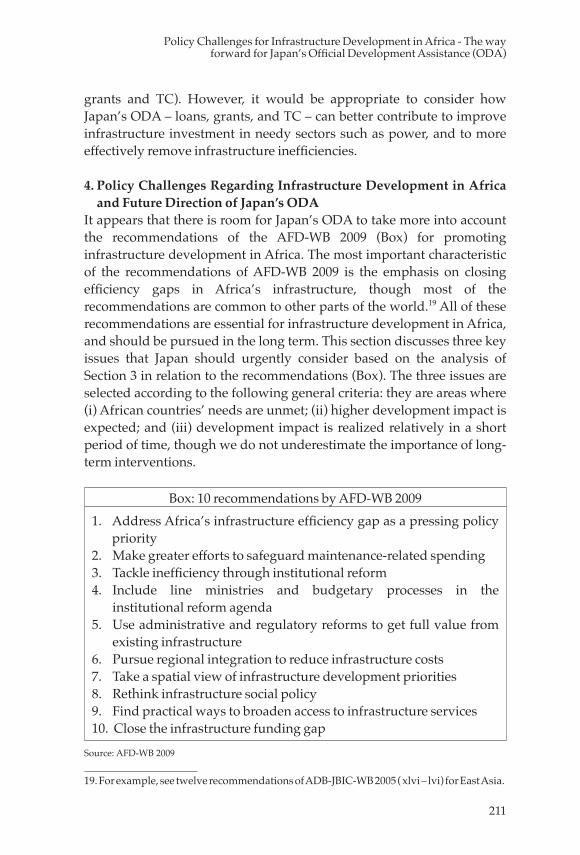
211
Policy Challenges for Infrastructure Development in Africa - The way forward for Japan’s Official Development Assistance (ODA)
grants and TC). However, it would be appropriate to consider how Japan’s ODA – loans, grants, and TC – can better contribute to improve infrastructure investment in needy sectors such as power, and to more effectively remove infrastructure inefficiencies.
4. Policy Challenges Regarding Infrastructure Development in Africa and Future Direction of Japan’s ODA
It appears that there is room for Japan’s ODA to take more into account the recommendations of the AFD-WB 2009 (Box) for promoting infrastructure development in Africa. The most important characteristic of the recommendations of AFD-WB 2009 is the emphasis on closing efficiency gaps in Africa’s infrastructure, though most of the recommendations are common to other parts of the world.19 All of these recommendations are essential for infrastructure development in Africa, and should be pursued in the long term. This section discusses three key issues that Japan should urgently consider based on the analysis of Section 3 in relation to the recommendations (Box). The three issues are selected according to the following general criteria: they are areas where (i) African countries’ needs are unmet; (ii) higher development impact is expected; and (iii) development impact is realized relatively in a short period of time, though we do not underestimate the importance of long-term interventions.
Box: 10 recommendations by AFD-WB 20091. Address Africa’s infrastructure efficiency gap as a pressing policy
priority2. Make greater efforts to safeguard maintenance-related spending3. Tackle inefficiency through institutional reform4. Include line ministries and budgetary processes in the
institutional reform agenda5. Use administrative and regulatory reforms to get full value from
existing infrastructure6. Pursue regional integration to reduce infrastructure costs7. Take a spatial view of infrastructure development priorities8. Rethink infrastructure social policy9. Find practical ways to broaden access to infrastructure services10. Close the infrastructure funding gap
Source: AFD-WB 2009
19. For example, see twelve recommendations of ADB-JBIC-WB 2005 ( xlvi – lvi) for East Asia.
212
Chapter 7
4.1 Rethinking of sectoral allocation of Japan’s ODAThe transport sector, especially roads, has received the largest share of Japan’s ODA. While Japan’s country assistance strategies for African countries give emphasis on infrastructure development, there is no clear policy on the allocation of funds between the sectors. Since Africa’s infrastructure needs and funding gaps are estimated, it is time to rethink the allocation of Japan’s ODA so that needy sectors can receive more support for more investment and efficiency improvement. In fact, JICA has recently been increasing loan/grant assistance to the power sector, and project preparation in Africa’s power sector has been strengthened as shown in the increase of TC in the power sector (Figures 5 and 7).Nevertheless, we do not mean that Japan’s grant/loan assistance should immediately and directly go to financing power sector investment projects. It should be noted that the power sector (particularly power generation) is one of the few sectors which can expect capital investment by the private sector even in low-income countries (Leigland 2010). Japan’s ODA to the power sector needs to be more carefully examined by sub-sector, as follows:
➢ Power generation: The possibility of private sector capital investment should always be explored in power generation projects. For this purpose, JICA should assist with the preparation of bankable projects through TC, regardless of whether they will be financed by the private or public sectors. When private capital investment is not possible, JICA should provide loans/grants for capital investment. Areas for Japan’s ODA financing for investment would include: thermal plants in which private investors are not interested, renewable energy projects (e.g., geothermal and wind-power) whose investment risk is usually higher than conventional thermal plants; and hydropower projects which require social and environmental considerations. Some recent project examples include a geothermal project in Kenya and a wind power project in Egypt.
➢ Transmission, distribution and rural electrification: These sub-sectors would qualify for public sector funding because the private sector is less interested due to generally low commercial viability. Assistance both for project preparation and investment would be necessary.
In a hydropower project in Uganda, while the power station is invested
213
Policy Challenges for Infrastructure Development in Africa - The way forward for Japan’s Official Development Assistance (ODA)
in by the private sector, the associated transmission lines are funded by JICA and AfDB through concessional loans. This sort of division of labor between private and public funds is common in power projects in Asia.On the other hand, it is difficult to expect private sector capital investment in the WSS and irrigation sectors due to low commercial viability; and, therefore, public financing is expected to close the funding gap. In WSS, while Japan’s ODA appears to place emphasis on efficiency improvement through TC, the low access rate to WSS is a serious problem (Section 2), suggesting room for Japan’s assistance for WSS investment. Likewise, raising productivity in agriculture is essential for Africa’s food security and economic transformation. Irrigation facilities are a vital component, together with improved inputs including fertilizers as shown in the green revolution in Asia. JICA should consider the possibilities of supporting new investment through loan/grant assistance in these two sectors.
Lastly, there is an important caution to be placed on the reallocation of Japan’s assistance among the sectors. The estimation of the funding gaps is made on the assumption that current spending continues (Table 2). If all development partners shift from the transport to other sectors at once, there is the risk that the transport sector would be in deficit. In addition, as in Section 2, there are variations in infrastructure between sectors and countries and the infrastructure deficits of sub-sectors (particularly, roads, ports and railways) within the transport sector vary. Therefore, sectoral reallocation needs coordination with recipient countries and other development partners, and a careful review of infrastructure needs and gaps in each country should be undertaken. (If the current resource allocation to the transport sector is reconsidered, the prioritization of spending is necessary within the transport sector, including emphasis on regional connectivity discussed in Chapter 8, financial support for road maintenance in the next Sub-section 4.2, and reallocation between transport sub-sectors.)
4.2 Financial assistance for maintenanceJapan has always emphasized the importance of maintenance of infrastructure over the years through TC projects (e.g., road maintenance) and ex-post evaluation of projects. Japan’s ODA, however, do not finance operation and maintenance expenditures, which shall be shouldered by recipient countries through their budget and user charges. Japan’s assistance for strengthening infrastructure maintenance
214
Chapter 7
has been through capacity building of maintenance techniques, financial management, etc., through technical assistance and overseas training. Japan only provides budget support, which possibly finances maintenance expenditures, on a limited basis in Africa, almost all in Tanzania.
JICA’s ex-post evaluations found financial weaknesses in JICA-assisted infrastructure projects at the operation and maintenance stage in Africa.20 JICA 2011 and 2012 include post-evaluations of fourteen (14) infrastructure projects funded by loans or grants in Africa. Out of 8 projects whose sustainability is rated “medium,” six (6) projects (43%), which are rated “medium,” have problems related to insufficient budget allocation or low cost recovery at the operation and maintenance stage.21
Ultimately, there are only two financing sources for infrastructure investment, operation and maintenance: tax and user charges.22 Therefore, in order to have the financial resources for infrastructure, governments, developers and service providers need to adopt cost-reflective tariffs when service charges are collected, and exert tax collection efforts to cover the cost in the case of non-revenue generating projects. Careful attention should be paid to affordability by poorer sections of society, for example, through designing targeted subsidy schemes and adopting more cost effective technologies. In the long run, Japan’s ODA should help developing countries in Africa take the self-help approach
In the short run, however, Japan should reconsider its approach to strengthening maintenance in Africa. The finding that insufficient budget and cost recovery caused insufficient maintenance in JICA-funded projects means that non-financial capacity building alone cannot address insufficient maintenance. Japan’s financial assistance for maintenance, through (sector) budget support or sector program loans, 20. Insufficient maintenance due to insufficient budget and low cost-recovery is a problem common for most developing countries (JICA 2012).21. In JICA post-evaluation, the rating of “sustainability” is in three grades: high, medium and low. Out of the 14 evaluated projects, 6 projects get high ratings and 8 projects get medium ratings regarding sustainability. There are no low-rated projects regarding sustainability in JICA 2011 and 2012.22. “Financiers – whether the private sector, or official lenders and donors - can change the requisite time profile of taxes or user charges by providing financing in the form of loans or equity, but eventually those loans need to be repaid or remunerated.” (ADB-JBIC-WB 2005, 30)
215
Policy Challenges for Infrastructure Development in Africa - The way forward for Japan’s Official Development Assistance (ODA)
can play an important role in the sustainability of infrastructure.
In addition, the financing of maintenance would have some advantages over new investments given the current situation in Africa: higher return and quicker impact. While a new investment project takes time from project preparation to completion, maintenance investment generally requires a shorter time because of minimal environmental considerations, a shorter time for contractor selection, less technical complexities, etc. Particularly, the economic return for road maintenance in SSA countries is quite high (138.8%) according to AFD-WB 2009 (70-71). If this statement is combined with the argument in Sub-section 4.1 – sectoral reallocation of resources – the policy implication is that a portion of the funds for new road investment should be shifted to road maintenance.
Before embarking on financial assistance for maintenance in Africa, there are two important considerations. First, it can and should be selective in terms of recipient countries and sectors. As in JICA 2011 and 2012, it should be noted that 57% of projects still have no problem with budget allocation or cost recovery. In addition, capacity constraints on the Japan side and fiduciary risks of recipient countries should also be taken into account. Countries and sectors for financial assistance regarding maintenance should be carefully selected in consideration of capital investment projects in the past and if there are on-going projects. Second, Japan should have a phase-out policy from this type of assistance since maintenance cannot be supported forever. It has to be undertaken together with capacity development TC for budget management, infrastructure asset management, and maintenance techniques.
4.3 Assistance regarding management reform of public utilitiesThree recommendations of AFD-WB 2009 (Nos. 3 to 5 of the Box) are regarding institutional and regulatory reforms. AFD-WB 2009 also finds that governance reform of public utilities is more successful in countries where broader governance reforms are in progress, and that some countries do well despite broader governance reform being delayed (106-108). The latter finding is consistent with the argument of pockets of effective agencies in weak governance states – “it is well established that even in countries that have poor governance and a weak public sector, exceptional well-functioning government and government supported agencies do exist”(Leonard 2010).
216
Chapter 7
While there is no doubt that broader governance reform should be pursued, it would take time to produce results due to the political economy of African countries. Therefore, a realistic approach would be that while broader governance reform is executed, efforts should be made to create effective organizations which are expected to produce positive results through organizational reforms in the short run.23 Japan should identify government agencies and public utilities of past, ongoing, and/or future Japan ODA projects, and should consider support for internal management and organizational reforms, and cost recovery mechanisms.
5. Conclusions
This chapter has reviewed the current status of infrastructure, and recent Japan ODA projects, and discussed three issues that Japan’s infrastructure assistance should consider in light of the findings and recommendations of AFD-WB 2009. We have suggested rethinking resource allocation between sectors, financial assistance for infrastructure maintenance, and the organizational reform of executing agencies.
One of the strengths of Japan’s ODA is that it can contribute both to address efficiency gaps and to close funding gaps through the three modalities: loans, grants and TC. These three modalities can be effectively used for various types of countries and sectors, depending on the stages of infrastructure development and the country’s needs. One important note is that loan assistance is indispensable to increase Japan’s financial support to Africa’s infrastructure. In view of the fact that the high indebtedness of some African countries hampered Japan’s infrastructure assistance, it is essential to pay careful attention to debt sustainability issues to sustain Japan’s infrastructure assistance. In close coordination with other development partners, it would be more effective to reconsider Japan’s infrastructure assistance strategy in Africa with new data and findings, and to take one step further by setting up an infrastructure assistance strategy for individual countries.
23. Some pockets of effective organizations in weak governance states were created through long-term management practices and strong organizational culture. This sort of effective organization cannot be created over a short period of time (Fujita 2011).
217
Policy Challenges for Infrastructure Development in Africa - The way forward for Japan’s Official Development Assistance (ODA)
References
Asian Development Bank (ADB), Japan Bank for International Cooperation (JBIC), and World Bank. 2005. Connecting East Asia: A new framework for infrastructure. Washington, DC: World Bank. Referred to as ADB-JBIC-WB 2005.
Bluffstone, R., and G. Köhlin, eds. 2011. Agricultural Investment and Productivity. Washington, DC: REF Press.
Calderón, C., and L. Servén. 2010. Infrastructure and economic development in Sub-Saharan Africa. Journal of African Economies 19, no. suppl. 1: i13–i87.
Foster, V., and C. Briceno-Garmendia, eds. 2009. Africa’s infrastructure: A time for transformation. Paris: Agence Française de Développement (AFD); Washington, DC: World Bank. Referred to as AFD-WB 2009.
International Monetary Fund (IMF). 2012. World economic outlook. Washington, DC: IMF.
Infrastructure Consortium for Africa (ICA). 2008. ICA annual report 2007. Tunis: African Development Bank (AfDB).
ICA. 2009. ICA annual report 2008. Tunis: AfDB.ICA. 2010. ICA annual report 2009. Tunis: AfDB.ICA. 2011. ICA annual report 2010. Tunis: AfDB.International Commission on Irrigation and Drainage (ICID). 2010. ICID
member countries data. http://www.icid.org/imp_data.pdf (accessed August 10, 2012).
Japan International Cooperation Agency (JICA). 2011. Annual evaluation report 2010. Tokyo: JICA.
JICA. 2012a. Annual evaluation report 2011. Tokyo: JICA.JICA. 2012b. JICA project database (accessed July/August 2012).Leigland, J. 2010. PPI in poor countries: How to increase private
participation in infrastructure management and investment. Gridlines series No. 51, Public-Private Infrastructure Advisory Facility (PPIAF), c/o World Bank, Washington, DC.
Leonard, D. K. 2010. ‘Pockets’ of effective agencies in weak governance states: Where are they likely and why does it matter? Public Administration and Development 30:91–101.
Fujita, Y. 2011. What makes the Bangladesh Local Government Engineering Department (LGED) so effective? Complementarity between LGED capacity and donor capacity development support. JICA-RI Working Paper No. 27, JICA Research Institute, Tokyo.
Ministry of Foreign Affairs of Japan (MOFAJ). 2011. Wagakuni no
218
Chapter 7
saimukyusaisochi (Koutekisaimu menjogaku) (Gaisanchi). [In Japanese.] http://www.mofa.go.jp/mofaj/ gaiko/oda/seisaku/keitai/enshakan/saimuhouki.html (accessed August 14, 2012).
United Nations Development Programme (UNDP). 2012. Africa human development report 2012: Toward a food secure future. New York: UNDP, Regional Bureau for Africa.
World Bank. 2012a. World development indicators database. http://data.worldbank.org/ data-catalog/world-development-indicators (accessed July 12, 2012).
World Bank. 2012b. Information and communications for development 2012: Maximizing mobile. Washington, DC: World Bank.
World Economic Forum (WEF). 2011. Global competitiveness report 2011–2012. Geneva: WEF.
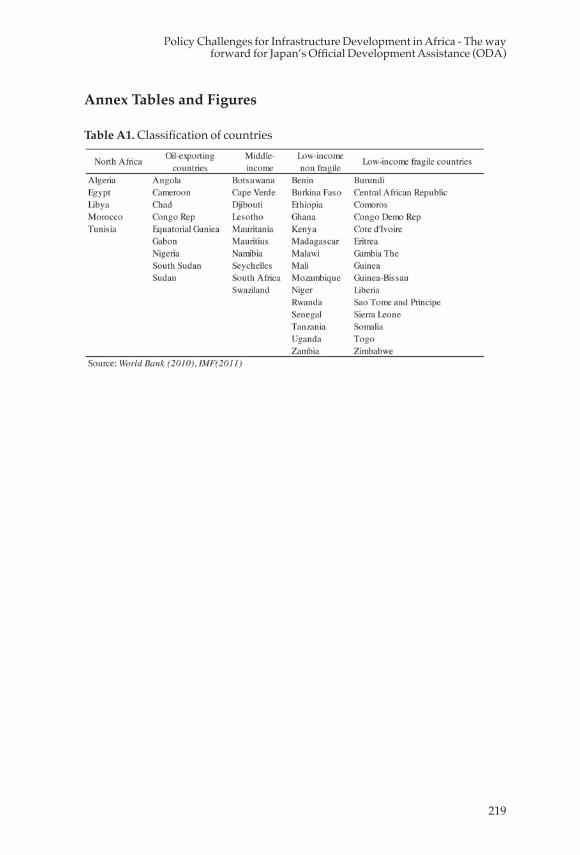
219
Policy Challenges for Infrastructure Development in Africa - The way forward for Japan’s Official Development Assistance (ODA)
Annex Tables and Figures
Table A1. Classification of countries
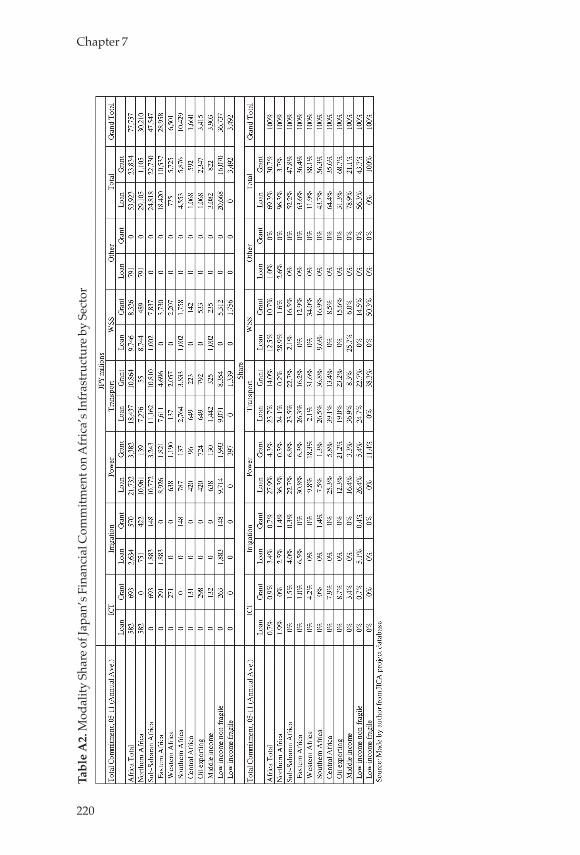
220
Chapter 7
Tabl
e A
2. M
odal
ity S
hare
of J
apan
’s F
inan
cial
Com
mitm
ent o
n A
fric
a’s I
nfra
stru
ctur
e by
Sect
or
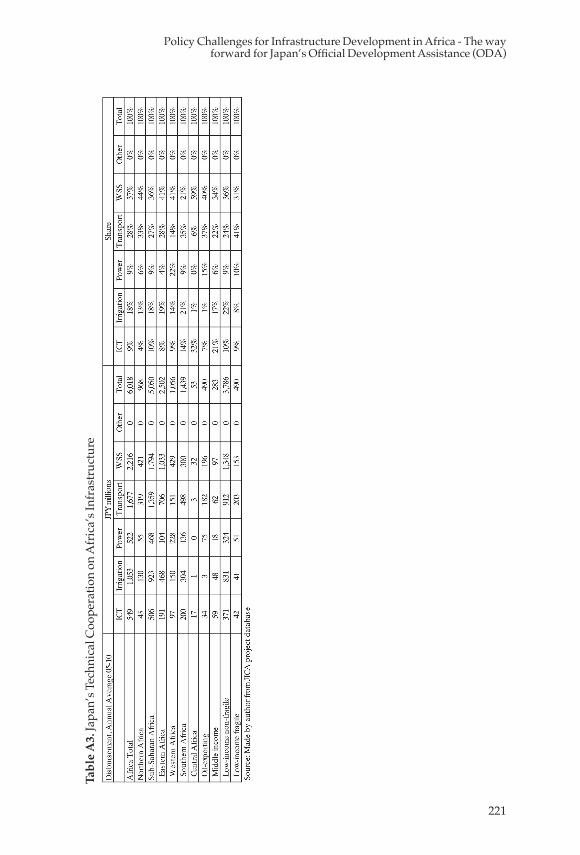
221
Policy Challenges for Infrastructure Development in Africa - The way forward for Japan’s Official Development Assistance (ODA)
Tabl
e A
3. Ja
pan’
s Tec
hnic
al C
oope
ratio
n on
Afr
ica’
s Inf
rast
ruct
ure
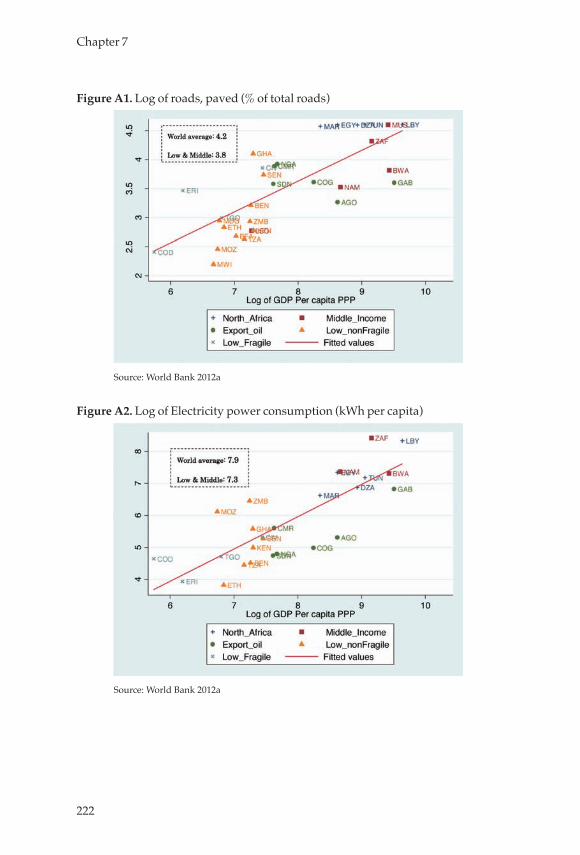
222
Chapter 7
Figure A1. Log of roads, paved (% of total roads)
Source: World Bank 2012a
Figure A2. Log of Electricity power consumption (kWh per capita)
Source: World Bank 2012a
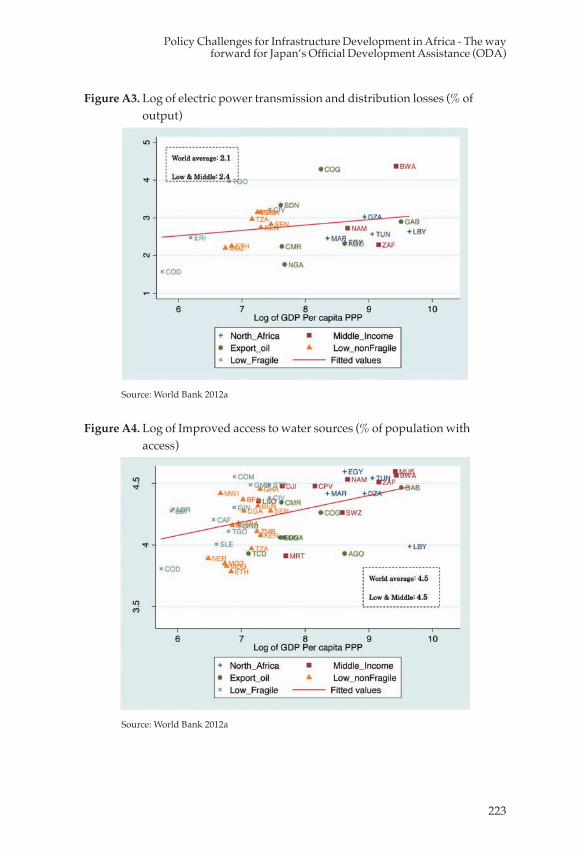
223
Policy Challenges for Infrastructure Development in Africa - The way forward for Japan’s Official Development Assistance (ODA)
Figure A3. Log of electric power transmission and distribution losses (% of output)
Source: World Bank 2012a
Figure A4. Log of Improved access to water sources (% of population with access)
Source: World Bank 2012a
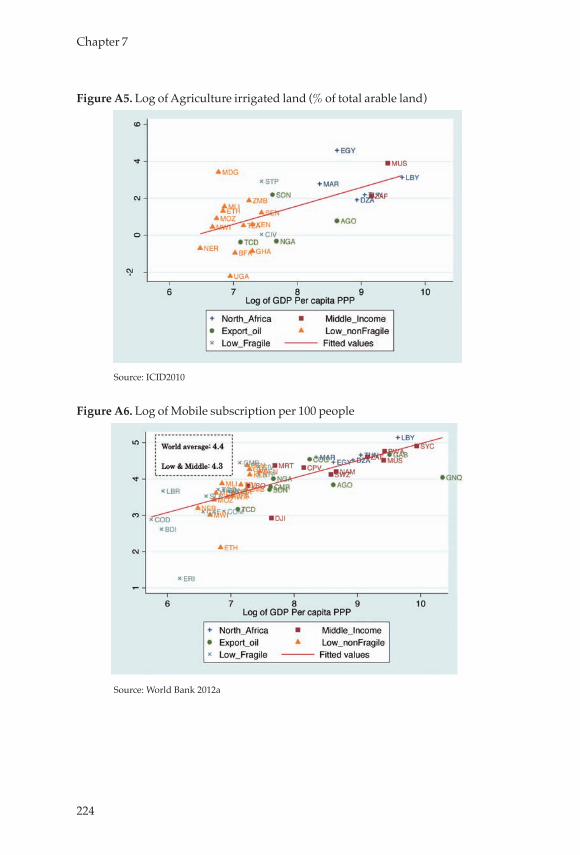
224
Chapter 7
Figure A5. Log of Agriculture irrigated land (% of total arable land)
Source: ICID2010
Figure A6. Log of Mobile subscription per 100 people
Source: World Bank 2012a
225
Chapter 8: Cross Border Transport Infrastructure (CBTI)
Kaori Matsushita
Cross Border Transport Infrastructure (CBTI) is indispensable to economic activities in Africa. However, the high cost of distribution due to the limited capacity of infrastructure facilities and inefficient customs/cross-border formalities constrains economic and social development in Africa. Under the circumstances, TICAD IV, held in May 2008, designated regional infrastructure development as a key task and have been striving to improve both the physical and software sides of CBTI in Africa in order to improve the efficiency of physical distribution.
This report summarizes the current situation of trading and physical distribution in Africa, discusses the importance of CBTI, and proposes a course of action for assisting CBTI.
Cross Border Transport Infrastructure (CBTI) is defined as follows:1 CBTI is a comprehensive and necessary infrastructure for cross-border transportation between countries. Such infrastructure includes physical infrastructure such as ports, railroads, main roads, transshipment facilities, border facilities including one-stop border posts (OSBPs), weigh bridges (vehicle weight measuring scales), and inland container depots (ICD), all of which constitute international transit corridors. CBTI also includes legal systems related to various cross-border matters, such as cross-border traffic regulations (police check), customs, international agreements, quarantine, and bond/security systems, as well as organization control/legal systems for smooth operation and maintenance of physical infrastructure.
1. The Current Conditions of Trading and Physical Distribution and Issues of Cross Border Transport Infrastructure in Africa
1.1 Trading/physical distributionThe value of exports in the whole of Africa including North Africa 1. This is based on the definition in JICA “Cross Border Transport Infrastructure Feasibility Study Phase 3 (Project Study)” (March 2009)
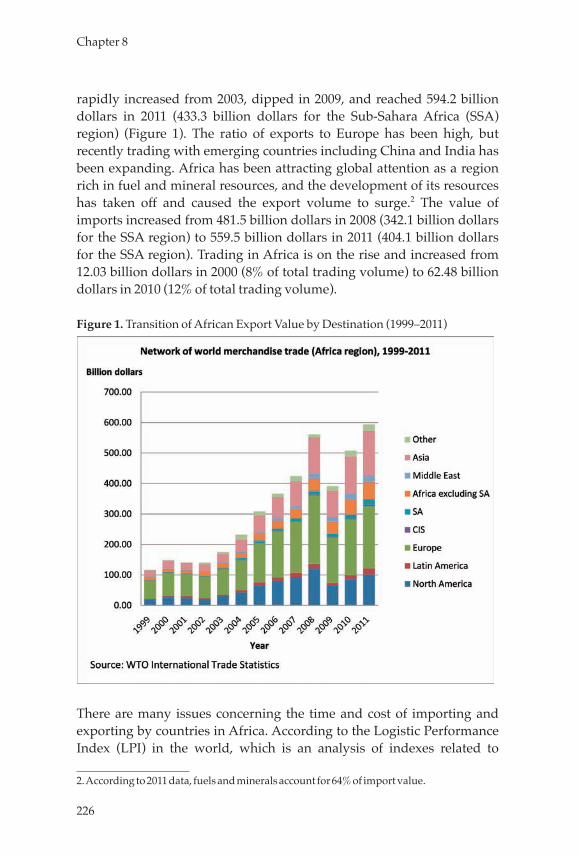
226
Chapter 8
rapidly increased from 2003, dipped in 2009, and reached 594.2 billion dollars in 2011 (433.3 billion dollars for the Sub-Sahara Africa (SSA) region) (Figure 1). The ratio of exports to Europe has been high, but recently trading with emerging countries including China and India has been expanding. Africa has been attracting global attention as a region rich in fuel and mineral resources, and the development of its resources has taken off and caused the export volume to surge.2 The value of imports increased from 481.5 billion dollars in 2008 (342.1 billion dollars for the SSA region) to 559.5 billion dollars in 2011 (404.1 billion dollars for the SSA region). Trading in Africa is on the rise and increased from 12.03 billion dollars in 2000 (8% of total trading volume) to 62.48 billion dollars in 2010 (12% of total trading volume).
Figure 1. Transition of African Export Value by Destination (1999–2011)
There are many issues concerning the time and cost of importing and exporting by countries in Africa. According to the Logistic Performance Index (LPI) in the world, which is an analysis of indexes related to
2. According to 2011 data, fuels and minerals account for 64% of import value.
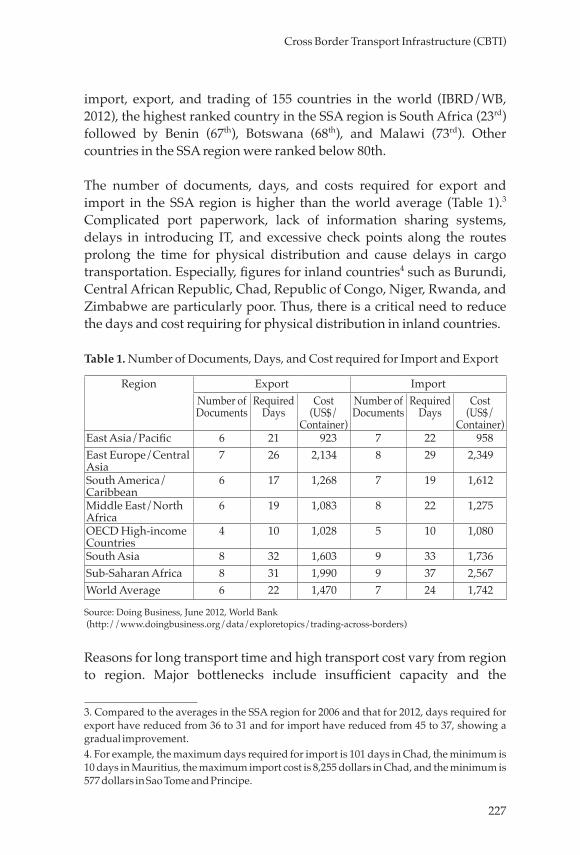
227
Cross Border Transport Infrastructure (CBTI)
import, export, and trading of 155 countries in the world (IBRD/WB, 2012), the highest ranked country in the SSA region is South Africa (23rd) followed by Benin (67th), Botswana (68th), and Malawi (73rd). Other countries in the SSA region were ranked below 80th.
The number of documents, days, and costs required for export and import in the SSA region is higher than the world average (Table 1).3 Complicated port paperwork, lack of information sharing systems, delays in introducing IT, and excessive check points along the routes prolong the time for physical distribution and cause delays in cargo transportation. Especially, figures for inland countries4 such as Burundi, Central African Republic, Chad, Republic of Congo, Niger, Rwanda, and Zimbabwe are particularly poor. Thus, there is a critical need to reduce the days and cost requiring for physical distribution in inland countries.
Table 1. Number of Documents, Days, and Cost required for Import and Export
Region Export ImportNumber of Documents
Required Days
Cost(US$/
Container)
Number of Documents
Required Days
Cost(US$/
Container)East Asia/Pacific 6 21 923 7 22 958East Europe/Central Asia
7 26 2,134 8 29 2,349
South America/Caribbean
6 17 1,268 7 19 1,612
Middle East/North Africa
6 19 1,083 8 22 1,275
OECD High-income Countries
4 10 1,028 5 10 1,080
South Asia 8 32 1,603 9 33 1,736Sub-Saharan Africa 8 31 1,990 9 37 2,567World Average 6 22 1,470 7 24 1,742
Source: Doing Business, June 2012, World Bank (http://www.doingbusiness.org/data/exploretopics/trading-across-borders)
Reasons for long transport time and high transport cost vary from region to region. Major bottlenecks include insufficient capacity and the
3. Compared to the averages in the SSA region for 2006 and that for 2012, days required for export have reduced from 36 to 31 and for import have reduced from 45 to 37, showing a gradual improvement.4. For example, the maximum days required for import is 101 days in Chad, the minimum is 10 days in Mauritius, the maximum import cost is 8,255 dollars in Chad, and the minimum is 577 dollars in Sao Tome and Principe.
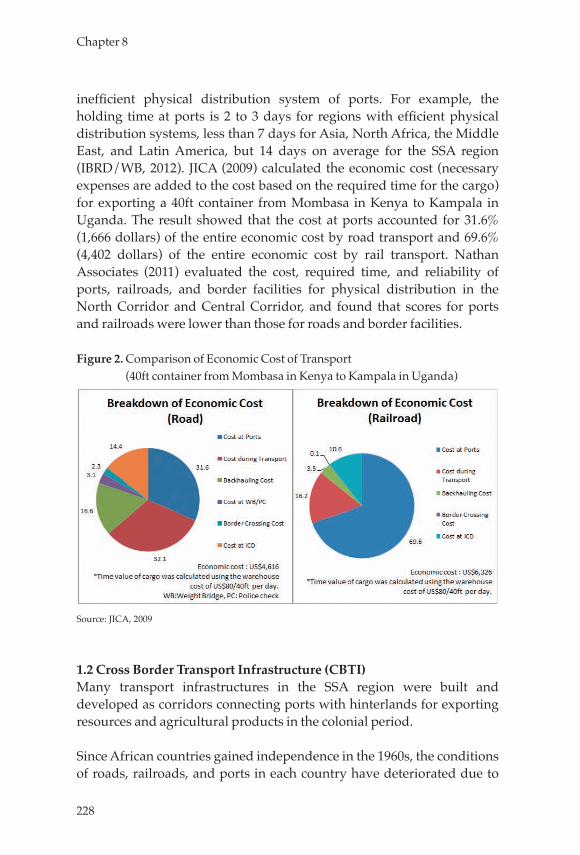
228
Chapter 8
inefficient physical distribution system of ports. For example, the holding time at ports is 2 to 3 days for regions with efficient physical distribution systems, less than 7 days for Asia, North Africa, the Middle East, and Latin America, but 14 days on average for the SSA region (IBRD/WB, 2012). JICA (2009) calculated the economic cost (necessary expenses are added to the cost based on the required time for the cargo) for exporting a 40ft container from Mombasa in Kenya to Kampala in Uganda. The result showed that the cost at ports accounted for 31.6% (1,666 dollars) of the entire economic cost by road transport and 69.6% (4,402 dollars) of the entire economic cost by rail transport. Nathan Associates (2011) evaluated the cost, required time, and reliability of ports, railroads, and border facilities for physical distribution in the North Corridor and Central Corridor, and found that scores for ports and railroads were lower than those for roads and border facilities.
Figure 2. Comparison of Economic Cost of Transport (40ft container from Mombasa in Kenya to Kampala in Uganda)
Source: JICA, 2009
1.2 Cross Border Transport Infrastructure (CBTI)Many transport infrastructures in the SSA region were built and developed as corridors connecting ports with hinterlands for exporting resources and agricultural products in the colonial period.
Since African countries gained independence in the 1960s, the conditions of roads, railroads, and ports in each country have deteriorated due to
229
Cross Border Transport Infrastructure (CBTI)
insufficient skills and funds for maintenance as well as damage to road surfaces caused by overloaded vehicles. As for railroads, in addition to aging freight vehicles and tracks, the volume of traffic has decreased on many lines due to operational reasons including failure of the concessions. The use of containers at ports was introduced in the early 1990s in Africa, but the development of roads and ports to handle the physical distribution of large containers has not kept pace.
The necessity of CBTI development in the SSA region was recognized in the 1970s. Aid agencies and regional economic communities (RECs) in Africa have pointed out the necessity of a “corridor approach” that develops interregional physical infrastructure and legal/procedural systems in an integrated manner. For example, the Trans-Africa Highway was proposed in 1971, the Sub-Saharan Africa Transport Policy Program in 1987, the Spatial Development Initiative in 1996, and the Corridor Diagnostic Study of the Northern and Central Corridors of East Africa (CDS) in 2011, as outlined below.
BOX(1) Trans Africa Highway (TAH)The concept consists of nine corridors traversing Africa lengthwise and crosswise (total length of 56,683 km), and was proposed in 1971. In 2003, the United Nations Economic Commission for Africa (UNECA), African Development Bank, and AU examined the development status of the TAH and addressed the needs for TAH development, maintenance, and control by securing funds for each country along the route. Since then, development of the TAH has been promoted mainly by the African Development Bank.(2) Sub-Saharan Africa Transport Policy Program (SSATP)This was established in 1987 through the combined efforts of the World Bank and UNECA. The SSATP has identified eight important regional economic corridors for developing transportation corridors from inland areas to each large-scale international port. The SSATP itself mainly conducts research on transport infrastructure development and formulates strategies and political measures. Under the strategy, each donor and cooperative agency, mainly the World Bank, supports individual infrastructure issues.
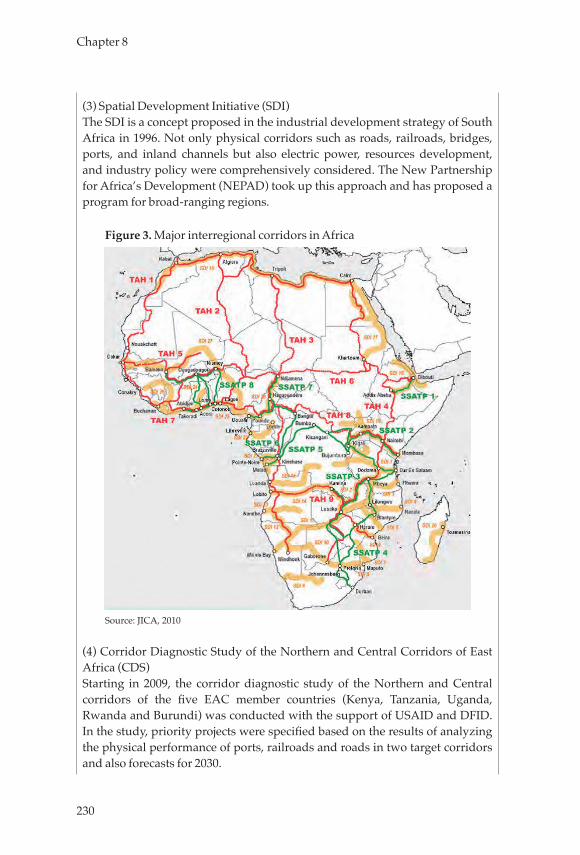
230
Chapter 8
(3) Spatial Development Initiative (SDI)The SDI is a concept proposed in the industrial development strategy of South Africa in 1996. Not only physical corridors such as roads, railroads, bridges, ports, and inland channels but also electric power, resources development, and industry policy were comprehensively considered. The New Partnership for Africa’s Development (NEPAD) took up this approach and has proposed a program for broad-ranging regions.
Figure 3. Major interregional corridors in Africa
Source: JICA, 2010
(4) Corridor Diagnostic Study of the Northern and Central Corridors of East Africa (CDS)Starting in 2009, the corridor diagnostic study of the Northern and Central corridors of the five EAC member countries (Kenya, Tanzania, Uganda, Rwanda and Burundi) was conducted with the support of USAID and DFID. In the study, priority projects were specified based on the results of analyzing the physical performance of ports, railroads and roads in two target corridors and also forecasts for 2030.
231
Cross Border Transport Infrastructure (CBTI)
(5) Programme for Infrastructure Development in Africa (PIDA)In 2010, the African Union Council decided to formulate PIDA, which provides a guideline for comprehensive infrastructure development in the whole of Africa. Studies were conducted mainly by the African Union Commission, African Development Bank, and NEPAD, and PIDA was approved by the African Union Summit in January 2012. In the transport sector, 24 programs (worth 25.4 billion dollars in total) that should be given priority to go forward by 2020 were selected based on the analysis of the African Regional Transport Integration Network (ARTIN), TAH, and 40 important corridors, 19 ports, and 53 airports. PIDA is an innovative program that was started by African initiatives. Relevance with PIDA is desired for the future development of regional infrastructure. Following approval by AU, NEPAD and the African Development Bank have been introducing PIDA to stakeholders throughout the world. It is necessary to pay particular attention to the future formulation and implementation of the project.
In addition to infrastructure development efforts, it is important to consider “Aid for Trade (AfT).” AfT activities promote technical assistance related to trading, supply-side assistance including improving production capacity and developing distribution infrastructure, and structural adjustment related to the deregulation of trade by initiatives of the World Trade Organization (WTO), OECD, and the World Bank. A regional comparison of assistance to Africa shows that the amount committed has greatly increased since 2002, doubling by 2009 to reach 13 billion dollars. Most of the resources have been used for the development of trade-related capacity and infrastructure (Figure 4). According to a case study analysis, an increase in AfT leads to an increase in export volume and reduction of import cost.5 Especially in Africa, it is effective to reduce the cost of container transport (OECS/WTO, 2011). Trade facilitation in the SSA region is expected to be promoted through this initiative.
5. A doubling of AfT related to infrastructure increases import volume by 3.5%, and a doubling of AfT related to trade facilitation decreases import cost by 5%. (OECD/WTO, 2011)
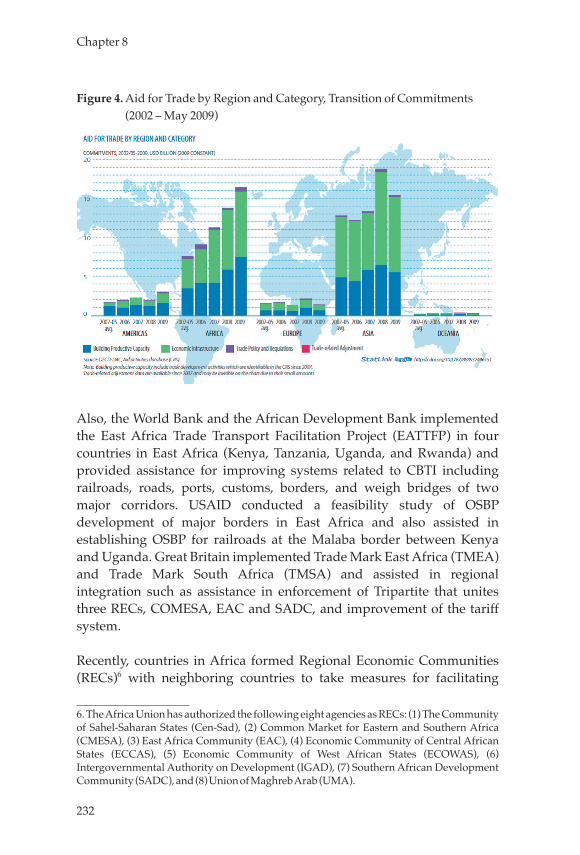
232
Chapter 8
Figure 4. Aid for Trade by Region and Category, Transition of Commitments (2002 – May 2009)
Also, the World Bank and the African Development Bank implemented the East Africa Trade Transport Facilitation Project (EATTFP) in four countries in East Africa (Kenya, Tanzania, Uganda, and Rwanda) and provided assistance for improving systems related to CBTI including railroads, roads, ports, customs, borders, and weigh bridges of two major corridors. USAID conducted a feasibility study of OSBP development of major borders in East Africa and also assisted in establishing OSBP for railroads at the Malaba border between Kenya and Uganda. Great Britain implemented Trade Mark East Africa (TMEA) and Trade Mark South Africa (TMSA) and assisted in regional integration such as assistance in enforcement of Tripartite that unites three RECs, COMESA, EAC and SADC, and improvement of the tariff system.
Recently, countries in Africa formed Regional Economic Communities (RECs)6 with neighboring countries to take measures for facilitating
6. The Africa Union has authorized the following eight agencies as RECs: (1) The Community of Sahel-Saharan States (Cen-Sad), (2) Common Market for Eastern and Southern Africa (CMESA), (3) East Africa Community (EAC), (4) Economic Community of Central African States (ECCAS), (5) Economic Community of West African States (ECOWAS), (6) Intergovernmental Authority on Development (IGAD), (7) Southern African Development Community (SADC), and (8) Union of Maghreb Arab (UMA).
233
Cross Border Transport Infrastructure (CBTI)
trade and physical distribution and regional integration. Issues to be focused on and progress of economic integration differ among the RECs, but they have promoted discussion and harmonization related to regional infrastructure studies, formulation of development plans, harmonization of regulations, standardization of cross border formalities, union of customs tariffs, and the common market. In recent years, they play an important role in the implementation of the CBTI development programs supported by aid agencies. The increasing trade volume in Africa shown in Figure 1 confirms that regional integration is moving forward.7 Since 2010, discussions on establishing an African Continental Free Trade Area (C-FTA) have been held in the African Union (UNECA, 2012). CBTI is extremely important to support the efforts by countries in Africa to accomplish economic growth.
2. Japan’s Contribution to Cross Border Transport Infrastructure Development
Including the period before TICAD IV, Japan has strived to develop infrastructure in Africa in cooperation with the international community. Below are cases that are especially closely linked to CBTI. Japan has focused on three approaches: corridor development, facilitating border formalities (OSBP assistance and customs capacity improvement), and institutional development of cross border transport systems.
2.1 Corridor development(1) Mombasa port and port area road development project
(North Corridor)This is a project to improve CBTI by integrally developing Mombasa Port in Kenya and roads to strengthen the regional corridor to inland countries. Mombasa Port is the only international trading port in Kenya and is among the largest in East Africa.8 It functions not only as an import and export base in the country but also as a gateway to the North Corridor connecting to Uganda, Rwanda, and Burundi. With steady economic growth in Kenya and East Africa since 2003, the volume of cargo handled at Mombasa Port has been increasing and reached 695,000
7. However, many RECs are funded by contributions from member countries. There are many issues related to promoting interregional integration because RECs do not have legal force over their own project budgets or member countries.8. In entire Sub-Saharan Africa, the capacity of the Mombasa Port is placed in fifth after Durban and Cape Town in South Africa, Lagos in Nigeria, and Abidjan in Cote d’lvoire (JICA, 2009).
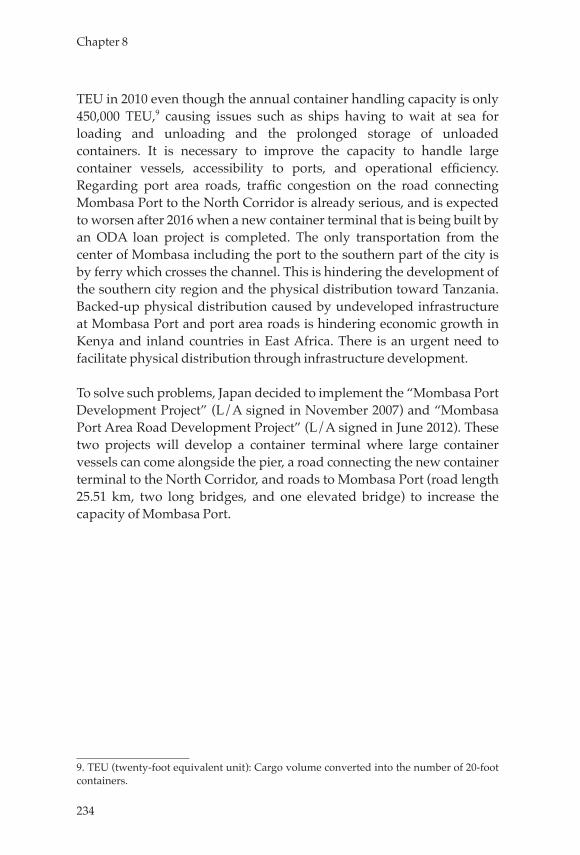
234
Chapter 8
TEU in 2010 even though the annual container handling capacity is only 450,000 TEU,9 causing issues such as ships having to wait at sea for loading and unloading and the prolonged storage of unloaded containers. It is necessary to improve the capacity to handle large container vessels, accessibility to ports, and operational efficiency. Regarding port area roads, traffic congestion on the road connecting Mombasa Port to the North Corridor is already serious, and is expected to worsen after 2016 when a new container terminal that is being built by an ODA loan project is completed. The only transportation from the center of Mombasa including the port to the southern part of the city is by ferry which crosses the channel. This is hindering the development of the southern city region and the physical distribution toward Tanzania. Backed-up physical distribution caused by undeveloped infrastructure at Mombasa Port and port area roads is hindering economic growth in Kenya and inland countries in East Africa. There is an urgent need to facilitate physical distribution through infrastructure development.
To solve such problems, Japan decided to implement the “Mombasa Port Development Project” (L/A signed in November 2007) and “Mombasa Port Area Road Development Project” (L/A signed in June 2012). These two projects will develop a container terminal where large container vessels can come alongside the pier, a road connecting the new container terminal to the North Corridor, and roads to Mombasa Port (road length 25.51 km, two long bridges, and one elevated bridge) to increase the capacity of Mombasa Port.
9. TEU (twenty-foot equivalent unit): Cargo volume converted into the number of 20-foot containers.
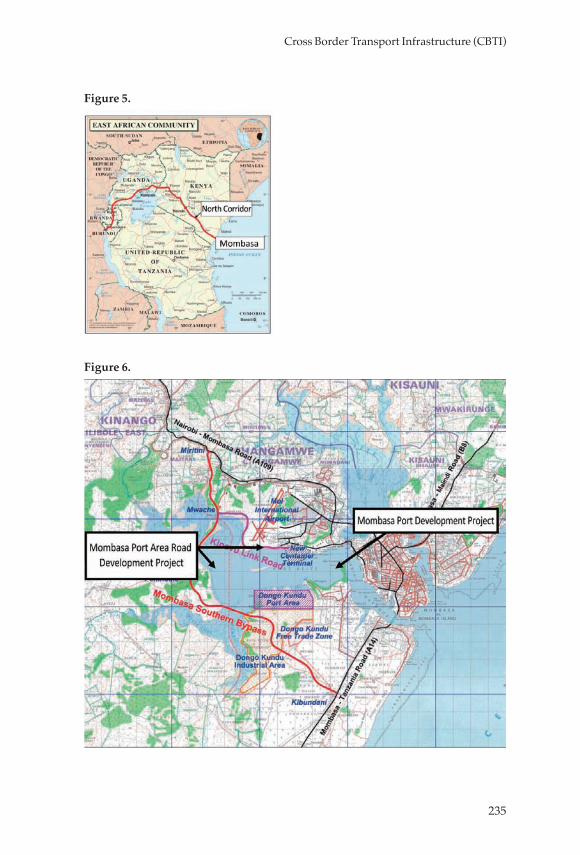
235
Cross Border Transport Infrastructure (CBTI)
Figure 5.
Figure 6.
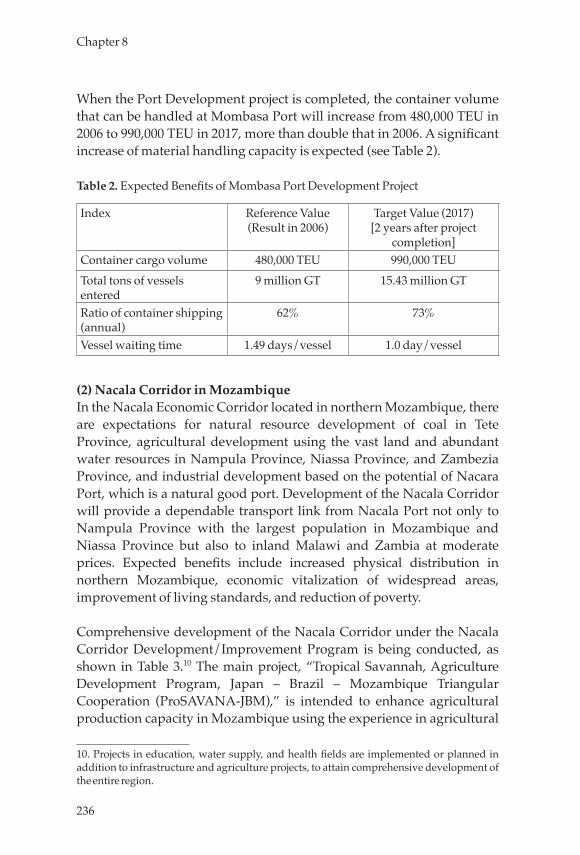
236
Chapter 8
When the Port Development project is completed, the container volume that can be handled at Mombasa Port will increase from 480,000 TEU in 2006 to 990,000 TEU in 2017, more than double that in 2006. A significant increase of material handling capacity is expected (see Table 2).
Table 2. Expected Benefits of Mombasa Port Development Project
Index Reference Value (Result in 2006)
Target Value (2017)[2 years after project
completion]Container cargo volume 480,000 TEU 990,000 TEUTotal tons of vessels entered
9 million GT 15.43 million GT
Ratio of container shipping (annual)
62% 73%
Vessel waiting time 1.49 days/vessel 1.0 day/vessel
(2) Nacala Corridor in MozambiqueIn the Nacala Economic Corridor located in northern Mozambique, there are expectations for natural resource development of coal in Tete Province, agricultural development using the vast land and abundant water resources in Nampula Province, Niassa Province, and Zambezia Province, and industrial development based on the potential of Nacara Port, which is a natural good port. Development of the Nacala Corridor will provide a dependable transport link from Nacala Port not only to Nampula Province with the largest population in Mozambique and Niassa Province but also to inland Malawi and Zambia at moderate prices. Expected benefits include increased physical distribution in northern Mozambique, economic vitalization of widespread areas, improvement of living standards, and reduction of poverty.
Comprehensive development of the Nacala Corridor under the Nacala Corridor Development/Improvement Program is being conducted, as shown in Table 3.10 The main project, “Tropical Savannah, Agriculture Development Program, Japan – Brazil – Mozambique Triangular Cooperation (ProSAVANA-JBM),” is intended to enhance agricultural production capacity in Mozambique using the experience in agricultural
10. Projects in education, water supply, and health fields are implemented or planned in addition to infrastructure and agriculture projects, to attain comprehensive development of the entire region.
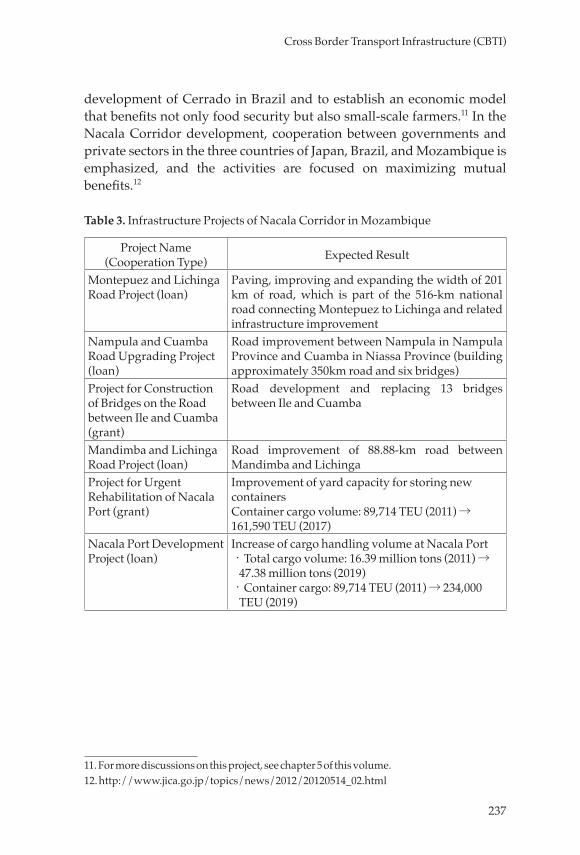
237
Cross Border Transport Infrastructure (CBTI)
development of Cerrado in Brazil and to establish an economic model that benefits not only food security but also small-scale farmers.11 In the Nacala Corridor development, cooperation between governments and private sectors in the three countries of Japan, Brazil, and Mozambique is emphasized, and the activities are focused on maximizing mutual benefits.12
Table 3. Infrastructure Projects of Nacala Corridor in Mozambique
Project Name (Cooperation Type) Expected Result
Montepuez and Lichinga Road Project (loan)
Paving, improving and expanding the width of 201 km of road, which is part of the 516-km national road connecting Montepuez to Lichinga and related infrastructure improvement
Nampula and Cuamba Road Upgrading Project (loan)
Road improvement between Nampula in Nampula Province and Cuamba in Niassa Province (building approximately 350km road and six bridges)
Project for Construction of Bridges on the Road between Ile and Cuamba (grant)
Road development and replacing 13 bridges between Ile and Cuamba
Mandimba and Lichinga Road Project (loan)
Road improvement of 88.88-km road between Mandimba and Lichinga
Project for Urgent Rehabilitation of Nacala Port (grant)
Improvement of yard capacity for storing new containersContainer cargo volume: 89,714 TEU (2011) → 161,590 TEU (2017)
Nacala Port Development Project (loan)
Increase of cargo handling volume at Nacala Port ‧ Total cargo volume: 16.39 million tons (2011) →
47.38 million tons (2019) ‧ Container cargo: 89,714 TEU (2011) → 234,000
TEU (2019)
11. For more discussions on this project, see chapter 5 of this volume. 12. http://www.jica.go.jp/topics/news/2012/20120514_02.html
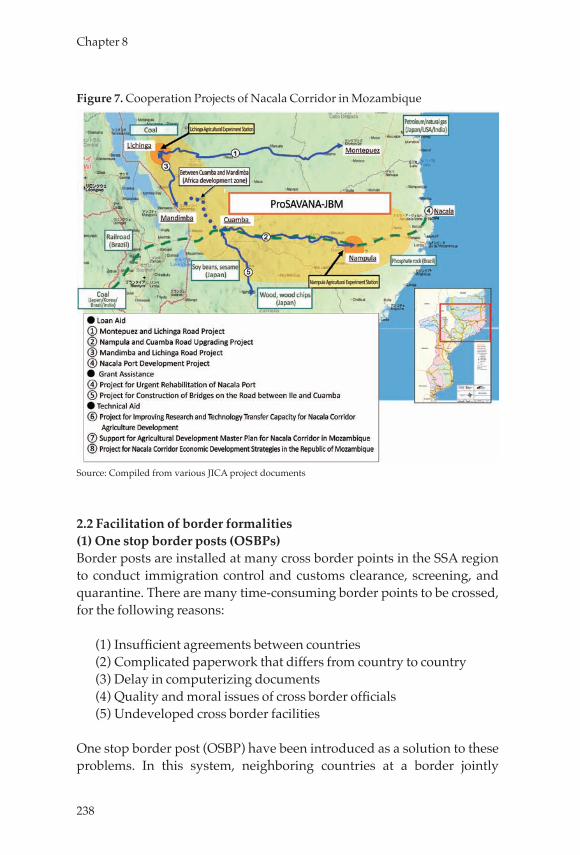
238
Chapter 8
Figure 7. Cooperation Projects of Nacala Corridor in Mozambique
Source: Compiled from various JICA project documents
2.2 Facilitation of border formalities(1) One stop border posts (OSBPs)Border posts are installed at many cross border points in the SSA region to conduct immigration control and customs clearance, screening, and quarantine. There are many time-consuming border points to be crossed, for the following reasons:
(1) Insufficient agreements between countries(2) Complicated paperwork that differs from country to country(3) Delay in computerizing documents(4) Quality and moral issues of cross border officials(5) Undeveloped cross border facilities
One stop border post (OSBP) have been introduced as a solution to these problems. In this system, neighboring countries at a border jointly
239
Cross Border Transport Infrastructure (CBTI)
conduct immigration control, customs clearance, and quarantine at the one-stop border post. These tasks are handled separately at present.The experience of OSBP at three places (Chirundu, Malaba, and Namanga) in the SSA region is introduced below.
Chirundu (Zambia/Zimbabwe)Chirundu is at the border between Zambia and Zimbabwe and is located on the North-South Corridor. The border is important for the transport of inland mineral resources such as copper produced in Zambia to Durban Port in South Africa and Beira Port in Mozambique. Japan has implemented assistance by drawing up a bilateral agreement between Zambia and Zimbabwe, grant aid assistance for the Chirundu Bridge Construction Project, and the Chirundu Border Related Facility Construction Project by providing non-project grant collateral funds and dispatching volunteers. Many partners have participated in this project. The World Bank conducted the baseline study13 which analyzed the traffic volume and reasons for delays at Chirundu. The British DFID allocated a project manager and introduced ICT. Such cooperation related to facilities and personnel was accumulated in 2009, and the first OSBP in Africa started operating after an OSBP-related legislative bill was enacted in the two countries.14
The effectiveness of the OSBP has been confirmed. For example, regarding the number of passing trucks, 225 trucks passed per day in 2007 (120 north-bound trucks, 105 south-bound trucks) but 380 trucks passed per day in 2011 (200 north-bound trucks, 180 south-bound trucks) (JICA/EAC, 2011). As for time taken to cross the border, that for passenger cars was reduced from 1–2 hours to 20 minutes, that for buses from 2 hours to 1 hour, and that for trucks from 1–2 days to less than 1 day. Future challenges are to fully utilize introduced facilities, standardize customs formalities, and promote further cooperation between the agencies of the two countries.
Malaba (Kenya/Uganda)Malaba is an important border between Kenya and Uganda in the North Corridor. The first OSBP exclusively for railroads in East Africa was
13. Barney Curtis, “The Chirundu Border Post: Detailed monitoring of transit times”, SSATP Discussion Paper No. 10, World Bank, 2009.14. Zimbabwe One Stop Border Posts Control Act, No. 21 of 2007 and Zambia One Stop Border Control Act, No. 8 of 2008.
240
Chapter 8
established in 2007 at Malaba based on a bilateral agreement concluded by the governments of Uganda and Kenya in 2006. Malaba is one of the target sites of “Capacity Building for the Customs Administrations of the Eastern African Region (Phase 2)”, a technical assistance project by JICA. Major activities of this project are introduction of a customs clearance system necessary for operating the OSBP (Real Time Monitoring System and Cargo Control System: RTMS/CCS) and capacity building through training of joint border monitoring and customs clearance work (tariff classification and customs valuation).
As a result of introducing the OSBP, the time required for railroad crossing has been reduced from 4-7 days to 2 hours. For road cargo, the time was reduced from 4 days to 3 hours (JICA/EAC, 2011).15 The improvement of yard and customs facilities and the implementation of 24-hour operation and joint customs screening by the two countries for some items (12 items accounting for 30% of all cargo) have influenced such improvement.
The handling of extra-territorial rights and administration (management and execution) under the bilateral agreement is an issue for the OSBP at Malaba.16 The further development of systems is planned.
Namanga (Kenya/Tanzania)Namanga on the border of Kenya and Tanzania is located on the corridor connecting Nairobi, the capital of Kenya, and Arusha, the central city of northern Tanzania. Namanga is used for 41% of exports from Kenya to Tanzania and 20% of exports from Tanzania to Kenya. In the yen-loan “Arusha-Namanga-Athi River Road Development Project” Japan will build 104.3 km of road between Arusha and Namanga on the Tanzania side, which is part of the international main road (240 km long) connecting Arusha in Tanzania to Athi River in Kenya, and will also develop infrastructure related to OSBP. This project is co-financed by the African Development Bank, which has provided loans for road construction on the Kenya side (135.7 km) and part of the Tanzania side,
15. The Trade Mark East Africa “Review of the impact of trade facilitation instruments”, 2012 introduces other ex post valuation of OSBP in Malaba (shortened from 3 days to 3 hours, and from more than 12 hours to 6 hours on average).16. For example, regarding criminal investigations of violations of the Immigration Control Law, such as large-scale tax evasion, smuggling, and handling of prosecuted defendants, it is not clearly stipulated which country’s authority should seize the articles and arrest and detain the defendant (JICA, 2009).
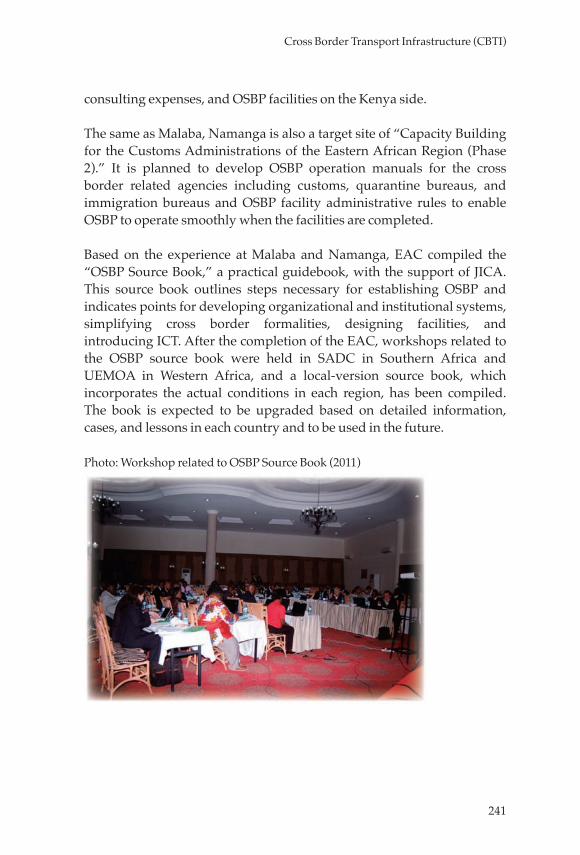
241
Cross Border Transport Infrastructure (CBTI)
consulting expenses, and OSBP facilities on the Kenya side.
The same as Malaba, Namanga is also a target site of “Capacity Building for the Customs Administrations of the Eastern African Region (Phase 2).” It is planned to develop OSBP operation manuals for the cross border related agencies including customs, quarantine bureaus, and immigration bureaus and OSBP facility administrative rules to enable OSBP to operate smoothly when the facilities are completed.
Based on the experience at Malaba and Namanga, EAC compiled the “OSBP Source Book,” a practical guidebook, with the support of JICA. This source book outlines steps necessary for establishing OSBP and indicates points for developing organizational and institutional systems, simplifying cross border formalities, designing facilities, and introducing ICT. After the completion of the EAC, workshops related to the OSBP source book were held in SADC in Southern Africa and UEMOA in Western Africa, and a local-version source book, which incorporates the actual conditions in each region, has been compiled. The book is expected to be upgraded based on detailed information, cases, and lessons in each country and to be used in the future.
Photo: Workshop related to OSBP Source Book (2011)
242
Chapter 8
(2) Capacity Development of Customs on the Borders of East Africa, Nambia and Botswana
As described in the previous section, JICA is implementing a project for improving the customs ability on the borders of five East African countries as well as Nambia and Botswana. The abolishment of tariffs in the region and the introduction of common external tariffs were realized in the five East African countries by 2010. At present, work is underway on building a common market. As cooperation for facilitating trade in the region, since 2007 JICA has implemented “Capacity Building for the Customs Administrations of the Eastern African Region” to introduce RTMS/CCS and provide training (Master Trainer Program) for training instructors on customs duties including the tariff classification and customs valuation.
On the border of Mamuno/Trans-Kalahari between Botswana and Nambia, the “Project for the Establishment of the One Stop Border Post (OSBP) between Botswana and Namibia at Mamuno/Trans Kalahari Border Post” has been implemented since 2010. The border is becoming increasingly important because the border connects Walvis Bay in Nambia and Johannesburg in South Africa, and the route connects North America, Europe, and Southern Africa with shorter times and distances. Both Botswana and Nambia have strategic intentions to establish a model case of OSBP in the region in order to lead the negotiations with other countries in the future. Although the initial project plan has been reviewed because of the belated approval of the bilateral agreement between the two countries, OSBP is expected to be steadily introduced with the support of the Project.
2.3 Harmonization of cross border transport systemIn many regions in Africa, overloaded vehicles constantly travel on the paved roads, damaging the road surface. However, appropriate measures to control overloaded vehicles cannot be taken because regulations differ from country to country. Furthermore, there are issues such as shortages of appropriate vehicle weighing machines and facilities and lack of cooperation by transportation companies. In response, the EAC has studied a legal framework of regulations on overloaded vehicles since 2010 with the support of JICA (JICA, 2011).
As a result of discussions on harmonizing regulations, five member states agreed on 23 items, including vehicle gross weight limit (56 tons)
243
Cross Border Transport Infrastructure (CBTI)
and interlink vehicles (full length of up to 22 m permitted on only specified routes), to build the foundation of institutionalization. Going forward, institutionalization at the EAC will be undertaken by the following process. The EAC assembly will approve an EAC law that defines broad principles of vehicle regulation, and the EAC Council will proclaim domestic laws and ordinances that stipulate detailed operational and administrative matters. The EAC laws and ordinances will supersede conflicting domestic laws and ordinances in member states.17 This is a strong and immediate mechanism for establishing a harmonized institutional system.
3. Direction of Cooperation in TICAD V3.1 Lessons(1) Comprehensive corridor development considering the entire corridorObviously, trade promotion and economic growth can be achieved only by combining a wide range of policies for them, of which CBTI development constitutes only a part. CBTI development must be positioned in a comprehensive corridor development framework that takes into consideration industrial development, resource development, and trade promotion of the entire supranational area.
As mentioned above, Japan has undertaken a project at Mombasa Port in Kenya with a view to benefiting the entire North Corridor and stimulating the economy in the Mombasa region. In addition, regarding the Nacala Corridor in Mozambique, Japan has worked on comprehensive corridor development linked to agricultural and resource development with the cooperation of governments and private sectors, aiming to improve the economic performance of the entire corridor and deliver benefits to poverty groups. The approach aiming for synergy effects by programming multiple issues will serve as a useful reference for future projects.
(2) Importance of a three-way approach involving infrastructure development, institutional development, and human resource development
To improve CBTI, key requirements are not only the development of conventional infrastructure such as ports, roads, and railroads, but also assistance in development systems and appropriate operation of
17. Based on subparagraphs (4) and (5) of Article 8 in EAC law
244
Chapter 8
regional agreements and domestic regulations, as well as human resources development of cross border officials (customs, immigration, quarantine, cross border police, etc.) and the private sector (customs clearance agencies, transportation companies, etc.) are important. As for customs, as implemented in Japan’s technical assistance projects, an approach designed to improve capacity in accordance with the international standard by cooperating with the international agency, the World Custom Organization (WCO), seems to be effective.
(3) Cooperation with Regional Economic Communities (RECs)When improving the systems (regional agreements, customs system standardization, harmonization of traffic laws, bond system, etc.) noted in (2) above, a legal framework covering multiple countries needs to be introduced. In Africa, RECs have already been established in regions with social and economic connections, and institutional improvement activities are being carried out in each region. Therefore, focusing on CBTI in cooperation with RECs will deliver benefits to business more effectively and efficiently.
3.2 Direction of future cooperationThe population of Arica is expected to continue increasing. It is important to facilitate trade by developing CBTI in order to develop industry and thus contribute to employment creation and regional development and also to satisfy the demands of the expanding market. Future efforts should target comprehensive corridor development by intensively allocating resources to corridors with high development potential in order to promote a shift from resource-dependent economies to a versatile and advanced regional industrial structure. As specific assistance measures for CBTI, it will be effective to form a cooperation structure in order to enhance port functions which are bottleneck in the physical distribution system, to develop the transport infrastructure to promote industrial and agricultural development using regional resources, and to assist in facilitating cross border formalities.
245
Cross Border Transport Infrastructure (CBTI)
References
African Development Bank. 2011. African economic outlook 2011. Paris: OECD.
African Union Commission, African Development Bank, and Economic Commission for Africa. 2012. Programme for Infrastructure Development in Africa (PIDA). Addis Ababa, Ethiopia: African Union Commission.
Arvis, J., R. Carruthers, G. Smith, and C. Willoughby. 2011. Connecting landlocked developing countries to markets. Washington, DC: World Bank.
Foster, V., and C. Briceno-Garmendia. 2010. Africa’s infrastructure: A time for transformation, Washington, DC: World Bank.
Hirano, K. 2009. Issues in Africa: World history of development assistance. Tokyo: Nippon Hyoronsha.
Japan International Cooperation Agency, and East African Community. 2011. One stop border post source book. n.p.
JICA Africa Department. 2009a. Preparatory study report of Western Africa comprehensive OSBP assistance program formulation. Study prepared for JICA, Tokyo, March.
JICA Africa Department. 2009b. Report of preparatory study of physical distribution improvement cooperation in the border area between Tanzania and Rwanda including Rusumo Bridge. Report prepared for JICA, Tokyo.
JICA Africa Department. 2011. Report of African development strategy review session. Report prepared for JICA, Tokyo.
JICA Economic Infrastructure Development Department. 2009. Project study: Final report. Report on Cross Border Transport Infrastructure Feasibility Study Phase 3, prepared for JICA, Tokyo.
JICA Industry Development, and JICA Public Policy Department. n.d. Project materials, Capacity Building for the Customs Administrations of the Eastern African Region, Phase 2.
JICA Industry Development, and JICA Public Policy Department. n.d. Project materials, Project for the Establishment of the One Stop Border Post (OSBP) between Botswana and Namibia at Mamuno/Trans Kalahari Border Post.
JICA Social Development Department. 2008. Final report of study (project study) of how the transport infrastructure assistance should be in Africa. Report prepared for JICA, Tokyo, March.
JICA. 2010a. Preliminary study on the Southern Africa Growth Belt:
246
Chapter 8
Integrated regional transport program. Report prepared for JICA, Tokyo.
JICA. 2010b. Project study of regional transport infrastructure (ports/railroads) in Sub-Saharan Africa. Study prepared for JICA, Tokyo.
JICA. 2011. Study for harmonization of overload vehicle control in the East African Community. Study prepared for JICA, Tokyo.
Nathan Associates, Inc. 2011. Corridor Diagnostic Study of the Northern and Central Corridors of East Africa. Report submitted to the Task Coordination Group, Corridor Diagnostic Study of the Northern and Central Corridors of East Africa, April.
Organisation for Economic Co-operation and Development (OECD), and World Trade Organization (WTO). 2011. Aid for trade at a glance 2011: Showing results. Paris: OECD.
Trade Mark East Africa. 2012. Review of the impact of trade facilitation instruments. n.p.
World Trade Organization. 2012a. World trade report 2012. Geneva: World Trade Organization.
World Bank. 2012b. Connecting to Compete 2012: Trade logistics in the global economy; The logistics performance index and its indicators. Washington, DC: World Bank.
World Bank. n.d. World development indicators. Online database. http://data.worldbank.org/ data-catalog/world-development-indicators.
World Bank, and International Finance Corporation. 2013. Doing business 2013: Smarter regulations for small and medium-size enterprises. Washington, DC: World Bank.
United Nations Economic Commission for Africa. 2012. Assessing regional integration in Africa V: Towards an African continental free trade area. Addis Ababa, Ethiopia: UNECA.
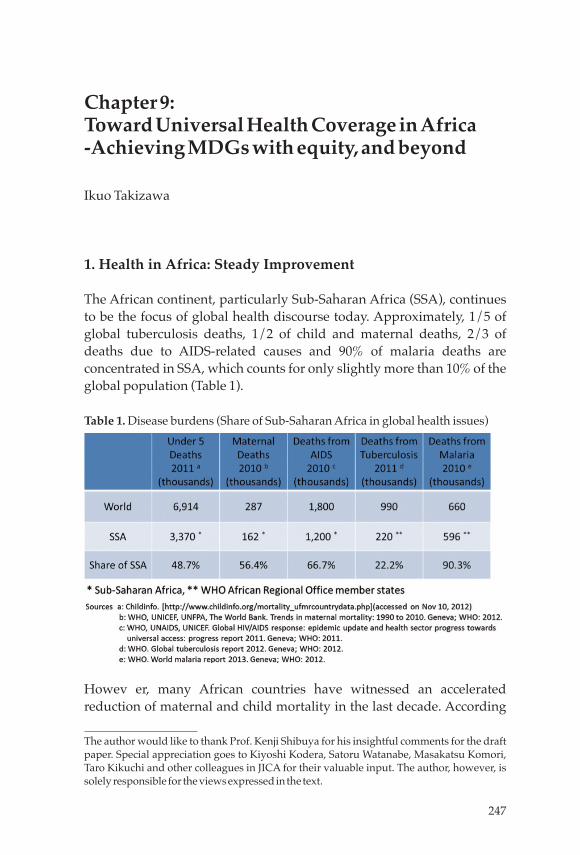
247
Chapter 9: Toward Universal Health Coverage in Africa -Achieving MDGs with equity, and beyond
Ikuo Takizawa
1. Health in Africa: Steady Improvement
The African continent, particularly Sub-Saharan Africa (SSA), continues to be the focus of global health discourse today. Approximately, 1/5 of global tuberculosis deaths, 1/2 of child and maternal deaths, 2/3 of deaths due to AIDS-related causes and 90% of malaria deaths are concentrated in SSA, which counts for only slightly more than 10% of the global population (Table 1).
Table 1. Disease burdens (Share of Sub-Saharan Africa in global health issues)
Howev er, many African countries have witnessed an accelerated reduction of maternal and child mortality in the last decade. According
The author would like to thank Prof. Kenji Shibuya for his insightful comments for the draft paper. Special appreciation goes to Kiyoshi Kodera, Satoru Watanabe, Masakatsu Komori, Taro Kikuchi and other colleagues in JICA for their valuable input. The author, however, is solely responsible for the views expressed in the text.
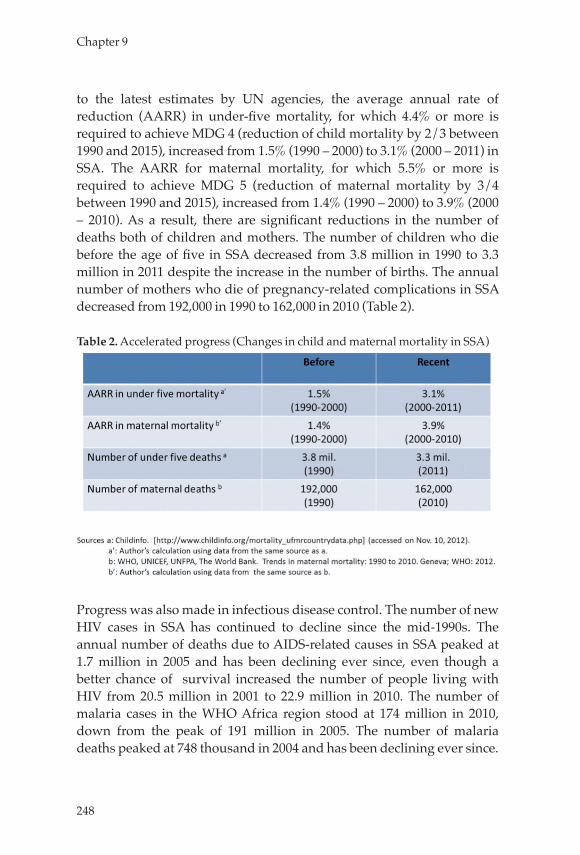
248
Chapter 9
to the latest estimates by UN agencies, the average annual rate of reduction (AARR) in under-five mortality, for which 4.4% or more is required to achieve MDG 4 (reduction of child mortality by 2/3 between 1990 and 2015), increased from 1.5% (1990 – 2000) to 3.1% (2000 – 2011) in SSA. The AARR for maternal mortality, for which 5.5% or more is required to achieve MDG 5 (reduction of maternal mortality by 3/4 between 1990 and 2015), increased from 1.4% (1990 – 2000) to 3.9% (2000 – 2010). As a result, there are significant reductions in the number of deaths both of children and mothers. The number of children who die before the age of five in SSA decreased from 3.8 million in 1990 to 3.3 million in 2011 despite the increase in the number of births. The annual number of mothers who die of pregnancy-related complications in SSA decreased from 192,000 in 1990 to 162,000 in 2010 (Table 2).
Table 2. Accelerated progress (Changes in child and maternal mortality in SSA)
Progress was also made in infectious disease control. The number of new HIV cases in SSA has continued to decline since the mid-1990s. The annual number of deaths due to AIDS-related causes in SSA peaked at 1.7 million in 2005 and has been declining ever since, even though a better chance of survival increased the number of people living with HIV from 20.5 million in 2001 to 22.9 million in 2010. The number of malaria cases in the WHO Africa region stood at 174 million in 2010, down from the peak of 191 million in 2005. The number of malaria deaths peaked at 748 thousand in 2004 and has been declining ever since.
249
Toward Universal Health Coverage in Africa-Achieving MDGs with equity, and beyond
The steady progress in health improvements was founded on the bold policy initiatives of African countries to strengthen the health systems to ensure physical and financial access to essential health services. Rapid expansion of high impact health interventions fueled by an increase in development assistance also contributed, as is described in a later section. For example, the Community-based Health Planning and Service program in Ghana, Health Extension Program in Ethiopia, and Health Surveillance Assistant in Malawi are good examples of country initiatives in improving physical access to essential health services of the underserved population. Cases such as the Mutuelles de Santé (Community-based Health Insurance Scheme) in Rwanda and the National Health Insurance Scheme in Ghana are gaining international attention as examples of publicly organized financial protection schemes which achieved high population coverage in low income settings in SSA. Performance-based financing is being introduced in many countries as a strategy to increase service coverage and quality, triggered by success stories from Rwanda and Burundi.
It is generally recognized that improvement in health will increase the academic performance of children and productivity of adults. There are some studies which indicate linkage between an increase in life expectancy with an increase in GDP. Improvement in health will reduce the cost of medical expenditures, therefore minimizing the risk of impoverishment due to high expenses. Health is the foundation for human security. The TICAD V process, in principle, needs to be built on those achievements in the past decade and should promote the continuation and further expansion of many good works which have already been started in Africa.
2. Health in Africa: Remaining/Emerging Challenges
Even though there is a clear indication of a steady improvement in health in Africa, there is a large disparity in the pace of progress. Many countries in SSA continue to struggle in ensuring physical access to essential health services to the population. Ensuring financial protection especially for the poor is the common challenge for both SSA and North African countries.
As for MDG 4, only about 1/4 of the countries in Africa (13 out of 54),
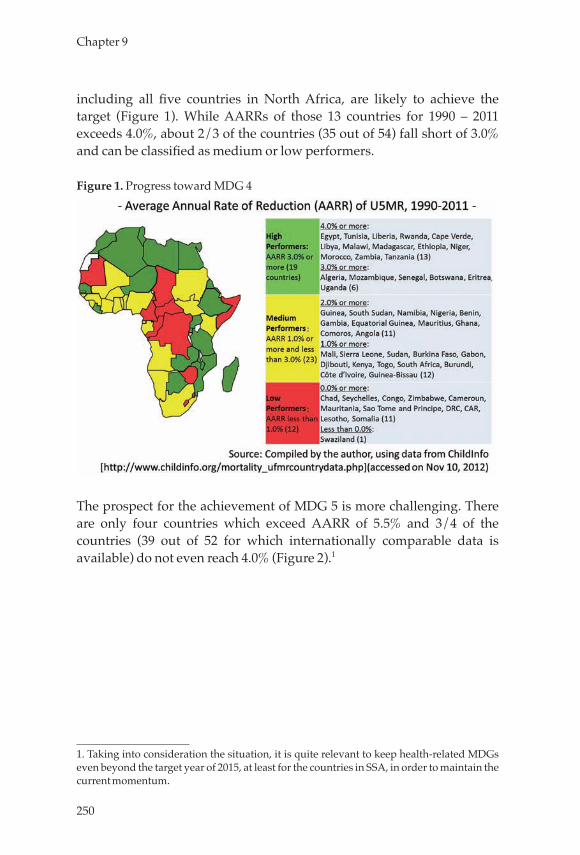
250
Chapter 9
including all five countries in North Africa, are likely to achieve the target (Figure 1). While AARRs of those 13 countries for 1990 – 2011 exceeds 4.0%, about 2/3 of the countries (35 out of 54) fall short of 3.0% and can be classified as medium or low performers.
Figure 1. Progress toward MDG 4
The prospect for the achievement of MDG 5 is more challenging. There are only four countries which exceed AARR of 5.5% and 3/4 of the countries (39 out of 52 for which internationally comparable data is available) do not even reach 4.0% (Figure 2).1
1. Taking into consideration the situation, it is quite relevant to keep health-related MDGs even beyond the target year of 2015, at least for the countries in SSA, in order to maintain the current momentum.
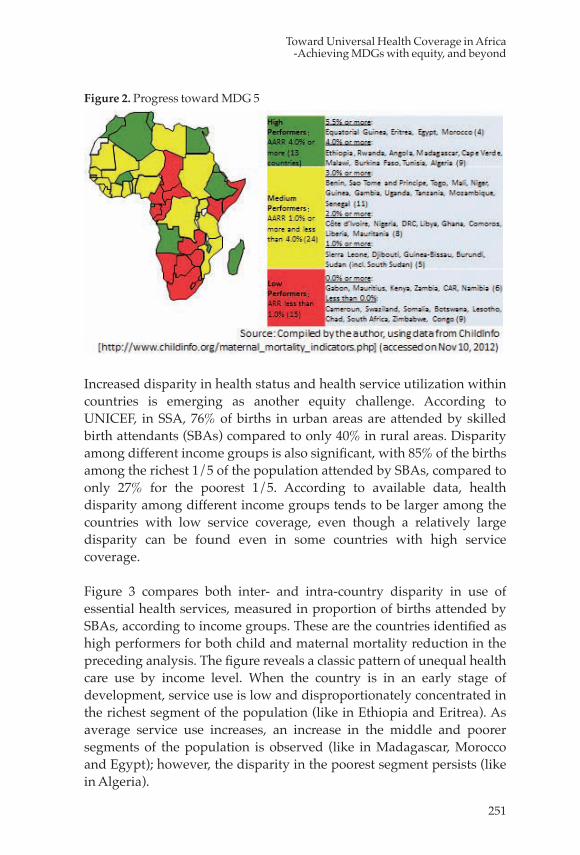
251
Toward Universal Health Coverage in Africa-Achieving MDGs with equity, and beyond
Figure 2. Progress toward MDG 5
Increased disparity in health status and health service utilization within countries is emerging as another equity challenge. According to UNICEF, in SSA, 76% of births in urban areas are attended by skilled birth attendants (SBAs) compared to only 40% in rural areas. Disparity among different income groups is also significant, with 85% of the births among the richest 1/5 of the population attended by SBAs, compared to only 27% for the poorest 1/5. According to available data, health disparity among different income groups tends to be larger among the countries with low service coverage, even though a relatively large disparity can be found even in some countries with high service coverage.
Figure 3 compares both inter- and intra-country disparity in use of essential health services, measured in proportion of births attended by SBAs, according to income groups. These are the countries identified as high performers for both child and maternal mortality reduction in the preceding analysis. The figure reveals a classic pattern of unequal health care use by income level. When the country is in an early stage of development, service use is low and disproportionately concentrated in the richest segment of the population (like in Ethiopia and Eritrea). As average service use increases, an increase in the middle and poorer segments of the population is observed (like in Madagascar, Morocco and Egypt); however, the disparity in the poorest segment persists (like in Algeria).
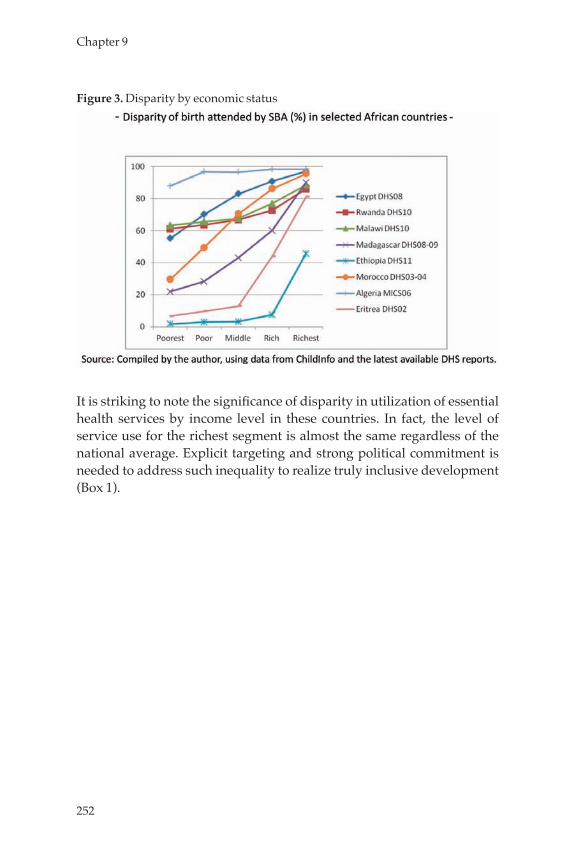
252
Chapter 9
Figure 3. Disparity by economic status
It is striking to note the significance of disparity in utilization of essential health services by income level in these countries. In fact, the level of service use for the richest segment is almost the same regardless of the national average. Explicit targeting and strong political commitment is needed to address such inequality to realize truly inclusive development (Box 1).
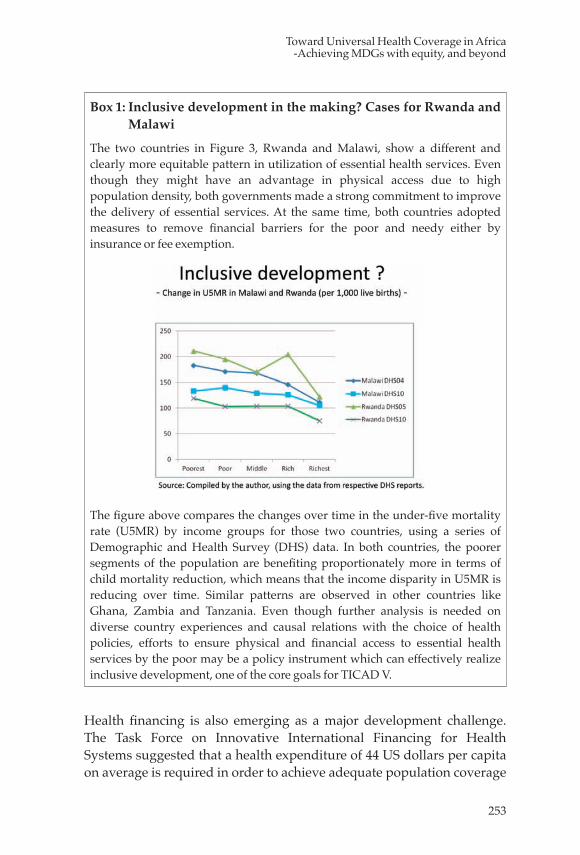
253
Toward Universal Health Coverage in Africa-Achieving MDGs with equity, and beyond
Box 1: Inclusive development in the making? Cases for Rwanda and Malawi
The two countries in Figure 3, Rwanda and Malawi, show a different and clearly more equitable pattern in utilization of essential health services. Even though they might have an advantage in physical access due to high population density, both governments made a strong commitment to improve the delivery of essential services. At the same time, both countries adopted measures to remove financial barriers for the poor and needy either by insurance or fee exemption.
The figure above compares the changes over time in the under-five mortality rate (U5MR) by income groups for those two countries, using a series of Demographic and Health Survey (DHS) data. In both countries, the poorer segments of the population are benefiting proportionately more in terms of child mortality reduction, which means that the income disparity in U5MR is reducing over time. Similar patterns are observed in other countries like Ghana, Zambia and Tanzania. Even though further analysis is needed on diverse country experiences and causal relations with the choice of health policies, efforts to ensure physical and financial access to essential health services by the poor may be a policy instrument which can effectively realize inclusive development, one of the core goals for TICAD V.
Health financing is also emerging as a major development challenge. The Task Force on Innovative International Financing for Health Systems suggested that a health expenditure of 44 US dollars per capita on average is required in order to achieve adequate population coverage
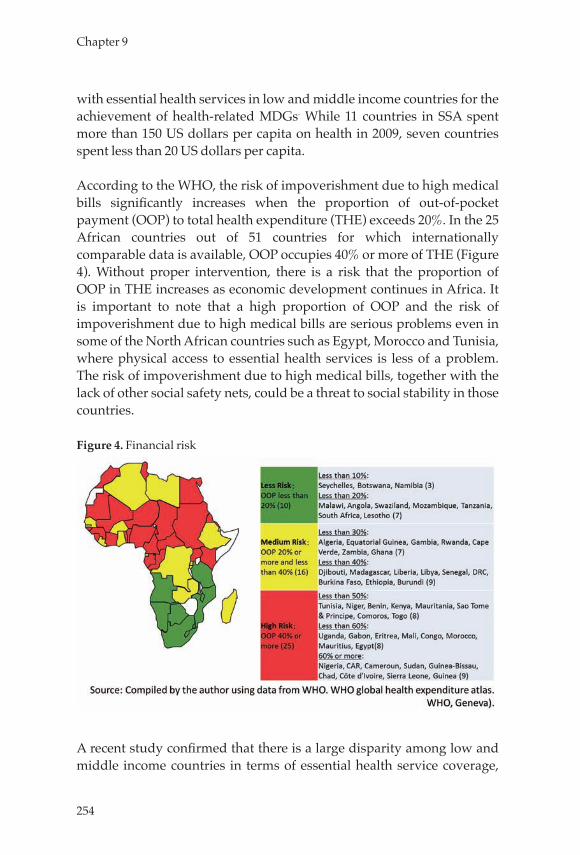
254
Chapter 9
with essential health services in low and middle income countries for the achievement of health-related MDGs. While 11 countries in SSA spent more than 150 US dollars per capita on health in 2009, seven countries spent less than 20 US dollars per capita.
According to the WHO, the risk of impoverishment due to high medical bills significantly increases when the proportion of out-of-pocket payment (OOP) to total health expenditure (THE) exceeds 20%. In the 25 African countries out of 51 countries for which internationally comparable data is available, OOP occupies 40% or more of THE (Figure 4). Without proper intervention, there is a risk that the proportion of OOP in THE increases as economic development continues in Africa. It is important to note that a high proportion of OOP and the risk of impoverishment due to high medical bills are serious problems even in some of the North African countries such as Egypt, Morocco and Tunisia, where physical access to essential health services is less of a problem. The risk of impoverishment due to high medical bills, together with the lack of other social safety nets, could be a threat to social stability in those countries.
Figure 4. Financial risk
A recent study confirmed that there is a large disparity among low and middle income countries in terms of essential health service coverage,
255
Toward Universal Health Coverage in Africa-Achieving MDGs with equity, and beyond
not only in Africa. It is also suggested that broader health coverage generally leads to improved overall population health, particularly for the poor. Considering the achievements so far and the remaining and emerging challenges, it is increasingly necessary to focus on health system issues especially equality in access and financial protection, which, together, call for concerted efforts toward universal health coverage (UHC). It is expected that action toward UHC will further accelerate the progress toward health-related MDGs, more inclusively benefiting the poor and the socially disadvantaged. It is essential for most of the countries in SSA to address physical, financial and sociocultural barriers simultaneously. The absolute lack of human resources for health, one of the major issues brought up in TICAD IV, continues to constrain efforts toward UHC, even though countries are taking initiatives to improve the situation as sited in Section 1. The focus in North African countries should be given to the expansion of financial protection and better targeting of the poor.
In addition, there is increasing concern that non-communicable diseases (NCDs) and injuries are on the rise both in North African countries with advanced demographic and epidemiological transitions and the low income countries in SSA. These transitions also call for more resilient health systems with better financial protection. Transformation or re-organization of health systems and the active participation of communities will be needed to provide promotional/preventive services and long-term/rehabilitative care which requires a significant degree of self-management by patients.
3. Development Assistance for Health in Africa
In response to the global commitment to MDGs and the series of initiatives which came out of the G8 Summits and other political arenas, development assistance for health (DAH), particularly for SSA, significantly increased in recent years. Participation of non-traditional actors such as the Bill and Melinda Gates Foundation and the establishment of large-scale global health funding mechanisms such as GAVI and GFATM, together with the increase in bilateral commitment including emerging donors, contributed to the increase. According to estimates by the Institute for Health Metrics and Evaluation, DAH for SSA increased from 1.1 billion US dollars in 2000 to 8.1 billion US dollars
256
Chapter 9
in 2010 in real terms. It is most likely that the rate of increase slowed down toward the end of the TICAD IV period.
The increase in DAH made a significant contribution in expanding the coverage of essential health services, which in turn contributed to the steady reduction of maternal and child mortality, and mortality and morbidity from major infectious diseases. Increased DAH contributed especially to expanding coverage of essential interventions related to focused health programs which address specific health conditions.2 Coverage of such interventions as long-lasting nets for malaria prevention, artemisinin-based combination therapy for malaria treatment, anti-retroviral therapy for HIV-infected people, HIV counseling and testing, immunizations for children, together with other essential life-saving interventions, expanded remarkably in SSA supported by focused DAH.
The Government of Japan (GOJ) also significantly increased DAH to Africa based on the commitment made at TICAD IV. The total amount of grant aid and technical assistance provided for Africa since the Japanese fiscal year (JFY) 2008 amounted to 47 billion yen as of the end of JFY2011, surpassing the commitment of 43 billion yen. The GOJ through JICA supported the training of 203,671 health personnel by the end of JFY2010, against a commitment of 100,000, and improved 3,935 health facilities by the end of JFY2011, against a commitment of 1,000.3
JICA focused its assistance on the most challenging regions in Ghana (Upper West), Kenya (Nyanza), and Senegal (Tambacounda and Kedougou). What was originally started as a pilot scheme was scaled up to benefit the whole of Tanzania (regional health and hospital management). The scaling up of geographically focused assistance is also being undertaken in Kenya and Senegal. Regional hospital networks were upgraded through combined capital and technical support in Uganda. Information systems to monitor human resources for health were introduced in Tanzania and South Sudan that cover the entire nation for the first time in those countries. Regional networks for health systems management were strengthened through the partnership with the African Health Leadership and Management Network
2. It is estimated that 50% of global DAH is allocated to MDG6 (control of infectious diseases). Taskforce on Innovative International Financing for Health Systems, op cit.3. Data provided by JICA (as of Nov. 2012)
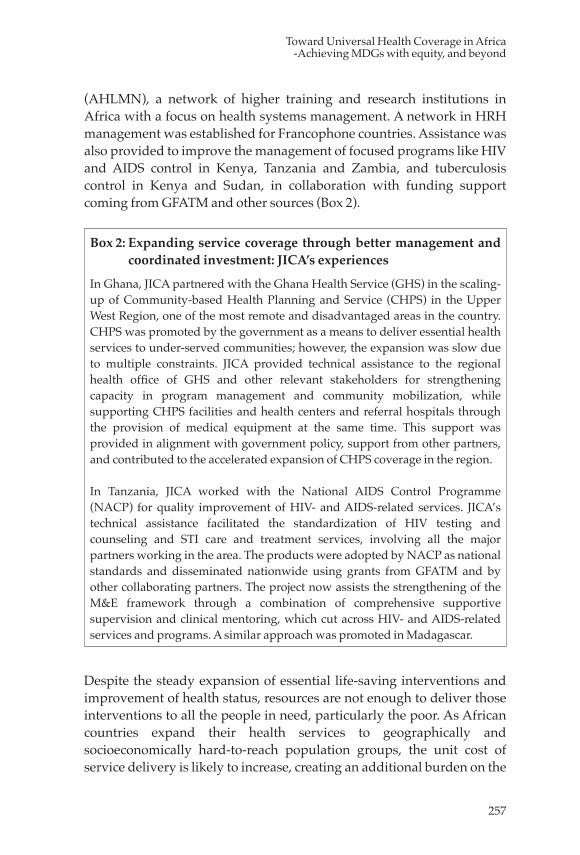
257
Toward Universal Health Coverage in Africa-Achieving MDGs with equity, and beyond
(AHLMN), a network of higher training and research institutions in Africa with a focus on health systems management. A network in HRH management was established for Francophone countries. Assistance was also provided to improve the management of focused programs like HIV and AIDS control in Kenya, Tanzania and Zambia, and tuberculosis control in Kenya and Sudan, in collaboration with funding support coming from GFATM and other sources (Box 2).
Box 2: Expanding service coverage through better management and coordinated investment: JICA’s experiences
In Ghana, JICA partnered with the Ghana Health Service (GHS) in the scaling-up of Community-based Health Planning and Service (CHPS) in the Upper West Region, one of the most remote and disadvantaged areas in the country. CHPS was promoted by the government as a means to deliver essential health services to under-served communities; however, the expansion was slow due to multiple constraints. JICA provided technical assistance to the regional health office of GHS and other relevant stakeholders for strengthening capacity in program management and community mobilization, while supporting CHPS facilities and health centers and referral hospitals through the provision of medical equipment at the same time. This support was provided in alignment with government policy, support from other partners, and contributed to the accelerated expansion of CHPS coverage in the region.
In Tanzania, JICA worked with the National AIDS Control Programme (NACP) for quality improvement of HIV- and AIDS-related services. JICA’s technical assistance facilitated the standardization of HIV testing and counseling and STI care and treatment services, involving all the major partners working in the area. The products were adopted by NACP as national standards and disseminated nationwide using grants from GFATM and by other collaborating partners. The project now assists the strengthening of the M&E framework through a combination of comprehensive supportive supervision and clinical mentoring, which cut across HIV- and AIDS-related services and programs. A similar approach was promoted in Madagascar.
Despite the steady expansion of essential life-saving interventions and improvement of health status, resources are not enough to deliver those interventions to all the people in need, particularly the poor. As African countries expand their health services to geographically and socioeconomically hard-to-reach population groups, the unit cost of service delivery is likely to increase, creating an additional burden on the
258
Chapter 9
health systems. The progression of demographic and epidemiological transitions and the increase in NCDs and injuries can be another threat to the already over-stretched health systems of many African countries.
However, a further increase in DAH seems very challenging considering the current global economic situation, at least for the near future. While efforts to strengthen global solidarity to save lives and ensure access by all to essential health services in Africa should be continued, a paradigm shift is also needed in the TICAD V process. Firstly, DAH should be allocated more strategically and catalytically in a way to increase the allocation of domestic resources for health by African countries. As many countries in Africa are now experiencing stable economic growth and are able to benefit from a demographic bonus, health systems need to be strengthened with a long-term vision to establish functional and sustainable social protection mechanisms. Secondly, DAH should be provided in a way to improve the management of health systems and programs. There is growing attention globally regarding improving the productivity and efficiency of health sectors through better management, reflecting the difficult economic situation and escalation of medical expenses. A growing body of evidence is being produced that improvement in management can actually increase the outputs and improve the quality of health services (Box 3). Proper management of the pooled fund may become another area of development concern. Thirdly, DAH should be provided in a manner to encourage private investment in the health sector. The private sector is already a vital partner in the delivery of health services in many African countries. As economic growth continues, the prospect for regarding the health sector as an industry, i.e., source of income, innovation and employment, will increase. Even though the role of the public sector and government regulation is essential, particularly on the health financing side in order to achieve pro-poor health systems, an environment should be created to attract more investment from the private sector in service delivery and technological innovations.
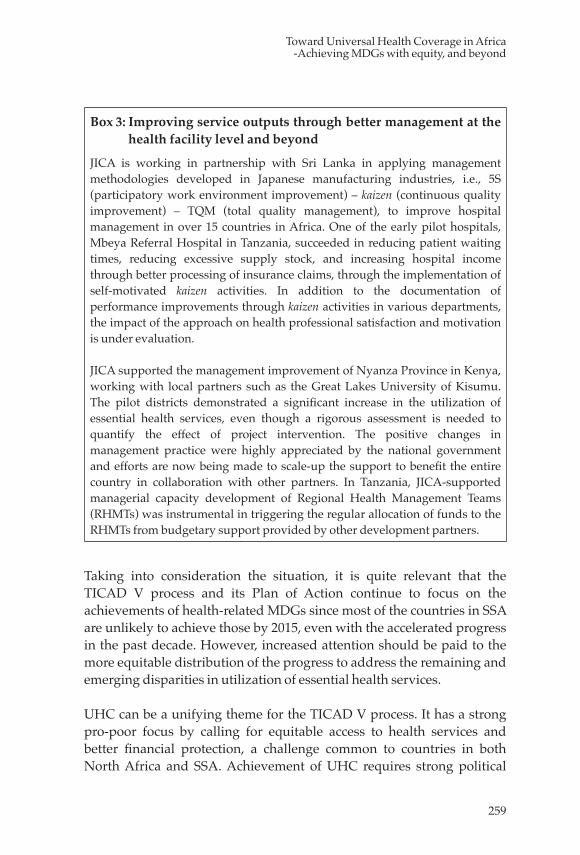
259
Toward Universal Health Coverage in Africa-Achieving MDGs with equity, and beyond
Box 3: Improving service outputs through better management at the health facility level and beyond
JICA is working in partnership with Sri Lanka in applying management methodologies developed in Japanese manufacturing industries, i.e., 5S (participatory work environment improvement) – kaizen (continuous quality improvement) – TQM (total quality management), to improve hospital management in over 15 countries in Africa. One of the early pilot hospitals, Mbeya Referral Hospital in Tanzania, succeeded in reducing patient waiting times, reducing excessive supply stock, and increasing hospital income through better processing of insurance claims, through the implementation of self-motivated kaizen activities. In addition to the documentation of performance improvements through kaizen activities in various departments, the impact of the approach on health professional satisfaction and motivation is under evaluation.
JICA supported the management improvement of Nyanza Province in Kenya, working with local partners such as the Great Lakes University of Kisumu. The pilot districts demonstrated a significant increase in the utilization of essential health services, even though a rigorous assessment is needed to quantify the effect of project intervention. The positive changes in management practice were highly appreciated by the national government and efforts are now being made to scale-up the support to benefit the entire country in collaboration with other partners. In Tanzania, JICA-supported managerial capacity development of Regional Health Management Teams (RHMTs) was instrumental in triggering the regular allocation of funds to the RHMTs from budgetary support provided by other development partners.
Taking into consideration the situation, it is quite relevant that the TICAD V process and its Plan of Action continue to focus on the achievements of health-related MDGs since most of the countries in SSA are unlikely to achieve those by 2015, even with the accelerated progress in the past decade. However, increased attention should be paid to the more equitable distribution of the progress to address the remaining and emerging disparities in utilization of essential health services.
UHC can be a unifying theme for the TICAD V process. It has a strong pro-poor focus by calling for equitable access to health services and better financial protection, a challenge common to countries in both North Africa and SSA. Achievement of UHC requires strong political
260
Chapter 9
leadership and effective and efficient mobilization of domestic resources for health including the partnership with the private sector. It requires a coordinated effort of both national governments and development partners. By focusing on UHC, new development partners such as BRICS can be brought on board for coordinated DAH to Africa. As these are the countries which recently achieved UHC (e.g., Brazil and China) or which are currently in the process of achieving UHC (e.g., India and South Africa), their experiences are full of vital lessons for the African countries in question.
There are many challenges with UHC as a development agenda. Firstly, even though it has a universality as mentioned before, UHC needs to be promoted in accordance with the evolving capacity and resource constraints of individual countries. In accordance with the definition by the WHO, UHC should be regarded as a direction, rather than a definite goal.4 There exists a large disparity among African countries in terms of their position toward UHC. Strategies tailored to the demographic, epidemiological, historical, political and economic context of each country should be deployed. In many countries in SSA, physical, financial and sociocultural barriers need to be addressed first, or simultaneously at least, with financial protection. In North African countries, financial access and better targeting of the poor should be prioritized.
Another challenge with UHC is measurement. Even though UHC is also attracting attention in the post-MDG discussion, there is no consensus yet on how to measure the progress toward UHC. Measures for UHC should probably be selected from health status indicators (i.e., MDG-like indicators), health service coverage indicators (e.g., proportion of births attended by SBAs and immunization coverage), and the indicators for financial protection (e.g., incidence of impoverishing health expenditure, proportion of OOP to THE) to capture its multiple dimensions.
UHC also faces a challenge because of its ‘narrow’ focus on healthcare rather than health itself. It is widely recognized that health is not produced by healthcare alone. Interventions regarding the social determinants of health are needed to address the root causes of ill health.
4. It is difficult to meet the entire health care needs of the population at an affordable cost even in developed countries. UHC is an endless endeavor.
261
Toward Universal Health Coverage in Africa-Achieving MDGs with equity, and beyond
Improvement in water and sanitation alone can have a significant impact on people’s health particularly in the African context. It is important to make sure that those issues are adequately addressed in the discourse of the relevant sectors.
4. Japan’s Actions in TICAD V Process
Japan’s role in promoting UHC in Africa can be significant. Japan celebrated its 50th anniversary of the achievement of UHC in the form of universal health insurance in 2011. Japan’s experience with UHC and its implications were published in a series of scientific papers for the benefit of a global audience. Japan played a major role in the global policy process to bring health systems strengthening onto development agendas through the G8 Toyako summit in 2008. There is a strong political leadership to promote UHC in the global health discourse and through the TICAD V process.
Financial capacity in increasing pooled funding and its population coverage is a key to progress toward UHC. Efforts to increase overall funding are needed. Japanese DAH is expected to play a catalytic role in the mobilization of domestic resources for UHC in Africa, depending on the evolving capacity of individual countries. However, an increase in funding alone will not be sufficient. Japanese DAH should also be provided in a way to regain a ‘can do’ attitude among political and technocratic leaders in Africa, which will be the moral foundation for the progress toward UHC.5 UHC is a long-term endeavor which requires continuous fine tuning of complex elements. Country experiences, including the one of Japan, commonly pointed out a critical importance of the roles of national political and technocratic leaders in the entire
5. It was Professor Francis Omaswa, founding Executive Director of the Global Health Workforce Alliance (GHWA) and former Director General for Health Services of the Ministry of Health, Uganda, who pointed out the loss of the ‘can do’ attitude among political and technocratic leaders as a cause for slow progress in health development in Africa. He says, “many political and technocratic leaders lost the confidence and the ‘can do’ attitude that was prevalent just before and after independence.” And then he maintains “the answer lies in growing a critical mass of individuals and institutions in each and every country that are active change agents, who are in the regular habit of using good evidence to support policy development by their governments and at the same time are able to hold their governments to account,” and “the answer also lies in growing the capacity of ministries of health to act as good stewards of health systems.” Omaswa F. Reclaiming the ‘can do’ attitude in the delivery of health services in Africa. Africa Health 2010; July: 7.
262
Chapter 9
process. Building on the achievements and outcomes in the TICAD IV process, JICA can contribute to the capacity development of African leaders and financial mobilization for UHC through the following assistances:
(1) Capacity development for health systems management through regional networking and country-focused assistanceJICA can provide assistance for the capacity development of African countries in health systems management, through the creation of a regional knowledge base and through the strengthening of country institutions, organizations and individuals.
JICA can contribute to creation of a regional knowledge base for UHC through, its ongoing partnership with AHLMN. AMREF as a host organization of AHLMN and JICA, in collaboration with the Government of Kenya, is now offering regional training on health systems management. The program has the potential to serve as a platform for knowledge sharing and informed policy choices for HSS and UHC. Opportunities exist to work with other development partners through Harmonization for Health in Africa (HHA) and other networks with similar objectives to broaden the impact.6
Improving health systems management at a country level can promote UHC through strategic planning, better targeting and more effective, efficient and accountable use of resources. Better health systems management can improve the performance of focused programs. Improving management can encourage decision making and problem solving at all levels of health systems, which cultivates professional satisfaction and motivation. JICA can extend the management assistance provided for national ministries of health and local health offices in countries like Kenya, Senegal and Tanzania to wider geographical areas or to other countries. In Kenya, for example, discussion among the relevant stakeholders is ongoing to scale up the management assistance provided to one province to the entire country, in line with the progress of decentralization under the new constitution. JICA can also support management improvement at the service delivery level, through the continued application of the 5S-kaizen-TQM approach in hospitals and other health facilities. These assistances are expected to contribute to
6. Other networks that have focused on UHC include the Joint Learning Network sponsored by the Rockefeller Foundation and SHIELD based in the University of Cape Town.

263
Toward Universal Health Coverage in Africa-Achieving MDGs with equity, and beyond
sustainable improvement in health systems performance when combined with financing interventions to incentivize better performance (i.e., performance/results-based financing) which are being tried and introduced in many countries in Africa.
(2) Capacity development for management of focused health programs targeting MNCH, infectious diseases and other emerging health needsJICA can support countries with focused health programs, such as MNCH, major infectious disease control and other emerging health needs. Efforts should be made to produce synergistic effects with large-scale funding for focused programs coming from other development partners.
Despite the accelerated expansion of essential interventions for MNCH and infectious disease control in Africa, gaps in service use will remain. In addition to the financial contributions by GOJ to the global funding mechanisms such as GFATM and GAVI, JICA can support the strengthening of the program management capacity of the national and local institutions to deliver better services. Assistance such as the strengthening of country-led donor coordination mechanisms, standardization and harmonization of various technical guidelines and tools, integration and unification of M&E frameworks, conducting implementation research and impact evaluations, and the strengthening of laboratory capacity and external quality control mechanisms (for tuberculosis and other infectious disease control) can be provided as part of the efforts to improve program management.
(3) Facilitate mobilizing financial resources for UHCIn combination with the assistance to strengthen the capacity for both health systems management and focused programs management, JICA can provide assistance to mobilize financial resources for UHC in accordance with the evolving capacity of individual countries.
It is essential that the African countries take leadership roles and make political decisions to mobilize more domestic resources for health in order to move toward UHC. Sound government financing, either through a general budget and/or insurance schemes, is indispensable in order to maintain health systems accountable to the health needs of the poor and their financial protection. However, many African countries will continue to face fiscal constraints even with sustained economic
264
Chapter 9
growth at least for the near future. There has been a remarkable increase in DAH to Africa, in particular to SSA. However, the major part of the funds is allocated to focused interventions such as HIV and AIDS, malaria, and other infectious disease control. Even though there are efforts to increase DAH allocation to the health systems strengthening, such as the establishment of a joint funding platform by GAVI, GFATM and the World Bank, the progress is slow.
JICA can provide financial assistance to eligible African countries through a best mix of grant and loan facilities in accordance with the evolving capacity of individual countries. Such assistance should be provided catalytically to facilitate government initiatives to increase domestic financing for health and expand pooled funding. It should be provided in a way to promote better management practices in government officials and health service providers. It should be catalytic to promote investment and innovations from the private sector. Combination with the support for management improvement, and coordination with support from other development partners is essential.
265
Toward Universal Health Coverage in Africa-Achieving MDGs with equity, and beyond
References
Barros, A. J. D., C. Ronsmans, H. Axelson, et al. 2012. Equity in maternal, newborn and child health interventions in Countdown to 2015: A retrospective review of survey data from 54 countries. Lancet 379:1225–1233.
Commission on Macroeconomics and Health. 2001. Macroeconomics and health: Investing in health for economic development. Geneva: WHO.
Dorgan, S., D. Layton, N. Bloom, et al. 2010. Management in healthcare: Why good practice really matters. London: McKinsey & Company.
Hafner, T., and J. Shiffman. 2013. The emergence of global attention to health systems strengthening. Health Policy and Planning 28:41–50.
Ikeda, N., E. Saito, N. Kondo, et al. 2011. Japan: Universal health care at 50 years 1; What has made the population of Japan healthy? Lancet 378:1094–1105.
Ikegami, N., B. K. Yoo, H. Hashimoto, et al. 2011. Japan: Universal health care at 50 years 2; Japanese universal health coverage; Evolution, achievements and challenges. Lancet 378:1106–1115.
Institute for Health Metrics and Evaluation. 2012. Financing global health 2012: the end of the golden age? Seattle: IHME.
Logie, D. E., M. Rowson, and F. Ndagije. 2008. Innovations in Rwanda’s health system: Looking to the future. Lancet 372:256–261.
Moreno-Serra, R., and P. C. Smith. 2012. Does progress towards universal health coverage improve population health? Lancet 380:917–923.
Nyonator, F. K., J. K. Awoonor-Williams, J. F. Phillips et al. 2005. The Ghana Community-based Health Planning and Services Initiative for scaling up service delivery innovation. Health Policy and Planning 20 (1): 25–34.
Sebastian, M. S., and H. Lemma. 2010. Efficiency of the health extension programme in Tigray, Ethiopia: a data envelopment analysis. BMC International Health and Human Rights 10:16. http://www.biomedcentral.com/1472-698X/10/16 (accessed August 1, 2011).
Takizawa, I. 2012. Health development in Africa: Accelerated improvement of health status and recommendations for Japan’s development assistance. [In Japanese.] Journal of Japan International Health Society 27 (1): 27–46.
Taskforce on Innovative International Financing for Health Systems. 2009. Constraints to scaling up and cost: Working group 1 report. Geneva: International Health Partnership.
266
Chapter 9
UNICEF. 2012. State of the world’s children 2012. New York: UNICEF. WHO, UNAIDS, and UNICEF. 2011. Global HIV/AIDS response: Epidemic
update and health sector progress towards universal access; Progress report 2011. Geneva: WHO.
WHO. 2010. The world health report: Health systems financing: The path to universal health coverage. Geneva: WHO.
WHO. 2012a. World malaria report 2013. Geneva: WHO.WHO. 2012b. WHO global health expenditure atlas. Geneva: WHO.
267
Chapter 10: Challenges in Educational Development in Africa and JICA’s Approach
Kazuro Shibuya
Introduction
This chapter looks at the challenges that Africa1 faces in education, and discusses JICA’s policies toward its development. Section 1 discusses the current and overall situation of education in Africa (Sections 1.1 and 1.2). The chapter will then discuss specific challenges for countries at different educational developmental stages because, obviously, countries at different developmental stages must have different developmental strategies depending on their respective prioritized goals (Section 1.3). As a precursor to later discussions, Section 1.4 will have a brief look at future challenges toward 2015 and beyond.
Section 2 discusses JICA’s approach toward educational development in Africa. In its efforts to contribute to education in Africa, JICA has conceived a few development models based on its policy focus and its comparative advantage built on Japan’ experience in education and human resources. Such development models will be intensively discussed in this paper while JICA can provide various and wide-range support for educational development in AfricaFinally, combining the discussions in previous sections, Section 3 will attempt to suggest some policy options for consideration by African leaders and their partners participating at TICAD V.
The author would like to thank Prof. Kazuhiro Yoshida for his insightful comments for the draft paper. Special appreciation goes to Kiyoshi Kodera, Hiroshi Kato, Nobuko Kayashima, Jun Sakuma, Mitsuko Kumagai, Kazuhiro Tambara, Jun Kawaguchi and other colleagues in JICA as well as the World Bank for their valuable input.
1. Since sub-Saharan Africa (SSA) is faced with very serious challenges, much of the discussion in this chapter will largely be on SSA. The challenges of North African countries, however, will be dealt with as appropriate.
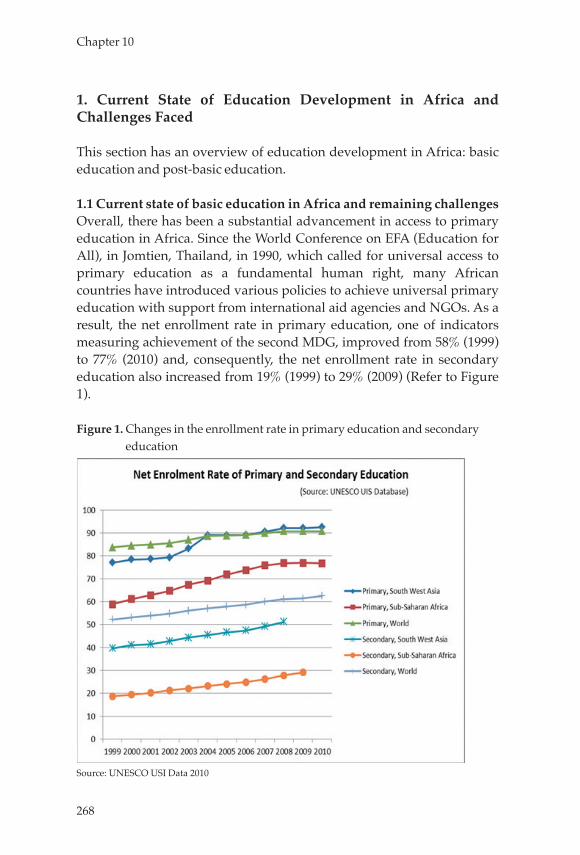
268
Chapter 10
1. Current State of Education Development in Africa and Challenges Faced
This section has an overview of education development in Africa: basic education and post-basic education.
1.1 Current state of basic education in Africa and remaining challengesOverall, there has been a substantial advancement in access to primary education in Africa. Since the World Conference on EFA (Education for All), in Jomtien, Thailand, in 1990, which called for universal access to primary education as a fundamental human right, many African countries have introduced various policies to achieve universal primary education with support from international aid agencies and NGOs. As a result, the net enrollment rate in primary education, one of indicators measuring achievement of the second MDG, improved from 58% (1999) to 77% (2010) and, consequently, the net enrollment rate in secondary education also increased from 19% (1999) to 29% (2009) (Refer to Figure 1).
Figure 1. Changes in the enrollment rate in primary education and secondary education
Source: UNESCO USI Data 2010
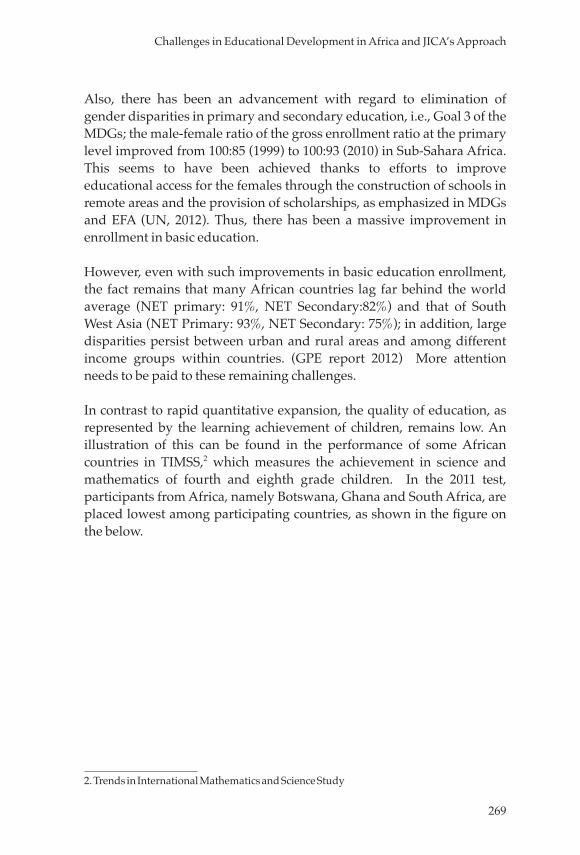
269
Challenges in Educational Development in Africa and JICA’s Approach
Also, there has been an advancement with regard to elimination of gender disparities in primary and secondary education, i.e., Goal 3 of the MDGs; the male-female ratio of the gross enrollment ratio at the primary level improved from 100:85 (1999) to 100:93 (2010) in Sub-Sahara Africa. This seems to have been achieved thanks to efforts to improve educational access for the females through the construction of schools in remote areas and the provision of scholarships, as emphasized in MDGs and EFA (UN, 2012). Thus, there has been a massive improvement in enrollment in basic education.
However, even with such improvements in basic education enrollment, the fact remains that many African countries lag far behind the world average (NET primary: 91%, NET Secondary:82%) and that of South West Asia (NET Primary: 93%, NET Secondary: 75%); in addition, large disparities persist between urban and rural areas and among different income groups within countries. (GPE report 2012) More attention needs to be paid to these remaining challenges.
In contrast to rapid quantitative expansion, the quality of education, as represented by the learning achievement of children, remains low. An illustration of this can be found in the performance of some African countries in TIMSS,2 which measures the achievement in science and mathematics of fourth and eighth grade children. In the 2011 test, participants from Africa, namely Botswana, Ghana and South Africa, are placed lowest among participating countries, as shown in the figure on the below.
2. Trends in International Mathematics and Science Study
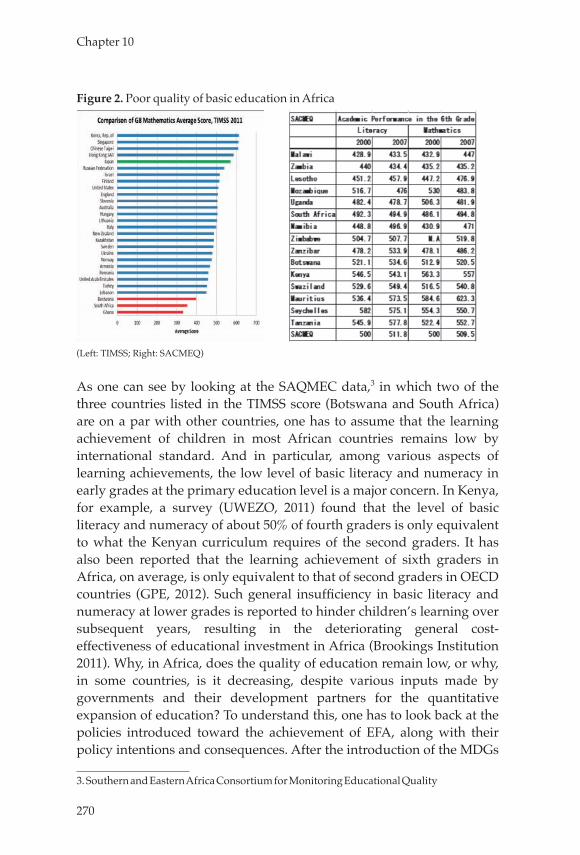
270
Chapter 10
Figure 2. Poor quality of basic education in Africa
(Left: TIMSS; Right: SACMEQ)
As one can see by looking at the SAQMEC data,3 in which two of the three countries listed in the TIMSS score (Botswana and South Africa) are on a par with other countries, one has to assume that the learning achievement of children in most African countries remains low by international standard. And in particular, among various aspects of learning achievements, the low level of basic literacy and numeracy in early grades at the primary education level is a major concern. In Kenya, for example, a survey (UWEZO, 2011) found that the level of basic literacy and numeracy of about 50% of fourth graders is only equivalent to what the Kenyan curriculum requires of the second graders. It has also been reported that the learning achievement of sixth graders in Africa, on average, is only equivalent to that of second graders in OECD countries (GPE, 2012). Such general insufficiency in basic literacy and numeracy at lower grades is reported to hinder children’s learning over subsequent years, resulting in the deteriorating general cost-effectiveness of educational investment in Africa (Brookings Institution 2011). Why, in Africa, does the quality of education remain low, or why, in some countries, is it decreasing, despite various inputs made by governments and their development partners for the quantitative expansion of education? To understand this, one has to look back at the policies introduced toward the achievement of EFA, along with their policy intentions and consequences. After the introduction of the MDGs
3. Southern and Eastern Africa Consortium for Monitoring Educational Quality
271
Challenges in Educational Development in Africa and JICA’s Approach
and the World Conference on EFA, Dakar, Senegal, both in 2000, universal primary education aiming at 100% enrollment and completion became the top priority for education policy in many countries; the governments were subsequently requested to work out their educational sector plans to clarify specific courses of action for the realization of these goals.
However, mostly African countries could not provide the quality learning environment (schools, teachers, teaching and learning materials etc.) to cope with the rapid expansion of access in basic education. This may have led to the deterioration of the quality of education during that era. This was observed even in those countries that participated in the EFA/Fast Track Initiative (FTI).4 The FTI was established in 2002 as a multi-donor fund for the purpose of providing financial and technical support for the planning process of these sector plans and to fill in the financing gap between the education sector resource requirement and the domestically available education budget. “The indicative framework” which FTI presented was referred to in the process of sector plan formulation by respective countries. They were benchmark figures such as the following: “Education share of budget defined as public recurrent spending on education as % of total public recurrent discretionary spending is approximately 20%,” “Primary education share of education budget is approximately 50%,” “Recurrent spending on items other than teacher remuneration as % of total recurrent spending on primary education is 33%,” “Average annual salary of primary school teachers divided by GDP per capita is 3.5”,5 “Pupil–teacher ratio in publicly-financed primary schools is 40 to 1,” and an “Percentage of repeaters among primary school pupils is less than 10%.”
However, many of the sector plans thus formulated did not necessarily turn out to be realistic in the context of each country; they tended to be over-ambitious given the insufficient capacities of understaffed education administration both at central and local levels, and the low capabilities of and insufficient incentives for teachers/staff on the ground. Thus, many problems arose such as delays in executing education budgets and in the supply of educational materials to schools. 4. Of the 45 countries involved in the FTI’s support for educational sector planning and application for necessary funds, 28 of these countries are in Africa. Therefore, more than half of the countries within Africa are participating in the FTI. EFA/FTI has turned to be the Global Partnership for Education since 2011.5. In Bruns et al. (2003), sample data for this indicator ranges from 0.6 to 9.6.
272
Chapter 10
Apart from these constraints, the shortage of additional financing made available was also among obstacles that prevented the expected progress. As a result, adequate facilities and materials were not made available to schools and students, both of whose number increased rapidly as a result of the free primary education policies. All this resulted in a deterioration of the learning environment (Cambridge Education, et al. 2009).
This hasty application of the indicative framework of FTI to the education sector plans without deliberate consideration of the country context could have been one factor that inadvertently brought the deterioration of the quality of teachers. This happened because many countries quickly increased the number of teachers to live up to the indicative pupil-teacher ratio and other indicators of the FTI: teacher salaries were lowered, more teachers were employed on a term-contract basis on lower salaries, teachers’ training periods were shortened, and enrollment requirements for teacher training programs were lowered in order to rapidly increase the number of licensed teachers (Aidan 2010, TISSA 2007). It is not only in the FTI participating countries but other non-FTI participating African countries as well that the deterioration of the quality of teachers occurred. Thus, it is worthwhile to further examine what education policies has been introduced and what were their consequences in such non-FTI participating countries.
It is also reported that the sudden increase of teachers with lesser qualifications has resulted in the deterioration of the social status and reputation that teachers used to enjoy among community residents and parents (Felix 2005). It appears that teachers’ dissatisfaction with their salaries and benefits have actually lowered their motivation, thus resulting in poor service delivery typically indicated by a high absentee rate and limited teaching time. These problems were actually predicted; as early as 2003 in the World Bank report (Bruns et al. 2003), which served as a theoretical background paper for the FTI’s indicative framework.
These developments, resulting in the deterioration in the learning environment (lack of school facilities, textbooks, and teaching materials), the poor quality of teachers and their services, are behind the poor learning performance of children, even with increased access. In addition to these policies, many countries have attempted to promote
273
Challenges in Educational Development in Africa and JICA’s Approach
the decentralization of their educational management aiming to improve the efficiency of administration and finance in education; it was also expected that decentralization would enhance the accountability of education to parents and community residents, thereby improving the quality of service delivery. As part of the policy, governments established what are called “school management committees” mainly comprising headteachers/teachers, parents, local community members and local government officers (local government or local branch of Ministry of Education), with the expectation of increased local participation in education and hence increased efficiency in school management.
Oftentimes, however, the school management committees have not been functioning as expected due to the government’s inability to provide sufficient budget allocation, clear delineation of the functions and mandates of the committees, and the insufficient ability of the school committee members. As such, and for other reasons as well, many schools supported by the school management committees ended up with inadequate facilities and teaching staff, failing to provide the education needed by children and their parents, who eventually lost interest in supporting such poorly performing schools. Thus, not receiving appropriate support from either the government or from the community, the quality of education at such schools eroded.It is as a result of these inadequate policy developments that Africa’s current level of educational quality remains sub-optimal. Many indicators point to the need for further efforts: a high dropout rate (30%), high repetition rate (15%), and low completion rate in primary education (67%) (compared to the world average of 2.5% (2010), 9.1% (2009) and 91% (2010), respectively). Continuous efforts to solve these problems are needed.
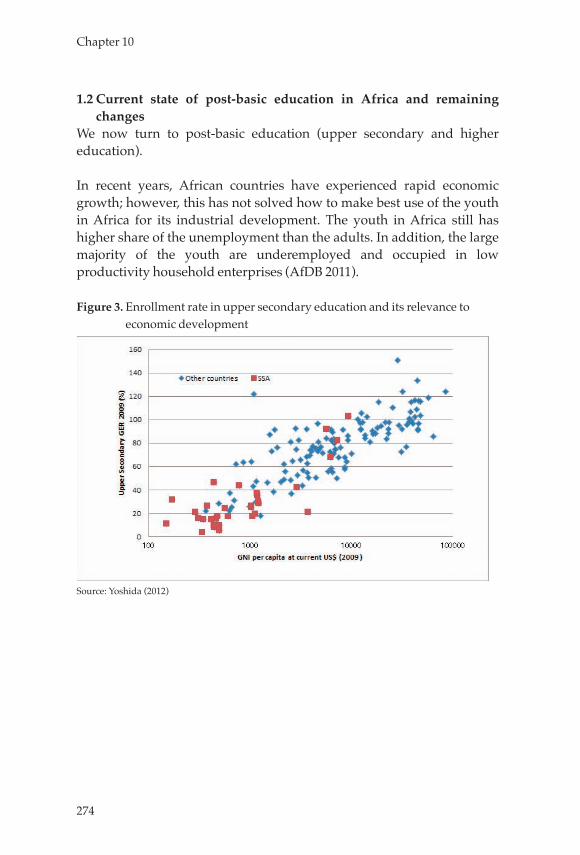
274
Chapter 10
1.2 Current state of post-basic education in Africa and remaining changes
We now turn to post-basic education (upper secondary and higher education).
In recent years, African countries have experienced rapid economic growth; however, this has not solved how to make best use of the youth in Africa for its industrial development. The youth in Africa still has higher share of the unemployment than the adults. In addition, the large majority of the youth are underemployed and occupied in low productivity household enterprises (AfDB 2011).
Figure 3. Enrollment rate in upper secondary education and its relevance to economic development
Source: Yoshida (2012)
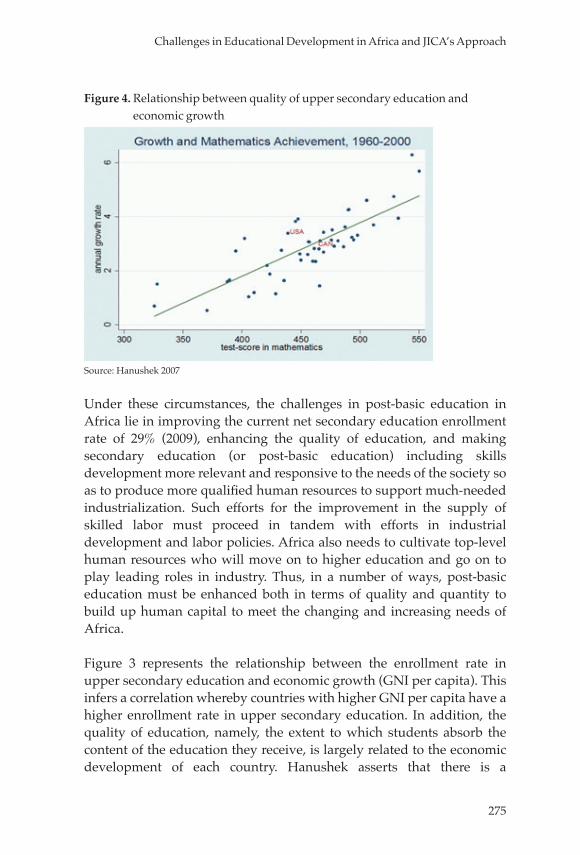
275
Challenges in Educational Development in Africa and JICA’s Approach
Figure 4. Relationship between quality of upper secondary education and economic growth
Source: Hanushek 2007
Under these circumstances, the challenges in post-basic education in Africa lie in improving the current net secondary education enrollment rate of 29% (2009), enhancing the quality of education, and making secondary education (or post-basic education) including skills development more relevant and responsive to the needs of the society so as to produce more qualified human resources to support much-needed industrialization. Such efforts for the improvement in the supply of skilled labor must proceed in tandem with efforts in industrial development and labor policies. Africa also needs to cultivate top-level human resources who will move on to higher education and go on to play leading roles in industry. Thus, in a number of ways, post-basic education must be enhanced both in terms of quality and quantity to build up human capital to meet the changing and increasing needs of Africa.
Figure 3 represents the relationship between the enrollment rate in upper secondary education and economic growth (GNI per capita). This infers a correlation whereby countries with higher GNI per capita have a higher enrollment rate in upper secondary education. In addition, the quality of education, namely, the extent to which students absorb the content of the education they receive, is largely related to the economic development of each country. Hanushek asserts that there is a
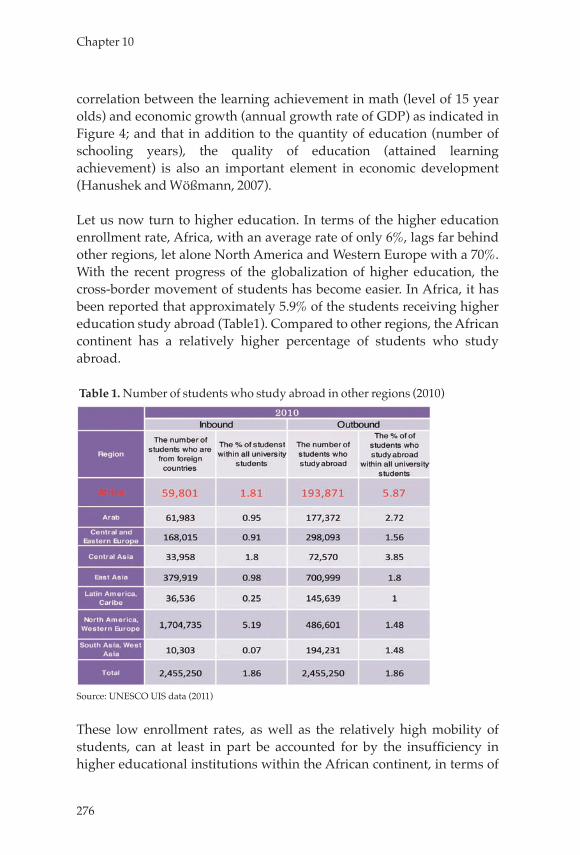
276
Chapter 10
correlation between the learning achievement in math (level of 15 year olds) and economic growth (annual growth rate of GDP) as indicated in Figure 4; and that in addition to the quantity of education (number of schooling years), the quality of education (attained learning achievement) is also an important element in economic development (Hanushek and Wößmann, 2007).
Let us now turn to higher education. In terms of the higher education enrollment rate, Africa, with an average rate of only 6%, lags far behind other regions, let alone North America and Western Europe with a 70%. With the recent progress of the globalization of higher education, the cross-border movement of students has become easier. In Africa, it has been reported that approximately 5.9% of the students receiving higher education study abroad (Table1). Compared to other regions, the African continent has a relatively higher percentage of students who study abroad.
Table 1. Number of students who study abroad in other regions (2010)
Source: UNESCO UIS data (2011)
These low enrollment rates, as well as the relatively high mobility of students, can at least in part be accounted for by the insufficiency in higher educational institutions within the African continent, in terms of
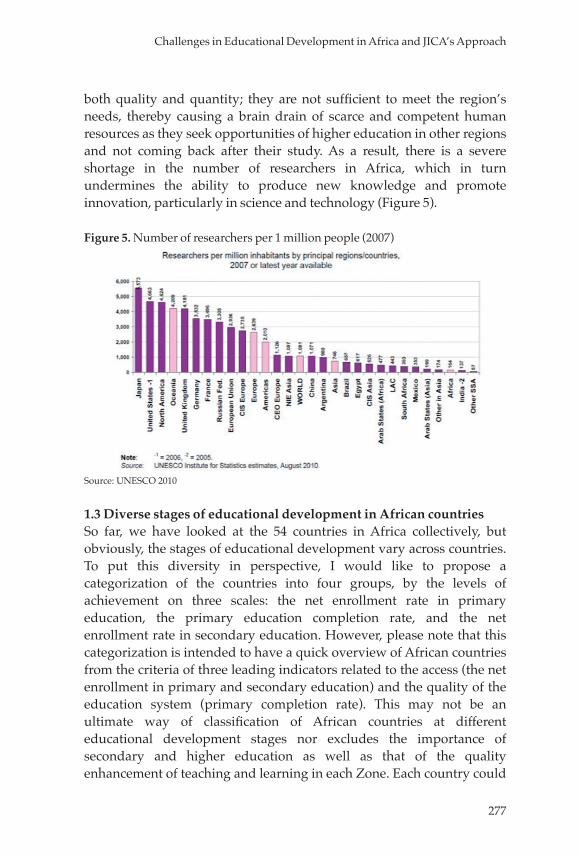
277
Challenges in Educational Development in Africa and JICA’s Approach
both quality and quantity; they are not sufficient to meet the region’s needs, thereby causing a brain drain of scarce and competent human resources as they seek opportunities of higher education in other regions and not coming back after their study. As a result, there is a severe shortage in the number of researchers in Africa, which in turn undermines the ability to produce new knowledge and promote innovation, particularly in science and technology (Figure 5).
Figure 5. Number of researchers per 1 million people (2007)
Source: UNESCO 2010
1.3 Diverse stages of educational development in African countriesSo far, we have looked at the 54 countries in Africa collectively, but obviously, the stages of educational development vary across countries. To put this diversity in perspective, I would like to propose a categorization of the countries into four groups, by the levels of achievement on three scales: the net enrollment rate in primary education, the primary education completion rate, and the net enrollment rate in secondary education. However, please note that this categorization is intended to have a quick overview of African countries from the criteria of three leading indicators related to the access (the net enrollment in primary and secondary education) and the quality of the education system (primary completion rate). This may not be an ultimate way of classification of African countries at different educational development stages nor excludes the importance of secondary and higher education as well as that of the quality enhancement of teaching and learning in each Zone. Each country could
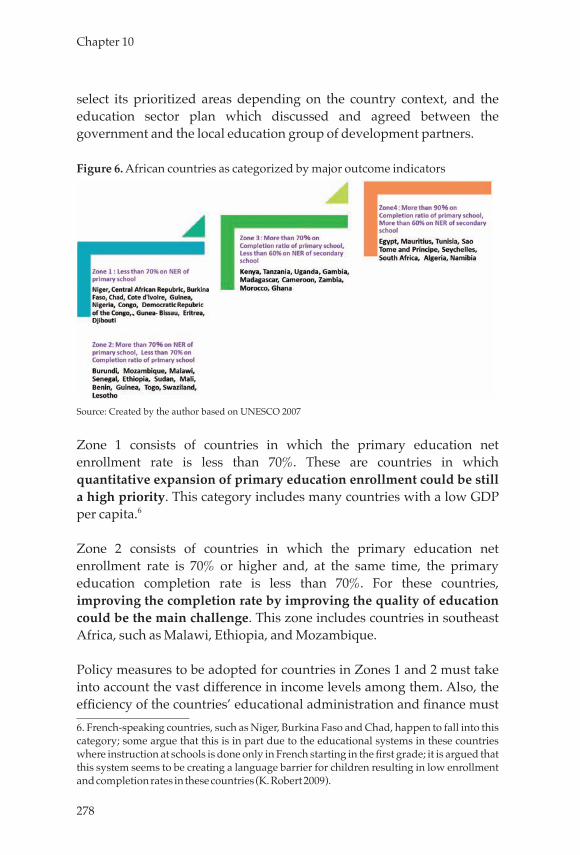
278
Chapter 10
select its prioritized areas depending on the country context, and the education sector plan which discussed and agreed between the government and the local education group of development partners.
Figure 6. African countries as categorized by major outcome indicators
Source: Created by the author based on UNESCO 2007
Zone 1 consists of countries in which the primary education net enrollment rate is less than 70%. These are countries in which quantitative expansion of primary education enrollment could be still a high priority. This category includes many countries with a low GDP per capita.6
Zone 2 consists of countries in which the primary education net enrollment rate is 70% or higher and, at the same time, the primary education completion rate is less than 70%. For these countries, improving the completion rate by improving the quality of education could be the main challenge. This zone includes countries in southeast Africa, such as Malawi, Ethiopia, and Mozambique.
Policy measures to be adopted for countries in Zones 1 and 2 must take into account the vast difference in income levels among them. Also, the efficiency of the countries’ educational administration and finance must 6. French-speaking countries, such as Niger, Burkina Faso and Chad, happen to fall into this category; some argue that this is in part due to the educational systems in these countries where instruction at schools is done only in French starting in the first grade; it is argued that this system seems to be creating a language barrier for children resulting in low enrollment and completion rates in these countries (K. Robert 2009).
279
Challenges in Educational Development in Africa and JICA’s Approach
be looked at; countries at similar income levels and all with a fairly reasonable level of public expenditure in education can sometimes display considerably different achievement results in the primary enrollment rate.
Zones 1 and 2 also include post-conflict countries such as the Democratic Republic of the Congo and South Sudan; policy measures in these countries must be designed and implemented with careful attention being paid to the history and other social, cultural and economic backgrounds.
Zone 3 includes countries with a primary education completion rate of 70% or higher, but in which the net enrollment rate in secondary education is less than 60%. This zone represents countries in which improving the enrollment rate in secondary education could be made a priority, and includes countries that are more socially and economically stable than those in Zones 1 and 2, such as Kenya, Tanzania, Uganda and Ghana.
Zone 4 includes countries in which most people have completed secondary education, and in which enrollment in higher education has been achieved to a certain extent; this zone includes the Maghreb countries in northern Africa, South Africa and Namibia. In these countries, industries are diversified and economic structures have been developed to some extent; the enrollment rates in primary and secondary education have been improved to some extent, and the focus has shifted to enhancing higher education.
In summary, countries in different categories have different development challenges, and even among the countries that are categorized as being at similar developmental levels, specific challenges differ from country to country. African governments and their development partners must be flexible in devising development/support measures taking into consideration the stages of educational development and their local context in each country.
1.4 Future global agenda for educational development in AfricaOne of the main issues in debates on educational development toward the MDG target year of 2015 and beyond is how to achieve “Learning for All,” a concept that calls for the assurance of the quality of learning not
280
Chapter 10
limited to the primary education level, but at all levels from pre-primary up to post basic education. This would be a concept that goes beyond the much used interpretation of “Education for All” concept, which is mainly aimed at universal primary education. More specifically, there are three main arguments about “Learning for All” : (1) providing education for children in rural areas, female students, disabled children, and ethnic minorities without disparity, encouraging out-of-school children to attend school and enhancing the quality of learning; (2) making early child development (ECD) interventions as well as early grade learning at lower primary school grades (including ensuring the learning achievement of children in early-grade literacy and numeracy); and (3) improving education linked to the employment and the cultivation of human resources (human resources and researchers who are engaged in science and technology).
Africa needs to pursue these agendas while continuing its steady efforts to address the challenges that we saw earlier. Specifically, efforts must continue for the improvement in the completion rate in primary education and the resultant increase in the enrollment into secondary education, which, in itself, needs to be expanded with the construction of schools and enhancement both in the quantity and quality of teachers. For the mainstreaming of Learning for All in Africa, various development partners have been already actively working.
In their support toward achieving Learning for All, many development partners seem to place strong emphasis on policy making by mobilizing budget support, including lending, with policy recommendations. One example is an initiative by the World Bank. As part of its new strategy (Education Strategy 2020), the World Bank is starting an initiative including the construction of a policy benchmarking database called SABER (the Systems Approach for Better Education Results). The idea behind the initiative is the emphasis on the importance of systematic support in informed policy making that is supported by the analysis and understanding of what policies are needed to produce the expected policy outcomes (such as improvement in enrollment rate, completion rate, and learning achievement) using inputs (such as schools, training of teachers, etc.). Another example of a policy support instrument is what is called results-based financing that development partners like the World Bank and DfID of the UK are promoting. This funding mechanism requires the achievement of pre-determined policy goals by the recipient
281
Challenges in Educational Development in Africa and JICA’s Approach
developing countries as a prerequisite for the disbursement of funds. 2. JICA-supported Projects and their Comparative Advantage
Over the years, Japan has been undertaking extensive international cooperation in education. The following sections will introduce three of JICA’s approaches, which are currently being actively pursued with encouraging outcomes, especially in the African context. The first two are specific models of educational development: the first one having to do with school-based management (Section 2.1) and the second one with the improvement of the quality of education through teacher training (Section 2.2). Following that, Section 2.3 will introduce JICA’s attempt to link the experiences on the ground and policy making at the central level.
2.1 Improvement of school management for a better educational environment
At the center of measures for improving access to education has been the construction of more schools. However, recently, in addition to the physical aspect of access, the significance of educational management has been highlighted as a key area of intervention. Educational management includes, at the central level, formulating a policy framework, securing appropriate budget allocation, improving administrative and fiscal capacities (budget preparation and execution), and information systems development such as EMIS (Education Management Information Systems). At the local level, interventions include transfer of authority over personnel and budgetary issues to local educational administrative bodies as part of decentralization policies, improving administrative and fiscal capacities (budget preparation and execution), and improvement of school management.
Among these, one approach that is receiving increasing attention in recent years is school-based management (SBM); SBM basically aims at enhancing the efficiency and quality of school management by holding individual schools more accountable through facilitating parents/community members’ participation in school management. As a vehicle to encourage participatory school management, the school management committee is set up, comprising of pupils’ parents, community members as well as school principals, teachers and local education administrators. Originating in World Bank projects in Latin America – projects with encouraging outcomes – this SBM has come to be widely practiced in
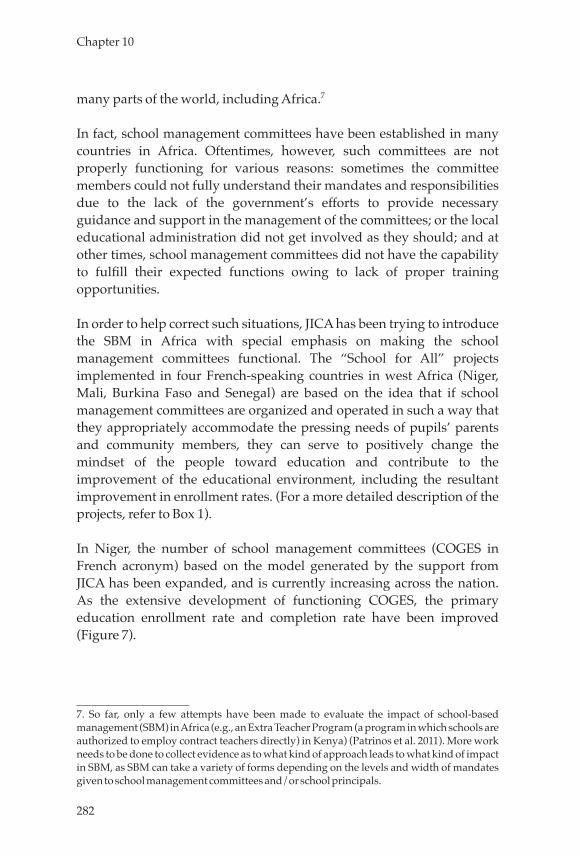
282
Chapter 10
many parts of the world, including Africa.7
In fact, school management committees have been established in many countries in Africa. Oftentimes, however, such committees are not properly functioning for various reasons: sometimes the committee members could not fully understand their mandates and responsibilities due to the lack of the government’s efforts to provide necessary guidance and support in the management of the committees; or the local educational administration did not get involved as they should; and at other times, school management committees did not have the capability to fulfill their expected functions owing to lack of proper training opportunities.
In order to help correct such situations, JICA has been trying to introduce the SBM in Africa with special emphasis on making the school management committees functional. The “School for All” projects implemented in four French-speaking countries in west Africa (Niger, Mali, Burkina Faso and Senegal) are based on the idea that if school management committees are organized and operated in such a way that they appropriately accommodate the pressing needs of pupils’ parents and community members, they can serve to positively change the mindset of the people toward education and contribute to the improvement of the educational environment, including the resultant improvement in enrollment rates. (For a more detailed description of the projects, refer to Box 1).
In Niger, the number of school management committees (COGES in French acronym) based on the model generated by the support from JICA has been expanded, and is currently increasing across the nation. As the extensive development of functioning COGES, the primary education enrollment rate and completion rate have been improved (Figure 7).
7. So far, only a few attempts have been made to evaluate the impact of school-based management (SBM) in Africa (e.g., an Extra Teacher Program (a program in which schools are authorized to employ contract teachers directly) in Kenya) (Patrinos et al. 2011). More work needs to be done to collect evidence as to what kind of approach leads to what kind of impact in SBM, as SBM can take a variety of forms depending on the levels and width of mandates given to school management committees and/or school principals.
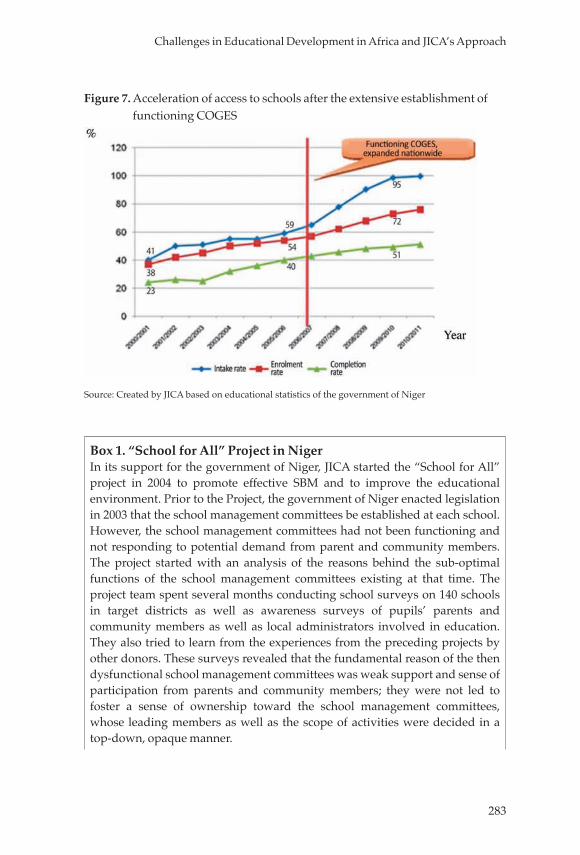
283
Challenges in Educational Development in Africa and JICA’s Approach
Figure 7. Acceleration of access to schools after the extensive establishment of functioning COGES
Source: Created by JICA based on educational statistics of the government of Niger
Box 1. “School for All” Project in NigerIn its support for the government of Niger, JICA started the “School for All” project in 2004 to promote effective SBM and to improve the educational environment. Prior to the Project, the government of Niger enacted legislation in 2003 that the school management committees be established at each school. However, the school management committees had not been functioning and not responding to potential demand from parent and community members. The project started with an analysis of the reasons behind the sub-optimal functions of the school management committees existing at that time. The project team spent several months conducting school surveys on 140 schools in target districts as well as awareness surveys of pupils’ parents and community members as well as local administrators involved in education. They also tried to learn from the experiences from the preceding projects by other donors. These surveys revealed that the fundamental reason of the then dysfunctional school management committees was weak support and sense of participation from parents and community members; they were not led to foster a sense of ownership toward the school management committees, whose leading members as well as the scope of activities were decided in a top-down, opaque manner.
284
Chapter 10
Thus, based on the discussions between the Nigerien and Japanese project members, it was agreed to incorporate into the project the following activities to make school management committees more functional: (1) Introduction of the system of democratic ballot-type election of leaders to make the selection process more transparent and democratic; this was deemed necessary to make sure that competent leaders with full support from the community are elected; (2) Implementation of awareness- and motivation-enhancing activities; this was done, for example, by organizing seminars on the necessity of participating in decision making through attending community assembly meetings; and by encouraging parents and community members to work out school action plans and making contributions to their implementation (either through monetary contributions or otherwise), stressing that all the project activities are just to supplement their own initiatives; (3) Nigerien-led project management and implementation; this was stressed as critically important not only in view of the strengthening of Nigeriens’ capacity, but also, and more importantly, to allow the Nigerien side to nurture the sense of true ownership of the whole activity as an endeavor they have to shoulder. Practically, the project made sure that major project activities, such as the organization of seminars and monitoring, were led and/or conducted by the Nigerien project members and administrators without depending on expatriate experts;. (4) Transparent information sharing; documents and information such as school action plans prepared by different school management committees were made open for transparent information sharing and mutual learning.
This cooperation expanded in scale and advanced in status over time; it started, in 2004, with approximately 130 targeted primary schools in a pilot province and then expanded the coverage to 2,800 schools in two provinces in 2007. In that year, the model for the school management committees developed by this project was officially approved as a government policy and was subsequently expanded on a national scale using World Bank funds. As of August 2012, school management committees have been established in all of the approximately 14,000 primary schools in eight provinces throughout the country, and of these committees, nearly 90% have formulated school action plans and mobilized funds of 155,000 F CFA per committee (2 billion F CFA nationwide) (source: JICA-supported School for All project in Niger). They are contributing to the improvement of school environments by mobilizing funds and local labor, which are used for school facility improvement, and the purchase of textbooks and teaching materials.
285
Challenges in Educational Development in Africa and JICA’s Approach
Trials to improve the quality of education or the conducive conditions that are necessary for quality improvement have also taken place. Over 60% of the committees are also involved in the organization of extra and nighttime classes to allow pupils to have additional learning time, resulting in an increase of 200 hours of learning time on average. This achievement can be significant in view of the fact in Niger where, while regulations demand 960 hours of instruction per year, many schools had ended up satisfying only 50 to 60% of that requirement.
2.2 Strengthening teacher education for improving quality of students’ learning
The second approach that JICA has been promoting in Africa is the improvement of the quality of education, attempted through enhancement of in-service teacher training (INSET).
As has been repeatedly pointed out throughout this chapter, improving the quality of education in Africa is as important as its quantitative expansion, as the poor quality of education (or learning by children) is one of the major factors causing high dropout and repetition rates in primary and secondary education in Africa.
The quality of an education system can be affected by many factors: the curriculum (objectives, content, sequence, etc.), quality and availability of textbooks and teaching materials, and the amount of learning time. And equally, or perhaps even more important, is the quality of teachers, which is considered as having a major impact on the quality of teaching and students’ learning outcome. The quality of teachers depends on a number of factors: first, for securing the basic quality of teachers, there must be a clear definition and standardization of what is required of teachers in the first place, according to which qualified candidates must be recruited and trained before they start working. Second, in school and classrooms, teachers must be guided appropriately by the leadership from the school’s principals, monitored for their performance and, when necessary, assisted and mentored. They must be appropriately motivated and incentivized in terms of salaries and benefits, and also must be given opportunities to improve their teaching skills.
JICA’s approach has to do with the last approach listed above, i.e., the support for teachers in maintaining and upgrading their knowledge and teaching skills through the development of in-service teacher training
286
Chapter 10
systems. JICA’s flagship project in improving the teachers’ quality is the SMASE project, which is short for the “Strengthening of Mathematics and Science Education.” The project is premised on two conceptual thrusts.
The first is the idea that science and math education in Africa must be upgraded by introducing a student-centered approach to the lessons in the classrooms. In science and math classrooms in Africa, typically, teachers rarely undertake experiments or use teaching materials; instead, they write on blackboards and talk “at” their students, while the students simply listen and take notes. This way of conducting classes, often called “Chalk & Talk,” is common. Taught this way, students tend to develop a passive attitude in class without any willingness to engage with other students or think on their own. This passive learning attitude of students has often led to low achievements in knowledge acquisition in or understanding of the subjects taught. Based on this observation JICA has recognized the need to transform the teaching style of teachers in such a way that students are encouraged to participate in group activities, create hypotheses, do experiments, and to think on their own; here the teacher’s role is to support the students to learn.
The second premise of the project is the idea that INSET could be an effective opportunity through which teachers can be motivated to brush up their knowledge and skills. One advantage of INSET programs is that training participants – teachers – can apply what they learn in training to their classes, easily, and immediately (For more details, see Box 2). The need for the strengthening of math and science education was judged as of particular importance because they are generally believed to be difficult subjects to learn, and in fact students perform poorly in these subjects, as demonstrated by the low pass rate in national exams.
Finally, collaboration with other development partners are taking place under the education sector plans in each country. For instance, in Ethiopia, JICA-supported in-service teacher training for science and mathematics teachers project is in well-coordinated partnership with the GEQIP program, which is a comprehensive quality improvement program of the Ethiopian government using pool-fund financed by the World Bank and other development partners. While JICA provides technical expertise for the INSET implementation and monitoring system as well as the training content in pilot areas, the GEQIP program
287
Challenges in Educational Development in Africa and JICA’s Approach
covers other non-pilot areas supporting the expenses of the INSET implementation and its monitoring.
Box 2. Approaches toward the improvement of the quality of education in science and math education (SMASE)8
JICA’s development model for the improvement of the quality of science and math education (SMASE) focuses on the development of INSET programs and systems. The exercise is premised on three key components. The first is the education principle commonly called “ASEI-PDSI.”9 Developed originally in Kenya, ASEI-PDSI is an educational paradigm that has guided the project’s activities to transform the traditional teacher-centered teaching method into a more student-centered, activity-oriented teaching/learning method. The second component was in-service teacher training known as the cascade method; this is a method whereby knowledge and teaching skills can be conveyed, through multiple-layer training programs, from the master trainers at the center to individual teachers on the ground in a relatively short period of time. And thirdly, the project placed strong emphasis on ownership by the recipient governments; the project made sure that its activities were implemented within the existing institutional framework and budget of the government, without excessively relying on funding from external sources.
Guided by these concepts and management principle, the activities that originated in Kenya have been expanded to other African countries, while flexibly adapting its project contents to the circumstances in each country (as of November 2012, SMASE projects are implemented in 13 countries).
Whenever a SMASE project gets started in a country, the project activities would start with a thorough check and analysis of the actual situation, needs of teachers and issues in schools through visits to schools/classrooms and baseline surveys on children’s learning achievements. Based on these analyses, the project team would then proceed to plan and implement teachers’ training programs with a number of trials and errors. The ultimate goal is to create sustainable in-service teacher-training programs that would be planned, operated, and monitored by local professionals.
8. For details of the project, see, Ogwel et al (2008), and Ishihara (2012).9. ASEI-PDSI is explained as a guiding principle of the SMASE projects that “involves providing meaningful teaching Activities focused on Student learning mainly Experimental/practical work and Improvising resources when necessary. The PDSI approach embraces orderly steps of executing learning activity by first Planning for the activity, then Doing it while Seeing, observing with intent to evaluate and then finally Improvising on the process.” (Ogwel et al. 2008)
288
Chapter 10
Over the years, the SMASE projects have increased the variety of the kinds of training programs to meet various and/or changing needs of different schools and teachers and countries. One was a system of post-training follow-up school visits, introduced not only to verify the usefulness of the contents of the training programs but also to help the ex-training participants to best apply their newly learned knowledge and skills in their class. Also introduced were school-based teacher training programs (lesson study) and regional training programs to complement the main cascade training. JICA has supported the establishment of cascade teacher training programs in Kenya, Malawi, Nigeria, and many other countries. Content-wise, the projects have been supporting the introduction of various materials such as reference books for teachers and workbooks for students in addition to ASEI-PSDI training programs.
Thus, SMASE projects have been instrumental in supporting African governments in developing a wide range of alternatives for the upgrading of science and math teachers. Overall, these activities can be said to have contributed, at the macro level, to the establishment of a country’s system of continuous professional development and, at the micro level, to the development of capabilities of a countless number of teachers who have been enabled to guide their pupils with their newly acquired teaching methods and skills.
Looking back at what JICA has been doing, it appears that one of JICA’s comparative advantages in international cooperation in education may reside in its ample body of experiences and practical knowhow that it can offer for use and consideration by governments and the international community for policy formulation.10 The importance of science and math education is widely shared among the governments and their partners.11 Capitalizing on its experience in this field, JICA is prepared to further strengthen its cooperation for the development of science and math education in Africa. It is prepared to strengthen its contribution both in practice on the ground and for national-level policy formulation, fully utilizing the already established network for
10. In a report on mathematics and science education in the East African Community (EAC) countries (World Bank, 2011), JICA is referred to as an agency that enhances teachers’ pedagogical capabilities.11. The World Bank and African Development Bank regard mathematics and science education as being essential to sustainable economic growth that utilizes science and technology.
289
Challenges in Educational Development in Africa and JICA’s Approach
mathematics and science education in Africa (SMASE-Africa12), now covering 34 countries.
2.3 JICA’s approaches that link policy and practiceDifferent actors in international cooperation have different comparative advantages and business domains. Some primarily work on the ground implementing specific projects and programs, and others concentrate on advocacy and policy making. While not many seem to be involved in both, JICA is one of such development partners trying to cover both domains of support for policy making and practice on the ground. Over the years, JICA has developed its cooperation strategy comprising three components: (1) model and content building, (2) capacity development of stakeholders, and, (3) support for informed policy making.
The first component, model and content building, refers to the activities through which models of educational development and educational contents are developed, tested on the ground and proven for their effectiveness. The typical examples of the first component are the functional school management committee, the in-service teacher training, and the teaching methods for student-centered lessons; these have been proven to yield maximum benefits on the ground in different local contexts. The second component, capacity development of stakeholders, refers to the activities geared to the capacity development of educational administrative officers, national and local trainers, principals, teachers, and school management committees, and many others, who are both developers as well as users of the above-mentioned models and contents. And the third component, support for informed policy making, refers to the activities leading to policy making and systems development on a larger scale needed to scale up and institutionalize the good practices on the ground.
Obviously, education policies are introduced, for example, to determine a certain course of action to achieve a certain pre-determined outcome, such as improving the quality of learning and the primary education completion rate. Oftentimes in Africa, however, policies such as sector development plans tend to be disconnected with the reality on the ground, in terms of the goals, objectives, and available resources without
12. SMASE-Africa is working as a network of 34 countries in Africa to share knowledge and experience and conduct south-south cooperation for science and mathematics education among the member countries.
290
Chapter 10
taking into account stakeholders’ capacity. As a result, many policies end up facing problematic outcomes.
To narrow this gap between policy and practice, it is imperative to understand the reality on the ground and rigorously analyze the causes and contexts of the issues. Then it is critical to identify the potential gaps between what the policymakers’ understand/believe/envision and what is actually happening or will likely happen on the ground after the adoption of the policy. For this gap-filling, careful surveys and research must be conducted, and to supplement them, additional information obtained through the implementation of actual projects could be enormously useful. As a development partner with hands-on experience of project implementation, JICA could be in the position to transform an ample body of tacit and non-tacit knowledge of the reality on the ground to best practices and knowledge which could help the policymakers to make informed decisions. This is the notion which JICA should pay more serious attention to in terms of the global policy dialogues among international community as well as local education groups in each country.
There are already several cases where national level policies have been formulated, supported or substantiated by knowledge accumulated on the ground: in Niger and Mali, for example, the JICA-supported model of school management committees was tested on the ground and came to be proven effective and applicable in the context of the two countries; the models were subsequently adopted as a national policy and have been expanded nationwide.
Concurrently, efforts are underway to distill these experiences further into the formulation of policy frameworks. As part of such effort, JICA is collaborating with the World Bank’s SABER furnishing the latter with the information on the ground related to SBM, indicating the gap between policies and practices, and presenting evidence on a workable model at the school level. These exercises could lead to the development of various policy tools, such as a set of indicators with which to measure the real impacts or interim outcomes of various actions, including systems reform by the government; if developed, these indicators could be used as disbursement indicators in result-based financing.
291
Challenges in Educational Development in Africa and JICA’s Approach
3.Towards TICAD V and beyond
The preparatory process for the TICAD V is in progress. While the challenges are enormous and varied across countries and regions, the conference must come up with clear, prioritized policy messages focused on a set of agendas according to which African governments and their partners can make concerted efforts toward their achievement. In the author’s view, the outcome document of the conference, Yokohama Action Plan, must highlight the following as the two pillars of the policy message: (1) scaling up of quality basic education, and (2) strengthening education that contributes to sustainable growth.
The first pillar, scaling up of quality basic education, demands full enrollment in basic education as well as the improvement in the completion rate in basic education, particularly primary education; this goal is to be achieved through the improvement of the quality of basic education, the increase in secondary education enrollment with expanded school facilities, and the provision of quality secondary education so that students can acquire advanced knowledge and practical skills for higher education or employment. The policy message should also pay due consideration to equity in terms of urban-rural, gender, and income disparities.
The second pillar, strengthening education that contributes to sustainable growth, demands that quality secondary education, and particularly that in mathematics and science, be expanded on the top of solid basic education. Added to this, higher education must also be expanded to foster, particularly, human resources in science and engineering. Technical and vocational education must also be strengthened to provide opportunities to learn skills leading to higher employability of the working-age population.
JICA is prepared to contribute to the concerted efforts of the African governments and the international community, and take measures as shown below, which are combinations of the business models shown above and other models and/or modes of cooperation that JICA has at its disposal.
292
Chapter 10
For the first pillar: scaling up of quality basic education
◆ Enhancing support for “School for All” ProjectJICA will continue to expand the model developed in the “School for All” project. Here, with the project model, functional school management committees accompanied by strong parent/community participation, transparent election of its representatives, and mutual learning among school management committees , and continuous monitoring by local education administrators, JICA could proceed its expansion in the following manner:, (1) scaling up from the pilot activities to a nationwide operation, and (2) further improving the quality of learning (i.e., securing extra learning time, introducing supplementary teaching materials to ensure basic numeracy) in countries where the project is already implemented. And, of course, the expansion of the model can entail (3) starting projects in new partner countries. JICA is of the view that the models developed in the School for All projects have been proven effective in bringing benefits for those who are in rural and disadvantaged areas, thus can contribute to the policy message to be agreed on in TICAD V.
◆ Construction of school facilities and teacher training institutions JICA will continue its support of the construction of schools, while fully taking into account the demand/supply of qualified teachers, and the need for reducing urban-rural, income, and gender disparities. For example, providing girls’ toilets in schools is very important to reduce gender disparity in education. In addition, JICA will continue its support for constructing teacher training institutions to help produce more qualified teachers. JICA is also prepared to contribute more to the policy making processes through various dialogue channels to offer recommendations on the allocation plan of qualified teachers and continuous capacity development of teachers.
For the second pillar: strengthening education that contributes to sustainable growth
◆ Strengthening teacher training (particularly in science and mathematics)
JICA will further reinforce its support for teacher training based on the achievements thus far. In so doing, JICA will continue targeting, in particular, mathematics and science subjects, as these are
293
Challenges in Educational Development in Africa and JICA’s Approach
important subjects for developing human resources for realizing sustainable growth, and yet are difficult for students to master. Toward the same goal, JICA will, in particular, make further use of its already-established network for strengthening mathematics and science education in Africa, namely SMASE-Africa, currently covering 34 countries. Using its various models and menus, JICA will support the capacity building of teachers in its partner countries. A big advantage of SMASE-Africa is that it is a network that enables South-South knowledge exchange and co-creation among participating countries, with the help of which JICA could partner with those partner countries that otherwise are not within easy reach.
◆ TICAD human development framework JICA will support sustainable growth in Africa by reinforcing cooperation in science and technology. Typical examples of support for the promotion of higher education include those for the Jomo Kenyatta University of Agriculture and Technology (JKUAT) and the Egypt-Japan University of Science and Technology (E-JUST). Backed by a consortium of Japanese universities, the projects would support the upgrading of higher education in these institutions to benefit not only the students of the two countries but also many aspiring students in the whole of the African continent. In addition, JICA will continue to maintain the provision of scholarships.
For enhancing vocational training, JICA will continue its support for related institutions, such as the ones that JICA has supported in Senegal and Uganda, which are establishing regional centers of excellence (COEs). Such COEs would play active roles in promoting intra-region study programs by receiving students from other African countries.
Differentiated approaches are needed for countries facing different challenges. As illustrated in Figure 6 in Section 1.3, African countries could be grouped into four groups. Subsequently, earlier in this section, the two important policy messages that TICAD V is likely to come up with, has been identified:(1) quality of basic, especially primary, education, and (2) the need to intensify human resources development for sustainable growth. Finally, four major approaches/interventions for educational development in Africa that JICA could intensify in the coming years have been highlighted. Needless to say,
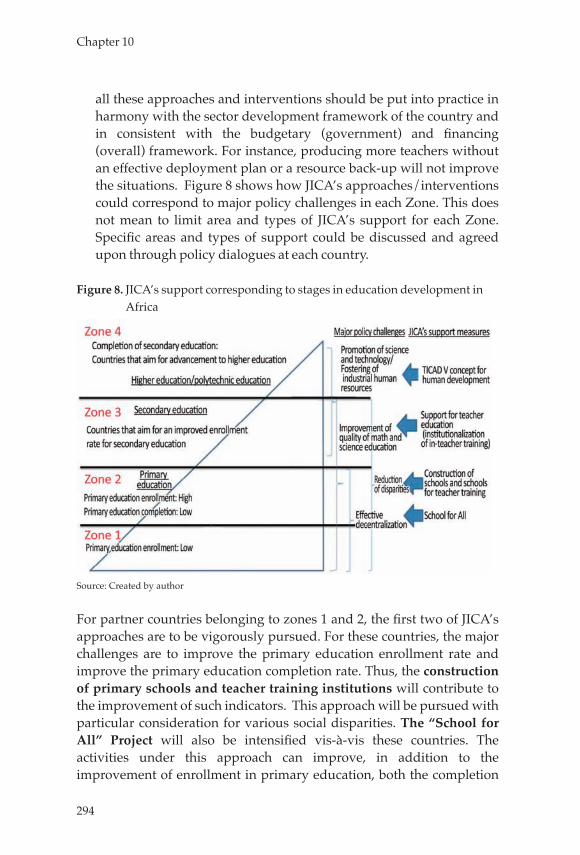
294
Chapter 10
all these approaches and interventions should be put into practice in harmony with the sector development framework of the country and in consistent with the budgetary (government) and financing (overall) framework. For instance, producing more teachers without an effective deployment plan or a resource back-up will not improve the situations. Figure 8 shows how JICA’s approaches/interventions could correspond to major policy challenges in each Zone. This does not mean to limit area and types of JICA’s support for each Zone. Specific areas and types of support could be discussed and agreed upon through policy dialogues at each country.
Figure 8. JICA’s support corresponding to stages in education development in Africa
Source: Created by author
For partner countries belonging to zones 1 and 2, the first two of JICA’s approaches are to be vigorously pursued. For these countries, the major challenges are to improve the primary education enrollment rate and improve the primary education completion rate. Thus, the construction of primary schools and teacher training institutions will contribute to the improvement of such indicators. This approach will be pursued with particular consideration for various social disparities. The “School for All” Project will also be intensified vis-à-vis these countries. The activities under this approach can improve, in addition to the improvement of enrollment in primary education, both the completion
295
Challenges in Educational Development in Africa and JICA’s Approach
rate as well as the quality of primary education. Countries in zones 1 and 2 also have to address the challenges in the secondary education level, to which strengthening teacher training must be stressed, and in particular, in science and math that can serve as a foundation for the students’ logical thinking abilities and general learning capabilities.
For countries in Zone 3, improving the enrollment rate in secondary education is a challenge, and for these countries, JICA could pursue, among others, support through the construction of school facilities and teacher training institutions, especially for secondary schools and teacher training institutions; more secondary schools are needed to accommodate an increasing number of pupils who are to complete primary education; and teacher training institutions for supplying qualified teachers to meet increasing demands. For countries in Zone 3, strengthening teacher training (particularly in science and mathematics) is important, since knowledge on science and math is a basic need for human resources for further professional training, employment and eventually for the country’s sustained growth. And finally, countries in this stage of development need to nurture human resources competent in science and technology, who will lead the country’s industrialization; hence, support for higher education and technical/vocational education will be provided through the TICAD V human development framework.
Zone 4 consists of countries that are already beyond the issues of enrollment or completion rates up to secondary education, with a significant portion of students advancing to higher or vocational education. An issue for these countries is how to develop highly qualified human resources, particularly in science and technology, by developing a system of quality higher education. For these countries, support through the TICAD V human development framework would be the main vehicle of cooperation.
In sum, JICA could furthermore commit to work in partnership under the education sector program in each country, and contribute to global policy dialogues as well as those in local education group with proactive and concrete actions and solutions, which could link between policy and practice.
296
Chapter 10
Concluding Remarks
This chapter started with an overview of the current challenges in educational development in Africa (Section 1), and then looked at some of JICA’s established models of development in education (Section 2). Combining these, the paper argued for a possible policy direction that JICA could employ in line with the policy message that would be agreed on at the TICAD V meeting (Section 3). As I see it, JICA has been active in program implementation on the ground, and also, recently, increasingly keen to contribute to policy debate at the country and international levels. Capitalizing on its comparative advantage that can link policy and practice, JICA has a lot to contribute to educational development in Africa. The challenges ahead of us are still enormous, and JICA should continue providing support for the realization of sustainable growth in Africa in partnership with a broad range of actors both from Japan and abroad.
297
Challenges in Educational Development in Africa and JICA’s Approach
References
African Development Bank (AfDB). 2011. AfDB’s human capital development strategy (2012–2016): One billion opportunities; Building human capital for inclusive growth in Africa. Draft approach paper, AfDB.
Aidan, M. 2010. Teachers in Anglophone Africa: Issues in teacher supply, training, and management. Washington, DC: World Bank.
Brookings Institution. 2011. A global compact on learning. Report prepared by the Center for Universal Education, Brookings Institution.
Bruns, B., A. Mingat, and R. Rakotomalala. 2003. Achieving universal primary education by 2015: A chance for every child. Washington, DC: World Bank.
Bruns, B., D. Filmer, and H. Patrinos. 2011. Making schools work: New evidence on accountability reforms. Washington, DC: World Bank.
Cambridge Education, et al. 2009. Mid-term evaluation of the EFA Fast Track Initiative, draft synthesis report, volume 2, annexes: Annex C; The FTI indicative framework and the UPC target. Fast Track Initiative evaluation report, contracted by the World Bank.
Felix, E. 2005. The neglected heart of educational development: Primary teacher education strategy in Malawi. Journal of Education for Teaching 31 (1): 25–36.
Global Partnership for Education. 2012. Results for learning report 2012. Washington, DC: Global Partnership for Education.
Hanushek, A., and L. Wößmann. 2007. The Role of Education Quality in Economic Growth. Policy Research Working Paper 4122, World Bank.
Ishihara, S. 2012. Network-type cooperation: Strengthening of mathematics and science education in Western, East, Central, and Southern Africa (SMASE-WECSA) Network. In Scaling up South-South and triangular cooperation, ed. H. Kato. Tokyo: JICA Research Institute.
Japan International Cooperation Agency. 2005. JICA thematic guidelines: Basic education. Tokyo: Japan International Cooperation Agency.
Kaplan, R. B. 2009. Language planning and policy in Africa, volume 2: Algeria, Cote d’Ivoire, Nigeria and Tunisia. Clevedon, UK: Multilingual Matters.
Ogwel, A., J. Odhiambo, and S. Kibe. 2008. Impact of SMASSE INSET on students’ capacity through improved teaching and learning in the
298
Chapter 10
classroom. http://www.academia.edu/ 465278/Impact_of_SMASSE_INSET_on_Students_Capacity_through_Improved_ Teaching_and_Learning_in_the_Classroom.
SACMEQ. 2005. Reports on the quality of education SACMEQ. http://www.sacmeq.org/ reports.htm (accessed in December 2012).
TTISSA. 2007. Teacher Education Policy Forum for Sub-Saharan Africa report. Report of the Teacher Education Policy Forum for Sub-Saharan Africa, UNESCO Headquarters, Paris, November 6–9.
UNESCO. 2011. EFA global monitoring report 2011. Paris: UNESCO.United Nations. 2012. Millennium development goals report 2012. New
York: United Nations.Uwezo. 2011. Uwezo Kenya 2011: Are Our Children Learning? Annual
Learning Assessment Report. Nairobi: Women Educational Researchers of Kenya.
World Bank. 2011a. Learning for all: World Bank Group Education Strategy 2020. Washington, DC: World Bank.
World Bank. 2011b. A regional exploration of pathways toward harmonization of math and science curriculum in the East African community. Discussion Paper.
Sawada, Y., and T. Ishii. 2012. Do community-managed schools facilitate social capital accumulation? Evidence from the COGES Project in Burkina-Faso. Working Paper No. 42, JICA Research Institute.
Yoshida, K. 2012. Education and skills development in the Philippines: Issues and experiences of Japan. Presentation made at the Department of Education, Manila, April 26.
Part Ⅲ: Resilience for Inclusive and Dynamic
Development

301
Chapter 11: Countermeasures against Climate Change in Africa
Tomonori Sudo
1. Introduction
Climate change is already a reality; various phenomena such as rises in global average temperature, floods and drought due to changes in precipitation, an increasing number of large-scale typhoons, hurricanes and cyclones and other extreme weather events have been observed, and, in the long run, rises in sea level caused by the melting of glaciers and ice sheets in the Antarctic, and many other serious phenomena could be realized. IPCC (2007) predicts that greenhouse gases (GHGs) will continue to increase, leading to serious climate change unless appropriate actions are taken promptly. The effects of climate change could threaten human lives, damage the social capital and the fruits of development that both advanced and developing countries have accumulated over the decades and centuries.
Developing countries are particularly vulnerable to climate change, since in addition to being adversely affected by the consequences of climate change such as torrential downpours, drought, the submerging of low-altitude areas due to a rise in sea level and so on, their physical and social capital is not sufficiently developed to adapt to climate change. African continent and other least developed countries (LDCs) and small island developing states (SIDS) are countries of particular concern for their vulnerability to climate change, as many of their inhabitants depend on the natural environment for their livelihoods, and those are already vulnerable even under the current climate conditions. Thus, climate change will introduce new risks to the Continent, in addition to current environmental and socioeconomic stressors.
On the other hand, Africa contributes the least to ongoing global warming, while advanced countries, as well as China, India, and other
302
Chapter 11
emerging countries, have attained economic growth while emitting large amounts of the GHGs that accompany industrialization.
A number of studies on the impact of climate change, mitigation and adaptation and other climate -related activities have been implemented in developing countries. Many developing countries have analyzed the risks caused by climate change and have formulated mitigation and adaptation policies, which have been submitted as National Communications to the Secretariat of the United Nations Framework Convention on Climate Change (UNFCCC) (UNFCCC 2012).
Climate change issues are also a critical development agenda, and development partners have worked to mainstream climate change issues into their development cooperation policies and strategies. The OECD has developed policy guidance to integrate climate change adaptation into development cooperation (OECD 2009). The World Bank featured climate change issues in its 2010 World Development Report (World Bank 2010), noting that although climate change is one of many issues that developing countries face, “Left unmanaged, climate change will reverse development progress and compromise the well-being of current and future generations.”(World Bank 2010: 37)
Japan has been an active player in the international community in its effort to combat climate change. In1997, the Japanese government announced a new initiative named the “Kyoto Initiatives,” advocating proactive assistance to developing countries for countermeasures against climate change. Of particular note for Africa, the Yokohama Action Plan, compiled at TICAD IV in 2008, discusses “Addressing Environmental Issues and Climate Change,” along with the need to promote measures for mitigating or adapting to climate change, water resources conservation, hygiene, and education for sustainable development (ESD).
JICA has worked to support countermeasures against climate change in Africa based on the Yokohama Action Plan, at the same time revising the “Direction of Low Carbon and Resilient Development Cooperation by JICA” (JICA 2012). JICA is offering assistance to developing countries in their countermeasures against climate change while advocating three basic policies: (1) climate compatible sustainable development; (2) comprehensive assistance utilizing an array of schemes; and (3)
303
Countermeasures against Climate Change in Africa
collaboration with development and climate partners.
Against this backdrop, this chapter discusses the challenges and the ways to address climate change in Africa. Section 2 gives an overview of the general discussion on the importance of such countermeasures; Section 3 summarizes the effects of climate change in Africa and the situation regarding GHG emissions; Sections 4 through 6 will discuss challenges and opportunities regarding climate change, respectively focusing on mitigation measures (Section 4), adaptation measures (Section 5); and on funding, technologies and market mechanisms related to countermeasures against climate change (Section 6). Finally, Section 7 proposes five recommendations for the direction of international cooperation to be pursued at TICAD V and beyond.
2. Dealing with Climate Change2.1 Impacts of climate changeDeveloping countries are highly vulnerable to natural disasters; according to a report by the Intergovernmental Panel on Climate Change (IPCC) published in 2012, over 95% of the people killed in natural disasters between 1970 and 2008 lived in developing countries. They suffer not only in terms of human causalities; the economic losses in developing countries caused by natural disasters between 2001 and 2006 were smaller than losses in developed countries in absolute terms, but were higher in low-income countries as a percentage of GDP (about 0.3%) than they were in advanced countries (below 0.1%) (IPCC 2012). As shown in Section 1, various phenomena caused by climate change will affect to the developing countries severely. Therefore, countermeasures against climate change need to include adaptation alongside with measures to mitigate exposure to the effects of climate change (mitigation). Here, “adaptation” refers to strengthening capacity (adaptive capacity) to reduce the vulnerability of people and natural systems to risks related to climate change.
2.2 Mitigation and adaptationMitigation includes introducing renewable energy, promoting energy conservation, reducing the methane gas generated from livestock waste, and increasing CO2 sequestration by afforestation, reforestation and forest conservation, and so on. However, these measures must be promoted in such a way that they do not impair the benefits of
304
Chapter 11
development. Therefore, governments need to formulate appropriate plans and strategies to balance both development policies and mitigation policies at the national and sectoral level. In addition, governments also need to establish socioeconomic systems where resources are utilized efficiently and effectively, and to promote development and deployment of low-carbon technologies that allow these plans and strategies to be realized.
Measures to deal with the effects of climate change (adaptation) include strengthening adaptive capacity against the increasing number of meteorological disasters, and infrastructure development to deal with the medium- to long-term impact of climate change. However, the impacts of climate change are influenced by such diverse factors and cannot be fully foreseen. Thus, such adaptation measures need to be considered based on the features of the regions, sectors, and communities concerned, along with nationwide measures. In order to steadily pursue adaptive measures in developing countries, the governments need to formulate National Adaptation Plans (NAPs) and other appropriate strategies and plans at the national and sector level. When formulating these plans, it is desirable to take into consideration the results of scientific analyses, such as impact assessments, backed up by scientific data. However, due to the uncertainty of the impacts of climate change, formulating policies based on a precautionary approach and a “no regrets policy” will be required, in a way that suits the development needs of developing countries.
Furthermore, the governments need to take into consideration the risk of “maladaptation” that exacerbates the vulnerability to climate change, when they design plans and projects. That is, without appropriate measures to avoid maladaptation, the adaptation plan and/or project may make the region (or other region) vulnerable further. Therefore, adaptive measures need to be examined with sufficient caution during implementation in order to prevent maladaptation, after discerning the vulnerability of the targeted strata and how they are affected by climate change.
3. Africa and Climate Change3.1 Greenhouse gas emissions in AfricaAs a region, Africa has among the world’s lowest greenhouse gas
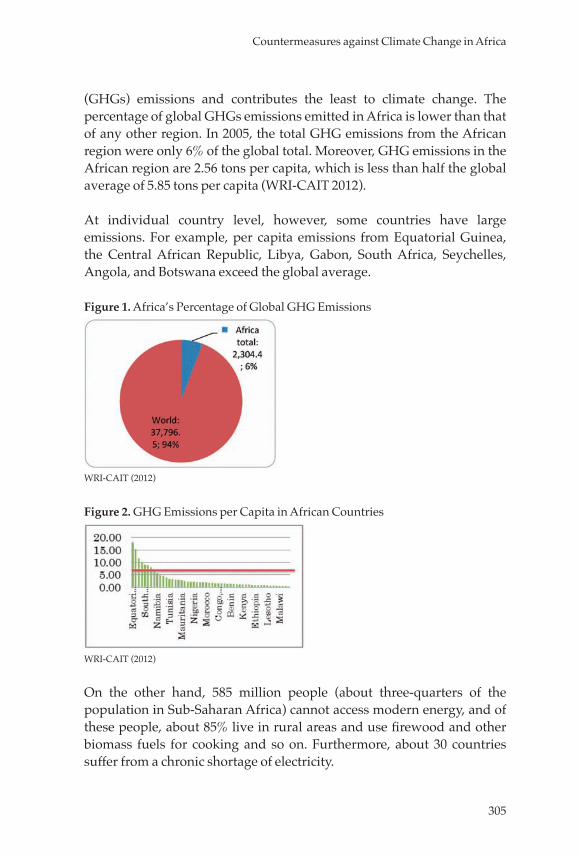
305
Countermeasures against Climate Change in Africa
(GHGs) emissions and contributes the least to climate change. The percentage of global GHGs emissions emitted in Africa is lower than that of any other region. In 2005, the total GHG emissions from the African region were only 6% of the global total. Moreover, GHG emissions in the African region are 2.56 tons per capita, which is less than half the global average of 5.85 tons per capita (WRI-CAIT 2012).
At individual country level, however, some countries have large emissions. For example, per capita emissions from Equatorial Guinea, the Central African Republic, Libya, Gabon, South Africa, Seychelles, Angola, and Botswana exceed the global average.
Figure 1. Africa’s Percentage of Global GHG Emissions
WRI-CAIT (2012)
Figure 2. GHG Emissions per Capita in African Countries
WRI-CAIT (2012)
On the other hand, 585 million people (about three-quarters of the population in Sub-Saharan Africa) cannot access modern energy, and of these people, about 85% live in rural areas and use firewood and other biomass fuels for cooking and so on. Furthermore, about 30 countries suffer from a chronic shortage of electricity.
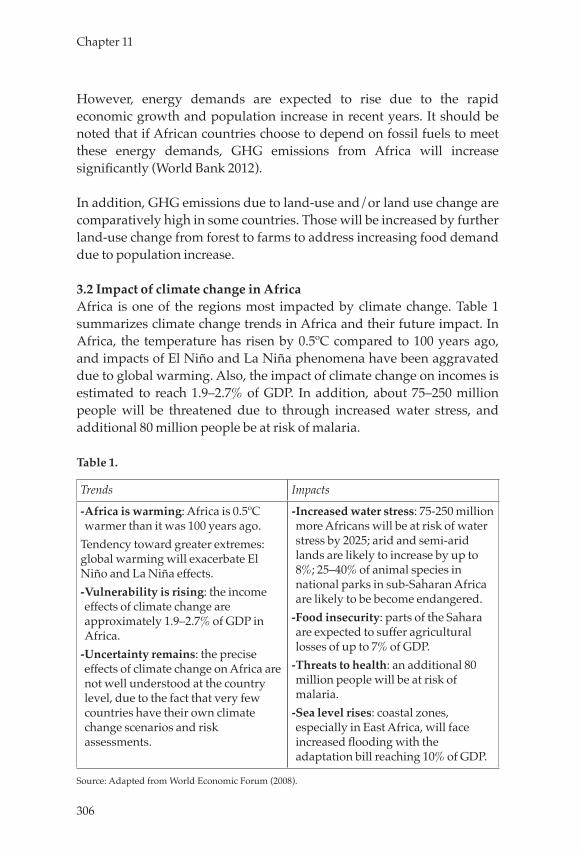
306
Chapter 11
However, energy demands are expected to rise due to the rapid economic growth and population increase in recent years. It should be noted that if African countries choose to depend on fossil fuels to meet these energy demands, GHG emissions from Africa will increase significantly (World Bank 2012).
In addition, GHG emissions due to land-use and/or land use change are comparatively high in some countries. Those will be increased by further land-use change from forest to farms to address increasing food demand due to population increase.
3.2 Impact of climate change in AfricaAfrica is one of the regions most impacted by climate change. Table 1 summarizes climate change trends in Africa and their future impact. In Africa, the temperature has risen by 0.5ºC compared to 100 years ago, and impacts of El Niño and La Niña phenomena have been aggravated due to global warming. Also, the impact of climate change on incomes is estimated to reach 1.9–2.7% of GDP. In addition, about 75–250 million people will be threatened due to through increased water stress, and additional 80 million people be at risk of malaria.
Table 1.
Trends Impacts
- Africa is warming: Africa is 0.5ºC warmer than it was 100 years ago.
Tendency toward greater extremes: global warming will exacerbate El Niño and La Niña effects.- Vulnerability is rising: the income effects of climate change are approximately 1.9–2.7% of GDP in Africa.
- Uncertainty remains: the precise effects of climate change on Africa are not well understood at the country level, due to the fact that very few countries have their own climate change scenarios and risk assessments.
- Increased water stress: 75-250 million more Africans will be at risk of water stress by 2025; arid and semi-arid lands are likely to increase by up to 8%; 25–40% of animal species in national parks in sub-Saharan Africa are likely to be become endangered.
- Food insecurity: parts of the Sahara are expected to suffer agricultural losses of up to 7% of GDP.
- Threats to health: an additional 80 million people will be at risk of malaria.
- Sea level rises: coastal zones, especially in East Africa, will face increased flooding with the adaptation bill reaching 10% of GDP.
Source: Adapted from World Economic Forum (2008).
307
Countermeasures against Climate Change in Africa
Climate change seems to have already begun to take its toll in Africa. In the past several decades, the average rainfall in Sub-Saharan Africa has shown a decreasing trend. Compared to the monthly rainfall between 1951 and 1980, the average amount in the 2000s has decreased by as much as 7 mm. The reduction ratio is 2.5 times that of Asia and more than 10 times that of Latin American and the Caribbean countries. The instability and decrease in rainfall poses a food security threat to Africa, where over 90% of agriculture depends on rainfall (UNDP 2012).
Also, Africa is a region where abnormal temperatures, droughts, wildfires, and other climatic disasters take place at the second highest frequency in the world, after East Asian and the Pacific. Even though other natural disasters such as floods and violent storms occur less frequently here than in other areas, their number has increased at the second highest rate in the world and the affected population has tripled in the past decade (UNDP 2012).
Climate change is believed to aggravate the frequency and intensity of extreme weather phenomena. There are concerns that this in turn could have serious impacts not only on agriculture and water resources, but also on ecological systems and gene resources, as exemplified by the expansion of disease vector habitats and the extinction of plant and animal species (IPCC 2011).
4. Mitigation Measures in Africa4.1 Challenges and opportunities regarding mitigation measures in
AfricaAs noted above, Africa contributes the least to ongoing global warming, while advanced countries, as well as China, India, and other emerging countries, have attained economic growth while emitting large amounts of the GHGs that accompany industrialization. In many African countries, where economic development and poverty reduction are the most urgent issues, expectations are high that economic development and poverty reduction will be realized by following the same path toward industrialization as these advanced and emerging countries, while effectively utilizing their own resources in the region. Moreover, there is an urgent need for improved access to energy in view of the fact that three-quarters of the population in the region have not had access to energy and have endured chronic electricity shortages, and also because
308
Chapter 11
energy demands are expected to increase as the economy and population grow.
Thus, although the lack of economic infrastructure development is an important challenge for Africa, this situation may be an opportunity for Africa to move toward greener and more sustainable development, in a manner unlike that adopted by the advanced and emerging countries.
Africa has a potential to develop renewable clean energy. For example, Africa holds 15% of the global hydroelectric power generation potential, but only about 10% of this has been developed (World Bank 2012). Besides hydroelectric power generation, there is also high potential for photovoltaic power, solar thermal power, wind power, geothermal power, and biomass energy. By utilizing these resources effectively, the risks accompanying fluctuations in the international price of crude oil and other fossil fuels may be reduced. In addition, there is a potential for Africa to improve efficiency of energy/resource use by leapfrogging to more efficient technologies and infrastructure.
Africa also has great potential for carbon sequestration and storage. The tropical forests in Africa’s Congo Basin constitute the second largest such area in the world. However, these forests have been continuing to shrink and deteriorate due to farmland conversion, excessive logging, forest fires, and other factors. According to the FAO, the global forest area shrank by about 13 million hectares a year on average between 2000 and 2010, which is equivalent to one-third of Japan’s national land area. Of this, Africa accounts for 3.4 million hectares (FAO 2010). The need to conserve forests, where these natural resources and carbon are stocked, has increased. The Congo Basin is an effective carbon sequestration and storage resource, and is also high in biodiversity. Congo Basin may be benefitted by Introducing Payment for Ecosystem Services (PES), such as Reducing Emissions from Deforestation and Forest Degradation plus conservation, the sustainable management of forests and enhancement of forest carbon stocks (REDD+), since PES could add new economic value to natural resources which has not yet been appropriately valued.
The sections that follow present a sector-by-sector discussion of the challenges and opportunities related to mitigation measures.
309
Countermeasures against Climate Change in Africa
4.2 Energy sectorImproving access to energy is important in view of making progress in industrialization, the poverty reduction accompanied by industrial development, and expanding opportunities to access education and medical services. In order to address increasing in energy demands, the governments need to consider stable energy supply while also attending to preventing pollution and conserving the natural environment.
Africa also has abundant potential for renewable energy, as exemplified by the photovoltaic power and solar thermal power that could be obtained from the ample sunlight in the Sahara Desert and surrounding areas, the geothermal energy found mainly in the Great Rift Valley, the copious source of hydroelectric energy found mainly along large international rivers, and the wind power capacity found mainly along the coastal areas. Crude oil and other fossil fuels have also been found in the region. Those resources could help the government to establish a low carbon society, if the government promotes proactive use of renewable energy and the cleaner use of limited fossil fuel resources appropriate to the economic and technology level of each country.
In addition, GHG emissions could be reduced if a more efficient and stable power supply were made possible by developing of efficient power transmission networks and regional power interchange systems based on power pooling. In remote regions, access to energy could be improved by utilizing small-scale power generation by hydroelectric power, solar power, wind power, and biomass power, as well as independent small-scale grids. However, the use of low-carbon energy requires efforts on the user side such as energy conservation in addition to those on the supplier side. Energy users in rural areas need to convert the traditional types of fuel and methods to modern and more thermally efficient methods.
To support African countries’ efforts toward increasing their energy efficiency, JICA has assisted in renewable energy projects including wind power generation in Egypt and geothermal power generation in Kenya, research to utilize solar energy in the Sahara Desert, and the development of efficient power transmission and distribution networks in Tanzania and Cameroon, and so on.
310
Chapter 11
4.3 Transportation and urban sectorsDeveloping the transportation infrastructure is also important to promote economic growth. On the other hand, economic growth could lead to increasing fuel demands and GHG emissions as road transportation demands increase. If the development of high-traffic arterial roads is insufficient, the increased traveling time caused by traffic jams could hinder economic growth and lead to excessive fuel consumption. Also, if the transportation infrastructure is vulnerable to the foreseeable natural disasters due to climate change, the transport of necessary goods could be impaired in times of disaster, and economic activities could be impeded until recovery is achieved. Therefore, the introduction of low-carbon transportation systems that have sufficient resilience to withstand disasters need to be considered when examining transportation system development.
JICA has assisted African countries in transport infrastructure in various ways: one typical example is the development of arterial roads such as the Nacala Corridor of Mozambique; another is logistics improvement by developing one stop border posts to reduce congestion at borders.
Urbanization has progressed rapidly in major urban areas. Urban plans should be revised by reallocating urban functions more efficiently, according to the development stage of the city, and in the medium- to long-term, disasters-resilient low-carbon urban development should be attempted. As such medium- to long-term projects, the introduction of railroads and Bus Rapid Transit (BRT) systems may be possible options mainly in large- and medium-scale cities.
4.4 Forest managementAs discussed above, Africa has an abundance of diverse forest resources, as exemplified by the Congo basin, which is the world’s second largest area of tropical forests. Forest conservation is important for increasing the water-retention capacity of the soil and mitigating the scale and frequency of natural disasters, in addition to retaining a resource for absorbing GHGs. In other words, forest conservation is expected to have both mitigating and adaptive effects. On the other hand, Africa has one of the highest percentages of forest reduction in the world. The percentage of forest coverage in the Sub-Saharan region fell from 31.2% in 1990 to 28.1% by 2010. This reduction is attributed to the excessive exploitation of forest resources caused by population growth, the
311
Countermeasures against Climate Change in Africa
accompanying fulfillment of basic needs, and economic development, as well as the conversion of forests to other uses (AUC et al. 2012).Mitigation measures with the aim of reducing GHGs by curbing forest reduction in developing countries were on the agenda for the first time at the 11th meeting of member countries to the United Nations Framework Convention on Climate Change (UNFCCC) (COP11). Subsequently, Reduced Emissions from Deforestation and forest Degradation (REDD) was officially adopted as one of the topics for consideration under the Bali Action Plan at COP13, and it was decided in the Copenhagen accord at COP15 to pursue the development of a REDD+ framework.
The introduction of Payments for Ecosystem Services, such as carbon sequestration and storage by forest resources (REDD+), is expected to provide an incentive for forest conservation in the Congo basin and other places where forest destruction is underway.1
In forest conservation, it is important for the policy makers and project developers to consider residents who depend on forest resources for their livelihoods. It is also important for the government to steadily promote the sustainable use of forest resources in a way that contributes to sustainable forest management, poverty reduction, and regional development. Communities that depend on forests for their subsistence have sometimes used appropriate forest conservation techniques as part of their regional traditions. These indigenous technologies could also be used for effective forest conservation. Also, for reviving deteriorated forests, sustainable forest management needs to be promoted by trading sustainably produced lumber, along with planting and replanting trees in Africa and other areas.
5. Adaptation Plans in Africa5.1 Challenges and opportunities for adaptation plans in AfricaThere is growing concern for Africa about extreme weather, such as the historical drought in the Horn of Africa in 2011, and on food security. Even if a significant reduction in CO2 is realized globally, it will still take a long time for GHG concentrations in the atmosphere and the climate system to stabilize, and the adverse effects from future climate change
1. JICA has assisted in forest conservation programs in the Congo Basin, Gabon, Ghana, Malawi, and other countries.
312
Chapter 11
could expand. Especially in Africa, where many of the poor live in rural areas and depend on natural resources for their livelihoods, including rain-fed farming, the impact of climate change is a huge threat to achieving inclusive development, since poor people will mainly be affected by the impact of climate change Water resources are not just used for drinking water and cultivating food for subsistence, but also for many other uses, including for power generation and as industrial water. In addition, in urban areas, due to rapid urbanization and population increases, improvements in urban infrastructure such as water supply, sewerage and drainage systems have been delayed, and measures to combat floods are also urgently required. From this viewpoint, it is necessary for the governments to consider appropriate water resource management including management of forest as source of water, improvements in food productivity, improvements in water supply and sewerage systems, and the appropriate reuse of water resources as cross-sectoral theme.
Another threat to development posed by climate change is loss of developmental dividend due to the increase in natural disasters. The higher frequency of natural disasters and their increased intensity may lead to a loss in the human, social, and natural capital that has been amassed thus far, and could wipe out all the efforts to reduce poverty that have been made to date. This makes efforts to prevent disasters and reduce their impacts essential to securing the benefits of development..
Furthermore, responses to future climate must be considered with regard to existing infrastructure as well as in the creation of new infrastructure. For example, an irrigation facility would require the installation of water-saving equipment so as to withstand the adverse effects of changes in precipitation brought by climate change. For developing countries to create a society and economy capable of withstanding the effects of medium- to long-term climate change, the establishment of climate-proof infrastructure will be required.
In many cases, water resource management and disaster prevention will require a cross-border response. Especially in Africa, with its many international rivers, cooperation among watershed nations is important. Since this is an area where benefits are maximized through cooperation as opposed to through settlement by disputes, a policy dialogue among countries and the formation of cooperative groups involving various
313
Countermeasures against Climate Change in Africa
stakeholders, such as private enterprises, citizen organizations, and communities, could maximize benefits, as well as accelerate regional unification, which in turn could lead to expanding markets and new business opportunities (AfDB 2012).
To tackle those challenges and to take an advantage of opportunities, African countries need to improve climate information for informed decision making, tailored solutions including development of early warning system, seasonal forecasts and regional level climate change projections.
The sections that follow will discuss, sector-wise, the challenges and opportunities concerning response measures.
5.2 Agricultural sectorBeing dependent on rainwater and lacking adequate distribution systems, Africa has traditionally been very vulnerable to shocks such as droughts and floods. For example, between 2010 and 2011, the Horn of Africa region suffered a severe drought, and more than 10 million people faced a serious food crisis. While the region has periodically suffered severe damage in the past, in recent years the rainwater cycle has become more irregular, and the amount of actual precipitation is falling.
Agriculture is a source of wealth and poverty reduction in Africa, as discussed in Chapter 2. Indeed, the share of employment in agriculture is 65% in the region, and still constitutes a large 32% share of GDP, one-third of the economic development factor (World Bank 2008). In the past, Africa increased production by expanding its cultivated acreage; however, cultivated acreage per capita has been declining due to demographic pressure, and, coupled with stagnant land productivity, this has resulted in a drop in grain production per capita.
Economic growth and strong demographic pressure have caused food consumption needs to expand rapidly, worsening the domestic supply and demand balance and increasing its dependency on food imports. In other words, Africa is highly vulnerable to external conditions such as a sharp increase in international food prices and bad weather accompanied by climate changes.
Although improvements in agricultural productivity are urgently
314
Chapter 11
required in Africa, improving productivity alone will not necessarily make the region less vulnerable or more resilient. Further measures should be considered for the government and farmers; for example, agricultural infrastructure development such as irrigation facilities to help farmers adapt to climate change, development of crop and cultivation methods, and the introduction of agricultural techniques adaptive to climate change. JICA is helping to improve the cultivation system to respond to the droughts and floods caused by climate change.
The private sector will play an important role in assisting local farmers to improve their productivity and enhancing the commercial values of the products through their investment and technology transfer, making their agricultural product competitive in the market. Particularly, foreign agricultural investments are needed in strengthening the production capacity of developing countries, and it is important for the governments to continue promoting this.2 On the other hand, if plans are poorly structured and implemented, international agricultural investment could have unintended negative effects on the political stability of the recipient nation, as well as on its social cohesion, human security, sustainable food production, food safety on a household level, and environmental protection. It may also lead to local residents losing access to resources they depend on. Furthermore, land transactions are a very sensitive issue. In Africa, where laws and regulations concerning land use are not well established and where communal land use is a traditional norm, international land transactions can trigger a serious, emotionally charged backlash. At the L’Aquila Summit in 2009, the G8 nations highlighted the Promotion of Responsible Agricultural Investment, a comprehensive approach to promoting global agricultural development through increased investment while mitigating the negative effects of international agricultural investment. In September 2009, the “Principles of Responsible Agricultural Investment that Respects Rights, Livelihoods, and Resources,”3 consisting of seven principles, were announced.4 The expectation is that through agricultural investments conducted in line with these principles, agricultural infrastructure will be developed and technology to improve agricultural productivity by sustainable methods will be introduced
2. See Chapter 4 of this volume for more detailed discussion on investments in agriculture. 3. http://www.mofa.go.jp/mofaj/gaiko/food_security/pdfs/besshi3.pdf4. Refer to the Knowledge Exchange Platform for Responsible Agricultural Investment (RAI), https://www.responsibleagroinvestment.org/rai/.
315
Countermeasures against Climate Change in Africa
(refer to Chapter 3).
Since the agricultural sector is the most vulnerable to climate change, another idea would be to establish a structure to cover losses from climate aberrations, such as a climate index insurance policy.
5.3 Disaster prevention and reductionIn recent years, many African countries have been hit by large-scale natural disasters, such as floods, droughts, coastal erosion, and mudslides. With the increasing frequency of natural disasters, the risks they pose and their influence on social and economic development are also rising. However, their effects are varied, and a case-by-case response is required. At the UN World Conference on Disaster Prevention in 2005, the Hyogo Framework for Action was adopted as an international framework for disaster prevention. In accordance with the Hyogo Framework for Action, it is important for the governments to establish disaster prevention plans in line with the priority that each country places on them.
To respond to large-scale disasters accompanying future climate change, meteorological and climate observation capabilities must be improved, and an early warning and evacuation system structure constructed on the bases of an accurate meteorological and climate change forecasting system. In addition, there is a need to improve climate change risk management capabilities in infrastructure development at a sector level, such as agricultural development, water resources management, and traffic, to mainstream disaster prevention and the rapid recovery from disasters.
In addition to conducting disaster prevention training in African countries, JICA is cooperating in programs to enhance response capabilities in countries including Benin, Cape Verde, Cote d’Ivoire, and Lesotho, helping to increase their resistance to natural disasters.
Hosono (2012) points out that there are three kinds of gaps between the capabilities required for disaster prevention and the actual levels of such capabilities, which are (1) the level required for addressing expected impact of disaster (a disaster scenario), (2) the level required for a level exceeding a disaster scenario, and (3) the level required to respond to long-term changes. To close these gaps, there are cases in which the
316
Chapter 11
traditional techniques handed down in the community or the technologies used in other developing countries are more favorable than the latest technology. In such cases, cooperation through South-South cooperation or triangular cooperation may be effective.
To respond to a temporary shortage of funds in case a massive disaster occurs, systems such as standby-type loans and insurance could be utilized as safety nets.
5.4 Water resources managementWater resources are an important component in almost all development sectors. Among others, water demand is expected to increase due to the expansion of agricultural and industrial production and the energy sector as well as increasing demand of safe water supply for human lives, while the changes in precipitation accompanying climate change, and the decreased water retention capability due to the reduction of forest resources are all likely to cause an unstable water supplies. Africa has not been able to fully develop the potential of its rich renewable water resources (UNECA et al. 2011). Therefore, developing these potential renewable water resources and appropriately managing water resources are important issues for Africa.
Africa has a number of international rivers like the Nile and the Congo, and approximately three-quarters of its surface water resources, estimated at 4.6 trillion cubic meters annually, are concentrated in eight major international rivers (World Bank 2009). This makes it essential to conduct cross-border water resource management and to establish master plans and enhance governance to conduct optimal Integrated Water Resource Management (IWRM) for each watershed, which would include the appropriate development of surface and ground water and the purification and recycling of industrial and living discharge water. Africa has established an Africa Water Vision for 2025, which aims to provide an environment in which all people will have equal access to water resources, be able to use these for power generation and agriculture, create an enabling environment for IWRM, and integrate regions based on watersheds (UNECA et al. 2011).
Reservoirs can be an effective response to an unstable water supply (World Bank 2009). However, a safe water supply will have a different meaning for urban and rural areas. In urban areas, improvements in the
317
Countermeasures against Climate Change in Africa
water supply system will be required to deal with the increase in population caused by the inflow of people into the areas. On the other hand, since many people lack access to safe water in rural areas, one urgent issue for the governments is to establish in these communities a system and infrastructure for a stable supply of safe water. JICA is currently assisting rural water supply projects in Djibouti and Ethiopia.
6. The Funding, Technology, and Market Mechanisms Associated with Climate Change Measures
The demand for funds to implement these measures is huge. As discussed in Chapter 7, there is a high demand for funds for infrastructure improvement in Africa. AFD-WB 2009 calculated the infrastructure funding needs for 2006–2015 to be US$93.3 billion, and the financial gap between this amount and that already expended to be US$48.0 billion. Of this, the funding gap, excluding the efficiency gap (US$17.0 billion), was calculated at US$31.0 billion (AFD-WB 2009). According to an estimate by the AfDB 2011, the funding needs accompanying climate change measures will be around US$9–12 billion annually, if Africa is to take the low-carbon development route, and the incremental cost if appropriate measures are not taken now is estimated to be around US$13–19 billion (AfDB 2011).
At COP16, the Cancun Agreement was established (UNFCCC 2010), which clearly stated that in the three years between 2010 and 2012, developed countries would provide funding aid of almost US$30 billion to developing countries in the area of climate change (“fast-start” finance). It also agreed to establish a Green Climate Fund that would make US$100 billion in funds available annually by 2020 (long-term funds).
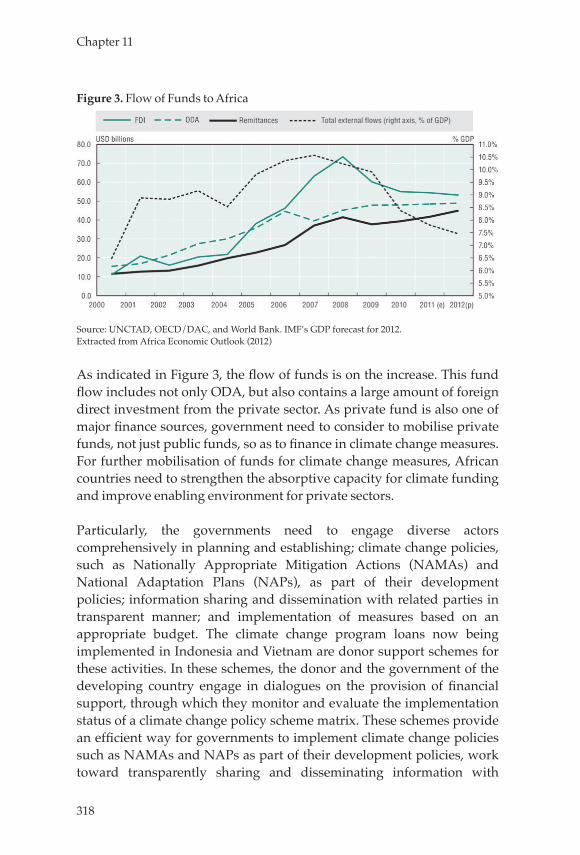
318
Chapter 11
Figure 3. Flow of Funds to Africa
Source: UNCTAD, OECD/DAC, and World Bank. IMF’s GDP forecast for 2012.Extracted from Africa Economic Outlook (2012)
As indicated in Figure 3, the flow of funds is on the increase. This fund flow includes not only ODA, but also contains a large amount of foreign direct investment from the private sector. As private fund is also one of major finance sources, government need to consider to mobilise private funds, not just public funds, so as to finance in climate change measures. For further mobilisation of funds for climate change measures, African countries need to strengthen the absorptive capacity for climate funding and improve enabling environment for private sectors.
Particularly, the governments need to engage diverse actors comprehensively in planning and establishing; climate change policies, such as Nationally Appropriate Mitigation Actions (NAMAs) and National Adaptation Plans (NAPs), as part of their development policies; information sharing and dissemination with related parties in transparent manner; and implementation of measures based on an appropriate budget. The climate change program loans now being implemented in Indonesia and Vietnam are donor support schemes for these activities. In these schemes, the donor and the government of the developing country engage in dialogues on the provision of financial support, through which they monitor and evaluate the implementation status of a climate change policy scheme matrix. These schemes provide an efficient way for governments to implement climate change policies such as NAMAs and NAPs as part of their development policies, work toward transparently sharing and disseminating information with
319
Countermeasures against Climate Change in Africa
related parties, and implement measures based on an appropriate budget (Sudo et al. 2008, Katsurai and Murakami 2012). On the other hand, Furukawa et al. (2013) have surveyed the effects of general budget support in the health sector and concluded that although there have been certain improvements in budget allocations in this sector, these have had a limited effect on improving health indicators. They comment that general funding support and the complementary effects of the projects and programs require attention. The complementary effects between policy, budget, and project, as pointed out before, should be considered carefully, when policy planner consider to introduce a climate change program loan.
There is also a strong need in Africa for appropriate low-carbon technologies for enhancing development that is resistant to the effects of climate change. The Cancun Agreements also included an agreement to establish a Climate Technology Center and Networks, in order to expand and promote the development and transfer of technology to assist in mitigation and adaptation, and to understand and support technical needs in developing countries. To promote the use of appropriate technology, various activities, such as formulating systematic capabilities and data-gathering capabilities, and establishing systems to share knowledge, will be required in addition to training human resources.
These technical and investment needs could also create an attractive market for private companies. Establishing an attractive market environment for private companies to introduce technology and investments could help promote climate change measures in the private sector.
The Clean Development Mechanism (CDM), one of the market mechanisms introduced under the Kyoto Protocol, was expected to promote the active participation of the private sector in the mitigation business, and over 5,500 projects have been registered to date. However, as of the end of December 2012, only 104 projects, a mere 1.9%, were in Africa (UNFCCC 2012). It has been pointed out that the current CDMs have not been able to fulfill the functions intended at the Kyoto Protocol due to the complexity of the applications and fundraising for low-profit projects (Yamada and Fujimori 2012). The use of market mechanisms, such as a simplified CDM or a bilateral offset credit system mechanism,
320
Chapter 11
could act as an incentive for private companies to provide investments and technical transfers, and efforts to improve the system and develop the ability to effectively utilize these mechanisms are important.
7. Toward the Effective Promotion of Climate Change Measures in Africa
As mentioned above, climate change is a cross-cutting issue and a problem that has possible global effects. This means that instead of individual actors such as countries, sectors, or communities responding in an ad-hoc manner, it requires a comprehensive approach spanning various strata from the individual and community level to the governmental and regional level, and there is a need to resolve the “apparent disconnect” generated between a policy-based top-down approach and a community-based bottom-up approach (Bharwani and Taylor 2011). In addition, the activities of each actor must be considered from the viewpoint of externalities that influences the actions of others. For example, an adaptive policy taken by one community might trigger a maladaptation that could exacerbate the disaster damage in another community. Therefore, to effectively implement climate change measures, information sharing among a wide range of actors is important, from the international level down to the community level.
Although Africa has the world’s lowest amount of GHG emissions, it is affected the most by climate change. For Africa to maximize its natural resource potential in a sustainable, low-carbon way, and be resilient to external shocks such as the effects of climate change, it must engage in sustainable development in which everyone can receive the benefits of growth. In other words, Africa is in a position to target sustainable development through inclusive and resilient green growth. Africa’s climate change measures are themselves the start of a new development process.
Regarding its support for climate change measures in developing countries, the Japanese government announced the Kyoto Initiative in 1999, the Environmental Conservation Initiative for Sustainable Development (EcoISD) in 2002, the Cool Earth Partnership in 2008, and the Hatoyama Initiative in 2009. Climate change was incorporated into the Yokohama action plan, at TICAD IV, and as part of the Cool Earth
321
Countermeasures against Climate Change in Africa
Partnership, US$92.1 million in funding was declared in the action plan to support climate change measures in African countries. In the three years from 2010 through 2012, a total of approximately US$1.3 billion was provided, as support for climate change measures in Africa, covering both mitigation measures and adaptation measures. Japan and JICA have more than fifteen years of experience in the area of climate change measures, and as the largest donor in this field, JICA supports many projects and programs. It has extensive knowledge on the establishment and implementation of promotion methods and the planning and implementation of specific policies related to climate change measures (such as energy, traffic, and agricultural policies), as well as in the measurement, reporting, and verification of GHG reduction effects using Climate-FIT, in vulnerability assessments, and in the methods used to assess project effects through post-project evaluations. This knowledge should be used effectively to support climate change measure policies in Africa. Based on the discussions above, we offer the following recommendations for the effective promotion of future climate change measures in Africa.
Recommendation 1:
It is necessary to establish climate change policies in accordance with the conditions of each country as part of its development policies, share and disseminate this information with stakeholders in a transparent manner, and implement it with appropriate budget allocation.
The climate change policies established by governments, such as Nationally Appropriate Mitigation Actions (NAMAs) and National Adaptation Plans (NAPs), are prepared as part of each country’s development policy, and it is desirable for these climate change policies to generate co-benefits that will contribute to sustainable development (Fujikura and Toyota 2012). Many countries in Africa have already created NAMAs. In addition, LDCs have already prepared National Adaptation Programs of Action (NAPAs). These clear, foreseeable, and stable policies lend credibility to the activities of actors, including in private investment. In establishing these policies, the opinions of actors in the private sector and civil society organisations (CSOs), as well as those of women and the poor, should also be actively incorporated along
322
Chapter 11
with those of the government. Furthermore, although the use of data based on scientific analysis is recommended wherever possible, such as the amount of GHG emissions and forecasts of the effects of climate change (Fujikura and Kawanishi, 2010), it is also necessary for the policy makers to respond to the needs of their respective countries based on precautionary principles and the concept of a “no regrets” policy, taking into consideration the capabilities of the subject sector, region, community, and others.
To support these activities, in addition to supporting projects or programmes, schemes such as climate change loans can be effective, but great care should be taken with regard to the mutually complementary nature of policy, budget, and project policy, as well as the leverage effects of general funding support.
Recommendation 2:
For effective Green Growth in Africa, support for access to information as well as innovation through R&D are important to identify opportunities for low-carbon and climate resilient growth and promote effective green growth.
Access to information is the most important factor in today’s society, not only for disseminating climate change policies, but also for providing disaster information or information concerning low-carbon technologies and funding access. It is also important for a country in determining how it can apply climate change measures implemented by other nations or communities, or what effect they could have. Making greater use of information and communication technology (ICT) is one way to improve access to this information. Sharing information and knowledge through policy dialogues is another effective method. In addition, the NAMAs established by each country require monitoring, reporting, and verification (MRV), and securing the transparency and accountability of information through MRV will enable the implementation of appropriate climate change policies in a plan-do-check-act (PDCA) cycle. Furthermore, access to technical information will promote a country’s introduction of technology that is internationally available and it can utilize, and could lead to the development of technology enabling leap-frogging. We must not forget that appropriate technical information includes not only cutting-edge technologies, but also information on
323
Countermeasures against Climate Change in Africa
traditional technologies, which can be very useful at times. Technology transfers are expected to include not only transfers from developed countries, but also transfers between developing countries through South-South cooperation and triangular cooperation (Hosono 2012).
From the viewpoint of inclusivity using environmental education to enhance people’s awareness of climate change is important, particular for the poor, who are vulnerable to the effects of climate change, and also for women, and future generations.
Recommendation 3:
It is necessary to establish an enabling environment where everyone, including the private sector, will participate in various climate change measures.
It is important for the public sector to establish a path toward the creation of a low-carbon economic society resilient to climate change through policies and system improvements. However, the public sector itself neither manufactures nor conducts business transactions on its own. Everyone, not just private companies and CSOs, but also poor and socially vulnerable people, is involved in certain economic and social activities. In view of the public and external nature of global-scale climate change, the participation of all is required for a low-carbon, socio-economic model that is resilient to climate change.
In particular, high expectations are placed on the private sector’s participation in climate change measures, in terms of its broad influence, funds, technology, and ability to increase employment. As pointed out by JICA-RI (2012), in addition to support from the policy side, in order to promote the participation of the private sector, actions will be required including organizing an investment environment such as stable macroeconomic operations, establishing fair and transparent legal systems, promoting business models such as public-private partnerships (PPPs), and providing support and seed money for establishing projects.
324
Chapter 11
Recommendation 4:
To promote climate change actions, it is necessary for African countries to use market mechanisms effectively along with the effective use of funds and promotion of capability development
The implementation of specific climate change measures requires funds and implementation capabilities. The Cancun Adaptation Framework requires annual funds of US$100 billion to be made available by 2020, as well as the structuring of a system to enable effective technology transfers; there is also a strong need for funds for climate change measures and technology in African countries. The effective use of funds is required, as well as the development of ways to maximize the effects of development and climate change measures while minimizing additional costs. Funding for climate change was discussed at the 2011 High Level Forum on Aid Effectiveness, and the partnership document it adopted calls for the promotion of consistency, transparency, and predictability in effective climate change finance and a broad approach toward development aid (OECD 2011).
In addition to their effective use for supporting climate change measures, public funds are also expected to provide leverage in obtaining private funds,. Establishing a structure and environment to promote private investment can also contribute to an overall increase in private investment, beyond climate change measures. Moreover, by monitoring and evaluating the efforts of the donors involved, even more effective cooperation could be possible. Lamhauge et al. (2012) have conducted studies on monitoring and evaluation methods with regard to several donors’ support for adaptation measures. Such monitoring and evaluation methods focusing on the role of donors should be examined in the future.
Market mechanisms like CDM and bilateral offset credit mechanisms, or innovative mechanisms like PES, including REDD+, can be easy for African countries to work with. As pointed out by JICA-RI (2012), in order for these mechanisms to be used effectively to benefit African countries, it is necessary to develop the capabilities of the African countries themselves, and to introduce these mechanisms into international society so they can become even easier to use.
325
Countermeasures against Climate Change in Africa
Recommendation 5:
JICA needs to function as a Solution Provider by establishing partnerships with various stakeholders..
From the viewpoint of the public and external nature of climate change on a global scale, an approach to climate change must be taken with the participation of all people. Japan and JICA have more than fifteen years of cooperation experience in the field of climate change, and also constitute the top donor in this field. Particularly, Japan and JICA have comparative advantage in effective use of renewable resources, improvement of efficiency and productivity with optimal management, and so on. There is a need to proceed with cooperation to implement the optimal climate change measures, with Japan and JICA providing all the cooperation knowledge they have amassed to date for everyone to use. In recent years, other donors have also started to provide active support for climate change measures. Further knowledge is also being amassed in the academic and private sectors. In order to establish a low-carbon economic society with the ability to withstand climate change, all this knowledge needs to be utilized in an intercomplementary manner so that all people, including the poor, will be able to receive the benefits of development. Providing an optimal solutions by establishing networks with various actors while keeping in mind international negotiations, technology, and funding trends in the climate change field will be required. To do this, we recommend establishing a broad collaboration among international organizations, other aid organizations, CSOs, universities, autonomous bodies, private companies and others, as well as providing bridges for exchanges among various actors, such as mediating policy dialogues between communities and governments.
326
Chapter 11
References
AfDB. 2012. Solutions for a changing climate: The African Development Bank’s response to impacts in Africa. Tunis, Tunisia: African Development Bank.
African Development Bank (AfDB). 2011. The cost of adaptation to climate change in Africa. Tunis, Tunisia: African Development Bank.
Bharwani, S., and A. Taylor. 2011. Understanding the dynamic nature of vulnerability to support climate adaptation and development: The case of Lesotho Highlands. In Fujikura and Kawanishi 2011, 153–172.
FAO. 2010. The global forest resources assessment 2010. Rome: FAO.Fujikura, R., and M. Kawanishi, eds. 2011. Climate change adaptation and
international development: Making development cooperation more effective. London: Earthscan.
Fujikura, R., and T. Toyota, eds. 2012. Climate change mitigation and international development cooperation. London: Routledge.
Furukawa, M., and J. Takahata. 2013. Is GBS still a preferable aid modality? Working Paper No. 50, JICA Research Institute.
Government of Japan. 2012. Japan’s fast-start finance for developing countries up to 2012. Submission to UNFCCC.
Hosono, A. 2012. Climate change, disaster risk management. In Scaling up South-South and triangular cooperation, ed. H. Kato, 15–41. Conference Volume Prepared for the Global South-South Development Expo 2012. Tokyo: JICA Research Institute.
IPCC. 2012. Summary for Policymakers. In Managing the risks of extreme events and disasters to advance climate change adaptation: A special report of Working Groups I and II of the Intergovernmental Panel on Climate Change, ed. C. B. Field, V. Barros, T. F. Stocker, D. Qin, D. J. Dokken, K. L. Ebi, M. D. Mastrandrea, K. J. Mach, G.-K. Plattner, S. K. Allen, M. Tignor, and P. M. Midgley, 1–19. Cambridge, UK: Cambridge University Press.
Intergovernmental Panel on Climate Change (IPCC) [M. L. Parry, O. F. Canziani, J. P. Palutikof, P. J. van der Linden, and C. E. Hanson, eds.]. 2007. Contribution of Working Group II to the Fourth Assessment Report of the IPCC. Cambridge, UK and New York: Cambridge University Press.
JICA Research Institute (JICA RI). 2012. Aiming for promotion of climate change mitigation policies in developing countries. Policy Brief No. 7, JICA Research Institute.
327
Countermeasures against Climate Change in Africa
Japan International Cooperation Agency (JICA). 2011. JICA Climate-FT: Climate finance impact tool for mitigation and adaptation, Version 1.0. Reference document.
Katsurai, T., and Y. Murakami. 2012. Effectiveness of development policy lending in mainstreaming and financing climate change: Case studies from Indonesia and Vietnam. In Fujikura and Toyota 2012, 149–179.
Lamhauge, N., E. Lanzi, and S. Agrawala. 2012. Monitoring and evaluation for adaptation: Lessons from development co-operation agencies. OECD Environment Working Papers No. 38, OECD, Paris.
Matsumoto, M. 2012. REDD+: A new strategy for conserving tropical forests; Scientific background of REDD+ and international discussions. In Fujikura and Toyota 2012, 49–60.
OECD. 2011. Busan partnership for effective development co-operation. Declaration, Fourth High Level Forum on Aid Effectiveness, Busan, Korea, November 29 to December 1.
Organization for Economic Cooperation and Development (OECD). 2009. Integrating climate change adaptation into development co-operation: Policy guidance. Paris: OECD.
Sudo, T., A. Sato, Y. Murakami, and M. Motohashi. 2009. Promotion of developing country’s climate policy implementation: Applying development policy loan. Paper presented at the Asia-Pacific Forum on Low Carbon Economy, Beijing, China, June.
Sudo, Tomonori. 2012. Climate change and development in Africa. Presentation at the fourth Annual Meeting of Low Carbon Society Research Network (LCS-RNet), Oxford, UK. http://lcs-rnet.org/meetings/2012/pdf/P3_3_Sudo.pdf (accessed January 8, 2013).
Troell, J. J., and C. Odote Oloo. 2011. Climate change adaptation and water in Kenya: Governing for resilience. In Fujikura and Kawanishi 2011, 259–285.
United Nations Development Program (UNDP). 2012. Africa human development 2012: Towards a food secure future. New York: UNDP, Regional Bureau for Africa.
United Nations Economic Council for Africa (UNECA), African Union, and African Development Bank (AfDB). 2011. The Africa water vision for 2025: Equitable and sustainable use of water for socioeconomic development. Addis Ababa, Ethiopia: United Nations Economic Council for Africa.
United Nations Framework Convention on Climate Change (UNFCCC).
328
Chapter 11
2010. Report of the Conference of the Parties on its sixteenth session, held in Cancun from 29 November to 10 December 2010. FCCC/CP/2010/7/Add.1.
World Bank Corporate Scorecard. 2012. CO2 emissions. Indicator definition. http://corporatescorecard.worldbank.org/images/pdfs/tier1/122.pdf (accessed August 31, 2012).
World Bank. 2009. Making development climate resilient: A World Bank strategy for Sub-Saharan Africa. Washington, DC: World Bank Sustainable Development Department.
World Bank. 2012. World development indicators 2012. Washington, DC: World Bank.
World Economic Forum. 2008. Africa@Risk: A global risk network briefing. Geneva: World Economic Forum.
Yamada, Kazuhito, and Mariko Fujimori, 2012. “Current Status and Critical Issues of the CDM. In Fujikura and Toyota 2012, 37–48.
329
Chapter 12: State-building and Conflict Prevention in Africa
Ryutaro Murotani
1. Introduction
Violent conflicts have been one of the major obstacles to economic growth and development in Africa.1 However, in the 2000s, according to the UCDP/PRIO datasets, the African continent witnessed a decrease in the number of armed conflicts and battle-related deaths compared to the 1990s. After the end of the Cold War, the number of armed conflicts in the world hit its peak in the early 1990s, but started to decline from 1993. In Africa, the number continued to increase to 18 in 1998, but started to decrease in the early 2000s (refer to Figure 1). The battle-related deaths per year in Africa, which used to be some 20,000 to 80,000 in the late 1990s, are some 3,000 to 10,000 in recent years. Today, Africa is no longer a continent with many large-scale violent conflicts.
Although the negative impact of violence has declined, we need to remain attentive to potential risks and continue to work on peace-building and conflict prevention. Conflict risks are still major concerns for foreign investors. According to a JETRO survey (2013), political and social instability is the largest concern for Japanese investors in Africa, and more companies are worried about it in 2012 than in 2007.
In the past, some countries suddenly became unstable and fell into violent conflict; there are only 15 countries in Africa that have gone through the past three decades without any armed conflict (based on UCDP/PRIO’s criteria). Besides, many countries experienced the 1. Although the statistics provided in the first section cover the entire African continent, the main focus of this chapter is countries in Sub-Sahara Africa. Having gone through the Arab Spring in 2011, many of the countries in North Africa are facing the challenge of a transition to more stable democratic rule. Though there are some similarities and inter-connectedness in challenges of state-building in North Africa and Sub-Sahara Africa, contexts and characteristics differ so widely that it would be difficult to address both regions in the limited length of this chapter.
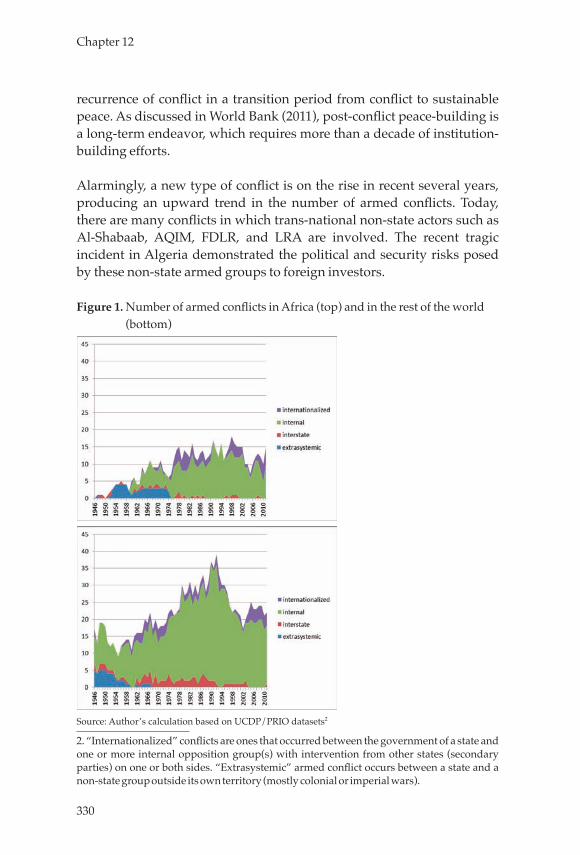
330
Chapter 12
recurrence of conflict in a transition period from conflict to sustainable peace. As discussed in World Bank (2011), post-conflict peace-building is a long-term endeavor, which requires more than a decade of institution-building efforts.
Alarmingly, a new type of conflict is on the rise in recent several years, producing an upward trend in the number of armed conflicts. Today, there are many conflicts in which trans-national non-state actors such as Al-Shabaab, AQIM, FDLR, and LRA are involved. The recent tragic incident in Algeria demonstrated the political and security risks posed by these non-state armed groups to foreign investors.
Figure 1. Number of armed conflicts in Africa (top) and in the rest of the world (bottom)
Source: Author’s calculation based on UCDP/PRIO datasets2
2. “Internationalized” conflicts are ones that occurred between the government of a state and one or more internal opposition group(s) with intervention from other states (secondary parties) on one or both sides. “Extrasystemic” armed conflict occurs between a state and a non-state group outside its own territory (mostly colonial or imperial wars).
331
State-building and Conflict Prevention in Africa
As the characteristics of violent conflicts have shifted from purely internal strife to violence and fragility caused by transnational non-state actors, capable state institutions that provide basic public services, including public safety in remote areas, are a significant element in preventing these problems. The lack of such capable institutions is one of the reasons that allow transnational non-state actors to be active in these fragile areas. The building of an “effective, legitimate, and resilient state” (OECD 2008, 7) is definitely necessary to address such problems.
Coercive measures are frequently needed to counter terrorists, however, it is also essential to look at structural problems that lead to these phenomena. To prevent the spread of the general public’s support for these non-state armed groups, poverty, inequality, and other social problems need to be addressed. It also requires a political/social mechanism that articulates citizens’ expectations and enables the state to respond to society’s demands. In this sense, state-building is a vital endeavor for achieving a stable and peaceful Africa.
The chapter discusses the challenges of state-building in Africa, particularly in relation to conflict prevention. It first highlights important points, which have been raised by existing literature and discussions, concerning state-building (Section 2). It emphasizes the importance of state legitimacy in the eyes of the people, livelihood improvement in addition to public safety, and a long-term perspective for state-building. Section 3 then introduces major research findings by JICA-RI and a JICA survey of its operations. For donors to help improve state legitimacy, the section calls attention to context-sensitivity, horizontal inequalities (HIs), and people’s perceptions. In Section 4, JICA’s current field experience related to state-building will be discussed. On the basis of the analysis in Section 2 and Section 3 and the review in Section 4, the final section will present policy implications for the future.
2. State-building: Building of Capable and Legitimate Institutions
Through their experiences of post-conflict peace-building, the international community, acknowledging the high risk of the recurrence of violent conflict, expanded its focus from short-term emergency response to long-term institution building. Not only in post-conflict
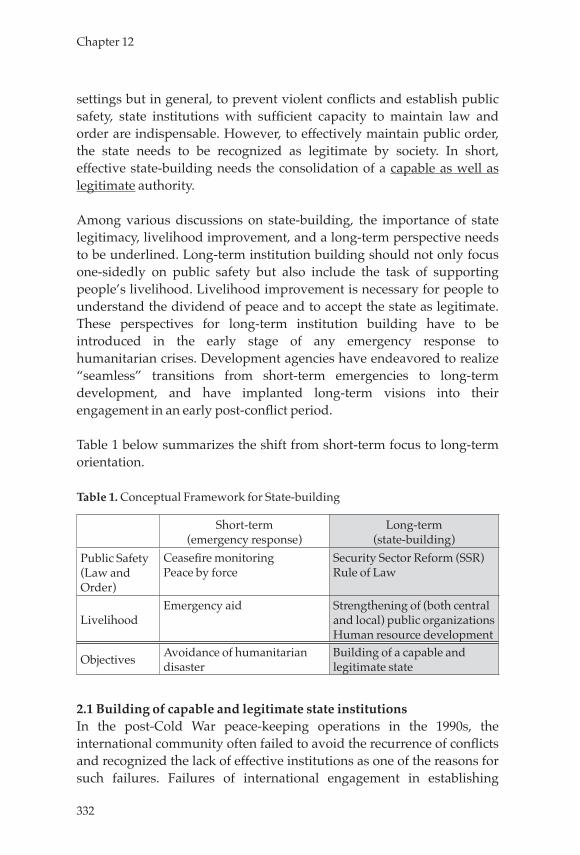
332
Chapter 12
settings but in general, to prevent violent conflicts and establish public safety, state institutions with sufficient capacity to maintain law and order are indispensable. However, to effectively maintain public order, the state needs to be recognized as legitimate by society. In short, effective state-building needs the consolidation of a capable as well as legitimate authority.
Among various discussions on state-building, the importance of state legitimacy, livelihood improvement, and a long-term perspective needs to be underlined. Long-term institution building should not only focus one-sidedly on public safety but also include the task of supporting people’s livelihood. Livelihood improvement is necessary for people to understand the dividend of peace and to accept the state as legitimate. These perspectives for long-term institution building have to be introduced in the early stage of any emergency response to humanitarian crises. Development agencies have endeavored to realize “seamless” transitions from short-term emergencies to long-term development, and have implanted long-term visions into their engagement in an early post-conflict period.
Table 1 below summarizes the shift from short-term focus to long-term orientation.
Table 1. Conceptual Framework for State-building
Short-term(emergency response)
Long-term(state-building)
Public Safety (Law and Order)
Ceasefire monitoringPeace by force
Security Sector Reform (SSR)Rule of Law
LivelihoodEmergency aid Strengthening of (both central
and local) public organizationsHuman resource development
Objectives Avoidance of humanitarian disaster
Building of a capable and legitimate state
2.1 Building of capable and legitimate state institutionsIn the post-Cold War peace-keeping operations in the 1990s, the international community often failed to avoid the recurrence of conflicts and recognized the lack of effective institutions as one of the reasons for such failures. Failures of international engagement in establishing
333
State-building and Conflict Prevention in Africa
sustainable peace forced the international community to pay greater attention to the building of public institutions that guarantee long-lasting sound governance. As incidents such as 9/11 increased global concerns about security vulnerability spilling over from weakly governed countries, scholars, including Fukuyama (2005), Chesterman (2004), Fearon and Laitin (2004), Krasner (2005), Ghani and Lockhart (2008), and Paris and Sisk (2009), debated the importance of and difficulties in state-building in recent years.
This argument also resonated with the international development community that has recognized the importance of good governance since the 1990s. The donor community started to discuss the need to improve its development effectiveness in fragile states, and accepted the idea of state-building in that context. In the OECD/DAC, the INCAF (International Network on Conflict and Fragility) functioned as an active forum to create policy guidance on state-building in fragile states (e.g., OECD 2011). Among the donors, state-building is understood as an effort to strengthen the capacity and legitimacy of state institutions to consolidate effective, legitimate, and resilient states (OECD 2008).3
The lack of capable and legitimate state institutions that protect people from human security crises makes the state vulnerable to violence by non-state actors. Public safety is one of the most fundamental public goods that should be provided by the state. Although such public safety may be temporarily and partially provided by international forces and/or civic groups, the state remains as the primary guarantor of public safety. Therefore, the strengthening of the state security capacity is fundamentally important to protect human security.
However, the mere reliance on coercive forces does not guarantee long-term stability. The state will face new challengers to public safety unless it has peaceful and stable relations with society. To be accepted by a wide range of social forces as the legitimate authority, the state needs to be equipped with inclusive institutions. If the state excludes some parts of its population from public services and the development process, it cannot be regarded as legitimate by the excluded groups. For instance, as we discuss below, horizontal inequalities (HIs) and group-based
3. Leaders of the fragile states themselves formed a group named g7+ and actively participate in the debates, contributing to the international dialogue between fragile states and donors on designing better international engagement to support state-building in fragile states.
334
Chapter 12
grievances have been the major causes of violent conflicts in Africa (Stewart 2010). What inclusive institutions look like, however, differs from one country to another depending on a country-specific context (e.g., OECD 2010).
2.2 Peace-building “from below”: greater emphasis on livelihoodAmong various aspects of institution building, the past decade has seen an increasing focus on public-safety issues, as typified by security sector reform (SSR). Critics, however, opposed the imposition of state institutions “from above,” and called for promoting the voices “from below” (e.g., Hilhorst et al. 2010). The efforts for institution building such as the formulation of a constitution, democratic elections, and justice sector reform, may not be the primary concern of the local populations. Advocates of peace-building “from below” emphasize the importance of welfare, livelihoods, and perceptions of the local people and communities (Richmond 2009, Shanmugaratnam 2008). Improvement of welfare and public service delivery is the key for the people to understand the dividends of peace. Richmond (2011) insists on the need to localize, contextualize, and hybridize international state-building policies to adapt to everyday human needs. Roberts (2011) suggests the shift of emphasis from political institution-building to institutions that serve society. Responding to local human needs would help improve the legitimacy of the state in the eyes of local people.
The state’s capacity to deliver services to the people largely depends on effective administrative organizations as well as on the ability of public officials who actually deliver the services to the people. Institutional capacity and human resource development are indispensable to improve the state capacity to support people’s livelihood.
2.3 Bridging the “gap” by institutional and individual capacity development
In the late 1990s, it was pointed out that there is a “gap” between humanitarian assistance and development assistance in a post-conflict situation. Development assistance often came too late in the transition from humanitarian crises to reconstruction phases. Although short-term relief can be provided by external actors, service delivery by local public organizations is indispensable for longer-term livelihood improvement. Besides, the two instruments have different modus operandi as humanitarian assistance tries to address emergency needs, while
335
State-building and Conflict Prevention in Africa
development assistance aims to support long-term development in more stable environments (Crisp 2001, Ogata 2011).
As a consequence of the increasing awareness of the gap, humanitarian agencies became more concerned about their long-term sustainability, while development agencies started to get involved in post-conflict situations much earlier than before. By infusing a long-term perspective into post-conflict assistance, the seamless supports aim at a smooth transition from short-term emergency to long-term institution building for improving the livelihoods of local people.
3. Research Findings from JICA-RI on State-building Efforts
With regard to state-building and conflict prevention, research projects at JICA Research Institute (JICA-RI) are mainly concerned with state legitimacy. Research findings by JICA-RI indicate that international engagement can support state-building by helping improve state legitimacy. Some of the findings are being reflected in JICA’s operational approach, which will be discussed in Section 4.
3.1 Capacity traps and legitimacy trapsIn the article “Capacity Traps and Legitimacy Traps: Development Assistance and State Building in Fragile Situations”, Takeuchi, Murotani, and Tsunekawa (2011) illustrate how the difference in political environment affects the impact of development assistance, and call for heightened awareness of the different types of fragility when donors decide upon their policies. They categorize post-conflict situations into two types: “capacity trap” and “legitimacy trap.” Capacity trap countries are those that have failed to improve state capacity to provide security and basic social services and consequently have failed to establish state legitimacy. Legitimacy trap countries are those that have demonstrated the capacity to provide security and services to the population but suffer from shaky legitimacy due to expanding inequalities and authoritarian management. In this environment, improving state capacity may not necessarily improve state legitimacy. On the contrary, it can further curtail state legitimacy. These two traps create very different contexts in which donors are required to plan their strategies carefully.
336
Chapter 12
3.2 Horizontal Inequalities (HIs)Inequality has always been an important factor that explains grievances and instability. To address group-based grievances, the perspective of horizontal inequalities (HIs), that is, inequalities between identity groups, has been developed.
Based on case studies and quantitative analysis in ten African countries, Mine et al. (Preventing Violent Conflict in Africa: Inequalities, Perceptions and Institutions, 2013) reconfirms the significance of HIs on instability and violent conflict in Africa. Particularly when one group is disadvantaged in multiple dimensions of inequalities (political, social, economic, and cultural), HIs are most likely to cause violent conflicts as demonstrated by the histories of South Africa and Kenya.
In Ethnic Diversity and Economic Instability in Africa: Interdisciplinary Perspectives, Hino et al. (2012) suggest that ethnic diversity, though not leading by itself to inter-group conflict, can be a potent force of instability when HIs are high, and particularly when high HIs coalesce with high vertical inequality within each ethnic community.
In short, the alleviation of inequalities is a necessary condition for enhancing state legitimacy, which is fundamental for long-term state-building.
3.3 People’s perceptions of inequalitiesIn assessing the legitimacy of states, people’s perceptions are sometimes more important than objective HIs, as people take actions based on their subjective beliefs. As advocates for peace-building “from below” argue, successful state-building efforts should be based on the understanding of the perceptions of local people. According to the analysis of Mine et al. (2013), people’s perception of horizontal inequalities (HIs) is not equal to the objective inequality that appears in statistical data. For instance, as observed in Nigeria and Zimbabwe, a group perceiving itself as the poorest is not necessarily the poorest according to social and economic statistics. This implies that external actors should pay attention not only to objective HIs but also to people’s perceptions.
Mine and his associates’ study demonstrates that this distortion of perceptions is most probably associated with political HIs. The groups that are politically marginalized tend to regard themselves as also being
337
State-building and Conflict Prevention in Africa
economically marginalized, even when this contradicts the objective evidence. The Igbo in Nigeria clearly show such tendency. On the other hand, their analysis also indicates that economically advantaged groups tend to behave in a hostile manner through the fear of losing their advantaged positions, when political power relations shift rapidly to their disadvantage. All this evidence points to the importance of political power distribution in post-conflict societies.
Regarding the political HIs, Mine et al. (2013) point to the importance of inclusive mechanisms, either formal or informal, that are open to various identity groups. Their case studies demonstrate the relative political stability of the countries that have power-dispersing mechanisms combining sustainable power-sharing based on informal practices and advanced decentralization. In various Sub-Saharan African countries, informal customs assure every major identity group is represented in decision-making. These power-dispersing mechanisms help fortify legitimacy by means of the inclusive political participation of major groups. If such an arrangement is combined with efficient service delivery and citizen safety (state capacity), the efforts for long-term institution building are on the right track.
JICA’s survey report titled Livelihood and Employment Promotion in Conflict Affected Countries4 (2012) also highlights the importance of people’s perception as a lesson learned from its operational experiences. This survey demonstrates that, although it is important to support socially vulnerable populations such as refugees and IDPs, widows, orphans, traumatized people, and handicapped people, exceptionally generous treatment of these people created tensions within communities in past JICA projects. Special consideration to ex-combatants can also create animosity among other people in local communities. External actors need to be careful of these sentiments and try to build confidence between socially vulnerable people and others within local communities.
4. JICA’s Approach to Support State-building
JICA has already integrated into its field practice many of the insights obtained from past research and discussion on state-building. JICA has been especially eager to support long-term strengthening of institutional
4. Details of the report will be discussed in the Section 4.1.
338
Chapter 12
and individual capacity, especially for the purpose of improving people’s everyday livelihood. Helping the recipient government to effectively connect itself with local residents to strengthen its legitimacy has also been the main goal of JICA activities.
JICA has also promoted “seamless” transition from early humanitarian aid for protection to development assistance for empowerment. This focus requires JICA to get engaged in institution building from the early stages of reconstruction.Finally, JICA has tried to be more attentive to political contexts in each country, and mainstream conflict-sensitivity (“do no harm”) to ensure the positive impact of its activities on state-building.
4.1 Enhancing state capacity and legitimacyThe Government of Japan and JICA have focused their attention more on post-conflict reconstruction and peace-building since the mid-1990s. The revised ODA Charter in 2003 recognizes “human security” as one of its five basic policies, and peace-building as one of its four priority issues. After Sadako Ogata became the President of JICA, JICA integrated the “human security” perspective, especially for conflict-torn countries, as its operational philosophy. As a result, Japan’s ODA spending in 43 countries that the OECD categorized in 2010 as “fragile states”5 increased its share in total ODA spending (net ODA total, excluding debt relief) from 9.86% in 2000 to 24.24% in 2009 (refer to Figure 2).
5. For statistical purposes, OECD chose 43 countries and areas as “fragile states” in 2010 by using CPIA of the World Bank, ISW (Index of State Weakness) of the Brookings Institution, and CIFP (Country Indicators for Foreign Policy Fragility Index) of Carlton University as their benchmarks.
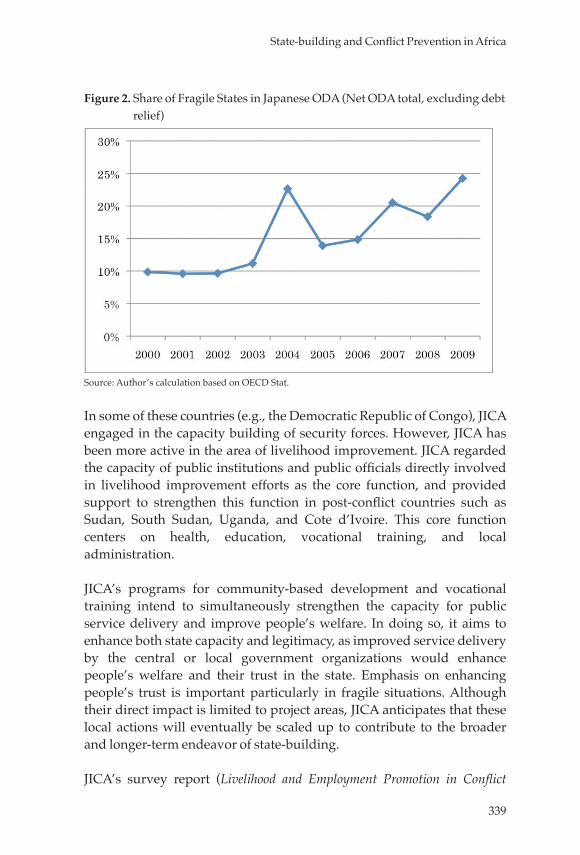
339
State-building and Conflict Prevention in Africa
Figure 2. Share of Fragile States in Japanese ODA (Net ODA total, excluding debt relief)
Source: Author’s calculation based on OECD Stat.
In some of these countries (e.g., the Democratic Republic of Congo), JICA engaged in the capacity building of security forces. However, JICA has been more active in the area of livelihood improvement. JICA regarded the capacity of public institutions and public officials directly involved in livelihood improvement efforts as the core function, and provided support to strengthen this function in post-conflict countries such as Sudan, South Sudan, Uganda, and Cote d’Ivoire. This core function centers on health, education, vocational training, and local administration.
JICA’s programs for community-based development and vocational training intend to simultaneously strengthen the capacity for public service delivery and improve people’s welfare. In doing so, it aims to enhance both state capacity and legitimacy, as improved service delivery by the central or local government organizations would enhance people’s welfare and their trust in the state. Emphasis on enhancing people’s trust is important particularly in fragile situations. Although their direct impact is limited to project areas, JICA anticipates that these local actions will eventually be scaled up to contribute to the broader and longer-term endeavor of state-building.
JICA’s survey report (Livelihood and Employment Promotion in Conflict
340
Chapter 12
Affected Countries, 2012) contains evaluations of twelve such projects for community development and vocational training in nine countries and areas, including seven projects in five Sub-Saharan African countries: South Sudan, Rwanda, Uganda, Eritrea, and the Democratic Republic of Congo (DRC). The following are some of the findings from JICA’s activities aiming at enhancing the capacity and legitimacy of state institutions, especially for livelihood improvement. Though the report is based on simple evaluations not as rigorous as academic research, the lessons learned from the field are suggestive.
■ Capacity development of local public officialsIn these projects, as the lack of individual and organizational capacity is acute in fragile situations, the process of implementation was designed to encourage capacity development of local government organizations. These entities were assigned the responsibility of jointly delivering public services with JICA experts, so that they could learn how to effectively provide services to the local population as on-the-job training.
The Project for Livelihood Improvement in and around Juba for Sustainable Peace and Development (LIPS) in South Sudan and the Study on Community Development in Cataracte District, Bas-Congo Province in the DRC are representative of JICA’s approach to community development, which primarily features the capacity development of government (both local and central) institutions, instead of the provision of benefits to farmers directly or via NGOs. When the LIPS project started in 2009, the government of the Southern Sudan had just four years of experience. Basic policy guidelines and strategies had not been well articulated, and local officers had little experience of working in the field. In the project, the community development officers, after receiving training, cultivated the land in cooperation with farmers, built schools, and supported local farmers in starting businesses. This firsthand experience enhanced the officials’ capacity and motivation. In the Bas-Congo Study, local government officials were directly engaged with local communities in conducting and monitoring pilot projects.
■ Feedback of data and knowledge into national policiesOn several occasions, local governments’ experience of actual service delivery had a feedback effect of updating and improving the policies at higher levels including national development strategies. As most of the conflict-affected countries do not have sufficient statistical data,
341
State-building and Conflict Prevention in Africa
firsthand information from the field can link the voices from below with national policy planning.
One good example is the LIPS project mentioned above. South Sudan’s Ministry of Agriculture and Forestry had had little information on agricultural activities in rural villages until the LIPS project provided them with community development manuals and agricultural technology packages. These documents were prepared on the basis of the field surveys, training, and sub-projects implemented in the LIPS project. The documents and information provided are being utilized to formulate a national agricultural development policy.
In Rwanda, the Project for Strengthening the Capacity of Tumba College of Technology (TCT) resulted in the TCT turning into a model for other vocational training centers. More specifically, the TCT conducted in-company training to strengthen the link between trainees and local companies. The Workforce Development Agency (WDA) of the Rwandan government subsequently adopted in-company training in other vocational training centers.
■ Building confidence in local government institutionsThe nurturing of state legitimacy is important particularly in conflict-affected countries because public service delivery has been suspended for a long period and people may look upon the government as a predatory body rather than a service delivery organization. Under such circumstances, service delivery improvement through participatory planning and implementation can enhance communication between local government officials and citizens and help the local government build confidence among people.
In South Sudan, where public service delivery had barely existed during the war that lasted for more than 20 years, a LIPS sub-project – agricultural extension workers trying to help local farmers – contributed to cultivating local people’s confidence in the new government. Local communities established their own rural development committees and directly negotiated with local governments. Communication between the two has been strengthened significantly in the process.
In the case of northern Uganda, local governments did not have even basic facilities such as city halls and offices; so the Project for
342
Chapter 12
Community Development for Promoting Return and Resettlement of IDPs in Northern Uganda provided offices and multi-purpose halls for a variety of public events such as public meetings, training courses, music festivals, and cooking contests. Local governments intended to foster the sense of affinity among local residents, particularly women’s groups. They also worked closely with returnees in designing sub-projects, so that local people’s trust in government officials would be enhanced.
4.2 Seamless assistanceUnder the leadership of President Sadako Ogata, JICA adopted the human security perspective as one of the key pillars for its operation. The human security perspective emphasizes both protection through emergency relief and empowerment for long-term development.
When Ogata became the president of JICA, she stressed the importance of “seamless” support bridging the gap between humanitarian and development assistance. In its mission statement of 2008, JICA endorsed “seamless assistance that spans everything from prevention of armed conflict and natural disasters to emergency aid following a conflict or disaster, assistance for prompt recovery, and mid- to long-term development assistance” as one of its four strategies.
In Sudan and South Sudan, for example, JICA joined the international joint assessment mission while separately conducted its own survey even before the Comprehensive Peace Agreement (CPA) was signed in 2005. This rapid engagement resulted in quick impact projects in the early recovery period in South Sudan, such as the Juba River port reconstruction. These projects were soon followed by larger development assistance including human resource development to serve long-term development.
4.3 Mainstreaming of conflict-sensitivity JICA has also tried to become more sensitive to negative effects on conflicts and state legitimacy that may be inadvertently caused by the donor’s activities. To avoid such pitfalls, JICA has introduced the Post-Conflict Needs Assessment (PNA) mechanism by which it analyzes potential conflict risks in each context, and pays due consideration to the impacts of such risks on state legitimacy. It stresses the importance of taking into account the coexistence and reconciliation between different social groups within local communities in designing community
343
State-building and Conflict Prevention in Africa
development projects. JICA also plans to introduce the evaluation guideline that incorporate conflict-sensitivity for projects in conflict-affected areas.
One example of such consideration is JICA’s efforts in Sudan and South Sudan that aim at mitigating grievances stemming from economic and social disparities among different regions. In South Sudan, in parallel with the assistance to the Juba areas, JICA has intensified its support to less developed regions such as Malakal. In Sudan, JICA has extended its support to less developed areas including Darfur, the eastern provinces, and Three Protocol Areas.
5. Conclusion
State-building and conflict prevention remain as vital challenges in Africa. Bearing in mind the changing nature of conflicts throughout the continent, the international community has increasingly focused on state-building. To prevent violent conflicts and establish long-term stability, building capable and legitimate state institutions, which look after both public safety and livelihood improvement, is essential.
JICA-RI’s research findings also demonstrate that successful state-building needs the strengthening of state capacity and legitimacy. Legitimacy building is an especially difficult task because it is deeply affected by changeable perceptions of the people. To nurture state legitimacy, horizontal inequalities (HIs) and other inequalities must be tackled. At the same time, inclusive institutions need to be constructed to foster a sense of fairness among the population.
JICA, as well as other development partners, has already started to integrate some of these insights into its planning and implementation. Coordination and mutual learning between donors will also be essential. However, in order to make their efforts to help state-building and conflict prevention more effective and efficient, greater and more persistent attention should be directed to the following points:
(1) Building of inclusive institutionsInclusive institutions are key to consolidating state legitimacy based on stable state-society relations. Inclusive institutions can mitigate the
344
Chapter 12
adverse effects of HIs. This, however, does not mean that attending HIs is not important. HIs need to be reduced since they are a root cause of violent conflicts. Meanwhile, inclusive institutions will help foster consensus and compromise among contending forces. However, institutions should not be imposed upon people by external actors since institutions can be securely established only when major stakeholders accept them as legitimate. What donors can do is to provide the recipient country with the opportunity to learn about current and historical experiences of other countries.
(2) Human security perspective: protection and empowermentIn tackling the challenges of state-building, the human security perspective should always be remembered, as it can provide a comprehensive understanding on state-building (Newman 2011). Human security integrates top-down measures to protect people and bottom-up measures to empower them. Capable institutions to protect people and empowered communities to hold the state accountable and legitimate are essential for bringing about a stable state that can maintain public safety and improve people’s livelihood. The human security perspective supports the seamless transition from emergency relief to long-term development. While top-down measures are necessary to protect people in emergencies, the empowerment of people and local communities are crucial for long-term development.
(3) Local context sensitivityExternal actors need to be sensitive to local contexts so they can avoid doing harm while maximizing the positive impact of their activities. In such assessment of local context, they need to be aware that people’s perceptions are not necessarily equal to statistical data. While HIs need to be reduced, at the same time, donors need to pay attention to how their efforts for HI reduction are perceived by various stakeholders and carefully design their projects. This caution is valid not only at the planning stage but also at the operation stage in which local people directly observe donors’ behavior. Donor coordination and information sharing must be crucial to avoid harming people’s perceptions.
Since the beginning of the millennium, Africa has started to witness a declining number of armed conflicts and battle-related deaths. Though trans-national non-state armed groups may impose new types of challenges on peace-building in Africa, structural problems such as
345
State-building and Conflict Prevention in Africa
poverty, inequality, and other social issues remain crucial for peace and security, and state-building remains imperative for a stable and peaceful Africa. African leaders have strived to establish sustainable peace throughout the continent. Donors can help their efforts by supporting the building of capable and legitimate states if they are sensitive enough to local contexts. TICAD will provide a forum for a wide range of stakeholders to discuss how we all can collaborate to address this crucial challenge.
346
Chapter 12
References
Chesterman, S. 2004. You, the people: The United Nations, transitional administrations and state building. Oxford: Oxford University Press.
Crisp, J. 2001. Mind the gap! UNHCR, humanitarian assistance and the development process. International migration review 35 (1): 168–191.
Fearon, J. D., and D. D. Laitin. 2004. Neotrusteeship and the problem of weak states. International Security 28 (4): 5–43.
Fukuyama, F. 2005. State building: Governance and world order in the twenty-first century. London: Profile Books.
Ghani, A., and C. Lockhart. 2008. Fixing failed states: A framework for rebuilding a fractured world. Oxford: Oxford University Press.
Hilhorst, D., I. Christoplos, and G. Van Der Haar. 2010. Reconstruction “from below:” A new magic bullet or shooting from the hip? Third World Quarterly 31 (7): 1107–1124.
Hino, H., J. Lonsdale, G. Ranis, and F. Stewart, eds. 2012. Ethnic diversity and economic instability in Africa: Interdisciplinary perspectives. Cambridge, UK: Cambridge University Press.
JETRO. 2013. Results of JETRO’s FY2012 survey on business conditions of Japanese-affiliated firms in Africa. Middle East and Africa Division, Overseas Research Department, JETRO, January. http://www.jetro.go.jp/en/news/releases/ 20130123893-news/ (accessed March 27, 2013).
JICA. 2008. Mission Statement: New JICA; Our vision, mission, and strategy. http://www.jica.go.jp/english/about/mission/index.html (accessed March 27, 2013).
JICA. 2012. Livelihood and employment promotion in conflict affected countries: Final report; Executive summary. Survey report.
Krasner, S. D., and C. Pascual. 2005. Addressing state failure. Foreign Affairs 84 (4): 153–63.
Mine, Y., F. Stewart, S. Fukuda-Parr, and T. Mkandawire, eds. 2013 (forthcoming). Preventing violent conflict in Africa: Inequalities, perceptions and institutions. London: Palgrave Macmillan.
Mine, Y., and M. Katayanagi. 2012. Prevention of violent conflicts in Africa. Policy Brief No. 8, JICA Research Institute.
Newman, E. 2011. A human security peace-building agenda. Third World Quarterly 32 (10): 1737–1756.
OECD. 2007. Principles for good international engagement in fragile states and situations. OECD: Paris.
OECD. 2008. Concepts and dilemmas of state building in fragile situations.
347
State-building and Conflict Prevention in Africa
OECD: Paris.OECD. 2010. The state’s legitimacy in fragile situations: Unpacking
complexity. DAC Conflict and Fragility Series. OECD: Paris.OECD. 2011. Supporting statebuilding in situations of conflict and fragility:
Policy guidance. DAC Guidelines and Reference Series. OECD: Paris.
Ogata, S. Inclusive development: Facing the future. In Development co-operation report 2011: 50th anniversary edition, ed. OECD, 91–96. Paris: OECD.
Paris, R., and T. D. Sisk. 2009. The dilemmas of statebuilding: Confronting the contradictions of postwar peace operations. London: Routledge.
Richmond, O. P. 2009. Becoming liberal, unbecoming liberalism: Liberal-local hybridity via the everyday as a response to the paradoxes of liberal peacebuilding. Journal of Intervention and Statebuilding 3 (3): 324–344.
Richmond, O. P., ed. 2011. Palgrave advances in peacebuilding: Critical developments and approaches. London: Palgrave Macmillan.
Roberts, D. 2011. Post-conflict peacebuilding, liberal irrelevance and the locus of legitimacy. International Peacekeeping 18 (4): 410–424.
Shanmugaratnam, N. 2008. Civil war, peace processes and livelihoods. In Between war and peace in Sudan and Sri Lanka, ed. N. Shanmugaratnam, 1–25. Oxford: James Currey.
Stewart, F. 2010. Horizontal inequalities as a cause of conflict: a review of CRISE findings. CRISE Overview No. 1, Centre for Research on Inequality, Human Security and Ethnicity, University of Oxford, Oxford.
Takeuchi, S., R. Murotani, and K. Tsunekawa. 2011. Capacity traps and legitimacy traps: Development assistance and state building in fragile situations. In Catalyzing development: A new vision for aid, ed. H. Kharas, K. Makino and W. Jung, 127–154. Washington, DC: Brookings Institution Press.
World Bank. 2011. World development report 2011: Conflict, security, and development. Washington, DC: World Bank.

Part Ⅳ: South-South Cooperation for Knowledge
Exchange

351
Chapter 13: South-South and Triangular Cooperation for Sub-Saharan Africa’s Development –With special emphasis on knowledge exchange and co-creation
Shunichiro Honda, Hiroshi Kato and Yukimi Shimoda
1. Introduction
This chapter looks at South-South Cooperation (SSC) and Triangular Cooperation (TrC) in the context of the development of Sub-Saharan Africa (SSA). The reason for our focus on SSC and TrC1 is twofold. First and most importantly, SSC/TrC has been one of the central principles underpinning and guiding the TICAD process since its beginning in 1993. And second, SSC/TrC has become the key theme both in the UN fora (UN 2012a) and the global process on development effectiveness agenda especially since the 2011 Fourth High Level Forum on Aid Effectiveness (HLF4) in Busan, which strongly highlighted SSC as well as TrC (Global Partnership for Effective Development Cooperation 2011).2
This paper has two specific objectives. One is to give a broad picture of
1. As to the definition of SSC and TrC, we rely on the definition of the UN, which reads as follows: “South-South cooperation development is a process whereby two or more developing countries pursue their individual and/or shared national capacity development objectives through exchanges of knowledge, skills, resources and technical know-how, and through regional and interregional collective actions, including partnerships involving governments, regional organizations, civil society, academia and the private sector, for their individual and/or mutual benefit within and across regions. South-South cooperation is not a substitute for, but rather a complement to, North-South cooperation (UN 2012b, p.5).”“Triangular cooperation involves Southern-driven partnerships between two or more developing countries supported by a developed country (ies)/or multilateral organization(s) to implement development cooperation programs and projects (UN 2012b, p.5).”2. HLF4 emphasized that “South-South and triangular cooperation have the potential to transform developing countries’ policies and approaches to service delivery by bringing effective, locally owned solutions that are appropriate to country contexts” (Global Partnership for Effective Development Cooperation 2011: p.9).
352
Chapter 13
the current state of SSC vis-à-vis SSA, given the increasing interest and actual involvement in African development by the Southern partners. And the other is to take a closer look at, among various forms of SSC/TrC, how knowledge exchange and co-creation is happening, based on JICA’s experiences in facilitating such processes by means of TrC.3
The body of the chapter consists of two parts. Section 2 is an overview of SSC/TrC targeting SSA. Section 3 will try to share some of Japan’s experience in supporting knowledge exchange and co-creation through TrC.
2. SSC/TrC: Overview of Trends and Issues 2.1 Africa as the central actor in SSCSSC itself is an age-old phenomenon, and Africa, together with Asia, has always been at the center of the movement. Cooperation among the South, particularly on the aspect of economic cooperation, dates back to 1955 when the Asia-Africa Conference was held in Bandung, Indonesia, to discuss Afro-Asian economic and cultural cooperation. In the subsequent decades, developing countries pressed further ahead to form a group to push their economic interests (Cheru 2011).4 Such a movement first culminated in the Non-Aligned Movement (NAM) involving more than 100 countries. Then in 1964, G 77, a forum for developing countries to articulate and promote their collective interests relating to the global economy was formed within the United Nations (UN). Throughout, Africa was at the center of the movements.
During the 1970s, several key resolutions and policy documents on technical cooperation among developing countries (TCDC) were adopted, which then culminated in the adoption of “the Buenos Aires Plan of Action (BAPA)” at the UN Conference on TCDC held in 1978. The action plan laid out both the conceptual and operational framework for TCDC promotion, which, to this day, remains as the main reference document (UN 1995). Following the launch of BAPA, there were also moves on the economic cooperation front, such as the Caracas Programme of Action adopted by the High-level Conference on 3. The South-South knowledge exchange in the context of African development seems to have been receiving inadequate attention compared to South-South trade and financing in Africa (UNCTAD 2010; UN 2008; Kragelund 2012).4. The South-South partnership in the field of economic cooperation has until recently been termed as Economic Cooperation among Developing Countries (ECDC) in UN fora.
353
South-South and Triangular Cooperation for Sub-Saharan Africa’s Development
–With special emphasis on knowledge exchange and co-creation
Economic Cooperation among Developing Countries (ECDC) in May 1981.
Such high levels of interest in SSC (including ECDC), however, waned in the following decades.5 Nonetheless, several notable actions on SSC/TrC started in the 1990s. In 1993, the UN General Assembly endorsed the strategy and framework for the promotion and application of TCDC (UN Resolution 48/172).6 And it was around this time that the first TICAD was co-organized in Tokyo by the Government of Japan, the Global Coalition for Africa (GCA)7 and the UN. In spite of the rather somber situation surrounding SSC at the time, the Tokyo Declaration for African Development adopted at the 1993 TICAD underscored the importance of SSC, especially the exchange of development knowledge and experience between Asia and Africa. The conference declaration read as follows:
We, the participants of TICAD, recognize that development achievement in East and South-East Asia have[sic] enhanced opportunities for South-South cooperation with Africa. We welcome the interest shown by some Asian and African countries in promoting this cooperation.8
The strong focus on SSC by the first TICAD then led to the holding of the Asia-Africa Forum in Bandung in the following year. The subsequent Tokyo Agenda of Action adopted during the second TICAD in 1998 further went on to highlight intra-African cooperation (TICAD 1998). At TICAD III in 2003, after the launch of the New Partnership for Africa’s Development (NEPAD) in 2001 and African Union (AU) in 2002, the participants reviewed the achievements and challenges of the preceding ten years and acknowledged the tangible contributions of the TICAD process in continuously upholding and supporting SSC/TrC practices, especially Asia and Africa cooperation. Building on the review results, its tenth anniversary declaration urged African countries and partners to
5. Manning pointed out that such decline of development cooperation from non-DAC states resulted in the dominance of aid from DAC countries and multi-lateral organizations up until the mid-2000s(Manning 2006). 6. DAC also endorsed the importance of SSC in its document of Principles on the New Orientations in Technical Cooperation (OECD/DAC 1991). 7. GCA was later replaced by the Africa Union (AU) following its establishment in 2002. The World Bank joined the TICAD process as co-organizers from the second TICAD. 8. Tokyo Declaration for African Development 1993 (TICAD 1993 Paragraph 26)

354
Chapter 13
further strengthen their partnership in the spirit of solidarity (TICAD 2003). In furthering the achievement of the past TICAD process, the “Yokohama Declaration towards a vibrant Africa”, the outcome document of the fourth TICAD was presented in 2008 (TICAD2008).
The centrality of SSC/TrC came to be reaffirmed in December 2009 with the Nairobi Outcome Document being adopted at the United Nations High-Level Conference on South-South Cooperation in Nairobi (UN 2010). Organized as the 30th anniversary of the 1978 Conference on TCDC in Buenos Aires, the conference set out the overall UN SSC/TrC framework.9 Such heightened energy surrounding this theme has also started to be felt in other global fora, such as the global monitoring process of the Paris Declaration on Aid Effectiveness. SSC/TrC was registered as one of the major agenda items at the HLF4. The outcome document of the Busan Forum, namely the Global Partnership for Effective Development Cooperation, strongly featured the theme as a highly promising approach for effective development cooperation in coming years.
Thus, in the history of the development of SSC/TrC as an effective means for development cooperation, Africa has been playing a dual role – both the central promoter and beneficiary. We also note that the TICAD process has been instrumental in supporting African countries’ efforts in SSC.
2.2 The current state of SSC for Sub-Saharan Africa10
The limited availability of data makes it nearly impossible to capture exactly the magnitude and breadth of SSC and TrC for SSA including technical cooperation (TC), which is the main aid instruments for knowledge exchange and co-creation. Currently accessible data is from the OECD Creditor Reporting System (CRS), which incorporates data from the limited numbers of non-DAC donors, including non-DAC
9. The document was formally endorsed at the 66th General Assembly in February 2010. After the conference actions to translate the Nairobi outcome document into practice got into full swing. A prime example is the annual Global South-South Development Expo (GSSD Expo) with the UN office for South-South Cooperation (UNOSSC) as its main secretariat.10. The Republic of Korea, which has often been included among the emerging donors, is not fully covered in this paper as it has been a DAC member only since 2009. Nevertheless, as a relatively new donor country, it is worth noting that Korea is among the active donors in knowledge promotion such as through its Knowledge Sharing Program (KSP) implemented by the Korea Development Institute (KDI).
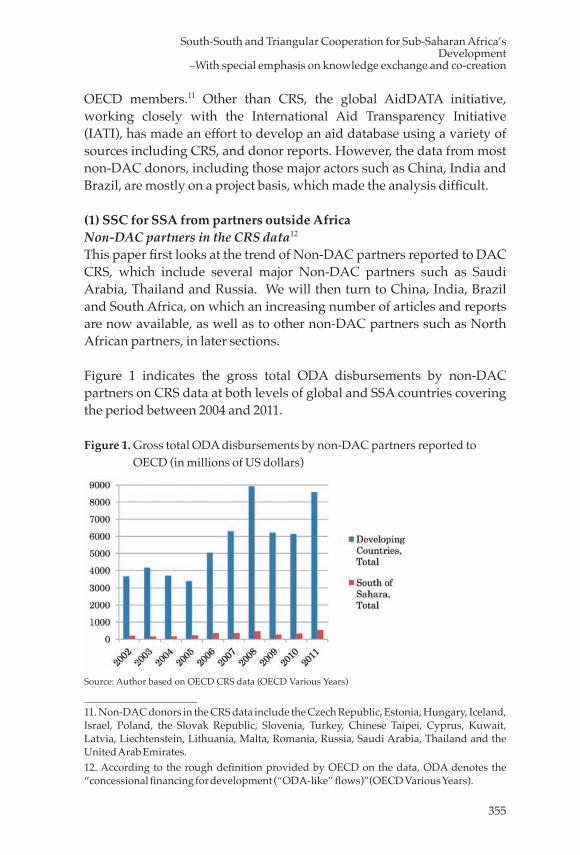
355
South-South and Triangular Cooperation for Sub-Saharan Africa’s Development
–With special emphasis on knowledge exchange and co-creation
OECD members.11 Other than CRS, the global AidDATA initiative, working closely with the International Aid Transparency Initiative (IATI), has made an effort to develop an aid database using a variety of sources including CRS, and donor reports. However, the data from most non-DAC donors, including those major actors such as China, India and Brazil, are mostly on a project basis, which made the analysis difficult.
(1) SSC for SSA from partners outside AfricaNon-DAC partners in the CRS data12
This paper first looks at the trend of Non-DAC partners reported to DAC CRS, which include several major Non-DAC partners such as Saudi Arabia, Thailand and Russia. We will then turn to China, India, Brazil and South Africa, on which an increasing number of articles and reports are now available, as well as to other non-DAC partners such as North African partners, in later sections.
Figure 1 indicates the gross total ODA disbursements by non-DAC partners on CRS data at both levels of global and SSA countries covering the period between 2004 and 2011.
Figure 1. Gross total ODA disbursements by non-DAC partners reported to OECD (in millions of US dollars)
Source: Author based on OECD CRS data (OECD Various Years)
11. Non-DAC donors in the CRS data include the Czech Republic, Estonia, Hungary, Iceland, Israel, Poland, the Slovak Republic, Slovenia, Turkey, Chinese Taipei, Cyprus, Kuwait, Latvia, Liechtenstein, Lithuania, Malta, Romania, Russia, Saudi Arabia, Thailand and the United Arab Emirates.12. According to the rough definition provided by OECD on the data, ODA denotes the “concessional financing for development (“ODA-like” flows)”(OECD Various Years).
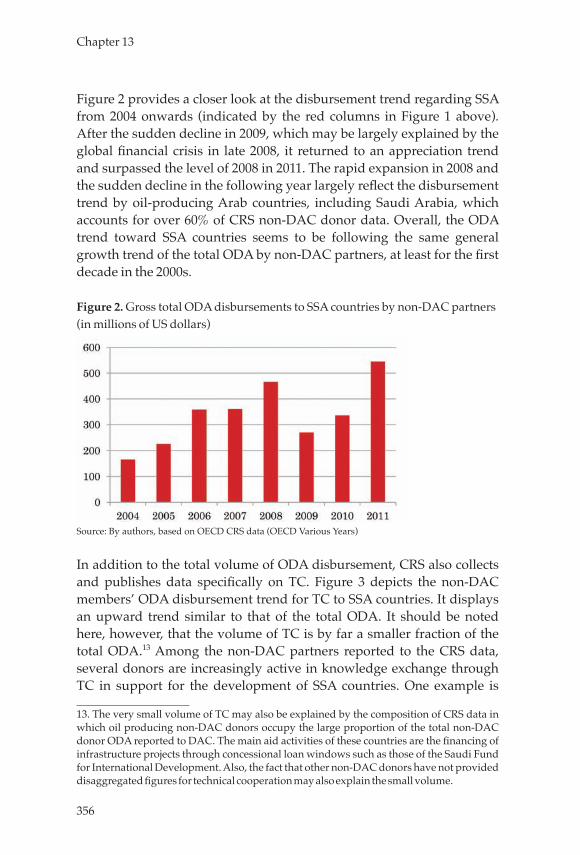
356
Chapter 13
Figure 2 provides a closer look at the disbursement trend regarding SSA from 2004 onwards (indicated by the red columns in Figure 1 above). After the sudden decline in 2009, which may be largely explained by the global financial crisis in late 2008, it returned to an appreciation trend and surpassed the level of 2008 in 2011. The rapid expansion in 2008 and the sudden decline in the following year largely reflect the disbursement trend by oil-producing Arab countries, including Saudi Arabia, which accounts for over 60% of CRS non-DAC donor data. Overall, the ODA trend toward SSA countries seems to be following the same general growth trend of the total ODA by non-DAC partners, at least for the first decade in the 2000s.
Figure 2. Gross total ODA disbursements to SSA countries by non-DAC partners (in millions of US dollars)
Source: By authors, based on OECD CRS data (OECD Various Years)
In addition to the total volume of ODA disbursement, CRS also collects and publishes data specifically on TC. Figure 3 depicts the non-DAC members’ ODA disbursement trend for TC to SSA countries. It displays an upward trend similar to that of the total ODA. It should be noted here, however, that the volume of TC is by far a smaller fraction of the total ODA.13 Among the non-DAC partners reported to the CRS data, several donors are increasingly active in knowledge exchange through TC in support for the development of SSA countries. One example is
13. The very small volume of TC may also be explained by the composition of CRS data in which oil producing non-DAC donors occupy the large proportion of the total non-DAC donor ODA reported to DAC. The main aid activities of these countries are the financing of infrastructure projects through concessional loan windows such as those of the Saudi Fund for International Development. Also, the fact that other non-DAC donors have not provided disaggregated figures for technical cooperation may also explain the small volume.
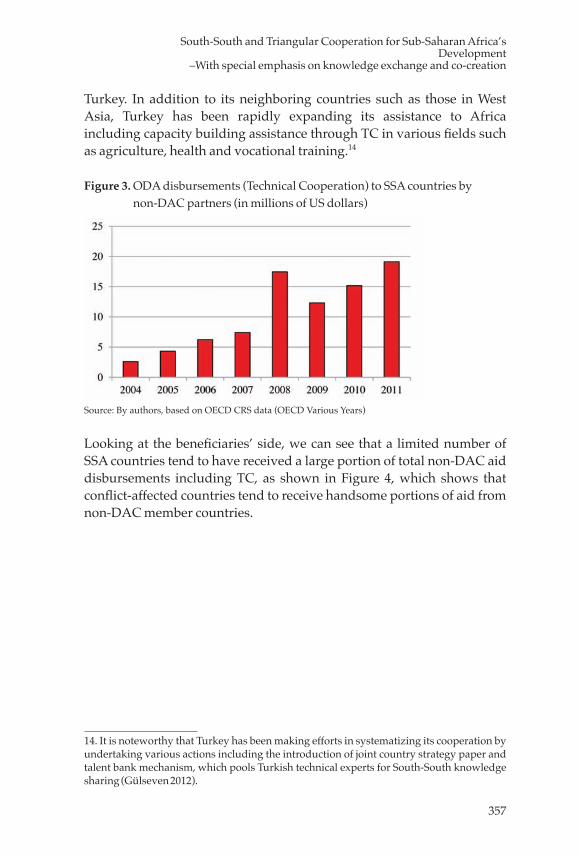
357
South-South and Triangular Cooperation for Sub-Saharan Africa’s Development
–With special emphasis on knowledge exchange and co-creation
Turkey. In addition to its neighboring countries such as those in West Asia, Turkey has been rapidly expanding its assistance to Africa including capacity building assistance through TC in various fields such as agriculture, health and vocational training.14
Figure 3. ODA disbursements (Technical Cooperation) to SSA countries by non-DAC partners (in millions of US dollars)
Source: By authors, based on OECD CRS data (OECD Various Years)
Looking at the beneficiaries’ side, we can see that a limited number of SSA countries tend to have received a large portion of total non-DAC aid disbursements including TC, as shown in Figure 4, which shows that conflict-affected countries tend to receive handsome portions of aid from non-DAC member countries.
14. It is noteworthy that Turkey has been making efforts in systematizing its cooperation by undertaking various actions including the introduction of joint country strategy paper and talent bank mechanism, which pools Turkish technical experts for South-South knowledge sharing (Gülseven 2012).
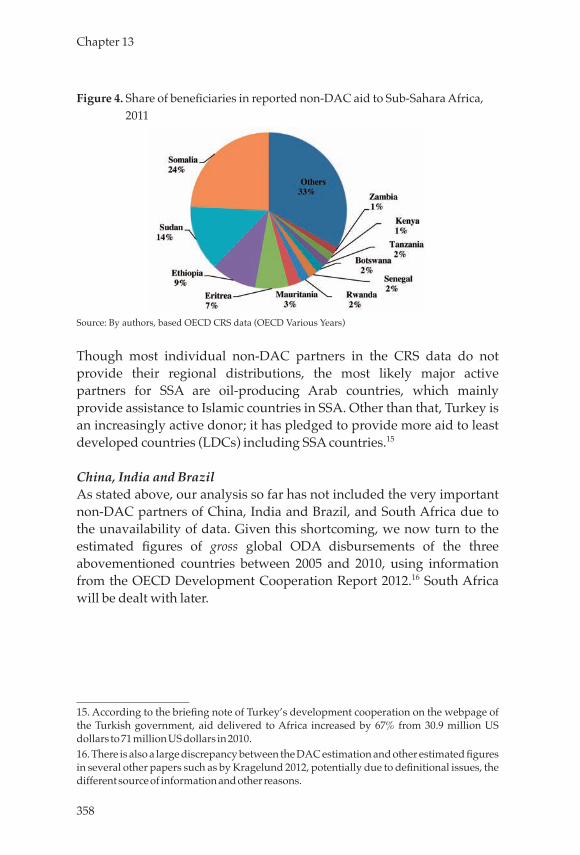
358
Chapter 13
Figure 4. Share of beneficiaries in reported non-DAC aid to Sub-Sahara Africa, 2011
Source: By authors, based OECD CRS data (OECD Various Years)
Though most individual non-DAC partners in the CRS data do not provide their regional distributions, the most likely major active partners for SSA are oil-producing Arab countries, which mainly provide assistance to Islamic countries in SSA. Other than that, Turkey is an increasingly active donor; it has pledged to provide more aid to least developed countries (LDCs) including SSA countries.15
China, India and BrazilAs stated above, our analysis so far has not included the very important non-DAC partners of China, India and Brazil, and South Africa due to the unavailability of data. Given this shortcoming, we now turn to the estimated figures of gross global ODA disbursements of the three abovementioned countries between 2005 and 2010, using information from the OECD Development Cooperation Report 2012.16 South Africa will be dealt with later.
15. According to the briefing note of Turkey’s development cooperation on the webpage of the Turkish government, aid delivered to Africa increased by 67% from 30.9 million US dollars to 71 million US dollars in 2010. 16. There is also a large discrepancy between the DAC estimation and other estimated figures in several other papers such as by Kragelund 2012, potentially due to definitional issues, the different source of information and other reasons.
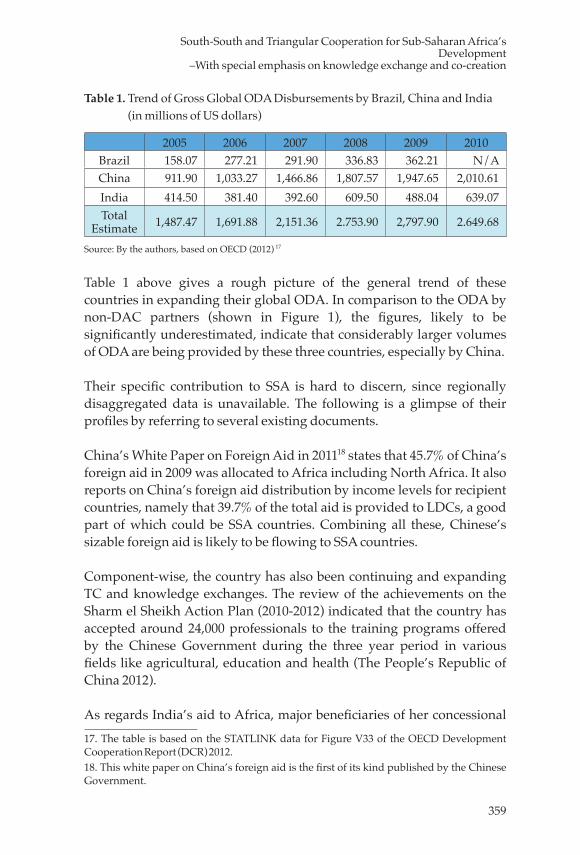
359
South-South and Triangular Cooperation for Sub-Saharan Africa’s Development
–With special emphasis on knowledge exchange and co-creation
Table 1. Trend of Gross Global ODA Disbursements by Brazil, China and India (in millions of US dollars)
2005 2006 2007 2008 2009 2010Brazil 158.07 277.21 291.90 336.83 362.21 N/A China 911.90 1,033.27 1,466.86 1,807.57 1,947.65 2,010.61 India 414.50 381.40 392.60 609.50 488.04 639.07 Total
Estimate 1,487.47 1,691.88 2,151.36 2.753.90 2,797.90 2.649.68
Source: By the authors, based on OECD (2012) 17
Table 1 above gives a rough picture of the general trend of these countries in expanding their global ODA. In comparison to the ODA by non-DAC partners (shown in Figure 1), the figures, likely to be significantly underestimated, indicate that considerably larger volumes of ODA are being provided by these three countries, especially by China.
Their specific contribution to SSA is hard to discern, since regionally disaggregated data is unavailable. The following is a glimpse of their profiles by referring to several existing documents.
China’s White Paper on Foreign Aid in 201118 states that 45.7% of China’s foreign aid in 2009 was allocated to Africa including North Africa. It also reports on China’s foreign aid distribution by income levels for recipient countries, namely that 39.7% of the total aid is provided to LDCs, a good part of which could be SSA countries. Combining all these, Chinese’s sizable foreign aid is likely to be flowing to SSA countries.
Component-wise, the country has also been continuing and expanding TC and knowledge exchanges. The review of the achievements on the Sharm el Sheikh Action Plan (2010-2012) indicated that the country has accepted around 24,000 professionals to the training programs offered by the Chinese Government during the three year period in various fields like agricultural, education and health (The People’s Republic of China 2012).
As regards India’s aid to Africa, major beneficiaries of her concessional 17. The table is based on the STATLINK data for Figure V33 of the OECD Development Cooperation Report (DCR) 2012.18. This white paper on China’s foreign aid is the first of its kind published by the Chinese Government.
360
Chapter 13
loan aid through the EXIM Bank from 2003 to 2007 (Indian financial years) include Sudan (21%), Ethiopia (7%) and Mali (5%) (Kondoh et al. 2010, pp.33-34). Under the Africa-India Partnership for Enhanced Cooperation adopted in 2011, training opportunities for over 1,200 professionals for Africa have been provided between 2011-12 (AIFS 2011).
Brazil’s SSC, according to the 2009 figure, amounted to over 362 million US dollars,19 out of which 14% is delivered through TC. In spite of the traditional focus on its support to neighboring countries in Latin American, Brazil is expanding its support to SSA. Moreover, it has also started to extend its assistance to non-Lusophone African countries like Ghana and Burkina Faso.20
(2) SSC partners in the African continentHaving looked at the partners outside the continent, we now turn to SSC partnerships on the African continent.
Regional mechanisms for intra-Africa collaborationFirst and foremost, the regional organs such as the African Union Commission (AUC), with its development arm of NEPAD and sub-regional organs like SADC and EAC, have played and are increasingly playing larger roles in intra-Africa development cooperation and knowledge facilitation. As part of their mandate, these regional and sub-regional organs have organized various programs and initiatives, which aim to promote the coordinated actions of development cooperation and sharing of knowledge and experience among African countries. Specifically regarding SSC, the AU and NEPAD formulated the African Platform for Development Effectiveness (APDev) in July 2010, with SSC as one of the three thematic thrusts (NEPAD n.d.). In more specific fields, the AUC and NEPAD Agency and the African Development Bank (ADB) have formed an initiative, namely the Programme for Infrastructure Development in Africa (PIDA), for the purpose of coordinated region-wide actions on infrastructure development (e.g., energy, transport, water, and ICT) in Africa (PIDA n.d.). In other areas such as agriculture,
19. This figure only covers the grant portion of aid provided by the Federal Government and excludes concessional loans, debt relief and cooperation by state and local governments (OECD 2012 p.260).20. However, according to the report by the Brazilian Government, African Portuguese-speaking countries still account for 55% of Brazil’s resources for TC in Africa (Brazilian International Cooperation Agency 2010).
361
South-South and Triangular Cooperation for Sub-Saharan Africa’s Development
–With special emphasis on knowledge exchange and co-creation
the Comprehensive Africa Agriculture Development Programme (CAADP) coordinated by NEPAD has been formulated to create a multilateral framework for agricultural development (CAADP n.d.) involving a broad range of stakeholders including state institutions, NGOs, the private sector and research organs in and outside Africa.21
The African Peer Review Mechanism (APRM) is an innovative NEPAD initiative worth mentioning. APRM is an African-led self-monitoring mechanism for political, economic and corporate governance among African countries that voluntarily acceded to it.22 The APRM process of review and the follow-up actions involve not only the government but also other actors such as civil societies and the private sector. As of the end of 2011, 14 countries had been peer-reviewed (APR Secretariat 2012). Though criticisms remain on its limited abilities to hold African leaders accountable, it has certainly offered rare opportunities for mutual learning among African countries on their governance challenges (Grutz 2010). We now turn to look at individual, prominent SSC partner countries in the African continent: South Africa, and North African countries, notably Egypt, Tunisia, and Morocco.
South Africa23
Being a BRICS country, South Africa is by far the major actor in SSC in Sub-Saharan Africa with its GDP roughly 40 times larger than average SSA economies. South Africa’s cooperation toward African peer countries covers a wide range of activities like aid, trade, security, and politics, which goes beyond the OECD-DAC’s categories.24
Since 2009 when President Zuma took office, the process of institutional development for SSC has been rapidly progressing, including the establishment of the South African Development Partnership Agency (SADPA), envisaged to be a unified agency for international cooperation, and of the Partnership Fund for Development, which will replace the African Renaissance and International Cooperation Fund (ARF). The
21. NEPAD has also opened a virtual space for the community of practice involving various themes including infrastructure and agriculture. The access to the community of practice for food security is http://www.nepad.org/foodsecurity/group.22.Thirty three member countries were in APRM as at January 2013 (APR Secretariat 2013). 23. This section draws heavily on Vickers (2012).24. In 2010, South Africa received about US$1,000 in net ODA. According to Vickers (2012, footnote 1 in p. 536), about 2.2 % of South Africa’s ODA was to Africa over the period 2000-2010.
362
Chapter 13
Department of International Relations and Cooperation (DIRCO), renamed from the Department of Foreign Affairs, was also established in 2010 for the purpose of “promoting South Africa’s national interests and values” and “the African Renaissance” (DIRCO 2010, p. 6). In April 2012, the concept of SADPA was formally approved by the government. The establishment of SADPA will bring a wide range of changes, including stricter project assessment, mobilization of multiple funding sources, and using various modes of cooperation with emphasis placed on grants and TC.
The notable characteristic of South African cooperation is the country’s active support in the areas of peace building, democratic governance and public sector capacity development including public financial management. This largely reflects the historical pathways along which the country has traveled in the post-Apartheid era.
South Africa has been contributing to sub-regional integration by participating in political and economic regional frameworks, such as the Southern African Customs Union (SACU), the Southern African Development Community (SADC), the SADC free trade area, and the Spatial Development Initiative (SDI).
Egypt25
Egypt has been an age-old actor of SSC since the 1970s, particularly in Africa and the Middle East, while learning from development experience gained from other regions including Asia. Egypt prioritizes SSC in its foreign policy, with four principle regions: “free trade areas; foreign direct investment; TC; and exerting efforts for the region’s positive integration into the global economy” (PEMA 2008, p. 8).
There are two funds for Egyptian SSC: one is the Egyptian Fund for Technical Co-operation with Africa (EFTCA) and the other is the Egyptian Fund for Technical Co-operation with the Commonwealth (EFTCC). The EFTCA started its activities in 1991 in order to consolidate and support cooperation between Egypt and other African countries. Its main activities have been organizing training courses, dispatching experts, and offering emergency humanitarian assistance to countries affected by natural disasters. Under the framework of the EFTCA, Egypt has helped more than 30 African countries, managed at least 45 projects,
25. This section chiefly draws on PEMA 2008 and JICA 2007.
363
South-South and Triangular Cooperation for Sub-Saharan Africa’s Development
–With special emphasis on knowledge exchange and co-creation
dispatched at least 90 short-term and 140 long-term experts in the areas of health, agriculture, water resources, and education, and provided food, medicine, and logistics assistance to many African countries (INSouth n.d.). The other fund, EFTCC, has organized various training courses in the areas of tourism, culture, crime and investigation, the Arabic language, migration, and medical industries for many CIS countries such as Uzbekistan, Moldova, Kazakhstan, Georgia, Albania, Armenia, Tajikistan, Russia, and Mongolia. Egypt also conducts SSC with other partners such as the EU, USAID, Norway, China and Korea, as well as Japan.
Tunisia26
Under the supervision of the Ministry of Planning and International Cooperation, Tunisia has been actively promoting and implementing SSC through the Tunisian Agency of Technical Cooperation (ATCT) established in 1972. The ATCT is obliged to implement the national policy of TC. It has regional offices in Kuwait, Oman, Mauritania, Qatar, Saudi Arabia, and the United Arab Emirates. Its missions include mobilizing appropriate Tunisian human resources to work abroad through TC, providing training for foreign professionals, carrying out technical assistance projects, and promoting SSC/TrC. Tunisia’s SSC for Africa covers various areas: poverty reduction, health, vocational training, banking, agriculture, water and the environment, telecommunications, and women’s empowerment. The ATCT has dispatched more than 30,000 Tunisian professionals and experts abroad for foreign employers, public and private institutions, and regional and international organizations. It also has provided tailor-made training and standard training programs for 3,000 foreign professionals from more than 39 countries, mainly African countries. These training programs are organized in specialized institutions within the country or by dispatching experts to participants’ countries, in cooperation with WB, UNDP, USAID, IDB, GTZ, and JICA.
Morocco27
Morocco is a member of the League of Arab States and the Arab Maghreb Union, and maintains friendly ties with the West. Morocco withdrew from the Organization of African Unity (AOU) in 1984 due to its territorial dispute over the Western Sahara. It is currently the only
26. This section draws chiefly on ATCT n.d.27. This section mainly draws on AMCI n.d. and JICA 2012d.
364
Chapter 13
African country which is not a member of the AU. However, Morocco also places emphasis on measures for Africa. As a foreign policy, Morocco has been promoting cooperation with African and Arab partners.
The Moroccan Agency for International Cooperation (AMCI) established in 1986 has been playing an active role in implementing SSC activities. The AMCI provides 1) training, particularly for foreign students and executives, 2) technical cooperation, and 3) economic and financial cooperation. Morocco receives about 8,000 students (including 6,500 scholarship recipients) from 42 countries, the majority of whom are from African countries. Following South Africa, which is the top investor in Africa, Morocco occupies second place.
The TC provided by the AMCI is to strengthen SSC in various areas through long-, medium-, and short-term training, study visits, dispatching experts, and implementation of joint programs. Partners of Morocco’s SSC activities vary: countries of the South for bilateral cooperation, traditional donor countries for triangular cooperation, and international organizations and agencies for multilateral cooperation. The number of beneficiary countries increased from 6 in 2000 to 22 in 2006.
Morocco has also provided economic and financial cooperation since the mid-1990s to support micro-projects in education, health, and small hydro.
2.3 TrC and Sub-Saharan AfricaTrC has been increasingly recognized as a vital modality in support of SSC. Most TrC is delivered through technical cooperation (TCs) including training and dispatch of experts. Its main advantage derives from the opportunities it provides for combining the expertise of diverse development actors28 – expertise likely to fit the needs of partner countries having similar development challenges. Traditional donors including DAC bilateral donors as well as multilateral development institutions can complement such endeavors through the provision of additional financing and knowledge. Hosono argues that “South and North can collaborate on knowledge creation, knowledge exchange,
28. More rigorous analysis regarding the effectiveness of TrC is a remaining challenge (McEwan 2012).
365
South-South and Triangular Cooperation for Sub-Saharan Africa’s Development
–With special emphasis on knowledge exchange and co-creation
capacity development, and institution building to implement development solutions at scale.”
Below we will have a brief look at TrC’s development trends and current status. In fact, a significant part of SSC reviewed above has been conducted as part of the broader triangular partnership.
(1) The trend of TrC by major multilaterals and DAC donorsGlobally, the most active bilateral donors in TrC are Japan, Germany and Spain, among which Japan has been widely recognized as the long-standing major actor for years (UN 2008; TT-SSC 2010). Regarding the multilateral institutions, UN specialized agencies including the UN Office of South-South Cooperation (UNOSSC), former Special Unit for South-South Cooperation, UNDP and World Bank are counted as the notable promoters of and contributors to TrC.
Aside from Japan, the details of whose TrC practices for SSA will be touched on in the next section, Germany has been the major TrC contributor mainly through GIZ. Though Latin America has been the main region for German TrC, it has also applied TrC to other regions including SSA (TT-SSC 2010). One example was the collaboration between Germany and Brazil to help strengthen the National Institute of Standardization and Quality (INNOQ) in Mozambique to improve the quality standards of products in Mozambique building on the capacity developed in the National Institute of Metrology, Standardization and Industrial Quality (INMETRO) in Brazil with past GIZ assistance (TT-SSC n.d.a).
As exemplified by the various declarations and guidelines illustrated in the preceding sections, the UN system has been a key promoter and actor in TrC for many years with UNOSSC as the focal point of the entire system. UNOSSC offers diverse modalities for the promotion and support of SSC/TrC to its partners. It manages the UN’s major trust fund for SSC/TrC, namely the United Nations Fund for South-South Cooperation. Through a cost-sharing arrangement, it also cooperates with donor governments, including Japan, to support SSC/TrC initiatives. Some major events organized by UNOSSC are supported by this cost-sharing modality, one of which is the annual Global South-South Development EXPO to showcase successful Southern development solutions to the complex challenges facing the South.
366
Chapter 13
UNOSSC also provides management services to various funds including the G-77’s Perez-Gurrero Trust Fund for South-South Cooperation and the India, Brazil and South Africa Facility for Poverty and Hunger Alleviation. It has recently established other new mechanisms such as the South-South Global Assets and Technological Exchange (SS-GATE), which supports the South-South public-private partnership through the provision of financial and other knowledge facilitation support.
Other UN specialized agencies such as UNEP, UNIDO and ILO have long engaged in TrC. For instance, in the furtherance of its TrC, UNEP has recently launched the South-South Cooperation Exchange Mechanism for capacity development and technology transfer in the environmental and sustainable development field, which is the online platform to exchange cases of innovative field practices in addition to its more traditional support to SSC through training, workshops and forums (UNEP n.d.).
The World Bank Institute (WBI), the training and knowledge exchange arm of the Bank, is also in the process of further strengthening its function as the support organ for south-south knowledge exchange and capacity development. WBI is using a broad range of SS exchange instruments including the South-South Experience Exchange Trust Fund (SSEETF), a catalytic funding mechanism launched in 2008 for demand-driven SSC initiatives, the Global Development Learning Network (GDLN), a mechanism to promote learning by linking affiliated institutions with ICT such as video-conferencing systems, and also support to regional centers of excellence such as the Zimbabwe-based African Capacity Building Foundation (ACBF), a multi-lateral foundation to support capacity development in policy formulation and public management.
(2) JICA’s triangular practice for SSA29 Japan has been widely recognized as the long-standing major bilateral actor in triangular cooperation (UN 2008, Fordelone 2009, TT-SSC 2010). The advent of JICA’s TrC dates back to 1975, the early days of SSC. Japan has been noted for the advancement of institutionalization regarding its engagement in SSC/TrC, which is still rare among DAC bilateral donors. The SSC/TrC has been clearly stated as one of the central approaches of Japan’s ODA in its ODA charter (Government of Japan 2003), mid-term
29. This section draws on JICA’s internal documents.
367
South-South and Triangular Cooperation for Sub-Saharan Africa’s Development
–With special emphasis on knowledge exchange and co-creation
policy (Government of Japan 2005) and JICA’s thematic guideline of SSC (JICA 2005).
Over the years, the volume and regional coverage of Japan’s TrC has been expanded and diversified for greater impact. The major form of Japan’s TrC has been what is called third-country training, or triangular training programs (JICA 2011). Many of these training programs in various fields are offered by the organizations in developing countries, which have built up their expertise and capacity in their respective areas through prior bilateral technical cooperation with JICA and other bilateral and multilateral aid agencies.
Among the regions, participants from SSA have steadily increased, especially since the second half of the 1990s following the launch of the first TICAD in 1993. In 1993, the number of participants from SSA was below 200, which is around 11% of the total beneficiaries in the year. By 2011, the number increased to 1,228 participants; the equivalent of 34% of the total participants (3,780). Also, it is noteworthy that several SSA countries like Ghana, Kenya, Senegal and Tanzania have become active in providing training for other SSA countries, the beneficiaries of which amounted to 381 participants in 2011. This implies that regional centers of excellence, which have knowledge and experiences to share with fellow countries, can be nurtured whatever the level of national income. Other than triangular training programs, JICA also helped dispatch experts from pivotal countries, though its size remains modest, with 23 experts in 2011.
To improve the impact, many of these training and expert dispatch programs have been combined with other aid instruments such as financial assistance within the broader program and project packages including the case of the African Institute of Capacity Development (AICAD), which we will look at shortly. New types of TrC approaches such as the establishment of a regional network as the community of practice, the increased use of ICT including videoconferencing and Internet-based information sharing have also been increasingly adopted, which will also be illustrated later.
To institutionalize TrC, Japan has adopted a system called partnership programs. Over the years, Japan has built up a framework to support SSC by partnering with countries with substantial capabilities for and
368
Chapter 13
willingness to promote SSC (JICA 2009). On the African continent, Japan has partnership programs with three countries: Egypt, Tunisia and Morocco.
In cooperation with the EFTCA in Egypt, JICA started implementing triangular training programs in 1985. In 1998, as an output of TICAD II, Egypt and Japan signed a partnership program, namely the Japan-Egypt Triangular Technical Cooperation Programme for the Promotion of South-South Cooperation in Africa. By 2012, Japan and Egypt cooperated in organizing more than 20 training programs on various themes such as rice cultivation and infectious disease prevention, and accepted about 2,200 participants from 49 SSA countries. The idea of cost-sharing was also introduced. Under the Programme, the two countries have been jointly implementing TC activities to support the socio-economic development of African countries by organizing international training and dispatching experts.
Tunisia entered into partnership with Japan in 1999, when the two governments signed the Japan-Tunisia Triangular Technical Cooperation Programme for the Promotion of South-South Cooperation in Africa. Many activities under the framework focus on areas that contribute to the achievement of the MDGs, such as agriculture, water, and health/medical. By 2012, Japan and Tunisia had cooperated in organizing 17 training programs for about 900 participants and dispatching 20 Tunisian experts.
Morocco and Japan signed the Japan-Morocco Triangular Technical Cooperation Programme for the Promotion of South-South Cooperation in Africa in 2003. Under the program, Morocco has been conducting international training related to such fields as road maintenance, fisheries, and maternal and child health. By 2012, Morocco had implemented nine international training courses for 1,009 participants from 26 SSA countries. One example is a training program for road maintenance engineers of Francophone SSA countries offered by the Institute of Training on Road Maintenance and Construction Machines (IFEER).30 Using inputs from Japan as appropriate, including Japanese
30. IFEER was established in 1993 with the support of the Japanese government including the capital grant aid for its facility construction as well as technical cooperation for capacity development. The institute has become a sub-regional training center for road maintenance engineers of Francophone SSA countries.
369
South-South and Triangular Cooperation for Sub-Saharan Africa’s Development
–With special emphasis on knowledge exchange and co-creation
road maintenance equipment widely in use in Francophone SSA countries, the course has been providing training fitted to the local needs.
Though not having signed a partnership program, South Africa is a major partner for Japan in supporting SSC for SSA. One of the notable triangular cooperation activities between Japan and South Africa is the support for the NEPAD initiative, in which South Africa has been one of the major players, hosting its secretariat. As an integral part of NEPAD support activities, South Africa’s Public Administration Leadership and Management Academy (PALMS) and JICA have been collaborating to organize triangular programs for the training of trainers for public sector development. Since its start, the program has accepted the trainers of management development institutes (MDI) all over SSA countries.
As illustrated by the examples above, Japan’s strength in TrC may lie in its accumulated experiences and the wealth of relationships of mutual trust it has developed with a number of Southern partners through its long commitment in TrC. In recent years, it has been trying to diversify its modes of delivery. The remaining task for Japan may be to take stocks of its vast past achievements, review them, and come up with innovative models fitted to the needs of the 21st century.
Though sketchy, our overview presented above of SSC and TrC for SSA shows that over a long period, starting from the 1950s, there has been steady progress in the promotion of SSC and TrC, involving more actors and increasing amounts of resources, accompanied by various institutional developments.
3. Case Studies of Triangular Cooperation for Knowledge Exchanges in SSA
So far, we have looked at the history, current state, and major actors and magnitude of SSC/TrC for SSA. We will now look at specific cases, focusing particularly on knowledge sharing and co-creation. The following five cases have been chosen to illustrate the wide variety of forms and contents of TrC.
370
Chapter 13
3.1 Cases (1) Transferring localized knowledge to neighboring countries:
Vocational and technical Training31
Senegal’s Vocational Training Center (CFPT) has been playing the role of a center of excellence among French-speaking African countries to increase human resources for industrial development.
The CFPT was established in 1984 with the support of Japan to meet the shortage of entry- and middle-level technical workers, which was an important target in the country’s 6th four-year economic development plan (81/82-84/85). The center was designed from the outset with the idea that Senegalese human resources would be nurtured by Senegalese instructors. Since its establishment, the institute has trained about 2,300 technicians and engineers who completed its two- or three-year programs (JICA n.d.).32 These courses have come to be recognized as the country’s top level programs, with their completion being treated as a certified qualification for studies in France and Canada. In addition, CFPT has been providing training and retraining to workers in both formal and informal sectors as an implementing organization of the Office National de Formation Professonnelle (ONFP)33 since the ONFP’s establishment in 1984.
Over the years, the CFPT gradually developed its own knowledge and skills best suited to the country’s needs. At first, the training content was heavily influenced by what was brought by Japanese experts. With time, however, various innovations were made to produce locally adjusted technical training systems. One small example of such adaptation is that at the CFPT, the students—future leaders in the workplace—are expected to maintain the workshop (work place) in an orderly, safe and clean fashion, according to the key lessons of the 5S doctrines—Sorting, Set in order, Systematic cleaning, Standardizing, and Sustaining. While maintaining its original message, this principle was localized and introduced into the Senegalese context with due modifications to make it suit local labor customs.
31. This section draws on JICA 2012a.32. Various qualifications obtained through Senegal’s education system are valid not only in neighboring countries, but also in France (JICA 2000, p. 324).33. ONFP is funded by corporate employment insurance, donors, and international organizations that provide financial support for vocational training.
371
South-South and Triangular Cooperation for Sub-Saharan Africa’s Development
–With special emphasis on knowledge exchange and co-creation
While building up its own capacity, the CFPT started supporting a large number of countries—more than 20 of them—in their human resource development; in 1999, in cooperation with JICA, it started providing 16 French-speaking countries with international training programs (JICA 2012b). Eventually, the Institute came to have about 15% of their BTI and BTS trainees coming from other countries.34 Cultural and socio-economic similarities with the neighboring French-speaking countries certainly facilitated the transfer and sharing of technologies and knowledge. This has resulted in making CFPT one of the core institutions for the development of human resources in West Africa.
One major beneficiary of such cooperation is the Democratic Republic of the Congo (DRC). Concurrently with the CFPT project, preparations for a JICA-supported project in DRC were under way. The project aimed to develop the capacity of the DRC’s National Institute of Professional Preparation (INPP),35 in which a group of core instructors had to be trained. Since CFPT seemed an ideal resource to support INPP, in 2010, discussions between INPP and CFPT began, facilitated by JICA; the two institutions worked out cooperation plans to meet the needs of the PP with the available resources at CFPT, and cooperation between the two started.
(2) Seeking relevant knowledge from around the world: Civil Service Training Centre in Ghana
The Ghanaian case presented below illustrates an interesting case where a wide range of knowledge was sought and accumulated from a variety of sources, and once internalized, such knowledge was shared more widely with others. Such knowledge exchange happened in a TC project assisted by JICA titled “Capacity Development of Public Administration,” launched in 2007. Its aim was to improve the capacity of the Ghanaian Civil Service Training Center (CSTC). The project focused on two key cross-cutting themes: Ethical Leadership (EL) and Quality and Productivity Improvement (QPI).
From the onset, the project tried to seek knowledge and experience not
34. The number of overseas trainees is limited to 15% of the total due to prioritizing Senegalese citizens (JICA 2000, p. 326).35. The INPP was awarded the International Star Award for Quality (ISAQ) in the Gold Category at the 2012 International Quality Awards in Geneva, Switzerland. The ISAQ is an award for those who are recognized for investing in the improvement of their products and services (ISAQ 2010).
372
Chapter 13
only from Japan but also from other Asian and Sub-Sahara African countries including Singapore, Malaysia, Bangladesh, Tanzania and South Africa, which are the members of the Commonwealth and share many common features in their civil service. In particular, the Civil Service College (CSC) in Singapore played a central role. JICA, with its close ties with these partners,36 played the dual role of catalyst and knowledge actor.
During the project, the Ghanaian CSTC acquired relevant knowledge resources from partner countries through diverse modes of triangular cooperation, including face-to-face training sessions as well as video-conferencing. Extensive and intensive exchanges were promoted between Ghanaian officials and their Southern counterparts.
All through these programs, CSTC applied a systematic approach to planning, execution and evaluation of training. Complemented by the improvement of training facilities, the annual number of training programs offered at CSTC has increased from 15 courses to 54 a year, which reflects the improved capacity of CSTC in organizing training provisions.37
With these achievements, CSTC is now moving toward becoming a regional center of excellence in civil service training. Assisted by JICA, the center has started offering training opportunities to Liberia and Sierra Leone. CSTC undertook training needs assessments in the two countries to adjust the training content to suit the needs. The first training was successfully launched in September 2011 and will provide training opportunities to civil servants from the neighboring two countries, with the aim of making them facilitators for future training programs in their respective countries.
(3) Establishing a regional knowledge platform for poverty reduction: AICAD38
The Project of the African Institute for Capacity Development (AICAD) is a cooperation project focusing on regional cooperation in human
36. Japan and Singapore had established close ties, and to facilitate collaboration for TrC, they introduced the Japan-Singapore Partnership Programme for the 21st Century (JSPP21) in 1994.37. This number includes training programs undertaken outside the project.38. This section draws on JICA 2012c.
373
South-South and Triangular Cooperation for Sub-Saharan Africa’s Development
–With special emphasis on knowledge exchange and co-creation
resource development at the higher education level in East Africa. The project is the brainchild of TICAD II, where the idea of establishing a human capacity development base for poverty reduction was discussed. Later, in 2000, in collaboration with Japan, Kenya, Tanzania, and Uganda reached an agreement to establish AICAD. AICAD was expected to work toward poverty reduction in East Africa through cooperation of the three countries; it highlighted three functions for community-level development activities: 1) research and development, 2) training and extension, and 3) information network and documentation.
Since its establishment, AICAD’s functions and organizational structure have been steadily developed. Headquartered at the Jomo Kenyatta University of Agriculture and Technology (JKUAT) in Kenya,39 it had three country offices: at the Egerton University in Kenya, the Makerere University in Uganda, and the Sokoine University of Agriculture in Tanzania. Biannually, Governing Board meetings are held to discuss important issues of AICAD’s management among the three countries’ ministries related to finance and education, science and technology, and representatives of the member universities.40
With poverty reduction as its ultimate goal, AICAD and its members have been promoting a wide variety of activities. They include, for example, in-country training programs and comprehensive multiple-level “Community Empowerment Programmes” for communities, a “Knowledge and Technology Dissemination Programme” for livelihood improvement, East African region-wide training,41 and the New Rice for Africa (NERICA) dissemination project. These activities resulted in enhancing social cohesion of target communities and women’s empowerment. Skills and knowledge obtained through these activities have also been being disseminated by the participants to communities, supporting poverty reduction in member countries.
AICAD’s function of networking with other organizations has also been developing. Since 2010, AICAD has been expanding its activities in the area of university outreach activities. It has conducted four regional training sessions in collaboration with the World Bank Institute (WBI)
39. JICA had supported the establishment and development of JKUAT since 1980.40. As of 2012, the participating universities from the three countries amount to 19 (seven from Kenya, seven from Tanzania, and five from Uganda).41. Some of the regional training was organized in collaboration with WBI and WIA.
374
Chapter 13
and the Wetlands International Africa (WIA). Also, AICAD’s three country offices have been constructing good partnerships with various organizations from national/local governments to NGOs.
Cooperating with Asia played an important role in AICAD’s development. Starting in 2002, various professional knowledge exchanges were conducted between educators of the three East African countries and those of Asia, namely Indonesia, Thailand and Japan.
The project had a system of sharing and spreading knowledge and skills. For instance, in 2007, a regional training program for export promotion was held in collaboration with Indonesia’s Export Trade Center. Subsequently, in Tanzania, the knowledge and skills shared from Indonesia at the training program spread into society through a cascade system of training: to community leaders and then from them to local community members.
(4) Networking for knowledge exchange: Coalition for African Rice Development (CARD)
The “Coalition for African Rice Development”, or CARD,42 is an example of a network-based initiative for knowledge exchange and co-creation. Launched on the occasion of the 2008 TICAD IV, it is a multi-stakeholder platform with a well-established management structure “to support the efforts of African countries to increase rice production (CARD 2011).” Providing complementary support for capacity development of SSA governments in effectively managing rice sector development, it has helped interested SSA governments in developing National Rice Development Strategies (NRDS) within the framework of Poverty Reduction Strategy Papers (PRSPs), agricultural development strategies as well as the country framework for the Comprehensive Africa Agriculture Development Programme (CAADP). So far, 21 out of 23 African member countries have successfully formulated NRDS through broad multi-stakeholders consultation process (CARD 2013). It has also provided other kinds of support for creating an environment for rice-related investment.
One of the hallmarks of CARD is its engagement of diverse actors. The steering committee is represented by a broad range of stakeholders
42. For a general description of CARD and a discussion from an agricultural technology’s point of view, see, respectively, Chapters 2 and 3 of this volume.
375
South-South and Triangular Cooperation for Sub-Saharan Africa’s Development
–With special emphasis on knowledge exchange and co-creation
including multi- and bilateral-organs, rice producing partner countries in SSA as well as Africa-based regional organs and initiatives. They include NEPAD, AGRA, FARA, WB, CGIAR, FAO, IRRI and JICA other than for SSA countries (JICA/AGRA 2008; CARD 2011).
With such broad engagement, CARD has tried to act as the forum among international and local knowledge organs like research institutions and donors. In other words, the CARD network is in itself an initiative and mechanism for multi-stakeholder knowledge exchange.
Another notable feature is its demand-driven approach. As the needs and priorities for rice production promotion widely differ from country to country, CARD specialists assist partner countries to identify the bottlenecks in rice production development and then extend the necessary support to address the bottlenecks by inviting specialists from knowledge partners in the CARD network.
CARD has also started to consciously promote intra-regional as well as inter-regional South-South and Triangular learning.43 SSC/TrC has been set as one of four pillars of the CARD programs. Lately, CARD has embarked on a sub-program of linking Asian partners with SSA counterparts. In late 2012, it organized three video conferences for the promotion of the South-South learning process with ASEAN partners including the Philippines, Thailand, Vietnam, and Japan (CARD 2011, 2012). Also included were government officials and private companies like seed sellers and rice millers, as well as farmers’ groups. The participants are now in the process of feeding back what they have learned from the conference into the implementation process of their NRDSs.
As seen from the above, CARD is a dynamic and broad network and platform for promoting intra- and inter-regional knowledge exchange aiming at higher productivity and more profitable rice production.
(5) Creating solutions to shared challenges: cross-border road transport
Triangular cooperation (TrC) can be an effective way of addressing
43. As part of the action for promoting information sharing on rice development, CARD is now developing a dedicated webpage with ample space for storing relevant information with links to all the key African initiatives in rice development (CARD 2011).
376
Chapter 13
regionally-shared issues among countries. One such example is the initiative of promoting One Stop Border Post (OSBP).44
OSBP is a trade facilitation approach through the promotion of harmonization and alignment of legal, institutional and procedural aspects of trade at borders with concomitant infrastructure development. With complementary financial and technical support from international donors including JICA, an OSBP for road transport was first introduced at the Chirundu border between Zimbabwe and Zambia in December 2009 with tangible impacts on smoother and more efficient border management. Even though the OSBP’s inauguration has been relatively recent, it has already produced significant improvements including the reduction of waiting times for border formalities.45 The successful launch of Africa’s first OSBP at Chirundu was a case where the concept of integrated border management was put into practice. The OSBP at Chirundu itself was the South-South partnership between Zimbabwe and Zambia assisted by both multilateral and bilateral donors including the World Bank, UK DFID and JICA. Right after the launch, a workshop on the OSBP for road transport was organized with invitees from RECs and representatives of five East African countries, which had planned to introduce OSBPs under the coordination of the East African Community (EAC).
Following the success at Chirundu, the OSBP practice is now being replicated on other borders such as Maraba between Kenya and Uganda and Namanga between Kenya and Tanzania as an integral part of the regional infrastructure initiative. Recognizing an increasing role of regional organizations such as the Southern African Development Community (SADC) and the East Africa Community (EAC) in catalyzing exchanges of knowledge and experience of development practices as well as for the harmonization of cross-border activities, JICA, with other development partners, has helped these regional organs in support of their stronger coordination and regulatory capacity in scaling-up the OSBP approach.
44. For more details, see Chapter 8 of this volume.45. It is reported that the required time for completing the border control has been reduced from 1–2 hours to 20 minutes for passenger cars, from 2 hours to 1 hour for buses, and from 1–2 days to less than one day for trucks, respectively (See Chapter 8 of this volume).
377
South-South and Triangular Cooperation for Sub-Saharan Africa’s Development
–With special emphasis on knowledge exchange and co-creation
3.2. Modes of SSC/TrC for knowledge exchange and co-creation (1) Modes of knowledge exchange Knowledge sharing and co-creation through SSC/TrC can take a wide variety of forms, depending on the kind of knowledge being dealt with, and the environment in which the exchange takes place. Below is a simple typology of the forms. It should be noted here, however, that the types below are not mutually exclusive and an initiative could evolve from one type to the other with time.
Hub-and-spokes with centers of excellenceIn recent years, knowledge exchange through networks has come to draw increasing attention as promising architecture. Among the varied forms of networks, the first is what can be described as the hub-and-spokes-type knowledge exchange. This is a simple form of network relying, at least initially, on an established central institution as a hub of the knowledge sharing activities. And as the network develops, spontaneous exchanges and interactions among the network members often occur, with which the process of a virtuous cycle could kick in. Among the cases presented above, the Senegalese and the Ghanaian ones represent this model, where the CFPT in Senegal and the CSTC in Ghana played central roles. The effectiveness of having these kinds of “centers of excellence” has been proven through a number of cases (Hosono 2013). Examples abound worldwide; to cite a few from Africa: Tanzania as a hub of quality control in hospital management (Honda 2012), Kenya as a hub of strengthening science and mathematics education (Ishihara 2012), and Egypt as a hub of infectious disease prevention and surveillance (TT-SSC n.d.b).
Complex form of network/platform for knowledge exchange and sharingIncreasingly, more complex network forms of knowledge exchange and sharing are being applied in recent initiatives. For this, unlike the case of the above hub-and-spokes, no single institution is assumed to be a central knowledge organ; rather, the alliance comprised a number of interested parties interacting among themselves.
AICAD links up multiple regional research and training organs such as the universities and NGOs. The AICAD headquarters in Kenya plays a facilitating role for knowledge exchanges among the members. CARD, as its name (the “Coalition”) indicates, is essentially “a consultative group of donors, research institutions and other relevant organizations
378
Chapter 13
that aims to promote rice cultivation in Africa via information sharing, harmonization of existing initiatives and projects and advocacy for further investment” (JICA/AGRA 2008; CARD 2011). Within the network, these diverse actors, each having specific expertise, share and learn a broad range of knowledge, including the formulation of national rice development strategies, agricultural extension methods and the knowledge on new high-yielding rice varieties. The CARD secretariat then plays the role of catalyzing and helps promote such multi-actor exchanges. With its expanding stakeholders and increasingly active knowledge exchanges, AICAD and CARD now evolve into more like a “platform” for knowledge sharing and exchange.
Partnership for knowledge sharing and joint problem solvingIn contrast to the above two types of knowledge exchange based on networks, the OSBP cases exemplify a tighter partnership among the members seeking solutions to their shared or similar development challenges. This process can, however, develop further, once the knowledge created proves useful. As illustrated in the OSBP’s case, the knowledge and experience created through the tight-knit collaboration between Zimbabwe and Zambia are being shared with countries in eastern and southern Africa. The case of Ghana in civil service training also illustrates the process of a problem-driven partnership for knowledge exchange: starting from the core partnership with a few commonwealth countries including Singapore, Ghana now further disseminates a locally adapted approach for civil service training to Sierra Leone.
(2) Institutional arrangementDifferent knowledge exchange requires different institutions. In some cases, as in CARD and AICAD, strong institutional arrangements were introduced from the very beginning; being large-scale projects involving multiple layers of actors, obviously these two projects needed to have a solid institutional base, such as organizational structures and governing bodies; in the case of CARD, the Steering Committee and other structures were put in place, and, for AICAD, networking systems connecting the three countries under the Governing Board as the highest decision making body were set up.
In contrast, the institutional building process took a quite different path in the case of the Senegalese and Ghanaian projects; it was a process of

379
South-South and Triangular Cooperation for Sub-Saharan Africa’s Development
–With special emphasis on knowledge exchange and co-creation
spontaneous and gradual development: the linkages between the core organizations (i.e., CFPT in Senegal and CSTC in Ghana) and their partner organizations were developed gradually as the knowledge sharing expanded by means of workshops and training courses.
These spontaneously developed institutions, however, can sometimes grow into more formalized organizations. For example, in a project concerning science and mathematics education, a knowledge sharing movement started with an initiative by Kenya, and over the years it gradually developed into a more formalized organization, comprising 27 African countries and regions, with well-articulated mechanisms for the network’s governance (Ishihara 2012). A similar experience can be found in a case of hospital management where, with Tanzania as a pivotal country, gradual networking progressed, which eventually grew into an organization of mutual learning involving 15 countries (Honda 2012).
The OSBP’s case illustrates another promising pattern. It is a case where the function of regional knowledge sharing on OSBP was strategically incorporated into well-established regional economic organizations such as SADC and EAC. Such approach of using regional organs in knowledge sharing would lead to more harmonized and less fragmented SSC/TrC in the region.
(3) The medium of exchange As preceding sections have demonstrated, effective knowledge sharing requires the strategic and timely applications of diverse instruments; they could include face-to-face training sessions, dispatch of technical experts, workshops and seminars, and the use of ICT-based information platforms. Especially, more and more opportunities have become available, taking advantage of ICT for knowledge exchange, as exemplified by the WBI’s GDLN, APDev’s Internet-based communities of practice, as well as the use of video-conferencing in the case of Ghana’s Civil Service Training.
On the other hand, it has also been widely recognized that face-to-face learning opportunities continue to be critical in knowledge sharing, particularly with regard to the sharing of tacit knowledge (World Bank and Korea Development Institute 2012; Nonaka 2008). To further improve the impact of SSC/TrC in coming years, strategic and creative
380
Chapter 13
use of these multiple instruments should be explored through the sharing of good practices among stakeholders of SSC/TrC.
(4) Capacity development for more effective SSC/TrC As an increasing number of countries expand their development cooperation activities, they are also strengthening their capacity as effective SSC performers. As shown above, the ongoing preparation towards the establishment of SADPA in South Africa is an example of such endeavor. Capacity development is also critical on the other side of SSC/TrC, the beneficiaries.
An example of systematic joint efforts for the development of the capacity as SSC partners is the one by the Brazilian Cooperation Agency of the Ministry of External Relations (ABC), UNOSSC and JICA. They have recently embarked on an innovative joint capacity development program in the management aspect of SSC/TrC planning and operations. It is an initiative to provide opportunities for knowledge and experience sharing among the government staff in charge of SSC/TrC technical cooperation. The target countries include both middle-income countries including Brazil mainly as SSC/TrC providers as well as low-income countries, which are mainly beneficiaries. In March 2013, its inaugural “international training course on management of South-South and Triangular Technical Cooperation” was organized in Brasília as part of the program; the program will span the next three years.46 The participants of the first training comprised 39 practitioners from 36 countries, including 17 African countries.
Lastly, we maintain that the opportunity for being an SSC cooperation provider is open to any country or organization beyond prominent emerging economies. As illustrated in the Senegalese and Ghanaian cases above, with capacity development, organizations can grow into regional centers of excellence for knowledge sharing, as long as the countries and/or organizations have strong ownership and a persistent will to develop such capacity. Perhaps traditional North-South cooperation by means of TrC can have a role to play in facilitating such capacity development processes, as exemplified in the above cases. In fact, there are countless cases of such capacity development of
46. In addition to the training opportunities, the program also includes other complementary support for SSC/TrC management including online consultation services and advisory missions especially for selected focus countries.
381
South-South and Triangular Cooperation for Sub-Saharan Africa’s Development
–With special emphasis on knowledge exchange and co-creation
institutions supported by traditional partners. The international community should continue to offer support, by means of appropriate TrC and others, as such countries and organizations that wish to develop their capacities to grow into cooperation providers.
4. Summary and Some Concluding Remarks and Implications
The discussion in Section 2.1 showed that Africa has been a central actor as the promoter and beneficiary of SSC. We also noted that the TICAD process has been playing an important role in promoting the momentum toward more and better SSC for African development. Though sketchy, our discussion in sections 2.2 and 2.3 has revealed that a wide variety of actors have long been and are acting as SSC partners for the development of SSA including regional organs and North African countries, in addition to the oft-cited emerging economies. The lack of data on the activities of emerging and other actors is a serious obstacle in understanding the whole picture, and more effort is called for in data collection and information sharing.
And in Section 3, we argued, based on the experiences we at JICA have accumulated, that knowledge sharing and co-creation through SSC and TrC can take a variety of forms with diverse instruments, depending on the types of knowledge creation and solutions needed. We also argued that knowledge sharing and co-creation should not be monopolized by a small number of actors but is a possibility for all aspiring countries and organizations. In that regards, the North donors with their extensive field office network and long history of close collaboration with counterpart organs in SSA countries are well-positioned to provide support. It is thus expected that the TICAD process will continue to provide space and opportunities for experience sharing and open dialogue among broad stakeholders on the furtherance of SSC/TrC towards inclusive and dynamic development in Africa.
Finally, having attempted to provide an overview of SSC/TrC for Sub-Saharan Africa’s development, the authors renewed their recognition of the multi-faceted and complex nature of SSC/TrC; a plethora of issues surrounding SSC/TrC remain uninvestigated, such as their geopolitical nature and the measurement and evaluation of their impact in the
382
Chapter 13
beneficiary countries.47 These remaining but critical questions require further research.
47. McEwan and Mawdsley 2012 argues for the need of more critical analysis of triangular or trilateral cooperation beyond the managerial/technical discussions, which most currently available papers including this one are limited to.
383
South-South and Triangular Cooperation for Sub-Saharan Africa’s Development
–With special emphasis on knowledge exchange and co-creation
References
Brazilian International Cooperation Agency (ABC). 2010. Brazilian technical cooperation in Africa. Brasilia: Agência Brasileira de Cooperação.
Tunisian Agency for Technical Cooperation (ACTC). n.d. ACTC. http://www.tunisie-competences.nat.tn/default.aspx?id=208&Lg=2
African Peer Review Secretariat (APR Secretariat). 2012. APRM annual report 2011. Midrand, South Africa: African Peer Mechanism Secretariat.
APR Secretariat. 2013. Communiqué. Issued at the end of the Eighteenth Summit of the Committee of Heads of State and Government Participating in the African Peer Review Mechanism (APR Forum), Addis Ababa, Ethiopia, July 14.
Africa-India Forum Summit (AIFS). 2011. Africa-India Framework for Enhanced Cooperation - Training programmes under AIFS for 2011-12.
Moroccan Agency for International Cooperation (AMCI). n.d. AMCI. http://www.amci.ma/bourseStage.asp?r=38&sr=73.
Ashoff, G. 2010. Triangular cooperation: Opportunities, risks and conditions for effectiveness. Development Outreach (World Bank Institute) October 2011.
The Comprehensive Africa Agriculture Development Programme (CAADP). n.d. About CAADP. http://www.nepad-caadp.net/about-caadp.php.
Coalition for African Rice Development (CARD). 2011. Coalition for African Rice Development (CARD) Standard Presentation Version March 2011. Nairobi: CARD Secretariat.
CARD. 2012. General Information 2012: CARD Seminar via video conference for the promotion of South-South Cooperation Programme. Nairobi: CARD Secretariat.
CARD. 2013. Progress of 2008–2013 and outlook for 2013–2018. Power Point presentation at the fifth CARD General Meeting, Dakar, February 6.
Cheru, F. 2011. South-South cooperation: What prospects for a new Bandung consensus?. In South-South cooperation: Africa on the center stage, ed. R. Modi. London: Palgrave Macmillan.
Department of International Relations and Cooperation (DIRCO). Strategic Plan 2010-2013. Cape Town: Government of the Republic of South Africa.
384
Chapter 13
Fordelone, T. Y. 2008. Triangular co-operation and aid effectiveness. Paris: OECD.
Global Partnership for Effective Development Cooperation. 2011. Global Partnership for Effective Development Cooperation. http://www.aideffect iveness .org/busanhlf4/images/stor ies/hlf4/OUTCOME_DOCUMENT_-_FINAL_EN.pdf.
Government of Japan. 2003. Japan’s official development assistance charter.
Government of Japan. 2005. Japan’s medium-term policy on official development assistance.
Gruzd, S. 2011. Ten reasons to keep faith with Africa’s peer review process. Policy Briefing 17, Governance and APRM Programme, South African Institute of International Affairs.
Gülseven, Y. 2012. Turkish development cooperation. Presentation at the UN South-South Stakeholders’ and High-level Development Cooperation Director-General Meeting, Vienna, November 22.
Honda, S. 2012. Inspired by Sri Lankan Practice: Scaling-up 5S-KAIZEN-TQM for improving African hospital service. In Scaling up South-South and triangular cooperation, ed. H. Kato. Tokyo: JICA Research Institute.
Hosono, A. 2012. South-South/triangular cooperation and capacity development. In Scaling up South-South and triangular cooperation, ed. H. Kato. Tokyo: JICA Research Institute.
Hosono, A. (forthcoming). Scaling up South-South cooperation through triangular cooperation: The Japanese experience. In Getting to scale: How to bring development solutions to millions of poor people, ed. L. Chandy, A. Hosono, H. Kharas, and J. Linn. Washington, DC: Brookings Institution Press.
INSouth. n.d. Egypt. http://www.insouth.org/index.php?option=com_content&view=art ic le&id=67:egypt&cat id=31:country-windows&Itemid=86.
ISAQ (International Star Award for Quality). 2010. ‘The Concept’. Business Initiative Directions. http://isaqconcept.wordpress.com/2010/07/17/the-concept-2/.
Ishihara, S. 2012. Network-type cooperation: Strengthening of mathematics and science education in Western, Eastern, Central, and Southern Africa (SMASE-WECSA) Network. In Scaling up South-South and triangular cooperation, ed. H. Kato. Tokyo: JICA Research Institute.
JICA. 2000. Senegal: Vocational training. In Annual evaluation report 2000.
385
South-South and Triangular Cooperation for Sub-Saharan Africa’s Development
–With special emphasis on knowledge exchange and co-creation
Tokyo: JICA.JICA. 2005. Thematic guideline of South-South cooperation. Tokyo: JICA JICA. 2007. Evaluation of third country training program: Japan–Egypt–
Africa (1985–2006). Cairo: JICA Egypt Office.JICA. 2009. Partnership program: Challenge to inclusive and dynamic
development through triangular cooperation with new partners. Program brochure, JICA.
JICA. 2011. Overview section. JICA knowledge site on South-South cooperation. [In Japanese.] Tokyo: JICA.
JICA. 2012a. Afurica chiiki hitozukuri kyoryoku no arikata ni kakaru johoshushu/kakuninchosa; Interimu ripoto (dorafuto) [Information collection/verification investigations for the ways of capacity development cooperation in African Region: Interim report (draft)]. Unpublished draft report, International Development Center of Japan and The International Development Journal, Tokyo.
JICA. 2012b. History. JICA’s World June: 22–23.JICA. 2012c. Joint evaluation report (terminal evaluation): The project of the
African Institute for Capacity Development (AICAD), phase III. Tokyo: JICA.
JICA. 2012d. Morokko Oukoku ni okeru JICA jigyo no gaiyo (dorafuto) [Kingdom of Morocco: JICA country analytical work (draft)]. Unpublished draft report, JICA, Tokyo.
JICA. n.d. Vocational and Technical Training Center in Senegal. Training center project.
JICA, and Agricultural Growth for Africa ( AGRA). 2008. Coalition for African Rice Development (CARD). Strategy and goals paper.
Kondoh, H., et al. 2010. Diversity and transformation of aid patterns in Asia’s “emerging donors.” Working Paper No. 21, JICA Research Institute.
Kragelund, P. 2012. The revival of non-traditional state actors’ interests in Africa: Does it matter for policy autonomy? Development Policy Review 30 (6): 703–718.
Manning, R. 2006. Will “emerging donors” change the face of international co-operation? Development Policy Review 24 (4): 371–385.
McEan, C., and E. Mawdsley. 2012. Trilateral development cooperation: Power and politics in emerging aid relationships. Development and Change 43 (6): 1185–1209.
Ministry of Foreign Affairs, Turkey. n.d. Turkey’s development cooperation: General characteristics and the Least Developed
386
Chapter 13
Countries (LDC) aspect. Nonaka, I., R. Tayama, and T. Hirata. 2008. Managing flow: A process
theory of the knowledge-based firm. New York: Palgrave Macmillan.The New Partnership for Africa’s Development (NEPAD) n.d..
Overview: Africa Platform for Development Effectiveness. Program summary, NEPAD, Johannesburg, South Africa.
OECD. 1991. The principles on new orientations in technical cooperation. Paris: OECD.
OECD. 2012. Development cooperation report 2011. Paris: OECD.OECD Creditor Reporting System (CRS). http://stats.oecd.org/Index.
aspx?QueryId=33364.Centre for Project Evaluation and Macroeconomic Analysis ( PEMA).
2008. IMPACT VI (3) (Ministry of International Co-operation, Government of the Arab Republic of Egypt, Cairo).
Programme for Infrastructure Development in Africa ( PIDA). n.d. About PIDA. Program description, Programme for Infrastructure Development in Africa (PIDA), African Development Bank Group.
The People’s Republic of China. 2012. Implementation of the follow-up actions of the Fourth Ministerial Conference of the Forum on China-Africa Cooperation. Ministry of Foreign Affairs.
Tokyo International Conference on African Development (TICAD). 1993. Tokyo declaration for African development: Towards the 21st Century. Conference declaration, TICAD I.
TICAD. 1998. Tokyo agenda of action. Conference declaration, TICAD II.TICAD. 2001. Tenth anniversary declaration. Conference declaration,
TICAD III.TICAD. 2008. Yokohama declaration towards a vibrant Africa.
Conference declaration, TICAD IV.Task Team on South-South Cooperation (TT-SSC). 2010. Boosting South-
South cooperation in the context of aid effectiveness. Summary report case stories presented to the Task Team on South-South Cooperation between December 22, 2009, and February 25, 2010.
TT-SSC. n.d.a. Germany–Brazil–Mozambique: Sharing quality standards. South-South Cooperation Case Stories series, Task Team on South-South Cooperation.
TT-SSC. n.d.b. Japan–Egypt–Sub-Saharan Africa ICCI story: Networking and capacity development for combating infectious diseases. South-South Cooperation Case Stories series, Task Team on South-South Cooperation.
387
South-South and Triangular Cooperation for Sub-Saharan Africa’s Development
–With special emphasis on knowledge exchange and co-creation
United Nations. 1995. New directions of technical cooperation among developing countries. UN High Committee on the Review of Technical Cooperation among Developing Countries Ninth Session. TCDC/9/3.
United Nations . 2008. Trends in South-South and triangular development cooperation. Background study for the Development Cooperation Forum, UN Economic and Social Council.
United Nations. 2010. Nairobi outcome document of the High-Level United Nations Conference on South-South Cooperation. UN General Assembly A/RES/64/222.
United Nations. 2012a. The State of South-South cooperation: Report of the Secretary-General. UN General Assembly A/67/208.
United Nations. 2012b. Framework of operational guidelines on United Nations support to South-South and triangular cooperation: Note by the Secretary-General. UN High-level Committee on South-South Cooperation.
UNCTAD. 2010. Economic development in Africa report 2010: South-South cooperation; Africa and the new forms of development partnership. Geneva: UNCTAD.
UNEP. n.d. UNEP South-South Knowledge Exchange Mechanism. Nairobi: UNEP.
Vickers, B. 2012. Towards a new aid paradigm: South Africa as African development partner. Cambridge Review of International Affairs 25 (4) 535–556.
World Bank, and Korea Development Institute 2011. Using knowledge exchange for capacity development: What works in global practice. Washington, DC: World Bank.


Appendices


391
Appendix 1: The TICAD Process and Japan
Kei Yoshizawa
This essay attempts to give a quick review of the history of the TICAD process. Looking back at the different policies and priorities agreed on at TICAD I through IV, and paying particular attention to the roles played by the Japanese government, the essay will try to shed light on the contributions that the TICAD process has had on African development. It will start with a chronological revisit to the process and, toward the end, offer some of the author’s views on its 20-year-long evolution.
TICAD I (October 1993, Tokyo)
TICAD I was held in 1993 in the midst of the drastically changing international environment in the aftermath of the end of the Cold War. On the African continent, many countries were struggling toward democracy, while at the same time many were experiencing political turmoil and some, civil wars. Western donors, on their part, were generally experiencing waning interest in supporting Africa after the fall of the Berlin Wall, and policy-wise, they were rather frustrated to see many African countries remaining stuck with slow improvement of macro-economic performance and poor governance. In the meantime, Japan, in 1989, had become the world’s top donor in regard to development assistance, overtaking the US, and its bilateral aid to Africa had been increasing rapidly since the late 1980s, including co-financing with the World Bank and IMF through Structural Adjustment Lending and Non-Project Grants supporting balance of payments aligning with structure adjustments.
Thus, TICAD I was held in an international environment where, on the one hand, there was a mounting sense, among African leaders, of the “Marginalization” of Africa in international politics, as well as that of discontentment vis-à-vis the Breton-Woods institutions and the Western donors; on the other hand, there was a mounting expectation toward
392
Appendix 1
Japan as an emerging, though a little unfamiliar, development partner. In 1993, as a multilateral forum, the conference was organized jointly by Japan, the UN, the UNDP and the GCA,1 and was participated in by 48 African countries (5 of which were represented by their heads of state), 8 international organizations, 12 bilateral donor countries and the EC.
The first TICAD conference came up with a message that, as I see it, mixed the dominant policy orientation in the international aid community at the time and Japan’s aid philosophy. The primary interests of the international community in the early 1990s were, on the economic front, economic reform toward a market economy and dealing with the debt crisis still lingering from the 1980s; and on the political/administrative front, the priority was democratization and administrative and financial reforms that the Good Governance principle demanded. These agendas inevitably echoed strongly in the Tokyo Declaration of TICAD I, but the document also incorporated policies and philosophies upheld by the Japanese Government, such as self-help efforts, south-south cooperation and sharing Asian experiences for African development (Horiuchi 2006:28).
In retrospect, it seems that the Japanese aid policy for Africa at the time of TICAD I was rather broad and not as clear as those that would be expressed later at TICAD IV. The commitment of the Japanese Government was also rather limited at TICAD I. It was later in TICAD II and thereafter that Japanese policy orientation took concrete forms and were translated into action programs. Despite these limitations, TICAD I, and Japan’s determination for African development that it represented, enhanced the expectations of African leaders for Japan; it was against this backdrop that the holding of TICAD II was announced in April 1996 (Horiuchi 2004: 24).
TICAD II (October 1998, Tokyo)
Following the success of TICAD I, the Japanese government embarked on efforts toward taking the lead in agenda setting in African development and, more generally, in international development. The most notable result was the adoption of the Shaping the 21st Century, The
1. Global Coalition for Africa, a group of experts and intellectuals on political and economic issues regarding Africa
393
The TICAD Process and Japan
Contribution of Development Cooperation, adopted at the DAC High Level Meeting held in May 1996 (Horiuchi 2004: 25), which was more broadly known as “DAC New Development Strategy”.
The DAC New Development Strategy was different from the then-dominant development paradigms that called primarily for Structural Adjustment and Good Governance. While these policies largely aimed at institutional and regulatory reforms, the DAC New Development Strategy urged that governments and partners focus on the results to be achieved through development, highlighting the importance of self-help efforts and clarifying the complementary role of development aid. It also introduced numerical targets – an expression of the results-focused orientation – on such domains as poverty reduction, social development (education, health), and environmental conservation and sustainable development.
These principles upheld in the DAC New Development Strategy were incorporated in the Tokyo Agenda for Action of TICAD II (Horiuchi 2004: 25); education, health and poverty reduction were identified as the key challenges.2 In addition, eight numerical targets and 370 development projects, mostly reflecting the targets, were presented.3
Also, it was at TICAD II that the TICAD framework as we know it today started to be shaped and formalized; the principle of “support for self-help efforts” was adopted as the basic principle of TICAD to be called “Ownership and Partnership” (Horiuchi 2006: 30); and other characteristics of TICAD emerged, such as the emphasis on poverty reduction and social development, a results-oriented approach accompanying numerical targets, and support for South-South Cooperation.
This TICAD framework constituted a pioneering initiative in international efforts toward the adoption of the Poverty Reduction Strategy by the IMF and the World Bank (1999), MDGs by the United Nations (2000) and NEPAD (New Partnership for Africa’s Development,
2. The Japanese government announced the provision of grant aid of about 90 billion yen over the subsequent five years in the fields of education, health and water supply.3. UNDP reviewed the progress of the implementation of Tokyo Agenda for Action (UNDP 2003).
394
Appendix 1
2001).4
TICAD II also served as a platform to strengthen various then-existing international development-related initiatives. For example, the Tokyo Declaration and Tokyo Agenda for Action of TICAD II incorporated the HIPC Initiative (Lyon Summit in 1996) and other decisions made before TICAD II about external debt issues. Subsequently, the expanded HIPC Initiative (Cologne Summit in 1999) was agreed on based on ownership and partnership principles and emphasis on poverty reduction and social development. The World Bank became a co-organizer of TICAD in 2001.
TICAD III (September 2003, Tokyo)
The most important topic of TICAD III was to support NEPAD (New Partnership for Africa’s Development), which was presented to the international community at the TICAD ministerial-level meeting (December 2001, Tokyo). NEPAD was consistent with the basic principles of TICAD in that it emphasized ownership by African countries of their development process (Horiuchi 2006: 34). TICAD III agreed to mobilize the support of the international community and expand the partnership in its support. Concrete actions for supporting NEPAD were subsequently developed reflecting TICAD III outcomes; including Cross-Border Transport Infrastructure (CBTI) and One Stop Border Post (OSBP) initiatives highlighted in the TICAD IV Action Plan,5 and the African Infrastructure Development Program (PIDA) formulated jointly by the African Development Bank, African Union Commission and the NEPAD Agency, adopted at the African Union Summit in 2012.
The Summary by the Chair of TICAD III confirmed the three pillars of African development, consisting of (1) people-centered development, (2) poverty reduction through economic growth, and (3) consolidation of peace. Highlighting “poverty reduction through economic growth” as the second pillar, this summary could arguably be understood as reflecting the position of the Japanese Government: in order to reduce poverty, economic growth must first of all be promoted – a position not
4. For details, see, for example, the Institute of International Affairs (2003)5. Please see Chapter 8 of this volume.
395
The TICAD Process and Japan
necessarily identical with either the market-oriented approach promoted by the IMF and World Bank through structural adjustments, or with the position of the United Nations that was calling for a mobilization of a massive amount of development assistance funds to achieve MDGs by 2015.
Following this, this economic growth agenda became the central issue in the subsequent TICAD process, coinciding with the economic growth of Africa that had started in the early 2000s led by exports of energy and mineral resources. In TICAD IV, “Boosting economic growth” was made the first priority. And toward TICAD V, discussions are underway to move the agenda more in the direction of further acceleration of growth, as summarized by Japanese Foreign Minister Mr. Kishida in the TICAD V Ministerial Preparatory Meeting in March 2013.
TICAD Ⅳ (May 2008, Yokohama)
TICAD IV was held in 2008. A total of 51 (out of 53) African countries participated in the conference, with 41 of them represented by heads of state or government. The conference positioned the issue of boosting economic growth as the first pillar, and came up with the outcome documents titled the Yokohama Declaration and Yokohama Action Plan, which clearly stated the commitments of the participants. Japan, for its part, announced that it would double its ODA to Africa and provide up to $4 billion of new ODA loans over the following five years to support the continent’s economic growth, despite its difficult fiscal position.
Another noteworthy development was the introduction of the follow-up mechanism for monitoring TICAD IV commitments and the Yokohama Action Plan; since 2009, follow-up ministerial meetings have been held every year to monitor the progress of these commitments. TICAD Progress Reports are compiled and reported to the ministerial meetings.
The TICAD IV Yokohama Declaration emphasized the importance of economic growth even more strongly than ever, putting it before other pillars, i.e., those related to MDGs, environmental issues and climate change, and consolidation of peace and good governance. The prioritization of economic growth in TICAD IV represented a remarkable shift from the traditional emphasis on social and human
396
Appendix 1
development since TICAD I and toward the development of infrastructure, trade and investment, and partnership with the private sector.
However, prior to TICAD IV, Japan was constrained in mobilizing its financial resources for supporting economic growth in Africa, due primarily to the debt accumulation problem in Africa. This constraint was relieved by the final settlement of long-standing debt problems agreed on at the Gleneagles G8 Summit in 2005, prompting the Japanese government to announce its ODA Loan support package for Africa through co-financing with the African Development Bank (EPSA).6 In TICAD IV, Japan pledged new ODA loans of up to $4 billion over five years focused on cross-border infrastructure projects in transportation and the power sector to promote regional integration in Africa. This pledge of “Doubling ODA to Africa” under the difficult fiscal situation in Japan was initiated by the strong political leadership of the Fukuda administration at the time, by switching the main destination of the ODA budget, which had been largely directed to other regions.
This also marked a major turning point in Japanese assistance to Africa, which had been virtually limited to assistance in social and human development mainly through grant aid and Technical Cooperation.7 The size of the pledged ODA loans ($4 billion over five years) may not look significant enough when compared with the vast financing gap in infrastructure investment reported to amount to $48 billion a year (World Bank 2008), but it could play an important role in complementing other financial resources, for example, through co-financing operations with the African Development Bank and the World Bank.
6. EPSA stands for Expanded Private Sector Assistance for Africa. It aims at the provision of ODA loans of $1 billion over 5 years from 2005 through co-financing with the African Development Bank.7. This does not mean that social and human development is no longer emphasized in the TICAD IV commitments of Japan; in parallel to infrastructure development, the Japanese contribution to the achievement of MDGs has also been strengthened through grant aid and Technical Cooperation as part of the commitment.
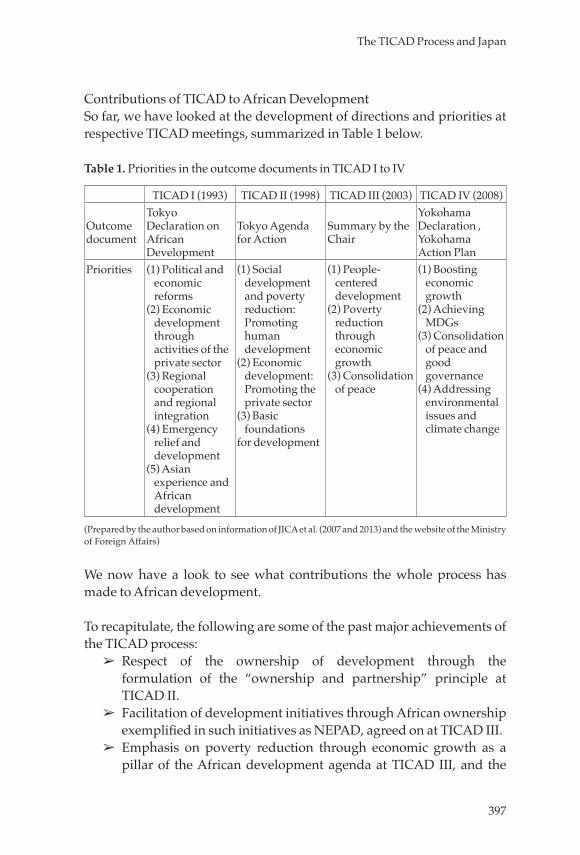
397
The TICAD Process and Japan
Contributions of TICAD to African DevelopmentSo far, we have looked at the development of directions and priorities at respective TICAD meetings, summarized in Table 1 below.
Table 1. Priorities in the outcome documents in TICAD I to IV
TICAD I (1993) TICAD II (1998) TICAD III (2003) TICAD IV (2008)
Outcome document
Tokyo Declaration on African Development
Tokyo Agenda for Action
Summary by the Chair
Yokohama Declaration , Yokohama Action Plan
Priorities (1) Political and economic reforms
(2) Economic development through activities of the private sector
(3) Regional cooperation and regional integration
(4) Emergency relief and development
(5) Asian experience and African development
(1) Social development and poverty reduction: Promoting human development
(2) Economic development: Promoting the private sector
(3) Basic foundations
for development
(1) People-centered development
(2) Poverty reduction through economic growth
(3) Consolidation of peace
(1) Boosting economic growth
(2) Achieving MDGs
(3) Consolidation of peace and good governance
(4) Addressing environmental issues and climate change
(Prepared by the author based on information of JICA et al. (2007 and 2013) and the website of the Ministry of Foreign Affairs)
We now have a look to see what contributions the whole process has made to African development.
To recapitulate, the following are some of the past major achievements of the TICAD process:
➢ Respect of the ownership of development through the formulation of the “ownership and partnership” principle at TICAD II.
➢ Facilitation of development initiatives through African ownership exemplified in such initiatives as NEPAD, agreed on at TICAD III.
➢ Emphasis on poverty reduction through economic growth as a pillar of the African development agenda at TICAD III, and the
398
Appendix 1
introduction of a growth-oriented development strategy at TICAD IV.
➢ Development of action plans based on numerical targets and outcome goals as well as the establishment of a follow-up mechanism in TICAD IV.
➢ Promotion of south-south and especially Asia-Africa cooperation8 since TICAD I.
The TICAD process also provided opportunities for the sharing of the development and growth experience between Asia and Africa, an agenda highlighted from TICAD I. The ideas drawn from Asian development experiences, like the role of the governments, growth-oriented development strategies, emphasizing the importance of infrastructure, and strengthening of ownership, added some values to the development strategies in Africa, which had traditionally been led by Washington Consensus-based thinking since the 1990s (Horiuchi 2006: 30, and JICA et al. 2013).
TICAD is different from other fora on African development in its character as a global, open, and multilateral forum. While the EU, China, Korea, India and Turkey, and others have held similar-looking summits or ministerial-level meetings with AU and African governments, these meetings are held with the aim of strengthening bilateral partnerships between the host government or institution and Africa. Unlike these, TICAD is a summit-level meeting on African Development between African governments and TICAD co-organizers, i.e., the Government of Japan, the UN, the UNDP, the World Bank and the African Union Commission. TICAD has a unique character as a forum open to international institutions, civil societies, the private sector, and academics to discuss and reach consensus on the African development agenda and action plan for the next 5 years, not limited to a bilateral partnership and commitment between Japan and Africa.
As an open forum, the TICAD process has attracted the attention and participation of NGOs and the private sector. For example, the Japanese civil society, with the establishment of the Africa Japan Forum (AJF) in 1994, has been playing an important role in the TICAD process; their contributions included participating in the TICAD meetings, organizing side events and consultative meetings with the Ministry of Foreign
8. For more detailed discussion on south-south cooperation, see Chapter 13 of this volume.
399
The TICAD Process and Japan
Affairs, presenting policy recommendations to TICAD meetings, communication with the public on Africa, networking with African civil societies (TCSF 2008). The private sector was also an important partner: the Keidanren (Japan Business Federation) also holds consultative meetings with the Ministry of Foreign Affairs9 and presents proposals to the Government of Japan on the TICAD process and public-private partnership in Africa (Keidanren 2013).
With the changing environment surrounding Africa and the whole world, the challenge for the future TICAD process could be how it can continue to further promote debates and garner resources for African development, both in public and private sectors, while strengthening its unique character as a global and open forum, and building on the rich experience and assets it has created over the last 20 years.
9. The Ministry of Foreign Affairs holds meetings with the civil society and the private sector for TICAD V (http://www.mofa.go.jp/mofaj/area/ticad/index.html)
400
Appendix 1
References
<Japanese books and documents>Horiuchi, S. 2004. Ten years of the footprint of the Tokyo International
Conference on African Development (TICAD). n.p. Japan Institute of International Affairs. 2003. Review on the New
Partnership for African Development (NEPAD). [In Japanese.] Foundation for Advanced Studies on International Development, Tokyo.
Japan International Cooperation Agency, and Mitsubishi UFJ Research and Consulting. 2007. Project Study on the TICAD Process; Review of the past achievements and implications for future success: Final report.
Japan International Cooperation Agency, and Mitsubishi UFJ Research and Consulting. 2013. TICAD 20th anniversary review
Keidanren. 2013. Contributing to sustainable growth in Sub-Saharan Africa: The business community’s Africa strategy towards TICAD V. http://www.keidanren.or.jp/policy/2013/ 007.html.
Ministry of Foreign Affairs of Japan. 2009–2012. TICAD IV annual progress report 2008–2011. http://www.mofa.go.jp/mofaj/area/ticad/report/index.html.
Ministry of Foreign Affairs of Japan. 2004. 2003 White paper on official development assistance (ODA). Tokyo: National Printing Bureau of Japan.
ODA Evaluation Committee. 2008. Evaluation report on assistance to Africa through the TICAD process. http://www.mofa.go.jp/mofaj/gaiko/oda/shiryo/hyouka/kunibetu/ gai/ticad/pdfs/jk07_01_0001.pdf.
Organization for Economic Cooperation and Development (OECD), Development Assistance Committee (DAC). 1996. Shaping the 21st century: The contribution of development cooperation [summary in Japanese]. http://www.mofa.go.jp/mofaj/gaiko/oda/doukou/dac/ sei_1_10.html.
TICAD Civil Society Forum (TCSF) [Y. Ishida, and M. Obayashi, eds.]. 2008. 2007 citizen’s white paper on policy for Africa. Kyoto: Koyo Shobo.
<English books and documents>Horiuchi, S. 2006. TICAD after 10 years: A preliminary assessment and
proposals for the future. In Japan, a model and a partner: Views and
401
The TICAD Process and Japan
issues in African development, ed. S. Adem. Leiden and Boston: Brill.
Japan International Cooperation Agency, and Mitsubishi UFJ Research and Consulting. 2007. Project study on the TICAD Process: Review of the past achievements and implications for future success; Final report. Report prepared for JICA, March.
Japan International Cooperation Agency, and Mitsubishi UFJ Research and Consulting. 2013. TICAD 20th Anniversary Review. Report prepared for JICA.
Keidanren. 2013. Contributing to sustainable growth in Sub-Saharan Africa: The business community’s Africa strategy towards TICAD V (summary). http://www.keidanren.or.jp/ en/policy/2013/007.html.
Ministry of Foreign Affairs of Japan. 2009–2012. TICAD IV annual progress reports 2008–2011. http://www.mofa.go.jp/region/africa/ticad/ticadfollow-up/report/index.html.
Organization for Economic Cooperation and Development (OECD), Development Assistance Committee (DAC). 1996. Shaping the 21st century: The contribution of development cooperation. Development Assistance Committee, OECD, May.
United Nations Development Programme (UNDP). 2003. Review of implementation of Tokyo Agenda for Action (TAA): Achievements of goals and objectives; Action by Africa and its partners. Review document.
World Bank. 2008. Africa Infrastructure Country Diagnostics. Program description.
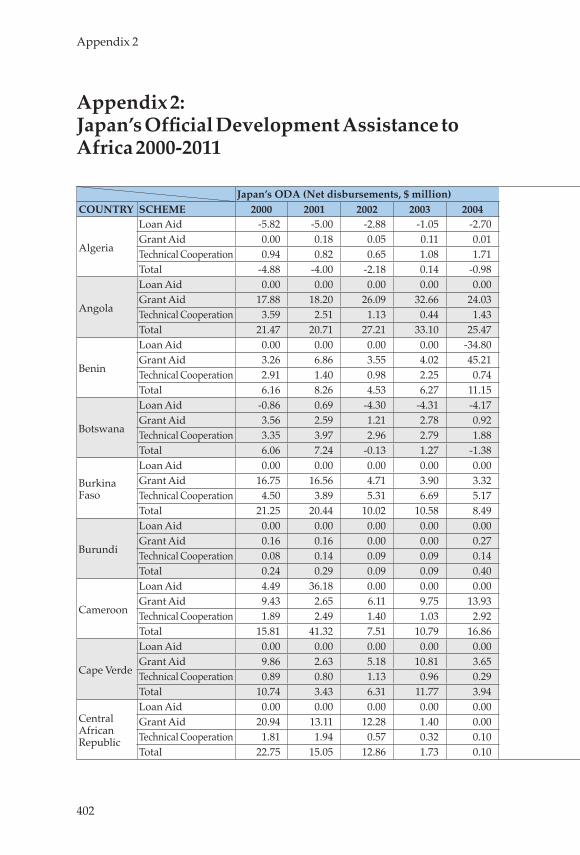
402
Appendix 2
Appendix 2: Japan’s Official Development Assistance to Africa 2000-2011
Japan’s ODA (Net disbursements, $ million)COUNTRY SCHEME 2000 2001 2002 2003 2004 2005 2006 2007 2008 2009 2010 2011 Total
Algeria
Loan Aid -5.82 -5.00 -2.88 -1.05 -2.70 -2.04 -17.25 1.43 0.47 0.47 13.68 0.00 -22.53 Grant Aid 0.00 0.18 0.05 0.11 0.01 0.22 1.24 2.71 1.99 0.00 0.02 0.01 8.71 Technical Cooperation 0.94 0.82 0.65 1.08 1.71 3.68 4.33 3.12 1.57 1.39 1.77 1.42 63.90 Total -4.88 -4.00 -2.18 0.14 -0.98 1.86 -11.68 7.26 4.03 1.86 15.48 1.43 50.08
Angola
Loan Aid 0.00 0.00 0.00 0.00 0.00 0.00 0.00 0.00 0.00 0.00 0.00 0.00 -0.32 Grant Aid 17.88 18.20 26.09 32.66 24.03 23.40 8.94 20.17 15.40 3.37 34.30 7.65 282.81 Technical Cooperation 3.59 2.51 1.13 0.44 1.43 2.89 3.46 2.94 2.35 3.39 3.32 3.77 41.14 Total 21.47 20.71 27.21 33.10 25.47 26.30 12.41 23.10 17.75 6.76 37.62 11.42 323.61
Benin
Loan Aid 0.00 0.00 0.00 0.00 -34.80 0.00 0.00 0.00 0.00 0.00 0.00 0.00 -3.14 Grant Aid 3.26 6.86 3.55 4.02 45.21 16.01 6.84 1.67 21.07 19.34 22.43 18.47 327.39 Technical Cooperation 2.91 1.40 0.98 2.25 0.74 1.85 3.22 5.13 6.14 6.51 6.70 7.70 58.28 Total 6.16 8.26 4.53 6.27 11.15 17.86 10.06 6.81 27.21 25.84 29.13 26.18 382.50
Botswana
Loan Aid -0.86 0.69 -4.30 -4.31 -4.17 -7.97 -6.04 -6.72 -24.60 -4.83 -5.14 -5.66 15.99 Grant Aid 3.56 2.59 1.21 2.78 0.92 5.28 4.54 2.47 20.52 0.22 12.87 0.27 70.72 Technical Cooperation 3.35 3.97 2.96 2.79 1.88 1.84 1.75 2.02 1.95 1.99 2.98 5.29 51.72 Total 6.06 7.24 -0.13 1.27 -1.38 -0.86 0.25 -2.22 -2.14 -2.61 10.71 -0.09 138.41
Burkina Faso
Loan Aid 0.00 0.00 0.00 0.00 0.00 0.00 0.00 0.00 0.00 0.00 0.00 0.00 0.00 Grant Aid 16.75 16.56 4.71 3.90 3.32 12.85 11.62 14.70 11.39 37.84 25.47 24.08 308.30 Technical Cooperation 4.50 3.89 5.31 6.69 5.17 6.03 6.85 5.73 9.58 11.93 16.11 16.22 112.99 Total 21.25 20.44 10.02 10.58 8.49 18.88 18.47 20.43 20.98 49.77 41.59 40.30 421.99
Burundi
Loan Aid 0.00 0.00 0.00 0.00 0.00 -1.42 3.10 -0.62 -0.77 -35.89 0.00 0.00 -11.22 Grant Aid 0.16 0.16 0.00 0.00 0.27 1.66 11.71 6.96 20.83 52.36 34.22 17.63 224.12 Technical Cooperation 0.08 0.14 0.09 0.09 0.14 0.25 0.62 2.18 3.28 3.95 4.84 3.57 24.23 Total 0.24 0.29 0.09 0.09 0.40 0.49 15.42 8.52 23.34 20.42 39.06 21.20 237.10
Cameroon
Loan Aid 4.49 36.18 0.00 0.00 0.00 8.56 -79.61 0.00 0.00 0.00 6.06 3.96 6.58 Grant Aid 9.43 2.65 6.11 9.75 13.93 9.04 95.89 16.00 12.50 4.30 31.45 13.03 299.48 Technical Cooperation 1.89 2.49 1.40 1.03 2.92 1.67 2.49 2.55 3.08 3.81 4.52 6.69 56.44 Total 15.81 41.32 7.51 10.79 16.86 19.27 18.77 18.55 15.58 8.11 42.03 23.68 362.52
Cape Verde
Loan Aid 0.00 0.00 0.00 0.00 0.00 0.00 0.00 0.00 0.00 1.49 6.73 20.63 28.86 Grant Aid 9.86 2.63 5.18 10.81 3.65 2.72 1.61 1.44 3.66 14.63 7.35 4.74 126.11 Technical Cooperation 0.89 0.80 1.13 0.96 0.29 0.11 0.92 0.44 1.64 1.75 3.32 1.17 22.35 Total 10.74 3.43 6.31 11.77 3.94 2.83 2.53 1.89 5.29 17.87 17.40 26.54 177.36
Central African Republic
Loan Aid 0.00 0.00 0.00 0.00 0.00 0.00 0.00 -0.99 -0.57 1.21 -6.12 0.00 -2.01 Grant Aid 20.94 13.11 12.28 1.40 0.00 0.09 0.00 3.15 12.57 4.70 14.15 38.14 342.26 Technical Cooperation 1.81 1.94 0.57 0.32 0.10 0.01 0.10 0.39 0.17 0.16 0.06 0.11 24.24 Total 22.75 15.05 12.86 1.73 0.10 0.10 0.10 2.55 12.18 6.08 8.09 38.25 364.52
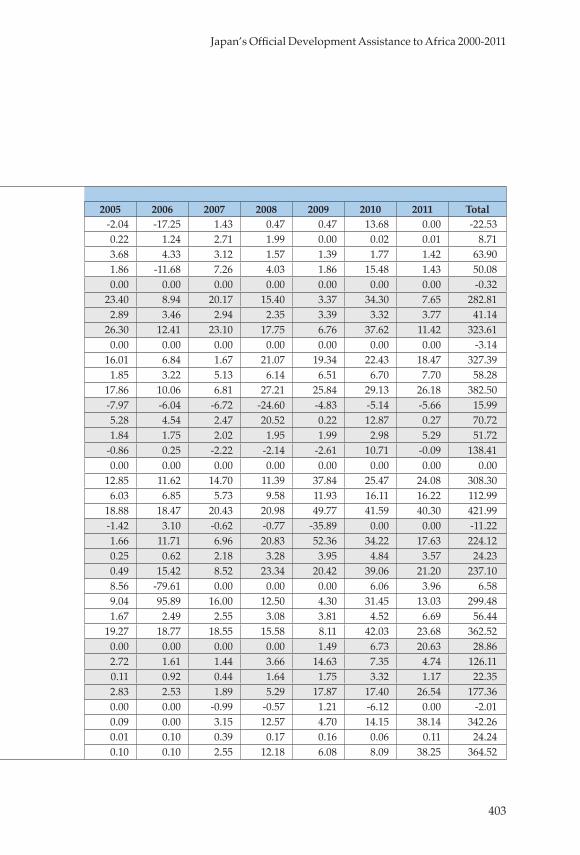
403
Japan’s Official Development Assistance to Africa 2000-2011
Appendix 2: Japan’s Official Development Assistance to Africa 2000-2011
Japan’s ODA (Net disbursements, $ million)COUNTRY SCHEME 2000 2001 2002 2003 2004 2005 2006 2007 2008 2009 2010 2011 Total
Algeria
Loan Aid -5.82 -5.00 -2.88 -1.05 -2.70 -2.04 -17.25 1.43 0.47 0.47 13.68 0.00 -22.53 Grant Aid 0.00 0.18 0.05 0.11 0.01 0.22 1.24 2.71 1.99 0.00 0.02 0.01 8.71 Technical Cooperation 0.94 0.82 0.65 1.08 1.71 3.68 4.33 3.12 1.57 1.39 1.77 1.42 63.90 Total -4.88 -4.00 -2.18 0.14 -0.98 1.86 -11.68 7.26 4.03 1.86 15.48 1.43 50.08
Angola
Loan Aid 0.00 0.00 0.00 0.00 0.00 0.00 0.00 0.00 0.00 0.00 0.00 0.00 -0.32 Grant Aid 17.88 18.20 26.09 32.66 24.03 23.40 8.94 20.17 15.40 3.37 34.30 7.65 282.81 Technical Cooperation 3.59 2.51 1.13 0.44 1.43 2.89 3.46 2.94 2.35 3.39 3.32 3.77 41.14 Total 21.47 20.71 27.21 33.10 25.47 26.30 12.41 23.10 17.75 6.76 37.62 11.42 323.61
Benin
Loan Aid 0.00 0.00 0.00 0.00 -34.80 0.00 0.00 0.00 0.00 0.00 0.00 0.00 -3.14 Grant Aid 3.26 6.86 3.55 4.02 45.21 16.01 6.84 1.67 21.07 19.34 22.43 18.47 327.39 Technical Cooperation 2.91 1.40 0.98 2.25 0.74 1.85 3.22 5.13 6.14 6.51 6.70 7.70 58.28 Total 6.16 8.26 4.53 6.27 11.15 17.86 10.06 6.81 27.21 25.84 29.13 26.18 382.50
Botswana
Loan Aid -0.86 0.69 -4.30 -4.31 -4.17 -7.97 -6.04 -6.72 -24.60 -4.83 -5.14 -5.66 15.99 Grant Aid 3.56 2.59 1.21 2.78 0.92 5.28 4.54 2.47 20.52 0.22 12.87 0.27 70.72 Technical Cooperation 3.35 3.97 2.96 2.79 1.88 1.84 1.75 2.02 1.95 1.99 2.98 5.29 51.72 Total 6.06 7.24 -0.13 1.27 -1.38 -0.86 0.25 -2.22 -2.14 -2.61 10.71 -0.09 138.41
Burkina Faso
Loan Aid 0.00 0.00 0.00 0.00 0.00 0.00 0.00 0.00 0.00 0.00 0.00 0.00 0.00 Grant Aid 16.75 16.56 4.71 3.90 3.32 12.85 11.62 14.70 11.39 37.84 25.47 24.08 308.30 Technical Cooperation 4.50 3.89 5.31 6.69 5.17 6.03 6.85 5.73 9.58 11.93 16.11 16.22 112.99 Total 21.25 20.44 10.02 10.58 8.49 18.88 18.47 20.43 20.98 49.77 41.59 40.30 421.99
Burundi
Loan Aid 0.00 0.00 0.00 0.00 0.00 -1.42 3.10 -0.62 -0.77 -35.89 0.00 0.00 -11.22 Grant Aid 0.16 0.16 0.00 0.00 0.27 1.66 11.71 6.96 20.83 52.36 34.22 17.63 224.12 Technical Cooperation 0.08 0.14 0.09 0.09 0.14 0.25 0.62 2.18 3.28 3.95 4.84 3.57 24.23 Total 0.24 0.29 0.09 0.09 0.40 0.49 15.42 8.52 23.34 20.42 39.06 21.20 237.10
Cameroon
Loan Aid 4.49 36.18 0.00 0.00 0.00 8.56 -79.61 0.00 0.00 0.00 6.06 3.96 6.58 Grant Aid 9.43 2.65 6.11 9.75 13.93 9.04 95.89 16.00 12.50 4.30 31.45 13.03 299.48 Technical Cooperation 1.89 2.49 1.40 1.03 2.92 1.67 2.49 2.55 3.08 3.81 4.52 6.69 56.44 Total 15.81 41.32 7.51 10.79 16.86 19.27 18.77 18.55 15.58 8.11 42.03 23.68 362.52
Cape Verde
Loan Aid 0.00 0.00 0.00 0.00 0.00 0.00 0.00 0.00 0.00 1.49 6.73 20.63 28.86 Grant Aid 9.86 2.63 5.18 10.81 3.65 2.72 1.61 1.44 3.66 14.63 7.35 4.74 126.11 Technical Cooperation 0.89 0.80 1.13 0.96 0.29 0.11 0.92 0.44 1.64 1.75 3.32 1.17 22.35 Total 10.74 3.43 6.31 11.77 3.94 2.83 2.53 1.89 5.29 17.87 17.40 26.54 177.36
Central African Republic
Loan Aid 0.00 0.00 0.00 0.00 0.00 0.00 0.00 -0.99 -0.57 1.21 -6.12 0.00 -2.01 Grant Aid 20.94 13.11 12.28 1.40 0.00 0.09 0.00 3.15 12.57 4.70 14.15 38.14 342.26 Technical Cooperation 1.81 1.94 0.57 0.32 0.10 0.01 0.10 0.39 0.17 0.16 0.06 0.11 24.24 Total 22.75 15.05 12.86 1.73 0.10 0.10 0.10 2.55 12.18 6.08 8.09 38.25 364.52
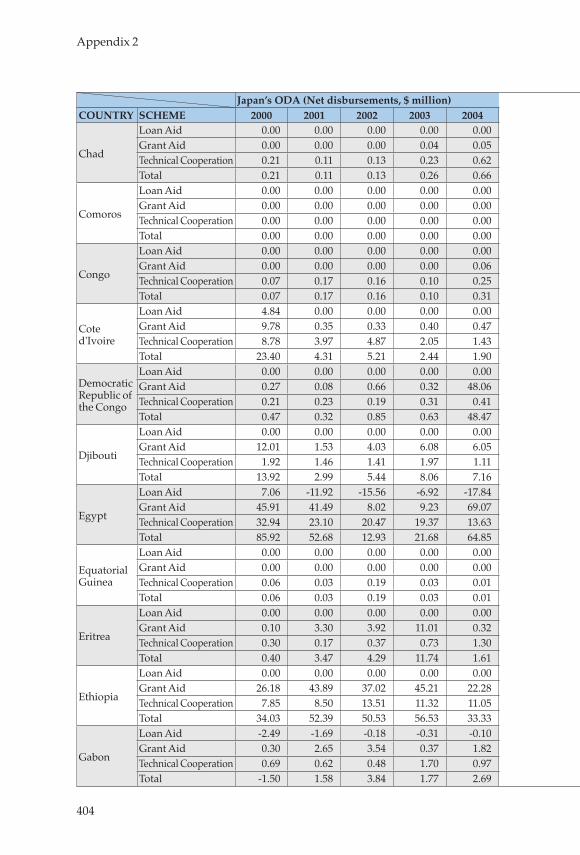
404
Appendix 2
Japan’s ODA (Net disbursements, $ million)COUNTRY SCHEME 2000 2001 2002 2003 2004 2005 2006 2007 2008 2009 2010 2011 Total
Chad
Loan Aid 0.00 0.00 0.00 0.00 0.00 0.00 0.00 0.00 0.00 0.00 0.00 0.00 0.00 Grant Aid 0.00 0.00 0.00 0.04 0.05 0.00 5.97 9.65 14.33 13.85 13.54 20.39 77.82 Technical Cooperation 0.21 0.11 0.13 0.23 0.62 2.05 2.77 0.25 0.06 0.13 0.22 0.43 9.14 Total 0.21 0.11 0.13 0.26 0.66 2.05 8.74 9.90 14.39 13.98 13.76 20.82 86.94
Comoros
Loan Aid 0.00 0.00 0.00 0.00 0.00 0.00 0.00 0.00 0.00 0.00 0.00 0.00 0.00 Grant Aid 0.00 0.00 0.00 0.00 0.00 0.00 0.00 0.00 0.00 5.11 0.41 2.11 48.25 Technical Cooperation 0.00 0.00 0.00 0.00 0.00 0.03 0.06 0.01 0.03 0.20 0.29 1.55 7.26 Total 0.00 0.00 0.00 0.00 0.00 0.03 0.06 0.01 0.03 5.30 0.70 3.66 55.51
Congo
Loan Aid 0.00 0.00 0.00 0.00 0.00 0.00 0.00 0.00 0.00 0.00 0.00 0.00 0.00 Grant Aid 0.00 0.00 0.00 0.00 0.06 0.00 0.00 4.97 10.49 0.00 5.46 6.94 36.13 Technical Cooperation 0.07 0.17 0.16 0.10 0.25 0.17 0.40 0.01 0.13 0.38 0.52 0.28 5.71 Total 0.07 0.17 0.16 0.10 0.31 0.17 0.40 4.99 10.62 0.38 5.98 7.21 41.83
Cote d'Ivoire
Loan Aid 4.84 0.00 0.00 0.00 0.00 0.00 11.71 0.00 0.00 0.00 45.79 1.56 163.06 Grant Aid 9.78 0.35 0.33 0.40 0.47 0.10 0.00 5.48 18.88 9.38 33.94 6.25 404.21 Technical Cooperation 8.78 3.97 4.87 2.05 1.43 1.27 1.24 1.06 0.62 1.01 1.54 0.36 105.71 Total 23.40 4.31 5.21 2.44 1.90 1.37 12.95 6.54 19.51 10.39 81.26 8.17 672.95
Democratic Republic of the Congo
Loan Aid 0.00 0.00 0.00 0.00 0.00 353.89 -4.95 0.00 0.00 0.00 -0.43 -1,029.04 -479.61 Grant Aid 0.27 0.08 0.66 0.32 48.06 2.72 27.50 20.25 45.32 52.62 66.19 1,206.16 1,641.44 Technical Cooperation 0.21 0.23 0.19 0.31 0.41 19.65 0.62 2.68 5.89 13.08 14.24 9.62 108.25 Total 0.47 0.32 0.85 0.63 48.47 376.26 23.17 22.93 51.22 65.70 80.00 186.74 1,270.06
Djibouti
Loan Aid 0.00 0.00 0.00 0.00 0.00 0.00 0.00 0.00 0.00 0.00 0.00 0.00 0.00 Grant Aid 12.01 1.53 4.03 6.08 6.05 5.48 3.50 2.58 2.24 26.52 34.42 11.95 247.74 Technical Cooperation 1.92 1.46 1.41 1.97 1.11 0.90 1.09 1.09 1.50 2.30 3.56 4.62 33.47 Total 13.92 2.99 5.44 8.06 7.16 6.38 4.59 3.67 3.74 28.82 37.98 16.57 281.22
Egypt
Loan Aid 7.06 -11.92 -15.56 -6.92 -17.84 -98.69 -40.23 -49.96 -38.32 -65.11 -73.07 -126.30 1,496.14 Grant Aid 45.91 41.49 8.02 9.23 69.07 51.55 22.69 10.59 33.22 23.55 20.75 0.14 1,365.22 Technical Cooperation 32.94 23.10 20.47 19.37 13.63 11.05 12.37 12.33 16.73 22.75 34.59 34.88 613.20 Total 85.92 52.68 12.93 21.68 64.85 -36.10 -5.18 -27.04 11.64 -18.81 -17.74 -91.29 3,474.55
Equatorial Guinea
Loan Aid 0.00 0.00 0.00 0.00 0.00 0.00 0.00 0.00 0.00 0.00 0.00 0.00 0.00 Grant Aid 0.00 0.00 0.00 0.00 0.00 0.00 0.00 0.00 0.00 0.00 0.00 0.28 8.25 Technical Cooperation 0.06 0.03 0.19 0.03 0.01 0.09 0.01 0.01 0.09 0.10 0.32 0.04 3.32 Total 0.06 0.03 0.19 0.03 0.01 0.09 0.01 0.01 0.09 0.10 0.32 0.32 11.57
Eritrea
Loan Aid 0.00 0.00 0.00 0.00 0.00 0.00 0.00 0.00 0.00 0.00 0.00 0.00 0.00 Grant Aid 0.10 3.30 3.92 11.01 0.32 5.48 7.57 6.60 17.24 7.22 8.25 7.25 104.08 Technical Cooperation 0.30 0.17 0.37 0.73 1.30 1.76 2.34 1.78 0.47 1.56 1.61 2.19 19.86 Total 0.40 3.47 4.29 11.74 1.61 7.24 9.91 8.37 17.71 8.78 9.86 9.44 123.95
Ethiopia
Loan Aid 0.00 0.00 0.00 0.00 0.00 0.00 0.00 0.00 0.00 0.00 0.00 0.00 0.00 Grant Aid 26.18 43.89 37.02 45.21 22.28 20.79 45.15 24.15 32.88 80.79 65.88 86.12 867.91 Technical Cooperation 7.85 8.50 13.51 11.32 11.05 13.38 12.71 11.89 14.24 16.98 28.01 33.59 270.13 Total 34.03 52.39 50.53 56.53 33.33 34.17 57.85 36.03 47.12 97.76 93.89 119.70 1,129.25
Gabon
Loan Aid -2.49 -1.69 -0.18 -0.31 -0.10 -0.68 -2.20 -2.10 -2.73 -4.89 -1.95 -2.36 -11.66 Grant Aid 0.30 2.65 3.54 0.37 1.82 5.40 0.12 0.04 0.37 0.13 21.92 8.76 47.55 Technical Cooperation 0.69 0.62 0.48 1.70 0.97 1.40 1.81 2.31 4.11 4.85 4.80 4.55 33.30 Total -1.50 1.58 3.84 1.77 2.69 6.13 -0.28 0.26 1.75 0.08 24.77 10.96 69.16
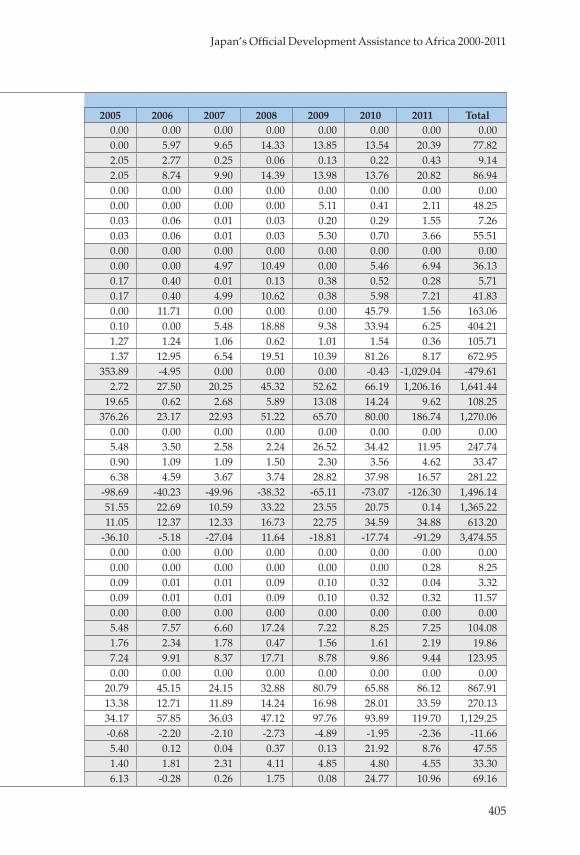
405
Japan’s Official Development Assistance to Africa 2000-2011
Japan’s ODA (Net disbursements, $ million)COUNTRY SCHEME 2000 2001 2002 2003 2004 2005 2006 2007 2008 2009 2010 2011 Total
Chad
Loan Aid 0.00 0.00 0.00 0.00 0.00 0.00 0.00 0.00 0.00 0.00 0.00 0.00 0.00 Grant Aid 0.00 0.00 0.00 0.04 0.05 0.00 5.97 9.65 14.33 13.85 13.54 20.39 77.82 Technical Cooperation 0.21 0.11 0.13 0.23 0.62 2.05 2.77 0.25 0.06 0.13 0.22 0.43 9.14 Total 0.21 0.11 0.13 0.26 0.66 2.05 8.74 9.90 14.39 13.98 13.76 20.82 86.94
Comoros
Loan Aid 0.00 0.00 0.00 0.00 0.00 0.00 0.00 0.00 0.00 0.00 0.00 0.00 0.00 Grant Aid 0.00 0.00 0.00 0.00 0.00 0.00 0.00 0.00 0.00 5.11 0.41 2.11 48.25 Technical Cooperation 0.00 0.00 0.00 0.00 0.00 0.03 0.06 0.01 0.03 0.20 0.29 1.55 7.26 Total 0.00 0.00 0.00 0.00 0.00 0.03 0.06 0.01 0.03 5.30 0.70 3.66 55.51
Congo
Loan Aid 0.00 0.00 0.00 0.00 0.00 0.00 0.00 0.00 0.00 0.00 0.00 0.00 0.00 Grant Aid 0.00 0.00 0.00 0.00 0.06 0.00 0.00 4.97 10.49 0.00 5.46 6.94 36.13 Technical Cooperation 0.07 0.17 0.16 0.10 0.25 0.17 0.40 0.01 0.13 0.38 0.52 0.28 5.71 Total 0.07 0.17 0.16 0.10 0.31 0.17 0.40 4.99 10.62 0.38 5.98 7.21 41.83
Cote d'Ivoire
Loan Aid 4.84 0.00 0.00 0.00 0.00 0.00 11.71 0.00 0.00 0.00 45.79 1.56 163.06 Grant Aid 9.78 0.35 0.33 0.40 0.47 0.10 0.00 5.48 18.88 9.38 33.94 6.25 404.21 Technical Cooperation 8.78 3.97 4.87 2.05 1.43 1.27 1.24 1.06 0.62 1.01 1.54 0.36 105.71 Total 23.40 4.31 5.21 2.44 1.90 1.37 12.95 6.54 19.51 10.39 81.26 8.17 672.95
Democratic Republic of the Congo
Loan Aid 0.00 0.00 0.00 0.00 0.00 353.89 -4.95 0.00 0.00 0.00 -0.43 -1,029.04 -479.61 Grant Aid 0.27 0.08 0.66 0.32 48.06 2.72 27.50 20.25 45.32 52.62 66.19 1,206.16 1,641.44 Technical Cooperation 0.21 0.23 0.19 0.31 0.41 19.65 0.62 2.68 5.89 13.08 14.24 9.62 108.25 Total 0.47 0.32 0.85 0.63 48.47 376.26 23.17 22.93 51.22 65.70 80.00 186.74 1,270.06
Djibouti
Loan Aid 0.00 0.00 0.00 0.00 0.00 0.00 0.00 0.00 0.00 0.00 0.00 0.00 0.00 Grant Aid 12.01 1.53 4.03 6.08 6.05 5.48 3.50 2.58 2.24 26.52 34.42 11.95 247.74 Technical Cooperation 1.92 1.46 1.41 1.97 1.11 0.90 1.09 1.09 1.50 2.30 3.56 4.62 33.47 Total 13.92 2.99 5.44 8.06 7.16 6.38 4.59 3.67 3.74 28.82 37.98 16.57 281.22
Egypt
Loan Aid 7.06 -11.92 -15.56 -6.92 -17.84 -98.69 -40.23 -49.96 -38.32 -65.11 -73.07 -126.30 1,496.14 Grant Aid 45.91 41.49 8.02 9.23 69.07 51.55 22.69 10.59 33.22 23.55 20.75 0.14 1,365.22 Technical Cooperation 32.94 23.10 20.47 19.37 13.63 11.05 12.37 12.33 16.73 22.75 34.59 34.88 613.20 Total 85.92 52.68 12.93 21.68 64.85 -36.10 -5.18 -27.04 11.64 -18.81 -17.74 -91.29 3,474.55
Equatorial Guinea
Loan Aid 0.00 0.00 0.00 0.00 0.00 0.00 0.00 0.00 0.00 0.00 0.00 0.00 0.00 Grant Aid 0.00 0.00 0.00 0.00 0.00 0.00 0.00 0.00 0.00 0.00 0.00 0.28 8.25 Technical Cooperation 0.06 0.03 0.19 0.03 0.01 0.09 0.01 0.01 0.09 0.10 0.32 0.04 3.32 Total 0.06 0.03 0.19 0.03 0.01 0.09 0.01 0.01 0.09 0.10 0.32 0.32 11.57
Eritrea
Loan Aid 0.00 0.00 0.00 0.00 0.00 0.00 0.00 0.00 0.00 0.00 0.00 0.00 0.00 Grant Aid 0.10 3.30 3.92 11.01 0.32 5.48 7.57 6.60 17.24 7.22 8.25 7.25 104.08 Technical Cooperation 0.30 0.17 0.37 0.73 1.30 1.76 2.34 1.78 0.47 1.56 1.61 2.19 19.86 Total 0.40 3.47 4.29 11.74 1.61 7.24 9.91 8.37 17.71 8.78 9.86 9.44 123.95
Ethiopia
Loan Aid 0.00 0.00 0.00 0.00 0.00 0.00 0.00 0.00 0.00 0.00 0.00 0.00 0.00 Grant Aid 26.18 43.89 37.02 45.21 22.28 20.79 45.15 24.15 32.88 80.79 65.88 86.12 867.91 Technical Cooperation 7.85 8.50 13.51 11.32 11.05 13.38 12.71 11.89 14.24 16.98 28.01 33.59 270.13 Total 34.03 52.39 50.53 56.53 33.33 34.17 57.85 36.03 47.12 97.76 93.89 119.70 1,129.25
Gabon
Loan Aid -2.49 -1.69 -0.18 -0.31 -0.10 -0.68 -2.20 -2.10 -2.73 -4.89 -1.95 -2.36 -11.66 Grant Aid 0.30 2.65 3.54 0.37 1.82 5.40 0.12 0.04 0.37 0.13 21.92 8.76 47.55 Technical Cooperation 0.69 0.62 0.48 1.70 0.97 1.40 1.81 2.31 4.11 4.85 4.80 4.55 33.30 Total -1.50 1.58 3.84 1.77 2.69 6.13 -0.28 0.26 1.75 0.08 24.77 10.96 69.16
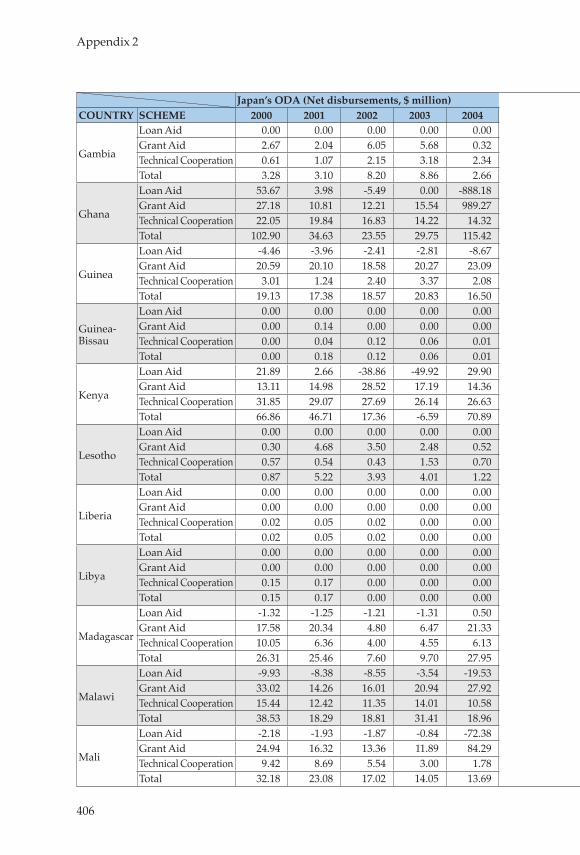
406
Appendix 2
Japan’s ODA (Net disbursements, $ million)COUNTRY SCHEME 2000 2001 2002 2003 2004 2005 2006 2007 2008 2009 2010 2011 Total
Gambia
Loan Aid 0.00 0.00 0.00 0.00 0.00 0.00 0.00 0.00 0.00 0.00 0.00 0.00 0.00 Grant Aid 2.67 2.04 6.05 5.68 0.32 2.61 8.26 5.81 0.61 10.48 16.25 11.17 130.76 Technical Cooperation 0.61 1.07 2.15 3.18 2.34 1.77 2.73 0.58 0.47 0.91 0.97 0.18 24.81 Total 3.28 3.10 8.20 8.86 2.66 4.38 10.99 6.39 1.08 11.39 17.22 11.45 155.56
Ghana
Loan Aid 53.67 3.98 -5.49 0.00 -888.18 0.00 0.00 0.00 0.00 0.00 0.00 0.00 -103.16 Grant Aid 27.18 10.81 12.21 15.54 989.27 28.03 24.66 27.13 33.86 44.93 47.36 22.04 1,684.79 Technical Cooperation 22.05 19.84 16.83 14.22 14.32 16.19 19.00 19.35 20.18 19.87 22.65 23.90 413.65 Total 102.90 34.63 23.55 29.75 115.42 44.22 43.66 46.48 54.03 64.80 70.00 45.94 1,995.29
Guinea
Loan Aid -4.46 -3.96 -2.41 -2.81 -8.67 -0.22 -8.05 -4.08 -0.24 0.00 0.00 0.00 38.58 Grant Aid 20.59 20.10 18.58 20.27 23.09 9.52 21.27 14.54 14.72 16.35 9.96 1.00 430.96 Technical Cooperation 3.01 1.24 2.40 3.37 2.08 2.65 3.86 1.56 2.37 1.85 0.84 0.98 56.07 Total 19.13 17.38 18.57 20.83 16.50 11.95 17.07 12.02 16.86 18.20 10.80 1.98 525.60
Guinea-Bissau
Loan Aid 0.00 0.00 0.00 0.00 0.00 0.00 0.00 0.00 0.00 0.00 0.00 0.00 0.00 Grant Aid 0.00 0.14 0.00 0.00 0.00 0.00 0.00 0.99 5.07 8.69 15.87 8.71 108.74 Technical Cooperation 0.00 0.04 0.12 0.06 0.01 0.03 0.04 0.09 0.76 0.74 0.24 1.07 7.48 Total 0.00 0.18 0.12 0.06 0.01 0.03 0.04 1.08 5.83 9.43 16.11 9.78 116.22
Kenya
Loan Aid 21.89 2.66 -38.86 -49.92 29.90 7.56 54.40 2.03 -53.06 -50.68 -68.29 -57.17 637.91 Grant Aid 13.11 14.98 28.52 17.19 14.36 23.39 24.46 28.65 41.59 59.53 68.85 100.53 935.34 Technical Cooperation 31.85 29.07 27.69 26.14 26.63 29.94 27.29 26.42 20.25 24.81 36.16 36.39 833.84 Total 66.86 46.71 17.36 -6.59 70.89 60.88 106.15 57.11 8.79 33.66 36.72 79.74 2,407.15
Lesotho
Loan Aid 0.00 0.00 0.00 0.00 0.00 0.00 0.00 0.00 0.00 0.00 0.00 0.00 0.00 Grant Aid 0.30 4.68 3.50 2.48 0.52 6.30 4.45 4.41 12.37 2.33 8.14 19.48 98.82 Technical Cooperation 0.57 0.54 0.43 1.53 0.70 0.38 0.32 0.46 0.80 0.24 0.70 0.75 10.53 Total 0.87 5.22 3.93 4.01 1.22 6.68 4.76 4.88 13.16 2.56 8.84 20.23 109.37
Liberia
Loan Aid 0.00 0.00 0.00 0.00 0.00 0.00 0.00 0.00 0.00 0.00 119.03 -198.24 -55.17 Grant Aid 0.00 0.00 0.00 0.00 0.00 0.00 17.19 12.21 12.54 11.06 10.85 240.64 345.80 Technical Cooperation 0.02 0.05 0.02 0.00 0.00 0.00 0.20 0.25 1.43 3.66 4.42 2.14 36.74 Total 0.02 0.05 0.02 0.00 0.00 0.00 17.40 12.46 13.98 14.71 134.31 44.55 327.37
Libya
Loan Aid 0.00 0.00 0.00 0.00 0.00 0.00 0.00 0.00 0.00 0.00 0.00 0.00 0.00 Grant Aid 0.00 0.00 0.00 0.00 0.00 0.00 0.00 0.00 0.00 0.00 0.00 8.13 8.13 Technical Cooperation 0.15 0.17 0.00 0.00 0.00 0.33 0.05 0.43 0.19 0.08 0.13 0.05 3.59 Total 0.15 0.17 0.00 0.00 0.00 0.33 0.05 0.43 0.19 0.08 0.13 8.18 11.72
Madagascar
Loan Aid -1.32 -1.25 -1.21 -1.31 0.50 -147.51 6.34 -0.90 -0.48 -0.26 0.00 0.00 -22.35 Grant Aid 17.58 20.34 4.80 6.47 21.33 178.92 30.05 103.04 11.47 7.39 0.00 0.00 779.22 Technical Cooperation 10.05 6.36 4.00 4.55 6.13 8.20 7.42 9.05 9.38 11.90 9.62 10.70 162.48 Total 26.31 25.46 7.60 9.70 27.95 39.61 43.82 111.19 20.37 19.03 9.62 10.70 919.39
Malawi
Loan Aid -9.93 -8.38 -8.55 -3.54 -19.53 -12.94 -4.78 -181.52 0.00 0.00 0.00 0.00 -35.38 Grant Aid 33.02 14.26 16.01 20.94 27.92 18.79 18.00 209.35 16.71 18.98 49.59 11.37 721.98 Technical Cooperation 15.44 12.42 11.35 14.01 10.58 13.84 10.16 12.47 14.08 16.82 19.86 17.27 306.40 Total 38.53 18.29 18.81 31.41 18.96 19.70 23.38 40.29 30.79 35.80 69.46 28.64 992.94
Mali
Loan Aid -2.18 -1.93 -1.87 -0.84 -72.38 0.00 0.00 0.00 0.00 0.00 0.00 0.00 -4.82 Grant Aid 24.94 16.32 13.36 11.89 84.29 20.39 23.51 6.89 32.01 32.80 34.58 36.70 551.18 Technical Cooperation 9.42 8.69 5.54 3.00 1.78 2.81 3.22 2.76 2.52 2.71 3.71 7.36 87.23 Total 32.18 23.08 17.02 14.05 13.69 23.20 26.74 9.65 34.52 35.51 38.29 44.06 633.59
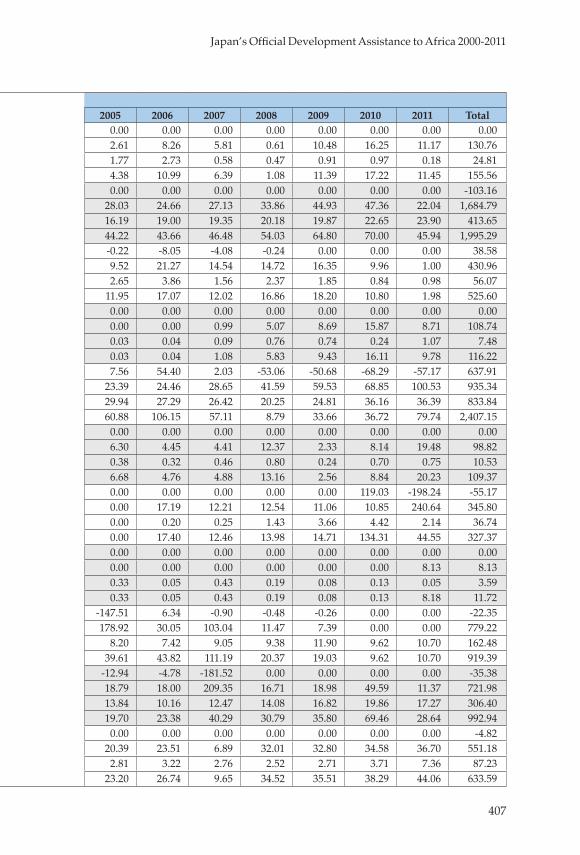
407
Japan’s Official Development Assistance to Africa 2000-2011
Japan’s ODA (Net disbursements, $ million)COUNTRY SCHEME 2000 2001 2002 2003 2004 2005 2006 2007 2008 2009 2010 2011 Total
Gambia
Loan Aid 0.00 0.00 0.00 0.00 0.00 0.00 0.00 0.00 0.00 0.00 0.00 0.00 0.00 Grant Aid 2.67 2.04 6.05 5.68 0.32 2.61 8.26 5.81 0.61 10.48 16.25 11.17 130.76 Technical Cooperation 0.61 1.07 2.15 3.18 2.34 1.77 2.73 0.58 0.47 0.91 0.97 0.18 24.81 Total 3.28 3.10 8.20 8.86 2.66 4.38 10.99 6.39 1.08 11.39 17.22 11.45 155.56
Ghana
Loan Aid 53.67 3.98 -5.49 0.00 -888.18 0.00 0.00 0.00 0.00 0.00 0.00 0.00 -103.16 Grant Aid 27.18 10.81 12.21 15.54 989.27 28.03 24.66 27.13 33.86 44.93 47.36 22.04 1,684.79 Technical Cooperation 22.05 19.84 16.83 14.22 14.32 16.19 19.00 19.35 20.18 19.87 22.65 23.90 413.65 Total 102.90 34.63 23.55 29.75 115.42 44.22 43.66 46.48 54.03 64.80 70.00 45.94 1,995.29
Guinea
Loan Aid -4.46 -3.96 -2.41 -2.81 -8.67 -0.22 -8.05 -4.08 -0.24 0.00 0.00 0.00 38.58 Grant Aid 20.59 20.10 18.58 20.27 23.09 9.52 21.27 14.54 14.72 16.35 9.96 1.00 430.96 Technical Cooperation 3.01 1.24 2.40 3.37 2.08 2.65 3.86 1.56 2.37 1.85 0.84 0.98 56.07 Total 19.13 17.38 18.57 20.83 16.50 11.95 17.07 12.02 16.86 18.20 10.80 1.98 525.60
Guinea-Bissau
Loan Aid 0.00 0.00 0.00 0.00 0.00 0.00 0.00 0.00 0.00 0.00 0.00 0.00 0.00 Grant Aid 0.00 0.14 0.00 0.00 0.00 0.00 0.00 0.99 5.07 8.69 15.87 8.71 108.74 Technical Cooperation 0.00 0.04 0.12 0.06 0.01 0.03 0.04 0.09 0.76 0.74 0.24 1.07 7.48 Total 0.00 0.18 0.12 0.06 0.01 0.03 0.04 1.08 5.83 9.43 16.11 9.78 116.22
Kenya
Loan Aid 21.89 2.66 -38.86 -49.92 29.90 7.56 54.40 2.03 -53.06 -50.68 -68.29 -57.17 637.91 Grant Aid 13.11 14.98 28.52 17.19 14.36 23.39 24.46 28.65 41.59 59.53 68.85 100.53 935.34 Technical Cooperation 31.85 29.07 27.69 26.14 26.63 29.94 27.29 26.42 20.25 24.81 36.16 36.39 833.84 Total 66.86 46.71 17.36 -6.59 70.89 60.88 106.15 57.11 8.79 33.66 36.72 79.74 2,407.15
Lesotho
Loan Aid 0.00 0.00 0.00 0.00 0.00 0.00 0.00 0.00 0.00 0.00 0.00 0.00 0.00 Grant Aid 0.30 4.68 3.50 2.48 0.52 6.30 4.45 4.41 12.37 2.33 8.14 19.48 98.82 Technical Cooperation 0.57 0.54 0.43 1.53 0.70 0.38 0.32 0.46 0.80 0.24 0.70 0.75 10.53 Total 0.87 5.22 3.93 4.01 1.22 6.68 4.76 4.88 13.16 2.56 8.84 20.23 109.37
Liberia
Loan Aid 0.00 0.00 0.00 0.00 0.00 0.00 0.00 0.00 0.00 0.00 119.03 -198.24 -55.17 Grant Aid 0.00 0.00 0.00 0.00 0.00 0.00 17.19 12.21 12.54 11.06 10.85 240.64 345.80 Technical Cooperation 0.02 0.05 0.02 0.00 0.00 0.00 0.20 0.25 1.43 3.66 4.42 2.14 36.74 Total 0.02 0.05 0.02 0.00 0.00 0.00 17.40 12.46 13.98 14.71 134.31 44.55 327.37
Libya
Loan Aid 0.00 0.00 0.00 0.00 0.00 0.00 0.00 0.00 0.00 0.00 0.00 0.00 0.00 Grant Aid 0.00 0.00 0.00 0.00 0.00 0.00 0.00 0.00 0.00 0.00 0.00 8.13 8.13 Technical Cooperation 0.15 0.17 0.00 0.00 0.00 0.33 0.05 0.43 0.19 0.08 0.13 0.05 3.59 Total 0.15 0.17 0.00 0.00 0.00 0.33 0.05 0.43 0.19 0.08 0.13 8.18 11.72
Madagascar
Loan Aid -1.32 -1.25 -1.21 -1.31 0.50 -147.51 6.34 -0.90 -0.48 -0.26 0.00 0.00 -22.35 Grant Aid 17.58 20.34 4.80 6.47 21.33 178.92 30.05 103.04 11.47 7.39 0.00 0.00 779.22 Technical Cooperation 10.05 6.36 4.00 4.55 6.13 8.20 7.42 9.05 9.38 11.90 9.62 10.70 162.48 Total 26.31 25.46 7.60 9.70 27.95 39.61 43.82 111.19 20.37 19.03 9.62 10.70 919.39
Malawi
Loan Aid -9.93 -8.38 -8.55 -3.54 -19.53 -12.94 -4.78 -181.52 0.00 0.00 0.00 0.00 -35.38 Grant Aid 33.02 14.26 16.01 20.94 27.92 18.79 18.00 209.35 16.71 18.98 49.59 11.37 721.98 Technical Cooperation 15.44 12.42 11.35 14.01 10.58 13.84 10.16 12.47 14.08 16.82 19.86 17.27 306.40 Total 38.53 18.29 18.81 31.41 18.96 19.70 23.38 40.29 30.79 35.80 69.46 28.64 992.94
Mali
Loan Aid -2.18 -1.93 -1.87 -0.84 -72.38 0.00 0.00 0.00 0.00 0.00 0.00 0.00 -4.82 Grant Aid 24.94 16.32 13.36 11.89 84.29 20.39 23.51 6.89 32.01 32.80 34.58 36.70 551.18 Technical Cooperation 9.42 8.69 5.54 3.00 1.78 2.81 3.22 2.76 2.52 2.71 3.71 7.36 87.23 Total 32.18 23.08 17.02 14.05 13.69 23.20 26.74 9.65 34.52 35.51 38.29 44.06 633.59
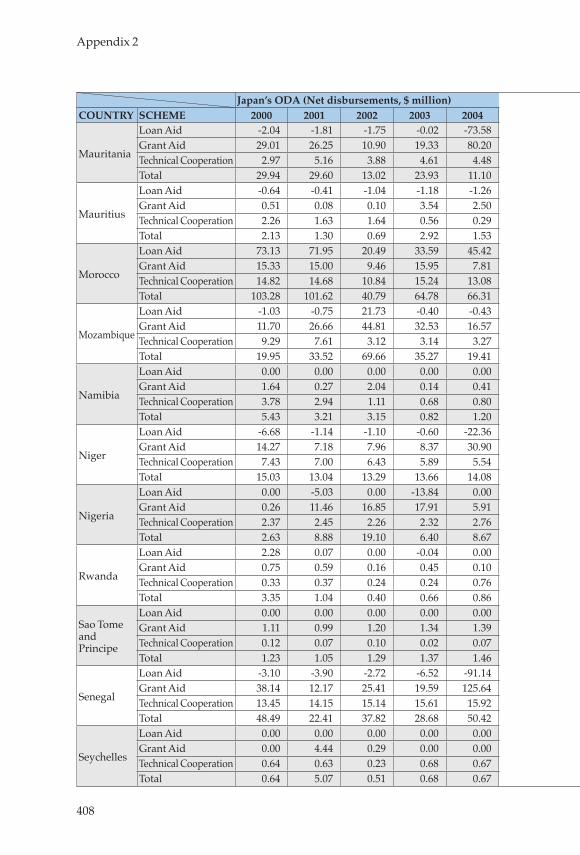
408
Appendix 2
Japan’s ODA (Net disbursements, $ million)COUNTRY SCHEME 2000 2001 2002 2003 2004 2005 2006 2007 2008 2009 2010 2011 Total
Mauritania
Loan Aid -2.04 -1.81 -1.75 -0.02 -73.58 0.00 0.00 0.00 0.00 0.00 0.00 0.00 -11.69 Grant Aid 29.01 26.25 10.90 19.33 80.20 11.62 9.72 22.13 10.75 6.70 12.53 9.03 484.12 Technical Cooperation 2.97 5.16 3.88 4.61 4.48 3.10 2.36 1.32 3.73 2.92 2.03 0.96 59.17 Total 29.94 29.60 13.02 23.93 11.10 14.72 12.08 23.45 14.49 9.63 14.56 9.99 531.64
Mauritius
Loan Aid -0.64 -0.41 -1.04 -1.18 -1.26 15.55 3.77 2.10 0.11 -3.34 -3.55 -3.85 22.67 Grant Aid 0.51 0.08 0.10 3.54 2.50 0.85 0.00 0.06 0.08 0.21 0.30 0.27 38.73 Technical Cooperation 2.26 1.63 1.64 0.56 0.29 0.15 0.24 0.61 0.17 1.06 0.40 1.15 40.92 Total 2.13 1.30 0.69 2.92 1.53 16.55 4.02 2.77 0.36 -2.07 -2.85 -2.44 102.31
Morocco
Loan Aid 73.13 71.95 20.49 33.59 45.42 -69.43 43.76 49.71 82.83 85.05 102.78 18.21 898.93 Grant Aid 15.33 15.00 9.46 15.95 7.81 2.22 8.44 6.01 16.85 4.77 8.23 1.74 275.71 Technical Cooperation 14.82 14.68 10.84 15.24 13.08 13.02 8.93 8.93 6.16 8.12 10.15 10.16 298.32 Total 103.28 101.62 40.79 64.78 66.31 -54.19 61.13 64.65 105.84 97.93 121.16 30.11 1,473.00
Mozambique
Loan Aid -1.03 -0.75 21.73 -0.40 -0.43 -0.43 0.00 0.00 0.00 0.00 0.38 17.21 51.09 Grant Aid 11.70 26.66 44.81 32.53 16.57 9.91 101.71 17.71 17.58 50.19 48.95 14.20 825.61 Technical Cooperation 9.29 7.61 3.12 3.14 3.27 5.29 5.12 10.07 6.15 10.49 13.52 17.08 124.27 Total 19.95 33.52 69.66 35.27 19.41 14.77 106.83 27.77 23.72 60.67 62.85 48.49 1,000.98
Namibia
Loan Aid 0.00 0.00 0.00 0.00 0.00 0.00 0.00 3.04 7.15 36.14 36.39 21.69 104.42 Grant Aid 1.64 0.27 2.04 0.14 0.41 0.00 0.18 1.41 0.61 0.14 0.17 0.15 59.54 Technical Cooperation 3.78 2.94 1.11 0.68 0.80 0.39 0.83 1.29 1.90 3.54 4.03 3.36 42.06 Total 5.43 3.21 3.15 0.82 1.20 0.39 1.01 5.74 9.66 39.82 40.59 25.21 205.99
Niger
Loan Aid -6.68 -1.14 -1.10 -0.60 -22.36 0.00 0.00 0.00 0.00 0.00 0.00 0.00 -28.63 Grant Aid 14.27 7.18 7.96 8.37 30.90 17.20 4.49 19.00 5.56 23.91 15.73 11.58 440.12 Technical Cooperation 7.43 7.00 6.43 5.89 5.54 6.47 7.60 9.29 11.38 11.15 9.43 4.27 188.86 Total 15.03 13.04 13.29 13.66 14.08 23.68 12.09 28.28 16.93 35.06 25.16 15.86 600.39
Nigeria
Loan Aid 0.00 -5.03 0.00 -13.84 0.00 63.29 -488.99 0.00 0.00 0.00 0.00 0.00 -182.34 Grant Aid 0.26 11.46 16.85 17.91 5.91 1.78 2,116.31 22.76 25.21 24.56 16.94 25.26 2,430.38 Technical Cooperation 2.37 2.45 2.26 2.32 2.76 4.09 4.30 4.08 3.75 4.33 6.93 13.30 131.56 Total 2.63 8.88 19.10 6.40 8.67 69.16 1,631.61 26.84 28.96 28.88 23.87 38.57 2,379.58
Rwanda
Loan Aid 2.28 0.07 0.00 -0.04 0.00 -0.88 0.00 0.00 0.00 0.00 0.00 0.00 5.53 Grant Aid 0.75 0.59 0.16 0.45 0.10 1.78 8.93 13.96 10.26 12.70 11.01 11.84 227.40 Technical Cooperation 0.33 0.37 0.24 0.24 0.76 1.94 3.81 5.58 7.49 8.64 11.81 12.44 70.15 Total 3.35 1.04 0.40 0.66 0.86 2.85 12.74 19.53 17.75 21.34 22.82 24.28 303.03
Sao Tome and Principe
Loan Aid 0.00 0.00 0.00 0.00 0.00 0.00 0.00 0.00 0.00 0.00 0.00 0.00 0.00 Grant Aid 1.11 0.99 1.20 1.34 1.39 1.31 0.00 2.89 7.15 0.21 2.85 3.44 46.30 Technical Cooperation 0.12 0.07 0.10 0.02 0.07 0.22 0.03 0.23 0.07 0.21 0.75 0.10 7.22 Total 1.23 1.05 1.29 1.37 1.46 1.53 0.03 3.11 7.22 0.42 3.54 3.54 53.53
Senegal
Loan Aid -3.10 -3.90 -2.72 -6.52 -91.14 0.00 0.00 0.00 3.19 3.83 2.80 0.00 -16.29 Grant Aid 38.14 12.17 25.41 19.59 125.64 9.62 20.08 18.59 7.89 25.32 30.82 56.34 934.18 Technical Cooperation 13.45 14.15 15.14 15.61 15.92 18.33 14.42 13.36 14.05 17.58 21.58 26.49 328.15 Total 48.49 22.41 37.82 28.68 50.42 27.95 34.50 31.95 25.13 46.74 55.21 82.83 1,246.02
Seychelles
Loan Aid 0.00 0.00 0.00 0.00 0.00 0.00 0.00 0.00 0.00 0.00 0.00 0.00 0.00 Grant Aid 0.00 4.44 0.29 0.00 0.00 0.00 0.00 0.00 0.36 7.79 8.94 1.12 41.25 Technical Cooperation 0.64 0.63 0.23 0.68 0.67 1.26 1.91 0.76 1.26 1.28 0.63 0.12 18.43 Total 0.64 5.07 0.51 0.68 0.67 1.26 1.91 0.76 1.62 9.06 9.57 1.24 59.67
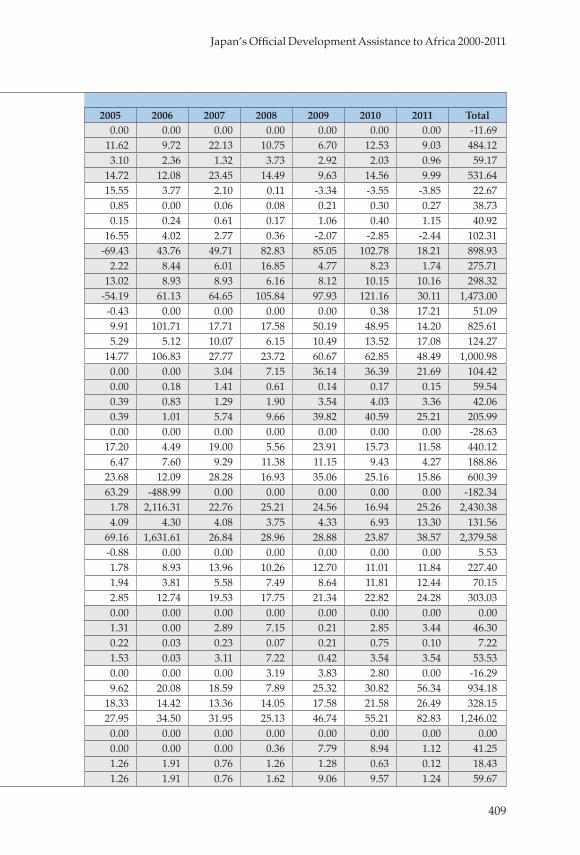
409
Japan’s Official Development Assistance to Africa 2000-2011
Japan’s ODA (Net disbursements, $ million)COUNTRY SCHEME 2000 2001 2002 2003 2004 2005 2006 2007 2008 2009 2010 2011 Total
Mauritania
Loan Aid -2.04 -1.81 -1.75 -0.02 -73.58 0.00 0.00 0.00 0.00 0.00 0.00 0.00 -11.69 Grant Aid 29.01 26.25 10.90 19.33 80.20 11.62 9.72 22.13 10.75 6.70 12.53 9.03 484.12 Technical Cooperation 2.97 5.16 3.88 4.61 4.48 3.10 2.36 1.32 3.73 2.92 2.03 0.96 59.17 Total 29.94 29.60 13.02 23.93 11.10 14.72 12.08 23.45 14.49 9.63 14.56 9.99 531.64
Mauritius
Loan Aid -0.64 -0.41 -1.04 -1.18 -1.26 15.55 3.77 2.10 0.11 -3.34 -3.55 -3.85 22.67 Grant Aid 0.51 0.08 0.10 3.54 2.50 0.85 0.00 0.06 0.08 0.21 0.30 0.27 38.73 Technical Cooperation 2.26 1.63 1.64 0.56 0.29 0.15 0.24 0.61 0.17 1.06 0.40 1.15 40.92 Total 2.13 1.30 0.69 2.92 1.53 16.55 4.02 2.77 0.36 -2.07 -2.85 -2.44 102.31
Morocco
Loan Aid 73.13 71.95 20.49 33.59 45.42 -69.43 43.76 49.71 82.83 85.05 102.78 18.21 898.93 Grant Aid 15.33 15.00 9.46 15.95 7.81 2.22 8.44 6.01 16.85 4.77 8.23 1.74 275.71 Technical Cooperation 14.82 14.68 10.84 15.24 13.08 13.02 8.93 8.93 6.16 8.12 10.15 10.16 298.32 Total 103.28 101.62 40.79 64.78 66.31 -54.19 61.13 64.65 105.84 97.93 121.16 30.11 1,473.00
Mozambique
Loan Aid -1.03 -0.75 21.73 -0.40 -0.43 -0.43 0.00 0.00 0.00 0.00 0.38 17.21 51.09 Grant Aid 11.70 26.66 44.81 32.53 16.57 9.91 101.71 17.71 17.58 50.19 48.95 14.20 825.61 Technical Cooperation 9.29 7.61 3.12 3.14 3.27 5.29 5.12 10.07 6.15 10.49 13.52 17.08 124.27 Total 19.95 33.52 69.66 35.27 19.41 14.77 106.83 27.77 23.72 60.67 62.85 48.49 1,000.98
Namibia
Loan Aid 0.00 0.00 0.00 0.00 0.00 0.00 0.00 3.04 7.15 36.14 36.39 21.69 104.42 Grant Aid 1.64 0.27 2.04 0.14 0.41 0.00 0.18 1.41 0.61 0.14 0.17 0.15 59.54 Technical Cooperation 3.78 2.94 1.11 0.68 0.80 0.39 0.83 1.29 1.90 3.54 4.03 3.36 42.06 Total 5.43 3.21 3.15 0.82 1.20 0.39 1.01 5.74 9.66 39.82 40.59 25.21 205.99
Niger
Loan Aid -6.68 -1.14 -1.10 -0.60 -22.36 0.00 0.00 0.00 0.00 0.00 0.00 0.00 -28.63 Grant Aid 14.27 7.18 7.96 8.37 30.90 17.20 4.49 19.00 5.56 23.91 15.73 11.58 440.12 Technical Cooperation 7.43 7.00 6.43 5.89 5.54 6.47 7.60 9.29 11.38 11.15 9.43 4.27 188.86 Total 15.03 13.04 13.29 13.66 14.08 23.68 12.09 28.28 16.93 35.06 25.16 15.86 600.39
Nigeria
Loan Aid 0.00 -5.03 0.00 -13.84 0.00 63.29 -488.99 0.00 0.00 0.00 0.00 0.00 -182.34 Grant Aid 0.26 11.46 16.85 17.91 5.91 1.78 2,116.31 22.76 25.21 24.56 16.94 25.26 2,430.38 Technical Cooperation 2.37 2.45 2.26 2.32 2.76 4.09 4.30 4.08 3.75 4.33 6.93 13.30 131.56 Total 2.63 8.88 19.10 6.40 8.67 69.16 1,631.61 26.84 28.96 28.88 23.87 38.57 2,379.58
Rwanda
Loan Aid 2.28 0.07 0.00 -0.04 0.00 -0.88 0.00 0.00 0.00 0.00 0.00 0.00 5.53 Grant Aid 0.75 0.59 0.16 0.45 0.10 1.78 8.93 13.96 10.26 12.70 11.01 11.84 227.40 Technical Cooperation 0.33 0.37 0.24 0.24 0.76 1.94 3.81 5.58 7.49 8.64 11.81 12.44 70.15 Total 3.35 1.04 0.40 0.66 0.86 2.85 12.74 19.53 17.75 21.34 22.82 24.28 303.03
Sao Tome and Principe
Loan Aid 0.00 0.00 0.00 0.00 0.00 0.00 0.00 0.00 0.00 0.00 0.00 0.00 0.00 Grant Aid 1.11 0.99 1.20 1.34 1.39 1.31 0.00 2.89 7.15 0.21 2.85 3.44 46.30 Technical Cooperation 0.12 0.07 0.10 0.02 0.07 0.22 0.03 0.23 0.07 0.21 0.75 0.10 7.22 Total 1.23 1.05 1.29 1.37 1.46 1.53 0.03 3.11 7.22 0.42 3.54 3.54 53.53
Senegal
Loan Aid -3.10 -3.90 -2.72 -6.52 -91.14 0.00 0.00 0.00 3.19 3.83 2.80 0.00 -16.29 Grant Aid 38.14 12.17 25.41 19.59 125.64 9.62 20.08 18.59 7.89 25.32 30.82 56.34 934.18 Technical Cooperation 13.45 14.15 15.14 15.61 15.92 18.33 14.42 13.36 14.05 17.58 21.58 26.49 328.15 Total 48.49 22.41 37.82 28.68 50.42 27.95 34.50 31.95 25.13 46.74 55.21 82.83 1,246.02
Seychelles
Loan Aid 0.00 0.00 0.00 0.00 0.00 0.00 0.00 0.00 0.00 0.00 0.00 0.00 0.00 Grant Aid 0.00 4.44 0.29 0.00 0.00 0.00 0.00 0.00 0.36 7.79 8.94 1.12 41.25 Technical Cooperation 0.64 0.63 0.23 0.68 0.67 1.26 1.91 0.76 1.26 1.28 0.63 0.12 18.43 Total 0.64 5.07 0.51 0.68 0.67 1.26 1.91 0.76 1.62 9.06 9.57 1.24 59.67
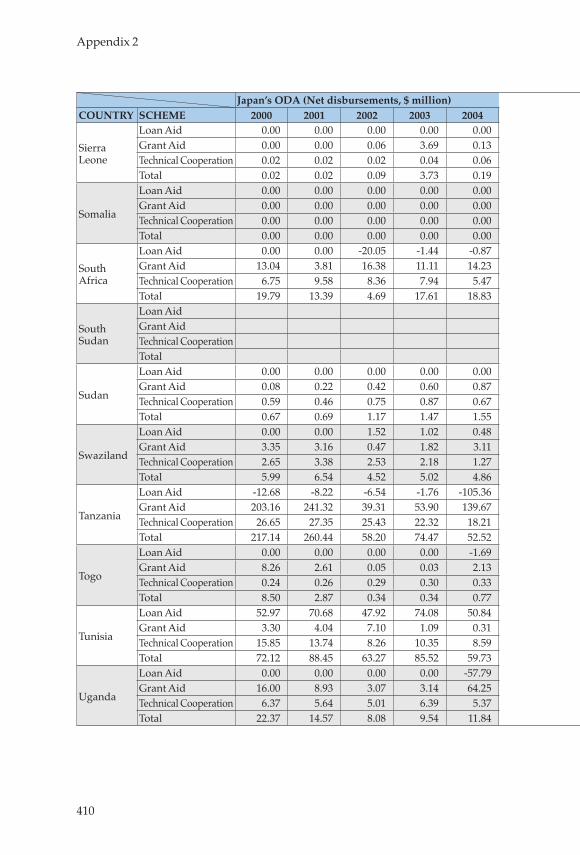
410
Appendix 2
Japan’s ODA (Net disbursements, $ million)COUNTRY SCHEME 2000 2001 2002 2003 2004 2005 2006 2007 2008 2009 2010 2011 Total
Sierra Leone
Loan Aid 0.00 0.00 0.00 0.00 0.00 -1.77 50.47 -16.62 0.00 0.00 0.00 0.00 37.27 Grant Aid 0.00 0.00 0.06 3.69 0.13 2.14 9.01 42.70 10.13 31.95 6.04 18.42 183.56 Technical Cooperation 0.02 0.02 0.02 0.04 0.06 1.73 3.21 4.02 4.00 5.50 6.18 8.11 38.85 Total 0.02 0.02 0.09 3.73 0.19 2.09 62.69 30.11 14.13 37.44 12.21 26.53 259.67
Somalia
Loan Aid 0.00 0.00 0.00 0.00 0.00 0.00 0.00 0.00 0.00 0.00 0.00 0.00 38.70 Grant Aid 0.00 0.00 0.00 0.00 0.00 0.00 0.24 3.85 23.24 22.60 29.05 51.96 210.51 Technical Cooperation 0.00 0.00 0.00 0.00 0.00 0.00 0.00 0.01 0.03 0.04 0.02 0.01 5.52 Total 0.00 0.00 0.00 0.00 0.00 0.00 0.24 3.86 23.27 22.64 29.07 51.97 254.77
South Africa
Loan Aid 0.00 0.00 -20.05 -1.44 -0.87 -0.85 -0.81 -0.80 -0.91 -1.01 -1.07 -1.18 5.89 Grant Aid 13.04 3.81 16.38 11.11 14.23 11.07 12.24 0.81 0.66 0.43 2.05 2.04 113.34 Technical Cooperation 6.75 9.58 8.36 7.94 5.47 5.87 4.49 4.65 3.92 5.24 6.13 7.25 107.79 Total 19.79 13.39 4.69 17.61 18.83 16.10 15.92 4.67 3.67 4.67 7.11 8.11 227.01
South Sudan
Loan Aid 0.00 0.00 Grant Aid 8.71 8.71 Technical Cooperation 16.85 16.85 Total 25.56 25.56
Sudan
Loan Aid 0.00 0.00 0.00 0.00 0.00 0.00 0.00 0.00 0.00 -27.63 0.00 0.00 21.59 Grant Aid 0.08 0.22 0.42 0.60 0.87 0.48 38.20 44.61 100.51 125.09 92.92 73.45 953.40 Technical Cooperation 0.59 0.46 0.75 0.87 0.67 1.64 4.53 6.97 9.14 13.57 26.16 23.28 125.72 Total 0.67 0.69 1.17 1.47 1.55 2.11 42.73 51.58 109.64 111.03 119.08 96.72 1,100.72
Swaziland
Loan Aid 0.00 0.00 1.52 1.02 0.48 21.54 9.63 4.75 0.00 0.00 0.00 -2.53 36.41 Grant Aid 3.35 3.16 0.47 1.82 3.11 3.51 1.37 2.01 2.31 0.19 2.81 14.43 83.93 Technical Cooperation 2.65 3.38 2.53 2.18 1.27 0.86 0.61 0.51 0.87 0.99 1.55 0.66 30.92 Total 5.99 6.54 4.52 5.02 4.86 25.91 11.62 7.26 3.18 1.19 4.36 12.55 151.29
Tanzania
Loan Aid -12.68 -8.22 -6.54 -1.76 -105.36 0.00 0.00 33.96 5.40 48.56 10.50 37.91 101.97 Grant Aid 203.16 241.32 39.31 53.90 139.67 14.44 17.68 667.66 43.36 48.68 65.87 43.73 2,454.59 Technical Cooperation 26.65 27.35 25.43 22.32 18.21 21.67 21.72 20.04 22.23 23.22 28.23 37.80 626.30 Total 217.14 260.44 58.20 74.47 52.52 36.11 39.39 721.66 70.99 120.46 104.60 119.44 3,182.85
Togo
Loan Aid 0.00 0.00 0.00 0.00 -1.69 -1.11 -1.05 -1.04 -0.59 12.89 -0.12 -120.44 -44.04 Grant Aid 8.26 2.61 0.05 0.03 2.13 1.57 1.34 1.16 0.80 20.96 6.65 126.61 257.05 Technical Cooperation 0.24 0.26 0.29 0.30 0.33 0.29 0.14 0.33 0.13 0.24 1.01 3.10 11.93 Total 8.50 2.87 0.34 0.34 0.77 0.76 0.44 0.46 0.33 34.09 7.54 9.26 224.96
Tunisia
Loan Aid 52.97 70.68 47.92 74.08 50.84 41.44 9.96 12.28 48.04 8.26 14.37 17.13 618.16 Grant Aid 3.30 4.04 7.10 1.09 0.31 0.57 0.19 0.18 0.03 0.19 12.22 0.16 40.97 Technical Cooperation 15.85 13.74 8.26 10.35 8.59 9.09 8.41 8.10 5.92 5.97 9.29 7.68 206.91 Total 72.12 88.45 63.27 85.52 59.73 51.10 18.56 20.56 53.98 14.41 35.87 24.97 866.06
Uganda
Loan Aid 0.00 0.00 0.00 0.00 -57.79 0.00 0.00 0.00 4.62 6.64 6.44 1.15 19.20 Grant Aid 16.00 8.93 3.07 3.14 64.25 4.80 13.56 17.83 39.75 23.16 42.06 28.19 462.66 Technical Cooperation 6.37 5.64 5.01 6.39 5.37 9.64 8.22 9.68 12.64 24.24 22.74 27.79 195.33 Total 22.37 14.57 8.08 9.54 11.84 14.44 21.78 27.51 57.01 54.05 71.24 57.12 677.21
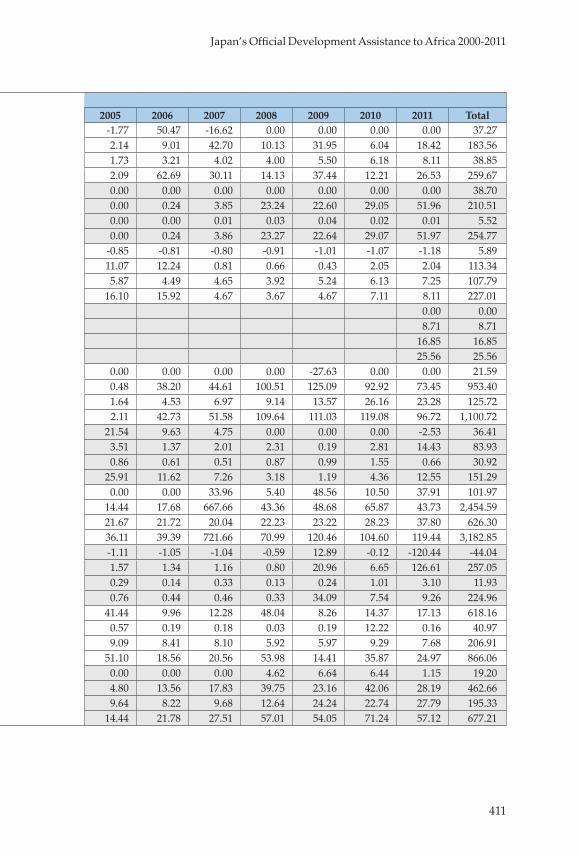
411
Japan’s Official Development Assistance to Africa 2000-2011
Japan’s ODA (Net disbursements, $ million)COUNTRY SCHEME 2000 2001 2002 2003 2004 2005 2006 2007 2008 2009 2010 2011 Total
Sierra Leone
Loan Aid 0.00 0.00 0.00 0.00 0.00 -1.77 50.47 -16.62 0.00 0.00 0.00 0.00 37.27 Grant Aid 0.00 0.00 0.06 3.69 0.13 2.14 9.01 42.70 10.13 31.95 6.04 18.42 183.56 Technical Cooperation 0.02 0.02 0.02 0.04 0.06 1.73 3.21 4.02 4.00 5.50 6.18 8.11 38.85 Total 0.02 0.02 0.09 3.73 0.19 2.09 62.69 30.11 14.13 37.44 12.21 26.53 259.67
Somalia
Loan Aid 0.00 0.00 0.00 0.00 0.00 0.00 0.00 0.00 0.00 0.00 0.00 0.00 38.70 Grant Aid 0.00 0.00 0.00 0.00 0.00 0.00 0.24 3.85 23.24 22.60 29.05 51.96 210.51 Technical Cooperation 0.00 0.00 0.00 0.00 0.00 0.00 0.00 0.01 0.03 0.04 0.02 0.01 5.52 Total 0.00 0.00 0.00 0.00 0.00 0.00 0.24 3.86 23.27 22.64 29.07 51.97 254.77
South Africa
Loan Aid 0.00 0.00 -20.05 -1.44 -0.87 -0.85 -0.81 -0.80 -0.91 -1.01 -1.07 -1.18 5.89 Grant Aid 13.04 3.81 16.38 11.11 14.23 11.07 12.24 0.81 0.66 0.43 2.05 2.04 113.34 Technical Cooperation 6.75 9.58 8.36 7.94 5.47 5.87 4.49 4.65 3.92 5.24 6.13 7.25 107.79 Total 19.79 13.39 4.69 17.61 18.83 16.10 15.92 4.67 3.67 4.67 7.11 8.11 227.01
South Sudan
Loan Aid 0.00 0.00 Grant Aid 8.71 8.71 Technical Cooperation 16.85 16.85 Total 25.56 25.56
Sudan
Loan Aid 0.00 0.00 0.00 0.00 0.00 0.00 0.00 0.00 0.00 -27.63 0.00 0.00 21.59 Grant Aid 0.08 0.22 0.42 0.60 0.87 0.48 38.20 44.61 100.51 125.09 92.92 73.45 953.40 Technical Cooperation 0.59 0.46 0.75 0.87 0.67 1.64 4.53 6.97 9.14 13.57 26.16 23.28 125.72 Total 0.67 0.69 1.17 1.47 1.55 2.11 42.73 51.58 109.64 111.03 119.08 96.72 1,100.72
Swaziland
Loan Aid 0.00 0.00 1.52 1.02 0.48 21.54 9.63 4.75 0.00 0.00 0.00 -2.53 36.41 Grant Aid 3.35 3.16 0.47 1.82 3.11 3.51 1.37 2.01 2.31 0.19 2.81 14.43 83.93 Technical Cooperation 2.65 3.38 2.53 2.18 1.27 0.86 0.61 0.51 0.87 0.99 1.55 0.66 30.92 Total 5.99 6.54 4.52 5.02 4.86 25.91 11.62 7.26 3.18 1.19 4.36 12.55 151.29
Tanzania
Loan Aid -12.68 -8.22 -6.54 -1.76 -105.36 0.00 0.00 33.96 5.40 48.56 10.50 37.91 101.97 Grant Aid 203.16 241.32 39.31 53.90 139.67 14.44 17.68 667.66 43.36 48.68 65.87 43.73 2,454.59 Technical Cooperation 26.65 27.35 25.43 22.32 18.21 21.67 21.72 20.04 22.23 23.22 28.23 37.80 626.30 Total 217.14 260.44 58.20 74.47 52.52 36.11 39.39 721.66 70.99 120.46 104.60 119.44 3,182.85
Togo
Loan Aid 0.00 0.00 0.00 0.00 -1.69 -1.11 -1.05 -1.04 -0.59 12.89 -0.12 -120.44 -44.04 Grant Aid 8.26 2.61 0.05 0.03 2.13 1.57 1.34 1.16 0.80 20.96 6.65 126.61 257.05 Technical Cooperation 0.24 0.26 0.29 0.30 0.33 0.29 0.14 0.33 0.13 0.24 1.01 3.10 11.93 Total 8.50 2.87 0.34 0.34 0.77 0.76 0.44 0.46 0.33 34.09 7.54 9.26 224.96
Tunisia
Loan Aid 52.97 70.68 47.92 74.08 50.84 41.44 9.96 12.28 48.04 8.26 14.37 17.13 618.16 Grant Aid 3.30 4.04 7.10 1.09 0.31 0.57 0.19 0.18 0.03 0.19 12.22 0.16 40.97 Technical Cooperation 15.85 13.74 8.26 10.35 8.59 9.09 8.41 8.10 5.92 5.97 9.29 7.68 206.91 Total 72.12 88.45 63.27 85.52 59.73 51.10 18.56 20.56 53.98 14.41 35.87 24.97 866.06
Uganda
Loan Aid 0.00 0.00 0.00 0.00 -57.79 0.00 0.00 0.00 4.62 6.64 6.44 1.15 19.20 Grant Aid 16.00 8.93 3.07 3.14 64.25 4.80 13.56 17.83 39.75 23.16 42.06 28.19 462.66 Technical Cooperation 6.37 5.64 5.01 6.39 5.37 9.64 8.22 9.68 12.64 24.24 22.74 27.79 195.33 Total 22.37 14.57 8.08 9.54 11.84 14.44 21.78 27.51 57.01 54.05 71.24 57.12 677.21
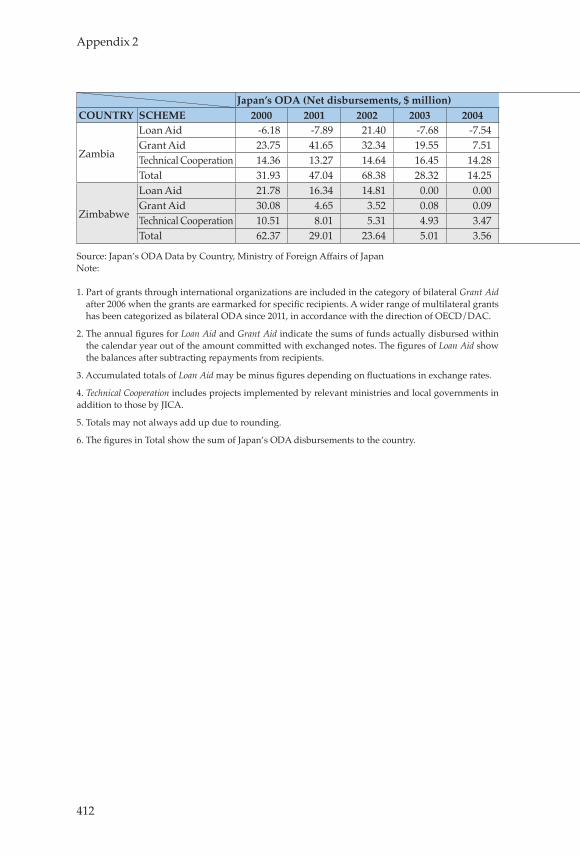
412
Appendix 2
Japan’s ODA (Net disbursements, $ million)COUNTRY SCHEME 2000 2001 2002 2003 2004 2005 2006 2007 2008 2009 2010 2011 Total
Zambia
Loan Aid -6.18 -7.89 21.40 -7.68 -7.54 -616.15 0.00 0.00 0.00 0.00 1.44 0.59 -309.45 Grant Aid 23.75 41.65 32.34 19.55 7.51 732.90 16.79 74.14 18.57 16.21 20.90 19.70 1,616.01 Technical Cooperation 14.36 13.27 14.64 16.45 14.28 15.19 14.75 20.48 18.57 20.43 23.80 25.79 460.31 Total 31.93 47.04 68.38 28.32 14.25 131.94 31.54 94.61 37.14 36.64 46.14 46.08 1,766.91
Zimbabwe
Loan Aid 21.78 16.34 14.81 0.00 0.00 0.00 0.00 0.00 0.00 0.00 0.00 0.00 143.79 Grant Aid 30.08 4.65 3.52 0.08 0.09 0.15 2.64 7.49 7.69 11.24 17.13 16.09 446.44 Technical Cooperation 10.51 8.01 5.31 4.93 3.47 3.94 3.90 4.22 2.27 1.14 1.79 2.01 149.64 Total 62.37 29.01 23.64 5.01 3.56 4.09 6.54 11.71 9.97 12.38 18.92 18.10 739.86
Source: Japan’s ODA Data by Country, Ministry of Foreign Affairs of JapanNote:
1. Part of grants through international organizations are included in the category of bilateral Grant Aid after 2006 when the grants are earmarked for specific recipients. A wider range of multilateral grants has been categorized as bilateral ODA since 2011, in accordance with the direction of OECD/DAC.
2. The annual figures for Loan Aid and Grant Aid indicate the sums of funds actually disbursed within the calendar year out of the amount committed with exchanged notes. The figures of Loan Aid show the balances after subtracting repayments from recipients.
3. Accumulated totals of Loan Aid may be minus figures depending on fluctuations in exchange rates.
4. Technical Cooperation includes projects implemented by relevant ministries and local governments in addition to those by JICA.
5. Totals may not always add up due to rounding.
6. The figures in Total show the sum of Japan’s ODA disbursements to the country.
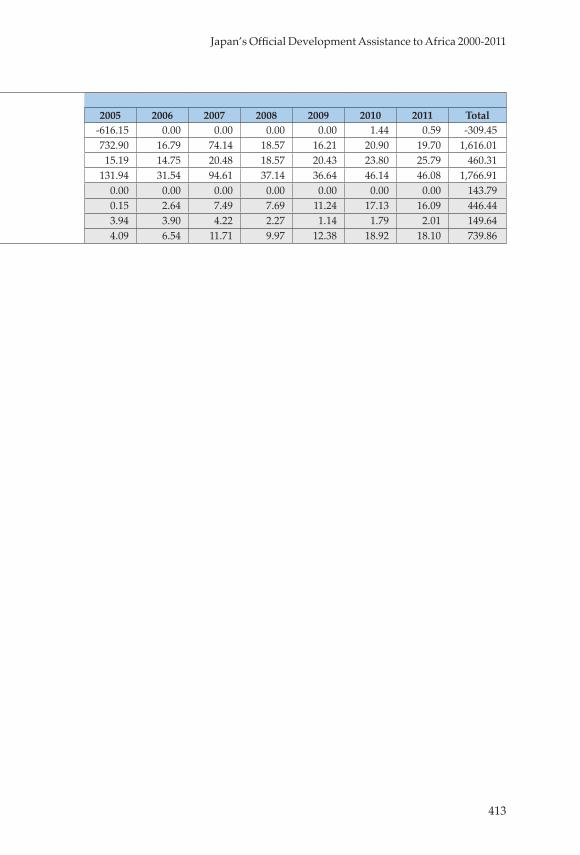
413
Japan’s Official Development Assistance to Africa 2000-2011
Japan’s ODA (Net disbursements, $ million)COUNTRY SCHEME 2000 2001 2002 2003 2004 2005 2006 2007 2008 2009 2010 2011 Total
Zambia
Loan Aid -6.18 -7.89 21.40 -7.68 -7.54 -616.15 0.00 0.00 0.00 0.00 1.44 0.59 -309.45 Grant Aid 23.75 41.65 32.34 19.55 7.51 732.90 16.79 74.14 18.57 16.21 20.90 19.70 1,616.01 Technical Cooperation 14.36 13.27 14.64 16.45 14.28 15.19 14.75 20.48 18.57 20.43 23.80 25.79 460.31 Total 31.93 47.04 68.38 28.32 14.25 131.94 31.54 94.61 37.14 36.64 46.14 46.08 1,766.91
Zimbabwe
Loan Aid 21.78 16.34 14.81 0.00 0.00 0.00 0.00 0.00 0.00 0.00 0.00 0.00 143.79 Grant Aid 30.08 4.65 3.52 0.08 0.09 0.15 2.64 7.49 7.69 11.24 17.13 16.09 446.44 Technical Cooperation 10.51 8.01 5.31 4.93 3.47 3.94 3.90 4.22 2.27 1.14 1.79 2.01 149.64 Total 62.37 29.01 23.64 5.01 3.56 4.09 6.54 11.71 9.97 12.38 18.92 18.10 739.86
Source: Japan’s ODA Data by Country, Ministry of Foreign Affairs of JapanNote:
1. Part of grants through international organizations are included in the category of bilateral Grant Aid after 2006 when the grants are earmarked for specific recipients. A wider range of multilateral grants has been categorized as bilateral ODA since 2011, in accordance with the direction of OECD/DAC.
2. The annual figures for Loan Aid and Grant Aid indicate the sums of funds actually disbursed within the calendar year out of the amount committed with exchanged notes. The figures of Loan Aid show the balances after subtracting repayments from recipients.
3. Accumulated totals of Loan Aid may be minus figures depending on fluctuations in exchange rates.
4. Technical Cooperation includes projects implemented by relevant ministries and local governments in addition to those by JICA.
5. Totals may not always add up due to rounding.
6. The figures in Total show the sum of Japan’s ODA disbursements to the country.

415
AAccelerated Industrial Development
of Africa (AIDA), 178-79, 189Action Plan on Food Price Volatility
and Agriculture, 73, 85-86Africa
agriculture, See African agriculturechallenges, in agricultural production, 78-80climate change and food insecurity, risk of, 42-43current status of development in, 21debt management policies, 43-44demographics, 33developmental challenges, 59-60development risks in, 41disaster prevention and reduction, 315-16economic development, 46-47economic growth, rate of, 23-26, 45economic reforms and progress, 28-29economic relationship, with foreign countries, 26-28economic transformation and sustained growth, strategies for, 21-22economy and society in 2040, 45-46employment situation in, 33-34foreign direct investment (FDI) promotion, issues with, 176GDP per capita (1970-1995), 36n27global economic downturn, impact of, 41-42good governance and anti-corruption, 30-31grain production in, 76
higher education and vocational technical education in, 54-55horticultural products, demand for, 144human capital development measures, 55IDA-eligible countries in, 44informal sector, presence of, 36-37intra-African market, 49intra-regional trade, 40investment in human capital, 54-56manufacturing industry, 50-52mitigation of climate change, strategies for, 43political instability, risk of, 41poverty reduction in, 31-33progress of MDGs in, 38-39quality of education, 34-35ratio of household enterprise employment to total employment, 37regional integration approach, 57-58service sector in, 52-54sustainability of African debt, 44TICAD V Action Plan, 56-62urbanization in, 35-36water resource management, 316-17
Africa Japan Forum (AJF), 398African agriculture, 47-50
Action Plan on Food Price Volatility and Agriculture (2011), 85-86challenges, 75-80Coalition for African Rice Development (CARD), 92-93Comprehensive Africa Agricultural Development Programme (CAADP), 87-88
Index
416
general risks, 84impacts of droughts, 83international frameworks for, 85-88investments, 80-82JICA’s support for, 88-91New Alliance for Food Security and Nutrition (2012), 86-87overview, 73-75resilience of, 91, 94-95Sector Wide Approaches (SWAPS), 88Smallholder Horticulture Empowerment Project (SHEP) approach, 91TICAD V plan, 88-92
African Continental Free Trade Area (C-FTA), 233
African Development Bank (AfDB), 2, 4, 43, 45, 46, 57, 58, 205n18, 229, 231-32, 240, 360, 394, 396
African Green Fund, 43African Institute for Capacity
Development (AICAD), 367, 372-74, 377-78
African Union (AU), 41, 56, 57, 87, 128, 178, 233, 353, 360, 398
Africa Rice Center (AfricaRice), 92Africa’s Infrastructure: A Time for
Transformation (2009), 195Agricultural Development Led
Industrialization (ADLI), 182Agricultural extension workers, 79,
108, 341Agricultural innovations, 6Agricultural land, 42, 47-48Agricultural Sector Development
Strategy (ASDS), 144Agriculture, 39, 47
African, See African agricultureclimate change and, 90, 94inclusive development, 124-26investments in, 120-22Japan’s Focus for, 91
in Kenya, 53low productivity, reasons for, 119market oriented, 50, 143-45, 152-53as a percentage of GDP, 313post-harvest processing of, 119poverty reduction, 75, 89, 106, 120, 125-26, 143, 180, 195, 307, 309, 311, 313productivity of, 50n52role of private sector, 119-20small-scale farmers’ approach, 50value chain systems, 119
Aid, 317, 360in Africa, 27agencies, 229foreign aid, in Africa, 26, 27, 31humanitarian, 338Japanese aid
in Africa, 204-10in Mozambique, 133-36
non-DAC donors, 354, 358“Aid for Trade (AfT)”, 231, 232
by region and category, 232Al-Shabaab, 330AQIM, 330Arusha-Namanga-Athi River Road
Development Project, 240ASEAN Plus Three Emergency Rice
Reserve (APTERR), 95Asia, 21, 32, 47, 52, 76-77, 79, 119
agricultural investments in, 80experience of, 52, 174, 179, 182, 189, 392food reserve systems, 91Green Revolution in, 99, 102, 107, 120rain-fed areas in, 104supply of vegetables in, 144vegetable supply trend in, 144
Asian rice technology, 101-6Association of Southeast Asian
Nations (ASEAN), 95, 182, 375
417
Index
BBali Action Plan at COP13, 311Bill and Melinda Gates Foundation,
93, 255Biofuels, 75, 81, 121BOKASHI bags, 154Bottom of Pyramid (BOP), 181BRAC, 93Brazil, 10, 29, 33, 40, 42, 93, 127, 131-33,
136, 138, 183, 237, 355, 358-60, 365-66, 380
Brazilian Agricultural Research Corporation (EMBRAPA), 132
Breton-Woods institutions, 391Buenos Aires Plan of Action (BAPA),
352Bunding, 11, 102-3, 105, 107, 109Business environment, 29, 37, 51-52,
60, 188Bus Rapid Transit (BRT) system, 310
CCamp David Summit (2012), 42, 86Cancun Agreement, 317, 319Capacity development, 160, 210, 215,
259, 262, 289, 292, 366community, 91of customs on borders of African countries, 242for health systems management, 262-63importance of, 163, 165institutional and individual, 334-35institutional and management, 127of local public officials, 340for management of health programs, 263market-oriented approach for, 143-45for more effective SSC/TrC, 380-81motivation theory for, 156for poverty reduction, 373of public sector, 362
South-South Cooperation (SSC), 380-81of SSA governments, 374-75
Capacity of Tumba College of Technology (TCT), 341
Caracas Programme of Action, 352Caribbean, 43
annual cost of adaptation in, 42rainfall and food security, 307
Centers of excellence (COEs), 293, 366-67, 377, 380
Cerealsimport of, 74, 78, 92trade deficit in, 78
China, 33, 40, 42, 44, 45, 74, 138, 226, 301, 307, 355, 358-60, 398
White Paper on Foreign Aid (2011), 359
Chirundu Border Related Facility Construction Project, 239
Chirundu Bridge Construction Project, 239
Chokwe irrigation scheme, 102-3, 108Civil society organisations (CSOs), 321Civil wars, 26, 41, 391Clean Development Mechanism
(CDM), 319Climate change, 323, 325
in Africa, See Climate change in AfricaCancun Adaptation Framework for, 324developing countries and, 301-2and food insecurity, 42impacts of, 303measures against, 81, 304mitigation and adaptation, 43, 303-4risk of maladaptation, 304vulnerability to, 301, 304
Climate change in Africaadaptation plans in, 311-13agricultural sector, 313-14carbon sequestration and storage,
418
potential for, 308effective measures, 320-25funding, technology, and market mechanisms associated with, 317-20greenhouse gas emissions, 304-7impacts, 306-7JICA supported projects and programs for, 321mitigation measures, 307-8renewable energy projects for energy efficiency, 309transportation infrastructure, impact on, 310urbanization and, 310
Climate Technology Center and Networks, 319
Coalition for African Rice Development (CARD), 48, 90, 92-93, 377-78
as a case of SSC, 374-75Committee on World Food Security
(CFS), 82, 122, 124Common Market for Eastern and
Southern Africa (COMESA), 56n70, 232
Community, 36, 40-41, 57, 61, 73, 75, 85, 189, 196, 233, 273, 281, 291, 302, 316, 320, 333
capacity development, 91-92ethnic, 336JICA’s programs, 339
Community Empowerment Programmes, 373
Comprehensive Africa Agriculture Development Program (CAADP), 50, 58, 73, 87-88, 120, 361, 374
Comprehensive corridor development, 243-44
Conference of the Parties (COP), 42-43, 311, 317
Conflict(s), 2, 9, 26, 41, 49, 59, 121, 204, 330, 332, 334, 336, 341-44
Cool Earth Partnership, 320
COP15, 43, 311COP16, 317Copenhagen Accord, 43, 311Corridor development, 13, 48, 57, 133,
134, 136, 233, 236-37, 243-44, 310Corridor Diagnostic Study of the
Northern and Central Corridors of East Africa (CDS, 2011), 229-30
Corruption, in Africa, 30-31prevention of, 60
CPIA scores, 28Cross border, 15, 25, 40, 56-57, 225, 233,
238, 241, 244, 276, 376, 396trade, 40transport system, 242-43
as a case of SSC, 225water resource management, 316
Cross Border Transport Infrastructure (CBTI), 228-31, 394
current condition and issues in trading and physical distribution, 225-28definition, 225Japan’s contribution, 233-43need for, 228-31solutions to shared challenges, 375-76
DDAC Network on Gender Equality
(2011), 94Debt sustainability, 41, 43-44, 208Department for International
Development (DFID), 230, 239, 280, 376
Development traps, 25, 31, 59Differentiated approach, 10, 57, 61, 293Direction of Low Carbon and Resilient
Development Cooperation by JICA, 302
Disparityamong different income groups, 251among low and middle income
419
Index
countries, 254by economic status, 252in education, 292electricity, 197, 199health services, 39, 249, 259in health status and health service utilization, 251-52income, 61, 253safe drinking water, 39, 198in terms of position toward UHC, 260
Doing Business environment, 188Do-no bags, 154Drought, 15, 42, 74, 83-84, 90, 94, 301,
307, 311, 313, 315
EEast Africa, 232-34
development of customs on borders of, 242higher education, level of, 373poverty reduction in, 373railroads in, 239supply of vegetables in, 144
East Africa Community (EAC), 376East Africa Trade Transport
Facilitation Project (EATTFP), 232East Asia, 4, 43, 51, 173
manufacturing industry in, 51East Asian Miracle, 7Economic Community of West African
States (ECOWAS), 95Economic Cooperation among
Developing Countries (ECDC), 353
Economic growth, 4, 10, 15, 21, 22-23, 26, 41, 45, 47, 49-50, 53, 56, 59, 77, 87, 138, 144, 174, 183, 189, 196, 199, 233, 234, 243, 274, 394-95
equity and sustainability of, 61poverty reduction and, 31-33of SSA, 3
Economic transformation, 21, 187, 213
Educationin Africa, See Educational development in Africahigher, 14, 34, 39, 54-55, 274-77, 279, 291, 293, 295, 373primary, 268, 271-73, 277-80, 289, 291, 293, 295quality of, 9, 14, 34-35, 39, 54, 61, 269, 270-71, 273, 275-76, 278, 281, 285quantity of, 276secondary, 35, 39, 54, 269, 275, 277, 279-80, 285, 291, 295vocational, 291, 295
Educational development in Africabasic education, quality of, 270current status, 268-77diverse stages of, 277-79“Education for All” concept, 280enrolment rate in primary and secondary education, 268-69future global agenda for, 279-81JICA’s approaches, linking policy and practice, 289-90JICA-supported projects, 281-90“Learning for All,” 280post-basic education, quality of, 274-77school-based management (SBM), 281school facilities and teacher training institutions, 292-93“School for All” project, 283-84, 292, 294science and math education (SMASE), quality of, 287-88teacher education, strategies to improve, 285-89TICAD, 291-95
Education For All (EFA), 268, 271-72Education for sustainable
development (ESD), 302Egypt-Japan University of Science and
Technology (E-JUST), 293
420
El Niño phenomena, 306Employment, 4, 12, 22, 33-38, 47,
54-55, 119, 244, 258, 274, 280, 291, 295, 313, 323
youth, 34Energy, demand for, 47Energy sector, climate change and, 309Enhanced Private Sector Assistance
for Africa (EPSA), 204Environmental Conservation
Initiative for Sustainable Development (EcoISD), 320
European Union (EU), 80n1“Examination on the Basic SHEP
Approach,” 149Export(s)
of agricultural products, 49of commodities, 21of energy, 21, 23, 45of oil, 23, 196, 199
F“FABLIST Forum: Farm Business
Linkage Stakeholder Forum,” 146“Facilitators’ Training for Farmers’
Demand-Driven Extension,” 147Family labor, 4, 107, 119Fast Track Initiative (FTI), 268, 271-72FDLR, 330Fertilizer, 11, 74, 78-79, 84, 93, 102, 103,
105, 107-9, 119-20, 122, 126, 144, 147, 154, 213
Finance for health, 253, 258Financial crisis, 4, 22, 27, 40, 42, 81, 356Financial sector, 53Fiscal policies, 44, 60Floods, 15, 42, 83, 105, 301, 307, 313,
314-15Food and Agriculture Organization
(FAO), 74Food insecurity, 83
climate change and, 42Food Price Index, 74
Foreign direct investment (FDI), 12, 26-28, 30, 176, 318, 362
Foreign aid, 26-27, 359Fragile countries, 26, 28, 197, 199Fragile situations, countries in, 59Fragile states, 58-59, 208, 333, 338-39Framework for the Improvement of
Rural Infrastructure, 58
GG8 Summit (2012), 48Gender, 38-39, 94, 127, 147, 153-54, 158,
163, 269, 291-92Getulio Vargas Foundation (FGV), 132Ghana
Civil Service Training Center (CSTC), 371-72Community-based Health Planning and Service program, 249Green Revolution in, 105-6Lowland Rice Development Project (LRDP), 118paddy yields and production practices in, 116, 118yields and production practices in rain-fed areas, 105-6
GIZ, 365Gleneagles summit, 195n2Global Coalition for Africa (GCA), 353Global Competitive Index (GCI), 196Global food security, in Africa, 73-75Global Fund for AIDS, Tuberculosis
and Malaria (GFATM), 255, 257, 263-64
Global Partnership for Effective Development Cooperation, 351, 354
Governance, 13, 24, 30, 59, 61, 122-24, 215-16, 316, 333, 361-62, 379, 391-92, 395
Government, roles of, 48-49, 80Graduate Research Institute for Policy
Studies (GRIPS), Japan, 11, 179,
421
Index
181, 183-84Green Climate Fund, 317Greenhouse gases (GHGs), 301
emissions in Africa, 304-6Green Revolution, 47, 99, 102, 107
in Africa, 92in Asia, 102, 213in SSA, 11, 99, 100-101, 108-10
Gross domestic product (GDP)growth rate for the agricultural sector, Africa, 75-76per capita, 37, 45-46, 197, 199, 271, 278service sector’s contribution, 53
Growth and Transformation Plan (GTP) 2010/11-2014/15, 182
HHarmonization for Health in Africa
(HHA), 262Hatoyama Initiative, 320
Health services, in AfricaAIDS-related deaths, 247average annual rate of reduction (AARR), 248development assistance in, 255-61financing for, 264Health Extension Program, Ethiopia, 249Health Surveillance Assistant in Malawi, 249remaining and emerging challenges, 249-55
Herbicide, 102Higher education, 14, 34, 39, 54-55,
274-77, 279, 291, 293, 295, 373High-Level Advisory Group on
Climate Change Financing (2010), 43
High Level Forum on Aid Effectiveness (2011), 324, 351
HIPC Initiative, 394HIV-AIDS, 38-39, 248, 257, 264
Hokkaido Toyako Summit, 179Horizontal inequalities (HIs), 331, 333,
336, 343Horn of Africa, 27, 42, 83-85, 94, 311,
313Horticulture, 94, 144-45, 147-48, 151,
154, 158, 162Human security, 16, 94, 249, 314, 333,
338, 342, 344Hygiene, 302
IImports
of agricultural products, 4-5, 75, 92, 228, 314of commodities, 24, 74of energy, 23, 199, 309, 395of oil, 23-24, 27, 44
Inclusive development, 93, 119, 124-26, 133, 253, 312
Inclusive growth, 39, 41, 46-47, 133, 174
Incomedisparities, 61, 253, 292distribution, 359
India, 29, 33, 40, 42, 45, 50, 74, 100, 189, 226, 301, 307, 355, 358-60
paddy yields and production practices in, 117
Indonesia, 2, 45, 138, 318, 352, 374Industrial development, in Africa
Accelerated Industrial Development of Africa (AIDA), 178-79development strategies, 179-87investment promotion and diversification, 187-89keys to sustainable economic growth, 189-90possibilities and challenges, 174-77
Infectious diseases, 39, 42, 130, 177, 247-48, 255-56, 263-64, 368, 377
Information and communication
422
technologies (ICTs), 28, 53, 55, 195, 198-99, 203, 239, 241, 322, 360, 367, 379
information platforms, 379Informal cross border trade (ICBT),
25n6, 40Infrastructure
climate change and, 312financial resources for, 9, 196, 204-11, 214for irrigation, 103maintenance of, 203, 213, 216, 225for transport, 8, 225, 228-33, 310urban, 312
Infrastructure Consortium for Africa (ICA), 13, 195
Infrastructure development in Africaby country groups, 199-201country’s competitiveness and, 202current status, 196-99efficiency gaps, 203financial weaknesses, in JICA-assisted infrastructure projects, 214financing source and gap, 204governance reform of public utilities, 215-16importance of maintenance in, 213-14information and communication technology (ICT), 198-99Japan’s infrastructure assistance, See Japanese aid, in Africapower, 197sectoral allocation of Japan’s ODA, 212-13share of Japan’s financial commitment on, 220spending needs and funding, 203transport, 197-98water supply and sanitation (WSS), 198
Instabilityeconomic, 41-42, 336
political, 26, 41, 204Institute of Technical Assistance and
rural Extension of Brazil (EMATER), 132
Institution building, 15, 331, 332, 334-35, 337-38, 365
Integrated Water Resource Management (IWRM), 316
Intergovernmental Panel on Climate Change (IPCC), 301, 303
International Aid Transparency Initiative (IATI), 355
International Centre for Tropical Agriculture (CIAT), 153
International Financial Cooperation (IFC), 176, 188
International Fund for Agricultural Development (IFAD), 92, 124
International Monetary Fund (IMF), 24, 25, 32, 53, 59, 391, 393, 395
Investmentin agriculture, 11, 48, 83, 121, 124, 137-38environment for, 120foreign direct, 12, 26-28, 30, 176, 318, 362
Irrigation, 6, 58, 79, 91, 94, 102-4, 107, 109, 114, 162, 198, 208, 210, 213, 312, 314
JJapan Brazil Partnership Program
(JBPP), 130Japanese aid, in Africa, 204-10, 256
allocation of loan/grant assistance, 205-8, 210-11Cross Border Transport Infrastructure (CBTI), 233-43to cross border transport infrastructure development, 233-43infrastructure assistance, 204-5infrastructure financing, 204policy challenges, 211-16
423
Index
technical cooperation (TC), 208-10, 221
Japan International Research Center for Agricultural Sciences (JIRCAS), 92, 132
Japan-Morocco Triangular Technical Cooperation Programme, 368
Japan, ODA Charter of, 338, 366Japan-Tunisia Triangular Technical
Cooperation Programme, 368JICA’s triangular practice for SSA,
366-69Jobs, 4, 175Jomo Kenyatta University of
Agriculture and Technology (JKUAT), 293, 373
KKaizen project, 9, 174, 181, 183-87, 259,
262Kenya
GDP, 143-44horticulture in, 145Mwea irrigation scheme in, 109services sector in, 53SHEP and SHEP UP project, 145-63supply of vegetables in, 144
Knowledge and Technology Dissemination Programme, 373
Knowledge sharing and co-creation, through SSC/TrC, 9, 369, 377-80
Korea, 93, 363, 379, 398Kyoto Initiatives, 302, 319-20
LLand, 6, 42, 47, 49, 75, 77, 79, 81, 87, 89,
99, 121, 125, 131, 306Land grabbing, 121Landlocked countries, 25La Niña phenomena, 306L’Aquila Summit (2009), 85, 124, 314Latin America, 43, 47, 80, 198, 228, 307,
360, 365
annual cost of adaptation in, 42World Bank projects in, 281
Learning, 9, 21, 56, 132, 138, 181, 183, 269, 270-72, 276, 285, 292, 343, 361, 379
Learning for all, 14, 279-80Lehman shock, 74, 81, 127Life expectancy, 249Livelihood, 15-16, 49, 91, 93, 120, 122,
126, 138, 301, 311-12, 314, 331, 332, 334-35, 338-40, 343-44, 373
Local government, 15, 273, 339, 341-42, 374
Logistic Performance Index (LPI), 226Low-carbon, 304, 309-10, 317, 319, 323,
325Low-carbon growth, 320Low income countries, 5, 7, 33, 55,
198-99, 203, 212, 255, 303LRA, 330
MMckinsey Global Institute (MGI), 23Malaria, 38, 42, 247, 248, 256, 264, 306Malaysian Industrial Development
Agency (MIDA), 188Management
reform of public utilities, 13, 195, 215-16school, 273, 281-85, 289-90, 292
Manufacturingin Africa, 50-52sector, 53, 175, 177share in GDP, 4, 51, 176
Maputo Declaration, 87, 90Market Facilitator’s Guide to
Participatory Agro-enterprise Development, 152
Market information, 86, 126, 153Market oriented agriculture, 50, 137,
143-45, 152-53Micro and Small Enterprise (MSE)
Development Strategy, 182
424
Middle East, 79, 228, 362Middle income countries, 2, 34, 58,
198-99, 254, 380Millenium Development Goals
(MDGs), 46, 61-62, 249-51progress of, 38-39
Mining sector, 23, 176, 188Ministry of Agricultural Development
(MDA), 132Mombasa port, 233-36Monetary policies, 27, 45Mortality
maternal, 2, 39, 248, 251under-five, 38, 248, 253
Motivation, 148, 156-57, 159-60, 259, 262, 272, 340
Mozambiqueagricultural development program, 93Chokwe irrigation scheme, 102-3, 108Green Revolution in, 102-3paddy yields and production practices in, 113regional development program in, 48yields and production practices in rain-fed areas, 102-3
NNacala Corridor Development
Program, 12-13, 48, 128, 131-33, 134, 136, 236-37, 310
Nacala Economic Corridor, Mozambique, 236-37, 243
Nacala project, 8National Adaptation Plans (NAPs),
304, 318, 321National Adaptation Programs of
Action (NAPAs), 321National Graduate Institute for Policy
Studies (GRIPS), 11, 179, 181, 184Nationally Appropriate Mitigation
Actions (NAMAs), 318, 321-22National Rice Development Strategies
(NRDS), 92-93, 374, 378National Service of Rural Learning
(SENAR), 132Natural disasters, 15, 74, 85, 303, 307,
310, 312, 315, 342, 362Natural resources, 2, 4-5, 8, 21, 25,
27-28, 59-60, 122, 134, 176-77, 189, 199, 236, 308, 312, 320
New Alliance for Food Security and Nutrition, 42, 48, 86-87, 136
New Partnership for Africa’s Development (NEPAD), 56, 128, 230, 353, 393, 394
New Rice for Africa (NERICA), 93, 101-2, 108, 373
Non-Aligned Movement (NAM), 352Non Governmental Organizations
(NGOs), 125, 134, 147, 268, 340, 361, 374, 377, 398
Non-Project Grants, 239, 391North Africa, 22, 26, 39, 41-42, 79, 174,
197, 199, 205, 225, 228, 249-50, 254-55, 260, 355, 359, 361, 381
North Corridor, 228, 233-36, 243Nutrition, 38, 42, 56, 144
OOffice National de Formation
Professonnelle (ONFP), 370Official development assistance
(ODA), 60by Japan, 138, 195, 402by non-DAC members, 356-57
Oilexporting countries, 23, 27, 44, 197, 199, 202importing countries, 23-24, 44
One stop border posts (OSBPs), 376, 394
capacity development, Namibia and Botswana, 242
425
Index
Chirundu (Zambia/Zimbabwe), 239harmonizing regulations, 242-43Malaba (Kenya/Uganda), 239-40Namanga (Kenya/Tanzania), 240-41reason for, 238-39
“Organizers’ Training on the Basic SHEP Approach,” 149
PParis Declaration on Aid
Effectiveness, 354Partnership programs, 130, 367-69Payment for Ecosystem Services
(PES), 308Plan for Accelerated and Sustained
Development to End Poverty (PASDEP) (2005-2009), 182
Population, 99, 161-62, 175, 197-98, 244, 249, 261, 306-8, 333
working-age, 22, 33-34, 36, 45, 50, 52, 291
Ports, 7, 126, 133, 198, 213, 225, 228-29, 234
Post-2015 agenda, 62Post-Conflict Needs Assessment
(PNA) mechanism, 342-43Post harvest processing, 119, 121, 137,
164Post-MDGs, 260Poverty, 4, 195, 243, 331, 363Poverty reduction
agriculture, 75, 89, 106, 120, 125-26, 143, 180, 195, 307, 309, 311, 313in East Africa, 373economic growth and, 31-33employment in low-income countries and, 33informal sector, role of, 37regional knowledge platform for, 363, 372-74
Poverty Reduction Strategy Papers
(PRSPs), 374Power, 8, 43, 197, 199, 203, 205, 208,
212, 309, 396Primary education, 268, 271-73, 277-
80, 289, 291, 293, 295enrolment rate of, 35, 38, 54, 268-69,
275-77, 279, 282Principles for Responsible
Agricultural Investment (PRAI), 49n48, 82-83, 93, 121, 124, 126, 135, 139, 314
Private sectorclimate change and, 319role of
in agriculture, 119-24in health sector, 258
Productivity, 3-4, 7, 11, 24, 37, 314, 325labor, 22, 37, 47, 52, 54-55
Programme for Infrastructure Development in Africa (PIDA), 231, 360
Project for Community Development for Promoting Return and Resettlement of IDPs, 341-42
Project for Livelihood Improvement, 340
Project for Strengthening the Capacity of Tumba College of Technology (TCT), 341
Promotion of Responsible Agricultural Investment, 314
Pro-poor growth, 259Pro-poor policy, 258ProSAVANA-JBM model aid,
Mozambique, 133-36ProSAVANA project, 10, 12Prospects, long-term, 45-46, 174, 182,
310, 331-32, 335Public Administration Leadership and
Management Academy (PALMS), 369
Public-Private-Partnership (PPP), 182, 323
426
Public utilities, 13, 195management reform of, 215-16
RRailways, 7, 198, 213Reducing Emissions from
Deforestation and Forest Degradation (REDD), 311
Reducing Emissions from Deforestation and Forest Degradation plus (REDD+), 324
ecosystem services, payments for, 311for enhancement of forest carbon stocks, 308for forest conservation, 308for sustainable management of forests, 308
Reformeconomic, 21, 28-29, 392government regulatory, 79, 83, 121, 215-16, 393institutional, 8, 124, 135-36, 211, 215, 393policy, 6, 24, 60, 75security sector reform (SSR), 334
Regional economic communities (RECs), 40, 56-57, 229, 232, 244
Regional integration, 22, 40, 53, 57-58, 232-33, 362, 396
Remittances, 26-27Renewable energy, 43, 212, 303, 309Resilience, 9, 11, 62, 73, 83-85, 90-91,
94-95, 310Resource curse, 59-60, 177Resources
energy, 5, 21, 23, 43, 45, 47, 395financial, 9, 196, 204-11, 263-64, 396forest, 81, 311human, 37, 55, 127, 143, 244, 255-56, 267, 275, 277, 280, 291, 293, 295, 363, 371land, 49, 75, 81, 121
mineral, 5, 21, 23, 45, 47, 187, 226, 239, 395natural, 2, 4-5, 15, 25, 60, 122, 134, 177, 199, 308, 312reallocation of, 215water, 49, 75, 81, 121, 236, 302, 307, 312, 315, 316-17
Rice, 6, 9, 11, 48, 78, 86, 90, 92-93, 99-109, 119, 368, 373-75
Risksclimate change, 42-43political, 26
Roads, 7, 8, 13, 14, 58, 79-80, 126, 133-34, 147, 154, 189, 197-98, 208, 213, 215, 225, 228-29, 233-36, 240, 310, 368-69, 376
Rural development, 39, 341
SSanitation, 39, 51, 198, 261Scaling up, 8
of education, 291-92of funds, 135, 256
Seed-fertilizer revolution, 102Seeds, 78-79, 84, 93, 102-3, 108-9,
119-20, 122, 154Self-employment, 4Senegal’s Vocational Training Center
(CFPT), 370Sensitization Workshops, 146, 159Service sector, 28, 47, 52-55, 175, 177Sharm el Sheikh Action Plan, 359Skilled birth attendants (SBAs), 251Small farmers, See Small-scale farmersSmallholder Horticulture
Empowerment and Promotion Unit Project (SHEP UP), 145
activities of, 148-49internal and behavioral changes in, 159
philosophy behind, 156-58Smallholder Horticulture
Empowerment Project (SHEP),
427
Index
145activities of, 146-47enabling conditions of, 160-63essence of success, 152-56“Facilitators’ Training for Farmers’ Demand-Driven Extension,” 147factors for success, 161-62internal and behavioral changes in activities of, 159, 167-69“Joint Extension Staff and Farmers Dual (2) Gender Training” (JEF2G Training), 147motivation theory and, 156-57“Organizers’ Training on the Basic SHEP Approach,” 149philosophy behind, 156-58survey on income, 151-52
Small-scale farmers, 12, 50, 82, 83, 88, 89-91, 93-94, 99, 106-7, 121-22, 128, 138, 143, 145, 151, 156, 163-64, 237
South African Development Partnership Agency (SADPA), 361
Southern African Development Community (SADC), 40, 128, 232, 241, 360, 362, 376, 379
South-South Cooperation (SSC)Africa, importance of, 352-54capacity development, 380-81centrality of, 354partners in African continent, 360-64for SSA from partners outside Africa, 355-60sub-Saharan Africa and, 354-64TICAD and, 353-54
Spatial Development Initiative (SDI), 229, 230, 362
Special Economic Zones, 8, 189SPRING-Singapore, 183State
capacity of, 261, 263-64legitimacy of, 9, 333-34, 336, 340
State-building in Africacapable and legitimate institutions,
331-34humanitarian and development assistance, 334-35JICA Research Institute (JICA-RI) findings, 335-37JICA’s approach to support, 337-43
Strengthening of Mathematics and Science Education (SMASE), 287-89, 293
Structural Adjustment Lending, 391Sub-Saharan Africa (SSA), 99
agricultural growth rate in, 76annual cost of adaptation in, 42Asian-type improved rice technology for, 101-6average rainfall in, 307cereal production in, 76, 77debt management policies, 43-44disease burden, 247forest coverage in, 310Green Revolution in, 99-101
need for, 99-100MDGs 2012 Progress Chart, 39private sector development and, 176share of industrial products of, 51trade deficit in cereals, 78
Sub-Saharan Africa Transport Policy Program (1987), 229
Sustainable Peace and Development (LIPS), 340-41
TTanzania
Green Revolution in, 103MV adoption in, 108paddy yields and production practices in, 114yields and production practices in rain-fed areas, 103
Task Force on Innovative International Financing for Health Systems, 253
Tax system, 30Technical cooperation among
428
developing countries (TCDC), 352Technology transfer, 101-6, 178, 314,
323-24, 366TICAD IV Action Plan, 3, 10, 12, 57, 92,
173-74, 179-80, 189, 196, 204, 225, 233, 255, 256, 262, 302, 320, 374, 392, 395-99
TICAD V Action Plan, 56-62, 88, 257assistance to mobilize financial resources for UHC, 263-64capacity development for health systems management, 262-63direction of cooperation in, 243-44human development framework, 295Japan’s role in promoting UHC under, 261-64
Tokyo Declaration for African Development, 353
Toyako summit (2008), 85, 179, 261Trade
partners of, 41, 45, 47terms of, 24-25, 40
Trade Mark East Africa (TMEA), 232Trade Mark South Africa (TMSA), 232Trade-Related Capacities for Market
Access (FIMA), 58Trans-Africa Highway (TAH), 221, 229Transformation, of African economies,
45-46Transport, 52-54, 58, 119, 126, 197“Triangle of Hope (TOH)” approach,
Zambia, 13, 174, 187-89Triangular Cooperation (TrC)
Africa, importance of, 352-54capacity development, 380-81for knowledge exchanges in SSA, 369-80and sub-Saharan Africa, 364-69
Triangular Cooperation Program for Tropical Savannah Agricultural Development among Japan, Brazil and Mozambique
(ProSAVANA-JBM)background, 128-30description of projects, 133-36objectives and characteristics, 132-33partnership between Japan and Brazil, 130-32points to consider, 136-37
Tropical forests, 308, 310Turkey, 357-58, 398
UUganda
Green Revolution in, 103-4paddy yields and production practices in, 115yields and production practices in rain-fed areas, 103-4
Unemploymenturban, 21youth, 33-34, 38, 55, 174, 274
Union Economique et Monetaire Ouest Africaine (UEMOA), 241
United Nations (UN), 39, 75, 124, 352, 354, 365
United Nations Children’s Fund (UNICEF), 251
United Nations Development Programme (UNDP), 80, 120, 198, 307, 363, 365, 392, 398
United Nations Framework Convention on Climate Change (UNFCCC), 42, 302, 311, 317, 319
United States, 73-74, 86, 183Universal health coverage (UHC), 14,
255Urbanization, 33, 35-36, 310, 312Urban sector
climate change and, 310transportation and, 310
VValue chain(s), 6, 48, 78-79, 81, 89,
429
Index
92-93, 119-20, 125, 127, 130-34, 137, 164
Vietnam, 58, 92, 190, 318, 375Vocational training, case of, 34, 55, 132,
293, 339, 340-41, 357, 363Voluntary Guidelines on the
Responsible Governance of Tenure of Land, Fisheries and Forests (VGGT), 82, 121-24, 138-39
Vulnerability, to climate change, 301, 304
WWater resources management, 15, 302,
315, 316-17Water supply, 15, 312, 316-17Wetlands International Africa (WIA),
374Wheat, 78, 99-100, 119Women, 81, 151, 153, 321, 323, 342, 373
empowerment, 363participation infarming, 94, 147political decision-making, 38
Workforce Development Agency (WDA), 341
World Bank (WB), 52, 55, 58-59, 79-80, 92, 120, 124, 137, 176, 188, 198, 231-32, 239, 264, 272, 280-81, 290, 302, 316, 330, 365-66, 373, 376, 379
World Development Report (2010), 143, 302
World food prices, causes of rise in, 74-75
World Food Programme (WFP), 75World Health Organization (WHO),
248, 254, 260
YYokohama Action Plan (2008), 57, 196,
291, 302, 320, 395Yokohama Declaration, 354, 395
ZZambia Development Agency (ZDA),
188