food processing - compressed air best practices
TRANSCRIPT
The Magazine for ENERGY EFFICIENCY in Compressed Air, Pneumatics, Blower and Vacuum Systems
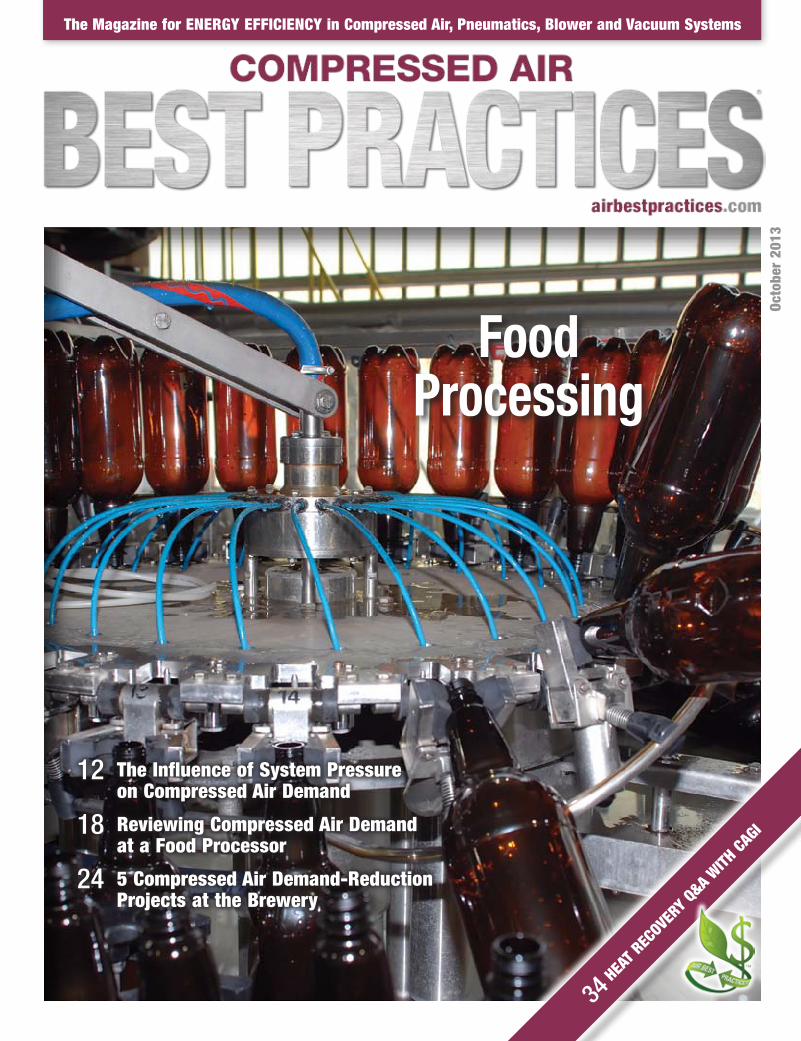
Food Processing
Octo
ber
2013
34 HEA
T REC
OVERY Q
&A wITH
CAGI
12 The Influence of System Pressure on Compressed Air Demand
18 Reviewing Compressed Air Demand at a Food Processor
24 5 Compressed Air Demand-Reduction Projects at the Brewery

Can you find the right balance?
© Copyright 2013 Atlas Copco Compressors LLC. All rights reserved.
Take that first step towardsustainable productivity.Using less energy and boosting productivity may seem like opposing goals, but Atlas Copcocan show you how to make them work together. And it won’t require you to walk a tightrope.With 14 production facilities in the United States and dozens more globally, we never stoplooking for ways to help our manufacturing teams – and more importantly yours – innovatefor sustainable productivity.
In 2013, Atlas Copco celebrates our 140th anniversary. To celebrate we are giving ourcustomers game-changing energy-saving solutions, including a remote monitoring systemthat has simplified and changed compressor maintenance forever, and arguably the mostrevolutionary new air compressor to ever hit the market.
Let Atlas Copco demonstrate to you just why, year after year, we have been listed as oneof the top 20 most sustainable companies in the world. Call 866-688-9611.
Atlas - Tightrope Ad 8.375 x 10.875:Layout 2 5/7/13 4:27 PM Page 1
Hitachi Cycling Refrigeration Air Dryer• Energysavingsoperationtomatch
airdemand.•Performanceoptimizationunder
extremeambientconditions.• Digitalcontrolsthatautomatically
manageenergyconsumption.
Hitachi Desiccant Air Dryer• Integralfilteranddesiccantcartridges
offersaspacesavingdesignforeitherfloororwallinstallation.
• PLCcontrolsenableintermittentorcontinuouscleandryair.
• Optionalpurgesavingcontrolswithdewpointsensor.
Hitachi Efficient Air Filtration• DesignedtoexceedtheISO8573-1
standardsforcompressedairpurityandtheISO12500SeriesInternationalstandardforcompressedairfiltertesting.
• Consistentliquidandparticulateremovalwithlowpressurelosses.
• Compactmodulardesignforeasyinstallationinconfinedspaces.
…the NEXT has arrived
Hitachi Air System Controller• Efficientcontroloffixedspeedand/orvariable
speedcompressorsystems.• Airsystemmanagementfor2to12compressors.• Optimizationofcontrolcontinuouslyselectsthe
mostefficientcombinationofcompressorsbasedonairdemand.
Inspiring the NEXT…
Hitachi America, Ltd. / Air Technology Group 6901 Northpark Blvd., Suite A, Charlotte, NC 28216 Tel: 704.972.9870 www.hitachi-america.us/ice/atg; [email protected] Hitachi Industrial Equipment Systems Co., Ltd.
Generation of Energy Efficient Oil-free Air Compressors
Evolution of Energy Saving Air Treatment
Air System Management Portfolio
Providing unequaled value for the discriminating consumer.
COLUMNS
5 From the Editor
6 Compressed Air, Pneumatics, Vacuum & Blower Industry News
45 Resources for Energy Engineers Technology Picks
48 Advertiser Index
49 The Marketplace Jobs and Technology
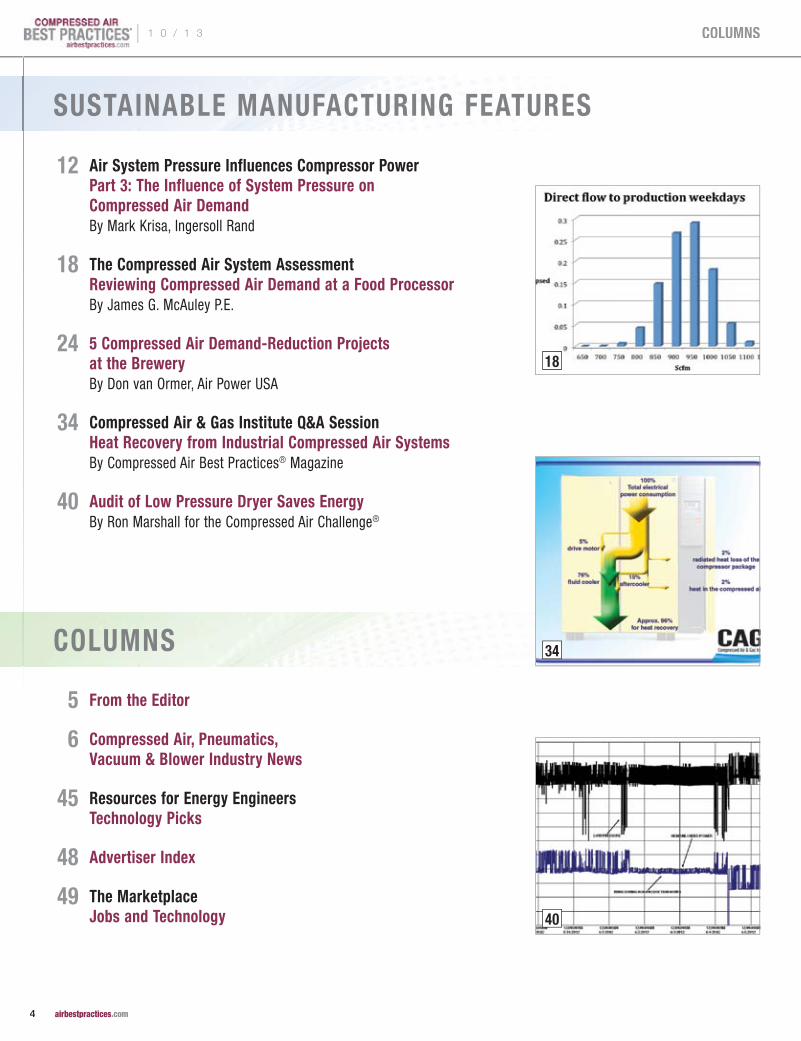
12 Air System Pressure Influences Compressor Power Part 3: The Influence of System Pressure on Compressed Air Demand By Mark Krisa, Ingersoll Rand
18 The Compressed Air System Assessment Reviewing Compressed Air Demand at a Food Processor By James G. McAuley P.E.
24 5 Compressed Air Demand-Reduction Projects at the Brewery By Don van Ormer, Air Power USA
34 Compressed Air & Gas Institute Q&A Session Heat Recovery from Industrial Compressed Air Systems By Compressed Air Best Practices® Magazine
40 Audit of Low Pressure Dryer Saves Energy By Ron Marshall for the Compressed Air Challenge®
SUSTAINABLE MANUFACTURING FEATURES
34
40
18
| 1 0 / 1 3
4 airbestpractices.com
Columns
supports the following organizations:
Our first article is titled, “The Influence of System Pressure on
Compressed Air Demand.” The third article of his series on air
system pressure, Mark Krisa from Ingersoll Rand provides an
in-depth look at artificial demand. While reaffirming that lower
system pressure can lead to energy conservation, this article also
outlines some common calculation errors that can be made.
Our second article is a case study of a portion of a compressed air system assessment,
done by James McAuley P.E., at a food processing plant. The article reviews compressed
air users at the baggers, bag houses, CO2 mold cleaning stations, and thermoformers.
A major brewery operates nine production lines: five bottle lines and four can lines.
Annual plant electric costs for the compressed air system total $736,000. Don van
Ormer, from Air Power USA, details five compressed air reduction projects.
The Compressed Air & Gas Institute (CAGI) offers our readers an interesting article
on heat recovery. The heat generated by compressed air systems can be a very good
source of energy savings. In fact, nearly all (96%) of the electrical energy used by an
industrial air compressor is converted into heat. Too often, that heat is simply ejected
into the ambient environment through the compressor cooling system. But here’s the
good news: nearly all this thermal energy can be recovered and put to useful work and
significantly lower a facility’s energy costs.
Ron Marshall, on behalf of the Compressed Air Challenge®, provides an article on how he
studied the use of heated 30 psi compressed air to dry the ink used in flexible packaging
printing machines. A common application in every food processing plant, efficiently
matching supply with demand can be a challenge.
PROCESS EXPO 2013 will be held November 3-6 at McCormick Hall in Chicago. We are
proud to be a Supporting Publication and hope you can visit the show. Please stop by
the Compressed Air Best Practices® Magazine booth (#2852) and say hello!
Thank you for your support and for investing in Compressed Air Best Practices®.
ROD SMITH Editor tel: 412-980-9901, [email protected]
From the From the From the eeeditorditorditor Food Processing
COMPRESSED AIR BEST PRACTICES® EDITORIAL ADVISORy BOARD
Indus
trial
Ener
gy M
anag
ers
Doug Barndt Manager, Demand Side Energy-Sustainability Ball Corporation
Eric Battino Productivity Senior Manager PepsiCo
William Jerald Energy Manager CalPortland
Jennifer Meier Global EH&S/ Plant Engineering Manager
Varroc Lighting Systems
Thomas Mort Energy Director Archer Daniels Midlands
Brad Reed Corporate Energy Team Leader Toyota
Greg Rhames Energy/Asset Reliability Manager Verallia
Brad Runda Global Director, Energy Koch Industries
Don Sturtevant Corporate Energy Manager Simplot
Com
pres
sed
Air S
yste
m A
sses
smen
ts
Richard Feustel Senior Energy Advisor SAIC/Wisconsin Focus on Energy
Jay Francis Vice President Marketing SPX Flow Technology
Tilo Fruth President Beko USA
Chris Gordon President Blackhawk Equipment
Clint Hodge National Accounts Manager ASCO Numatics
Paul Humphreys General Manager Edmac
Compressor Parts
Paul Johnson Global Sales Manager Parker Hannifin
Kurt Kondas President Universal Air & Gas Products
Mark Krisa Director Global Service Solutions Ingersoll Rand
Frank Langro Director Marketing / Product Management Festo
Ron Marshall Customer Engineering Services Compressed Air Challenge®
Pierre Noack President Aerzen USA
Wayne Perry Technical Director Kaeser Compressors
Andy Poplin Sales Manager Atlas Machine & Supply
Nitin Shanbhag Senior Manager, Industrial Division Hitachi America
Richard Stasyshan
Technical DirectorCompressed Air & Gas Institute
Hank Van Ormer President Air Power USA
1 0 / 1 3 |
5 airbestpractices.com
Columns
C o m p r e s s e d A i r , C o m p r e s s e d A i r , C o m p r e s s e d A i r , ppp n e u mn e u mn e u m AAA t it it i CCC s , s , s , VVV A CA CA C u u m & B l o w e r u u m & B l o w e r u u m & B l o w e r iii n d u s t r y n d u s t r y n d u s t r y nnn e w se w se w s
Compressed Air and Gas Handbook Now Free Online
The Compressed Air and Gas Handbook, the authoritative and widely
used reference manual for information about the proper installation,
use and maintenance of compressors and pneumatic equipment, is now
available online in PDF format. Formerly available only as a 750-page
hardbound book for $70, the individual chapters are now available as
free downloadable PDF documents on the CAGI website, www.cagi.org.
Published in 1947, the first edition of the Compressed Air and Gas
Handbook was a joint effort of the CAGI Educational and Technical
Committees. The original hardbound handbook consisted of five
chapters and nearly 400 pages. Now in its sixth edition, the illustrated
handbook contains engineering information from leading manufacturers
and valuable reference
data about compressed
air systems. “The CAGI
handbook is an excellent,
comprehensive resource
for compressed air
professionals,” said Paul
Humphreys of CAGI. “Now,
with its availability online,
even more professionals
can have access to this
valuable information.”
The handbook is still
available for purchase
as a hardbound book
through the CAGI website.
About CAGI For almost 100 years, the Compressed Air and Gas Institute (www.cagi.
org) has been the leading source of manufacturer and product-neutral
support for compressed air professionals. In addition to the Compressed
Air and Gas Handbook, the CAGI website offers many resource materials
such as selection guides, videos and online training.
Atlas Copco Acquires Edwards
Atlas Copco AB and Edwards Group Ltd. have entered into an agreement
where Atlas Copco will acquire Edwards, a leading global supplier
of vacuum and abatement solutions for an amount of up to BEUR 1.235
(BSEK 10.6). The company is headquartered in the United Kingdom
and listed on the NASDAQ stock exchange in New York.
“Edwards is a technology leader with a well-developed structure
and solid customer relationships in industries we know well.
It is a great fit for Atlas Copco,” said Ronnie Leten, President and
CEO at Atlas Copco. “The vacuum solutions market is growing and
has similar characteristics to our existing industrial businesses.”
Edwards is a technology and market leader in sophisticated vacuum
products and abatement solutions with more than 90 years’ experience.
The products and services are integral to manufacturing processes,
such as for semiconductors and flat panel displays, and are used within
an increasingly diverse range of industrial applications. The vacuum
solutions market is estimated to be larger than BEUR 4.65 (BSEK 40).
Edwards has more than 3,200 employees and is headquartered in
Crawley, United Kingdom.
The acquisition of Edwards offers Atlas Copco an opportunity to expand
into a growing business which serves industries that are well-known to
Atlas Copco. There are several synergies between vacuum and compressed
air solutions in sales, service and technology development.
“We recognize the strength Edwards has in its people and products as
well as their excellence in technology and innovation. We are excited
that this professional company will join our Group,” said Ronnie Leten.
Edwards had revenues in 2012 of MEUR 746 (MSEK 6 400), of which
more than half in Asia, with an adjusted EBITDA margin was 19.1%. The
reported operating margin was 10.6%, including restructuring costs and
amortization of the sellers’ purchase price adjustments, corresponding
to about 4 percentage points of revenues. The acquisition is an all-cash
transaction utilizing Atlas Copco’s existing own funds.
| 1 0 / 1 3
6 airbestpractices.com
Columns

The TasTe of success
A growing world requires more food. At the same time, manufacturers seek food processing technologies and other solutions to help cope
with rising transport costs, increased government regulations, food safety concerns and changing consumer tastes.
At SPX, we understand the market drivers, trends and obstacles impacting the food and beverage industry.
From compressed air treatment products, rugged flow control valves to a wide range of integrated food processing equipment, we provide
solutions to help customers improve process performance and profitability – and respond quickly to changing consumer and market demands.
Come by and see at us Process Expo, McCormick Place, Chicago, IL – Booth # 5112.
The transaction, which will be completed by way of a merger, is subject to customary closing
conditions including Edwards shareholder approval and antitrust clearance. It has been
unanimously approved by the Boards of Directors of both companies. Further, the Board
of Directors of Edwards unanimously recommends the offer to all Edwards shareholders.
The transaction is expected to close in the first quarter of 2014. Edwards shareholders
representing approximately 84% of the current shares outstanding have entered into voting
agreements with Atlas Copco to vote in favor of the transaction. Edwards will be part of Atlas
Copco’s new Vacuum Solutions division within the Compressor Technique business area.
More information about Edwards on www.Edwardsvacuum.com. Visit www.atlascopco.com for more information on Atlas Copco.
NyPA Saves Energy and Water
The New York Power Authority (NYPA) announced the completion of two energy efficiency
projects at the Indian Brook Water Treatment Facility and the John-Paul Rodrigues Ossining
Operations Center that will save the Village of Ossining $123,000 a year in energy and water costs.
More efficient fuel oil use will reduce greenhouse gas emissions from the operations center by
more than 15 percent, while enhanced water-flow control will ensure that the amount of water
being processed by the village is closely calibrated with the end-use needs of its residents.
NYPA provided $1 million in low-cost financing for the initiatives, commencing work
in June 2012.
Indian Brook’s three vertical turbine pumps were replaced and new motor drives were
installed to control high-efficiency motors that allow for operating at variable speeds. At the
John-Paul Rodrigues Operations Center, a new energy efficiency boiler was installed, along
with steam traps that minimize heat loss.
“Under Governor Cuomo’s leadership, NYPA is steadily ratcheting up its statewide efforts
to improve the energy efficiency of public facilities like those in the Village of Ossining,”
Gil C. Quiniones, president and chief executive officer, NYPA, said. “We’re responsive to
the specialized needs of local and state governments in helping to manage their energy
consumption, as we work toward lowering their monthly costs for utilities and their
resource demands.”
Every NYPA energy efficiency project results in savings that pay for the cost of the initiative.
The total savings for each project exceed the cost of the upgrades over the lifespan of the
improvements. Program participants repay the low-cost financing by sharing the savings
with NYPA. After the costs have been repaid, participants retain all the savings.
“These NYPA energy efficiency programs provided the village with a cost-effective means to
upgrade and improve our capital infrastructure, realizing immediate and future energy savings,
and creating a healthier environment,” said William R. Hanauer, mayor, Village of Ossining.
The village government’s fuel-oil bills will be lowered by $19,000 a year. There will be another
$104,000 a year in water-cost savings from the Indian Brook upgrades. The filtration plant
COMPRESSED AIR, PNEUMATICS, VACUUM & BLOWER INDUSTRy NEWS
Providing engineered, on-demand nitrogen
generation solutions for your industry.
Call 888.722.5253www.titusair.com
On-DemandNitrogen
Generation Solutions
Intelligent Design. Engineered Solutions. Proven Savings.
| 1 0 / 1 3
8 airbestpractices.com
Columns
Advanced hydrocarbon monitoring systems for compressed air
Advanced hydrocarbon removal systems for compressed air
Each technology featured above is unique and exclusive to BEKO worldwide.
produces an average of 3.6 million gallons of water each day for the
village’s 25,000 residents.
The plant has two sources of available water — a free source from the
Ossining Reservoir, which is not enough to serve the entire village, and
a supplemental source that is purchased from the Old Croton Reservoir
owned by the City of New York. Older pumps at the filtration plant,
operating at fixed speeds, could not be regulated. The new variable-
speed controls ensure that the amounts of treated water closely match
the actual use.
The previous boiler at the John-Paul Rodrigues Operations Center had
an operating efficiency of approximately 75 percent. The heat energy
emitted from the new high efficiency boiler supplies the same amount
of energy as the older equipment but uses less fuel, at an efficiency
rating of 83 percent. In addition, the replacement of 76 steam traps
will result in reduced heating costs at the facility.
Visit www.nypa.gov
New Bioenergy Report from the European Environment Agency
Using biomass for energy is an important part of the renewable energy mix. However, bioenergy production should follow EU resource efficiency principles, according to a new report from the European Environment Agency (EEA). This means extracting more energy from the same material input, and avoiding negative environmental effects potentially caused by bioenergy production.
“Bioenergy” refers to energy uses of any kind of biomass, whether for
heating, power generation or transport. The report, “EU bioenergy from
a resource efficiency perspective”, primarily looks at the potential for
energy from agricultural land, although it includes forest and waste
biomass in the overall analysis.
In 2010 bioenergy was the source of approximately 7.5 % of energy
used in the EU. This is foreseen to rise to around 10 % by 2020,
1 0 / 1 3 |
9 airbestpractices.com
Columns
or approximately half of the projected renewable energy output,
according to EU Member States’ National Renewable Energy Plans.
Bioenergy should be produced in line with EU objectives to use
resources more efficiently, the report says. This means reducing the
land and other resources needed to produce each unit of bioenergy
and avoiding environmental harm from bioenergy production. According
to the EEA analysis, the most efficient energy use of biomass is for
heating and electricity as well as advanced biofuels, also called “second
generation” biofuels. First generation transport biofuels, for example,
biodiesel based on oilseed rape or ethanol from wheat, are shown
to be a far less efficient use of resources.
Building on previous analysis, the report shows that the current energy
crop mix is not favorable to the environment. The report recommends
a broader mix of crops to reduce environmental impacts. Specifically,
this should include perennial crops, which are not harvested annually
— for example energy grasses or short rotation willow plantations.
This would enhance, rather than harm, “ecosystem services” provided
by farmland — such as flood prevention and water filtration.
Bioenergy is often considered ‘carbon neutral’, as the carbon dioxide
released in combustion is assumed to be compensated by the CO2
absorbed during plant growth. However, as shown in this report, indirect
land use change can negate any greenhouse gas savings from biofuel
production based on energy crops. This is due to the displacement of
crop production onto previously unused land, which can lead to the
conversion of forests and savannah to agriculture. Such land use change
harms biodiversity and increases greenhouse gas emissions.
Hans Bruyninckx, EEA Executive Director, said: “Bioenergy is an
important component of our renewable energy mix, helping to
ensure a stable energy supply. But this study highlights the fact that
forest biomass and productive land are limited resources, and part
of Europe’s ‘natural capital’. So it is essential that we consider how
we can use existing resources efficiently before we impose additional
demands on land for energy production.”
Bioenergy in 2020 — exploring different options
The report develops three different “storylines” with varying
technological, economic and policy assumptions. This helps explore
different future options, illustrating which bioenergy types are most
resource-efficient and which have the lowest environmental impact.
The main conclusions of this analysis are next:
The EEA has revised its estimate of potential bioenergy production in the
EU first published in 2006, reducing the estimate by approximately 40%.
The estimate was revised due to changes in scientific understanding, the
changed EU policy framework and accounting for economic factors.
Different biomass-to-energy conversion technologies vary significantly
in their efficiency. For example, generating electricity by burning pure
biomass is only approximately 30-35% efficient, while burning the same
material to produce heat is usually more than 85% efficient. In general,
using bioenergy for heat and power is a considerably more efficient way
of reducing greenhouse gas emissions, compared to using bioenergy
for transport fuel.
Different energy cropping systems can vary hugely in their productivity,
as well as in environmental impacts. High-yielding systems with efficient
conversion can deliver more than 20 times more energy compared
to low-yielding inefficient systems using the same land area.
Current EU bioenergy policy only partially accounts for potentially
adverse environmental effects connected to direct land-use effects,
including changes in land management. Additional policies could help
reduce these environmental impacts, particularly regarding water
resources and farmland biodiversity.
The countries with the largest estimated agricultural bioenergy potential
in 2020 are France, Germany, Spain, Italy, Poland and Romania, the
report says.
Extensively using mature trees for energy purposes may have a negative
effect on the climate, due to the long time it takes for the trees to
regrow and re-capture the CO2 that is released when wood is used for
energy. This ‘carbon debt’ does not arise if bioenergy uses other forest
biomass instead, for example branches left over from forest harvesting
by-products or waste products from timber and paper production.
Using organic waste and agricultural or forestry residues as feedstock
is more resource efficient than many other types of feedstock, as it does
not add pressure on land and water resources and offers very high
greenhouse gas savings.
Visit www.eea.europa.eu
C O M P R E S S E D A I R , P N E U M AT I C S , V A C U U M & B L O W E R I N D U S T R y N E W S
To read more To read more To read more Industry NewsIndustry NewsIndustry News articles, articles, articles,Industry News articles,Industry NewsIndustry NewsIndustry News articles,Industry News articles,Industry News articles,Industry NewsIndustry NewsIndustry News articles,Industry Newsvisit www.airbestpractices.comvisit www.airbestpractices.comvisit www.airbestpractices.com
| 1 0 / 1 3
10 airbestpractices.com
Columns
Delivering The Quality You Paid For, With More Value Than You Bargained For.
FS-Elliott has been building and servicing reliable, energy-effi cient, oil-free
centrifugal air and gas compressors for over 50 years. Our customers enjoy the
resources of a global industry leader with the convenience and responsiveness
of local sales and service. We’re ready to serve you, too.
Today, tomorrow, and years down the road.
724.387.3200 fs-elliott.com
13842_FSE_8.375x10.875_CompressedAirBP_Ad_New.indd 5 8/13/13 1:19 PM
c Energy conservation measures (ECM)
associated with compressed air have received
a significant amount of attention over the
years, mostly due to a reasonably short
financial return compared with other energy
consuming equipment. Over time many of
the corrective actions put forward to reduce
compressed air energy consumption have
been simplified with the goal of encouraging
action. Although this is done with the best
of intentions, sometimes simplifications and
generalizations do not necessarily lead to
positive results. One of the most common
energy conservation measures for compressed
air that leverages best practice calculations
involves reducing system pressure. It is the
objective of this series of articles to highlight
some of the more common issues associated
with estimating energy conservation resulting
from changing system pressure.
Part 1 of this series identified issues with
common methods used to calculate energy
savings associated with the influence of
system pressure on air compressor power.
Part 2 focused specifically on centrifugal
compressors to identify the relationship
between pressure, capacity and power.
This third and final article will focus on the
influence of system pressure on compressed
air demand.
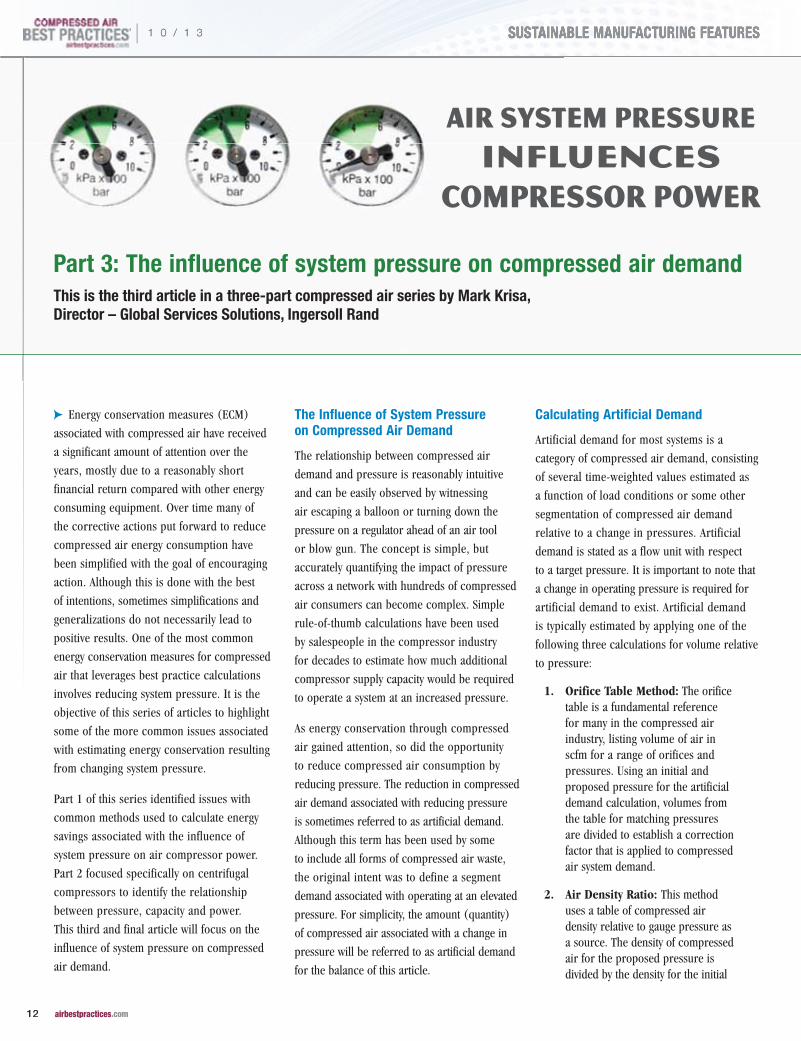
The Influence of System Pressure on Compressed Air Demand
The relationship between compressed air
demand and pressure is reasonably intuitive
and can be easily observed by witnessing
air escaping a balloon or turning down the
pressure on a regulator ahead of an air tool
or blow gun. The concept is simple, but
accurately quantifying the impact of pressure
across a network with hundreds of compressed
air consumers can become complex. Simple
rule-of-thumb calculations have been used
by salespeople in the compressor industry
for decades to estimate how much additional
compressor supply capacity would be required
to operate a system at an increased pressure.
As energy conservation through compressed
air gained attention, so did the opportunity
to reduce compressed air consumption by
reducing pressure. The reduction in compressed
air demand associated with reducing pressure
is sometimes referred to as artificial demand.
Although this term has been used by some
to include all forms of compressed air waste,
the original intent was to define a segment
demand associated with operating at an elevated
pressure. For simplicity, the amount (quantity)
of compressed air associated with a change in
pressure will be referred to as artificial demand
for the balance of this article.
Calculating Artificial Demand
Artificial demand for most systems is a
category of compressed air demand, consisting
of several time-weighted values estimated as
a function of load conditions or some other
segmentation of compressed air demand
relative to a change in pressures. Artificial
demand is stated as a flow unit with respect
to a target pressure. It is important to note that
a change in operating pressure is required for
artificial demand to exist. Artificial demand
is typically estimated by applying one of the
following three calculations for volume relative
to pressure:
1. Orifice Table Method: The orifice table is a fundamental reference for many in the compressed air industry, listing volume of air in scfm for a range of orifices and pressures. Using an initial and proposed pressure for the artificial demand calculation, volumes from the table for matching pressures are divided to establish a correction factor that is applied to compressed air system demand.
2. Air Density Ratio: This method uses a table of compressed air density relative to gauge pressure as a source. The density of compressed air for the proposed pressure is divided by the density for the initial
Part 3: The influence of system pressure on compressed air demandThis is the third article in a three-part compressed air series by Mark Krisa, Director – Global Services Solutions, Ingersoll Rand
Air System PressureInfluences
Compressor Power
| 1 0 / 1 3
12 airbestpractices.com
SUSTAINABLE MANUFACTURING FEATURESSUSTAINABLE MANUFACTURING FEATURES
COMPRESSED AIR ALSO PRODUCES OILY CONDENSATE*
Help ensure it doesn’t impact ourENVIRONMENT.
JORC Zero Air-Loss Condensate Drains and Oil/Water Separators provide
SUSTAINABLE CONDENSATE MANAGEMENT
Zero Air-Loss Condensate Drains
Lock-Down Air Leaks
JORC Industrial LLC. • 1146 River Road • New Castle, DE 19720Phone: 302-395-0310 • Fax: 302-395-0312 • [email protected] • www.jorc.com
*A 250 hp compressor can produce 40,515 gallons of oily condensate per year.
Sepremium Oil/Water Separator
Air-Saver G2
Smart Guard Ultra
Electronic
No Electricity Required
Mag-11 - 230 psi POD-DC Non-Electric
Smart Guard
pressures and factored against the initial demand to estimate the proposed demand.
3. Absolute Pressure Ratio: For this method, initial and proposed absolute pressures are divided and factored against the initial demand to estimate the proposed demand. This method will deliver the same results as the orifice chart provided the same standard conditions are used to correct from gauge to absolute pressure. The density method will also deliver very similar results. This is the most commonly used calculation for correcting volume relative to changes in pressure, because it does not require a table reference and can be used as a simple equation.
Since artificial demand is the difference in flow associated with
operating at a different pressure, it has been stated using two
equations to simplify interpretation of the calculation. Please note;
volume in this context refers to the flow of air expressed as a volume
with respect to time with V representing the demand in scfm and
P representing gauge pressure in psig.
V final = V initial x [(P final+14.5) / (P initial+14.5)]
V artificial = (V initial – V final) x (% influenced load)
Artificial Demand — Potential Calculation Errors
When calculating artificial demand, it is very important to segment
load conditions and the associated pressures. For many systems,
network pressure is highest when demand for compressed air
is lowest. This is normally the case for a few reasons:
p For systems with multiple compressors using cascaded control set points, as fewer compressors are required the next trim compressor in the cascade will dictate the supply pressure using higher pressure values.
p With compressors using pneumatic inlet modulation controls, pressure increases as compressor supply is reduced. These machines use a subtractive pilot that operates using proportional logic, modulating the inlet valve as a function of the signal pressure.
1 0 / 1 3 |
13 airbestpractices.com
SUSTAINABLE MANUFACTURING FEATURESSUSTAINABLE MANUFACTURING FEATURES
p Pressure losses across filters and dryers are reduced as flow across the components becomes less. This applies to systems with multiple compressors connected to common purification equipment or when compressors have some form of supply reduction controls.
p Any pressure losses across the pipe network, sub-headers and shared point-of-use components will decrease as flow through the components is reduced. This will elevate pressure to some applications as demand decreases.
Since artificial demand is the additional
volume of compressed air consumed relative
to an initial operating pressure, it is imperative
to use pressure values related to each load
condition. This is a common error, and for
some systems, can be significant depending on
how much pressure and demand vary between
load conditions. To assist with the explanation,
the sample system from Part 1 of this series
published in the July 2013 issue will be
referenced as follows:
Sample system This example is based on a simple system
with four identical 100 hp compressors
operating using loaded/unloaded local
controls, and a simple pressure cascade
between compressor control settings.
Compressors are rated for 400 scfm at
site conditions, consuming 100 hp at
115 psig and 70 hp at 50 percent load.
Each compressor has a 20-second start-
permissive (off to full-load). Total system
storage is 660 U.S. gallons. For simplicity,
the system has no filters or dryers and total
∆P from compressor package discharge to
furthest point in the network is <0.4 psi.
After recording pressure, amps and flow
for a seven-day period, four distinct load
conditions were identified:
1. Day shift, operating eight hours a day, 40 hours a week with an average pressure of 107 psig, three compressors fully loaded and a fourth unit in trim using an online/offline control constantly cycling between 114 psig and 100 psig at 50 percent load.
2. Afternoon shift, operating eight hours a day, 40 hours a week with an average pressure of 113 psig, one compressor fully loaded and a second unit in trim constantly cycling between 120 psig and 106 psig at 50 percent load.
3. Night shift and weekends, operating 88 hours a week with an average pressure of 116 psig, with only one compressor in trim constantly cycling between 123 psig and 109 psig at 50 percent load.
4. Weekdays at 7 a.m. the day shift starts, with demand transitioning from lowest load to highest load linearly in 60 seconds. Since demand increases faster than compressor supply, pressure falls below 100 psig — at times as low as 86 psig — before recovering back to 100 psig. The total event lasts around 90 seconds, followed by the system returning to the normal day shift condition (6.5 h/y). This occurs every weekday morning and no one at the facility has ever complained about insufficient pressure.
For this system, a recommendation was
made to install a compressor system
controller that would operate any
combination of compressors within a 10
psi control band using a rate of change
anticipatory control logic, limiting pressure
decay to less than 5 psi during the transition
AIR SySTEM PRESSURE INFLUENCES COMPRESSOR POWER
Your Partner in Air Compressor Custom Cooling
Systems
For more information contact us at:
www.hydrothrift.com
330-837-5141
| 1 0 / 1 3
14 airbestpractices.com
SUSTAINABLE MANUFACTURING FEATURES
from night to day shift. Proposed system
would operate at an average pressure of 96
psig +/- 5 psi.
The maximum recorded pressure of 123
psig from the sample system cannot be used
to calculate artificial demand for all load
conditions. Aside from the low-load period
when demand averages 200 scfm, the other
load conditions operate at lower pressures.
Assuming a proposed operating pressure
of 96 psig, a reduction in demand of almost
20 percent would be falsely estimated for all
conditions by incorrectly using the maximum
pressure value of 123 psig. During the day shift
when demand is highest, average pressure is
only 107 psig. Using this pressure, artificial
demand would represent a potential 9 percent
reduction in demand; less than half of the
savings compared with the estimate using the
maximum pressure.
The most common and significant error when
calculating artificial demand is assuming that
the relative changes in network or supply
pressure will impact all compressed-air-
consuming equipment. It is important to
understand that compressed air demand
consists of compressed air discharging to the
atmosphere or some reduced pressure across
an interface. Depending on the size of the
system, there could be hundreds or thousands
of individual points, each contributing to
the total system demand. This could be air
expanding to drive an assembly tool, air
actuating a valve by filling a cylinder or air
leaking through a blister in a hose. At some
point for each individual consumer, there
is an interface where pressure can influence
air density, velocity and the volume flow rate.
Depending on the system and how compressed
air is consumed, a reduction in network
pressure could directly impact the entire
demand, a percentage of demand or have no
impact at all. Some frequent artificial demand
considerations are as follows:
Aside from reliably and effi ciently generating high quality oil free
compressed air, our SO 270 has more to offer than meets the eye:
e.g., for further effi ciency improvement, the option to use an
external HOC adsorption dryer which uses the existing heat of the
compressed air to dry it entirely without any additional energy
supply. Another option is heat recovery. Highest energy effi ciency
for extreme applications – the water cooled SO 270, with or
without frequency control, is ready to provide your company
with the necessary air to work.
To learn more about BOGE, the SO product range, or our other products phone 770-874-1570 or visit www.boge.com/us
Thomas Lalk, Product Developer Oil free Screw Compressors, BOGE
B O G E A I R . T H E A I R T O W O R K .
True greatness comes from within: This is where oil free compressed air is generated
with low energy consumption.”
”
”
1 0 / 1 3 |
15 airbestpractices.com
SUSTAINABLE MANUFACTURING FEATURES
p Point-of-use regulators. The majority of compressed air applications have one or several pressure regulators influencing point-of-use pressure. Depending on the design, size and regulator settings, pressure downstream may not decrease at all based on a reduction in network pressure. If pressure downstream of the regulator does not change, the demand associated with the application will not change. The percentage of compressed air demand that falls into this category will not have artificial demand associated with network pressure and this percentage of the system demand must be excluded from any artificial demand calculations. It is important to acknowledge that having a regulator installed does not necessarily isolate network pressure from the point-of-use. Many low-cost regulators will track with the upstream network pressure, causing pressure to decrease at the point of influence. Depending on the installation, artificial demand for the application relative to the change in network pressure could be a percentage of the estimated value or in some situations greater when regulated pressure is very low.
p Sonic velocity. Some applications will not be influenced by a reduction in network pressure, regardless of whether they are regulated or not. These are applications where air has reached a maximum internal velocity at some lower pressure. As long as the supplied pressure is above some critical value, demand will
not change. It is not uncommon to find an application reach a velocity limit at 30 to 40 psig. The portion of compressed air demand operating in these conditions will not have artificial demand and must be excluded from the calculation.
p Pressure independent control. Some modern compressed-air-consuming equipment controls compressed air at the application based on a desired outcome. An example would be high-speed weaving machines where compressed air is used to move a thread across a defined path in a required time. Internal pressure requirements are low and the unit will automatically adjust internal pressure to achieve the required speed. If network pressure were reduced to this application, it would internally compensate for a change in network pressure, and compressed air demand would not change. This type of application does not have artificial demand, and the volume of total system demand associated with these applications must be excluded from any artificial demand estimations.
p Compressed air leaks. Some compressed air auditors assume 30 percent of compressed air demand is associated with leaks without any form of measurement or validation. The second assumption is that all leaks are unregulated and any reduction in system pressure will have an associated reduction in artificial demand. For most industrial systems with more than 200 horsepower of
compressor supply, a significant percentage of overhead piping joints are welded and not very susceptible to developing leaks. If every mechanical joint used to connect hose, tube or pipe is considered a potential leak, the majority are typically located downstream of one or more regulators. Consequently it is not correct to assume 30 percent of the system demand is unregulated and directly influenced by a reduction in system pressure.
Correcting Artificial Demand at the Point-of-Use — Application Tuning
Many compressed air components are installed
with a filter-regulator-lubricator (FRL) without
detailed expectations regarding application
pressure. Air cylinders are a great example
of an application that can potentially have
artificial demand. It is not uncommon to find
regulators set at 90 to 100 psi for a cylinder
that will deliver sufficient force and speed at a
significantly lower pressure. During installation
and tuning of the installed equipment, the
cylinder speed is reduced by increasing back
pressure on the exhaust metering valve instead
of lowering the pressure. The net result for
example, is 95 psig supply with 55 psig back
pressure. Unless the 95 psig is required to
deliver a specified force after the cylinder
is fully extended, this same cylinder could be
tuned to operate at close to 40 psig by adjusting
the regulator and exhaust valve, reducing
the required volume of compressed air 49
percent. The higher regulated pressure may
also be required to compensate for undersized
components causing excessive pressure drop
while the cylinder is extending. This can often
be seen by watching the pressure gauge when
the cylinder strokes. When friction (pressure
drop) ahead of the cylinder or the regulator
AIR SySTEM PRESSURE INFLUENCES COMPRESSOR POWER
| 1 0 / 1 3
16 airbestpractices.com
SUSTAINABLE MANUFACTURING FEATURES
itself is the issue, the gauge reading will initially
drop while the cylinder is extending and then
recover after the cylinder has completed the
designated task. After the cylinder is fully
extended, the required work has been done
and air is flowing to the cylinder for no purpose
other than to raise the pressure unnecessarily,
increasing the consumed volume of air. After
the cylinder is fully extended, the rate of flow
will decrease, along with the pressure drop
as pressure increases in the cylinder until
flow has stopped. It is not uncommon to see
30 to 50 psi deflection that can be corrected
to reduce demand. Although this action may
not be as glamorous as a demand expander
with a segmented valve and PID control, it
can be implemented with almost no capital
investment and can deliver significant results
for many systems. A facility could reduce total
compressed air consumption 20 to 40 percent
by diligently tuning point-of-use applications.
Energy Conservation and Artificial Demand
It is important to reaffirm that artificial
demand is a reduction in demand, not energy.
Assuming the pressure at the discharge of the
compressor does not change and network
pressure was reduced using some type of
pressure-reducing device, the energy reduction
will be based on how the installed compressors
reduce consumed power relative to the
reduction in supply requirements. A best-in-
class system will reduce power almost directly
proportionate to the change in demand. Other
systems will deliver a reduction in power that
is a percentage of the demand reduction with
the extreme being a system with centrifugal
compressors that have no more throttle
capability and are discharging excess air to the
atmosphere in an effort to control pressure.
For this type of system, a reduction in demand
will have no impact on power.
Closing Comments
Although efforts to reduce compressed air
pressure can potentially deliver significant
energy savings with an attractive rate of return,
topics discussed in all three parts of this
series identify issues that can erode some
or all of the assumed savings. Simple rule-of-
thumb estimates are an easy way to quickly
assess an opportunity to determine if more
detailed analysis is warranted but more detail
is required for investment grade projects.
The sample system referenced in this series
of articles illustrates how energy savings
estimates associated with artificial demand and
compressor power could vary from more than
50 percent to less than 3 percent depending
on calculation method, compressor design and
how compressed air is consumed. For larger
systems or projects that require validated
results, the experience and capabilities of the
individuals assessing the system becomes more
significant. Contracting credible resources
with a reference list of implemented systems
becomes an investment as the costs for
corrective actions and risks associated with
overestimating savings become substantial.
About the Author
Mark Krisa is director of global services solutions at Ingersoll Rand and leads the company’s compressed air audit program. This program is designed to deliver customer value by leveraging engineering and compressed air science to improve system reliability, quality and efficiency.
Krisa graduated from the University of Western Ontario in Canada with a degree in engineering science, and has worked in the compressed air industry for more than 20 years. His experience in the industry is diverse, ranging from compressor service technician to engineering and compressed air system auditor. Krisa has authored several papers and speaks regularly at conferences and training events across the Americas. You can contact Krisa with questions or comments at [email protected].
AIR SySTEM PRESSURE INFLUENCES COMPRESSOR POWER
Our R-Series Rotary Screw Compressors prove
that R stands for rugged reliability. Designed for
virtual 24/7 operation, the R-Series line offers
advanced features like Progressive Adaptive
Control™ (PAC™) protection, V-Shield™
technology, a sequential cooling system and
state-of-the-art Xe-Series controls for effi cient
operation and reduced cost of ownership.
Innovative designs backed by a century of
service. Dependability for decades. That’s
Ingersoll Rand.
www.ingersollrandproducts.com
Everything Running Smoothly,
Every Day (after day, after day)
21873.indd 1 12/11/12 10:39 AM
To read more To read more To read more System AssessmentSystem AssessmentSystem Assessment articles, articles, articles, System Assessment articles, System AssessmentSystem AssessmentSystem Assessment articles, System Assessment articles, System Assessment articles, System AssessmentSystem AssessmentSystem Assessment articles, System Assessmentvisit www.airbestpractices.com/system-visit www.airbestpractices.com/system-visit www.airbestpractices.com/system-
assessmentsassessmentsassessments
1 0 / 1 3 |
17 airbestpractices.com
SUSTAINABLE MANUFACTURING FEATURES
The Compressed Air The Compressed Air The Compressed Air sssysysysTTTem Assessmenem Assessmenem AssessmenTTT
Reviewing Compressed Air Demand at a Food ProcessorBy James G. McAuley P.E.
c This article reviews portions of an audit
report of a compressed air system in a food
industry factory located in the U.S. Although
the audit explored different supply-side options
the client should consider to improve dynamic
efficiency, we will focus on the demand side
of the system for this article.
The Compressed Air System
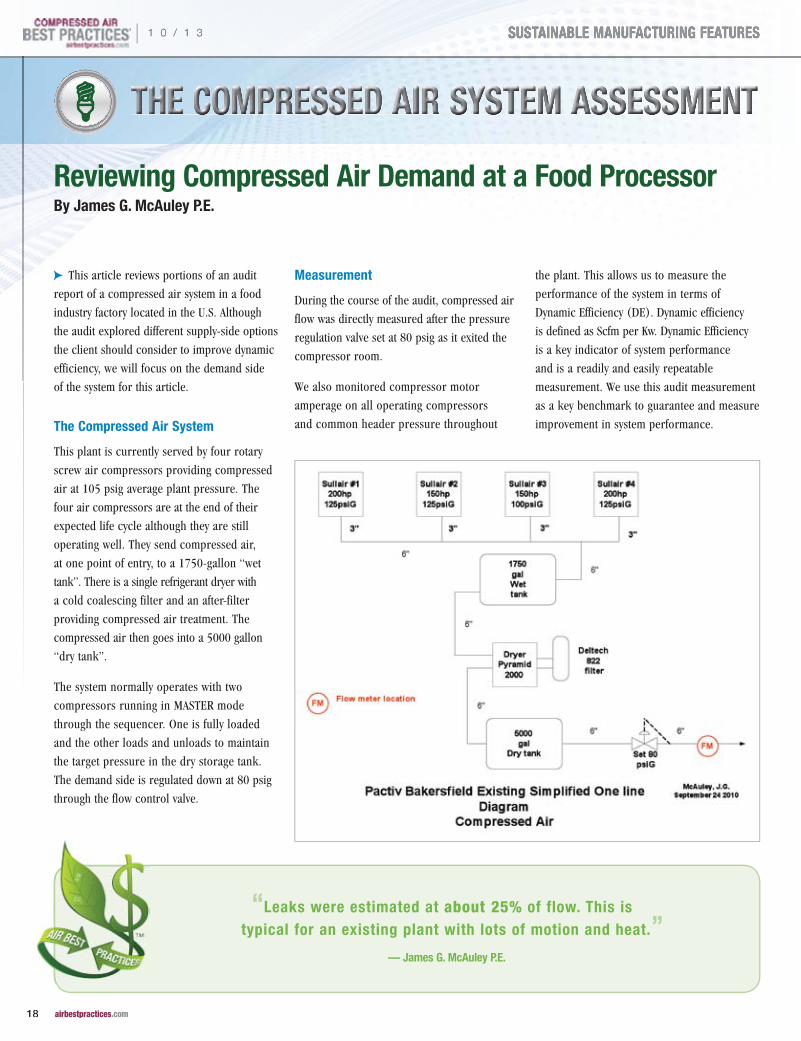
This plant is currently served by four rotary
screw air compressors providing compressed
air at 105 psig average plant pressure. The
four air compressors are at the end of their
expected life cycle although they are still
operating well. They send compressed air,
at one point of entry, to a 1750-gallon “wet
tank”. There is a single refrigerant dryer with
a cold coalescing filter and an after-filter
providing compressed air treatment. The
compressed air then goes into a 5000 gallon
“dry tank”.
The system normally operates with two
compressors running in MASTER mode
through the sequencer. One is fully loaded
and the other loads and unloads to maintain
the target pressure in the dry storage tank.
The demand side is regulated down at 80 psig
through the flow control valve.
Measurement
During the course of the audit, compressed air
flow was directly measured after the pressure
regulation valve set at 80 psig as it exited the
compressor room.
We also monitored compressor motor
amperage on all operating compressors
and common header pressure throughout
the plant. This allows us to measure the
performance of the system in terms of
Dynamic Efficiency (DE). Dynamic efficiency
is defined as Scfm per Kw. Dynamic Efficiency
is a key indicator of system performance
and is a readily and easily repeatable
measurement. We use this audit measurement
as a key benchmark to guarantee and measure
improvement in system performance.
“Leaks were estimated at about 25% of flow. This is typical for an existing plant with lots of motion and heat.”
— James G. McAuley P.E.
| 1 0 / 1 3
18 airbestpractices.com
SUSTAINABLE MANUFACTURING FEATURESSUSTAINABLE MANUFACTURING FEATURES
Reviewing Compressed Air Demand at a Food ProcessorBy James G. McAuley P.E.
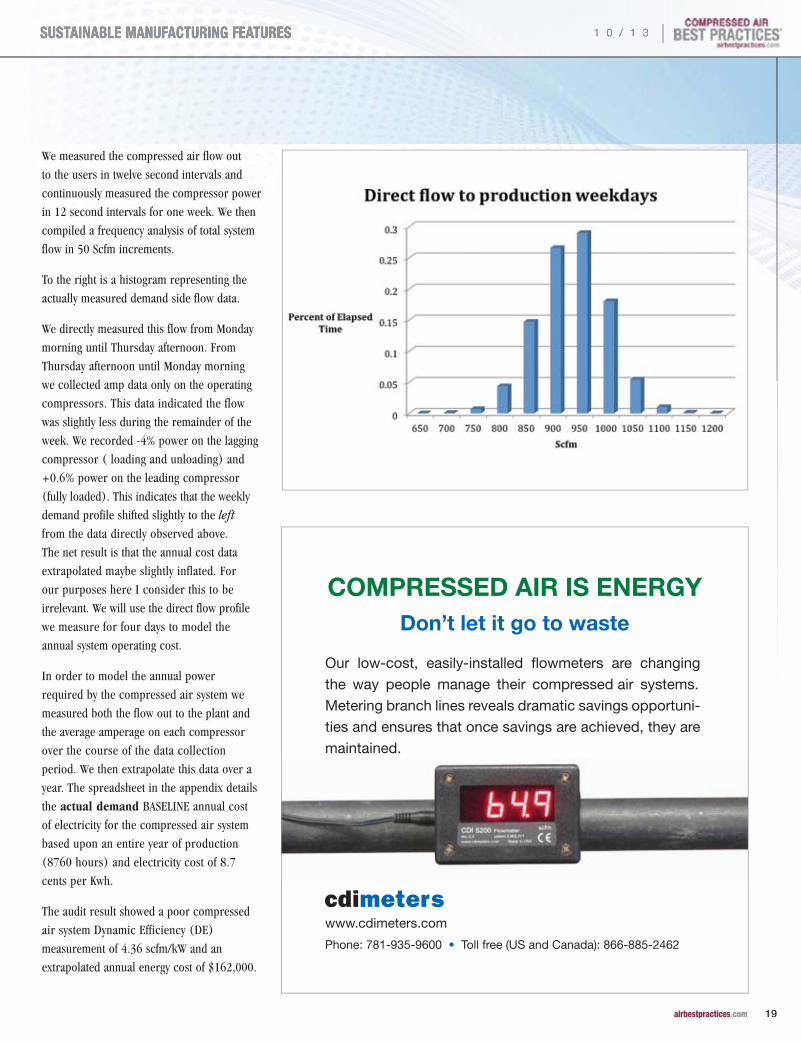
We measured the compressed air flow out
to the users in twelve second intervals and
continuously measured the compressor power
in 12 second intervals for one week. We then
compiled a frequency analysis of total system
flow in 50 Scfm increments.
To the right is a histogram representing the
actually measured demand side flow data.
We directly measured this flow from Monday
morning until Thursday afternoon. From
Thursday afternoon until Monday morning
we collected amp data only on the operating
compressors. This data indicated the flow
was slightly less during the remainder of the
week. We recorded -4% power on the lagging
compressor ( loading and unloading) and
+0.6% power on the leading compressor
(fully loaded). This indicates that the weekly
demand profile shifted slightly to the left
from the data directly observed above.
The net result is that the annual cost data
extrapolated maybe slightly inflated. For
our purposes here I consider this to be
irrelevant. We will use the direct flow profile
we measure for four days to model the
annual system operating cost.
In order to model the annual power
required by the compressed air system we
measured both the flow out to the plant and
the average amperage on each compressor
over the course of the data collection
period. We then extrapolate this data over a
year. The spreadsheet in the appendix details
the actual demand BASELINE annual cost
of electricity for the compressed air system
based upon an entire year of production
(8760 hours) and electricity cost of 8.7
cents per Kwh.
The audit result showed a poor compressed
air system Dynamic Efficiency (DE)
measurement of 4.36 scfm/kW and an
extrapolated annual energy cost of $162,000.
COMPRESSED AIR IS ENERGYDon’t let it go to waste
Our low-cost, easily-installed flowmeters are changing
the way people manage their compressed air systems.
Metering branch lines reveals dramatic savings opportuni-
ties and ensures that once savings are achieved, they are
maintained.
www.cdimeters.com
Phone: 781-935-9600 • Toll free (US and Canada): 866-885-2462
1 0 / 1 3 |
19 airbestpractices.com
SUSTAINABLE MANUFACTURING FEATURESSUSTAINABLE MANUFACTURING FEATURES
Allocated Unit Costs for Compressed Air
The allocated unit cost for compressed air
at this plant is $1.99 per hour of operation
per 100 Scfm of usage. This number is
derived from the total cost of compressed
air operations, the average demand side flow
rate observed in the system (930 Scfm), and
the total hours per year (8760). It is a useful
number when comparing costs.
The allocation of unit cost will allow plant
management to estimate the financial impact
of various management decisions including the
operating cost associated with new equipment
and the efficacy of better (more) intense
maintenance practices. Caution: It is not the
marginal cost of the next 100 scfm of use nor
the savings derived from the last 100 scfm of
use eliminated. This number is average for a
facility of this type and size in the United States.
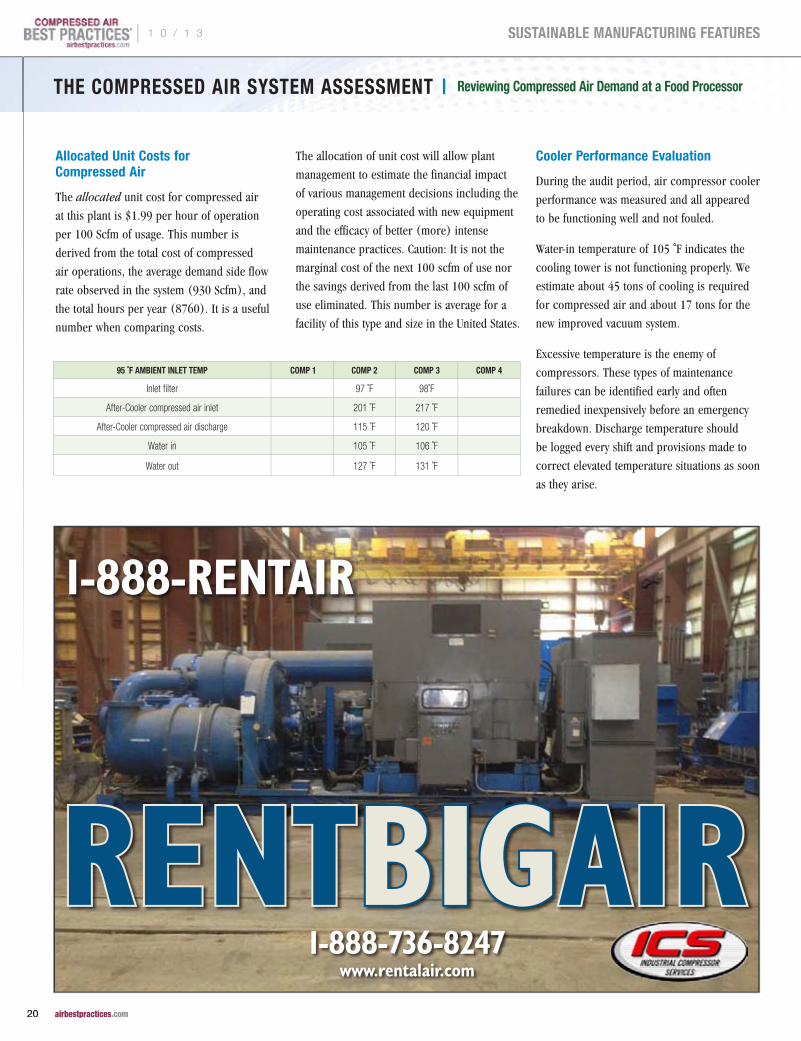
Cooler Performance Evaluation
During the audit period, air compressor cooler
performance was measured and all appeared
to be functioning well and not fouled.
Water-in temperature of 105 ˚F indicates the
cooling tower is not functioning properly. We
estimate about 45 tons of cooling is required
for compressed air and about 17 tons for the
new improved vacuum system.
Excessive temperature is the enemy of
compressors. These types of maintenance
failures can be identified early and often
remedied inexpensively before an emergency
breakdown. Discharge temperature should
be logged every shift and provisions made to
correct elevated temperature situations as soon
as they arise.
THE COMPRESSED AIR SySTEM ASSESSMENT | Reviewing Compressed Air Demand at a Food Processor
95 ˚F AMBIENT INLET TEMP COMP 1 COMP 2 COMP 3 COMP 4
Inlet filter 97 ˚F 98˚F
After-Cooler compressed air inlet 201 ˚F 217 ˚F
After-Cooler compressed air discharge 115 ˚F 120 ˚F
Water in 105 ˚F 106 ˚F
Water out 127 ˚F 131 ˚F
1-888-RENTAIR
1-888-736-8247www.rentalair.com
RENTBIGAIR
| 1 0 / 1 3
20 airbestpractices.com
SUSTAINABLE MANUFACTURING FEATURES
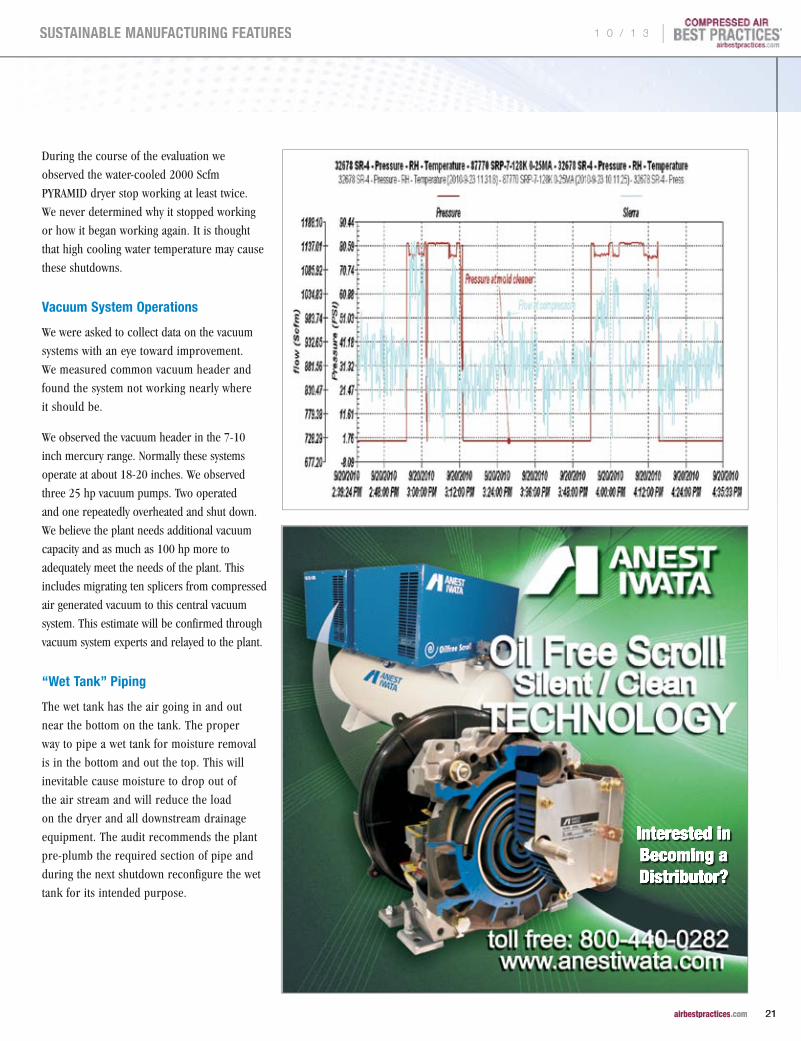
During the course of the evaluation we
observed the water-cooled 2000 Scfm
PYRAMID dryer stop working at least twice.
We never determined why it stopped working
or how it began working again. It is thought
that high cooling water temperature may cause
these shutdowns.
Vacuum System Operations
We were asked to collect data on the vacuum
systems with an eye toward improvement.
We measured common vacuum header and
found the system not working nearly where
it should be.
We observed the vacuum header in the 7-10
inch mercury range. Normally these systems
operate at about 18-20 inches. We observed
three 25 hp vacuum pumps. Two operated
and one repeatedly overheated and shut down.
We believe the plant needs additional vacuum
capacity and as much as 100 hp more to
adequately meet the needs of the plant. This
includes migrating ten splicers from compressed
air generated vacuum to this central vacuum
system. This estimate will be confirmed through
vacuum system experts and relayed to the plant.
“Wet Tank” Piping
The wet tank has the air going in and out
near the bottom on the tank. The proper
way to pipe a wet tank for moisture removal
is in the bottom and out the top. This will
inevitable cause moisture to drop out of
the air stream and will reduce the load
on the dryer and all downstream drainage
equipment. The audit recommends the plant
pre-plumb the required section of pipe and
during the next shutdown reconfigure the wet
tank for its intended purpose.
Interested in Becoming a Distributor?
THE COMPRESSED AIR SySTEM ASSESSMENT | Reviewing Compressed Air Demand at a Food Processor
1 0 / 1 3 |
21 airbestpractices.com
SUSTAINABLE MANUFACTURING FEATURES
airbestpractices.com
ENERGY KAIZEN EVENTS
Get your FREE Subscription to Compressed Air Best Practices® Magazine to learn how to save energy.
Subscribe at
p Food Packaging Plant Saves $70,000 or 1.1 Million kWh per year. p Paper Mill Saves $207,000 or 4.5 Million kWh per year.
THE COMPRESSED AIR SySTEM ASSESSMENT | Reviewing Compressed Air Demand at a Food Processor
Potentially Inappropriate Uses of Compressed Air
Because compressed air is ubiquitous in most industrial settings, and since it is a highly adaptable energy source, it tends to be the first choice for power at remote locations even when it is clearly not the most efficient choice. We surveyed the entire plant looking for potentially inappropriate uses of compressed air.
It is worth repeating here this indisputable fact; 85% of the input purchased energy used to drive an air compressor is immediately dissipated in the heat of compression and lost forever. Only 15% of the purchased energy is actually imparted to the fluid (the compressed air) to later go out and do useful work in the plant. If it can be done with electricity it is automatically 8 times more efficient than with compressed air.
We surveyed the entire plant with an ultrasonic detector and identified only one open blowing application that could be modified.
p On the Rennco baggers a quarter inch open blow is used to close the open end of the bag prior to tie wrapping the end. This has been modified such that it
is intermittent. I observed approximately 25% on time for this application. Assuming 6000 hours per year for each and six in operation at 20 Scfm full flow and our $1.99 per hour per hundred Allocated Cost model, this use is costing the plant about $3600 per year.
(20/1000) x .25 x1.99 x 6000 hours x 6 baggers = $3582/year
p Even though a blower would use only 30% of this energy it would have to stay on 100% of the time, thus there are no net savings using a blower here.
p The 15 bag houses on the roof are all well controlled via differential pressure and not on time. This has dramatically reduced the compressed air cost here from over 350 Scfm estimated in 1999 to less than 30 Scfm now. I observed only a few firings while surveying the equipment on the roof over a ten minute period.
p We also looked at the CO2 mold cleaning operations.
We wanted to be sure they were not dragging down the local header pressure at the mold cleaning operations. They were not, at least not at the normal mold cleaning station. We observed that the mold cleaning
| 1 0 / 1 3
22 airbestpractices.com
SUSTAINABLE MANUFACTURING FEATURES
operation used about 200 Scfm for less than ten minutes. This is about 33 cents worth of compressed air for each cleaning operation.
200/100 x .165 hours x 1.99 $/hr/100 Scfm = 33 cents
p The compressed air use appears efficient and effective in this application. Here is a flow tracing of a typical CO
2 mold cleaning operation.
p Ten Thermoformers (TF) are equipped with Airvac ( Milford Ct) compressed air vacuum generators. These use 0.41 Scfm each. There are twelve on each TF. We estimate they use 65 Scfm or 15 Kw of power ( 65/4.36). Vacuum pumps are estimated to do this at 30% of the power of compressed air or for a net savings of $7545 per year.
(65/100) x $1.99 x .7 x 6000 hours per year = $7545
Effective Leak Management Processes
Leaks were estimated at about 25% of flow. This is typical for a existing plant with lots of motion and heat. We noted many normal leak modes including push pull connectors, connections subjected to excessive heat and vibration (behind the safety fence) and many final connections to applications including unions, pipe clamps, and FRL.
We recommend the plant invest in an ultrasonic United Electric Ultraprobe 3000 hand held detector and recruit a Plant Champion to identify and fix leaks on a regular basis . This monthly shift task, with the Ultrasonic detector, can ultimately achieve reduction in leak loss level to 15%. In this plant, this could be responsible for up to $16,000 in yearly savings using our allocated cost model.
930 Scfm x ( .25-.15) x 1.99 $/100Scfm x 8760 hr/yr =$16,212
We’d like to highlight, at Extruder 504, a very large long-term leak at the MAC solenoid manifold.
Summary
The compressed air system at this food processing plant is not now operating near peak performance. In fact, it runs at a combined dynamic efficiency (DE) of about 4.36 Scfm/Kw. We believe we can boost this dynamic efficiency to 5.69 by modifying the supply side situation and addressing the demand side issues outlined in this article.
For more information contact James G. McAuley P.E., tel: 832-563-6395, email: [email protected], www.JimMcAuley.com
THE COMPRESSED AIR SySTEM ASSESSMENT | Reviewing Compressed Air Demand at a Food Processor
To learn more, visit www.aerzenusa.com108 Independence Way • Coatesville, PA 19320
(610) 380-0244 • [email protected]
Learn how to save energy andincrease operating efficiencieswith the Aerzen Delta Hybrid
Rotary Lobe Compressor.
A New Twist in Energy-Efficient Air
• Substantial energy savings
• Reliable and durable
• Space saving, easy handling
• Reduction of maintenance costs
• Simple operation up to +22psig / -21”Hg
Aerzen Compressed Air Ad RND2_Aerzen Compressed Air Ad 8/15/11 3:47 P
To read more To read more To read more System AssessmentSystem AssessmentSystem Assessment articles, visit articles, visit articles, visit System Assessment articles, visit System AssessmentSystem AssessmentSystem Assessment articles, visit System Assessment articles, visit System Assessment articles, visit System AssessmentSystem AssessmentSystem Assessment articles, visit System Assessmentwww.airbestpractices.com/system-assessmentswww.airbestpractices.com/system-assessmentswww.airbestpractices.com/system-assessments
1 0 / 1 3 |
23 airbestpractices.com
SUSTAINABLE MANUFACTURING FEATURES
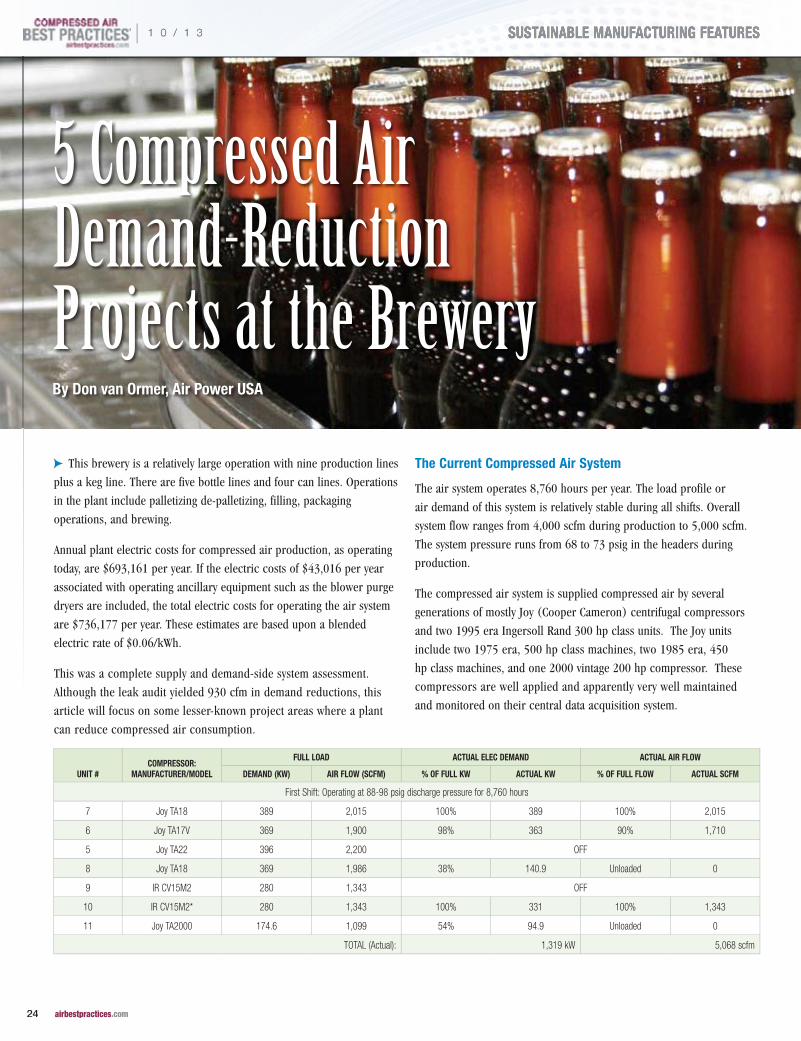
c This brewery is a relatively large operation with nine production lines
plus a keg line. There are five bottle lines and four can lines. Operations
in the plant include palletizing de-palletizing, filling, packaging
operations, and brewing.
Annual plant electric costs for compressed air production, as operating
today, are $693,161 per year. If the electric costs of $43,016 per year
associated with operating ancillary equipment such as the blower purge
dryers are included, the total electric costs for operating the air system
are $736,177 per year. These estimates are based upon a blended
electric rate of $0.06/kWh.
This was a complete supply and demand-side system assessment.
Although the leak audit yielded 930 cfm in demand reductions, this
article will focus on some lesser-known project areas where a plant
can reduce compressed air consumption.
The Current Compressed Air System
The air system operates 8,760 hours per year. The load profile or
air demand of this system is relatively stable during all shifts. Overall
system flow ranges from 4,000 scfm during production to 5,000 scfm.
The system pressure runs from 68 to 73 psig in the headers during
production.
The compressed air system is supplied compressed air by several
generations of mostly Joy (Cooper Cameron) centrifugal compressors
and two 1995 era Ingersoll Rand 300 hp class units. The Joy units
include two 1975 era, 500 hp class machines, two 1985 era, 450
hp class machines, and one 2000 vintage 200 hp compressor. These
compressors are well applied and apparently very well maintained
and monitored on their central data acquisition system.
5 Compressed Air Demand-Reduction Projects at the Brewery
UNIT #COMPRESSOR:
MANUFACTURER/MODEL
FULL LOAD ACTUAL ELEC DEMAND ACTUAL AIR FLOW
DEMAND (KW) AIR FLOW (SCFM) % OF FULL KW ACTUAL KW % OF FULL FLOW ACTUAL SCFM
First Shift: Operating at 88-98 psig discharge pressure for 8,760 hours
7 Joy TA18 389 2,015 100% 389 100% 2,015
6 Joy TA17V 369 1,900 98% 363 90% 1,710
5 Joy TA22 396 2,200 OFF
8 Joy TA18 369 1,986 38% 140.9 Unloaded 0
9 IR CV15M2 280 1,343 OFF
10 IR CV15M2* 280 1,343 100% 331 100% 1,343
11 Joy TA2000 174.6 1,099 54% 94.9 Unloaded 0
TOTAL (Actual): 1,319 kW 5,068 scfm
By Don van Ormer, Air Power USA
| 1 0 / 1 3
24 airbestpractices.com
SUSTAINABLE MANUFACTURING FEATURESSUSTAINABLE MANUFACTURING FEATURES
During our site visit, the units performed very well, spending very little, if any, time in blow-
off. There are seven air compressors and usually three units carry the plant load — two are
at idle and two are not running, waiting to come on in the auto hot start “ready” mode.
The compressed air goes through water-cooled after-coolers and then goes to four blower
purge dryers. During our site visit, all the dryers were working well with their dewpoint
demand controls engaged and working. Pressure dewpoints were always at a consistent -40 °F.
The plant runs 24 hours a day, 7 days a week, almost all 365 days a year. There are two
planned shutdown days every year. For calculating usage, we have agreed to use 8,760 hours
per year. The new negotiated power cost from the plant’s utility provider is 6 cents per kWh.
Project #1: Automatic Equipment Shut-Offs
Shutting off the air supply to machinery when not in use can often minimize some of the
most significant air leaks. When such air users are found, there are usually some very
economical and easy methods to switch off air automatically as machinery is shut off.
Slow-acting, electric-operated automatic ball valves that can be installed in the main feed
line to a piece of equipment and wired so it will open and close whenever the machine
is powered up or shut off.
The system assessment identified Filtech laser coolers as using compressed air when not
in operation. The table below lists locations where automatic shut-off valves may be of use,
either as individual machine shut-offs or as zone valves, in front of the laser coolers.
Current peak demand with 15 units x 20 cfm is 300 cfm at 80% usage or 240 cfm average
demand. According to plant personnel, these units were running even when the line was
down for cooling. If we consider a normal operation of the Packer or a device or part of the
line, depending on the product being packaged (6 pack, 12 pack, case, etc.), the estimate
of average usage is 30% of the Packager.
When shut off cooling air flow when process is off, the utilization factor will go from 80%
to 30%. Air demand will go from an average flow of 240 cfm to an average of 90 cfm,
making a net average savings of 150 cfm. We recommend a 10 minute delay after shutdown
for additional cooling. This should be reviewed by staff engineering.
Filtech Laser Cooler Locations and Compressed Air Consumption
Line 64 12-12 Packer 20+ cfm
Line 63 Packer 20+ cfm
Line 65 Packer 20+ cfm
Line 66 3 Packers 60 cfm
LOCATION DESCRIPTION SIzE (CFM) USAGE (%) NET SAVINGS (AVG CFM)
#1 All Filtech Laser Coolers Cooling for laser 300 50% 150 cfm
TOTAL 300 cfm — 150 cfm
1 0 / 1 3 |
25 airbestpractices.com
SUSTAINABLE MANUFACTURING FEATURESSUSTAINABLE MANUFACTURING FEATURES
5 COMPRESSED AIR DEMAND-REDUCTION PROJECTS AT THE BREWERy
Cfm savings 150 cfm
Cost per cfm $129.18 cfm/yr
Total savings $19,377 /year
Estimated cost of project (solenoid/timer) $300 each
Total cost (15 units x $300) $4,500
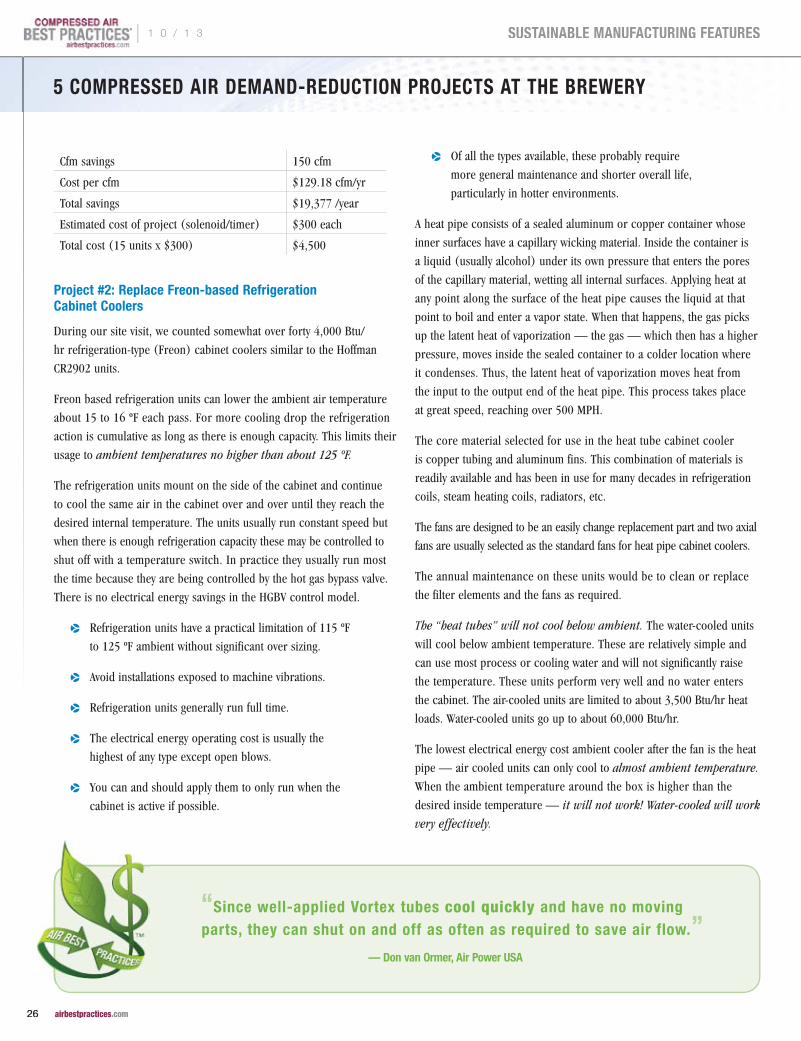
Project #2: Replace Freon-based Refrigeration Cabinet Coolers
During our site visit, we counted somewhat over forty 4,000 Btu/
hr refrigeration-type (Freon) cabinet coolers similar to the Hoffman
CR2902 units.
Freon based refrigeration units can lower the ambient air temperature
about 15 to 16 ºF each pass. For more cooling drop the refrigeration
action is cumulative as long as there is enough capacity. This limits their
usage to ambient temperatures no higher than about 125 ºF.
The refrigeration units mount on the side of the cabinet and continue
to cool the same air in the cabinet over and over until they reach the
desired internal temperature. The units usually run constant speed but
when there is enough refrigeration capacity these may be controlled to
shut off with a temperature switch. In practice they usually run most
the time because they are being controlled by the hot gas bypass valve.
There is no electrical energy savings in the HGBV control model.
p Refrigeration units have a practical limitation of 115 ºF
to 125 ºF ambient without significant over sizing.
p Avoid installations exposed to machine vibrations.
p Refrigeration units generally run full time.
p The electrical energy operating cost is usually the
highest of any type except open blows.
p You can and should apply them to only run when the
cabinet is active if possible.
p Of all the types available, these probably require
more general maintenance and shorter overall life,
particularly in hotter environments.
A heat pipe consists of a sealed aluminum or copper container whose
inner surfaces have a capillary wicking material. Inside the container is
a liquid (usually alcohol) under its own pressure that enters the pores
of the capillary material, wetting all internal surfaces. Applying heat at
any point along the surface of the heat pipe causes the liquid at that
point to boil and enter a vapor state. When that happens, the gas picks
up the latent heat of vaporization — the gas — which then has a higher
pressure, moves inside the sealed container to a colder location where
it condenses. Thus, the latent heat of vaporization moves heat from
the input to the output end of the heat pipe. This process takes place
at great speed, reaching over 500 MPH.
The core material selected for use in the heat tube cabinet cooler
is copper tubing and aluminum fins. This combination of materials is
readily available and has been in use for many decades in refrigeration
coils, steam heating coils, radiators, etc.
The fans are designed to be an easily change replacement part and two axial
fans are usually selected as the standard fans for heat pipe cabinet coolers.
The annual maintenance on these units would be to clean or replace
the filter elements and the fans as required.
The “heat tubes” will not cool below ambient. The water-cooled units
will cool below ambient temperature. These are relatively simple and
can use most process or cooling water and will not significantly raise
the temperature. These units perform very well and no water enters
the cabinet. The air-cooled units are limited to about 3,500 Btu/hr heat
loads. Water-cooled units go up to about 60,000 Btu/hr.
The lowest electrical energy cost ambient cooler after the fan is the heat
pipe — air cooled units can only cool to almost ambient temperature.
When the ambient temperature around the box is higher than the
desired inside temperature — it will not work! Water-cooled will work
very effectively.
“Since well-applied Vortex tubes cool quickly and have no moving parts, they can shut on and off as often as required to save air flow.”
— Don van Ormer, Air Power USA
| 1 0 / 1 3
26 airbestpractices.com
SUSTAINABLE MANUFACTURING FEATURES
www.n-psi.com
We recommend replacing these coolers with a Noren Model CC3060, Type 22 or equal heat
pipe with cooling water assist. The cooling water does not enter the cabinet. The Noren
CC3060 with water assist is rated to handle 9,300 Btu/hr of cooling, so it will only be 67%
loaded at 4,000 Btu/year. Comparative specifications:
HEAT PIPE/WATER ASSIST 4,000 BTU/HR FREON REFRIGERATION
Cooling capacity 9,300 Btu/hr 4,000 Btu/hr
Weight 13 lbs 98 lbs
Estimated life 10 years (+) 5 years
Duty cycle 57% 100%
Operating energy cost 35 watts 1.7 kW
Energy cost per unit (1.7 kW x $0.06 x 8,760 hrs) $894 /yr
Annual energy cost for 40 units $35,740 /yr
Energy required per heat pipe-type cabinet cooler (35 ÷ 1,000) 0.035 kW
Annual kW cost: 40 heat pipe units (.035 x 40 x $0.06 x 8,760 hrs) $735.84 /yr
Net savings ($35,740.80 - $735.84) $35,004 /yr
Estimated purchase cost (including freight and installation) $45,000
Project #3: Control Compressed Air Vortex Tube Cabinet Coolers with Thermostat-controlled Solenoid
Compressed air vortex tube cabinet coolers behave in a very predictable and controllable way.
When compressed air is released into the tube through the Vortex generator, hot air blows out
of one end of the tube and cold air out of the other.
The Vortex flow generator — an interchangeable, stationary part — regulates the volume
of compressed air, allowing the plant to alter the air flows and temperature ranges that can
be produced with the tube on some models.
Everything else equal as the inlet pressure rises, the cold air temperature drops (within
performance limits). Colder air may be delivered if the installation minimizes pressure loss to
the inlet of the Vortex tube cooler. A compressed air temperature drop up to 90 ºF is available.
Back-pressure on the cold end will reduce the ratios across the tube and raise the cold
end temperature. There is usually a relief valve in the Vortex tube cooler assembly venting
the cabinet air, not allowing back pressure to build up, and exchange hot air for cold air.
Since well-applied Vortex tubes cool quickly and have no moving parts, they can shut on and
off as often as required to save air flow.
Vortex tube coolers should always be controlled by a thermostat sensing the inside cabinet air
and an electric solenoid to shut the air on and off with the signal.
1 0 / 1 3 |
27 airbestpractices.com
SUSTAINABLE MANUFACTURING FEATURES
All the vortex coolers were not running cool
enough, probably due to low pressure and
possibly dirt or a ring seal failure. None of
the units have auto shut off controls. Add auto
shut off to all the vortex units and raise the
pressure 75 80 psi. Estimated minimum flow
savings with an auto thermostat shut off with
80 psi inlet is 72 cfm.
Total number of coolers observed
12
Total peak scfm 180 scfm
Total average current scfm
144 scfm
Total peak cfm savings 180 scfm
Total average scfm saved (minimum)
72 scfm
Cost per scfm $129.18 scfm/yr
Total savings $11,897 /yr
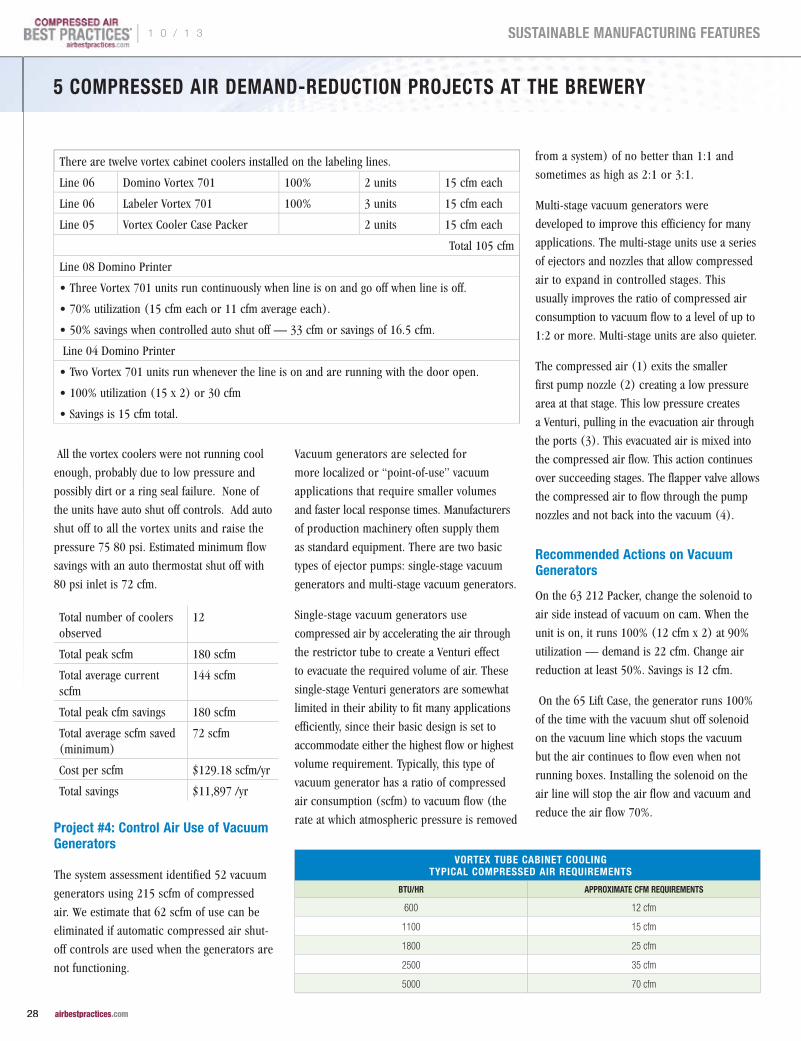
Project #4: Control Air Use of Vacuum Generators
The system assessment identified 52 vacuum
generators using 215 scfm of compressed
air. We estimate that 62 scfm of use can be
eliminated if automatic compressed air shut-
off controls are used when the generators are
not functioning.
Vacuum generators are selected for
more localized or “point-of-use” vacuum
applications that require smaller volumes
and faster local response times. Manufacturers
of production machinery often supply them
as standard equipment. There are two basic
types of ejector pumps: single-stage vacuum
generators and multi-stage vacuum generators.
Single-stage vacuum generators use
compressed air by accelerating the air through
the restrictor tube to create a Venturi effect
to evacuate the required volume of air. These
single-stage Venturi generators are somewhat
limited in their ability to fit many applications
efficiently, since their basic design is set to
accommodate either the highest flow or highest
volume requirement. Typically, this type of
vacuum generator has a ratio of compressed
air consumption (scfm) to vacuum flow (the
rate at which atmospheric pressure is removed
from a system) of no better than 1:1 and
sometimes as high as 2:1 or 3:1.
Multi-stage vacuum generators were
developed to improve this efficiency for many
applications. The multi-stage units use a series
of ejectors and nozzles that allow compressed
air to expand in controlled stages. This
usually improves the ratio of compressed air
consumption to vacuum flow to a level of up to
1:2 or more. Multi-stage units are also quieter.
The compressed air (1) exits the smaller
first pump nozzle (2) creating a low pressure
area at that stage. This low pressure creates
a Venturi, pulling in the evacuation air through
the ports (3). This evacuated air is mixed into
the compressed air flow. This action continues
over succeeding stages. The flapper valve allows
the compressed air to flow through the pump
nozzles and not back into the vacuum (4).
Recommended Actions on Vacuum Generators
On the 63 212 Packer, change the solenoid to
air side instead of vacuum on cam. When the
unit is on, it runs 100% (12 cfm x 2) at 90%
utilization — demand is 22 cfm. Change air
reduction at least 50%. Savings is 12 cfm.
On the 65 Lift Case, the generator runs 100%
of the time with the vacuum shut off solenoid
on the vacuum line which stops the vacuum
but the air continues to flow even when not
running boxes. Installing the solenoid on the
air line will stop the air flow and vacuum and
reduce the air flow 70%.
There are twelve vortex cabinet coolers installed on the labeling lines.
Line 06 Domino Vortex 701 100% 2 units 15 cfm each
Line 06 Labeler Vortex 701 100% 3 units 15 cfm each
Line 05 Vortex Cooler Case Packer 2 units 15 cfm each
Total 105 cfm
Line 08 Domino Printer
• Three Vortex 701 units run continuously when line is on and go off when line is off.
• 70% utilization (15 cfm each or 11 cfm average each).
• 50% savings when controlled auto shut off — 33 cfm or savings of 16.5 cfm.
Line 04 Domino Printer
• Two Vortex 701 units run whenever the line is on and are running with the door open.
• 100% utilization (15 x 2) or 30 cfm
• Savings is 15 cfm total.
VORTEx TUBE CABINET COOLING TyPICAL COMPRESSED AIR REQUIREMENTS
BTU/HR APPROxIMATE CFM REQUIREMENTS
600 12 cfm
1100 15 cfm
1800 25 cfm
2500 35 cfm
5000 70 cfm
5 COMPRESSED AIR DEMAND-REDUCTION PROJECTS AT THE BREWERy
| 1 0 / 1 3
28 airbestpractices.com
SUSTAINABLE MANUFACTURING FEATURES
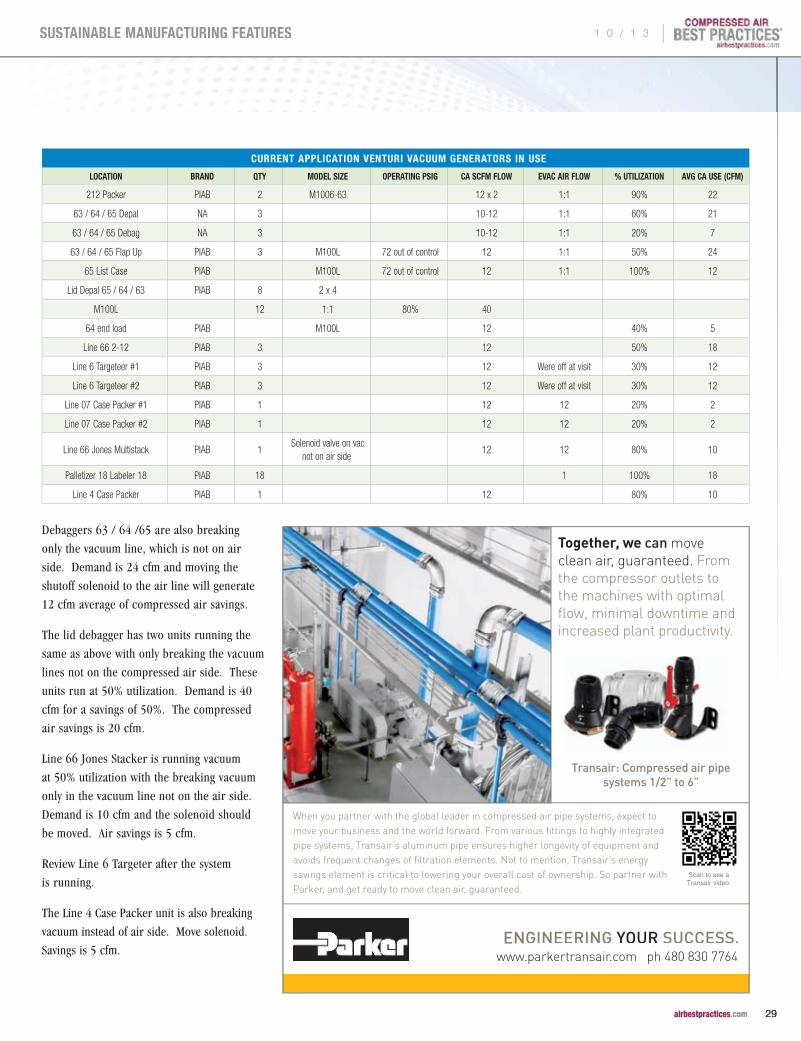
Debaggers 63 / 64 /65 are also breaking
only the vacuum line, which is not on air
side. Demand is 24 cfm and moving the
shutoff solenoid to the air line will generate
12 cfm average of compressed air savings.
The lid debagger has two units running the
same as above with only breaking the vacuum
lines not on the compressed air side. These
units run at 50% utilization. Demand is 40
cfm for a savings of 50%. The compressed
air savings is 20 cfm.
Line 66 Jones Stacker is running vacuum
at 50% utilization with the breaking vacuum
only in the vacuum line not on the air side.
Demand is 10 cfm and the solenoid should
be moved. Air savings is 5 cfm.
Review Line 6 Targeter after the system
is running.
The Line 4 Case Packer unit is also breaking
vacuum instead of air side. Move solenoid.
Savings is 5 cfm.
When you partner with the global leader in compressed air pipe systems, expect to move your business and the world forward. From various fittings to highly integrated pipe systems, Transair’s aluminum pipe ensures higher longevity of equipment and avoids frequent changes of filtration elements. Not to mention, Transair’s energy savings element is critical to lowering your overall cost of ownership. So partner with Parker, and get ready to move clean air, guaranteed.
Together, we can move clean air, guaranteed. From the compressor outlets to the machines with optimal flow, minimal downtime and increased plant productivity.
www.parkertransair.com ph 480 830 7764
Scan to see a Transair video.
Transair: Compressed air pipe systems 1/2” to 6”
CURRENT APPLICATION VENTURI VACUUM GENERATORS IN USE
LOCATION BRAND QTy MODEL SIzE OPERATING PSIG CA SCFM FLOW EVAC AIR FLOW % UTILIzATION AVG CA USE (CFM)
212 Packer PIAB 2 M1006-63 12 x 2 1:1 90% 22
63 / 64 / 65 Depal NA 3 10-12 1:1 60% 21
63 / 64 / 65 Debag NA 3 10-12 1:1 20% 7
63 / 64 / 65 Flap Up PIAB 3 M100L 72 out of control 12 1:1 50% 24
65 List Case PIAB M100L 72 out of control 12 1:1 100% 12
Lid Depal 65 / 64 / 63 PIAB 8 2 x 4
M100L 12 1:1 80% 40
64 end load PIAB M100L 12 40% 5
Line 66 2-12 PIAB 3 12 50% 18
Line 6 Targeteer #1 PIAB 3 12 Were off at visit 30% 12
Line 6 Targeteer #2 PIAB 3 12 Were off at visit 30% 12
Line 07 Case Packer #1 PIAB 1 12 12 20% 2
Line 07 Case Packer #2 PIAB 1 12 12 20% 2
Line 66 Jones Multistack PIAB 1 Solenoid valve on vac
not on air side 12 12 80% 10
Palletizer 18 Labeler 18 PIAB 18 1 100% 18
Line 4 Case Packer PIAB 1 12 80% 10
1 0 / 1 3 |
29 airbestpractices.com
SUSTAINABLE MANUFACTURING FEATURES

Subscribe at airbestpractices.com
2013 FOCUS INDUSTRIES:pp Energy: Biogas
pp Food Packaging & Containers
pp Plastic Blow Molding
pp System Assessments
pp Energy: Compressed Natural Gas
pp Pneumatic Conveying
pp Compressed Air System Automation
pp Wastewater Treatment
pp Food Processing
pp Metal Fabrication & Machining
pp Air Compressor Controls
F R E E S U B S C R I P T I O NDIGITAL EDITION FREE WORLDWIDE | PRINT EDITION FREE TO U.S. SUBSCRIBERS
Learn How To Save Energy & Improve Productivity In YOUR Industry!
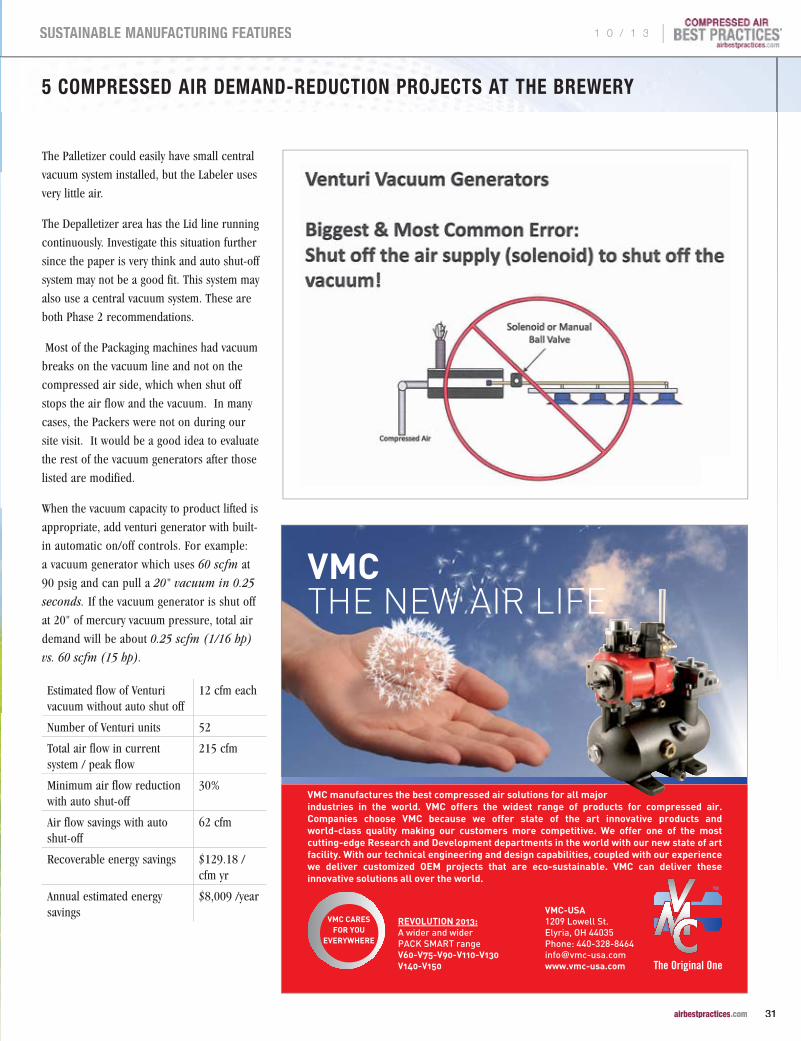
The Palletizer could easily have small central
vacuum system installed, but the Labeler uses
very little air.
The Depalletizer area has the Lid line running
continuously. Investigate this situation further
since the paper is very think and auto shut-off
system may not be a good fit. This system may
also use a central vacuum system. These are
both Phase 2 recommendations.
Most of the Packaging machines had vacuum
breaks on the vacuum line and not on the
compressed air side, which when shut off
stops the air flow and the vacuum. In many
cases, the Packers were not on during our
site visit. It would be a good idea to evaluate
the rest of the vacuum generators after those
listed are modified.
When the vacuum capacity to product lifted is
appropriate, add venturi generator with built-
in automatic on/off controls. For example:
a vacuum generator which uses 60 scfm at
90 psig and can pull a 20" vacuum in 0.25
seconds. If the vacuum generator is shut off
at 20" of mercury vacuum pressure, total air
demand will be about 0.25 scfm (1/16 hp)
vs. 60 scfm (15 hp).
Estimated flow of Venturi vacuum without auto shut off
12 cfm each
Number of Venturi units 52
Total air flow in current system / peak flow
215 cfm
Minimum air flow reduction with auto shut-off
30%
Air flow savings with auto shut-off
62 cfm
Recoverable energy savings $129.18 /cfm yr
Annual estimated energy savings
$8,009 /year
VMC manufactures the best compressed air solutions for all major industries in the world. VMC offers the widest range of products for compressed air. Companies choose VMC because we offer state of the art innovative products and world-class quality making our customers more competitive. We offer one of the most cutting-edge Research and Development departments in the world with our new state of art facility. With our technical engineering and design capabilities, coupled with our experience we deliver customized OEM projects that are eco-sustainable. VMC can deliver these innovative solutions all over the world.
REVOLUTION 2013: A wider and wider PACK SMART range V60-V75-V90-V110-V130 V140-V150
VMCTHE NEW AIR LIFE
VMC CARES FOR YOU
EVERYWHERE
VMC-USA1209 Lowell St.Elyria, OH 44035Phone: [email protected] at airbestpractices.com
2013 FOCUS INDUSTRIES:pp Energy: Biogas
pp Food Packaging & Containers
pp Plastic Blow Molding
pp System Assessments
pp Energy: Compressed Natural Gas
pp Pneumatic Conveying
pp Compressed Air System Automation
pp Wastewater Treatment
pp Food Processing
pp Metal Fabrication & Machining
pp Air Compressor Controls
F R E E S U B S C R I P T I O NDIGITAL EDITION FREE WORLDWIDE | PRINT EDITION FREE TO U.S. SUBSCRIBERS
Learn How To Save Energy & Improve Productivity In YOUR Industry!
5 COMPRESSED AIR DEMAND-REDUCTION PROJECTS AT THE BREWERy
1 0 / 1 3 |
31 airbestpractices.com
SUSTAINABLE MANUFACTURING FEATURES
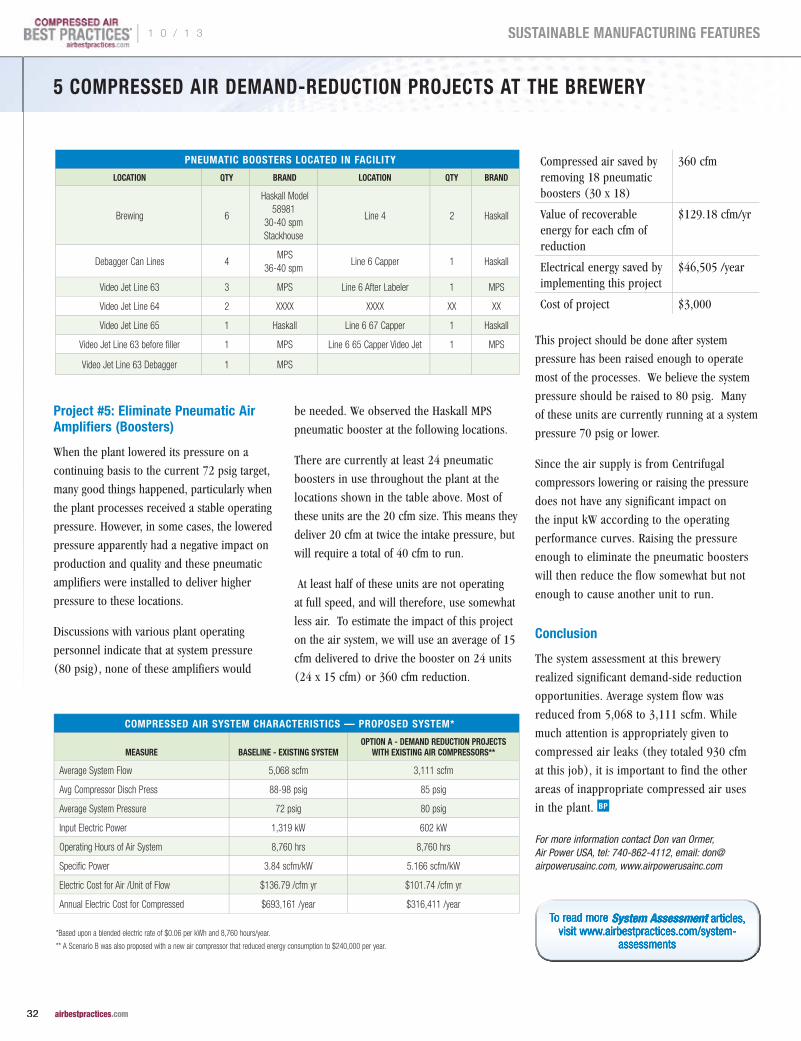
Project #5: Eliminate Pneumatic Air Amplifiers (Boosters)
When the plant lowered its pressure on a
continuing basis to the current 72 psig target,
many good things happened, particularly when
the plant processes received a stable operating
pressure. However, in some cases, the lowered
pressure apparently had a negative impact on
production and quality and these pneumatic
amplifiers were installed to deliver higher
pressure to these locations.
Discussions with various plant operating
personnel indicate that at system pressure
(80 psig), none of these amplifiers would
be needed. We observed the Haskall MPS
pneumatic booster at the following locations.
There are currently at least 24 pneumatic
boosters in use throughout the plant at the
locations shown in the table above. Most of
these units are the 20 cfm size. This means they
deliver 20 cfm at twice the intake pressure, but
will require a total of 40 cfm to run.
At least half of these units are not operating
at full speed, and will therefore, use somewhat
less air. To estimate the impact of this project
on the air system, we will use an average of 15
cfm delivered to drive the booster on 24 units
(24 x 15 cfm) or 360 cfm reduction.
Compressed air saved by removing 18 pneumatic boosters (30 x 18)
360 cfm
Value of recoverable energy for each cfm of reduction
$129.18 cfm/yr
Electrical energy saved by implementing this project
$46,505 /year
Cost of project $3,000
This project should be done after system
pressure has been raised enough to operate
most of the processes. We believe the system
pressure should be raised to 80 psig. Many
of these units are currently running at a system
pressure 70 psig or lower.
Since the air supply is from Centrifugal
compressors lowering or raising the pressure
does not have any significant impact on
the input kW according to the operating
performance curves. Raising the pressure
enough to eliminate the pneumatic boosters
will then reduce the flow somewhat but not
enough to cause another unit to run.
Conclusion
The system assessment at this brewery
realized significant demand-side reduction
opportunities. Average system flow was
reduced from 5,068 to 3,111 scfm. While
much attention is appropriately given to
compressed air leaks (they totaled 930 cfm
at this job), it is important to find the other
areas of inappropriate compressed air uses
in the plant.
For more information contact Don van Ormer, Air Power USA, tel: 740-862-4112, email: [email protected], www.airpowerusainc.com
To read more To read more To read more System AssessmentSystem AssessmentSystem Assessment articles, articles, articles, System Assessment articles, System AssessmentSystem AssessmentSystem Assessment articles, System Assessment articles, System Assessment articles, System AssessmentSystem AssessmentSystem Assessment articles, System Assessmentvisit www.airbestpractices.com/system-visit www.airbestpractices.com/system-visit www.airbestpractices.com/system-
assessmentsassessmentsassessments
COMPRESSED AIR SySTEM CHARACTERISTICS — PROPOSED SySTEM*
MEASURE BASELINE - ExISTING SySTEMOPTION A - DEMAND REDUCTION PROJECTS
WITH ExISTING AIR COMPRESSORS**
Average System Flow 5,068 scfm 3,111 scfm
Avg Compressor Disch Press 88-98 psig 85 psig
Average System Pressure 72 psig 80 psig
Input Electric Power 1,319 kW 602 kW
Operating Hours of Air System 8,760 hrs 8,760 hrs
Specific Power 3.84 scfm/kW 5.166 scfm/kW
Electric Cost for Air /Unit of Flow $136.79 /cfm yr $101.74 /cfm yr
Annual Electric Cost for Compressed $693,161 /year $316,411 /year
*Based upon a blended electric rate of $0.06 per kWh and 8,760 hours/year.
** A Scenario B was also proposed with a new air compressor that reduced energy consumption to $240,000 per year.
PNEUMATIC BOOSTERS LOCATED IN FACILITy
LOCATION QTy BRAND LOCATION QTy BRAND
Brewing 6
Haskall Model 58981
30-40 spm Stackhouse
Line 4 2 Haskall
Debagger Can Lines 4 MPS
36-40 spm Line 6 Capper 1 Haskall
Video Jet Line 63 3 MPS Line 6 After Labeler 1 MPS
Video Jet Line 64 2 XXXX XXXX XX XX
Video Jet Line 65 1 Haskall Line 6 67 Capper 1 Haskall
Video Jet Line 63 before filler 1 MPS Line 6 65 Capper Video Jet 1 MPS
Video Jet Line 63 Debagger 1 MPS
5 COMPRESSED AIR DEMAND-REDUCTION PROJECTS AT THE BREWERy
| 1 0 / 1 3
32 airbestpractices.com
SUSTAINABLE MANUFACTURING FEATURES

©2013 FPSA
When you make the effort to travel to a show, you’re looking for concentrated information from suppliers to your industry.
Food ProcessingSuppliers Association
NOVEMBER 3 - 6
2013 | CHICAGO
McCormick Place
South Hall/North Hall
REGISTER NOWwww.myprocessexpo.com
No other North American show can match PROCESS EXPO’s fixed focus on food & beverage processing and packaging.
You’ll see over 500 industry-focused exhibitors − including top equipment manufacturers. Learn from industry and academic experts in timely, educational sessions. Watch solutions at work on the show floor.
Food & beverage solutions. Straight up.
Food & Beverage.Full-Strength.
FPSA_Best Air Practices.Jul13.indd 1 5/17/13 11:43 AM
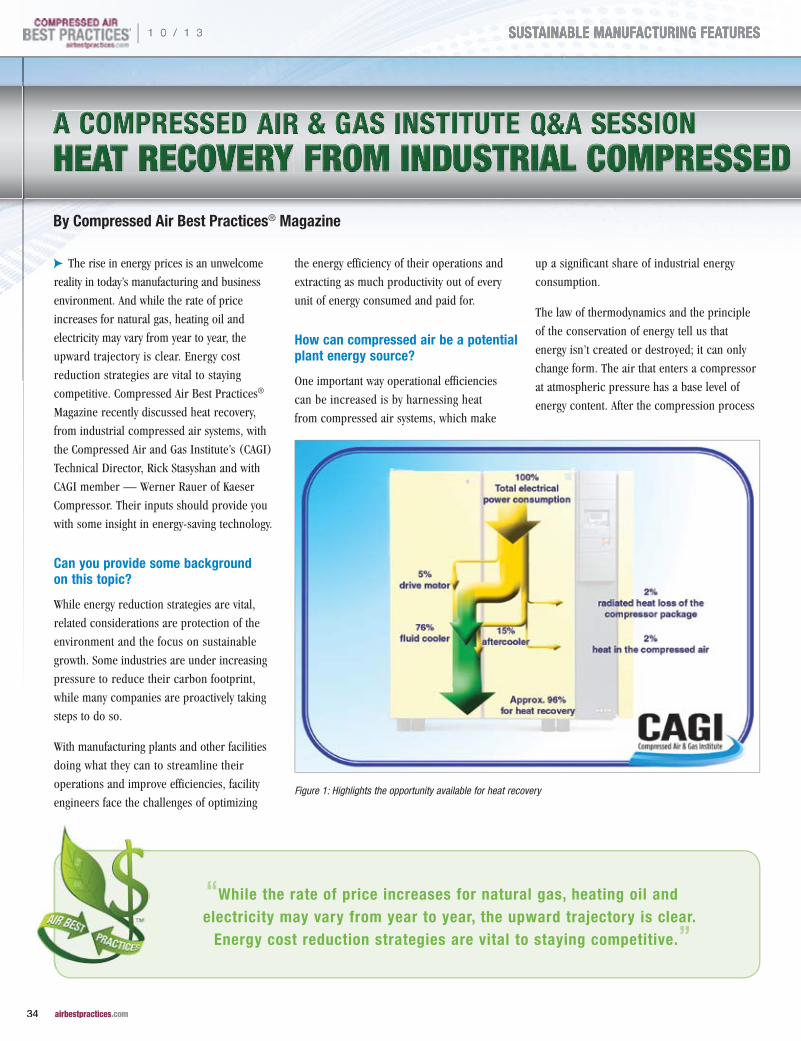
By Compressed Air Best Practices® Magazine
A COMPRESSED AIR & GAS INSTITUTE Q&A SESSION HEAT RECOVERY FROM INDuSTRIAl COMPRESSED AIR SYSTEMSA COMPRESSED & GAS NSTITUTE Q&A SESSION
ECOVERY FROM uSTRIAl COMPRESSEDA COMPRESSED AIR & GAS INSTITUTE Q&A SESSIONHEAT REAT REAT ECOVERY FROM INDuSTRIAl COMPRESSED A
c The rise in energy prices is an unwelcome
reality in today’s manufacturing and business
environment. And while the rate of price
increases for natural gas, heating oil and
electricity may vary from year to year, the
upward trajectory is clear. Energy cost
reduction strategies are vital to staying
competitive. Compressed Air Best Practices®
Magazine recently discussed heat recovery,
from industrial compressed air systems, with
the Compressed Air and Gas Institute’s (CAGI)
Technical Director, Rick Stasyshan and with
CAGI member — Werner Rauer of Kaeser
Compressor. Their inputs should provide you
with some insight in energy-saving technology.
Can you provide some background on this topic?
While energy reduction strategies are vital,
related considerations are protection of the
environment and the focus on sustainable
growth. Some industries are under increasing
pressure to reduce their carbon footprint,
while many companies are proactively taking
steps to do so.
With manufacturing plants and other facilities
doing what they can to streamline their
operations and improve efficiencies, facility
engineers face the challenges of optimizing
the energy efficiency of their operations and
extracting as much productivity out of every
unit of energy consumed and paid for.
How can compressed air be a potential plant energy source?
One important way operational efficiencies
can be increased is by harnessing heat
from compressed air systems, which make
up a significant share of industrial energy
consumption.
The law of thermodynamics and the principle
of the conservation of energy tell us that
energy isn’t created or destroyed; it can only
change form. The air that enters a compressor
at atmospheric pressure has a base level of
energy content. After the compression process
Figure 1: Highlights the opportunity available for heat recovery
“While the rate of price increases for natural gas, heating oil and electricity may vary from year to year, the upward trajectory is clear.
Energy cost reduction strategies are vital to staying competitive.”
| 1 0 / 1 3
34 airbestpractices.com
SUSTAINABLE MANUFACTURING FEATURESSUSTAINABLE MANUFACTURING FEATURES
increases the air pressure and raises its
temperature, the energy becomes available for
transfer. The heat must be removed to maintain
proper compressor operating temperatures
and to cool the compressed air to make
it suitable for plant use.
The heat generated by compressed air systems
can be a very good source of energy savings.
In fact, nearly all (96%) of the electrical
energy used by an industrial air compressor
is converted into heat. The balance remains
in the compressed air or radiates from the
compressor into the immediate surroundings.
(Figure 1)
Too often, that heat is simply ejected into the
ambient environment through the compressor
cooling system. But here’s the good news:
Nearly all this thermal energy can be recovered
and put to useful work and significantly lower
a facility’s energy costs.
Can you give our readers some examples on how to use this energy source?
Some uses of recovered energy from
compressed air systems:
p Supplemental space heating
p Makeup air heating
p Boiler makeup water preheating
p Industrial process heating
p Water heating for showers, bathrooms, etc.
p Heating process fluids
p Heating food and beverage products
p Heat-driven chillers
With the popularity of rotary screw air compressors, is this an opportunity?
One of the more common pieces of
equipment found in manufacturing plants
is the air-cooled, lubricated rotary screw air
compressor. The amount of heat recovered
using these systems will vary if the compressor
has a variable load. But in general, very good
results will be achieved when the primary air
compressor package is an oil-injected rotary
screw type design.
Oil-less rotary screw compressors are also well
suited for heat recovery activities. As with other
compressor systems, the input electrical energy
is converted into heat. Because they operate at
CRP Oil/Water Separators that Work100% of the time on 100% of compressor lubricants
Clean Resources • www.cleanresources.com • 800-566-0402
No Maintenance
Guaranteed to reduce effluent to less than 10 ppm
EPA Compliant
100% of the time on 100% of compressor lubricants
www.cleanresources.com
Separators that Work100% of the time on 100% of compressor lubricants
• 800-566-0402 www.cleanresources.com
100% of the time on 100% of compressor lubricants
www.cleanresources.com
increases the air pressure and raises its
temperature, the energy becomes available for temperature, the energy becomes available for
transfer. The heat must be removed to maintain
proper compressor operating temperatures
and to cool the compressed air to make
it suitable for plant use.
The heat generated by compressed air systems
p Heating food and beverage productsproducts
p Heat-driven chillers
With the popularity of rotary screw air compressors, is this an opportunity? results will be achieved when the primary air
compressor package is an oil-injected rotary
A COMPRESSED AIR & GAS INSTITUTE Q&A SESSION HEAT RECOVERY FROM INDuSTRIAl COMPRESSED AIR SYSTEMS SYSTEMS AIR SYSTEMS
®
1 0 / 1 3 |
35 airbestpractices.com
SUSTAINABLE MANUFACTURING FEATURESSUSTAINABLE MANUFACTURING FEATURES
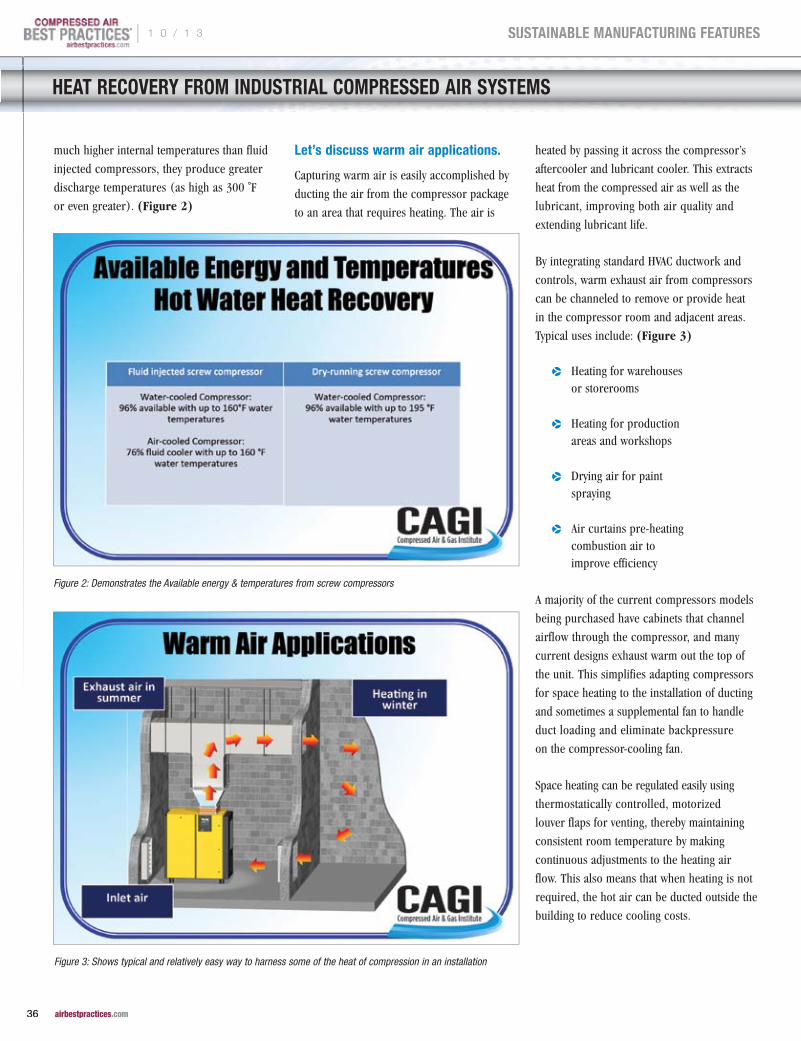
HEAT RECOVERy FROM INDUSTRIAL COMPRESSED AIR SySTEMS
much higher internal temperatures than fluid
injected compressors, they produce greater
discharge temperatures (as high as 300 ˚F
or even greater). (Figure 2)
Let’s discuss warm air applications.
Capturing warm air is easily accomplished by
ducting the air from the compressor package
to an area that requires heating. The air is
heated by passing it across the compressor’s
aftercooler and lubricant cooler. This extracts
heat from the compressed air as well as the
lubricant, improving both air quality and
extending lubricant life.
By integrating standard HVAC ductwork and
controls, warm exhaust air from compressors
can be channeled to remove or provide heat
in the compressor room and adjacent areas.
Typical uses include: (Figure 3)
p Heating for warehouses or storerooms
p Heating for production areas and workshops
p Drying air for paint spraying
p Air curtains pre-heating combustion air to improve efficiency
A majority of the current compressors models
being purchased have cabinets that channel
airflow through the compressor, and many
current designs exhaust warm out the top of
the unit. This simplifies adapting compressors
for space heating to the installation of ducting
and sometimes a supplemental fan to handle
duct loading and eliminate backpressure
on the compressor-cooling fan.
Space heating can be regulated easily using
thermostatically controlled, motorized
louver flaps for venting, thereby maintaining
consistent room temperature by making
continuous adjustments to the heating air
flow. This also means that when heating is not
required, the hot air can be ducted outside the
building to reduce cooling costs.
Figure 2: Demonstrates the Available energy & temperatures from screw compressors
Figure 3: Shows typical and relatively easy way to harness some of the heat of compression in an installation
| 1 0 / 1 3
36 airbestpractices.com
SUSTAINABLE MANUFACTURING FEATURES

Can you expand on some of the other opportunities using heat of compression?
Water/Fluid Heating The key to heat recovery effectiveness
with water-cooled compressors is attaining
a “thermal match” between the heat being
recovered and the heat that is needed on
a regular (hourly) basis.
Plate heat exchangers offer a cost-effective
way to capture heat from the rotary screw
compressor and utilize it to heat water for
diverse processes such as electroplating,
chemical processing and laundry services.
Fail-safe heat exchangers provide
additional protection against contamination
of process water or fluids by the compressor
cooling fluid. This makes them more suitable
for heating applications in the food and
pharmaceutical industry sectors — as well
as for heating potable water.
Some compressor manufacturers offer built-
in heat recovery heat exchangers as options.
In some cases, they are fully integrated inside
the compressor cabinet and require very little
onsite engineering.
Beyond the energy savings, what are some of the other benefits and potential paybacks?
Most process applications in production
facilities can benefit from heat recovery from
compressed air systems throughout the year,
not just during the cold-weather months.
In most space heating applications heat is
required during three seasons. And during
the warmer months, removing the heat of
compression will make the compressor
room temperatures much more comfortable.
TRACE AnalyticsLLC ™the Aircheck Labthe Aircheck Lab
www.AirCheckLab.com 800-247-1024
Trace Analytics, LLC is an A2LA Accredited Laboratory Established in 1989
Compressed Air Quality TestingParticles, Water, Oil,
the Int’l Standard for Compressed Air – ISO 8573-1:2010,the updated BCAS Best Practice Guideline, and
SQF Air Purityfor the Food & Beverage Industry
for
and
Microbiological ContaminantsAsk us about
Figure 4: Shows ROI payback in a typical screw compressor installation
1 0 / 1 3 |
37 airbestpractices.com
SUSTAINABLE MANUFACTURING FEATURES
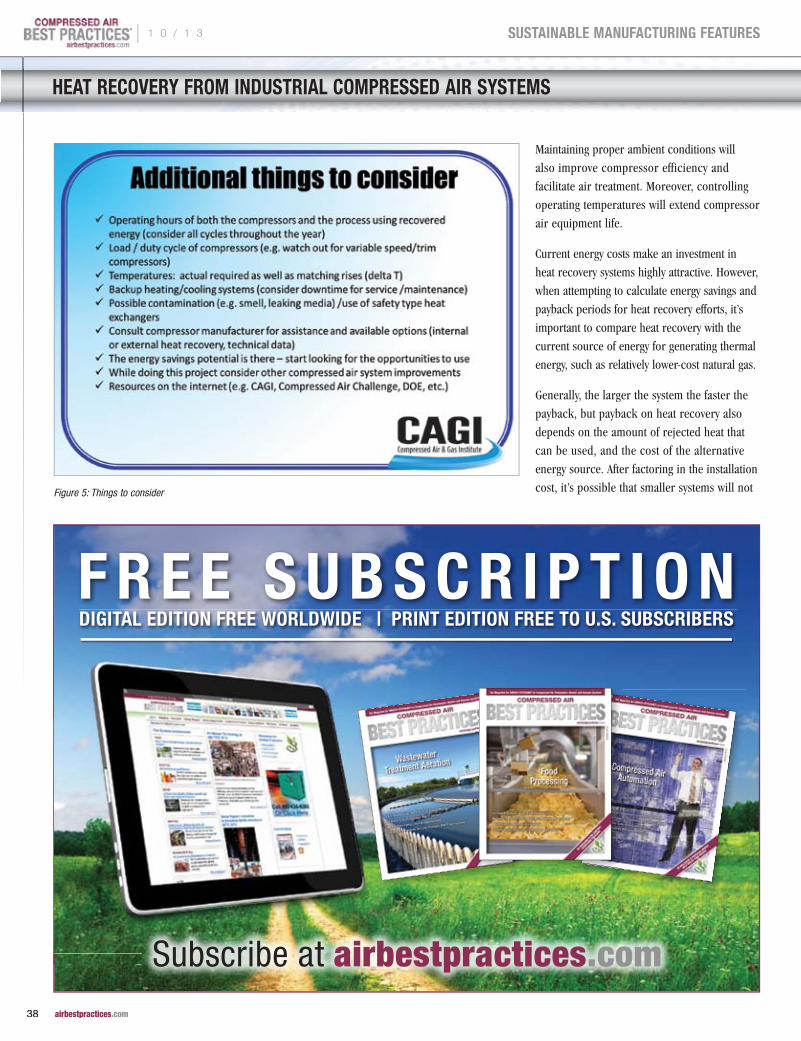
Maintaining proper ambient conditions will
also improve compressor efficiency and
facilitate air treatment. Moreover, controlling
operating temperatures will extend compressor
air equipment life.
Current energy costs make an investment in
heat recovery systems highly attractive. However,
when attempting to calculate energy savings and
payback periods for heat recovery efforts, it’s
important to compare heat recovery with the
current source of energy for generating thermal
energy, such as relatively lower-cost natural gas.
Generally, the larger the system the faster the
payback, but payback on heat recovery also
depends on the amount of rejected heat that
can be used, and the cost of the alternative
energy source. After factoring in the installation
cost, it’s possible that smaller systems will not Figure 5: Things to consider
HEAT RECOVERy FROM INDUSTRIAL COMPRESSED AIR SySTEMS
F R E E S U B S C R I P T I O NDIGITAL EDITION FREE WORLDWIDE | PRINT EDITION FREE TO U.S. SUBSCRIBERS
Subscribe at airbestpractices.com
| 1 0 / 1 3
38 airbestpractices.com
SUSTAINABLE MANUFACTURING FEATURES
provide enough recoverable BTUs of energy to
make the investment worthwhile. (Figure 4)
Rejected heat can also be used to heat water
or other process fluids. It can be done with
either air-cooled or water-cooled compressors,
although the best efficiencies are usually
obtained from water-cooled compressor
installations where discharge cooling water
is connected directly to a continuous process
heating application such as a heating boiler’s
return circuit for year-round energy savings.
Naturally, higher energy savings will be realized
when the alternative-heating source is an older,
less efficient technology. Investing in newer,
more efficient equipment may be more cost
effective. Many heaters are now operating
at ~85% efficiency or better, and thus
compressor heat recovery activities will result
in relatively less annual energy savings.
Beyond energy savings, an important argument
can also be made that heat recovery activities
benefit the environment. After all, substantial
energy savings also mean a reduction in the
carbon footprint of a plant. As energy policies
and regulations continue to evolve in the United
States and other countries, these considerations
are only expected to become more important.
Can you give our readers some points to think about when considering this topic?
Figure 5 highlights additional things to
consider for your application. A compressed
air system audit by a trained and qualified
compressor system expert will assist
you in determining the best options and
opportunities available for your facility.
For more information, visit the CAGI web site at www.cagi.org
The best of both worlds in one compact, side by side, combination package. The ACOC(H) cools rotary screw compressor oil and compressed air in a single combined core. Ideal for conversions, stringent space requirements and remote location mounting.
Our highest performing aftercooler, the AHP(H) is built from high-performance plate & bar aluminum construction. Energy effi cient and durable with fl exible mounting in horizontal or vertical confi gurations.
OIL COOLER
AIR AFTERCOOLER
AIR FLOW
AFTERCOOLERAFTERCOOLER
AIR FLOW
BELT GUARD AFTERCOOLER
HORIZONTAL AIR FLOWS
ACOC(H) Oil/AirCombination
AFTERCOOLERAFTERCOOLER
The BGA is built from bar & plate brazed aluminum construction, allowing the use of free air fl ow from the belt guard on reciprocating compressors. No fan motor required via mounting to compressor belt guard.
BGA New Brazed Aluminum Version AHP(H) Air
Aftercooler
5215 21st Street ▪ Racine, WI 53406-5096(262) 554-8330 ▪ [email protected]
Compressor AftercoolersCompressor AftercoolersSERIES
COMPRESSORNew Models Ready from Stock!
The Compressed Air & Gas Institute (CAGI) is an association of manufacturers
of compressed air system equipment: compressors, blowers, air drying and filtration,
and pneumatic tools. Links to member websites are provided on the CAGI site. The
members’ representatives are readily available to assist users in recommending the proper
equipment to meet your compressed air needs. CAGI’s mission is to be the united voice
of the compressed air industry, serving as the unbiased authority on technical, educational,
promotional, and other matters that affect the compressed air and gas industry.
For more detailed information about VSD technology applications, compressed air system
audits or answers to any of your compressed air questions, please contact the Compressed
Air and Gas Institute. The Compressed Air and Gas Institute is the united voice of the
compressed air industry, serving as the unbiased authority on technical, educational,
promotional, and other matters that affect compressed air and gas equipment suppliers
and their customers. CAGI educational resources include e-learning coursework on the
SmartSite, selection guides, videos and the Compressed Air & Gas Handbook. For more
information, visit the CAGI web site at www.cagi.org
For more For more For more CAGICAGICAGI articles, visit articles, visit articles, visit CAGI articles, visit CAGICAGICAGI articles, visit CAGI articles, visit CAGI articles, visit CAGICAGICAGI articles, visit CAGIwww.airbestpractices.com/standards/iso-cagiwww.airbestpractices.com/standards/iso-cagiwww.airbestpractices.com/standards/iso-cagi
1 0 / 1 3 |
39 airbestpractices.com
SUSTAINABLE MANUFACTURING FEATURES
c Compressed air audits are valuable
exercises on significant energy users in a plant.
Often done on main compressed air systems,
these studies are also valuable on secondary
systems, like dedicated low pressure circuits
that feed production machinery. An audit
of such a system turned up some surprising
results on a process that was initially thought
to be very efficient.
A common accessory to flexible packaging
printing machines is an electrically powered
nozzle system utilizing heated low pressure
(30 psi) compressed air. The hot pressurized
air is precisely directed through a compact
arrangement of nozzles at a web of just printed
material which causes the ink to dry quickly.
This operation not only speeds up the printer
throughput, but requires substantially less
supply and exhaust air volumes over standard
natural gas fan powered drying systems.
Reported energy savings for this type of drying
system is in the order of 25 to 50% over the
gas type. These dryers require a supply of
clean and dry 30 psi air from an external
source. One such source is low pressure
lubricant free screw compressors.
On request by the customer, as part of basic
customer service, the local power utility,
Manitoba Hydro, undertook an analysis
of one of these drying systems which was
installed at a large Winnipeg based plastics
product manufacturer. The dryer was supplied
compressed air from a dedicated 150 HP
air-cooled lubricant-free single-stage screw
compressor capable of producing 1050 cfm
of continuous 2.5 bar (38 psi) compressed air.
Initial spot check readings were taken on the
air compressor which was operating in load/
unload mode. The hour meters on the local
control showed the compressor had been
running 51,500 hours, yet showed the unit was
loaded only 9,400 hours of the total. In all, the
compressor duty cycle calculated to only 18%
over the life of the unit. Power measurements
showed the compressor consumed 128kW
fully loaded and 84 kW unloaded. A check
of the manufacturer’s specifications for this
unit showed something was wrong, the loaded
kW reading was higher than normal and
the unloaded kW was much higher than the
expected 20 to 30% of full load.
Hour meter readings and kW measurements
can be very important indicators of
compressed air system efficiency issues. In this
case, it would appear that internal compressor
problems and a mismatch in compressor
capacity may be greatly reducing the overall
efficiency of the system. Fully loaded this
compressor could produce a flow of 38 psi
compressed air at a specific power of 11.2 kW
per 100 cfm. The unit was actually consuming
power at a rate of 34.5 kW per 100 cfm, even
higher than an efficient compressed air system
would run at 125 psi. The initial readings
showed that about 75% of the compressor’s
total power was consumed when the unit was
unloaded and producing no air.
Data loggers were placed on the system
and a load profile was developed (Chart 1).
During the data logging the compressor was
repaired which immediately reduced the power
consumption in both the loaded and unloaded
AuDIT OF lOw PRESSuRE DRYER SAVES ENERGY
By Ron Marshall for the Compressed Air Challenge®
| 1 0 / 1 3
40 airbestpractices.com
SUSTAINABLE MANUFACTURING FEATURESSUSTAINABLE MANUFACTURING FEATURES
HEAD-IN-THE-SAND COMPRESSED AIR MONITORING POLICY?
NOT WITH US.
TRANSMITTER FOR MEASURING COMPRESSED AIR CONSUMPTION AND MONITORING DEWPOINTOnly by closely monitoring compressed air can operating costs be reduced and availability ensured. E+E Elektronik‘s thermal mass flow meters provide an accurate means of measuring consumption throughout compressed air networks. A dewpoint sensor can also be installed in the same ball valve for quality control purposes. www.epluse.com
Unbenannt-1 1 05.09.2013 16:13:16
Learn the Basics of Compressed Air Analysis
Join Compressed Air Challenge for the next session of
Fundamentals of Compressed Air Systems WE
(web-edition) coming in November of 2013. Led by our
experienced instructors, this web-based version of the popular
Fundamentals of Compressed Air Systems training uses
an interactive format that enables the instructor to diagram
examples, give pop quizzes and answer student questions
in real time. Participation is limited to 25 students. Please
visit www.compressedairchallenge.org, to access online
registration and for more information about the training.
If you have additional questions about the new web-based
training or other CAC training opportunities, please contact
the CAC at [email protected]
Fundamentals of Compressed Air Systems WE (web-edition)
1 0 / 1 3 |
41 airbestpractices.com
SUSTAINABLE MANUFACTURING FEATURESSUSTAINABLE MANUFACTURING FEATURES
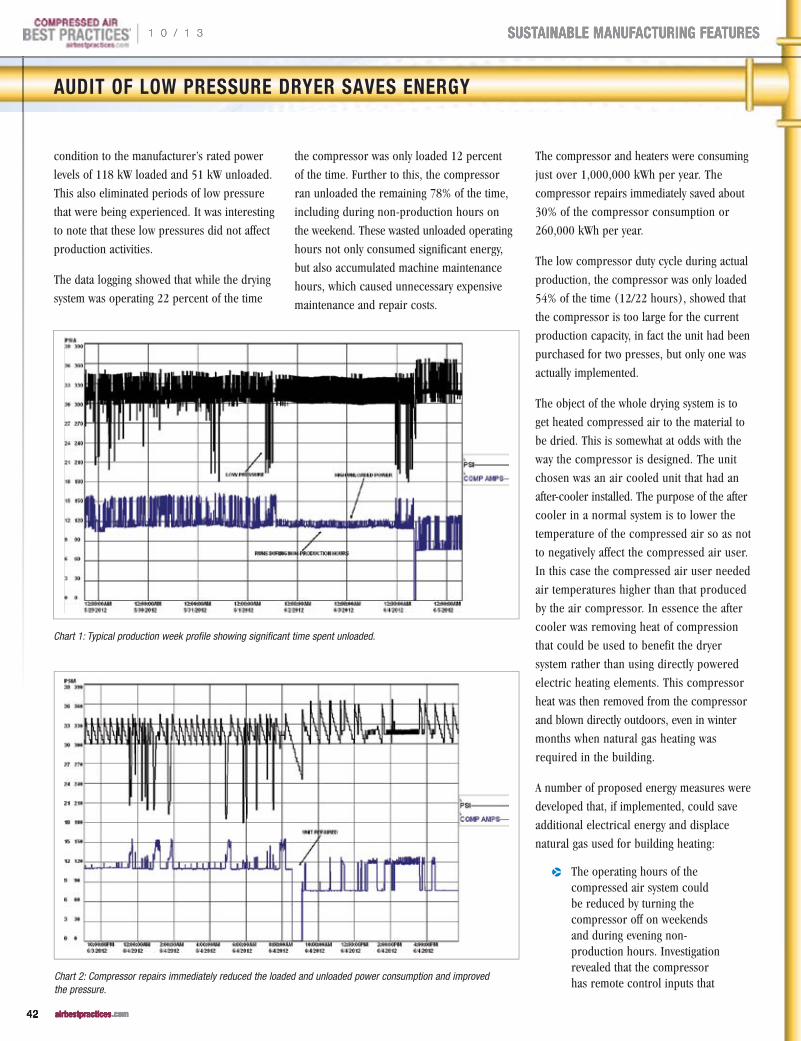
AUDIT OF LOW PRESSURE DRyER SAVES ENERGy
condition to the manufacturer’s rated power
levels of 118 kW loaded and 51 kW unloaded.
This also eliminated periods of low pressure
that were being experienced. It was interesting
to note that these low pressures did not affect
production activities.
The data logging showed that while the drying
system was operating 22 percent of the time
the compressor was only loaded 12 percent
of the time. Further to this, the compressor
ran unloaded the remaining 78% of the time,
including during non-production hours on
the weekend. These wasted unloaded operating
hours not only consumed significant energy,
but also accumulated machine maintenance
hours, which caused unnecessary expensive
maintenance and repair costs.
The compressor and heaters were consuming
just over 1,000,000 kWh per year. The
compressor repairs immediately saved about
30% of the compressor consumption or
260,000 kWh per year.
The low compressor duty cycle during actual
production, the compressor was only loaded
54% of the time (12/22 hours), showed that
the compressor is too large for the current
production capacity, in fact the unit had been
purchased for two presses, but only one was
actually implemented.
The object of the whole drying system is to
get heated compressed air to the material to
be dried. This is somewhat at odds with the
way the compressor is designed. The unit
chosen was an air cooled unit that had an
after-cooler installed. The purpose of the after
cooler in a normal system is to lower the
temperature of the compressed air so as not
to negatively affect the compressed air user.
In this case the compressed air user needed
air temperatures higher than that produced
by the air compressor. In essence the after
cooler was removing heat of compression
that could be used to benefit the dryer
system rather than using directly powered
electric heating elements. This compressor
heat was then removed from the compressor
and blown directly outdoors, even in winter
months when natural gas heating was
required in the building.
A number of proposed energy measures were
developed that, if implemented, could save
additional electrical energy and displace
natural gas used for building heating:
p The operating hours of the compressed air system could be reduced by turning the compressor off on weekends and during evening non-production hours. Investigation revealed that the compressor has remote control inputs that
Chart 1: Typical production week profile showing significant time spent unloaded.
Chart 2: Compressor repairs immediately reduced the loaded and unloaded power consumption and improved the pressure.
| 1 0 / 1 3
42 airbestpractices.com
SUSTAINABLE MANUFACTURING FEATURES
FABTECH represents every step of the metal manufacturing process from start to fi nish. It’s where new ideas, products and technology are highlighted through interactive exhibits, education and networking. Compare solutions from 1,500+ exhibitors, find machine tools to improve quality and productivity, and learn ways to increase profi t. REGISTER NOW for the show with a degree of difference.
November 18–21, 2013 | Chicago, IL | fabtechexpo.com
North America’s Largest Metal Forming,Fabricating, Welding and Finishing Event
A 360º VIEW OF THE MOST INNOVATIVE TECHNOLOGY AND PROCESSES. FABTECH 2013.
METAL FORMING | FABRICATING | WELDING | FINISHING
Cosponsors:
Scan code to watch video.
Follow us:
FABTECH2013_360Ad_SME-FullPg.indd 1 3/6/13 10:51 AM
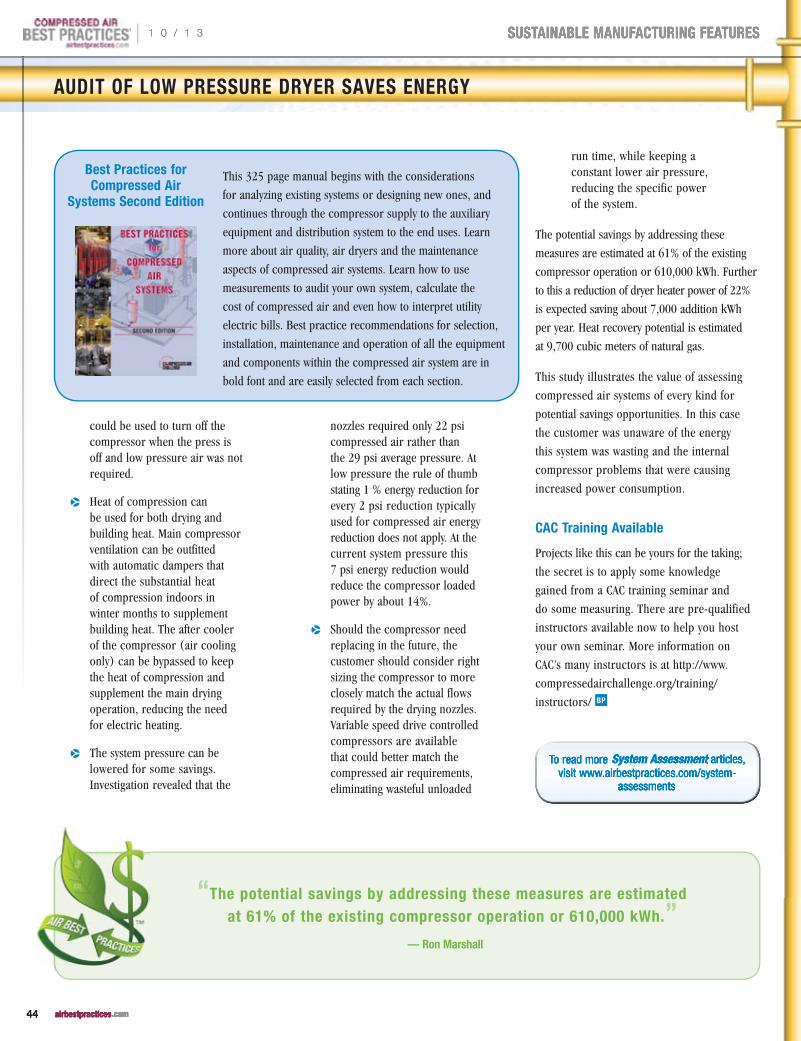
AUDIT OF LOW PRESSURE DRyER SAVES ENERGy
could be used to turn off the compressor when the press is off and low pressure air was not required.
p Heat of compression can be used for both drying and building heat. Main compressor ventilation can be outfitted with automatic dampers that direct the substantial heat of compression indoors in winter months to supplement building heat. The after cooler of the compressor (air cooling only) can be bypassed to keep the heat of compression and supplement the main drying operation, reducing the need for electric heating.
p The system pressure can be lowered for some savings. Investigation revealed that the
nozzles required only 22 psi compressed air rather than the 29 psi average pressure. At low pressure the rule of thumb stating 1 % energy reduction for every 2 psi reduction typically used for compressed air energy reduction does not apply. At the current system pressure this 7 psi energy reduction would reduce the compressor loaded power by about 14%.
p Should the compressor need replacing in the future, the customer should consider right sizing the compressor to more closely match the actual flows required by the drying nozzles. Variable speed drive controlled compressors are available that could better match the compressed air requirements, eliminating wasteful unloaded
run time, while keeping a constant lower air pressure, reducing the specific power of the system.
The potential savings by addressing these
measures are estimated at 61% of the existing
compressor operation or 610,000 kWh. Further
to this a reduction of dryer heater power of 22%
is expected saving about 7,000 addition kWh
per year. Heat recovery potential is estimated
at 9,700 cubic meters of natural gas.
This study illustrates the value of assessing
compressed air systems of every kind for
potential savings opportunities. In this case
the customer was unaware of the energy
this system was wasting and the internal
compressor problems that were causing
increased power consumption.
CAC Training Available
Projects like this can be yours for the taking;
the secret is to apply some knowledge
gained from a CAC training seminar and
do some measuring. There are pre-qualified
instructors available now to help you host
your own seminar. More information on
CAC’s many instructors is at http://www.
compressedairchallenge.org/training/
instructors/
This 325 page manual begins with the considerations
for analyzing existing systems or designing new ones, and
continues through the compressor supply to the auxiliary
equipment and distribution system to the end uses. Learn
more about air quality, air dryers and the maintenance
aspects of compressed air systems. Learn how to use
measurements to audit your own system, calculate the
cost of compressed air and even how to interpret utility
electric bills. Best practice recommendations for selection,
installation, maintenance and operation of all the equipment
and components within the compressed air system are in
bold font and are easily selected from each section.
Best Practices for Compressed Air
Systems Second Edition
To read more To read more To read more System AssessmentSystem AssessmentSystem Assessment articles, articles, articles, System Assessment articles, System AssessmentSystem AssessmentSystem Assessment articles, System Assessment articles, System Assessment articles, System AssessmentSystem AssessmentSystem Assessment articles, System Assessmentvisit www.airbestpractices.com/system-visit www.airbestpractices.com/system-visit www.airbestpractices.com/system-
assessmentsassessmentsassessments
“The potential savings by addressing these measures are estimated at 61% of the existing compressor operation or 610,000 kWh.”
— Ron Marshall
| 1 0 / 1 3
44 airbestpractices.com
SUSTAINABLE MANUFACTURING FEATURES
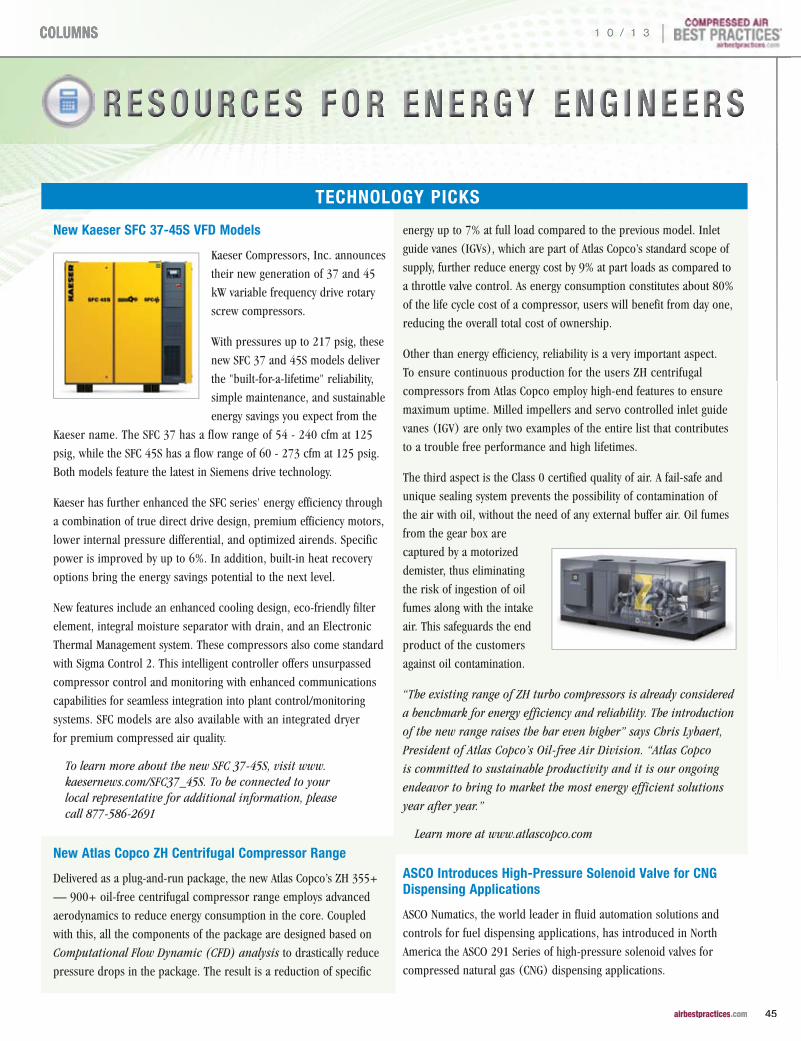
R e s o uR e s o uR e s o u RRR c e s f oc e s f oc e s f o RRR eee n en en e RRR g y g y g y eee n g i n e en g i n e en g i n e e RRR sss
TECHNOLOGy PICKS
New Kaeser SFC 37-45S VFD Models
Kaeser Compressors, Inc. announces
their new generation of 37 and 45
kW variable frequency drive rotary
screw compressors.
With pressures up to 217 psig, these
new SFC 37 and 45S models deliver
the "built-for-a-lifetime" reliability,
simple maintenance, and sustainable
energy savings you expect from the
Kaeser name. The SFC 37 has a flow range of 54 - 240 cfm at 125
psig, while the SFC 45S has a flow range of 60 - 273 cfm at 125 psig.
Both models feature the latest in Siemens drive technology.
Kaeser has further enhanced the SFC series' energy efficiency through
a combination of true direct drive design, premium efficiency motors,
lower internal pressure differential, and optimized airends. Specific
power is improved by up to 6%. In addition, built-in heat recovery
options bring the energy savings potential to the next level.
New features include an enhanced cooling design, eco-friendly filter
element, integral moisture separator with drain, and an Electronic
Thermal Management system. These compressors also come standard
with Sigma Control 2. This intelligent controller offers unsurpassed
compressor control and monitoring with enhanced communications
capabilities for seamless integration into plant control/monitoring
systems. SFC models are also available with an integrated dryer
for premium compressed air quality.
To learn more about the new SFC 37-45S, visit www.kaesernews.com/SFC37_45S. To be connected to your local representative for additional information, please call 877-586-2691
New Atlas Copco zH Centrifugal Compressor Range
Delivered as a plug-and-run package, the new Atlas Copco’s ZH 355+
— 900+ oil-free centrifugal compressor range employs advanced
aerodynamics to reduce energy consumption in the core. Coupled
with this, all the components of the package are designed based on
Computational Flow Dynamic (CFD) analysis to drastically reduce
pressure drops in the package. The result is a reduction of specific
energy up to 7% at full load compared to the previous model. Inlet
guide vanes (IGVs), which are part of Atlas Copco’s standard scope of
supply, further reduce energy cost by 9% at part loads as compared to
a throttle valve control. As energy consumption constitutes about 80%
of the life cycle cost of a compressor, users will benefit from day one,
reducing the overall total cost of ownership.
Other than energy efficiency, reliability is a very important aspect.
To ensure continuous production for the users ZH centrifugal
compressors from Atlas Copco employ high-end features to ensure
maximum uptime. Milled impellers and servo controlled inlet guide
vanes (IGV) are only two examples of the entire list that contributes
to a trouble free performance and high lifetimes.
The third aspect is the Class 0 certified quality of air. A fail-safe and
unique sealing system prevents the possibility of contamination of
the air with oil, without the need of any external buffer air. Oil fumes
from the gear box are
captured by a motorized
demister, thus eliminating
the risk of ingestion of oil
fumes along with the intake
air. This safeguards the end
product of the customers
against oil contamination.
“The existing range of ZH turbo compressors is already considered
a benchmark for energy efficiency and reliability. The introduction
of the new range raises the bar even higher” says Chris Lybaert,
President of Atlas Copco’s Oil-free Air Division. “Atlas Copco
is committed to sustainable productivity and it is our ongoing
endeavor to bring to market the most energy efficient solutions
year after year.”
Learn more at www.atlascopco.com
ASCO Introduces High-Pressure Solenoid Valve for CNG Dispensing Applications
ASCO Numatics, the world leader in fluid automation solutions and
controls for fuel dispensing applications, has introduced in North
America the ASCO 291 Series of high-pressure solenoid valves for
compressed natural gas (CNG) dispensing applications.
1 0 / 1 3 |
45 45 airbestpracticesairbestpractices.com.com
Columns
TECHNOLOGy PICKS
RESOURCES FOR ENERGy ENGINEERS
“As CNG becomes a popular
fuel in commercial fleets
and personal vehicles, the
demand for fueling stations is
expected to rise dramatically,”
said Robert W. Kemple, Jr.,
executive vice president, sales
and marketing — Americas,
ASCO Numatics. “The Series 291
valve is specifically designed for CNG dispensing equipment in North
America. Few valves on the market have the high flow and pressure
ratings, plus the low power consumption, that are critical to design
engineers at CNG station packagers and dispensing manufacturers.”
Solenoid valves play a key role controlling CNG flow in dispensing
equipment. The 291 Series’ rugged construction and unique internal
design are tailored to meet the industry’s unique requirements for
solenoid valves. It safely withstands pressures of over 5,000 psi,
provides superior flow rates, and consumes only 12 watts of power.
“Dispensing equipment manufacturers will benefit from our CNG valve
line’s small size, great fit, and low power consumption, plus the high
quality that only ASCO can provide,” said Kemple. “Station packagers
will value our high flow rate that permits faster vehicle fueling and
exceptional reliability that reduces maintenance and down time.”
The 291 Series valves are offered in three pipe sizes — 3/8 inch,
1/2 inch, and 1 inch — plus three-station and six-station manifold
versions.
Customers can access Emerson ASCO’s worldwide technical and
application support through its distributors, field sales representatives,
and the company’s technical support center via phone and the Web.
The ASCO 291 Series CNG valves can be ordered from ASCO distributors or directly from the company in the U.S., Canada, and Mexico. For more information, contact ASCO at 800-972-ASCO, by e-mail at [email protected], or visit http://www.ascovalve.com/CNG
PowerScout 3 Plus Meter Receives BTL Acceptance
DENT Instruments, a global leader in the design and manufacture
of power and energy measurement instruments, announces that the
PowerScout 3 Plus Power Meter has been certified by independent
testing labs to have met or exceeded equipment interoperability
guidelines of one of the industry’s leading standards agencies, BACnet
Testing Laboratory (BTL).
“We recognize that the BTL mark is becoming an increasingly
common requirement,” says Christopher Dent, President of DENT
Instruments. “We are very excited to announce that the PowerScout 3
Plus has passed rigorous BTL testing. Our customers in the building
automation market, including system integrators, can be confident
that the PowerScout 3 Plus is fully interoperable
with third-party BACnet devices.”
Ideal for new construction or building
recommissioning, the PowerScout 3 Plus
instruments are dependable single-point
submeters for precise energy measurement.
Paired with flexible and easy-to-mount RoCoil
CTs or traditional split-core style CTs, the DENT
PowerScout provides accurate and cost-effective
energy measurement for a wide range of building
submetering projects.
DENT Instruments is a leading supplier of an
array of precision measurement instrumentation
and analytical software in the field of energy
management.
www.dentinstruments.com
Festo VTOC Valve Manifold for Semiconductor Industry
Festo said today its high density/small footprint VTOC pilot gas valve
manifold delivers the ideal solution for space-limited semiconductor
gas box applications. The VTOC valve manifold can be ordered in
wide range of configurations from 2 to 24 valve positions, giving
OEMs the flexibility to order a manifold best suited to available gas
box real estate.
These manifolds are designed for 2 x 3/2 valves, enabling a compact
24 valve position manifold to accommodate up to 48 solenoid coils.
Valve airflow is 10 normal liters (NI)/minute. An online configuration
tool helps OEMs quickly select the best option for the gas box
application. All units are tested and ready to install on delivery.
VTOC options include: configurable manifold rails (pneumatic and
electric connections), multi-pin plug connection with sub-D plug
| 1 0 / 1 3
46 airbestpractices.com
Columns
TECHNOLOGy PICKS
or flat ribbon cable, valve with
non-detenting manual override,
and choices of pneumatic
outlets — push-in connectors,
straight, or angled. Also optional
are individual contacts for each
coil — separate commons
— and diodes to ensure the
current is in only one direction.
This can be used to increase
safety in user circuits.
“The VTOC was designed for the OEM looking for a valve manifold
with the highest density and smallest footprint possible,” said
Frank Latino, product manager, valve terminals and electronics,
Festo. “The VTOC does that and more through ease of ordering,
wide choice of options, and ready to install tested units. It is an
excellent example of the type of innovations Festo is delivering
to the semiconductor industry.”
Read about the VTOC and see the online configurator. For additional sales information, call Festo at 800-993-3786 and visit www.festo.com/us
Klüber Lubrication Promotes Food Industry Products
Klüber Lubrication, a worldwide manufacturer of specialty lubricants,
will display its latest NSF H1-registered lubricants for the packaging
and processing industry at PACK EXPO, Sept. 23-25 at the Las
Vegas Convention Center. Klüber will exhibit at booth S7046 and
have representatives available to discuss the company’s products,
services and expertise with PACK EXPO attendees. Products from
Klüber provide efficient solutions for increasing productivity in
extreme applications, such as ovens, freezers and high friction points
in conveyors, proofers and palletizers. Klüber will showcase the
following products and services at PACK EXPO:
The ALLPLEX FMG Series of greases are multi-purpose, NSF
H1 registered products for the food processing, beverage and
pharmaceutical industries. ALLPLEX is specifically designed for
use in applications where incidental food contact is possible.
The special additive package provides for excellent anti-wear and
extreme pressure protection from corrosion. Equipment in wash-
down environments benefits from the aluminum complex thickener
system, which provides excellent water resistance in addition to a
broad temperature range. ALLPLEX is available in multiple standard
packaging options from drums to cartridges, and can be used as
a single point lubricator. Klüber has also included ALLPLEX with its
innovative Klübermatic system, a single point lubricator option that
improves process efficiencies, as well as safety in the workplace.
Klüberfood NH1 CH 2-220 is the premier oil for lubricating high-
temperature chains in both baking and beverage can manufacturing
applications. This fully synthetic, ester-based lubricant can operate at
extreme temperatures for longer periods of time and without residue
build-up, all while protecting chain components from increased
wear. Users benefit from dramatically reduced consumption, cleaner
operations, reduced noise and no smoking when applying oil. The
can manufacturing environment presents significant challenges for
proper lubrication of chains, including high temperatures, high and
low speeds, potential ingredient contamination, increasing wear and
more. Klüberfood NH1 CH 2-220 is an NSF H1-registered lubricant
that not only keeps food safe from incidental contact, but solves each
of the aforementioned challenges as well.
Spraying Systems
Klüber Lubrication, in collaboration with Spraying Systems Co.,
tested and qualified a solution for pin-chain applications for beverage
can manufacturing. The combination of the AccuJet® Electrostatic
Lube System with Klüberfood NH1 CH 2-220 provides complete
and optimum lubrication of DECO oven pin-chains. As a result,
users reduce oil consumption, increase chain life and, due to the
elimination of oil mist, create a safer work environment for operators
while decreasing chances of contamination.
Klüberfood NK1 Z 8-001 Spray is a cleaner and de-greasing spray
for the food-processing and pharmaceutical industries. This spray
has been formulated to aid in the rapid and thorough removal of oils,
greases, waxes and resin residues. Klüberfood NK1 Z 8-001 Spray
is an organic solvent
cleaning agent that
is registered NSF K1
and K3, which helps
promote safety in non-
food processing areas.
Visit www.klubersolutions.com
1 0 / 1 3 |
47 airbestpractices.com
Columns
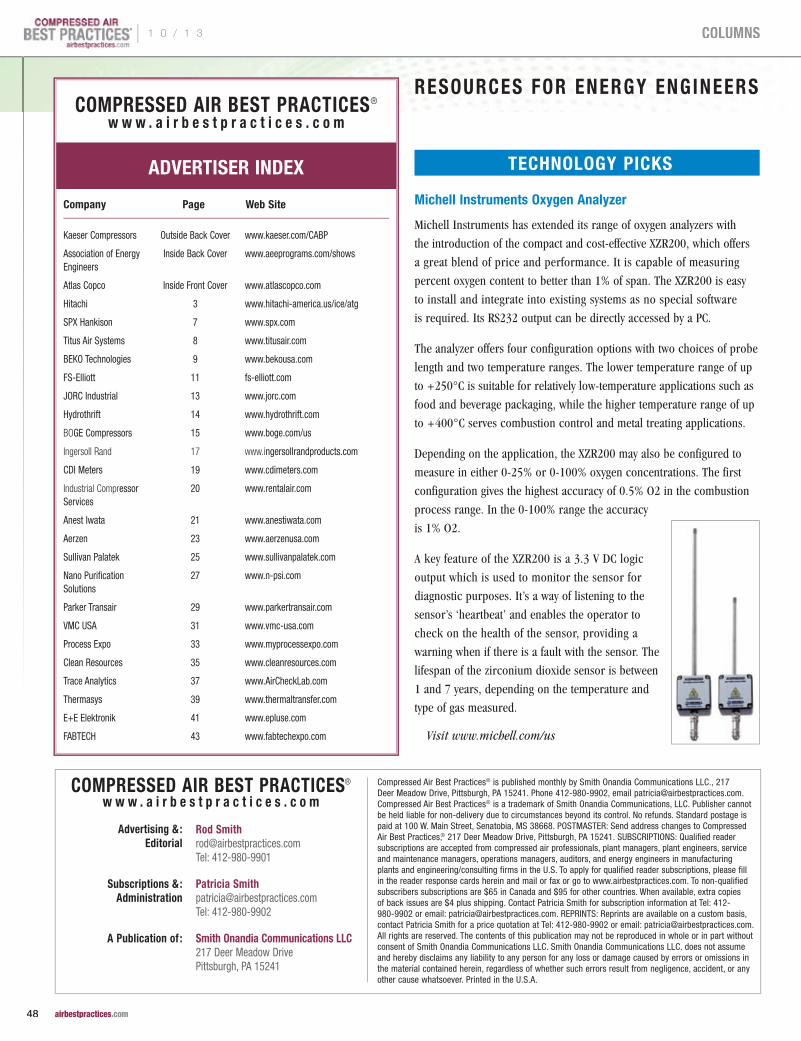
Michell Instruments Oxygen Analyzer
Michell Instruments has extended its range of oxygen analyzers with
the introduction of the compact and cost-effective XZR200, which offers
a great blend of price and performance. It is capable of measuring
percent oxygen content to better than 1% of span. The XZR200 is easy
to install and integrate into existing systems as no special software
is required. Its RS232 output can be directly accessed by a PC.
The analyzer offers four configuration options with two choices of probe
length and two temperature ranges. The lower temperature range of up
to +250°C is suitable for relatively low-temperature applications such as
food and beverage packaging, while the higher temperature range of up
to +400°C serves combustion control and metal treating applications.
Depending on the application, the XZR200 may also be configured to
measure in either 0-25% or 0-100% oxygen concentrations. The first
configuration gives the highest accuracy of 0.5% O2 in the combustion
process range. In the 0-100% range the accuracy
is 1% O2.
A key feature of the XZR200 is a 3.3 V DC logic
output which is used to monitor the sensor for
diagnostic purposes. It’s a way of listening to the
sensor’s ‘heartbeat’ and enables the operator to
check on the health of the sensor, providing a
warning when if there is a fault with the sensor. The
lifespan of the zirconium dioxide sensor is between
1 and 7 years, depending on the temperature and
type of gas measured.
Visit www.michell.com/us
RESOURCES FOR ENERGy ENGINEERS
TECHNOLOGy PICKS
COMPRESSED AIR BEST PRACTICES®
w w w . a i r b e s t p r a c t i c e s . c o m
ADVERTISER INDEx
Company Page Web Site
Kaeser Compressors Outside Back Cover www.kaeser.com/CABP
Association of Energy Engineers
Inside Back Cover www.aeeprograms.com/shows
Atlas Copco Inside Front Cover www.atlascopco.com
Hitachi 3 www.hitachi-america.us/ice/atg
SPX Hankison 7 www.spx.com
Titus Air Systems 8 www.titusair.com
BEKO Technologies 9 www.bekousa.com
FS-Elliott 11 fs-elliott.com
JORC Industrial 13 www.jorc.com
Hydrothrift 14 www.hydrothrift.com
BOGE Compressors 15 www.boge.com/us
Ingersoll Rand 17 www.ingersollrandproducts.com
CDI Meters 19 www.cdimeters.com
Industrial Compressor Services
20 www.rentalair.com
Anest Iwata 21 www.anestiwata.com
Aerzen 23 www.aerzenusa.com
Sullivan Palatek 25 www.sullivanpalatek.com
Nano Purification Solutions
27 www.n-psi.com
Parker Transair 29 www.parkertransair.com
VMC USA 31 www.vmc-usa.com
Process Expo 33 www.myprocessexpo.com
Clean Resources 35 www.cleanresources.com
Trace Analytics 37 www.AirCheckLab.com
Thermasys 39 www.thermaltransfer.com
E+E Elektronik 41 www.epluse.com
FABTECH 43 www.fabtechexpo.com
Compressed Air Best Practices® is published monthly by Smith Onandia Communications LLC., 217 Deer Meadow Drive, Pittsburgh, PA 15241. Phone 412-980-9902, email [email protected]. Compressed Air Best Practices® is a trademark of Smith Onandia Communications, LLC. Publisher cannot be held liable for non-delivery due to circumstances beyond its control. No refunds. Standard postage is paid at 100 W. Main Street, Senatobia, MS 38668. POSTMASTER: Send address changes to Compressed Air Best Practices,® 217 Deer Meadow Drive, Pittsburgh, PA 15241. SUBSCRIPTIONS: Qualified reader subscriptions are accepted from compressed air professionals, plant managers, plant engineers, service and maintenance managers, operations managers, auditors, and energy engineers in manufacturing plants and engineering/consulting firms in the U.S. To apply for qualified reader subscriptions, please fill in the reader response cards herein and mail or fax or go to www.airbestpractices.com. To non-qualified subscribers subscriptions are $65 in Canada and $95 for other countries. When available, extra copies of back issues are $4 plus shipping. Contact Patricia Smith for subscription information at Tel: 412-980-9902 or email: [email protected]. REPRINTS: Reprints are available on a custom basis, contact Patricia Smith for a price quotation at Tel: 412-980-9902 or email: [email protected]. All rights are reserved. The contents of this publication may not be reproduced in whole or in part without consent of Smith Onandia Communications LLC. Smith Onandia Communications LLC. does not assume and hereby disclaims any liability to any person for any loss or damage caused by errors or omissions in the material contained herein, regardless of whether such errors result from negligence, accident, or any other cause whatsoever. Printed in the U.S.A.
COMPRESSED AIR BEST PRACTICES® w w w . a i r b e s t p r a c t i c e s . c o m
Advertising & : Editorial
Rod Smith [email protected] Tel: 412-980-9901
Subscriptions & : Administration
Patricia Smith [email protected] Tel: 412-980-9902
A Publication of : Smith Onandia Communications LLC 217 Deer Meadow Drive Pittsburgh, PA 15241
| 1 0 / 1 3
48 airbestpractices.com
Columns
T H E M A R K E T P L A C ET H E M A R K E T P L A C ET H E M A R K E T P L A C EJOBS
TECHNOLOGy
Sales EngineersApplication EngineersProduct Managers
MANN+HUMMEL
Our construction, agriculture, heavy duty and compressor business is quickly growing. If you are a Professional Sales, Application, or Product Manager, and are interested in joining our MANN+HUMMEL team please visit our website and apply today!
MANN+HUMMEL USA, Inc.6400 South Sprinkle Road Portage, MI 49002
www.Mann-Hummel.com
Contact Rod Smith for ad rates: [email protected], Tel: 412-980-9901
Service SaleS conSultantJacksonville & orlando Florida
Air Centers of Florida— serving North & Central Florida’s compressed air needs since 1987.
We are looking for an energetic, experienced sales professional that will be responsible for meeting revenue goals by selling air compressor products and aftermarket services using technical, organizational, and customer knowledge to influence and assist them in applying products and services to meet their needs.
We offer a comprehensive benefits package including medical, dental, 401k, disability, life insurance, paid time off, holiday pay and more!
Email: [email protected] or visit us online for an application at www.AirCentersofFlorida.com
air Dryer ProDuct engineer skF elgin, illinois
The SKF air dryer product line covers applications for on-highway, off-highway and industrial use and is a practical, reliable, cost effective dryer system that insures quality compressed air – free of oil, contaminants, and water. The air dryer is a desiccant type that offers competitive advantages in performance, serviceability and return on investment. The Product Engineer will be responsible for new product design; creating products specification and manage revisions; testing and analysis of product performance; and supporting sales with product proposals and other customer requirements.
BSME preferred. 5+ years pneumatic product engineering experience within compressed air systems. Proficient with 3D modeling, Pro E preferred. Ability to travel 15%.
Applications may be made to SKF USA Inc., at [email protected]. www.skf.com
Air Technologies,® one of the world’s largest independent compressor distributors and service centers, has immediate openings throughout the Midwest for the following positions:
Sales EngineersAftermarket Sales EngineersService ManagersService Technicians
We offer an outstanding benefits package including superior compensation, a 401K plan and wonderful opportunities for advancement. Join a winning team at Air Technologies®! Please send your resume to [email protected] or fax to 614-414-4044.
www.aircompressors.com EOE/M/F/D/V
Modular Piping for Compressed Air, Nitrogen and Vacuum
Heavy-Duty 100% Aluminum Pipe & Fittings
Master Distributors
Midwest: www.pneutechproducts.com East Coast: www.titusco.com
Seeking Master Distributors in Uncovered Regions in the Americas
Contact Paolo Nardi: [email protected], www.teseoair.com
RESOURCES FOR ENERGy ENGINEERS
1 0 / 1 3 |
49 airbestpractices.com
Columns
T H E M A R K E T P L A C ET H E M A R K E T P L A C ET H E M A R K E T P L A C E
Rebuild all brands, makes, models of Air Ends, Blowers
and Gear Boxes
Sample of The PROS Company work.
Before & After
The PROS Company 601 Texas Avenue
Lubbock, Texas 79401 806-749-7761 (PRO1) www.thePROSco.com
• Dealdirectwiththemanufacturer
• ASMEcertified• Internalliners&externalfinishes
• Inventoryofpopularsizes
• Shipsfromourcentrallocation
1-800-925-0011www.TIGGtanks.com
TECHNOLOGy
IPAC
The IPAC Advantage• Compact• Heavy Duty Industrial
Grade Construction• Rigid and Durable Air
in/out Connections• Flex Connections Unnecessary• Available TEFC Motors• Low Energy Cost• Meets All OSHA Requirements
Product Options• Air Motors With Mufflers• Low Ambient
Control Packages• Special Coatings
(i.e. Corrosion Resistant)• Alternate Materials-
Tube, Fin, or Housing• Custom Designs Available
Air Cooled AfterCoolers
"Your Compressed Air Treatment Specialists" E-Mail: [email protected]
IPAC, INC.155 Pineview Dr. Amherst, New York 14228
1-800-388-3211 | www.ipacinc.com
www.n-psi.comExperience. Customer. Service... n-psi
“We are quickly moving away from our current vendor to make nano our primary supplier.”
– A system integrator in the Northeast
High efficiency compressor controllersControl Rotary Screw, Vane, Scroll or Recip Compressors
Save Energy controlling up to FOUR compressors and qualify for Utility Rebates.
• Automatic Lead/Lag Control-up to FOUR Compressors
Accurate Pressure Control with Pressure Transducers
Compressors and Vacuum Pumps from 1 to 250 hp
Thousands of Installations Worldwide. Call for Application Engineering.
Standard Pneumatic Products, Inc. Tel: 203-270-1400 • Toll free: 800-979-9156 Email: [email protected]
www.stdpneumatics.com
| 1 0 / 1 3
50 airbestpractices.com
Columns

www.aeeprograms.com/shows 770.447.5083
2014 ENERGY SHOWS ATLANTIC CITY, NJ • SEATTLE WA
WASHINGTON, DC
April 9-10, 2014Atlantic City Convention Center Atlantic City, New Jerseywww.globalconevent.com
June 25-26, 2014Washington State Convention Center, Seattle, Washingtonwww.energyevent.com
Energy Management Congress
32ndWEST COAST
October 1-2, 2014 Washington Convention CenterWashington, DCwww.energycongress.com
Globalcon, presented by the Association of Energy Engineers, is designed specifically to help energy managers, facility managers, VP’s of operations, building owners, property managers, energy engineers and directors of utilities get up to speed on the latest developments in the energy field, explore promising new technologies, compare energy supply options, engage energy management initiatives and learn about innovative and cost-conscious project implementation strategies.
The West Coast Energy Management Congress, is the largest energy conference & technology expo held on the U.S. West Coast specifically for business, industrial and institutional energy users. It brings together the top experts in all areas of the field to help you set a clear, optimum path to energy savings and retrofit strategies.
Now in its 37th year, the World Energy Engineering Congress, is recognized as the most important energy event of national scope for end users in all areas of the energy field. A comprehensive forum where you can assess the “big picture” and see exactly how the economic and market forces, new technologies, regulatory developments & industry trends all merge. Concurrent programs include GreenStreet and FemWorks (Federal Energy Management Workshops).
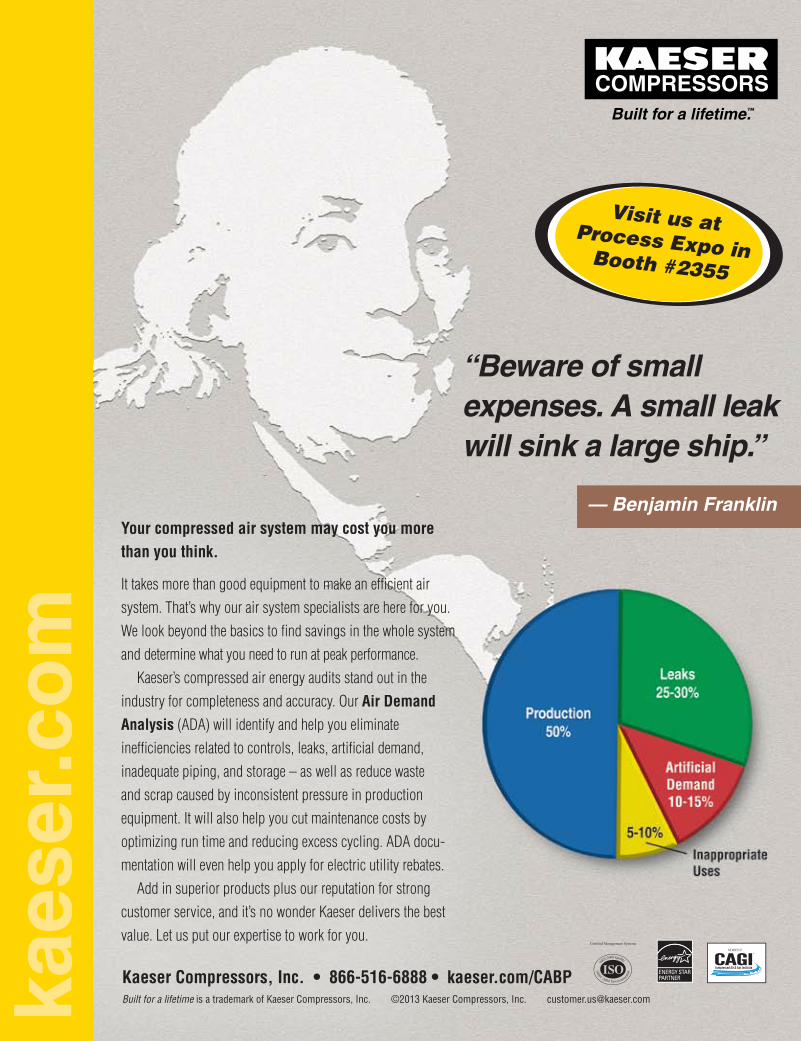
kaes
er.c
om
“Beware of small expenses. A small leak will sink a large ship.”
Your compressed air system may cost you more than you think.
It takes more than good equipment to make an effi cient air system. That’s why our air system specialists are here for you. We look beyond the basics to fi nd savings in the whole system and determine what you need to run at peak performance.
Kaeser’s compressed air energy audits stand out in the industry for completeness and accuracy. Our Air Demand Analysis (ADA) will identify and help you eliminate ineffi ciencies related to controls, leaks, artifi cial demand, inadequate piping, and storage – as well as reduce waste and scrap caused by inconsistent pressure in production equipment. It will also help you cut maintenance costs by optimizing run time and reducing excess cycling. ADA docu-mentation will even help you apply for electric utility rebates.
Add in superior products plus our reputation for strong customer service, and it’s no wonder Kaeser delivers the best value. Let us put our expertise to work for you.
— Benjamin Franklin
Kaeser Compressors, Inc. • 866-516-6888 • kaeser.com/CABPBuilt for a lifetime is a trademark of Kaeser Compressors, Inc. ©2013 Kaeser Compressors, Inc. [email protected]
Visit us atProcess Expo in Booth #2355