flower strips increase the control of rosy apple aphids after
TRANSCRIPT
Flower strips increase the control of rosy apple aphids after parasitoid releases
in an apple orchard
Tougeron K. 1,2*, Ferrais L. 1*, Gardin P. 1, Lateur M. 3 & Hance T. 1
1Earth and Life Institute, Ecology and Biodiversity, Université catholique de Louvain, croix-du-Sud 4-5, 1348 Louvain-la-Neuve,
Belgium 2UMR CNRS 7058 EDYSAN, Université de Picardie Jules Verne, 33 rue St Leu, 80000 Amiens, France 3Centre Wallon de Recherches Agronomiques (CRA-W), Research Unit Plant Biodiversity & Breeding, rue de Liroux 4, 5030
Gembloux, Belgium
*co-first authors
Contact author: Louise Ferrais, [email protected]
ORCIDs: Kévin Tougeron (0000-0003-4897-3787); Thierry Hance (0000-0001-5569-5020); Marc Lateur
(0000-0003-1565-5029)
Abstract
Mass releases of two parasitoid species, Aphidius matricariae and Ephedrus cerasicola, may provide an
alternative measure to pesticides to control the rosy apple aphid Dysaphis plantaginea in organic apple
orchards. As a proof of concept study, we tested if the presence of flower strips between apple tree rows
could improve the action of three early parasitoid releases—and of other naturally present aphid enemies—
on the control of aphid colonies and number of aphids per tree. Apple trees located at different distances
from parasitoid release points were monitored in plots with and without flower strips in an organic apple
orchard over two years, along the season of aphid infestation (March to July). Our case study demonstrated
that the presence of flowering plant mixes in the alleyways of an apple orchard improved the biological
control of D. plantaginea, with an effect size of 33.4% less aphids in plots with flower strips, compared to
plots without flower strips, at the infestation peak date. We also showed a negative effect of higher distance
to parasitoid release points on aphid control, but our results at the infestation peak date suggest that the
presence of flowers could marginally compensate for the detrimental effect of distance, probably by
improving the persistence and dispersal capacities of natural enemies. Despite high variations in aphid
population dynamics between years, we conclude that combining flower strips with early parasitoid releases
in apple orchards is promising for biological control of the rosy apple aphid, although the method merits to
be further refined and repeated in more orchards.
Key-words: Dysaphis plantaginea; organic apple growing; conservation biological pest control; natural
enemies; temperature; distance
1. Introduction
Biodiversity has been degraded in most cropping systems, as a direct consequence of farm intensification,
use of pesticides, urbanization combined with climate change, and destruction of semi-natural areas such as
hedges or meadows (Kleijn et al., 2009). Yet, there is a tight relationship between biodiversity and the
ecosystem services it provides, particularly disease regulation, pollination of crops, and biological control
of pests (Fiedler et al., 2008; Philpott, 2013; van Lenteren et al., 2018). For example, reduction in diversity
of non-cultivated plants over the past decades (Wesche et al., 2012) has had a noteworthy impact on
arthropod communities and food-webs within cropped areas. It has sometimes led to an increase in
abundance of herbivorous agricultural pests, concomitant with a reduction in the abundance and diversity
of predators and parasitoids, consequently altering the biological control service (Meehan et al., 2011;
Scherber, 2015), although overall evidence of this point remains incomplete. Interestingly, abundance,
species richness and functional diversity of crop pests and natural enemies can be manipulated by habitat
management (Landis et al., 2000; Philpott, 2013).
Habitat management programs in conservation biological control are attempting to counterbalance the
general trend and to determine which factors are maximizing the efficiency of biocontrol at different time
and spatial scales (Mkenda et al., 2019). Conservation biological control strategies often aim at enhancing
indigenous plant diversity and habitat complexity near crops to improve pest regulation by natural enemies
(Landis et al., 2000; Perović et al., 2015; Tscharntke et al., 2005). In particular, grassy margin and flowering
strips within or around crops have been shown to support diverse natural enemy communities by facilitating
colonization and movement among and within crops through their role as corridors and reservoirs, and by
enhancing survival and persistence through the provision of alternative resources and thermal shelters
(Albrecht et al., 2020; Balmer et al., 2013; Damien et al., 2017; Wratten et al., 2002). For example, Tschumi
et al., (2016) showed that tailored flower strips are effective measures to promote hoverflies, lacewings and
ladybirds, and to enhance aphid control in nearby potato crops.
In temperate areas, apple production represents an important part of fruit crops and contributes for up to
19% of the cultivated area in fruits in the European Union, but still relies on a heavy use of pesticides to
control different kinds of pests (FAO, 2018; Simon et al., 2011). Rising concern on health- and environment-
damaging risks, and public growing demand for organic food production have encouraged the emergence
of new cultivation methods. Development of Integrated pest management (IPM) and organic approaches
have been undertaken since the 1970’s in an attempt to limit the use of pesticides and make apple production
more sustainable (Blommers, 1994; Cross et al., 2015; Heijne et al., 2015; Reganold et al., 2001). One
approach to attain this goal has been the use of companion flowering plants, sown between tree rows or at
close proximity, to increase the abundance and diversity and retain natural enemies of orchard pests, in
addition to improving pollination (Campbell et al., 2017; Santos et al., 2018). In a pan-European study,
Cahenzli et al., (2019) demonstrated that the implementation of perennial flower strips between apple tree
rows allowed to boost natural enemies and to reduce key apple pests and the associated fruit damages,
showing that such strategies can be applied over large scales.
In commercial apple orchards, one of the major insect pests is the rosy apple aphid Dysaphis plantaginea
(Hemiptera: Aphidinae), causing leaf-rolling and fruit deformation (Wilkaniec, 1993), and significant yield
losses when uncontrolled (Dib et al., 2010). A set of predatory arthropods, including minute pirate bugs,
aphid midges, hoverflies, ladybugs and spiders, as well as parasitic wasps, can be found in orchards and can
help reducing populations of the rosy apple aphid (Bribosia et al., 2005; Cross et al., 2015; Dib et al., 2012;
Miñarro et al., 2005; Peusens et al., 2006). All these natural enemies of the rosy apple aphid may benefit
from sustainable management and implementation of flower strips in orchards (Bostanian et al., 2004;
Campbell et al., 2017; Dib et al., 2012) that are adapted to the location (latitude), and to the target season,
to take into consideration plant phenology (Cahenzli et al., 2019; Sigsgaard et al., 2013). However, one
major issue is that D. plantaginea is active very early in orchards and damages apple trees starting early
spring, when most aphidophagous species are not present at sufficient densities to control aphid populations
(Brown and Mathews, 2007; Dib et al., 2010). Therefore, augmentative releases of beneficial insects in early
spring have been proposed to complement the impact of the naturally occurring natural enemies of aphids
(Dib et al., 2016; Kehrli and Wyss, 2001). The aim is to target aphid fundatrix, the wingless aphids hatching
from overwintering eggs, because they are relatively few in number, but at the starting point of an
exponential and massive parthenogenetic reproduction in early spring, which will be damaging trees (Ferrais
et al., 2021).
A cocktail of two solitary parasitoid species, Aphidius matricariae and Ephedrus cerasicola (Hymenoptera:
Braconidae), was developed in previous projects to control D. plantaginea in apple orchards (Boivin et al.,
2012; Dumont et al., 2011; Ferrais et al., 2021; Nicolas et al., 2013). Parasitoid cocktails are used in
inundative biological control strategies in several crop systems, because each species can complement the
others on their host spectrum, on activity timing, and on behavioral and physiological specificities (Boivin
et al., 2012). Although this cocktail was promising in laboratory studies, preliminary field experiments
reported poor control of the rosy apple aphid, probably because of poor establishment, persistence and
dispersal capacities of parasitoids, after release (Hance et al., 2017). The aim of this exploratory work on
which future studies could build on was to consider the role of flower strip management as a solution for
enhancing biological control of aphids by mass release of parasitoids, by improving the persistence and
spatial coverage of parasitoids in apple orchards. In this study focusing on one apple orchard, after release
of a parasitoid cocktail, (i) we hypothesized that the efficiency of aphid control by parasitoids decreases
with the distance from the release point, but (ii) that the presence of flowering strips between tree lines
would enhance early control of aphids by easing parasitoid movement and providing them with food
sources.
2. Material and Methods
2.1. Study area and release protocol
To determine the optimal release dates, we estimated the time when >50% of the aphid fundatrix emerged,
using a day-degree (DD) model (Ferrais et al., 2021). An accumulation of 110 to 230 DDs is needed for D.
plantaginea eggs to emerge, with an average of 153 DD (Sébastien Demeter, Université catholique de
Louvain, pers. comm.). Similar results are found in the literature with an average of 140 DDs (110 to 180
DDs) (Graf et al., 2006). The value of DDs accumulated in a day by aphid eggs was calculated using the
following formula:
Aphid eggs are accumulating degree days as soon as the outside temperature exceeds 4°C, which represents
their developmental temperature threshold (Graf et al., 2006). The value was obtained by summing the DDs
for the 24 hours of the day. For each hour of the day, the threshold temperature Tt was subtracted from the
temperature of the studied hour TH(i). The result was then divided by 24 to obtain a mean hourly value.
Degree-day calculation began on the 15th January, the date on which eggs are known to emerge from 90
days of diapause (Graf et al., 2006). Then, DDs were summed up for each day from the 15th January until
the day at which a total of 153 DD was obtained.
Monitoring was carried out in 2018 (from April 13th to June 06th) and in 2019 (from March 29th to July
2nd) in an experimental organic apple orchard located in CRA-W, Gembloux, Belgium (50.566°N, 4.710°E)
(Figure 1). The orchard was planted in 2002 and is composed of five different varieties, randomly arranged
(Pinova, Reinette Hernaut, Reinette des Capucins, Pirouette, Reinette de Waleffe) that are grafted on
rootstock M 9 in distances of 3.5 x 1.5 m. The orchard was surrounded by meadows and beyond by cultivated
fields (beetroot and cereals). The orchard was divided into six plots; three of them planted with flower strips
sown in 2015 between and on both sides of each apple tree row (species composition provided in Table
A1), and three control plots without flower strips (Figure 1). There was a dirt track with a few grassy plants
regularly mowed between each plot. Parasitoid releases were carried out on nine trees situated in the middle
of one of the central rows of each of the six plots (54 trees in total), at about 1 to 1.5 m in height. Within
each plot, three transects for aphid population monitoring were drawn starting from the rows where
parasitoids were released, and covering two additional rows on both sides of the central row. The central
row (i.e., where parasitoids were released) and the associated transects were selected to be as close to the
center of each plot as possible and as far away from the other plots as possible to avoid effect of adjacent
plot treatments. Three distances from the release points were then defined: 1) central row with parasitoid
release points, 2) rows directly adjacent to the central row, and 3) two rows apart from the central row. It
was unfortunately not possible to maintain an untreated area within the apple orchard, as growers would not
take the risk of uncontrolled aphid outbreaks.
Three parasitoid releases were done, at 10 days intervals, according to a preliminary study that showed that
these two species are complementary in terms of emergence timing in the orchards (Ferrais et al., 2021).
For each release, the mix of parasitoid species was provided by Viridaxis SA (Belgium) in cardboard tubes,
each containing ≈675 A. matricariae and ≈570 E. cerasicola at the final development stage and placed
directly on each tree. This allowed obtaining a minimum emergence per release of 114 A. matricariae and
135 E. cerasicola per tree. In 2018, releases were done on the 13th of April, the 24th of April and the 04th
of May. In 2019, parasitoids were released on the 29th of March, the 11th and the 20th of April.
2.2. Monitoring protocol
Within each plot, we counted aphid colonies on five trees on each of the three transects (Figure 1) every
ten days, for a total of 90 monitored trees (5 trees in 3 transects in 6 plots) per year. One colony was delimited
on a floral bud at the beginning of the infestation, and later on one leaf, because aphids move from the floral
bud to the leaves. We could not define any strict size limit that would define a colony, except that a colony
could not be bigger than the flower bud or the leaf. In addition, we marked two colonies with colored plastic
clamping rings at each distance from the central row in each of the six plots, for a total of 36 monitored
colonies (6 colonies x 6 plots). For distance 1, consisting of only one row, the two colonies were on different
trees from this row. For distance 2 and 3, consisting of two rows for each distance, one colony was marked
in each row. Since at the beginning of the season only few aphids could be found, the first colony observed
on each row was marked. We counted the number of aphids in each of these colonies every ten days. To
obtain the number of aphids per tree, the mean aphid number per marked colony was multiplied by the total
number of colonies per tree. This, however, assumes that parasitism occurs randomly on the tree, which is
probably not the case. Nevertheless, it was impossible to count all the aphids, so we must assume that the
randomly selected colonies that we monitored were fairly representative of the total colonies on each tree.
In the first few weeks of monitoring, fundatrix in the marked colonies may move around the tree or
disappear. Therefore, when an aphid colony counted two or less aphids, another colony on the same tree
was marked to replace it, in order to have continuous observations across the season. In 2018, aphid colonies
could not be counted on the 29th of May, but it was estimated by adding the number of colonies from the
6th June with the number of colonies that had disappeared since the previous sampling date. Since estimating
the number of aphids per colony was not possible, the total aphid number per tree is missing on the 29th of
May, 2018. All of the aphid colonies marked for aphid count had disappeared for the last date of survey in
2019, so no aphid number data could be obtained for this date. There was a total of five trees on which no
aphid colonies were ever observed over the 2018 monitoring season. Five dead trees were not monitored for
aphid infestation and were removed from the dataset.
2.3. Statistical analyses
Data was analyzed globally, for the two years put together. The number of aphid colonies per tree and the
number of aphids per tree were analyzed with negative binomial generalized linear mixed models (GLMMs)
with a log link function, using the ‘glmmTMB’ R package (Magnusson et al., 2017), to account for zero-
inflation in count data. Explanatory variables were the year (factor with two levels: 2018 and 2019), the date
(used as a quantitative predictive variable, included as both a linear and a quadratic effect: the number of
days since the first monitoring date of each year), the distance to the release point (factor with three levels:
distance 1, distance 2, distance 3), the treatment (factor with two levels: flower strips and without flowers).
Interactions of year and date, treatment and distance, treatment and date, and distance and date were included
in the model. Indeed, it was expected that the distance and treatment effects could vary with the sampling
date, because of plant phenology or of growth of aphid populations and of their natural enemies. It was also
expected that the effect of the flower strip could vary depending on the distance to the row where parasitoids
were released. To factor in repeated measures and variability among apple trees, the identity of each tree
(factor with 175 levels: 90 trees x 2 years – 5 dead trees that could not be monitored) was used in the models
as random effect. The apple tree variety (factor with five levels: Pinova, Reinette Hernaut, Reinette des
Capucins, Pirouette and Reinette de Waleffe) was also used as random effect in our models, to account for
the noise it could create in the analysis, as some varieties are more sensitive to aphid attacks than others.
The effect of the block (factor with 6 levels) was first tested as a fixed effect but ultimately removed from
the models because it did not explain significant variance in our dataset, for both the number of aphids (chi²
= 3.7, df = 5, p = 0.58) and the number of colonies per tree (chi² = 3.9, df = 5, p = 0.56).
We used two additional negative binomial GLMMs to analyze separately the number of aphid colonies per
tree and the number of aphids per tree at the peak date of their infestation on each tree (i.e., maximum
number monitored on each tree over one sampling season). We used the year, the distance, the treatment
and their three-way interaction as fixed effects, and the apple tree variety as a random effect. The three-way
interaction was used because it is reasonable to expect the effect of the treatments (distance and presence of
flower strips) to depend on the year at the peak date. Results were then analysed and presented for each year
separately to account for the differences in aphid dynamics between years.
Model interpretation was carried out with the function Anova (package ‘car’; Fox and Weisberg, 2011).
Multiple comparisons were done with the ‘emmeans’ package on the significant factor variables (Lenth et
al., 2019). Model dispersion parameters were verified using the DHARMa package (Hartig, 2020). Model
predicted values (marginal means) and asymmetric confidence intervals calculated based on standard errors
on the fitted scale were represented using the ggeffects and sjPlot packages (Lüdecke, 2018). All statistical
analyses were performed with R version 4.0 (R Core Team, 2020).
3. Results
3.1. Global results (both years)
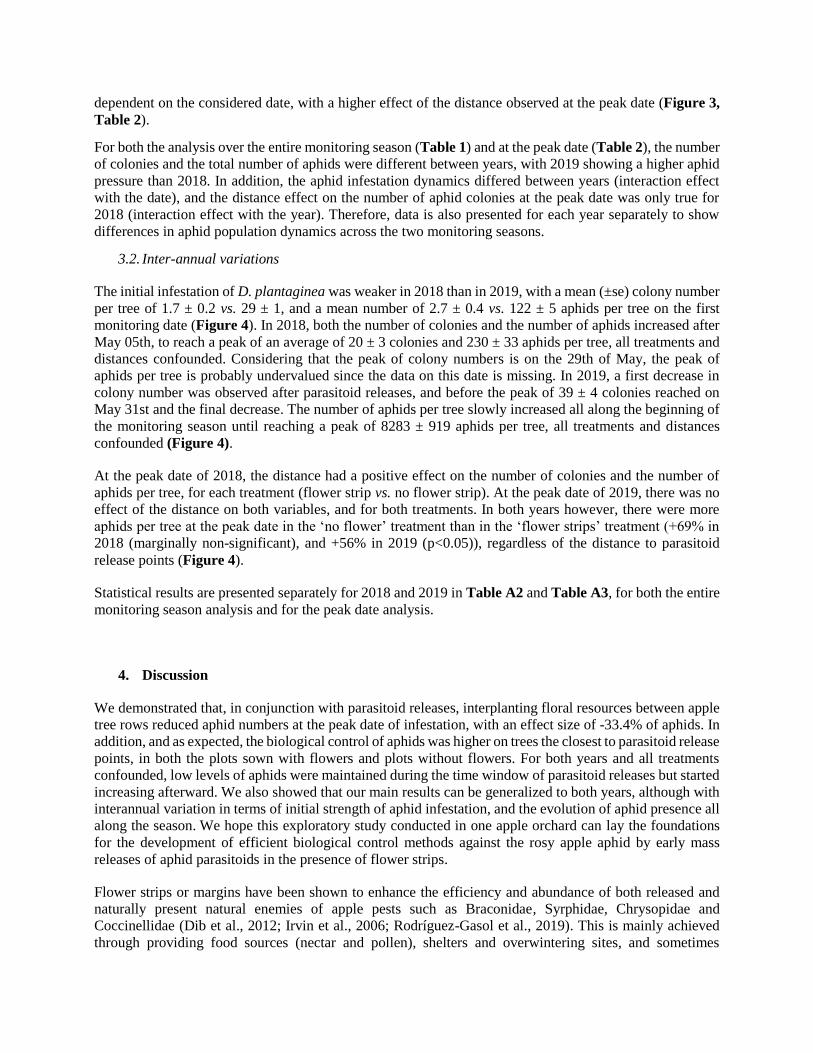
For data analyzed over the course of the entire season, we did not find any effect of the flower strip
treatment; plots with or without flower had, all monitoring dates confounded, the same number of aphid
colonies and aphids per tree. There was a positive effect of the distance to the parasitoid release point on the
number of aphid colonies and the number of aphids per tree (i.e., the further away from the parasitoid release
point, the greater the aphid infestation), and this effect was observed regardless of the treatment (no
interaction effect) (Figure 2, Table 1).
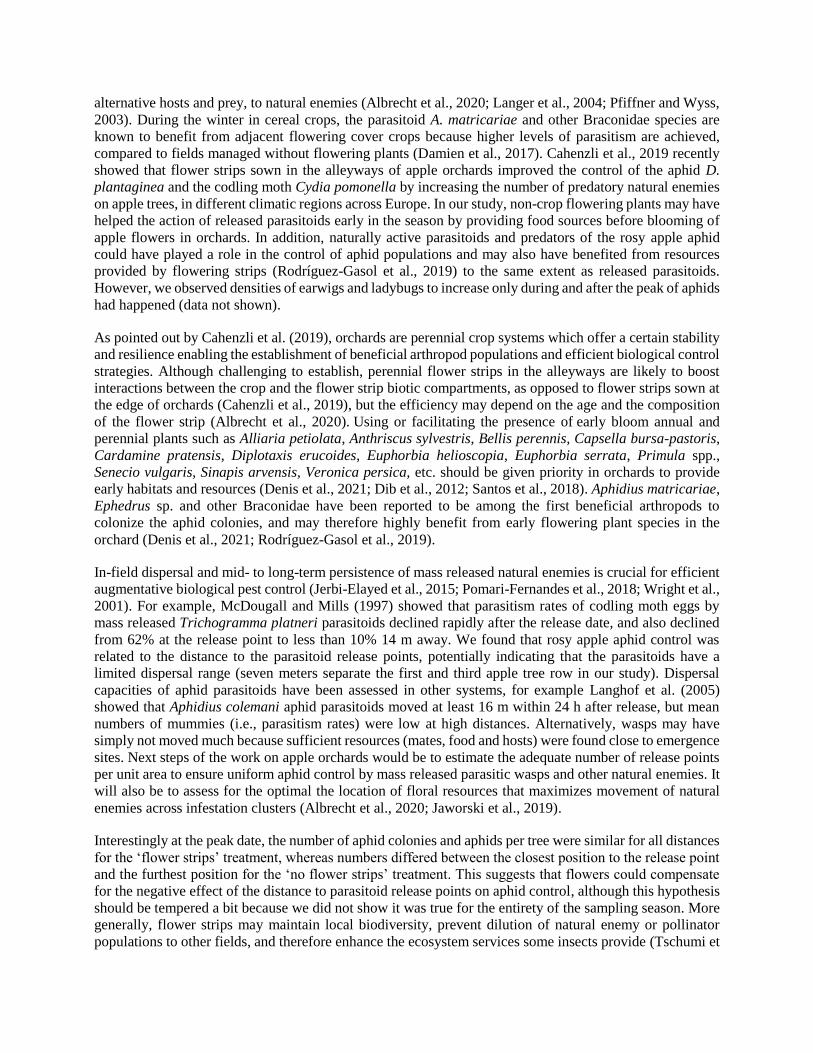
However, the effect of the treatment was dependent on the date for the number of aphids, as we observed
1.5 times more aphids per tree in plots without flower strips than in plots with flower strips at the peak date.
To the same extent, the effect of the distance on both the number of colonies and the number of aphids was
dependent on the considered date, with a higher effect of the distance observed at the peak date (Figure 3,
Table 2).
For both the analysis over the entire monitoring season (Table 1) and at the peak date (Table 2), the number
of colonies and the total number of aphids were different between years, with 2019 showing a higher aphid
pressure than 2018. In addition, the aphid infestation dynamics differed between years (interaction effect
with the date), and the distance effect on the number of aphid colonies at the peak date was only true for
2018 (interaction effect with the year). Therefore, data is also presented for each year separately to show
differences in aphid population dynamics across the two monitoring seasons.
3.2. Inter-annual variations
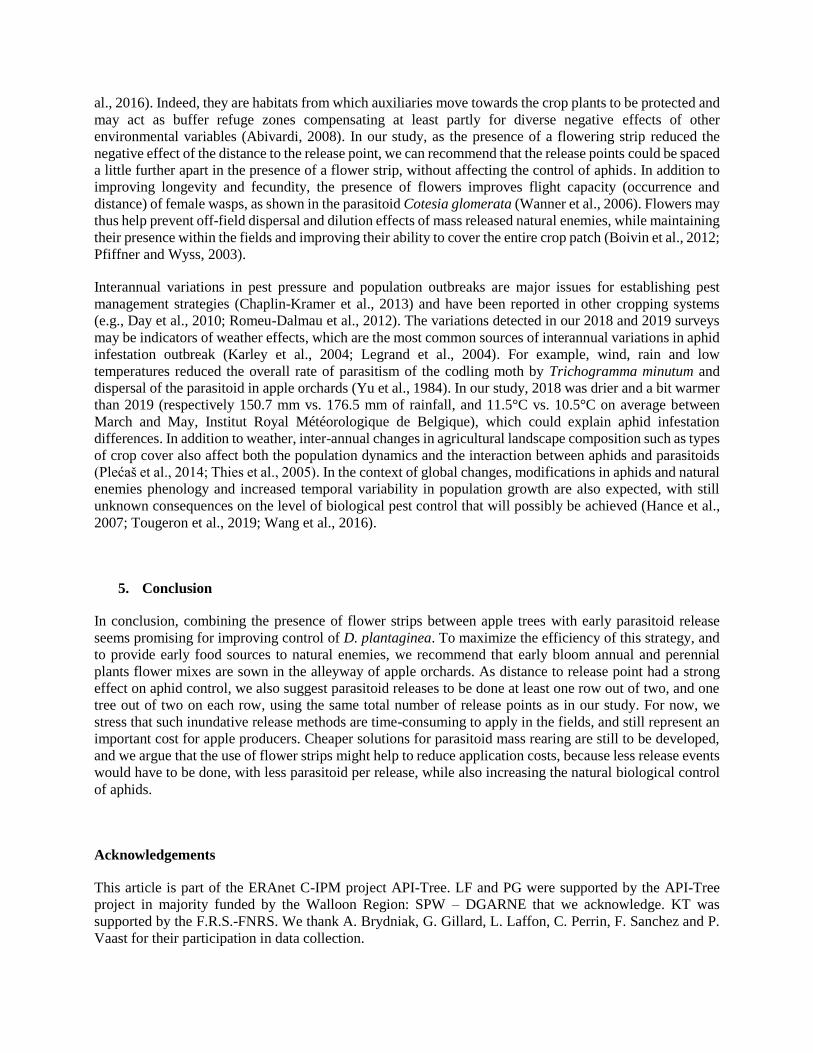
The initial infestation of D. plantaginea was weaker in 2018 than in 2019, with a mean (±se) colony number
per tree of 1.7 ± 0.2 vs. 29 ± 1, and a mean number of 2.7 ± 0.4 vs. 122 ± 5 aphids per tree on the first
monitoring date (Figure 4). In 2018, both the number of colonies and the number of aphids increased after
May 05th, to reach a peak of an average of 20 ± 3 colonies and 230 ± 33 aphids per tree, all treatments and
distances confounded. Considering that the peak of colony numbers is on the 29th of May, the peak of
aphids per tree is probably undervalued since the data on this date is missing. In 2019, a first decrease in
colony number was observed after parasitoid releases, and before the peak of 39 ± 4 colonies reached on
May 31st and the final decrease. The number of aphids per tree slowly increased all along the beginning of
the monitoring season until reaching a peak of 8283 ± 919 aphids per tree, all treatments and distances
confounded (Figure 4).
At the peak date of 2018, the distance had a positive effect on the number of colonies and the number of
aphids per tree, for each treatment (flower strip vs. no flower strip). At the peak date of 2019, there was no
effect of the distance on both variables, and for both treatments. In both years however, there were more
aphids per tree at the peak date in the ‘no flower’ treatment than in the ‘flower strips’ treatment (+69% in
2018 (marginally non-significant), and +56% in 2019 (p<0.05)), regardless of the distance to parasitoid
release points (Figure 4).
Statistical results are presented separately for 2018 and 2019 in Table A2 and Table A3, for both the entire
monitoring season analysis and for the peak date analysis.
4. Discussion
We demonstrated that, in conjunction with parasitoid releases, interplanting floral resources between apple
tree rows reduced aphid numbers at the peak date of infestation, with an effect size of -33.4% of aphids. In
addition, and as expected, the biological control of aphids was higher on trees the closest to parasitoid release
points, in both the plots sown with flowers and plots without flowers. For both years and all treatments
confounded, low levels of aphids were maintained during the time window of parasitoid releases but started
increasing afterward. We also showed that our main results can be generalized to both years, although with
interannual variation in terms of initial strength of aphid infestation, and the evolution of aphid presence all
along the season. We hope this exploratory study conducted in one apple orchard can lay the foundations
for the development of efficient biological control methods against the rosy apple aphid by early mass
releases of aphid parasitoids in the presence of flower strips.
Flower strips or margins have been shown to enhance the efficiency and abundance of both released and
naturally present natural enemies of apple pests such as Braconidae, Syrphidae, Chrysopidae and
Coccinellidae (Dib et al., 2012; Irvin et al., 2006; Rodríguez-Gasol et al., 2019). This is mainly achieved
through providing food sources (nectar and pollen), shelters and overwintering sites, and sometimes
alternative hosts and prey, to natural enemies (Albrecht et al., 2020; Langer et al., 2004; Pfiffner and Wyss,
2003). During the winter in cereal crops, the parasitoid A. matricariae and other Braconidae species are
known to benefit from adjacent flowering cover crops because higher levels of parasitism are achieved,
compared to fields managed without flowering plants (Damien et al., 2017). Cahenzli et al., 2019 recently
showed that flower strips sown in the alleyways of apple orchards improved the control of the aphid D.
plantaginea and the codling moth Cydia pomonella by increasing the number of predatory natural enemies
on apple trees, in different climatic regions across Europe. In our study, non-crop flowering plants may have
helped the action of released parasitoids early in the season by providing food sources before blooming of
apple flowers in orchards. In addition, naturally active parasitoids and predators of the rosy apple aphid
could have played a role in the control of aphid populations and may also have benefited from resources
provided by flowering strips (Rodríguez-Gasol et al., 2019) to the same extent as released parasitoids.
However, we observed densities of earwigs and ladybugs to increase only during and after the peak of aphids
had happened (data not shown).
As pointed out by Cahenzli et al. (2019), orchards are perennial crop systems which offer a certain stability
and resilience enabling the establishment of beneficial arthropod populations and efficient biological control
strategies. Although challenging to establish, perennial flower strips in the alleyways are likely to boost
interactions between the crop and the flower strip biotic compartments, as opposed to flower strips sown at
the edge of orchards (Cahenzli et al., 2019), but the efficiency may depend on the age and the composition
of the flower strip (Albrecht et al., 2020). Using or facilitating the presence of early bloom annual and
perennial plants such as Alliaria petiolata, Anthriscus sylvestris, Bellis perennis, Capsella bursa-pastoris,
Cardamine pratensis, Diplotaxis erucoides, Euphorbia helioscopia, Euphorbia serrata, Primula spp.,
Senecio vulgaris, Sinapis arvensis, Veronica persica, etc. should be given priority in orchards to provide
early habitats and resources (Denis et al., 2021; Dib et al., 2012; Santos et al., 2018). Aphidius matricariae,
Ephedrus sp. and other Braconidae have been reported to be among the first beneficial arthropods to
colonize the aphid colonies, and may therefore highly benefit from early flowering plant species in the
orchard (Denis et al., 2021; Rodríguez-Gasol et al., 2019).
In-field dispersal and mid- to long-term persistence of mass released natural enemies is crucial for efficient
augmentative biological pest control (Jerbi-Elayed et al., 2015; Pomari-Fernandes et al., 2018; Wright et al.,
2001). For example, McDougall and Mills (1997) showed that parasitism rates of codling moth eggs by
mass released Trichogramma platneri parasitoids declined rapidly after the release date, and also declined
from 62% at the release point to less than 10% 14 m away. We found that rosy apple aphid control was
related to the distance to the parasitoid release points, potentially indicating that the parasitoids have a
limited dispersal range (seven meters separate the first and third apple tree row in our study). Dispersal
capacities of aphid parasitoids have been assessed in other systems, for example Langhof et al. (2005)
showed that Aphidius colemani aphid parasitoids moved at least 16 m within 24 h after release, but mean
numbers of mummies (i.e., parasitism rates) were low at high distances. Alternatively, wasps may have
simply not moved much because sufficient resources (mates, food and hosts) were found close to emergence
sites. Next steps of the work on apple orchards would be to estimate the adequate number of release points
per unit area to ensure uniform aphid control by mass released parasitic wasps and other natural enemies. It
will also be to assess for the optimal the location of floral resources that maximizes movement of natural
enemies across infestation clusters (Albrecht et al., 2020; Jaworski et al., 2019).
Interestingly at the peak date, the number of aphid colonies and aphids per tree were similar for all distances
for the ‘flower strips’ treatment, whereas numbers differed between the closest position to the release point
and the furthest position for the ‘no flower strips’ treatment. This suggests that flowers could compensate
for the negative effect of the distance to parasitoid release points on aphid control, although this hypothesis
should be tempered a bit because we did not show it was true for the entirety of the sampling season. More
generally, flower strips may maintain local biodiversity, prevent dilution of natural enemy or pollinator
populations to other fields, and therefore enhance the ecosystem services some insects provide (Tschumi et
al., 2016). Indeed, they are habitats from which auxiliaries move towards the crop plants to be protected and
may act as buffer refuge zones compensating at least partly for diverse negative effects of other
environmental variables (Abivardi, 2008). In our study, as the presence of a flowering strip reduced the
negative effect of the distance to the release point, we can recommend that the release points could be spaced
a little further apart in the presence of a flower strip, without affecting the control of aphids. In addition to
improving longevity and fecundity, the presence of flowers improves flight capacity (occurrence and
distance) of female wasps, as shown in the parasitoid Cotesia glomerata (Wanner et al., 2006). Flowers may
thus help prevent off-field dispersal and dilution effects of mass released natural enemies, while maintaining
their presence within the fields and improving their ability to cover the entire crop patch (Boivin et al., 2012;
Pfiffner and Wyss, 2003).
Interannual variations in pest pressure and population outbreaks are major issues for establishing pest
management strategies (Chaplin-Kramer et al., 2013) and have been reported in other cropping systems
(e.g., Day et al., 2010; Romeu-Dalmau et al., 2012). The variations detected in our 2018 and 2019 surveys
may be indicators of weather effects, which are the most common sources of interannual variations in aphid
infestation outbreak (Karley et al., 2004; Legrand et al., 2004). For example, wind, rain and low
temperatures reduced the overall rate of parasitism of the codling moth by Trichogramma minutum and
dispersal of the parasitoid in apple orchards (Yu et al., 1984). In our study, 2018 was drier and a bit warmer
than 2019 (respectively 150.7 mm vs. 176.5 mm of rainfall, and 11.5°C vs. 10.5°C on average between
March and May, Institut Royal Météorologique de Belgique), which could explain aphid infestation
differences. In addition to weather, inter-annual changes in agricultural landscape composition such as types
of crop cover also affect both the population dynamics and the interaction between aphids and parasitoids
(Plećaš et al., 2014; Thies et al., 2005). In the context of global changes, modifications in aphids and natural
enemies phenology and increased temporal variability in population growth are also expected, with still
unknown consequences on the level of biological pest control that will possibly be achieved (Hance et al.,
2007; Tougeron et al., 2019; Wang et al., 2016).
5. Conclusion
In conclusion, combining the presence of flower strips between apple trees with early parasitoid release
seems promising for improving control of D. plantaginea. To maximize the efficiency of this strategy, and
to provide early food sources to natural enemies, we recommend that early bloom annual and perennial
plants flower mixes are sown in the alleyway of apple orchards. As distance to release point had a strong
effect on aphid control, we also suggest parasitoid releases to be done at least one row out of two, and one
tree out of two on each row, using the same total number of release points as in our study. For now, we
stress that such inundative release methods are time-consuming to apply in the fields, and still represent an
important cost for apple producers. Cheaper solutions for parasitoid mass rearing are still to be developed,
and we argue that the use of flower strips might help to reduce application costs, because less release events
would have to be done, with less parasitoid per release, while also increasing the natural biological control
of aphids.
Acknowledgements
This article is part of the ERAnet C-IPM project API-Tree. LF and PG were supported by the API-Tree
project in majority funded by the Walloon Region: SPW – DGARNE that we acknowledge. KT was
supported by the F.R.S.-FNRS. We thank A. Brydniak, G. Gillard, L. Laffon, C. Perrin, F. Sanchez and P.
Vaast for their participation in data collection.
Contribution statement
PG & TH conceived and designed the work; LF & PG collected and cured data; KT & LF analysed,
interpreted, and presented data; KT & LF wrote the article; all co-authors revised the manuscript and
approved the final version; TH supervised the project and secured funding
References
Abivardi, C., 2008. Flower Strips as Ecological Compensation Areas for Pest Management, in: Capinera,
J.L. (Ed.), Encyclopedia of Entomology. Springer Netherlands, Dordrecht, pp. 1489–1494.
https://doi.org/10.1007/978-1-4020-6359-6_3847
Albrecht, M., Williams, N.M., Tschumi, M., 2020. The effectiveness of flower strips and hedgerows on
pest control, pollination services and crop yield: a quantitative synthesis. Ecology Letters 23,
1488-1498.
Balmer, O., Pfiffner, L., Schied, J., Willareth, M., Leimgruber, A., Luka, H., Traugott, M., 2013. Noncrop
flowering plants restore top-down herbivore control in agricultural fields. Ecol Evol 3, 2634–
2646. https://doi.org/10.1002/ece3.658
Blommers, L.H.M., 1994. Integrated Pest Management in European Apple Orchards. Annual Review of
Entomology 39, 213–241.
Boivin, G., Hance, T., Brodeur, J., 2012. Aphid parasitoids in biological control. Canadian Journal of
Plant Science 92, 1–12. https://doi.org/10.4141/cjps2011-045
Bostanian, N.J., Goulet, H., O’Hara, J., Masner, L., Racette, G., 2004. Towards Insecticide Free Apple
Orchards: Flowering Plants to Attract Beneficial Arthropods. Biocontrol Science and Technology
14, 25–37. https://doi.org/10.1080/09583150310001606570
Bribosia, E., Bylemans, D., Migon, M., Impe, G.V., 2005. In-field production of parasitoids of Dysaphis
plantaginea by using the rowan aphid Dysaphis sorbi as substitute host. Biocontrol 50, 601–610.
https://doi.org/10.1007/s10526-004-5526-2
Brown, M.W., Mathews, C.R., 2007. Conservation Biological Control of Rosy Apple Aphid, Dysaphis
plantaginea (Passerini), in Eastern North America. Environmental Entomology 36, 1131–1139.
https://doi.org/10.1603/0046-225X(2007)36[1131:CBCORA]2.0.CO;2
Cahenzli, F., Sigsgaard, L., Daniel, C., Herz, A., Jamar, L., Kelderer, M., Jacobsen, S.K., Kruczyńska, D.,
Matray, S., Porcel, M., Sekrecka, M., Świergiel, W., Tasin, M., Telfser, J., Pfiffner, L., 2019.
Perennial flower strips for pest control in organic apple orchards - A pan-European study.
Agriculture, Ecosystems & Environment 278, 43–53. https://doi.org/10.1016/j.agee.2019.03.011
Campbell, A., Wilby, A., Sutton, P., Wäckers, F., 2017. Getting More Power from Your Flowers: Multi-
Functional Flower Strips Enhance Pollinators and Pest Control Agents in Apple Orchards. Insects
8, 101. https://doi.org/10.3390/insects8030101
Chaplin-Kramer, R., de Valpine, P., Mills, N.J., Kremen, C., 2013. Detecting pest control services across
spatial and temporal scales. Agriculture, ecosystems & environment 181, 206–212.
Cross, J., Fountain, M., Markó, V., Nagy, C., 2015. Arthropod ecosystem services in apple orchards and
their economic benefits. Ecol Entomol 40, 82–96. https://doi.org/10.1111/een.12234
Damien, M., Le Lann, C., Desneux, N., Alford, L., Al Hassan, D., Georges, R., van Baaren, J., 2017.
Flowering crops in winter increases pest control but not trophic link diversity. Agriculture,
Ecosystems & Environment 247, 418-425.
Day, K.R., Ayres, M.P., Harrington, R., Kidd, N.A.C., 2010. Interannual dynamics of aerial and arboreal
green spruce aphid populations. Popul Ecol 52, 317–327. https://doi.org/10.1007/s10144-009-
0190-0
Denis, C., Riudavets, J., Gabarra, R., Molina, P., Arnó, J., 2021. Selection of insectary plants for the
conservation of biological control agents of aphids and thrips in fruit orchards. Bulletin of
Entomological Research 111, 517-527.
Dib, H., Jamont, M., Sauphanor, B., Capowiez, Y., 2016. The feasibility and efficacy of early-season
releases of a generalist predator (Forficula auricularia L.) to control populations of the RAA
(Dysaphis plantaginea Passerini) in Southeastern France. Bull. Entomol. Res. 106, 233–241.
https://doi.org/10.1017/S0007485315001042
Dib, H., Libourel, G., Warlop, F., 2012. Entomological and functional role of floral strips in an organic
apple orchard: Hymenopteran parasitoids as a case study. J Insect Conserv 16, 315–318.
https://doi.org/10.1007/s10841-012-9471-6
Dib, H., Simon, S., Sauphanor, B., Capowiez, Y., 2010. The role of natural enemies on the population
dynamics of the rosy apple aphid, Dysaphis plantaginea Passerini (Hemiptera: Aphididae) in
organic apple orchards in south-eastern France. Biological Control 55, 97–109.
https://doi.org/10.1016/j.biocontrol.2010.07.005
Dumont, V.-A., Trigaux, A., Moreau, A., Hance, T., 2011. Study of two conditioning methods of
parasitoids used in biological control prior to inundative releases in apple orchards. European
Journal of Environmental Sciences 1, 51–56. https://doi.org/10.14712/23361964.2015.65
FAO, 2018. Food and Agriculture Organization of the United Nations. https://www.fao.org/faostat/en/.
Accessed 15/11/2021.
Ferrais, L., Tougeron, K., Gardin, P., Hance, T., 2021. Assessing the optimal frequency of early parasitoid
releases in an apple orchard to control Dysaphis plantaginea: a proof of concept study. Biological
Agriculture & Horticulture (in press).
Fiedler, A.K., Landis, D.A., Wratten, S.D., 2008. Maximizing ecosystem services from conservation
biological control: The role of habitat management. Biological Control 45, 254–271.
https://doi.org/10.1016/j.biocontrol.2007.12.009
Fox, J., Weisberg, H.S., 2011. An R Companion to Applied Regression, 2nd ed. Sage, Thousand Oaks,
CA, USA.
Graf, B., Höpli, H., Höhn, H., Samietz, J., 2006. Temperature effects on egg development of the rosy
apple aphid and forecasting of egg hatch. Entomologia experimentalis et applicata 119, 207–211.
Hance, T., Kohandani-Tafresh, F., Munaut, F., 2017. Biological Control. In: Aphids as Crop Pests, van
Emden H. and Harrington R. (Eds.), CABI, Wallingford, UK, pp. 448–493.
Hance, T., van Baaren, J., Vernon, P., Boivin, G., 2007. Impact of Extreme Temperatures on Parasitoids in
a Climate Change Perspective. Annual Review of Entomology 52, 107–126.
https://doi.org/10.1146/annurev.ento.52.110405.091333
Hartig, F., 2020. DHARMa: Residual Diagnostics for Hierarchical (Multi-Level / Mixed) Regression
Models. R package version 0.3.3.0. https://CRAN.R-project.org/package=DHARMa.
Heijne, B., Helsen, H.H.M., Caffi, T., Rossi, V., Strassemeyer, J., Köhl, J., Riemens, M.M., Alaphilippe,
A., Simon, S., Capowiez, Y., Holb, I.J., Buurma, J.S., Hennen, W.H.G.J., 2015. PURE progress in
innovative IPM in pome fruit in Europe. Acta Hortic. 383–390.
https://doi.org/10.17660/ActaHortic.2015.1105.40
Irvin, N.A., Scarratt, S.L., Wratten, S.D., Frampton, C.M., Chapman, R.B., Tylianakis, J.M., 2006. The
effects of floral understoreys on parasitism of leafrollers (Lepidoptera: Tortricidae) on apples in
New Zealand. Agric Forest Ent 8, 25–34. https://doi.org/10.1111/j.1461-9555.2006.00285.x
Jaworski, C.C., Xiao, D., Xu, Q., Ramirez‐Romero, R., Guo, X., Wang, S., Desneux, N., 2019. Varying
the spatial arrangement of synthetic herbivore‐induced plant volatiles and companion plants to
improve conservation biological control. Journal of Applied Ecology 56, 1176–1188.
Jerbi-Elayed, M., Lebdi-Grissa, K., Le Goff, G., Hance, T., 2015. Influence of Temperature on Flight,
Walking and Oviposition Capacities of two Aphid Parasitoid Species (Hymenoptera: Aphidiinae).
Journal of Insect Behavior 28, 157-166. https://doi.org/10.1007/s10905-015-9490-8
Karley, A.J., Parker, W.E., Pitchford, J.W., Douglas, A.E., 2004. The mid-season crash in aphid
populations: why and how does it occur? Ecological Entomology 29, 383–388.
Kehrli, P., Wyss, E., 2001. Effects of augmentative releases of the coccinellid, Adalia bipunctata, and of
insecticide treatments in autumn on the spring population of aphids of the genus Dysaphis in apple
orchards. Entomologia Experimentalis et Applicata 99, 245–252. https://doi.org/10.1046/j.1570-
7458.2001.00823.x
Kleijn, D., Kohler, F., Báldi, A., Batáry, P., Concepción, E.D., Clough, Y., Díaz, M., Gabriel, D.,
Holzschuh, A., Knop, E., Kovács, A., Marshall, E.J.P., Tscharntke, T., Verhulst, J., 2009. On the
relationship between farmland biodiversity and land-use intensity in Europe. Proc. R. Soc. B 276,
903–909. https://doi.org/10.1098/rspb.2008.1509
Landis, D.A., Wratten, S.D., Gurr, G.M., 2000. Habitat management to conserve natural enemies of
arthropod pests in agriculture. Annual review of entomology 45, 175–201.
Langer, A., Boivin, G., Hance, T., 2004. Oviposition, flight and walking capacity at low temperatures of
four aphid parasitoid species (Hymenoptera: Aphidiinae). European journal of Entomology 101,
473–480.
Langhof, M., Meyhöfer, R., Poehling, H.-M., Gathmann, A., 2005. Measuring the field dispersal of
Aphidius colemani (Hymenoptera: Braconidae). Agriculture, Ecosystems & Environment 107,
137–143. https://doi.org/10.1016/j.agee.2004.12.001
Legrand, M.A., Colinet, H., Vernon, P., Hance, T., 2004. Autumn, winter and spring dynamics of aphid
Sitobion avenae and parasitoid Aphidius rhopalosiphi interactions. Annals of applied biology 145,
139–144.
Lenth, R., Singmann, H., Love, J., Buerkner, P., Herve, M., 2019. Estimated marginal means, aka least-
squares means. R package version 1.3.2.
Lüdecke, D., 2018. ggeffects: Tidy Data Frames of Marginal Effects from Regression Models. JOSS 3,
772. https://doi.org/10.21105/joss.00772
Magnusson, A., Skaug, H., Nielsen, A., Berg, C., Kristensen, K., Maechler, M., Brooks, M., 2017.
Generalized linear mixed models using template model builder. GlmmTMB. R package version
0.1 3.
McDougall, S.J., Mills, N.J., 1997. Dispersal of Trichogramma platneri Nagarkatti (Hym.,
Trichogrammatidae) from point-source releases in an apple orchard in California. Journal of
Applied Entomology 121, 205–209. https://doi.org/10.1111/j.1439-0418.1997.tb01394.x
Meehan, T.D., Werling, B.P., Landis, D.A., Gratton, C., 2011. Agricultural landscape simplification and
insecticide use in the Midwestern United States. Proceedings of the National Academy of
Sciences 108, 11500–11505.
Miñarro, M., Hemptinne, J.-L., Dapena, E., 2005. Colonization of apple orchards by predators of Dysaphis
plantaginea: sequential arrival, response to prey abundance and consequences for biological
control. Biocontrol 50, 403–414. https://doi.org/10.1007/s10526-004-5527-1
Mkenda, P.A., Pandey, S., Johnson, A.C., Gurr, G., 2019. Advances in conservation biological control and
habitat management in IPM. Burleigh Dodds Science Publishing Limited, Cambridge, UK, pp.
451–480.
Nicolas, A., Dagbert, T., Le Goff, G., Hance, T., 2013. La lutte biologique contre le puceron cendré du
pommier par des lâchers d’auxiliaires en verger. ISBN: D/2013/131131Earth & Life Institute,
Louvain-la-Neuve.
Perović, D., Gámez-Virués, S., Börschig, C., Klein, A.-M., Krauss, J., Steckel, J., Rothenwöhrer, C.,
Erasmi, S., Tscharntke, T., Westphal, C., 2015. Configurational landscape heterogeneity shapes
functional community composition of grassland butterflies. J Appl Ecol 52, 505–513.
https://doi.org/10.1111/1365-2664.12394
Peusens, G., Buntinx, L., Gobin, B., 2006. Parasitation of the parasitic wasp Ephedrus persicae (Frogatt)
on the rosy apple aphid Dysaphis plantaginea (Passerini). Communications in agricultural and
applied biological sciences 71, 369–374.
Pfiffner, L., Wyss, E., 2003. Use of sown wildflower strips to enhance natural enemies of agricultural
pests. In: Gurr, G.M., Wratten, S.D., Altieri, M.A. (Eds.), Ecological Engineering for Pest
Management: Advances in Habitat Manipulation for Arthropods. CABI, Wallingford, UK, pp.
165–186. https://doi.org/10.1079/9780851999036.0165
Philpott, S.M., 2013. Biodiversity and Pest Control Services. Encyclopedia of Biodiversity. Elsevier, pp.
373–385.
Plećaš, M., Gagić, V., Janković, M., Petrović-Obradović, O., Kavallieratos, N.G., Tomanović, ž., Thies,
C., Tscharntke, T., Ćetković, A., 2014. Landscape composition and configuration influence cereal
aphid–parasitoid–hyperparasitoid interactions and biological control differentially across years.
Agriculture, Ecosystems & Environment 183, 1–10. https://doi.org/10.1016/j.agee.2013.10.016
Pomari-Fernandes, A., de Freitas Bueno, A., De Bortoli, S.A., Favetti, B.M., 2018. Dispersal capacity of
the egg parasitoid Telenomus remus Nixon (Hymenoptera: Platygastridae) in maize and soybean
crops. Biological Control 126, 158–168. https://doi.org/10.1016/j.biocontrol.2018.08.009
Reganold, J.P., Glover, J.D., Andrews, P.K., Hinman, H.R., 2001. Sustainability of three apple production
systems. Nature 410, 926–930.
Rodríguez-Gasol, N., Avilla, J., Aparicio, Y., Arnó, J., Gabarra, R., Riudavets, J., Alegre, S., Lordan, J.,
Alins, G., 2019. The contribution of surrounding margins in the promotion of natural enemies in
Mediterranean apple orchards. Insects 10, 148.
Romeu-Dalmau, C., Espadaler, X., Piñol, J., 2012. Abundance, interannual variation and potential pest
predator role of two co-occurring earwig species in citrus canopies: Earwigs in citrus canopies.
Journal of Applied Entomology 136, 501–509. https://doi.org/10.1111/j.1439-0418.2011.01671.x
Santos, L.A.O., Botelho Costa, M., Lavigne, C., Fernandes, O.A., Bischoff, A., Franck, P., 2018.
Influence of the margin vegetation on the conservation of aphid biological control in apple
orchards. J Insect Conserv 22, 465–474. https://doi.org/10.1007/s10841-018-0074-8
Scherber, C., 2015. Insect responses to interacting global change drivers in managed ecosystems. Current
Opinion in Insect Science 11, 56–62. https://doi.org/10.1016/j.cois.2015.10.002
Sigsgaard, L., Betzer, C., Naulin, C., Eilenberg, J., Enkegaard, A., Kristensen, K., 2013. The Effect of
Floral Resources on Parasitoid and Host Longevity: Prospects for Conservation Biological
Control in Strawberries. Journal of Insect Science 13, 1–17.
https://doi.org/10.1673/031.013.10401
Simon, S., Brun, L., Guinaudeau, J., Sauphanor, B., 2011. Pesticide use in current and innovative apple
orchard systems. Agronomy Sust. Developm. 31, 541–555. https://doi.org/10.1007/s13593-011-
0003-7
Thies, C., Roschewitz, I., Tscharntke, T., 2005. The landscape context of cereal aphid-parasitoid
interactions. Proceedings of the Royal Society B: Biological Sciences 272, 203–210.
https://doi.org/10.1098/rspb.2004.2902
Tougeron, K., Brodeur, J., Le Lann, C., Van Baaren, J., 2019. How climate change affects the seasonal
ecology of insect parasitoids. Ecol Entomol 45, 167–181. https://doi.org/10.1111/een.12792
Tscharntke, T., Klein, A.M., Kruess, A., Steffan‐Dewenter, I., Thies, C., 2005. Landscape perspectives on
agricultural intensification and biodiversity–ecosystem service management. Ecology letters 8,
857–874.
Tschumi, M., Albrecht, M., Collatz, J., Dubsky, V., Entling, M.H., Najar-Rodriguez, A.J., Jacot, K., 2016.
Tailored flower strips promote natural enemy biodiversity and pest control in potato crops. J Appl
Ecol 53, 1169–1176. https://doi.org/10.1111/1365-2664.12653
van Lenteren, J.C., Bolckmans, K., Köhl, J., Ravensberg, W.J., Urbaneja, A., 2018. Biological control
using invertebrates and microorganisms: plenty of new opportunities. BioControl 63, 39–59.
https://doi.org/10.1007/s10526-017-9801-4
Wang, L., Hui, C., Sandhu, H.S., Li, Z., Zhao, Z., 2016. Population dynamics and associated factors of
cereal aphids and armyworms under global change. Sci Rep 5, 18801.
https://doi.org/10.1038/srep18801
Wanner, H., Gu, H., Dorn, S., 2006. Nutritional value of floral nectar sources for flight in the parasitoid
wasp, Cotesia glomerata. Physiol Entomol 31, 127–133. https://doi.org/10.1111/j.1365-
3032.2006.00494.x
Wesche, K., Krause, B., Culmsee, H., Leuschner, C., 2012. Fifty years of change in Central European
grassland vegetation: Large losses in species richness and animal-pollinated plants. Biological
Conservation 150, 76–85.
Wilkaniec, B., 1993. The influence of feeding of the rosy apple aphid, Dysaphis plantaginea (Pass.)
(Homoptera: Aphididae) on the growth of apple fruits. Roczniki Nauk Rolniczych. Seria E,
Ochrona Roślin 23, 75–78.
Wratten, S., Berndt, L., Gurr, G., Tylianakis, J., Fernando, P., Didham, R., 2002. Adding floral diversity to
enhance parasitoid fitness and efficacy. Proceedings of the First International Symposium on
Biological Control of Arthropods, Honolulu, Hawaii.
Wright, M.G., Hoffmann, M.P., Chenus, S.A., Gardner, J., 2001. Dispersal Behavior of Trichogramma
ostriniae (Hymenoptera: Trichogrammatidae) in Sweet Corn Fields: Implications for
Augmentative Releases against Ostrinia nubilalis (Lepidoptera: Crambidae). Biological Control
22, 29–37. https://doi.org/10.1006/bcon.2001.0948
Yu, D.S.K., Laing, J.E., Hagley, E.A.C., 1984. Dispersal of Trichogramma spp. (Hymenoptera:
Trichogrammatidae) in an Apple Orchard After Inundative Releases. Environmental Entomology
13, 371–374. https://doi.org/10.1093/ee/13.2.371
Tables
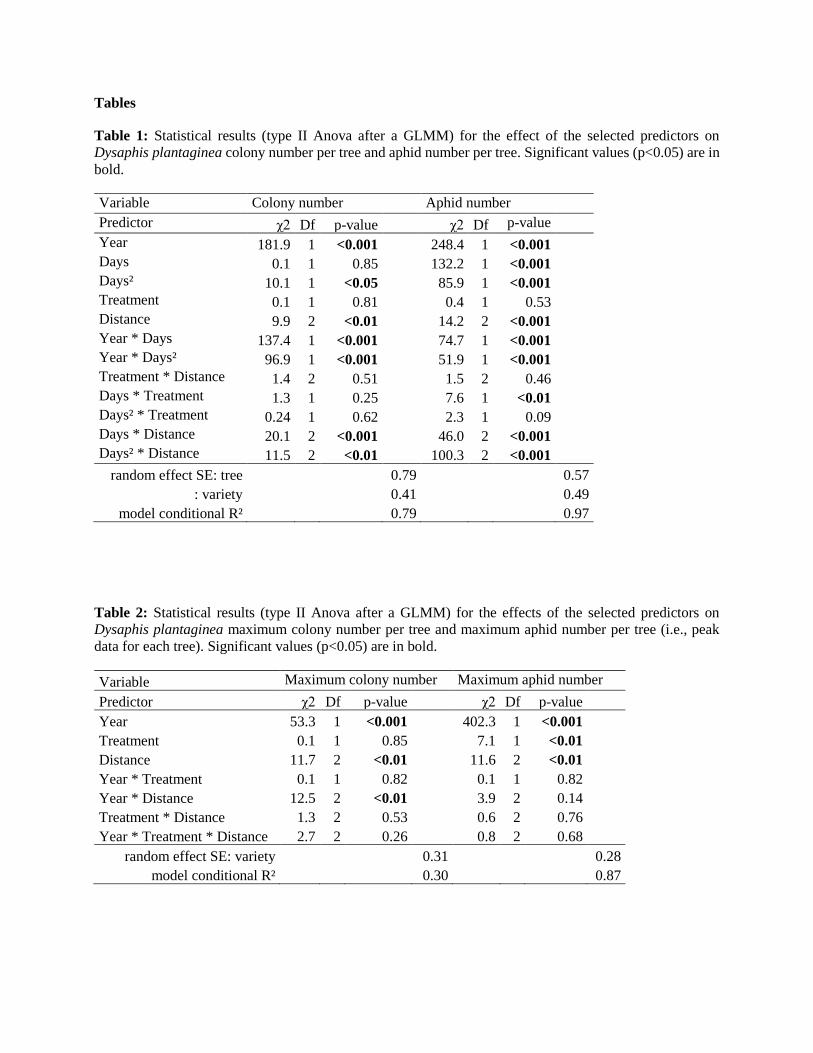
Table 1: Statistical results (type II Anova after a GLMM) for the effect of the selected predictors on
Dysaphis plantaginea colony number per tree and aphid number per tree. Significant values (p<0.05) are in
bold.
Variable Colony number Aphid number
Predictor χ2 Df p-value χ2 Df p-value
Year 181.9 1 <0.001 248.4 1 <0.001
Days 0.1 1 0.85 132.2 1 <0.001
Days² 10.1 1 <0.05 85.9 1 <0.001
Treatment 0.1 1 0.81 0.4 1 0.53
Distance 9.9 2 <0.01 14.2 2 <0.001
Year * Days 137.4 1 <0.001 74.7 1 <0.001
Year * Days² 96.9 1 <0.001 51.9 1 <0.001
Treatment * Distance 1.4 2 0.51 1.5 2 0.46
Days * Treatment 1.3 1 0.25 7.6 1 <0.01
Days² * Treatment 0.24 1 0.62 2.3 1 0.09
Days * Distance 20.1 2 <0.001 46.0 2 <0.001
Days² * Distance 11.5 2 <0.01 100.3 2 <0.001
random effect SE: tree 0.79 0.57
: variety 0.41 0.49
model conditional R² 0.79 0.97
Table 2: Statistical results (type II Anova after a GLMM) for the effects of the selected predictors on
Dysaphis plantaginea maximum colony number per tree and maximum aphid number per tree (i.e., peak
data for each tree). Significant values (p<0.05) are in bold.
Variable Maximum colony number Maximum aphid number
Predictor χ2 Df p-value χ2 Df p-value
Year 53.3 1 <0.001 402.3 1 <0.001
Treatment 0.1 1 0.85 7.1 1 <0.01
Distance 11.7 2 <0.01 11.6 2 <0.01
Year * Treatment 0.1 1 0.82 0.1 1 0.82
Year * Distance 12.5 2 <0.01 3.9 2 0.14
Treatment * Distance 1.3 2 0.53 0.6 2 0.76
Year * Treatment * Distance 2.7 2 0.26 0.8 2 0.68
random effect SE: variety 0.31 0.28
model conditional R² 0.30 0.87
Figures
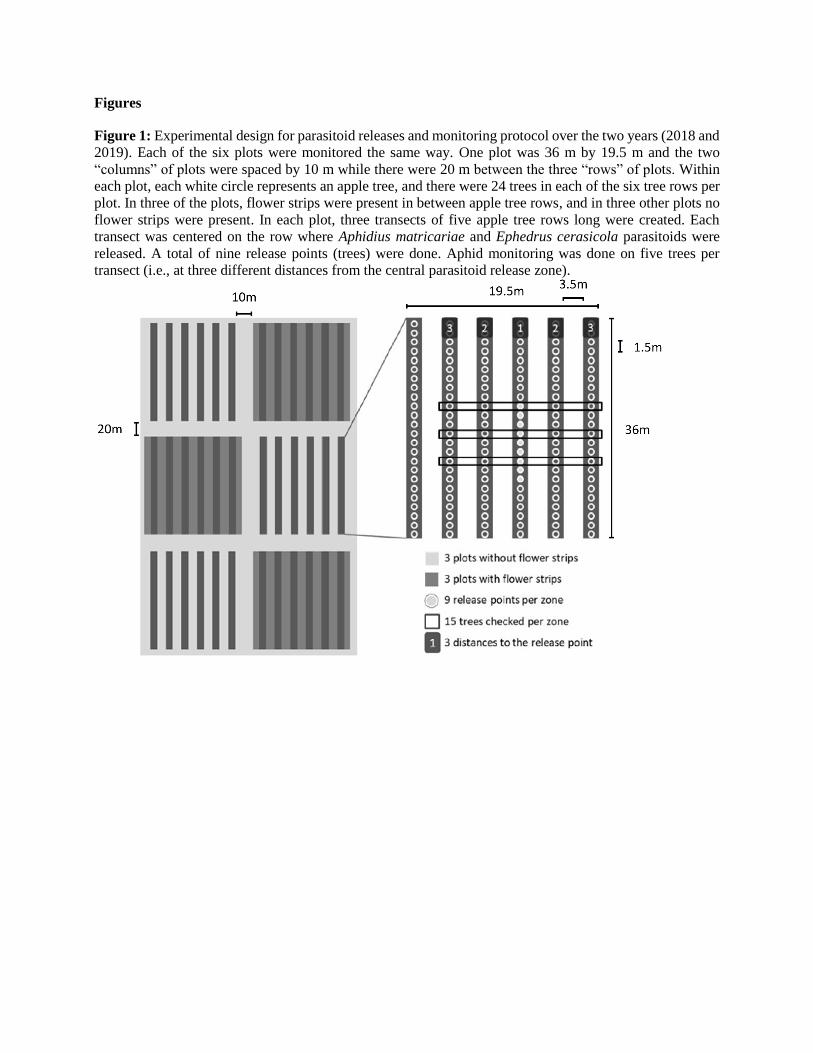
Figure 1: Experimental design for parasitoid releases and monitoring protocol over the two years (2018 and
2019). Each of the six plots were monitored the same way. One plot was 36 m by 19.5 m and the two
“columns” of plots were spaced by 10 m while there were 20 m between the three “rows” of plots. Within
each plot, each white circle represents an apple tree, and there were 24 trees in each of the six tree rows per
plot. In three of the plots, flower strips were present in between apple tree rows, and in three other plots no
flower strips were present. In each plot, three transects of five apple tree rows long were created. Each
transect was centered on the row where Aphidius matricariae and Ephedrus cerasicola parasitoids were
released. A total of nine release points (trees) were done. Aphid monitoring was done on five trees per
transect (i.e., at three different distances from the central parasitoid release zone).
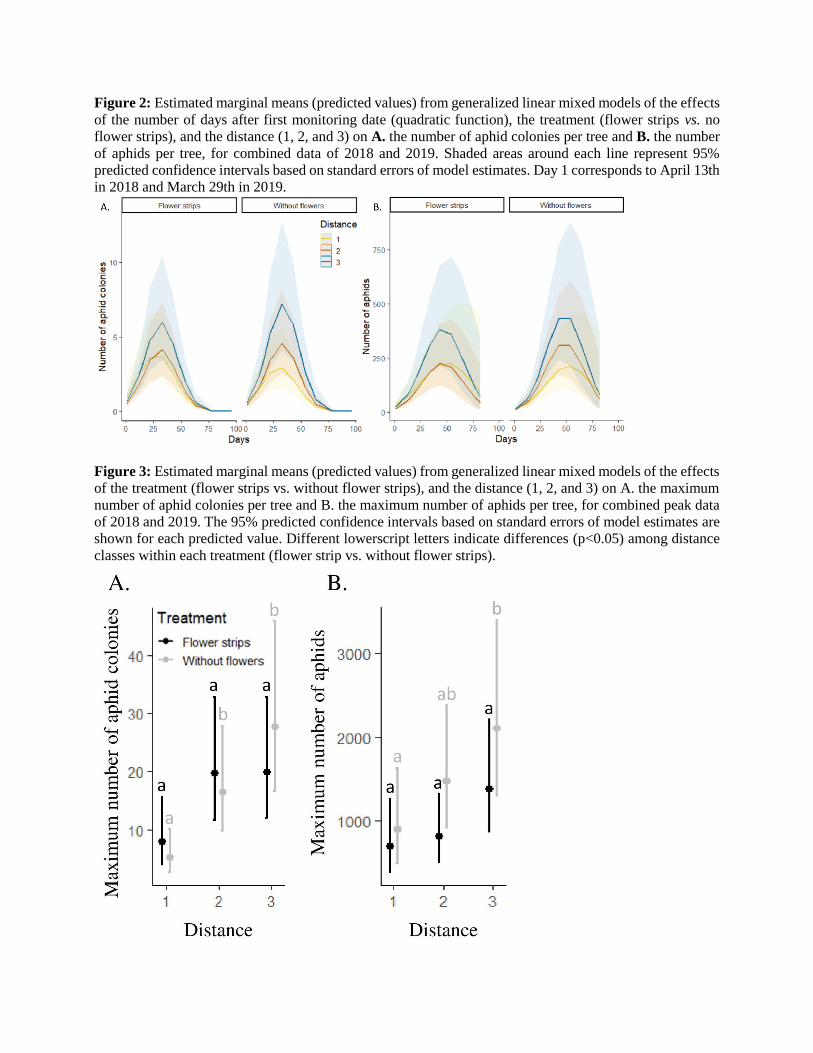
Figure 2: Estimated marginal means (predicted values) from generalized linear mixed models of the effects
of the number of days after first monitoring date (quadratic function), the treatment (flower strips vs. no
flower strips), and the distance (1, 2, and 3) on A. the number of aphid colonies per tree and B. the number
of aphids per tree, for combined data of 2018 and 2019. Shaded areas around each line represent 95%
predicted confidence intervals based on standard errors of model estimates. Day 1 corresponds to April 13th
in 2018 and March 29th in 2019.
Figure 3: Estimated marginal means (predicted values) from generalized linear mixed models of the effects
of the treatment (flower strips vs. without flower strips), and the distance (1, 2, and 3) on A. the maximum
number of aphid colonies per tree and B. the maximum number of aphids per tree, for combined peak data
of 2018 and 2019. The 95% predicted confidence intervals based on standard errors of model estimates are
shown for each predicted value. Different lowerscript letters indicate differences (p<0.05) among distance
classes within each treatment (flower strip vs. without flower strips).
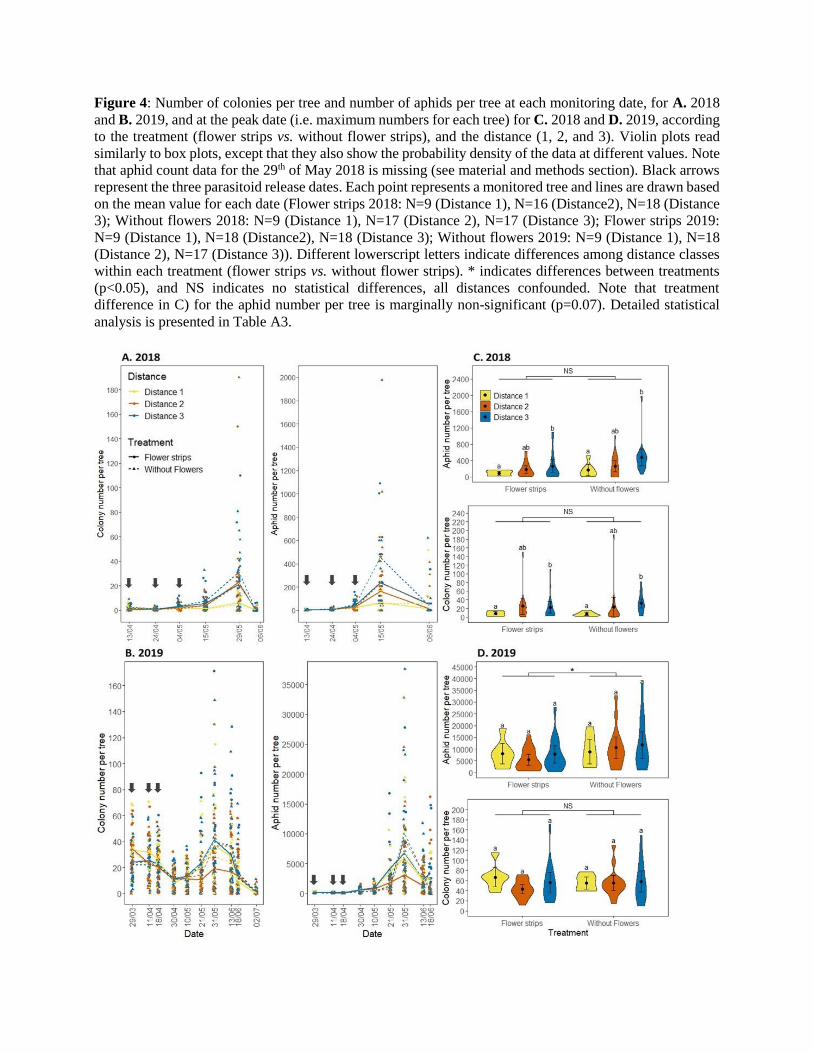
Figure 4: Number of colonies per tree and number of aphids per tree at each monitoring date, for A. 2018
and B. 2019, and at the peak date (i.e. maximum numbers for each tree) for C. 2018 and D. 2019, according
to the treatment (flower strips vs. without flower strips), and the distance (1, 2, and 3). Violin plots read
similarly to box plots, except that they also show the probability density of the data at different values. Note
that aphid count data for the 29th of May 2018 is missing (see material and methods section). Black arrows
represent the three parasitoid release dates. Each point represents a monitored tree and lines are drawn based
on the mean value for each date (Flower strips 2018: N=9 (Distance 1), N=16 (Distance2), N=18 (Distance
3); Without flowers 2018: N=9 (Distance 1), N=17 (Distance 2), N=17 (Distance 3); Flower strips 2019:
N=9 (Distance 1), N=18 (Distance2), N=18 (Distance 3); Without flowers 2019: N=9 (Distance 1), N=18
(Distance 2), N=17 (Distance 3)). Different lowerscript letters indicate differences among distance classes
within each treatment (flower strips vs. without flower strips). * indicates differences between treatments
(p<0.05), and NS indicates no statistical differences, all distances confounded. Note that treatment
difference in C) for the aphid number per tree is marginally non-significant (p=0.07). Detailed statistical
analysis is presented in Table A3.