flames user manual - eso.org
TRANSCRIPT
EUROPEAN SOUTHERN OBSERVATORY
Organisation Europeene pour des Recherches Astronomiques dans l’Hemisphere AustralEuropaische Organisation fur astronomische Forschung in der sudlichen Hemisphare
ESO - European Southern ObservatoryKarl-Schwarzschild Str. 2, D-85748 Garching bei Munchen
Very Large Telescope
Paranal Science Operations
FLAMES User Manual
Doc. No. VLT-MAN-ESO-13700-2994
Issue 97, Date 17/12/2015
D. GadottiPrepared . . . . . . . . . . . . . . . . . . . . . . . . . . . . . . . . . . . . . . . . . .
Date Signature
A. KauferApproved . . . . . . . . . . . . . . . . . . . . . . . . . . . . . . . . . . . . . . . . . .
Date Signature
S. MieskeReleased . . . . . . . . . . . . . . . . . . . . . . . . . . . . . . . . . . . . . . . . . .
Date Signature

FLAMES User Manual VLT-MAN-ESO-13700-2994 ii
This page was intentionally left blank

FLAMES User Manual VLT-MAN-ESO-13700-2994 iii
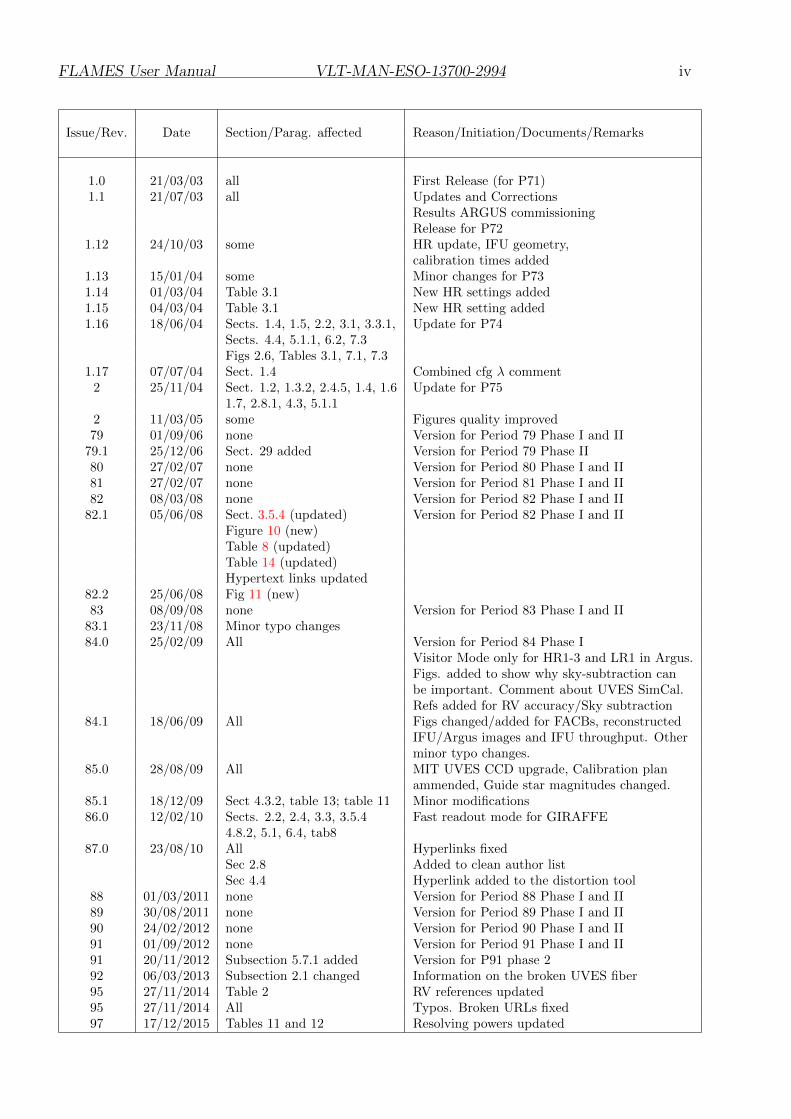
Change Record
FLAMES User Manual VLT-MAN-ESO-13700-2994 iv
Issue/Rev. Date Section/Parag. affected Reason/Initiation/Documents/Remarks
1.0 21/03/03 all First Release (for P71)1.1 21/07/03 all Updates and Corrections
Results ARGUS commissioningRelease for P72
1.12 24/10/03 some HR update, IFU geometry,calibration times added
1.13 15/01/04 some Minor changes for P731.14 01/03/04 Table 3.1 New HR settings added1.15 04/03/04 Table 3.1 New HR setting added1.16 18/06/04 Sects. 1.4, 1.5, 2.2, 3.1, 3.3.1, Update for P74
Sects. 4.4, 5.1.1, 6.2, 7.3Figs 2.6, Tables 3.1, 7.1, 7.3
1.17 07/07/04 Sect. 1.4 Combined cfg λ comment2 25/11/04 Sect. 1.2, 1.3.2, 2.4.5, 1.4, 1.6 Update for P75
1.7, 2.8.1, 4.3, 5.1.12 11/03/05 some Figures quality improved79 01/09/06 none Version for Period 79 Phase I and II
79.1 25/12/06 Sect. 29 added Version for Period 79 Phase II80 27/02/07 none Version for Period 80 Phase I and II81 27/02/07 none Version for Period 81 Phase I and II82 08/03/08 none Version for Period 82 Phase I and II
82.1 05/06/08 Sect. 3.5.4 (updated) Version for Period 82 Phase I and IIFigure 10 (new)Table 8 (updated)Table 14 (updated)Hypertext links updated
82.2 25/06/08 Fig 11 (new)83 08/09/08 none Version for Period 83 Phase I and II
83.1 23/11/08 Minor typo changes84.0 25/02/09 All Version for Period 84 Phase I
Visitor Mode only for HR1-3 and LR1 in Argus.Figs. added to show why sky-subtraction canbe important. Comment about UVES SimCal.Refs added for RV accuracy/Sky subtraction
84.1 18/06/09 All Figs changed/added for FACBs, reconstructedIFU/Argus images and IFU throughput. Otherminor typo changes.
85.0 28/08/09 All MIT UVES CCD upgrade, Calibration planammended, Guide star magnitudes changed.
85.1 18/12/09 Sect 4.3.2, table 13; table 11 Minor modifications86.0 12/02/10 Sects. 2.2, 2.4, 3.3, 3.5.4 Fast readout mode for GIRAFFE
4.8.2, 5.1, 6.4, tab887.0 23/08/10 All Hyperlinks fixed
Sec 2.8 Added to clean author listSec 4.4 Hyperlink added to the distortion tool
88 01/03/2011 none Version for Period 88 Phase I and II89 30/08/2011 none Version for Period 89 Phase I and II90 24/02/2012 none Version for Period 90 Phase I and II91 01/09/2012 none Version for Period 91 Phase I and II91 20/11/2012 Subsection 5.7.1 added Version for P91 phase 292 06/03/2013 Subsection 2.1 changed Information on the broken UVES fiber95 27/11/2014 Table 2 RV references updated95 27/11/2014 All Typos. Broken URLs fixed97 17/12/2015 Tables 11 and 12 Resolving powers updated
FLAMES User Manual VLT-MAN-ESO-13700-2994 v
This page was intentionally left (almost) blank
FLAMES User Manual VLT-MAN-ESO-13700-2994 vi
Contents
1 Introduction 1
1.1 On the Contents of the FLAMES User Manual . . . . . . . . . . . . . . . . . . 1
1.2 Information available outside this Manual . . . . . . . . . . . . . . . . . . . . 2
2 Capabilities of the Facility 3
2.1 UVES – FIBRE mode . . . . . . . . . . . . . . . . . . . . . . . . . . . . . . . 3
2.2 GIRAFFE . . . . . . . . . . . . . . . . . . . . . . . . . . . . . . . . . . . . . . 5
2.3 FLAMES Observing Modes . . . . . . . . . . . . . . . . . . . . . . . . . . . . 7
2.4 Limitations and Caveats . . . . . . . . . . . . . . . . . . . . . . . . . . . . . . 8
2.5 FLAMES within the VLT Observatory . . . . . . . . . . . . . . . . . . . . . . 10
2.6 High-resolution spectrographs at ESO La Silla . . . . . . . . . . . . . . . . . . 11
2.7 FLAMES Sample Observations and Calibrations . . . . . . . . . . . . . . . . . 11
2.8 Acknowledgment . . . . . . . . . . . . . . . . . . . . . . . . . . . . . . . . . . 12
2.9 Bibliography . . . . . . . . . . . . . . . . . . . . . . . . . . . . . . . . . . . . . 12
2.10 Glossary . . . . . . . . . . . . . . . . . . . . . . . . . . . . . . . . . . . . . . . 13
2.11 Abbreviations and Acronyms . . . . . . . . . . . . . . . . . . . . . . . . . . . 15
3 FLAMES Characteristics and Sub-Systems 16
3.1 Opto-mechanical Layout . . . . . . . . . . . . . . . . . . . . . . . . . . . . . . 16
3.2 Corrector . . . . . . . . . . . . . . . . . . . . . . . . . . . . . . . . . . . . . . 17
3.3 Fibre Positioner (OzPoz) . . . . . . . . . . . . . . . . . . . . . . . . . . . . . . 18
3.3.1 Positioner Performance Characteristics . . . . . . . . . . . . . . . . . . 20
3.4 Buttons and Fibre Systems . . . . . . . . . . . . . . . . . . . . . . . . . . . . . 20
3.4.1 Magnetic Buttons . . . . . . . . . . . . . . . . . . . . . . . . . . . . . . 21
3.4.2 UVES Fibres . . . . . . . . . . . . . . . . . . . . . . . . . . . . . . . . 22
3.4.3 MEDUSA Fibres . . . . . . . . . . . . . . . . . . . . . . . . . . . . . . 23
3.4.4 IFU Fibres . . . . . . . . . . . . . . . . . . . . . . . . . . . . . . . . . . 25
3.4.5 IFU Orientation . . . . . . . . . . . . . . . . . . . . . . . . . . . . . . . 26
3.4.6 ARGUS Fibres . . . . . . . . . . . . . . . . . . . . . . . . . . . . . . . 26
3.5 GIRAFFE . . . . . . . . . . . . . . . . . . . . . . . . . . . . . . . . . . . . . . 26
3.5.1 Slit Unit . . . . . . . . . . . . . . . . . . . . . . . . . . . . . . . . . . . 26
3.5.2 Filters and the Filter Wheel . . . . . . . . . . . . . . . . . . . . . . . . 28
3.5.3 Dioptric Spectrograph . . . . . . . . . . . . . . . . . . . . . . . . . . . 28
3.5.4 GIRAFFE scientific CCD “Carreras” . . . . . . . . . . . . . . . . . . . 29
3.5.5 Spectral Format and Efficiency . . . . . . . . . . . . . . . . . . . . . . 32
3.5.6 GIRAFFE Setup Stability and Repeatability . . . . . . . . . . . . . . . 33
3.5.7 GIRAFFE Calibration Units . . . . . . . . . . . . . . . . . . . . . . . . 33
3.6 UVES – FIBRE mode . . . . . . . . . . . . . . . . . . . . . . . . . . . . . . . 34
3.6.1 The RED Spectrograph Arm . . . . . . . . . . . . . . . . . . . . . . . . 34
3.6.2 Scientific CCD Mosaic “STING”+“ZEUS” . . . . . . . . . . . . . . . . 35
FLAMES User Manual VLT-MAN-ESO-13700-2994 vii
3.6.3 Spectral Resolution and Overall Efficiency . . . . . . . . . . . . . . . . 37
3.7 FLAMES Features and Problems . . . . . . . . . . . . . . . . . . . . . . . . . 38
3.7.1 Maximum reachable S/N ratio . . . . . . . . . . . . . . . . . . . . . . . 38
3.7.2 Enhanced Dark Current after a FIERA Start-up . . . . . . . . . . . . . 38
3.8 GIRAFFE Features and Problems . . . . . . . . . . . . . . . . . . . . . . . . . 39
3.8.1 Low counts in blue attached screen flatfields . . . . . . . . . . . . . . . 39
3.8.2 Contamination from Simultaneous Th-Ar Calibrations . . . . . . . . . 39
3.8.3 In-focus Ghosts and Scattered Light . . . . . . . . . . . . . . . . . . . 39
3.8.4 CCD Defects . . . . . . . . . . . . . . . . . . . . . . . . . . . . . . . . 39
3.9 UVES Features and Problems . . . . . . . . . . . . . . . . . . . . . . . . . . . 40
3.9.1 UVES SimCal lamp too bright for long exposures . . . . . . . . . . . . 40
3.9.2 Fibre Overlap in the 520 nm Setup . . . . . . . . . . . . . . . . . . . . 40
3.9.3 Fibre-to-fibre Contamination . . . . . . . . . . . . . . . . . . . . . . . . 40
3.9.4 Spectral Gaps in the RED . . . . . . . . . . . . . . . . . . . . . . . . . 42
3.9.5 Optical Ghosts in the far red Spectra . . . . . . . . . . . . . . . . . . . 42
3.9.6 CCD Cosmetic Defects . . . . . . . . . . . . . . . . . . . . . . . . . . . 42
4 Preparing the Observations 43
4.1 Introduction . . . . . . . . . . . . . . . . . . . . . . . . . . . . . . . . . . . . . 43
4.2 FLAMES Modes and basic Choices . . . . . . . . . . . . . . . . . . . . . . . . 44
4.3 GIRAFFE and UVES Standard Settings . . . . . . . . . . . . . . . . . . . . . 45
4.3.1 GIRAFFE Standard Settings . . . . . . . . . . . . . . . . . . . . . . . 45
4.3.2 UVES Standard Settings . . . . . . . . . . . . . . . . . . . . . . . . . . 47
4.4 Differential Atmospheric Effects . . . . . . . . . . . . . . . . . . . . . . . . . . 48
4.5 Preparing the Target Input Files . . . . . . . . . . . . . . . . . . . . . . . . . 52
4.5.1 Run FPOSS to Prepare the Target Setup Files . . . . . . . . . . . . . . 53
4.6 Broken and low-transmission fibres . . . . . . . . . . . . . . . . . . . . . . . . 54
4.7 Introducing the Observation Blocks . . . . . . . . . . . . . . . . . . . . . . . . 56
4.7.1 GIRAFFE and UVES Exposure Time Calculators . . . . . . . . . . . . 56
4.7.2 Choice of the Sample Target . . . . . . . . . . . . . . . . . . . . . . . . 56
4.7.3 Choice of Instrument Configuration and Spectral Format . . . . . . . . 57
4.7.4 Exposure Time and predicted Counts and S/N Ratios . . . . . . . . . . 57
4.8 P2PP tool . . . . . . . . . . . . . . . . . . . . . . . . . . . . . . . . . . . . . . 57
4.8.1 Acquisition Templates . . . . . . . . . . . . . . . . . . . . . . . . . . . 57
4.8.2 Observing Templates . . . . . . . . . . . . . . . . . . . . . . . . . . . . 58
4.8.3 Computing Time Overheads for your Programme . . . . . . . . . . . . 58
5 The Calibration of FLAMES Data 60
5.1 General Concept . . . . . . . . . . . . . . . . . . . . . . . . . . . . . . . . . . 60
5.2 Positioner Calibration Unit . . . . . . . . . . . . . . . . . . . . . . . . . . . . . 60
5.3 Nasmyth Screen . . . . . . . . . . . . . . . . . . . . . . . . . . . . . . . . . . . 61
FLAMES User Manual VLT-MAN-ESO-13700-2994 viii
5.4 Simultaneous Calibrations . . . . . . . . . . . . . . . . . . . . . . . . . . . . . 61
5.5 Longslit Calibrations . . . . . . . . . . . . . . . . . . . . . . . . . . . . . . . . 61
5.5.1 GIRAFFE Longslit Unit . . . . . . . . . . . . . . . . . . . . . . . . . . 61
5.6 The UVES Calibration Unit . . . . . . . . . . . . . . . . . . . . . . . . . . . . 62
5.7 Fibre to Fibre Transmission and Sky Subtraction issues . . . . . . . . . . . . . 62
5.7.1 New strategies for sky subtraction . . . . . . . . . . . . . . . . . . . . . 63
5.8 Special Calibrations . . . . . . . . . . . . . . . . . . . . . . . . . . . . . . . . . 63
5.8.1 Detector Flats . . . . . . . . . . . . . . . . . . . . . . . . . . . . . . . . 63
5.8.2 Use of Telluric Standard Stars to correct for Fringing or atmospheric Lines 63
5.9 FLAMES Science Calibration Plan . . . . . . . . . . . . . . . . . . . . . . . . 66
6 FLAMES Observing Operations 68
6.1 During the Night . . . . . . . . . . . . . . . . . . . . . . . . . . . . . . . . . . 68
6.2 Pointing and Guiding . . . . . . . . . . . . . . . . . . . . . . . . . . . . . . . . 69
6.3 ARGUS fast observations . . . . . . . . . . . . . . . . . . . . . . . . . . . . . . 70
6.4 Evaluation of the Results, Offline Data Analysis . . . . . . . . . . . . . . . . . 70
6.5 FLAMES Raw Data Structure . . . . . . . . . . . . . . . . . . . . . . . . . . . 71
6.5.1 HDU2: OzPoz table . . . . . . . . . . . . . . . . . . . . . . . . . . . . 71
6.5.2 HDU3: FLAMES FIBRE Table . . . . . . . . . . . . . . . . . . . . . . 72
7 Appendix 75
7.1 FLAMES Raw Data Spectral Format . . . . . . . . . . . . . . . . . . . . . . . 75
7.1.1 GIRAFFE - MEDUSA . . . . . . . . . . . . . . . . . . . . . . . . . . . 76
7.1.2 GIRAFFE - IFU . . . . . . . . . . . . . . . . . . . . . . . . . . . . . . 77
7.1.3 GIRAFFE - ARGUS . . . . . . . . . . . . . . . . . . . . . . . . . . . . 79
7.1.4 UVES - FIBRE . . . . . . . . . . . . . . . . . . . . . . . . . . . . . . . 80
7.2 Characteristics of GIRAFFE Filters . . . . . . . . . . . . . . . . . . . . . . . 81
7.3 FLAMES calibration times . . . . . . . . . . . . . . . . . . . . . . . . . . . . . 86
7.4 Comparison between old and new HR gratings . . . . . . . . . . . . . . . . . . 86
List of Figures
1 Schematic view of an Integral Field Unit . . . . . . . . . . . . . . . . . . . . . 6
2 MEDUSA entrance losses due to fibre-object decentering . . . . . . . . . . . . 9
3 View of the Fibre Positioner and GIRAFFE on the Nasmyth A Platform . . . 16
4 TCCD image of the Fiducial Stars . . . . . . . . . . . . . . . . . . . . . . . . . 19
5 Histogram of Fibre Transmission at 600 nm . . . . . . . . . . . . . . . . . . . . 21
6 UVES Fibre Bundles and Slit Geometry . . . . . . . . . . . . . . . . . . . . . 22
7 Schematic view of Microlenses . . . . . . . . . . . . . . . . . . . . . . . . . . . 24
8 MEDUSA Fibre Bundles and Slit Geometry . . . . . . . . . . . . . . . . . . . 25
9 ARGUS Microlens Array and Slit Geometry . . . . . . . . . . . . . . . . . . . 27
FLAMES User Manual VLT-MAN-ESO-13700-2994 ix
10 Quantum Efficiency ratio New chip/Old chip . . . . . . . . . . . . . . . . . . . 29
11 Fringing: Old and New chip comparison . . . . . . . . . . . . . . . . . . . . . 30
12 GIRAFFE Spectral Format and Slit Curvature . . . . . . . . . . . . . . . . . . 32
13 QE Zeus / Nigel . . . . . . . . . . . . . . . . . . . . . . . . . . . . . . . . . . . 37
14 Finging for Zeus and Nigel . . . . . . . . . . . . . . . . . . . . . . . . . . . . . 38
15 UVES Fibre-to-Fibre Contamination . . . . . . . . . . . . . . . . . . . . . . . 41
16 Atmospheric Dispersion Effects at 9 arcmin from center . . . . . . . . . . . . . 49
17 Atmospheric Dispersion Effects at 12.5 arcmin from center . . . . . . . . . . . 50
18 Chromatic Atmospheric Dispersion Effects . . . . . . . . . . . . . . . . . . . . 51
19 FPOSS Sample Input File . . . . . . . . . . . . . . . . . . . . . . . . . . . . . 53
20 Raw GIRAFFE IFU images of the solar spectrum on plate 1 (top) and plate2 (bottom) taken in May 2009. Variations in the IFU responses on each plateare clear although the absolute level depends on the solar illumination so thisfigure should not be used to compare the two plates. . . . . . . . . . . . . . . 55
21 Image taken at L881.7-nm showing many sky lines . . . . . . . . . . . . . . . . 64
22 Extracted spectra at L881.7 . . . . . . . . . . . . . . . . . . . . . . . . . . . . 65
23 Argus reconstructed image with Argus position angle in the acquisition set to+45 degrees. Top panel: Original pointing. Bottom panel: Telescope movedby 1.0 arcseconds North and 1.0 arcseconds East i.e. the object moves 1.0arcseconds South and 1.0 arcseconds West on ARGUS. . . . . . . . . . . . . . 74
24 GIRAFFE - MEDUSA Spectral Format . . . . . . . . . . . . . . . . . . . . . . 76
25 GIRAFFE - IFU Spectral Format . . . . . . . . . . . . . . . . . . . . . . . . . 77
26 Reconstructed image of 15 IFU units produced by the pipeline. . . . . . . . . . 78
27 GIRAFFE - ARGUS Spectral Format . . . . . . . . . . . . . . . . . . . . . . . 79
28 UVES - FIBRE Spectral Format . . . . . . . . . . . . . . . . . . . . . . . . . . 80
29 GIRAFFE Filters HR 01-06 . . . . . . . . . . . . . . . . . . . . . . . . . . . . 81
30 GIRAFFE Filters HR 07-12 . . . . . . . . . . . . . . . . . . . . . . . . . . . . 82
31 GIRAFFE Filters HR 13-18 . . . . . . . . . . . . . . . . . . . . . . . . . . . . 83
32 GIRAFFE Filters HR 19-22, LR 01-02 . . . . . . . . . . . . . . . . . . . . . . 84
33 GIRAFFE Filters LR 03-08 . . . . . . . . . . . . . . . . . . . . . . . . . . . . 85
FLAMES User Manual VLT-MAN-ESO-13700-2994 1
1 Introduction
1.1 On the Contents of the FLAMES User Manual
The current version of the FLAMES user manual is available online as a retrievable pdf fileat the FLAMES ESO home page:
http://www.eso.org/sci/facilities/paranal/instruments/flames/doc/
Prior to the observing proposal application and/or phase 2 announcements, the User Manualis usually updated; any significant changes are announced on the FLAMES web pages. Ifyou do not have access to the WWW, a printed copy can be requested from ESO’s VisitingAstronomers Section (e-mail: [email protected]) in Garching, Germany. Paper copies of anew version of the FLAMES User Manual are printed out only after a major revision of thedocument.
Chapter 2 is addressed to users who are not familiar with the FLAMES facility and who areinterested in a quick overview of its capabilities, as in the case of similar VLT (and LaSilla) instruments. This should enable a potential user to select the best instrument for agiven observing program. It also includes information on how to access FITS files of referenceFLAMES spectra and a glossary of terms used in the Manual.
Chapter 3 provides the description of the instrument: the instrument layout (§ 3.1),its main components (Corrector, § 3.2; Fibre Positioner, § 3.3, Fibre System, § 3.4), theproperties of GIRAFFE and UVES (§ 3.5, 3.6) spectrographs, including their resolving powerand overall efficiency. In addition, it contains the requirements to be kept in mind whileplanning the observations or reducing the data. It can be consulted by users who want toprepare an Observing Proposal (Phase I), but should definitely be read by those who havebeen granted observing time and have to prepare their observations (Phase II). In particular,the description of the Atmospheric Effects affecting FLAMES observations andtheir consequences on planning and optimizing the observations is of fundamentalimportance. In particular, for MEDUSA mode the relative astrometry should bebetter than 0.3 arcseconds for all targets.
Chapter 4 presents the basic information needed to prepare an observing programme:thevarious observing modes (§ 4.2), the standard wavelength settings (§ 4.3), and a description ofthe Exposure Time Calculator (§ 4.7.1). This chapter explains how to prepare a targetinput file and how to generate a positioner allocation file. It assumes that the readeris familiar with the fibre assignment software (FPOSS) and with the FLAMES templates. TheFPOSS manual and template descriptions are provided as separate documents and releasedbefore Phase II.
Chapter 5 deals with the calibration strategy (wavelength, flat-fielding, relative and abso-lute calibrations) of the data obtained in standard operation. It also outlines the calibrationtechniques for high velocity accuracy and demanding sky subtraction. Chapter 6 provides in-formation for the visiting astronomers who come to the Paranal Observatory to use FLAMES.A description of the raw data format is presented in § 6.5.
The detailed technical information on the instrument (e.g., transmission curves of theGIRAFFE filters) can be found in the Appendices (Chapter 7).
The FLAMES Templates Reference Guide [1] contains detailed instructions for the use
FLAMES User Manual VLT-MAN-ESO-13700-2994 2
of the observing and calibration templates. The FPOSS manual [2] illustrates the use ofthe positioner software for the allocations of the fibres to the objects are given as separatedocuments, although they should be considered by the user as PART of the present manual.
1.2 Information available outside this Manual
If you cannot find a specific piece of information in the FLAMES User Manual or in caseyou have remaining questions, please check http://www.eso.org/sci/observing/ or morespecifically:
• For information on the instrument performance, Phase I, and Phase II proposal prepa-ration, please contact the User Support Division ([email protected]).
• For Phase II preparation of Service Mode Observation Blocks (OBs) follow the instruc-tions given in the FLAMES-specific P2PP page:
http://www.eso.org/observing/p2pp/FLAMES/FLAMES-P2PP.html
• For questions directly related to your granted observing run in Visitor Mode, pleasecontact Paranal Science Operations ([email protected] and [email protected]). Visitor modespecific information on FLAMES is found at:
http://www.eso.org/sci/facilities/paranal/instruments/flames/visitor.html
• For updates on the instrument not yet recorded in the current version of the user manual,consult the FLAMES web page at:
http://www.eso.org/sci/facilities/paranal/instruments/flames/
• For technical information on the instrument not related to an observing programme, con-tact: optics and mechanics: Hans Dekker ([email protected]); the electronics systems:Walter Nees ([email protected]); the CCD detector systems Roland Reiss ([email protected]);the instrument software Peter Biereichel ([email protected]); fibres and fibre systemGerardo Avila ([email protected]).
FLAMES User Manual VLT-MAN-ESO-13700-2994 3
2 Capabilities of the Facility
FLAMES is the multi-object, intermediate and high resolution fibre facility of the VLT.Mounted at the Nasmyth A platform of UT2 it offers a rather large corrected field of view(25 arcmin diameter).
In 2008 FLAMES completed 6 years of operations at the VLT and a conference was held tocelebrate this. The presentations are available at the workshop page at http://www.eso.org/sci/facilities/paranal/instruments/flames/doc/FLAMES_6th_Anniversary/FLAMES_6th_
Anniversary.html. It gives the reader a flavour of the science to date performed with theinstrument.
FLAMES consists of several components:
• An optical Corrector, providing excellent image quality and tele-centricity over the fullfield of view of 25 arcmin diameter.
• A Fibre Positioner hosting two plates. While one plate is observing, the other one ispositioning the fibres for the subsequent observations, therefore limiting the dead timebetween observations to less than 15 minutes.
• A link to the UVES spectrograph (RED arm) via eight single object fibres per plate.
• A high and intermediate resolution optical spectrograph, GIRAFFE, with its own fibresystems in three possible configurations: MEDUSA, IFU, ARGUS.
• A coordinating observing software system, that allows simultaneous UVES and GI-RAFFE observations.
The operation of FLAMES requires that the observer has her/his own targetcoordinate list, with a relative astrometric accuracy better than ∼ 0.3 arcsec (rms)at the time of the Phase 2 proposal preparation.
The minimum object separation is 11 arcsec, which is limited entirely by the size of themagnetic buttons. The Fibre Positioner is able to position the fibres with an accuracy betterthan ±0.1 arcsec (peak–to–peak).
In addition to the targets, the user must also provide coordinates for one VLT guide star andfour fiducial stars in the same astrometric solution as the targets. The VLT guide star is usedto first point the telescope and to close the active optics loop, while the four fiducials are usedto correct this pointing for further small offsets in coordinates due to corrections of the fieldgeometry. Ideally it should have an R-magnitude of between ∼9–11.
2.1 UVES – FIBRE mode
UVES is the high resolution spectrograph of the VLT UT2. It has been designed for workingin slit mode only but was modified to add a fibre mode on its RED arm. Each positionerplate has eight fibres connected to the red arm of UVES. In 520-nm mode only 6 of these areavailable. With an aperture on the sky of 1 arcsec, the fibres project onto five UVES pixels inthe dispersion direction giving a resolving power of ∼ 47000.
FLAMES User Manual VLT-MAN-ESO-13700-2994 4
Spectro. Mode N. Objects Aperture [′′] R Cover.
UVES RED 8 (with sky) 1.0 47000 200UVES7 RED 7 (with sky) 1.0 47000 200
+1 Simul. Calib.
GIRAF HR MEDUSA 131a (with sky) 1.2 19000† λ/22 – λ/12GIRAF LR MEDUSA 131a (with sky) 1.2 7000† λ/9.5GIRAF HR IFU 15 (+15 sky) 2×3 30000† λ/22 – λ/12GIRAF LR IFU 15 (+15 sky) 2×3 11000† λ/9.5GIRAF HR ARGUS 1 11.5×7.3 30000† λ/22 – λ/12
or 6.6×4.2GIRAF LR ARGUS 1 11.5×7.3 11000† λ/9.5
or 6.6×4.2
Spectro. Mode V S/N=10 V S/N=30 ”/pix RV accuracy\
UVES RED 17.5 15.5 0.18 300 m s−1
UVES7 RED 17.5 15.5 0.18 30 m s−1
GIRAF HR MEDUSA 19.3 17.4 0.19 150 m s−1
GIRAF LR MEDUSA 19.9 18.0 0.19 300 m s−1
GIRAF HR IFU 17.9‡ 15.9‡ 0.19 150 m s−1
GIRAF LR IFU 18.5‡ 16.5‡ 0.19 300 m s−1
GIRAF HR ARGUS 17.9‡ 15.9‡ 0.19 150 m s−1
GIRAF LR ARGUS 18.5‡ 16.5‡ 0.19 300 m s−1
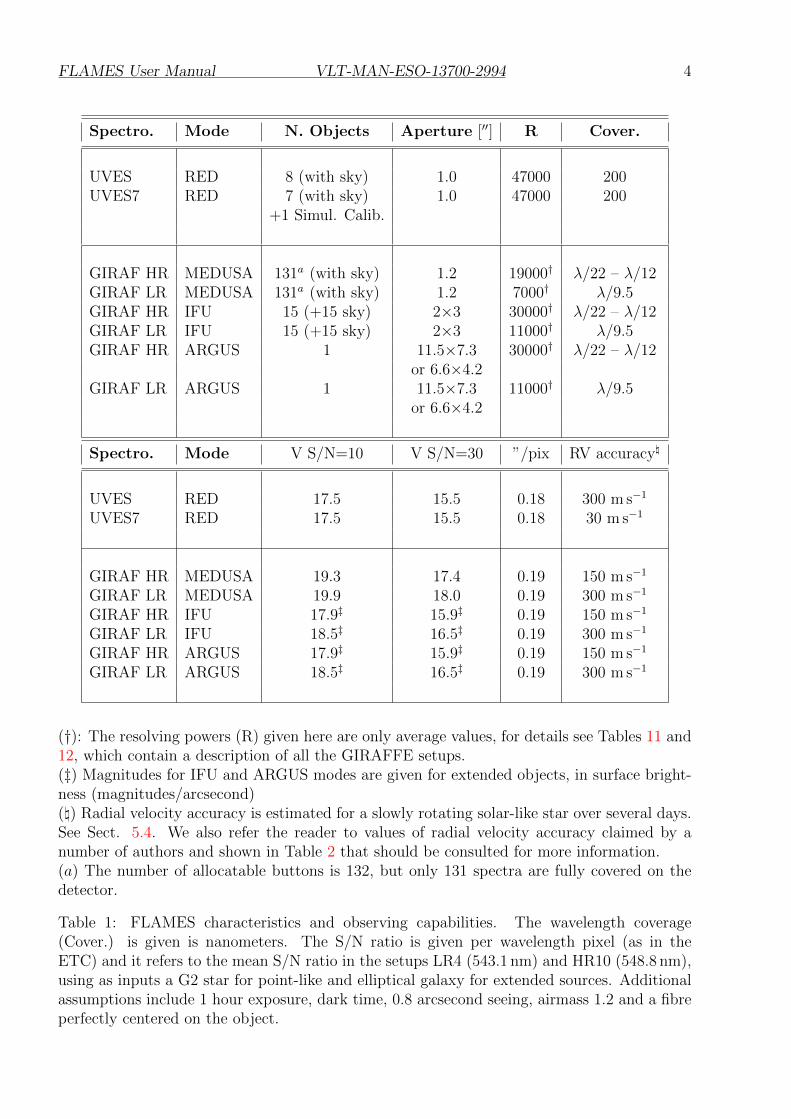
(†): The resolving powers (R) given here are only average values, for details see Tables 11 and12, which contain a description of all the GIRAFFE setups.(‡) Magnitudes for IFU and ARGUS modes are given for extended objects, in surface bright-ness (magnitudes/arcsecond)(\) Radial velocity accuracy is estimated for a slowly rotating solar-like star over several days.See Sect. 5.4. We also refer the reader to values of radial velocity accuracy claimed by anumber of authors and shown in Table 2 that should be consulted for more information.(a) The number of allocatable buttons is 132, but only 131 spectra are fully covered on thedetector.
Table 1: FLAMES characteristics and observing capabilities. The wavelength coverage(Cover.) is given is nanometers. The S/N ratio is given per wavelength pixel (as in theETC) and it refers to the mean S/N ratio in the setups LR4 (543.1 nm) and HR10 (548.8 nm),using as inputs a G2 star for point-like and elliptical galaxy for extended sources. Additionalassumptions include 1 hour exposure, dark time, 0.8 arcsecond seeing, airmass 1.2 and a fibreperfectly centered on the object.
FLAMES User Manual VLT-MAN-ESO-13700-2994 5
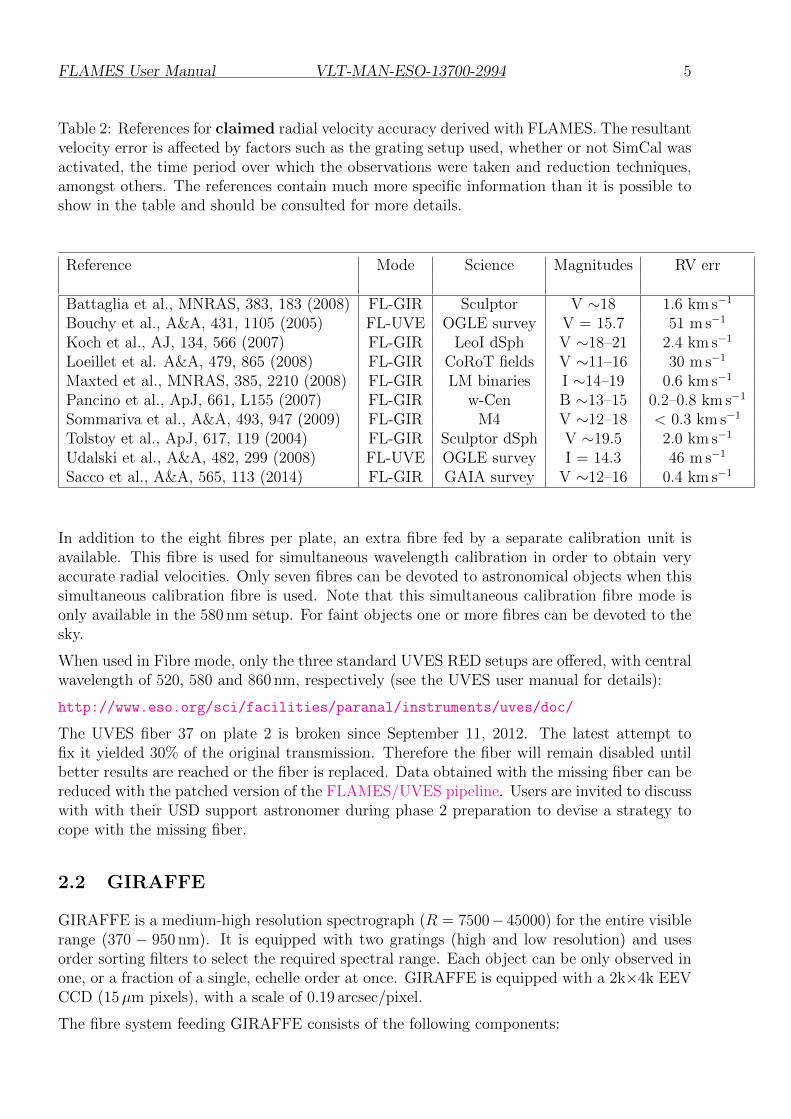
Table 2: References for claimed radial velocity accuracy derived with FLAMES. The resultantvelocity error is affected by factors such as the grating setup used, whether or not SimCal wasactivated, the time period over which the observations were taken and reduction techniques,amongst others. The references contain much more specific information than it is possible toshow in the table and should be consulted for more details.
Reference Mode Science Magnitudes RV err
Battaglia et al., MNRAS, 383, 183 (2008) FL-GIR Sculptor V ∼18 1.6 km s−1
Bouchy et al., A&A, 431, 1105 (2005) FL-UVE OGLE survey V = 15.7 51 m s−1
Koch et al., AJ, 134, 566 (2007) FL-GIR LeoI dSph V ∼18–21 2.4 km s−1
Loeillet et al. A&A, 479, 865 (2008) FL-GIR CoRoT fields V ∼11–16 30 m s−1
Maxted et al., MNRAS, 385, 2210 (2008) FL-GIR LM binaries I ∼14–19 0.6 km s−1
Pancino et al., ApJ, 661, L155 (2007) FL-GIR w-Cen B ∼13–15 0.2–0.8 km s−1
Sommariva et al., A&A, 493, 947 (2009) FL-GIR M4 V ∼12–18 < 0.3 km s−1
Tolstoy et al., ApJ, 617, 119 (2004) FL-GIR Sculptor dSph V ∼19.5 2.0 km s−1
Udalski et al., A&A, 482, 299 (2008) FL-UVE OGLE survey I = 14.3 46 m s−1
Sacco et al., A&A, 565, 113 (2014) FL-GIR GAIA survey V ∼12–16 0.4 km s−1
In addition to the eight fibres per plate, an extra fibre fed by a separate calibration unit isavailable. This fibre is used for simultaneous wavelength calibration in order to obtain veryaccurate radial velocities. Only seven fibres can be devoted to astronomical objects when thissimultaneous calibration fibre is used. Note that this simultaneous calibration fibre mode isonly available in the 580 nm setup. For faint objects one or more fibres can be devoted to thesky.
When used in Fibre mode, only the three standard UVES RED setups are offered, with centralwavelength of 520, 580 and 860 nm, respectively (see the UVES user manual for details):
http://www.eso.org/sci/facilities/paranal/instruments/uves/doc/
The UVES fiber 37 on plate 2 is broken since September 11, 2012. The latest attempt tofix it yielded 30% of the original transmission. Therefore the fiber will remain disabled untilbetter results are reached or the fiber is replaced. Data obtained with the missing fiber can bereduced with the patched version of the FLAMES/UVES pipeline. Users are invited to discusswith with their USD support astronomer during phase 2 preparation to devise a strategy tocope with the missing fiber.
2.2 GIRAFFE
GIRAFFE is a medium-high resolution spectrograph (R = 7500−45000) for the entire visiblerange (370 − 950 nm). It is equipped with two gratings (high and low resolution) and usesorder sorting filters to select the required spectral range. Each object can be only observed inone, or a fraction of a single, echelle order at once. GIRAFFE is equipped with a 2k×4k EEVCCD (15µm pixels), with a scale of 0.19 arcsec/pixel.
The fibre system feeding GIRAFFE consists of the following components:
FLAMES User Manual VLT-MAN-ESO-13700-2994 6
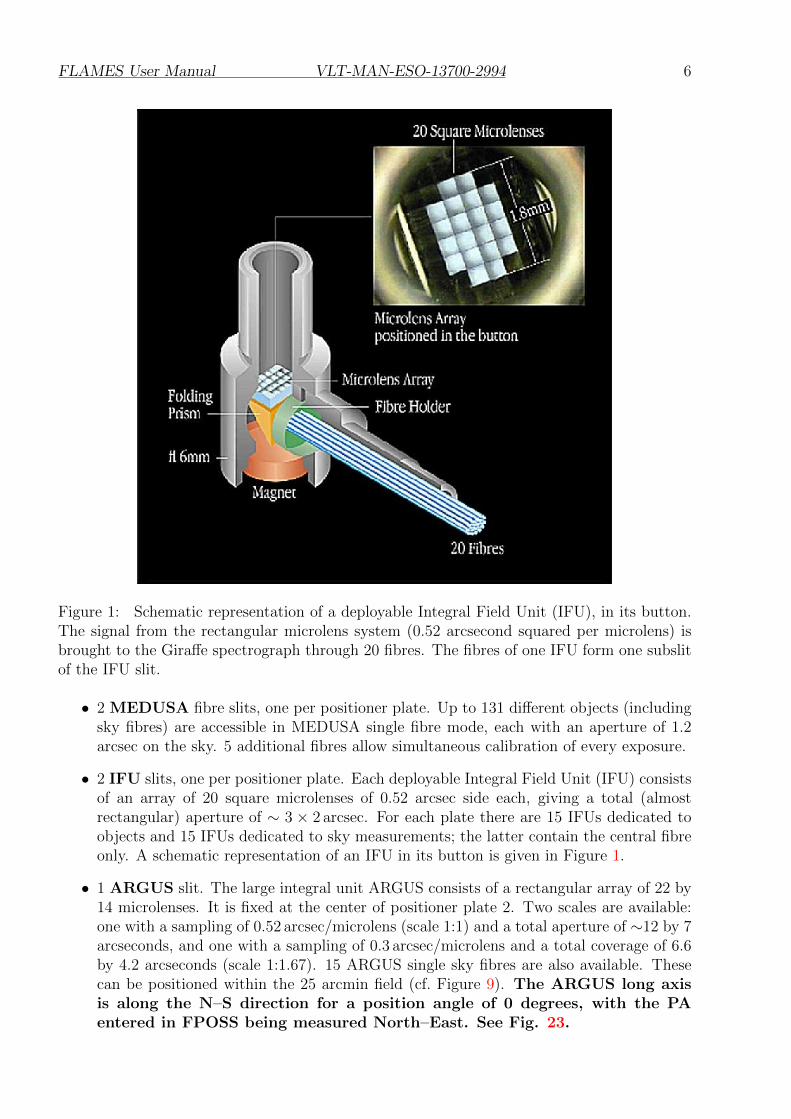
Figure 1: Schematic representation of a deployable Integral Field Unit (IFU), in its button.The signal from the rectangular microlens system (0.52 arcsecond squared per microlens) isbrought to the Giraffe spectrograph through 20 fibres. The fibres of one IFU form one subslitof the IFU slit.
• 2 MEDUSA fibre slits, one per positioner plate. Up to 131 different objects (includingsky fibres) are accessible in MEDUSA single fibre mode, each with an aperture of 1.2arcsec on the sky. 5 additional fibres allow simultaneous calibration of every exposure.
• 2 IFU slits, one per positioner plate. Each deployable Integral Field Unit (IFU) consistsof an array of 20 square microlenses of 0.52 arcsec side each, giving a total (almostrectangular) aperture of ∼ 3 × 2 arcsec. For each plate there are 15 IFUs dedicated toobjects and 15 IFUs dedicated to sky measurements; the latter contain the central fibreonly. A schematic representation of an IFU in its button is given in Figure 1.
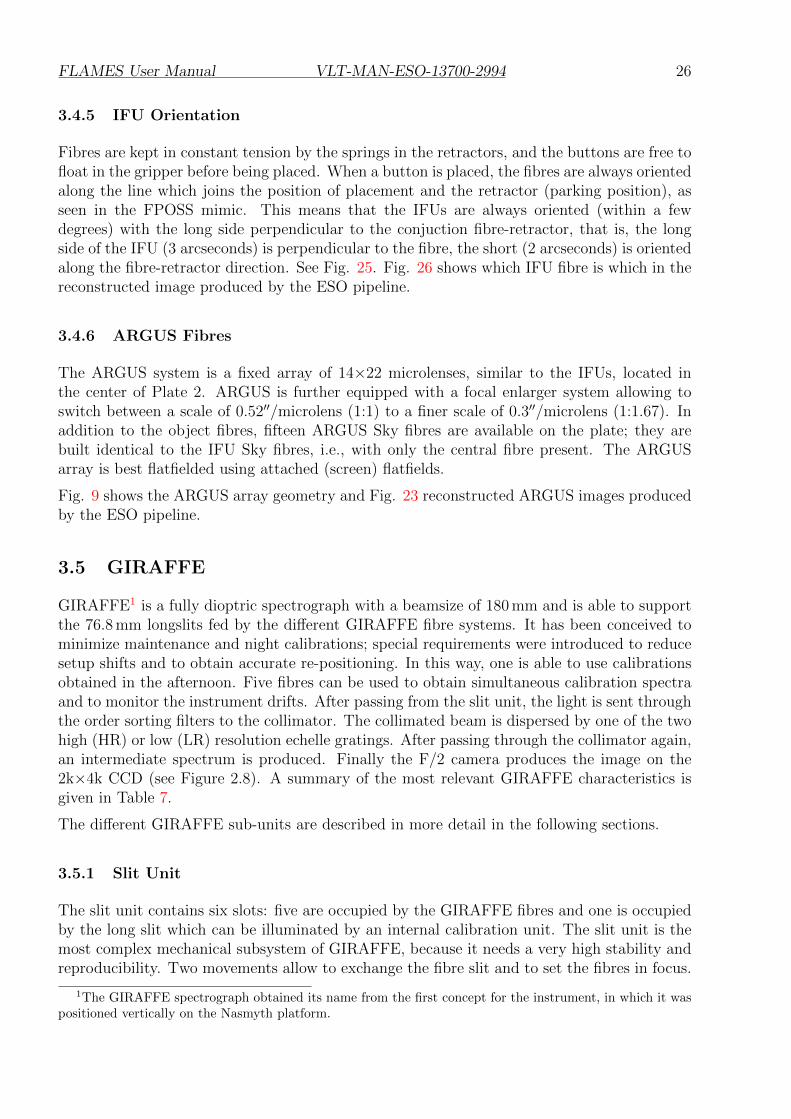
• 1 ARGUS slit. The large integral unit ARGUS consists of a rectangular array of 22 by14 microlenses. It is fixed at the center of positioner plate 2. Two scales are available:one with a sampling of 0.52 arcsec/microlens (scale 1:1) and a total aperture of ∼12 by 7arcseconds, and one with a sampling of 0.3 arcsec/microlens and a total coverage of 6.6by 4.2 arcseconds (scale 1:1.67). 15 ARGUS single sky fibres are also available. Thesecan be positioned within the 25 arcmin field (cf. Figure 9). The ARGUS long axisis along the N–S direction for a position angle of 0 degrees, with the PAentered in FPOSS being measured North–East. See Fig. 23.
FLAMES User Manual VLT-MAN-ESO-13700-2994 7
Users should pay attention to the small list of broken fibres (see Sec. 4.6).
GIRAFFE is operated with 39 fixed setups (31 high resolution + 8 low resolution) whosecharacteristics are given in Table 11 and Table 12. In addition to the normal readout mode of225KHz, 1x1, high gain, a new fast readout mode of 625KHz, 1x1, low gain is offered in P86in visitor mode.
For performance estimates (based on measured transmission curves and performances) theuser is referred to the Exposure Time Calculator at http://www.eso.org/observing/etc/
A summary of the GIRAFFE characteristics is given in Table 1, including estimated bestperformance S/N ratios.
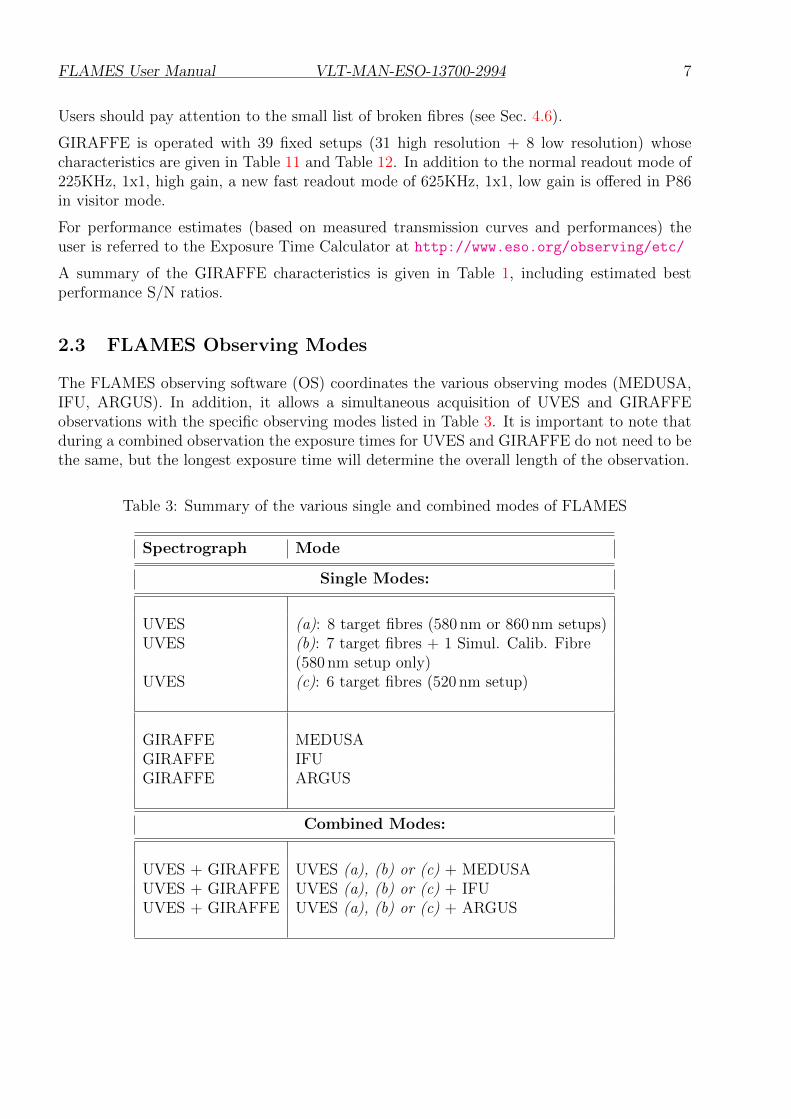
2.3 FLAMES Observing Modes
The FLAMES observing software (OS) coordinates the various observing modes (MEDUSA,IFU, ARGUS). In addition, it allows a simultaneous acquisition of UVES and GIRAFFEobservations with the specific observing modes listed in Table 3. It is important to note thatduring a combined observation the exposure times for UVES and GIRAFFE do not need to bethe same, but the longest exposure time will determine the overall length of the observation.
Table 3: Summary of the various single and combined modes of FLAMES
Spectrograph Mode
Single Modes:
UVES (a): 8 target fibres (580 nm or 860 nm setups)UVES (b): 7 target fibres + 1 Simul. Calib. Fibre
(580 nm setup only)UVES (c): 6 target fibres (520 nm setup)
GIRAFFE MEDUSAGIRAFFE IFUGIRAFFE ARGUS
Combined Modes:
UVES + GIRAFFE UVES (a), (b) or (c) + MEDUSAUVES + GIRAFFE UVES (a), (b) or (c) + IFUUVES + GIRAFFE UVES (a), (b) or (c) + ARGUS
FLAMES User Manual VLT-MAN-ESO-13700-2994 8
2.4 Limitations and Caveats
FLAMES is a complex instrument because of the different modes available and the multi-object capability. In order to operate it efficiently, a number of limitations had to be imposed.
• The observer is responsible for the accuracy of the input catalogue. A relativeaccuracy of better than 0.3 arcseconds (rms) is required to limit the lossesdue to fibre-object mismatch. VLT guide star and fiducial stars must havecoordinates in the same reference system as the objects.
No cross check of the coordinates supplied by the user is performed by ESO. The qualityof the astrometry remains fully the observer’s responsibility. Common errors includeusing a mix of astrometric systems, not correcting for stellar proper mo-tions and assuming that bright stars always have accurate coordinates (theydon’t....).
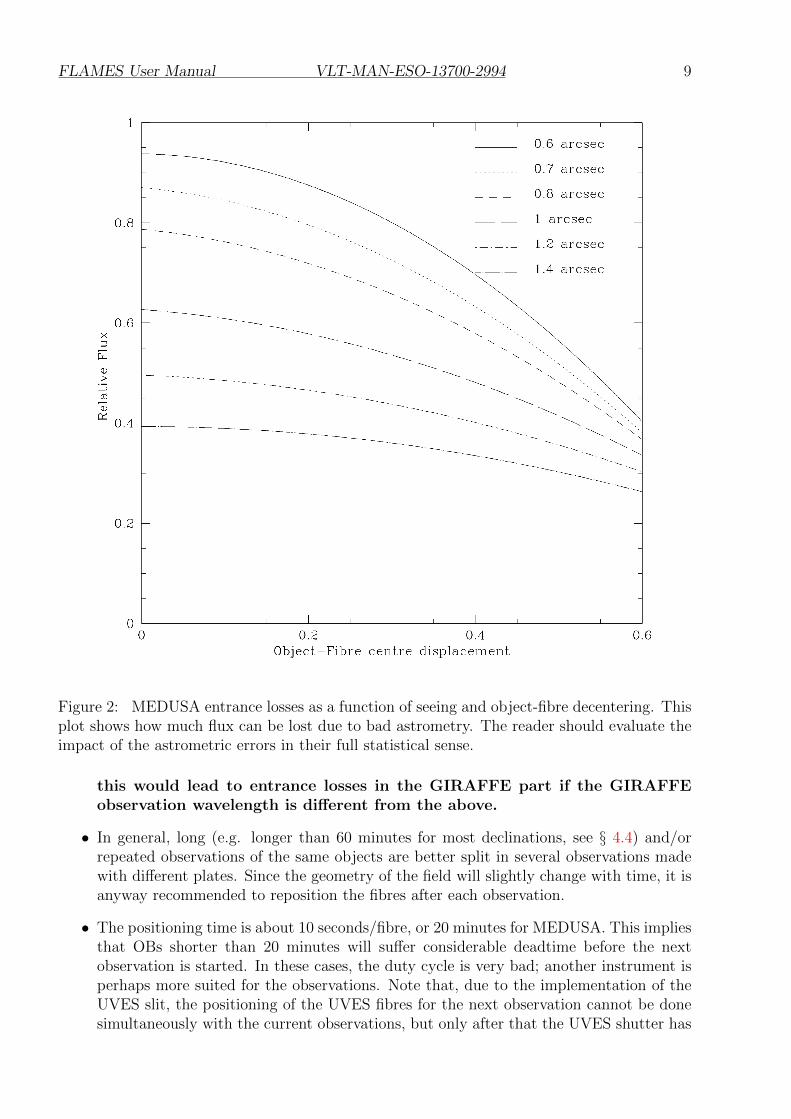
Figure 2 shows the amount of flux lost in a MEDUSA fibre as a function of seeing andfibre-to-object decentering (in fraction of arcseconds); it is evident as bad coordinatesmay spoil completely the predicted performance. The reader should consider the fullimplications of the statistical meaning of the astrometric accuracy; if it is too bad, someof the objects will not get light at all!. This factor is even more important for the UVESfibres which are 1.0 arcseconds in diameter as opposed to 1.2 arcseconds for MEDUSAfibres.
• Given the high number of possible configurations, the spectral format is fixed for bothGIRAFFE and UVES: no CCD binning, only one CCD readout speed in service modeand a possibility to use a fast readout mode in visitor mode only, no tuning of thewavelength, no change in resolving power are possible.
• Since the day-time calibration procedure is rather long (up to several minutes/setup,especially in the bluest setups) only a limited number of setups may be allowed pernight, both in service and visitor modes.
• Screen flats in the blue are very time consuming and may not provide sufficient counts toflatfield the data well. Hence starting from P84, ARGUS settings HR1, HR2, HR3 andLR1 need to be observed in visitor mode only. This only affects Argus; all Medusaand IFU settings will continue to be observed in Service or Visitor mode.
• The atmospheric effects depend on the wavelength of observation. The VLT pointingand guiding is made for a given wavelength. While it is possible in P2PP to specifytwo different observing wavelengths for the UVES and GIRAFFE fibres, the VLT willpoint and guide only to the GIRAFFE wavelength in this combined mode.This implies that the pointing will be correct, but if the airmass is changing drasticallyduring the observations and the UVES and GIRAFFE wavelengths differ dramatically,then the UVES λ is disregarded and the UVES fibres may loose a considerable amountof light. For the same reason, it is important that if the observer wishes to observethe same objects at different wavelengths, two OBs (and therefore two different fibrepositionings) are made, repositioning the fibres for the correct wavelength. We finallynote that in a combined observation, if the UVES part is more important,then the GIRAFFE configuration wavelength can be chosen to be close to theUVES wavelength e.g. H572.8 in the case of using UVES-580 nm. Of course,
FLAMES User Manual VLT-MAN-ESO-13700-2994 9
Figure 2: MEDUSA entrance losses as a function of seeing and object-fibre decentering. Thisplot shows how much flux can be lost due to bad astrometry. The reader should evaluate theimpact of the astrometric errors in their full statistical sense.
this would lead to entrance losses in the GIRAFFE part if the GIRAFFEobservation wavelength is different from the above.
• In general, long (e.g. longer than 60 minutes for most declinations, see § 4.4) and/orrepeated observations of the same objects are better split in several observations madewith different plates. Since the geometry of the field will slightly change with time, it isanyway recommended to reposition the fibres after each observation.
• The positioning time is about 10 seconds/fibre, or 20 minutes for MEDUSA. This impliesthat OBs shorter than 20 minutes will suffer considerable deadtime before the nextobservation is started. In these cases, the duty cycle is very bad; another instrument isperhaps more suited for the observations. Note that, due to the implementation of theUVES slit, the positioning of the UVES fibres for the next observation cannot be donesimultaneously with the current observations, but only after that the UVES shutter has
FLAMES User Manual VLT-MAN-ESO-13700-2994 10
been closed. Repositioning of UVES fibres requires 90 seconds in total.
• The UVES simultaneous wavelength Th-Ar lamp can accept exposure times in the rangeof 3− 60 minutes for the 580 nm setup giving an acceptable level of exposure. Shorter orlonger exposure times, however, will result in under (and over) exposed Th-Ar referencespectra, respectively. These will not be accepted in Service Mode. In the 860 nm setuplong exposures would provide heavily saturated Ar lines, producing strong, persistentremnants. Neither the 860 or the 520 nm setups are offered with the simultaneouscalibration option.
• All observations must be prepared with the FPOSS preparatory tool (See § 4.5 and4.5.1 and the FPOSS manual). The Target Setup Files created by this tool must not bemodified by the user. This will cause the P2PP process to fail.
• The limited size of the MEDUSA and UVES fibres, together with the lack of informationon the object-fibre displacement makes it impossible to compute the amount of flux lost;therefore no absolute spectro-photometry can be obtained with these fibre systems.
Unlike other multi-object ESO instruments, FLAMES does not have pre-imaging capabilitiesto prepare target selection. This implies that astrometric lists must be prepared by theobserver. Experience with other similar instruments shows that most observation failures aredue to improper target preparation. Also, given the relatively large field, atmospheric effects(e.g., differential refraction and its variations, see § 4.4) may be relevant, and the reader isasked to consider them carefully when preparing the observations.
2.5 FLAMES within the VLT Observatory
A detailed overview of the different instruments on the VLT is given on the ESO homepageunder VLT Instrumentation:
http://www.eso.org/sci/facilities/paranal/instruments/
In the choice of the best instrument for a given observing programme, the following possibilitiesshould be considered:
VLT instruments that can perform spectroscopy in the UV-Visual-Red-regions(300− 1100 nm)
• FORS2 at UT1 is an instrument operated at Cassegrain and has MOS capabilitiesand masks where up to 200 slitlets can be inserted. The highest resolution possibleis ∼ 6000, although only with certain setups. See the FORS webpage for details athttp://www.eso.org/sci/facilities/paranal/instruments/fors/
• UVES at UT2 is the instrument which is closest to FLAMES in terms of spectralresolution. In slit mode, the resolving power of UVES can be up to 120 000. The UVESred arm is also part of FLAMES, but its blue arm (300 − 500 nm) is not connected toFLAMES. When used in slit mode, with a dichroic blue and red spectra can be recordedsimultaneously. This option is not available in UVES fibre mode with FLAMES.
When used in slit mode, the RED arm of UVES is about 2 times more efficient thanthe FLAMES fibre link. The multiplex advantage of using the FLAMES fibre link with
FLAMES User Manual VLT-MAN-ESO-13700-2994 11
respect to the slit mode can therefore be ≈ 3 − 4 (depending if one or more fibres arededicated to record the sky). This has to be considered just as a rough number, becausethe precise value will depend on the seeing and on resolving power adopted for UVESin slit mode.
GIRAFFE, in particular in IFU mode, can approach the typical resolution used withUVES, and its use can be considered as a valid alternative to UVES slit when severalsources are present in the field and a very large wavelength coverage is not required.
UVES is equipped with a Iodine cell for accurate radial velocity measurements. Whilethis system is likely more accurate than the multi-fibre system of FLAMES, it does notoffer multiplex capabilities. The UVES iodine cell cannot be used in combination withthe fibres because it is located in the focal plane of Nasmyth B, i.e., before the Fibrelink to FLAMES. See the UVES webpage for details:
http://www.eso.org/sci/facilities/paranal/instruments/uves/
• VIMOS at UT3 has a smaller field of view than FLAMES (a square of 14 × 14 arcmin-utes), but a higher multiplex gain (up to 400 mini-slits punched in to mask). The majordifference is the spectral format and a lower resolution (R = 4500 for a 0.5 arcsec wideslit). VIMOS also has a Integral Field Unit. This Unit is larger than the GIRAFFE-ARGUS: it may be as large as 60′′×60′′ with a resolving power of 300 or as large as30′′×30′′ with a resolving power of 2000. See the VIMOS webpage for details:
http://www.eso.org/sci/facilities/paranal/instruments/vimos/
• Xshooter at UT2 is designed to cover the spectral range from∼300–2480-nm at mediumresolution. See the ESO website for the current status of this instrument:
http://www.eso.org/sci/facilities/paranal/instruments/xshooter/
2.6 High-resolution spectrographs at ESO La Silla
High-dispersion, echelle format spectrographs available at ESO La Silla include FEROS atthe MPG/ESO 2.2m telescope (R ∼ 48,000), (check call for proposals to see if it is offered),and HARPS (R ∼ 110,000)at the ESO 3.6m telescope. Information on these instrumentscan be found at http://www.ls.eso.org/lasilla/sciops
2.7 FLAMES Sample Observations and Calibrations
A large number of scientific observations of a variety of targets and their associated calibrationshave been obtained during the FLAMES Commissioning and Science Verification runs. Theyhave been made publicly available at:
http://www.eso.org/sci/activities/vltcomm/flames/
and
http://www.eso.org/sci/activities/vltsv/flamessv/
FLAMES calibrations are available from the ESO archive at http://archive.eso.org/.
FLAMES User Manual VLT-MAN-ESO-13700-2994 12
2.8 Acknowledgment
The present maintainer of this document (D. Gadotti) is grateful to the previous instrumentscientists of FLAMES (C. Martayan, C.Melo, J. Smoker, A. Kaufer, R. Scarpa, D. Naef)whose hard and competent work contributed to make of FLAMES a great facility.
2.9 Bibliography
[1 ] FLAMES Templates Reference Guide, VLT-INS-MAN-ITA-13750-0009,(http://www.eso.org/sci/facilities/paranal/instruments/flames/doc/)
[2 ] FPOSS User Manual, VLT-INS-MAN-AUS-13271-0079,(http://www.eso.org/sci/facilities/paranal/instruments/flames/doc/)
[3 ] FLAMES Calibration Plan, VLT-PLA-ESO-13700-3248,(http://www.eso.org/sci/facilities/paranal/instruments/flames/doc/)
[4 ] UVES User Manual , VLT-MAN-ESO-13200-1825,(http://www.eso.org/sci/facilities/paranal/instruments/uves/doc/)
[5 ] P2PP Users’ Manual, VLT-MAN-ESO-19200-1644,(http://www.eso.org/observing/p2pp/P2PP-tool.html#Manual)
[6 ] Mechanical features for the OzPoz positioner for the VLT, Gillingham et al. 2000, SPIEconference(http://www.eso.org/sci/facilities/paranal/instruments/flames/doc/)
[7 ] Installation and commissioning of FLAMES, the VLT Multifibre Facility, Pasquini et al.2002, The Messenger 110, 1(http://www.eso.org/sci/publications/messenger/)
[8 ] Installation and first results of FLAMES, the VLT multifibre facility, Pasquini et al. 2002,SPIE conference(http://www.eso.org/sci/facilities/paranal/instruments/flames/doc/)
[9 ] The Data Reduction Software for GIRAFFE, the VLT medium resolution multi-objectfiber-fed spectrograph, Blecha et al. 2002, SPIE conference(http://www.eso.org/sci/facilities/paranal/instruments/flames/doc/)
[10 ] Toward accurate radial velocities with the fibre-fed GIRAFFE multi-object VLT spectro-graph, Royer et al. 2002, SPIE conference(http://www.eso.org/sci/facilities/paranal/instruments/flames/doc/)
[11 ] Quality Control of VLT-FLAMES/GIRAFFE data, Hanuschik et al. 2004, SPIE con-ference(http://www.eso.org/sci/facilities/paranal/instruments/flames/doc/)
FLAMES User Manual VLT-MAN-ESO-13700-2994 13
2.10 Glossary
Acquisition: Accurate positioning of the telescope in order to center the target on thespectrograph slit.
BIAS frame: Read–out of the CCD detector of a zero seconds integration time exposurewith shutter closed. The registered number of electrons per pixel has to be subtractedfrom a science exposure, because these were not created by photons from the source.
Calibration: Procedures to remove the instrumental signature from the scientific data (e.g.,subtract BIAS frames and divide by the flatfield).
Camera: GIRAFFE and UVES have dioptric cameras imaging the dispersed parallel beamson the respective CCD detectors.
Charge-Coupled Device (CCD): Electronic 2D-array detector converting photons intoelectrons.
Cross-disperser grating: An echelle spectrograph contains two dispersive elements. Oneis the echelle grating, the other one is called the cross-disperser grating. UVES hosts twocross-dispersers, each with two different gratings. The cross-disperser grating determinesthe distance between the echelle orders.
Decker: Reflecting and movable blades placed in front of the slit and determining its length.
FACB: Fiducial Acquisition Coherent Bundles. These are 4 bundles of coherent fibres totake images of 4 reference stars and link the telescope to the targets.
Flatfield (FF): Spectrum obtained from light source with a flat (i.e. without spectral fea-tures) energy distribution, e.g. a tungsten lamp. The registered signal provides infor-mation about the response of the detector, allowing a determination of the variation insensitivity from pixel to pixel, the echelle order shape, the presence of bad columns onthe detector, etc.
Free Setting: A setting of the instrument defined by the observer, generally with a differentwavelength, readout or binning than any of the standard settings. No free settings areavailable with FLAMES.
Grating: The main light dispersing elements of UVES and GIRAFFE are echelle gratings.
Guide star: A point source used for accurate tracking (and active control of the telescopemirrors) ideally with magnitude between R∼9 and R∼11.
Maintenance: Technical procedures developed to control and maintain the quality of tele-scope, instrument, and detector.
Observation Block (OB): A logical unit of exposures needed to obtain a coherent setof data. Encompasses all relevant information for a successful data acquisition on atarget. It consists of target information, a set of templates, parameter files for thetemplates, conditions, requirements and comments concerning the specified observations.It represents the entity the short-term scheduler deals with. Constructing ObservationBlocks is part of the Phase II Proposal Preparation Process.
FLAMES User Manual VLT-MAN-ESO-13700-2994 14
Order Separation Filters: In GIRAFFE the wavelength range covered in each setup isdefined by using filters as predisperser: inserted in the beam they reject all the lightoutside the defined bandpass, which instead is dispersed by the echelle grating.
Phase II Proposal Preparation (P2PP): During this phase the successful applicant (whosePhase I proposal has been accepted based on the scientific rationale and technical feasi-bility) prepares the Observation Blocks to carry out the observing programme.
Focal Plates: The Fibre Positioner can host up to 4 plates: these are metallic sphericalsurfaces where the fibre buttons are positioned for the observations. Only two plates areonly currently in use.
Pre-slit area: UVES optical elements located in front of the spectrograph slits.
Spectrograph arm: UVES consists of two “separate” spectrographs, one optimized for theblue (blue arm) and one for the red wavelength region (red arm). Only the red arm isconnected to the fibres.
Spectrograph slit: Two parallel, reflecting metal blades with an adjustable separation (slitwidth) form the entrance slit of the spectrograph. The image of the astronomical sourceproduced by the telescope is focused on the slit plane.
Standard Setting: A pre-defined setting of the instrument facilitating the preparation ofthe observations. The Observatory keeps an updated database of the relevant calibrationfiles for all Standard Settings of the instrument.
Template: A set of instructions for the performance of a standard operation on an instru-ment, typically an instrument and detector setups. The templates represent speciallydevised sequences for all instrument operations and calibrations.
Template Signature File: This file is a description of a Template and its parameters. Itcontains information about the type and allowed ranges of the parameters; some of theparameters have to be set by the observer.
Wavelength calibration: Spectrum obtained from a reference emission-line lamp (e.g. Th-Ar). The wavelengths of the (many) emission lines are accurately known and are usedto transform pixel space into wavelength space.
FLAMES User Manual VLT-MAN-ESO-13700-2994 15
2.11 Abbreviations and Acronyms
AT Acquisition TemplateBOB Broker for Observation BlocksCAL Calibration exposureCCD Charge-Coupled DeviceCD Cross-disperserESO European Southern ObservatoryETC Exposure Time CalculatorFLAMES Fibre Large Array Multi Element SpectrographFPOSS Fibre Positioner Observing Support SoftwareFRD Focal Ratio DegradationIFU (deployable) Integral Field UnitOB Observation BlockOS Observation SoftwareP2PP Phase II Proposal PreparationRTD Real Time DisplaySTD Standard starSM Service ModeTSF Template Signature FileUVES Ultraviolet and Visual Echelle SpectrographVLT Very Large telescopeVM Visitor Mode
FLAMES User Manual VLT-MAN-ESO-13700-2994 16
3 FLAMES Characteristics and Sub-Systems
3.1 Opto-mechanical Layout
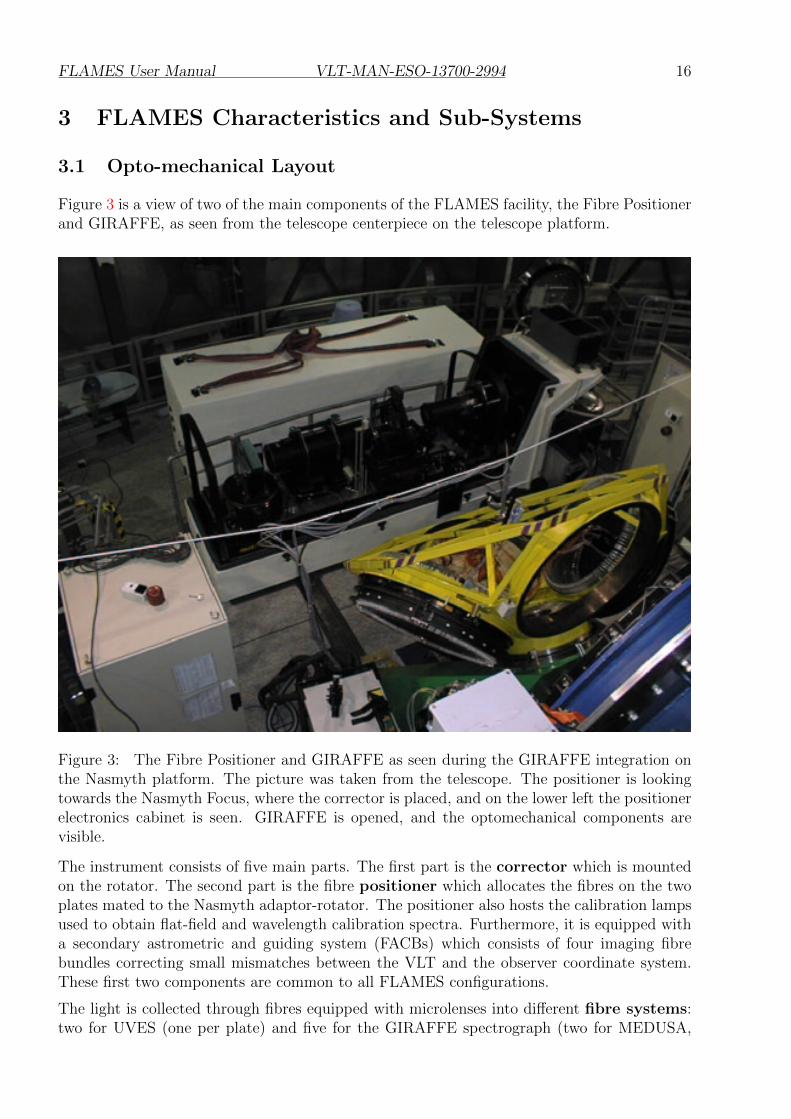
Figure 3 is a view of two of the main components of the FLAMES facility, the Fibre Positionerand GIRAFFE, as seen from the telescope centerpiece on the telescope platform.
Figure 3: The Fibre Positioner and GIRAFFE as seen during the GIRAFFE integration onthe Nasmyth platform. The picture was taken from the telescope. The positioner is lookingtowards the Nasmyth Focus, where the corrector is placed, and on the lower left the positionerelectronics cabinet is seen. GIRAFFE is opened, and the optomechanical components arevisible.
The instrument consists of five main parts. The first part is the corrector which is mountedon the rotator. The second part is the fibre positioner which allocates the fibres on the twoplates mated to the Nasmyth adaptor-rotator. The positioner also hosts the calibration lampsused to obtain flat-field and wavelength calibration spectra. Furthermore, it is equipped witha secondary astrometric and guiding system (FACBs) which consists of four imaging fibrebundles correcting small mismatches between the VLT and the observer coordinate system.These first two components are common to all FLAMES configurations.
The light is collected through fibres equipped with microlenses into different fibre systems:two for UVES (one per plate) and five for the GIRAFFE spectrograph (two for MEDUSA,
FLAMES User Manual VLT-MAN-ESO-13700-2994 17
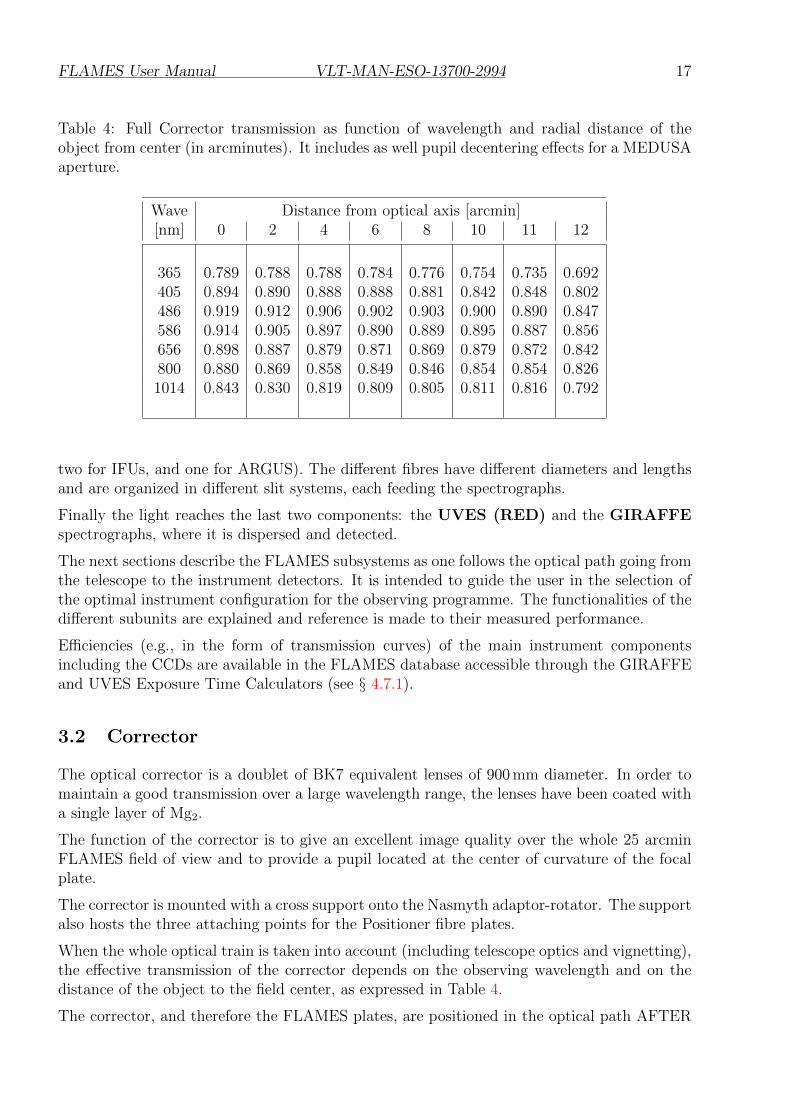
Table 4: Full Corrector transmission as function of wavelength and radial distance of theobject from center (in arcminutes). It includes as well pupil decentering effects for a MEDUSAaperture.
Wave Distance from optical axis [arcmin][nm] 0 2 4 6 8 10 11 12
365 0.789 0.788 0.788 0.784 0.776 0.754 0.735 0.692405 0.894 0.890 0.888 0.888 0.881 0.842 0.848 0.802486 0.919 0.912 0.906 0.902 0.903 0.900 0.890 0.847586 0.914 0.905 0.897 0.890 0.889 0.895 0.887 0.856656 0.898 0.887 0.879 0.871 0.869 0.879 0.872 0.842800 0.880 0.869 0.858 0.849 0.846 0.854 0.854 0.8261014 0.843 0.830 0.819 0.809 0.805 0.811 0.816 0.792
two for IFUs, and one for ARGUS). The different fibres have different diameters and lengthsand are organized in different slit systems, each feeding the spectrographs.
Finally the light reaches the last two components: the UVES (RED) and the GIRAFFEspectrographs, where it is dispersed and detected.
The next sections describe the FLAMES subsystems as one follows the optical path going fromthe telescope to the instrument detectors. It is intended to guide the user in the selection ofthe optimal instrument configuration for the observing programme. The functionalities of thedifferent subunits are explained and reference is made to their measured performance.
Efficiencies (e.g., in the form of transmission curves) of the main instrument componentsincluding the CCDs are available in the FLAMES database accessible through the GIRAFFEand UVES Exposure Time Calculators (see § 4.7.1).
3.2 Corrector
The optical corrector is a doublet of BK7 equivalent lenses of 900 mm diameter. In order tomaintain a good transmission over a large wavelength range, the lenses have been coated witha single layer of Mg2.
The function of the corrector is to give an excellent image quality over the whole 25 arcminFLAMES field of view and to provide a pupil located at the center of curvature of the focalplate.
The corrector is mounted with a cross support onto the Nasmyth adaptor-rotator. The supportalso hosts the three attaching points for the Positioner fibre plates.
When the whole optical train is taken into account (including telescope optics and vignetting),the effective transmission of the corrector depends on the observing wavelength and on thedistance of the object to the field center, as expressed in Table 4.
The corrector, and therefore the FLAMES plates, are positioned in the optical path AFTER
FLAMES User Manual VLT-MAN-ESO-13700-2994 18
the VLT guide probe. This implies that the guide probe will vignet the field of view. It istherefore very important to select carefully the VLT guide star. VLT guide star should havean R magnitude between R∼9 and R∼11 for optimal performance. Although fainter objects(to R∼13) may work, experience has shown that due to uncertainties in the magnitude andnon-ideal observing conditions (e.g. cirrus or poor seeing), the Active Optics loop may fail toclose. If this occurs, then another guide star would need to be chosen that would likely vignetthe fibres on the plate.
Finally, it is also very important that the guide star is sufficiently isolated to avoid confusionin its choice.
Note that FLAMES does not have an atmospheric dispersion corrector.
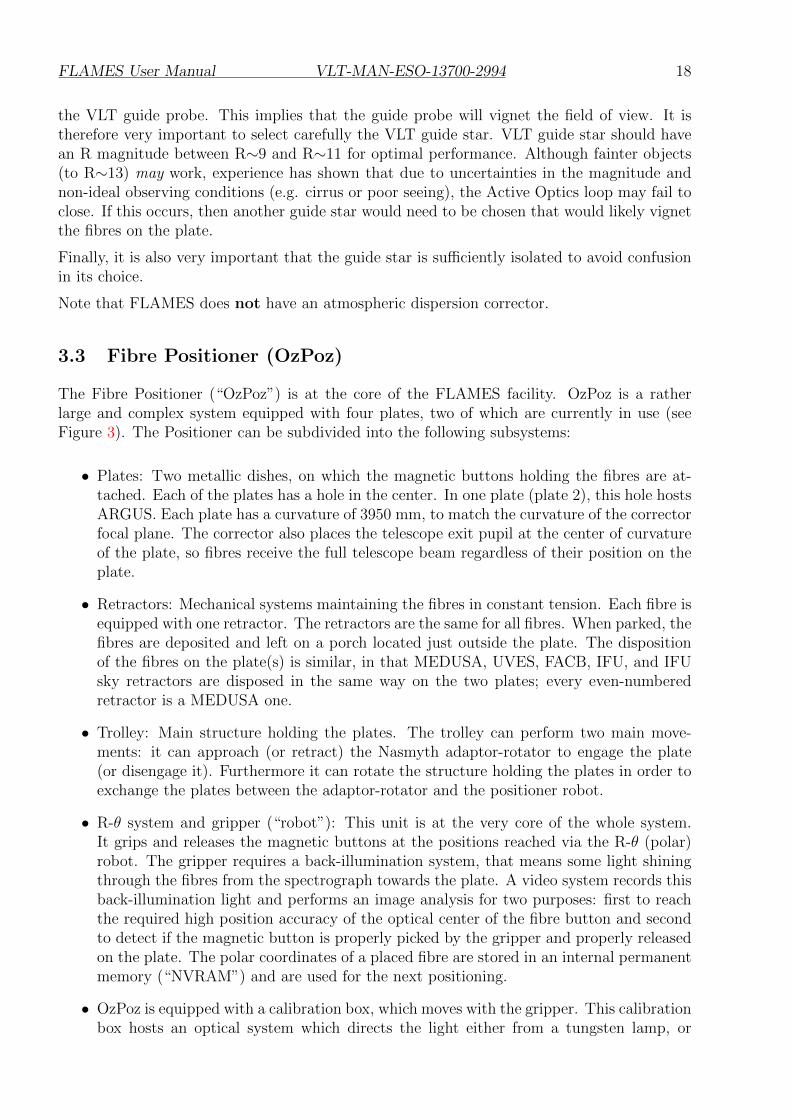
3.3 Fibre Positioner (OzPoz)
The Fibre Positioner (“OzPoz”) is at the core of the FLAMES facility. OzPoz is a ratherlarge and complex system equipped with four plates, two of which are currently in use (seeFigure 3). The Positioner can be subdivided into the following subsystems:
• Plates: Two metallic dishes, on which the magnetic buttons holding the fibres are at-tached. Each of the plates has a hole in the center. In one plate (plate 2), this hole hostsARGUS. Each plate has a curvature of 3950 mm, to match the curvature of the correctorfocal plane. The corrector also places the telescope exit pupil at the center of curvatureof the plate, so fibres receive the full telescope beam regardless of their position on theplate.
• Retractors: Mechanical systems maintaining the fibres in constant tension. Each fibre isequipped with one retractor. The retractors are the same for all fibres. When parked, thefibres are deposited and left on a porch located just outside the plate. The dispositionof the fibres on the plate(s) is similar, in that MEDUSA, UVES, FACB, IFU, and IFUsky retractors are disposed in the same way on the two plates; every even-numberedretractor is a MEDUSA one.
• Trolley: Main structure holding the plates. The trolley can perform two main move-ments: it can approach (or retract) the Nasmyth adaptor-rotator to engage the plate(or disengage it). Furthermore it can rotate the structure holding the plates in order toexchange the plates between the adaptor-rotator and the positioner robot.
• R-θ system and gripper (“robot”): This unit is at the very core of the whole system.It grips and releases the magnetic buttons at the positions reached via the R-θ (polar)robot. The gripper requires a back-illumination system, that means some light shiningthrough the fibres from the spectrograph towards the plate. A video system records thisback-illumination light and performs an image analysis for two purposes: first to reachthe required high position accuracy of the optical center of the fibre button and secondto detect if the magnetic button is properly picked by the gripper and properly releasedon the plate. The polar coordinates of a placed fibre are stored in an internal permanentmemory (“NVRAM”) and are used for the next positioning.
• OzPoz is equipped with a calibration box, which moves with the gripper. This calibrationbox hosts an optical system which directs the light either from a tungsten lamp, or
FLAMES User Manual VLT-MAN-ESO-13700-2994 19
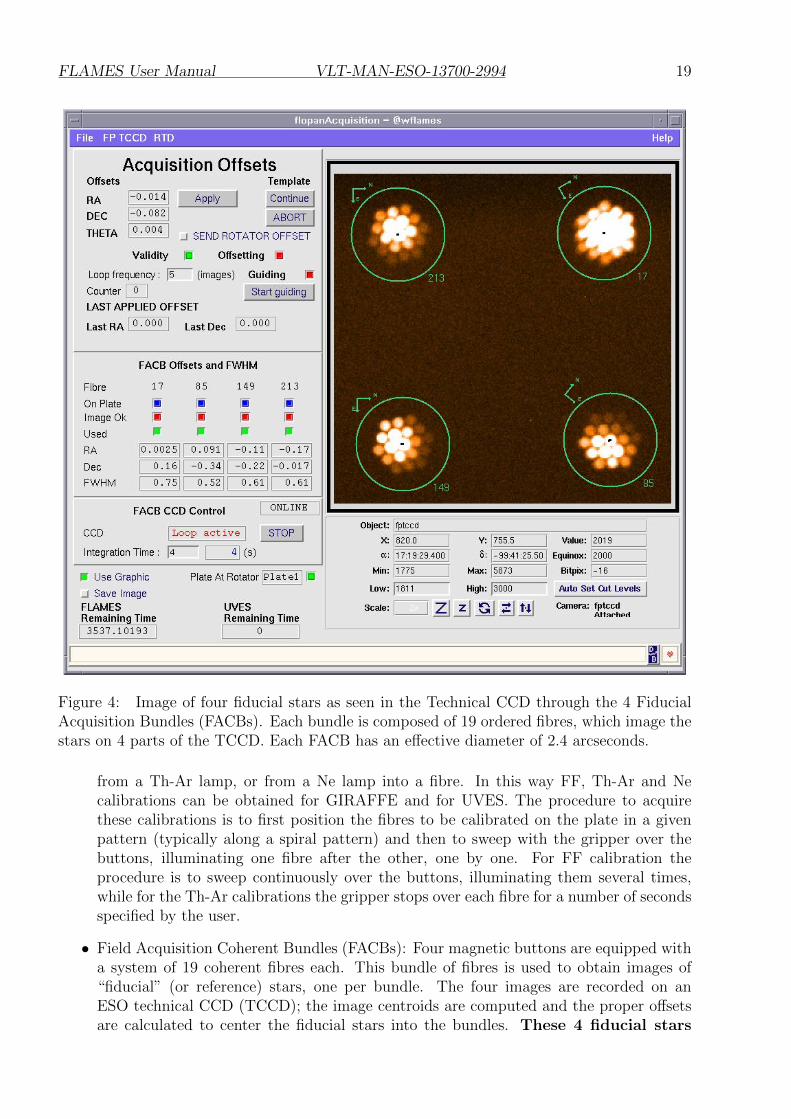
Figure 4: Image of four fiducial stars as seen in the Technical CCD through the 4 FiducialAcquisition Bundles (FACBs). Each bundle is composed of 19 ordered fibres, which image thestars on 4 parts of the TCCD. Each FACB has an effective diameter of 2.4 arcseconds.
from a Th-Ar lamp, or from a Ne lamp into a fibre. In this way FF, Th-Ar and Necalibrations can be obtained for GIRAFFE and for UVES. The procedure to acquirethese calibrations is to first position the fibres to be calibrated on the plate in a givenpattern (typically along a spiral pattern) and then to sweep with the gripper over thebuttons, illuminating one fibre after the other, one by one. For FF calibration theprocedure is to sweep continuously over the buttons, illuminating them several times,while for the Th-Ar calibrations the gripper stops over each fibre for a number of secondsspecified by the user.
• Field Acquisition Coherent Bundles (FACBs): Four magnetic buttons are equipped witha system of 19 coherent fibres each. This bundle of fibres is used to obtain images of“fiducial” (or reference) stars, one per bundle. The four images are recorded on anESO technical CCD (TCCD); the image centroids are computed and the proper offsetsare calculated to center the fiducial stars into the bundles. These 4 fiducial stars
FLAMES User Manual VLT-MAN-ESO-13700-2994 20
represent the link between the sky and the plate coordinates, therefore it isabsolutely necessary that they are chosen carefully: They must be sufficientlyisolated, in the same coordinate system as the target stars and of visualmagnitude brighter than R = 15. Given the limited dynamical range of theTechnical CCD, the FACB stars should be within a range of 3 magnitudes.Each FACB bundle has an effective diameter of 2.4′′. An example of a TCCD imagewith the four stars in the FACB bundles is shown in Figure 4. In P86, a TCCD snapshotshould be taken automatically once the acquisition is done.
• Positioning Software: This is based on a well-tested and complex code developed initiallyfor the 2dF system at Anglo-Australian Observatory (AAO). This so-called “delta”-task allows crossing of the fibres in their final positions and determines the buttonmovements sequence from a given fibre configuration to the next (solving a travelingsalesman problem). It is worth noticing that to reach a new complex configuration morethan one move per fibre may be needed. A more detailed explanation can be found inthe FPOSS manual.
3.3.1 Positioner Performance Characteristics
The main performance characteristics of the Fibre Positioner can be summarized as follows.
1. Mechanical Positioning accuracy: better than 0.08 arcsec.
2. Positioning time: 6 seconds/move. The whole configuring time also depends on thenumber of moves necessary to re-configure the plate, that is, the number of moves perfibre needed to re-position one button, as well as by the number of attempts per buttonneeded to achieve the required positional accuracy.
3. Possibility to configure the next observation while observing.
4. Plate Exchange time: less than 180 seconds (w/o considering field acquisition).
5. Calibration unit equipped with Th-Ar, Ne and FF lamps
6. Performing fine centering of the plate on the sky with FACBs.
7. Minimum button separation 11 arcseconds (button diameter: 10 arcsecs).
3.4 Buttons and Fibre Systems
FLAMES is equipped with different types of fibres for UVES and for the different modesof GIRAFFE. At the output of the fibre system, individual fibres are arranged in differentsubslit systems depending on the fibre type. Each GIRAFFE mode has five fibres per slitdevoted to simultaneous wavelength calibration, in addition to the fibres coming fromthe Positioner. These fibres provide five calibration spectra for each observation acquired withGIRAFFE. The UVES system has a similar simultaneous calibration capability: in that case,one of the eight fibres is reserved for calibration.
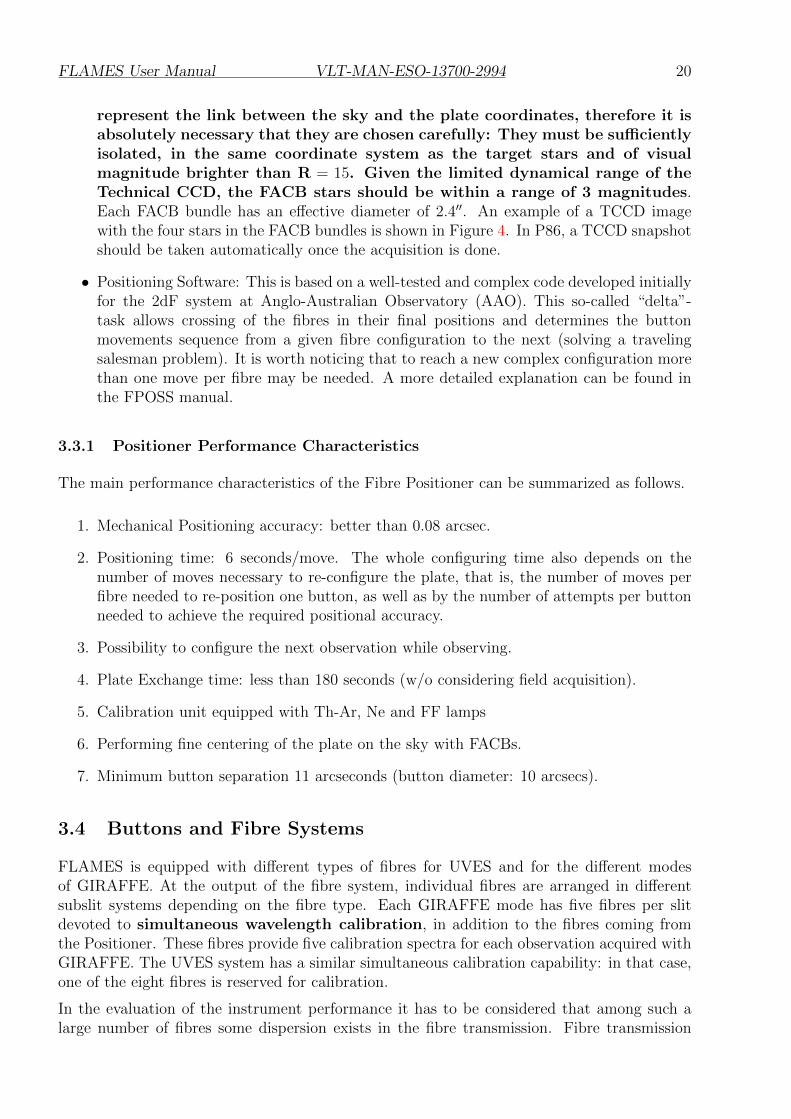
In the evaluation of the instrument performance it has to be considered that among such alarge number of fibres some dispersion exists in the fibre transmission. Fibre transmission
FLAMES User Manual VLT-MAN-ESO-13700-2994 21
within the GIRAFFE F/5 and UVES F/10 apertures have been measured for every singlefibre, and the distribution of the transmission is given in Figure 5 for the different fibre types.
Figure 5: Distribution of the transmission of the FLAMES fibres at 600 nm. each fibre hasbeen measured in laboratory.
3.4.1 Magnetic Buttons
The Magnetic Buttons have two purposes: first, they are the mechanical means which allowsthe fibre end to be placed on the plate in front of the stellar target. Second, they are thesupport of the optical interface between the telescope beam and the fibre. A magnet gluedat the base of the button enables the fibres to be placed on the curved plate. The diameterof the stainless steel button is 6 mm (10.3 arcsec), but in order to avoid collisions between thebuttons, the minimum allowed separation of two buttons is set to 11 arcsec. The magnet is atablet of 4 mm diameter and 1.2 mm high. The magnetic attachment force is around 235 gr.
Single microlenses for MEDUSA and UVES fibres and arrays of microlenses for ARGUS andthe IFUs are used to reduce the F/15 telescope beam to around F/5 into the fibres. Theselenses image the pupil of the telescope onto the fibre entranced surfaces. This system helps toscramble the photometric variations produced by oscillations of the star on the fibre by guidingerrors. In the case of MEDUSA and UVES fibres, the optics are rod lenses with their imagefocal plane on the flat surface. The lens has been cut to 45 degrees to fold the telescope beaminto the fibre, parallel to the plate. In the case of ARGUS and IFUs, all arrays of microlensesare glued to a single total reflection 45 degrees prism.
FLAMES User Manual VLT-MAN-ESO-13700-2994 22
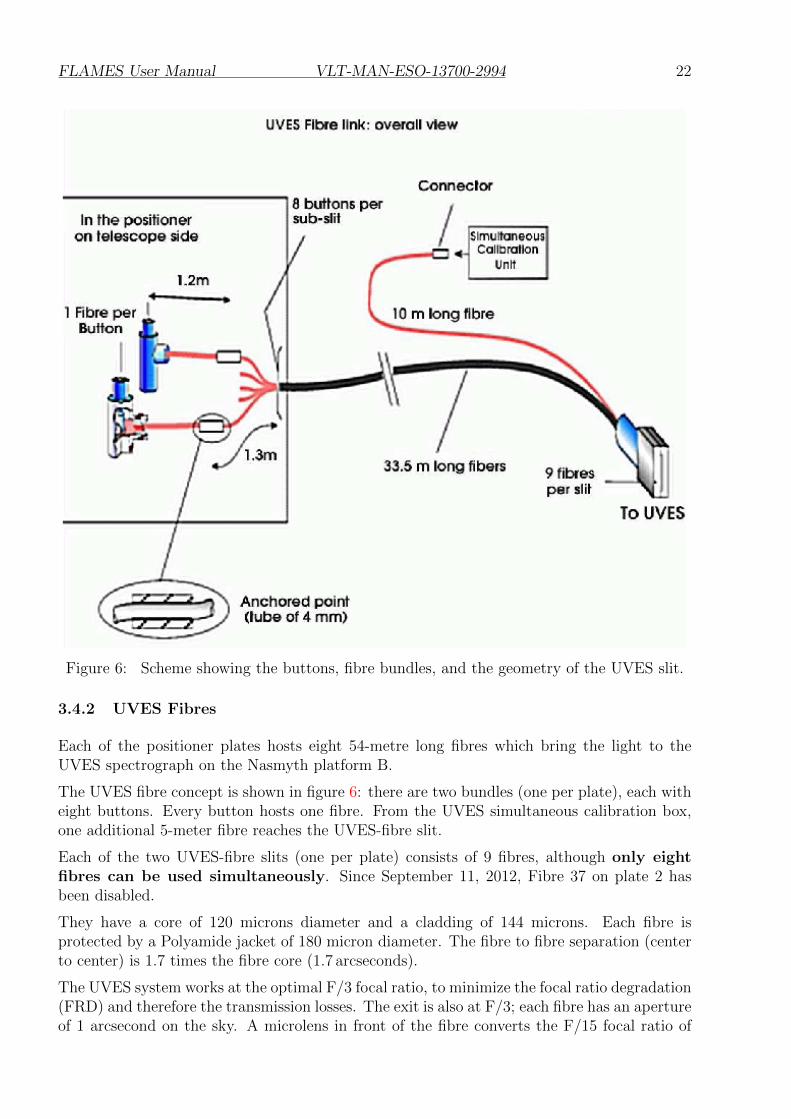
Figure 6: Scheme showing the buttons, fibre bundles, and the geometry of the UVES slit.
3.4.2 UVES Fibres
Each of the positioner plates hosts eight 54-metre long fibres which bring the light to theUVES spectrograph on the Nasmyth platform B.
The UVES fibre concept is shown in figure 6: there are two bundles (one per plate), each witheight buttons. Every button hosts one fibre. From the UVES simultaneous calibration box,one additional 5-meter fibre reaches the UVES-fibre slit.
Each of the two UVES-fibre slits (one per plate) consists of 9 fibres, although only eightfibres can be used simultaneously. Since September 11, 2012, Fibre 37 on plate 2 hasbeen disabled.
They have a core of 120 microns diameter and a cladding of 144 microns. Each fibre isprotected by a Polyamide jacket of 180 micron diameter. The fibre to fibre separation (centerto center) is 1.7 times the fibre core (1.7 arcseconds).
The UVES system works at the optimal F/3 focal ratio, to minimize the focal ratio degradation(FRD) and therefore the transmission losses. The exit is also at F/3; each fibre has an apertureof 1 arcsecond on the sky. A microlens in front of the fibre converts the F/15 focal ratio of
FLAMES User Manual VLT-MAN-ESO-13700-2994 23
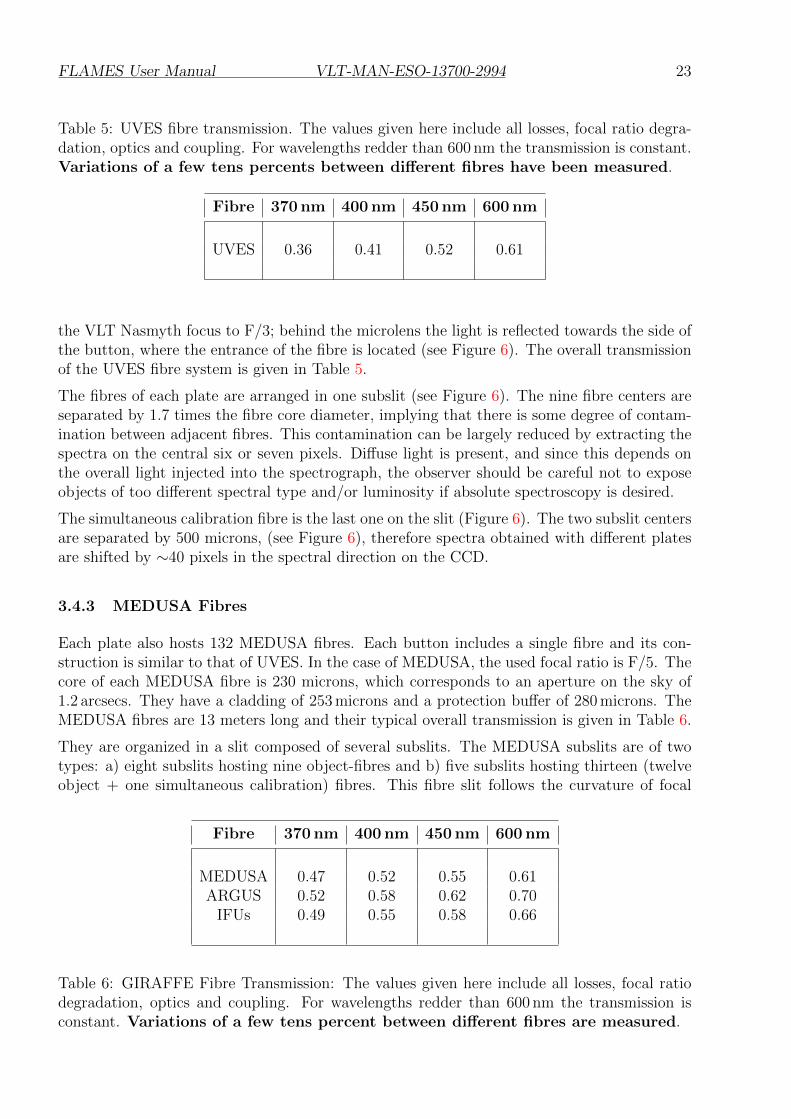
Table 5: UVES fibre transmission. The values given here include all losses, focal ratio degra-dation, optics and coupling. For wavelengths redder than 600 nm the transmission is constant.Variations of a few tens percents between different fibres have been measured.
Fibre 370 nm 400 nm 450 nm 600 nm
UVES 0.36 0.41 0.52 0.61
the VLT Nasmyth focus to F/3; behind the microlens the light is reflected towards the side ofthe button, where the entrance of the fibre is located (see Figure 6). The overall transmissionof the UVES fibre system is given in Table 5.
The fibres of each plate are arranged in one subslit (see Figure 6). The nine fibre centers areseparated by 1.7 times the fibre core diameter, implying that there is some degree of contam-ination between adjacent fibres. This contamination can be largely reduced by extracting thespectra on the central six or seven pixels. Diffuse light is present, and since this depends onthe overall light injected into the spectrograph, the observer should be careful not to exposeobjects of too different spectral type and/or luminosity if absolute spectroscopy is desired.
The simultaneous calibration fibre is the last one on the slit (Figure 6). The two subslit centersare separated by 500 microns, (see Figure 6), therefore spectra obtained with different platesare shifted by ∼40 pixels in the spectral direction on the CCD.
3.4.3 MEDUSA Fibres
Each plate also hosts 132 MEDUSA fibres. Each button includes a single fibre and its con-struction is similar to that of UVES. In the case of MEDUSA, the used focal ratio is F/5. Thecore of each MEDUSA fibre is 230 microns, which corresponds to an aperture on the sky of1.2 arcsecs. They have a cladding of 253 microns and a protection buffer of 280 microns. TheMEDUSA fibres are 13 meters long and their typical overall transmission is given in Table 6.
They are organized in a slit composed of several subslits. The MEDUSA subslits are of twotypes: a) eight subslits hosting nine object-fibres and b) five subslits hosting thirteen (twelveobject + one simultaneous calibration) fibres. This fibre slit follows the curvature of focal
Fibre 370 nm 400 nm 450 nm 600 nm
MEDUSA 0.47 0.52 0.55 0.61ARGUS 0.52 0.58 0.62 0.70
IFUs 0.49 0.55 0.58 0.66
Table 6: GIRAFFE Fibre Transmission: The values given here include all losses, focal ratiodegradation, optics and coupling. For wavelengths redder than 600 nm the transmission isconstant. Variations of a few tens percent between different fibres are measured.
FLAMES User Manual VLT-MAN-ESO-13700-2994 24
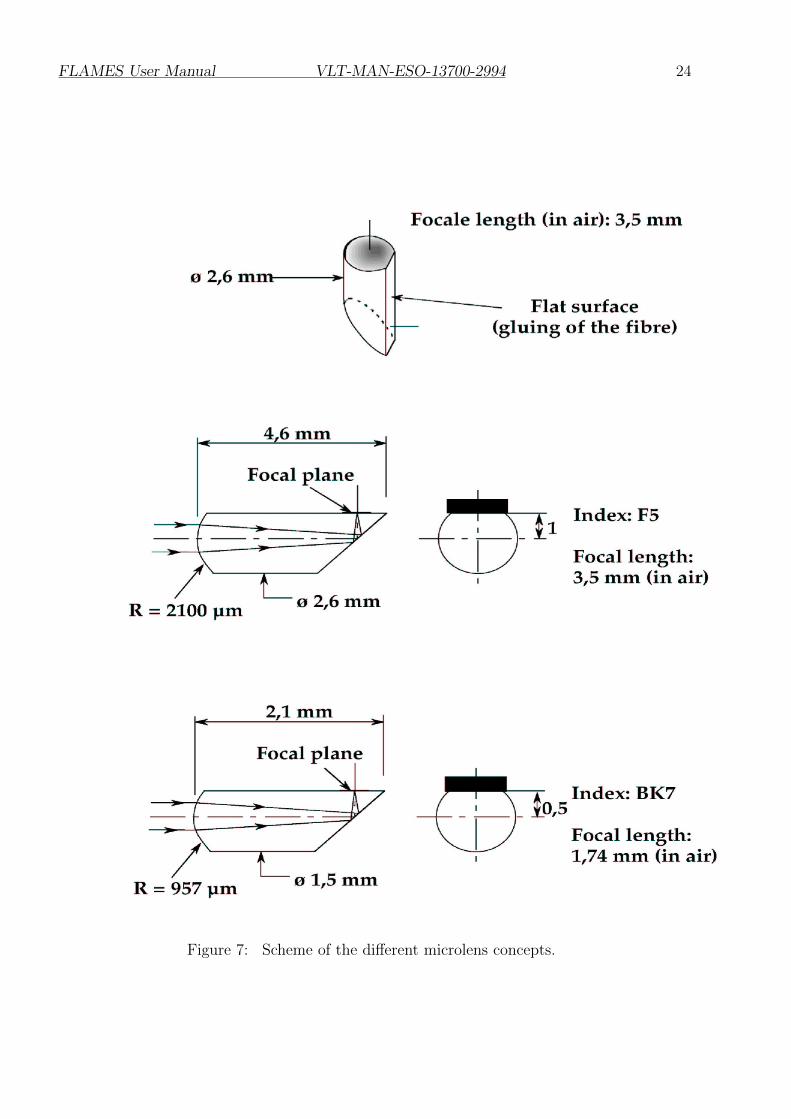
Figure 7: Scheme of the different microlens concepts.
FLAMES User Manual VLT-MAN-ESO-13700-2994 25
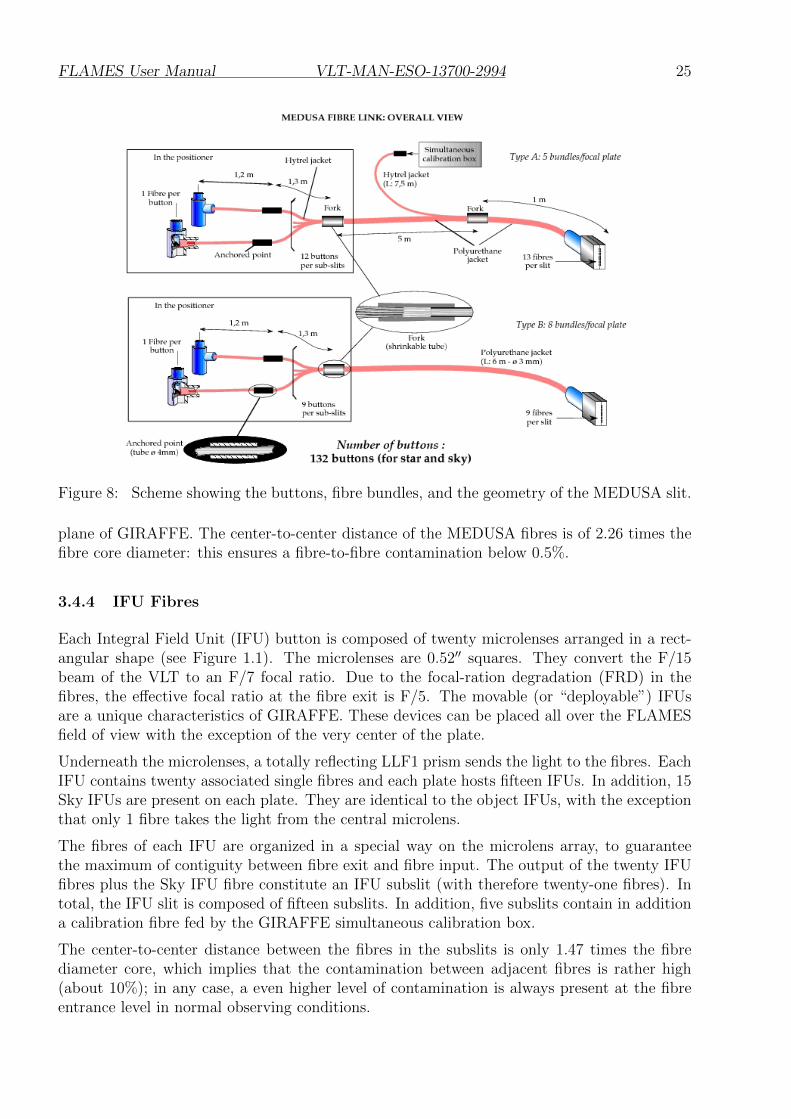
Figure 8: Scheme showing the buttons, fibre bundles, and the geometry of the MEDUSA slit.
plane of GIRAFFE. The center-to-center distance of the MEDUSA fibres is of 2.26 times thefibre core diameter: this ensures a fibre-to-fibre contamination below 0.5%.
3.4.4 IFU Fibres
Each Integral Field Unit (IFU) button is composed of twenty microlenses arranged in a rect-angular shape (see Figure 1.1). The microlenses are 0.52′′ squares. They convert the F/15beam of the VLT to an F/7 focal ratio. Due to the focal-ration degradation (FRD) in thefibres, the effective focal ratio at the fibre exit is F/5. The movable (or “deployable”) IFUsare a unique characteristics of GIRAFFE. These devices can be placed all over the FLAMESfield of view with the exception of the very center of the plate.
Underneath the microlenses, a totally reflecting LLF1 prism sends the light to the fibres. EachIFU contains twenty associated single fibres and each plate hosts fifteen IFUs. In addition, 15Sky IFUs are present on each plate. They are identical to the object IFUs, with the exceptionthat only 1 fibre takes the light from the central microlens.
The fibres of each IFU are organized in a special way on the microlens array, to guaranteethe maximum of contiguity between fibre exit and fibre input. The output of the twenty IFUfibres plus the Sky IFU fibre constitute an IFU subslit (with therefore twenty-one fibres). Intotal, the IFU slit is composed of fifteen subslits. In addition, five subslits contain in additiona calibration fibre fed by the GIRAFFE simultaneous calibration box.
The center-to-center distance between the fibres in the subslits is only 1.47 times the fibrediameter core, which implies that the contamination between adjacent fibres is rather high(about 10%); in any case, a even higher level of contamination is always present at the fibreentrance level in normal observing conditions.
FLAMES User Manual VLT-MAN-ESO-13700-2994 26
3.4.5 IFU Orientation
Fibres are kept in constant tension by the springs in the retractors, and the buttons are free tofloat in the gripper before being placed. When a button is placed, the fibres are always orientedalong the line which joins the position of placement and the retractor (parking position), asseen in the FPOSS mimic. This means that the IFUs are always oriented (within a fewdegrees) with the long side perpendicular to the conjuction fibre-retractor, that is, the longside of the IFU (3 arcseconds) is perpendicular to the fibre, the short (2 arcseconds) is orientedalong the fibre-retractor direction. See Fig. 25. Fig. 26 shows which IFU fibre is which in thereconstructed image produced by the ESO pipeline.
3.4.6 ARGUS Fibres
The ARGUS system is a fixed array of 14×22 microlenses, similar to the IFUs, located inthe center of Plate 2. ARGUS is further equipped with a focal enlarger system allowing toswitch between a scale of 0.52′′/microlens (1:1) to a finer scale of 0.3′′/microlens (1:1.67). Inaddition to the object fibres, fifteen ARGUS Sky fibres are available on the plate; they arebuilt identical to the IFU Sky fibres, i.e., with only the central fibre present. The ARGUSarray is best flatfielded using attached (screen) flatfields.
Fig. 9 shows the ARGUS array geometry and Fig. 23 reconstructed ARGUS images producedby the ESO pipeline.
3.5 GIRAFFE
GIRAFFE1 is a fully dioptric spectrograph with a beamsize of 180 mm and is able to supportthe 76.8 mm longslits fed by the different GIRAFFE fibre systems. It has been conceived tominimize maintenance and night calibrations; special requirements were introduced to reducesetup shifts and to obtain accurate re-positioning. In this way, one is able to use calibrationsobtained in the afternoon. Five fibres can be used to obtain simultaneous calibration spectraand to monitor the instrument drifts. After passing from the slit unit, the light is sent throughthe order sorting filters to the collimator. The collimated beam is dispersed by one of the twohigh (HR) or low (LR) resolution echelle gratings. After passing through the collimator again,an intermediate spectrum is produced. Finally the F/2 camera produces the image on the2k×4k CCD (see Figure 2.8). A summary of the most relevant GIRAFFE characteristics isgiven in Table 7.
The different GIRAFFE sub-units are described in more detail in the following sections.
3.5.1 Slit Unit
The slit unit contains six slots: five are occupied by the GIRAFFE fibres and one is occupiedby the long slit which can be illuminated by an internal calibration unit. The slit unit is themost complex mechanical subsystem of GIRAFFE, because it needs a very high stability andreproducibility. Two movements allow to exchange the fibre slit and to set the fibres in focus.
1The GIRAFFE spectrograph obtained its name from the first concept for the instrument, in which it waspositioned vertically on the Nasmyth platform.
FLAMES User Manual VLT-MAN-ESO-13700-2994 27
Figure 9: Geometry of the ARGUS microlens array. The arrows • −→ indicate the orientationof the subslits in the array and the direction of the increasing number of the fibre’s positionin the subslit (PSSN) as given in the static Fibre Binary Table (cf. Section 6.5.2). The x andy coordinate system refers to the X and Y columns of the Fibre Binary Table with which theARGUS image array is reconstructed from the fibre’s position in the ARGUS slit (FPS). Fora ARGUS position angle of PA = 0 the North–East orientation on sky is indicated for thereconstructed image, too. This is the long axis of ARGUS. See also Fig. 23.
FLAMES User Manual VLT-MAN-ESO-13700-2994 28
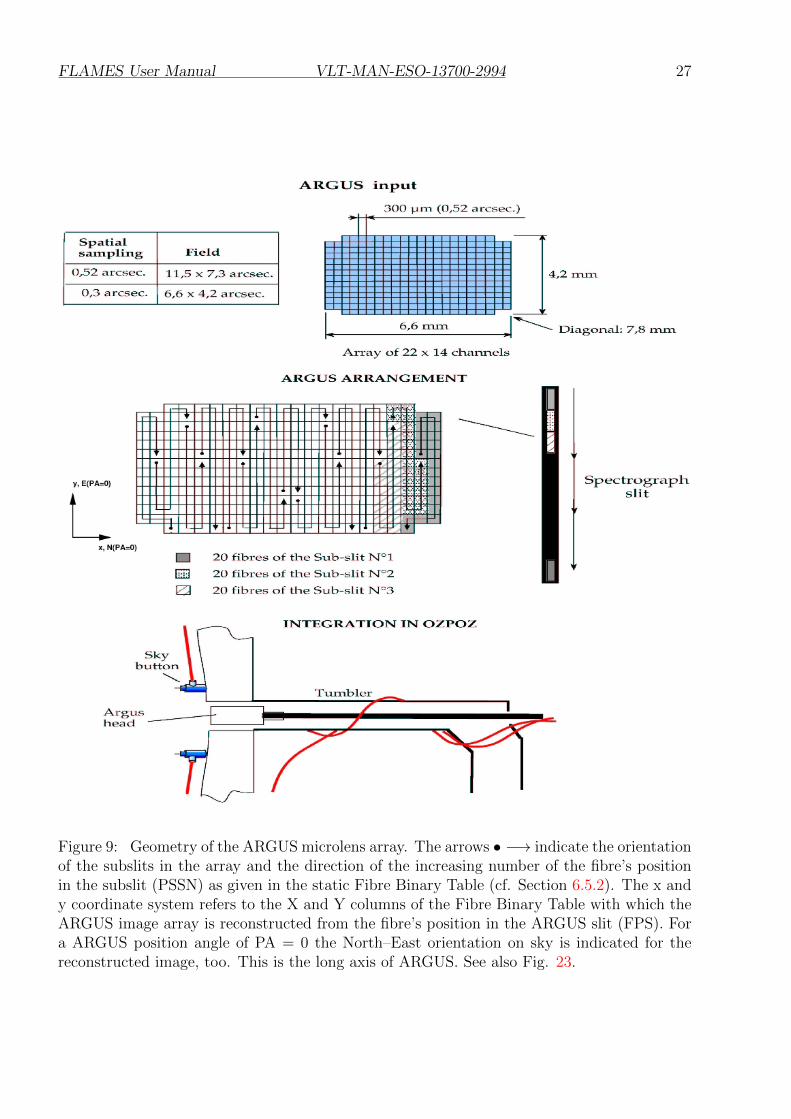
Table 7: Summary of GIRAFFE spectrograph characteristics
Type Echelle + Order selection FiltersCollimator beam 180 mmCollimator aperture F/5HR Echelle 204× 408 mm, 316 lines/mm, 63.4◦ blaze angleLR Grating 156× 204 mm, 600 lines/mm, 38◦ blaze angleCamera Focal Length 360 mm (mean)Detector 2048× 4096, 15µm EEV CCDScale 0.19 arcsec/pixelSlit height 76.8 mm
In addition, the slit unit is equipped with a number of back-illumination LEDs. These LEDsare powered and controlled by the Fibre Positioner. They are used to allow the gripper camerato view the fibre output when positioning. Clearly, since they are lit during the GIRAFFEexposures, special care was taken in keeping them very well light-tight, in order not to createlight contamination in the spectrograph. Thanks to this system, while one is observing with aset of fibres on one plate, any set of fibres on the other plate can be prepared by the positionerfor the next observations.
3.5.2 Filters and the Filter Wheel
After the slit, an interferometric filter selects the light according to the chosen wavelength andresolution. In addition to excellent transmission and image quality, these filters must fulfillvery stringent requirements on the bandpass edges and blocking over the whole CCD sensitivebandpass, in order to avoid pollution from adjacent spectral orders. This is very critical,especially in the blue where the orders are rather short in wavelength. The transmissioncurves for all filters can be found in the Appendix (Chapter 7).
The thirty GIRAFFE filters are mounted on a filter wheel with four layers, each with twelvefilter positions. A filter is selected by selecting the one of the 4 layers (A-D) and one of therotational filter positions (1-12).
3.5.3 Dioptric Spectrograph
After the light is passed through the filters it is reflected towards the collimator, which worksin double pass, i.e., the light passes through it again after being dispersed. The configurationangle is six degrees. The main dispersers are two commercial echelles:
The high dispersion grating is a protected silver coated 200×400 mm 63.6 degree echelle (R2)with a high groove density (316 lines/mm), which ensures large orders also in the blue. Thegrating can turn on a turntable turret with very high accuracy (0.05 pixel) and repeatability(0.05 pixel rms). The whole (370− 950 nm) spectral range is covered by twenty-four setups in10 grating orders.
FLAMES User Manual VLT-MAN-ESO-13700-2994 29
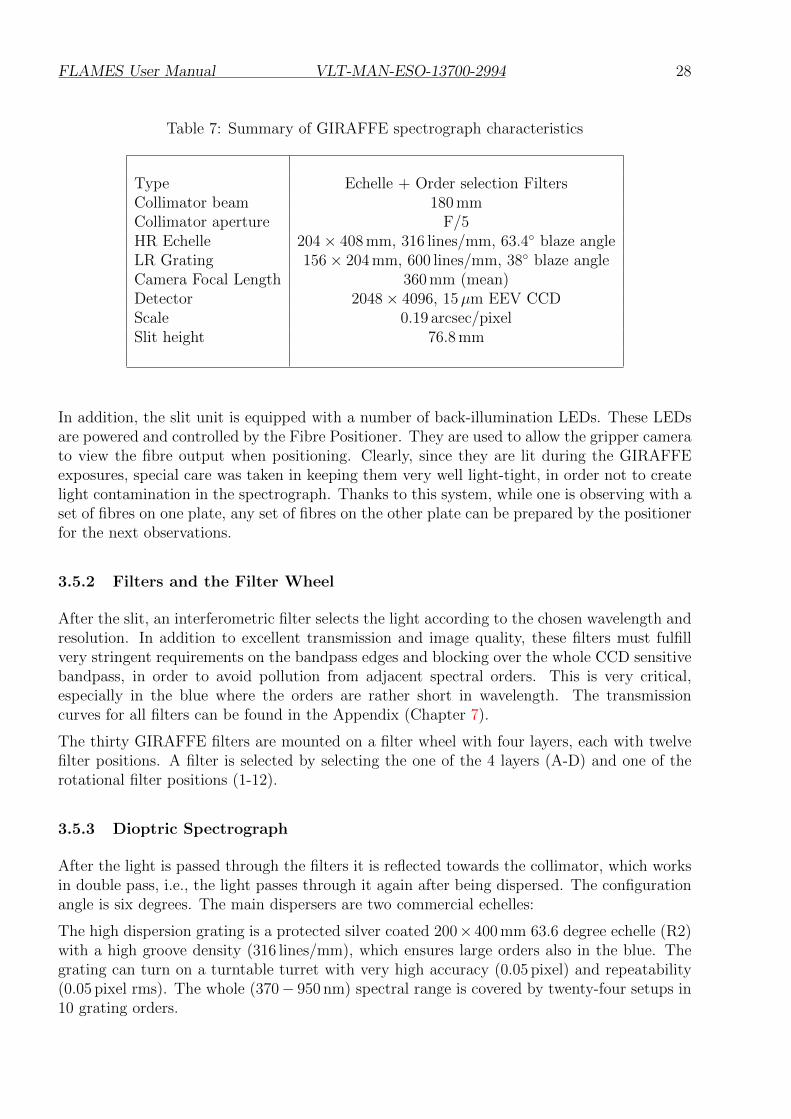
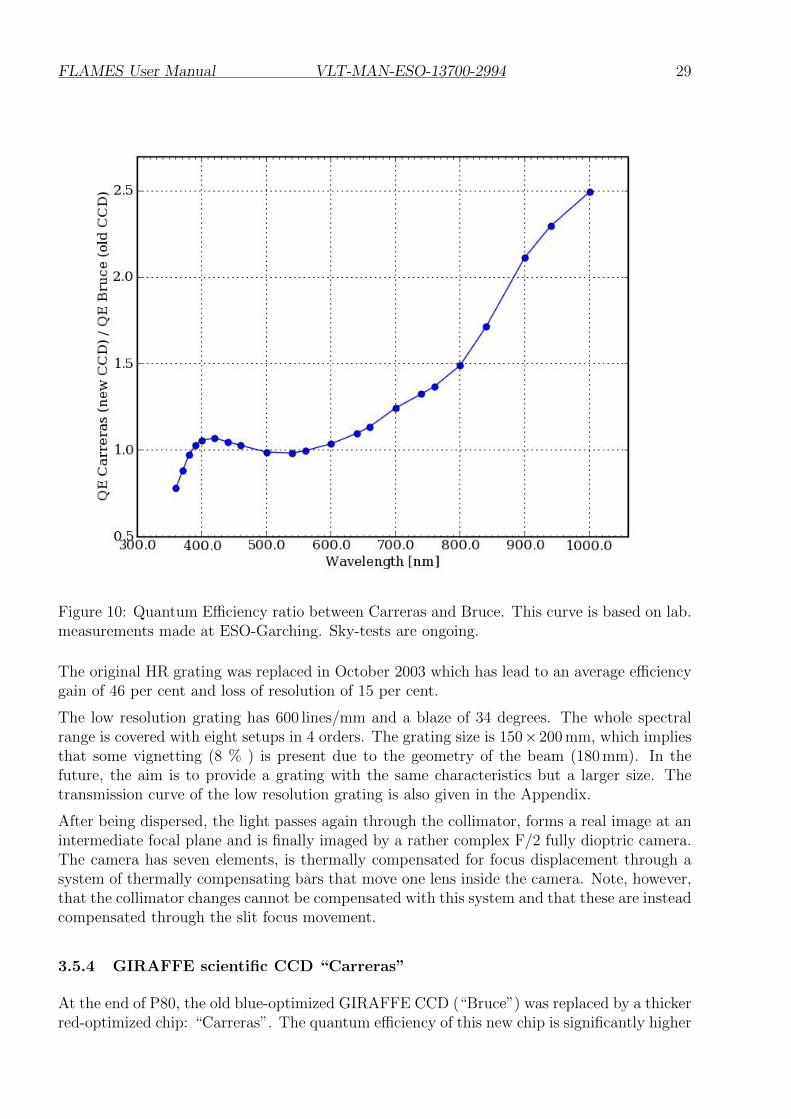
Figure 10: Quantum Efficiency ratio between Carreras and Bruce. This curve is based on lab.measurements made at ESO-Garching. Sky-tests are ongoing.
The original HR grating was replaced in October 2003 which has lead to an average efficiencygain of 46 per cent and loss of resolution of 15 per cent.
The low resolution grating has 600 lines/mm and a blaze of 34 degrees. The whole spectralrange is covered with eight setups in 4 orders. The grating size is 150×200 mm, which impliesthat some vignetting (8 % ) is present due to the geometry of the beam (180 mm). In thefuture, the aim is to provide a grating with the same characteristics but a larger size. Thetransmission curve of the low resolution grating is also given in the Appendix.
After being dispersed, the light passes again through the collimator, forms a real image at anintermediate focal plane and is finally imaged by a rather complex F/2 fully dioptric camera.The camera has seven elements, is thermally compensated for focus displacement through asystem of thermally compensating bars that move one lens inside the camera. Note, however,that the collimator changes cannot be compensated with this system and that these are insteadcompensated through the slit focus movement.
3.5.4 GIRAFFE scientific CCD “Carreras”
At the end of P80, the old blue-optimized GIRAFFE CCD (“Bruce”) was replaced by a thickerred-optimized chip: “Carreras”. The quantum efficiency of this new chip is significantly higher
FLAMES User Manual VLT-MAN-ESO-13700-2994 30
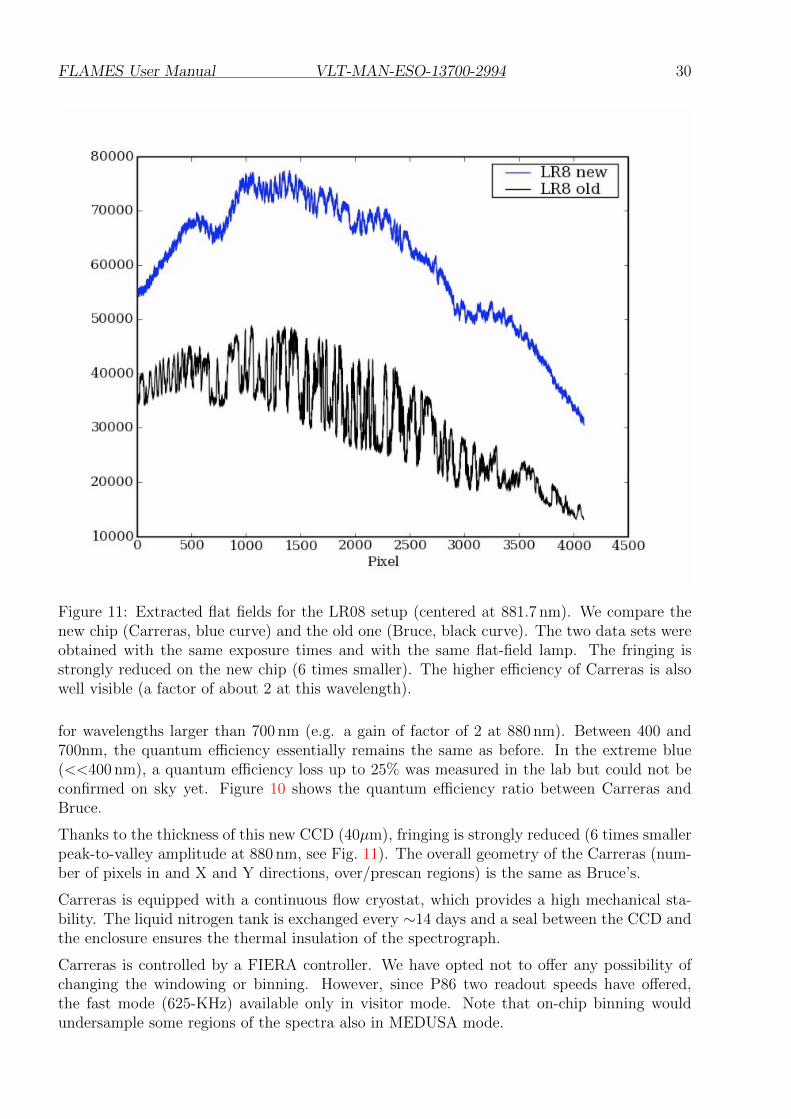
Figure 11: Extracted flat fields for the LR08 setup (centered at 881.7 nm). We compare thenew chip (Carreras, blue curve) and the old one (Bruce, black curve). The two data sets wereobtained with the same exposure times and with the same flat-field lamp. The fringing isstrongly reduced on the new chip (6 times smaller). The higher efficiency of Carreras is alsowell visible (a factor of about 2 at this wavelength).
for wavelengths larger than 700 nm (e.g. a gain of factor of 2 at 880 nm). Between 400 and700nm, the quantum efficiency essentially remains the same as before. In the extreme blue(<<400 nm), a quantum efficiency loss up to 25% was measured in the lab but could not beconfirmed on sky yet. Figure 10 shows the quantum efficiency ratio between Carreras andBruce.
Thanks to the thickness of this new CCD (40µm), fringing is strongly reduced (6 times smallerpeak-to-valley amplitude at 880 nm, see Fig. 11). The overall geometry of the Carreras (num-ber of pixels in and X and Y directions, over/prescan regions) is the same as Bruce’s.
Carreras is equipped with a continuous flow cryostat, which provides a high mechanical sta-bility. The liquid nitrogen tank is exchanged every ∼14 days and a seal between the CCD andthe enclosure ensures the thermal insulation of the spectrograph.
Carreras is controlled by a FIERA controller. We have opted not to offer any possibility ofchanging the windowing or binning. However, since P86 two readout speeds have offered,the fast mode (625-KHz) available only in visitor mode. Note that on-chip binning wouldundersample some regions of the spectra also in MEDUSA mode.
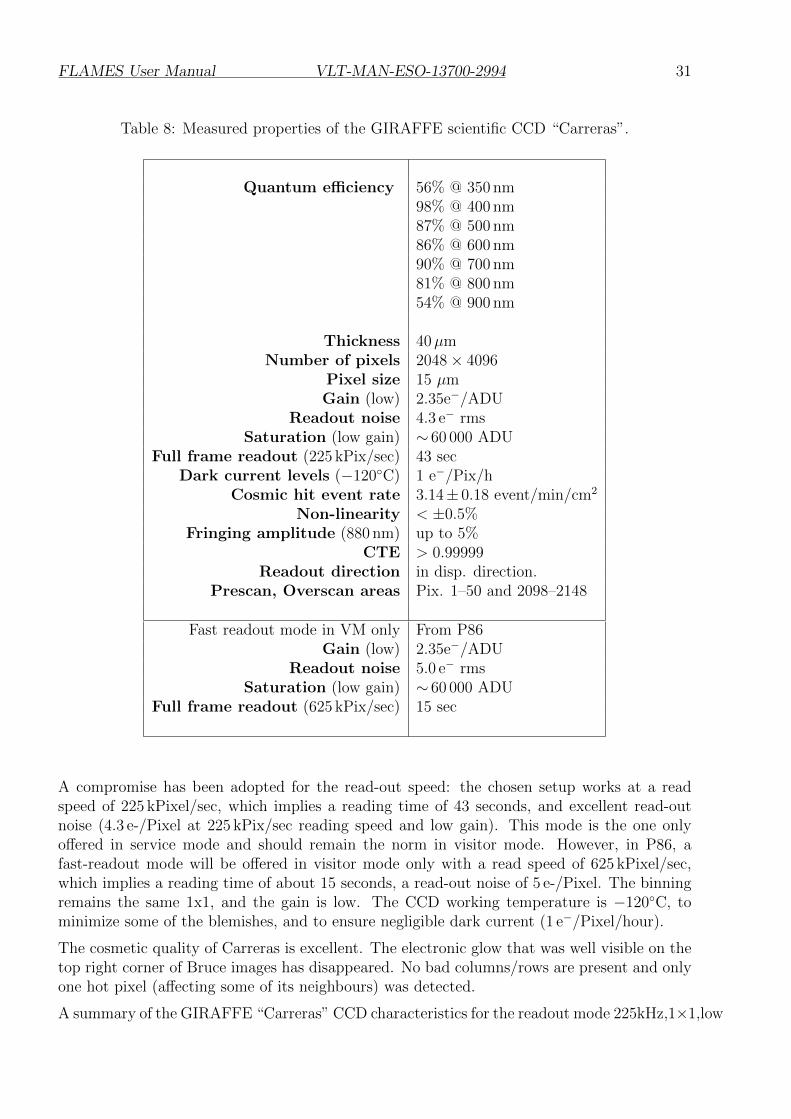
FLAMES User Manual VLT-MAN-ESO-13700-2994 31
Table 8: Measured properties of the GIRAFFE scientific CCD “Carreras”.
Quantum efficiency 56% @ 350 nm98% @ 400 nm87% @ 500 nm86% @ 600 nm90% @ 700 nm81% @ 800 nm54% @ 900 nm
Thickness 40µmNumber of pixels 2048× 4096
Pixel size 15 µmGain (low) 2.35e−/ADU
Readout noise 4.3 e− rmsSaturation (low gain) ∼ 60 000 ADU
Full frame readout (225 kPix/sec) 43 secDark current levels (−120◦C) 1 e−/Pix/h
Cosmic hit event rate 3.14± 0.18 event/min/cm2
Non-linearity < ±0.5%Fringing amplitude (880 nm) up to 5%
CTE > 0.99999Readout direction in disp. direction.
Prescan, Overscan areas Pix. 1–50 and 2098–2148
Fast readout mode in VM only From P86Gain (low) 2.35e−/ADU
Readout noise 5.0 e− rmsSaturation (low gain) ∼ 60 000 ADU
Full frame readout (625 kPix/sec) 15 sec
A compromise has been adopted for the read-out speed: the chosen setup works at a readspeed of 225 kPixel/sec, which implies a reading time of 43 seconds, and excellent read-outnoise (4.3 e-/Pixel at 225 kPix/sec reading speed and low gain). This mode is the one onlyoffered in service mode and should remain the norm in visitor mode. However, in P86, afast-readout mode will be offered in visitor mode only with a read speed of 625 kPixel/sec,which implies a reading time of about 15 seconds, a read-out noise of 5 e-/Pixel. The binningremains the same 1x1, and the gain is low. The CCD working temperature is −120◦C, tominimize some of the blemishes, and to ensure negligible dark current (1 e−/Pixel/hour).
The cosmetic quality of Carreras is excellent. The electronic glow that was well visible on thetop right corner of Bruce images has disappeared. No bad columns/rows are present and onlyone hot pixel (affecting some of its neighbours) was detected.
A summary of the GIRAFFE “Carreras” CCD characteristics for the readout mode 225kHz,1×1,low
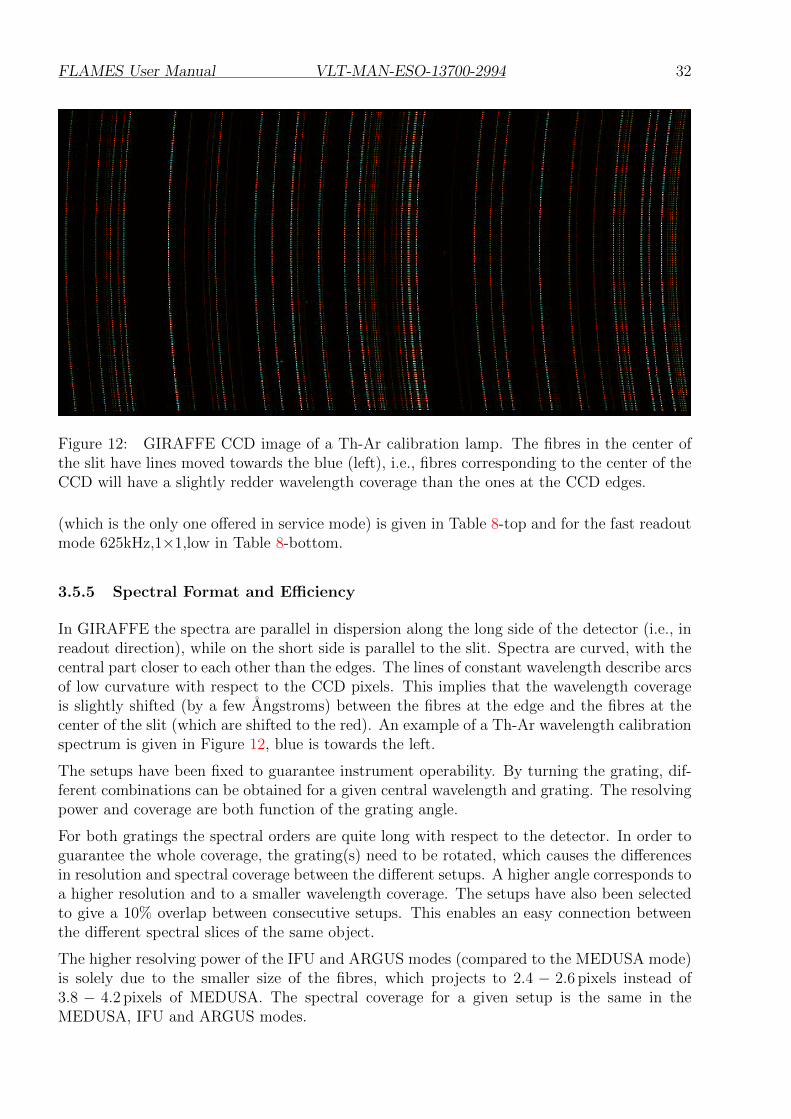
FLAMES User Manual VLT-MAN-ESO-13700-2994 32
Figure 12: GIRAFFE CCD image of a Th-Ar calibration lamp. The fibres in the center ofthe slit have lines moved towards the blue (left), i.e., fibres corresponding to the center of theCCD will have a slightly redder wavelength coverage than the ones at the CCD edges.
(which is the only one offered in service mode) is given in Table 8-top and for the fast readoutmode 625kHz,1×1,low in Table 8-bottom.
3.5.5 Spectral Format and Efficiency
In GIRAFFE the spectra are parallel in dispersion along the long side of the detector (i.e., inreadout direction), while on the short side is parallel to the slit. Spectra are curved, with thecentral part closer to each other than the edges. The lines of constant wavelength describe arcsof low curvature with respect to the CCD pixels. This implies that the wavelength coverageis slightly shifted (by a few Angstroms) between the fibres at the edge and the fibres at thecenter of the slit (which are shifted to the red). An example of a Th-Ar wavelength calibrationspectrum is given in Figure 12, blue is towards the left.
The setups have been fixed to guarantee instrument operability. By turning the grating, dif-ferent combinations can be obtained for a given central wavelength and grating. The resolvingpower and coverage are both function of the grating angle.
For both gratings the spectral orders are quite long with respect to the detector. In order toguarantee the whole coverage, the grating(s) need to be rotated, which causes the differencesin resolution and spectral coverage between the different setups. A higher angle corresponds toa higher resolution and to a smaller wavelength coverage. The setups have also been selectedto give a 10% overlap between consecutive setups. This enables an easy connection betweenthe different spectral slices of the same object.
The higher resolving power of the IFU and ARGUS modes (compared to the MEDUSA mode)is solely due to the smaller size of the fibres, which projects to 2.4 − 2.6 pixels instead of3.8 − 4.2 pixels of MEDUSA. The spectral coverage for a given setup is the same in theMEDUSA, IFU and ARGUS modes.

FLAMES User Manual VLT-MAN-ESO-13700-2994 33
For a given spectral format, the spectral resolution is very uniform along the chip. Measure-ments show a variation of the resolving power along the chip of less than 4% rms.
It is important to recall that the efficiency can change substantially within the same setup,by almost a factor two if the wavelength of interest is close edge of the order. The ETC givesa very reasonable representation of the final spectral format.
3.5.6 GIRAFFE Setup Stability and Repeatability
GIRAFFE was built to be mechanically very stable; the slit exchange mechanics were designedto ensure high setup repeatability; the basic requirement being that the calibrations madeduring the day would well reproduce the night observations. This has been achieved, asconfirmed form tests in Garching and Paranal. The flexures due to temperature variationsmeasured in GIRAFFE in long term tests amount to∼ 0.4 pixels/K along and perpendicular todispersion, which translates into typical shifts of ∼0.2 pixel in the 12 hours night/day intervalon the detector. The number given above includes the repeatability of the setup, since thetests were done by swapping setups between the tests. Note that GIRAFFE has no thermalcompensation in the axis perpendicular to the dispersion, so that occasional large changes inthe temperature can cause bigger shifts than those noted above. In these cases the calibrationsneed to be repeated as the extraction of fibre data are very sensitive to such shifts betweenscience and calibration frames.
The grating position is monitored daily and the results are available here:
http://www.eso.org/observing/dfo/quality/GIRAFFE/reports/HEALTH
/trend_report_STABILITY_HC.html
3.5.7 GIRAFFE Calibration Units
In addition to the calibrations performed through the Positioner calibration Unit (illuminatingall the fibres sequentially, cf. § 3.3), GIRAFFE is equipped with two calibration units:
Simultaneous Calibration Unit (SCU)
In order to limit the use of time-consuming night calibrations, in each GIRAFFE mode 5fibres are devoted to the acquisition of simultaneous Th-Ar spectra illuminated by the SCUduring the science integration. The unit is equipped with a tunable neutral density filter whichallows good Th-Ar exposure levels for integration times between 2 and 120 minutes. If notdeselected in the observing template, these 5 SCU spectra are acquired automatically. Notethat for faint objects the SimCal spectra can contaminate neighbouring spectra, especially forsettings redward of 650-nm (see Sect. 3.8.2). Users can choose to take a 60-s exposure withthe lamp ON, then the (long integration) science target with it OFF, then a 60-s exposurewith it ON again, in order to eliminate the possibility of contamination.
Longslit Calibration Unit
One of the GIRAFFE slits is equipped with a longslit unit, fed by a calibration system withan integrating sphere. The slit is illuminated by an F/5 beam to simulate the F/5 fibre exit.This slit unit is mainly used for engineering tests and is equipped with one FF, one Ne andone Th-Ar lamp.
FLAMES User Manual VLT-MAN-ESO-13700-2994 34
3.6 UVES – FIBRE mode
In fibre mode, part of the pre-slit area of UVES (see UVES Manual) is substituted by a fibreprojector, which transforms the fibre focal aperture F/3 at the fibre exit into a 25 mm parallelbeam.
In front of the fibre projector a shutter allows the light from the fibres to reach the modeselection mirror where the fibre mode is selected. After the light passes through a re-imagingF/10 lens, the regular red UVES slit and the UVES RED arm is used in fibre mode. UVES isexhaustively described in the UVES User Manual; only a very short description is given here(see http://www.eso.org/sci/facilities/paranal/instruments/uves).
The UVES RED arm (λλ 420−1100 nm) is a white-pupil type design. With a beam of 200 mm,the off-axis parabolic collimator illuminates the echelle grating of 214× 840× 125 mm with alarge blaze angle (76◦). The echelle is used in quasi-Littrow mode, i.e., the angle of incidenceand the angle of diffraction are equal but in a different plane, which maximizes efficiency.
The grating cross-dispersers provide an order separation larger than 10 arcsec at any wave-length in the spectral range 420− 1100 nm. This separation allows to host the 8 UVES fibres(for the 580-nm and 860-nm settings), which have an aperture of 1 arcsecond each and areseparated by 1.47 arcseconds.
The red camera is dioptric (no central obstruction) and provides an external focal plane foreasy detector interfacing and upgrading during the lifetime of the instrument, together witha large field, good image quality and high optical transmission.
In the red arm, a mosaic of two 4096 × 2048 pixels CCDs is offered, separated by about 1mm (loss of one order in the gap). The direction of the spectral dispersion (= echelle orders)is along the larger dimension of the CCDs. The instrument spectral formats (wavelengthcoverage, etc.) are always computed for these fixed CCD window settings.
The Arm Selector unit has four positions: Free (direct feed to the red arm), Mirror#1 tofeed the blue arm, Dichroic#1 and Dichroic#2 to feed both arms. In fibre mode, the backsideof Mirror#1 is used to feed the red arm of UVES with the light from the eight FLAMES fibres.The working position of this unit is determined automatically by the instrument software oncethe instrument observing mode is selected.
3.6.1 The RED Spectrograph Arm
The red mirror collimator consists of two off-axis parabolas and two flat mirrors. It is ofthe “white pupil” type with two 200 mm pupils: one for the echelle and one at the cross-disperser/camera which results in a moderate size of the optical components and a simplifieddesign.
The red echelle grating is 840 mm long and 210 cm wide. Because grating masters of thissize cannot be ruled, a new process was developed in which a replica is made of two preciselyaligned masters. The result is called a “monolithic mosaic” and has a resolving power on theorder of 2 000 000 and a stable Line Spread Function. The groove density and hence the orderlength was selected such that the order length at 990 nm is equal to the CCD length. Furtherinformation on the echelle (and cross-disperser) gratings can be found in Table 9.
The cross-disperser unit is a grating turret with two gratings mounted back-to-back. Se-
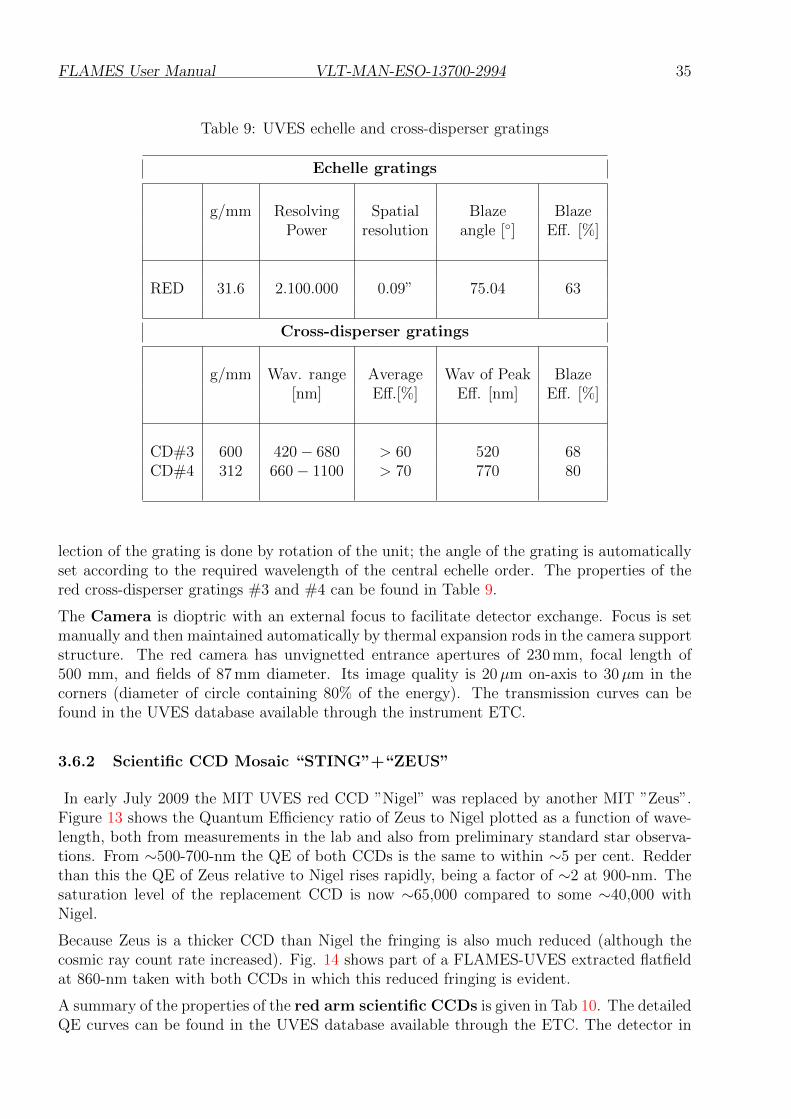
FLAMES User Manual VLT-MAN-ESO-13700-2994 35
Table 9: UVES echelle and cross-disperser gratings
Echelle gratings
g/mm Resolving Spatial Blaze BlazePower resolution angle [◦] Eff. [%]
RED 31.6 2.100.000 0.09” 75.04 63
Cross-disperser gratings
g/mm Wav. range Average Wav of Peak Blaze[nm] Eff.[%] Eff. [nm] Eff. [%]
CD#3 600 420− 680 > 60 520 68CD#4 312 660− 1100 > 70 770 80
lection of the grating is done by rotation of the unit; the angle of the grating is automaticallyset according to the required wavelength of the central echelle order. The properties of thered cross-disperser gratings #3 and #4 can be found in Table 9.
The Camera is dioptric with an external focus to facilitate detector exchange. Focus is setmanually and then maintained automatically by thermal expansion rods in the camera supportstructure. The red camera has unvignetted entrance apertures of 230 mm, focal length of500 mm, and fields of 87 mm diameter. Its image quality is 20µm on-axis to 30µm in thecorners (diameter of circle containing 80% of the energy). The transmission curves can befound in the UVES database available through the instrument ETC.
3.6.2 Scientific CCD Mosaic “STING”+“ZEUS”
In early July 2009 the MIT UVES red CCD ”Nigel” was replaced by another MIT ”Zeus”.Figure 13 shows the Quantum Efficiency ratio of Zeus to Nigel plotted as a function of wave-length, both from measurements in the lab and also from preliminary standard star observa-tions. From ∼500-700-nm the QE of both CCDs is the same to within ∼5 per cent. Redderthan this the QE of Zeus relative to Nigel rises rapidly, being a factor of ∼2 at 900-nm. Thesaturation level of the replacement CCD is now ∼65,000 compared to some ∼40,000 withNigel.
Because Zeus is a thicker CCD than Nigel the fringing is also much reduced (although thecosmic ray count rate increased). Fig. 14 shows part of a FLAMES-UVES extracted flatfieldat 860-nm taken with both CCDs in which this reduced fringing is evident.
A summary of the properties of the red arm scientific CCDs is given in Tab 10. The detailedQE curves can be found in the UVES database available through the ETC. The detector in
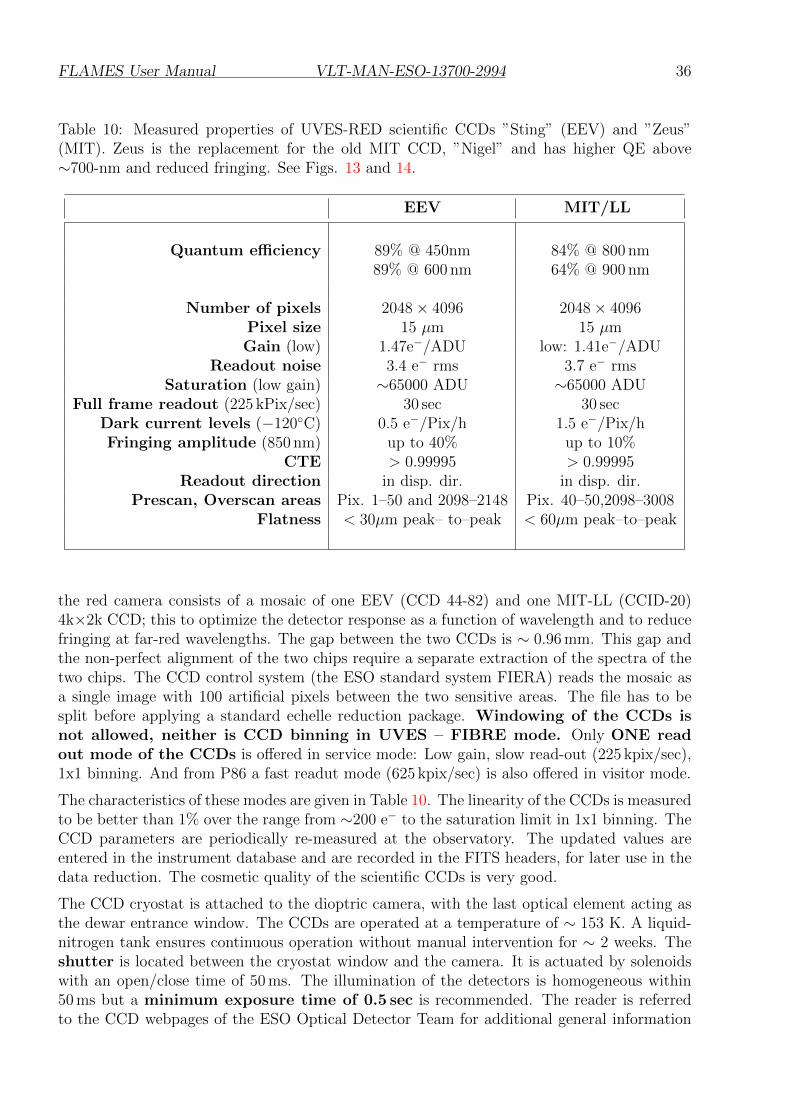
FLAMES User Manual VLT-MAN-ESO-13700-2994 36
Table 10: Measured properties of UVES-RED scientific CCDs ”Sting” (EEV) and ”Zeus”(MIT). Zeus is the replacement for the old MIT CCD, ”Nigel” and has higher QE above∼700-nm and reduced fringing. See Figs. 13 and 14.
EEV MIT/LL
Quantum efficiency 89% @ 450nm 84% @ 800 nm89% @ 600 nm 64% @ 900 nm
Number of pixels 2048× 4096 2048× 4096Pixel size 15 µm 15 µmGain (low) 1.47e−/ADU low: 1.41e−/ADU
Readout noise 3.4 e− rms 3.7 e− rmsSaturation (low gain) ∼65000 ADU ∼65000 ADU
Full frame readout (225 kPix/sec) 30 sec 30 secDark current levels (−120◦C) 0.5 e−/Pix/h 1.5 e−/Pix/hFringing amplitude (850 nm) up to 40% up to 10%
CTE > 0.99995 > 0.99995Readout direction in disp. dir. in disp. dir.
Prescan, Overscan areas Pix. 1–50 and 2098–2148 Pix. 40–50,2098–3008Flatness < 30µm peak– to–peak < 60µm peak–to–peak
the red camera consists of a mosaic of one EEV (CCD 44-82) and one MIT-LL (CCID-20)4k×2k CCD; this to optimize the detector response as a function of wavelength and to reducefringing at far-red wavelengths. The gap between the two CCDs is ∼ 0.96 mm. This gap andthe non-perfect alignment of the two chips require a separate extraction of the spectra of thetwo chips. The CCD control system (the ESO standard system FIERA) reads the mosaic asa single image with 100 artificial pixels between the two sensitive areas. The file has to besplit before applying a standard echelle reduction package. Windowing of the CCDs isnot allowed, neither is CCD binning in UVES – FIBRE mode. Only ONE readout mode of the CCDs is offered in service mode: Low gain, slow read-out (225 kpix/sec),1x1 binning. And from P86 a fast readut mode (625 kpix/sec) is also offered in visitor mode.
The characteristics of these modes are given in Table 10. The linearity of the CCDs is measuredto be better than 1% over the range from ∼200 e− to the saturation limit in 1x1 binning. TheCCD parameters are periodically re-measured at the observatory. The updated values areentered in the instrument database and are recorded in the FITS headers, for later use in thedata reduction. The cosmetic quality of the scientific CCDs is very good.
The CCD cryostat is attached to the dioptric camera, with the last optical element acting asthe dewar entrance window. The CCDs are operated at a temperature of ∼ 153 K. A liquid-nitrogen tank ensures continuous operation without manual intervention for ∼ 2 weeks. Theshutter is located between the cryostat window and the camera. It is actuated by solenoidswith an open/close time of 50 ms. The illumination of the detectors is homogeneous within50 ms but a minimum exposure time of 0.5 sec is recommended. The reader is referredto the CCD webpages of the ESO Optical Detector Team for additional general information
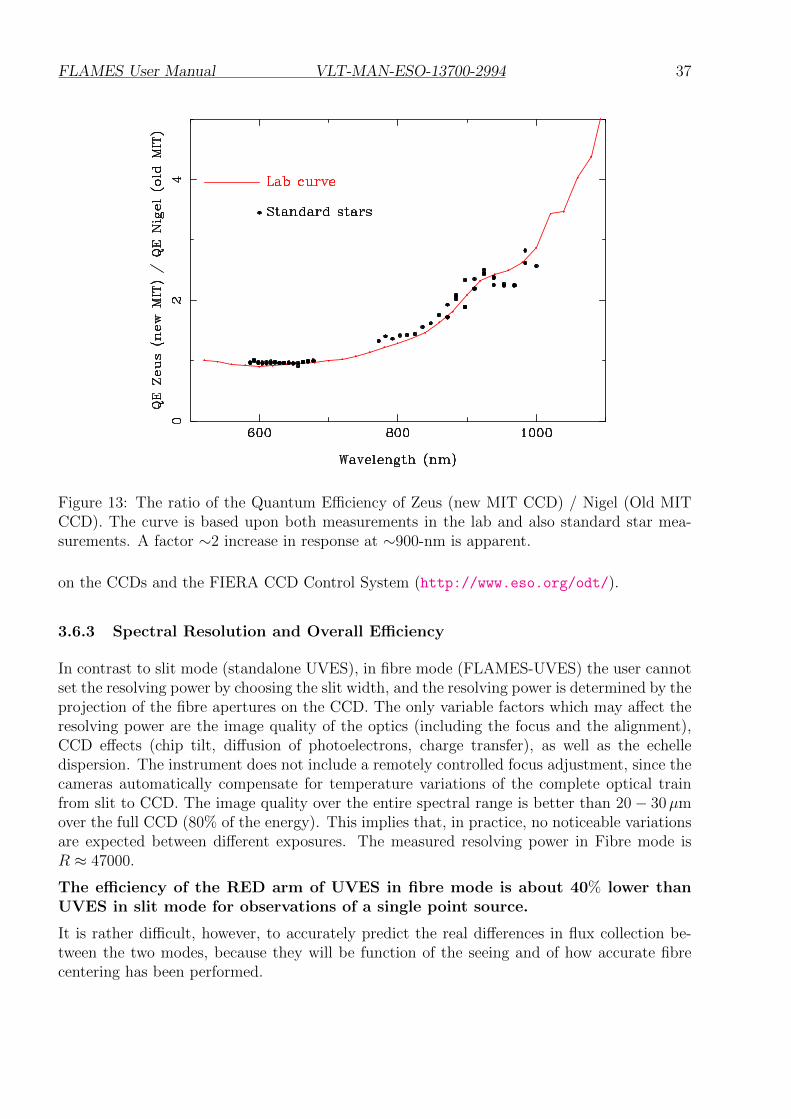
FLAMES User Manual VLT-MAN-ESO-13700-2994 37
Figure 13: The ratio of the Quantum Efficiency of Zeus (new MIT CCD) / Nigel (Old MITCCD). The curve is based upon both measurements in the lab and also standard star mea-surements. A factor ∼2 increase in response at ∼900-nm is apparent.
on the CCDs and the FIERA CCD Control System (http://www.eso.org/odt/).
3.6.3 Spectral Resolution and Overall Efficiency
In contrast to slit mode (standalone UVES), in fibre mode (FLAMES-UVES) the user cannotset the resolving power by choosing the slit width, and the resolving power is determined by theprojection of the fibre apertures on the CCD. The only variable factors which may affect theresolving power are the image quality of the optics (including the focus and the alignment),CCD effects (chip tilt, diffusion of photoelectrons, charge transfer), as well as the echelledispersion. The instrument does not include a remotely controlled focus adjustment, since thecameras automatically compensate for temperature variations of the complete optical trainfrom slit to CCD. The image quality over the entire spectral range is better than 20− 30µmover the full CCD (80% of the energy). This implies that, in practice, no noticeable variationsare expected between different exposures. The measured resolving power in Fibre mode isR ≈ 47000.
The efficiency of the RED arm of UVES in fibre mode is about 40% lower thanUVES in slit mode for observations of a single point source.
It is rather difficult, however, to accurately predict the real differences in flux collection be-tween the two modes, because they will be function of the seeing and of how accurate fibrecentering has been performed.
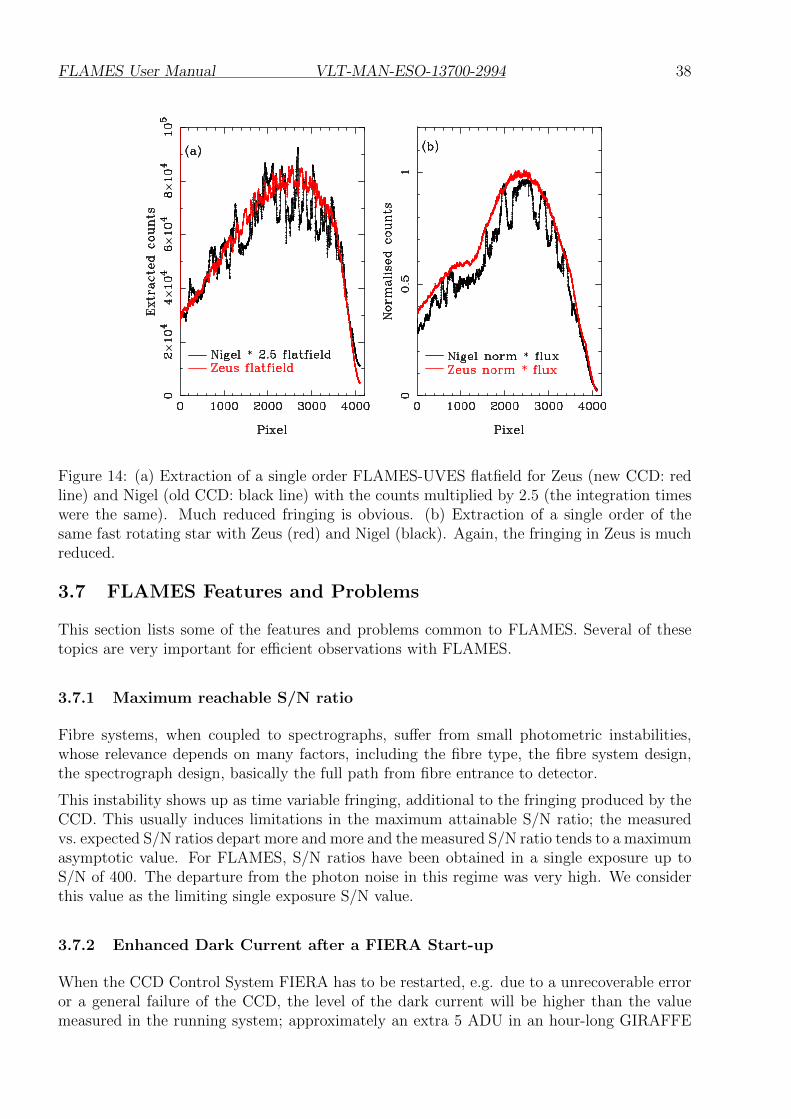
FLAMES User Manual VLT-MAN-ESO-13700-2994 38
Figure 14: (a) Extraction of a single order FLAMES-UVES flatfield for Zeus (new CCD: redline) and Nigel (old CCD: black line) with the counts multiplied by 2.5 (the integration timeswere the same). Much reduced fringing is obvious. (b) Extraction of a single order of thesame fast rotating star with Zeus (red) and Nigel (black). Again, the fringing in Zeus is muchreduced.
3.7 FLAMES Features and Problems
This section lists some of the features and problems common to FLAMES. Several of thesetopics are very important for efficient observations with FLAMES.
3.7.1 Maximum reachable S/N ratio
Fibre systems, when coupled to spectrographs, suffer from small photometric instabilities,whose relevance depends on many factors, including the fibre type, the fibre system design,the spectrograph design, basically the full path from fibre entrance to detector.
This instability shows up as time variable fringing, additional to the fringing produced by theCCD. This usually induces limitations in the maximum attainable S/N ratio; the measuredvs. expected S/N ratios depart more and more and the measured S/N ratio tends to a maximumasymptotic value. For FLAMES, S/N ratios have been obtained in a single exposure up toS/N of 400. The departure from the photon noise in this regime was very high. We considerthis value as the limiting single exposure S/N value.
3.7.2 Enhanced Dark Current after a FIERA Start-up
When the CCD Control System FIERA has to be restarted, e.g. due to a unrecoverable erroror a general failure of the CCD, the level of the dark current will be higher than the valuemeasured in the running system; approximately an extra 5 ADU in an hour-long GIRAFFE
FLAMES User Manual VLT-MAN-ESO-13700-2994 39
exposure following the shutdown and an extra 0.5 ADU RMS noise. It is important to checkthe performance of the detectors by taking e.g. a dark exposures of a few minutes in binnedmode. An interval of 2–3 hours is normally sufficient to return to optimal performance of theCCD.
3.8 GIRAFFE Features and Problems
3.8.1 Low counts in blue attached screen flatfields
It is almost impossible to get sufficient flux with a reasonable exposure time forthe bluest setups for attached screen flats. In the bluest three HR settings there aretypically only a few hundred ADU detected in a 20-minute exposure time in the bluest part ofthe CCD. Hence accurate flatfielding for the HR1, HR2, HR3 and LR1 settings for ARGUSONLY is not presently possible within service mode normal programmes. These four settingsare therefore only offered in visitor mode in Argus to allow for more time to take the attachedflatfields in the daytime. Even then the number of derived counts obtained at the far blue endmay only be around a thousand in a few hours. Note that for Medusa and IFU settings therobot (not screen) flats are adequate in the blue so all settings are offered in service mode forthese fibre systems.
3.8.2 Contamination from Simultaneous Th-Ar Calibrations
Although GIRAFFE has very low level of scattered light, the 5 simultaneous fibres, in particu-lar in the reddest setups may show very strong Argon lines. These lines cannot be suppressedby any filter, and give visible ghosts (at the level of several ADUs) over a large part of the CCDarea. It appears as a diffuse increase in the background (10−20 electrons), with an increase upto 40− 60 electrons (numbers are indicative) very close to the strong lines. These ghosts maybe very bad for those users interested in faint objects low S/N ratio observations, since theyincrease substantially the background. Since the spectrograph is quite stable, users who areobserving faint objects and who are not interested in accurate radial velocity determinationsshould switch the simultaneous calibration OFF. This can be done by filling in the appropriatefield in the FLAMES observing templates. For Medusa mode, the retractor positions of fibresadjacent to the simultaneous calibrations are as follows; Medusa plate 1; retractor positions24, 44, 84, 104, 144, 164, 194, 224, 264. Medusa plate 2; retractor positions 24, 44, 84, 106,130, 170, 204, 224, 264.
3.8.3 In-focus Ghosts and Scattered Light
A 3% scattered light level is observed in the reddest 300 pixels of the spectrum; the featureis rather sharp and most likely caused by a white light ghost, i.e., a reflection inside thecollimator; it affects all the 2048 pixels along the slit direction.
3.8.4 CCD Defects
• The old detector:“Bruce” (until P80)
FLAMES User Manual VLT-MAN-ESO-13700-2994 40
The EEV chip “Bruce” has very few cosmetic defects. The most noticeable is a hotcolumn, which affect all the pixels of row 420 redder than pixel 1270. This column doesnot affect the same spectrum in all setups, due to slight shifts between the differentsetups. The most affected spectra are spectrum number 24 in MEDUSA mode, whichcorresponds to button 58, but a movement of±1 spectrum depending on the chosen setupand on the long term spectrograph spectrograph stability, is possible. Other defects canbe generally eliminated by flat fielding.
In the upper red corner (i.e, at fibres with high button numbers) a rectangle of about350×200 pixels shows a higher level of counts in long exposures (up to about 60 electronsin one hour). This feature is generally referred as “the glow”.
• The new detector:“Carreras” (after P80)
The EEV chip “Carreras” has very clean cosmetics. It has no known bad column orrow. The number of dark pixels (i.e. pixels with flux values less than 50% of the localmean) is 62. There is only one hot pixel located at [185;3040]. This hot pixel affects thecounts recorded for some of its neighbours. The exact number of affected surroundingpixels depends on the CCD temperature (typically about 10 pixels at the operatingtemperature).
3.9 UVES Features and Problems
We note that in early July 2009 the RED MIT CCD of UVES (Nigel) was replaced by Zeusthat has a higher throughput redwards of 700-nm and less fringing. See Sect. 3.6.2. s
3.9.1 UVES SimCal lamp too bright for long exposures
When observing with the FLAMES-UVES (7+1) setting, the strength of the simultaneousThAr calibration lamp is set for an exposure time of 15 minutes. Unlike the SimCal lamp inGIRAFFE, there is no filter available in UVES to reduce the flux for long exposures. Thisleads to saturation in some lines in long integration times.
3.9.2 Fibre Overlap in the 520 nm Setup
Below 500 nm, the order separation becomes too small to accommodate all 8 UVES fibreswithout overlap. Therefore, the decker of the UVES slit masks the UVES fibres #8 and #9(corresponding to buttons 103 and 235, respectively) if the 520 nm setting is selected. If thesetwo fibres have been assigned to targets, the light will be lost. Hence only 6 fibres are availablein the 520-nm setting.
3.9.3 Fibre-to-fibre Contamination
Given the limited separation between the UVES fibres, a small degree of contamination existsbetween one fibre and its neighbour on the slit. This can be seen easily in Figure 15 showinga trace of three UVES orders in direction perpendicular to the dispersion: three groups of 8fibres are seen and the reader can notice that the flux level in the interfibre is higher than
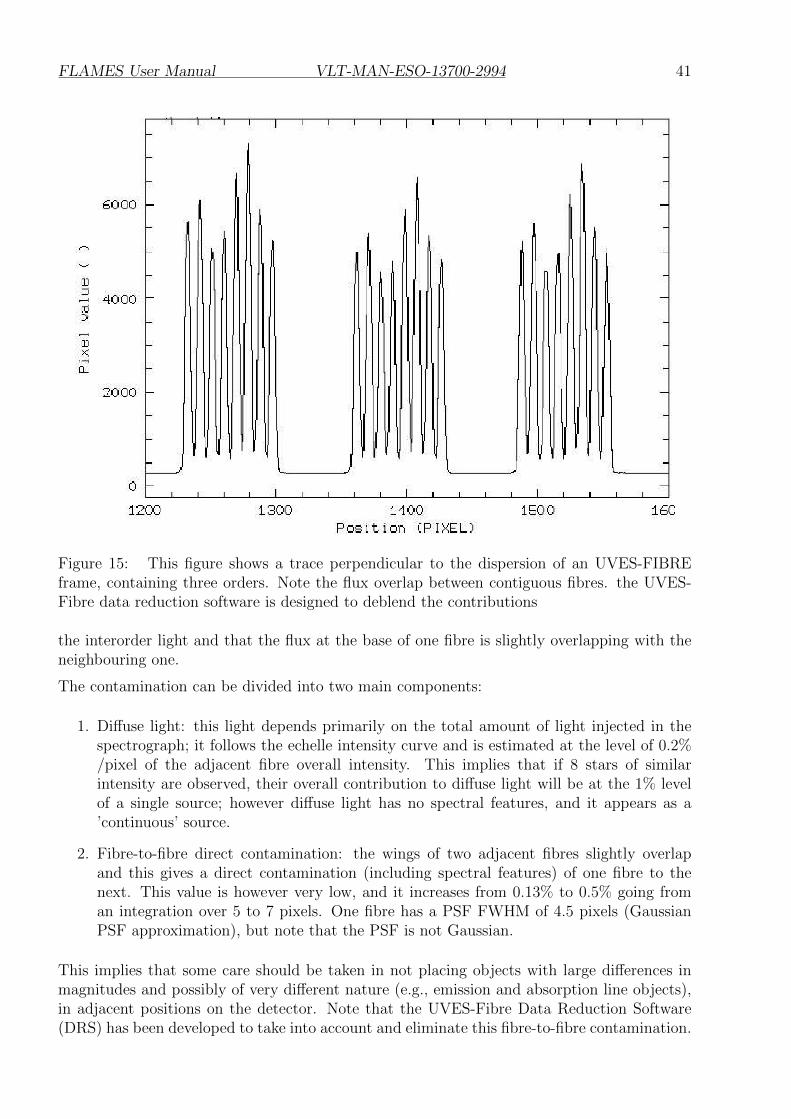
FLAMES User Manual VLT-MAN-ESO-13700-2994 41
Figure 15: This figure shows a trace perpendicular to the dispersion of an UVES-FIBREframe, containing three orders. Note the flux overlap between contiguous fibres. the UVES-Fibre data reduction software is designed to deblend the contributions
the interorder light and that the flux at the base of one fibre is slightly overlapping with theneighbouring one.
The contamination can be divided into two main components:
1. Diffuse light: this light depends primarily on the total amount of light injected in thespectrograph; it follows the echelle intensity curve and is estimated at the level of 0.2%/pixel of the adjacent fibre overall intensity. This implies that if 8 stars of similarintensity are observed, their overall contribution to diffuse light will be at the 1% levelof a single source; however diffuse light has no spectral features, and it appears as a’continuous’ source.
2. Fibre-to-fibre direct contamination: the wings of two adjacent fibres slightly overlapand this gives a direct contamination (including spectral features) of one fibre to thenext. This value is however very low, and it increases from 0.13% to 0.5% going froman integration over 5 to 7 pixels. One fibre has a PSF FWHM of 4.5 pixels (GaussianPSF approximation), but note that the PSF is not Gaussian.
This implies that some care should be taken in not placing objects with large differences inmagnitudes and possibly of very different nature (e.g., emission and absorption line objects),in adjacent positions on the detector. Note that the UVES-Fibre Data Reduction Software(DRS) has been developed to take into account and eliminate this fibre-to-fibre contamination.

FLAMES User Manual VLT-MAN-ESO-13700-2994 42
3.9.4 Spectral Gaps in the RED
The CCD detector in the red arm (see Section 2.4) consists of a mosaic of two chips, separatedby a gap of approximately 0.96 mm. This results in the loss of one echelle order in the recordedspectrum around the central wavelength selected by the observer. At 580 nm the gap spansaround 5 nm and at 860 nm the gap is 10 nm. The dimension of the gap at any centralwavelength can be predicted with high accuracy (≤ 0.5 nm) using the instrument ETC.
3.9.5 Optical Ghosts in the far red Spectra
Spectra imaged on the CCD mosaic in the red arm are partly reflected back to the cross-disperser grating through the camera lenses. After a further reflection on the grating, thesecond order spectrum is re-imaged by the camera on the CCDs. These “ghosts” appear asin-focus echelle orders, with a steeper inclination and approximately twice the order separa-tion than the primary spectra. The effect is relevant with the cross-disperser #4 at the farend of the spectrum (central wavelength 860 nm) where the efficiency of the CCD decreasesand the importance of reflections is higher. On the MIT chip (upper CCD in the mosaic),reflections from the EEV (lower CCD of the mosaic) are seen. For reference, see the flat-fielddata available on the UVES web page. The relative intensity of the ghosts to the primaryechelle orders depends on the shape of the target spectrum. With flat fields and at a centralwavelength of 860 nm, the intensity of the ghost orders is < 1% of the real orders on the EEVchip and between 1 and 7% on the MIT chip.
3.9.6 CCD Cosmetic Defects
The CCDs of UVES are of excellent cosmetic quality. The number of hot or less sensitivepixels is limited (< 0.1%) and has little effect on the quality of the data because of the goodsampling.
The defects which, depending on the signal-to-noise of the spectrum, might be visible in theextracted data are listed below. In the EEV CCD (blue side of the CCD mosaic) there are fourtrails of hot pixels which appear in long exposures (X coordinates 3896, 3963, 4052 and 4140in an unbinned FITS file, middle of the chip in y). They each affect a single column (longerdimension of the CCD) and are almost parallel to the echelle orders. They would appear asbroadish emission lines in the bluer part of the extracted spectrum of a faint object.
Nigel (Old MIT CCD)
In the MIT-LL chip (red side of the CCD mosaic), there is a trap in the column X = 1609which might show up as a slight depression over ∼130 pixels in the extracted spectrum of oneorder
Zeus (New MIT CCD)
In the MIT-LL chip (red side of the CCD mosaic), there is a bad column at 1254 weaklyvisible in the bias images.
FLAMES User Manual VLT-MAN-ESO-13700-2994 43
4 Preparing the Observations
4.1 Introduction
Before the actual execution of observations, several steps have to be taken. The preparationof an observing programme is split in two parts: Phase I and Phase II. In Phase I, i.e., theapplication for VLT observing time, the emphasis is put on the scientific justification and onthe technical feasibility of the proposed observations. For the specific case of FLAMES,the proponents must clearly show that they have (or will have) the proper targetlist (including astrometry) prior to Phase II. In Phase II the successful applicants haveto prepare their detailed observing plan including the instrument setups using via the Phase IIPreparation (P2PP) tool.
Prior to Phase II, however, it is fundamental that the applicants have preparedthe proper files containing the target list and have already processed them withthe FPOSS tool.
Together with the general Phase I and Phase II documentation:
http://www.eso.org/sci/observing/proposals the information contained in this chapter
(and in Chapter 5) provides guidelines for the Phase I and Phase II preparation processfor FLAMES observations. In Chapter 6 information is given for astronomers who come toParanal to observe with FLAMES.
The preparation process can be summarized as follows:
Phase I
• Scientific justification
• Choice of instrument and mode
• Estimate of exposure time to reach the required S/N ratio at the desired resolution.
• Selection of the targets, check availability of accurate coordinates.
• Estimate of telescope and instrument overheads
• Determination of scheduling constraints (e.g. visibility, time-critical observations)
• Overview of observation plan (e.g., target list, calibration needs)
Phase II (only for successful applicants)
(bold represent tasks specific for FLAMES)
• Preparation of the target input files
• Preparation of the positioner Target Setup Files with FPOSS. Users shouldpay particular attention to the list of broken fibres (see below Sec. 4.6)
• Identification of detailed instrument setups
• Preparation of required Observation Blocks.
FLAMES User Manual VLT-MAN-ESO-13700-2994 44
• Recalculation of exposure time if new version of ETC has been released.
Due to its design and concept, FLAMES is an ideal instrument for observations in servicemode, carried out by the observatory staff (i.e., in absence of the applicant).
All the information necessary to the execution of the observations has to be provided to ESOin the form of Observation Blocks prepared through the P2PP tool, following the instruc-tions sent to the applicants. The Observatory staff will combine the execution of differentprogrammes in the same night optimizing the time sequence, seeing, and moon requirements.Observations carried out with the applicant present at the telescope are referred to as visitormode observations. In this mode the astronomer prepares (or finalizes) the OBs at the Obser-vatory in advance of his/her nights. He/she decides about the sequence of observations duringthe night, but their execution is, however, still performed by the telescope and instrumentoperator.
To facilitate the preparation of Phase I (and Phase II) proposals, in addition to the informationprovided in this User Manual, ESO has developed sophisticated Exposure Time Calculators(ETC), one for GIRAFFE and one for UVES-Fibre (see § 4.7.1). The ETC permits one toestimate the signal-to-noise ratio for a given configuration and exposure time (taking intoaccount specific atmospheric conditions) and determines the spectral format resulting fromthe selected instrument setup.
The Observation Blocks (OB) are prepared using another ESO-provided software tool calledP2PP, see:
http://www.eso.org/observing/p2pp/
It is worthwhile recalling that for FLAMES the OB preparation is very simple, while mostof the effort is required to provide objects, fiducial stars and VLT guide stars in the sameastrometric coordinate system with a relative rms accuracy better than 0.3 arcsecs.
A UVES-fibre (since April 2003) and a GIRAFFE (from April 2004) data reduction pipelineruns at the observatory. They enable automatic extraction and wavelength calibration of mostsettings, in order to check of the quality of the observations (resolution, signal-to-noise ratioin the extracted spectra). The science data are calibrated with calibration exposures from acalibration database which is updated when required.
Note that at the time of writing there is no sky subtraction available in the GIRAFFEpipeline.
4.2 FLAMES Modes and basic Choices
After the detailed description of the GIRAFFE and UVES spectrographs, and their subsystemsand functions (Chapter 3), we provide an overview of the different FLAMES observing modes.
FLAMES is equipped with two spectrographs, GIRAFFE and the RED arm of UVES. UVEScan be either used with all 8 fibres acquiring source (or sky) photons, or by using seven fibreson sources and one fibre to record simultaneously a Th-Ar arclamp spectrum (UVES 7+1).
GIRAFFE can operate in either MEDUSA, IFU or ARGUS mode. Simultaneous observationswith UVES can be carried out with any of the GIRAFFE modes. However, only one GIRAFFEmode can be used at a time (e.g., it is not possible to observe simultaneously with MEDUSA+ IFU).
FLAMES User Manual VLT-MAN-ESO-13700-2994 45
In summary, all the possible modes of FLAMES include:
1. UVES (8 fibres to targets in 580 or 860 nm setup, 1 arcsec diameter each)
2. UVES (6 fibres to targets in 520 nm setup, 1 arcsec diameter each)
3. UVES 7+1 (7 fibres to targets + 1 simultaneous calibration fibre illuminated with aTh-Ar lamp, only in the 580 nm setup)
4. GIRAFFE–MEDUSA (131 fibres to targets, 1.2 arcsec diameter each + 5 simultaneouscalibration fibres illuminated with a Th-Ar lamp)
5. GIRAFFE–IFU (15 movable rectangular Integral Field Units, 2×3 arcsec each, made ofan array of 20 fibres + 15 sky fibre units)
6. GIRAFFE–ARGUS (Single, fixed Integral Field Unit, consisting of 14×22 microlenses,with scale of either 0.52 or 0.3 arcsec each)
7. Any combined simultaneous UVES (or UVES 7+1) plus GIRAFFE mode (two simulta-neous GIRAFFE modes are not possible!)
However, in order to insure a manageable calibration database, only a limited amount of setupcombinations (such as CCD setting) are offered.
It is also important to note that in the COMBINED modes the guiding can be performedonly at one given wavelength, even if the two spectrographs have different central wavelengthsettings. This could result in some efficiency losses for the cases when the UVES and GI-RAFFE central wavelength are far apart and/or when the chromatic atmospheric effects ofthe atmosphere are relevant during the exposure (see § 4.4).
4.3 GIRAFFE and UVES Standard Settings
To facilitate the preparation of Observation Blocks (§ 4.7), standard settings have beendefined that allow the observer to select a pre-defined instrument setting for which all param-eters are fixed at optimal values and only the exposure time and number of observations areleft to be decided. The observers can only use these standard settings. The automaticdata processing pipelines are available for these standard settings only.
The FLAMES standard settings are given in Chapter 2, and repeated here for the sake ofcompleteness:
4.3.1 GIRAFFE Standard Settings
GIRAFFE standard settings are given for the high and low resolution modes in Tables 11 and12 respectively. Each setting has a unique FITS keyword INS.EXP.MODE, which is the sameas the “p2pp name” given in the tables. In these tables, in addition to the central wavelengthsof the settings, their coverage and resolving power is given, as measured with Th-Ar lines.Since the coverage varies slightly from fibre to fibre (cf. § 3.5.5), the coverage given in thetables is the coverage interval common to all fibres.
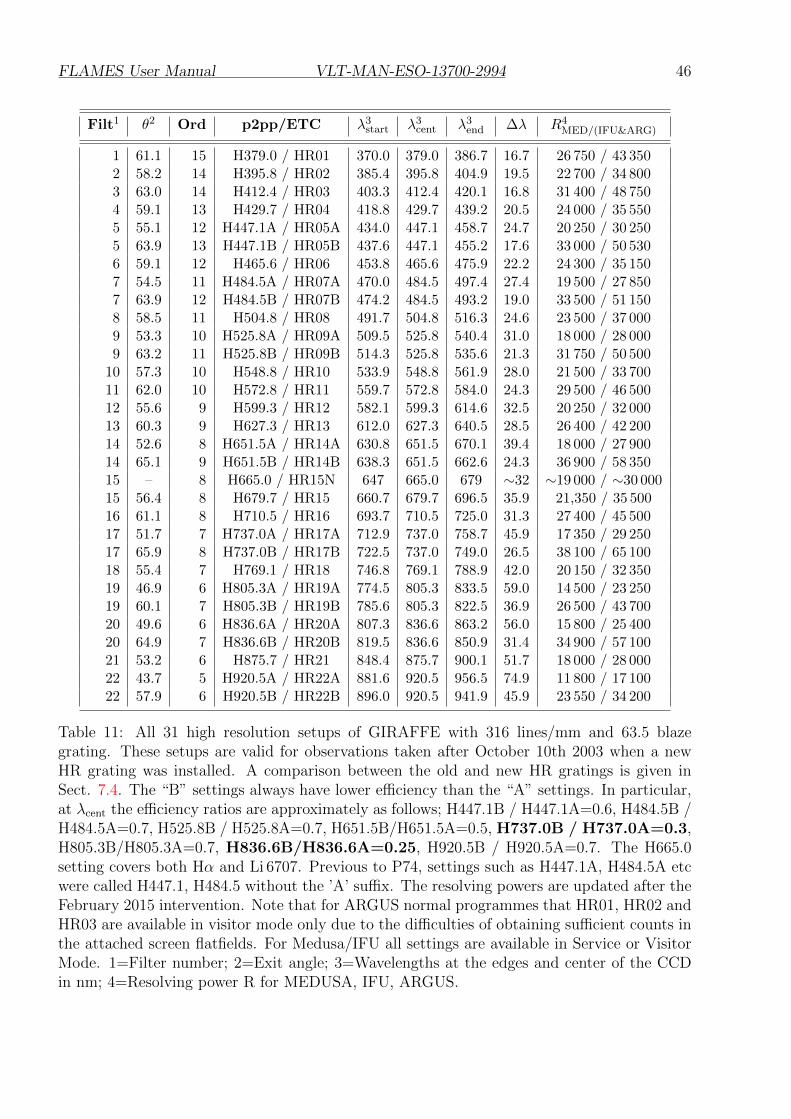
FLAMES User Manual VLT-MAN-ESO-13700-2994 46
Filt1 θ2 Ord p2pp/ETC λ3start λ3cent λ3end ∆λ R4MED/(IFU&ARG)
1 61.1 15 H379.0 / HR01 370.0 379.0 386.7 16.7 26 750 / 43 3502 58.2 14 H395.8 / HR02 385.4 395.8 404.9 19.5 22 700 / 34 8003 63.0 14 H412.4 / HR03 403.3 412.4 420.1 16.8 31 400 / 48 7504 59.1 13 H429.7 / HR04 418.8 429.7 439.2 20.5 24 000 / 35 5505 55.1 12 H447.1A / HR05A 434.0 447.1 458.7 24.7 20 250 / 30 2505 63.9 13 H447.1B / HR05B 437.6 447.1 455.2 17.6 33 000 / 50 5306 59.1 12 H465.6 / HR06 453.8 465.6 475.9 22.2 24 300 / 35 1507 54.5 11 H484.5A / HR07A 470.0 484.5 497.4 27.4 19 500 / 27 8507 63.9 12 H484.5B / HR07B 474.2 484.5 493.2 19.0 33 500 / 51 1508 58.5 11 H504.8 / HR08 491.7 504.8 516.3 24.6 23 500 / 37 0009 53.3 10 H525.8A / HR09A 509.5 525.8 540.4 31.0 18 000 / 28 0009 63.2 11 H525.8B / HR09B 514.3 525.8 535.6 21.3 31 750 / 50 500
10 57.3 10 H548.8 / HR10 533.9 548.8 561.9 28.0 21 500 / 33 70011 62.0 10 H572.8 / HR11 559.7 572.8 584.0 24.3 29 500 / 46 50012 55.6 9 H599.3 / HR12 582.1 599.3 614.6 32.5 20 250 / 32 00013 60.3 9 H627.3 / HR13 612.0 627.3 640.5 28.5 26 400 / 42 20014 52.6 8 H651.5A / HR14A 630.8 651.5 670.1 39.4 18 000 / 27 90014 65.1 9 H651.5B / HR14B 638.3 651.5 662.6 24.3 36 900 / 58 35015 – 8 H665.0 / HR15N 647 665.0 679 ∼32 ∼19 000 / ∼30 00015 56.4 8 H679.7 / HR15 660.7 679.7 696.5 35.9 21,350 / 35 50016 61.1 8 H710.5 / HR16 693.7 710.5 725.0 31.3 27 400 / 45 50017 51.7 7 H737.0A / HR17A 712.9 737.0 758.7 45.9 17 350 / 29 25017 65.9 8 H737.0B / HR17B 722.5 737.0 749.0 26.5 38 100 / 65 10018 55.4 7 H769.1 / HR18 746.8 769.1 788.9 42.0 20 150 / 32 35019 46.9 6 H805.3A / HR19A 774.5 805.3 833.5 59.0 14 500 / 23 25019 60.1 7 H805.3B / HR19B 785.6 805.3 822.5 36.9 26 500 / 43 70020 49.6 6 H836.6A / HR20A 807.3 836.6 863.2 56.0 15 800 / 25 40020 64.9 7 H836.6B / HR20B 819.5 836.6 850.9 31.4 34 900 / 57 10021 53.2 6 H875.7 / HR21 848.4 875.7 900.1 51.7 18 000 / 28 00022 43.7 5 H920.5A / HR22A 881.6 920.5 956.5 74.9 11 800 / 17 10022 57.9 6 H920.5B / HR22B 896.0 920.5 941.9 45.9 23 550 / 34 200
Table 11: All 31 high resolution setups of GIRAFFE with 316 lines/mm and 63.5 blazegrating. These setups are valid for observations taken after October 10th 2003 when a newHR grating was installed. A comparison between the old and new HR gratings is given inSect. 7.4. The “B” settings always have lower efficiency than the “A” settings. In particular,at λcent the efficiency ratios are approximately as follows; H447.1B / H447.1A=0.6, H484.5B /H484.5A=0.7, H525.8B / H525.8A=0.7, H651.5B/H651.5A=0.5, H737.0B / H737.0A=0.3,H805.3B/H805.3A=0.7, H836.6B/H836.6A=0.25, H920.5B / H920.5A=0.7. The H665.0setting covers both Hα and Li 6707. Previous to P74, settings such as H447.1A, H484.5A etcwere called H447.1, H484.5 without the ’A’ suffix. The resolving powers are updated after theFebruary 2015 intervention. Note that for ARGUS normal programmes that HR01, HR02 andHR03 are available in visitor mode only due to the difficulties of obtaining sufficient counts inthe attached screen flatfields. For Medusa/IFU all settings are available in Service or VisitorMode. 1=Filter number; 2=Exit angle; 3=Wavelengths at the edges and center of the CCDin nm; 4=Resolving power R for MEDUSA, IFU, ARGUS.
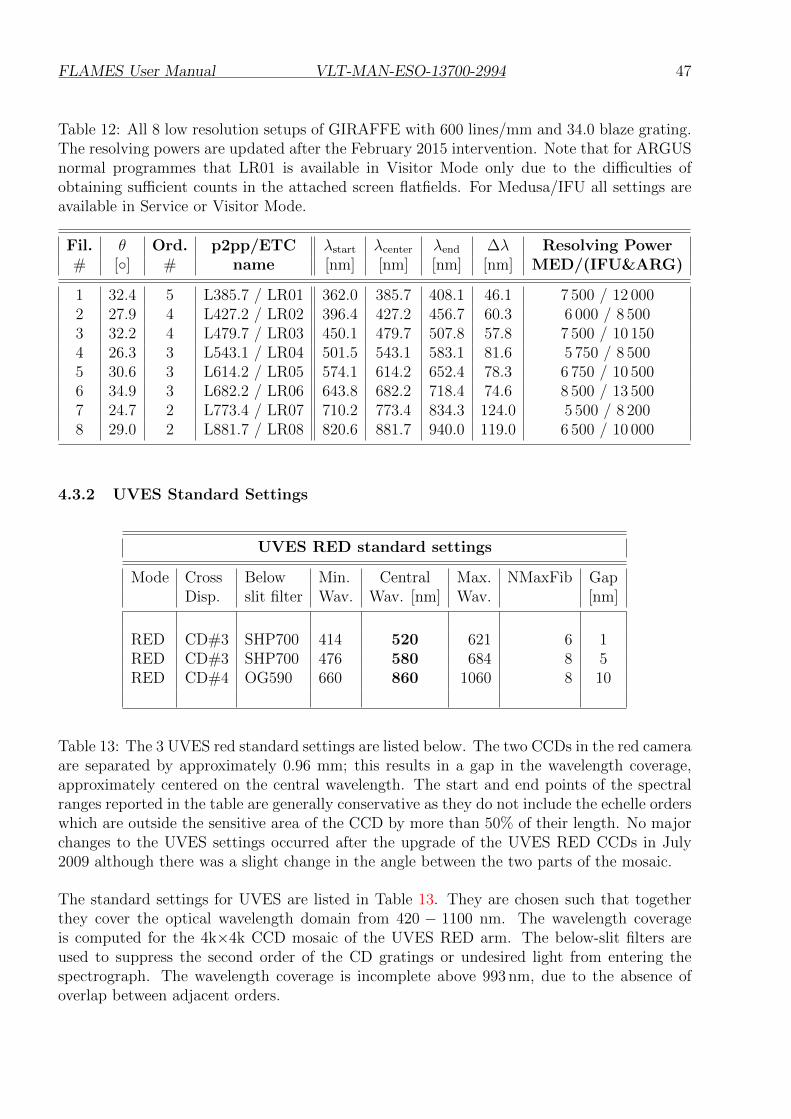
FLAMES User Manual VLT-MAN-ESO-13700-2994 47
Table 12: All 8 low resolution setups of GIRAFFE with 600 lines/mm and 34.0 blaze grating.The resolving powers are updated after the February 2015 intervention. Note that for ARGUSnormal programmes that LR01 is available in Visitor Mode only due to the difficulties ofobtaining sufficient counts in the attached screen flatfields. For Medusa/IFU all settings areavailable in Service or Visitor Mode.
Fil. θ Ord. p2pp/ETC λstart λcenter λend ∆λ Resolving Power# [◦] # name [nm] [nm] [nm] [nm] MED/(IFU&ARG)
1 32.4 5 L385.7 / LR01 362.0 385.7 408.1 46.1 7 500 / 12 0002 27.9 4 L427.2 / LR02 396.4 427.2 456.7 60.3 6 000 / 8 5003 32.2 4 L479.7 / LR03 450.1 479.7 507.8 57.8 7 500 / 10 1504 26.3 3 L543.1 / LR04 501.5 543.1 583.1 81.6 5 750 / 8 5005 30.6 3 L614.2 / LR05 574.1 614.2 652.4 78.3 6 750 / 10 5006 34.9 3 L682.2 / LR06 643.8 682.2 718.4 74.6 8 500 / 13 5007 24.7 2 L773.4 / LR07 710.2 773.4 834.3 124.0 5 500 / 8 2008 29.0 2 L881.7 / LR08 820.6 881.7 940.0 119.0 6 500 / 10 000
4.3.2 UVES Standard Settings
UVES RED standard settings
Mode Cross Below Min. Central Max. NMaxFib GapDisp. slit filter Wav. Wav. [nm] Wav. [nm]
RED CD#3 SHP700 414 520 621 6 1RED CD#3 SHP700 476 580 684 8 5RED CD#4 OG590 660 860 1060 8 10
Table 13: The 3 UVES red standard settings are listed below. The two CCDs in the red cameraare separated by approximately 0.96 mm; this results in a gap in the wavelength coverage,approximately centered on the central wavelength. The start and end points of the spectralranges reported in the table are generally conservative as they do not include the echelle orderswhich are outside the sensitive area of the CCD by more than 50% of their length. No majorchanges to the UVES settings occurred after the upgrade of the UVES RED CCDs in July2009 although there was a slight change in the angle between the two parts of the mosaic.
The standard settings for UVES are listed in Table 13. They are chosen such that togetherthey cover the optical wavelength domain from 420 − 1100 nm. The wavelength coverageis computed for the 4k×4k CCD mosaic of the UVES RED arm. The below-slit filters areused to suppress the second order of the CD gratings or undesired light from entering thespectrograph. The wavelength coverage is incomplete above 993 nm, due to the absence ofoverlap between adjacent orders.
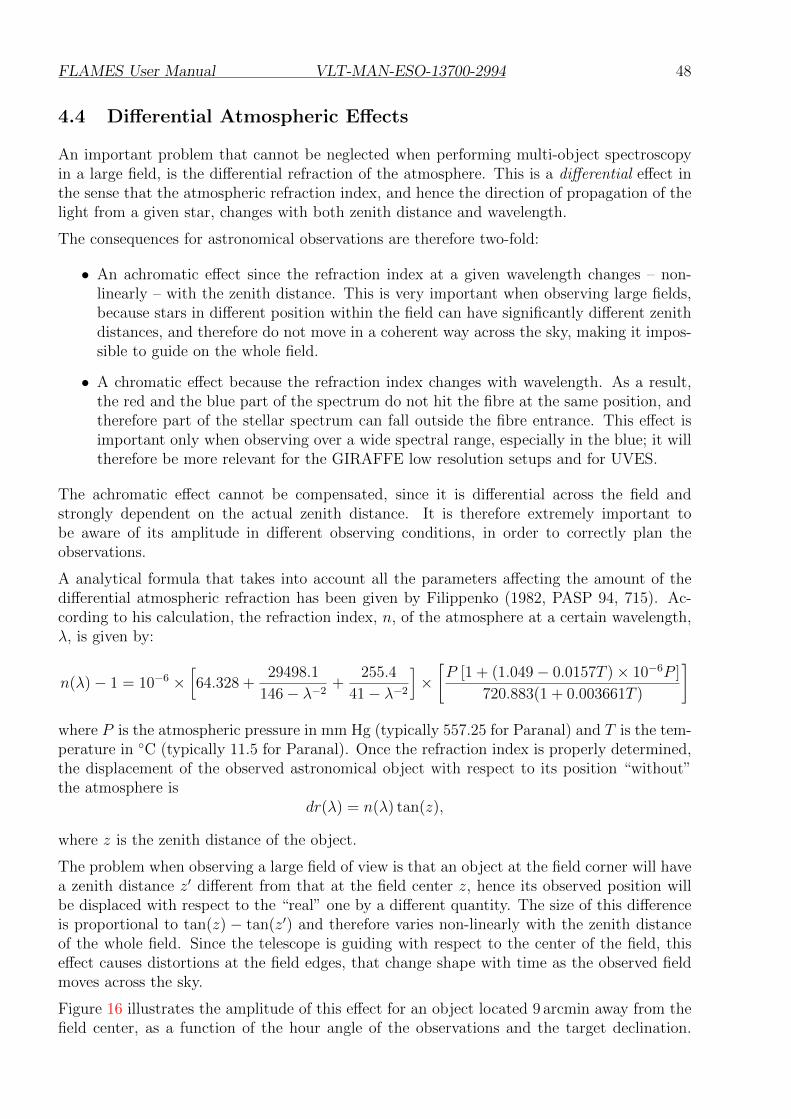
FLAMES User Manual VLT-MAN-ESO-13700-2994 48
4.4 Differential Atmospheric Effects
An important problem that cannot be neglected when performing multi-object spectroscopyin a large field, is the differential refraction of the atmosphere. This is a differential effect inthe sense that the atmospheric refraction index, and hence the direction of propagation of thelight from a given star, changes with both zenith distance and wavelength.
The consequences for astronomical observations are therefore two-fold:
• An achromatic effect since the refraction index at a given wavelength changes – non-linearly – with the zenith distance. This is very important when observing large fields,because stars in different position within the field can have significantly different zenithdistances, and therefore do not move in a coherent way across the sky, making it impos-sible to guide on the whole field.
• A chromatic effect because the refraction index changes with wavelength. As a result,the red and the blue part of the spectrum do not hit the fibre at the same position, andtherefore part of the stellar spectrum can fall outside the fibre entrance. This effect isimportant only when observing over a wide spectral range, especially in the blue; it willtherefore be more relevant for the GIRAFFE low resolution setups and for UVES.
The achromatic effect cannot be compensated, since it is differential across the field andstrongly dependent on the actual zenith distance. It is therefore extremely important tobe aware of its amplitude in different observing conditions, in order to correctly plan theobservations.
A analytical formula that takes into account all the parameters affecting the amount of thedifferential atmospheric refraction has been given by Filippenko (1982, PASP 94, 715). Ac-cording to his calculation, the refraction index, n, of the atmosphere at a certain wavelength,λ, is given by:
n(λ)− 1 = 10−6 ×[64.328 +
29498.1
146− λ−2+
255.4
41− λ−2]×[P [1 + (1.049− 0.0157T )× 10−6P ]
720.883(1 + 0.003661T )
]
where P is the atmospheric pressure in mm Hg (typically 557.25 for Paranal) and T is the tem-perature in ◦C (typically 11.5 for Paranal). Once the refraction index is properly determined,the displacement of the observed astronomical object with respect to its position “without”the atmosphere is
dr(λ) = n(λ) tan(z),
where z is the zenith distance of the object.
The problem when observing a large field of view is that an object at the field corner will havea zenith distance z′ different from that at the field center z, hence its observed position willbe displaced with respect to the “real” one by a different quantity. The size of this differenceis proportional to tan(z) − tan(z′) and therefore varies non-linearly with the zenith distanceof the whole field. Since the telescope is guiding with respect to the center of the field, thiseffect causes distortions at the field edges, that change shape with time as the observed fieldmoves across the sky.
Figure 16 illustrates the amplitude of this effect for an object located 9 arcmin away from thefield center, as a function of the hour angle of the observations and the target declination.
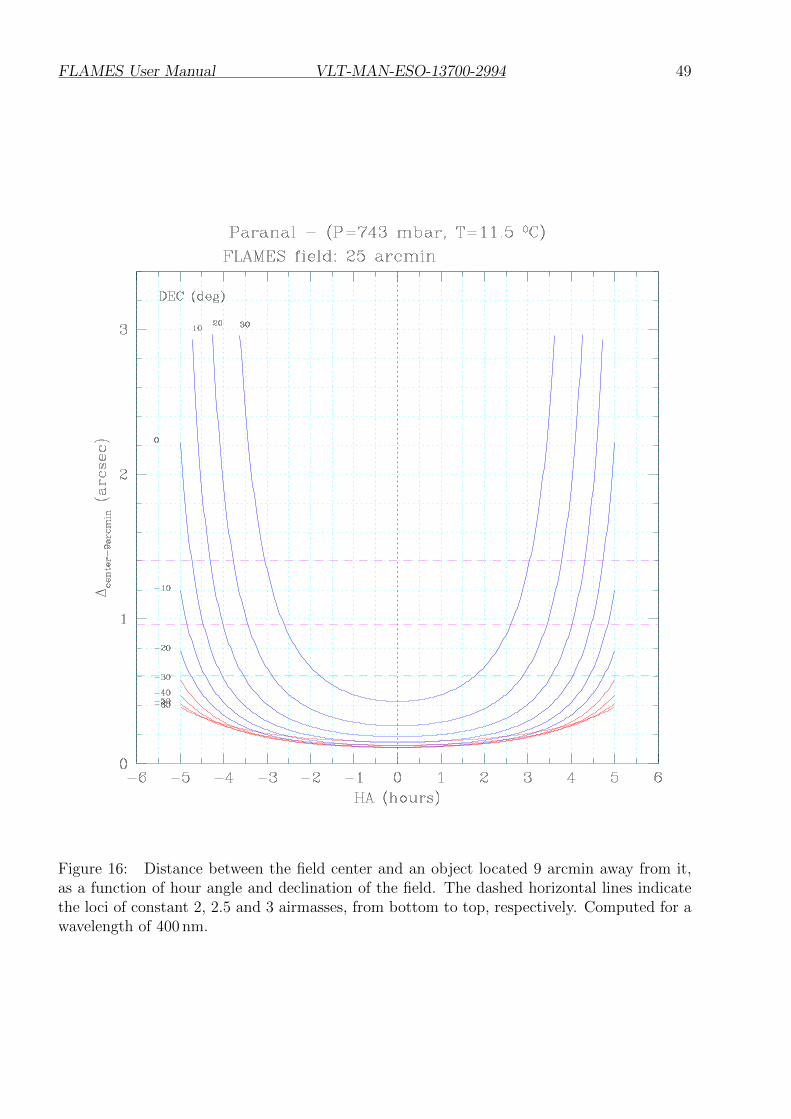
FLAMES User Manual VLT-MAN-ESO-13700-2994 49
Figure 16: Distance between the field center and an object located 9 arcmin away from it,as a function of hour angle and declination of the field. The dashed horizontal lines indicatethe loci of constant 2, 2.5 and 3 airmasses, from bottom to top, respectively. Computed for awavelength of 400 nm.
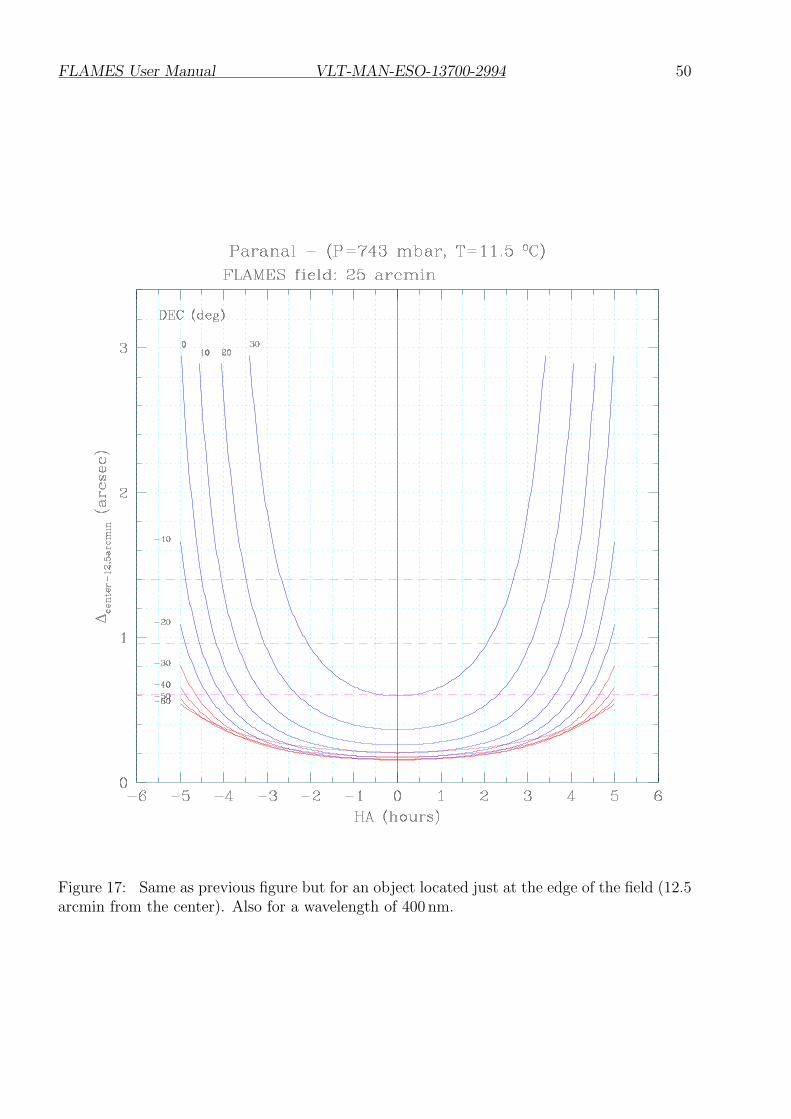
FLAMES User Manual VLT-MAN-ESO-13700-2994 50
Figure 17: Same as previous figure but for an object located just at the edge of the field (12.5arcmin from the center). Also for a wavelength of 400 nm.
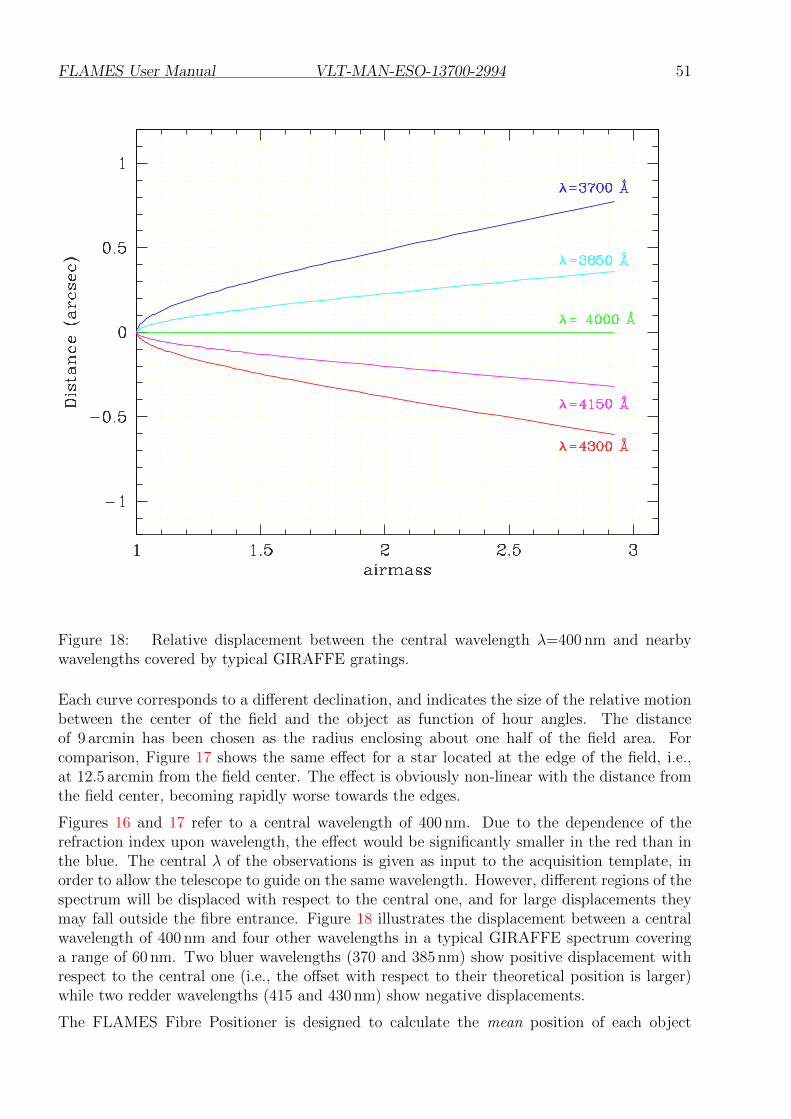
FLAMES User Manual VLT-MAN-ESO-13700-2994 51
Figure 18: Relative displacement between the central wavelength λ=400 nm and nearbywavelengths covered by typical GIRAFFE gratings.
Each curve corresponds to a different declination, and indicates the size of the relative motionbetween the center of the field and the object as function of hour angles. The distanceof 9 arcmin has been chosen as the radius enclosing about one half of the field area. Forcomparison, Figure 17 shows the same effect for a star located at the edge of the field, i.e.,at 12.5 arcmin from the field center. The effect is obviously non-linear with the distance fromthe field center, becoming rapidly worse towards the edges.
Figures 16 and 17 refer to a central wavelength of 400 nm. Due to the dependence of therefraction index upon wavelength, the effect would be significantly smaller in the red than inthe blue. The central λ of the observations is given as input to the acquisition template, inorder to allow the telescope to guide on the same wavelength. However, different regions of thespectrum will be displaced with respect to the central one, and for large displacements theymay fall outside the fibre entrance. Figure 18 illustrates the displacement between a centralwavelength of 400 nm and four other wavelengths in a typical GIRAFFE spectrum coveringa range of 60 nm. Two bluer wavelengths (370 and 385 nm) show positive displacement withrespect to the central one (i.e., the offset with respect to their theoretical position is larger)while two redder wavelengths (415 and 430 nm) show negative displacements.
The FLAMES Fibre Positioner is designed to calculate the mean position of each object
FLAMES User Manual VLT-MAN-ESO-13700-2994 52
during the exposure, knowing the field coordinates and the time of the observation. As shownin Figure 16, extremely rapid variations of airmass causes the position of an object close to thefield edge to change by up to 2 arcsec in one hour exposure. For this reason, it is extremelyimportant to carefully plan the duration of each single exposure, in order to minimize the fluxlosses due to the fact that objects far away from the field center may move away fromtheir fibre in the course of long exposures.
Observers should make sure that their observations are confined to the flat part of the curvesshown in Figure 16. For instance, fields at declinations below −30o can be observed continu-ously for 3-4 hours before and after their culmination. On the contrary, fields at declinationbetween 0 and +30o can be observed for no longer than ∼ 1 hour, and as close as possibleto zero hour angle. Users preparing FLAMES observations are invited to visit in order togenerate the plots shown in Figure 16 and 17 for a specific declination and wavelength.
In order to allow the Fibre Positioner to calculate the mean position of each object duringthe exposure, it is necessary to provide an expected total execution time of the completeobservation defined in the observing block (OB).
4.5 Preparing the Target Input Files
All the information regarding the targets are usually defined using the Observation SupportSoftware (OSS), a number of software tools intended to assist the user in this process.
For FLAMES, the OSS consists of FPOSS, the Fibre Positioner OSS, i.e., a software pack-age that takes an input file, with the target coordinate list, and allows the user to define(automatically and/or interactively) the way the FLAMES fibre have to be allocated to thetargets.
For this reason, FPOSS is basically the core of the preparation of the FLAMES observations.The subsequent step, the definition of the observing sequence and exposure times with P2PP,is then relatively straightforward.
The FPOSS software can be downloaded from the following page:
http://www.eso.org/observing/p2pp/OSS/FPOSS/FPOSS-tool.html
The FPOSS user manual can be retrieved at:
http://www.eso.org/sci/facilities/paranal/instruments/flames/doc/
The target information flow starts with the creation of the target input file. The latter is fed toFPOSS, which then generates a Target Setup File containing the target, guide star, observingmode, fiducial stars fibre, and guide probe assignation. This Target Setup File is associated toan OB via P2PP. The content of the Target Setup File (plus additional information) is addedas a FITS binary table to the final spectral images.
Since ESO has no means to check the correctness of the input file, the astronomer must bevery careful; an error in such a file will propagate through the whole data flow without beingdetected.
The Target Input file is an ASCII file containing the following columns (see Figure 19 for anexample and the FPOSS User Manual for details):
1. Object ID - MANDATORY -

FLAMES User Manual VLT-MAN-ESO-13700-2994 53
LABEL M67 central fieldUTDATE 2001 04 23CENTRE 08 51 22.82 11 50 09.4*EQUINOX J2000.0M67_00005 08 50 15.98 11 33 58.6 P 1 18.16 1 (B−V)= 0.614M67_00006 08 50 26.13 11 33 59.2 P 1 19.80 2 (B−V)= 0.034M67_00007 08 51 01.87 11 34 01.5 P 1 15.27 3 (B−V)= 0.008M67_00012 08 52 04.43 11 34 10.2 P 1 19.51 4 (B−V)= 0.379M67_00017 08 50 52.99 11 34 16.3 P 1 17.28 5 (B−V)=−0.008M67_00020 08 50 22.52 11 34 20.8 P 1 15.53 6 (B−V)= 0.018M67_00022 08 50 33.83 11 34 21.6 P 1 14.66 7 (B−V)=−0.209M67_00023 08 50 42.31 11 34 22.0 P 1 18.69 8 (B−V)= 0.013M67_00025 08 51 31.60 11 34 24.2 P 1 17.48 9 (B−V)=−0.064
Figure 19: Example of an input file for FPOSS.
2. Right ascension in hh mm ss.ss (J2000) - MANDATORY -
3. Declination in ±dd mm ss.ss (J2000) - MANDATORY -
4. Object type: - MANDATORY -G = VLT Guide Star (Magnitudes ideally between R∼ 9 and R∼11).F = FACB (astrometric fiducial star: Field Acquisition Coherent Bundle). Due to thelimited dynamical range of the technical CCD, these stars must not havea difference in R-magnitude exceeding 3 magnitudes. The absolute magnitudemay be from R=8–15.P = Program target (same as M)M = MEDUSA targetI = IFU targetJ = IFU SKY targetA = ARGUS sky targetU = UVES targetS = Sky (generic, can be allocated by any fibre type)
5. Priority: 9 to 1, from 9 highest to lower, respectively - MANDATORY -
6. Target Magnitude
7. Target program ID (integer number)
8. Comments
Fields not labeled as MANDATORY are in fact optional for FPOSS. For possible additionalinformation contained in the Comment field see the FPOSS manual.
4.5.1 Run FPOSS to Prepare the Target Setup Files
The FPOSS manual provides a full explanation of its use, here we give just a brief summaryof the general concepts. The use of the FPOSS follows the following simple steps:
1. Loading of the input file with Guide, Fiducial, and Target stars
2. Selecting the VLT Guide star
3. Selecting the FLAMES observing mode
4. Assignment of the fibres to target objects
5. Assignment of the fibres to sky positions (if needed)
6. Checking configuration over hour angle range
FLAMES User Manual VLT-MAN-ESO-13700-2994 54
7. Saving of the fibre assignment to the Target Setup File.
Once the saving is performed, a Target Setup File is generated, containing all the informationnecessary for the observation, with the exception of the spectrograph setup.
This file is of utmost importance. The files contains a checksum and must not beedited. If the file is edited, the following process (P2PP) will not proceed andwill not be able to create OBs. Only Target Setup Files created by the FPOSSare accepted by the system.
4.6 Broken and low-transmission fibres
Although FLAMES fibres are mechanically very stable, the gripper might occasionally fail tomove them, leading to the faulty fibre to be disabled. The large majority of the failures aredue to dust on the plate and/or on the button itself and are readily solved (within 1-2 days)by cleaning the plate and button. However, it might happen that a button remains disabledfor a longer time due to a more severe problem.
If the configuration file provided by the user makes use of a broken fibre, the problematic fibre issimply ignored by the system which places all available fibers leaving the broken fibres parked.Thus, if during phase II preparation a given target has been allocated to the problematic fibre,no data will be produced for this target. There is an additional detail. Since FLAMES hastwo observing plates available, the fact that a given fibre is disabled in one plate does notmean that the fibre with the same fiber number is also disabled in the other plate.
For instance, if object XYZ-1 has been allocated to fibre Medusa 116 and this fibre is brokenin plate 1 but not in plate 2, then a spectrum of XYZ-1 will be produced when the user’s OBis observed with plate 2 whereas with plate 1 no data will be collected.
Since the amount of broken fibres is small (1-2 per plate) most of the objects will have dataproduced by both plates. However, if the user has a have-to-observe target, he or she mustpay attention to the list of broken fibres and not allocate this particular (and precious) targetto any of the fibres in the list of broken fibers.
Note that since FPOSS doesn’t know with which plate your configuration will be observed, itwill allow you to allocate broken fibres. It is up to the user to manually correct the configu-ration (deleting allocations and re-allocating the target to another fibre by hand as describedin the FPOSS manual) making sure that highly important targets are not allocated to any ofthe broken fibres2.
Fig. 20 shows IFU sky spectra taken on plate 1 and and on plate 2. Differences in the relativeresponses of the IFUs are clearly present within each plate although the absolute value in thiscase just depended on the sky brightness.
2The updated list of broken fibres is available at:http://www.eso.org/sci/facilities/paranal/instruments/flames/visitor.html#Fibres
andhttp://www.eso.org/observing/p2pp/FLAMES/FLAMES-P2PP.html#Fibres
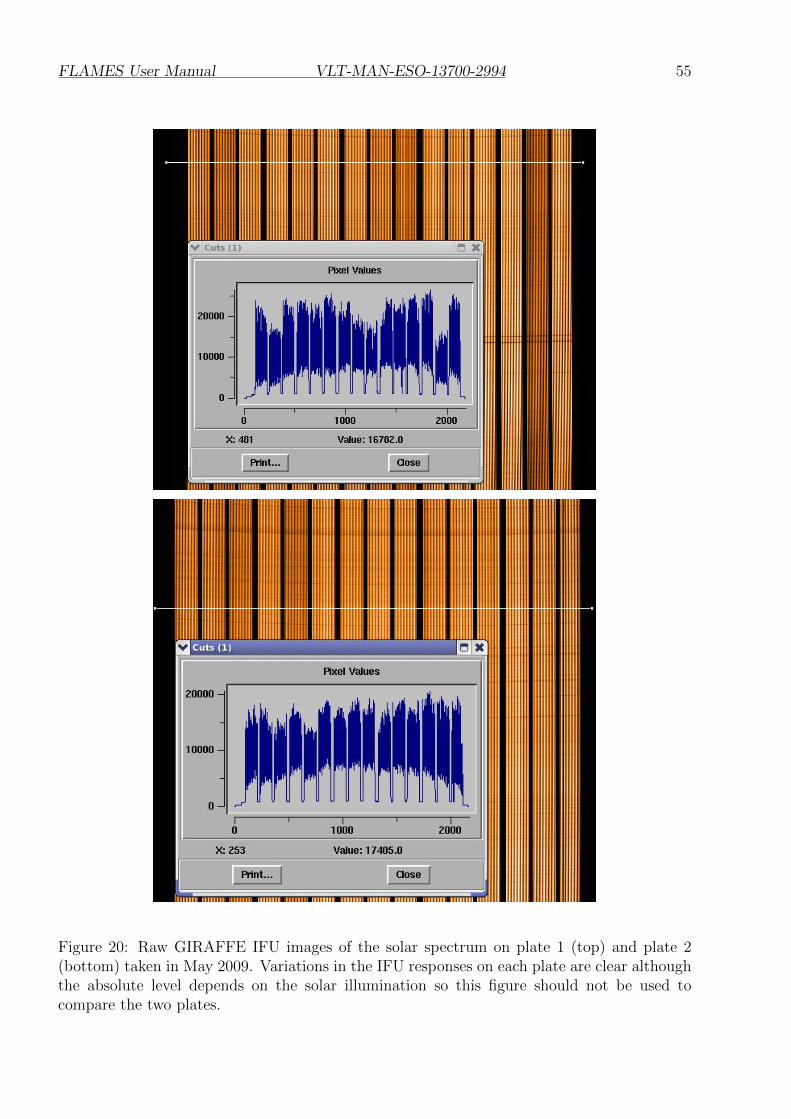
FLAMES User Manual VLT-MAN-ESO-13700-2994 55
Figure 20: Raw GIRAFFE IFU images of the solar spectrum on plate 1 (top) and plate 2(bottom) taken in May 2009. Variations in the IFU responses on each plate are clear althoughthe absolute level depends on the solar illumination so this figure should not be used tocompare the two plates.

FLAMES User Manual VLT-MAN-ESO-13700-2994 56
4.7 Introducing the Observation Blocks
An Observation Block (OB) is a logical unit specifying the telescope, instrument, anddetector parameters and the actions needed to obtain a “single” observation. It is the smallest“schedulable” entity, which means that the execution of an OB is normally not interrupted assoon as the target has been acquired. An OB is executed only once; when identical observationsequences are required (e.g. repeated observations using the same instrument setting, butdifferent targets), a series of OBs must be constructed. The detailed definition of FLAMESObservation Blocks and Templates are given in the FLAMES Template Reference Guide [1].
Usually, one OB consists of two separate entities: the acquisition template and the observationtemplate(s). It is important to recall that, although not mandatory, it is much more convenientto repeat the fibre positioning when the same objects are observed through different setups,and/or very long integrations are required, in order to minimize the effects of the atmosphere(see § 4.4).
P2PP will read the information regarding the targets from the Target Setup File. Note thatonly the files produced by FPOSS are accepted by P2PP.
4.7.1 GIRAFFE and UVES Exposure Time Calculators
The GIRAFFE and UVES – FIBRE mode Exposure Time and Spectral Format Calcu-lator (ETC) is accessible through the ESO WEB page at:
http://www.eso.org/observing/etc/. The ETC models the instrument and detector in
their different configurations. It can be used to compute the detailed spectral format (wave-length and order number as function of position on the detector) and the expected S/N forthe specified target, atmospheric conditions as a function of exposure time. The ETC can alsobe used to access the efficiency curves of the various optical components as measured in thelaboratory in advance of the installation.
While using the FLAMES ETC, the user has to keep in mind two fundamental points:
1. Some of the transmission factors are mean values: for instance, Table 4 shows how thecorrector transmission varies with the distance from the field center. The ETC assumesa distance of 8 arcminutes. In the same way, fibre-to-fibre transmission variations arepresent at the 5− 10% level. The ETC values are also mean values.
2. With an aperture of only 1.2 and 1.0 arcseconds on the sky (MEDUSA and UVES,respectively), the photon-collecting efficiency will strongly depend on the accuracy of theastrometry. The ETC is set to a default value of 0.3 arcseconds for the average object-fibre displacement. An option allows the user to specify the object-fibre displacementto evaluate the effects of bad astrometry on the photon-collecting efficiency.
4.7.2 Choice of the Sample Target
For the input flux distribution to the ETC, four options can be selected: (1) A blackbodyenergy distribution at a given temperature; (2) a power-law distribution; (3) a template spec-trum: stellar spectra from spectral type O5 to M2, nebular spectra, galaxy spectra, or aquasar spectrum; (4) a single line at a wavelength, width, and flux level to be specified. In all
FLAMES User Manual VLT-MAN-ESO-13700-2994 57
cases but point (4) the object magnitude (in a given broad-band filter) has to be entered. Forextended sources, the magnitudes are given per square arcsec. In addition to the target, it isnecessary to enter the sky conditions (phase of the moon and FWHM of seeing disc).
4.7.3 Choice of Instrument Configuration and Spectral Format
Based on the properties of the optical components of the spectrograph, the format of theechelle spectrum covered by the detector depends solely on the selected central wavelength.The instrument templates with standard settings can be selected from the pull-down menu.The corresponding spectral formats are given in Tables 11 & 12 for Giraffe and 13 for UVES.The final entry is the exposure time.
4.7.4 Exposure Time and predicted Counts and S/N Ratios
The output of the ETC is a table listing the pixel size in wavelength, the computed efficiency,the total expected electrons for the object and the sky, the maximum pixel intensity (tomonitor saturation), the predicted S/N ratio per extracted pixel in dispersion direction, thecentral wavelength and the wavelength bin size.
4.8 P2PP tool
The Phase 2 PreParation (P2PP) tool allows the observer to construct OBs. An online tutorialfor the creation of FLAMES OBs is available at:
http://www.eso.org/sci/observing/phase2/SMGuidelines/Documentation/P2PPTutorialFLAMES.
html. If the observations have been prepared carefully using FPOSS to define the FLAMES
modes and targets-to-fibre assignments (as saved in the Target Setup File) and the ETC todefine the required instrument setups and exposure times, the use of the P2PP tool almosttrivial: one acquisition template and one (or several) observing templates have to be combinedin one OB.
4.8.1 Acquisition Templates
There are 4 acquisition templates for FLAMES. The first three correspond to the three in-strument modes (UVES, COMBINED and GIRAFFE). The fourth template is available invisitor mode only and is the fast acquisition in the ARGUS mode of GIRAFFE only.
In the first three templates the observer has to fill in the same (2) parameters only:
a) Name of the Target Setup File created by FPOSS to be associated to the template (viaa file selector box).
b) Observing wavelength (from a pull-down menu with all FLAMES standard setups). Incase of combined observations, both the GIRAFFE and UVES observing wavelengthshave to be indicated.
Finally, the fourth template is for the fast acquisition mode of ARGUS, where no FPOSSsetup file is needed. See the template reference manual for details.
FLAMES User Manual VLT-MAN-ESO-13700-2994 58
4.8.2 Observing Templates
There are 5 observing templates, one for UVES, one for GIRAFFE, one for COMBINED andtwo for ARGUS. In the first three cases only a few parameters are required to be given:
a) Setup (grating, central wavelength, and readout mode from pull-down menu). The choicefor the readout mode will be added for P86.
b) Observing time for each exposure. Note that UVES and GIRAFFE may have differentexposure times!
c) Number of exposures
d) Switch for the simultaneous calibration (GIRAFFE only). Set to OFF in case negativeeffects on your observations are expected.
Of course, in case of COMBINED observations, this information needs to be given for UVESand GIRAFFE separately. For the final two (ARGUS) cases, the OB must include the infor-mation above, plus three additional parameters:
e) Number of offsets.
f) List of offsets in Right Ascension.
g) List of offsets in Declination.
4.8.3 Computing Time Overheads for your Programme
With the Exposure Time Calculator, the user obtains an estimate of the observing timeneeded to reach the desired S/N depending on the object magnitude and observing configura-tion. To compute the total observing time required for the programme, one needs to add thetime for all actions required to carry on the scientific observation. When applying for serviceor visitor mode observations, the computation of the overheads is required and has tobe included in the application.
The following estimates of the overheads must be used and are also the basis for the automaticcalculation of execution times within the P2PP tool, used for the final definition of the OBsin service and visitor mode:
• Target Acquisition: ∼ 13 minutes (except ARGUS fast Visitor Mode onlywhich is 8 minutes)
The target acquisition includes the configuration of UVES fibres, the homing of thetelescope rotator to zero degrees, the swapping of the plates, and the acquisition of thefield: ∼7 minutes. The telescope preset, acquisition of the guide star, and start of theactive optics account for an additional ∼6 minutes.
• GIRAFFE and UVES Instrument setup: 1 minute
A new instrument setup takes 1 minutes for GIRAFFE and UVES.
FLAMES User Manual VLT-MAN-ESO-13700-2994 59
• GIRAFFE and UVES CCD readout: 1 minute
The readout time for the CCD mosaic in the UVES red arm and for GIRAFFE CCD is1 minute each. In combined mode all CCDs can be read in parallel.
• Plate Configuration: 0 - 20 minutes
Plate configurations take 20 minutes at most (MEDUSA mode). This does not translateinto overheads if the running exposure on the other plate is at least 20 minutes long.Plate configuration overheads are to be taken into account only when the exposure timeon one plate is shorter than 20 minutes.
• Nighttime Screenflat Calibration: ∼7 minutes
If attached screen FF calibrations are requested at nighttime, they will need (on average)7 extra minutes. Note that the attached FF exposure time strongly depends on thewavelength. It is almost impossible to get sufficient flux with a decent exposuretime for the bluest setups. The in-use exposure times for attached screen FF can befound in Table 14 (=t(FF,screen)). The exact attached FF exposure time has to be takeninto account when computing overheads. Note that in an attached (NasA) flatfield in thebluest three HR settings there are typically only a few hundred ADU detected in a 20-minute exposure time in the bluest part of the CCD. Hence accurate flatfielding for theHR1, HR2, HR3 and LR1 settings for ARGUS ONLY is not presently possible withinservice mode. These four settings are therefore only offered in VISITOR MODE INARGUS to allow for more time to take the attached flatfields in the daytime. Eventhen the number of derived counts obtained at the far blue end may only be around athousand in a few hours. For Medusa and IFU the robot flats may be used so all setupsare accepted in Service or Visitor mode.
• Daytime Calibrations: 0 minutes
Bias frames, flatfield and Th-Ar calibration lamp exposures are taken only during theday with the same instrument and detector setup as the science exposures. Standardcalibrations are carried out automatically by the Observatory. No overheads need to beaccounted for.
FLAMES User Manual VLT-MAN-ESO-13700-2994 60
5 The Calibration of FLAMES Data
5.1 General Concept
Given the possibility of using two spectrographs in many setups, the possibility of obtainingsuitable calibrations has been a constant concern for FLAMES. The operation concept relieson the fact that all necessary calibrations can be taken during the day, and they have anaccuracy level to guarantee that a sky subtraction to better than 2% is possible. To achievethis goal a high photometric fibre stability is required, and an overall high instrument setuprepeatability and stability. All calibrations are carried out using the calibration unit of theFibre Positioner (see next section and Section 2.3).
As described in the other Sections, in P86 a fast readout mode will be offered in visitor modeonly. This choice is explained by the fact that no calibration database currently exists for thisspecial readout mode. And it is not possible to dela in service mode with two different readoutmodes at the same time due to the time used by the calibrations to be taken. Moreover, itis possible that the pipeline does not fully support the reduction of data taken with this fastreadout mode. The quality control of the data obtained with this fast readout mode will befully operational.
With the exception of the attached Nasmyth FF calibrations, the observer is not supposed toprepare any calibration OBs: calibrations will be provided by the Observatory, following theFLAMES Calibration Plan [3].
5.2 Positioner Calibration Unit
The positioner calibration unit has been conceived to provide the user with the followingperformance:
• Fibre-to-fibre relative flux illumination flat field: relative illumination better than 0.3%.This ensures that accurate fibre-to-fibre relative transmission can be derived using theflat spectra acquired with the positioner.
• Integration time per button: less than ten seconds. For a flat field level of at least8000 e−/pixel, and for a Th-Ar level of at least twenty lines per GIRAFFE setup. Thisis valid for the majority of the setups. In the BLUE setups calibrations require longerintegration time and the targeted flux cannot always be obtained.
This performance has been obtained using a mixture of hardware and operations. The fibres tobe calibrated are first positioned following a spiral pattern on the plate. In order to guaranteethe same flat field relative illumination, it is necessary to minimize lamp variability. This isachieved by sweeping the gripper above the fibres several times; the gripper movement is soaccurate to guarantee the same illumination time/fibre to a level of a fraction of percent.
These flats can be therefore used for both, flat fielding and fibre to fibre transmission mea-surement purposes.
In the case of Th-Ar exposures, the gripper moves from one fibre to the next and dwells onthe fibre for a given amount of time, then goes to the next.

FLAMES User Manual VLT-MAN-ESO-13700-2994 61
For ARGUS calibrations (both flats & arcs), the robot first illuminates the sky fibers bysweeping in front of them with its lamp on. Then, it illuminates the ARGUS array (whichis located at the center of plate 2, see Fig. 9) by scanning over it with the lamp on. As aconsequence, the total times exposure time is ∼ twice the IFU one (∼ half for sky fibres andhalf for the array).
5.3 Nasmyth Screen
To perform a very accurate sky subtraction, it may be useful to acquire Nasmyth screenflat fields (or so-called attached flats). These flats are obtained by illuminating the closedNasmyth shutter with halogen lamps after the observations. The fibres are not moved at allfrom their observing positions during this type of calibration. They are maintained with thesame geometry and torsion property. This ensures the minimum difference between observingand calibration conditions, but on the other hand, especially for wavelengths bluewards of 420nm, it is very (night-)time consuming. For this reason starting in P84 the observatory onlyoffers ARGUS HR1, HR2, HR3 and LR1 observations in visitor mode where more time willbe available during the day on a best-effort basis to obtain more screen flatfields. Medusaand IFU systems remain available for all settings in service or visitor mode as they can useflatfields taken using the robot.
5.4 Simultaneous Calibrations
GIRAFFE is equipped with five simultaneous calibration fibres per slit. Unless explicitlyavoided by the user in the observing template, every spectrum contains five simultaneous arcspectra, evenly located along the CCD 2k width. These spectra can be used to track thewavelength solution for all the fibres.
Tests on solar spectra during GIRAFFE integration in Garching reached high accuracy overa few days, and tests on stars during commissioning showed that an accuracy of 70 m s−1 canbe obtained on a time basis of a few hours for slowly rotating cool stars. This was reachedin 15 minute exposures for objects brighter than 14.3 magnitude in the HR09 setup (cf. TheESO Messenger, 110, 1). More accurate and detailed long term RV studies are presently beingcarried out on old open clusters.
For FLAMES-UVES the radial velocity instrumental error is about 30–50 m s−1 when usingthe 7+1 mode which includes a fibre dedicated to simultaneous calibration (580-nm only,Astronomy & Astrophysics, 421, L13).
5.5 Longslit Calibrations
5.5.1 GIRAFFE Longslit Unit
One of the slits of GIRAFFE is equipped with a longslit unit, which is used for engineeringpurposes; calibrations obtained with this unit are of no interest for the observer.
FLAMES User Manual VLT-MAN-ESO-13700-2994 62
5.6 The UVES Calibration Unit
The UVES calibration unit is a mechanical structure mounted on the Nasmyth rotator flange,which in the case of UVES is kept fixed during observations. It hosts continuum lamps which,in combination with various filters, are used for flatfield calibration and one Th-Ar lamp forwavelength calibration. The lamps are mounted on an integrating sphere and relay opticssimulate the F/15 telescope beam. The light from the lamps is fed into the instrument beamby 45◦ mirrors mounted on a slide.
The flatfield spectra provide a good correction for the blaze function of the echelle. Theycorrect the pixel-to-pixel variation in CCD sensitivity as a function of the wavelength ofthe light. In the red part of the spectra (λ ≥ 650 nm) narrow fringes with peak-to-valleyamplitudes up to 30% are present on the EEV CCD of the mosaic. On the MIT-LL CCD, thefringes are less sharp and of smaller amplitude.
In the fibre mode of UVES, long slit spectra are acquired with a slit longer than the extentof the fibre slit to ensure that even in case of small shifts between the observation and thecalibrations, the detector area covered by the fibres is covered by the long slit spectra. Pixel-to-pixel variations can be reduced in this way.
5.7 Fibre to Fibre Transmission and Sky Subtraction issues
When dealing with fibre spectra proper sky subtraction is a concern. For some science casesthis may be the limiting factor on the quality of the reduced data. In the present scheme(i.e., without nod and shuffle technique) it is critical to characterize the fibre to fibre relativetransmission with excellent accuracy. This task is not always trivial, because fibres maydevelop photometric instabilities which depend on their history and on the way they arerouted. In FLAMES we have ensured that in normal operating conditions, the fibre system isconstant to better than 1% stability. At this point, the most critical issue is to find a way touniformly illuminate the fibres. This task is done by the positioner.
Other steps to obtain a correct sky subtraction involve a) the knowledge of the transmissionof the corrector, which is given in Table 4 as a function of wavelength and position on the fieldof view and b) a good spatial distribution of the fibres, which can account for sky variationsin the field of view. It is also important that enough fibres are allocated to the recording ofthe sky.
Fig. 21 shows an example of a GIRAFFE image of exposure of 2750-s taken with Carreras ata wavelength of L881.7. Aside from the many cosmic rays present, the attention of the readeris drawn to the many sky emission-lines present at this and other red settings. Fig 22 showsextracted spectra which emphasise the strength of the sky lines.
Before submitting a proposal PIs should consider downloading previous GIRAFFE spectrafrom the ESO archive to see how badly their spectra will be contaminated by sky lines. Wenote that the current version of the GIRAFFE pipeline does not perform sky subtraction.PIs should consider referring to the following articles (amongst others) on how to remove skyfeatures in FLAMES data:
• Battaglia et al., (2008), MNRAS, 383, 183. Contains a detailed description of how skylines can removed from FLAMES-GIRAFFE spectra.
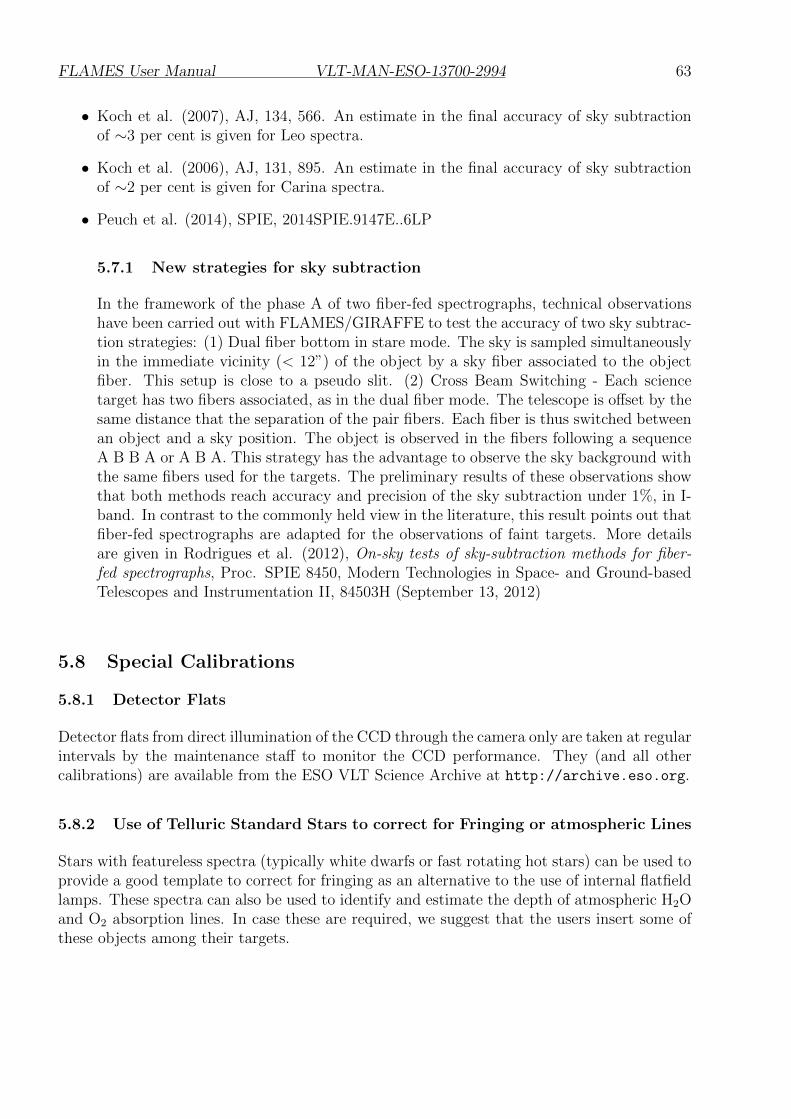
FLAMES User Manual VLT-MAN-ESO-13700-2994 63
• Koch et al. (2007), AJ, 134, 566. An estimate in the final accuracy of sky subtractionof ∼3 per cent is given for Leo spectra.
• Koch et al. (2006), AJ, 131, 895. An estimate in the final accuracy of sky subtractionof ∼2 per cent is given for Carina spectra.
• Peuch et al. (2014), SPIE, 2014SPIE.9147E..6LP
5.7.1 New strategies for sky subtraction
In the framework of the phase A of two fiber-fed spectrographs, technical observationshave been carried out with FLAMES/GIRAFFE to test the accuracy of two sky subtrac-tion strategies: (1) Dual fiber bottom in stare mode. The sky is sampled simultaneouslyin the immediate vicinity (< 12”) of the object by a sky fiber associated to the objectfiber. This setup is close to a pseudo slit. (2) Cross Beam Switching - Each sciencetarget has two fibers associated, as in the dual fiber mode. The telescope is offset by thesame distance that the separation of the pair fibers. Each fiber is thus switched betweenan object and a sky position. The object is observed in the fibers following a sequenceA B B A or A B A. This strategy has the advantage to observe the sky background withthe same fibers used for the targets. The preliminary results of these observations showthat both methods reach accuracy and precision of the sky subtraction under 1%, in I-band. In contrast to the commonly held view in the literature, this result points out thatfiber-fed spectrographs are adapted for the observations of faint targets. More detailsare given in Rodrigues et al. (2012), On-sky tests of sky-subtraction methods for fiber-fed spectrographs, Proc. SPIE 8450, Modern Technologies in Space- and Ground-basedTelescopes and Instrumentation II, 84503H (September 13, 2012)
5.8 Special Calibrations
5.8.1 Detector Flats
Detector flats from direct illumination of the CCD through the camera only are taken at regularintervals by the maintenance staff to monitor the CCD performance. They (and all othercalibrations) are available from the ESO VLT Science Archive at http://archive.eso.org.
5.8.2 Use of Telluric Standard Stars to correct for Fringing or atmospheric Lines
Stars with featureless spectra (typically white dwarfs or fast rotating hot stars) can be used toprovide a good template to correct for fringing as an alternative to the use of internal flatfieldlamps. These spectra can also be used to identify and estimate the depth of atmospheric H2Oand O2 absorption lines. In case these are required, we suggest that the users insert some ofthese objects among their targets.
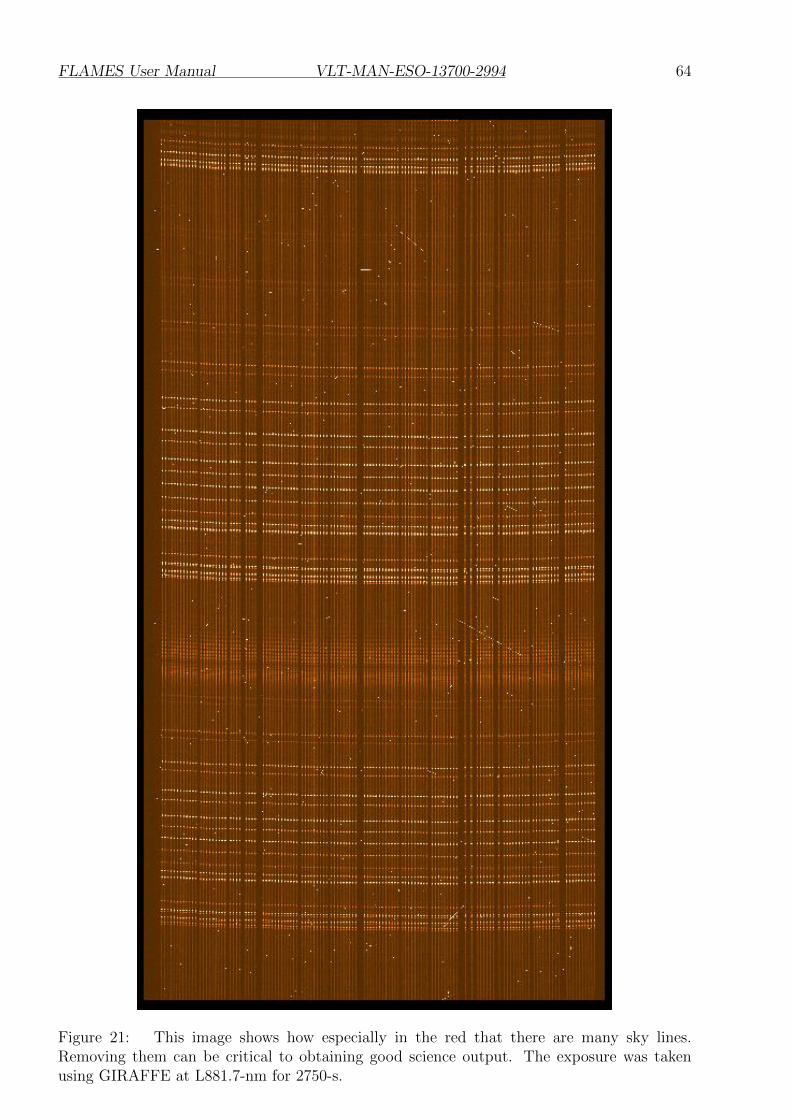
FLAMES User Manual VLT-MAN-ESO-13700-2994 64
Figure 21: This image shows how especially in the red that there are many sky lines.Removing them can be critical to obtaining good science output. The exposure was takenusing GIRAFFE at L881.7-nm for 2750-s.
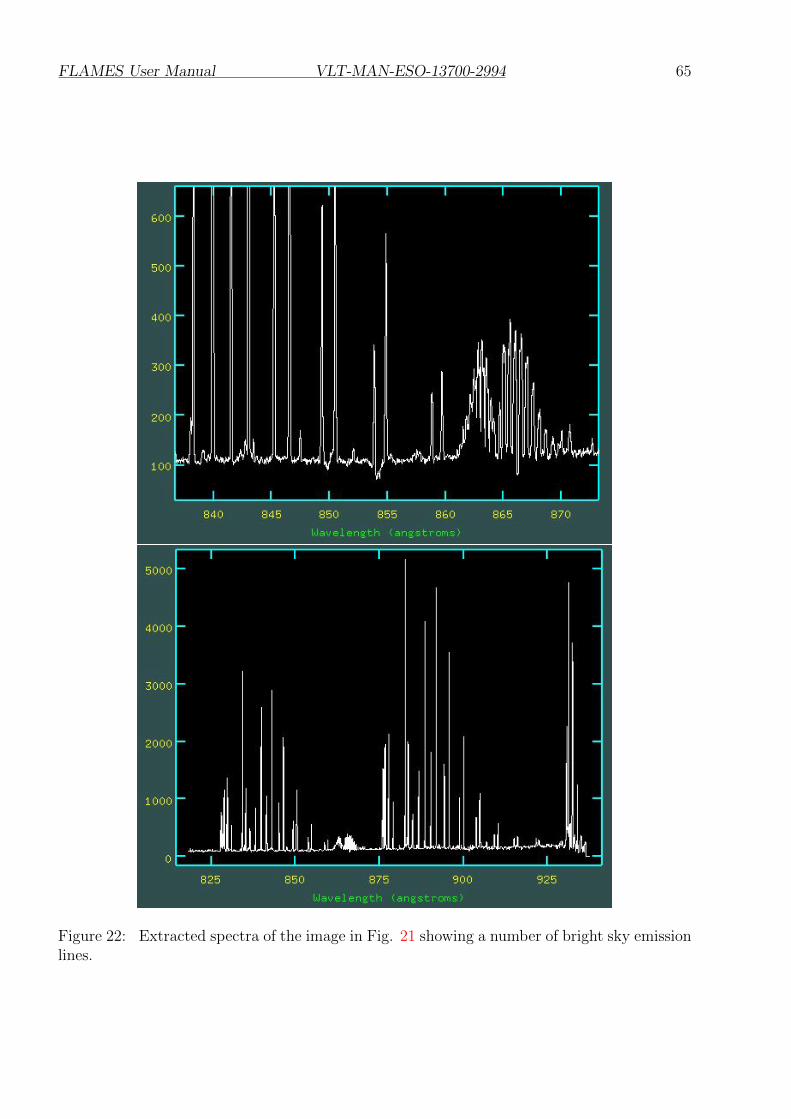
FLAMES User Manual VLT-MAN-ESO-13700-2994 65
Figure 22: Extracted spectra of the image in Fig. 21 showing a number of bright sky emissionlines.

FLAMES User Manual VLT-MAN-ESO-13700-2994 66
5.9 FLAMES Science Calibration Plan
Table 5.9 provides a summary of the FLAMES Science Calibration Plan as defined in theFLAMES Calibration Plan [3]. We note that specphot standards are generally selected by thenighttime astronomer from the list available at :http://www.eso.org/sci/observing/tools/standards/spectra/
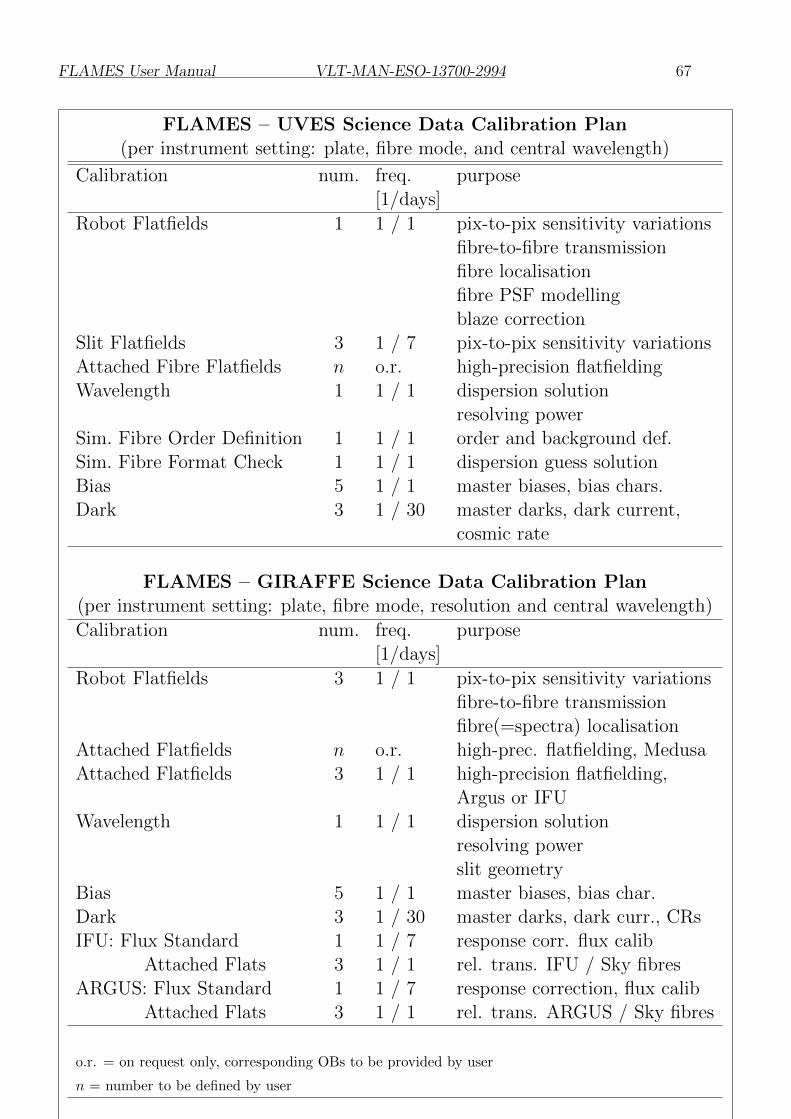
FLAMES User Manual VLT-MAN-ESO-13700-2994 67
FLAMES – UVES Science Data Calibration Plan(per instrument setting: plate, fibre mode, and central wavelength)
Calibration num. freq. purpose[1/days]
Robot Flatfields 1 1 / 1 pix-to-pix sensitivity variationsfibre-to-fibre transmissionfibre localisationfibre PSF modellingblaze correction
Slit Flatfields 3 1 / 7 pix-to-pix sensitivity variationsAttached Fibre Flatfields n o.r. high-precision flatfieldingWavelength 1 1 / 1 dispersion solution
resolving powerSim. Fibre Order Definition 1 1 / 1 order and background def.Sim. Fibre Format Check 1 1 / 1 dispersion guess solutionBias 5 1 / 1 master biases, bias chars.Dark 3 1 / 30 master darks, dark current,
cosmic rate
FLAMES – GIRAFFE Science Data Calibration Plan(per instrument setting: plate, fibre mode, resolution and central wavelength)
Calibration num. freq. purpose[1/days]
Robot Flatfields 3 1 / 1 pix-to-pix sensitivity variationsfibre-to-fibre transmissionfibre(=spectra) localisation
Attached Flatfields n o.r. high-prec. flatfielding, MedusaAttached Flatfields 3 1 / 1 high-precision flatfielding,
Argus or IFUWavelength 1 1 / 1 dispersion solution
resolving powerslit geometry
Bias 5 1 / 1 master biases, bias char.Dark 3 1 / 30 master darks, dark curr., CRsIFU: Flux Standard 1 1 / 7 response corr. flux calib
Attached Flats 3 1 / 1 rel. trans. IFU / Sky fibresARGUS: Flux Standard 1 1 / 7 response correction, flux calib
Attached Flats 3 1 / 1 rel. trans. ARGUS / Sky fibres
o.r. = on request only, corresponding OBs to be provided by user
n = number to be defined by user
FLAMES User Manual VLT-MAN-ESO-13700-2994 68
6 FLAMES Observing Operations
This chapter explains in some detail the operation of FLAMES. A sound understanding ofthe rather peculiar FLAMES operations procedure is crucial for good planning of visitor ANDservice mode observations. We summarize again a number of particulars which need to betaken into consideration for FLAMES operations:
1. The relative distance between objects is going to change during an observation, thereforein general long observations should be avoided.
2. Observations of the same objects at different wavelengths or multiple observations of thesame objects should be executed only after re-positioning of the fibres.
3. The Fibre Positioner configures while observing; this implies that two OBs are running atthe same time. Also, the positioner needs to know the mean time of the next observationwhile the current one is still running. In practice, it gives some rigidity to the wholeoperation scheme.
4. When used in combined mode, FLAMES produces UVES and GIRAFFE frames.
5. Each FLAMES sub-system (Positioner, GIRAFFE, UVES) has its own Observing Soft-ware (OS). The complete system is coordinated by the FLAMES Super-OS which is theonly OS allowed to talk to the Telescope Control Software (TCS). The frames producedby the spectrographs are complemented with information coming from the TCS.
6.1 During the Night
Observations with FLAMES are carried out at the Console of UT2, located in the VLTControl Building just below the Paranal summit. From there, all telescopes and instrumentsare remotely controlled. The telescope and instrument operator carries out the observationsand checks that they perform correctly; the main responsibility of the visiting astronomers isthe selection of the OBs, based on the sky conditions and on the results of the first observations.
The GIRAFFE and UVES – FIBRE mode raw data are saved in the FLAMES workstation.After the data has been transferred to the Archive workstation, copies of the files are receivedon the astronomer’s offline workstation and on the pipeline workstation where the automaticdata reduction is running. The pipeline products are eventually forwarded to the astronomer’soffline workstation (Note that the UVES – FIBRE pipeline has been available from April 2003,the GIRAFFE pipeline from April 2004).
Given the necessity to run target assignation at the Fibre Positioner together with targetobservation at the telescope, two BOBs (Broker for Observation Blocks) are running simulta-neously. Although the two BOBs are perfectly symmetric and exchangeable, for the sake ofsimplicity we will call BOB-obs the one observing and BOB-config the one configuring.
The Target Setup File generated by the FPOSS (associating the fibres to the object coordi-nates) is linked to the OB through P2PP.
The OB is read by BOB-config and the acquisition template is executed. The positionerSW knows the actual time, the expected execution time of the OB (as provided by the user)and computes the mid-time of the new observation. The coordinates are transformed into
FLAMES User Manual VLT-MAN-ESO-13700-2994 69
plate R, θ positions, the back-illumination is switched on (about 30 milliseconds/fibre) andthe buttons are placed. Once the configuration of the plate is completed, it receives an uniqueidentifier (say plate-1) and a validity time-stamp is generated.
When the OB is re-run (on BOB-obs), it looks for the status of plate-1. Finding it at theconfiguration position, i.e., at the robot, and knowing that no other observation is running onthe telescope side, it sets the telescope rotator back to the home (=zero) position, disengagesthe current plate, rotates the tumbler, and engages the new plate.
At this point the center field coordinates are sent to the telescope and to the rotator. TheVLT field acquisition can start: search for guide star, closing of the active optics loop, andfield stabilization. The four FACBs check that the fiducial or reference stars are indeed inthe right position or of needed telescope offsets are computed and applied. The acquisitiontemplate is now finished and the observing template can start.
While running the observing template on BOB-obs, the next OB can be selected and run onBOB-config which, after some sanity checks, starts the configuration of the next field.
Clearly this cycle is very critical, and once started, there is not much room for maneuver.Usually, if some observations require repetition, the plate will need to be reconfigured, thefield be re-acquired and re-executed after another OB has been executed.
6.2 Pointing and Guiding
FLAMES is not equipped with any auxiliary slit viewer or imaging system in addition to the4 FACBs, therefore the whole system relies on the (relative) accuracy between the targets, theVLT guide star and the 4 FACBs.
After the telescope has been pointed, the images from the 4 FACBs are recorded on the techni-cal CCD and the centroids in each of the quadrants are computed and offsets calculated. Thefiducial stars in the FACBs are therefore the ONLY sources linking the geometryof the plate to the sky.
The target, VLT guide star and fiducial (FACBs) coordinates must be in thesame reference system (i.e., their coordinates must be computed from the sameastrometric solution) with a relative accuracy better than 0.3 arcseconds to avoidwasting telescope time.
To help the users in their observations preparation, ESO has performed a pre-FLAMES stellarsurvey using the Wide Field Imager (WFI) at the ESO-MPI 2.2-m telescope:
http://www.eso.org/science/eis
In order to guarantee a correct centering and offset calculation, FACB reference stars shouldnot have close visual companions (within 3 arcseconds). Telescope Guide Stars shouldhave magnitude R between 9 and 11. FACB stars should be brighter than R∼ 15and be of comparable magnitude: within 3 magnitudes. This latter requirementwas imposed by the small dynamics of the FLAMES technical CCD (0–4095).Recently, a new technical CCD has been installed. The dynamics of this new chipis enhanced: 0–65 535 but it is still recommended to use FACB stars with similarmagnitudes.
Recent images will help to minimize errors due to neglected proper motion in the targets /
FLAMES User Manual VLT-MAN-ESO-13700-2994 70
guide / fiducial stars.
The tracking of the telescope is corrected for errors of low frequency (< 1 Hz) by an autoguidingfacility. The autoguider makes use of a guide star observed by the guide probe in the adaptor-rotator that is moved into the telescope beam. The guide star is selected by the observer inthe input file to the FPOSS and needs to be in the same coordinate system as the targets andof the fiducial (FACBs) stars.
Once the telescope acquisition and active optics correction is executed, some small shifts maystill be present between the telescope and the target coordinates. When the four FACBs startworking, the offsets of the 4 stars are computed and the operator may apply them to centerfiducial stars on the FACBs. After the centering is considering satisfactory, the observingtemplate can start and the science integration proceeds.
6.3 ARGUS fast observations
In Visitor mode only, it is possible to move from field to field and take observations of differentscience targets at different wavelengths without reconfiguring plate 2, at the centre of whichARGUS is located. These observations rely on the VLT guide star, and hence do not use theFACBs. These observations are performed using the FLAMES giraf acq argfast acquisitontemplate. The 15 ARGUS sky single fibres are placed in a circle with radius defined by theuser. Use of the template saves time as swapping the plates back and forth is not necessary.However, swapping is avoided only if (a) The ARGUS sky fibres are at the same radius and/ornot used (b) The plate scale is the same for the two observations.
Note that the FLAMES giraf acq argfast template can be used with any of the following ob-servation templates:
• FLAMES giraf obs argoff (science target with offsets)
• FLAMES giraf obs argstd (standard star observation with offsets)
• FLAMES giraf obs exp (“normal” Giraffe science template)
6.4 Evaluation of the Results, Offline Data Analysis
At the end of each integration, the CCD frames are read out by the FIERA controller andtransferred to the instrument workstation and subsequently to the archive.
During the readout the frames are displayed automatically on two Real-Time Display (RTD)panels (one for GIRAFFE, one for UVES) for first inspection using the standard RTD tools.More detailed analysis of the new exposures or previous exposures has to be carried out onthe astronomer’s offline workstation where copies of the raw files are available within a fewseconds. After pipeline processing, the pipeline products are also forwarded to the offlineworkstation from where they can be accessed and inspected by the astronomer. Note that itis possible that the pipeline does not fully support the fast readout mode in case of use invisitor mode. Standard data reduction tools like MIDAS, IRAF, or IDL are available for thispurpose.
The rather complex data structure of FLAMES raw frames is described in the next section.
FLAMES User Manual VLT-MAN-ESO-13700-2994 71
6.5 FLAMES Raw Data Structure
Given the complexity of the instrument, the data must carry all the relevant information aboutthe objects and the instrument configurations through the whole data-flow process. In the caseof FLAMES, two binary tables associated to the detector image are of utmost importance,because they contain all the information to associate the spectra to the objects.
Both GIRAFFE and UVES – FIBRE mode FITS data have the same data and header structureand include 3 FITS HDUs (Header Units):
HDU1: image the image header contains in addition to the primary FITS keywords addi-tional keywords for the status of telescope, positioner, spectrograph, detector, templates,etc. during the exposure.
HDU2: OzPoz table associates the objects to the fibre buttons. This is basically the sametable as was provided in the Target Setup File for FPOSS, plus additional informationfrom OzPoz, such as the R and θ position of each button on the plate and the corre-sponding positioning errors. The table header contains keywords related to the fibrepositioning process, e.g., the time and wavelength for which the field was configure.
HDU3: FLAMES FIBRE Table contains the fibre description: association between fibrebuttons and position in the subslit and slit, measured (laboratory) fibre transmission atdifferent wavelengths, fibre bundle. For the ARGUS fibre bundle, the X and Y positionof the individual fibre in the reconstructed image matrix is given.
6.5.1 HDU2: OzPoz table
The OzPoz binary table will be different for every frame; this table associates the objects tothe fibre buttons. The basic information for this table is taken from the Target Setup File(association object-to-fibre and object characteristics). This information is complemented byOzPoz with all information related to the positioning of the fibres.
The table is structured as:
Col 1: Object Identification (from Target Setup File, column 1)
Col 2: RA Right Ascension (from Target Setup File, column 2)
Col 3: DEC Declination (from Target Setup File, column 3)
Col 4: R Button R position on plate (microns)
Col 5: R Error Error in R (microns)
Col 6: Theta Button θ position on plate (radians)
Col 7: Theta Error Error in θ (microns)
Col 8: Type Object type (MEDUSA, IFU, etc. . .)
Col 9: Button OzPoz button number
Col 10: Priority Object Priority (from Target Setup File, column 5)
Col 11: Orient Button Orientation
Col 12: In Tol T or F if positioned or not within tolerance (40 microns = 0.08”)
Col 13: Magnitude Target Magnitude (from Target Setup File, column 6)
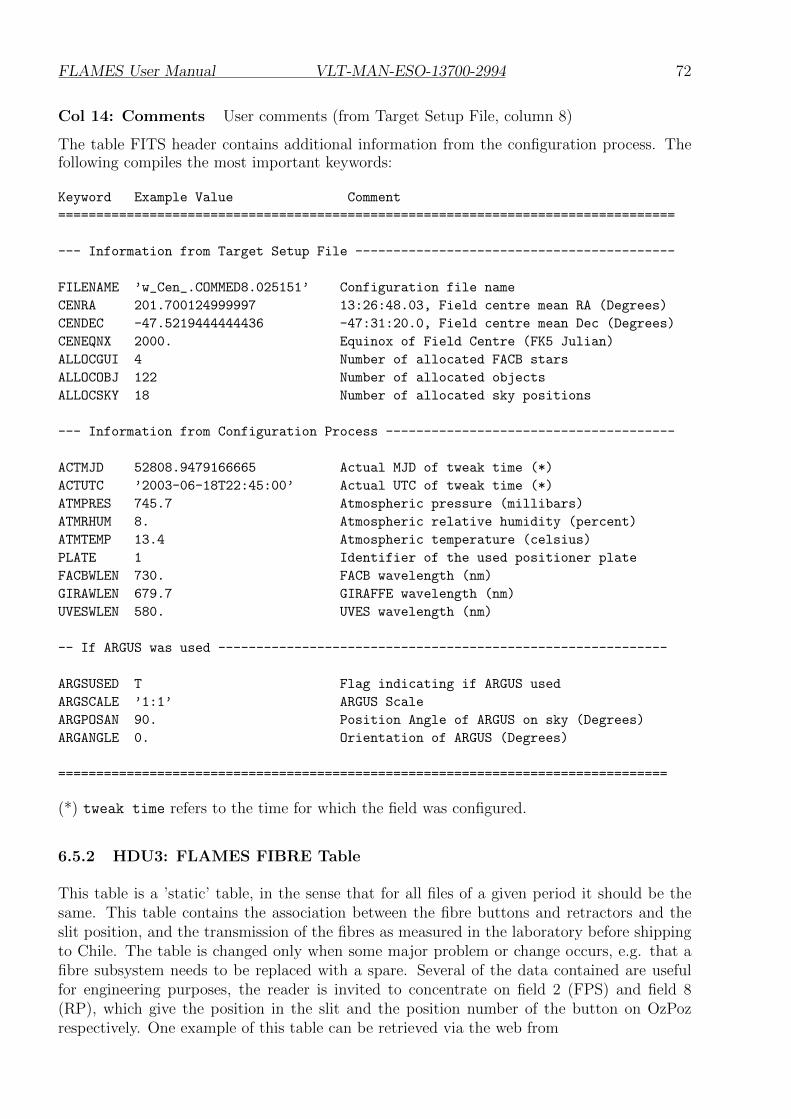
FLAMES User Manual VLT-MAN-ESO-13700-2994 72
Col 14: Comments User comments (from Target Setup File, column 8)
The table FITS header contains additional information from the configuration process. Thefollowing compiles the most important keywords:
Keyword Example Value Comment
=================================================================================
--- Information from Target Setup File ------------------------------------------
FILENAME ’w_Cen_.COMMED8.025151’ Configuration file name
CENRA 201.700124999997 13:26:48.03, Field centre mean RA (Degrees)
CENDEC -47.5219444444436 -47:31:20.0, Field centre mean Dec (Degrees)
CENEQNX 2000. Equinox of Field Centre (FK5 Julian)
ALLOCGUI 4 Number of allocated FACB stars
ALLOCOBJ 122 Number of allocated objects
ALLOCSKY 18 Number of allocated sky positions
--- Information from Configuration Process --------------------------------------
ACTMJD 52808.9479166665 Actual MJD of tweak time (*)
ACTUTC ’2003-06-18T22:45:00’ Actual UTC of tweak time (*)
ATMPRES 745.7 Atmospheric pressure (millibars)
ATMRHUM 8. Atmospheric relative humidity (percent)
ATMTEMP 13.4 Atmospheric temperature (celsius)
PLATE 1 Identifier of the used positioner plate
FACBWLEN 730. FACB wavelength (nm)
GIRAWLEN 679.7 GIRAFFE wavelength (nm)
UVESWLEN 580. UVES wavelength (nm)
-- If ARGUS was used -----------------------------------------------------------
ARGSUSED T Flag indicating if ARGUS used
ARGSCALE ’1:1’ ARGUS Scale
ARGPOSAN 90. Position Angle of ARGUS on sky (Degrees)
ARGANGLE 0. Orientation of ARGUS (Degrees)
================================================================================
(*) tweak time refers to the time for which the field was configured.
6.5.2 HDU3: FLAMES FIBRE Table
This table is a ’static’ table, in the sense that for all files of a given period it should be thesame. This table contains the association between the fibre buttons and retractors and theslit position, and the transmission of the fibres as measured in the laboratory before shippingto Chile. The table is changed only when some major problem or change occurs, e.g. that afibre subsystem needs to be replaced with a spare. Several of the data contained are usefulfor engineering purposes, the reader is invited to concentrate on field 2 (FPS) and field 8(RP), which give the position in the slit and the position number of the button on OzPozrespectively. One example of this table can be retrieved via the web from
FLAMES User Manual VLT-MAN-ESO-13700-2994 73
http://www.eso.org/observing/dfo/quality/GIRAFFE/txt/fibre.dat
Schematic examples for the raw data format of the different fibre types are given in Ap-pendix 7.1.
Description of the table columns:
Col 1: Slit Slit name from fibre type and plate number
Col 2: FPS Progressive fibre position number in the slit
Col 3: SSN Subslit number
Col 4: PSSN Fibre Position in the subslit
Col 5: Retractor Serial Number of the retractor
Col 6: BN Serial Number of the button used in the retractor
Col 7: FBN Serial Number of the fibre used for the button
Col 8: RP Retractor position on the plate. This number corresponds to the fibre numberused e.g. in FPOSS. All even numbers are MEDUSA fibres
Col 9-17: wave Fibre Transmission values as measured in the lab. Each column is a dif-ferent wavelength
Col 18: X x position of fibre in the reconstructed image matrix
Col 19: Y y position of fibre in the reconstructed image matrix
Col 20: FPD Fibre Position on the Detector. For all setups except ARGUS this is thesame as FPS. For ARGUS it is reversed. Added April 2004.
Note that the ARGUS image reconstruction using the x and y columns for the table will givethe image in the standard North – East orientation on sky. If the ARGUS position angle was0 (ARGPOSAN = 0), N is along the X axis and E along the Y axis. A non-zero PA is shown inFigure 23). The position angle is counted in the standard sense, i.e., N to E.
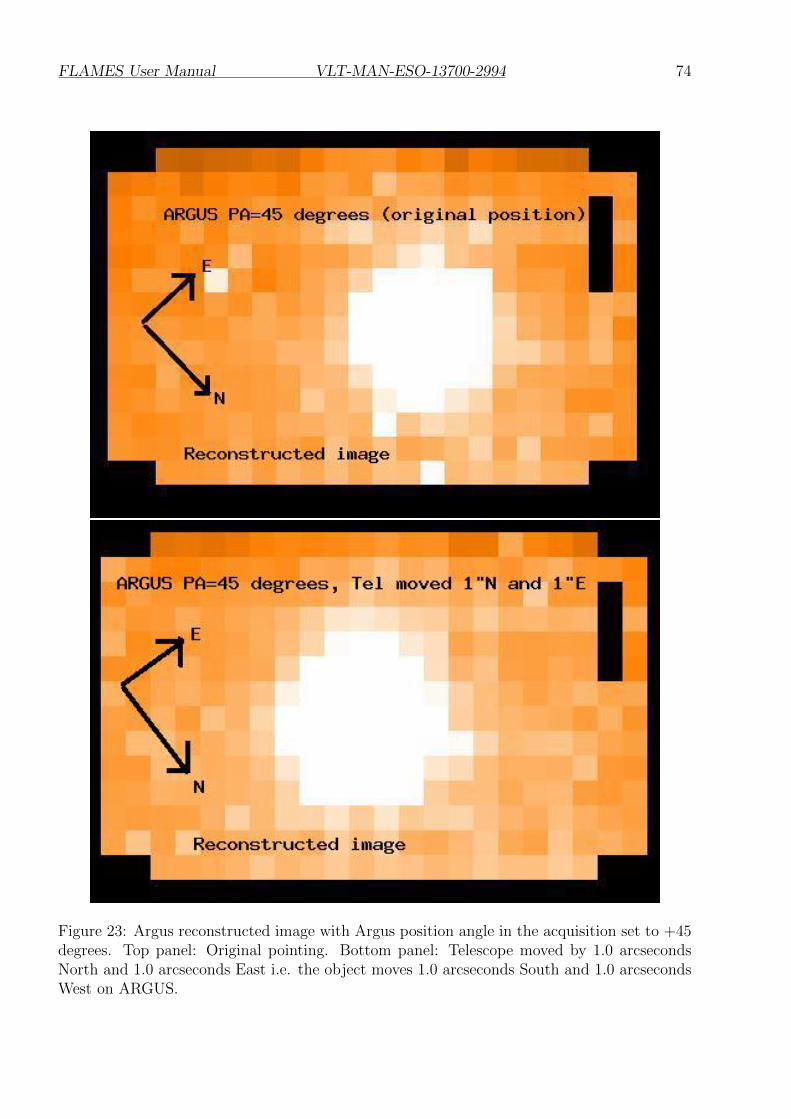
FLAMES User Manual VLT-MAN-ESO-13700-2994 74
Figure 23: Argus reconstructed image with Argus position angle in the acquisition set to +45degrees. Top panel: Original pointing. Bottom panel: Telescope moved by 1.0 arcsecondsNorth and 1.0 arcseconds East i.e. the object moves 1.0 arcseconds South and 1.0 arcsecondsWest on ARGUS.
FLAMES User Manual VLT-MAN-ESO-13700-2994 75
7 Appendix
7.1 FLAMES Raw Data Spectral Format
The following figures give a schematic view of the spectral format for the different FLAMESfibre types on the raw images.
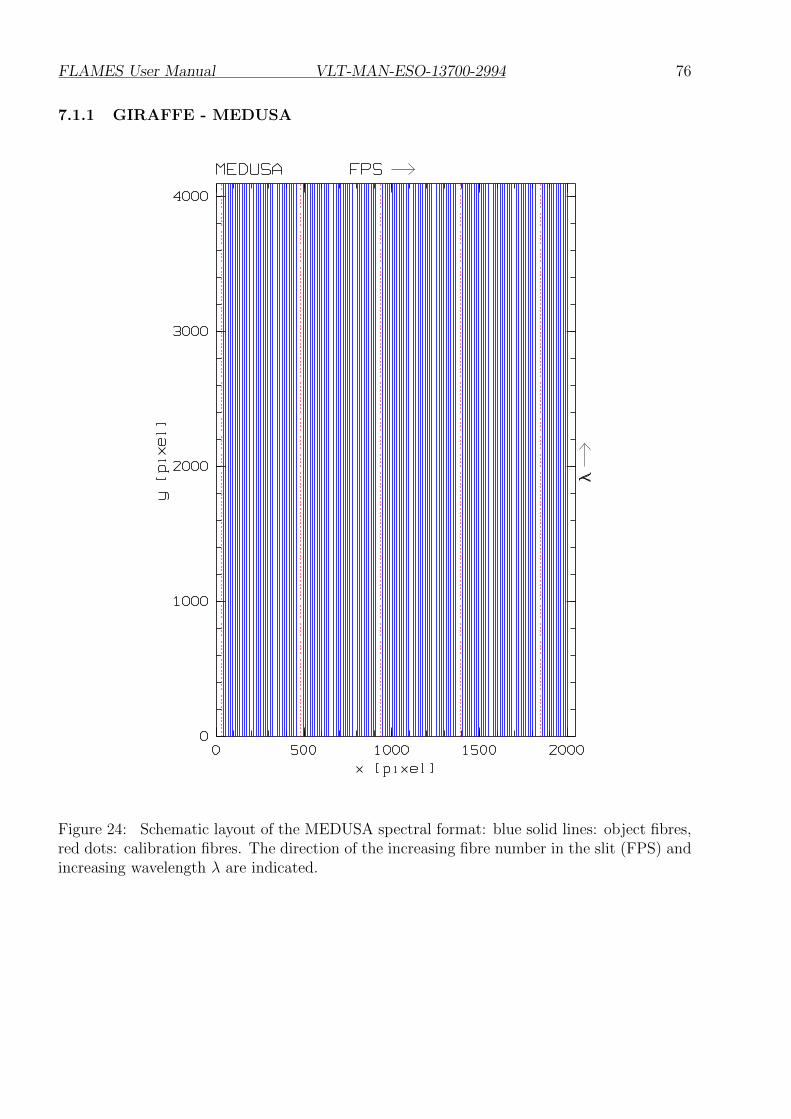
FLAMES User Manual VLT-MAN-ESO-13700-2994 76
7.1.1 GIRAFFE - MEDUSA
Figure 24: Schematic layout of the MEDUSA spectral format: blue solid lines: object fibres,red dots: calibration fibres. The direction of the increasing fibre number in the slit (FPS) andincreasing wavelength λ are indicated.
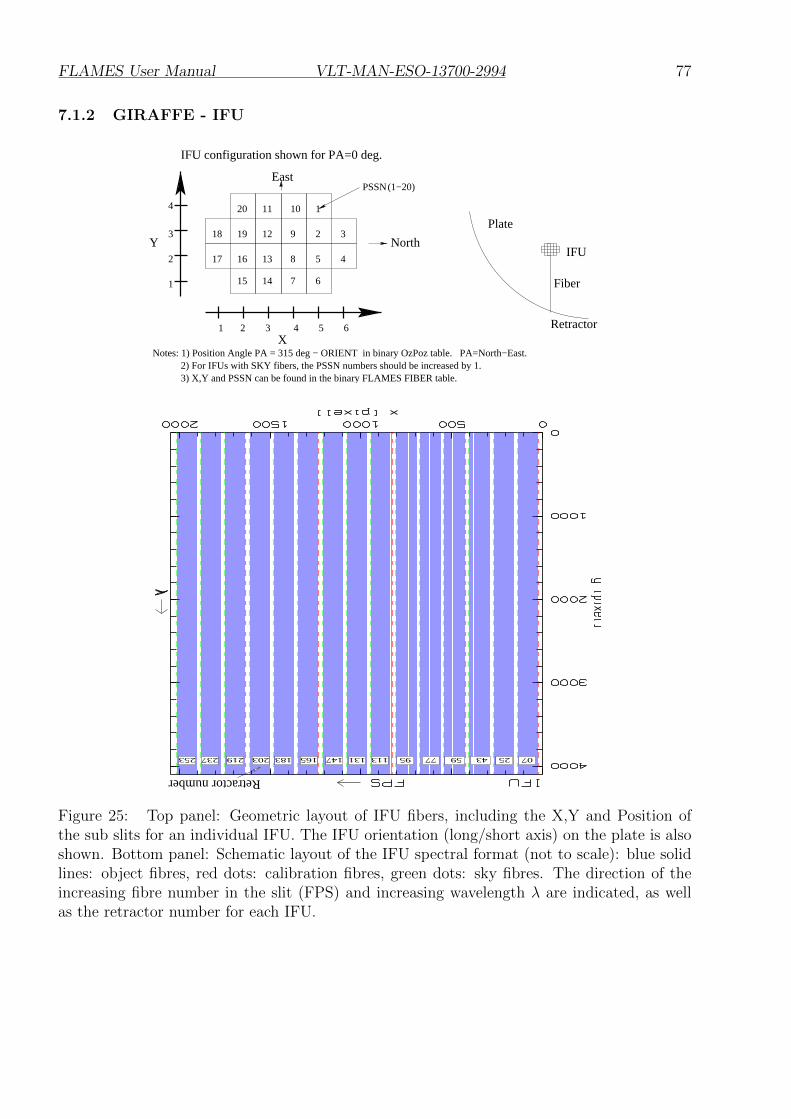
FLAMES User Manual VLT-MAN-ESO-13700-2994 77
7.1.2 GIRAFFE - IFU
5
67
8
9
1011
12
131617
18 19
20
15 14
2 3
4
Y
X1 2 3 4 5 6
1
2
3
4 1
(1−20)PSSN
Notes: 1) Position Angle PA = 315 deg − ORIENT in binary OzPoz table.
3) X,Y and PSSN can be found in the binary FLAMES FIBER table.2) For IFUs with SKY fibers, the PSSN numbers should be increased by 1.
PA=North−East.
Plate
Fiber
IFU
Retractor
IFU configuration shown for PA=0 deg.
East
North
0725253 219 183 165 147 131 113 95 77 4359203237
Retractor number
Figure 25: Top panel: Geometric layout of IFU fibers, including the X,Y and Position ofthe sub slits for an individual IFU. The IFU orientation (long/short axis) on the plate is alsoshown. Bottom panel: Schematic layout of the IFU spectral format (not to scale): blue solidlines: object fibres, red dots: calibration fibres, green dots: sky fibres. The direction of theincreasing fibre number in the slit (FPS) and increasing wavelength λ are indicated, as wellas the retractor number for each IFU.
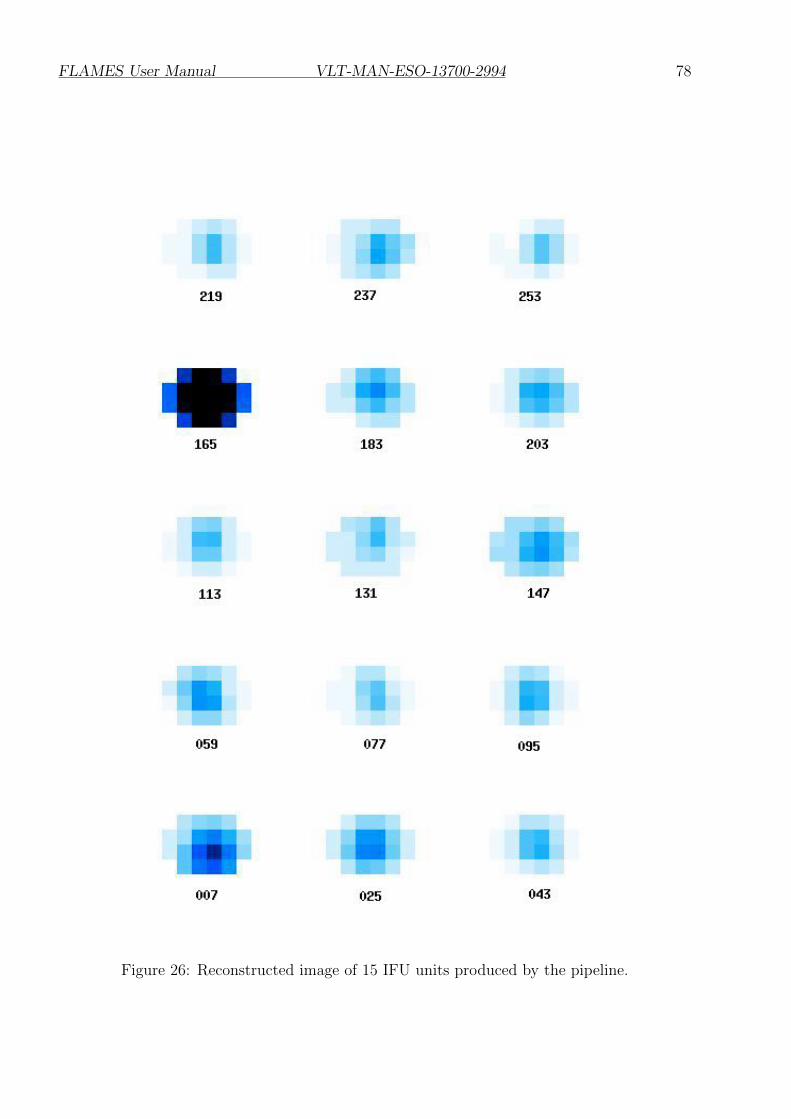
FLAMES User Manual VLT-MAN-ESO-13700-2994 78
Figure 26: Reconstructed image of 15 IFU units produced by the pipeline.
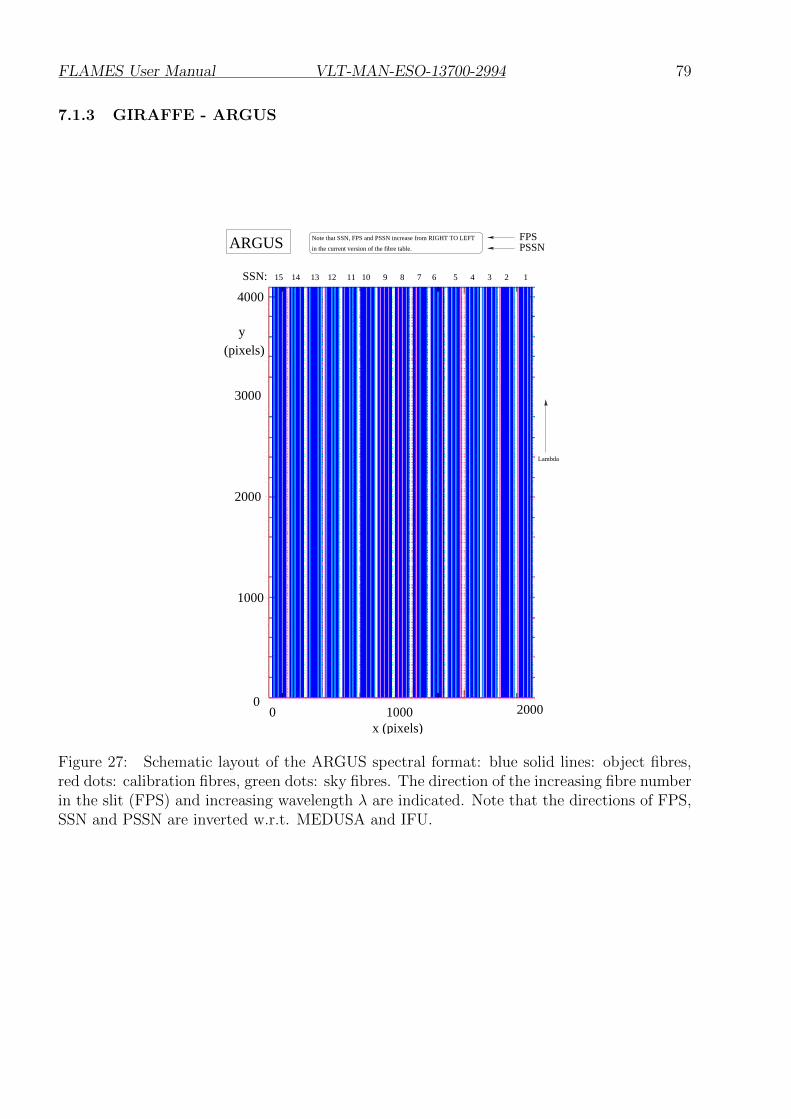
FLAMES User Manual VLT-MAN-ESO-13700-2994 79
7.1.3 GIRAFFE - ARGUS
SSN: 15 14 13 12 11 10 9 8 7 6 5 4 3 2 1
00
1000
3000
4000
1000 2000
x (pixels)
2000
y
(pixels)
ARGUS Note that SSN, FPS and PSSN increase from RIGHT TO LEFT
in the current version of the fibre table.
FPSPSSN
Lambda
Figure 27: Schematic layout of the ARGUS spectral format: blue solid lines: object fibres,red dots: calibration fibres, green dots: sky fibres. The direction of the increasing fibre numberin the slit (FPS) and increasing wavelength λ are indicated. Note that the directions of FPS,SSN and PSSN are inverted w.r.t. MEDUSA and IFU.
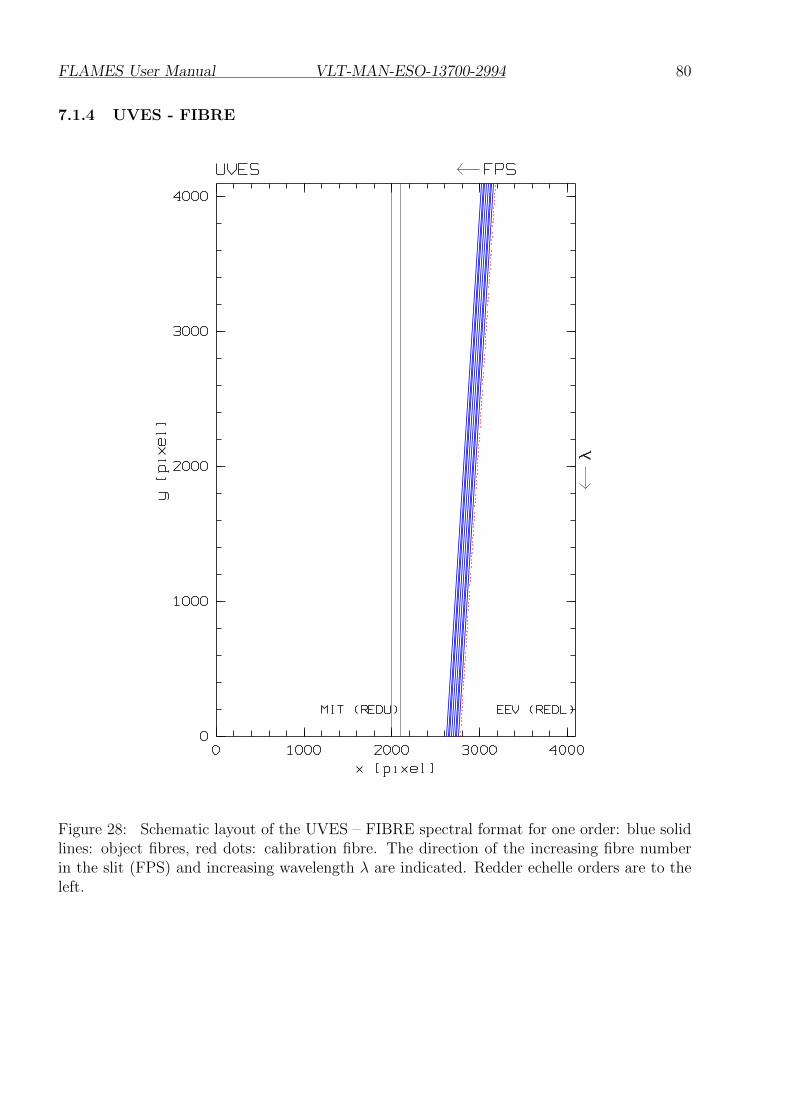
FLAMES User Manual VLT-MAN-ESO-13700-2994 80
7.1.4 UVES - FIBRE
Figure 28: Schematic layout of the UVES – FIBRE spectral format for one order: blue solidlines: object fibres, red dots: calibration fibre. The direction of the increasing fibre numberin the slit (FPS) and increasing wavelength λ are indicated. Redder echelle orders are to theleft.
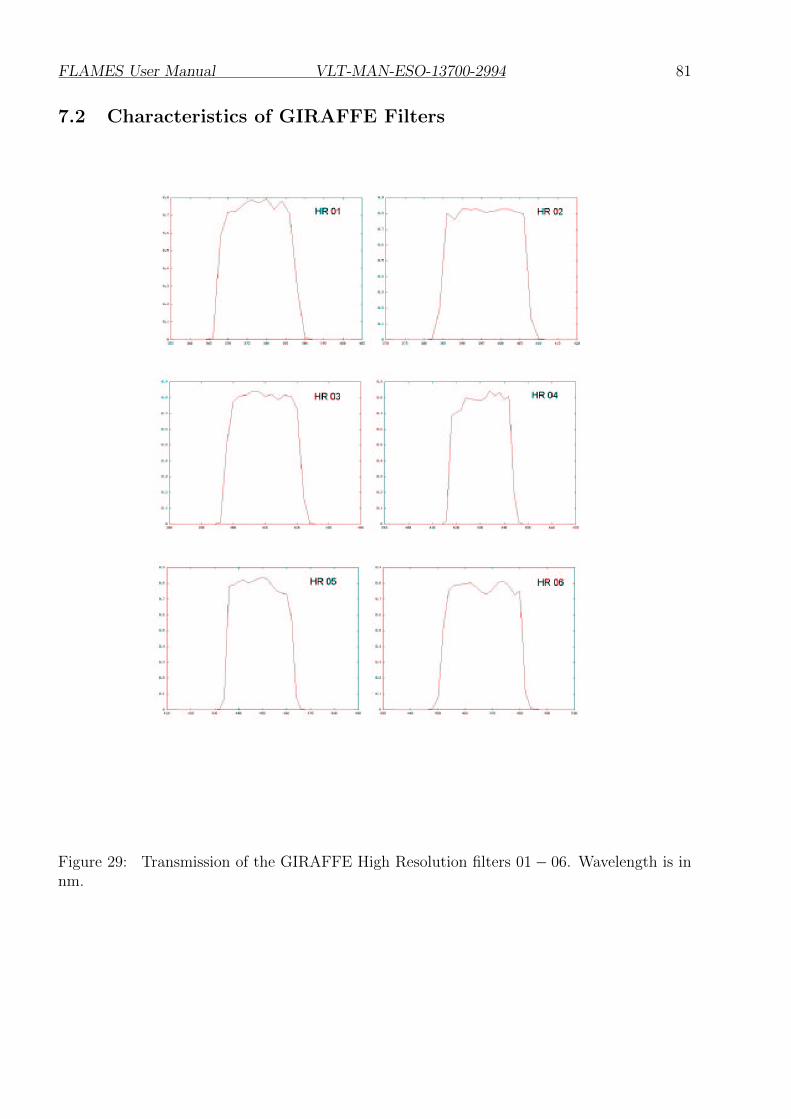
FLAMES User Manual VLT-MAN-ESO-13700-2994 81
7.2 Characteristics of GIRAFFE Filters
Figure 29: Transmission of the GIRAFFE High Resolution filters 01− 06. Wavelength is innm.
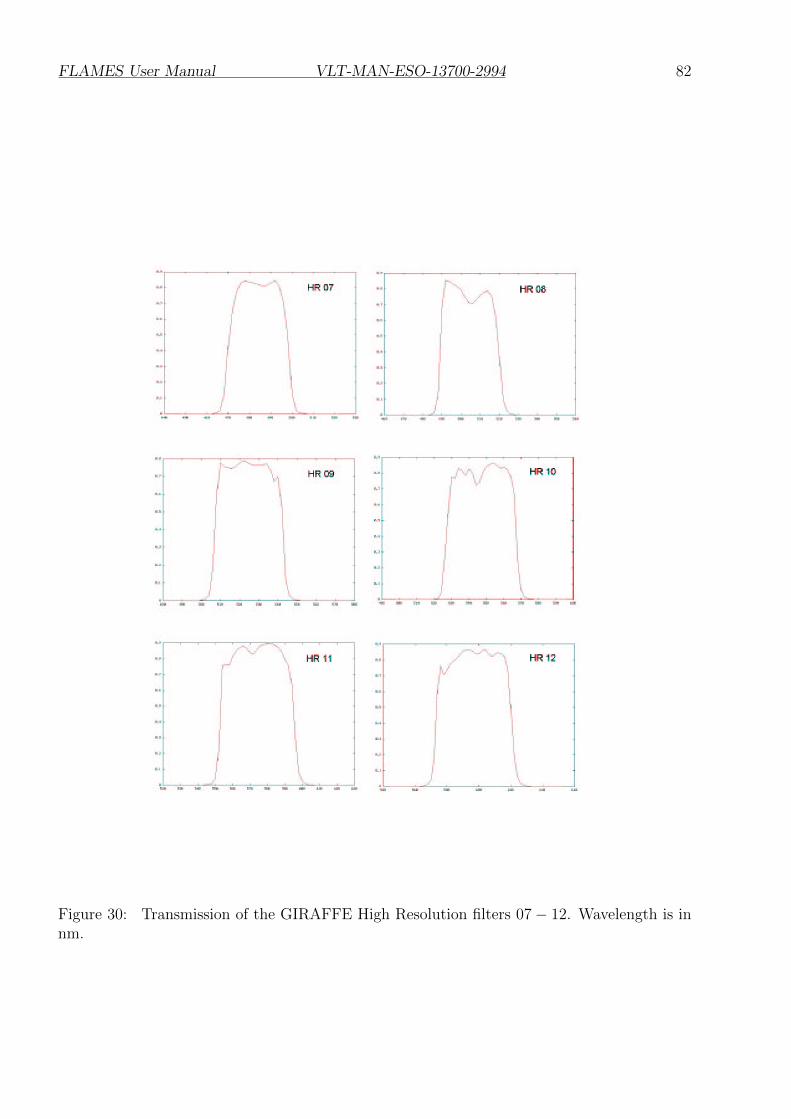
FLAMES User Manual VLT-MAN-ESO-13700-2994 82
Figure 30: Transmission of the GIRAFFE High Resolution filters 07− 12. Wavelength is innm.
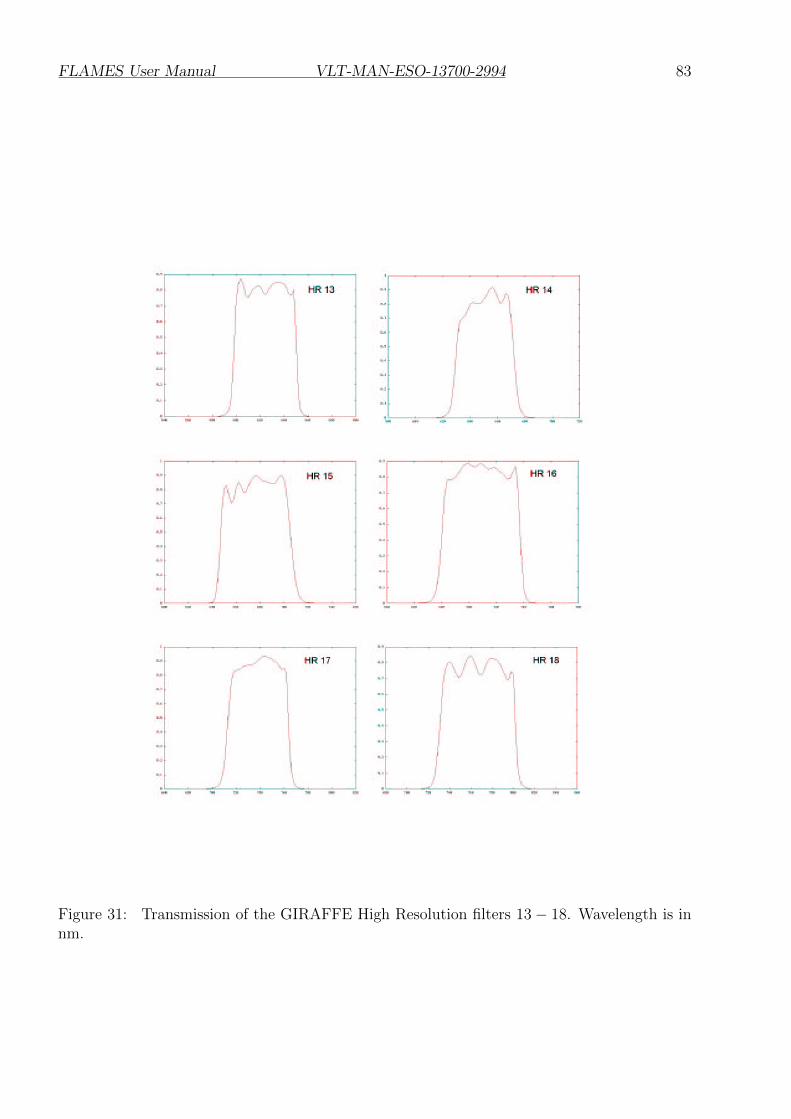
FLAMES User Manual VLT-MAN-ESO-13700-2994 83
Figure 31: Transmission of the GIRAFFE High Resolution filters 13− 18. Wavelength is innm.
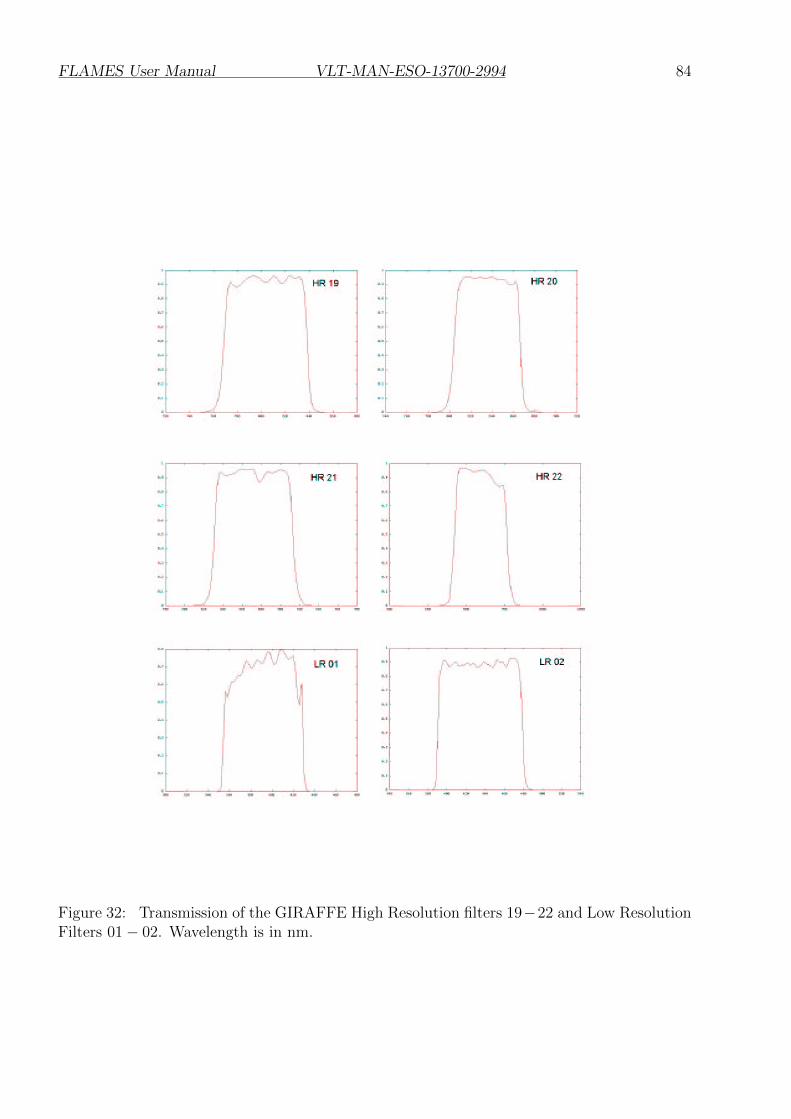
FLAMES User Manual VLT-MAN-ESO-13700-2994 84
Figure 32: Transmission of the GIRAFFE High Resolution filters 19−22 and Low ResolutionFilters 01− 02. Wavelength is in nm.
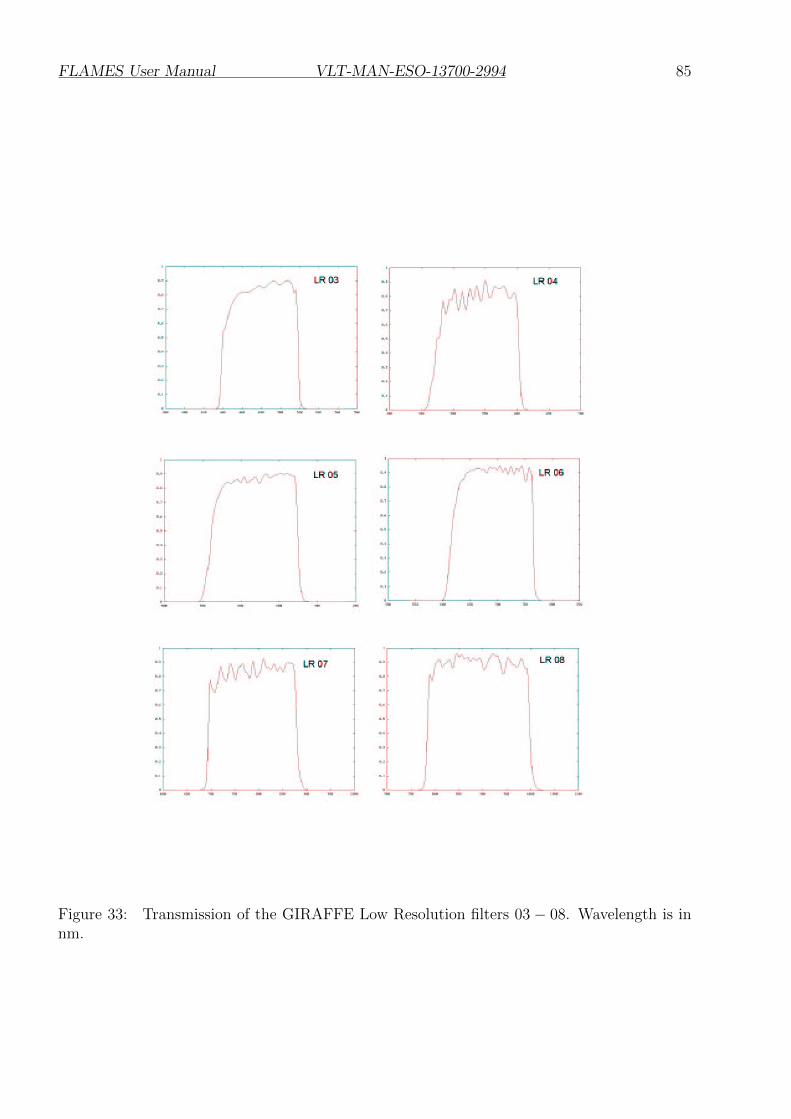
FLAMES User Manual VLT-MAN-ESO-13700-2994 85
Figure 33: Transmission of the GIRAFFE Low Resolution filters 03 − 08. Wavelength is innm.
FLAMES User Manual VLT-MAN-ESO-13700-2994 86
7.3 FLAMES calibration times
Table 14 lists the calibrations times used for calibrating MEDUSA observations. Flat-fieldtimes are exposure time per frame. Typically, 3 frames are taken (more in the case of bluesettings). IFU exposure times are twice the MEDUSA values. For ARGUS, the attachedscreen flat-field exposure times are twice the MEDUSA values. ARGUS calibrations usingthe robot are typically 4 times longer than the MEDUSA ones as the robot first needs toilluminate the sky fibers and then the ARGUS array. The quality of the ARGUS robot flats isnot as good as for MEDUSA as the illumination of the array is not so uniform. For this reasonscreenflats are preferred for ARGUS, although in the blue the integration times required arevery long.
7.4 Comparison between old and new HR gratings
In early October 2003, the high resolution grating on GIRAFFE was changed, leading to anincrease in sensitivity at the loss of spectral resolutions in some setups. A comparison betweenold and new gratings is shown Table 15 below.
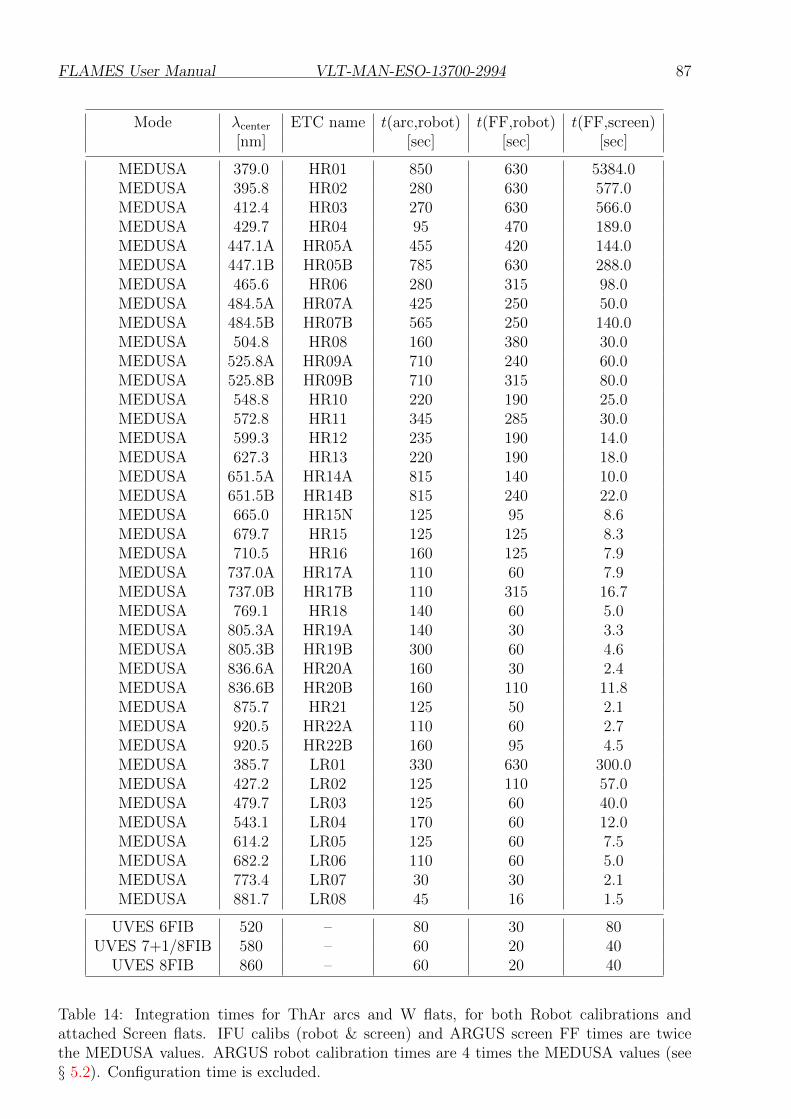
FLAMES User Manual VLT-MAN-ESO-13700-2994 87
Mode λcenter ETC name t(arc,robot) t(FF,robot) t(FF,screen)[nm] [sec] [sec] [sec]
MEDUSA 379.0 HR01 850 630 5384.0MEDUSA 395.8 HR02 280 630 577.0MEDUSA 412.4 HR03 270 630 566.0MEDUSA 429.7 HR04 95 470 189.0MEDUSA 447.1A HR05A 455 420 144.0MEDUSA 447.1B HR05B 785 630 288.0MEDUSA 465.6 HR06 280 315 98.0MEDUSA 484.5A HR07A 425 250 50.0MEDUSA 484.5B HR07B 565 250 140.0MEDUSA 504.8 HR08 160 380 30.0MEDUSA 525.8A HR09A 710 240 60.0MEDUSA 525.8B HR09B 710 315 80.0MEDUSA 548.8 HR10 220 190 25.0MEDUSA 572.8 HR11 345 285 30.0MEDUSA 599.3 HR12 235 190 14.0MEDUSA 627.3 HR13 220 190 18.0MEDUSA 651.5A HR14A 815 140 10.0MEDUSA 651.5B HR14B 815 240 22.0MEDUSA 665.0 HR15N 125 95 8.6MEDUSA 679.7 HR15 125 125 8.3MEDUSA 710.5 HR16 160 125 7.9MEDUSA 737.0A HR17A 110 60 7.9MEDUSA 737.0B HR17B 110 315 16.7MEDUSA 769.1 HR18 140 60 5.0MEDUSA 805.3A HR19A 140 30 3.3MEDUSA 805.3B HR19B 300 60 4.6MEDUSA 836.6A HR20A 160 30 2.4MEDUSA 836.6B HR20B 160 110 11.8MEDUSA 875.7 HR21 125 50 2.1MEDUSA 920.5 HR22A 110 60 2.7MEDUSA 920.5 HR22B 160 95 4.5MEDUSA 385.7 LR01 330 630 300.0MEDUSA 427.2 LR02 125 110 57.0MEDUSA 479.7 LR03 125 60 40.0MEDUSA 543.1 LR04 170 60 12.0MEDUSA 614.2 LR05 125 60 7.5MEDUSA 682.2 LR06 110 60 5.0MEDUSA 773.4 LR07 30 30 2.1MEDUSA 881.7 LR08 45 16 1.5
UVES 6FIB 520 – 80 30 80UVES 7+1/8FIB 580 – 60 20 40
UVES 8FIB 860 – 60 20 40
Table 14: Integration times for ThAr arcs and W flats, for both Robot calibrations andattached Screen flats. IFU calibs (robot & screen) and ARGUS screen FF times are twicethe MEDUSA values. ARGUS robot calibration times are 4 times the MEDUSA values (see§ 5.2). Configuration time is excluded.
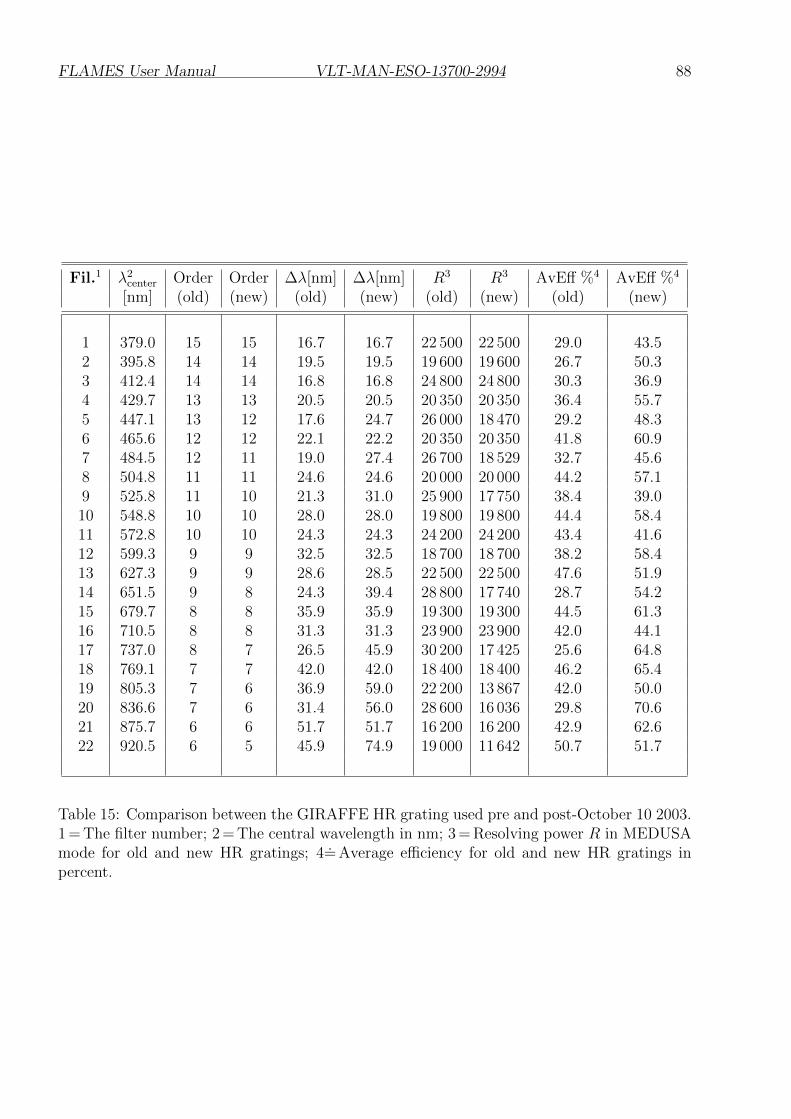
FLAMES User Manual VLT-MAN-ESO-13700-2994 88
Fil.1 λ2center Order Order ∆λ[nm] ∆λ[nm] R3 R3 AvEff %4 AvEff %4
[nm] (old) (new) (old) (new) (old) (new) (old) (new)
1 379.0 15 15 16.7 16.7 22 500 22 500 29.0 43.52 395.8 14 14 19.5 19.5 19 600 19 600 26.7 50.33 412.4 14 14 16.8 16.8 24 800 24 800 30.3 36.94 429.7 13 13 20.5 20.5 20 350 20 350 36.4 55.75 447.1 13 12 17.6 24.7 26 000 18 470 29.2 48.36 465.6 12 12 22.1 22.2 20 350 20 350 41.8 60.97 484.5 12 11 19.0 27.4 26 700 18 529 32.7 45.68 504.8 11 11 24.6 24.6 20 000 20 000 44.2 57.19 525.8 11 10 21.3 31.0 25 900 17 750 38.4 39.010 548.8 10 10 28.0 28.0 19 800 19 800 44.4 58.411 572.8 10 10 24.3 24.3 24 200 24 200 43.4 41.612 599.3 9 9 32.5 32.5 18 700 18 700 38.2 58.413 627.3 9 9 28.6 28.5 22 500 22 500 47.6 51.914 651.5 9 8 24.3 39.4 28 800 17 740 28.7 54.215 679.7 8 8 35.9 35.9 19 300 19 300 44.5 61.316 710.5 8 8 31.3 31.3 23 900 23 900 42.0 44.117 737.0 8 7 26.5 45.9 30 200 17 425 25.6 64.818 769.1 7 7 42.0 42.0 18 400 18 400 46.2 65.419 805.3 7 6 36.9 59.0 22 200 13 867 42.0 50.020 836.6 7 6 31.4 56.0 28 600 16 036 29.8 70.621 875.7 6 6 51.7 51.7 16 200 16 200 42.9 62.622 920.5 6 5 45.9 74.9 19 000 11 642 50.7 51.7
Table 15: Comparison between the GIRAFFE HR grating used pre and post-October 10 2003.1 = The filter number; 2 = The central wavelength in nm; 3 = Resolving power R in MEDUSAmode for old and new HR gratings; 4= Average efficiency for old and new HR gratings inpercent.

FLAMES User Manual VLT-MAN-ESO-13700-2994 89
—— oOo ——