five months after unlock | sbi
TRANSCRIPT
Five Months After Unlock
State Bank of India
09 November 2020
2State Bank of India
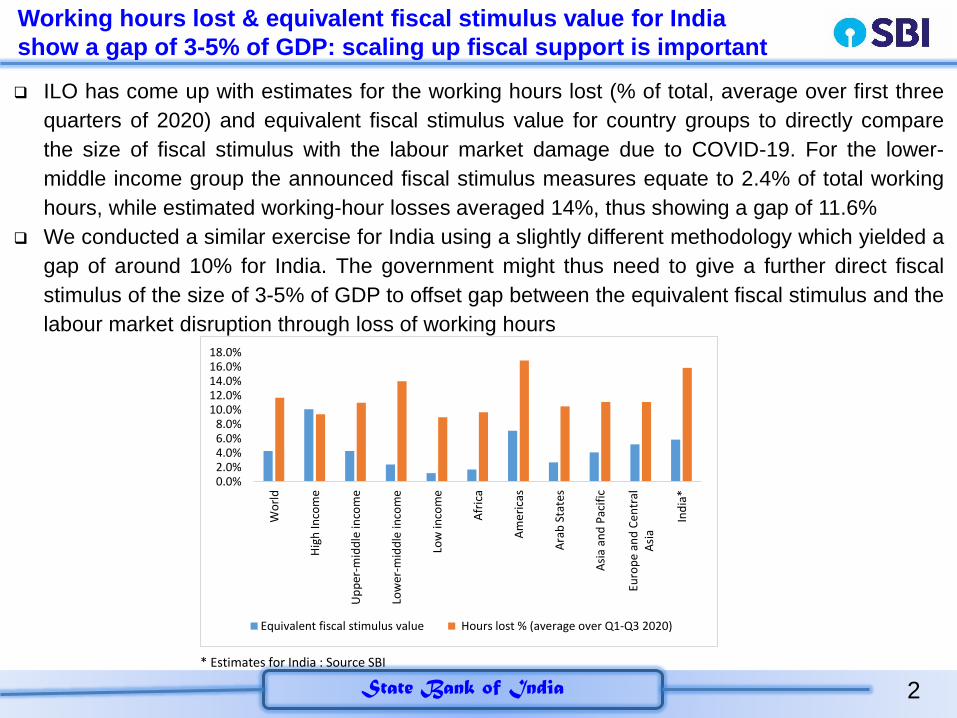
Working hours lost & equivalent fiscal stimulus value for India
show a gap of 3-5% of GDP: scaling up fiscal support is important
ILO has come up with estimates for the working hours lost (% of total, average over first three
quarters of 2020) and equivalent fiscal stimulus value for country groups to directly compare
the size of fiscal stimulus with the labour market damage due to COVID-19. For the lower-
middle income group the announced fiscal stimulus measures equate to 2.4% of total working
hours, while estimated working-hour losses averaged 14%, thus showing a gap of 11.6%
We conducted a similar exercise for India using a slightly different methodology which yielded a
gap of around 10% for India. The government might thus need to give a further direct fiscal
stimulus of the size of 3-5% of GDP to offset gap between the equivalent fiscal stimulus and the
labour market disruption through loss of working hours
0.0%2.0%4.0%6.0%8.0%
10.0%12.0%14.0%16.0%18.0%
Wo
rld
Hig
h In
com
e
Up
per
-mid
dle
inco
me
Low
er-m
idd
le in
com
e
Low
inco
me
Afr
ica
Am
eri
cas
Ara
b S
tate
s
Asi
a an
d P
acif
ic
Euro
pe
an
d C
en
tral
Asi
a
Ind
ia*
Equivalent fiscal stimulus value Hours lost % (average over Q1-Q3 2020)
* Estimates for India : Source SBI
3State Bank of India
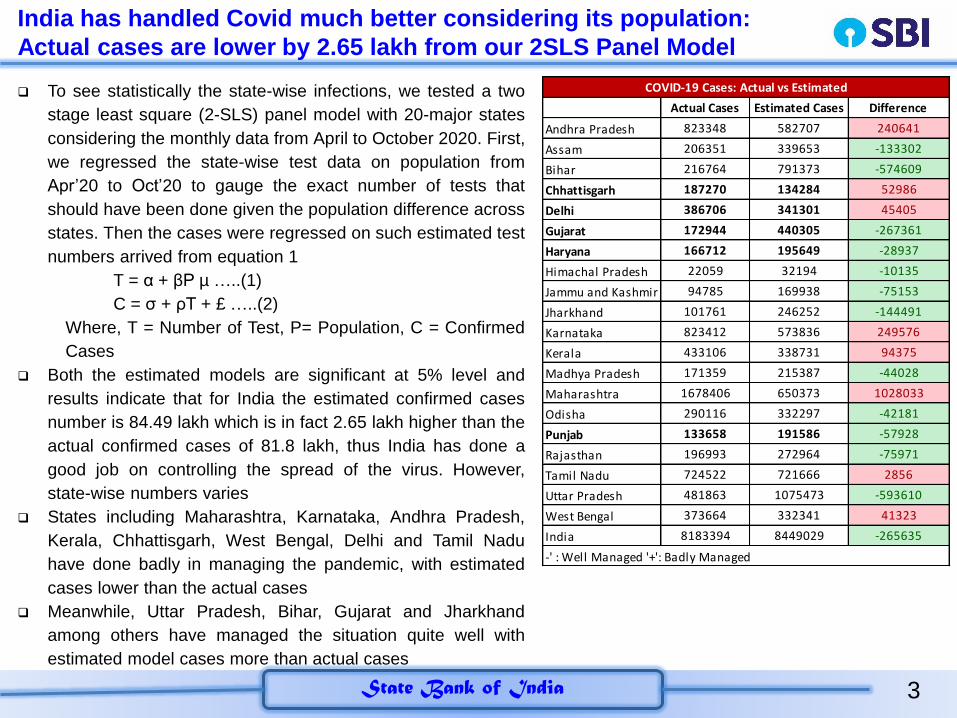
India has handled Covid much better considering its population:
Actual cases are lower by 2.65 lakh from our 2SLS Panel Model
To see statistically the state-wise infections, we tested a two
stage least square (2-SLS) panel model with 20-major states
considering the monthly data from April to October 2020. First,
we regressed the state-wise test data on population from
Apr’20 to Oct’20 to gauge the exact number of tests that
should have been done given the population difference across
states. Then the cases were regressed on such estimated test
numbers arrived from equation 1
T = α + βP µ …..(1)
C = σ + ρT + £ …..(2)
Where, T = Number of Test, P= Population, C = Confirmed
Cases
Both the estimated models are significant at 5% level and
results indicate that for India the estimated confirmed cases
number is 84.49 lakh which is in fact 2.65 lakh higher than the
actual confirmed cases of 81.8 lakh, thus India has done a
good job on controlling the spread of the virus. However,
state-wise numbers varies
States including Maharashtra, Karnataka, Andhra Pradesh,
Kerala, Chhattisgarh, West Bengal, Delhi and Tamil Nadu
have done badly in managing the pandemic, with estimated
cases lower than the actual cases
Meanwhile, Uttar Pradesh, Bihar, Gujarat and Jharkhand
among others have managed the situation quite well with
estimated model cases more than actual cases
Actual Cases Estimated Cases Difference
Andhra Pradesh 823348 582707 240641
Assam 206351 339653 -133302
Bihar 216764 791373 -574609
Chhattisgarh 187270 134284 52986
Delhi 386706 341301 45405
Gujarat 172944 440305 -267361
Haryana 166712 195649 -28937
Himachal Pradesh 22059 32194 -10135
Jammu and Kashmir 94785 169938 -75153
Jharkhand 101761 246252 -144491
Karnataka 823412 573836 249576
Kerala 433106 338731 94375
Madhya Pradesh 171359 215387 -44028
Maharashtra 1678406 650373 1028033
Odisha 290116 332297 -42181
Punjab 133658 191586 -57928
Rajasthan 196993 272964 -75971
Tamil Nadu 724522 721666 2856
Uttar Pradesh 481863 1075473 -593610
West Bengal 373664 332341 41323
India 8183394 8449029 -265635
COVID-19 Cases: Actual vs Estimated
-' : Well Managed '+': Badly Managed
4State Bank of India
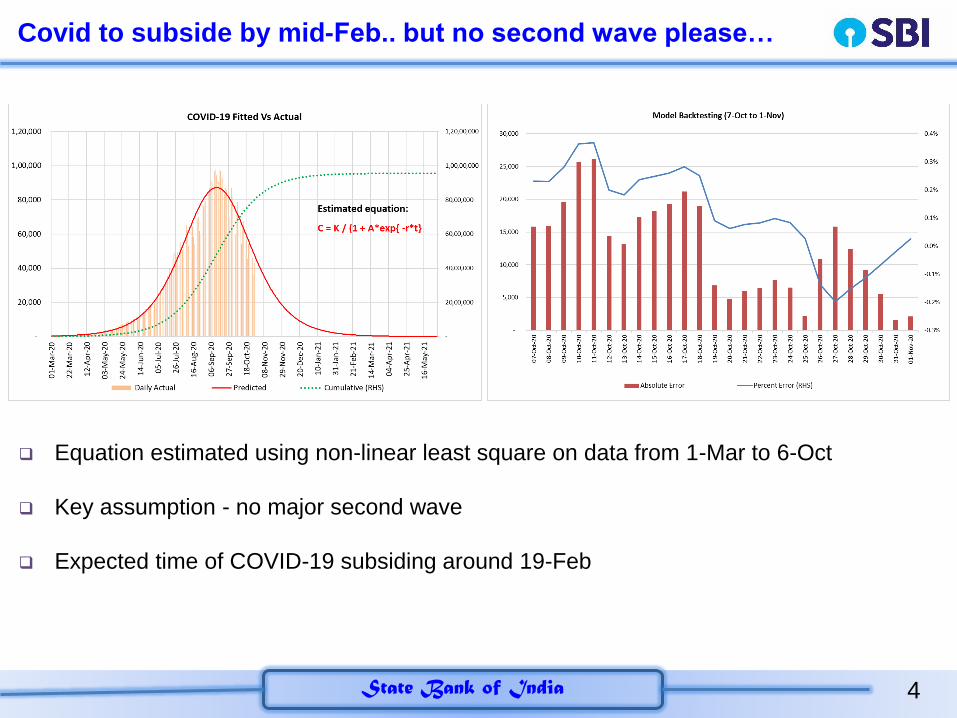
Covid to subside by mid-Feb.. but no second wave please…
Equation estimated using non-linear least square on data from 1-Mar to 6-Oct
Key assumption - no major second wave
Expected time of COVID-19 subsiding around 19-Feb
5State Bank of India
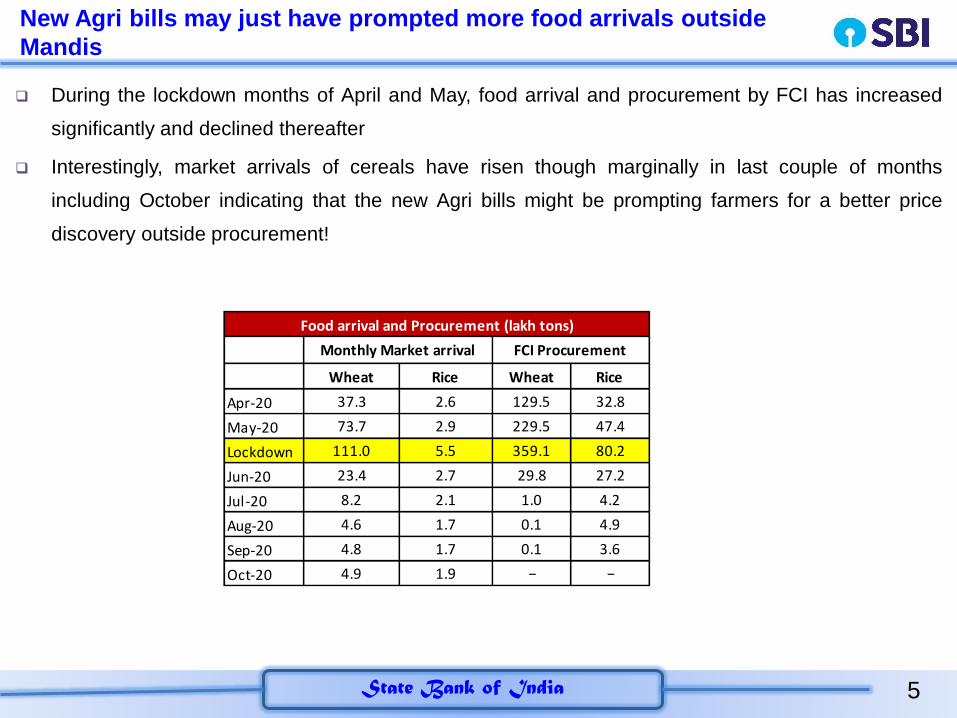
New Agri bills may just have prompted more food arrivals outside
Mandis
During the lockdown months of April and May, food arrival and procurement by FCI has increased
significantly and declined thereafter
Interestingly, market arrivals of cereals have risen though marginally in last couple of months
including October indicating that the new Agri bills might be prompting farmers for a better price
discovery outside procurement!
Wheat Rice Wheat Rice
Apr-20 37.3 2.6 129.5 32.8
May-20 73.7 2.9 229.5 47.4
Lockdown 111.0 5.5 359.1 80.2
Jun-20 23.4 2.7 29.8 27.2
Jul-20 8.2 2.1 1.0 4.2
Aug-20 4.6 1.7 0.1 4.9
Sep-20 4.8 1.7 0.1 3.6
Oct-20 4.9 1.9 − −
Food arrival and Procurement (lakh tons)
Monthly Market arrival FCI Procurement
6State Bank of India
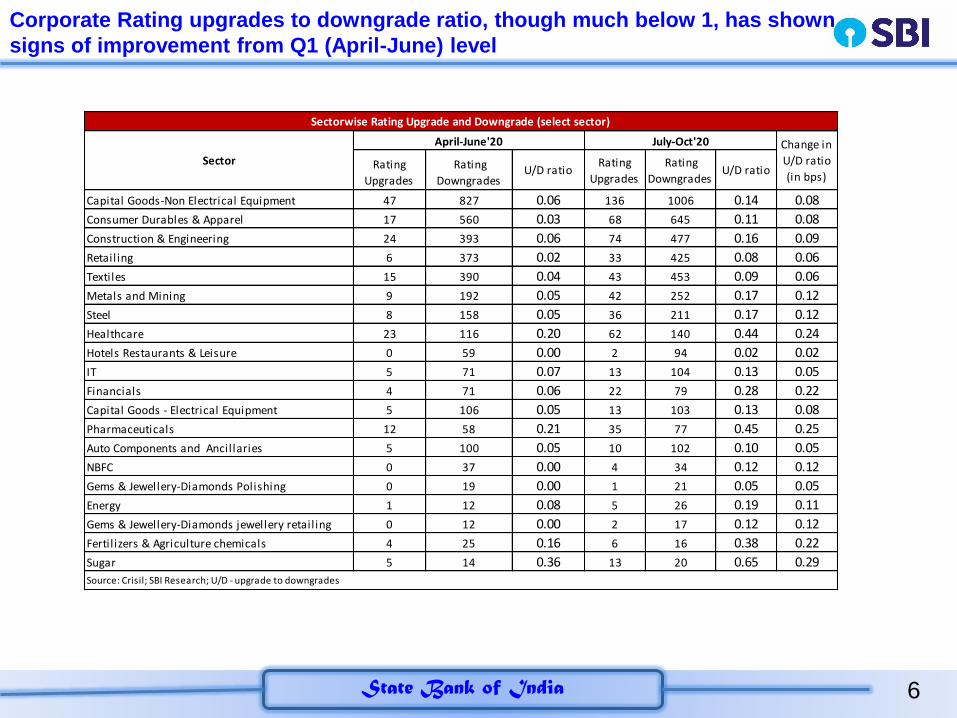
Corporate Rating upgrades to downgrade ratio, though much below 1, has shown
signs of improvement from Q1 (April-June) level
Rating
Upgrades
Rating
DowngradesU/D ratio
Rating
Upgrades
Rating
DowngradesU/D ratio
Capital Goods-Non Electrical Equipment 47 827 0.06 136 1006 0.14 0.08
Consumer Durables & Apparel 17 560 0.03 68 645 0.11 0.08
Construction & Engineering 24 393 0.06 74 477 0.16 0.09
Retailing 6 373 0.02 33 425 0.08 0.06
Textiles 15 390 0.04 43 453 0.09 0.06
Metals and Mining 9 192 0.05 42 252 0.17 0.12
Steel 8 158 0.05 36 211 0.17 0.12
Healthcare 23 116 0.20 62 140 0.44 0.24
Hotels Restaurants & Leisure 0 59 0.00 2 94 0.02 0.02
IT 5 71 0.07 13 104 0.13 0.05
Financials 4 71 0.06 22 79 0.28 0.22
Capital Goods - Electrical Equipment 5 106 0.05 13 103 0.13 0.08
Pharmaceuticals 12 58 0.21 35 77 0.45 0.25
Auto Components and Ancillaries 5 100 0.05 10 102 0.10 0.05
NBFC 0 37 0.00 4 34 0.12 0.12
Gems & Jewellery-Diamonds Polishing 0 19 0.00 1 21 0.05 0.05
Energy 1 12 0.08 5 26 0.19 0.11
Gems & Jewellery-Diamonds jewellery retailing 0 12 0.00 2 17 0.12 0.12
Fertil izers & Agriculture chemicals 4 25 0.16 6 16 0.38 0.22
Sugar 5 14 0.36 13 20 0.65 0.29
Sectorwise Rating Upgrade and Downgrade (select sector)
Sector
April-June'20 July-Oct'20 Change in
U/D ratio
(in bps)
Source: Crisil; SBI Research; U/D - upgrade to downgrades
7State Bank of India
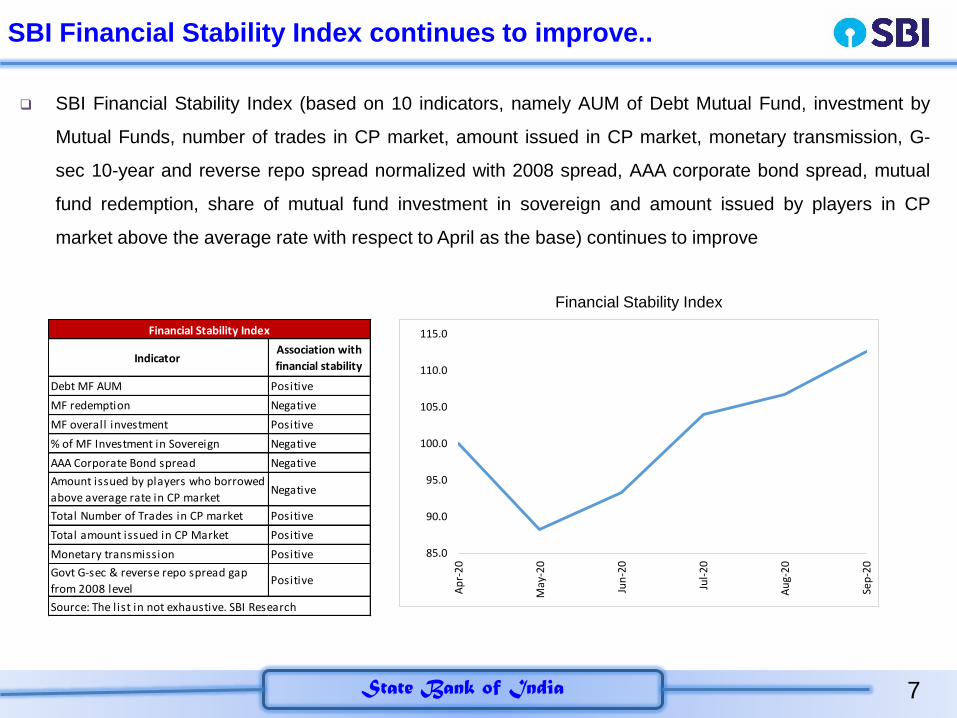
SBI Financial Stability Index continues to improve..
SBI Financial Stability Index (based on 10 indicators, namely AUM of Debt Mutual Fund, investment by
Mutual Funds, number of trades in CP market, amount issued in CP market, monetary transmission, G-
sec 10-year and reverse repo spread normalized with 2008 spread, AAA corporate bond spread, mutual
fund redemption, share of mutual fund investment in sovereign and amount issued by players in CP
market above the average rate with respect to April as the base) continues to improve
85.0
90.0
95.0
100.0
105.0
110.0
115.0
Ap
r-2
0
May
-20
Jun
-20
Jul-
20
Au
g-2
0
Sep
-20
Indicator Association with
financial stability
Debt MF AUM Positive
MF redemption Negative
MF overall investment Positive
% of MF Investment in Sovereign Negative
AAA Corporate Bond spread Negative
Amount issued by players who borrowed
above average rate in CP marketNegative
Total Number of Trades in CP market Positive
Total amount issued in CP Market Positive
Monetary transmission Positive
Govt G-sec & reverse repo spread gap
from 2008 levelPositive
Financial Stability Index
Source: The list in not exhaustive. SBI Research
Financial Stability Index
8State Bank of India
US election impact on India
Based on the final outcome of the US election the economic impact is equally
balanced
The economic and strategic partnership as it is taking shape will continue and
the US adjustment to Indo-Pacific will continue
There may be some relook at policy of onshoring and free trade
The size of the next fiscal stimulus, taxation and Federal Reserves stance in
response to the fiscal policy needs to be watched out
DXY should ideally get stronger against other Developed Market currencies, but
weaker against Emerging Market?.....
• Rupee could have an appreciative bias making RBI liquidity management more
challenging… Watch out….
9State Bank of India
Rethinking Economics in Pandemic
Widespread debate about relevance of Mainstream economics being taught in addressing the
contemporary economic challenges
A survey conducted among 920 economics students across the world shows that current
curriculum is silent about alternatives to market mechanisms for the delivery of essential goods
and services during a pandemic, or the role of labour market interventions like furlough
schemes. During the current pandemic, it has been widely accepted that price mechanism is
not the best way of allocating resources
Economics must recognise the role of political bias in economists’ policy proposals. Only 7
pages of Mankiw’s bestselling textbook (Mankiw, 2008) are dedicated to discrimination whilst in
the top five economics journals between 1990 and 2018, only 49 out of 7567 papers (0.65%)
explicitly addressed discrimination (Bohren et. al, 2020)
Furthermore, the results show that “mainstream economists’ papers and proposals are to be
presented in a way that is open and transparent about their inherent biases”
Global Financial crisis provided a turning point in how Economics as a subject is taught.
Economists of the future should receive a training that is critical, pluralist, interdisciplinary and
applicable to real world problems. Also, economics degrees should draw on literature from
different schools of thought, such as stratification to formulate a more complete,
interdisciplinary understanding of how and why discrimination persists
10State Bank of India
Summary………………………………………………..(1/4)
INDIA AND THE WORLD
European countries are witnessing lockdown again as the new cases continue to rise steeply
2 stage least squares panel model estimate shows India handled Covid better significantly considering its population.
Karnataka, Andhra Pradesh, Maharashtra, Kerala, Chhattisgarh, West Bengal, Delhi and Tamil Nadu have
done badly in managing the pandemic, with estimated cases lower than the actual cases. Meanwhile, Uttar
Pradesh, Bihar, Gujarat and Jharkhand among others have managed the situation well with estimated cases
more than their actual cases
New cases continue to rise in top 15 districts which are mostly urban. The good thing is that it is not spreading to
other areas and the fatality rate in top 15 districts is actually declining: Does that mean that India has now
developed a sense of herd immunity?
The share of rural districts in new cases that has declined further to 39% in Oct’20 compared to 43.4% in Sep’20
Assuming no major second wave, our non-linear least square model on data from 1-Mar to 6-Oct shows
COVID-19 is likely to subside around 19-Feb
STATEWISE DIAGNOSIS
India has achieved its national peak in terms of daily new cases, condition of Delhi, Kerala, Odisha and West Bengal
deteriorated, with rising daily new cases and daily deaths
While Delhi and Kerala increasing daily cases and test positivity show an expected increasing association, but for
West Bengal increasing daily cases are not associated with higher test positivity
Considering peak recovery rate of 78% and taking the confirmed and current recovered cases data, Delhi seems to
be still underreporting the Covid cases by 60,000 followed by West Bengal, Rajasthan and Kerala
11State Bank of India
Summary………………………………………………..(2/4)
ECONOMY PICKED UP MOMENTUM IN OCT
Corporate results for Q2 FY21 show that companies producing essential goods have mostly
witnessed strong results while those producing non-essential goods/services have mostly shown
weaker results. Moreover, rating upgrades to downgrade ratio, though much below 1, has shown
sign of improvement from Q1 (April-June) level
SBI Business Activity Index as well SBI Index continues to improve in Oct
Apple Mobility, RTO transactions, PMI manufacturing, GST e-way bills, petrol consumption, vehicle sales,
SBI index, food arrival and prices and Air quality all show improved economic activity in Oct. The numbers
have also crossed the peak reached in last 1 year for some indicators including manufacturing index, GST e-
way bills, vehicle sales (from the positive level reached 2 years ago)
Rail freight earnings continues to increase across segments, except for foodgrain, flours and pulses in
Oct’20 compared to Sep’20
increase in Vehicle Sales persisted in Oct across companies, however, retail sales as % of wholesale sales
has declined in case of 2-wheelers and Passenger vehicles this fiscal, indicating increase in inventory with
the dealers
Power consumption data shows improvement in many states in Oct compared to previous month
Oct’20 GST revenue is 10% higher than the GST revenues in the same month last year. The positive trend
which started from Sep’20 has sustained. E-way bills which hit a record high of 5.74 crore in Sep’20 have
further grown in Oct’20 to 6.42 crore
Employment demanded under MGNREGA has declined but yoy growth continues to improve
12State Bank of India
Summary………………………………………………..(3/4)
ECONOMY PICKED UP MOMENTUM IN OCT
China is giving push to infrastructure to counter the impact of COVID-19. China’s steel demand is expected
to increase by 8% in 2020, aided by government infrastructure stimulus and a strong property market
The Chinese revival only has limited upside for Indian Steel Industry. Domestic Steel demand improved by
8% M-o-M in Aug’20, as Indian Economy is gradually opening up under the Unlock 5.0. Steel Export from
India declined by 25% M-o-M during Aug’20, as both domestic demand and realisations improved in the
month of August, prompting Steelmakers to lower exports
BEHAVIOURAL CHANGES DURING PANDEMIC
There is similarity in behavioural changes during the current pandemic and 1665 London plague. Various
aspects of individual, society and the government support the same, including concept of kitchen garden,
more of home cooked food, (less of food deliveries in current pandemic), Shortage of certain essentials, Rise
of quacks, beliefs in miraculous cure, People become more religious and altruistic, Communities not taking it
seriously until it arrives in their midst, Authorities imposing local restrictions initially, doing Contact tracing
and isolation, Identification of essential services among others
13State Bank of India
Summary………………………………………………..(4/4)
BANKS
In September credit has picked-up but not able to keep the momentum in October. ASCBs
data for the fortnight ended 23 Oct’20 indicates that credit grew by 5.1% YoY compared to last
year growth of 8.9%. While, on YTD basis credit growth contracted by 0.3% compared to last
year YTD growth of 0.7%
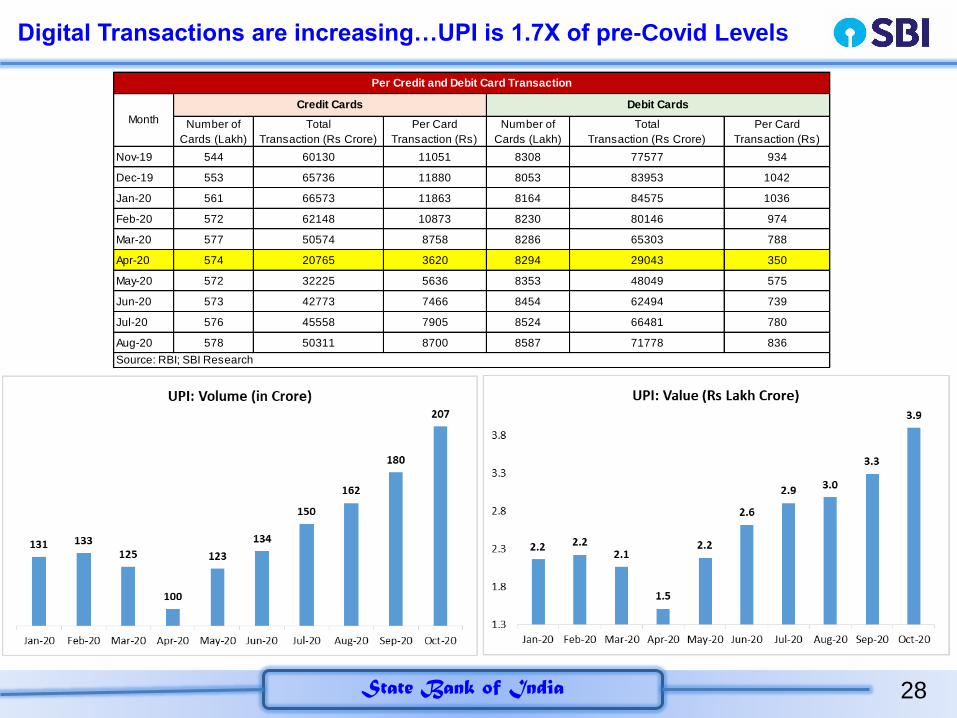
UPI transactions continues to grow in both value and volume terms with current values 1.7
times the pre-COVID levels
There has been an improvement in collective efficiency in Q2 FY21 after the end of
moratorium period. Even Micro finance institutions have witnessed an improvement
FINANCIAL MARKETS
Mutual Fund witnessed decline in AUM, increase in redemptions & net outflows
in Sep’20, indicating a troublesome month for the industry
Commercial paper issuances decreased by 48% in Oct’20 to Rs 1.02 lakh crore as compared
to Rs 1.93 lakh crore in Sep’20
Mutual fund holding in NBFC paper (CP) decreased by Rs 6554 crore from June’20 to Rs
47678 crore in Sep’20
But overall SBI Financial Stability Index also continues to improve
14State Bank of India
COVID-19 Update
15State Bank of India
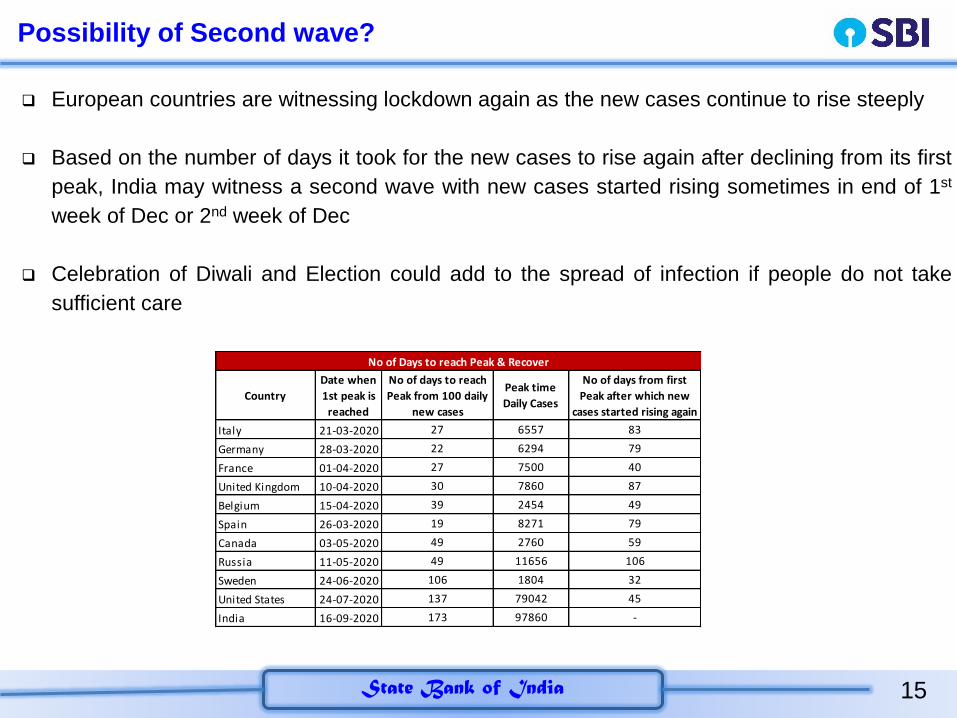
Possibility of Second wave?
European countries are witnessing lockdown again as the new cases continue to rise steeply
Based on the number of days it took for the new cases to rise again after declining from its first
peak, India may witness a second wave with new cases started rising sometimes in end of 1st
week of Dec or 2nd week of Dec
Celebration of Diwali and Election could add to the spread of infection if people do not take
sufficient care
Country
Date when
1st peak is
reached
No of days to reach
Peak from 100 daily
new cases
Peak time
Daily Cases
No of days from first
Peak after which new
cases started rising again
Italy 21-03-2020 27 6557 83
Germany 28-03-2020 22 6294 79
France 01-04-2020 27 7500 40
United Kingdom 10-04-2020 30 7860 87
Belgium 15-04-2020 39 2454 49
Spain 26-03-2020 19 8271 79
Canada 03-05-2020 49 2760 59
Russia 11-05-2020 49 11656 106
Sweden 24-06-2020 106 1804 32
United States 24-07-2020 137 79042 45
India 16-09-2020 173 97860 -
No of Days to reach Peak & Recover
16State Bank of India
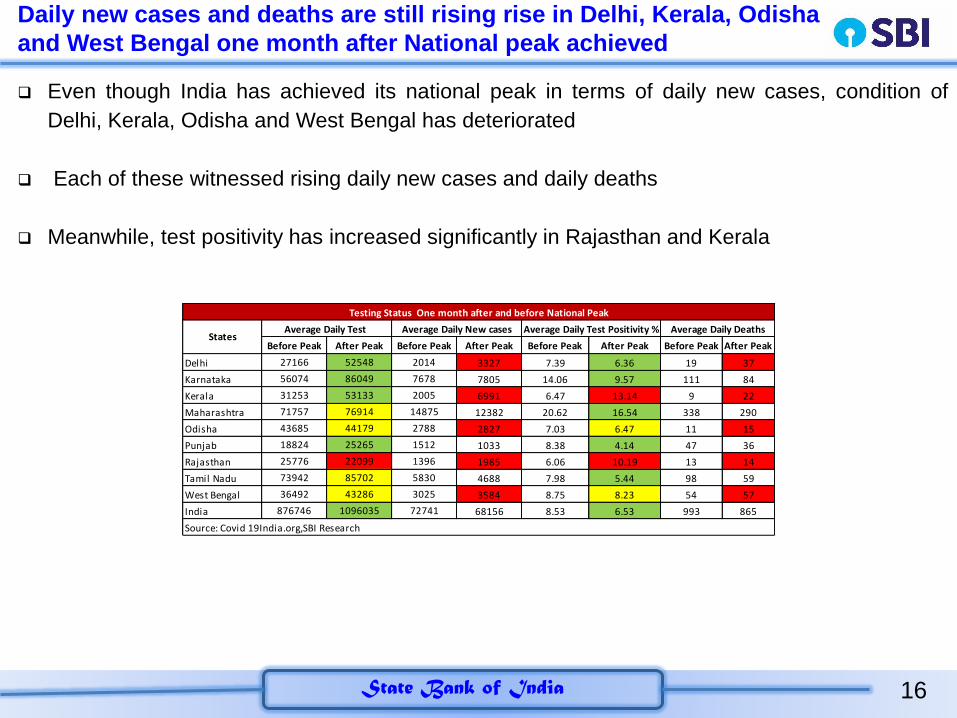
Daily new cases and deaths are still rising rise in Delhi, Kerala, Odisha
and West Bengal one month after National peak achieved
Even though India has achieved its national peak in terms of daily new cases, condition of
Delhi, Kerala, Odisha and West Bengal has deteriorated
Each of these witnessed rising daily new cases and daily deaths
Meanwhile, test positivity has increased significantly in Rajasthan and Kerala
Before Peak After Peak Before Peak After Peak Before Peak After Peak Before Peak After Peak
Delhi 27166 52548 2014 3327 7.39 6.36 19 37
Karnataka 56074 86049 7678 7805 14.06 9.57 111 84
Kerala 31253 53133 2005 6991 6.47 13.14 9 22
Maharashtra 71757 76914 14875 12382 20.62 16.54 338 290
Odisha 43685 44179 2788 2827 7.03 6.47 11 15
Punjab 18824 25265 1512 1033 8.38 4.14 47 36
Rajasthan 25776 22099 1396 1985 6.06 10.19 13 14
Tamil Nadu 73942 85702 5830 4688 7.98 5.44 98 59
West Bengal 36492 43286 3025 3584 8.75 8.23 54 57
India 876746 1096035 72741 68156 8.53 6.53 993 865
Source: Covid 19India.org,SBI Research
Testing Status One month after and before National Peak
StatesAverage Daily Test Average Daily New cases Average Daily Test Positivity % Average Daily Deaths
17State Bank of India
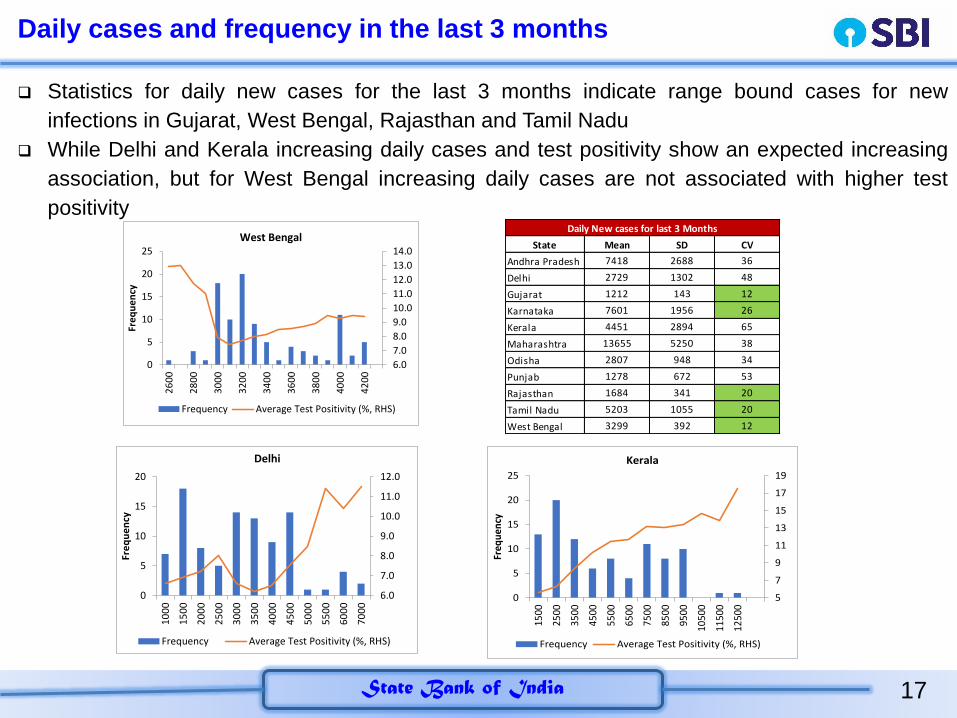
Daily cases and frequency in the last 3 months
Statistics for daily new cases for the last 3 months indicate range bound cases for new
infections in Gujarat, West Bengal, Rajasthan and Tamil Nadu
While Delhi and Kerala increasing daily cases and test positivity show an expected increasing
association, but for West Bengal increasing daily cases are not associated with higher test
positivity
State Mean SD CV
Andhra Pradesh 7418 2688 36
Delhi 2729 1302 48
Gujarat 1212 143 12
Karnataka 7601 1956 26
Kerala 4451 2894 65
Maharashtra 13655 5250 38
Odisha 2807 948 34
Punjab 1278 672 53
Rajasthan 1684 341 20
Tamil Nadu 5203 1055 20
West Bengal 3299 392 12
Daily New cases for last 3 Months
6.0
7.0
8.0
9.0
10.0
11.0
12.0
13.0
14.0
0
5
10
15
20
25
26
00
28
00
30
00
32
00
34
00
36
00
38
00
40
00
42
00
Fre
qu
en
cy
West Bengal
Frequency Average Test Positivity (%, RHS)
6.0
7.0
8.0
9.0
10.0
11.0
12.0
0
5
10
15
20
10
00
15
00
20
00
25
00
30
00
35
00
40
00
45
00
50
00
55
00
60
00
70
00
Fre
qu
en
cy
Delhi
Frequency Average Test Positivity (%, RHS)
5
7
9
11
13
15
17
19
0
5
10
15
20
25
1500
2500
3500
4500
5500
6500
7500
8500
9500
1050
0
1150
0
1250
0
Freq
uen
cy
Kerala
Frequency Average Test Positivity (%, RHS)
18State Bank of India
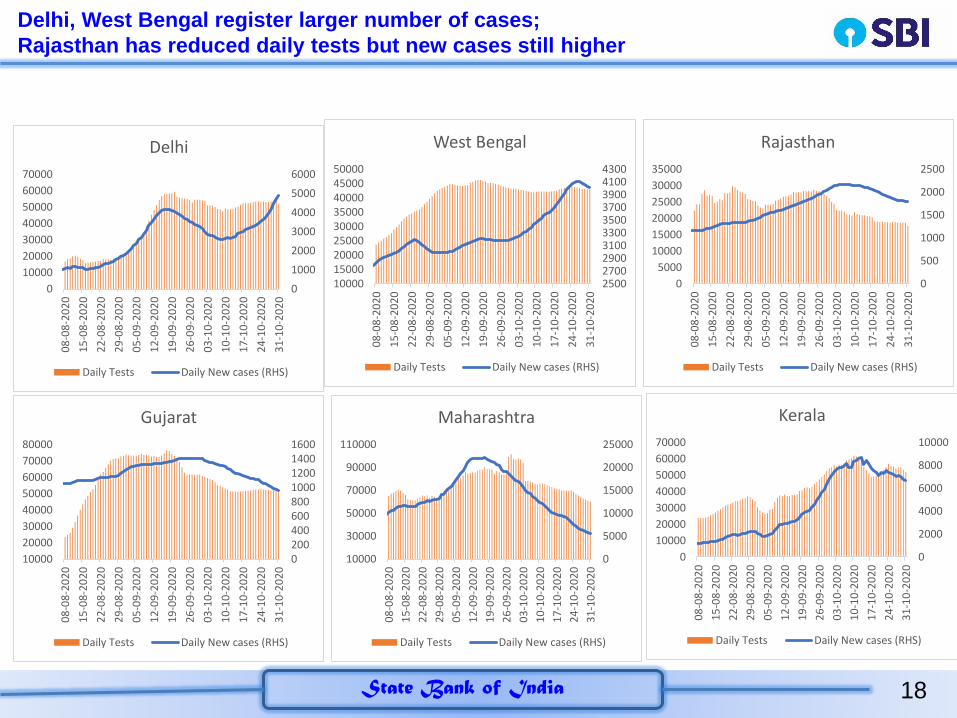
Delhi, West Bengal register larger number of cases;
Rajasthan has reduced daily tests but new cases still higher
0
1000
2000
3000
4000
5000
6000
0
10000
20000
30000
40000
50000
60000
70000
08
-08
-20
20
15
-08
-20
20
22
-08
-20
20
29
-08
-20
20
05
-09
-20
20
12
-09
-20
20
19
-09
-20
20
26
-09
-20
20
03
-10
-20
20
10
-10
-20
20
17
-10
-20
20
24
-10
-20
20
31
-10
-20
20
Delhi
Daily Tests Daily New cases (RHS)
02004006008001000120014001600
10000
20000
30000
40000
50000
60000
70000
80000
08
-08
-20
20
15
-08
-20
20
22
-08
-20
20
29
-08
-20
20
05
-09
-20
20
12
-09
-20
20
19
-09
-20
20
26
-09
-20
20
03
-10
-20
20
10
-10
-20
20
17
-10
-20
20
24
-10
-20
20
31
-10
-20
20
Gujarat
Daily Tests Daily New cases (RHS)
0
5000
10000
15000
20000
25000
10000
30000
50000
70000
90000
110000
08
-08
-20
20
15
-08
-20
20
22
-08
-20
20
29
-08
-20
20
05
-09
-20
20
12
-09
-20
20
19
-09
-20
20
26
-09
-20
20
03
-10
-20
20
10
-10
-20
20
17
-10
-20
20
24
-10
-20
20
31
-10
-20
20
Maharashtra
Daily Tests Daily New cases (RHS)
0
2000
4000
6000
8000
10000
0
10000
20000
30000
40000
50000
60000
70000
08
-08
-20
20
15
-08
-20
20
22
-08
-20
20
29
-08
-20
20
05
-09
-20
20
12
-09
-20
20
19
-09
-20
20
26
-09
-20
20
03
-10
-20
20
10
-10
-20
20
17
-10
-20
20
24
-10
-20
20
31
-10
-20
20
Kerala
Daily Tests Daily New cases (RHS)
2500270029003100330035003700390041004300
100001500020000250003000035000400004500050000
08
-08
-20
20
15
-08
-20
20
22
-08
-20
20
29
-08
-20
20
05
-09
-20
20
12
-09
-20
20
19
-09
-20
20
26
-09
-20
20
03
-10
-20
20
10
-10
-20
20
17
-10
-20
20
24
-10
-20
20
31
-10
-20
20
West Bengal
Daily Tests Daily New cases (RHS)
0
500
1000
1500
2000
2500
0
5000
10000
15000
20000
25000
30000
35000
08
-08
-20
20
15
-08
-20
20
22
-08
-20
20
29
-08
-20
20
05
-09
-20
20
12
-09
-20
20
19
-09
-20
20
26
-09
-20
20
03
-10
-20
20
10
-10
-20
20
17
-10
-20
20
24
-10
-20
20
31
-10
-20
20
Rajasthan
Daily Tests Daily New cases (RHS)
19State Bank of India
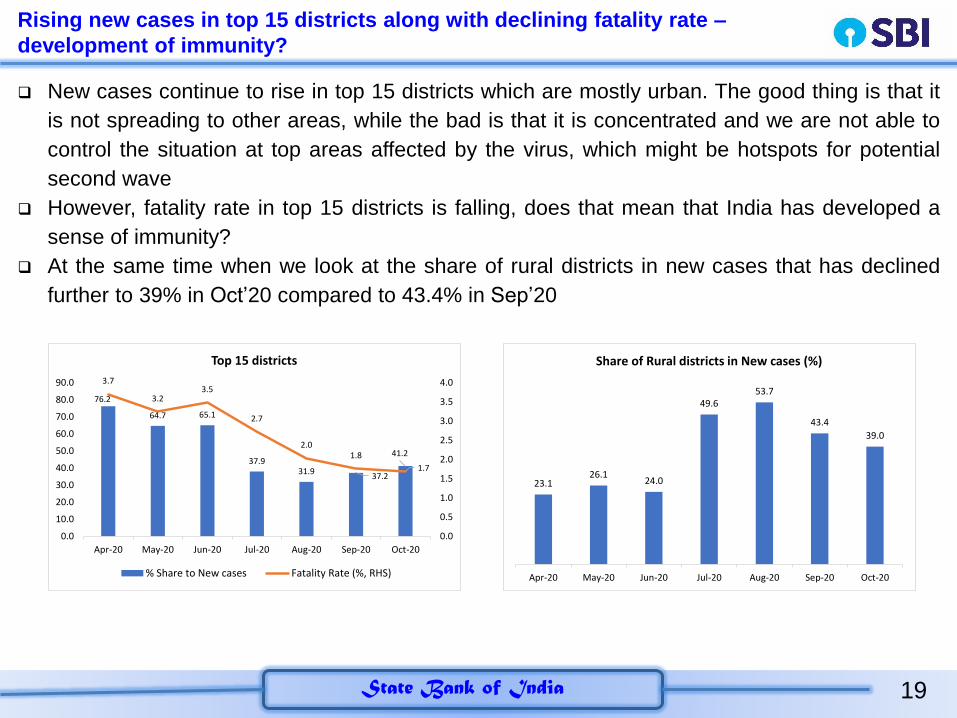
Rising new cases in top 15 districts along with declining fatality rate –
development of immunity?
New cases continue to rise in top 15 districts which are mostly urban. The good thing is that it
is not spreading to other areas, while the bad is that it is concentrated and we are not able to
control the situation at top areas affected by the virus, which might be hotspots for potential
second wave
However, fatality rate in top 15 districts is falling, does that mean that India has developed a
sense of immunity?
At the same time when we look at the share of rural districts in new cases that has declined
further to 39% in Oct’20 compared to 43.4% in Sep’20
23.126.1
24.0
49.653.7
43.4
39.0
Apr-20 May-20 Jun-20 Jul-20 Aug-20 Sep-20 Oct-20
Share of Rural districts in New cases (%)
76.2
64.7 65.1
37.931.9
37.2
41.2
3.7
3.23.5
2.7
2.01.8
1.7
0.0
0.5
1.0
1.5
2.0
2.5
3.0
3.5
4.0
0.0
10.0
20.0
30.0
40.0
50.0
60.0
70.0
80.0
90.0
Apr-20 May-20 Jun-20 Jul-20 Aug-20 Sep-20 Oct-20
Top 15 districts
% Share to New cases Fatality Rate (%, RHS)

20State Bank of India
Behavioural changes amidst
current COVID reveal remarkable
resemblance from 1665 London
Plague
21State Bank of India
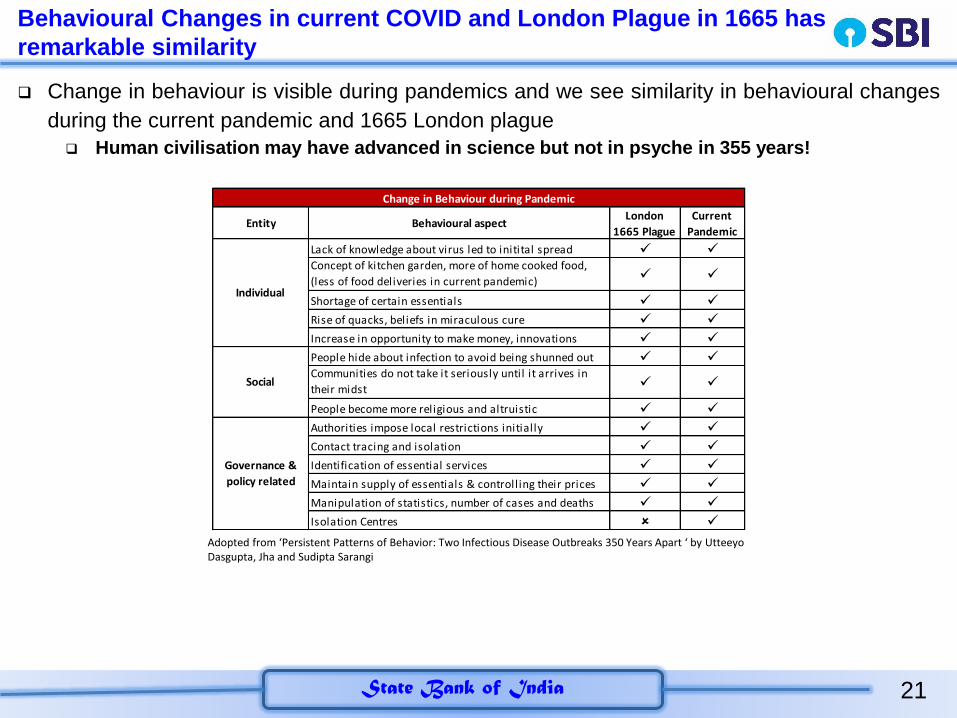
Behavioural Changes in current COVID and London Plague in 1665 has
remarkable similarity
Change in behaviour is visible during pandemics and we see similarity in behavioural changes
during the current pandemic and 1665 London plague
Human civilisation may have advanced in science but not in psyche in 355 years!
Entity Behavioural aspectLondon
1665 Plague
Current
Pandemic
Lack of knowledge about virus led to initital spread
Concept of kitchen garden, more of home cooked food,
(less of food deliveries in current pandemic)
Shortage of certain essentials
Rise of quacks, beliefs in miraculous cure
Increase in opportunity to make money, innovations
People hide about infection to avoid being shunned out
Communities do not take it seriously until it arrives in
their midst
People become more religious and altruistic
Authorities impose local restrictions initially
Contact tracing and isolation
Identification of essential services
Maintain supply of essentials & controlling their prices
Manipulation of statistics, number of cases and deaths
Isolation Centres
Change in Behaviour during Pandemic
Individual
Social
Governance &
policy related
Adopted from ‘Persistent Patterns of Behavior: Two Infectious Disease Outbreaks 350 Years Apart ‘ by UtteeyoDasgupta, Jha and Sudipta Sarangi
22State Bank of India
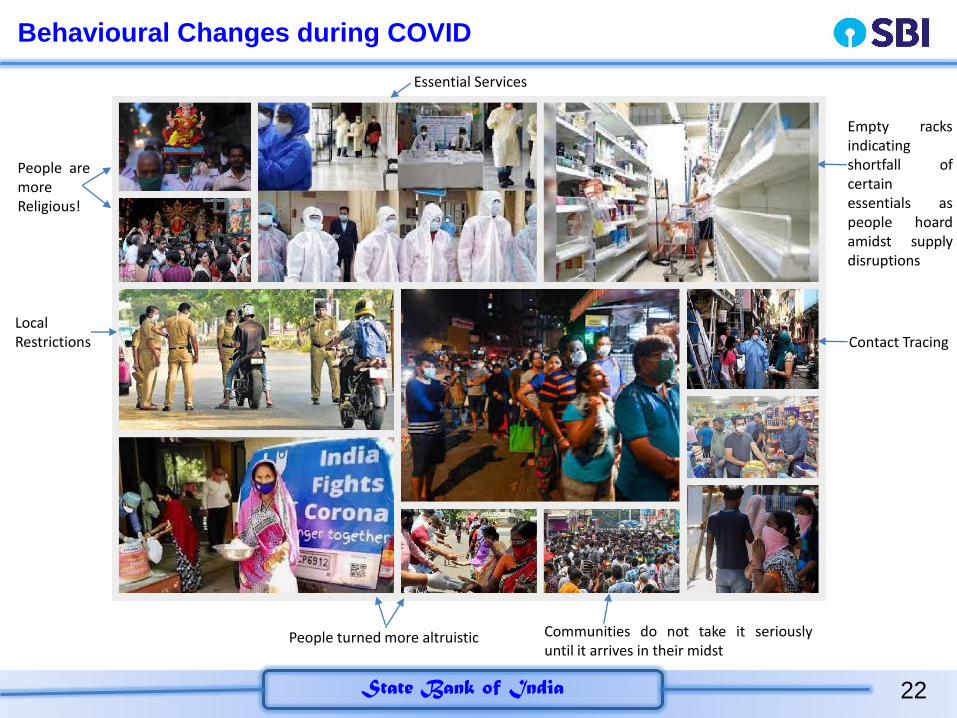
Behavioural Changes during COVID
Empty racksindicatingshortfall ofcertainessentials aspeople hoardamidst supplydisruptions
Contact Tracing
People turned more altruistic
People aremoreReligious!
LocalRestrictions
Essential Services
Communities do not take it seriouslyuntil it arrives in their midst
23State Bank of India
London 1665 and COVID 2020 both show emergence of quacks
Rise of quacks: Whenever a global epidemic disease occurs and medical science has no cure
for such afflictions, then quacks come on the scene claiming to offer sure cure of the dreaded
diseases. Their way of treatment works by fluke. With vaccine yet to be come, desperate
patients are going to quacks and spiritual healers in large numbers to get their health restored
A number of instances have occurred in various states in current COVID
Recent news about quacks manufacturing Ayurveda and siddha medicines in Tamil Nadu
through without licensing using social media
In Ganjam district of Odisha people are resorting to quacks instead of going to hospitals in
fear of contracting Covid. They approach hospital only when they are extremely sick
In West Bengal where untrained people are providing generic medicines for minor
ailments. During the current pandemic also, advise is being given by such people
providing masks, sanitisers and telling them how to be safe
24State Bank of India
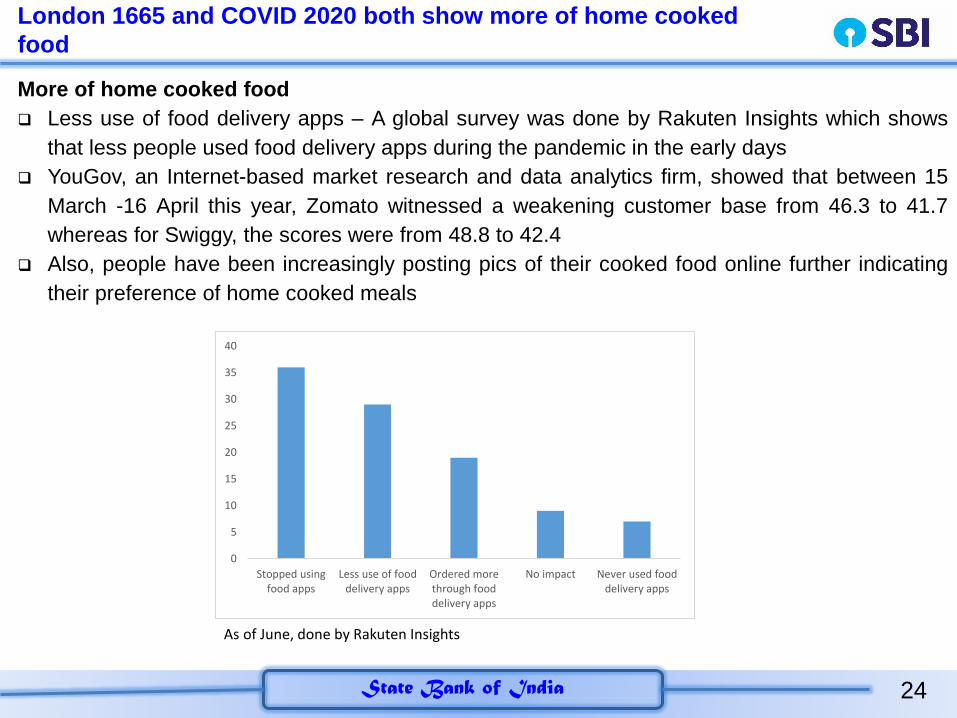
London 1665 and COVID 2020 both show more of home cooked
food
More of home cooked food
Less use of food delivery apps – A global survey was done by Rakuten Insights which shows
that less people used food delivery apps during the pandemic in the early days
YouGov, an Internet-based market research and data analytics firm, showed that between 15
March -16 April this year, Zomato witnessed a weakening customer base from 46.3 to 41.7
whereas for Swiggy, the scores were from 48.8 to 42.4
Also, people have been increasingly posting pics of their cooked food online further indicating
their preference of home cooked meals
0
5
10
15
20
25
30
35
40
Stopped usingfood apps
Less use of fooddelivery apps
Ordered morethrough fooddelivery apps
No impact Never used fooddelivery apps
As of June, done by Rakuten Insights
25State Bank of India
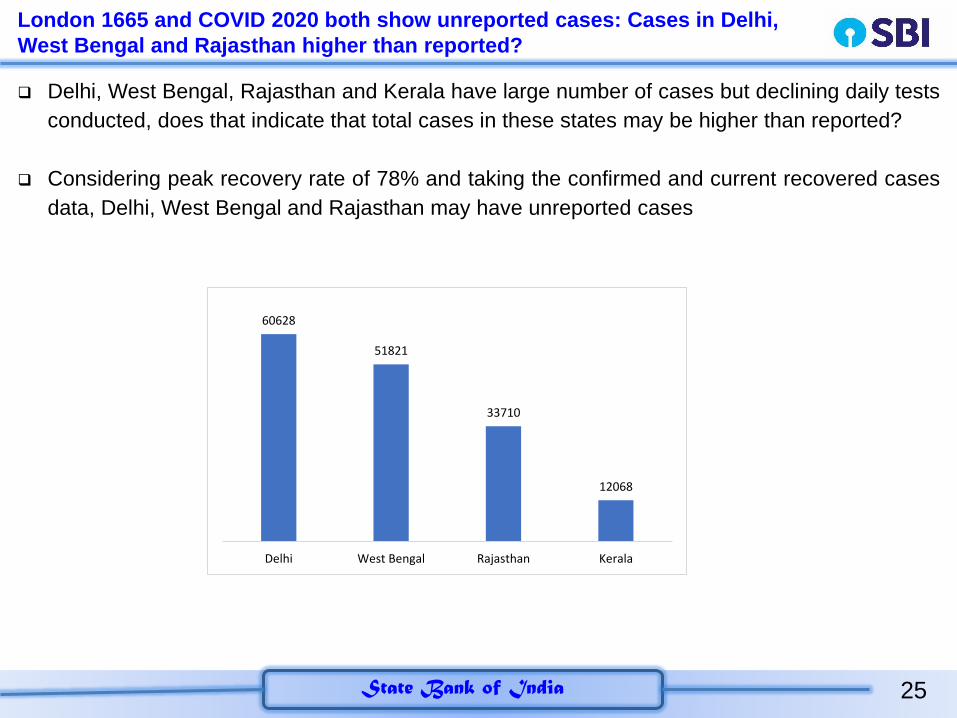
London 1665 and COVID 2020 both show unreported cases: Cases in Delhi,
West Bengal and Rajasthan higher than reported?
Delhi, West Bengal, Rajasthan and Kerala have large number of cases but declining daily tests
conducted, does that indicate that total cases in these states may be higher than reported?
Considering peak recovery rate of 78% and taking the confirmed and current recovered cases
data, Delhi, West Bengal and Rajasthan may have unreported cases
60628
51821
33710
12068
Delhi West Bengal Rajasthan Kerala
26State Bank of India
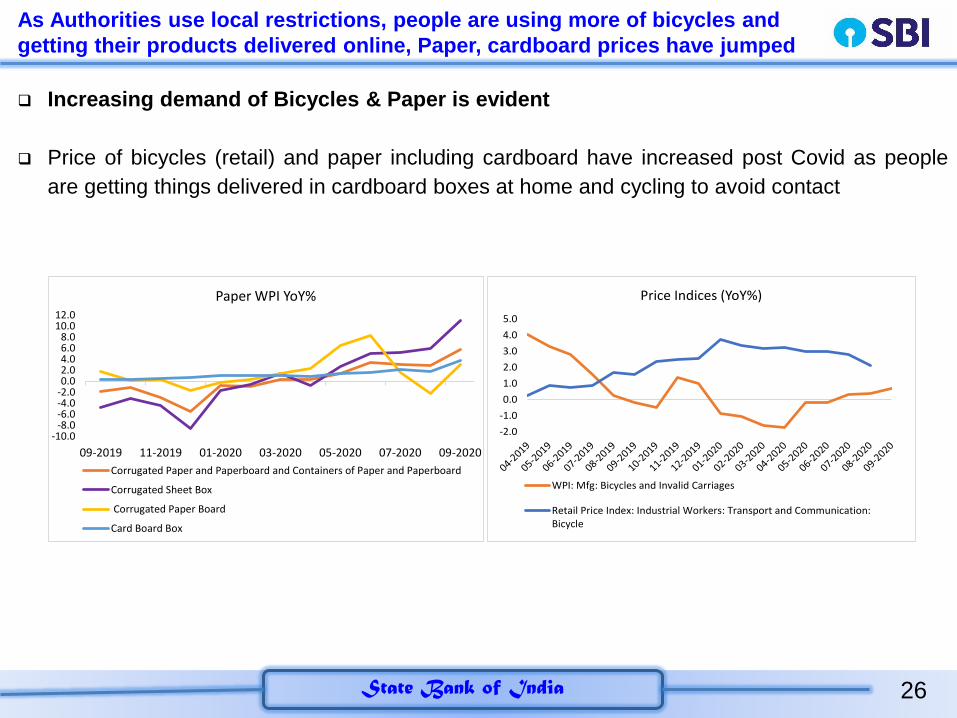
As Authorities use local restrictions, people are using more of bicycles and
getting their products delivered online, Paper, cardboard prices have jumped
-10.0-8.0-6.0-4.0-2.00.02.04.06.08.0
10.012.0
09-2019 11-2019 01-2020 03-2020 05-2020 07-2020 09-2020
Paper WPI YoY%
Corrugated Paper and Paperboard and Containers of Paper and Paperboard
Corrugated Sheet Box
Corrugated Paper Board
Card Board Box
-2.0
-1.0
0.0
1.0
2.0
3.0
4.0
5.0
Price Indices (YoY%)
WPI: Mfg: Bicycles and Invalid Carriages
Retail Price Index: Industrial Workers: Transport and Communication:Bicycle
Increasing demand of Bicycles & Paper is evident
Price of bicycles (retail) and paper including cardboard have increased post Covid as people
are getting things delivered in cardboard boxes at home and cycling to avoid contact
27State Bank of India
Economic Momentum in October
28State Bank of India
Digital Transactions are increasing…UPI is 1.7X of pre-Covid Levels
Number of
Cards (Lakh)
Total
Transaction (Rs Crore)
Per Card
Transaction (Rs)
Number of
Cards (Lakh)
Total
Transaction (Rs Crore)
Per Card
Transaction (Rs)
Nov-19 544 60130 11051 8308 77577 934
Dec-19 553 65736 11880 8053 83953 1042
Jan-20 561 66573 11863 8164 84575 1036
Feb-20 572 62148 10873 8230 80146 974
Mar-20 577 50574 8758 8286 65303 788
Apr-20 574 20765 3620 8294 29043 350
May-20 572 32225 5636 8353 48049 575
Jun-20 573 42773 7466 8454 62494 739
Jul-20 576 45558 7905 8524 66481 780
Aug-20 578 50311 8700 8587 71778 836
Per Credit and Debit Card Transaction
Month
Credit Cards Debit Cards
Source: RBI; SBI Research
29State Bank of India
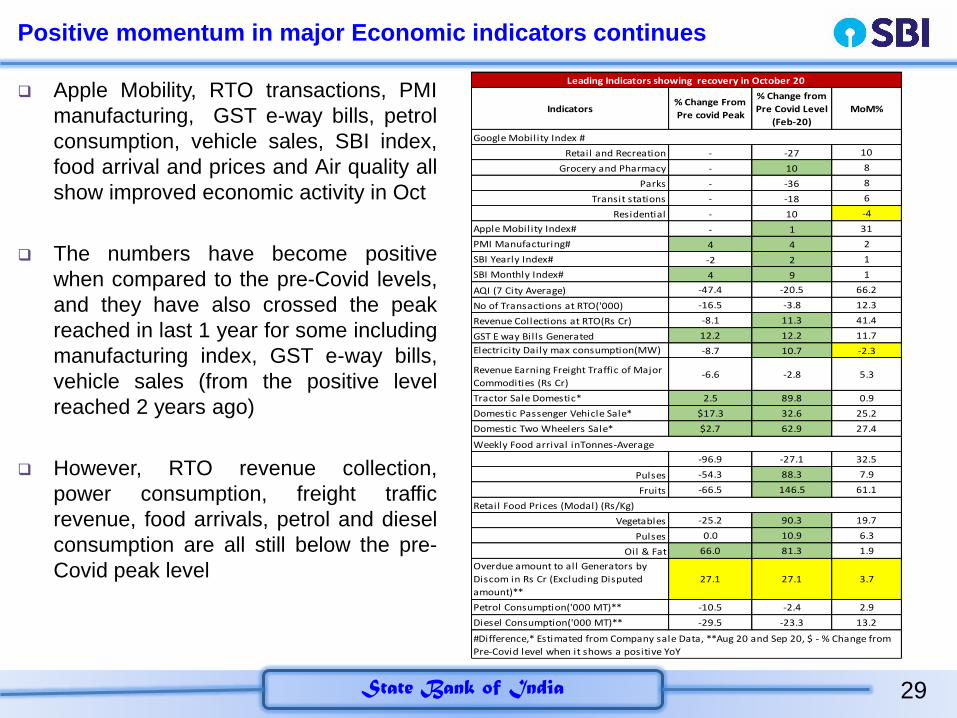
Positive momentum in major Economic indicators continues
Apple Mobility, RTO transactions, PMI
manufacturing, GST e-way bills, petrol
consumption, vehicle sales, SBI index,
food arrival and prices and Air quality all
show improved economic activity in Oct
The numbers have become positive
when compared to the pre-Covid levels,
and they have also crossed the peak
reached in last 1 year for some including
manufacturing index, GST e-way bills,
vehicle sales (from the positive level
reached 2 years ago)
However, RTO revenue collection,
power consumption, freight traffic
revenue, food arrivals, petrol and diesel
consumption are all still below the pre-
Covid peak level
Indicators% Change From
Pre covid Peak
% Change from
Pre Covid Level
(Feb-20)
MoM%
Retail and Recreation - -27 10
Grocery and Pharmacy - 10 8
Parks - -36 8
Transit stations - -18 6
Residential - 10 -4
Apple Mobility Index# - 1 31
PMI Manufacturing# 4 4 2
SBI Yearly Index# -2 2 1
SBI Monthly Index# 4 9 1
AQI (7 City Average) -47.4 -20.5 66.2
No of Transactions at RTO('000) -16.5 -3.8 12.3
Revenue Collections at RTO(Rs Cr) -8.1 11.3 41.4
GST E way Bills Generated 12.2 12.2 11.7
Electricity Daily max consumption(MW) -8.7 10.7 -2.3
Revenue Earning Freight Traffic of Major
Commodities (Rs Cr)-6.6 -2.8 5.3
Tractor Sale Domestic* 2.5 89.8 0.9
Domestic Passenger Vehicle Sale* $17.3 32.6 25.2
Domestic Two Wheelers Sale* $2.7 62.9 27.4
-96.9 -27.1 32.5
Pulses -54.3 88.3 7.9
Fruits -66.5 146.5 61.1
Vegetables -25.2 90.3 19.7
Pulses 0.0 10.9 6.3
Oil & Fat 66.0 81.3 1.9
Overdue amount to all Generators by
Discom in Rs Cr (Excluding Disputed
amount)**
27.1 27.1 3.7
Petrol Consumption('000 MT)** -10.5 -2.4 2.9
Diesel Consumption('000 MT)** -29.5 -23.3 13.2
#Difference,* Estimated from Company sale Data, **Aug 20 and Sep 20, $ - % Change from
Pre-Covid level when it shows a positive YoY
Leading Indicators showing recovery in October 20
Google Mobility Index #
Weekly Food arrival inTonnes-Average
Retail Food Prices (Modal) (Rs/Kg)
30State Bank of India
Business activity index continues its upward trend in Oct
SBI business activity index shows increase in economic activity with the current level already
around the level achieved in mid-March, though the latest week figure for 2 Nov’20 shows a
modest dip
Increase in % of leading indicators showing acceleration also strengthens improvement in
economic recovery
93.2
92.4
40.0
50.0
60.0
70.0
80.0
90.0
100.0
110.0
17
-Fe
b-2
0
02
-Mar
-20
16
-Mar
-20
30
-Mar
-20
13
-Ap
r-2
0
27
-Ap
r-2
0
11
-May
-20
25
-May
-20
08
-Ju
n-2
0
22
-Ju
n-2
0
06
-Ju
l-2
0
20
-Ju
l-2
0
03
-Au
g-2
0
17
-Au
g-2
0
31
-Au
g-2
0
14
-Se
p-2
0
28
-Se
p-2
0
12
-Oct
-20
26
-Oct
-20
Business Activity Index
31State Bank of India
SBI Index improves further
The yearly SBI Composite Index has gone above the psychological level of 50 and stood at
53.0 (Moderate Growth) in Oct’20, compared to 52.1 (Low Growth) in Sep’20 and 49.8 (Low
Decline) in Oct’19
The monthly index also increased to 59.3 (High Growth) in Oct’20, compared to 58.0 (High
Growth) in Sep’20 and 50.83 (Low Growth) in Oct’19
32State Bank of India
Rail Freight Earnings continues to increase in Oct
Rail freight earnings continues to increase across segments, except for foodgrain, flours and pulsesin Oct’20 compared to Sep’20
However, in H1 FY21 only foodgrains, flours and pulses show significant positive yoy growth
Freight Earnings account for around 65% of the gross traffic receipts of Railways with passengerfreight accounting for the remaining, thus improving dynamics is good for Railways
Commodity H1FY21 H1FY20
Change in
H1FY21 Over
H1FY20 (%)
Sep-20 Oct-20 MoM%
CEMENT AND CLINKER 3,821.8 4,430.1 -13.7 822.3 942.7 14.6
CHEMICAL MANURES 3,275.5 3,271.9 0.1 677.2 725.8 7.2
COAL AND COKE 20,459.9 29,957.9 -31.7 4,011.3 4,339.0 8.2
CONTAINER 2,491.0 3,035.2 -17.9 479.6 499.2 4.1
FOODGRAINS, FLOURS AND PULSES 5,374.2 3,374.9 59.2 979.5 688.6 -29.7
IRON OR STEEL 2,805.3 3,657.2 -23.3 624.4 635.5 1.8
MINERALS AND ORES 6,503.6 6,929.2 -6.1 1,274.5 1,511.0 18.6
OTHERS* 2,814.7 2,804.5 0.4 572.1 543.8 -4.9
PETROLEUM PRODUCTS AND GASES 2,602.8 2,868.3 -9.3 460.0 545.7 18.6
Total 50,148.8 60,329.2 -16.9 9,900.9 10,431.1 5.4
Rail Freight Earnings (Rs Cr)
Source: Rail Dhrishti,*Bricks & stones ,sugar,salt,metal scrap & pig iron, hydrogenated & edible oil and
other miscellaneous commodities
33State Bank of India
Vehicle Sales continue to increase in Oct across companies;
registration of Passenger vehicles and trucks positive in Oct
Auto sales data reveal higher growth in Oct compared to last month. Even yoy growthremained robust for key players
Compact segment continues to show robust growth
Vehicle registration data shows positive yoy growth for tractors only in H1 FY21, mom showsincrease in Passenger Vehicle and Trucks
Manufacturer Oct-20 Oct-19 Sep-20 MoM% YoY%
Maruti Suzuki 163656 139121 147900 10.7 17.6
Hyundai 56605 50010 50200 12.8 13.2
Tata Motors 23600 13169 21200 11.3 79.2
Kia Motors India 21021 12854 18676 12.6 63.5
Mahindra 18622 18460 14800 25.8 0.9
Toyota 12373 11866 8116 52.5 4.3
Renault 11005 11516 8805 25.0 -4.4
Honda 10836 10010 10199 6.2 8.3
Ford 7084 7017 5765 22.9 1.0
MG Motor India 3750 3536 2537 47.8 6.1
Volkswagen India 2054 3213 2050 0.2 -36.1
Skoda Auto India 1421 1378 1312 8.3 3.1
Nissan India 983 1581 780 26.0 -37.8
Fiat 832 854 554 50.2 -2.6
Auto Sale in October
Category H1FY21 H1FY20H1FY21 Over
H1FY20 (%)Sep-20 Oct-20 MoM%
Two wheeler 40,58,836 79,13,956 -48.7 10,20,258 10,11,484 -0.9
Three Wheelers 80,437 3,20,760 -74.9 24,088 22,039 -8.5
PV(Light and Medium) 9,64,751 15,30,541 -37.0 2,60,534 2,91,717 12.0
Trucks 12,914 1,12,368 -88.5 5,247 7,166 36.6
Bus 2,265 13,091 -82.7 197 168 -14.7
Tractors 2,71,057 2,61,422 3.7 68,351 52,961 -22.5
Vehicle Registration
Source: CMIE, Vahan Dashboard
Category Segments Sep-20 Oct-20 Oct-19 % YoY % MoM
Mini (Alto, S-Presso, Old
WagonR)27,246 28,462 28537 -0.3 4.5
Compact (Swift, Celerio, Dzire,
Baleno,Ignis, new Wagon R)84213 95067 75094 26.6 12.9
Mid-size (Ciaz) 1,534 1,422 2371 -40.0 -7.3
UVs (Gypsy, Ertiga, S- Cross,
Vitara Brezza, XL6)23699 25396 23108 9.9 7.2
Vans (Omni, Eeco) 11,220 13,309 10011 32.9 18.6
Total Domestic Passenger
Vehicle Sale147912 163656 139121 17.6 10.6
LCV (Super Carry) 2128 3169 2429 30.5 48.9
Domestic Sales (Maruti Suzuki) 1,50,040 1,66,825 1,41,550 17.9 11.2
Sales to other OEM: Compact 2568 6037 2727 121.4 135.1
Total domestic sales 1,52,608 1,72,862 144277 19.8 13.3
Exports 7834 9586 9158 4.7 22.4
Overall Sales 1,60,442 1,82,448 153435 18.9 13.7
Maruti Suzuki: October2020 Sales
34State Bank of India
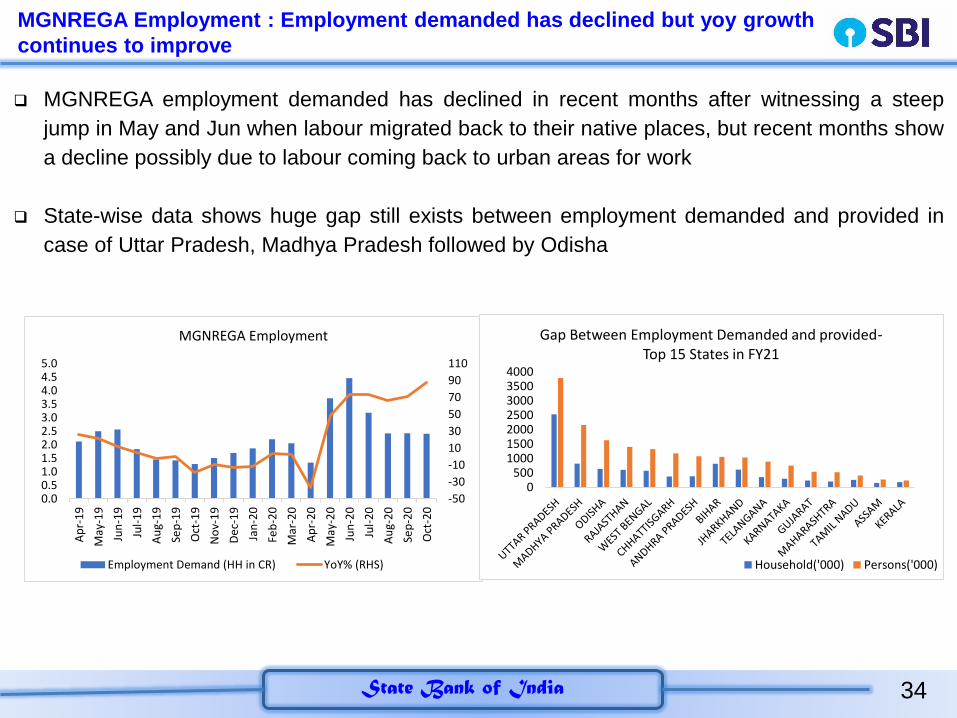
MGNREGA Employment : Employment demanded has declined but yoy growth
continues to improve
MGNREGA employment demanded has declined in recent months after witnessing a steep
jump in May and Jun when labour migrated back to their native places, but recent months show
a decline possibly due to labour coming back to urban areas for work
State-wise data shows huge gap still exists between employment demanded and provided in
case of Uttar Pradesh, Madhya Pradesh followed by Odisha
-50
-30
-10
10
30
50
70
90
110
0.00.51.01.52.02.53.03.54.04.55.0
Ap
r-1
9
May
-19
Jun
-19
Jul-
19
Au
g-1
9
Sep
-19
Oct
-19
No
v-1
9
De
c-1
9
Jan
-20
Feb
-20
Mar
-20
Ap
r-2
0
May
-20
Jun
-20
Jul-
20
Au
g-2
0
Sep
-20
Oct
-20
MGNREGA Employment
Employment Demand (HH in CR) YoY% (RHS)
0500
1000150020002500300035004000
Gap Between Employment Demanded and provided-Top 15 States in FY21
Household('000) Persons('000)
35State Bank of India
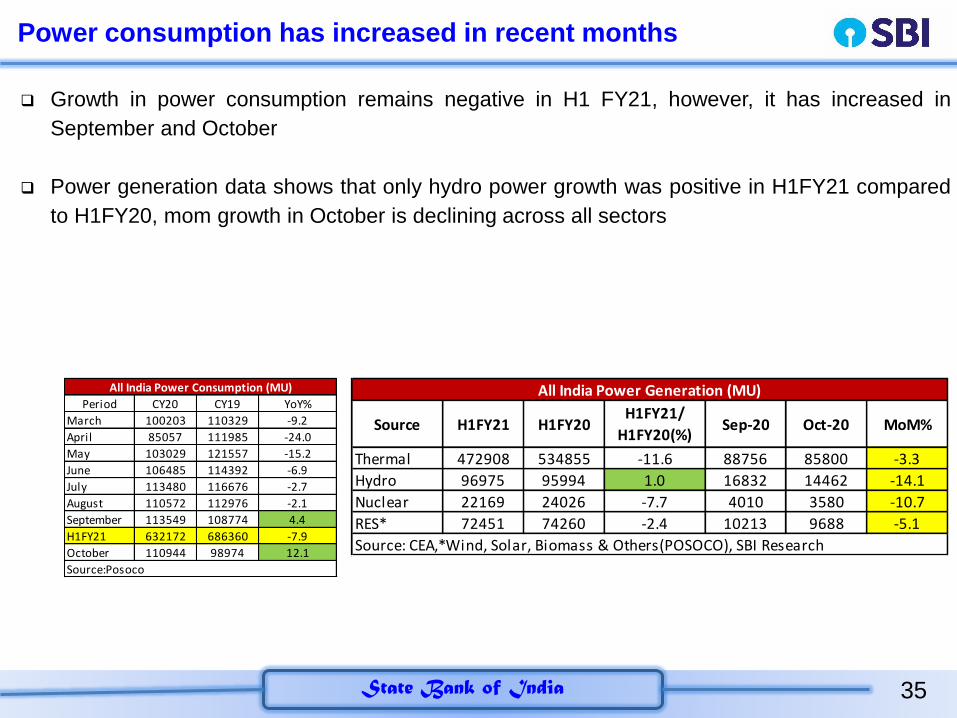
Power consumption has increased in recent months
Growth in power consumption remains negative in H1 FY21, however, it has increased in
September and October
Power generation data shows that only hydro power growth was positive in H1FY21 compared
to H1FY20, mom growth in October is declining across all sectors
Period CY20 CY19 YoY%
March 100203 110329 -9.2
April 85057 111985 -24.0
May 103029 121557 -15.2
June 106485 114392 -6.9
July 113480 116676 -2.7
August 110572 112976 -2.1
September 113549 108774 4.4
H1FY21 632172 686360 -7.9
October 110944 98974 12.1
All India Power Consumption (MU)
Source:Posoco
Source H1FY21 H1FY20H1FY21/
H1FY20(%)Sep-20 Oct-20 MoM%
Thermal 472908 534855 -11.6 88756 85800 -3.3
Hydro 96975 95994 1.0 16832 14462 -14.1
Nuclear 22169 24026 -7.7 4010 3580 -10.7
RES* 72451 74260 -2.4 10213 9688 -5.1
All India Power Generation (MU)
Source: CEA,*Wind, Solar, Biomass & Others(POSOCO), SBI Research
36State Bank of India
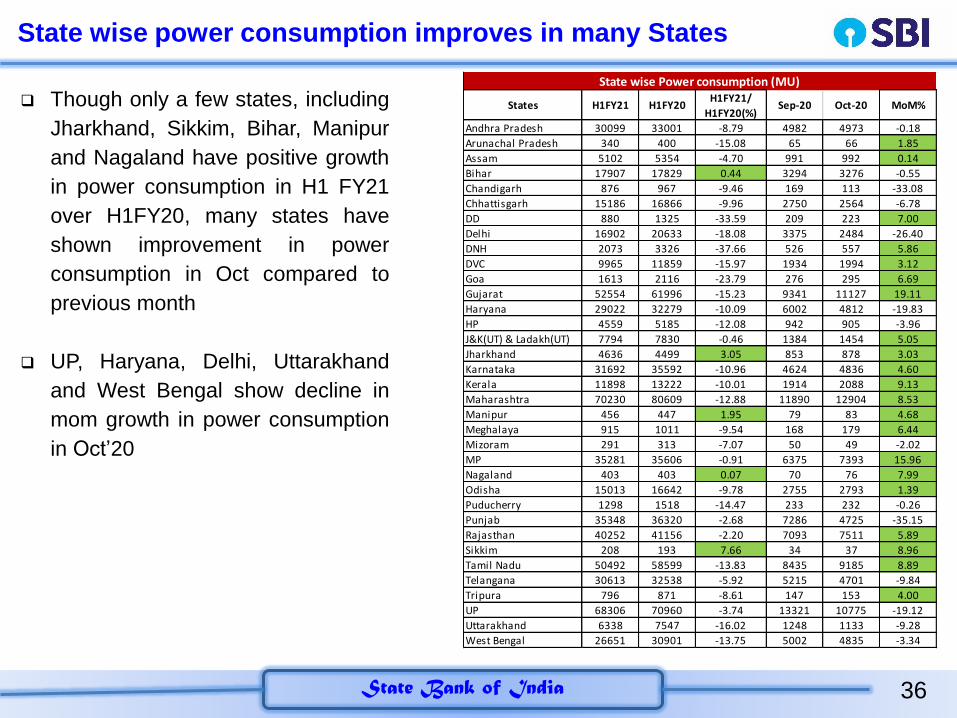
State wise power consumption improves in many States
Though only a few states, including
Jharkhand, Sikkim, Bihar, Manipur
and Nagaland have positive growth
in power consumption in H1 FY21
over H1FY20, many states have
shown improvement in power
consumption in Oct compared to
previous month
UP, Haryana, Delhi, Uttarakhand
and West Bengal show decline in
mom growth in power consumption
in Oct’20
States H1FY21 H1FY20H1FY21/
H1FY20(%)Sep-20 Oct-20 MoM%
Andhra Pradesh 30099 33001 -8.79 4982 4973 -0.18
Arunachal Pradesh 340 400 -15.08 65 66 1.85
Assam 5102 5354 -4.70 991 992 0.14
Bihar 17907 17829 0.44 3294 3276 -0.55
Chandigarh 876 967 -9.46 169 113 -33.08
Chhattisgarh 15186 16866 -9.96 2750 2564 -6.78
DD 880 1325 -33.59 209 223 7.00
Delhi 16902 20633 -18.08 3375 2484 -26.40
DNH 2073 3326 -37.66 526 557 5.86
DVC 9965 11859 -15.97 1934 1994 3.12
Goa 1613 2116 -23.79 276 295 6.69
Gujarat 52554 61996 -15.23 9341 11127 19.11
Haryana 29022 32279 -10.09 6002 4812 -19.83
HP 4559 5185 -12.08 942 905 -3.96
J&K(UT) & Ladakh(UT) 7794 7830 -0.46 1384 1454 5.05
Jharkhand 4636 4499 3.05 853 878 3.03
Karnataka 31692 35592 -10.96 4624 4836 4.60
Kerala 11898 13222 -10.01 1914 2088 9.13
Maharashtra 70230 80609 -12.88 11890 12904 8.53
Manipur 456 447 1.95 79 83 4.68
Meghalaya 915 1011 -9.54 168 179 6.44
Mizoram 291 313 -7.07 50 49 -2.02
MP 35281 35606 -0.91 6375 7393 15.96
Nagaland 403 403 0.07 70 76 7.99
Odisha 15013 16642 -9.78 2755 2793 1.39
Puducherry 1298 1518 -14.47 233 232 -0.26
Punjab 35348 36320 -2.68 7286 4725 -35.15
Rajasthan 40252 41156 -2.20 7093 7511 5.89
Sikkim 208 193 7.66 34 37 8.96
Tamil Nadu 50492 58599 -13.83 8435 9185 8.89
Telangana 30613 32538 -5.92 5215 4701 -9.84
Tripura 796 871 -8.61 147 153 4.00
UP 68306 70960 -3.74 13321 10775 -19.12
Uttarakhand 6338 7547 -16.02 1248 1133 -9.28
West Bengal 26651 30901 -13.75 5002 4835 -3.34
State wise Power consumption (MU)
37State Bank of India
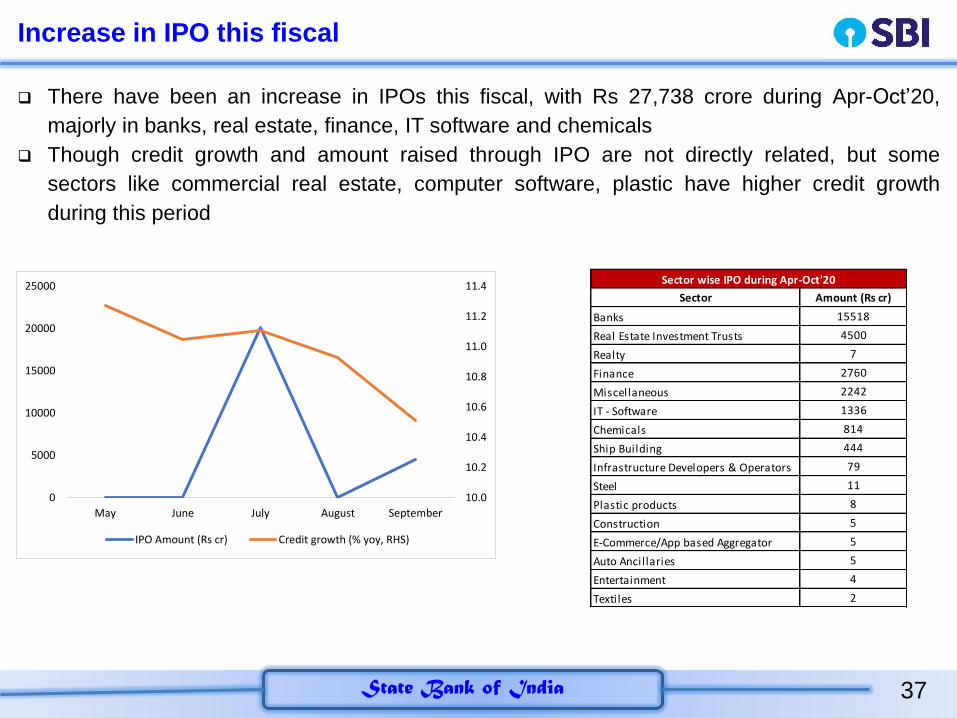
Increase in IPO this fiscal
There have been an increase in IPOs this fiscal, with Rs 27,738 crore during Apr-Oct’20,
majorly in banks, real estate, finance, IT software and chemicals
Though credit growth and amount raised through IPO are not directly related, but some
sectors like commercial real estate, computer software, plastic have higher credit growth
during this period
10.0
10.2
10.4
10.6
10.8
11.0
11.2
11.4
0
5000
10000
15000
20000
25000
May June July August September
IPO Amount (Rs cr) Credit growth (% yoy, RHS)
Sector Amount (Rs cr)
Banks 15518
Real Estate Investment Trusts 4500
Realty 7
Finance 2760
Miscellaneous 2242
IT - Software 1336
Chemicals 814
Ship Building 444
Infrastructure Developers & Operators 79
Steel 11
Plastic products 8
Construction 5
E-Commerce/App based Aggregator 5
Auto Ancillaries 5
Entertainment 4
Textiles 2
Sector wise IPO during Apr-Oct'20
38State Bank of India
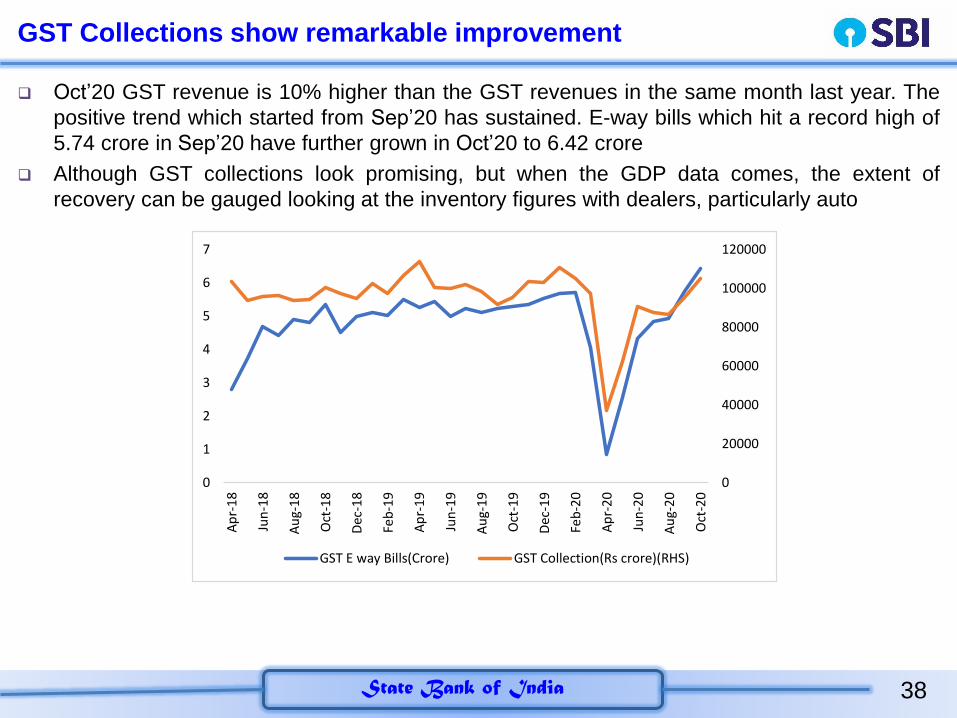
GST Collections show remarkable improvement
Oct’20 GST revenue is 10% higher than the GST revenues in the same month last year. The
positive trend which started from Sep’20 has sustained. E-way bills which hit a record high of
5.74 crore in Sep’20 have further grown in Oct’20 to 6.42 crore
Although GST collections look promising, but when the GDP data comes, the extent of
recovery can be gauged looking at the inventory figures with dealers, particularly auto
0
20000
40000
60000
80000
100000
120000
0
1
2
3
4
5
6
7A
pr-
18
Jun
-18
Au
g-1
8
Oct
-18
Dec
-18
Feb
-19
Ap
r-1
9
Jun
-19
Au
g-1
9
Oct
-19
Dec
-19
Feb
-20
Ap
r-2
0
Jun
-20
Au
g-2
0
Oct
-20
GST E way Bills(Crore) GST Collection(Rs crore)(RHS)
39State Bank of India
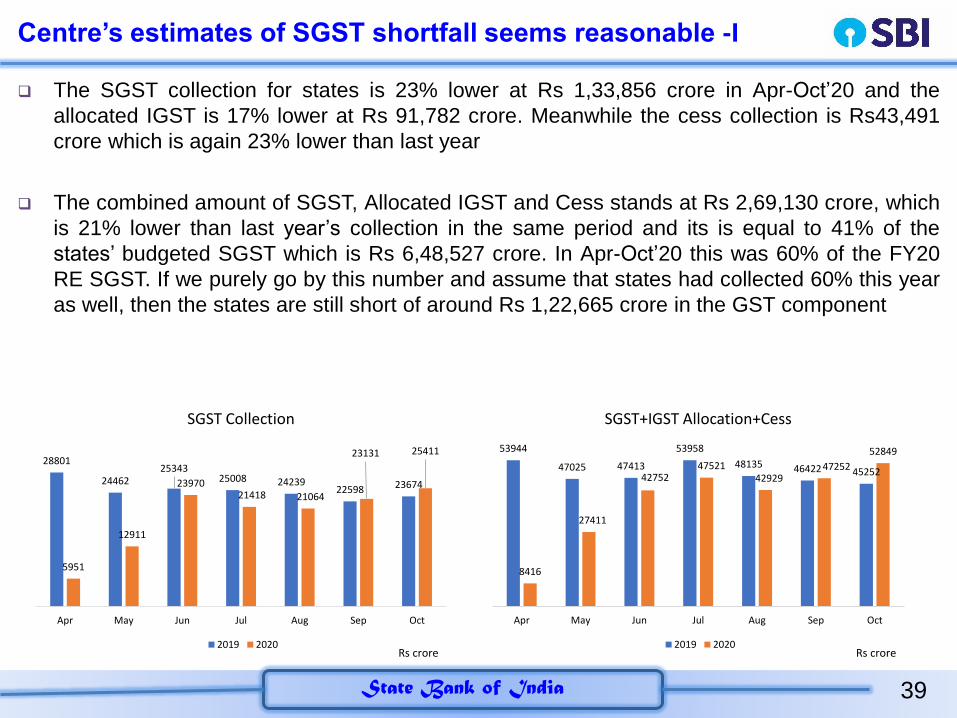
Centre’s estimates of SGST shortfall seems reasonable -I
The SGST collection for states is 23% lower at Rs 1,33,856 crore in Apr-Oct’20 and the
allocated IGST is 17% lower at Rs 91,782 crore. Meanwhile the cess collection is Rs43,491
crore which is again 23% lower than last year
The combined amount of SGST, Allocated IGST and Cess stands at Rs 2,69,130 crore, which
is 21% lower than last year’s collection in the same period and its is equal to 41% of the
states’ budgeted SGST which is Rs 6,48,527 crore. In Apr-Oct’20 this was 60% of the FY20
RE SGST. If we purely go by this number and assume that states had collected 60% this year
as well, then the states are still short of around Rs 1,22,665 crore in the GST component
28801
2446225343
25008 2423922598 23674
5951
12911
2397021418 21064
23131 25411
Apr May Jun Jul Aug Sep Oct
SGST Collection
2019 2020Rs crore
53944
47025 47413
53958
48135 46422 45252
8416
27411
4275247521
4292947252
52849
Apr May Jun Jul Aug Sep Oct
SGST+IGST Allocation+Cess
2019 2020Rs crore
40State Bank of India
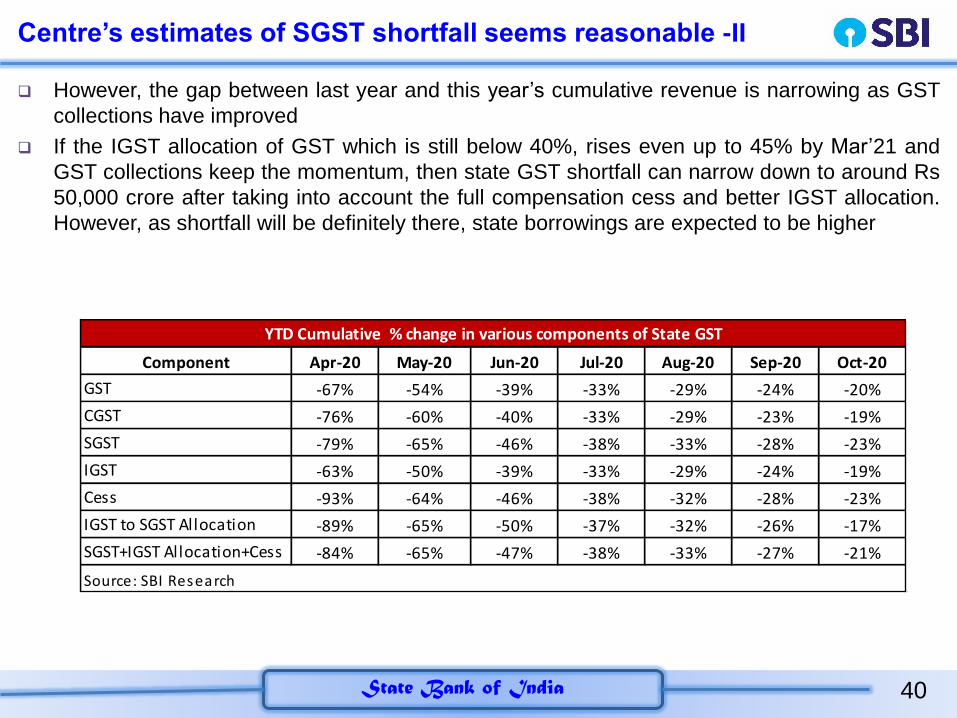
Centre’s estimates of SGST shortfall seems reasonable -II
However, the gap between last year and this year’s cumulative revenue is narrowing as GST
collections have improved
If the IGST allocation of GST which is still below 40%, rises even up to 45% by Mar’21 and
GST collections keep the momentum, then state GST shortfall can narrow down to around Rs
50,000 crore after taking into account the full compensation cess and better IGST allocation.
However, as shortfall will be definitely there, state borrowings are expected to be higher
Component Apr-20 May-20 Jun-20 Jul-20 Aug-20 Sep-20 Oct-20
GST -67% -54% -39% -33% -29% -24% -20%
CGST -76% -60% -40% -33% -29% -23% -19%
SGST -79% -65% -46% -38% -33% -28% -23%
IGST -63% -50% -39% -33% -29% -24% -19%
Cess -93% -64% -46% -38% -32% -28% -23%
IGST to SGST Allocation -89% -65% -50% -37% -32% -26% -17%
SGST+IGST Allocation+Cess -84% -65% -47% -38% -33% -27% -21%
YTD Cumulative % change in various components of State GST
Source: SBI Research
41State Bank of India
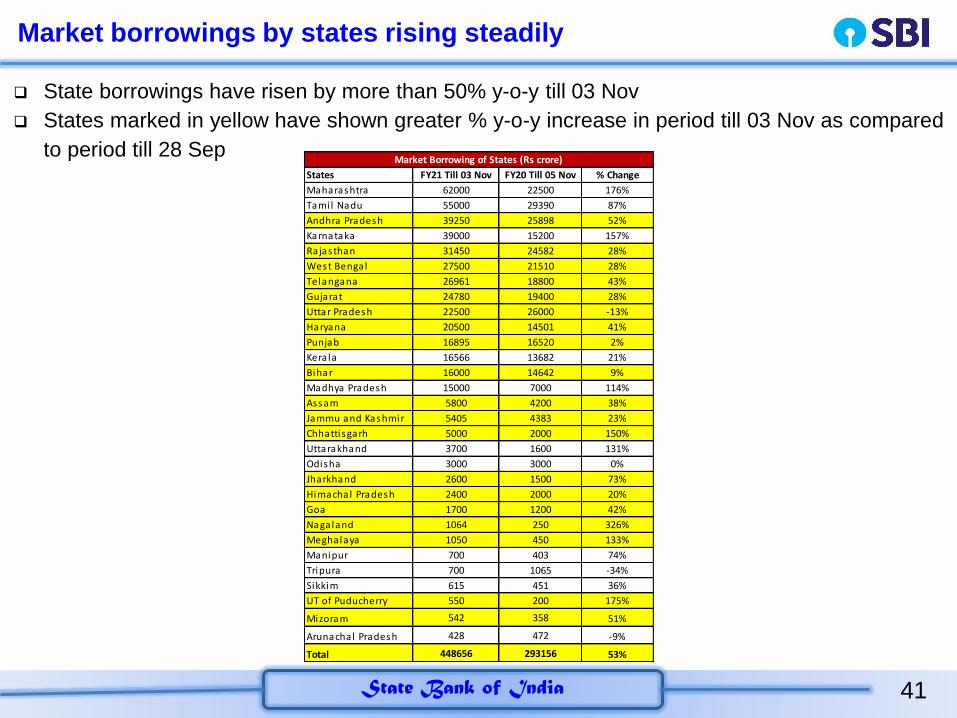
Market borrowings by states rising steadily
States FY21 Till 03 Nov FY20 Till 05 Nov % Change
Maharashtra 62000 22500 176%
Tami l Nadu 55000 29390 87%
Andhra Pradesh 39250 25898 52%
Karnataka 39000 15200 157%
Rajasthan 31450 24582 28%
West Bengal 27500 21510 28%
Telangana 26961 18800 43%
Gujarat 24780 19400 28%
Uttar Pradesh 22500 26000 -13%
Haryana 20500 14501 41%
Punjab 16895 16520 2%
Kera la 16566 13682 21%
Bihar 16000 14642 9%
Madhya Pradesh 15000 7000 114%
Assam 5800 4200 38%
Jammu and Kashmir 5405 4383 23%
Chhattisgarh 5000 2000 150%
Uttarakhand 3700 1600 131%
Odisha 3000 3000 0%
Jharkhand 2600 1500 73%
Himachal Pradesh 2400 2000 20%
Goa 1700 1200 42%
Nagaland 1064 250 326%
Meghalaya 1050 450 133%
Manipur 700 403 74%
Tripura 700 1065 -34%
Sikkim 615 451 36%
UT of Puducherry 550 200 175%
Mizoram 542 358 51%
Arunachal Pradesh 428 472 -9%
Total 448656 293156 53%
Market Borrowing of States (Rs crore)
State borrowings have risen by more than 50% y-o-y till 03 Nov
States marked in yellow have shown greater % y-o-y increase in period till 03 Nov as compared
to period till 28 Sep
42State Bank of India
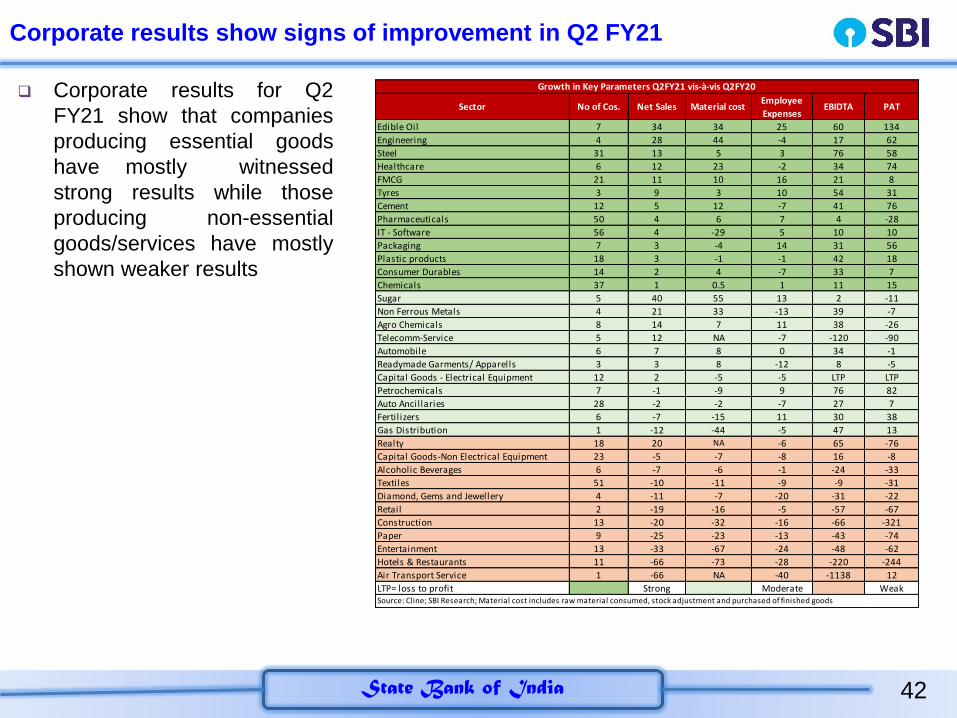
Corporate results show signs of improvement in Q2 FY21
Sector No of Cos. Net Sales Material costEmployee
ExpensesEBIDTA PAT
Edible Oil 7 34 34 25 60 134
Engineering 4 28 44 -4 17 62
Steel 31 13 5 3 76 58
Healthcare 6 12 23 -2 34 74
FMCG 21 11 10 16 21 8
Tyres 3 9 3 10 54 31
Cement 12 5 12 -7 41 76
Pharmaceuticals 50 4 6 7 4 -28
IT - Software 56 4 -29 5 10 10
Packaging 7 3 -4 14 31 56
Plastic products 18 3 -1 -1 42 18
Consumer Durables 14 2 4 -7 33 7
Chemicals 37 1 0.5 1 11 15
Sugar 5 40 55 13 2 -11
Non Ferrous Metals 4 21 33 -13 39 -7
Agro Chemicals 8 14 7 11 38 -26
Telecomm-Service 5 12 NA -7 -120 -90
Automobile 6 7 8 0 34 -1
Readymade Garments/ Apparells 3 3 8 -12 8 -5
Capital Goods - Electrical Equipment 12 2 -5 -5 LTP LTP
Petrochemicals 7 -1 -9 9 76 82
Auto Ancillaries 28 -2 -2 -7 27 7
Fertil izers 6 -7 -15 11 30 38
Gas Distribution 1 -12 -44 -5 47 13
Realty 18 20 NA -6 65 -76
Capital Goods-Non Electrical Equipment 23 -5 -7 -8 16 -8
Alcoholic Beverages 6 -7 -6 -1 -24 -33
Textiles 51 -10 -11 -9 -9 -31
Diamond, Gems and Jewellery 4 -11 -7 -20 -31 -22
Retail 2 -19 -16 -5 -57 -67
Construction 13 -20 -32 -16 -66 -321
Paper 9 -25 -23 -13 -43 -74
Entertainment 13 -33 -67 -24 -48 -62
Hotels & Restaurants 11 -66 -73 -28 -220 -244
Air Transport Service 1 -66 NA -40 -1138 12
LTP= loss to profit Strong Moderate Weak
Growth in Key Parameters Q2FY21 vis-à-vis Q2FY20
Source: Cline; SBI Research; Material cost includes raw material consumed, stock adjustment and purchased of finished goods
Corporate results for Q2
FY21 show that companies
producing essential goods
have mostly witnessed
strong results while those
producing non-essential
goods/services have mostly
shown weaker results
43State Bank of India
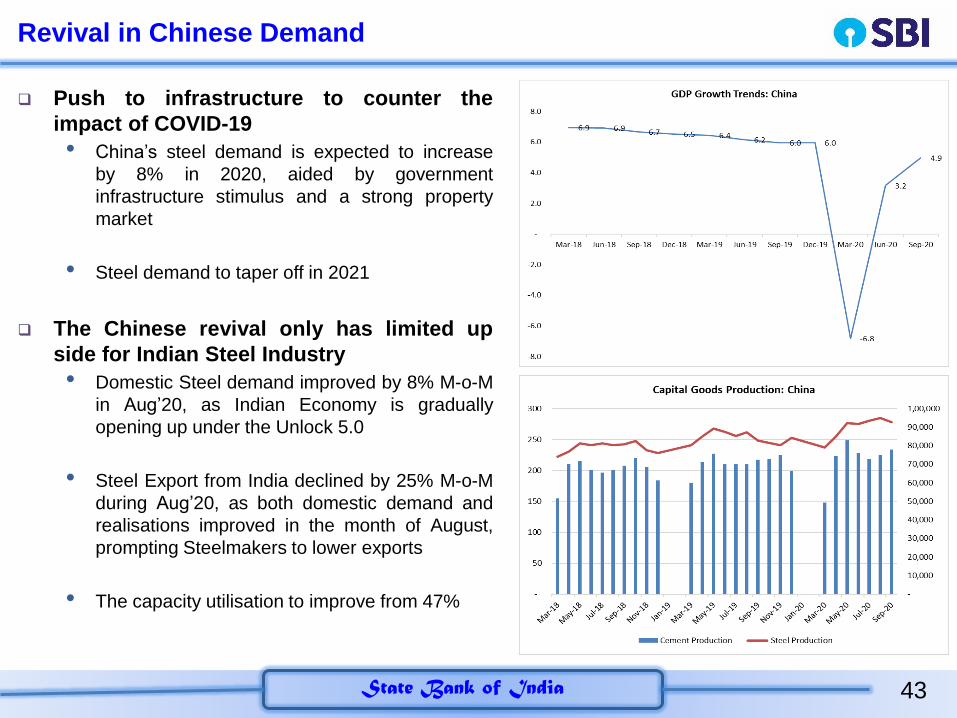
Revival in Chinese Demand
Push to infrastructure to counter the
impact of COVID-19
• China’s steel demand is expected to increase
by 8% in 2020, aided by government
infrastructure stimulus and a strong property
market
• Steel demand to taper off in 2021
The Chinese revival only has limited up
side for Indian Steel Industry
• Domestic Steel demand improved by 8% M-o-M
in Aug’20, as Indian Economy is gradually
opening up under the Unlock 5.0
• Steel Export from India declined by 25% M-o-M
during Aug’20, as both domestic demand and
realisations improved in the month of August,
prompting Steelmakers to lower exports
• The capacity utilisation to improve from 47%
44State Bank of India
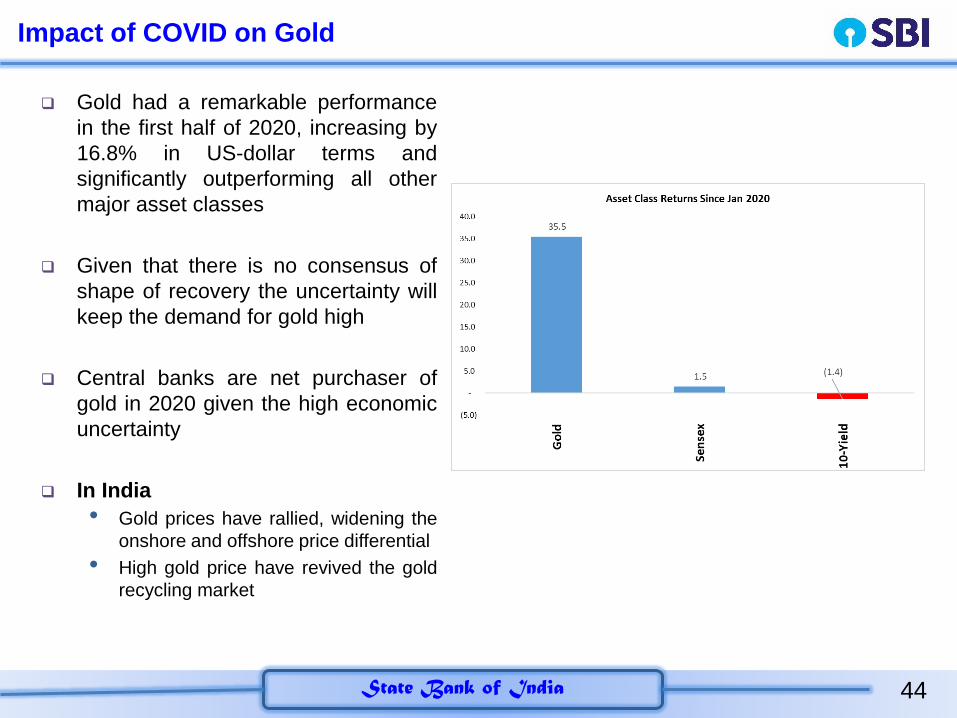
Impact of COVID on Gold
Gold had a remarkable performance
in the first half of 2020, increasing by
16.8% in US-dollar terms and
significantly outperforming all other
major asset classes
Given that there is no consensus of
shape of recovery the uncertainty will
keep the demand for gold high
Central banks are net purchaser of
gold in 2020 given the high economic
uncertainty
In India
• Gold prices have rallied, widening the
onshore and offshore price differential
• High gold price have revived the gold
recycling market
45State Bank of India
Banking & Financial Markets
46State Bank of India
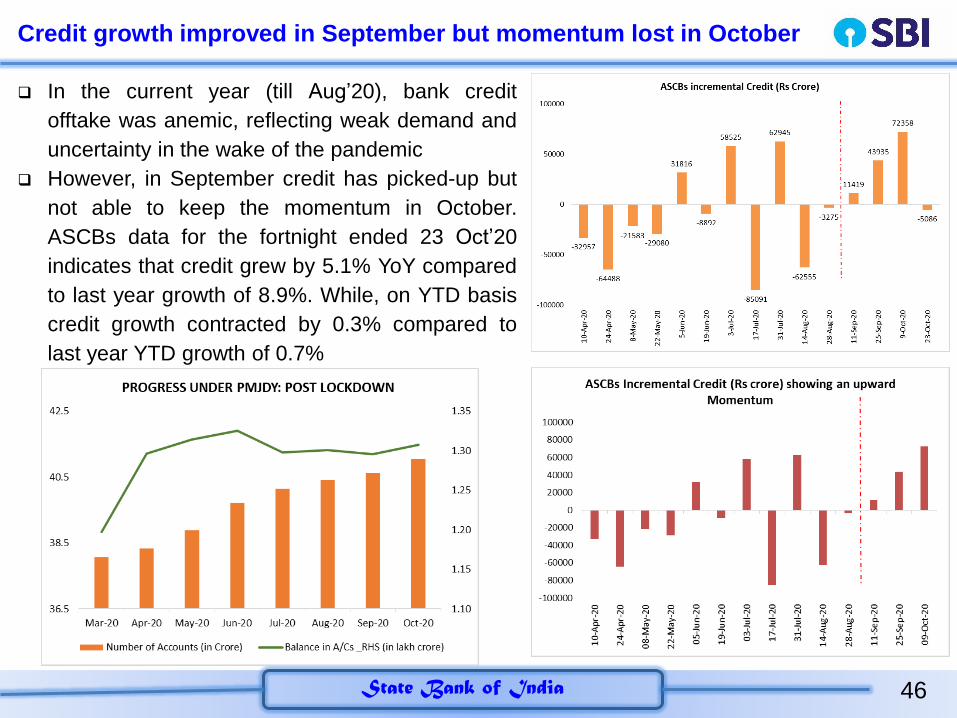
Credit growth improved in September but momentum lost in October
In the current year (till Aug’20), bank credit
offtake was anemic, reflecting weak demand and
uncertainty in the wake of the pandemic
However, in September credit has picked-up but
not able to keep the momentum in October.
ASCBs data for the fortnight ended 23 Oct’20
indicates that credit grew by 5.1% YoY compared
to last year growth of 8.9%. While, on YTD basis
credit growth contracted by 0.3% compared to
last year YTD growth of 0.7%
47State Bank of India
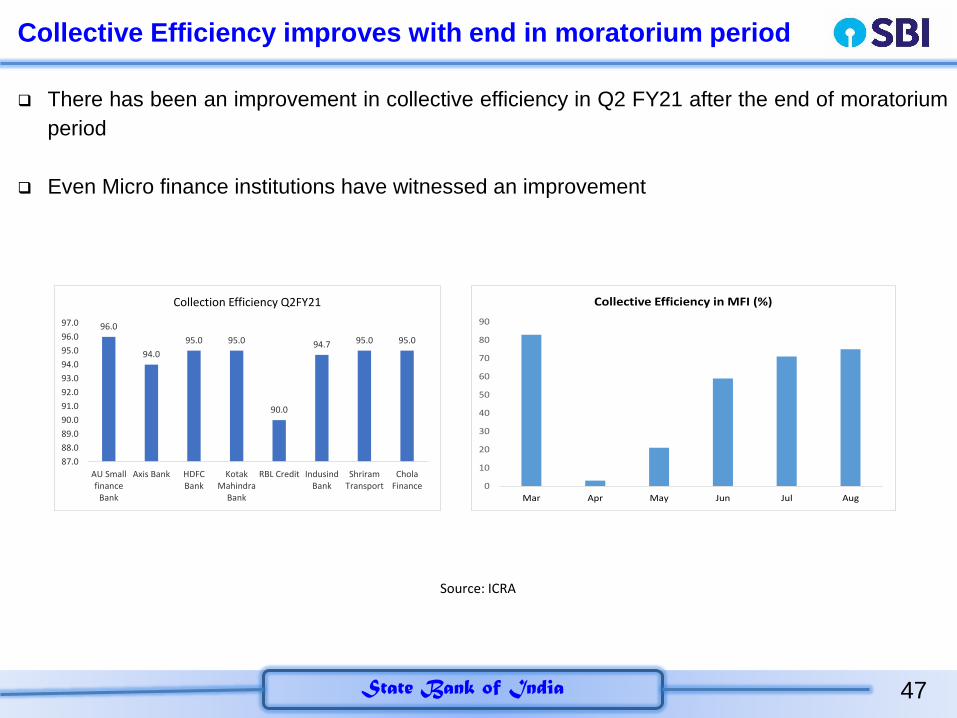
Collective Efficiency improves with end in moratorium period
There has been an improvement in collective efficiency in Q2 FY21 after the end of moratorium
period
Even Micro finance institutions have witnessed an improvement
0
10
20
30
40
50
60
70
80
90
Mar Apr May Jun Jul Aug
Collective Efficiency in MFI (%)
Source: ICRA
96.0
94.0
95.0 95.0
90.0
94.7 95.0 95.0
87.0
88.0
89.0
90.0
91.0
92.0
93.0
94.0
95.0
96.0
97.0
AU Smallfinance
Bank
Axis Bank HDFCBank
KotakMahindra
Bank
RBL Credit IndusindBank
ShriramTransport
CholaFinance
Collection Efficiency Q2FY21
48State Bank of India
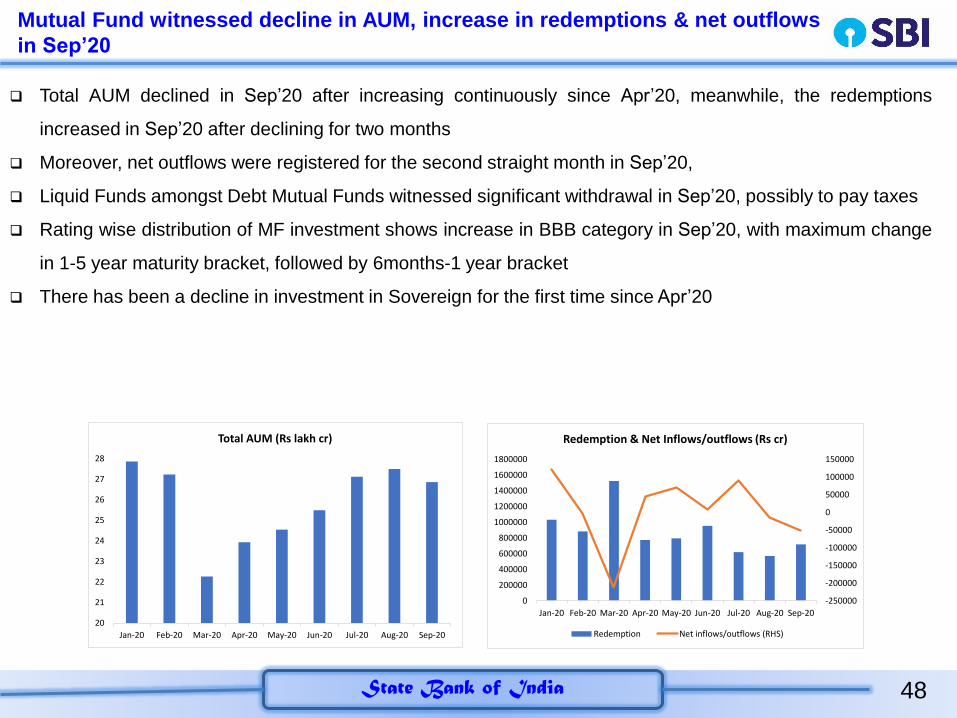
Mutual Fund witnessed decline in AUM, increase in redemptions & net outflows
in Sep’20
Total AUM declined in Sep’20 after increasing continuously since Apr’20, meanwhile, the redemptions
increased in Sep’20 after declining for two months
Moreover, net outflows were registered for the second straight month in Sep’20,
Liquid Funds amongst Debt Mutual Funds witnessed significant withdrawal in Sep’20, possibly to pay taxes
Rating wise distribution of MF investment shows increase in BBB category in Sep’20, with maximum change
in 1-5 year maturity bracket, followed by 6months-1 year bracket
There has been a decline in investment in Sovereign for the first time since Apr’20
-250000
-200000
-150000
-100000
-50000
0
50000
100000
150000
0
200000
400000
600000
800000
1000000
1200000
1400000
1600000
1800000
Jan-20 Feb-20 Mar-20 Apr-20 May-20 Jun-20 Jul-20 Aug-20 Sep-20
Redemption & Net Inflows/outflows (Rs cr)
Redemption Net inflows/outflows (RHS)20
21
22
23
24
25
26
27
28
Jan-20 Feb-20 Mar-20 Apr-20 May-20 Jun-20 Jul-20 Aug-20 Sep-20
Total AUM (Rs lakh cr)
49State Bank of India
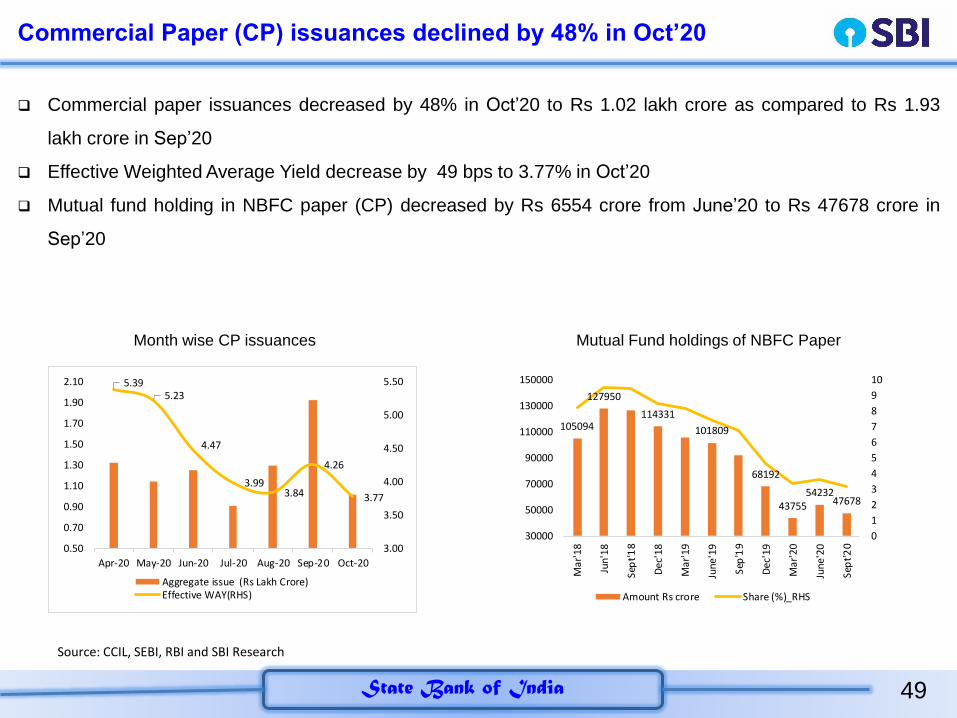
Commercial Paper (CP) issuances declined by 48% in Oct’20
Commercial paper issuances decreased by 48% in Oct’20 to Rs 1.02 lakh crore as compared to Rs 1.93
lakh crore in Sep’20
Effective Weighted Average Yield decrease by 49 bps to 3.77% in Oct’20
Mutual fund holding in NBFC paper (CP) decreased by Rs 6554 crore from June’20 to Rs 47678 crore in
Sep’20
Month wise CP issuances Mutual Fund holdings of NBFC Paper
Source: CCIL, SEBI, RBI and SBI Research
5.395.23
4.47
3.993.84
4.26
3.77
3.00
3.50
4.00
4.50
5.00
5.50
0.50
0.70
0.90
1.10
1.30
1.50
1.70
1.90
2.10
Apr-20 May-20 Jun-20 Jul-20 Aug-20 Sep-20 Oct-20
Aggregate issue (Rs Lakh Crore)Effective WAY(RHS)
105094
127950
114331
101809
68192
4375554232
47678
0
1
2
3
4
5
6
7
8
9
10
30000
50000
70000
90000
110000
130000
150000
Ma
r'1
8
Jun
'18
Sep
t'1
8
De
c'1
8
Ma
r'1
9
Jun
e'1
9
Sep
'19
De
c'1
9
Ma
r'2
0
Jun
e'2
0
Sep
t'2
0
Amount Rs crore Share (%)_RHS
50State Bank of India
Disclaimer:This Report is not a priced publication of the Bank. Theopinion expressed is of Research Team and not necessarilyreflect those of the Bank or its subsidiaries. The contentscan be reproduced with proper acknowledgement. The write-up on Economic & Financial Developments is based oninformation & data procured from various sources and noresponsibility is accepted for the accuracy of facts andfigures. The Bank or the Research Team assumes no liabilityif any person or entity relies on views, opinion or facts &figures finding in this Report.
Contact Details:Dr. Soumya Kanti GhoshGroup Chief Economic AdviserState Bank of India, Corporate CentreNariman Point, Mumbai - 400021Email: [email protected]
[email protected]:022-22742440:@kantisoumya