fine-scale genetic structure of whitebark pine (pinus albicaulis): assogiarrions with watersmd and...
TRANSCRIPT

E~buEurlorz. 531 1 f , 1999, pp. 73-90
FINE-SCALE GENETIC STRUCTURE OF WHITEBARK PINE (PINUS ALBICAULIS): ASSOGIArrIONS WITH WATERSmD AND GROWTH F O W
DEBORAH L. ROGERS,~ CONSTANCE I. MILLAR, AND ROBERT I). WESTFALL PaciJic So~dthrr~est Research Station, USDA Forest Sentice, P.O. Box 245, Berkeley, CaliJbrnia 94701
Abstract.-The fine-scale genetic structure of a subalpine conifer, whitebark pine (Pinus albicaulis Engelm.), was studied at nested geographic levels from watershed to adjacent stems in the eastern Sierra Nevada Range of California. A combination of several characteristics contributed to unpredicted genetic structure in this species. This includes being one of only 20 pine species worldwide with wingless, bird-dispersed seeds; having the reputed capacity to reproduce vegetatively; and forming distinct growth morphologies at different elevations in this part of its natural range. Genetic differentiation, as measured with 21 allozyme loci, among the three studied watersheds is virtually negligible (FsT = 0.004). This is a surprising result because the upper-elevation sites vary somewhat in slope aspect; thus, aspect was confounded with watershed effect. Differentiation between the upper-elevation prostrate krummholz thickets and lower-elevation upright tree clump growth forms is modest (FST = 0.05 1). Much stronger differentiation was measured among the individual thickets and clumps within their sample sites (FST = 0.334). Within krummholz thickets, multiple individuals are present and genetic relationships often resemble half- to full-sibling family structure (mean r = 0.320). Canonical trend surface analysis in two intensively sampled thickets indicates greatest genotypic variation in the direction of the prevailing wind. At lower elevations, most (72%) of the tree clumps contained more than one genotype; the remaining clumps are probably multistemmed trees. Within tree clumps, family relationships are closer than those for krummholz thickets-commonly full-sibling to selfed structure (mean v = 0.597). Genetic structure is apparently profoundly influenced by the seed-caching behavior of Clark's nutcracker (Nucifraga columbiaiza Wilson). Western pine species typically show little among-population differentiation and high levels of within-pop- ulation genetic variation. In whitebark pine in the eastern Sierra Nevada of California, genetic variation is highly structured, especially within the natural groupings-krummholz thickets and upright tree clumps.
Key words.-Family structure, genetic relatedness, growth form, krurnmholz, subalpine, treeline,
Received December 19, 1997. Accepted September 30, 1998.
Fine-scale genetic structure in plant species may result structuring, increase in inbreeding, and/or reduction in ge- from microenvironmental selection, local features of mating netic variation. Species capable of facultative asexual repro- and seed dispersal systems, and differences among local pop- duction, such as layering, may show increased incidence of ulations in genetic parameters. The strong relationship be- clonal growth near their treelines, with uncertainconsequenc- tween spatial and genetic structure, particularly in plant spe- cies because of their limited mobility, implies that population genetic processes should be treated in spatial or geographic contexts (Epperson and Li 1996). Forest tree species are typ- ically studied on broad spatial scales, commensurate with their frequently extensive natural ranges. However, fine-scale genetic structure of forest tree species may be particularly revealing and important near the margins of species' ranges or communities. For example, forest-tundra ecotones are dy- namic areas that may be particularly sensitive to changes in climate (Hansen-Bristow and Ives 1984; Weisberg and Baker 199%). Any upper subalpine zone is a reflection of the dy- narnic interactions between heredity and environment (Clau- sen 1965). However, the influence of genetic structure in determining the responsiveness of marginal or ecotonal pop- ulations to climatic change is not well studied.
In tree species, the ability to respond to changes in climate, such as a warming trend, by upward or northward movement of its treeline may be related to genetic composition in this dynamic zone. For example, in dioecious species, harsh grow- ing conditions near the treeline might alter sex ratios-there- by influencing effective population size and possibly genetic variation. In monoecious species, limited pollen flow and/or seed dispersal near the treeline might lead to subpopulation
es for genetic structure. Changes in climate may affect be- havior of animal vectors of seeds or wind patterns responsible for pollen and/or seed dispersal. Finally, the harsh physical conditions of treeline present strong selection pressures. Clearly, the amount and structure of genetic variation in eco- tonal populations will affect the nature and rate of response to changes in climate.
In the eastern Sierra Nevada, California, environmental gradients affecting ecotonal plant populations are particularly steep. Although the Sierra Nevada is 80-1 10 km wide, its crest occurs near the eastern edge of its range, above a mas- sive fault scarp that drops off abruptly into the Great Basin deserts (Arno 1984). Whitebark pine (Pinus aEbicauEis En- gelm.) is a common component of upper elevational ecotonal plant communities, with a natural range that extends through- out subalpine forests and timberlines in western regions of the United States and Canada. Its widely ranging but often disjunct occurrence is generally described as having two ma- jor components, eastern (Rocky Mountains) and western (Coast, Olympic, Cascade, and Sierra Nevada mountain rang- es) distributions and also many geographically distinct small- er populations. There is regional variation in the type(s) of growth form assumed by the species that is a function of elevation and climate. Whitebark pine stands in the northern Rocky Mountain and northern Cascade ranges, where ele-
Present address: Genetic Resources Conservation Program, vations are modest, tend to be dominated by upright trees. University of California, One Shields Avenue, Davis, california In Contrast, in areas with higher elevations such as the eastern 956 16; E-mail: debrogers @ucdavis.edu. Sierra Nevada, whitebark pine exhibits a range of growth
8 1999 The Society for the Study of Evolution. All rights reserved.

GENETIC STRUCTURE OF A PIKE '75
forms-including a short, prostrate, krummholz thicket, typ- ically occurring at higher elevations, and an upright tree form, typically growing in tight tree clumps at lower elevations, Dominance of one form over the other varies widely in the Sierran portion of the species'range.
Among conifers in this region, whitebark pine has the high- est elevation range and is the only conifer forming extensive stands of krummholz thickets. Furthermore, a higher pro- portion of tree-form whitebark pine on the south- and east- facing slopes, relative to the north-facing slopes (particularly at higher elevations), suggests that temperature or tempera- ture-related features may be limiting the elevational treeline of the species in this region (Clausen 1965). Microclimatic effects, particularly from snow (e.g., protection from winds afforded by snow cover), are thought to be critical to local distribution of forest and krummholz in the central Sierra Nevada (Klikoff 1965). In addition to harsh and steeply grad- ed environmental influences, there are several attributes of whitebark pine that putatively affect both its distribution and local genetic structure. It is one of only 20 species of pine worldwide (of 90-100 pine species in total) with wingless, bird-dispersed seeds (Tomback and Linhart 1990). The major seed disperser of whitebark pine is Clark's nutcracker (Nu- cifraga columbinna Wilson)-a fact that has significant im- plications for the regeneration capacity of the species, its ability to colonize in new locations (Tomback 1982), and the genetic structure of the species (Furnier et al. 1987). The tree clumps in which it frequently occurs at lower elevations with- in the nutcracker's habitat zone are an inferred consequence of seed-cache origin (Tomback and Linhart 1990). Although in the evolutionary history of food caching by birds and mammals, cached items are, for the most part, "prey that have lost in an ecological predator-prey interaction," the seeds of whitebark pine that are cached (as well as those of other large-seeded plant species) "are probably represented more heavily in future generations than other seeds of the same species" (Smith and Reichman 1984). Furthermore, whitebark pine may have the potential to reproduce vege- tatively by layering, with unmeasured impacts on genetic structure (Arno 1984). At treeline, vegetative reproduction via branch layering is important in maintaining populations of trees and shrubs (Tranquillini 19791, with empirical ex- amples from Alnus, Larix. and Picea species (Hermanutz et al. 1989)
Although the mutualistic relationship between Clark's nut- cracker and whitebark pine has been well studied (e.g., Tom- back 1982; Tomback and Linhart 1990), the genetic impli- cations for this method of seed dispersal in various regions of the species' range, effects of vegetative reproduction on genetic structure, and genetic relationships among growth forms at different elevations are imperfectly known, Inter- action among these variables could have considerable impact on the genetic structure of whitebark pine. For example, both caching activity and tendency to reproduce vegetatively could be affected by elevation, which would influence the dynamic interface of krummholz and upright growth forms. Although the relationships between genetic structure within plant pop- ulations and life- history traits have been surveyed for a wide range of plant species (e.g., Loveless and Hamrick 1984), the trends do not support predictions for genetic structure in
whitebark pine because of the lack of local-scale andlor em- pirical information for this species (i.e., whitebark pine is considered to have a largely outcrossing mating system, yet there is little local or empirical information to support the theory) and the contradicting trends suggested by some of its features (e.g., animal-attached seed dispersal and facul- tative asexual reproduction suggest a propensity toward pop- ulation subdivision. whereas long-livedness, outcrossing mating system, seed dormancy, and wind-pollination retard subdivisions within populations).
Earlier biochemical studies (i.e., allozyme and monoter- pene) of genetic structure in whitebark pine have investigated population structure in rangewide, regional, andlor marginal populations (Zavarin et al. 199 1 ; Yandell 1993; Jorgensen and Hamrick 1997; Bruederle et al. 1998), with conclusions of little population structure rangewide and moderate differ- entiation of some marginal populations. In the rangewide study, the vast majority of genetic variation (96.6%) was found to occur within populations (Jorgensen and Hamrick 1997). A regional alIozyme study of nine whitebark pine populations in the greater Yellowstone area (including sites in Wyoming and Montana) revealed only modest population differentiation (fiT = 0.025, Bruederle et al. 1998). A study of monoterpene variability in 24 rangewide populations dis- closed little variation among the nine California populations sampled, with regional differentiation noted between Cali- fornia and Rocky Mountain populations (Zavarin et al. 1991). Two studies of within-population structure have considered genotypic composition within tree clumps in Rocky Moun- tain populations (Linhart and Tomback 1985; Furnier et al. 1987). These studies indicate that clusters in these northern and eastern reaches of the species' range often contain two or more individuals. We are aware of only one previous study of genetic relatedness within or among clumps (Furnier et al. 1987). In that study, clumps in southwestern Alberta, Can- ada, were examined and low genetic distances within clumps were found, in contrast to high genetic distances among clumps. Clumps in the southwestern extent of the species' range have not been explored, nor has the genetic compo- sition of krummholz growth form or the relationship between adjacent krummholz thicket and upright tree clump growth forms.
We have chosen a watershed scale to investigate whitebark pine because this scale encompasses the elevational treeline and subalpine forest and provides distinctive natural "groups" of the species-krummholz thickets and tree clumps-that may be biologically meaningful genetic struc- tures. Although these growth forms occur in adjacent envi- ronments, we expect that there may be differing selection pressures between them, based on obvious biotic and abiotic differences related to elevation.
Here, we refer to the upright tree form of whitebark pine, where it occurs as two or more closely associated stems. as "tree clumps" following the terminology of Lanner (1980) and Carsey and Tomback (1994). The propensity for the spe- cies to develop low, J-shaped. branches that can masquerade as individual trunks as well as to grow in close proximity with several other trees, makes identification of these clumps difficult without genetic analysis. Although the term was em- ployed previously to indicate multitrunk trees or groups of
76 DEBORAH L. ROGERS ET AL.
trees that have not been classified by genetic analysis (Carsey and Tomback 19941, here we continue to use "tree cluster'" after genetic analysis where we wish to refer collectively to all compositions within the upright, multistemmed growth form, Sampled units are referred to as "stems" because we cannot distinguish trunks from branches, We call the prostrate growth form in the higher elevations "'krummholz thickets." Although this growth form is assumed by some to be envi- ronmentally induced (e.g., Arno 1984) and by others to be an alpine race, probably with some genetic basis (e.g., Clau- sen 1965), we make neither assumption in this investigation.
In this paper, we present an analysis of watershed-level genetic structure in treeline and subalpine populations of whitebark pine in the eastern Sierra Nevada. Specifically, we investigated three questions concerning genetic structure: (1) Are krummholz thickets andlor tree clumps mainly single genotypes? (2) If not, what are the levels of relatedness within and among tree clumps and krummholz thickets? (3) Does the genetic composition of the stands of krummholz thickets differ from the stands of upright tree clumps?
Study Location
In the Sierra Nevada Mountains of eastern California, whitebark pine occurs in two distinctive growth forms: krummholz thickets at higher elevations and upright tree clumps and individual trees or seedlings at lower elevations. The krurnmholz thicket growth form is low, prostrate, and shrublike, with intertwined and meandering stems under the mat of foliage. Connections between the foliage and the stems and recognition of discrete individuals are not often possible by cursory observation. Thickets occur in discrete patches, often separated by 30 m or more. Individual stems rarely occur among krummholz thickets. Tree clumps are composed of upright trees with one to many closely spaced stems. In- dividual stems often appear to be emerging from the same origin. Without destructive sampling, it is difficult to discern individual trees from branches that originate below ground. Alternatively, individual stems may fuse and thus masquer- ade as a multistemmed tree. Tree clumps may be close to- gether (a few meters) or sparsely scattered in a stand (i.e., 20-50 m).
Sample sites were selected in three watersheds in the east central Sierra Nevada, Mono County, California (just west and northwest of Mono Lake), in which whitebark pine for- ests are common (Fig. 1). The sample sites are located along 15 km of the eastern escarpment of the Sierra Nevada (ca. 38"2'N, 119"16'W). Sites at Mount Dunderberg are the north- ernmost and are separated from those at the middle water- shed, Virginia Lakes Canyon, by approximately 2 km. Sites at the southernmost watershed, Warren Bench. are approxi- mately 12 km from the Virginia Lakes sites. The watersheds are topographically and geologically similar, situated as east- and northeast-facing canyons and slopes just over the eastern crest of the Sierra Nevada. Sample sites range in elevation from approximately 3000 m for the tree clumps to 3700 m for krummholz stands. They are in a single climatic zone and underlain by common rocks and soils of the region, which are derived from Cenozoic metamorphic base materials.
At the upper elevations, whitebark pine is the dominant woody species, with only infrequent occurrences of lodgepole pine (Pinus contorta Dougl.) and shrubby Ribes spp., both of which may also exhibit krummholz growth. At lower ele- vations in these watersheds, whitebark pine remains the dom- inant woody species, but lodgepole pine is more frequent than at upper elevations, and trembling aspen (Populus tre- muloides Michx.) is present. Other tree species common to this ecological zone. but not occurring within the study sites, include western white pine (Pinus nzonticola Dougl.), limber pine (Pinus Jfexilis James), western juniper (Juniperus occi- dentalis Hook.), and mountain hemlock (Tsuga mertensiana [Bong.] Carr.).
Field and Laboratory Methods
In each watershed, 80 foliar samples were taken from both the upper elevation (krummholz thickets) and lower elevation (tree clump) growth forms. Virginia Lakes was sampled in late October 1995; Warren Bench and Dunderberg were sam- pled in July and August 1996. Upper elevation sample sites had different slope aspects within each watershed: Dunder- berg (N to NW); Virginia Lakes (SE); and Warren Bench (NE). Within each watershed, 10 discrete krummholz thickets were sampled by taking eight equidistant samples around the perimeter of each thicket. Neighboring thickets were sampled consecutively when they were at least 30 m apart. Thicket size varied from approximately 20-450 m2 in area. Often roughly rectangular in shape, the dimension parallel to the contour of the slope (as well as dominant wind direction) was usually greater than the dimension parallel to the gradient of the slope. At lower elevations in each watershed, tree clumps were randomly chosen within an area of approxi- mately 2 ha, with clusters at least 30 m apart. Every stem in each selected clump was sampled and measured for diameter at breast height. Physical connections among stems within clumps were noted. Because of the varying number of stems per clump, the number of clumps sampled within each wa- tershed varied within a narrow range of 13-15 clumps. In- dividual stems (i.e., clumps of one) were infrequent, but were sampled in approximate frequency to their overall occur- rence.
Observations were made of the occurrence of young seed- Ling clusters. (These are referred to as clusters instead of clumps because they are recognizable as groups of individ- uals without genetic analysis.) Although such clusters are not infrequent in the overall study area, only two were noted within the sampling period (one day per site): once each at Warren Bench and Dunderberg, both among the tree clump growth forms. In both eases, seedlings were removed and assayed.
At Dunderberg, all stems in three of the tree clumps were cored to estimate age by tree ring counts. Cores were taken approximately 20 cm above ground level. A total of 17 stems was cored. Cores were lightly sanded and rings were counted under 2x magnification.
Three krummholz thickets at Dunderberg were sampled intensively. A grid was laid out on each thicket with flagging tape: grid lines were approximately 3 m apart along the down- slope axis and 1.5 m apart along the contour of the slope.
GENETIC STRUCTURE OF A PINE
SCALE 1 : 100000
1000 0 1000 2000 - METERS
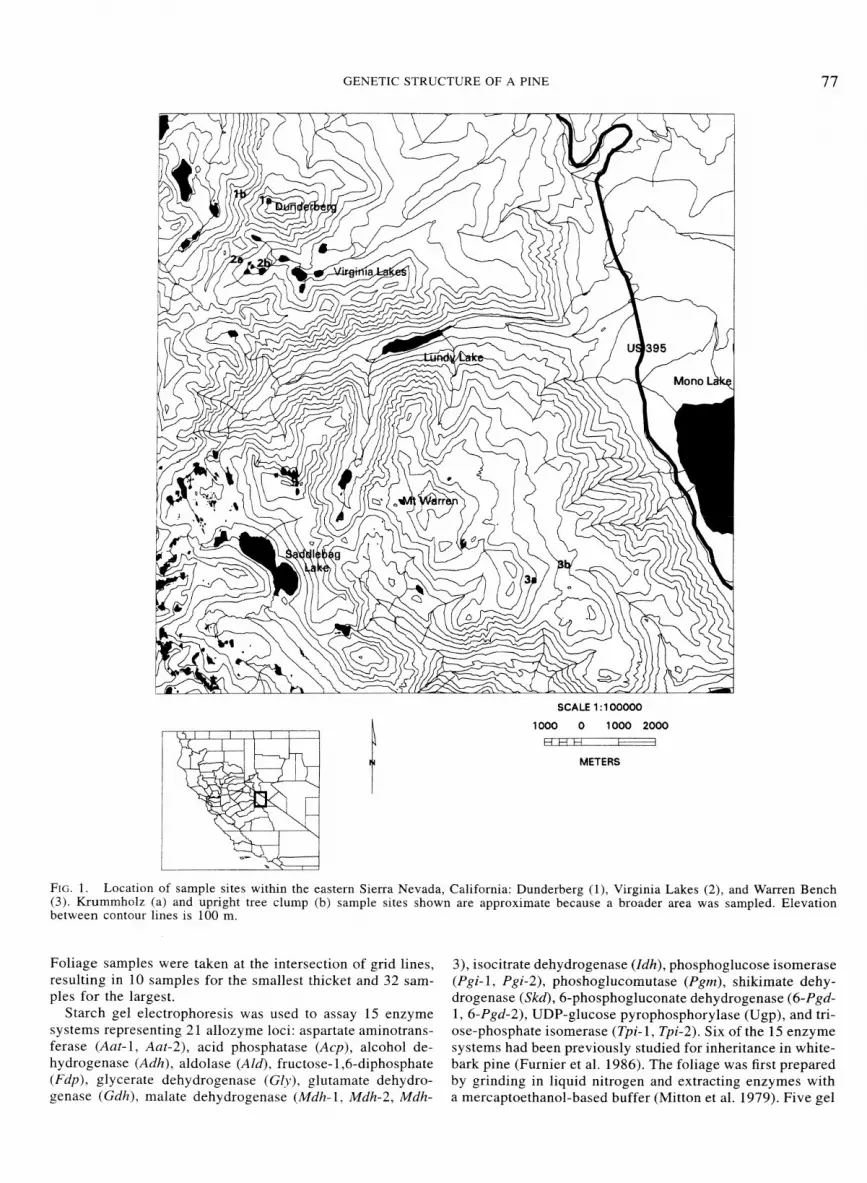
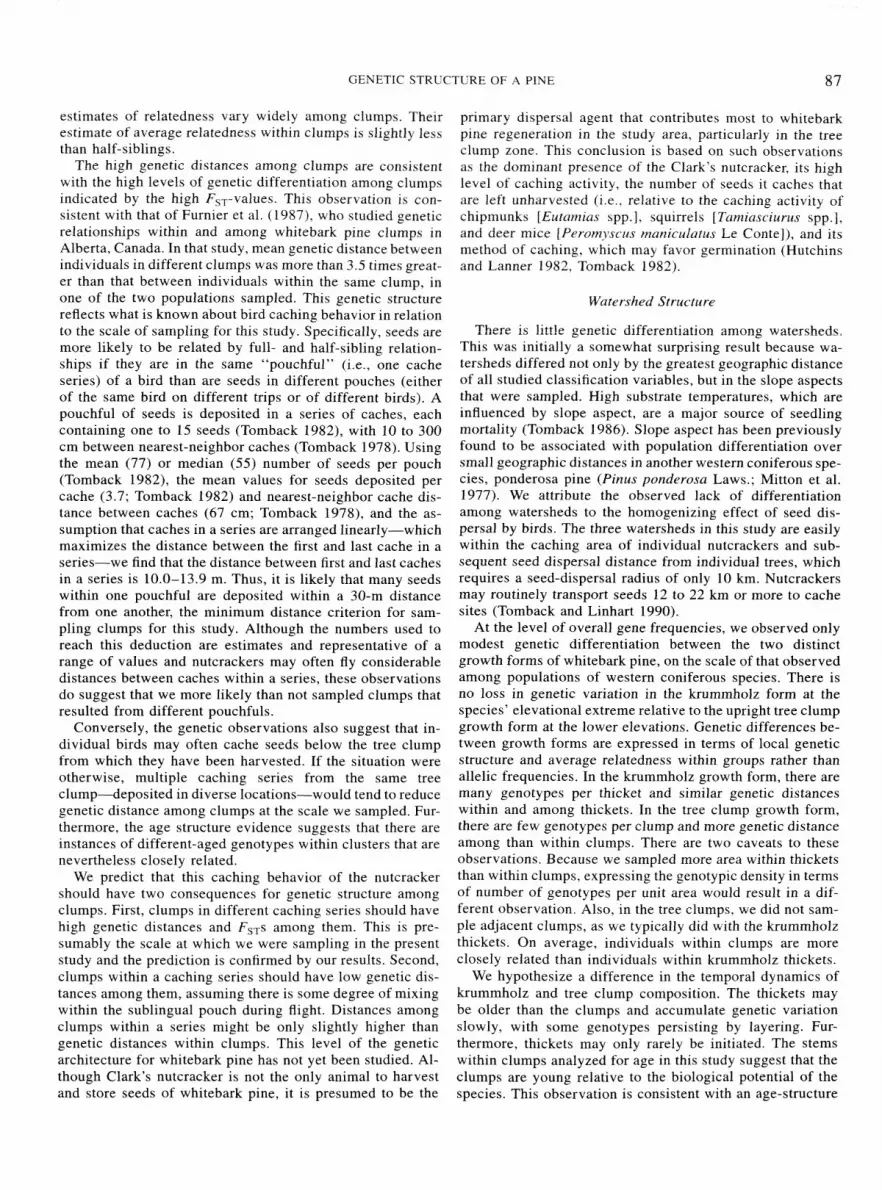
FIG. 1. Location of sample sites within the eastern Sierra Nevada, California: Dunderberg (I), Virginia Lakes (2), and Warren Bench (3). Krummholz (a) and upright tree clump (b) sample sites shown are approximate because a broader area was sampled. Elevation between contour lines is 100 m.
Foliage samples were taken at the intersection of grid lines, resulting in 10 samples for the smallest thicket and 32 sam- ples for the largest.
Starch gel electrophoresis was used to assay 15 enzyme systems representing 2 1 allozyme loci: aspartate aminotrans- ferase (Aat- 1, Aat-2), acid phosphatase (Acp), alcohol de- hydrogenase (Adh), aldolase (Ald), fructose- l,6-diphosphate (Fdp), glycerate dehydrogenase (Gly), glutamate dehydro- genase (Gdh), malate dehydrogenase (Mdh- 1, Mdh-2, Mdh-
3), isocitrate dehydrogenase (Idh), phosphoglucose isomerase (Pgi- 1, Pgi-2), phoshoglucomutase (Pgm), shikimate dehy- drogenase (Skd), 6-phosphogluconate dehydrogenase (6-Pgd- 1, 6-Pgd-2), UDP-glucose pyrophosphorylase (Ugp), and tri- ose-phosphate isomerase (Tpi- 1, Tpi-2). Six of the 15 enzyme systems had been previously studied for inheritance in white- bark pine (Furnier et al. 1986). The foliage was first prepared by grinding in liquid nitrogen and extracting enzymes with a mercaptoethanol-based buffer (Mitton et al. 1979). Five gel
'78 DEBORAH L. ROGERS ET AL.
buffer systems (morpholine citrate pH 6.1, 7.1, and 8.1 ; and tris citrate pH 8.3 and 8.8) were used to run the 15 enzyme systems, with two to five enzymes assayed per gel buffer system. Buffer recipes and electrophoresis protocol generally followed those of Conkle et al. (1982). Staining recipes fol- lowed those of Wendel and Weeden (1989). Diploid, 2 1-locus genotypes were established for all 480 foliar samples for the main study and additional samples from the intensively stud- ied krummholz thickets, plus the two seedling clusters.
Statistical Analyses
Multilocus genotypes were examined to determine the ge- netic relationship among samples within each clump or thick- et (group). The number of distinct genotypes per group was determined. Descriptive measures of genetic diversity, in- cluding percent polymorphic loci, effective number of alleles per locus, and expected heterozygosity, were calculated for each site.
As a measure of genetic distance (but not as an indicator of relatedness) Rogers' (1972) genetic distance was selected (Swofford 1989). We used this distance measure to allow comparison with the Furnier et al. (1987) allozyme study of whitebark pine. Rogers' genetic distances were calculated between all pairs of individuals (samples) within each group (clump or krummholz), between each group within a growth form, between growth forms within watersheds, and among watersheds. This calculation was then repeated for the ge- netically distinct samples (i.e., not all samples had unique multilocus genotypes), which provides a comparison of ge- netic distance with and without putative branches. In a pre- vious study of linkage of allozymes in seed tissue of white- bark pine, significant linkage was observed between Adh and Pgi-2 (Furnier et al. 1986). Although this is a violation of the assumption of independence among loci, the recombi- nation frequency was still fairly large (0.35) and was not considered to be a major problem in the current study for the estimation of genetic distances.
The genetic composition of the seedling clusters is de- scribed separately. Genetic distance, as measured by the Rog- ers' genetic distance method, was calculated for each paired comparison of the seedling cluster and other tree clumps sampled at the same site.
Because we favor the approach of Schuster and Mitton (1991), we used two methods to estimate the relatedness of individuals within clumps and thickets. First, we estimated average relatedness (r), as developed by Quellar and Good- night (1989, eq. 6):
- C C C C (~El,,rn P , - , , m ) l " / k f f
C C C C (P,?, - P e l , , ) ' (1)
i j X a
where groups (i.e., clumps and krumtnholz thickets) were referenced by i = 1, . . . n,; individuals within groups by j = 1, . . . n,; loci by k = 1, . . . nk; allelic positions by a =
1, 2, . . . n,, and for any allele designated nz, p, is the pop- ulation frequency of that allele; p,, is the frequency of that allele in individual j of group i, and pCi,,, is the frequency of that allele in group i excluding individual j; pi-,,m is the sample mean calculated after exclusion of group i.
Second, we generated expected distributions of the number of loci differing between stems within groups under models of selfing, full-sibling, half-sibling, and no relatedness. These distributions were produced as follows. The average fre- quency of the common allele for each population was cal- culated. Then the probability of nonidentity at a locus for each relationship set was computed. Finally, the probabilities of nonidentity at multiple loci were computed using the bi- nomial expansion of n loci, differing at zero to 11 loci. We then graphed the expected and observed distributions.
F-statistics were calculated with all three watersheds to- gether as a three-level hierarchical analysis, and for each growth form in each watershed separately (BIOSYS-1, Swof- ford 1989). Each watershed was then subjected to an analysis in which two algorithms and two datasets were compared, resulting in four sets of F-statistics for each watershed, as follows. Analyses were performed both with a complete and a reduced dataset, the latter containing only one copy per genotype. For each dataset, F-statistics were generated both with BIOSYS-1 (Swofford 1989), which assumes a fixed ef- fects model (Wright 1978) and with POPGENE, Version 1.1 (Yeh and Boyle 1996), which assumes a random effects model (Weir 1990). The experimental design was actually a mixed model (i.e., growth forms within watersheds are fixed, wa- tersheds and groups within growth forms are random).
Spatial trends of genotypes within the three intensively sampled krummholz thickets were examined by using ca- nonical trend surface analysis (Wartenberg 1985). Genotypic data were transformed to linear combinations of allelic scores according to a method of Smouse and Williams (1982). The independent variables were y (downslope direction), x (per- pendicular to y and parallel with the contour of the slope), x2, y2? and xy. Analyses were performed using PROC CAN- CORR (SAS Institute 1985). Contour plots were produced in Mathematica (Wolfram 1996) with functions provided by Wickham- Jones ( 1994).
The relationship between surface area of krummholz thick- ets and the number of genotypes identified among the eight samples taken at each was explored using Pearson product- moment correlation coefficients. Surface area of each thicket was estimated based on the assumption of a rectangular shape. Finally, the effect of perimeter sampling versus in- tensive sampling for the three intensively sampled krumm- holz thickets was investigated by comparing the percent unique genotypes, percent polymorphic loci, and expected heterozygosity in each.
RESULTS
Krummholz Thickets
Over all watersheds, every krummholz thicket sampled contains at least two genotypes. On average, there are 4.0- 6.6 genotypes revealed among the eight samples taken at each thicket (Table 1). On average, genotypes within a thicket differ from one another by 2.25 alleles (Warren Bench) to 3.76 alleles (Virginia Lakes). Other diversity statistics are fairly high, with over 50% loci polymorphic and expected heterozygosity averaging (on a watershed) between 0.128 and 0.141.
Genetic distance among genotypes within thickets is sim-

GENETIC STRUCTURE OF A PINE 79
TABLE 1. Genetic diversity measures in krummholz thickets and tree clumps.
Range In medn \ d u e s among u aterihed6
Krum~nholz thicket3 Tree clump\
Mean no. multilocus genotypes per group
Percent unique multilocus genotypes per group
Polymorphic loci (%)j Mean no. alleles6 Effective no. alleles/locus Observed heterozygosity Expected heterozygosity7 Mean no. of differing alleles be-
tween stems or samples within groups
No. of groups per site with only one multilocus genotype
' Based on 15 enzyme systems with 21 scorable loci. The ranges represent the lowest to highest mean values per grow& form from the three watersheds. An individual clump or thicket is called a "group."
Based on eight samples within each krummholz thicket. ' Not applicable: varies with clump size. "xclusive of single trees (i.e., tree clumps only).
A locus was considered polymorphic if more than one allele was detected. Per polymorphic locus. Mean within-group Hardy-Weinberg expected heterozygosity.
ilar to that between thickets in two of the three watersheds (Table 2). At Warren Bench, genetic distance among thickets is approximately twice that within thickets. The genetic dis- tance between krummholz thickets in one watershed and those in another (mean = 0.133; range = 0.117-0.152) are on the same scale as the distance among thickets in the same watershed (mean = 0.119; range = 0.095-0.15 1; data not shown).
The three intensively sampled krummholz thickets at Dun- derberg reveal additional genotypes over those detected by perimeter sampling alone. The number of unique genotypes per thicket increases from seven to 11 for the first thicket, three to four for the second, and seven to 14 for the third with intensive sampling. However, intensive sampling does not detect additional polymorphic loci or additional alleles at any loci. Expected and observed heterozygosity values are lowered slightly by the additional samples in two thickets, whereas they are increased more substantially in the third thicket. Perimeter sampling, where the standard eight samples
TABLE 3. Unbiased estimates of relatedness ( r ) within tree clumps and krummholz thickets. Values presented are means among all groups within a growth form, with the range indicated in paren- theses.
Mean r !range)
Watershed Tree clurnpt K r u ~ ~ l r n h o l z thtcLet\
Bunderberg 0.765 (0.393-0.901) 0.25 1 (-0.189-0.623) Virginia Lakes 0.448 (-0.03 1-0.9 18) 0.254 (-0.023-0.85 1) Warren Bench 0.616 (0.163-0.880) 0.456 (-0.205-0.908)
Overall 0.597 0.320
were collected, detects from 50% to 75% of the genotypes detected with intensive sampling (where the sampling inter- val was fixed). We conclude that perimeter sampling in krummholz thickets is a parsimonious method for sampling genotypic composition. Although internal intensive sampling always revealed new genotypes beyond those discovered in the perimeter, the rate of discovery of additional genotypes per sample is less than that of perimeter sampling.
The average unbiased estimates of relatedness within thick- ets are approximately that expected for half-siblings at two of the watersheds and closer to that expected for full-siblings at the third (Table 3). However, estimates of relatedness for individual thickets show a broad range from -0.205 to 0.908 (minimum and maximum values, respectively, for sampled thickets at Warren Bench).
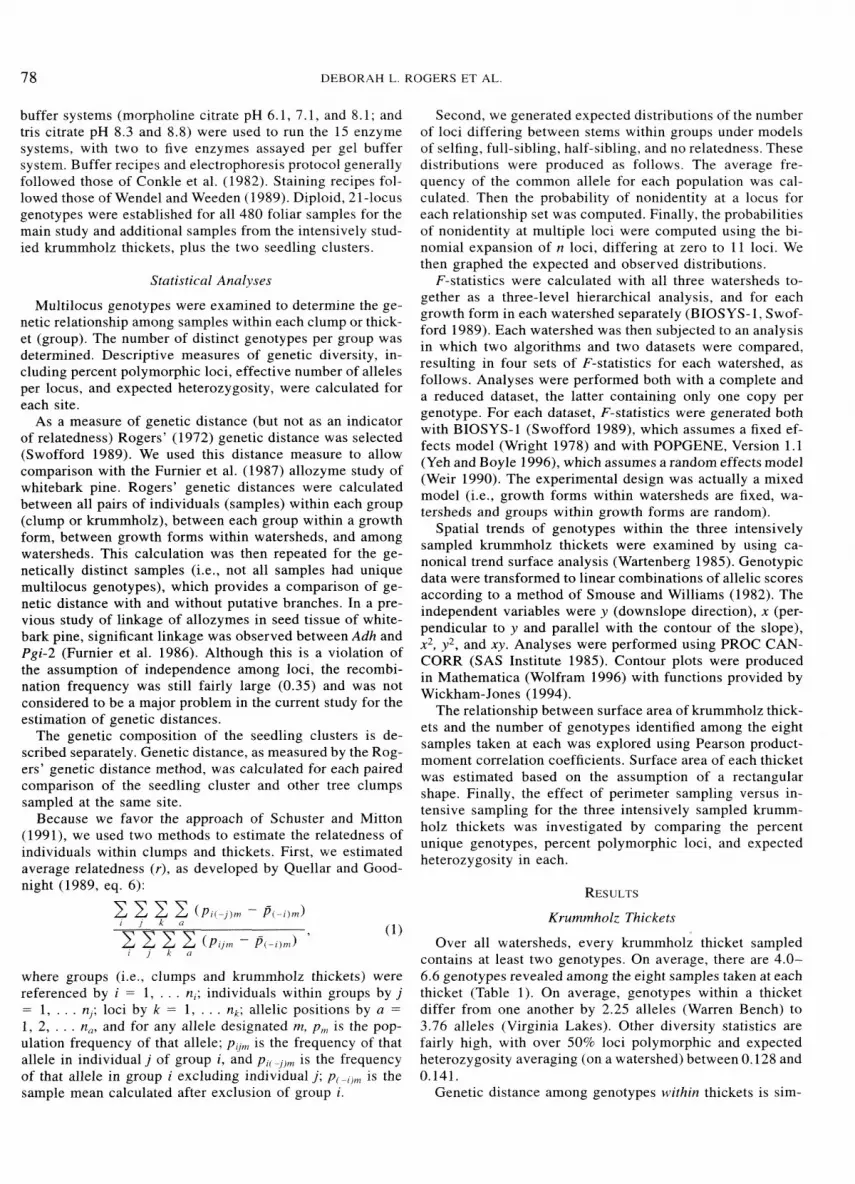
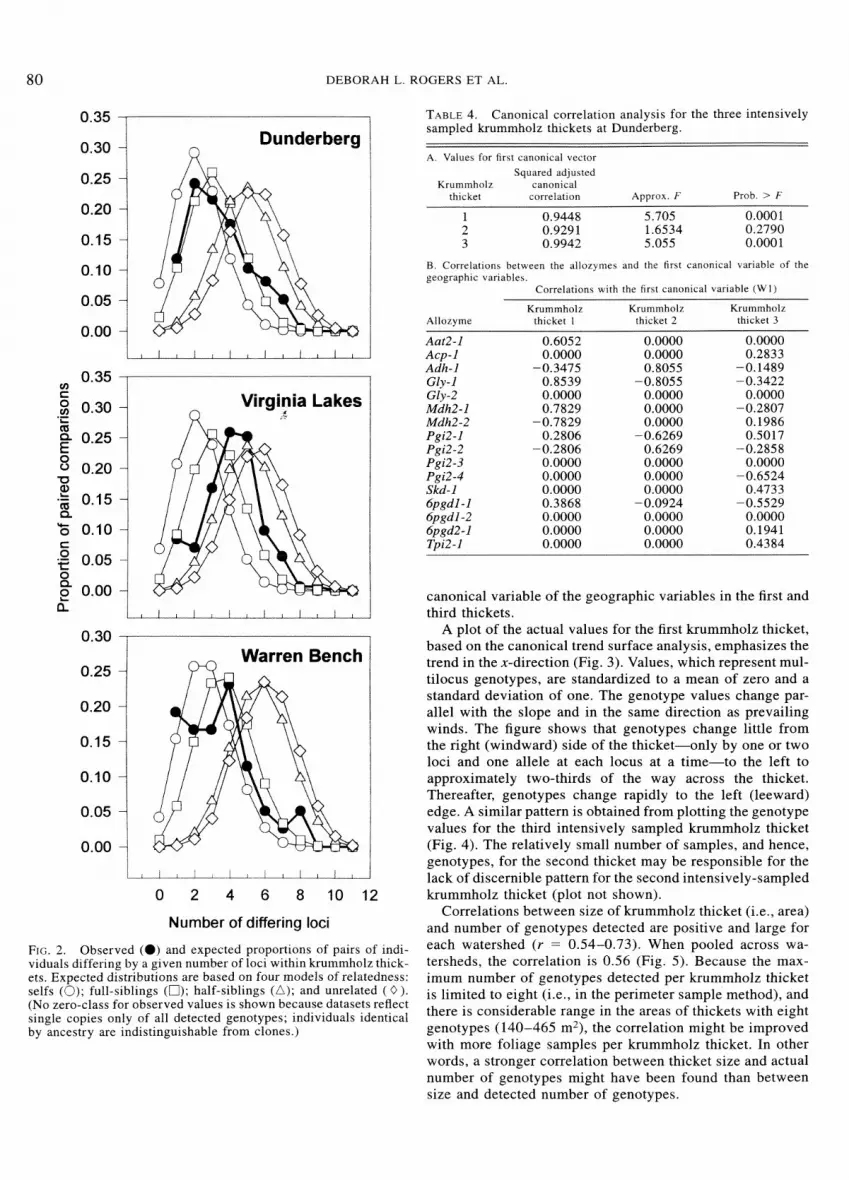
The observed distribution of number of loci exhibiting different genotypes between pairs of samples in krummholz thickets most closely resembles the expected distribution of full-sibling relationships in two of the three watersheds (Fig. 2). At the third watershed site, Virginia Lakes, the observed distribution is approximately bimodal, intermediate to that expected for full- and half-sibling relationships. Thus, this portrayal of within-thicket relationships suggests a slightly higher degree of relationship, on average, than that of the Quellar and Goodnight (1989) estimator.
The correlation between the first pair of canonical variables is large and significant in the first and third intensively sam- pled krummholz thickets (Table 4). The canonical variable representing the geographic (independent) variables was most strongly related to the x-direction in both cases. The x-di- rection is parallel to the contour and perpendicular to the slope of the sampled areas. There are no obvious similarities in the suite of allozymes that are correlated with the first
TABLE 2. Rogers' genetic distance among and within groups of each growth form at every sampled watershed.
Watershed
W ~ t h l n groups Among group\
L'nlque U n ~ q u e Growth form All samples genotypes All samples genotypes
Dunderberg Krummholz thickets Tree clumps
Virginia Lakes Krummholz thickets Tree clumps
Warren Bench Krummholz thickets Tree clumps
DEBORAH L. ROGERS ET AL
Dunderberg I
Virginia a Lakes .'+
1 - Warren Bench /
Number of differing loci
FIG. 2. Observed (@) and expected proportions of pairs of indi- viduals differing by a given number of loci within krummholz thick- ets. Expected distributions are based on four models of relatedness: selfs (0); full-siblings (0); half-siblings (A); and unrelated ( 0 ) . (No zero-class for observed values is shown because datasets reflect single copies only of all detected genotypes; individuals identical by ancestry are indistinguishable from clones.)
TABLE 4. Canonical correlation analysis for the three intensively sampled krummholz thickets at Dunderberg.
A. Values for first canonical vector Squared adjusted
Krummholz canonical thicket correlation Appmx. F Prob. > F
B. Correlations between the allozymes and the first canonical variable of the geographic variables.
Correlations with the first canonical variable (W 1)
Krummholz Krummholz Krummholz Allozyme thicket 1 thicket 2 thicket 3
Aat2-1 Acp-1 Adh-1 Gly-1 Gly -2 Mdh2-1 m 2 - 2 Pgi2-1 Pgi2-2 Pgi2-3 Pgi2-4 Skd- I 6pgd l - 1 6pgdl -2 6pgd2 - 1 Tpi2-1
canonical variable of the geographic variables in the first and third thickets.
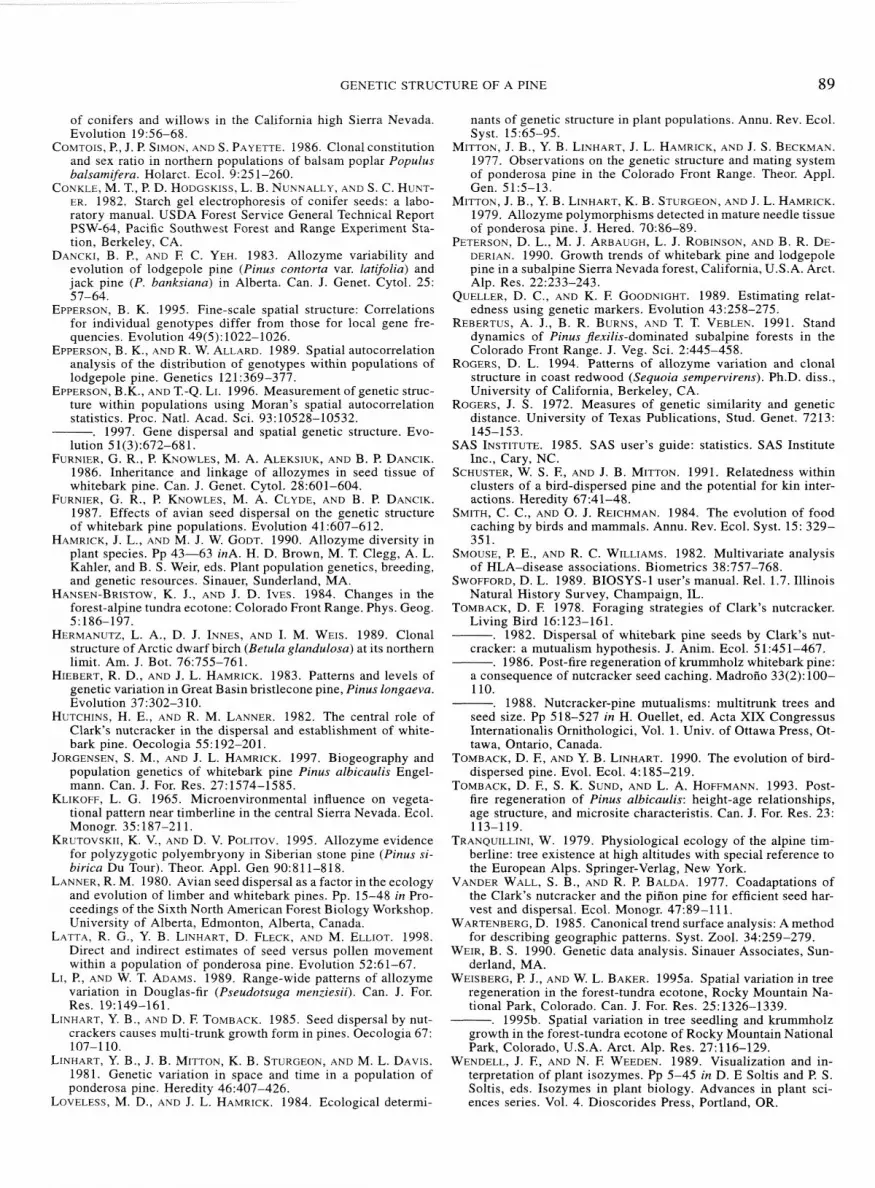
A plot of the actual values for the first krummholz thicket, based on the canonical trend surface analysis, emphasizes the trend in the x-direction (Fig. 3). Values, which represent mul- tilocus genotypes, are standardized to a mean of zero and a standard deviation of one. The genotype values change par- allel with the slope and in the same direction as prevailing winds. The figure shows that genotypes change little from the right (windward) side of the thicket-only by one or two loci and one allele at each locus at a time-to the left to approximately two-thirds of the way across the thicket. Thereafter, genotypes change rapidly to the left (leeward) edge. A similar pattern is obtained from plotting the genotype values for the third intensively sampled krummholz thicket (Fig. 4). The relatively small number of samples, and hence, genotypes, for the second thicket may be responsible for the lack of discernible pattern for the second intensively-sampled krummholz thicket (plot not shown).
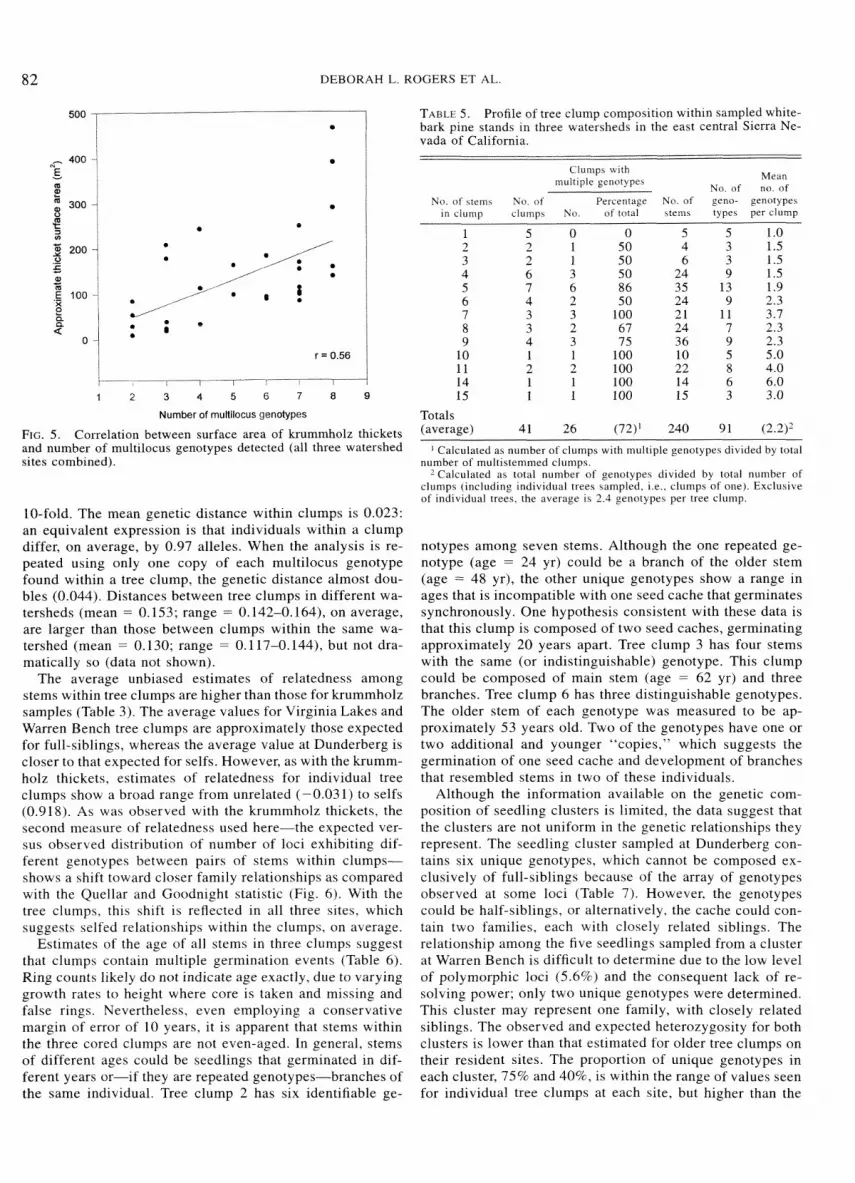
Correlations between size of krummholz thicket (i.e., area) and number of genotypes detected are positive and large for each watershed (r = 0.54-0.73). When pooled across wa- tersheds, the correlation is 0.56 (Fig. 5). Because the max- imum number of genotypes detected per krummholz thicket is limited to eight (i.e., in the perimeter sample method), and there is considerable range in the areas of thickets with eight genotypes (140-465 m2), the correlation might be improved with more foliage samples per krummholz thicket. In other words, a stronger correlation between thicket size and actual number of genotypes might have been found than between size and detected number of genotypes.

GENETIC STRUCTURE OF A PINE
FIG. 3. Standardized values for the multilocus genotypes detected from the first intensively sampled krummholz thicket at Dunderberg based on canonical trend surface analysis, plotted according to their actual spatial relationship to one another, with the x-direction parallel to and the y-direction orthogonal to the slope. Contour lines represent boundaries between intervals of standardized values.
Tree Clumps loci (43-4896, as compared with 52-5'7% for the krummholz
Seventy-two percent of the sampled clumps, with between two and 15 stems per clump, contain two or more genotypes (Table 5). All of these except one contain some putative branches as well. Conversely, 28% of the sampled tree clumps-some with as many as nine stems-reveal only one genotype (putatively "multitrunk trees"). All of the tree clumps with 10 or more stems contain at least three geno- types. The maximum number of genotypes found in any tree clump is six: one such clump is composed of seven stems,
thickets) and fewer differing alleles between stems within clumps (0.95-1.46 averaged within sites as compared with 2.25-3.76 for krummhoEz thickets). One-third of the tree clumps at Dunderberg and Virginia Lakes and one-half of the tree clumps at Warren Bench were not in Hardy-Weinberg equilibrium (data not shown). Most often, this disequilibrium was due to an excess of heterozygotes. (See, for example, F,,-values in Table 9B) Thus, the level and nature of dis- equilibrium appeared to be similar between the two growth
the other, 14. The average number of stems per tree clump f ~ m ~ s . is 2.2: the average is less than two for clusters with five or Genetic distance among tree clu~llps is much greater than fewer stems. The largest sampled tree clump, with 15 stems, that within clumps (Table 2). Distance among tree clumps, is composed of only three genotypes. on average at each watershed, is approximately three times
Genetic diversity values are modestly high for the tree that within clumps (when only one copy per genotype is clumps and similar to those found for the krurnmholz thickets, included in the analysis). The range of genetic distances with- with two exceptions (Table 1). There are fewer polymorphic in tree clumps on the same watershed varies from five- to
FIG. 4. Standardized values for the multilocus genotypes detected from the third intensively sampled krummholz thicket at Dunderberg based on canonical trend surface analysis, plotted according to their actual spatial relationship to one another, with the x-direction parallel to and the y-direction orthogonal to the slope. Contour lines represent boundaries between intervals of standardized values.
82 DEBORAH L. ROGERS ET AL.
i I I 1 I I I 1
1 2 3 4 5 6 7 8 9
Number of multilocus genotypes
FIG. 5. Correlation between surface area of krumrnholz thickets and number of multilocus genotypes detected (all three watershed sites combined).
10-fold. The mean genetic distance within clumps is 0.023: an equivalent expression is that individuals within a clump differ, on average, by 0.97 alleles. When the analysis is re- peated using only one copy of each multilocus genotype found within a tree clump, the genetic distance almost dou- bles (0.044). Distances between tree clumps in different wa- tersheds (mean = 0.153; range = 0. 1 42-0.164), on average, are larger than those between clumps within the same wa- tershed (mean = 0.130; range = 0.117-0.144), but not dra- matically so (data not shown).
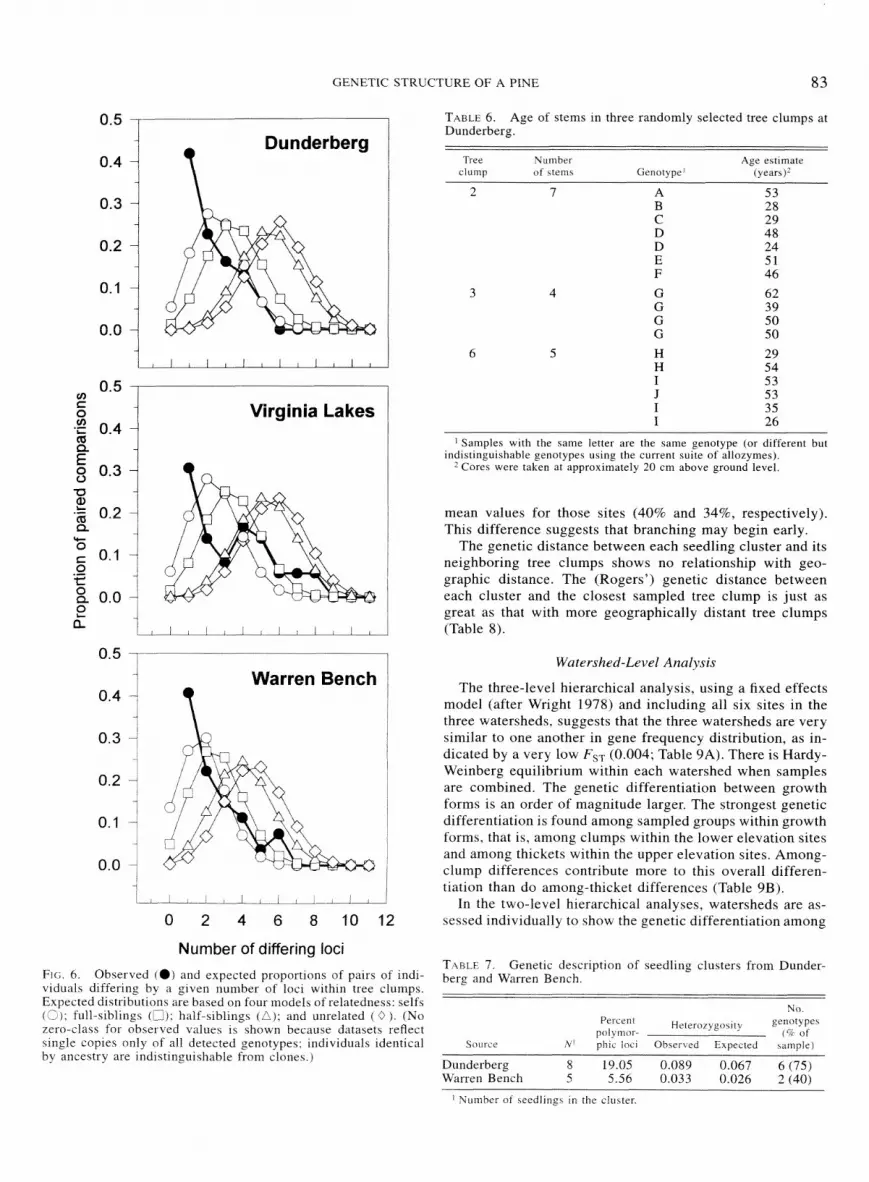
The average unbiased estimates of relatedness among stems within tree clumps are higher than those for krummholz samples (Table 3). The average values for Virginia Lakes and Warren Bench tree clumps are approximately those expected for full-siblings, whereas the average value at Dunderberg is closer to that expected for selfs. However, as with the krumm- holz thickets, estimates of relatedness for individual tree clumps show a broad range from unrelated (-0.031) to selfs (0.918). As was observed with the krummholz thickets, the second measure of relatedness used here-the expected ver- sus observed distribution of number of loci exhibiting dif- ferent genotypes between pairs of stems within clumps- shows a shift toward closer family relationships as compared with the Quellar and Coodnight statistic (Fig. 6). With the tree clumps, this shift is reflected in all three sites. which suggests selfed relationships within the clumps, on average.
Estimates of the age of all stems in three clumps suggest that clumps contain multiple germination events (Table 6). Ring counts likely do not indicate age exactly, due to varying growth rates to height where core is taken and missing and false rings. Nevertheless, even employing a conservative margin of error of 10 years, it is apparent that stems within the three cored clumps are not even-aged. In general, stems of different ages could be seedlings that germinated in dif- ferent years or-if they are repeated genotypes-branches of the same individual. Tree clump 2 has six identifiable ge-
TABLE 5. Profile of tree clump composition within sampled white- bark pine stands in three watersheds in the east central Sierra Ne- vada of California.
Mean No. of no. of
No of \tern\ No of Percentage No of geno- genotype\ in clump clumps. S o of total \tern\ types. per clump
1 2 3 4 5 6 7 8 9
10 11 14 15
Totals (average)
Calculated as number of clumps with multiple genotypes divided by total number of multistemmed clumps.
Ta lcu la t ed as total number of genotypes divided by total number of clumps (including individual trees sampled. i.e., clumps of one). Exclusive of individual trees. the average is 2.4 genotypes per tree clump.
notypes among seven stems. Although the one repeated ge- notype (age = 24 yr) could be a branch of the older stem (age = 48 yr), the other unique genotypes show a range in ages that is incompatible with one seed cache that germinates synchronously. One hypothesis consistent with these data is that this clump is composed of two seed caches, germinating approximately 20 years apart. Tree clump 3 has four stems with the same (or indistinguishable) genotype. This clump could be composed of main stem (age = 62 yr) and three branches. Tree clump 6 has three distinguishable genotypes. The older stem of each genotype was measured to be ap- proximately 53 years old. Two of the genotypes have one or two additional and younger "copies," which suggests the germination of one seed cache and development of branches that resembled stems in two of these individuals.
Although the information available on the genetic com- position of seedling clusters is limited, the data suggest that the clusters are not uniform in the genetic relationships they represent. The seedling cluster sampled at Dunderberg con- tains six unique genotypes, which cannot be composed ex- clusively of full-siblings because of the array of genotypes observed at some loci (Table 7). However, the genotypes could be half-siblings, or alternatively, the cache could con- tain two families. each with closely related siblings. The relationship among the five seedlings sampled from a cluster at Warren Bench is difficult to determine due to the low level of polymorphic loci (5.6%) and the consequent lack of re- solving power; only two unique genotypes were determined, This cluster may represent one family, with closely related siblings. The observed and expected heterozygosity for both clusters is lower than that estimated for older tree clumps on their resident sites. The proportion of unique genotypes in each cluster, 75% and 40%, is within the range of values seen for individual tree clumps at each site, but higher than the
GENETIC STRUCTURE OF A PINE 83
TABLE 6. Age of stems in three randomly selected tree clumps at Dunderberg.
Dunderberg I Tree Piumber Age estlrnate clump of stern5 Genotype" t years):
2 7 A 53 B 2 8 C 29 D 48 D 24 E 5 1 F 46
Virginia Lakes 1 I
' Samples with the same letter are the same genotype (or different but indistinguishable genotypes using the current suite of allozymes).
*Cores were taken at approximately 20 cm above ground level.
mean values for those sites (40% and 34%' respectively). This difference suggests that branching may begin early.
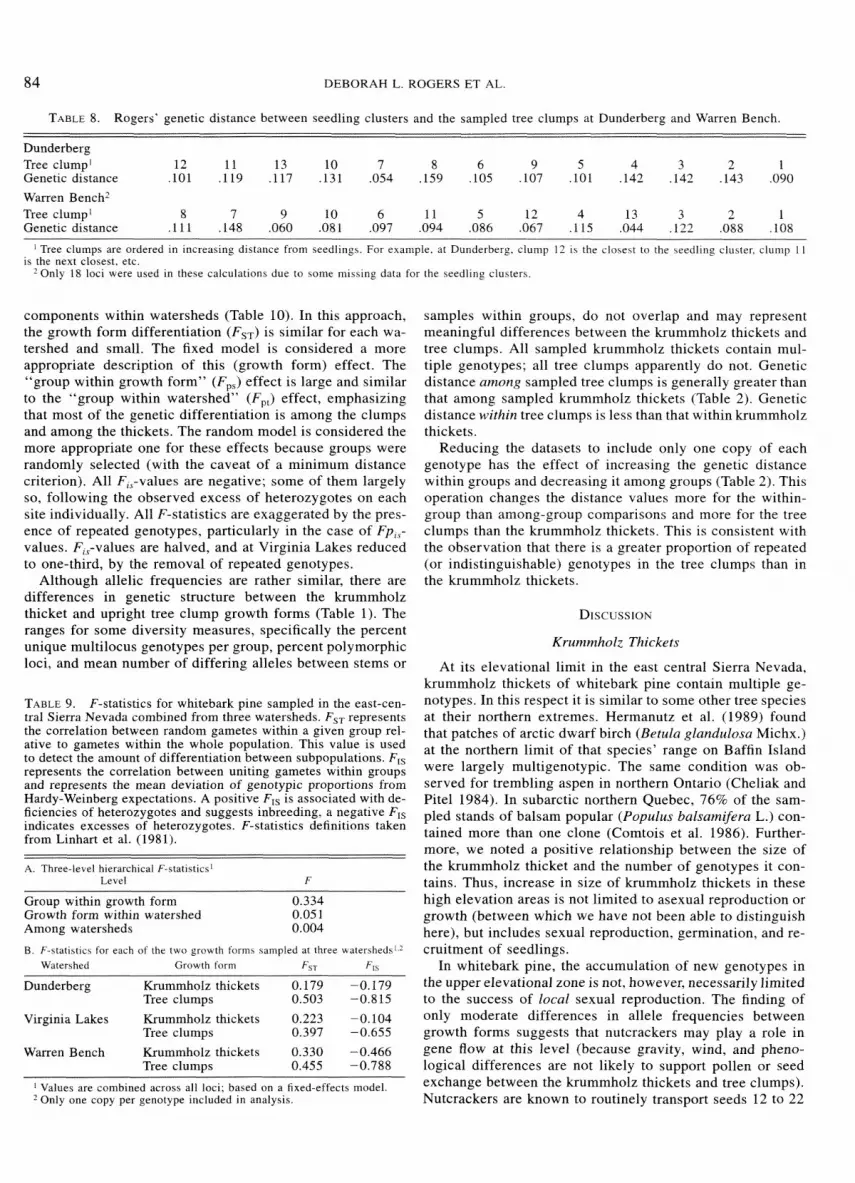
The genetic distance between each seedling cluster and its neighboring tree clumps shows no relationship with geo- graphic distance. The (Rogers') genetic distance between each cluster and the closest sampled tree clump is just as great as that with more geographically distant tree clumps (Table 8).
Watershed-Level Analysis Warren Bench The three-level hierarchical analysis, using a fixed effects
model (after Wright 19'78) and including all six sites in the three watersheds, suggests that the three watersheds are very similar to one another in gene frequency distribution, as in- dicated by a very low FST (0.004; Table 9A). There is Hardy- Weinberg equilibrium within each watershed when samples are combined. The genetic differentiation between growth forms is an order of magnitude larger. The strongest genetic differentiation is found among sampled groups within growth forms, that is, among clumps within the lower elevation sites and among thickets within the upper elevation sites. Arnong- clump differences contribute more to this overall differen- tiation than do among-thicket differences (Table 9B).
In the two-level hierarchical analyses, watersheds are as- sessed individually to show the genetic differentiation among
Number of differing loci TABLE 7. Genetic description of seedling clusters from Dunder- berg and Warren Bench. FIG. 6. Observed (@) and expected proportions of pairs of indi-
viduals differing by a given number of loci within tree clumps. Expected distributions are based on four models of relatedness: selfs (2); full-siblings (L); half-s~blings (L); and unrelated ( 0 ). (No zero-class for observed values 1s shou-n because datasets reflect ungle copies only of all detected genotypes; individuals identical by ancestry are indi~tinguirhable from clones.)
N o
Percent Hetero7ygo\lrq genotYPe' pol y mor- ("iir ot
Source A ' p h ~ c Inca Ob\erved Expected \ample)
Dunderberg 8 19.05 0.089 0.067 6 (75) Warren Bench 5 5.56 0.033 0.026 2 (40)
Nnrnber ot 5eedIingc rn the cinster.
84 DEBORAH L. ROGERS ET AL.
TABLE 8. Rogers' genetic distance between seedling clusters and the sampled tree clumps at Dunderberg and Warren Bench.
Dunderberg Tree clump" 12 11 13 10 7 8 6 9 5 4 3 2 1 Genetic distance . lo1 .I19 .I17 .I31 ,054 .I59 .I05 . lo7 . lo1 .I42 .I42 .I43 ,090
W r e n Bench2 Tree clump1 8 7 9 10 6 11 5 12 4 13 3 2 1 Genetic distance '111 .I48 ,060 .081 .097 .094 .Of36 .067 . l l S .044 .I22 .088 ,108
Tree clumps are ordered in increasing distance from seedlings. For example, at Dunderberg. clump 12 tc the closest to the seedllng cluster. clump I I is the next closest, etc.
W n l y 18 loci a e r e used in these calculations due to some rnlssing data for the seedling clusters.
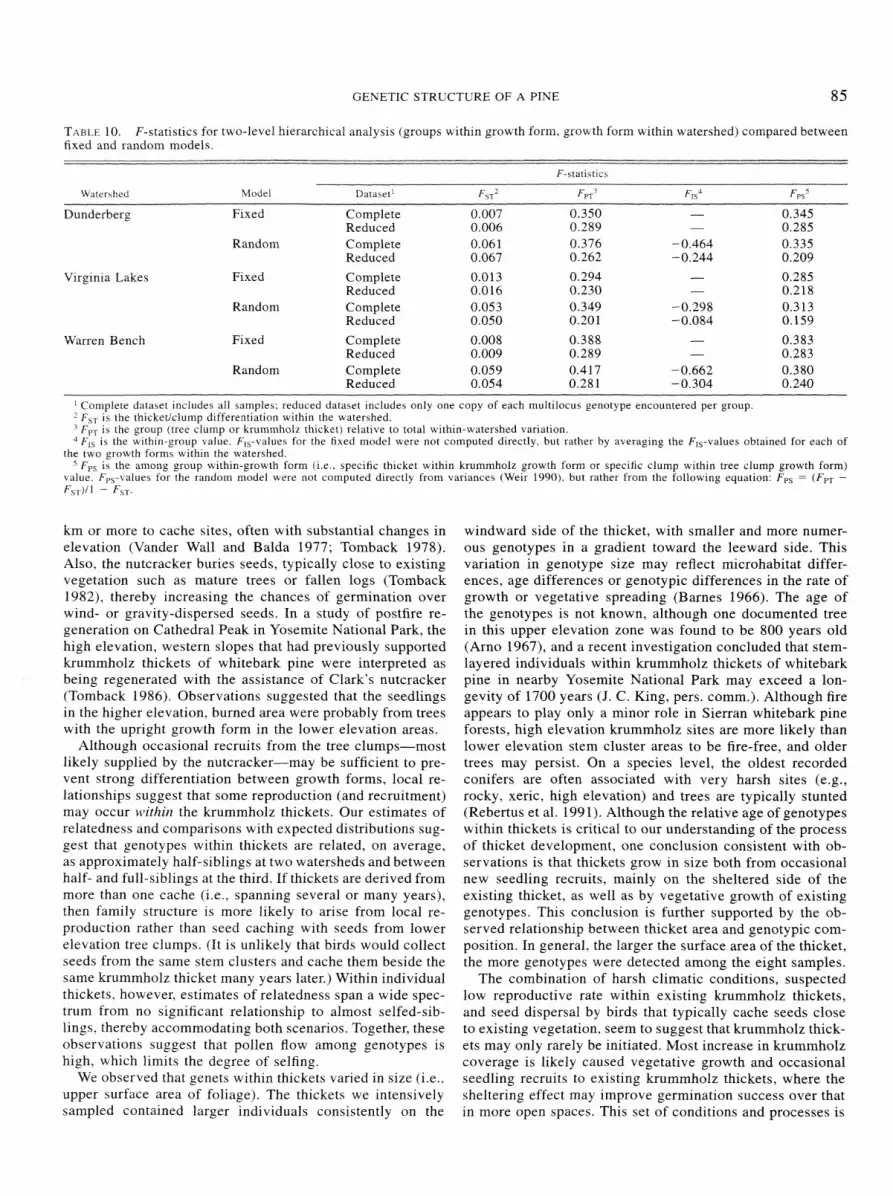
components within watersheds (Table 10). In this approach, the growth form differentiation (FST) is similar for each wa- tershed and small. The fixed model is considered a more appropriate description of this (growth form) effect. The "group within growth form" (Fbs) effect is large and similar to the "group within watershed" (Fpt) effect, emphasizing that most of the genetic differentiation is among the clumps and among the thickets. The random model is considered the more appropriate one for these effects because groups were randomly selected (with the caveat of a minimum distance criterion). All F,,-values are negative; some of them largely so, following the observed excess of heterozygotes on each site individually. All F-statistics are exaggerated by the pres- ence of repeated genotypes, particularly in the case of Fp,,- values. F,,-values are halved, and at Virginia Lakes reduced to one-third, by the removal of repeated genotypes.
Although allelic frequencies are rather similar, there are differences in genetic structure between the krumrnholz thicket and upright tree clump growth forms (Table 1). The ranges for some diversity measures, specifically the percent unique multilocus genotypes per group, percent polymorphic loci, and mean number of differing alleles between stems or
TABLE 9. F-statistics for whitebark pine sampled in the east-cen- tral Sierra Nevada combined from three watersheds. Fs, represents
samples within groups, do not overlap and may represent meaningful differences between the krummholz thickets and tree clumps. All sampled krummholz thickets contain mul- tiple genotypes; all tree clumps apparently do not. Genetic distance among sampled tree clumps is generally greater than that among sampled krummholz thickets (Table 2). Genetic distance within tree clumps is less than that within krummholz thickets.
Reducing the datasets to include only one copy of each genotype has the effect of increasing the genetic distance within groups and decreasing it among groups (Table 2). This operation changes the distance values more for the within- group than among-group comparisons and more for the tree clumps than the krummholz thickets. This is consistent with the observation that there is a greater proportion of repeated (or indistinguishable) genotypes in the tree clumps than in the krummholz thickets.
Krummholz Thickets
At its elevational limit in the east central Sierra Nevada, krummholz thickets of whitebark pine contain multiple ge- notypes. In this respect it is similar to some other tree species at their northern extremes. Hermanutz et al. (1989) found
the ~ ~ r r e l a t i o n between random gametes within a given group rel- that patches of arctic dwarf birch (Betula glandulosa Michx.) ative to gametes within the whole population. This value is used at the northern limit of that species, range on Baffin Island to detect the amount of differentiation between subpopulations. FIs represents the correlation between uniting gametes within groups were largely mult igenOt~~ic. The same was Ob-
and represents the mean deviation of genotypic proportions from served for trembling aspen in northern Ontario (Cheliak and Hardy-Weinberg expectations. A positive FIs is associated with de- Pitel 1984). In subarctic northern Quebec, 76% of the Sam- - frciencies of heterozygotes and suggests inbreeding5 a negative FIS pled stands of balsam popular (Populus balsamifera L.) con- indicates excesses of heterozygotes. F-statistics definitions taken from Linhart et al. (1981). tained more than one clone (Comtois et al. 1986). Further-
more, we noted a positive relationship between the size of A. Three-level hierarchical F-statistics1 the krummholz thicket and the number of genotypes it con-
Level F
Group within growth form 0.334 Growth form within watershed 0.05 1 Among watersheds 0.004
B. F-statistics for each of the two growth forms sampled at three ~ a t e r s h e d s ~ ' Watershed Growth form Fsr Fis
Dunderberg Krummholz thickets 0.179 -0.179 Tree clumps 0.503 -0.815
Virginia Lakes Krummholz thickets 0.223 -0.104 Tree clumps 0.397 -0.655
Warren Bench IG-ummholz thickets 0.330 -0.466 Tree clumps 0.455 -0.788
Values are combined across all loci; based on a fixed-effects model. ' Only one copy per genotype included in analysis.
tains. Thus, increase in size of krummholz thickets in these high elevation areas is not limited to asexual reproduction or growth (between which we have not been able to distinguish here), but includes sexual reproduction, germination, and re- cruitment of seedlings.
In whitebark pine, the accumulation of new genotypes in the upper elevational zone is not, however, necessarily limited to the success of local sexual reproduction. The finding of only moderate differences in allele frequencies between growth forms suggests that nutcrackers may play a role in gene flow at this level (because gravity, wind, and pheno- logical differences are not likely to support pollen or seed exchange between the krummholz thickets and tree clumps). Nutcrackers are known to routinely transport seeds 12 to 22
GENETIC STRUCTURE OF A PINE 85
TABLE 10. F-statistics for two-level hierarchical analysis (groups within growth form, growth form within watershed) compared between fixed and random models.
F-statlrtici
Dunderberg
Virginia Lakes
Warren Bench
Fixed Complete Reduced
Random Complete Reduced
Fixed Complete Reduced
Random Complete Reduced
Fixed Complete Reduced
Random Complete Reduced
Cornplete dataset Includes all samples, reduced dataset Includes only one copy of each mult~locus genotype encountered per group FsT 1s the thiclreticlun~p drfferent~ation wlthrn the watershed FpT 1s the group (tree clump or krummholz th~cket) relat~ve to total urthln-watershed varlatlon Fls 1s the with~n-group value Fls-kalues for the fixed model were not computed directly, but rather by averagmg the F,-values obtained for each of
the two growth forms wlthrn the watershed Fps 15 the among group within-growth form ir e , speclfic thicket w~thin krummholz growth form or specrfic clump withln tree clump growth form)
kalue Fp,-balues for the random model were not computed d~rectly from variances (Weir 1990), but rather from the following equatlon FPs = (FPT - F,,)/l - FST
km or more to cache sites, often with substantial changes in elevation (Vander Wall and Balda 1977; Tomback 1978). Also. the nutcracker buries seeds, typically close to existing vegetation such as mature trees or fallen logs (Tomback 1982), thereby increasing the chances of germination over wind- or gravity-dispersed seeds. In a study of postfire re- generation on Cathedral Peak in Yosemite National Park, the high elevation, western slopes that had previously supported krummholz thickets of whitebark pine were interpreted as being regenerated with the assistance of Clark's nutcracker (Tomback 1986). Observations suggested that the seedlings in the higher elevation, burned area were probably from trees with the upright growth form in the lower elevation areas.
Although occasional recruits from the tree clumps-most likely supplied by the nutcracker-may be sufficient to pre- vent strong differentiation between growth forms, local re- lationships suggest that some reproduction (and recruitment) may occur within the krummholz thickets. Our estimates of relatedness and comparisons with expected distributions sug- gest that genotypes within thickets are related, on average, as approximately half-siblings at two watersheds and between half- and full-siblings at the third. If thickets are derived from more than one cache (i.e., spanning several or many years), then family structure is more likely to arise from local re- production rather than seed caching with seeds from lower elevation tree clumps. (It is unlikely that birds would collect seeds from the same stem clusters and cache them beside the same krummholz thicket many years later.) Within individual thickets, however, estimates of relatedness span a wide spec- trum from no significant relationship to almost selfed-sib- lings, thereby accommodating both scenarios. Together, these observations suggest that pollen flow among genotypes is high, which limits the degree of selfing.
We observed that genets within thickets varied in size (i.e., upper surface area of foliage). The thickets we intensively sampled contained larger individuals consistently on the
windward side of the thicket, with smaller and more numer- ous genotypes in a gradient toward the leeward side. This variation in genotype size may reflect microhabitat differ- ences, age differences or genotypic differences in the rate of growth or vegetative spreading (Barnes 1966). The age of the genotypes is not known, although one documented tree in this upper elevation zone was found to be 800 years old (Arno 1967), and a recent investigation concluded that stem- layered individuals within krummholz thickets of whitebark pine in nearby Yosemite National Park may exceed a lon- gevity of 1700 years (J. C. King, pers. comm.). Although fire appears to play only a minor role in Sierran whitebark pine forests, high elevation krummholz sites are more likely than lower elevation stem cluster areas to be fire-free, and older trees may persist. On a species level, the oldest recorded conifers are often associated with very harsh sites (e.g., rocky, xeric, high elevation) and trees are typically stunted (Rebertus et al. 1991). Although the relative age of genotypes within thickets is critical to our understanding of the process of thicket development, one conclusion consistent with ob- servations is that thickets grow in size both from occasional new seedling recruits, mainly on the sheltered side of the existing thicket, as well as by vegetative growth of existing genotypes. This conclusion is further supported by the ob- served relationship between thicket area and genotypic com- position. In general, the larger the surface area of the thicket, the more genotypes were detected among the eight samples.
The combination of harsh climatic conditions, suspected low reproductive rate within existing krummholz thickets, and seed dispersal by birds that typically cache seeds close to existing vegetation, seem to suggest that krumrnholz thick- ets may only rarely be initiated. Most increase in krummholz coverage is likely caused vegetative growth and occasional seedling recruits to existing krummholz thickets, where the sheltering effect may improve germination success over that in more open spaces. This set of conditions and processes is

86 DEBORAH L. ROGERS ET AL.
consistent with the observed pattern of high genotypic di- versity within thickets and as much genetic distance among as within thickets.
Tree Clumps
Most tree clumps in the sampled watersheds contain more than one genotype, which is consistent with two earlier stud- ies in other regions of the species' natural range. In the first such investigation, Linhart and Tomback (1985) found that five of the six multistemmed clusters sampled (83%) in Wy- oming showed two or more genotypes, this differentiation being based on only four loci, two of which were polymor- phic. In the Rocky Mountains, near Calgary, Alberta, 23 of the 35 whitebark pine clumps sampled (66%) were found to contain more than one genotype using a suite of 11 loci (Furnier et al. 1987). These two earlier studies plus the cur- rent study together present observations of genetic structure of tree clumps near the geographic limits of the species' natural range-the southwestern, northcentral, and north- eastern margins, respectively. Thus, this multigenotypic con- dition of tree clumps appears to be a rangewide phenomenon, despite regional differences in climate, ecology, and history.
Limber pine, which also occurs in the subalpine and at treeline and also has its seeds dispersed by Clark's nutcracker, may show more variability among regions in the genotypic composition of its tree clumps. In 19 sampled clumps of limber pine in Colorado and Wyoming, 15 (79%) contained more than one genotype (Linhart and Tomback 1985). In contrast, only 18% of 108 sampled tree clumps in a Colorado population were multigenotypic (Schuster and Mitton 1991). Carsey and Tomback (1994), sampling four populations in Colorado, found that 23.5-81% of tree clumps were multi- genotypic.
Although most tree clumps of whitebark pine in this part of the species' range have two or more genotypes, the con- verse condition is equally compelling. More than one-quarter of the clumps are composed of only one putative genotype. Furthermore, in none of the sampled clumps were all of the stems different genotypes. There are three plausible expla- nations for the apparently monogenotypic clumps and ge- netically indistinct stems in multigenotypic clumps. The first is that some stems are actually branches-a conclusion reached by Schuster and Mitton (199 1) for a large proportion of sampled multistemmed clumps of limber pine. This pos- sibility is consistent with the observation that in the study area, "skirts" of branches, which bend out and then up, are common at the base of young trees. As these grow, the bases could easily be covered by litter and these branches mistaken for closely situated stems. Although no obvious branches were sampled in this study, stems were often so closely sit- uated that they appeared to arise from a common below- ground origin. This possibility is also strongly supported by the age profiles of the sampled stems in three tree clumps. There is always a 10- to 25-year difference between the age of the oldest stem of a putative multistemmed tree and its next nearest-aged member.
The second explanation is that multiple members of a pu- tative multistemmed tree are actually different, but indistin- guishable (with the 21-locus survey) genotypes. In that case,
one would expect them to be from the same seed cache. very closely related (i.e., selfs, full- or half-siblings), and ap- proximately even-aged (i.e., germination in whitebark pine seeds within the same cache may be staggered over several years and may occasionally span up to eight years; Tomback et al, 1993). The evidence in support of the stems being indistinguishable but different genotypes is found in the iso- zyme analysis of seedlings from two seed caches. In both cases, some seedlings were not genetically differentiated by the suite of allozymes used in this study. However, in both cases, the number of polymorphic loci was much reduced from the overall population, which suggests that the power of resolution in the mature stem clusters may have been con- siderably greater than that in the two sampled seed caches. Furthermore, the ability to detect closely related siblings is high, as indicated by the expected low proportion of indi- viduals that would not differ at any loci (Figs. 1, 5).
The third possibility is that of cleavage polyembryony, in which embryos of a single egg divide to produce identical embryos. Polyembryony is known to be a constant feature of pines (Buchholz 1918) and has been well studied both embryologically and cytologically in many pine species but rarely studied genetically (Krutovskii and Politov 1995). (The second type of polyembryony, simple or noncleavage, also occurs in pines and results in heterogenic embryos within the ovule.) One genetic study of polyembryony in Siberian stone pine (Pinus sibirica Du Tour) determined that more than 2% of mature seeds contained more than one embryo and half of those were apparently the result of cleavage poly- embryony (Krutovskii and Politov 1995). To the extent that the multiple embryos germinate, they contribute to hyper- familial relationships (simple polyembryony) or genetically identical copies (cleavage polyembryony) in the seedlings. Our conservative conclusion is that branches, genetically in- distinguishable trees, and polyembr yony all may contribute to the incidence of single-genotype clumps and repeated ge- notypes within multigenotypic clumps. However, we strongly suspect that branches play the greatest role.
Genetic relationships within clumps show a spectrum of possibilities, characterized by small genetic distances and estimates of relatedness that average greater than full-sibling on two watersheds and greater than half-sibling on the third. The mean genetic distance within clumps (0.023 for all data; 0.044 for single copies of each genotype) is less than the average reported (0.075) in the tree clumps in the Rocky Mountains (Furnier et al. 1987). Our observations are con- sistent with Tomback's (1988) estimate that 73-9392 of cach- es contain two or more sibling or half-sibling seeds.
This spectrum of genetic relationships within clumps has been previously reported for limber pine. Carsey and Tom- back (1994). studying the composition of clumps of limber pine in the Colorado Front Range of the southern Rocky Mountains, found that relatedness between clump members varies widely. Individuals in some clumps were unrelated; in others, they were related as half-siblings, and in still others they were related more closely than full-siblings. On average, trees within clumps were related as half- to full-siblings. By using the same measure of relatedness and sampling near the eastern extreme of the range of limber pine in northeastern Colorado, Schuster and Mitton (1991) found that individual
GENETIC STRUCTURE OF A PINE 87
estimates of relatedness vary widely among clumps. Their estimate of average relatedness within clumps is slightly less than half-siblings.
The high genetic distances among clumps are consistent with the high levels of genetic differentiation among clumps indicated by the high FsT-values. This observation is con- sistent with that of Furnier et al. (198'71, who studied genetic relationships within and among whitebark pine clumps in Alberta, Canada. In that study, mean genetic distance between individuals in different clumps was more than 3.5 times great- er than that between individuals within the same clump, in one of the two populations sampled. This genetic structure reflects what is known about bird caching behavior in relation to the scale of sampling for this study. Specifically, seeds are more likely to be related by full- and half-sibling relation- ships if they are in the same "pouchful" (i.e., one cache series) of a bird than are seeds in different pouches (either of the same bird on different trips or of different birds). A pouchful of seeds is deposited in a series of caches, each containing one to 15 seeds (Tomback 1982), with 10 to 300 cm between nearest-neighbor caches (Tomback 1978). Using the mean (77) or median (55) number of seeds per pouch (Tomback 1982), the mean values for seeds deposited per cache (3.7; Tomback 1982) and nearest-neighbor cache dis- tance between caches (67 cm; Tomback 1978), and the as- sumption that caches in a series are arranged linearly-which maximizes the distance between the first and last cache in a series-we find that the distance between first and last caches in a series is 10.0-13.9 m. Thus, it is likely that many seeds within one pouchful are deposited within a 30-m distance from one another, the minimum distance criterion for sam- pling clumps for this study. Although the numbers used to reach this deduction are estimates and representative of a range of values and nutcrackers may often fly considerable distances between caches within a series, these observations do suggest that we more likely than not sampled clumps that resulted from different pouchfuls.
Conversely, the genetic observations also suggest that in- dividual birds may often cache seeds below the tree clump from which they have been harvested. If the situation were otherwise, multiple caching series from the same tree clump-deposited in diverse locations-would tend to reduce genetic distance among clumps at the scale we sampled. Fur- thermore, the age structure evidence suggests that there are instances of different-aged genotypes within clusters that are nevertheless closely related.
We predict that this caching behavior of the nutcracker should have two consequences for genetic structure among clumps. First, clumps in different caching series should have high genetic distances and FsTs among them. This is pre- sumably the scale at which we were sampling in the present study and the prediction is confirmed by our results. Second, clumps within a caching series should have low genetic dis- tances among them, assuming there is some degree of mixing within the sublingual pouch during flight. Distances among clumps within a series might be only slightly higher than genetic distances within clumps. This level of the genetic architecture for whitebark pine has not yet been studied. Al- though Clark's nutcracker is not the only animal to harvest and store seeds of whitebark pine, it is presumed to be the
primary dispersal agent that contributes most to whitebark pine regeneration in the study area, particularly in the tree clump zone. This conclusion is based on such observations as the dominant presence of the Clark's nutcracker, its high level of caching activity. the number of seeds it caches that are left unharvested (i.e., relative to the caching activity of chipmunks [Eutanzias spp. 1, squirrels [ Tamiasciurus spp. J , and deer mice [Peronzyscus maniculadus Le Contej), and its method of caching, which may favor germination (Hutchins and Lanner 1982, Tomback 1982).
There is little genetic differentiation among watersheds, This was initially a somewhat surprising result because wa- tersheds differed not only by the greatest geographic distance of all studied classification variables, but in the slope aspects that were sampled. High substrate temperatures, which are influenced by slope aspect, are a major source of seedling mortality (Tomback 1986). Slope aspect has been previously found to be associated with population differentiation over small geographic distances in another western coniferous spe- cies, ponderosa pine (Pinus ponderosa Laws.; Mitton et al. 1977). We attribute the observed lack of differentiation among watersheds to the homogenizing effect of seed dis- persal by birds. The three watersheds in this study are easily within the caching area of individual nutcrackers and sub- sequent seed dispersal distance from individual trees, which requires a seed-dispersal radius of only 10 km. Nutcrackers may routinely transport seeds 12 to 22 km or more to cache sites (Tomback and Linhart 1990).
At the level of overall gene frequencies, we observed only modest genetic differentiation between the two distinct growth forms of whitebark pine, on the scale of that observed among populations of western coniferous species. There is no loss in genetic variation in the krummholz form at the species' elevational extreme relative to the upright tree clump growth form at the lower elevations. Genetic differences be- tween growth forms are expressed in terms of local genetic structure and average relatedness within groups rather than allelic frequencies. In the krummholz growth form, there are many genotypes per thicket and similar genetic distances within and among thickets. In the tree clump growth form, there are few genotypes per clump and more genetic distance among than within clumps. There are two caveats to these observations. Because we sampled more area within thickets than within clumps, expressing the genotypic density in terms of number of genotypes per unit area would result in a dif- ferent observation. Also, in the tree clumps, we did not sam- ple adjacent clumps, as we typically did with the krummholz thickets. On average, individuals within clumps are more closely related than individuals within krummholz thickets.
We hypothesize a difference in the temporal dynamics of krummholz and tree clump composition. The thickets may be older than the clumps and accumulate genetic variation slowly. with some genotypes persisting by layering. Fur- thermore, thickets may only rarely be initiated. The stems within clumps analyzed for age in this study suggest that the clumps are young relative to the biological potential of the species. This observation is consistent with an age-structure
88 DEBORAH L. ROGERS ET AL.
study of the species conducted just south of the study area in the mid-1980s. There, most whitebark pine trees sampled were less than 120 years old, with the highest frequency category being 61-80 yr old (Peterson et al. 1990). Younger trees, those with diameter at breast height (dbh) less than 4 cm, were not included in that study, which skews the results towards an older demographic structure. The stem clusters at lower elevations may die and be replaced more quickly with new clusters, thus leading to a genetic landscape that changes more quickly over time than at upper elevations.
A study of conifers in the forest-tundra ecotone of the Rocky Mountains in Colorado shows that limber pine krummholz has a higher density of both living and dead ascending stems than does subalpine fir (Abies lasiocarpa ([Hook.] Nutt.) or Engelmann spruce (Picea engelmannii [Parry]) krummholz (Weisberg and Baker 1995b). Conse- quently, limber pine might show the most rapid patch height increase response to climate change, as compared to the other coniferous species in that region. In the present study, the absence of strong genetic differentiation between the growth forms and the existence of high levels of genetic variation in the krummholz growth form suggest that there is genetic potential for whitebark pine to respond to favorable shifts in climate, perhaps as ably or more so than limber pine.
Genetic Structure in Relation to Other Western Conifers
Since the 1980s, abundant allozyme studies of widespread, open-pollinated, coniferous species in the western United States and elsewhere-most of which have wind-dispersed seed-have composed a rather consistent pattern of genetic architecture for this taxonomic group (e.g., Dancik and Yeh 1983; Hiebert and Hamrick 1983; Li and Adams 1989; Wheeler et al. 1995). For such species, genetic differences among populations are low and within populations are high (e.g., Hamrick and Godt 1990). This pattern is assumed to be maintained by high levels of gene flow-both seed- and pollen-mediated-among populations, with genetic differ- ences developing only over large distances. The sampling design for such studies often is focused on broad-scale ge- netic structure. Studies designed specifically to learn about fine-scale genetic structure in western conifers have focused on relatively few species (e.g., Linhart et al. 1981; Epperson and Allard 1989; Rogers 1994; Latta et al. 1998). In contrast, studies by Linhart et al. (1981) of ponderosa pine suggest a family structure over short distances, with no evidence of inbreeding.
Sampling intensity required to detect fine-scale structure may vary according to species attributes and even among populations of the same species, given differences in envi- ronments among populations. Analyses of genotypes within two populations of lodgepole pine detected little genetic structure, which is consistent with the wind-dispersal over large distances of both seed and pollen in this species (Ep- person and Allard 1989). However, the sampling design did not permit detection of structure on a scale smaller than 50 feet.
Our results with whitebark pine suggest that considerably more genetic structure may exist within local populations of some coniferous species than these average values suggest.
The high allozyme diversity frequently reported within co- nifer populations may not be randomly distributed. Rather, when sampled for ecologically significant patterns, this di- versity may reflect significant genetic structure. In particular, local genetic structure may be expected where microenvi- ronmental factors change on this scale or where seed andlor pollen dispersal may not follow conifer conventions.
In whitebark pine, bird dispersal of seed, local climatic and topographic effects, and growth form suggest a suite of conditions that are meaningfully related to genetic structure. Biologically significant local patterns in genetic structure may exist also in other conifers, but may be more subtle or not apparent with conventional sampling schemes. For ex- ample, genetic structuring may also be viewed from the per- spective of pollen versus seed-mediated structure, yet con- ventional (i.e., allozyme) markers consider biparental struc- ture only. When maternally and paternally inherited genetic markers were compared within a population of ponderosa pine, considerable patch structure was observed for (mater- nally inherited) mtDNA, but not for (paternally inherited) cpDNA, thus inferring stronger structure due to seed than pollen dispersal (Latta et al. 1998 ). Whether a similar pattern would be found for whitebark pine, where seeds are bird- dispersed over potentially large distances, is an interesting question. Finally, appropriate analytical techniques for dis- cerning fine-scale spatial genetic structure (e.g., Epperson 1995; Epperson and Li 1997) are emerging and should assist in the elucidation of previously overlooked genetic patterns that may be meaningful.
We thank the Pacific Southwest Research Station of the USDA Forest Service and the Pew Foundation for financial support of this study. We also appreciate the valuable com- ments provided by D. Tomback and two anonymous review- ers. P. Hodgskiss and D. Delany made helpful suggestions regarding protocol for isozyme analysis. C. Young helped with some of the field collections. D. Elliott-Fisk facilitated the administration of research funds. We are grateful to the USDA Forest Service for the stewardship of and accessibility to the whitebark pine habitats sampled for this study.
ARNO, S. F. 1967. Interpreting the timberline. M.Sc, thesis, Uni- versity of Montana, Missoula, MT.
. 1984. Timberline: mountain and arctic forest frontiers. Mountaineers, Seattle, WA.
BARNES, B. V. 1966. The clonal growth habit of American aspens. Ecology 47:439-447.
BREUDERLE, L. P., D. E TOMBACK, K. K. KELLY, AND R. C. HARD- WICK. 1998. Population genetic structure in a bird-dispersed pine, Pinus albicaulis Engelm. (Pinaceae). Can. J. Bot. 76:83- 90.
BUCHHOLZ, J. T. 1918. Suspensor and early embryo of Pinus. Bot. Gazette 66: 185-228.
CARSEY, K. S., AND D. E TOMBACK. 1994. Growth form distribution and genetic relationships in tree clusters of Pirzus$exilis, a bird- dispersed pine. Oecologia 98:402-411.
CHELIAK, W. M., AND J. A. PITEL. 1984. Electrophoretic identifi- cation of clones of trembling aspen. Can. J. For. Res. 14:740- 743.
CLAUSEN, J. 1965. Population studies of alpine and subalpine races
GENETIC STRUCTURE OF A PINE 89
of conifers and willows in the California high Sierra Nevada. Evolution 1956-68.
COMTOIS, P., J. F? SIMON, AND S. PAYETTE. 1986. Clonal constitution and sex ratio in northern populations of balsam poplar Populus balsamifera. Holarct. Ecol. 9 9 5 1-260.
CONKLE, M. T., D. HODGSKISS, L. B. NUNSALLY, AND S. C. HUNT- ER. 1982. Starch gel electrophoresis of conifer seeds: a labo- ratory manual. USDA Forest Service General Technical Report PSW-64, Pacific Southwest Forest and Range Experiment Sta- tion. Berkeley, CA.
DANCKI, B. F?, AND E C. YEW. 1983. Allozyme variability and evolution of lodgepole pine (Pinus contorta var. latifolia) and jack pine (P. banksiann) in Alberta. Can. J. Genet. Cytol. 25: 57-64.
EPPERSON, B. K. 1995. Fine-scale spatial structure: Correlations for individual genotypes differ from those for local gene fre- quencies. Evolution 49(5): 1022-1026.
EPPERSON, B. R., AND R. W. ALLARD. 1989. Spatial autocorrelation analysis of the distribution of genotypes within populations of lodgepole pine. Genetics 12 1 :369-377.
EPPERSON, B.K., AND T.-Q. LI. 1996. Measurement of genetic struc- ture within populations using Moran's spatial autocorrelation statistics. Proc. Natl. Acad. Sci. 93:10528-10532.
. 1997. Gene dispersal and spatial genetic structure. Evo- lution 5 1(3):672-68 1.
FURNIER, G. R., P. KNOWLES, M. A. ALEKSIUK, AND B. P. DANCIK. 1986. Inheritance and linkage of allozymes in seed tissue of whitebark pine. Can. J. Genet. Cytol. 28:601-604.
FURNIER, G. R., P. KNOWLES, M. A. CLYDE, AND B. P. DANCIK. 1987. Effects of avian seed dispersal on the genetic structure of whitebark pine populations. Evolution 4 1 :607-6 12.
HAMRICK, J. L., AND M. J. W. GODT. 1990. Allozyme diversity in plant species. Pp 43-63 inA. H. D. Brown, M. T. Clegg, A. L. Kahler, and B. S. Weir, eds. Plant population genetics, breeding, and genetic resources. Sinauer, Sunderland, MA.
HANSEN-BRISTOW, K. J., AND J. D. IVES. 1984. Changes in the forest-alpine tundra ecotone: Colorado Front Range. Phys. Geog. 5:186-197.
HERMANUTZ, L. A., D. J. INNES, AND I. M. WEIS. 1989. Clonal structure of Arctic dwarf birch (Betula glandulosa) at its northern limit. Am. J. Bot. 76:755-761.
HIEBERT, R. D., AND J. L. HAMRICK. 1983. Patterns and levels of genetic variation in Great Basin bristlecone pine, Pinus longaeva. Evolution 37:302-3 10.
HUTCHINS, H. E., AND R. M. LANNER. 1982. The central role of Clark's nutcracker in the dispersal and establishment of white- bark pine. Oecologia 55: 192-201.
JORGENSEN, S. M., AND J. L. HAMRICK. 1997. Biogeography and population genetics of whitebark pine Pinus albicaulis Engel- mann. Can. J. For. Res. 27:1574-1585.
KLIKOFF, L. G. 1965. Microenvironmental influence on vegeta- tional pattern near timberline in the central Sierra Nevada. Ecol. Monogr. 35: 187-21 1.
KRUTOVSKII, K. V., AND D. V. POLITOV. 1995. Allozyme evidence for polyzygotic polyembryony in Siberian stone pine (Pinus si- birica Du Tour). Theor. Appl. Gen 90:811-8 18.
LANNER, R. M. 1980. Avian seed dispersal as a factor in the ecology and evolution of limber and whitebark pines. Pp. 15-48 in Pro- ceedings of the Sixth North American Forest Biology Workshop. University of Alberta, Edmonton, Alberta, Canada.
LATTA, R. G., Y. B. LINHART, D. FLECK, AND M. ELLIOT. 1998. Direct and indirect estimates of seed versus pollen movement within a population of ponderosa pine. Evolution 52:61-67.
LI, p, AND W. T. ADAMS. 1989. Range-wide patterns of allozyme variation in Douglas-fir (Pseudotsuga menziesii). Can. J. For. Res. 19: 149-161.
LINHART, Y. B., AND D. E TOMBACK. 1985. Seed dispersal by nut- crackers causes multi-trunk growth form in pines. Oecologia 67: 107-1 10.
LINHART, Y. B., J. B. MITTON, K. B. STURGEON, AND M. L. DAVIS. 1981. Genetic variation in space and time in a population of ponderosa pine. Heredity 46:407-426.
LOVELESS, M. D., AND J. L. HAMRICK. 1984. Ecological determi-
nants of genetic structure in plant populations. Annu. Rev. Ecol. Syst. 15:65-95.
MITTON, J. B., Y. B. LINHART, J. L. HAMRICK, AND J. S. BECKMAN. 1977. Observations on the genetic structure and mating system of ponderosa pine in the Colorado Front Range. Theor. Appl. Gen. 515-13.
MITTON, J. B., Y. B. LINHART, K. B. STURGEON, AND J. L. HAMRICK. 1979. Allozyme polymorphisms detected in mature needle tissue of ponderosa pine. J. Hered. 70:86-89.
PETERSON, D. L., ll/I. J. ARBAUGH, L. J. ROBINSON, AND B. R. DE- DERIAK. 1990. Growth trends of whitebark pine and lodgepole pine in a subalpine Sierra Nevada forest, California, U.S.A. Arct. Alp. Res. 22:233-243.
QUELLER, D. C., AND K. E GOODNIGHT. 1989. Estimating relat- edness using genetic markers. Evolution 43:258-275.
REBERTUS, A. J., B. R. BURNS, AND T. T. VEBLEK. 1991. Stand dynamics of Pinus JEexilis-dominated subalpine forests in the Colorado Front Range. J. Veg. Sci. 2:445-458.
ROGERS, D. L. 1994. Patterns of allozyme variation and clonal structure in coast redwood (Sequoia sempervirens). Ph.D. diss., University of California, Berkeley, CA.
ROGERS, J. S. 1972. Measures of genetic similarity and genetic distance. University of Texas Publications, Stud. Genet. 7213: 145-153.
SAS INSTITUTE. 1985. SAS user's guide: statistics. SAS Institute Inc., Cary, NC.
SCHUSTER, W S. E, AND J. B. MITTON. 1991. Relatedness within clusters of a bird-dispersed pine and the potential for kin inter- actions. Heredity 67:41-48.
SMITH, C. C., AND 0 . J. REICHMAN. 1984. The evolution of food caching by birds and mammals. Annu. Rev. Ecol. Syst. 15: 329- 35 1.
SMOUSE, F? E., AND R. C. WILLIAMS. 1982. Multivariate analysis of HLA-disease associations. Biometrics 38:757-768.
SWOFFORD, D. L. 1989. BIOSYS-1 user's manual. Rel. 1.7. Illinois Natural History Survey, Champaign, IL.
TOMBACK, D. E 1978. Foraging strategies of Clark's nutcracker. Living Bird 16: 123-161.
. 1982. Dispersal of whitebark pine seeds by Clark's nut- cracker: a mutualism hypothesis. J. Anim. Ecol. 5 1 :45 1-467.
. 1986. Post-fire regeneration of krummholz whitebark pine: a consequence of nutcracker seed caching. Madroiio 33(2): 100- 110.
. 1988. Nutcracker-pine mutualisms: multitrunk trees and seed size. Pp 518-527 in H. Ouellet, ed. Acta XIX Congressus Internationalis Ornithologici, Vol. 1. Univ. of Ottawa Press, Ot- tawa, Ontario, Canada.
TOMBACK, D. E, AND Y. B. LINHART. 1990. The evolution of bird- dispersed pine. Evol. Ecol. 4:185-219.
TOMBACK, D. E, S. K. SUND, AND L. A. HOFFMANN. 1993. Post- fire regeneration of Pinus albicaulis: height-age relationships, age structure, and microsite characteristis. Can. J. For. Res. 23: 113-1 19.
TRANQUILLINI, W. 1979. Physiological ecology of the alpine tirn- berline: tree existence at high altitudes with special reference to the European Alps. Springer-Verlag, New York.
VANDER WALL, S. B., AND R. I? BALDA. 1977. Coadaptations of the Clark's nutcracker and the piiion pine for efficient seed har- vest and dispersal. Ecol. Monogr. 47:89-111.
WARTENBERG, D. 1985. Canonical trend surface analysis: A method for describing geographic patterns. Syst. 2001. 34:259-279.
WEIR, B. S. 1990. Genetic data analysis. Sinauer Associates, Sun- derland, MA.
WEISBERG, P. J., AND W. L. BAKER. 1995a. Spatial variation in tree regeneration in the forest-tundra ecotone, Rocky Mountain Na- tional Park, Colorado. Can. J. For. Res. 25: 1326-1339.
. 1995b. Spatial variation in tree seedling and krummholz growth in the forest-tundra ecotone of Rocky Mountain National Park, Colorado, U.S.A. Arct. Alp. Res. 27:116-129.
WENDELL, J. E, AND N. E WEEDEN. 1989. Visualization and in- terpretation of plant isozymes. Pp 5-45 in D. E Soltis and I? S. Soltis, eds. Isozymes in plant biology. Advances in plant sci- ences series. Vol. 4. Dioscorides Press, Portland, OR.

90 DEBORAH L. ROGERS ET AL.
WHEELER, N. C., K, S. .TECH, S. A. MASTERS, C. J. O'BRIEN, D. W TIMMONS, R. W STONECYPHER, AND A. LUPKES. 1995. Genetic variation and parameter estimates in Ta,xus breval'ia (Pacific yew). Can. J . For. Res. 25:1913-1927.
VV'~~KHAM-JONE~, T. 1994. Computer graphics with mathemat~ca. Springer-Verlag, New York.
WOLFRAM, S. 1996. The mathematica book. 3rd ed. Wolfram Me- dia, Champaign, IL; Cambridge Univ. Press, Cambridge, U.K.
WRIGHT, S. 1978. Evolution and the genetics of populations. Vol. 4. Variability within and among natural populations. Univ. of Chicago Press, Chicago, IL.
YAKDELL, U, C. 1993. An allozyme analysis of whitebark pine (Pinus albicaulis Engl.). M.Sc. thesis. University of Nevada, Reno, NV.
YEH, E C., AND T. J. B. BOYLE. 1996. POPGEME. Vers. 1.1. A qu~ck user's guide. University of Alberta, Edmonton, Alberta, Canada.
ZALJARIN, E., 2;. RAFIL, L. G. COOL, AND I(. S ~ A J B ~ R K . 1991. Geo- graphic monoterpene variability of Pinus nlbicarclis. Biochem. Syst. Ecol. 19:147-155.
Corresponding Editor: D. Pi5ero.