findings on happiness \u0026 school
TRANSCRIPT

Findings on Happiness and SCHOOL
World Database of Happiness
Correlational Findings on Happiness and SCHOOL
Subject Code: S1
© on data collection: Ruut Veenhoven, Erasmus
University Rotterdam
Classification of Findings
Subject Code DescriptionNr of Studies
on this Subject
S1 SCHOOL 1
S1.1 School career 0
S1.1.1 Earlier schooling 0
S1.1.1.1 . earlier school-behavior 4
S1.1.1.2 . earlier school-environment 2
S1.1.1.3 . earlier attitudes to school 5
S1.1.2 Change in schooling 0
S1.1.2.1 . change in school-behavior 0
S1.1.2.2 . change in school-environment 0
S1.1.2.3 . change in attitudes to school 0
S1.1.3 Current stage in school-career 6
S1.1.4 Later schooling 1
S1.1.4.1 . later school-behavior 0
S1.1.4.2 . later school-environment 1
S1.1.4.3 . later attitudes to school 0
S1.2 Current school-behavior 1
S1.2.1 School-attendance 0
S1.2.1.1 . involved in schooling or not 21
S1.2.1.2 . absenteeism 0
S1.2.1.3 . extra-curricular activity 6
S1.2.2 School-success 15
S1.2.3 Involvement in school-work 7
S1.2.4 Misbehavior in school 8
S1.3 Current school-environment 0
S1.3.1 Social characteristics of school 0
S1.3.1.1 . socio-economic level of school 2
S1.3.1.2 . ethnic homogeneity of school 2
S1.3.2 Social climate in school 0
S1.3.4 Intellectual level of school 3
S1.3.5 School-type 6
S1.3.6 Curriculum followed 4
http://worlddatabaseofhappiness.eur.nl/hap_cor/top_sub.php?code=S1 (1 of 147)9-9-2009 14:01:24

Findings on Happiness and SCHOOL
S1.4 Attitudes to school 6
S1.4.1 Perceived usefulness of schooling 10
S1.4.2 Perceived pressure of school-work 6
S1.4.3 Satisfaction with own school-performance 2
S1.4.4 Satisfaction with school-facilities 10
Appendix 1 Happiness Items used
Appendix 2 Statistics used
Appendix 3 About the World Database of Happiness
Appendix 4 Further Findings in the World Database of Happiness
Appendix 5 Related Subjects
Cite as
Veenhoven, R.: Findings on SCHOOL World Database of Happiness, Correlational Findings Internet: worlddatabaseofhappiness.eur.nl Erasmus University Rotterdam, 2009, Netherlands
http://worlddatabaseofhappiness.eur.nl/hap_cor/top_sub.php?code=S1 (2 of 147)9-9-2009 14:01:24

Findings on Happiness and SCHOOL
Correlational finding on Happiness and SCHOOL Subject code: S1
Study BRINK 1997/2
Reported in: Brinkerhoff, M.B.; Fredell, K.; Frideres, J. Basic Minimum Needs, Quality of Life and Selected Correlates: Explorations in Villages in Northern India. Social Indicators Research, 1997, Vol. 42, 245 - 281 ISSN p 0303 8300; ISSN e 1573 0921 DOI:10.1023/A:1006834830518 Page in Report: 263
Population: Adult, general public, poor rural village, Bhopalpani, India 1991
Sample: Non-probability purposive-quota sample
Non-Response: 108
N: 0
Correlate
Authors label: Training centre (1)
Our classification: SCHOOL, code S1
Measurement: Family needs prioritized by Paired Comparisons.Out of four basic needsss were asked to compare two at a time and to select, which they sought 'their family needs most'Items were: -food -health -employment -leisureThis leads to six pairs of comparisons.Score pro need can be:0. not mentioned1. once2. twice3. three timesNeeds index is the mean number of times an item is chosen.
Measured Values: 0: 0,87; 1: 46,8; 2:26,6; 3: 19,3: M: 7,3
Remarks: Items for pairwise comparison were selected by participant observation and open interviews
Observed Relation with Happiness
Happiness Measure
Statistics Elaboration/Remarks
O-SLu/?/sq/l/5/a r=+.16 ns
O-H?/?/sq/f/7/a r=+.11 ns
http://worlddatabaseofhappiness.eur.nl/hap_cor/top_sub.php?code=S1 (3 of 147)9-9-2009 14:01:24

Findings on Happiness and SCHOOL
Correlational finding on Happiness and . earlier school-behavior Subject code: S1.1.1.1
Study BACHM 1977
Reported in: Bachman, J. G.;O'Malley, P. M.; Johnston, J. Youth in Transition, Vol. VI: Adolescence to Adulthood, Change and Stability in the Lives of Young Men. Institute for Social Research, 1970, University of Michigan, Ann Arbor, USA Page in Report:
Population: Public highschool boys followed 8 years from grade 10, USA, 1966-74
Sample:
Non-Response: 2.8% at T1, 17.2% at T2, 21.0% at T3, 28.9% at T4, 28.5% at T5
N: 1628
Correlate
Authors label: Delinquent behavior in school (2)
Our classification: . earlier school-behavior, code S1.1.1.1
Measurement: At T1, T2 and T3: a mean of seven items measuring the amount of school-oriented delinquent behaviour. Included are questions on how often respondent has been suspended, damaged school property, and gotten into a serious fight at school. Scale: 0.00 = never to 4.00 = five or more times
Observed Relation with Happiness
Happiness Measure
Statistics Elaboration/Remarks
O-HP/g/mq/v/5/a tau=- Delinquent behavior in schoolHappiness T1 T2 T3T1 tau = -.19 (001) -.14 (001) -.12 (001)T2 tau = -.10 (01) -.15 (001) -.11 (01)T3 tau = -.07 (ns) -.10 (01) -.08 (05)T4 tau = -.06 (ns) -.04 (ns) -.04 (ns)T1:1966, T2:1968, T3:1969, T4:1970
Correlational finding on Happiness and . earlier school-behavior Subject code: S1.1.1.1
Study BACHM 1977
http://worlddatabaseofhappiness.eur.nl/hap_cor/top_sub.php?code=S1 (4 of 147)9-9-2009 14:01:24

Findings on Happiness and SCHOOL
Reported in: Bachman, J. G.;O'Malley, P. M.; Johnston, J. Youth in Transition, Vol. VI: Adolescence to Adulthood, Change and Stability in the Lives of Young Men. Institute for Social Research, 1970, University of Michigan, Ann Arbor, USA Page in Report:
Population: Public highschool boys followed 8 years from grade 10, USA, 1966-74
Sample:
Non-Response: 2.8% at T1, 17.2% at T2, 21.0% at T3, 28.9% at T4, 28.5% at T5
N: 1628
Correlate
Authors label: Serious delinquent behaviors (2)
Our classification: . earlier school-behavior, code S1.1.1.1
Measurement: A mean of 10 items asking the respondent how often he had done such things as 'set fire to someone else's property on purpose', 'hurt someone badly enough to need bandages or a doctor', 'taken something not belonging to you worth over $50' etc. Scale: 1.00 = never to 5.00 = five or more times.Assessed at T1, T2, T3, T4 and T5
Observed Relation with Happiness
Happiness Measure
Statistics Elaboration/Remarks
O-HP/g/mq/v/5/a tau=- Serious delinquent behavior T1 T2 T3 T4 T5HappinessT1 -.18 -.14 -.12 -.04 ns -.10T2 -.09 -.11 -.09 -.03 ns -.07 ns T3 -.04 ns -.07 ns -.11 -.05 ns -.04 nsT4 -.03 ns -.02 ns -.05 ns -.04 ns -.03 nsAll tau's significant, unless otherwise indicatedT1:1966, T2:1968, T3:1969, T4:1970, T5:1974
Correlational finding on Happiness and . earlier school-behavior Subject code: S1.1.1.1
Study BACHM 1977
Reported in: Bachman, J. G.;O'Malley, P. M.; Johnston, J. Youth in Transition, Vol. VI: Adolescence to Adulthood, Change and Stability in the Lives of Young Men. Institute for Social Research, 1970, University of Michigan, Ann Arbor, USA Page in Report:
Population: Public highschool boys followed 8 years from grade 10, USA, 1966-74
Sample:
http://worlddatabaseofhappiness.eur.nl/hap_cor/top_sub.php?code=S1 (5 of 147)9-9-2009 14:01:24

Findings on Happiness and SCHOOL
Non-Response: 2.8% at T1, 17.2% at T2, 21.0% at T3, 28.9% at T4, 28.5% at T5
N: 1628
Correlate
Authors label: Theft and vandalism (2)
Our classification: . earlier school-behavior, code S1.1.1.1
Measurement: A mean of nine items which measure the number of times respondent has commited acts of theft or vandalism. Scale: 0.00 = never to 4.00 = five or more times. Assessed at T1, T2, T3, T4 and T5
Observed Relation with Happiness
Happiness Measure
Statistics Elaboration/Remarks
O-HP/g/mq/v/5/a tau=- Theft and vandalism T1 T2 T3 T4 T5HappinessT1 -.19 -.14 -.13 -.03 ns -.11T2 -.10 -.13 -.10 -.03 ns -.07 nsT3 -.06 ns -.09 -.11 -.04 ns -.04 nsT4 -.04 ns -.04 ns -.06 ns -.04 ns -.03 nsAll tau's significant, unless indicated otherwiseT1:1966, T2:1968, T3:1969, T4:1970, T5:1974
Correlational finding on Happiness and . earlier school-behavior Subject code: S1.1.1.1
Study SMITH 1982
Reported in: Smith, T. W. College Dropouts: An Analyses of the Psychological Well-Being and Attidudes of Various Educational Groups. Social Psychology Quarterly, 1982, Vol. 45, 50 - 53. ISSN 0190 2725 Page in Report: 52
Population: 18+aged,general public, non-institutionalized, USA, 1972-80
Sample:
Non-Response:
N: 11997
Correlate
Authors label: School drop out Earlier (1)
http://worlddatabaseofhappiness.eur.nl/hap_cor/top_sub.php?code=S1 (6 of 147)9-9-2009 14:01:24

Findings on Happiness and SCHOOL
Our classification: . earlier school-behavior, code S1.1.1.1
Measurement: College Dropouts0 Associate or bachelor's degree1 Some college but no degree
Graduate School Dropouts0 Graduate degree1 Bachelor's with 5 or more years of college but no graduate degree
Remarks: % happy:
Observed Relation with Happiness
Happiness Measure
Statistics Elaboration/Remarks
O-HL/c/sq/v/3/aa G=-.05 p<.01
degree: 37,9
O-HL/c/sq/v/3/aa tb=-.03 ns no degree: 34,9
O-HL/c/sq/v/3/aa G=-.08 p<.01
degree: 40,2
O-HL/c/sq/v/3/aa tb=-.04 ns no degree: 35,7
Correlational finding on Happiness and . earlier school-environment Subject code: S1.1.1.2
Study BACHM 1977
Reported in: Bachman, J. G.;O'Malley, P. M.; Johnston, J. Youth in Transition, Vol. VI: Adolescence to Adulthood, Change and Stability in the Lives of Young Men. Institute for Social Research, 1970, University of Michigan, Ann Arbor, USA Page in Report:
Population: Public highschool boys followed 8 years from grade 10, USA, 1966-74
Sample:
Non-Response: 2.8% at T1, 17.2% at T2, 21.0% at T3, 28.9% at T4, 28.5% at T5
N: 1628
Correlate
Authors label: School mean intelligence scores (1)
http://worlddatabaseofhappiness.eur.nl/hap_cor/top_sub.php?code=S1 (7 of 147)9-9-2009 14:01:24

Findings on Happiness and SCHOOL
Our classification: . earlier school-environment, code S1.1.1.2
Measurement: High school's mean GATB-J score, Gates score and Quick Test score, computed from the scores of all the T1 respondents at that school. See also C 1.3
Observed Relation with Happiness
Happiness Measure
Statistics Elaboration/Remarks
O-HP/g/mq/v/5/a tau= ns Quick GATB-J GatesHappiness Test testT1 tau = -.04 -.04 -.04T2 tau = -.01 -.04 -.03T3 tau = -.03 -.03 -.02T4 tau = -.01 -.00 -.02All tau's not significantT1:1966, T2:1968, T3:1969, T4:1970
Correlational finding on Happiness and . earlier school-environment Subject code: S1.1.1.2
Study BACHM 1977
Reported in: Bachman, J. G.;O'Malley, P. M.; Johnston, J. Youth in Transition, Vol. VI: Adolescence to Adulthood, Change and Stability in the Lives of Young Men. Institute for Social Research, 1970, University of Michigan, Ann Arbor, USA Page in Report:
Population: Public highschool boys followed 8 years from grade 10, USA, 1966-74
Sample:
Non-Response: 2.8% at T1, 17.2% at T2, 21.0% at T3, 28.9% at T4, 28.5% at T5
N: 1628
Correlate
Authors label: High school curriculum college preparatory (1)
Our classification: . earlier school-environment, code S1.1.1.2
Measurement: Respondent reported his program of high school study at T1, T2 and T3: 0 = vocational, bussiness, general, agricultural or other; 1 = college preparatory
http://worlddatabaseofhappiness.eur.nl/hap_cor/top_sub.php?code=S1 (8 of 147)9-9-2009 14:01:24

Findings on Happiness and SCHOOL
Observed Relation with Happiness
Happiness Measure
Statistics Elaboration/Remarks
O-HP/g/mq/v/5/a tau= ns HS curriculum college preparatoryHappiness T1 T2 T3T1 tau = +.04 +.06 +.06T2 tau = -.02 +.03 +.02T3 tau = +.01 -.02 +.01T4 tau = -.01 -.01 +.02All tau's not significantT1:1966, T2:1968, T3:1969, T4:1970
Correlational finding on Happiness and . earlier attitudes to school Subject code: S1.1.1.3
Study BACHM 1977
Reported in: Bachman, J. G.;O'Malley, P. M.; Johnston, J. Youth in Transition, Vol. VI: Adolescence to Adulthood, Change and Stability in the Lives of Young Men. Institute for Social Research, 1970, University of Michigan, Ann Arbor, USA Page in Report:
Population: Public highschool boys followed 8 years from grade 10, USA, 1966-74
Sample:
Non-Response: 2.8% at T1, 17.2% at T2, 21.0% at T3, 28.9% at T4, 28.5% at T5
N: 1628
Correlate
Authors label: Interest in courses (1)
Our classification: . earlier attitudes to school, code S1.1.1.3
Measurement: Simple direct question at T1, T2 and T3: How interesting are most of your courses to you? 1 = very dull; 2 = slightly dull; 3 = fairly interesting;4 = quite interesting; 5 = very exciting and stimulating
Observed Relation with Happiness
Happiness Measure
Statistics Elaboration/Remarks
http://worlddatabaseofhappiness.eur.nl/hap_cor/top_sub.php?code=S1 (9 of 147)9-9-2009 14:01:24

Findings on Happiness and SCHOOL
O-HP/g/mq/v/5/a tau=+ p<.001
Interest in coursesHappiness T1 T2 T3T1 tau = +.33 +.23 +.19T2 tau = +.25 +.32 +.26T3 tau = +.23 +.26 +.28T4 tau = +.21 +.19 +.22All tau's significant (001)T1:1966, T2:1968, T3:1969, T4:1970
Correlational finding on Happiness and . earlier attitudes to school Subject code: S1.1.1.3
Study BACHM 1977
Reported in: Bachman, J. G.;O'Malley, P. M.; Johnston, J. Youth in Transition, Vol. VI: Adolescence to Adulthood, Change and Stability in the Lives of Young Men. Institute for Social Research, 1970, University of Michigan, Ann Arbor, USA Page in Report:
Population: Public highschool boys followed 8 years from grade 10, USA, 1966-74
Sample:
Non-Response: 2.8% at T1, 17.2% at T2, 21.0% at T3, 28.9% at T4, 28.5% at T5
N: 1628
Correlate
Authors label: School attitudes (2)
Our classification: . earlier attitudes to school, code S1.1.1.3
Measurement: Positive and negative school attitudes were measured at T1, T2 and T3. Positive school attitude: a mean of 15 items which stress the intrinsic value of education; scale: 1.00 = low (education has little value) to 4.00 = high (education has high value)Negative school attitude: a mean of 8 items indicating the respondent's negative or avoidance attitudes toward school. Scale: 1.00 = low negativity;4.00 = high negativity
Observed Relation with Happiness
Happiness Measure
Statistics Elaboration/Remarks
http://worlddatabaseofhappiness.eur.nl/hap_cor/top_sub.php?code=S1 (10 of 147)9-9-2009 14:01:24

Findings on Happiness and SCHOOL
O-HP/g/mq/v/5/a tau= p<.001
Positive school attitudesHappiness T1 T2 T2T1 tau = +.41 +.27 +.25T2 tau = +.33 +.39 +.32T3 tau = +.23 +.27 +.37T4 tau = +.20 +.23 +.27All tau's significant (001)
Negative school attitudesHappiness T1 T2 T3T1 _ = -.25 -.21 -.22T2 _ = -.21 -.26 -.23T3 _ = -.17 -.18 -.27T4 _ = -.18 -.16 -.19All _ significant (001)T1:1966, T2:1968, T3:1969, T4:1970
Correlational finding on Happiness and . earlier attitudes to school Subject code: S1.1.1.3
Study BACHM 1977
Reported in: Bachman, J. G.;O'Malley, P. M.; Johnston, J. Youth in Transition, Vol. VI: Adolescence to Adulthood, Change and Stability in the Lives of Young Men. Institute for Social Research, 1970, University of Michigan, Ann Arbor, USA Page in Report:
Population: Public highschool boys followed 8 years from grade 10, USA, 1966-74
Sample:
Non-Response: 2.8% at T1, 17.2% at T2, 21.0% at T3, 28.9% at T4, 28.5% at T5
N: 1628
Correlate
Authors label: Academic achievementvalue (3)
Our classification: . earlier attitudes to school, code S1.1.1.3
Measurement: Index at T1, T2 and T3 of four items that indicate the extent to which the respondent considers it to be "a good thing" to demonstrate behavior indicative of academic achievement. Items: "studying constantly in order to become a well-educated person; working hard to achieve academic honors; striving to get the top grade-point average in the group; studying hard to get good grades in school." Scale: 1 = low to 6 = high in academic achievement value
Observed Relation with Happiness
http://worlddatabaseofhappiness.eur.nl/hap_cor/top_sub.php?code=S1 (11 of 147)9-9-2009 14:01:24

Findings on Happiness and SCHOOL
Happiness Measure
Statistics Elaboration/Remarks
O-HP/g/mq/v/5/a tau=+ p<.s Academic achievement valueHappiness T1 T2 T3T1 +.26 (001) +.15 (001) +.15 (001)T2 +.16 (001) +.22 (001) +.14 (001)T3 +.12 (01) +.18 (001) +.25 (001)T4 +.10 (01) +.13 (001) +.18 (001)All tau's significantT1:1966, T2:1968, T3:1969, T4:1970
Correlational finding on Happiness and . earlier attitudes to school Subject code: S1.1.1.3
Study BACHM 1977
Reported in: Bachman, J. G.;O'Malley, P. M.; Johnston, J. Youth in Transition, Vol. VI: Adolescence to Adulthood, Change and Stability in the Lives of Young Men. Institute for Social Research, 1970, University of Michigan, Ann Arbor, USA Page in Report:
Population: Public highschool boys followed 8 years from grade 10, USA, 1966-74
Sample:
Non-Response: 2.8% at T1, 17.2% at T2, 21.0% at T3, 28.9% at T4, 28.5% at T5
N: 1628
Correlate
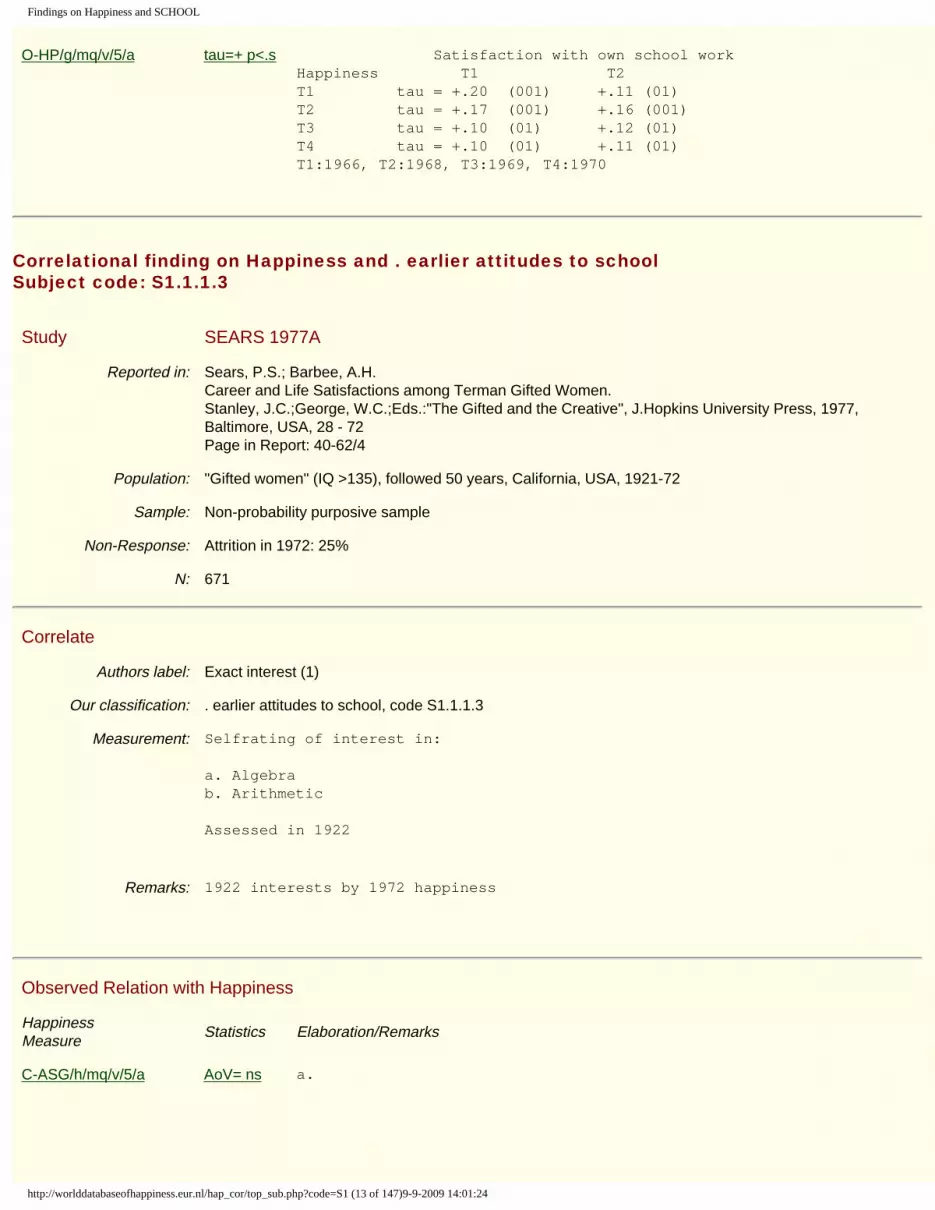
Authors label: Satisfaction with own school work (3)
Our classification: . earlier attitudes to school, code S1.1.1.3
Measurement: Simple direct question at T1 and T2: "How satisfied are you with the way you're actually doing in school?" 1 = not at all; 2 = not very; 3 = somewhat; 4 = quite; 5 = very satisfied
Observed Relation with Happiness
Happiness Measure
Statistics Elaboration/Remarks
http://worlddatabaseofhappiness.eur.nl/hap_cor/top_sub.php?code=S1 (12 of 147)9-9-2009 14:01:24
Findings on Happiness and SCHOOL
O-HP/g/mq/v/5/a tau=+ p<.s Satisfaction with own school workHappiness T1 T2T1 tau = +.20 (001) +.11 (01)T2 tau = +.17 (001) +.16 (001)T3 tau = +.10 (01) +.12 (01)T4 tau = +.10 (01) +.11 (01)T1:1966, T2:1968, T3:1969, T4:1970
Correlational finding on Happiness and . earlier attitudes to school Subject code: S1.1.1.3
Study SEARS 1977A
Reported in: Sears, P.S.; Barbee, A.H. Career and Life Satisfactions among Terman Gifted Women. Stanley, J.C.;George, W.C.;Eds.:"The Gifted and the Creative", J.Hopkins University Press, 1977, Baltimore, USA, 28 - 72 Page in Report: 40-62/4
Population: "Gifted women" (IQ >135), followed 50 years, California, USA, 1921-72
Sample: Non-probability purposive sample
Non-Response: Attrition in 1972: 25%
N: 671
Correlate
Authors label: Exact interest (1)
Our classification: . earlier attitudes to school, code S1.1.1.3
Measurement: Selfrating of interest in:
a. Algebrab. Arithmetic
Assessed in 1922
Remarks: 1922 interests by 1972 happiness
Observed Relation with Happiness
Happiness Measure
Statistics Elaboration/Remarks
C-ASG/h/mq/v/5/a AoV= ns a.
http://worlddatabaseofhappiness.eur.nl/hap_cor/top_sub.php?code=S1 (13 of 147)9-9-2009 14:01:24

Findings on Happiness and SCHOOL
M-PL/h/sq/v/5/b Chi²= ns a.
C-ASG/h/mq/v/5/a AoV= ns b.
M-PL/h/sq/v/5/b Chi²= ns b.
Correlational finding on Happiness and Current stage in school-career Subject code: S1.1.3
Study CONST 1965
Reported in: Constantinople, A.P. Some Correlates of Happiness and Unhappiness in College Students. Unpublished Doctoral Dissertation, 1965, University of Rochester, USA. Page in Report: 50
Population: College students, University of Rochester, USA, 1965
Sample:
Non-Response: 30% (take home questionnaire).
N: 952
Correlate
Authors label: Stage of study. (1)
Our classification: Current stage in school-career, code S1.1.3
Measurement: Freshmen / sophomores / juniors / seniors.
Observed Relation with Happiness
Happiness Measure
Statistics Elaboration/Remarks
A-AOL/cy/sq/v/10/a DM=+ p<.01
Stronger among males.S-shaped curve among males: Stronger relationship from freshman to junior years.U-shaped curve among females: sophomores being most unhappy.
Correlational finding on Happiness and Current stage in school-career Subject code: S1.1.3
Study CSIKS 2003
http://worlddatabaseofhappiness.eur.nl/hap_cor/top_sub.php?code=S1 (14 of 147)9-9-2009 14:01:24

Findings on Happiness and SCHOOL
Reported in: Csikszentmihalyi, M.; Hunter, J. Happiness in Everyday Life: the Uses of Experience Sampling. Journal of Happiness Studies, 2003, Vol. 4, 185 - 199. ISSN p 1389 4978; ISSN e 1573 7780. DOI 10.1007/s11205-005-0805-6 Page in Report: 194,195
Population: Teenagers, USA, 1998
Sample: Non-probability purposive sample
Non-Response:
N: 828
Correlate
Authors label: Grade level in school
Our classification: Current stage in school-career, code S1.1.3
Measurement: Grade level in school
Observed Relation with Happiness
Happiness Measure
Statistics Elaboration/Remarks
A-ARE/mi/sqr/n/7/a Beta=-.05 p<.001
Beta controlled for:- age- gender- SES
A-ARE/mi/sqr/n/7/a Beta=-.08 p<.012
Beta additionally controlled for: - time in flow
Correlational finding on Happiness and Current stage in school-career Subject code: S1.1.3
Study HEERE 1969
Reported in: Heeren, S.D. Entrepreneurial vs. Bureaucratic Fathers as Related to Family Structure, Happiness, and Two Measures of Independence. Unpublished PhD Dissertation, University of Kansas, 1969, USA Page in Report: 28
Population: Male undergraduates, University of Kansas, USA, 1967
Sample:
Non-Response: 5% incomplete information.
N: 103
http://worlddatabaseofhappiness.eur.nl/hap_cor/top_sub.php?code=S1 (15 of 147)9-9-2009 14:01:24

Findings on Happiness and SCHOOL
Correlate
Authors label: Stage of study (1)
Our classification: Current stage in school-career, code S1.1.3
Measurement: freshman / sophomore / junior / senior /graduate student / other
Observed Relation with Happiness
Happiness Measure
Statistics Elaboration/Remarks
O-HL/g/sq/n/9/b r= ns
Correlational finding on Happiness and Current stage in school-career Subject code: S1.1.3
Study MAN 1991
Reported in: Man, P. The Influence of Peers and Parents on Youth Life Satisfaction in Hong Kong. Social Indicators Research, 1991, Vol. 24, 347 - 365. ISSN p 0303 8300: ISSN e 1573 0921 DOI:10.1007/BF00383734 Page in Report: 358
Population: 13-16 aged students, Hong Kong, 1983-1984.
Sample: Non-probability chunk sample
Non-Response:
N: 1906
Correlate
Authors label: school class
Our classification: Current stage in school-career, code S1.1.3
Measurement: 1 middle 1 (younger)2 middle 4 (older)
Observed Relation with Happiness
Happiness Measure
Statistics Elaboration/Remarks
http://worlddatabaseofhappiness.eur.nl/hap_cor/top_sub.php?code=S1 (16 of 147)9-9-2009 14:01:24

Findings on Happiness and SCHOOL
O-SLW/?/sq/n/7/a DM=- Grade 1: M = 4.00Grade 4: M = 2.76difference -1.24
Correlational finding on Happiness and Current stage in school-career Subject code: S1.1.3
Study VENTE 1996
Reported in: Ventegodt, S. Liskvalitet hos 4500 31-33-arige. (The Quality of Life of 4500 31-33-Years-Olds). Forskningscenter for Livskvalitet, Forskningscentrets Forlag, København 1996, ISBN 8790190068 http://www.livskvalitet.org/t2/index.asp Page in Report: 94
Population: 31-33 aged, Denmark 1993, born in University Hospital in Copenhagen
Sample: Non-probability chunk sample
Non-Response: 39%
N: 4500
Correlate
Authors label: attending school or university
Our classification: Current stage in school-career, code S1.1.3
Measurement: 1: no post-secondary education (less than 13 years of schooling)2: short post-secondary education (13-14 years)3: intermediate post-secondary education (15-16 years)4: long post-secondary education(more than 16 years)
Measured Values: N: all:431, %: 1:23,4, 2:35,5, 3:19,7, 4:21,3
Remarks: Adult students only
Observed Relation with Happiness
Happiness Measure
Statistics Elaboration/Remarks
A-AOL/m/sq/v/5/a r=-.05 p<.3173
1: Mt=7.482: Mt=8.013: Mt=7.594: Mt=7.34
http://worlddatabaseofhappiness.eur.nl/hap_cor/top_sub.php?code=S1 (17 of 147)9-9-2009 14:01:24

Findings on Happiness and SCHOOL
O-SLu/c/sq/v/5/e r=-.03 p<.2792
1: Mt=7.232: Mt=7.763: Mt=7.394: Mt=7.04
O-HL/c/sq/v/5/h r=-.03 p<.4958
1: Mt=6.732: Mt=7.303: Mt=6.944: Mt=6.68
Correlational finding on Happiness and Current stage in school-career Subject code: S1.1.3
Study WASHB 1941
Reported in: Washburne, J.N. Factors Related to Social Adjustment of College Girls. Journal of Social Psychology. 1941, Vol. 13, 281 - 289. ISSN 0022 4545 Page in Report: 283
Population: Female college students, New York, USA, 194?
Sample:
Non-Response: -
N: 238
Correlate
Authors label: Being a freshman (1)
Our classification: Current stage in school-career, code S1.1.3
Measurement: 0 Junior 1 Freshmen
Observed Relation with Happiness
Happiness Measure
Statistics Elaboration/Remarks
M-CO/?/?q/?/0/a SNR= + ns L-shaped curve: positive relationship among unhappy students only.
M-CO/?/?q/?/0/a D%=+ ns L-shaped curve: positive relationship among unhappy students only.
http://worlddatabaseofhappiness.eur.nl/hap_cor/top_sub.php?code=S1 (18 of 147)9-9-2009 14:01:24

Findings on Happiness and SCHOOL
Correlational finding on Happiness and Later schooling Subject code: S1.1.4
Study BACHM 1977
Reported in: Bachman, J. G.;O'Malley, P. M.; Johnston, J. Youth in Transition, Vol. VI: Adolescence to Adulthood, Change and Stability in the Lives of Young Men. Institute for Social Research, 1970, University of Michigan, Ann Arbor, USA Page in Report:
Population: Public highschool boys followed 8 years from grade 10, USA, 1966-74
Sample:
Non-Response: 2.8% at T1, 17.2% at T2, 21.0% at T3, 28.9% at T4, 28.5% at T5
N: 1628
Correlate
Authors label: Level of (later) college (1)
Our classification: Later schooling, code S1.1.4
Measurement: College mean of Scholastic Aptitude Test scores, or American College Test scores, or estimates of these scores (See Astin, 1971) (measured at T5)
Observed Relation with Happiness
Happiness Measure
Statistics Elaboration/Remarks
O-HP/g/mq/v/5/a tau= ns T1 happiness: tau = .00 (ns)T2 happiness: tau = -.04 (ns)T3 happiness: tau = -.04 (ns)T4 happiness: tau = -.06 (ns)T1:1966, T2:1968, T3:1969, T4:1970, T5:1974
Correlational finding on Happiness and . later school-environment Subject code: S1.1.4.2
Study BACHM 1977
Reported in: Bachman, J. G.;O'Malley, P. M.; Johnston, J. Youth in Transition, Vol. VI: Adolescence to Adulthood, Change and Stability in the Lives of Young Men. Institute for Social Research, 1970, University of Michigan, Ann Arbor, USA Page in Report:
Population: Public highschool boys followed 8 years from grade 10, USA, 1966-74
Sample:
http://worlddatabaseofhappiness.eur.nl/hap_cor/top_sub.php?code=S1 (19 of 147)9-9-2009 14:01:24

Findings on Happiness and SCHOOL
Non-Response: 2.8% at T1, 17.2% at T2, 21.0% at T3, 28.9% at T4, 28.5% at T5
N: 1628
Correlate
Authors label: Prestige of (later) college (1)
Our classification: . later school-environment, code S1.1.4.2
Measurement: Prestige of institution attended as an undergraduate (measured at T5)
Observed Relation with Happiness
Happiness Measure
Statistics Elaboration/Remarks
O-HP/g/mq/v/5/a tau= ns T1 happiness: tau = +.07 (ns)T2 happiness: tau = -.02 (ns)T3 happiness: tau = -.03 (ns)T4 happiness: tau = -.07 (ns)T1:1966, T2:1968, T3:1969, T4:1970, T5:1974
Correlational finding on Happiness and Current school-behavior Subject code: S1.2
Study LEE 2003
Reported in: Lee, M. Daily Contextual Variations in Levels of Adolescent Happiness. The Korean Journal of Developmental Psychology, 2003, Vol. 16, 193 - 209 Page in Report: 200
Population: Middle school students, South Korea, 200?
Sample: Non-probability chunk sample
Non-Response: 24
N: 134
Correlate
Authors label: daily activity
Our classification: Current school-behavior, code S1.2
http://worlddatabaseofhappiness.eur.nl/hap_cor/top_sub.php?code=S1 (20 of 147)9-9-2009 14:01:24

Findings on Happiness and SCHOOL
Measurement: Time spend on activities:A study B active leisureC passive leisureD interpersonal relationshipE living maintenance
Assessed using experience sampling during one week. When beeped Ss answered the open question:'What do you do right now'. Responses were later classified in these 5 categories.Higher scores mean more time spend on this activity
Observed Relation with Happiness
Happiness Measure
Statistics Elaboration/Remarks
A-AOL/mi/mqr/v/4/a DM= M SDA 1.06 .87B 1.91 .98C 1.69 .99D 1.66 1.05E 1.27 .96
A-AOL/mi/mqr/v/4/a BMCT= p<.05
B>C,D>E>A
Correlational finding on Happiness and . involved in schooling or not Subject code: S1.2.1.1
Study BALL 2008/2
Reported in: Ball, R.E.; Chernova K. Absolute Income, Relative Income, and Happiness. Social Indicators Research, 2008, Vol. 88, 497 - 529 (Also Paper ISQOLS Conference, 2004, Philadelphia, USA). ISSN p 0303 8300; ISSN e 1573 0921 DOI:10.1007/s11205-007-9217-0 Page in Report: 514
Population: Adults, 18 Nations, 1995-1997
Sample: Probability simple random sample
Non-Response:
N: 20771
Correlate
Authors label: Employment
Our classification: . involved in schooling or not, code S1.2.1.1
http://worlddatabaseofhappiness.eur.nl/hap_cor/top_sub.php?code=S1 (21 of 147)9-9-2009 14:01:24

Findings on Happiness and SCHOOL
Measurement: a part timeb self employedc retiredd housewifee unemployedf student
Observed Relation with Happiness
Happiness Measure
Statistics Elaboration/Remarks
O-SLW/c/sq/n/10/a Beta=+.04 p<.029
self employed
O-SLW/c/sq/n/10/a Beta=+.02 p<.472
part time
O-SLW/c/sq/n/10/a Beta=-.02 p<.558
retired
O-SLW/c/sq/n/10/a Beta=+.15 p<.001
housewife
O-SLW/c/sq/n/10/a Beta=-.21 p<.001
unemployed
O-SLW/c/sq/n/10/a Beta=+.08 p<.022
student
Betas controlled for:-Interaction between relative and absolute income-Individual variables -Income -Marital status -Gender -Age -Children -Health -Religion-Country (dummies)
No difference if controlled for country variables instead of dummies.
Correlational finding on Happiness and . involved in schooling or not Subject code: S1.2.1.1
Study BOHNK 2008
Reported in: Böhnke, P.; Kohler, U. Well-being and Inequality WZB Discussion Paper no. SP I 2008-201, 2008, Berlin, Germany ISSN 1612 3468 http://www.wzb.eu Page in Report: 24
http://worlddatabaseofhappiness.eur.nl/hap_cor/top_sub.php?code=S1 (22 of 147)9-9-2009 14:01:24

Findings on Happiness and SCHOOL
Population: 18+ aged, in 28 European nations, 2003
Sample: Mixed samples
Non-Response:
N: 18600
Correlate
Authors label: Still in education
Our classification: . involved in schooling or not, code S1.2.1.1
Measurement: 0 = employed (reference)1 = still in education
Observed Relation with Happiness
Happiness Measure
Statistics Elaboration/Remarks
O-SLu/c/sq/n/10/b B=+.13 p<.05
No controls
O-SLu/c/sq/n/10/b B=+.18 p<.05
B controlled for-gender-age-type of community-income-class/occupation-education-housing
O-SLu/c/sq/n/10/b B=+.20 p<.05
B additionally controlled for-marital status-contacts with friends/neighbours-voluntary work
O-SLu/c/sq/n/10/b B==.17 p<.05
B additionally controlled for-church attendance-internet use
O-SLu/c/sq/n/10/b B=+.12 ns B additionally controlled for-long term illness and health satisfaction.
Correlational finding on Happiness and . involved in schooling or not Subject code: S1.2.1.1
http://worlddatabaseofhappiness.eur.nl/hap_cor/top_sub.php?code=S1 (23 of 147)9-9-2009 14:01:24

Findings on Happiness and SCHOOL
Study CBS 2004
Reported in: Centraal Bureau voor de Statistiek (CBS) Waardering Leefsituatie, 2002 . (Appreciation Living Condition 2002.) Central Bureau for Statistics, 2004, The Hague, Netherlands http://statline.cbs.nl Page in Report: 1
Population: 12+ aged, The Netherlands, 2002
Sample: Probability multi-stage cluster sample
Non-Response:
N: 37482
Correlate
Authors label: Occupation
Our classification: . involved in schooling or not, code S1.2.1.1
Measurement: a: higher managementb: further white collarc: small businessd: skilled blue collare: unskilled manualf: unemployedg: in educationh: unfit for labori: pre-retired, retiredj: homemaker (with children)k: other
Observed Relation with Happiness
Happiness Measure
Statistics Elaboration/Remarks
O-HP/u/sq/v/5/a DM= higher management M = 4,20 CI95 [4,18-4,22]further white collar M = 4,15 CI95 [4,13-4,17]small business M = 4,16 CI95 [4,12-4,20]skilled manual M = 4,15 CI95 [4,12-4,18]unskilled manual M = 4,01 CI95 [3,98-4,04] unemployed M = 3,86 CI95 [3,97-3,94]in education M = 4,11 CI95 [4,08-4,14]unfit for labor M = 3,65 CI95 [3,59-3,71]retired M = 4,07 CI95 [4,02-4,13]homemaker M = 4,07 CI95 [4,02-4,12]other M = 3,95 CI95 [3,91-3,99]
O-HP/u/sq/v/5/a BMCT= a,c,d>f,g,h.i.j>e>k>f>h
http://worlddatabaseofhappiness.eur.nl/hap_cor/top_sub.php?code=S1 (24 of 147)9-9-2009 14:01:24

Findings on Happiness and SCHOOL
O-SLW/c/sq/n/5/b DMt= higher management M = 3,51 CI95 [3,49-3,54]further white collar M = 3,44 CI95 [3,40-3,47]small business M = 3,43 CI95 [3,36-3,50]skilled manual M = 3,43 CI95 [3,38-3,47]unskilled manual M = 3,27 CI95 [3,38-3,47] unemployed M = 2,83 CI95 [2,74-2,93]in education M = 3,44 CI95 [3,40-3,49]unfit for labor M = 2,66 CI95 [2,59-2,73]retired M = 3,50 CI95 [3,42-3,57]homemaker M = 3,28 CI95 [3,21-3,34]other M = 3,21 CI95 [3,16-3,26]
O-SLW/c/sq/n/5/b BMCT= p<.05
a,i,g > b,d,e,h,j,f,ka,b,c,d,g,i > e,k > f > h
Correlational finding on Happiness and . involved in schooling or not Subject code: S1.2.1.1
Study CUMMI 2004C
Reported in: Cummins, R.A.; Eckersley, R.; Lo, S.K.; Okerstrom, E.; et al. Australian Unity Wellbeing Index, Survey 10, Report 10. The Wellbeing of Australians-Health and Body Weight. Australian Centre on Quality of Life, 2004, Melbourne, Australia. http://www.deakin.edu.au/research/acqol/index.htm Page in Report: 175+
Population: 18+ aged, Australia, 2004
Sample: Probability area sample
Non-Response: 89%
N: 2000
Correlate
Authors label: Full time Work Status
Our classification: . involved in schooling or not, code S1.2.1.1
Measurement: a: Full time paid employmentb: Full time retiredc: Semi retiredd: Full time volunteere: Full time home or family caref: Unemployedg: Full time Student
Measured Values: N = a: 750, b: 517, c: 39, d: 13, e: 208, f: 94
Observed Relation with Happiness
http://worlddatabaseofhappiness.eur.nl/hap_cor/top_sub.php?code=S1 (25 of 147)9-9-2009 14:01:24

Findings on Happiness and SCHOOL
Happiness Measure
Statistics Elaboration/Remarks
O-SLW/u/sq/n/11/ca DMt= a Mt = 7,66; SD = 1,60b Mt = 8,14; SD = 1,57c Mt = 7,49; SD = 1,92d Mt = 8,62; SD = 0,96e Mt = 7,79; SD = 1,81f Mt = 6,55; SD = 2,53g Mt = 7,16; SD = 1,42
O-SLW/u/sq/n/11/ca BMCT= f
Correlational finding on Happiness and . involved in schooling or not Subject code: S1.2.1.1
Study CUMMI 2004C
Reported in: Cummins, R.A.; Eckersley, R.; Lo, S.K.; Okerstrom, E.; et al. Australian Unity Wellbeing Index, Survey 10, Report 10. The Wellbeing of Australians-Health and Body Weight. Australian Centre on Quality of Life, 2004, Melbourne, Australia. http://www.deakin.edu.au/research/acqol/index.htm Page in Report: 177
Population: 18+ aged, Australia, 2004
Sample: Probability area sample
Non-Response: 89%
N: 2000
Correlate
Authors label: Full time Work Status
Our classification: . involved in schooling or not, code S1.2.1.1
Measurement: a: Full time paid employmentb: Full ttime retiredc: Semi retiredd: Full time volunteere: Full time home or family caref: Unemployed
Measured Values: N = a: 1433; b: 1007, c: 86, d: 22, e: 366, f: 233
Remarks: Combined Surveys 9-10
Observed Relation with Happiness
http://worlddatabaseofhappiness.eur.nl/hap_cor/top_sub.php?code=S1 (26 of 147)9-9-2009 14:01:24

Findings on Happiness and SCHOOL
Happiness Measure
Statistics Elaboration/Remarks
O-SLW/u/sq/n/11/ca DMt= a Mt = 7,74; SD = 1,57b Mt = 8,08; SD = 1,65c Mt = 7,78; SD = 1,69d Mt = 8,32; SD = 1,25e Mt = 7,87; SD = 1,77f Mt = 6,61; SD = 2,36
O-SLW/u/sq/n/11/ca BMCT= f<(a,b,c,d,e)a
Correlational finding on Happiness and . involved in schooling or not Subject code: S1.2.1.1
Study DEROG 1996
Reported in: Derogatis, L.R.; Rutigliano P.J. Derogatis Affects Balance Scale: DABS. Spilker, B.;Ed.: "Quality of Life and Pharmacoeconomics in Clinical Trials, Second Edition", Lippincott-Raven Publishers, 1996, Philadelphia, USA, 169 - 177 ISBN:07817 03328 Page in Report:
Population: Students and mental patients, USA 199?
Sample: Non-probability chunk sample
Non-Response: not reported
N: 338
Correlate
Authors label: Mental illness
Our classification: . involved in schooling or not, code S1.2.1.1
Measurement: 1. mental patients a. outpatients, mainly sexual dysfunction complaints b. inpatients0. normals (students)
Measured Values: N=338, 1a: 88, 1b: 50, 0: 200
Remarks: Selection method of respondents (normals) not reported.
Observed Relation with Happiness
Happiness Measure
Statistics Elaboration/Remarks
http://worlddatabaseofhappiness.eur.nl/hap_cor/top_sub.php?code=S1 (27 of 147)9-9-2009 14:01:24

Findings on Happiness and SCHOOL
A-Bde/c/mq/n/5/a D%=- Unhappy Moderate Happy1. a.mental outpatients 18,2% 38,6% 43,2% b.mental inpatients 56,0% 26,0% 18,0%0. normals 2.5% 19,0% 78,5%
Correlational finding on Happiness and . involved in schooling or not Subject code: S1.2.1.1
Study EUROP 1997
Reported in: European Commission Eurobarometer Report 47, Public Opinion of the European Union. European Union, 1997, Brussels, Belgium http://europa.eu.int/comm/public_opinion/archives/eb/eb47/eb47_en.htm Page in Report: B2
Population: 15+ aged, EU member states, 1997
Sample: Probability multi-stage cluster sample
Non-Response:
N: 15900
Correlate
Authors label: Terminal education age
Our classification: . involved in schooling or not, code S1.2.1.1
Measurement: 1: 15<2: 16-193: 20+4: still studying
Observed Relation with Happiness
Happiness Measure
Statistics Elaboration/Remarks
O-SLL/u/sq/v/4/b DM=+ 1: 15< M=2,86 CI95: 2,84-2,882: 16-19 M=2,90 CI95: 2,88-2,923: 20+ M=3,01 CI95: 2,99-3,044: still studying M=3,05 CI95: 3,01-3,09
O-SLL/u/sq/v/4/b BMCT=+ p<.05
1< 2<3,4
Correlational finding on Happiness and . involved in schooling or not Subject code: S1.2.1.1
http://worlddatabaseofhappiness.eur.nl/hap_cor/top_sub.php?code=S1 (28 of 147)9-9-2009 14:01:24

Findings on Happiness and SCHOOL
Study EUROP 1998
Reported in: European Commission Eurobarometer Report 49, Public Opinion of the European Union. European Union,1998, Brussels, Belgium http://europa.eu.int/comm/public_opinion/archives/eb/eb49/eb49_en.htm Page in Report: B.59
Population: 15+ aged, EU member states, 1998
Sample: Probability multi-stage cluster sample
Non-Response:
N: 16165
Correlate
Authors label: Terminal Education Age
Our classification: . involved in schooling or not, code S1.2.1.1
Measurement: Terminal education age1: 15<2: 16-193: 20+4: still studying
Measured Values: 1: 31%, 2: 39%, 3: 21%, 4: 9%
Observed Relation with Happiness
Happiness Measure
Statistics Elaboration/Remarks
O-SLL/u/sq/v/4/b DM=+ 1: 15<: M=2,81 CI95 = 2,79-2,832: 16-19: M=2,92 CI95 = 2,90-2,943: 20+: M=3,02 CI95 = 3,00-3,044: still studying M=3,07 CI95 = 3,04-3,11
O-SLL/u/sq/v/4/b BMCT=+ p<.05
1<2<3,4
Correlational finding on Happiness and . involved in schooling or not Subject code: S1.2.1.1
Study EUROP 1999
Reported in: European Commission Eurobarometer Report 52, Public Opinion of the European Union Commision of the European Community, 1999, Brussels, Belgium http://europa.eu.int/comm/public_opinion/archives/eb/eb52/eb52_en.htm Page in Report: B.2
http://worlddatabaseofhappiness.eur.nl/hap_cor/top_sub.php?code=S1 (29 of 147)9-9-2009 14:01:24

Findings on Happiness and SCHOOL
Population: + 15 aged, EU member states, 1999
Sample: Probability multi-stage cluster sample
Non-Response:
N: 15900
Correlate
Authors label: Terminal Education Age
Our classification: . involved in schooling or not, code S1.2.1.1
Measurement: 1: 15<2: 16-193: 20+4: still studying
Measured Values: 1: 30%, 2: 41%, 3: 20%, 4: 9%
Observed Relation with Happiness
Happiness Measure
Statistics Elaboration/Remarks
O-SLL/u/sq/v/4/b DM=+ 1: 15< M= 2,92 CI95: 2.90-2,942: 16-19 M= 2,98 CI95: 2,96-3,003: 20+ M= 3,08 CI95: 3,06-3,104: still studying M= 3,13 CI95: 3,10-3,16
O-SLL/u/sq/v/4/b BMCT=+ p<.05
1<2<3,4
Correlational finding on Happiness and . involved in schooling or not Subject code: S1.2.1.1
Study EUROP 2000
Reported in: European Commission Eurobarometer Report 53, Public Opinion in the European Union European Union, 2000, Brussels, Belgium http://europa.eu.int/comm/public_opinion/archives/eb/eb53/eb53_en.htm Page in Report: B.2
Population: 15+ aged, EU member states 2000
Sample: Probability multi-stage cluster sample
Non-Response:
N: 16078
http://worlddatabaseofhappiness.eur.nl/hap_cor/top_sub.php?code=S1 (30 of 147)9-9-2009 14:01:24

Findings on Happiness and SCHOOL
Correlate
Authors label: Terminal education age
Our classification: . involved in schooling or not, code S1.2.1.1
Measurement: 1: 15< 2: 16-19 3: 20+ 4: still studying
Measured Values: 1: 30%, 2: 41%, 3: 21%, 4: 9%
Observed Relation with Happiness
Happiness Measure
Statistics Elaboration/Remarks
O-SLL/u/sq/v/4/b DM=+ 1: 15< M= 2,81 CI95: 2.79-2,832: 16-19 M= 2,88 CI95: 2,86-2,903: 20+ M= 3,00 CI95: 2,98-3,024: still studying M= 3,08 CI95: 3,05-3,12
O-SLL/u/sq/v/4/b BMCT=+ p<.05
1<2<3<4
Correlational finding on Happiness and . involved in schooling or not Subject code: S1.2.1.1
Study EUROP 2001
Reported in: European Commission Eurobarometer Report 54, Public Opinion in the European Union European Union, 2001, Brussels, Belgium http://europa.eu.int/comm/public_opinion/archives/eb/eb54/eb54_en.htm Page in Report: B.2
Population: 15+ aged, EU member states 2000
Sample: Probability multi-stage cluster sample
Non-Response:
N: 15900
Correlate
Authors label: Terminal education age
Our classification: . involved in schooling or not, code S1.2.1.1
http://worlddatabaseofhappiness.eur.nl/hap_cor/top_sub.php?code=S1 (31 of 147)9-9-2009 14:01:24

Findings on Happiness and SCHOOL
Measurement: 1: 15<2: 16-193: 20+4: still studying
Measured Values: 1: 29%, 2: 40%, 3: 21%, 4: 10%
Observed Relation with Happiness
Happiness Measure
Statistics Elaboration/Remarks
O-SLL/u/sq/v/4/b DM=+ 1: 15< M=2,92 CI95:2,90-2,942: 16-19 M=3,01 CI95:2,99-3,033: 20+ M=3,09 CI95:3,07-3,114: still studying M=3,14 CI95:3,11-3,17
O-SLL/u/sq/v/4/b BMCT=+ p<.05
1<2<3<4
Correlational finding on Happiness and . involved in schooling or not Subject code: S1.2.1.1
Study FREY 2000B
Reported in: Frey, B.S.;Stutzer, A. Maximizing Happiness? German Economic Review, 2000, Vol. 1, 145 - 167 Page in Report: 156
Population: Adults, Switzerland, 1992
Sample: Probability sample (unspecified)
Non-Response:
N: 6000
Correlate
Authors label: Employment status
Our classification: . involved in schooling or not, code S1.2.1.1
Measurement: o Employed (reference)1 a Unemployed b Self-employed c At home d School e Retired f Other
http://worlddatabaseofhappiness.eur.nl/hap_cor/top_sub.php?code=S1 (32 of 147)9-9-2009 14:01:24

Findings on Happiness and SCHOOL
Observed Relation with Happiness
Happiness Measure
Statistics Elaboration/Remarks
O-SLW/c/sq/n/10/a Beta=-.83 p<.01
Unemployed (vs. employed)
O-SLW/c/sq/n/10/a Beta=+.11 p<.01
Self employed (vs. employed)
O-SLW/c/sq/n/10/a Beta=+.17 p<.01
At home (vs. employed)
O-SLW/c/sq/n/10/a Beta=+.02 At school (vs. employed)
O-SLW/c/sq/n/10/a Beta=-.12 p<.01
Retired (vs. employed)
O-SLW/c/sq/n/10/a Beta=+.18 p<.01
Other (vs. employed)
Betas controlled for- Income- Education- Demographic factors (gender, age, marital status)- Institutional factor (direct democratic rights)
Correlational finding on Happiness and . involved in schooling or not Subject code: S1.2.1.1
Study GRAHA 2004
Reported in: Graham, C.; Eggers, A; Sukhtankar, S. Does Happiness Pay? An Exploration based on Panel Data from Russia Journal of Economic Behavior & Organization, 2004, Vol. 55, 319 - 342. ISSN 0167 2681 DOI:10.1016/j.jebo.2003.09.0002 Page in Report: 323,327
Population: 10+ aged, followed 5 years, Russia 1995-2000
Sample: Probability sample (unspecified)
Non-Response:
N: 5269
Correlate
Authors label: Student
Our classification: . involved in schooling or not, code S1.2.1.1
http://worlddatabaseofhappiness.eur.nl/hap_cor/top_sub.php?code=S1 (33 of 147)9-9-2009 14:01:24

Findings on Happiness and SCHOOL
Measurement: 0: Non student1: Student
Measured Values: 1; T1: M=0,17; SD=0,37; T2: M=0,12; SD=0,32
Remarks: Assessed at T1 (1995) and T2 (2000)Russia went through major changes in this era, among which a financial crisis in 1998
Observed Relation with Happiness
Happiness Measure
Statistics Elaboration/Remarks
O-SLW/c/sq/v/5/n Beta=+.46 T1:1995: student (vs non-student)
O-SLW/c/sq/v/5/n Beta=+.02 T2:2000 student (vs non-student)
Beta's controlled for: - gender- marital status- income- education level- minority- age- retirement- housewife- employment- self-employed- health index
T1-T2 difference in Beta: ns
Correlational finding on Happiness and . involved in schooling or not Subject code: S1.2.1.1
Study NUVOL 2004/1
Reported in: Nuvolati, G. The Italian Case. Commuting and Quality of Life. Paper 6the Congress ISQOLS, 2004, Philadelphia, USA Page in Report: 7
Population: 15+ aged. Italy, 1996
Sample: Probability sample (unspecified)
Non-Response: 1,7%
N: 3561
http://worlddatabaseofhappiness.eur.nl/hap_cor/top_sub.php?code=S1 (34 of 147)9-9-2009 14:01:24

Findings on Happiness and SCHOOL
Correlate
Authors label: Occupation
Our classification: . involved in schooling or not, code S1.2.1.1
Measurement: a: entrepreneur/self employedb: clerk/teacherc: worker/ farmerd: housewifee: retiredf: studentg: unemployed
Observed Relation with Happiness
Happiness Measure
Statistics Elaboration/Remarks
O-SQL/u/sq/v/4/a D%= % Satisfied:a: 85,5 b: 83,8 c: 84,7 d: 80,8 e: 86,0 f: 83,2 g: 53,6
Correlational finding on Happiness and . involved in schooling or not Subject code: S1.2.1.1
Study OOSTE 2008
Reported in: Oosterhof, S.F. Maakt Vrije Tijd Gelukkig? De Invloed van Vrije Tijd op de Geluksbeleving van Nederlanders. (Does Leisure Time Make you Happy? The Influence of Leisure Time on the Happiness Experience of the Dutch).) Master Thesis, Faculty Social Sciences, Erasmus University Rotterdam, 2008, Netherlands Page in Report: 33
Population: 12+ aged, Netherlands, 2005
Sample: Probability multi-stage cluster sample
Non-Response: 11%
N: 2204
Correlate
Authors label: Employment situation
Our classification: . involved in schooling or not, code S1.2.1.1
http://worlddatabaseofhappiness.eur.nl/hap_cor/top_sub.php?code=S1 (35 of 147)9-9-2009 14:01:24

Findings on Happiness and SCHOOL
Measurement: a: Study/ schoolb: No day job outside the house c: Retiredd: Working (reference category)
Measured Values: N = 1: 216 2: 273 3: 329 4: 1125
Observed Relation with Happiness
Happiness Measure
Statistics Elaboration/Remarks
O-HP/u/sq/v/5/a D%= Study No day job Retired Working Very happy 25.5% 29% 24% 24,5%Happy 69% 65% 65% 67,5%Not happy 5,5% 15% 11% 8%
O-HP/u/sq/v/5/a OR= UNHAPPY (vs happy) VERY HAPPY (vs happy) observed controlled observed controlledStudy 0,93 0,71 0,98 0,93No job 2,67* 2,46* 1,19 1,14Retired 1,95* 1,89* 1,18 1,12 Working 1 1 1 1
Control variables are:- gender- education - family stage - urban living environment- self reported health- self reported stress* = P<.05
Correlational finding on Happiness and . involved in schooling or not Subject code: S1.2.1.1
Study SOONS 2006
Reported in: Soons, J. Het Geluk van de Happy Single. (The Happiness of the Happy Single). Demos, 2006, Vol 21, 75 - 77. ISSN 0169 1473 Page in Report: 76
Population: Young adults, followed from age 18 to 26, The Netherlands, 1987-1999
Sample: Probability stratified sample
Non-Response:
N: 1775
Correlate
http://worlddatabaseofhappiness.eur.nl/hap_cor/top_sub.php?code=S1 (36 of 147)9-9-2009 14:01:24

Findings on Happiness and SCHOOL
Authors label: Daily activity
Our classification: . involved in schooling or not, code S1.2.1.1
Measurement: a No daily occupationb Full-time educationc Having a job
Remarks: Assessed at T1 + T2 (merged file)
Observed Relation with Happiness
Happiness Measure
Statistics Elaboration/Remarks
O-Sum/u/mq/v/7/a DM= No daily activity M = 5,8Full-time education M = 6,9Having a job M = 6,7
Correlational finding on Happiness and . involved in schooling or not Subject code: S1.2.1.1
Study STUTZ 2006
Reported in: Stutzer, A.; Frey, B.S. Does Marriage Make People Happy, or Do Happy People Get Married? Journal of Socio-Economics, 2006, Vol. 35, 326 - 347. ISSN 1053 5357 DOI:10.1016/j.socec.2005.11.043 (also Working Paper No. 143, Institute for Empirical Research in Economics, 2003, University of Zürich, Switzerland. ISSN 1424 0459) Page in Report: 25
Population: Adult members of private households, Germany,1984-2000
Sample: Non-probability purposive sample
Non-Response:
N: 15268
Correlate
Authors label: Employment
Our classification: . involved in schooling or not, code S1.2.1.1
http://worlddatabaseofhappiness.eur.nl/hap_cor/top_sub.php?code=S1 (37 of 147)9-9-2009 14:01:24

Findings on Happiness and SCHOOL
Measurement: 0 employed(reference group)1 a self-employed b unemployed c some work d non-working e maternity leave f military service g in education h retired
Observed Relation with Happiness
Happiness Measure
Statistics Elaboration/Remarks
O-SLW/c/sq/n/11/d B=-.26 p<.01
a: Self-employedWhen trait-happiness is also controled B=-.10
O-SLW/c/sq/n/11/d B=-1.0 p<.01
b: UnemployedWhen trait-happiness is also controled B=-.67
O-SLW/c/sq/n/11/d B=-.24 p<.01
c: Some workWhen trait-happiness is also controled B=-.12
O-SLW/c/sq/n/11/d B=-.12 p<.01
d: Non-workingWhen trait-happiness is also controled B=-.08
O-SLW/c/sq/n/11/d B=+.14 p<.01
e: Maternity leave When trait-happiness is also controled B=-.03
O-SLW/c/sq/n/11/d B=-.36 p<.01
f: Military serviceWhen trait-happiness is also controled B=-.46
O-SLW/c/sq/n/11/d B=-.00 ns g: In educationWhen trait-happiness is also controled B=-.00
O-SLW/c/sq/n/11/d B=-.09 p<.01
h: RetiredWhen trait-happiness is also controled B=-.01
B's controled for:- age- education- household income- position in the household- country of origin- time (dummy for wave of panel)and additionally for:- trait-happiness (average over all 14 waves)
http://worlddatabaseofhappiness.eur.nl/hap_cor/top_sub.php?code=S1 (38 of 147)9-9-2009 14:01:24

Findings on Happiness and SCHOOL
Correlational finding on Happiness and . involved in schooling or not Subject code: S1.2.1.1
Study TUCKE 2006
Reported in: Tucker, K.L., Ozer, D.J., Lyubomirsky, S. Testing for Measurement Invariance in the Satisfaction with Life Scale: A Comparison of Russians and North Americans. Social Indicators Research, 2006, Vol. 78, 341 - 360. ISSN p 0303 8300; ISSN e 1573 0921 DOI:10.1007/s11205-005-1037-5 Page in Report: 347
Population: Students and community members, US and Russia, 1999
Sample: Non-probability purposive sample
Non-Response: 0
N: 277
Correlate
Authors label: Students vs community members
Our classification: . involved in schooling or not, code S1.2.1.1
Measurement: 0. Community members (no students) in the USA or Russia1. Students in the USA or Russia
Measured Values: 0= 125 1= 152
Observed Relation with Happiness
Happiness Measure
Statistics Elaboration/Remarks
O-V/u/sq/v/7/a DM=+ American Russian All Mean SD Mean SD MeanCommunity mbs 4,71 1,52 3,16 1,29 3,94Students 4,61 1,38 4,08 1,53 4,35Difference -0,10 +0,92 +0,41
O-SLC/u/sq/v/7/a DM=+ American Russian All Mean SD Mean SD MeanCommunity mbs 4,79 1,46 3,08 1,34 3,93Students 4,81 1,33 4,20 1,55 4,50Difference +0,02 +1,12 +0,57
http://worlddatabaseofhappiness.eur.nl/hap_cor/top_sub.php?code=S1 (39 of 147)9-9-2009 14:01:24

Findings on Happiness and SCHOOL
O-SLu/u/sq/v/7/a DM=+ American Russian All Mean SD Mean SD MeanCommunity mbs 4,94 1,64 3,86 1,29 4,39Students 5,36 1,08 5,11 1,43 5,25Difference +0,42 +1,25 +0,86
C-RA/h/sq/v/7/a DM=+ American Russian All Mean SD Mean SD MeanCommunity mbs 4,94 1,63 3,30 1,24 4,11Students 5,17 1,42 4,26 1,60 4,78Difference +0,23 +0,96 +0,67
Correlational finding on Happiness and . involved in schooling or not Subject code: S1.2.1.1
Study UGLAN 2006
Reported in: Uglanova, E. Analysis of Happiness Variable in Monitoring of Social and Economic Changes in Russia 1993 - 2. Data Independent Institute for Social Policy, 2006, Russia http://sofist.socpol.ru Page in Report: question 124
Population: 16+ aged, Russia, 1993
Sample: Probability multi-stage cluster sample
Non-Response: ?
N: 2018
Correlate
Authors label: Current occupation
Our classification: . involved in schooling or not, code S1.2.1.1
Measurement: What is your occupational status?1 work as an employee on regular basis2 work regularly (temporaly) on contract basis3 have my own business4 self-employed, have my own farm5 serve in the army, police, work for the Ministry of Internal Affairs6 student7 retired8 housewife (including maternity leave cases)9 unemployed10 other
Measured Values: N = 1: 60,9% 2: 5,7% 3: 3,2% 4: 0,9% 5: 0,5% 6: 5,2% 7: 16,3% 8: 4% 9: 2,9% 10: 0,4%
Observed Relation with Happiness
http://worlddatabaseofhappiness.eur.nl/hap_cor/top_sub.php?code=S1 (40 of 147)9-9-2009 14:01:24

Findings on Happiness and SCHOOL
Happiness Measure
Statistics Elaboration/Remarks
O-SLW/c/sq/v/4/g DM= 1: M = 2,522: M = 2,603: M = 3,024: M = 2,845: M = 2,806: M = 2,677: M = 2,348: M = 2,599: M = 2,30 10:M = 2,67
Correlational finding on Happiness and . involved in schooling or not Subject code: S1.2.1.1
Study VENTE 1996
Reported in: Ventegodt, S. Liskvalitet hos 4500 31-33-arige. (The Quality of Life of 4500 31-33-Years-Olds). Forskningscenter for Livskvalitet, Forskningscentrets Forlag, København 1996, ISBN 8790190068 http://www.livskvalitet.org/t2/index.asp Page in Report: 112
Population: 31-33 aged, Denmark 1993, born in University Hospital in Copenhagen
Sample: Non-probability chunk sample
Non-Response: 39%
N: 4500
Correlate
Authors label: main occupation
Our classification: . involved in schooling or not, code S1.2.1.1
Measurement: "What is your main occupation "a: independent businessman/tradesmanb: assistant in spouse's businessc: unskilled/semi-skilled workerd: skilled workere: housewifef: salaried employee/civil servantg: studenth: pensioneri: social security recipient
Measured Values: N: All:4467; %:a:6,2; b:0,6; c:17,2; d:16,5; e:1,7; f:47,5; g:3,9; h:2,3; I:4,0
Observed Relation with Happiness
http://worlddatabaseofhappiness.eur.nl/hap_cor/top_sub.php?code=S1 (41 of 147)9-9-2009 14:01:24

Findings on Happiness and SCHOOL
Happiness Measure
Statistics Elaboration/Remarks
A-AOL/m/sq/v/5/a a: Mt=8.00b: Mt=8.08c: Mt=7.83d: Mt=7.89e: Mt=7.70f: Mt=7.86g: Mt=7.28h: Mt=6.09i: Mt=6.35
O-SLu/c/sq/v/5/e a: Mt=7.70b: Mt=8.08c: Mt=7.41d: Mt=7.61e: Mt=7.56f: Mt=7.55g: Mt=6.81h: Mt=5.88i: Mt=5.99
O-HL/c/sq/v/5/h a: Mt=7.18b: Mt=7.79c: Mt=6.96d: Mt=7.11e: Mt=7.46f: Mt=7.13g: Mt=6.60h: Mt=6.06i: Mt=6.01
Correlational finding on Happiness and . involved in schooling or not Subject code: S1.2.1.1
Study ZUMA 1989
Reported in: Zentrum fur Umfrageforschung Mannheim (ZUMA) Wohlfahrtsurveys 1978,1980,1984,1988. Unpublished data-set. Especially prepared for the World Database of Happiness. Page in Report:
Population: 18+ aged, general public, West-Germany, 1978-88
Sample:
Non-Response: ?
N: 2100
Correlate
http://worlddatabaseofhappiness.eur.nl/hap_cor/top_sub.php?code=S1 (42 of 147)9-9-2009 14:01:24

Findings on Happiness and SCHOOL
Authors label: Being student (1)
Our classification: . involved in schooling or not, code S1.2.1.1
Measurement: Question :' Are you at this moment ahigh-school or college student ?'0 no1 yes
Observed Relation with Happiness
Happiness Measure
Statistics Elaboration/Remarks
O-HL/c/sq/v/4/b SNR= eta G r ß
1978 -.02 -.06 -.02 +.041980 +.05 +.31 +.05 +.031984 +.04 +.23 +.04 +.041988 +.00 +.05 +.00 +.01
ß's controlled for age, gender, perceived classand marital status.
O-SLW/c/sq/n/11/ba SNR= eta G r ß
1978 +.04 +.21 +.04 +.011980 +.06 +.27 +.06 +.061984 +.01 +.07 +.01 +.001988 +.03 +.19 +.03 +.02
ß's controlled for age, gender, perceived class and marital status.
Correlational finding on Happiness and . extra-curricular activity Subject code: S1.2.1.3
Study BRENN 1970
Reported in: Brenner, B. Social Factors in Mental Well-Being at Adolescence. PhD Dissertation, The American University, 1970, Washington DC, USA Page in Report: 108/314
Population: Highschool pupils, New York State, USA, 1960
Sample:
Non-Response: 1%
N: 5204
http://worlddatabaseofhappiness.eur.nl/hap_cor/top_sub.php?code=S1 (43 of 147)9-9-2009 14:01:24

Findings on Happiness and SCHOOL
Correlate
Authors label: Time spent on extra-curricular activi- ties (1)
Our classification: . extra-curricular activity, code S1.2.1.3
Measurement: Open-ended direct question: 0 / 1-4 / 5 hours or more in a average week.
Observed Relation with Happiness
Happiness Measure
Statistics Elaboration/Remarks
O-HL/u/sq/v/4/b G=+.14
O-HL/u/sq/v/4/b V= .09 p<.01
Correlational finding on Happiness and . extra-curricular activity Subject code: S1.2.1.3
Study BRENN 1970
Reported in: Brenner, B. Social Factors in Mental Well-Being at Adolescence. PhD Dissertation, The American University, 1970, Washington DC, USA Page in Report: 108/314
Population: Highschool pupils, New York State, USA, 1960
Sample:
Non-Response: 1%
N: 5204
Correlate
Authors label: Time spent on extra-curricular activi- ties (2)
Our classification: . extra-curricular activity, code S1.2.1.3
Measurement: Open-ended direct question: 0 / 1-4 / 5 hours or more in a average week.
Observed Relation with Happiness
Happiness Measure
Statistics Elaboration/Remarks
A-AOL/g/sq/v/5/a G=+.14
http://worlddatabaseofhappiness.eur.nl/hap_cor/top_sub.php?code=S1 (44 of 147)9-9-2009 14:01:24

Findings on Happiness and SCHOOL
A-AOL/g/sq/v/5/a V= .09 p<.01
Correlational finding on Happiness and . extra-curricular activity Subject code: S1.2.1.3
Study BRENN 1970
Reported in: Brenner, B. Social Factors in Mental Well-Being at Adolescence. PhD Dissertation, The American University, 1970, Washington DC, USA Page in Report: 108/124 -
Population: Highschool pupils, New York State, USA, 1960
Sample:
Non-Response: 1%
N: 5204
Correlate
Authors label: Participation in extracurricular ac- tivities (1)
Our classification: . extra-curricular activity, code S1.2.1.3
Measurement: 2-item index of open-ended questions on number of extracurricular activities taken part in, and number of hours spent on these activities in an average week.
Observed Relation with Happiness
Happiness Measure
Statistics Elaboration/Remarks
O-HL/u/sq/v/4/b G=+.14 After control for:- having fun in life : Gs = +.07- tending to be a lonely person : Gs = +.10- having faith in people : Gs = +.10- sensitivity to failure : Gs = +.14- educational level of mother : Gs = +.12- school social class : Gs = +.12- self-esteem : Gs = +.12- tending to be a lonely person, and having fun in life : Gs = +.07- having faith in people, and having fun in life : Gs = +.04- having faith in people, and tending to be a lonely person : Gs = +.06- educational level of mother, and having fun in life : Gs = +.07- educational level of mother, and tending to be a lonely person : Gs = +.08- educational level of mother, and
http://worlddatabaseofhappiness.eur.nl/hap_cor/top_sub.php?code=S1 (45 of 147)9-9-2009 14:01:24

Findings on Happiness and SCHOOL
having faith in people : Gs = +.09- school social class, and having fun in life : Gs = +.06- school social class, and tending to be a lonely person : Gs = +.08- school social class, and having faith in people : Gs = +.08- school social class, and educa- tional level of mother : Gs = +.11
Unaffected by stability of self-imageUnaffected by hours spent on work for payPositive in middle and upper class : G = +.14After control for : Gs = +.10Negative in lower class : G = -.29After control for : Gs = -.24
O-HL/u/sq/v/4/b V= .07 p<.01
Correlational finding on Happiness and . extra-curricular activity Subject code: S1.2.1.3
Study BRENN 1970
Reported in: Brenner, B. Social Factors in Mental Well-Being at Adolescence. PhD Dissertation, The American University, 1970, Washington DC, USA Page in Report: 108/124 -
Population: Highschool pupils, New York State, USA, 1960
Sample:
Non-Response: 1%
N: 5204
Correlate
Authors label: Participation in extracurricular ac- tivities (2)
Our classification: . extra-curricular activity, code S1.2.1.3
Measurement: 2-item index of open-ended questions on number of extracurricular activities taken part in, and number of hours spent on these activities in an average week.
Observed Relation with Happiness
Happiness Measure
Statistics Elaboration/Remarks
http://worlddatabaseofhappiness.eur.nl/hap_cor/top_sub.php?code=S1 (46 of 147)9-9-2009 14:01:24

Findings on Happiness and SCHOOL
A-AOL/g/sq/v/5/a G=+.24 After control for:- having fun in life : Gs = +.19- tending to be a lonely person : Gs = +.21- having faith in people : Gs = +.21- sensitivity to failure : Gs = +.24- educational level of mother : Gs = +.22- school social class : Gs = +.23- tending to be a lonely person, and having fun in life : Gs = +.19- having faith in people, and having fun in life : Gs = +.17- having faith in people, and tending to be a lonely person : Gs = +.18- educational level of mother, and having fun in life : Gs = +.19- educational level of mother, and tending to be a lonely person : Gs = +.19- educational level of mother, and having faith in people : Gs = +.18- school social class, and having fun in life : Gs = +.19- school social class, and tending to be a lonely person : Gs = +.20- school social class, and having faith in people : Gs = +.21- school social class, and educa- tional level of mother : Gs = +.21
Medium and high stability of self-image : G = +.27Low stability of self-image : G = +.21
Spent no time on working for payspend : G = +.27Spent some hours on work for pay : G = +.22
Lower class : G = -.13Middle and upper class : G = +.21
Unaffected by school social class
A-AOL/g/sq/v/5/a V= .11 p<.01
Correlational finding on Happiness and . extra-curricular activity Subject code: S1.2.1.3
Study BRENN 1970
Reported in: Brenner, B. Social Factors in Mental Well-Being at Adolescence. PhD Dissertation, The American University, 1970, Washington DC, USA Page in Report: 108/318
http://worlddatabaseofhappiness.eur.nl/hap_cor/top_sub.php?code=S1 (47 of 147)9-9-2009 14:01:24

Findings on Happiness and SCHOOL
Population: Highschool pupils, New York State, USA, 1960
Sample:
Non-Response: 1%
N: 5204
Correlate
Authors label: Number of extra-curricular activities taken part in (1)
Our classification: . extra-curricular activity, code S1.2.1.3
Measurement: Open-ended direct question 0 / 1-2 / 3+
Observed Relation with Happiness
Happiness Measure
Statistics Elaboration/Remarks
O-HL/u/sq/v/4/b G=+.14
O-HL/u/sq/v/4/b V= .10 p<.01
Correlational finding on Happiness and . extra-curricular activity Subject code: S1.2.1.3
Study BRENN 1970
Reported in: Brenner, B. Social Factors in Mental Well-Being at Adolescence. PhD Dissertation, The American University, 1970, Washington DC, USA Page in Report: 108/318
Population: Highschool pupils, New York State, USA, 1960
Sample:
Non-Response: 1%
N: 5204
Correlate
Authors label: Number of extra-curricular activities taken part in (2)
Our classification: . extra-curricular activity, code S1.2.1.3
Measurement: Open-ended direct question 0 / 1-2 / 3+
http://worlddatabaseofhappiness.eur.nl/hap_cor/top_sub.php?code=S1 (48 of 147)9-9-2009 14:01:24

Findings on Happiness and SCHOOL
Observed Relation with Happiness
Happiness Measure
Statistics Elaboration/Remarks
A-AOL/g/sq/v/5/a G=+.16
A-AOL/g/sq/v/5/a V= .35 p<.01
Correlational finding on Happiness and School-success Subject code: S1.2.2
Study ABBEY 1983
Reported in: Abbey, A.; Dunkel-Schetter, C.; Brickman, P. Handling the Stress of Looking for a Job in Law School. Basic and Applied Social Psychology, 1983, Vol. 4, 263 - 278. ISSN 0197 3533 Page in Report: 272
Population: Law school students, Chicago, USA, 198?
Sample: Non-probability accidental sample
Non-Response: ?
N: 85
Correlate
Authors label: Perceived class rank (1)
Our classification: School-success, code S1.2.2
Measurement: Self-perceived rank in their class
Measured Values: (65% of the interviewed students reported being in the top 25% o their class, 27% reported being in the 25-50% range, while only 8% reported being in the lower 50% of their class.
Observed Relation with Happiness
Happiness Measure
Statistics Elaboration/Remarks
O-HL/g/sq/n/9/a DM=+ p<.05
1: High M= 4,200: Lower M= 3,44difference +0,76
Correlational finding on Happiness and School-success Subject code: S1.2.2
http://worlddatabaseofhappiness.eur.nl/hap_cor/top_sub.php?code=S1 (49 of 147)9-9-2009 14:01:24

Findings on Happiness and SCHOOL
Study ABBEY 1983
Reported in: Abbey, A.; Dunkel-Schetter, C.; Brickman, P. Handling the Stress of Looking for a Job in Law School. Basic and Applied Social Psychology, 1983, Vol. 4, 263 - 278. ISSN 0197 3533 Page in Report: 272
Population: Law school students, Chicago, USA, 198?
Sample: Non-probability accidental sample
Non-Response: ?
N: 85
Correlate
Authors label: Publications (1)
Our classification: School-success, code S1.2.2
Measurement: Has written a legal publication.1: yes0: no
Measured Values: 1: 45%
Observed Relation with Happiness
Happiness Measure
Statistics Elaboration/Remarks
O-HL/g/sq/n/9/a DM=+ p<.01
1: With publications: M=4.372: Without: M=3,49difference +0,88
Correlational finding on Happiness and School-success Subject code: S1.2.2
Study BACHM 1970
Reported in: Bachman, J.G.; Kahn, R.L.; Mednick, M.; Davidson, T.N. Youth in Transition. Vol.II: The Impact of Family Background on Intelligence in 10th-Grade Boy. Institute for Social Research, 1970, University of Michigan, Ann Arbor, USA Page in Report: 247
Population: Public highschool boys followed 3 years from grade 10, USA, 1966-69
Sample:
Non-Response: 2.8% incomplete information in 1966
N: 1799
http://worlddatabaseofhappiness.eur.nl/hap_cor/top_sub.php?code=S1 (50 of 147)9-9-2009 14:01:24
Findings on Happiness and SCHOOL
Correlate
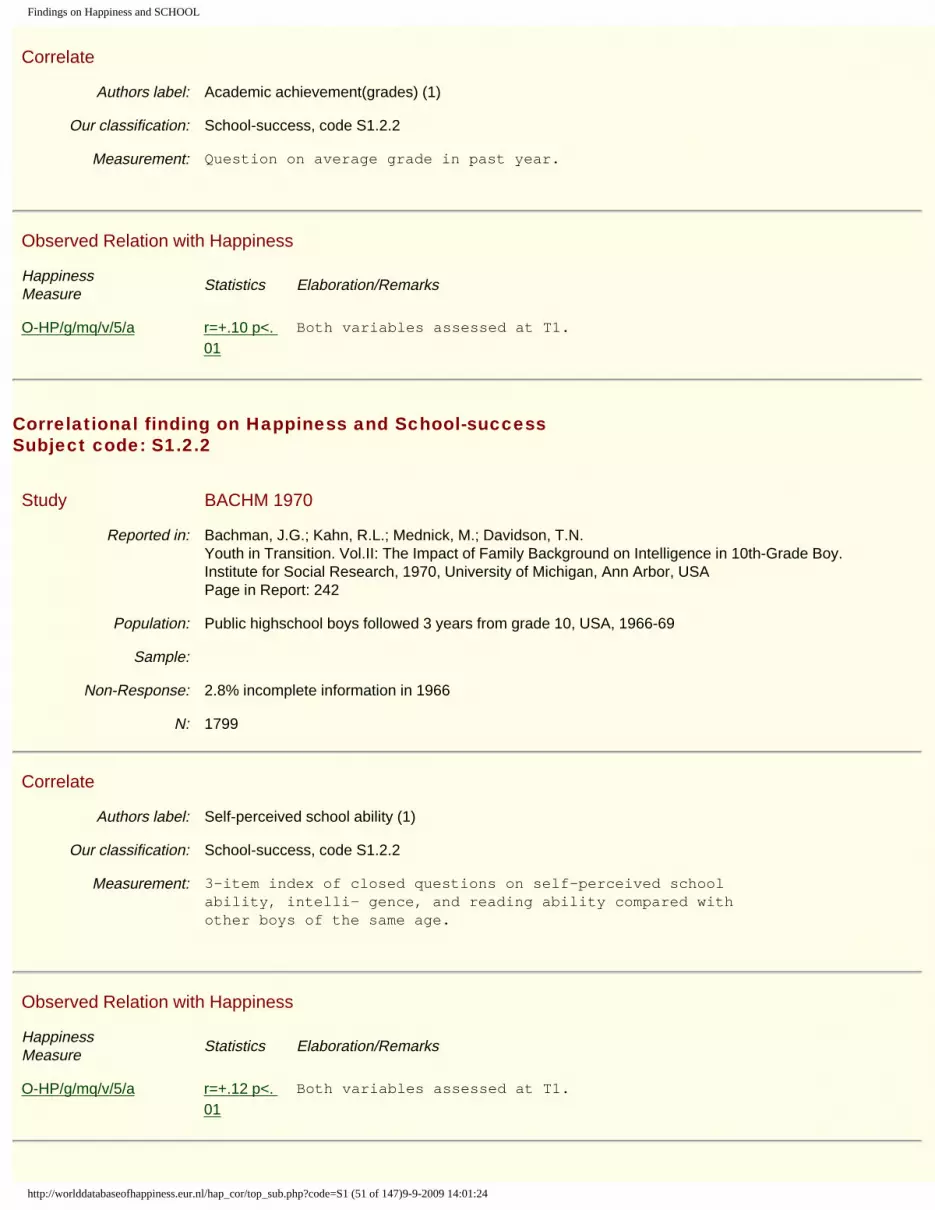
Authors label: Academic achievement(grades) (1)
Our classification: School-success, code S1.2.2
Measurement: Question on average grade in past year.
Observed Relation with Happiness
Happiness Measure
Statistics Elaboration/Remarks
O-HP/g/mq/v/5/a r=+.10 p<. 01
Both variables assessed at T1.
Correlational finding on Happiness and School-success Subject code: S1.2.2
Study BACHM 1970
Reported in: Bachman, J.G.; Kahn, R.L.; Mednick, M.; Davidson, T.N. Youth in Transition. Vol.II: The Impact of Family Background on Intelligence in 10th-Grade Boy. Institute for Social Research, 1970, University of Michigan, Ann Arbor, USA Page in Report: 242
Population: Public highschool boys followed 3 years from grade 10, USA, 1966-69
Sample:
Non-Response: 2.8% incomplete information in 1966
N: 1799
Correlate
Authors label: Self-perceived school ability (1)
Our classification: School-success, code S1.2.2
Measurement: 3-item index of closed questions on self-perceived school ability, intelli- gence, and reading ability compared with other boys of the same age.
Observed Relation with Happiness
Happiness Measure
Statistics Elaboration/Remarks
O-HP/g/mq/v/5/a r=+.12 p<. 01
Both variables assessed at T1.
http://worlddatabaseofhappiness.eur.nl/hap_cor/top_sub.php?code=S1 (51 of 147)9-9-2009 14:01:24

Findings on Happiness and SCHOOL
Correlational finding on Happiness and School-success Subject code: S1.2.2
Study BACHM 1977
Reported in: Bachman, J. G.;O'Malley, P. M.; Johnston, J. Youth in Transition, Vol. VI: Adolescence to Adulthood, Change and Stability in the Lives of Young Men. Institute for Social Research, 1970, University of Michigan, Ann Arbor, USA Page in Report:
Population: Public highschool boys followed 8 years from grade 10, USA, 1966-74
Sample:
Non-Response: 2.8% at T1, 17.2% at T2, 21.0% at T3, 28.9% at T4, 28.5% at T5
N: 1628
Correlate
Authors label: Repeated grade (1)
Our classification: School-success, code S1.2.2
Measurement: Simple direct question at T1: "Whereyou ever kept back a grade?" 1 = yes, 0 = no
Observed Relation with Happiness
Happiness Measure
Statistics Elaboration/Remarks
O-HP/g/mq/v/5/a tau=- ns T1 happiness: tau = -.07 (ns)T2 happiness: tau = -.01 (ns)T3 happiness: tau = -.01 (ns)T4 happiness: tau = -.03 (ns)T1:1966, T2:1968, T3:1969, T4:1970
Correlational finding on Happiness and School-success Subject code: S1.2.2
Study BACHM 1977
Reported in: Bachman, J. G.;O'Malley, P. M.; Johnston, J. Youth in Transition, Vol. VI: Adolescence to Adulthood, Change and Stability in the Lives of Young Men. Institute for Social Research, 1970, University of Michigan, Ann Arbor, USA Page in Report:
Population: Public highschool boys followed 8 years from grade 10, USA, 1966-74
Sample:
http://worlddatabaseofhappiness.eur.nl/hap_cor/top_sub.php?code=S1 (52 of 147)9-9-2009 14:01:24

Findings on Happiness and SCHOOL
Non-Response: 2.8% at T1, 17.2% at T2, 21.0% at T3, 28.9% at T4, 28.5% at T5
N: 1628
Correlate
Authors label: Average grade (1)
Our classification: School-success, code S1.2.2
Measurement: Respondent reported his average grade for all his courses for the year at T1, T2 and T3:10 = failure, E or F (59% or less);22 = D- (60 - 62); 25 = D (63 - 66);28 = D+ (67 - 69); 32 = C- (70 - 72);35 = C (73 - 76); 38 = C+ (77 - 79);42 = B- (80 - 82); 45 = B (83 - 86);48 = B+ (87 - 89); 52 = A- (90 - 92);55 = A (93 - 96); 58 = A+ (97 - 100)
Observed Relation with Happiness
Happiness Measure
Statistics Elaboration/Remarks
O-HP/g/mq/v/5/a tau=+ Average gradeHappiness T1 T2 T3T1 +.11 (01) +.12 (001) +.07 (ns)T2 +.09 (05) +.13 (001) +.03 (ns)T3 +.06 (ns) +.08 (05) +.02 (ns)T4 +.02 (ns) +.06 (ns) +.02 (ns)T1:1966, T2:1968, T3:1969, T4:1970
Correlational finding on Happiness and School-success Subject code: S1.2.2
Study BACHM 1977
Reported in: Bachman, J. G.;O'Malley, P. M.; Johnston, J. Youth in Transition, Vol. VI: Adolescence to Adulthood, Change and Stability in the Lives of Young Men. Institute for Social Research, 1970, University of Michigan, Ann Arbor, USA Page in Report:
Population: Public highschool boys followed 8 years from grade 10, USA, 1966-74
Sample:
Non-Response: 2.8% at T1, 17.2% at T2, 21.0% at T3, 28.9% at T4, 28.5% at T5
N: 1628
Correlate
http://worlddatabaseofhappiness.eur.nl/hap_cor/top_sub.php?code=S1 (53 of 147)9-9-2009 14:01:24

Findings on Happiness and SCHOOL
Authors label: Self-percieved school ability (1)
Our classification: School-success, code S1.2.2
Measurement: Index at T1 and T2 of three items in which respondent rates himself in comparison to others his age on overall school ability, reading ability, and intelligence. Scale: 1 = far below average to 6 = far above average
Observed Relation with Happiness
Happiness Measure
Statistics Elaboration/Remarks
O-HP/g/mq/v/5/a tau=+ Self-percieved school abilityHappiness T1 T2T1 tau = +.13 (001) +.07 (ns)T2 tau = +.11 (01) +.11 (01)T3 tau = +.08 (05) +.05 (ns)T4 tau = +.05 (ns) +.05 (ns)T1:1966, T2:1968, T3:1969, T4:1970
Correlational finding on Happiness and School-success Subject code: S1.2.2
Study CONST 1965
Reported in: Constantinople, A.P. Some Correlates of Happiness and Unhappiness in College Students. Unpublished Doctoral Dissertation, 1965, University of Rochester, USA. Page in Report: 67
Population: College students, University of Rochester, USA, 1965
Sample:
Non-Response: 30% (take home questionnaire).
N: 952
Correlate
Authors label: Academic status. (1)
Our classification: School-success, code S1.2.2
Measurement: Cumulative grade point average (GPA).
Observed Relation with Happiness
http://worlddatabaseofhappiness.eur.nl/hap_cor/top_sub.php?code=S1 (54 of 147)9-9-2009 14:01:24

Findings on Happiness and SCHOOL
Happiness Measure
Statistics Elaboration/Remarks
A-AOL/cy/sq/v/10/a DM=+ p<.01
Posistive among males only.Significant (05) among sophomore males only.Unaffected by stage of study among females.
Correlational finding on Happiness and School-success Subject code: S1.2.2
Study CONST 1965
Reported in: Constantinople, A.P. Some Correlates of Happiness and Unhappiness in College Students. Unpublished Doctoral Dissertation, 1965, University of Rochester, USA. Page in Report: 69
Population: College students, University of Rochester, USA, 1965
Sample:
Non-Response: 30% (take home questionnaire).
N: 952
Correlate
Authors label: Academic status (discrepancy betweenaptitude and achiev. (1)
Our classification: School-success, code S1.2.2
Measurement: Achievement index computed by subtracting the SAT-Verbal score from that associated with the cumulative grade point average.
Observed Relation with Happiness
Happiness Measure
Statistics Elaboration/Remarks
A-AOL/cy/sq/v/10/a D%=+ ns Computed for freshmen and juniors only (N=274).
Correlational finding on Happiness and School-success Subject code: S1.2.2
Study CURRI 2004
http://worlddatabaseofhappiness.eur.nl/hap_cor/top_sub.php?code=S1 (55 of 147)9-9-2009 14:01:24

Findings on Happiness and SCHOOL
Reported in: Currie, C.; Roberts, Ch.; Morgan, A.; Smith, R.; Settertobulte, W.: et al; Eds. Young People's Health in Context. World Health Organization Europe, 2004, Copenhagen, Denmark. ISBN 92 890 1372 9 Page in Report: 186
Population: 11-15 aged, school children, 33 countries and regions, 2001
Sample: Probability cluster sample
Non-Response:
N: 162306
Correlate
Authors label: Academic achievement
Our classification: School-success, code S1.2.2
Measurement: Self report on single question:In your opinion, what does your class teacher(s) think aboutyour school performance compared to your classmates?4 very good3 good2 average1 below average.
Measured Values: not reported
Remarks: 15 year olds only (N = 50816)
Observed Relation with Happiness
Happiness Measure
Statistics Elaboration/Remarks
C-BW/c/sq/l/11/a rs=+ Girls: rs = +.23Boys : rs = +.19
Correlational finding on Happiness and School-success Subject code: S1.2.2
Study PORTE 1967
Reported in: Porter J. Sex-Role Concepts, Their Relationship to Psychological Well-Being and to Future Plans of Female College Seniors. Unpublished doctoral dissertation, 1967, University of Rochester, New York, USA Page in Report: 96
Population: Female students college seniors, followed two months, Rochester, USA, 1965-66
http://worlddatabaseofhappiness.eur.nl/hap_cor/top_sub.php?code=S1 (56 of 147)9-9-2009 14:01:24

Findings on Happiness and SCHOOL
Sample:
Non-Response: 8%; unaffected by place of residence
N: 162
Correlate
Authors label: Academic status (1)
Our classification: School-success, code S1.2.2
Measurement: Cumulative grade point average
Observed Relation with Happiness
Happiness Measure
Statistics Elaboration/Remarks
A-AOL/cq/sq/v/10/a r= ns T2 happiness by T2 grade
Correlational finding on Happiness and School-success Subject code: S1.2.2
Study SMITH 1982
Reported in: Smith, T. W. College Dropouts: An Analyses of the Psychological Well-Being and Attidudes of Various Educational Groups. Social Psychology Quarterly, 1982, Vol. 45, 50 - 53. ISSN 0190 2725 Page in Report: 52
Population: 18+aged,general public, non-institutionalized, USA, 1972-80
Sample:
Non-Response:
N: 11997
Correlate
Authors label: School drop out (1)
Our classification: School-success, code S1.2.2
http://worlddatabaseofhappiness.eur.nl/hap_cor/top_sub.php?code=S1 (57 of 147)9-9-2009 14:01:24

Findings on Happiness and SCHOOL
Measurement: College Dropouts0 Associate or bachelor's degree1 Some college but no degree
Graduate School Dropouts0 Graduate degree1 Bachelor's with 5 or more years of college but no graduate degree
Remarks: % happy:
Observed Relation with Happiness
Happiness Measure
Statistics Elaboration/Remarks
O-HL/c/sq/v/3/aa G=-.05 p<.01
degree: 37,9
O-HL/c/sq/v/3/aa tb=-.03 ns no degree: 34,9
O-HL/c/sq/v/3/aa G=-.08 p<.01
degree: 40,2
O-HL/c/sq/v/3/aa tb=-.04 ns no degree: 35,7
Correlational finding on Happiness and School-success Subject code: S1.2.2
Study WEBB 1915/1
Reported in: Webb, E. Character and Intelligence. An Attempt at an Exact Study of Character. Cambridge University Press, 1915, London, UK Page in Report: 26
Population: Male college students, England, 1912
Sample:
Non-Response: -
N: 194
Correlate
Authors label: Examination ability (1)
http://worlddatabaseofhappiness.eur.nl/hap_cor/top_sub.php?code=S1 (58 of 147)9-9-2009 14:01:24

Findings on Happiness and SCHOOL
Our classification: School-success, code S1.2.2
Measurement: Rating on a 7-point scale on the basis of 3 terminal examinations.The result of the first and the third were pooled to give one set of values, and the second furnished the other.
Observed Relation with Happiness
Happiness Measure
Statistics Elaboration/Remarks
A-CP/g/rdp/ro/7/a r=+.09
Correlational finding on Happiness and School-success Subject code: S1.2.2
Study WESSM 1966/2
Reported in: Wessman, A.E.;Ricks, D.F. Mood and Personality. Holt, Rinehart and Wilson, 1966, New York, USA. ISBN 03 0541 151 8 Page in Report: 123
Population: Male college students, followed 3 years, Harvard University, USA, 1957-60
Sample: Non-probability chunk sample
Non-Response: 37%: 9 dropouts, incomplete; about the same happiness distribution.
N: 17
Correlate
Authors label: College performance (1)
Our classification: School-success, code S1.2.2
Measurement: Student's yearly grade average.
Observed Relation with Happiness
Happiness Measure
Statistics Elaboration/Remarks
A-ARE/md/sqr/v/10/a r=+.43 p<. 10
Freshman year : r = +.50 (05)Sophomore year : r = +.53 (05)Junior year : r = +.15 (ns)Senior year : r = +.31 (ns)
http://worlddatabaseofhappiness.eur.nl/hap_cor/top_sub.php?code=S1 (59 of 147)9-9-2009 14:01:24

Findings on Happiness and SCHOOL
Correlational finding on Happiness and School-success Subject code: S1.2.2
Study WESSM 1966/2
Reported in: Wessman, A.E.;Ricks, D.F. Mood and Personality. Holt, Rinehart and Wilson, 1966, New York, USA. ISBN 03 0541 151 8 Page in Report: 123
Population: Male college students, followed 3 years, Harvard University, USA, 1957-60
Sample: Non-probability chunk sample
Non-Response: 37%: 9 dropouts, incomplete; about the same happiness distribution.
N: 17
Correlate
Authors label: Academic performancerelative to poten- tial abilities (1)
Our classification: School-success, code S1.2.2
Measurement: Discrepancy between predicted rank list (PRL) before college entrance and ac- tual grade average for the four years.
Observed Relation with Happiness
Happiness Measure
Statistics Elaboration/Remarks
A-ARE/md/sqr/v/10/a r=-.34 ns The PRL = expected college grade average on the basis of the student's previous secondary schoolrecord, level of preparation, and aptitude tests.
Correlational finding on Happiness and Involvement in school-work Subject code: S1.2.3
Study BACHM 1977
Reported in: Bachman, J. G.;O'Malley, P. M.; Johnston, J. Youth in Transition, Vol. VI: Adolescence to Adulthood, Change and Stability in the Lives of Young Men. Institute for Social Research, 1970, University of Michigan, Ann Arbor, USA Page in Report:
Population: Public highschool boys followed 8 years from grade 10, USA, 1966-74
Sample:
Non-Response: 2.8% at T1, 17.2% at T2, 21.0% at T3, 28.9% at T4, 28.5% at T5
http://worlddatabaseofhappiness.eur.nl/hap_cor/top_sub.php?code=S1 (60 of 147)9-9-2009 14:01:24

Findings on Happiness and SCHOOL
N: 1628
Correlate
Authors label: Number of hours of homework (1)
Our classification: Involvement in school-work, code S1.2.3
Measurement: Simple direct question at T1, T2 and T3: "About how many hours do you spend in an average week on all your homework including both in and out of school?"1 = no hours; 2 = 1 to 4 hours;3 = 5 to 9 hours; 4 = 10 to 14 hours;5 = 15 to 19 hours; 6 = 20 to 24 hours;7 = 25 or more hours
Observed Relation with Happiness
Happiness Measure
Statistics Elaboration/Remarks
O-HP/g/mq/v/5/a tau=+ Number of hours of homeworkHappiness T1 T2 T3T1 +.07 (ns) +.05 (ns) +.07 (ns)T2 +.03 (ns) +.06 (ns) +.06 (ns)T3 +.02 (ns) +.01 (ns) +.10 (01)T4 +.02 (ns) -.00 (ns) +.04 (ns)T1:1966, T2:1968, T3:1969, T4:1970
Correlational finding on Happiness and Involvement in school-work Subject code: S1.2.3
Study BACHM 1977
Reported in: Bachman, J. G.;O'Malley, P. M.; Johnston, J. Youth in Transition, Vol. VI: Adolescence to Adulthood, Change and Stability in the Lives of Young Men. Institute for Social Research, 1970, University of Michigan, Ann Arbor, USA Page in Report:
Population: Public highschool boys followed 8 years from grade 10, USA, 1966-74
Sample:
Non-Response: 2.8% at T1, 17.2% at T2, 21.0% at T3, 28.9% at T4, 28.5% at T5
N: 1628
Correlate
Authors label: Does best work in school (1)
Our classification: Involvement in school-work, code S1.2.3
http://worlddatabaseofhappiness.eur.nl/hap_cor/top_sub.php?code=S1 (61 of 147)9-9-2009 14:01:24

Findings on Happiness and SCHOOL
Measurement: Simple direct question at T1 and T2: "How close do you come to doing the best work you are able to do on school?" 1 = not at all close;2 = not very close; 3 = somewhat close; 4 = quite close; 5 = very close
Observed Relation with Happiness
Happiness Measure
Statistics Elaboration/Remarks
O-HP/g/mq/v/5/a tau=+ Does best work in schoolHappiness T1 T2T1 tau = +.19 (001) +.11 (01)T2 tau = +.15 (001) +.16 (001)T3 tau = +.11 (01) +.10 (01)T4 tau = +.08 (05) +.07 (ns)T1:1966, T2:1968, T3:1969, T4:1970
Correlational finding on Happiness and Involvement in school-work Subject code: S1.2.3
Study BACHM 1977
Reported in: Bachman, J. G.;O'Malley, P. M.; Johnston, J. Youth in Transition, Vol. VI: Adolescence to Adulthood, Change and Stability in the Lives of Young Men. Institute for Social Research, 1970, University of Michigan, Ann Arbor, USA Page in Report:
Population: Public highschool boys followed 8 years from grade 10, USA, 1966-74
Sample:
Non-Response: 2.8% at T1, 17.2% at T2, 21.0% at T3, 28.9% at T4, 28.5% at T5
N: 1628
Correlate
Authors label: Works harder than average (1)
Our classification: Involvement in school-work, code S1.2.3
Measurement: Simple direct question at T1 and T2: "How hard do you think you work in school compared to the other students in your class?" 1 = much less hard;2 = less hard; 3 = about average: 4 = harder; 5 = much harder
Observed Relation with Happiness
http://worlddatabaseofhappiness.eur.nl/hap_cor/top_sub.php?code=S1 (62 of 147)9-9-2009 14:01:24
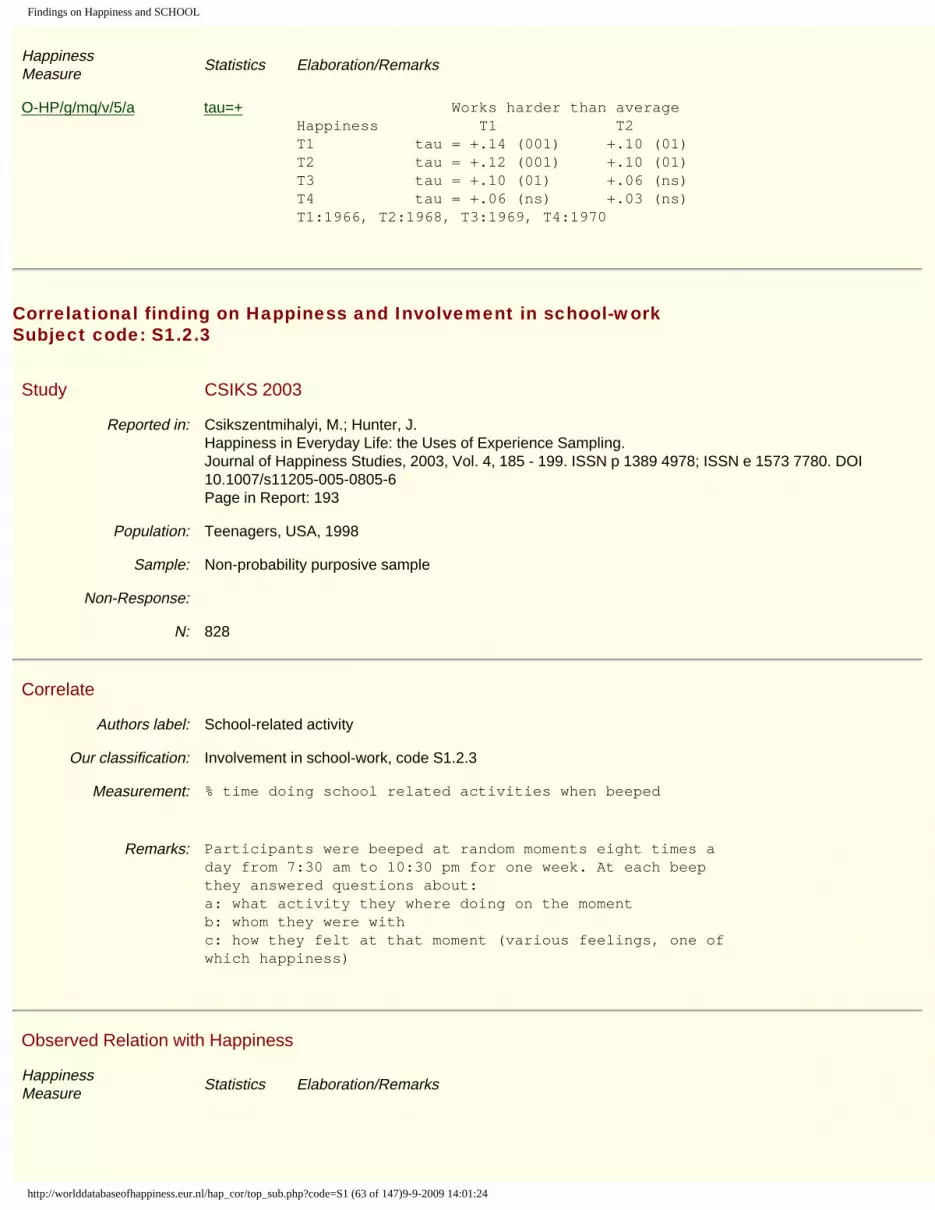
Findings on Happiness and SCHOOL
Happiness Measure
Statistics Elaboration/Remarks
O-HP/g/mq/v/5/a tau=+ Works harder than averageHappiness T1 T2T1 tau = +.14 (001) +.10 (01)T2 tau = +.12 (001) +.10 (01)T3 tau = +.10 (01) +.06 (ns)T4 tau = +.06 (ns) +.03 (ns)T1:1966, T2:1968, T3:1969, T4:1970
Correlational finding on Happiness and Involvement in school-work Subject code: S1.2.3
Study CSIKS 2003
Reported in: Csikszentmihalyi, M.; Hunter, J. Happiness in Everyday Life: the Uses of Experience Sampling. Journal of Happiness Studies, 2003, Vol. 4, 185 - 199. ISSN p 1389 4978; ISSN e 1573 7780. DOI 10.1007/s11205-005-0805-6 Page in Report: 193
Population: Teenagers, USA, 1998
Sample: Non-probability purposive sample
Non-Response:
N: 828
Correlate
Authors label: School-related activity
Our classification: Involvement in school-work, code S1.2.3
Measurement: % time doing school related activities when beeped
Remarks: Participants were beeped at random moments eight times a day from 7:30 am to 10:30 pm for one week. At each beep they answered questions about:a: what activity they where doing on the momentb: whom they were with c: how they felt at that moment (various feelings, one of which happiness)
Observed Relation with Happiness
Happiness Measure
Statistics Elaboration/Remarks
http://worlddatabaseofhappiness.eur.nl/hap_cor/top_sub.php?code=S1 (63 of 147)9-9-2009 14:01:24

Findings on Happiness and SCHOOL
A-ARE/mi/sqr/n/7/a Beta= Beta controlled for;- age- gender- SES
A-ARE/mi/sqr/n/7/a t.=+2.3 p<.024
Average (trait) happiness is higher among teenagers who study more, though happiness of the moment (state) yends to be lower while studying than during most other activities
Correlational finding on Happiness and Involvement in school-work Subject code: S1.2.3
Study HERZO 1982/3
Reported in: Herzog, A.R.;Rodgers, W.L.; Woodworth, J. Subjective Well-Being among Different Age Groups. Research Report I.S.R., University of Michigan, 1982, Ann Arbor, USA Page in Report: 84/5
Population: 50+ aged, general public, USA, 1975
Sample:
Non-Response:
N: 410
Correlate
Authors label: Education related activities (1)
Our classification: Involvement in school-work, code S1.2.3
Measurement: During 24-hour period prior to the interview, respondents reported each activity they engaged in (PARTICIPATION) and the time spend on each activity (DURATION) on an activity diary. Activities were coded into categories, one of which was "education related activities".
Work status was measured by self-labeling by respondents and a question about engagement in work for pay at present. Self-labeled housewives were excluded.
Observed Relation with Happiness
Happiness Measure
Statistics Elaboration/Remarks
O-DT/u/sq/v/7/a r=-.04 ns PARTICIPATION: working males
http://worlddatabaseofhappiness.eur.nl/hap_cor/top_sub.php?code=S1 (64 of 147)9-9-2009 14:01:24

Findings on Happiness and SCHOOL
O-DT/u/sq/v/7/a r=-.02 ns retired males
O-DT/u/sq/v/7/a r=+.08 ns retired females
O-DT/u/sq/v/7/a Beta=-.07 ns
working males
O-DT/u/sq/v/7/a Beta=-.03 ns
retired males
O-DT/u/sq/v/7/a Beta=+.12 ns
retired females
O-DT/u/sq/v/7/a r=-.07 ns DURATION: working males
O-DT/u/sq/v/7/a r=-.02 ns retired males
O-DT/u/sq/v/7/a r=+.08 ns retired females
O-DT/u/sq/v/7/a Beta=-.11 ns
working males
O-DT/u/sq/v/7/a Beta=+.03 ns
retired males
O-DT/u/sq/v/7/a Beta=+.12 ns
retired femalesß controlled for self-reported health, income and age. Relations with 'participation' also controled for 'duration' and relations with 'duration' also for participation.
Correlational finding on Happiness and Involvement in school-work Subject code: S1.2.3
Study WEBB 1915/1
Reported in: Webb, E. Character and Intelligence. An Attempt at an Exact Study of Character. Cambridge University Press, 1915, London, UK Page in Report: 26
Population: Male college students, England, 1912
Sample:
Non-Response: -
N: 194
http://worlddatabaseofhappiness.eur.nl/hap_cor/top_sub.php?code=S1 (65 of 147)9-9-2009 14:01:24

Findings on Happiness and SCHOOL
Correlate
Authors label: Mental work (1)
Our classification: Involvement in school-work, code S1.2.3
Measurement: Trained peer-rating of mental work be- stowed on usual studies on a 7-point scale on the basis of observation during 6 months.
Observed Relation with Happiness
Happiness Measure
Statistics Elaboration/Remarks
A-CP/g/rdp/ro/7/a r=-.02
Correlational finding on Happiness and Involvement in school-work Subject code: S1.2.3
Study WEBB 1915/2
Reported in: Webb, E. Character and Intelligence. An Attempt at an Exact Study of Character. Cambridge University Press, 1915, London, UK Page in Report: 27
Population: ±12 aged, male school pupils, London, England, 1912
Sample:
Non-Response: -
N: 140
Correlate
Authors label: Mental work bestowedupon usual studies, extent of (1)
Our classification: Involvement in school-work, code S1.2.3
Measurement: Class-master rating on a 7-point scale on the basis of observation during 6 months.
Observed Relation with Happiness
Happiness Measure
Statistics Elaboration/Remarks
A-CP/g/rdt/ro/7/a r=+.41
http://worlddatabaseofhappiness.eur.nl/hap_cor/top_sub.php?code=S1 (66 of 147)9-9-2009 14:01:24

Findings on Happiness and SCHOOL
Correlational finding on Happiness and Misbehavior in school Subject code: S1.2.4
Study BACHM 1970
Reported in: Bachman, J.G.; Kahn, R.L.; Mednick, M.; Davidson, T.N. Youth in Transition. Vol.II: The Impact of Family Background on Intelligence in 10th-Grade Boy. Institute for Social Research, 1970, University of Michigan, Ann Arbor, USA Page in Report: 247
Population: Public highschool boys followed 3 years from grade 10, USA, 1966-69
Sample:
Non-Response: 2.8% incomplete information in 1966
N: 1799
Correlate
Authors label: Delinquent behaviors (1)
Our classification: Misbehavior in school, code S1.2.4
Measurement: 26-item index of closed questions on running away from home, hitting parents, stealing, fighting, drinking alcohol without permission, etc. (adapted from Gold, 1966).
Observed Relation with Happiness
Happiness Measure
Statistics Elaboration/Remarks
O-HP/g/mq/v/5/a r=-.21 p<. 001
Both variables assessed at T1.
Correlational finding on Happiness and Misbehavior in school Subject code: S1.2.4
Study BACHM 1970
Reported in: Bachman, J.G.; Kahn, R.L.; Mednick, M.; Davidson, T.N. Youth in Transition. Vol.II: The Impact of Family Background on Intelligence in 10th-Grade Boy. Institute for Social Research, 1970, University of Michigan, Ann Arbor, USA Page in Report: 243
Population: Public highschool boys followed 3 years from grade 10, USA, 1966-69
Sample:
Non-Response: 2.8% incomplete information in 1966
N: 1799
http://worlddatabaseofhappiness.eur.nl/hap_cor/top_sub.php?code=S1 (67 of 147)9-9-2009 14:01:24

Findings on Happiness and SCHOOL
Correlate
Authors label: Rebellious behaviorsin school (2)
Our classification: Misbehavior in school, code S1.2.4
Measurement: 13-item index of closed questions on fighting with other students, not working hard, skipping classes, copying someone else's assignments, etc.
Observed Relation with Happiness
Happiness Measure
Statistics Elaboration/Remarks
O-HP/g/mq/v/5/a r=-.26 p<. 001
Both variables assessed at T1.
Correlational finding on Happiness and Misbehavior in school Subject code: S1.2.4
Study BACHM 1970
Reported in: Bachman, J.G.; Kahn, R.L.; Mednick, M.; Davidson, T.N. Youth in Transition. Vol.II: The Impact of Family Background on Intelligence in 10th-Grade Boy. Institute for Social Research, 1970, University of Michigan, Ann Arbor, USA Page in Report: 122
Population: Public highschool boys followed 3 years from grade 10, USA, 1966-69
Sample:
Non-Response: 2.8% incomplete information in 1966
N: 1799
Correlate
Authors label: Impulse to aggres- sion (1)
Our classification: Misbehavior in school, code S1.2.4
Measurement: 4-item index of closed questions on feelings of swearing, losing temper at teachers, being rude to teachers, picking a fight with parents.
Observed Relation with Happiness
Happiness Measure
Statistics Elaboration/Remarks
http://worlddatabaseofhappiness.eur.nl/hap_cor/top_sub.php?code=S1 (68 of 147)9-9-2009 14:01:24

Findings on Happiness and SCHOOL
O-HP/g/mq/v/5/a r=-.33 p<. 001
Both variables assessed at T1.
Correlational finding on Happiness and Misbehavior in school Subject code: S1.2.4
Study BACHM 1970
Reported in: Bachman, J.G.; Kahn, R.L.; Mednick, M.; Davidson, T.N. Youth in Transition. Vol.II: The Impact of Family Background on Intelligence in 10th-Grade Boy. Institute for Social Research, 1970, University of Michigan, Ann Arbor, USA Page in Report: 243
Population: Public highschool boys followed 3 years from grade 10, USA, 1966-69
Sample:
Non-Response: 2.8% incomplete information in 1966
N: 1799
Correlate
Authors label: Rebellious behaviors in school (1)
Our classification: Misbehavior in school, code S1.2.4
Measurement: 13-item index of closed question on fighting with other students, not working hard, skipping classes, copying someone else's assignments.
Observed Relation with Happiness
Happiness Measure
Statistics Elaboration/Remarks
O-HP/g/mq/v/5/a r=-.26 p<. 001
Both variables assessed at T1.
Correlational finding on Happiness and Misbehavior in school Subject code: S1.2.4
Study BACHM 1977
Reported in: Bachman, J. G.;O'Malley, P. M.; Johnston, J. Youth in Transition, Vol. VI: Adolescence to Adulthood, Change and Stability in the Lives of Young Men. Institute for Social Research, 1970, University of Michigan, Ann Arbor, USA Page in Report:
Population: Public highschool boys followed 8 years from grade 10, USA, 1966-74
http://worlddatabaseofhappiness.eur.nl/hap_cor/top_sub.php?code=S1 (69 of 147)9-9-2009 14:01:24

Findings on Happiness and SCHOOL
Sample:
Non-Response: 2.8% at T1, 17.2% at T2, 21.0% at T3, 28.9% at T4, 28.5% at T5
N: 1628
Correlate
Authors label: Rebellious behavior in school (1)
Our classification: Misbehavior in school, code S1.2.4
Measurement: T1 and T2: a mean of 13 items in which respondent indicated how often he did such things as "argue with your teachers," "goof-off in class," "skip classes," "cheat on tests," etc.
Scale: 1 = never to 5 = almost always
Observed Relation with Happiness
Happiness Measure
Statistics Elaboration/Remarks
O-HP/g/mq/v/5/a tau=- p<.001
Rebellious behavior in schoolHappines T1 T2T1 tau = -.29 -.17 T2 tau = -.25 -.25 T3 tau = -.17 -.19 T4 tau = -.18 -.16 All tau's significant (001)T1:1966, T2:1968, T3:1969, T4:1970
Correlational finding on Happiness and Misbehavior in school Subject code: S1.2.4
Study BACHM 1977
Reported in: Bachman, J. G.;O'Malley, P. M.; Johnston, J. Youth in Transition, Vol. VI: Adolescence to Adulthood, Change and Stability in the Lives of Young Men. Institute for Social Research, 1970, University of Michigan, Ann Arbor, USA Page in Report:
Population: Public highschool boys followed 8 years from grade 10, USA, 1966-74
Sample:
Non-Response: 2.8% at T1, 17.2% at T2, 21.0% at T3, 28.9% at T4, 28.5% at T5
N: 1628
Correlate
Authors label: Delinquent behavior in school (1)
http://worlddatabaseofhappiness.eur.nl/hap_cor/top_sub.php?code=S1 (70 of 147)9-9-2009 14:01:24

Findings on Happiness and SCHOOL
Our classification: Misbehavior in school, code S1.2.4
Measurement: At T1, T2 and T3: a mean of seven items measuring the amount of school-oriented delinquent behaviour. Included are questions on how often respondent has been suspended, damaged school property, and gotten into a serious fight at school. Scale: 0.00 = never to 4.00 = five or more times
Observed Relation with Happiness
Happiness Measure
Statistics Elaboration/Remarks
O-HP/g/mq/v/5/a tau=- Delinquent behavior in schoolHappiness T1 T2 T3T1 tau = -.19 (001) -.14 (001) -.12 (001)T2 tau = -.10 (01) -.15 (001) -.11 (01)T3 tau = -.07 (ns) -.10 (01) -.08 (05)T4 tau = -.06 (ns) -.04 (ns) -.04 (ns)T1:1966, T2:1968, T3:1969, T4:1970
Correlational finding on Happiness and Misbehavior in school Subject code: S1.2.4
Study BACHM 1977
Reported in: Bachman, J. G.;O'Malley, P. M.; Johnston, J. Youth in Transition, Vol. VI: Adolescence to Adulthood, Change and Stability in the Lives of Young Men. Institute for Social Research, 1970, University of Michigan, Ann Arbor, USA Page in Report:
Population: Public highschool boys followed 8 years from grade 10, USA, 1966-74
Sample:
Non-Response: 2.8% at T1, 17.2% at T2, 21.0% at T3, 28.9% at T4, 28.5% at T5
N: 1628
Correlate
Authors label: Serious delinquent behaviors (1)
Our classification: Misbehavior in school, code S1.2.4
Measurement: A mean of 10 items asking the respondent how often he had done such things as 'set fire to someone else's property on purpose', 'hurt someone badly enough to need bandages or a doctor', 'taken something not belonging to you worth over $50' etc. Scale: 1.00 = never to 5.00 = five or more times.Assessed at T1, T2, T3, T4 and T5
http://worlddatabaseofhappiness.eur.nl/hap_cor/top_sub.php?code=S1 (71 of 147)9-9-2009 14:01:24

Findings on Happiness and SCHOOL
Observed Relation with Happiness
Happiness Measure
Statistics Elaboration/Remarks
O-HP/g/mq/v/5/a tau=- Serious delinquent behavior T1 T2 T3 T4 T5HappinessT1 -.18 -.14 -.12 -.04 ns -.10T2 -.09 -.11 -.09 -.03 ns -.07 ns T3 -.04 ns -.07 ns -.11 -.05 ns -.04 nsT4 -.03 ns -.02 ns -.05 ns -.04 ns -.03 nsAll tau's significant, unless otherwise indicatedT1:1966, T2:1968, T3:1969, T4:1970, T5:1974
Correlational finding on Happiness and Misbehavior in school Subject code: S1.2.4
Study BACHM 1977
Reported in: Bachman, J. G.;O'Malley, P. M.; Johnston, J. Youth in Transition, Vol. VI: Adolescence to Adulthood, Change and Stability in the Lives of Young Men. Institute for Social Research, 1970, University of Michigan, Ann Arbor, USA Page in Report:
Population: Public highschool boys followed 8 years from grade 10, USA, 1966-74
Sample:
Non-Response: 2.8% at T1, 17.2% at T2, 21.0% at T3, 28.9% at T4, 28.5% at T5
N: 1628
Correlate
Authors label: Theft and vandalism (1)
Our classification: Misbehavior in school, code S1.2.4
Measurement: A mean of nine items which measure the number of times respondent has commited acts of theft or vandalism. Scale: 0.00 = never to 4.00 = five or more times. Assessed at T1, T2, T3, T4 and T5
Observed Relation with Happiness
Happiness Measure
Statistics Elaboration/Remarks
http://worlddatabaseofhappiness.eur.nl/hap_cor/top_sub.php?code=S1 (72 of 147)9-9-2009 14:01:24

Findings on Happiness and SCHOOL
O-HP/g/mq/v/5/a tau=- Theft and vandalism T1 T2 T3 T4 T5HappinessT1 -.19 -.14 -.13 -.03 ns -.11T2 -.10 -.13 -.10 -.03 ns -.07 nsT3 -.06 ns -.09 -.11 -.04 ns -.04 nsT4 -.04 ns -.04 ns -.06 ns -.04 ns -.03 nsAll tau's significant, unless indicated otherwiseT1:1966, T2:1968, T3:1969, T4:1970, T5:1974
Correlational finding on Happiness and . socio-economic level of school Subject code: S1.3.1.1
Study BACHM 1977
Reported in: Bachman, J. G.;O'Malley, P. M.; Johnston, J. Youth in Transition, Vol. VI: Adolescence to Adulthood, Change and Stability in the Lives of Young Men. Institute for Social Research, 1970, University of Michigan, Ann Arbor, USA Page in Report:
Population: Public highschool boys followed 8 years from grade 10, USA, 1966-74
Sample:
Non-Response: 2.8% at T1, 17.2% at T2, 21.0% at T3, 28.9% at T4, 28.5% at T5
N: 1628
Correlate
Authors label: School mean socioeconomic level (1)
Our classification: . socio-economic level of school, code S1.3.1.1
Measurement: High school's mean socioeconomic level computed from the combined S.E.L.'s of all the T1 respondents at that school.
Observed Relation with Happiness
Happiness Measure
Statistics Elaboration/Remarks
O-HP/g/mq/v/5/a tau=- ns T1 happiness: tau = -.06 (ns)T2 happiness: tau = -.07 (ns)T3 happiness: tau = -.05 (ns)T4 happiness: tau = -.02 (ns)T1:1966, T2:1968, T3:1969, T4:1970
Correlational finding on Happiness and . socio-economic level of school
http://worlddatabaseofhappiness.eur.nl/hap_cor/top_sub.php?code=S1 (73 of 147)9-9-2009 14:01:24

Findings on Happiness and SCHOOL
Subject code: S1.3.1.1
Study BRENN 1970
Reported in: Brenner, B. Social Factors in Mental Well-Being at Adolescence. PhD Dissertation, The American University, 1970, Washington DC, USA Page in Report: 113/346
Population: Highschool pupils, New York State, USA, 1960
Sample:
Non-Response: 1%
N: 5204
Correlate
Authors label: School social class (1)
Our classification: . socio-economic level of school, code S1.3.1.1
Measurement: Score on the basis of the percentage of juniors and seniors of 'upper class' status.
Observed Relation with Happiness
Happiness Measure
Statistics Elaboration/Remarks
O-HL/u/sq/v/4/b G=+.14 After control for participation in extra-curricu- lar activities : Gs = +.12
Middle and upper class : G = +.11Lower class : G = +.05
A-AOL/g/sq/v/5/a G=+.07 After control for participation in extracurricu-lar activities: G = +.04.Unaffected by social class.
O-HL/u/sq/v/4/b V= .08 p<. 01
A-AOL/g/sq/v/5/a V= .04 p<. 01
Correlational finding on Happiness and . ethnic homogeneity of school Subject code: S1.3.1.2
Study BACHM 1977
http://worlddatabaseofhappiness.eur.nl/hap_cor/top_sub.php?code=S1 (74 of 147)9-9-2009 14:01:24

Findings on Happiness and SCHOOL
Reported in: Bachman, J. G.;O'Malley, P. M.; Johnston, J. Youth in Transition, Vol. VI: Adolescence to Adulthood, Change and Stability in the Lives of Young Men. Institute for Social Research, 1970, University of Michigan, Ann Arbor, USA Page in Report:
Population: Public highschool boys followed 8 years from grade 10, USA, 1966-74
Sample:
Non-Response: 2.8% at T1, 17.2% at T2, 21.0% at T3, 28.9% at T4, 28.5% at T5
N: 1628
Correlate
Authors label: Attendance of black segregated school (1)
Our classification: . ethnic homogeneity of school, code S1.3.1.2
Measurement: Whether respondent did attend Black segregated (less than 10% white) school at T1, assesed separately for northern and southern states. 0 = no, 1 = yes
Observed Relation with Happiness
Happiness Measure
Statistics Elaboration/Remarks
O-HP/g/mq/v/5/a tau= ns - Southern states:T1 happiness: tau = +.02 (ns)T2 happiness: tau = -.01 (ns)T3 happiness: tau = -.01 (ns)T4 happiness: tau = -.02 (ns)- Northern states:T1 happiness: tau = +.01 (ns)T2 happiness: tau = -.01 (ns)T3 happiness: tau = -.01 (ns)T4 happiness: tau = -.02 (ns)T1:1966, T2:1968, T3:1969, T4:1970
Correlational finding on Happiness and . ethnic homogeneity of school Subject code: S1.3.1.2
Study BACHM 1977
Reported in: Bachman, J. G.;O'Malley, P. M.; Johnston, J. Youth in Transition, Vol. VI: Adolescence to Adulthood, Change and Stability in the Lives of Young Men. Institute for Social Research, 1970, University of Michigan, Ann Arbor, USA Page in Report:
Population: Public highschool boys followed 8 years from grade 10, USA, 1966-74
Sample:
http://worlddatabaseofhappiness.eur.nl/hap_cor/top_sub.php?code=S1 (75 of 147)9-9-2009 14:01:24

Findings on Happiness and SCHOOL
Non-Response: 2.8% at T1, 17.2% at T2, 21.0% at T3, 28.9% at T4, 28.5% at T5
N: 1628
Correlate
Authors label: Attendance of integrated school (1)
Our classification: . ethnic homogeneity of school, code S1.3.1.2
Measurement: Whether respondent did attend integrated (more than 10% white) HSat T1; 0 = no, 1 = yes
Observed Relation with Happiness
Happiness Measure
Statistics Elaboration/Remarks
O-HP/g/mq/v/5/a tau= ns T1 happiness: tau = +.02 (ns)T2 happiness: tau = -.02 (ns)T3 happiness: tau = +.01 (ns)T4 happiness: tau = +.02 (ns)T1:1966, T2:1968, T3:1969, T4:1970
Correlational finding on Happiness and Intellectual level of school Subject code: S1.3.4
Study BACHM 1977
Reported in: Bachman, J. G.;O'Malley, P. M.; Johnston, J. Youth in Transition, Vol. VI: Adolescence to Adulthood, Change and Stability in the Lives of Young Men. Institute for Social Research, 1970, University of Michigan, Ann Arbor, USA Page in Report:
Population: Public highschool boys followed 8 years from grade 10, USA, 1966-74
Sample:
Non-Response: 2.8% at T1, 17.2% at T2, 21.0% at T3, 28.9% at T4, 28.5% at T5
N: 1628
Correlate
Authors label: School mean intelligence scores (2)
Our classification: Intellectual level of school, code S1.3.4
http://worlddatabaseofhappiness.eur.nl/hap_cor/top_sub.php?code=S1 (76 of 147)9-9-2009 14:01:24

Findings on Happiness and SCHOOL
Measurement: High school's mean GATB-J score, Gates score and Quick Test score, computed from the scores of all the T1 respondents at that school. See also C 1.3
Observed Relation with Happiness
Happiness Measure
Statistics Elaboration/Remarks
O-HP/g/mq/v/5/a tau= ns Quick GATB-J GatesHappiness Test testT1 tau = -.04 -.04 -.04T2 tau = -.01 -.04 -.03T3 tau = -.03 -.03 -.02T4 tau = -.01 -.00 -.02All tau's not significantT1:1966, T2:1968, T3:1969, T4:1970
Correlational finding on Happiness and Intellectual level of school Subject code: S1.3.4
Study VENTE 1995
Reported in: Ventegodt, S. Livskvalitet i Danmark. (Quality of Life in Denmark). Forskningscentrets Forlag (The Quality of Life Research Center), København, Denmark, ISBN 8790190017 http://www.livskvalitet.org/t1/index.asp Page in Report: 90
Population: 18-88 aged, general public, Denmark, 1993
Sample: Non-probability purposive sample
Non-Response: 39%
N: 1494
Correlate
Authors label: attending school or university (1)
Our classification: Intellectual level of school, code S1.3.4
Measurement: 1: no post-secondary education (less than 13 years of schooling)2: short post-secondary education (13-14 years)3: intermediate post-secondary education (15-16 years)4: long post-secondary education(more than 16 years)
http://worlddatabaseofhappiness.eur.nl/hap_cor/top_sub.php?code=S1 (77 of 147)9-9-2009 14:01:24

Findings on Happiness and SCHOOL
Measured Values: N: all:231, 1:138, 2:34, 3:35, 4:24,
Remarks: Students only
Observed Relation with Happiness
Happiness Measure
Statistics Elaboration/Remarks
A-AOL/m/sq/v/5/a r=-.02 ns 1: Mt=7.90 2: Mt=7.86 3: Mt=7.43 4: Mt=8.13 All Mt=7.85
O-SLu/c/sq/v/5/e r=-03 ns 1: Mt=7.39 2: Mt=7.58 3: Mt=6.71 4: Mt=7.60All Mt=7.34
O-HL/c/sq/v/5/h r=+.04 ns 1: Mt=6.90 2: Mt=7.35 3: Mt=6.64 4: Mt=7.40All Mt=6.98
Correlational finding on Happiness and Intellectual level of school Subject code: S1.3.4
Study VENTE 1996
Reported in: Ventegodt, S. Liskvalitet hos 4500 31-33-arige. (The Quality of Life of 4500 31-33-Years-Olds). Forskningscenter for Livskvalitet, Forskningscentrets Forlag, København 1996, ISBN 8790190068 http://www.livskvalitet.org/t2/index.asp Page in Report: 94
Population: 31-33 aged, Denmark 1993, born in University Hospital in Copenhagen
Sample: Non-probability chunk sample
Non-Response: 39%
N: 4500
Correlate
Authors label: attending school or university
Our classification: Intellectual level of school, code S1.3.4
http://worlddatabaseofhappiness.eur.nl/hap_cor/top_sub.php?code=S1 (78 of 147)9-9-2009 14:01:24

Findings on Happiness and SCHOOL
Measurement: 1: no post-secondary education (less than 13 years of schooling)2: short post-secondary education (13-14 years)3: intermediate post-secondary education (15-16 years)4: long post-secondary education(more than 16 years)
Measured Values: N: all:431, %: 1:23,4, 2:35,5, 3:19,7, 4:21,3
Remarks: Adult students only
Observed Relation with Happiness
Happiness Measure
Statistics Elaboration/Remarks
A-AOL/m/sq/v/5/a r=-.05 p<.3173
1: Mt=7.482: Mt=8.013: Mt=7.594: Mt=7.34
O-SLu/c/sq/v/5/e r=-.03 p<.2792
1: Mt=7.232: Mt=7.763: Mt=7.394: Mt=7.04
O-HL/c/sq/v/5/h r=-.03 p<.4958
1: Mt=6.732: Mt=7.303: Mt=6.944: Mt=6.68
Correlational finding on Happiness and School-type Subject code: S1.3.5
Study CBS 1984
Reported in: Centraal Bureau voor de Statistiek De Leefsituatie van de Nederlandse Jeugd van 13-24 jaar in 1979. Deel 4. (Life Situation of the Dutch Youth of 13-24 in 1979, Vol. 4: An Analysis of Youth in One-Parent Families.) S.D.U./C.B.S. Publications, 1984, The Hague, Netherlands http://statline.cbs.nl Page in Report: 49
Population: Adolescents, The Netherlands, 1979
Sample:
Non-Response: 35%, of which: refusals 62%, no contact 27%, unable 8%
N: 3113
http://worlddatabaseofhappiness.eur.nl/hap_cor/top_sub.php?code=S1 (79 of 147)9-9-2009 14:01:24

Findings on Happiness and SCHOOL
Correlate
Authors label: Day time school (1)
Our classification: School-type, code S1.3.5
Measurement: Direct question: Are you going to day- time education? No (1), yes (2)
Observed Relation with Happiness
Happiness Measure
Statistics Elaboration/Remarks
O-SLL/c/sq/v/5/d Beta=+.04 ns
ß controlled for broken home, age, education of head of household and head of household employed.
O-HP/u/sq/v/4/a Beta=+.08 p<.05
ß controlled for broken home, age, education of head of household and head of household employed.
Correlational finding on Happiness and School-type Subject code: S1.3.5
Study JONES 2002C
Reported in: Jones, F. Happiness and Optimism among Canada's 12 to 15 Year Olds. Religious Commitment Notes 02-14, November 2002, The Christian Commitment Research Institute. Canada http://www.ccri.ca/rcn02-14.html Page in Report: 6, 10,11
Population: 12-15 aged, Canada, 1998
Sample: Probability cluster sample
Non-Response: 13%
N: 31194
Correlate
Authors label: Schooltype
Our classification: School-type, code S1.3.5
Measurement: Kind of school the child attends1: non-public school2: public school
http://worlddatabaseofhappiness.eur.nl/hap_cor/top_sub.php?code=S1 (80 of 147)9-9-2009 14:01:24

Findings on Happiness and SCHOOL
Observed Relation with Happiness
Happiness Measure
Statistics Elaboration/Remarks
O-HL/c/sq/v/4/n D%=- % very happy1: non-public school 30%2: public school 28%
O-HL/c/sq/v/4/n B=+.00 p<.891
Girls attending public school
O-HL/c/sq/v/4/n B=+.03 p<.403
Boys attending public school
O-HL/c/sq/v/4/n B=+.06 p<.247
Children with religious affiliation only: (girls N=1192, boys N=1178)
girls attending public school
O-HL/c/sq/v/4/n B=+.07 p<.156
boys attending public school
B controlled for:- child's age- religion- worship frequency, child- family composition - education of the mother - working mother or not- smoking and drinking by the mother- household income- region
Correlational finding on Happiness and School-type Subject code: S1.3.5
Study TERBO 2002
Reported in: TerBogt , T.; VanDorsselaer, S.; Vollebergh, W. Psychische Gezondheid, Risicogedrag en Welbevinden van Nederlandse Scholieren. (Psychlogical Health, Risk Behavior and Well-Being of Dutch Adolescents). Research Report Trimbos Institute, University of Utrecht, 2003, Utrecht, Netherlands, ISBN 90 5253 431 4 Page in Report: 45
Population: 11-15 aged schoolchildren, the Netherlands, 2001
Sample: Probability multi-stage cluster sample
Non-Response:
N: 7556
http://worlddatabaseofhappiness.eur.nl/hap_cor/top_sub.php?code=S1 (81 of 147)9-9-2009 14:01:24

Findings on Happiness and SCHOOL
Correlate
Authors label: School type
Our classification: School-type, code S1.3.5
Measurement: a Primary schoolb Secondary school
Measured Values: a) 75 primary schools, b) 66 secondary schools N = 7556
Observed Relation with Happiness
Happiness Measure
Statistics Elaboration/Remarks
C-BW/c/sq/l/11/a DM= p<.05 Primary schools M = 8,6Secondary schools M = 7,9Difference -0,7
Correlational finding on Happiness and School-type Subject code: S1.3.5
Study TERBO 2002
Reported in: TerBogt , T.; VanDorsselaer, S.; Vollebergh, W. Psychische Gezondheid, Risicogedrag en Welbevinden van Nederlandse Scholieren. (Psychlogical Health, Risk Behavior and Well-Being of Dutch Adolescents). Research Report Trimbos Institute, University of Utrecht, 2003, Utrecht, Netherlands, ISBN 90 5253 431 4 Page in Report: 39
Population: 11-15 aged schoolchildren, the Netherlands, 2001
Sample: Probability multi-stage cluster sample
Non-Response:
N: 7556
Correlate
Authors label: School level
Our classification: School-type, code S1.3.5
Measurement: 1) Vbo/Mavo(lower secundary school(vbo))2) Mavo/Havo(middle secundary education (mavo)3) Havo/Vwo(higher secundary education (havo)4) Vwo(pre-university education (vwo)
Measured Values: 1: 24%, 2: 34,8 %, 3: 23,8 %, 4: 16,6 %
http://worlddatabaseofhappiness.eur.nl/hap_cor/top_sub.php?code=S1 (82 of 147)9-9-2009 14:01:24

Findings on Happiness and SCHOOL
Remarks: Secondary school pupils only. N = 5730
Observed Relation with Happiness
Happiness Measure
Statistics Elaboration/Remarks
C-BW/c/sq/l/11/a OR=0,71 Vbo
C-BW/c/sq/l/11/a OR=0,71 Mavo
C-BW/c/sq/l/11/a OR=0,90 Havo
C-BW/c/sq/l/11/a OR=1 Vwo
OR is chance of being happy (score 7 or higher)OR controlled for :- age- gender- ethnicity
Correlational finding on Happiness and School-type Subject code: S1.3.5
Study VENTE 1995
Reported in: Ventegodt, S. Livskvalitet i Danmark. (Quality of Life in Denmark). Forskningscentrets Forlag (The Quality of Life Research Center), København, Denmark, ISBN 8790190017 http://www.livskvalitet.org/t1/index.asp Page in Report: 92
Population: 18-88 aged, general public, Denmark, 1993
Sample: Non-probability purposive sample
Non-Response: 39%
N: 1494
Correlate
Authors label: type of education (1)
Our classification: School-type, code S1.3.5
http://worlddatabaseofhappiness.eur.nl/hap_cor/top_sub.php?code=S1 (83 of 147)9-9-2009 14:01:24

Findings on Happiness and SCHOOL
Measurement: Single question:"If you are attending school or university at present, indicate which type of education"a: non-vocationalb: pedagogical (child-care, teaching)c: the humanitiesd: administration, clerical, commercee: the sciencesf: industrial and the tradesg: agricultural, fisheries, foodh: transportationi: healthj: public safety etc
Measured Values: N: a:85, b:17, c:14, d:67, e:2, f:25, g:10, h:4, i:14, j:3
Remarks: Students only
Observed Relation with Happiness
Happiness Measure
Statistics Elaboration/Remarks
A-AOL/m/sq/v/5/a DMt= a: non-vocational Mt=8.03b: pedagogical (child-care, teaching) Mt=7.65c: the humanities Mt=8.75d: administration, clerical, commerce Mt=7.76e: the sciences Mt=8.75 f: industrial and the trades Mt=7.80g: agricultural, fisheries, food Mt=7.00h: transportation Mt=7.50i: health Mt=7.14j: public safety etc Mt=8.34All Mt=7.85
O-SLu/c/sq/v/5/e DMt= a: non-vocational Mt=7.68b: pedagogical (child-care, teaching) Mt=7.35 c: the humanities Mt=7.86 d: administration, clerical, commerce Mt=7.01 e: the sciences Mt=8.75f: industrial and the trades Mt=7.30g: agricultural, fisheries, food Mt=7.00 h: transportation Mt=7.50 i: health Mt=6.96 j: public safety etc Mt=7.50All Mt=7.38
http://worlddatabaseofhappiness.eur.nl/hap_cor/top_sub.php?code=S1 (84 of 147)9-9-2009 14:01:24

Findings on Happiness and SCHOOL
O-HL/c/sq/v/5/h DMt= a: non-vocational Mt=7.24b: pedagogical (child-care, teaching) Mt=6.91c: the humanities Mt=7.50d: administration, clerical, commerce Mt=6.94e: the sciences Mt=8.75 f: industrial and the trades Mt=7.00g: agricultural, fisheries, food Mt=6.50 h: transportation Mt=5.00 i: health Mt=6.25j: public safety etc Mt=6.66All Mt=7.00
Correlational finding on Happiness and School-type Subject code: S1.3.5
Study VENTE 1996
Reported in: Ventegodt, S. Liskvalitet hos 4500 31-33-arige. (The Quality of Life of 4500 31-33-Years-Olds). Forskningscenter for Livskvalitet, Forskningscentrets Forlag, København 1996, ISBN 8790190068 http://www.livskvalitet.org/t2/index.asp Page in Report: 96
Population: 31-33 aged, Denmark 1993, born in University Hospital in Copenhagen
Sample: Non-probability chunk sample
Non-Response: 39%
N: 4500
Correlate
Authors label: type of education
Our classification: School-type, code S1.3.5
Measurement: Single question:"If you are attending school or university at present, indicate which type of education"a: non-vocationalb: pedagogical (child-care, teaching)c: the humanitiesd: administration, clerical, commercee: the sciencesf: industrial and the tradesg: agricultural, fisheries, foodh: transportationi: healthj: public safety etc
Measured Values: N: all:473, %: a:15,6, b:13,5, c:13,1, d:34,5, e:4,0, f:7,0, g:3,2, h:0,4, i:8,0, j:0,6
http://worlddatabaseofhappiness.eur.nl/hap_cor/top_sub.php?code=S1 (85 of 147)9-9-2009 14:01:24

Findings on Happiness and SCHOOL
Remarks: Adult students only
Observed Relation with Happiness
Happiness Measure
Statistics Elaboration/Remarks
A-AOL/m/sq/v/5/a a: Mt=7.30b: Mt=7.39c: Mt=7.66d: Mt=7.81e: Mt=6.86f: Mt=7.73g: Mt=7.50h: Mt=7.50i: Mt=8.09j: Mt=9.16
O-SLu/c/sq/v/5/e a: Mt=6.99b: Mt=7.35c: Mt=7.18d: Mt=7.58e: Mt=6.45f: Mt=7.50g: Mt=6.84h: Mt=8.75i: Mt=7.96j: Mt=9.16
O-HL/c/sq/v/5/h a: Mt=6.43b: Mt=6.73c: Mt=7.05d: Mt=7.03e: Mt=6.84f: Mt=6.59g: Mt=7.66h: Mt=7.50i: Mt=7.50j: Mt=8.34
Correlational finding on Happiness and Curriculum followed Subject code: S1.3.6
Study BACHM 1977
Reported in: Bachman, J. G.;O'Malley, P. M.; Johnston, J. Youth in Transition, Vol. VI: Adolescence to Adulthood, Change and Stability in the Lives of Young Men. Institute for Social Research, 1970, University of Michigan, Ann Arbor, USA Page in Report:
Population: Public highschool boys followed 8 years from grade 10, USA, 1966-74
http://worlddatabaseofhappiness.eur.nl/hap_cor/top_sub.php?code=S1 (86 of 147)9-9-2009 14:01:24
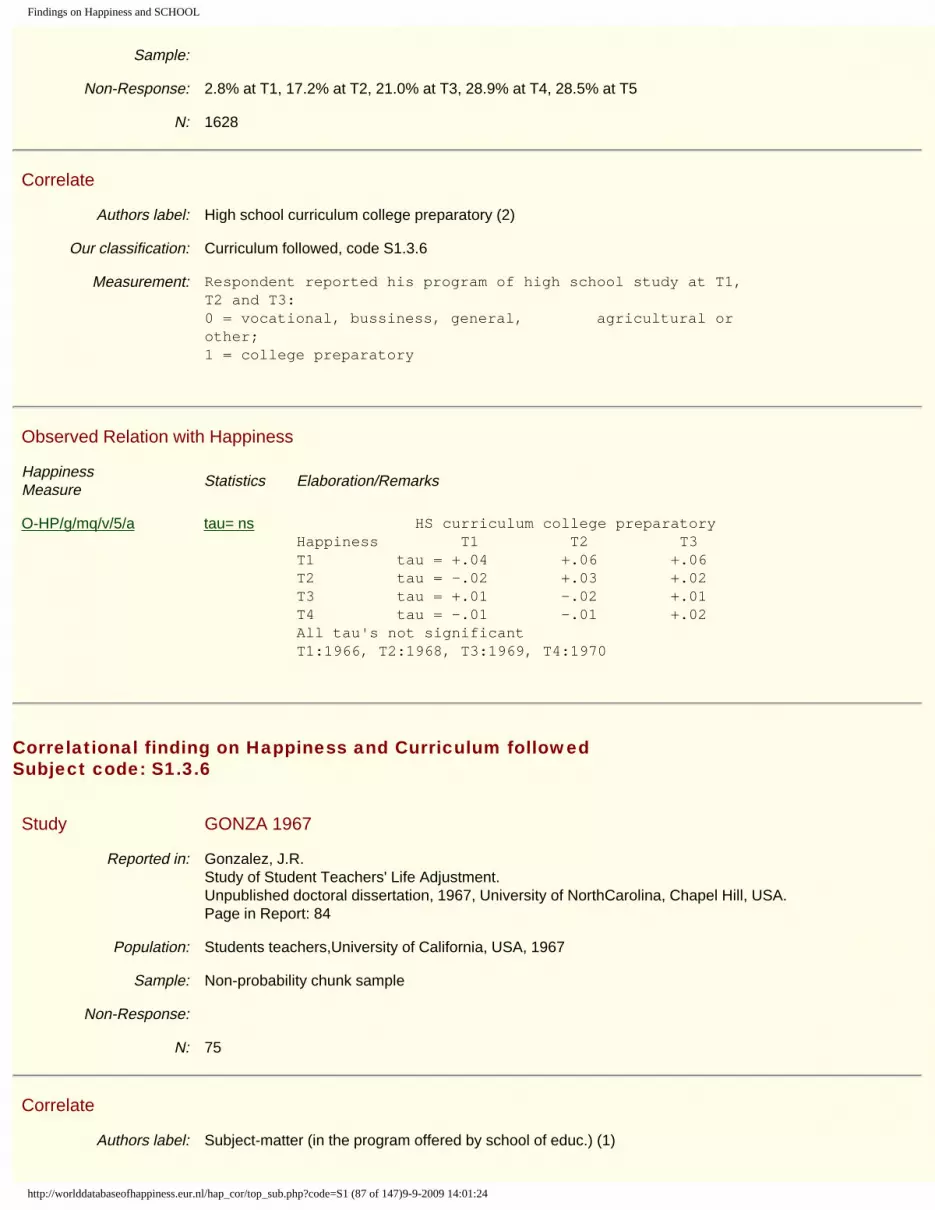
Findings on Happiness and SCHOOL
Sample:
Non-Response: 2.8% at T1, 17.2% at T2, 21.0% at T3, 28.9% at T4, 28.5% at T5
N: 1628
Correlate
Authors label: High school curriculum college preparatory (2)
Our classification: Curriculum followed, code S1.3.6
Measurement: Respondent reported his program of high school study at T1, T2 and T3: 0 = vocational, bussiness, general, agricultural or other; 1 = college preparatory
Observed Relation with Happiness
Happiness Measure
Statistics Elaboration/Remarks
O-HP/g/mq/v/5/a tau= ns HS curriculum college preparatoryHappiness T1 T2 T3T1 tau = +.04 +.06 +.06T2 tau = -.02 +.03 +.02T3 tau = +.01 -.02 +.01T4 tau = -.01 -.01 +.02All tau's not significantT1:1966, T2:1968, T3:1969, T4:1970
Correlational finding on Happiness and Curriculum followed Subject code: S1.3.6
Study GONZA 1967
Reported in: Gonzalez, J.R. Study of Student Teachers' Life Adjustment. Unpublished doctoral dissertation, 1967, University of NorthCarolina, Chapel Hill, USA. Page in Report: 84
Population: Students teachers,University of California, USA, 1967
Sample: Non-probability chunk sample
Non-Response:
N: 75
Correlate
Authors label: Subject-matter (in the program offered by school of educ.) (1)
http://worlddatabaseofhappiness.eur.nl/hap_cor/top_sub.php?code=S1 (87 of 147)9-9-2009 14:01:24

Findings on Happiness and SCHOOL
Our classification: Curriculum followed, code S1.3.6
Measurement: Foreign Languages / Humanities / English / Elementary Education / Physical or Special Education / Natural Sciences / Social Sciences / Mathematics.
Observed Relation with Happiness
Happiness Measure
Statistics Elaboration/Remarks
O-HL/u/sq/v/3/c D%=+ % very happy:-foreign languages --humanities 29%-English 45%-elementary education 47%-physical education 50%-special education --natural sciences 60%-social sciences 86%-mathematics -
Correlational finding on Happiness and Curriculum followed Subject code: S1.3.6
Study GONZA 1967
Reported in: Gonzalez, J.R. Study of Student Teachers' Life Adjustment. Unpublished doctoral dissertation, 1967, University of NorthCarolina, Chapel Hill, USA. Page in Report: 82
Population: Students teachers,University of California, USA, 1967
Sample: Non-probability chunk sample
Non-Response:
N: 75
Correlate
Authors label: Teaching level. (1)
Our classification: Curriculum followed, code S1.3.6
Measurement: Elementary / secondary / fifth year.
Observed Relation with Happiness
http://worlddatabaseofhappiness.eur.nl/hap_cor/top_sub.php?code=S1 (88 of 147)9-9-2009 14:01:24

Findings on Happiness and SCHOOL
Happiness Measure
Statistics Elaboration/Remarks
O-HL/u/sq/v/3/c G=+.09 ns G' based on proportion very happy (vs not very happy).
Correlational finding on Happiness and Curriculum followed Subject code: S1.3.6
Study VANEE 2005
Reported in: VanEe, M. ;VanDijk, J. The Influence on Happiness: A Research on Happiness among Students in Utrecht and St. Louis. Thesis, University of Utrecht, 2005, Netherlands Page in Report: 67
Population: University students, USA and The Netherlands, 2004
Sample: Non-probability accidental sample
Non-Response:
N: 361
Correlate
Authors label: major
Our classification: Curriculum followed, code S1.3.6
Measurement: Single question: What is your major?a: lawb: psychologyc: medicine
Measured Values: 1: 31%, 2: 35%, 3: 34%
Observed Relation with Happiness
Happiness Measure
Statistics Elaboration/Remarks
O-SLW/c/sq/n/10/aa BMCT=+ p<.05
Law: M = 7.64Psychology: M = 7.85Medicine: M = 8.16a < c
O-HL/u/sq/v/4/a BMCT=+ ns
Law: M = 3.22Psychology: M = 3.26Medicine: M = 3.40
http://worlddatabaseofhappiness.eur.nl/hap_cor/top_sub.php?code=S1 (89 of 147)9-9-2009 14:01:24

Findings on Happiness and SCHOOL
A-BB/cm/mq/v/2/a BMCT=0 ns
Law: M = 1.63Psychology: M = 1.47Medicine: M = 1.94
A-BB/cm/mq/v/2/a BMCT=001
Correlational finding on Happiness and Attitudes to school Subject code: S1.4
Study BRADS 2006
Reported in: Bradshaw, J.; Hoelscher, P.; Richardson, D. Comparing Child Well-Being in OECD Countries: Concepts and Methods. Innocenti Working Paper no. 2006-3, Unicef Research Centre, 2006, Florence, Italy. ISSN: 1014 7837 Page in Report: 4, 70-72,75
Population: 15 yearaged, 29 countries, 2001
Sample: Probability multi-stage cluster sample
Non-Response:
N: 137682
Correlate
Authors label: Feeling an outsider
Our classification: Attitudes to school, code S1.4
Measurement: Self report on single question:I feel like an outsider (or left out of things)
Measured Values: OECD countries: Austria = 5,8 Belgium = 7,9 Canada = 8,9 Czech Republic = 9,7 Denmark = 5,3 Finland = 5,5 France = 7,7 Germany = 6,1 Greece = 6,3 Hungary = 9,3 Ireland = 5,6 Italy = 4,9 Netherlands = 3,9 Norway = 5,6 Poland = 8,2 Portugal = 6,4 Spain = 3,3 Sweden = 5,2 Switzerland = 7,1 United Kingdom 6,8 United States = NA . Average of OECD countries: 6,4 %, SD = 1,7 % Non-OECD Countries: Croatia = NA Estonia = NA Israel = 2,3 Latvia = 5,2 Lithuania = NA Malta = NA Russian Federation = 6,1 Slovenia = NA
Remarks: source: PISA 2003
Observed Relation with Happiness
Happiness Measure
Statistics Elaboration/Remarks
C-BW/c/sq/l/11/a r=-.44 p<.05
% happy in nation by % feeling an outsider
Correlational finding on Happiness and Attitudes to school
http://worlddatabaseofhappiness.eur.nl/hap_cor/top_sub.php?code=S1 (90 of 147)9-9-2009 14:01:24

Findings on Happiness and SCHOOL
Subject code: S1.4
Study BRADS 2006
Reported in: Bradshaw, J.; Hoelscher, P.; Richardson, D. Comparing Child Well-Being in OECD Countries: Concepts and Methods. Innocenti Working Paper no. 2006-3, Unicef Research Centre, 2006, Florence, Italy. ISSN: 1014 7837 Page in Report: 70, 72, 73
Population: 15 yearaged, 29 countries, 2001
Sample: Probability multi-stage cluster sample
Non-Response:
N: 137682
Correlate
Authors label: Feeling awkward and out of place
Our classification: Attitudes to school, code S1.4
Measurement: Self report on single question:I feel awkward and out of place- disagree- agree
Measured Values: OECD countries: Austria = 8,2, Belgium = 15,6, Canada = 10,5 Czech Republic = 6,4 Denmark = 11,8 Finland = 8,4 France = 12,3 Germany = 11,4 Greece = 8,3 Hungary = 7,6 Ireland = 7,8 Italy = 6,2 Netherlands = 6,9 Norway = 9,1 Poland = 9,9 Portugal = 11,7 Spain = 8,9 Sweden = 4,9 Switzerland = 11,7 United Kingdom 8,7 United States = NA Average of OECD countries: 6,4 %, SD = 1,7 % Non-OECD Countries: Croatia = NA Estonia = NA Israel = 3,6 Latvia = 9,6 Lithuania = NA Malta = NA Russian Federation 14,3 Slovenia NA
Remarks: Data: PISA 2003
Observed Relation with Happiness
Happiness Measure
Statistics Elaboration/Remarks
C-BW/c/sq/l/11/a r=-.10 ns % happy in nation by %feeling awkward
Correlational finding on Happiness and Attitudes to school Subject code: S1.4
Study BRADS 2006
http://worlddatabaseofhappiness.eur.nl/hap_cor/top_sub.php?code=S1 (91 of 147)9-9-2009 14:01:24

Findings on Happiness and SCHOOL
Reported in: Bradshaw, J.; Hoelscher, P.; Richardson, D. Comparing Child Well-Being in OECD Countries: Concepts and Methods. Innocenti Working Paper no. 2006-3, Unicef Research Centre, 2006, Florence, Italy. ISSN: 1014 7837 Page in Report: 4, 70, 75
Population: 15 yearaged, 29 countries, 2001
Sample: Probability multi-stage cluster sample
Non-Response:
N: 137682
Correlate
Authors label: Feeling lonely
Our classification: Attitudes to school, code S1.4
Measurement: Self report on single question:"I feel lonely"
Measured Values: OECD countries: Austria = 7,2 Belgium = 6,4 Canada = 7,6 Czech Republic = 7,0 Denmark = 6,2 Finland = 6,2 France = 6,4 Germany = 6,2 Greece = 6,5 Hungary = 7,3 Ireland = 4,6 Italy = 6,0 Netherlands = 2,9 Norway = 7,0 Poland = 8,4 Portugal = 5,0 Spain = 4,4 Sweden = 6,7 Switzerland = 6,6 United Kingdom = 5,4 United States = NA Average of OECD countries: 7,4 %, SD = 5,3 % Non-OECD Countries: Croatia = NA Estonia = NA Israel = 2,7 Latvia = 9,0 Lithuania = NA Malta = NA Russian Federation = 8,5 Slovenia = NA
Remarks: Data: PISA 2003
Observed Relation with Happiness
Happiness Measure
Statistics Elaboration/Remarks
C-BW/c/sq/l/11/a r=-.42 ns % happy in nation by % feeling lonely
Correlational finding on Happiness and Attitudes to school Subject code: S1.4
Study CURRI 2004
Reported in: Currie, C.; Roberts, Ch.; Morgan, A.; Smith, R.; Settertobulte, W.: et al; Eds. Young People's Health in Context. World Health Organization Europe, 2004, Copenhagen, Denmark. ISBN 92 890 1372 9 Page in Report: 185,186
Population: 11-15 aged, school children, 33 countries and regions, 2001
Sample: Probability cluster sample
Non-Response:
http://worlddatabaseofhappiness.eur.nl/hap_cor/top_sub.php?code=S1 (92 of 147)9-9-2009 14:01:24

Findings on Happiness and SCHOOL
N: 162306
Correlate
Authors label: Liking school
Our classification: Attitudes to school, code S1.4
Measurement: Self report on single question:How do you feel about school at present? 4 I like it a lot3 I like it a bit2 I don’t like it very much1 I don’t like it at all.
Measured Values: not reported
Remarks: 15 year olds only (N = 50816)
Observed Relation with Happiness
Happiness Measure
Statistics Elaboration/Remarks
C-BW/c/sq/l/11/a rs=+ Girls:rs = +.25Boys :rs = +.19
Correlational finding on Happiness and Attitudes to school Subject code: S1.4
Study CURRI 2004
Reported in: Currie, C.; Roberts, Ch.; Morgan, A.; Smith, R.; Settertobulte, W.: et al; Eds. Young People's Health in Context. World Health Organization Europe, 2004, Copenhagen, Denmark. ISBN 92 890 1372 9 Page in Report: 185,186
Population: 11-15 aged, school children, 33 countries and regions, 2001
Sample: Probability cluster sample
Non-Response:
N: 162306
Correlate
Authors label: Peer support
Our classification: Attitudes to school, code S1.4
http://worlddatabaseofhappiness.eur.nl/hap_cor/top_sub.php?code=S1 (93 of 147)9-9-2009 14:01:24
Findings on Happiness and SCHOOL
Measurement: Self report on three questionsA The students in my class(es) enjoy being together. B Most of the students in my class(es) are kind and helpful. C Other students accept me as I am.Response categories were: Strongly agree, Agree, Neither agree nor disagree, Disagree, Strongly disagree.
Recoded as:3 Positive: agree or strongly agree with all these statments2 Middle: Do not agree with one of these three statements1 Negative: Do not agree with at least two of the three statements
Measured Values: not reported
Remarks: 15 year olds only (N =50816)
Observed Relation with Happiness
Happiness Measure
Statistics Elaboration/Remarks
C-BW/c/sq/l/11/a rs=+ Girls: rs = +.24Boys : rs = +.21
Correlational finding on Happiness and Attitudes to school Subject code: S1.4
Study CURRI 2004
Reported in: Currie, C.; Roberts, Ch.; Morgan, A.; Smith, R.; Settertobulte, W.: et al; Eds. Young People's Health in Context. World Health Organization Europe, 2004, Copenhagen, Denmark. ISBN 92 890 1372 9 Page in Report: 185, 187, 189
Population: 11-15 aged, school children, 33 countries and regions, 2001
Sample: Probability cluster sample
Non-Response:
N: 162306
Correlate
Authors label: School experience
Our classification: Attitudes to school, code S1.4
http://worlddatabaseofhappiness.eur.nl/hap_cor/top_sub.php?code=S1 (94 of 147)9-9-2009 14:01:24

Findings on Happiness and SCHOOL
Measurement: Self report on seven questions:A Liking school:How do you feel about school at present? B academic achievement: In your opinion, what does your class teacher(s) think about your school performance compared to your classmates? C Peer support was measured using three items:* The students in my class(es) enjoy being together. * Most of the students in my class(es) are kind and helpful. * Other students accept me as I am.
D School pressure: How pressured do you feel by the schoolwork you have to do?
Classified as having 3 Positive2 Middle school experience1 negative school experience
Measured Values: not reported
Remarks: 15 year olds only (N =50816)
Observed Relation with Happiness
Happiness Measure
Statistics Elaboration/Remarks
C-BW/c/sq/l/11/a D%=+ % Happy Girls Boys Total- Negative 53.0 63.4 57.6- Middle 78.2 85.4 81.6- Positive 93.4 94.7 94.0
Set Image size:
http://worlddatabaseofhappiness.eur.nl/hap_cor/top_sub.php?code=S1 (95 of 147)9-9-2009 14:01:24
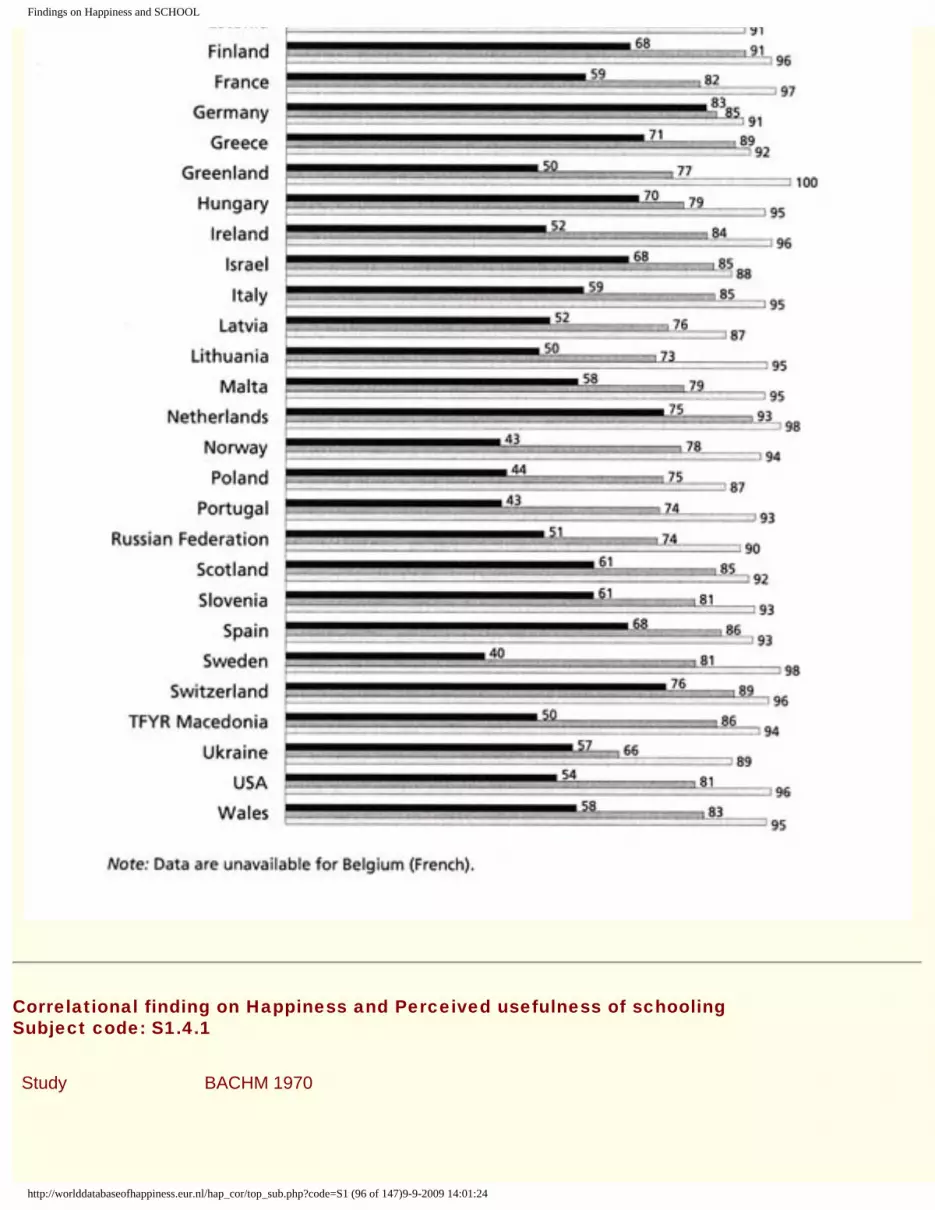
Findings on Happiness and SCHOOL
Correlational finding on Happiness and Perceived usefulness of schooling Subject code: S1.4.1
Study BACHM 1970
http://worlddatabaseofhappiness.eur.nl/hap_cor/top_sub.php?code=S1 (96 of 147)9-9-2009 14:01:24

Findings on Happiness and SCHOOL
Reported in: Bachman, J.G.; Kahn, R.L.; Mednick, M.; Davidson, T.N. Youth in Transition. Vol.II: The Impact of Family Background on Intelligence in 10th-Grade Boy. Institute for Social Research, 1970, University of Michigan, Ann Arbor, USA Page in Report: 242
Population: Public highschool boys followed 3 years from grade 10, USA, 1966-69
Sample:
Non-Response: 2.8% incomplete information in 1966
N: 1799
Correlate
Authors label: Positive attitude towards school (1)
Our classification: Perceived usefulness of schooling, code S1.4.1
Measurement: 15-item index containing items that stress the intrinsic value of education.
Observed Relation with Happiness
Happiness Measure
Statistics Elaboration/Remarks
O-HP/g/mq/v/5/a r=+.38 p<. 001
Both variables assessed at T1.
Correlational finding on Happiness and Perceived usefulness of schooling Subject code: S1.4.1
Study BACHM 1970
Reported in: Bachman, J.G.; Kahn, R.L.; Mednick, M.; Davidson, T.N. Youth in Transition. Vol.II: The Impact of Family Background on Intelligence in 10th-Grade Boy. Institute for Social Research, 1970, University of Michigan, Ann Arbor, USA Page in Report: 242
Population: Public highschool boys followed 3 years from grade 10, USA, 1966-69
Sample:
Non-Response: 2.8% incomplete information in 1966
N: 1799
Correlate
Authors label: Negative attitude toward school (1)
Our classification: Perceived usefulness of schooling, code S1.4.1
http://worlddatabaseofhappiness.eur.nl/hap_cor/top_sub.php?code=S1 (97 of 147)9-9-2009 14:01:24

Findings on Happiness and SCHOOL
Measurement: 8-item index containing questions ranging from general dissatisfaction with school to a devaluation of school in comparison to other sources of experiences.
Observed Relation with Happiness
Happiness Measure
Statistics Elaboration/Remarks
O-HP/g/mq/v/5/a r=-.24 p<. 001
Both variables assessed at T1.
Correlational finding on Happiness and Perceived usefulness of schooling Subject code: S1.4.1
Study BACHM 1970
Reported in: Bachman, J.G.; Kahn, R.L.; Mednick, M.; Davidson, T.N. Youth in Transition. Vol.II: The Impact of Family Background on Intelligence in 10th-Grade Boy. Institute for Social Research, 1970, University of Michigan, Ann Arbor, USA Page in Report: 243
Population: Public highschool boys followed 3 years from grade 10, USA, 1966-69
Sample:
Non-Response: 2.8% incomplete information in 1966
N: 1799
Correlate
Authors label: Having plans to go to college (1)
Our classification: Perceived usefulness of schooling, code S1.4.1
Measurement: Open question on future plans; other plans vs plan to enter post-high school education.
Observed Relation with Happiness
Happiness Measure
Statistics Elaboration/Remarks
O-HP/g/mq/v/5/a r=+.07 p<. 05
Both variables assessed at T1.
Correlational finding on Happiness and Perceived usefulness of schooling Subject code: S1.4.1
http://worlddatabaseofhappiness.eur.nl/hap_cor/top_sub.php?code=S1 (98 of 147)9-9-2009 14:01:24

Findings on Happiness and SCHOOL
Study BACHM 1977
Reported in: Bachman, J. G.;O'Malley, P. M.; Johnston, J. Youth in Transition, Vol. VI: Adolescence to Adulthood, Change and Stability in the Lives of Young Men. Institute for Social Research, 1970, University of Michigan, Ann Arbor, USA Page in Report:
Population: Public highschool boys followed 8 years from grade 10, USA, 1966-74
Sample:
Non-Response: 2.8% at T1, 17.2% at T2, 21.0% at T3, 28.9% at T4, 28.5% at T5
N: 1628
Correlate
Authors label: School attitudes (1)
Our classification: Perceived usefulness of schooling, code S1.4.1
Measurement: Positive and negative school attitudes were measured at T1, T2 and T3. Positive school attitude: a mean of 15 items which stress the intrinsic value of education; scale: 1.00 = low (education has little value) to 4.00 = high (education has high value)Negative school attitude: a mean of 8 items indicating the respondent's negative or avoidance attitudes toward school. Scale: 1.00 = low negativity;4.00 = high negativity
Observed Relation with Happiness
Happiness Measure
Statistics Elaboration/Remarks
O-HP/g/mq/v/5/a tau= p<.001
Positive school attitudesHappiness T1 T2 T2T1 tau = +.41 +.27 +.25T2 tau = +.33 +.39 +.32T3 tau = +.23 +.27 +.37T4 tau = +.20 +.23 +.27All tau's significant (001)
Negative school attitudesHappiness T1 T2 T3T1 _ = -.25 -.21 -.22T2 _ = -.21 -.26 -.23T3 _ = -.17 -.18 -.27T4 _ = -.18 -.16 -.19All _ significant (001)T1:1966, T2:1968, T3:1969, T4:1970
Correlational finding on Happiness and Perceived usefulness of schooling Subject code: S1.4.1
http://worlddatabaseofhappiness.eur.nl/hap_cor/top_sub.php?code=S1 (99 of 147)9-9-2009 14:01:24

Findings on Happiness and SCHOOL
Study BACHM 1977
Reported in: Bachman, J. G.;O'Malley, P. M.; Johnston, J. Youth in Transition, Vol. VI: Adolescence to Adulthood, Change and Stability in the Lives of Young Men. Institute for Social Research, 1970, University of Michigan, Ann Arbor, USA Page in Report:
Population: Public highschool boys followed 8 years from grade 10, USA, 1966-74
Sample:
Non-Response: 2.8% at T1, 17.2% at T2, 21.0% at T3, 28.9% at T4, 28.5% at T5
N: 1628
Correlate
Authors label: Academic achievementvalue (1)
Our classification: Perceived usefulness of schooling, code S1.4.1
Measurement: Index at T1, T2 and T3 of four items that indicate the extent to which the respondent considers it to be "a good thing" to demonstrate behavior indicative of academic achievement. Items: "studying constantly in order to become a well-educated person; working hard to achieve academic honors; striving to get the top grade-point average in the group; studying hard to get good grades in school." Scale: 1 = low to 6 = high in academic achievement value
Observed Relation with Happiness
Happiness Measure
Statistics Elaboration/Remarks
O-HP/g/mq/v/5/a tau=+ p<.s Academic achievement valueHappiness T1 T2 T3T1 tau = +.26 (001) +.15 (001) +.15 (001)T2 tau = +.16 (001) +.22 (001) +.14 (001)T3 tau = +.12 (01) +.18 (001) +.25 (001)T4 tau = +.10 (01) +.13 (001) +.18 (001)All tau's significantT1:1966, T2:1968, T3:1969, T4:1970
Correlational finding on Happiness and Perceived usefulness of schooling Subject code: S1.4.1
Study CONST 1965
http://worlddatabaseofhappiness.eur.nl/hap_cor/top_sub.php?code=S1 (100 of 147)9-9-2009 14:01:24

Findings on Happiness and SCHOOL
Reported in: Constantinople, A.P. Some Correlates of Happiness and Unhappiness in College Students. Unpublished Doctoral Dissertation, 1965, University of Rochester, USA. Page in Report: 65
Population: College students, University of Rochester, USA, 1965
Sample:
Non-Response: 30% (take home questionnaire).
N: 952
Correlate
Authors label: Attitude toward college. (2)
Our classification: Perceived usefulness of schooling, code S1.4.1
Measurement: Product score of the subjective relevance of the goal mentioned and perceived instrumentality of the University of Rochester for the attainment of that goal; as assessed by a 14-item inventory of important goals (Perceived Instrumentality of College Test). 1. Learning how to learn from books and teachers. 2. Acquiring an appreciation of ideas. 3. Establishing own personal, social and academic values. 4. Developing relationships with the opposite sex. 5. Contributing in a distinguished, meaningful manner to some campus group. 6. Developing the ability to get along with different kinds of people. 7. Becoming self-confident. 8. Personal independence.
http://worlddatabaseofhappiness.eur.nl/hap_cor/top_sub.php?code=S1 (101 of 147)9-9-2009 14:01:24

Findings on Happiness and SCHOOL
9. Finding a spouse. 10. Achieving academic distinction. 11. Having many good friends. 12. Discovering own strong points and limitations. 13. Preparing for a career which begins right after graduation. 14. Preparing for a career which requires further study beyond the B.A. or B.S.
Remarks: Correlations of the Elation-Depression Scale with both the individual subjective relevance scores and the Rochester instrumentality scores for each goal indicate that happiness is more closely associated with perceived Rochester instrumentality than with subjective relevance of each goal. In most cases the correlations of happiness with the subjective relevance scores are less than .10 (ns).
Observed Relation with Happiness
Happiness Measure
Statistics Elaboration/Remarks
A-AOL/cy/sq/v/10/a r=+ freshman males : r=+.29 (05)freshman females: r=+.07 (ns)junior males : r=+.16 (ns)junior females : r=+.00 (ns)
http://worlddatabaseofhappiness.eur.nl/hap_cor/top_sub.php?code=S1 (102 of 147)9-9-2009 14:01:24

Findings on Happiness and SCHOOL
A-AOL/cy/sq/v/10/a r=+ freshman males : r=+.25 (05)freshman females: r=+.25 (05)junior males : r=+.05 (ns)junior females : r=+.02 (ns)
A-AOL/cy/sq/v/10/a r=+ freshman males : r=+.15 (ns)freshman females: r=+.44 (05)junior males : r=+.31 (05)junior females : r=+.17 (ns)
A-AOL/cy/sq/v/10/a r=+ freshman males : r=+.29 (05)freshman females: r=+.29 (05)junior males : r=+.18 (ns)junior females : r=+.14 (ns)
A-AOL/cy/sq/v/10/a r=+ freshman males : r=+.11 (ns)freshman females: r=+.29 (05)junior males : r=-.02 (ns)junior females : r=+.21 (05)
A-AOL/cy/sq/v/10/a r=+ freshman males : r=+.19 (ns)freshman females: r=+.14 (ns)junior males : r=+.15 (ns)junior females : r=+.14 (ns)
A-AOL/cy/sq/v/10/a r=+ freshman males : r=+.39 (05)freshman females: r=+.02 (ns)junior males : r=+.38 (05)junior females : r=+.32 (05)
A-AOL/cy/sq/v/10/a r=+ freshman males : r=+.24 (05)freshman females: r=+.17 (ns)junior males : r=+.28 (05)junior females : r=+.05 (ns)
http://worlddatabaseofhappiness.eur.nl/hap_cor/top_sub.php?code=S1 (103 of 147)9-9-2009 14:01:24

Findings on Happiness and SCHOOL
A-AOL/cy/sq/v/10/a r=+ freshman males : r=+.21 (05)freshman females: r=+.20 (05)junior males : r=+.18 (ns)junior females : r=+.11 (ns)
A-AOL/cy/sq/v/10/a r=+ freshman males : r=+.27 (05)freshman females: r=+.08 (ns)junior males : r=+.24 (05)junior females : r=+.03 (ns)
A-AOL/cy/sq/v/10/a r=+ freshman males : r=+.36 (05)freshman females: r=+.28 (05)junior males : r=+.17 (ns)junior females : r=+.19 (ns)
A-AOL/cy/sq/v/10/a r=+ freshman males : r=+.12 (ns)freshman females: r=+.10 (ns)junior males : r=+.20 (05)junior females : r=+.07 (ns)
A-AOL/cy/sq/v/10/a r=+ freshman males : r=+.11 (ns)freshman females: r=+.13 (ns)junior males : r=+.05 (ns)junior females : r=+.15 (ns)
A-AOL/cy/sq/v/10/a r=+ freshman males : r=+.36 (05)freshman females: r=+.04 (ns)junior males : r=+.28 (05)junior females : r=+.07 (ns)
Correlational finding on Happiness and Perceived usefulness of schooling Subject code: S1.4.1
Study CONST 1965
Reported in: Constantinople, A.P. Some Correlates of Happiness and Unhappiness in College Students. Unpublished Doctoral Dissertation, 1965, University of Rochester, USA. Page in Report: 63
Population: College students, University of Rochester, USA, 1965
http://worlddatabaseofhappiness.eur.nl/hap_cor/top_sub.php?code=S1 (104 of 147)9-9-2009 14:01:24

Findings on Happiness and SCHOOL
Sample:
Non-Response: 30% (take home questionnaire).
N: 952
Correlate
Authors label: Attitude toward college. (1)
Our classification: Perceived usefulness of schooling, code S1.4.1
Measurement: Product score of subjective importance of a goal and perceived instrumentality of the University of Rochester for the attainment of that goal, using a list of 14 goals (see above).Scores were summed to obtain a total score.
Observed Relation with Happiness
Happiness Measure
Statistics Elaboration/Remarks
A-AOL/cy/sq/v/10/a DM=+ Analysis on the basis of data from the 16 most happy and 16 least happy freshman and junior males and females who returned the second questionnaire.
Strongest among freshman males (01).Lowests among junior females (ns).Significant among junior males and freshman females (05).
Correlational finding on Happiness and Perceived usefulness of schooling Subject code: S1.4.1
Study CONST 1965
Reported in: Constantinople, A.P. Some Correlates of Happiness and Unhappiness in College Students. Unpublished Doctoral Dissertation, 1965, University of Rochester, USA. Page in Report: 61
Population: College students, University of Rochester, USA, 1965
Sample:
Non-Response: 30% (take home questionnaire).
N: 952
Correlate
Authors label: Attitude toward college. (3)
http://worlddatabaseofhappiness.eur.nl/hap_cor/top_sub.php?code=S1 (105 of 147)9-9-2009 14:01:24

Findings on Happiness and SCHOOL
Our classification: Perceived usefulness of schooling, code S1.4.1
Measurement: Product score of subjective importance of a goal and what the ideal university could contribute to the attainment of that goal, minus product score of subjective importance and Rochester instrumentality for that goal, using a lists of 14 goals (see above).
Observed Relation with Happiness
Happiness Measure
Statistics Elaboration/Remarks
A-AOL/cy/sq/v/10/a DM=+ p<.05
Strongest among freshman females (01)Lowest among junior females (ns)Significant among males only (05)
Correlational finding on Happiness and Perceived usefulness of schooling Subject code: S1.4.1
Study CONST 1970
Reported in: Constantinople, A.P. Some Correlates of Average Level of Happiness among College Students. Paper, 1970 based on unpublished doctoral dissertation, 1965, University of Rochester, USA Page in Report: 11
Population: Undergraduate college students, University of Rochester, USA, followed 12 months, 1965-68
Sample:
Non-Response: 50% return of mailed questionnaire.
N: 581
Correlate
Authors label: Perceived instrumen-tality of college. (1)
Our classification: Perceived usefulness of schooling, code S1.4.1
http://worlddatabaseofhappiness.eur.nl/hap_cor/top_sub.php?code=S1 (106 of 147)9-9-2009 14:01:24

Findings on Happiness and SCHOOL
Measurement: Closed questions on the degree of which the university is perceived as helping or hindering progress toward each of the goals mentioned. (Perceived Instru-mentality of College Test; see Constantinople 1965, 1967).
1. Learning how to learn from books and teachers. 2. Acquiring an appreciation of ideas. 3. Establishing own personal, social and academic values. 4. Developing relationships with opposite sex. 5. Contributing in a distinguished, meaningful manner to some campus group. 6. Developing ability to get along with different kinds of people. 7. Becoming self-confident. 8. Personal independence. 9. Finding a spouse.10. Achieving academic dinstinction.11. Having many good friends.12. Discovering own strong points and limitations.13. Preparing for career which requires further study beyond the B.A. or B.S.14. Preparing for acareer wich begins right after graduation.
Remarks: See also above under CONST 1965.
The goals were each scored for their importance as a goal in the S's own college experience too. These rating generally correlate less than .10 with happiness.
Observed Relation with Happiness
Happiness Measure
Statistics Elaboration/Remarks
A-AOL/cy/sq/v/10/a r=+ 1:learning how to learnfreshman males : r = -.09 (ns)senior males : r = +.23 (01)freshman females : r = +.06 (ns)senior females : r = +.03 (ns)
A-AOL/cy/sq/v/10/a r=+ 2:appreciation of ideasfreshman males : r = +.14 (ns)senior males : r = +.29 (01)freshman females : r = +.07 (ns)senior females : r = +.17 (05)
http://worlddatabaseofhappiness.eur.nl/hap_cor/top_sub.php?code=S1 (107 of 147)9-9-2009 14:01:24
Findings on Happiness and SCHOOL
A-AOL/cy/sq/v/10/a r=+ 3:establishing own valuesfreshman males : r = +.11 (ns)senior males : r = +.34 (01)freshman females : r = +.20 (05)senior females : r = -.01 (ns)
A-AOL/cy/sq/v/10/a r=+ 4:opposite sexfreshman males : r = +.17 (05)senior males : r = +.30 (01)freshman females : r = +.30 (01)senior females : r = +.06 (ns)
A-AOL/cy/sq/v/10/a r=+ 5:campus groupfreshman males : r = +.08 (ns)senior males : r = +.10 (ns)freshman females : r = +.11 (ns)senior females : r = +.22 (05)
A-AOL/cy/sq/v/10/a r=+ 6:ability to get alongfreshman males : r = +.27 (01)senior males : r = +.26 (01)freshman females : r = +.18 (05)senior females : r = +.30 (01)
A-AOL/cy/sq/v/10/a r=+ 7:self-confidentfreshman males : r = +.32 (01)senior males : r = +.32 (01)freshman females : r = +.28 (01)senior females : r = +.23 (01)
A-AOL/cy/sq/v/10/a r=+ 8:personal independencefreshman males : r = +.07 (ns)senior males : r = +.22 (05)freshman females : r = +.05 (ns)senior females : r = +.09 (ns)
A-AOL/cy/sq/v/10/a r=+ 9:finding a spousefreshman males : r = +.01 (ns)senior males : r = +.30 (01)freshman females : r = +.25 (01)senior females : r = +.01 (ns)
A-AOL/cy/sq/v/10/a r=+ 10:academic distinctionfreshman males : r = +.16 (05)senior males : r = +.23 (01)freshman females : r = +.19 (05)senior females : r = -.01 (ns)
http://worlddatabaseofhappiness.eur.nl/hap_cor/top_sub.php?code=S1 (108 of 147)9-9-2009 14:01:24
Findings on Happiness and SCHOOL
A-AOL/cy/sq/v/10/a r=+ 11:many good friendsfreshman males : r = +.24 (01)senior males : r = +.22 (05)freshman females : r = +.15 (ns)senior females : r = +.11 (ns)
A-AOL/cy/sq/v/10/a r=+ 12:strong pointsfreshman males : r = +.10 (ns)senior males : r = +.28 (01)freshman females : r = +.22 (01)senior females : r = +.24 (01)
A-AOL/cy/sq/v/10/a r=+ 13:careerfreshman males : r = +.05 (ns)senior males : r = -.03 (ns)freshman females : r = +.05 (ns)senior females : r = +.27 (01)
A-AOL/cy/sq/v/10/a r=+ 14:graduate schoolfreshman males : r = +.16 (05)senior males : r = +.27 (01)freshman females : r = +.10 (ns)senior females : r = -.08 (ns)
Correlational finding on Happiness and Perceived usefulness of schooling Subject code: S1.4.1
Study SYMON 1937
Reported in: Symonds, P.M. Happiness as Related to Problems and Interests. Journal of Educational Psychology, 1937, Vol. 28, 290 - 294 Page in Report: 292
Population: High school pupils and college students, USA, 193?
Sample:
Non-Response: -
N: 1651
Correlate
Authors label: Being interested in study habits (1)
Our classification: Perceived usefulness of schooling, code S1.4.1
Measurement: Closed question
http://worlddatabaseofhappiness.eur.nl/hap_cor/top_sub.php?code=S1 (109 of 147)9-9-2009 14:01:24

Findings on Happiness and SCHOOL
Observed Relation with Happiness
Happiness Measure
Statistics Elaboration/Remarks
A-CP/g/sq/v/7/a SNR= ns
A-CP/g/sq/v/7/a DM= ns
Correlational finding on Happiness and Perceived pressure of school-work Subject code: S1.4.2
Study BACHM 1977
Reported in: Bachman, J. G.;O'Malley, P. M.; Johnston, J. Youth in Transition, Vol. VI: Adolescence to Adulthood, Change and Stability in the Lives of Young Men. Institute for Social Research, 1970, University of Michigan, Ann Arbor, USA Page in Report:
Population: Public highschool boys followed 8 years from grade 10, USA, 1966-74
Sample:
Non-Response: 2.8% at T1, 17.2% at T2, 21.0% at T3, 28.9% at T4, 28.5% at T5
N: 1628
Correlate
Authors label: Satisfaction with own school work (2)
Our classification: Perceived pressure of school-work, code S1.4.2
Measurement: Simple direct question at T1 and T2: "How satisfied are you with the way you're actually doing in school?" 1 = not at all; 2 = not very; 3 = somewhat; 4 = quite; 5 = very satisfied
Observed Relation with Happiness
Happiness Measure
Statistics Elaboration/Remarks
O-HP/g/mq/v/5/a tau=+ p<.s Satisfaction with own school workHappiness T1 T2T1 tau = +.20 (001) +.11 (01)T2 tau = +.17 (001) +.16 (001)T3 tau = +.10 (01) +.12 (01)T4 tau = +.10 (01) +.11 (01)T1:1966, T2:1968, T3:1969, T4:1970
http://worlddatabaseofhappiness.eur.nl/hap_cor/top_sub.php?code=S1 (110 of 147)9-9-2009 14:01:24

Findings on Happiness and SCHOOL
Correlational finding on Happiness and Perceived pressure of school-work Subject code: S1.4.2
Study CURRI 2004
Reported in: Currie, C.; Roberts, Ch.; Morgan, A.; Smith, R.; Settertobulte, W.: et al; Eds. Young People's Health in Context. World Health Organization Europe, 2004, Copenhagen, Denmark. ISBN 92 890 1372 9 Page in Report: 185,186
Population: 11-15 aged, school children, 33 countries and regions, 2001
Sample: Probability cluster sample
Non-Response:
N: 162306
Correlate
Authors label: School pressure
Our classification: Perceived pressure of school-work, code S1.4.2
Measurement: Self report on single question:How pressured do you feel by the schoolwork you have to do?1 not at all2 a little3 some4 a lot.
Measured Values: not reported
Remarks: 15 year olds only (N =50816)
Observed Relation with Happiness
Happiness Measure
Statistics Elaboration/Remarks
C-BW/c/sq/l/11/a rs=- Girls:rs = -.16Boys :rs = -.15
Correlational finding on Happiness and Perceived pressure of school-work Subject code: S1.4.2
Study GORMA 1971
http://worlddatabaseofhappiness.eur.nl/hap_cor/top_sub.php?code=S1 (111 of 147)9-9-2009 14:01:24

Findings on Happiness and SCHOOL
Reported in: Gorman, B.S. A Multivariate Study of the Relationship of Cognitive Control and Cognitive Style Principles to Reported Daily Mood Experiences. Unpublished doctoral dissertation, 1971, City University of New York, USA Page in Report: 216/222
Population: Undergraduate students, Nassau Community College, USA, 1970
Sample:
Non-Response: 4%, 3% refusal, 1% incomplete information
N: 67
Correlate
Authors label: Pressure of academicwork (2)
Our classification: Perceived pressure of school-work, code S1.4.2
Measurement: Repeated closed question on immediate pressure during past day, scored every day during one month: none / rather light / moderate / fairly heavy / very heavy / extremely heavy.
Observed Relation with Happiness
Happiness Measure
Statistics Elaboration/Remarks
A-ARE/md/sqr/v/10/b r=+.21 ns
Correlational finding on Happiness and Perceived pressure of school-work Subject code: S1.4.2
Study GORMA 1971
Reported in: Gorman, B.S. A Multivariate Study of the Relationship of Cognitive Control and Cognitive Style Principles to Reported Daily Mood Experiences. Unpublished doctoral dissertation, 1971, City University of New York, USA Page in Report: 216/222
Population: Undergraduate students, Nassau Community College, USA, 1970
Sample:
Non-Response: 4%, 3% refusal, 1% incomplete information
N: 67
Correlate
Authors label: Pressure of academicwork (1)
http://worlddatabaseofhappiness.eur.nl/hap_cor/top_sub.php?code=S1 (112 of 147)9-9-2009 14:01:24
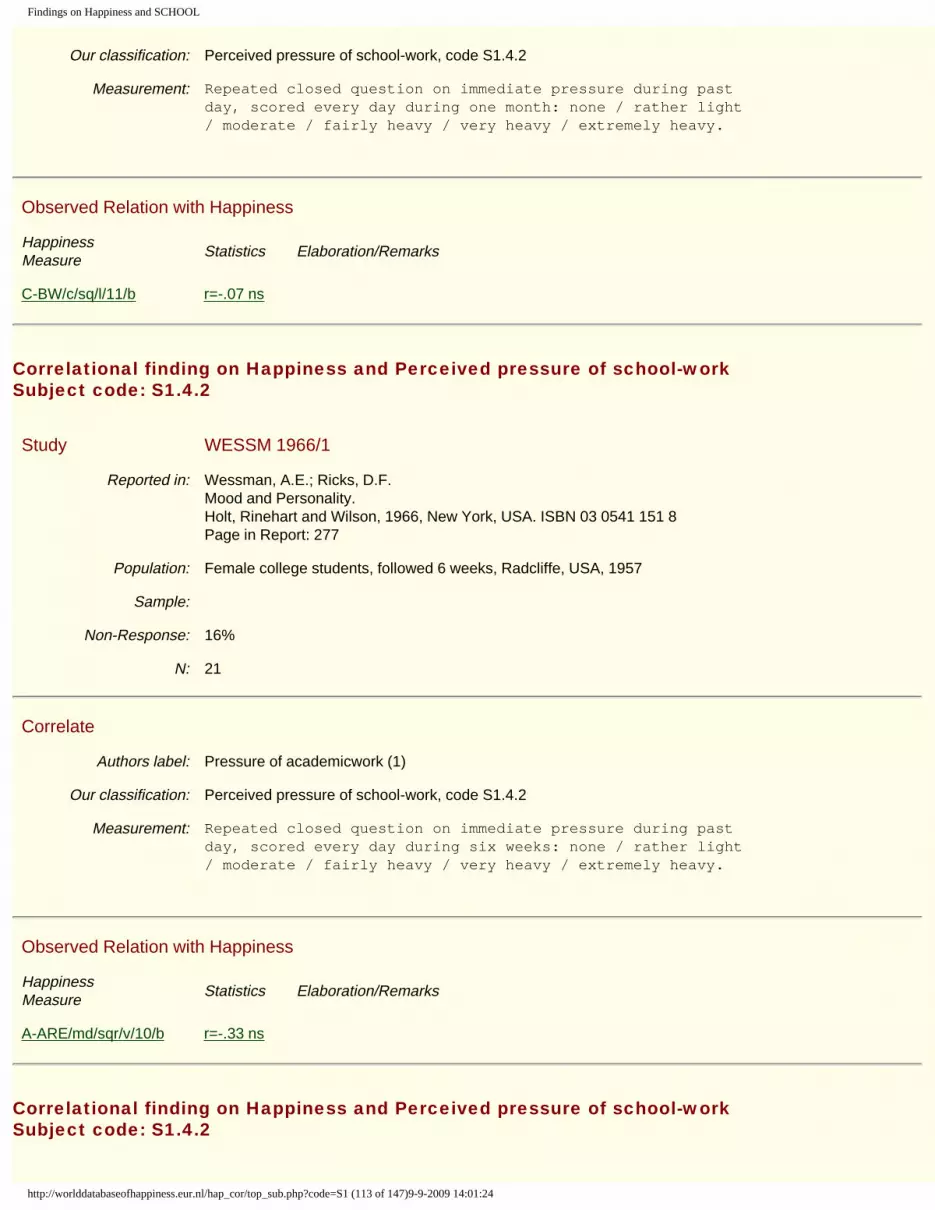
Findings on Happiness and SCHOOL
Our classification: Perceived pressure of school-work, code S1.4.2
Measurement: Repeated closed question on immediate pressure during past day, scored every day during one month: none / rather light / moderate / fairly heavy / very heavy / extremely heavy.
Observed Relation with Happiness
Happiness Measure
Statistics Elaboration/Remarks
C-BW/c/sq/l/11/b r=-.07 ns
Correlational finding on Happiness and Perceived pressure of school-work Subject code: S1.4.2
Study WESSM 1966/1
Reported in: Wessman, A.E.; Ricks, D.F. Mood and Personality. Holt, Rinehart and Wilson, 1966, New York, USA. ISBN 03 0541 151 8 Page in Report: 277
Population: Female college students, followed 6 weeks, Radcliffe, USA, 1957
Sample:
Non-Response: 16%
N: 21
Correlate
Authors label: Pressure of academicwork (1)
Our classification: Perceived pressure of school-work, code S1.4.2
Measurement: Repeated closed question on immediate pressure during past day, scored every day during six weeks: none / rather light / moderate / fairly heavy / very heavy / extremely heavy.
Observed Relation with Happiness
Happiness Measure
Statistics Elaboration/Remarks
A-ARE/md/sqr/v/10/b r=-.33 ns
Correlational finding on Happiness and Perceived pressure of school-work Subject code: S1.4.2
http://worlddatabaseofhappiness.eur.nl/hap_cor/top_sub.php?code=S1 (113 of 147)9-9-2009 14:01:24

Findings on Happiness and SCHOOL
Study WESSM 1966/2
Reported in: Wessman, A.E.;Ricks, D.F. Mood and Personality. Holt, Rinehart and Wilson, 1966, New York, USA. ISBN 03 0541 151 8 Page in Report: 66
Population: Male college students, followed 3 years, Harvard University, USA, 1957-60
Sample: Non-probability chunk sample
Non-Response: 37%: 9 dropouts, incomplete; about the same happiness distribution.
N: 17
Correlate
Authors label: Pressure of academicwork (1)
Our classification: Perceived pressure of school-work, code S1.4.2
Measurement: Repeated closed question on immediate pressure during past day, scored every day during six weeks: none / rather light / moderate / fairly heavy / very heavy / extremely heavy.
Observed Relation with Happiness
Happiness Measure
Statistics Elaboration/Remarks
A-ARE/md/sqr/v/10/a r=-.34 ns
Correlational finding on Happiness and Satisfaction with own school-performance Subject code: S1.4.3
Study BACHM 1978/2
Reported in: Bachman, J.G.; O'Malley, P.M.; Johnston, J. Youth in Transition, Vol. VI: Adolescence to Adulthooud, Change and Stability in the Lives of Young Men. Institute for Social Research, 1970, University of Michigan, Ann Arbor, USA Page in Report:
Population: Public highschool boys followed 8 years from grade 10, USA, 1966-74
Sample:
Non-Response: 2.8% at T1, 17.2% at T2, 21.0% at T3, 28.9% at T4, 28.5% at T5
N: 2213
Correlate
Authors label: Satisfaction with own school work (1)
http://worlddatabaseofhappiness.eur.nl/hap_cor/top_sub.php?code=S1 (114 of 147)9-9-2009 14:01:24

Findings on Happiness and SCHOOL
Our classification: Satisfaction with own school-performance, code S1.4.3
Measurement: Simple direct question at T1 and T2:"How satisfied are you with the way you're actually doing in school?"1 = not at all; 2 = not very; 3 = somewhat; 4 = quite; 5 = verysatisfied
Observed Relation with Happiness
Happiness Measure
Statistics Elaboration/Remarks
O-HP/g/mq/v/5/a tau=+ p<.s Satisfaction with own school workHappiness T1 T2T1 tau = +.20 (001) +.11 (01)T2 tau = +.17 (001) +.16 (001)T3 tau = +.10 (01) +.12 (01)T4 tau = +.10 (01) +.11 (01)T1:1966, T2:1968, T3:1969, T4:1970
Correlational finding on Happiness and Satisfaction with own school-performance Subject code: S1.4.3
Study CHA 2003
Reported in: Cha, K.H. Subjective Well-Being among College Students. Social Indicators Research, 2003, Vol.62/63, 455 - 477. ISSN p 0303 8300; ISSN e 1573 0921 DOI:10.1023/A:1022669906470 ISSN: 0303 8300 doi:10.1023/A:1022669906470 Page in Report: 466
Population: College students, Korea, 199?
Sample: Non-probability chunk sample
Non-Response:
N: 350
Correlate
Authors label: School ability
Our classification: Satisfaction with own school-performance, code S1.4.3
Measurement: School ability subscale of self-rating scale (Fleming and Courtney, 1984). 6 point-scale
Error Estimates: alpha=.72
http://worlddatabaseofhappiness.eur.nl/hap_cor/top_sub.php?code=S1 (115 of 147)9-9-2009 14:01:24

Findings on Happiness and SCHOOL
Observed Relation with Happiness
Happiness Measure
Statistics Elaboration/Remarks
A-BD2/cm/mq/v/7/b r=+.29 p<.01
Correlational finding on Happiness and Satisfaction with school-facilities Subject code: S1.4.4
Study ANDRE 1976/5
Reported in: Andrews, F.M.; Withey, S.B. Social Indicators of Well-being: Americans' Perceptions of Life Quality Plenum Press, 1976, New York, USA. ISBN 0 306 30935 1 Page in Report: 113
Population: 18+ aged, general public, non-institutionalized, USA, 1973/7
Sample:
Non-Response:
N: 222
Correlate
Authors label: Satisfaction with school facilities in the area (1)
Our classification: Satisfaction with school-facilities, code S1.4.4
Measurement: Closed question: "How do you feel about the schools in this area?"Rated on a 7-point scale: terrible/ unhappy/ mostly dissatisfied/ mixed/ mostly satisfied/ pleased/ delighted
Observed Relation with Happiness
Happiness Measure
Statistics Elaboration/Remarks
O-DT/u/sqt/v/7/a r=+.41
Correlational finding on Happiness and Satisfaction with school-facilities Subject code: S1.4.4
Study BRINK 1997/1
http://worlddatabaseofhappiness.eur.nl/hap_cor/top_sub.php?code=S1 (116 of 147)9-9-2009 14:01:24

Findings on Happiness and SCHOOL
Reported in: Brinkerhoff, M.B.; Fredell, K.; Frideres, J. Basic Minimum Needs, Quality of Life and Selected Correlates: Explorations in Villages in Northern India. Social Indicators Research, 1997, Vol. 42, 245 - 281 ISSN p 0303 8300; ISSN e 1573 0921 DOI:10.1023/A:1006834830518 Page in Report: 262
Population: Adult, general public, poor rural village, Barasi, India 1991
Sample: Non-probability purposive-quota sample
Non-Response: 0
N: 234
Correlate
Authors label: boys school facilities (1)
Our classification: Satisfaction with school-facilities, code S1.4.4
Measurement: Village needs prioritized by Paired Comparisons.Out of four basic needsss were asked to compare two at a time and to select, which they sought 'their family needs most'Items were: -food -health -employment -leisureThis leads to six pairs of comparisons.Score pro need can be:0. not mentioned1. once2. twice3. three timesNeeds index is the mean number of times an item is chosen.
Measured Values: 0: 1,96%; 1: 9,9%; 2: 20,9%; 3: 35,0% M: 35,0%
Remarks: Items for pairwise comparison were selected by participant observation and open interviews
Observed Relation with Happiness
Happiness Measure
Statistics Elaboration/Remarks
O-H?/?/sq/f/7/a r=_.13 p<.05
O-SLu/?/sq/l/5/a r=-.06 ns
Correlational finding on Happiness and Satisfaction with school-facilities Subject code: S1.4.4
http://worlddatabaseofhappiness.eur.nl/hap_cor/top_sub.php?code=S1 (117 of 147)9-9-2009 14:01:24

Findings on Happiness and SCHOOL
Study BRINK 1997/1
Reported in: Brinkerhoff, M.B.; Fredell, K.; Frideres, J. Basic Minimum Needs, Quality of Life and Selected Correlates: Explorations in Villages in Northern India. Social Indicators Research, 1997, Vol. 42, 245 - 281 ISSN p 0303 8300; ISSN e 1573 0921 DOI:10.1023/A:1006834830518 Page in Report: 262
Population: Adult, general public, poor rural village, Barasi, India 1991
Sample: Non-probability purposive-quota sample
Non-Response: 0
N: 234
Correlate
Authors label: school facilities for girls (1)
Our classification: Satisfaction with school-facilities, code S1.4.4
Measurement: Village needs prioritized by Paired Comparisons.Out of four basic needsss were asked to compare two at a time and to select, which they sought 'their family needs most'Items were: -food -health -employment -leisureThis leads to six pairs of comparisons.Score pro need can be:0. not mentioned1. once2. twice3. three timesNeeds index is the mean number of times an item is chosen.
Measured Values: 0: 1,64% 1: 8,5%; 2: 34,2% 3: 41,5%; M: 15,8%
Remarks: Items for pairwise comparison were selected by participant observation and open interviews
Observed Relation with Happiness
Happiness Measure
Statistics Elaboration/Remarks
O-H?/?/sq/f/7/a r=+.1 ns
O-SLu/?/sq/l/5/a r=+.13 p<.05
Correlational finding on Happiness and Satisfaction with school-facilities
http://worlddatabaseofhappiness.eur.nl/hap_cor/top_sub.php?code=S1 (118 of 147)9-9-2009 14:01:24

Findings on Happiness and SCHOOL
Subject code: S1.4.4
Study BUTTE 1977
Reported in: Buttel, F.H.; Martinson, O.B. Ideology and Social Indicators of the Quality of Life. Social Indicators Research, 1977, Vol. 4, 353 - 369 ISSN p 0303 8300; ISSN e 1573 0921 DOI:10.1007/BF00353138 Page in Report: 358
Population: 18+ aged, general public, Winconsin USA, 1974
Sample:
Non-Response:
N: 548
Correlate
Authors label: Satisfaction with quality of public schools (3)
Our classification: Satisfaction with school-facilities, code S1.4.4
Measurement: Single closed question rated on a 5-point scale: How do you feel about the quality of public schools in this school district, do you think they are: very good / fairly good / both good and bad / not very good / not good at all.
Observed Relation with Happiness
Happiness Measure
Statistics Elaboration/Remarks
C-A/u/sq/v/7/a r=+.19 p<.05
Correlational finding on Happiness and Satisfaction with school-facilities Subject code: S1.4.4
Study BUTTE 1977
Reported in: Buttel, F.H.; Martinson, O.B. Ideology and Social Indicators of the Quality of Life. Social Indicators Research, 1977, Vol. 4, 353 - 369 ISSN p 0303 8300; ISSN e 1573 0921 DOI:10.1007/BF00353138 Page in Report: 358
Population: 18+ aged, general public, Winconsin USA, 1974
Sample:
Non-Response:
N: 548
http://worlddatabaseofhappiness.eur.nl/hap_cor/top_sub.php?code=S1 (119 of 147)9-9-2009 14:01:24

Findings on Happiness and SCHOOL
Correlate
Authors label: Satisfaction with quality of public schools (2)
Our classification: Satisfaction with school-facilities, code S1.4.4
Measurement: Single closed question rated on a 5-point scale: How do you feel about the quality of public schools in this school district, do you think they are: very good / fairly good / both good and bad / not very good / not good at all.
Observed Relation with Happiness
Happiness Measure
Statistics Elaboration/Remarks
O-SLW/u/sq/v/7/b r=+.19 p<.05
Correlational finding on Happiness and Satisfaction with school-facilities Subject code: S1.4.4
Study BUTTE 1977
Reported in: Buttel, F.H.; Martinson, O.B. Ideology and Social Indicators of the Quality of Life. Social Indicators Research, 1977, Vol. 4, 353 - 369 ISSN p 0303 8300; ISSN e 1573 0921 DOI:10.1007/BF00353138 Page in Report: 358
Population: 18+ aged, general public, Winconsin USA, 1974
Sample:
Non-Response:
N: 548
Correlate
Authors label: Satisfaction with quality of public schools (1)
Our classification: Satisfaction with school-facilities, code S1.4.4
Measurement: Single closed question rated on a 5-point scale: How do you feel about the quality of public schools in this school district, do you think they are: very good / fairly good / both good and bad / not very good / not good at all.
Observed Relation with Happiness
http://worlddatabaseofhappiness.eur.nl/hap_cor/top_sub.php?code=S1 (120 of 147)9-9-2009 14:01:24
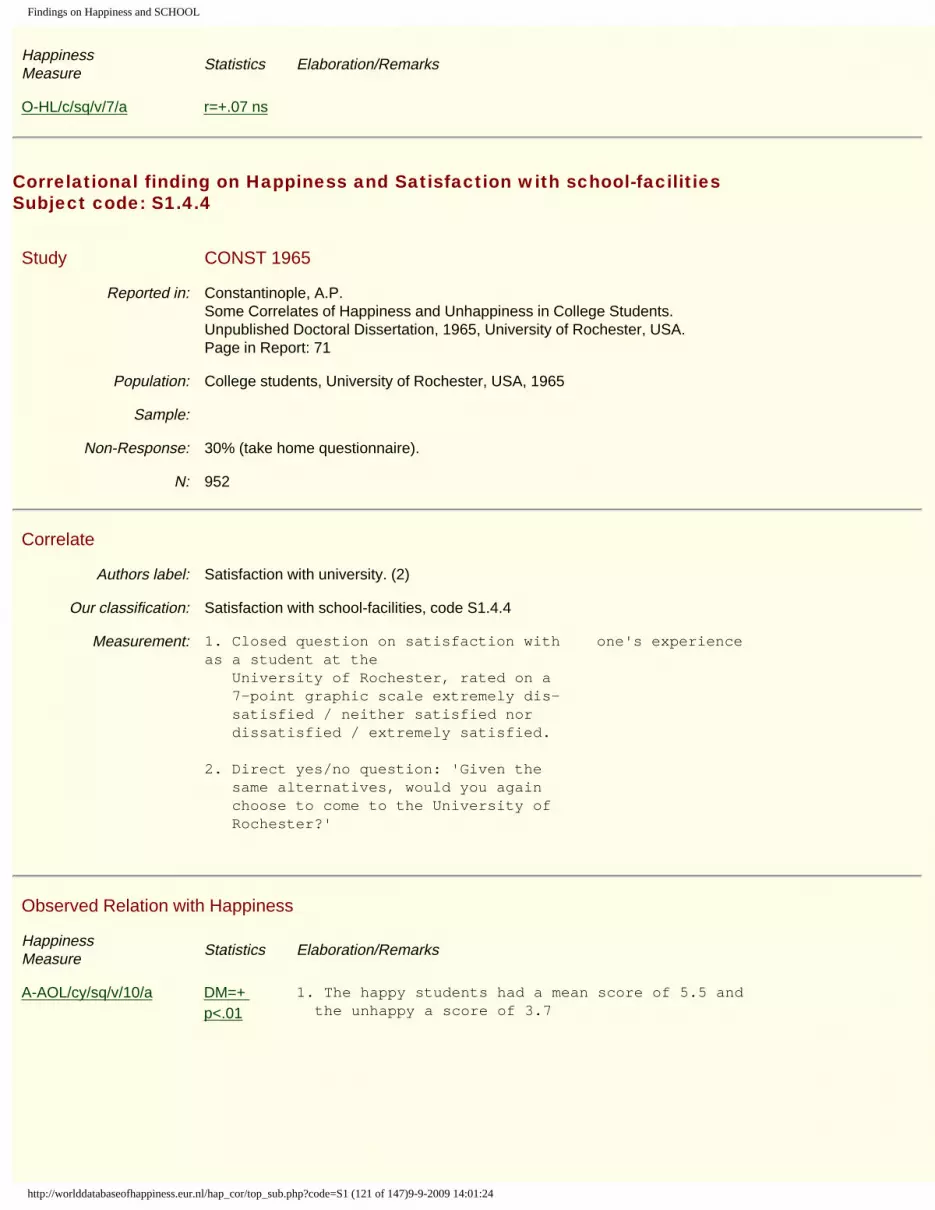
Findings on Happiness and SCHOOL
Happiness Measure
Statistics Elaboration/Remarks
O-HL/c/sq/v/7/a r=+.07 ns
Correlational finding on Happiness and Satisfaction with school-facilities Subject code: S1.4.4
Study CONST 1965
Reported in: Constantinople, A.P. Some Correlates of Happiness and Unhappiness in College Students. Unpublished Doctoral Dissertation, 1965, University of Rochester, USA. Page in Report: 71
Population: College students, University of Rochester, USA, 1965
Sample:
Non-Response: 30% (take home questionnaire).
N: 952
Correlate
Authors label: Satisfaction with university. (2)
Our classification: Satisfaction with school-facilities, code S1.4.4
Measurement: 1. Closed question on satisfaction with one's experience as a student at the University of Rochester, rated on a 7-point graphic scale extremely dis- satisfied / neither satisfied nor dissatisfied / extremely satisfied.
2. Direct yes/no question: 'Given the same alternatives, would you again choose to come to the University of Rochester?'
Observed Relation with Happiness
Happiness Measure
Statistics Elaboration/Remarks
A-AOL/cy/sq/v/10/a DM=+ p<.01
1. The happy students had a mean score of 5.5 and the unhappy a score of 3.7
http://worlddatabaseofhappiness.eur.nl/hap_cor/top_sub.php?code=S1 (121 of 147)9-9-2009 14:01:24

Findings on Happiness and SCHOOL
A-AOL/cy/sq/v/10/a D%=+ 2. 71% of the happy students and 37.5% of the unhappy students responded affirmatively.
The 16 most happy and the 16 most unhappy stu- dents in each of 8 sex/class groups (N=256) were compared.
Correlational finding on Happiness and Satisfaction with school-facilities Subject code: S1.4.4
Study CONST 1965
Reported in: Constantinople, A.P. Some Correlates of Happiness and Unhappiness in College Students. Unpublished Doctoral Dissertation, 1965, University of Rochester, USA. Page in Report: 71
Population: College students, University of Rochester, USA, 1965
Sample:
Non-Response: 30% (take home questionnaire).
N: 952
Correlate
Authors label: Satisfaction with university. (1)
Our classification: Satisfaction with school-facilities, code S1.4.4
Measurement: 1. Closed question rated on a 7-point graphic scale on satisfaction with one's experience as a student at the University of Rochester: extremely dissatisfied / neither satisfied nor dissatisfied / extremely satisfied.
2. Direct yes / no question: 'Given the same alternatives, would you again choose to come to the University of Rochester?'
Observed Relation with Happiness
Happiness Measure
Statistics Elaboration/Remarks
http://worlddatabaseofhappiness.eur.nl/hap_cor/top_sub.php?code=S1 (122 of 147)9-9-2009 14:01:24

Findings on Happiness and SCHOOL
A-AOL/cy/sq/v/10/a DM=+ p<.01
A-AOL/cy/sq/v/10/a D%=+ Analysis on the basis of the 16 most and 16 least happy Ss in each of the 8 sex/class group: (N=256)
Correlational finding on Happiness and Satisfaction with school-facilities Subject code: S1.4.4
Study HULIN 1969
Reported in: Hulin, C.L. Source of Variation in Job and Life Satisfaction: The Role of Community and Job-Related Variables. Journal of Applied Psychology, 1969, Vol. 53, 279 -291 Page in Report: 285
Population: White collar workers, living in company towns, Columbia Canada, 196?
Sample:
Non-Response: 24%
N: 470
Correlate
Authors label: Satisfaction with community's school facilities. (1)
Our classification: Satisfaction with school-facilities, code S1.4.4
Measurement: Question rated on a graphic rating scale very dissatisfied / somewhat dissatisfied / neither dissatisfied nor satisfied / somewhat satisfied / very satisfied.
Observed Relation with Happiness
Happiness Measure
Statistics Elaboration/Remarks
O-SLu/g/sq/f/7/a r=+ Males : r = +.12 (05)Females: r = +.08 (ns)
Correlational finding on Happiness and Satisfaction with school-facilities
http://worlddatabaseofhappiness.eur.nl/hap_cor/top_sub.php?code=S1 (123 of 147)9-9-2009 14:01:24
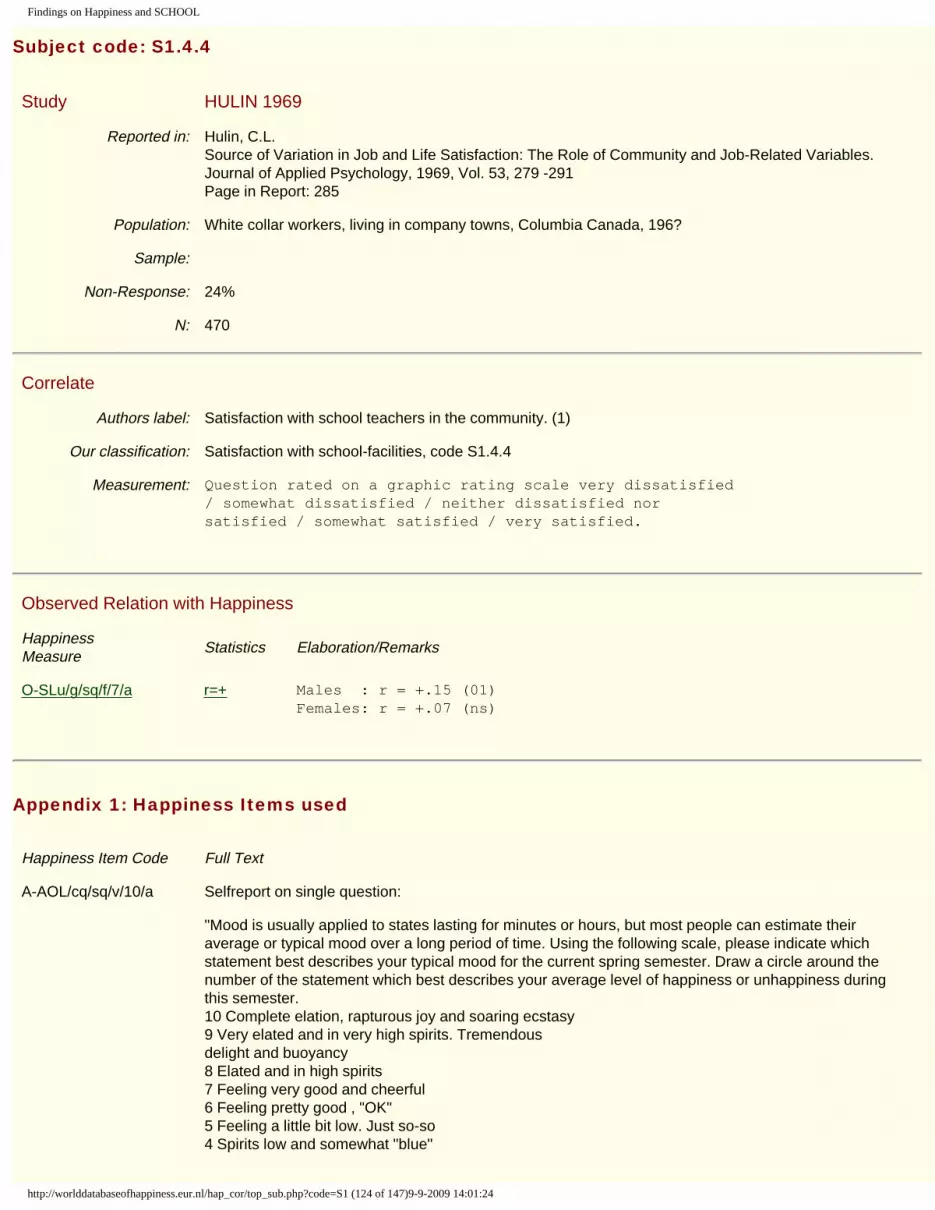
Findings on Happiness and SCHOOL
Subject code: S1.4.4
Study HULIN 1969
Reported in: Hulin, C.L. Source of Variation in Job and Life Satisfaction: The Role of Community and Job-Related Variables. Journal of Applied Psychology, 1969, Vol. 53, 279 -291 Page in Report: 285
Population: White collar workers, living in company towns, Columbia Canada, 196?
Sample:
Non-Response: 24%
N: 470
Correlate
Authors label: Satisfaction with school teachers in the community. (1)
Our classification: Satisfaction with school-facilities, code S1.4.4
Measurement: Question rated on a graphic rating scale very dissatisfied / somewhat dissatisfied / neither dissatisfied nor satisfied / somewhat satisfied / very satisfied.
Observed Relation with Happiness
Happiness Measure
Statistics Elaboration/Remarks
O-SLu/g/sq/f/7/a r=+ Males : r = +.15 (01)Females: r = +.07 (ns)
Appendix 1: Happiness Items used
Happiness Item Code Full Text
A-AOL/cq/sq/v/10/a Selfreport on single question: "Mood is usually applied to states lasting for minutes or hours, but most people can estimate their average or typical mood over a long period of time. Using the following scale, please indicate which statement best describes your typical mood for the current spring semester. Draw a circle around the number of the statement which best describes your average level of happiness or unhappiness during this semester. 10 Complete elation, rapturous joy and soaring ecstasy 9 Very elated and in very high spirits. Tremendous delight and buoyancy 8 Elated and in high spirits 7 Feeling very good and cheerful 6 Feeling pretty good , "OK" 5 Feeling a little bit low. Just so-so 4 Spirits low and somewhat "blue"
http://worlddatabaseofhappiness.eur.nl/hap_cor/top_sub.php?code=S1 (124 of 147)9-9-2009 14:01:24
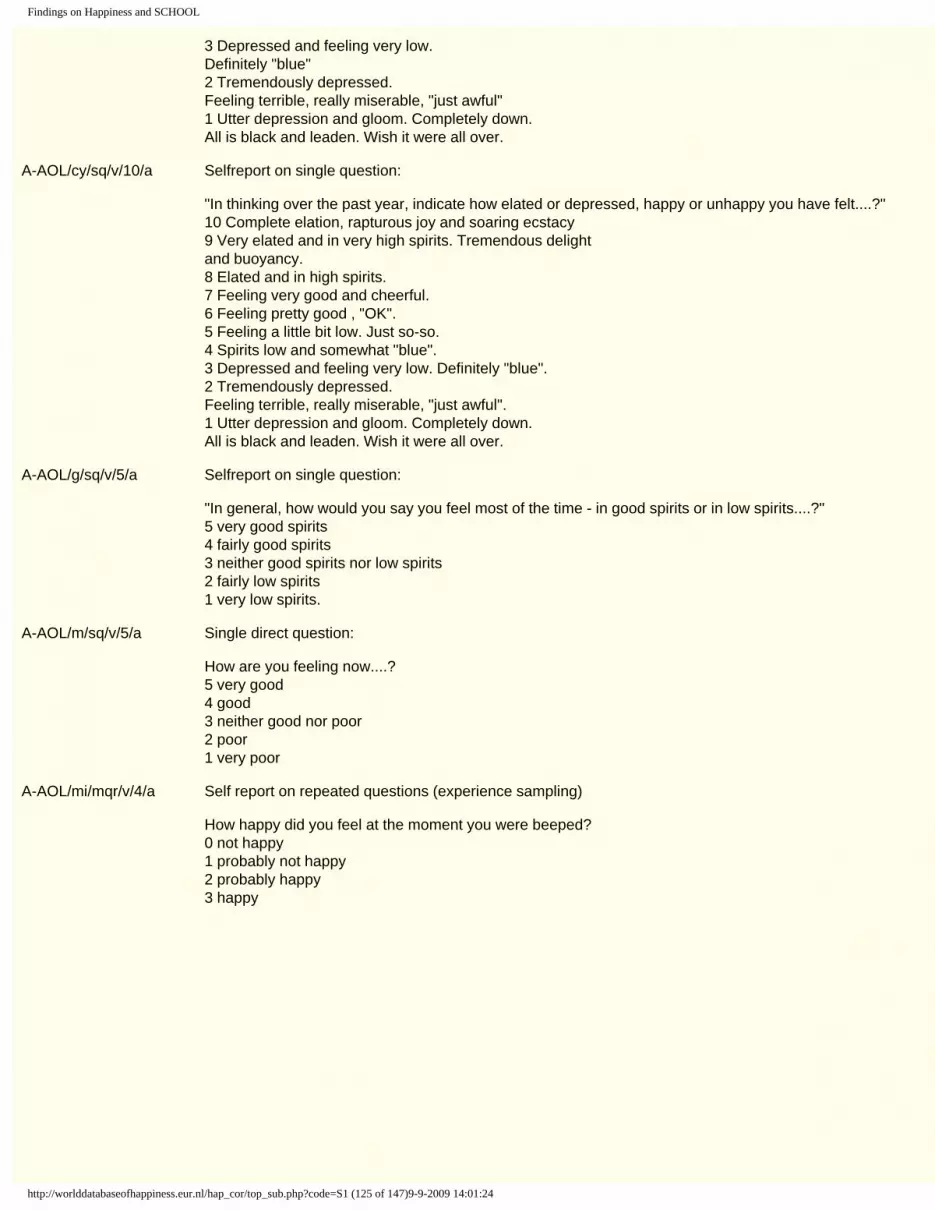
Findings on Happiness and SCHOOL
3 Depressed and feeling very low. Definitely "blue" 2 Tremendously depressed. Feeling terrible, really miserable, "just awful" 1 Utter depression and gloom. Completely down. All is black and leaden. Wish it were all over.
A-AOL/cy/sq/v/10/a Selfreport on single question: "In thinking over the past year, indicate how elated or depressed, happy or unhappy you have felt....?" 10 Complete elation, rapturous joy and soaring ecstacy 9 Very elated and in very high spirits. Tremendous delight and buoyancy. 8 Elated and in high spirits. 7 Feeling very good and cheerful. 6 Feeling pretty good , "OK". 5 Feeling a little bit low. Just so-so. 4 Spirits low and somewhat "blue". 3 Depressed and feeling very low. Definitely "blue". 2 Tremendously depressed. Feeling terrible, really miserable, "just awful". 1 Utter depression and gloom. Completely down. All is black and leaden. Wish it were all over.
A-AOL/g/sq/v/5/a Selfreport on single question: "In general, how would you say you feel most of the time - in good spirits or in low spirits....?" 5 very good spirits 4 fairly good spirits 3 neither good spirits nor low spirits 2 fairly low spirits 1 very low spirits.
A-AOL/m/sq/v/5/a Single direct question: How are you feeling now....? 5 very good 4 good 3 neither good nor poor 2 poor 1 very poor
A-AOL/mi/mqr/v/4/a Self report on repeated questions (experience sampling) How happy did you feel at the moment you were beeped? 0 not happy 1 probably not happy 2 probably happy 3 happy
http://worlddatabaseofhappiness.eur.nl/hap_cor/top_sub.php?code=S1 (125 of 147)9-9-2009 14:01:24

Findings on Happiness and SCHOOL
A-ARE/md/sqr/v/10/a Selfreport on single question, repeated every evening before retiring during 3 weeks (experience sampling). "On the average, how happy or unhappy did you feel today....?" 1 Extremely unhappy. Utterly depressed. Completely down. 2 Very unhappy. Depressed. Spirits very low. 3 Pretty unhappy. Somewhat 'blue'. Spirits down. 4 Mildly unhappy. Just a little low. 5 Barely unhappy. Just this side of neutral. 6 Barely happy. Just this side of neutral. 7 Mildly happy. Feeling fairly good and somewhat cheerful. 8 Pretty happy. Spirits high. Feeling good. 9 Very happy. Feeling really good. Elated. 10 Extremely happy. Feeling ecstatic, joyous, fantastic. Name: Wessman & Ricks' `Elation - Depression Scale" (adapted version)
A-ARE/md/sqr/v/10/b Selfreport on single question, answered every evening before retiring during six weeks (experience sampling) "On average; how elated or depressed, happy or unhappy you felt today....? 10 Complete elation, rapturous joy and soaring ecstasy 9 Very elated and in very high spirits. Tremendous delight and buoyancy 8 Elated and in high spirits 7 Feeling very good and cheerful 6 Feeling pretty good , "OK" 5 Feeling a little bit low. Just so-so 4 Spirits low and somewhat 'blue' 3 Depressed and feeling very low. Definitely 'blue' 2 Tremendously depressed. Feeling terrible, really miserable, "just awful" 1 Utter depression and gloom. Completely down. All is black and leaden. Wish it were all over. Name: Wessman & Ricks' `Elation - depression scale'
A-ARE/mi/sqr/n/7/a Selfreport on single question repeated several times a day. " .. mood .." Full lead question not reported 7 happy 6 5 4 3 2 1 sad
http://worlddatabaseofhappiness.eur.nl/hap_cor/top_sub.php?code=S1 (126 of 147)9-9-2009 14:01:24

Findings on Happiness and SCHOOL
A-BB/cm/mq/v/2/a Selfreport on 10 questions: During the past few weeks, did you ever feel ....? (yes/no) A Particularly exited or interested in something? B So restless that you couldn't sit long in a chair? C Proud because someone complimented you on something you had done? D Very lonely or remote from other people? E Pleased about having accomplished something? F Bored? G On top of the world? H Depressed or very unhappy? I That things were going your way? J Upset because someone criticized you? Answer options and scoring: yes = 1 no = 0 Summation: -Positive Affect Score (PAS): A+C+E+G+I -Negative Affect Score (NAS): B+D+F+H+J -Affect Balance Score (ABS): PAS minus NAS Possible range: -5 to +5 Name: Bradburn's 'Affect Balance Scale' (standard version)
A-BD2/cm/mq/v/7/b Selfreport on 8 questions: Using the scale below, indicate how much of the time during the PAST MONTH have you felt each emotion? A affectionate B joyful C sad D worried E irritable F guilty G happy H proud 1 never 2 slight amount (rare) 3 some of the time 4 about half the time 5 much of the time 6 almost always 7 always Computation: (A+B+G+H)-(C+D+E+F)/8 Name: Diener's 'Affect Balance'
http://worlddatabaseofhappiness.eur.nl/hap_cor/top_sub.php?code=S1 (127 of 147)9-9-2009 14:01:24
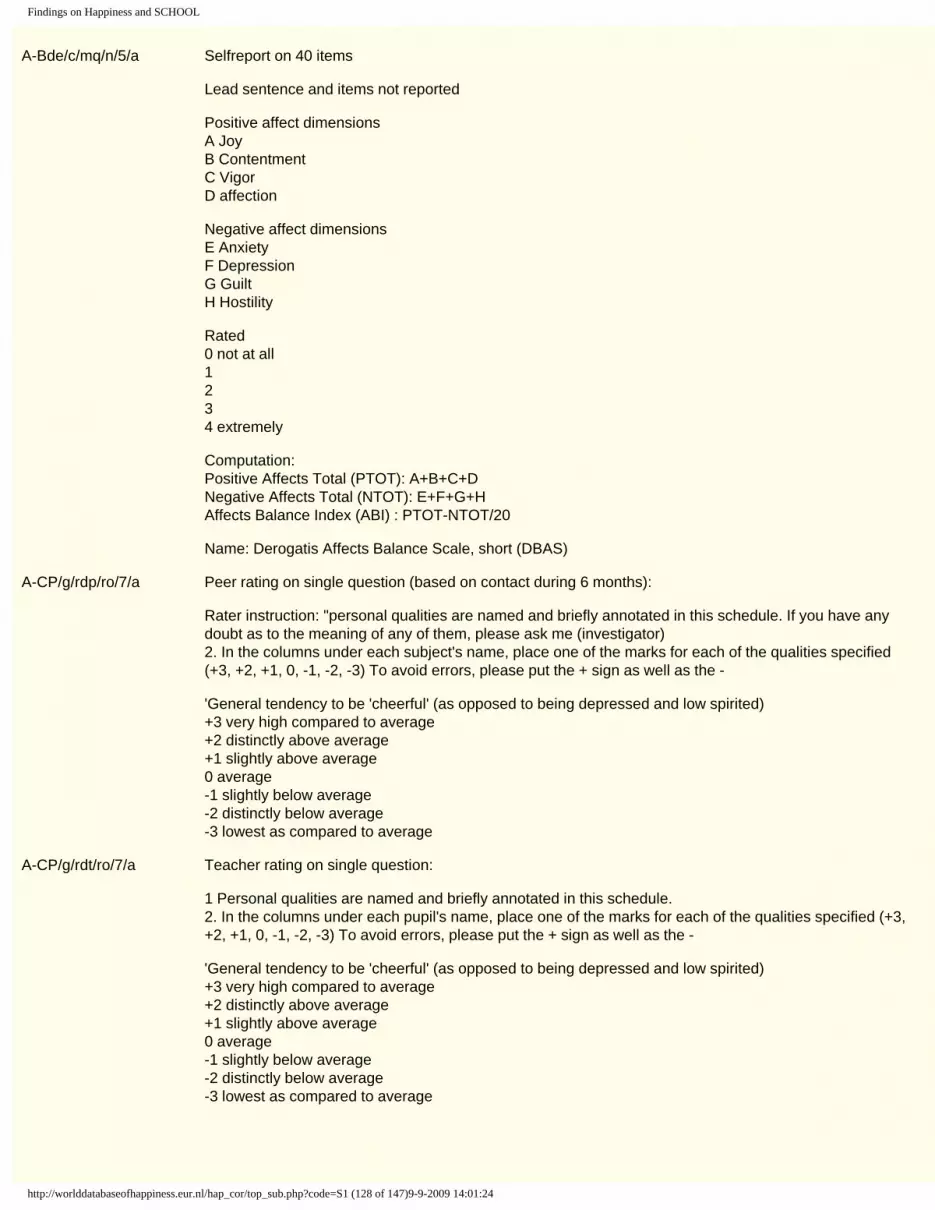
Findings on Happiness and SCHOOL
A-Bde/c/mq/n/5/a Selfreport on 40 items Lead sentence and items not reported Positive affect dimensions A Joy B Contentment C Vigor D affection Negative affect dimensions E Anxiety F Depression G Guilt H Hostility Rated 0 not at all 1 2 3 4 extremely Computation: Positive Affects Total (PTOT): A+B+C+D Negative Affects Total (NTOT): E+F+G+H Affects Balance Index (ABI) : PTOT-NTOT/20 Name: Derogatis Affects Balance Scale, short (DBAS)
A-CP/g/rdp/ro/7/a Peer rating on single question (based on contact during 6 months): Rater instruction: "personal qualities are named and briefly annotated in this schedule. If you have any doubt as to the meaning of any of them, please ask me (investigator) 2. In the columns under each subject's name, place one of the marks for each of the qualities specified (+3, +2, +1, 0, -1, -2, -3) To avoid errors, please put the + sign as well as the - 'General tendency to be 'cheerful' (as opposed to being depressed and low spirited) +3 very high compared to average +2 distinctly above average +1 slightly above average 0 average -1 slightly below average -2 distinctly below average -3 lowest as compared to average
A-CP/g/rdt/ro/7/a Teacher rating on single question: 1 Personal qualities are named and briefly annotated in this schedule. 2. In the columns under each pupil's name, place one of the marks for each of the qualities specified (+3, +2, +1, 0, -1, -2, -3) To avoid errors, please put the + sign as well as the - 'General tendency to be 'cheerful' (as opposed to being depressed and low spirited) +3 very high compared to average +2 distinctly above average +1 slightly above average 0 average -1 slightly below average -2 distinctly below average -3 lowest as compared to average
http://worlddatabaseofhappiness.eur.nl/hap_cor/top_sub.php?code=S1 (128 of 147)9-9-2009 14:01:24

Findings on Happiness and SCHOOL
A-CP/g/sq/v/7/a Selfreport on single question: "Check one of the following groups of adjectives which best describes you." 7 full of deep joy, excitedly happy, enthusiastic, thrilled 6 cheerful, successful, optimistic, lighthearted 5 satisfied, comfortable, life goes smoothly, peaceful 4 contented at times and at other times discontented, life has both favorable and unfavorable features 3 restless, impatient, uncertain, dull, cross, confined 2 anxious, irritated, discouraged, disappointed, discontented 1 gloomy, miserable, a failure, no pleasure in anything
C-A/u/sq/v/7/a Selfreport on single question: "How do you feel about what you are accomplishing in life...?" 7 completely satisfied 6 very satisfied 5 satisfied 4 satisfied-dissatisfied 3 dissatisfied 2 very dissatisfied 1 completely dissatisfied.
C-ASG/h/mq/v/5/a Selfreport on 2 questions: A. "How important was each of the following goals in life in the plans you made for yourself in early adulthood?" - occupational success - family life - friendships - richness of cultural life - total service to society. 1 less important to me than to most people 2 3 4 5 of prime importance to me B. "How successful have you been in the pursuit of these goals?" 1 little satisfaction in this area 2 3 4 5 had excellent fortune in this respect Computation: General Satisfaction 5 is the quotient obtained by multiplying the planned goal (early adulthood) by the reported success in attaining that goal, adding the five of these multiplied areas and dividing them by the sum of the planned goals for each of the areas. Pa.Sa + Pb.Sb + Pc.Sc + Pd.Sd + Pe.Se ----------------------------------------------------------------- Pa + Pb + Pc + Pd + Pe Pa = planned goal a (1-5) Sa = success goal a (1-5)
http://worlddatabaseofhappiness.eur.nl/hap_cor/top_sub.php?code=S1 (129 of 147)9-9-2009 14:01:24

Findings on Happiness and SCHOOL
C-BW/c/sq/l/11/a Selfreport on single question: "Here is a picture of a ladder. Suppose we say that the top of the ladder represents the best possible life for you and the bottom represents the worst possible life for you. Where on the ladder do you feel you personally stand at the present time?" [ 10 ] best possible life [ 9 ] [ 8 ] [ 7 ] [ 6 ] [ 5 ] [ 4 ] [ 3 ] [ 2 ] [ 1 ] [ 0 ] worst possible life Preceded by 1) open questions about what the respondent imagines as the best possible life and the worst possible life. 2) ratings on the ladder of one's life five years ago and where on the ladder one expects to stand five years from now. Name: Cantril's self anchoring ladder rating of life (original)
C-BW/c/sq/l/11/b Selfreport on single question: "Above you see a numbered ladder. Consider the top of the ladder as the best possible life and the bottom of the ladder as the worst possible life. A Please place an X where you feel you are now. B Place an Y at the point where you were five years ago. C Please place a Z at the point that you feel you will be at five years from now. [ 10 ] best possible life [ 9 ] [ 8 ] [ 7 ] [ 6 ] [ 5 ] [ 4 ] [ 3 ] [ 2 ] [ 1 ] [ 0 ] worst possible life Question A is the case question. Name: Cantril's self anchoring ladder rating of life (modified version)
C-RA/h/sq/v/7/a Selfreport on single question: Sofar, I have achieved the most important things I want in life. 1 strongly disagree 2 disagree 3 slightly disagree 4 neither agree, nor disagree 5 slightly agree 6 agree 7 strongly agree Item in Diener's Satisfaction With Life Scale (SWLS)
http://worlddatabaseofhappiness.eur.nl/hap_cor/top_sub.php?code=S1 (130 of 147)9-9-2009 14:01:24

Findings on Happiness and SCHOOL
M-CO/?/?q/?/0/a Selfreport on multiple questions: Questions indicated both happiness and a sense of contentment and well-being (Full questions not reported) Summation: not reported Name: `Happiness subtest' of Washburn's `Social Adjustment Scale'.
M-PL/h/sq/v/5/b Selfreport on single question: following enumeration of lifegoals in six areas, the last of which was 'joy in living' " How successful have you been in pursuit of that goal.....?" (joy in living) 5 had excellent fortune in this respect 4 3 2 1 found little satisfaction in this area
O-DT/u/sq/v/7/a Selfreport on single question: How do you feel about your life as a whole.....? 7 delighted 6 pleased 5 mostly satisfied 4 mixed 3 mostly dissatisfied 2 unhappy 1 terrible Name: Andrews & Withey's `Delighted-Terrible Scale' (original version)
O-DT/u/sqt/v/7/a Selfreport on single question, asked twice in interview: How do you feel about your life as a whole......? 7 delighted 6 pleased 5 mostly satisfied 4 mixed 3 mostly dissatisfied 2 unhappy 1 terrible Summation: arithmetic mean Name: Andrews & Withey's "Delighted-Terrible Scale" (original version) Also known as Lehman's 'Global lifesatisfaction'
O-H?/?/sq/f/7/a Selfreport on single question: Lead item not reported Rated on a 7-step pictorial faces scale, presented on a card (pictures not shown here) 7 smiling face, very happy 6 5 4 3 2 1 frowning face, very unhappy
http://worlddatabaseofhappiness.eur.nl/hap_cor/top_sub.php?code=S1 (131 of 147)9-9-2009 14:01:24

Findings on Happiness and SCHOOL
O-HL/c/sq/v/3/aa Selfreport on single question: Taken all together, how would you say things are these days? Would you say that you are....? 3 very happy 2 pretty happy 1 not too happy
O-HL/c/sq/v/4/b Selfreport on single question: Is your life at this moment ....? 4 very happy 3 fairly happy 2 fairly unhappy 1 very unhappy
O-HL/c/sq/v/4/n Selfreport on single question: In general, I am happy with how things are in my life right now 1 disagree strongly 2 disagree 3 agree 4 strongly agree
O-HL/c/sq/v/5/h Selfreport on single question 'How happy are you now?' 5 very happy 4 happy 3 neither happy nor unhappy 2 unhappy 1 very unhappy Original text in Danish: 'Hvor lykkelig er du for tiden?' 5 meget lykkelig 4 lykkelig 3 hverken eller 2 ullykklig 1 meget ullykkelig
O-HL/c/sq/v/7/a Selfreport on single question: In general, how happy would you say you are these days.....? 7 extremely happy 6 very happy 5 pretty happy 4 not too happy 3 a bit unhappy 2 pretty unhappy 1 very unhappy
http://worlddatabaseofhappiness.eur.nl/hap_cor/top_sub.php?code=S1 (132 of 147)9-9-2009 14:01:24

Findings on Happiness and SCHOOL
O-HL/g/sq/n/9/a Selfreport on single question: Generally, how happy are you.....? 1 not at all 2 3 4 5 6 7 8 9 completely (Originally presented on a horizontal line scale)
O-HL/g/sq/n/9/b Selfreport on single question: "How happy would you say your life is in general.....?" 1 very unhappy 2 3 4 neither happy 5 nor 6 unhappy 7 8 9 very happy
O-HL/u/sq/v/3/c Selfreport on single question: "Would you say:......?" 1 You are unhappy? 2 You are reasonably happy? 3 You are happy ?
O-HL/u/sq/v/4/a Selfreport on single question: Taking all things together, would you say you are.....? 4 very happy 3 quite happy 2 not very happy 1 not at all happy.
O-HL/u/sq/v/4/b Selfreport on single question: On the whole, how happy would you say you are.....? 4 very happy 3 fairly happy 2 not very happy 1 very unhappy
http://worlddatabaseofhappiness.eur.nl/hap_cor/top_sub.php?code=S1 (133 of 147)9-9-2009 14:01:24

Findings on Happiness and SCHOOL
O-HP/g/mq/v/5/a Selfreport on 6 questions: " Describe the kind of person you are. Please read each sentence, then mark how often it is true for you" 1 I feel like smiling 2 I generally feel in good spirits 3 I feel happy 4 I am very satisfied with life 5 I find a good deal of happiness in life 6 I feel sad Response options: 5 almost always true 4 often true 3 sometimes true 2 seldom true 1 never true Summation: average Possible range: 1 to 5
O-HP/u/sq/v/4/a Selfreport on single question: Do you consider yourself as a happy person......? 4 very happy 3 happy 2 neither happy nor unhappy 1 not too happy - don't know
O-HP/u/sq/v/5/a Selfreport on single question To what extend do you consider yourself a happy person....? 5 very happy 4 happy 3 neither happy nor unhappy 2 not very happy 1 unhappy
O-SLC/u/sq/v/7/a Selfreport on single question: The conditions of my life are excellent 1 strongly disagree 2 disagree 3 slightly disagree 4 neither agree, nor disagree 5 slightly agree 6 agree 7 strongly agree Item in Diener's Satisfaction With Life Scale (SWLS)
O-SLL/c/sq/v/5/d Selfreport on single question: How satisfied are you with the life you currently lead? 5 extraordinary satisfied 4 very satisfied 3 satisfied 2 fairly satisfied 1 not so satisfied
http://worlddatabaseofhappiness.eur.nl/hap_cor/top_sub.php?code=S1 (134 of 147)9-9-2009 14:01:24

Findings on Happiness and SCHOOL
O-SLL/u/sq/v/4/b Selfreport on single question: On the whole how satisfied are you with the life you lead? 4 very satisfied 3 fairly satisfied 2 not very satisfied 1 not at all satisfied - Don't know
O-SLu/?/sq/l/5/a Selfreport on single question: "..... satisfaction with life ......" (full lead item not reported) Rated on a wooden miniature ladder, handed to the respondent [ 5 ] very satisfied [ 4 ] [ 3 ] [ 2 ] [ 1 ] very dissatisfied
O-SLu/c/sq/n/10/b Selfreport on single question: All things considered, how satisfied or dissatisfied are you with your life these days? Please tell me on a scale of 1 to 10, where one means very dissatisfied and 10 means very satisfied 10 very satisfied 9 8 7 6 5 4 3 2 1 very dissatisfied
O-SLu/c/sq/v/5/e Selfreport on single question: 'How satisfied are you with your life now?' 5 very satisfied 2 satisfied 3 neither satisfied nor dissatisfied 2 dissatisfied 1 very dissatisfied Original text in Danish: 'Hvor tilfreds er du med dit liv for tiden?' 5 meget tilfreds 4 tilfreds 3 hverken tilfreds eller utilfreds 2 utilfreds 1 meget utilfreds
http://worlddatabaseofhappiness.eur.nl/hap_cor/top_sub.php?code=S1 (135 of 147)9-9-2009 14:01:24

Findings on Happiness and SCHOOL
O-SLu/g/sq/f/7/a Selfreport on single question: "...... satisfaction with life in general........" (Full question not reported.) Responses scored on pictorial scale consisting of seven smilies, expressing variations from very unhappy to very happy. 1 unhappy face 2 3 4 neutral face 5 6 7 unhappy face (Pictures not reproduced here.) Name: Kunin's `Faces Scale'.
O-SLu/u/sq/v/7/a Selfreport on single question: I am satisfied with my life. 1 strongly disagree 2 disagree 3 slightly disagree 4 neither agree, nor disagree 5 slightly agree 6 agree 7 strongly agree Item in Diener's Satisfaction With Life Scale (SWLS)
O-SLW/?/sq/n/7/a Selfreport on single question ..satisfaction with life as a whole.. (full item not reported) 7 very satisfied 6 5 4 just as satisfied as dissatisfied 3 2 1 very dissatisfied (numbering reversed)
O-SLW/c/sq/n/10/a Selfreport on single question: All things considered, how satisfied are you with your life as-a-whole these days? 1 dissatisfied 2 3 4 5 6 7 8 9 10 satisfied
http://worlddatabaseofhappiness.eur.nl/hap_cor/top_sub.php?code=S1 (136 of 147)9-9-2009 14:01:24

Findings on Happiness and SCHOOL
O-SLW/c/sq/n/10/aa Selfreport on single question: All things considered, how satisfied are you with your life as-a-whole now.....? 1 dissatisfied 2 3 4 5 6 7 8 9 10 satisfied
O-SLW/c/sq/n/11/ba Selfreport on single question; What do you think, how satisfied are you at this moment- all in all - with your life ?' 'If for instance you are totally satisfied with your life, please mark a '10'.If you are totally unsatisfied with your life, mark a '0'.If you are not completely unsatisfied nor totally satisfied range yourself somewhere between '1' and '9" 10 completely satisfied 9 8 7 6 5 4 3 2 1 0 completely dissatisfied
O-SLW/c/sq/n/11/d Selfreport on single question: Taking all things together, how satisfied are you with your life these days? Please answer with the help of this scale. For instance, when you are totally satisfied with your life, please tick '10'. When you are totally unsatisfied with your life, please tick '0'. You may use all values in between to indicate that you are neither totally satisfied nor totally unsatisfied." 10 totally satisfied 9 8 7 6 5 4 3 2 1 0 totally unsatisfied
O-SLW/c/sq/n/5/b Selfreport on single question: When you consider your life-as-a-whole, are you..........? 0 quite dissatisfied 1 2 3 4 very satisfied
http://worlddatabaseofhappiness.eur.nl/hap_cor/top_sub.php?code=S1 (137 of 147)9-9-2009 14:01:24

Findings on Happiness and SCHOOL
O-SLW/c/sq/v/4/g Selfreport on single question: How satisfied are you with your life as a whole these days? 4 quite satisfied 3 rather satisfied 2 rather unsatisfied 1 not at all satisfied - no answer - hard to say
O-SLW/c/sq/v/5/n Selfreport on single question Now taking everything into account, how satisfied or dissatisfied are you with your life these days? 5 very satisfied 4 satisfied 3 neither satisfied nor dissatisfied 2 dissatisfied 1 very dissatisfied - don't know - no answers Numerical scale reversed
O-SLW/u/sq/n/11/ca Selfreport on single question: Thinking about your own life and personal circumstances, how satisfied are you with your life as a whole? 1 very dissatisfied 2 3 4 5 neutral 6 7 8 9 10 very satisfied First item in Cummins' 'Personal Well-being Scale' (labels used until 2005)
O-SLW/u/sq/v/7/b Selfreport on single question : How do you feel about your life as a whole.....? 7 completely satisfied 6 very satisfied 5 satisfied 4 satisfied/dissatisfied 3 dissatisfied 2 very dissatisfied 1 completely dissatisfied
O-SQL/u/sq/v/4/a Selfreport on single question: All in all, how do you judge your quality of life? 4 very satisfactory 3 sufficiently satisfactory 2 not too satisfactory 1 unsatisfactory - don't know
http://worlddatabaseofhappiness.eur.nl/hap_cor/top_sub.php?code=S1 (138 of 147)9-9-2009 14:01:24

Findings on Happiness and SCHOOL
O-Sum/u/mq/v/7/a Selfreport on four questions: Using the 1-7 scale below, indicate your agreement with each of the items by placing the appropriate number on the line preceding that item. Please be open and honest in your responding. A In most ways my life is close to ideal B The conditions of my life are excellent C I am satisfied with my life D So far, I have gotten the important things I want in life Answers rated: 7 strongly agree 6 agree 5 slightly agree 4 neither agree nor disagree 3 slightly disagree 2 disagree 1 strongly disagree Computation: A+B+C+D divided by 4 Name: Shortened Diener's Satisfaction with Life Scale (SWLS) (In the original scale item 5 reads: 'If I could live my life over, I would change nothing'. This item is left out in this selection because a positive answer to this question does not necessarily mean that the respondent doesn't like the life he/she actually lives.)
O-V/u/sq/v/7/a Selfreport on single question: In most ways my life is close to ideal 1 strongly disagree 2 disagree 3 slightly disagree 4 neither agree, nor disagree 5 slightly agree 6 agree 7 strongly agree Item in Diener's Satisfaction With Life Scale (SWLS)
http://worlddatabaseofhappiness.eur.nl/hap_cor/top_sub.php?code=S1 (139 of 147)9-9-2009 14:01:24

Findings on Happiness and SCHOOL
Appendix 2: Statistics used
Symbol Explanation
AoV ANALYSIS of VARIANCE (ANOVA) Type: statistical procedure Measurement level: Correlate(s): nominal, Happiness: metric. In an ANOVA, the total happiness variability, expressed as the sum of squares, is split into two or more parts, each of which is assigned to a source of variability. At least one of those sources is the variability of the correlate, in case there is only one, and always one other is the residual variability, which includes all unspecified influences on the happiness variable. Each sum of squares has its own number of degrees of freedom (df), which sum up to Ne -1 for the total variability. If a sum of squares (SS) is divided by its own number of df, a mean square (MS) is obtained. The ratio of two correctly selected mean squares has an F-distribution under the hypothesis that the corresponding association has a zero-value. NOTE: A significantly high F-value only indicates that, in case of a single correlate, the largest of the c mean values is systematically larger than the smallest one. Conclusions about the other pairs of means require the application of a Multiple Comparisons Procedure (see e.g. BONFERRONI's MULTIPLE COMPARISON TEST, DUNCAN's MULTIPLE RANGE TEST or STUDENT-NEWMAN-KEULS)
B REGRESSION COEFFICIENT (non-standardized) by LEAST SQUARES (OLS) Type: test statistic Measurement level: Correlate: metric, Happiness: metric Theoretical range: unlimited Meaning: B > 0 A higher correlate level corresponds with, on an average, higher happiness rating. B < 0 A higher correlate level corresponds with, on an average, lower happiness rating. B = 0 Not any correlation with the relevant correlate.
Beta (ß) STANDARDIZED REGRESSION COEFFICIENT by LEAST SQUARES (OLS) Type: test statistic. Measurement level: Correlates: all metric, Happinessl: metric. Range: [-1 ; +1] Meaning: beta > 0 « a higher correlate level corresponds with, on an average, higher happiness rating. beta < 0 « a higher correlate level corresponds with, on an average, lower happiness rating. beta = 0 « no correlation. beta = + 1 or -1 « perfect correlation. Remark: Mean of observations is subtracted from all observations if standardized.
BMCT BONFERRONI's MULTIPLE COMPARISON TEST Type: statistical procedure Measurement level: Correlate: nominal, Happiness: metric Meaning: if the correlate is measured at c levels, the c mean happiness values can be ranked from low to high. A multiple comparison procedure judges for each of the ½c(c-1) pairs whether or not they differ significantly. A convenient way to represent the results is by ranking the c means and by underlining them in such a way that means which have a common underlining do NOT differ significantly. When added by us, this test is performed at the 95% confidence level for all the differences together.
http://worlddatabaseofhappiness.eur.nl/hap_cor/top_sub.php?code=S1 (140 of 147)9-9-2009 14:01:24

Findings on Happiness and SCHOOL
Chi² CHI-SQUARE Type: test statistic Range: [0; Ne*(min(c,r)-1)], where c and r are the number of columns and rows respectively in a cross tabulation of Ne sample elements. Meaning: Chi² <= (c-1) * (r-1) means: no association Chi² >> (c-1) * (r-1) means: strong association
D% DIFFERENCE in PERCENTAGES Type: descriptive statistic only. Measurement level: Correlate level: dichotomous, but nominal or ordinal theoretically possible as well. Happiness level: dichotomous Range: [-100; +100] Meaning: the difference of the percentages happy people at two correlate levels.
DM DIFFERENCE of MEANS Type: descriptive statistic only. Measurement level: Correlate: dichotomous, Happiness: metric Range: depending on the happiness rating scale of the author; range symmetric about zero. Meaning: the difference of the mean happiness, as measured on the author's rating scale, between the two correlate levels.
DMt DIFFERENCE of MEANS AFTER TRANSFORMATION Type: descriptive statistic only. Measurement level: Correlate: dichotomous, Happiness: metric Theoretical range: [-10; +10] Meaning: the difference of the mean happiness (happiness measured at a 0-10 rating scale) between the two correlate levels.
G GOODMAN & Kruskal's GAMMA Type: test statistic Measurement level: Correlate: ordinal, Happinessl: ordinal Range: [-1; +1] Meaning: G = 0 « no rank correlation G = +1 « strongest possible rank correlation, where high correlate values correspond with high happiness ratings. G = -1 « strongest possible rank correlation, where high correlate values correspond with low happiness ratings.
OR ODDS RATIO Type: descriptive statistic only. Measurement level: Correlate: dichotomous, Happiness level: dichotomous Range: nonnegative unlimited Meaning: OR = 1 « no association at all; OR = 0 or infinite « at least one level of the correlate allows an error-free prediction of the happiness.
http://worlddatabaseofhappiness.eur.nl/hap_cor/top_sub.php?code=S1 (141 of 147)9-9-2009 14:01:24

Findings on Happiness and SCHOOL
r PRODUCT-MOMENT CORRELATION COEFFICIENT (Also "Pearson's correlation coefficient' or simply 'correlation coefficient') Type: test statistic. Measurement level: Correlate: metric, Happiness: metric Range: [-1; +1] Meaning: r = 0 « no correlation , r = 1 « perfect correlation, where high correlate values correspond with high happiness values, and r = -1 « perfect correlation, where high correlate values correspond with low happiness values.
rs SPEARMAN'S RANK CORRELATION COEFFICIENT Type: test statistic Measurement level: Correlate: ordinal, Happiness: ordinal. Range: [-1; +1] Meaning: rs = 0 « no rank correlation rs = 1 « perfect rank correlation, where high correlate values are associated with high happiness ratings rs =-1 « perfect rank correlation, where high correlate values are associated with low happiness ratings
SNR Statistic Not Reported
t. t-STATISTIC (Student's t-statistic) Type: symmetric standard test statistic. One parameter: n (= number of degrees of freedom (df) ; range df: [1; + infinite) Range for t: unlimited Meaning : the test statistic is the ratio of a difference between a statistic and its expected value under the null hypothesis and its (estimated) standard error with n degrees of freedom. The critical values of its probability distribution are tabulated extensively in almost any textbook on Statistics.
tau GOODMAN & Kruskal's TAU Type: descriptive statistic only. Measurement level: Correlate: nominal, Happiness: ordinal Range: [0; +1] Meaning: tau = 0 « knowledge of the correlate value does not improve the prediction quality of the happiness rating. tau = 1 « knowledge of the correlate value enables a perfect (error-free) prediction of the happiness rating.
tb KENDALL'S RANK CORRELATION COEFFICIENT TAU-B Type: test statistic Measurement level: Correlate: ordinal, Happiness: ordinal Range: [-1; +1] Meaning: tb = 0 « no rank correlation tb = 1 « perfect rank correlation, where high values of the correlate correspond with high happiness ratings. tb = -1 « perfect rank correlation, where high values of the correlate correspond with low happiness ratings.
http://worlddatabaseofhappiness.eur.nl/hap_cor/top_sub.php?code=S1 (142 of 147)9-9-2009 14:01:24

Findings on Happiness and SCHOOL
V CRAMéR's V Type: test statistic Measurement level: Correlate: nominal, Happiness: ordinal Range: [0; 1] Meaning: V = 0 « no association V = 1 « strongest possible association
Appendix 3: About the World Database of Happiness
Structure of the collections
The World Database of Happiness is an ongoing register of scientific research on the subjective enjoyment of life. It brings together findings that are scattered throughout many studies and provides a basis for synthetic work.
World literature on Happiness
Selection on subject
Bibliography and Directory
Selection of empirical studies Selection on valid measurement: Item Bank
Abstracting and classification of findings
How happy people are, distributional findings Happiness in Nations , Happiness in Publics
What goes together with happiness Correlational Findings
Listing of comparable findings in Nations
States of Nations , Trends in Nations
Size of the collections 1226 Happiness measures (Item Bank) 4258 Nations surveys in 206 Nations 149 Distinguished publics in 1199 studies 12032 Correlational findings in 1196 studies
Appendix 4 Further Findings in the World Database of Happiness
Main Subjects Subject Description Number of Studies
A1 ACTIVITY: LEVEL (how much one does) 58
A2 ACTIVITY: PATTERN (what one does) 32
A3 AFFECTIVE LIFE 48
A4 AGE 400
http://worlddatabaseofhappiness.eur.nl/hap_cor/top_sub.php?code=S1 (143 of 147)9-9-2009 14:01:24

Findings on Happiness and SCHOOL
A5 AGGRESSION 12
A6 ANOMY 32
A7 APPEARANCE (good looks) 15
A8 ATTITUDES 6
A9 AUTHORITARIANISM 4
B1 BIRTH CONTROL 1
B2 BIRTH HISTORY (own birth) 201
B3 BODY 77
C1 CHILDREN 1
C2 CHILDREN: WANT FOR (Parental aspirations) 6
C3 CHILDREN: HAVING (parental status) 195
C4 CHILDREN: CHARACTERISTICS OF ONE'S CHILDREN 25
C5 CHILDREN: RELATION WITH ONE'S CHILDREN 8
C6 CHILDREN: REARING OF ONE'S CHILDREN (parental behavior) 26
C7 COMMUNAL LIVING 9
C8 CONCERNS 18
C9 COPING 43
C10 CREATIVENESS 6
C11 CULTURE (Arts and Sciences) 8
D1 DAILY JOYS & HASSLES 5
E1 EDUCATION 302
E2 EMPLOYMENT 363
E3 ETHNICITY 98
E4 EXPRESSIVE BEHAVIOR 12
F1 FAMILY OF ORIGIN (earlier family for adults, current for young) 236
F2 FAMILY OF PROCREATION 58
F3 FAMILY OF RELATIVES 157
F4 FARMING 25
F5 FREEDOM 32
F6 FRIENDSHIP 152
G1 GENDER 370
G2 GRIEF 1
H1 HABITS 1
H2 HANDICAP 25
H3 HAPPINESS: VIEWS ON HAPPINESS 49
H4 HAPPINESS: DISPERSION OF HAPPINESS 10
H5 HAPPINESS: CAREER 191
H6 HAPPINESS: CORRESPONDENCE OF DIFFERENT MEASURES 310
H7 HAPPINESS OF OTHERS 0
H8 HAPPINESS: REPUTATION OF HAPPINESS 19
H9 HEALTH-BEHAVIOR 25
H10 HELPING 5
H11 HOPE 8
H12 HOUSEHOLD: COMPOSITION 137
H13 HOUSEHOLD: WORK 32
H14 HOUSING 106
I1 INCOME 552
I2 INSTITUTIONAL LIVING 43
http://worlddatabaseofhappiness.eur.nl/hap_cor/top_sub.php?code=S1 (144 of 147)9-9-2009 14:01:24

Findings on Happiness and SCHOOL
I3 INTELLIGENCE 71
I4 INTERESTS 8
I5 INTERVIEW 73
I6 INTIMACY 103
L1 LANGUAGE 2
L2 LEADERSHIP 8
L3 LEISURE 206
L4 LIFE APPRAISALS: OTHER THAN HAPPINESS 368
L5 LIFE CHANGE 35
L6 LIFE EVENTS 86
L7 LIFE GOALS 75
L8 LIFE HISTORY 2
L9 LIFE STYLE 22
L10 LOCAL ENVIRONMENT 374
L11 LOTTERY 8
L12 LOVE-LIFE 31
M1 MARRIAGE: MARITAL STATUS CAREER 64
M2 MARRIAGE: CURRENT MARITAL STATUS 543
M3 MARRIAGE: RELATIONSHIP 115
M4 MARRIAGE: PARTNER 46
M5 MEANING 23
M6 MEDICAL TREATMENT 81
M7 MENTAL HEALTH 218
M8 MIGRATION: TO OTHER COUNTRY 29
M9 MIGRATION: MOVING WITHIN COUNTRY (residential mobility) 17
M10 MIGRATION: MIGRANT WORK 3
M11 MILITARY LIFE 7
M12 MODERNITY 6
M13 MOOD 246
M14 MOTIVATION 7
N1 NATION: NATIONALITY 29
N2 NATION: ERA (temporal period) 41
N3 NATION: NATIONAL CHARACTER (modal personality) 29
N4 NATION: CONDITION IN ONE'S NATION 430
N5 NATION: POSITION OF ONE'S NATION 1
N6 NATION: ATTITUDES TO ONES NATION 152
N7 NATION: LIVABILITY OF ONE'S NATION 17
N8 NATION i: ATTITUDES IN 1
N9 REGION IN NATION 59
N10 NUTRITION 23
N21 ERA 0
O1 OCCUPATION 178
O2 ORGAN TRANSPLANTATION 17
P1 PERSONALITY: HISTORY 48
P2 PERSONALITY: CHANGE 10
P3 PERSONALITY: CURRENT ORGANIZATION 7
P4 PERSONALITY: CURRENT TRAITS 462
P5 PERSONALITY: LATER 23
http://worlddatabaseofhappiness.eur.nl/hap_cor/top_sub.php?code=S1 (145 of 147)9-9-2009 14:01:24

Findings on Happiness and SCHOOL
P6 PHYSICAL HEALTH 427
P7 PLANNING 11
P8 POLITICAL BEHAVIOUR 231
P9 POPULARITY 26
P10 POSSESSIONS 60
P11 PRISON 1
P12 PROBLEMS 25
P13 PSYCHO-SOMATIC COMPLAINTS 62
P14 PETS 3
R1 RELIGION 251
R2 RESOURCES 9
R3 RETIREMENT 89
R4 ROLES 23
S1 SCHOOL 129
S2 SELF-IMAGE 237
S3 SEX-LIFE 61
S4 SLEEP 16
S5 SOCIAL MOBILITY 17
S6 SOCIAL PARTICIPATION: PERSONAL CONTACTS 69
S7 SOCIAL PARTICIPATION : VOLUNTARY ASSOCIATIONS 131
S8 SOCIAL PARTICIPATION: TOTAL (personal + associations) 34
S9 SOCIO-ECONOMIC STATUS 154
S10 SOCIAL SUPPORT: RECEIVED 62
S11 SOCIAL SUPPORT: PROVIDED 6
S12 SPORTS 38
S13 STIMULANTS 49
S14 SUICIDE 8
S15 SUMMED DETERMINANTS 92
T1 TIME 53
T2 THERAPY 38
T3 TOLERANCE 37
V1 VALUES: CAREER 8
V2 VALUES: CURRENT PREFERENCES (own) 73
V3 VALUES: CLIMATE (current values in environment) 7
V4 VALUES: SIMILARITY (current fit with others) 12
V5 VICTIM 14
W1 WAR 5
W2 WISDOM 2
W3 WORK: CAREER 2
W4 WORK: CONDITIONS 68
W5 WORK: ATTITUDES 347
W6 WORK: PERFORMANCE (current) 29
W7 WORRIES 31
XX UNCLASSIFIED 25
Appendix 5: Related Subjects
http://worlddatabaseofhappiness.eur.nl/hap_cor/top_sub.php?code=S1 (146 of 147)9-9-2009 14:01:24
Findings on Happiness and SCHOOL
Subject Related Subject(s)
S1 SCHOOL E1 EDUCATION
S1.2.1.1 . involved in schooling or not E2.2 Current employment status
S1.2.1.2 . absenteeism W6.2.1.1 . absenteeism at work
S1.2.1.3 . extra-curricular activity L3.3.1 Leisure activity level
S1.2.2 School-success E1.2.1 Level of school-education
S1.2.2 School-success I3 INTELLIGENCE
S1.2.3 Involvement in school-work T1.4 Current time-usage
S1.3.1.1 . socio-economic level of school S9 SOCIO-ECONOMIC STATUS
S1.3.1.2 . ethnic homogeneity of school E3.6 Ethnic diversity in environment
S1.4 Attitudes to school L10.4.2.5 . satisfaction with local schools
S1.4.1 Perceived usefulness of schooling E1.4 Attitudes to one's education
S1.4.2 Perceived pressure of school-work S1.2.3 Involvement in school-work
S1.4.3 Satisfaction with own school-performance S2.5.2 Satisfaction with own accomplishments
S1.4.4 Satisfaction with school-facilities L10.4.2.5 . satisfaction with local schools
A report of the World Database of Happiness, Correlational Findings
http://worlddatabaseofhappiness.eur.nl/hap_cor/top_sub.php?code=S1 (147 of 147)9-9-2009 14:01:24