finding a secure \" completion time \" for a construction project: a test experiment
TRANSCRIPT
Proceedings of the International Conference on Civil, Structural and Transportation EngineeringOttawa, Ontario, Canada, May 4-5 2015 Paper No. 298
Finding a Secure “Completion Time” for a Construction Project: A Test Experiment
Mohammad (Mani) Poshdar, Vicente A. GonzálezThe University of Auckland, Department of Civil and Environmental Engineering
Private Bag 92019, Auckland 1142, New [email protected]; [email protected]
Abstract - Construction schedules are extensively affected by occurred variability at “activity level”. Among the strategies that deal with the detrimental impacts of variability “use of buffers” is a common practice. However, the buffer allocation approaches in construction industry have been informal and often inconsistent. This study reports a test experiment that has applied a new structured probabilistic-based buffer allocation method. The new method focuses on finding the best compromise between an excessive buffer size scenario, which results in undesirable waste, and an insufficient-buffer scenario, which increases risk of time overrun in the project. The results were compared to the outputs from a simulation experiment on the same project. The comparison demonstrated the capability of the proposed method to incorporate the impact of variability at activity level on the probabilistic distribution of the overall variability at “project level”. Also, while the accuracy provided by the probabilistic-based method was almost identical to the results from the computer simulation, the new method outperformed simulation in terms of the required calculation time.
Keywords: Buffers, Scheduling, Network analysis, Project variability.
1. IntroductionVariability represents one of the major problems in construction. It prevents systems and/or
their environment to be expressed deterministically. As a result, deterministic assumptions in development of a construction schedule are deemed to fail. In such an uncertain environment an optimal schedule can be provided through a combination of proactive/reactive strategies (Van de Vonder et al., 2006). Buffers have been a common choice to be used as a part of the obtained proactive strategies. They can isolate a production process from its environment as well as its depending processes (Hopp and Spearman, 2008). Buffers have been implemented in the form of scheduling excess time (time buffer), extra work capacity (capacity buffer), or extra material stockpile (inventory buffer) (González et al. 2011). While they can take different forms, buffers often are represented by time added to the project duration (Ballard and Howell 1995).
Traditionally, the construction industry employs informal and often inconsistent approaches to allocate buffers (González et al., 2013). Park and Peña-Mora (2004) mention the lack of efficient buffer sizing methods as one of the major causes for poor scheduling performance of projects. Normally, at buffering stage a sequence of trial and error might be undertaken to keep the expected “completion time” of the project within the acceptable range (Herroelen, 2014).
The existing buffer sizing methods can be categorized into three major groups: 1. Analytical methods; numerous heuristic procedures have been suggested in this category,
among them “Critical Chain Project Management” (CCPM) by Goldratt (1997) has received a wide recognition.
2. Simulation based methods; they permits to measure the performance of the system, and develop the scheduling models within the network based on simulating the experiments. (Martinez and Ioannou, 1997). Evolutionary and genetic algorithms are among the methods of
298-1
this group that have been employed to find the optimum buffer allocation in a construction project.
3. Combinatory methods; that rely on both analytical and simulation techniques at the same time. Reliability and stability buffering approach suggested by Lee et al. (2006) is a well-known method in this group.
In most cases, however, the methods are claimed to be too theoretical or too complex to be implemented on construction sites (González et al., 2013). The calculated buffer size may either overprotect the project completion time or fail to prevent the propagation of disruptions because of the variability associated with the performance of the activities (Schatteman et al., 2008).
This research examines the capabilities of a new structured probabilistic-based method developed to support decision making about the proper size of buffer. The method focuses on the projects with “road runner” management approach. In this type of projects the activities will not wait till their planned start time. Instead, they start as soon as their predecessor(s) finish (Demeulemeester and Herroelen, 2002). CCPM guidelines suggest to place the “project buffer” at the end of the planned schedule in such cases. The new proposed probabilistic method adheres to this suggestion for buffer placement, while it uses the immunity level provided against the variations for the buffer sizing purpose. Ben-Haim and Laufer (1998) have termed the provided immunity level as “reliability”. Misra (1992) suggests that “reliability” can be quantified by measuring the probability of a successful event. Accordingly, the proposed method plots the gained “reliability” in the system against the used size of buffer as well as the associated “completion time”. The plotted diagram can aid to select the best compromise within a feasible range of buffer sizes with the aim of providing a certain level of protection in the planned schedule. In this paper, the outcomes from the implementing of the suggested approach have been examined through a set of computational experiments on the collected records from a road construction project.
2. Research Objective and MethodologyUse of simulation is almost universally accepted as the most effective solution for the
scheduling purposes because of its modeling versatility and power (Martinez and Ioannou, 1997). This study tests a new structured analytic buffer allocation technique with the aim of identifying its potential advantages and disadvantages compare to the simulation experiment.
The research has been conducted in three phases:1. The records from a bridge construction project were collected and adopted as the
basic material for the computational experiment. The collected data included sixteen activities of the project which involved a range from lot clearing to installation of precast concrete members.
2. The computational experiment was undertaken that analysed the project and identified the proper buffer size to be inserted into the schedule using the new proposed method. In addition, a simulation experiment was conducted to identify the versatile range of the potential outcomes.
3. The results from the two aforementioned computational experiments were compared and the accuracy and efficiency of the proposed buffering method was evaluated.
3. Research AssumptionsThe following assumptions were made developing the new proposed method:
298-2
1. The activities start as soon as their last predecessor is finished. 2. The probable variability in a construction system can be consistently modeled by means of
Probability Distribution Functions (PDFs). 3. Resource availability issue is possible to be translated into tasks duration uncertainty. 4. The duration of activities along the network is independent to each other.
4. The New Structured Buffer Sizing Method A new buffer sizing method has been suggested which generates a range of feasible buffer
sizes, and assesses the improvement in the level of reliability provided by each additional unit of buffer to the system. The “analytical statistics” is applied to model the random fluctuations in the performance of individual activities. The impacts of the variability at the activity level on the performance of the whole network of activities, measured by time, have been progressively calculated. The final calculation results give the overall project variability model which can be presented in the form of a comparative graph. Decision makers can use the graph to find the best compromise for their particular project. The method comprises of five steps which include: 1. Creation of the baseline schedule; 2. Deterministic calculation of the expected completion time; 3. Modeling variability at “activity level”; 4. Determination of the variability model at “project level”; 5. Creating a comparative graph that supports the final decision making process.
These five steps will be discussed in detail through an undertaken test experiment.
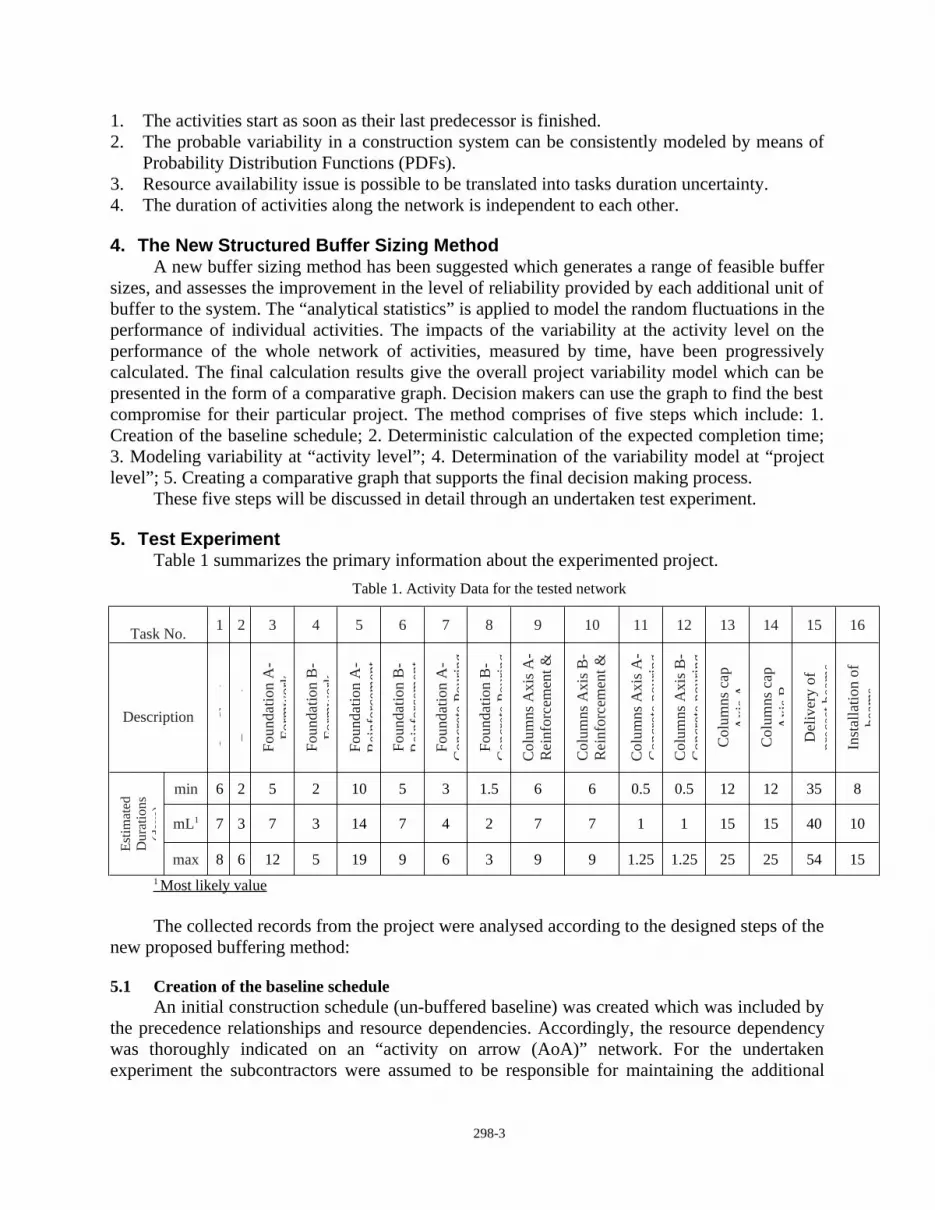
5. Test Experiment Table 1 summarizes the primary information about the experimented project.
Table 1. Activity Data for the tested network
Task No. 1 2 3 4 5 6 7 8 9 10 11 12 13 14 15 16
Description
Lot C
lear
ing
Exca
vatio
nFo
unda
tion
A-
Form
wor
k
Foun
datio
n B
- Fo
rmw
ork
Foun
datio
n A
- R
einf
orce
men
t
Foun
datio
n B
- R
einf
orce
men
t
Foun
datio
n A
- C
oncr
ete
Pour
ing
Foun
datio
n B
- C
oncr
ete
Pour
ing
Col
umns
Axi
s A-
Rei
nfor
cem
ent &
Fr
amew
ork
Col
umns
Axi
s B-
Rei
nfor
cem
ent &
Fr
amew
ork
Col
umns
Axi
s A-
Con
cret
e po
urin
g
Col
umns
Axi
s B-
Con
cret
e po
urin
g
Col
umns
cap
A
xis A
Col
umns
cap
A
xis B
Del
iver
y of
pr
ecas
t bea
ms
Inst
alla
tion
of
beam
s
Estim
ated
D
urat
ions
(d
ays)
min 6 2 5 2 10 5 3 1.5 6 6 0.5 0.5 12 12 35 8
mL1 7 3 7 3 14 7 4 2 7 7 1 1 15 15 40 10
max 8 6 12 5 19 9 6 3 9 9 1.25 1.25 25 25 54 151 Most likely value
The collected records from the project were analysed according to the designed steps of the new proposed buffering method:
5.1 Creation of the baseline schedule An initial construction schedule (un-buffered baseline) was created which was included by
the precedence relationships and resource dependencies. Accordingly, the resource dependency was thoroughly indicated on an “activity on arrow (AoA)” network. For the undertaken experiment the subcontractors were assumed to be responsible for maintaining the additional
298-3
resource capacity in case of necessity to keep their commitments about the work durations. Hence, the activities were supposed to be protected by proper capacity buffers. Therefore in this study, no uncertainty was associated with the precedence relationships in the project network.
5.2 Deterministic calculation of the expected completion time The expected completion time for each activity was deterministically calculated based on
the estimated completion time for its predecessors plus the estimated duration for the activity itself. Use of median [suggested by Goldratt (1997)], or mean [suggested by (Demeulemeester and Herroelen, 2002)] values are suggested to represent the duration of the activities. This study used the mean (most likely) value for this purpose (the second row in Table 1). According to the calculations on the designed network of activities (see Fig. 1) the completion time of project was expected to be at day-68.
5.3 Modeling the variability at “activity level” The stochastic nature of variability at activity level was captured utilizing a probabilistic
mathematical model. Use of Probability Distribution Functions (PDFs) is a common choice for this purpose that allows for the “smoothing out” the irregularities in data, and helps to generate values from an observed range (Law, 2007). In construction, a divergent set of PDFs have been suggested to represent the potential variability levels. Beta, Burr, Triangular, Normal, Lognormal, Gamma, Erlang, Johnson, and Extreme value are some prominent suggestions in this regard (Poshdar et al., 2014). The variability models at activity level were created based on the information provided by the project experts (Table 1). Given the expected range of variability, Beta PDF was considered as a reasonable choice.
5.4 Determination of the variability model at “project level”
The accumulation of the identified PDFs at the “activity level” can provide the variability model at the “project level”. In probability theory, the sum of two PDFs, which represent independent random variables, is calculated through “convolution” (Feller, 2008). An “approximation analytic approach” based on the proposed method by Dodin (1985) was adopted to combine the variability models identified at “activity level”. For this purpose two main stages were undertaken:
1. Discretizing the identified variability models: The continuous models were approximated with discrete histograms. As the time breakdown scale in the designed project baseline schedule was decided to be one “working day”, the models were discretized using the same scale. The “equal distance” method was applied to divide the estimated range for duration of the activity into intervals with the length of a working day. An additional round of discretization with a smaller size of intervals (1/1000 of its original size) helped to minimize the potential error in the approximated probabilities for each interval of the histograms.
2. Calculation of the overall variability distribution: Each activity on the project network was associated with three random variables: First, the “time performance” of the individual activity that is characterized by a PDF as per the descriptions in section 5.3.; second, the activity “start time” which is governed by the “completion time” of its predecessor(s); third, the activity “completion time” which is dependent to the aforementioned variables.
Accordingly, a “cumulative probabilistic index” (CPI) was defined to represent the probability distributions of the two latter variables. The CPIs reflected the “accumulated likely variability” through the network, starting from the node 0 to the intended point on the network.
298-4
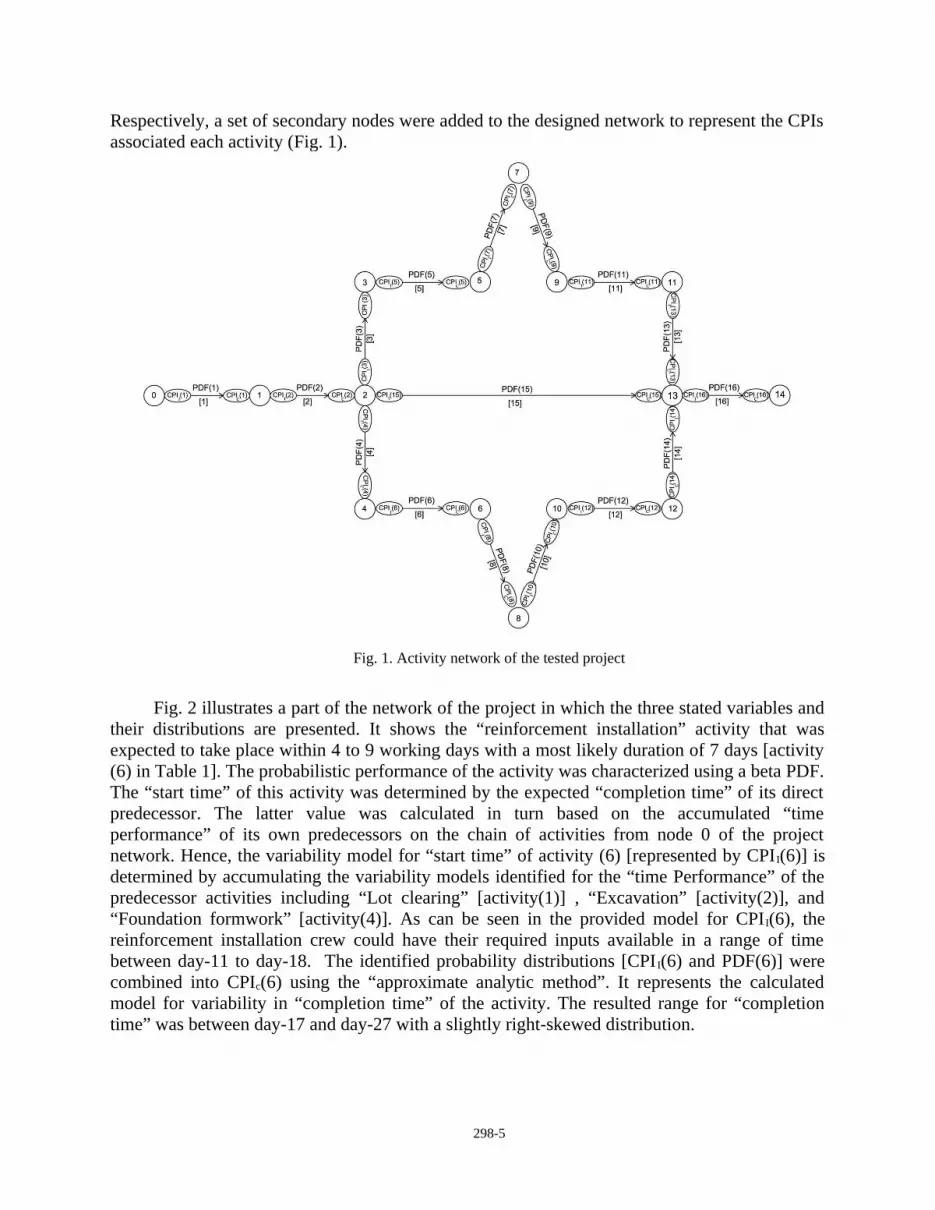
Respectively, a set of secondary nodes were added to the designed network to represent the CPIs associated each activity (Fig. 1).
Fig. 1. Activity network of the tested project
Fig. 2 illustrates a part of the network of the project in which the three stated variables and
their distributions are presented. It shows the “reinforcement installation” activity that was expected to take place within 4 to 9 working days with a most likely duration of 7 days [activity (6) in Table 1]. The probabilistic performance of the activity was characterized using a beta PDF. The “start time” of this activity was determined by the expected “completion time” of its direct predecessor. The latter value was calculated in turn based on the accumulated “time performance” of its own predecessors on the chain of activities from node 0 of the project network. Hence, the variability model for “start time” of activity (6) [represented by CPII(6)] is determined by accumulating the variability models identified for the “time Performance” of the predecessor activities including “Lot clearing” [activity(1)] , “Excavation” [activity(2)], and “Foundation formwork” [activity(4)]. As can be seen in the provided model for CPII(6), the reinforcement installation crew could have their required inputs available in a range of time between day-11 to day-18. The identified probability distributions [CPI I(6) and PDF(6)] were combined into CPIc(6) using the “approximate analytic method”. It represents the calculated model for variability in “completion time” of the activity. The resulted range for “completion time” was between day-17 and day-27 with a slightly right-skewed distribution.
298-5
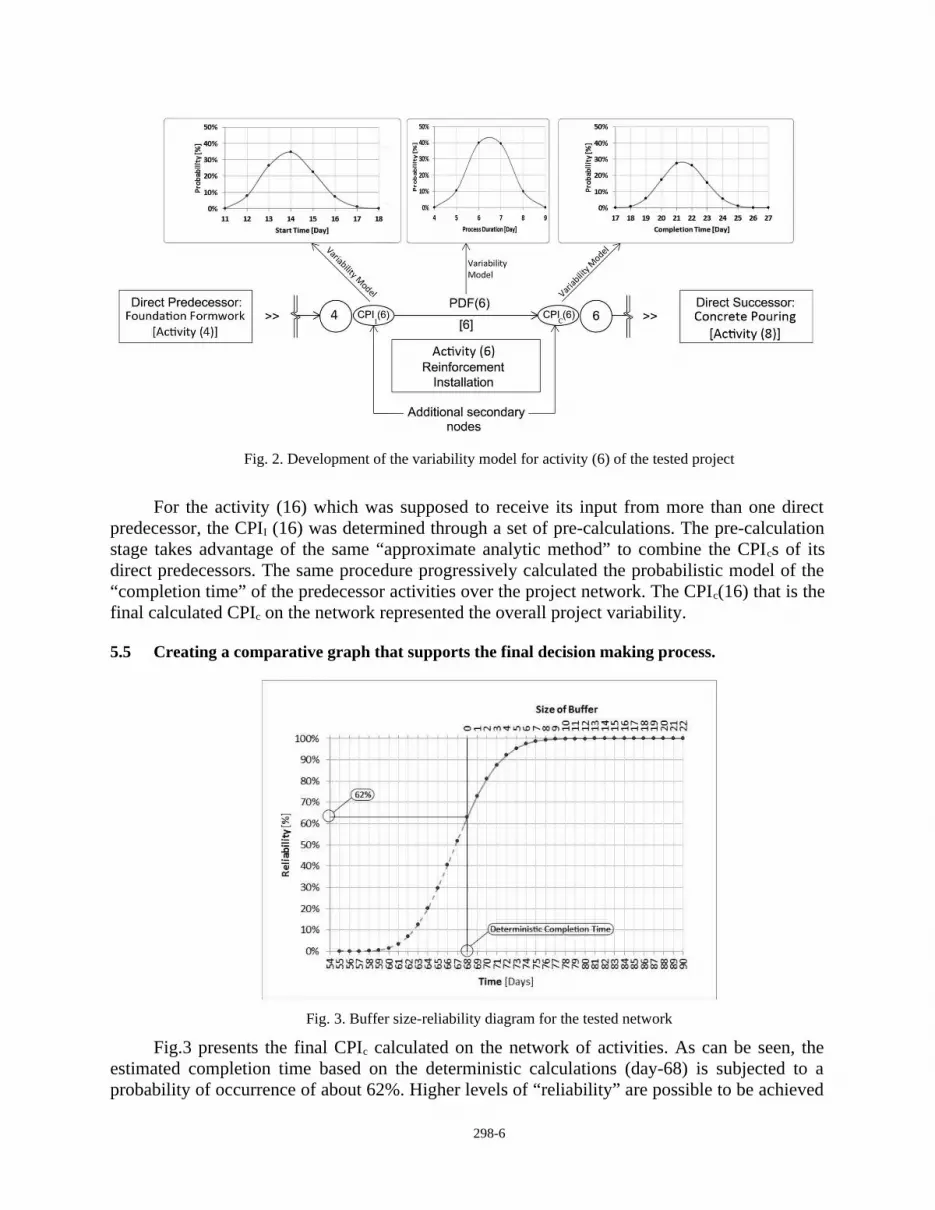
Fig. 2. Development of the variability model for activity (6) of the tested project
For the activity (16) which was supposed to receive its input from more than one direct predecessor, the CPII (16) was determined through a set of pre-calculations. The pre-calculation stage takes advantage of the same “approximate analytic method” to combine the CPIcs of its direct predecessors. The same procedure progressively calculated the probabilistic model of the “completion time” of the predecessor activities over the project network. The CPIc(16) that is the final calculated CPIc on the network represented the overall project variability.
5.5 Creating a comparative graph that supports the final decision making process.
Fig. 3. Buffer size-reliability diagram for the tested network
Fig.3 presents the final CPIc calculated on the network of activities. As can be seen, the estimated completion time based on the deterministic calculations (day-68) is subjected to a probability of occurrence of about 62%. Higher levels of “reliability” are possible to be achieved
298-6
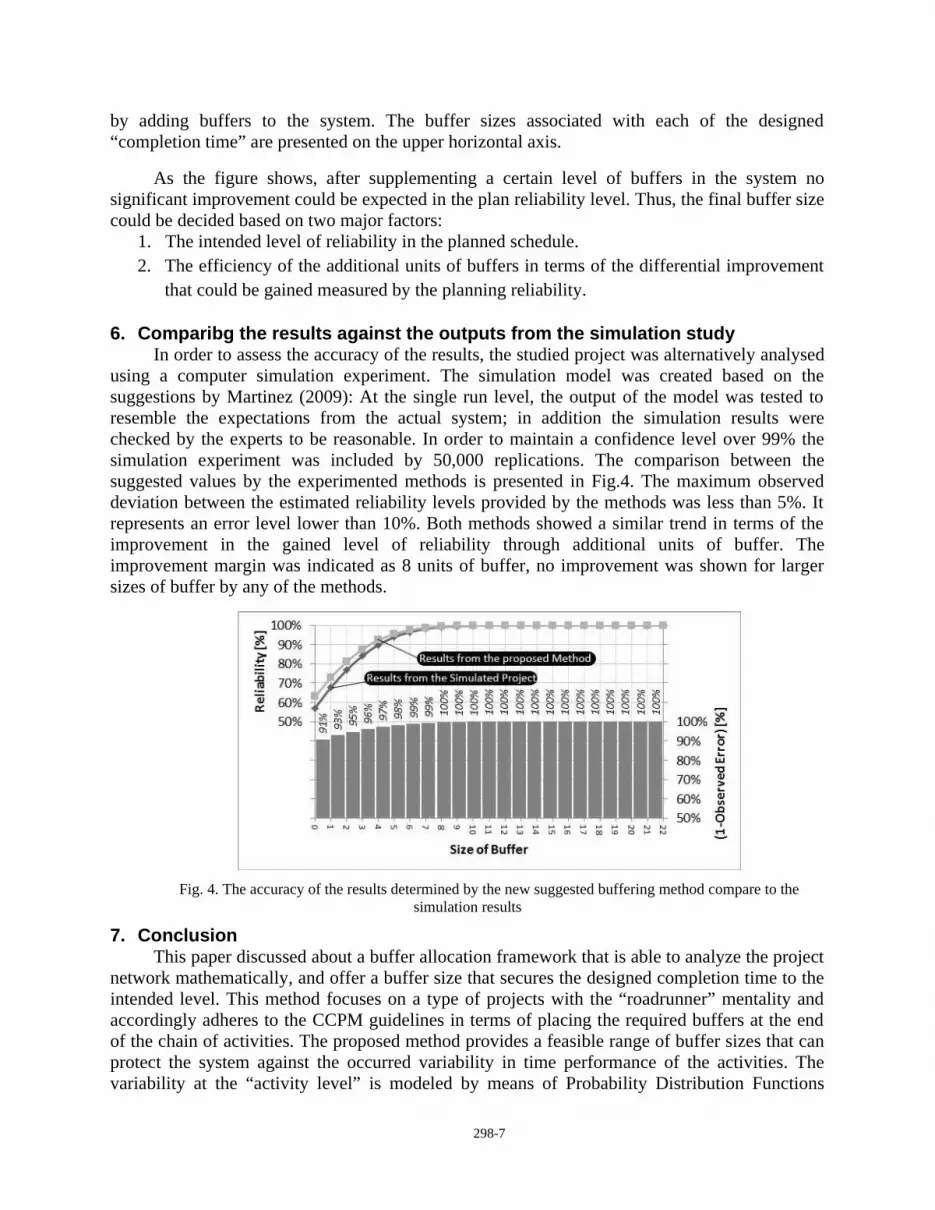
by adding buffers to the system. The buffer sizes associated with each of the designed “completion time” are presented on the upper horizontal axis.
As the figure shows, after supplementing a certain level of buffers in the system no significant improvement could be expected in the plan reliability level. Thus, the final buffer size could be decided based on two major factors:
1. The intended level of reliability in the planned schedule.2. The efficiency of the additional units of buffers in terms of the differential improvement
that could be gained measured by the planning reliability.
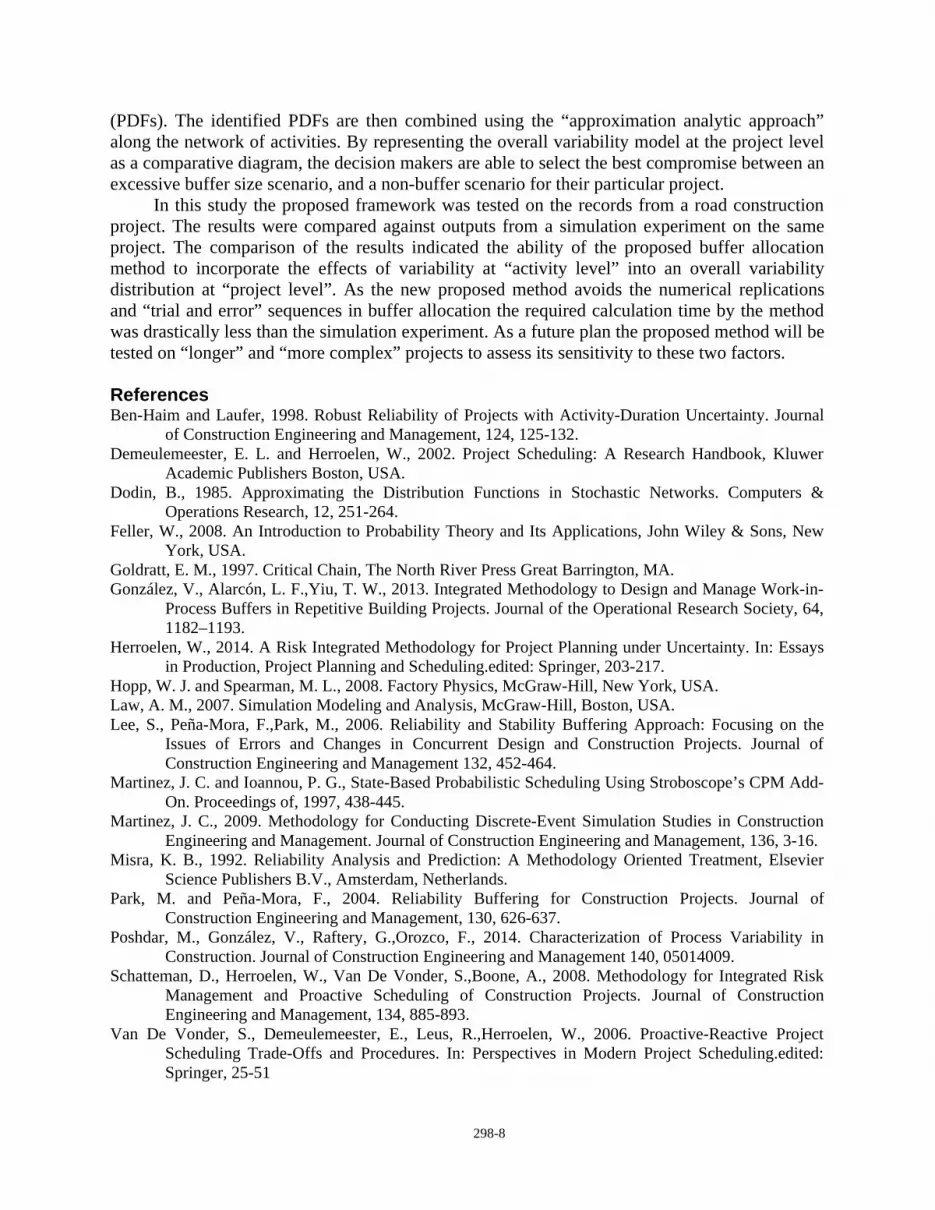
6. Comparibg the results against the outputs from the simulation studyIn order to assess the accuracy of the results, the studied project was alternatively analysed
using a computer simulation experiment. The simulation model was created based on the suggestions by Martinez (2009): At the single run level, the output of the model was tested to resemble the expectations from the actual system; in addition the simulation results were checked by the experts to be reasonable. In order to maintain a confidence level over 99% the simulation experiment was included by 50,000 replications. The comparison between the suggested values by the experimented methods is presented in Fig.4. The maximum observed deviation between the estimated reliability levels provided by the methods was less than 5%. It represents an error level lower than 10%. Both methods showed a similar trend in terms of the improvement in the gained level of reliability through additional units of buffer. The improvement margin was indicated as 8 units of buffer, no improvement was shown for larger sizes of buffer by any of the methods.
Fig. 4. The accuracy of the results determined by the new suggested buffering method compare to the simulation results
7. ConclusionThis paper discussed about a buffer allocation framework that is able to analyze the project
network mathematically, and offer a buffer size that secures the designed completion time to the intended level. This method focuses on a type of projects with the “roadrunner” mentality and accordingly adheres to the CCPM guidelines in terms of placing the required buffers at the end of the chain of activities. The proposed method provides a feasible range of buffer sizes that can protect the system against the occurred variability in time performance of the activities. The variability at the “activity level” is modeled by means of Probability Distribution Functions
298-7
(PDFs). The identified PDFs are then combined using the “approximation analytic approach” along the network of activities. By representing the overall variability model at the project level as a comparative diagram, the decision makers are able to select the best compromise between an excessive buffer size scenario, and a non-buffer scenario for their particular project.
In this study the proposed framework was tested on the records from a road construction project. The results were compared against outputs from a simulation experiment on the same project. The comparison of the results indicated the ability of the proposed buffer allocation method to incorporate the effects of variability at “activity level” into an overall variability distribution at “project level”. As the new proposed method avoids the numerical replications and “trial and error” sequences in buffer allocation the required calculation time by the method was drastically less than the simulation experiment. As a future plan the proposed method will be tested on “longer” and “more complex” projects to assess its sensitivity to these two factors.
ReferencesBen-Haim and Laufer, 1998. Robust Reliability of Projects with Activity-Duration Uncertainty. Journal
of Construction Engineering and Management, 124, 125-132.Demeulemeester, E. L. and Herroelen, W., 2002. Project Scheduling: A Research Handbook, Kluwer
Academic Publishers Boston, USA.Dodin, B., 1985. Approximating the Distribution Functions in Stochastic Networks. Computers &
Operations Research, 12, 251-264.Feller, W., 2008. An Introduction to Probability Theory and Its Applications, John Wiley & Sons, New
York, USA.Goldratt, E. M., 1997. Critical Chain, The North River Press Great Barrington, MA.González, V., Alarcón, L. F.,Yiu, T. W., 2013. Integrated Methodology to Design and Manage Work-in-
Process Buffers in Repetitive Building Projects. Journal of the Operational Research Society, 64, 1182–1193.
Herroelen, W., 2014. A Risk Integrated Methodology for Project Planning under Uncertainty. In: Essays in Production, Project Planning and Scheduling.edited: Springer, 203-217.
Hopp, W. J. and Spearman, M. L., 2008. Factory Physics, McGraw-Hill, New York, USA.Law, A. M., 2007. Simulation Modeling and Analysis, McGraw-Hill, Boston, USA.Lee, S., Peña-Mora, F.,Park, M., 2006. Reliability and Stability Buffering Approach: Focusing on the
Issues of Errors and Changes in Concurrent Design and Construction Projects. Journal of Construction Engineering and Management 132, 452-464.
Martinez, J. C. and Ioannou, P. G., State-Based Probabilistic Scheduling Using Stroboscope’s CPM Add-On. Proceedings of, 1997, 438-445.
Martinez, J. C., 2009. Methodology for Conducting Discrete-Event Simulation Studies in Construction Engineering and Management. Journal of Construction Engineering and Management, 136, 3-16.
Misra, K. B., 1992. Reliability Analysis and Prediction: A Methodology Oriented Treatment, Elsevier Science Publishers B.V., Amsterdam, Netherlands.
Park, M. and Peña-Mora, F., 2004. Reliability Buffering for Construction Projects. Journal of Construction Engineering and Management, 130, 626-637.
Poshdar, M., González, V., Raftery, G.,Orozco, F., 2014. Characterization of Process Variability in Construction. Journal of Construction Engineering and Management 140, 05014009.
Schatteman, D., Herroelen, W., Van De Vonder, S.,Boone, A., 2008. Methodology for Integrated Risk Management and Proactive Scheduling of Construction Projects. Journal of Construction Engineering and Management, 134, 885-893.
Van De Vonder, S., Demeulemeester, E., Leus, R.,Herroelen, W., 2006. Proactive-Reactive Project Scheduling Trade-Offs and Procedures. In: Perspectives in Modern Project Scheduling.edited: Springer, 25-51
298-8