financial and management accounting - e-class
TRANSCRIPT
FINANCIAL and MANAGEMENT ACCOUNTING
Orestes Vlismas, Ph.D
Learning Objectives:
▪ On completion of the management accounting module of the
course, students:
▪ will be able to understand the basic concepts management
accounting,
▪ will be familiar with current trends applied internationally,
▪ will have the skills to use management accounting techniques,
tools and methods in practice,
▪ will be able to select the most suitable management accounting
method, tool or technique to extract and process accounting
information for decision making.
Financial and Management Accounting 2
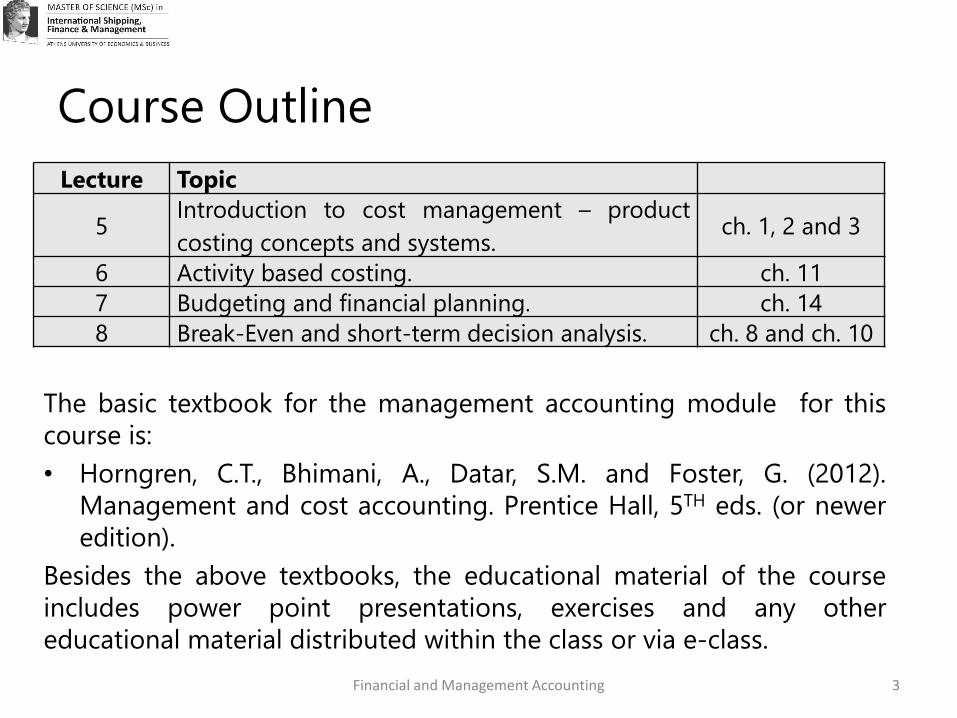
Course Outline
The basic textbook for the management accounting module for this
course is:
• Horngren, C.T., Bhimani, A., Datar, S.M. and Foster, G. (2012).
Management and cost accounting. Prentice Hall, 5TH eds. (or newer
edition).
Besides the above textbooks, the educational material of the course
includes power point presentations, exercises and any other
educational material distributed within the class or via e-class.
Lecture Topic
5Introduction to cost management – product
costing concepts and systems.ch. 1, 2 and 3
6 Activity based costing. ch. 11
7 Budgeting and financial planning. ch. 14
8 Break-Even and short-term decision analysis. ch. 8 and ch. 10
Financial and Management Accounting 3
Marking Scheme
Financial and Management Accounting
At the end of the semester students will sit an exam (whichwill consist of two modules: one for financial accountingand the other one for management accounting). They, also,will have to prepare two assignments (one for financialaccounting and the other for management accounting).
The deadline of assignment: exam day!
The final grade is determined by the following algorithm:
70% x Exam Grade + 30% x Assignment Grade
Note: a student is required to receive at least 50% (pass) ofthe corresponding mark of both exam modules andassignments.
4
Financial and Management
Accounting
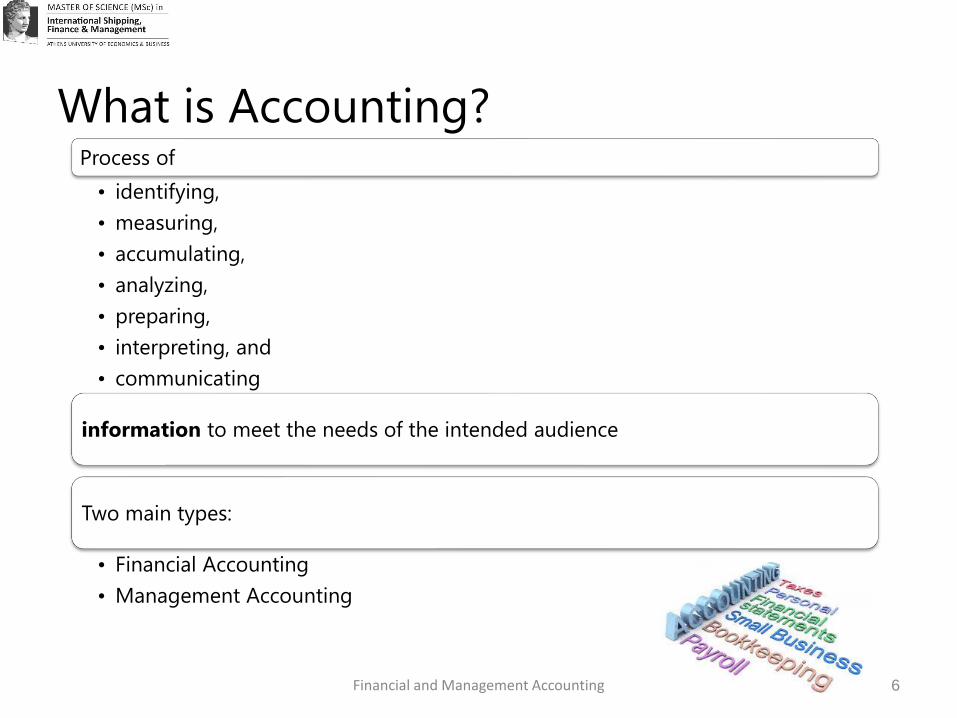
Process of
• identifying,
• measuring,
• accumulating,
• analyzing,
• preparing,
• interpreting, and
• communicating
information to meet the needs of the intended audience
Two main types:
• Financial Accounting
• Management Accounting
6Financial and Management Accounting
What is Accounting?
Financial and Management Accounting
Financial and Management Accounting
• Financial accounting focuses on external reporting that is directed
by authoritative guidelines. Organizations are required to follow
these guidelines in their financial reports to outside parties.
• Financial accounting is guided by prescribed accounting
principles. These principles define the set of revenue and cost
measurement rules and the types of item that are classified as
assets, liabilities or owners’ equity in balance sheets.
• Management accounting measures and reports financial information
as well as other types of information that are intended primarily to
assist managers in fulfilling the goals of the organization.
• A management accounting system is an important facet of overall
organizational control
7
Financial and Management Accounting
Financial and Management Accounting
• Management accounting focuses on the identification, generation,presentation, interpretation and use of relevant information relevantto:
– inform strategic decisions and formulate business strategy;
– plan long, medium and short-term operations;
– determine capital structure and fund that structure;
– design reward strategies for executives and shareholders;
– inform operational decisions;
– control operations and ensure the efficient use of resources;
– measure and report financial and non-financial performance to managementand other stakeholders;
– implement corporate governance procedures, risk management and internalcontrols (CIMA 2005).
8
Differences between Financial and
Management Accounting
Financial and Management Accounting
• Regulations. Management accounting reports are generally prepared
for internal use and no external regulations govern their preparation.
Conversely, financial accounting reports are generally required to be
prepared according to accounting regulations and guidelines imposed
by law and the accounting profession.
• Range and detail of information. Management accounting reports
may encompass financial, non-financial and qualitative information
which may be very detailed or highly aggregated. Financial accounting
is usually broad based, lacking detail and intended to provide an
overview of the position and performance of an organization over a
time period. It tends to focus on financial information.
9
Differences between Financial and
Management Accounting
Financial and Management Accounting
• Reporting interval. Management accounting reports may be
produced frequently – on an hourly, daily or weekly basis, possibly
to span several years. The interval covered by management
accounting information will be dictated by the decision-making and
control need of the information users. Conversly, financial
accounting reports are produced annualy. Some large companies
also produce semi-annual and quarterly reports.
• Time period. Management accounting reports may include
historical and current information but also often provide information
on expected future performance and position of an organization for
the past period. They tend to be backward-looking.
10
Introduction to
Cost Elements in Shipping
Costing System, Cost and Cost Object
Financial and Management Accounting
▪ A costing system is the systematic procedure of categorizing,
aggregating and properly allocating the total expenditures in order
for the cost of a service, a product, a facility or another cost object
to be calculated.
▪ Accountants usually define cost as a resource sacrificed or forgone
to achieve a specific objective.
▪ Managers often want to know how much a certain thing (such as a
new product, a machine, a service or a process) costs. We call this
‘thing’ cost object, which is anything for which a separate
measurement of costs.
12
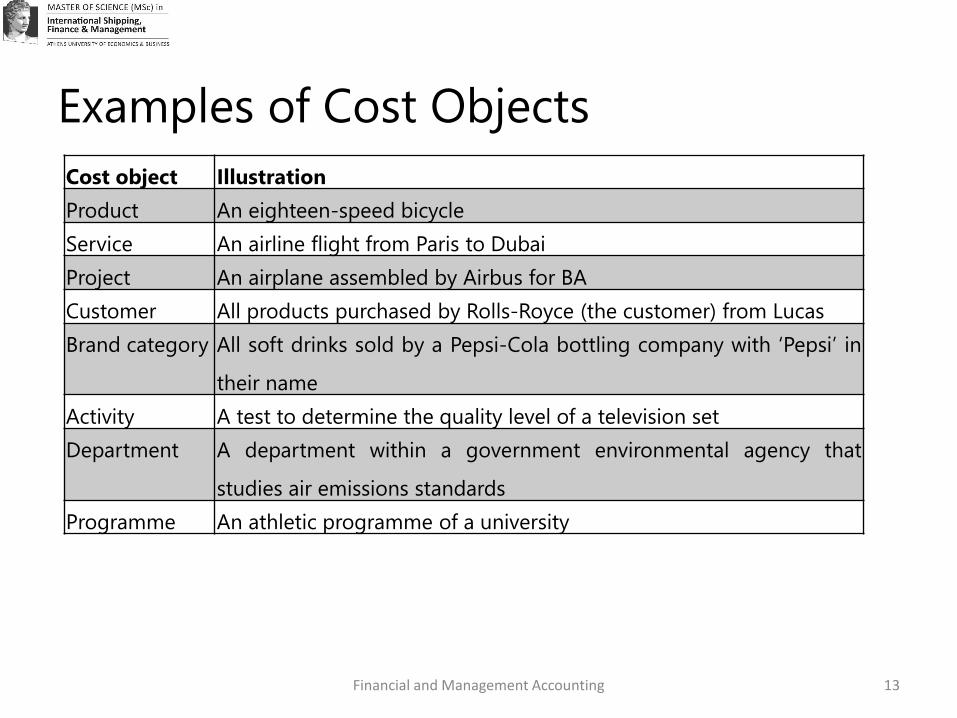
Examples of Cost Objects
Financial and Management Accounting
Cost object Illustration
Product An eighteen-speed bicycle
Service An airline flight from Paris to Dubai
Project An airplane assembled by Airbus for BA
Customer All products purchased by Rolls-Royce (the customer) from Lucas
Brand category All soft drinks sold by a Pepsi-Cola bottling company with ‘Pepsi’ in
their name
Activity A test to determine the quality level of a television set
Department A department within a government environmental agency that
studies air emissions standards
Programme An athletic programme of a university
13
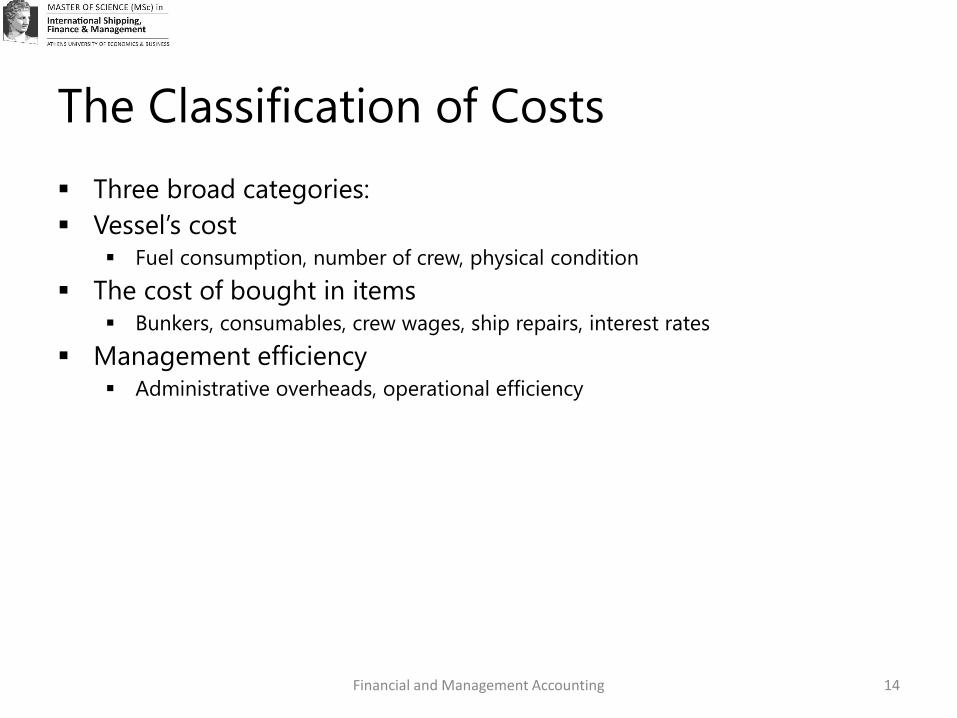
The Classification of Costs
Financial and Management Accounting
▪ Three broad categories:
▪ Vessel’s cost▪ Fuel consumption, number of crew, physical condition
▪ The cost of bought in items▪ Bunkers, consumables, crew wages, ship repairs, interest rates
▪ Management efficiency▪ Administrative overheads, operational efficiency
14
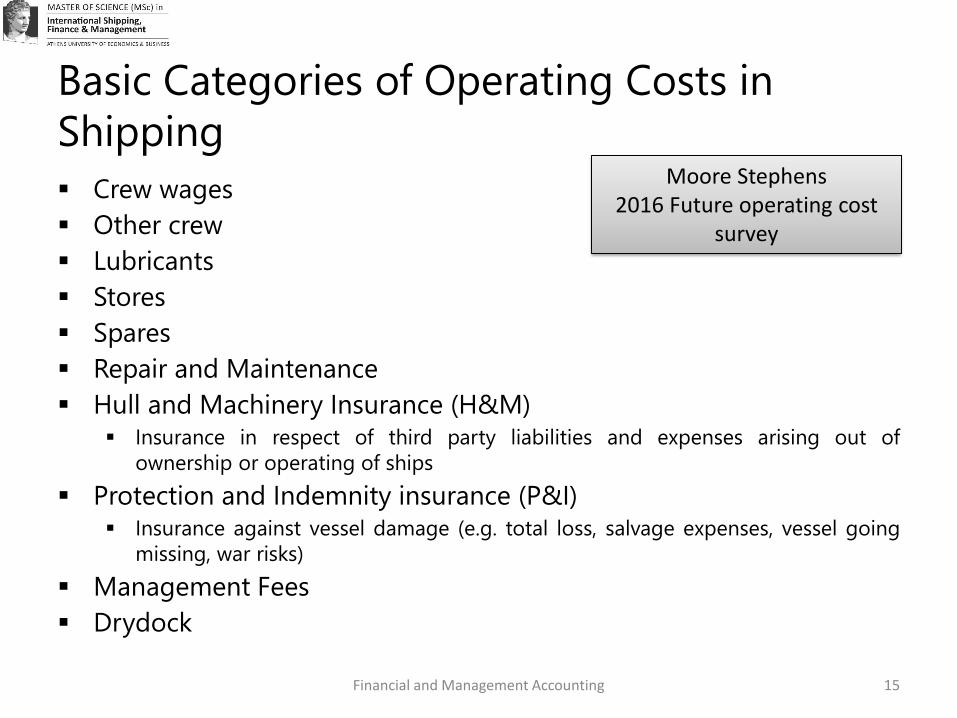
Basic Categories of Operating Costs in
Shipping
Financial and Management Accounting
▪ Crew wages
▪ Other crew
▪ Lubricants
▪ Stores
▪ Spares
▪ Repair and Maintenance
▪ Hull and Machinery Insurance (H&M)▪ Insurance in respect of third party liabilities and expenses arising out of
ownership or operating of ships
▪ Protection and Indemnity insurance (P&I)▪ Insurance against vessel damage (e.g. total loss, salvage expenses, vessel going
missing, war risks)
▪ Management Fees
▪ Drydock
15
Moore Stephens 2016 Future operating cost
survey
Financial and Management Accounting 16
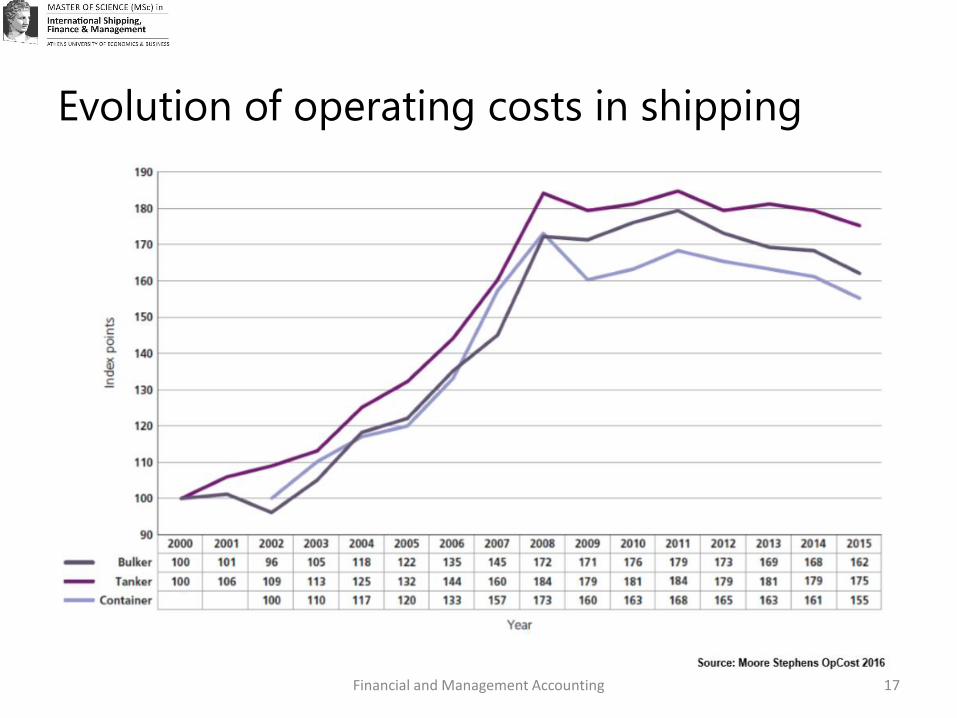
Evolution of operating costs in shipping
Financial and Management Accounting 17
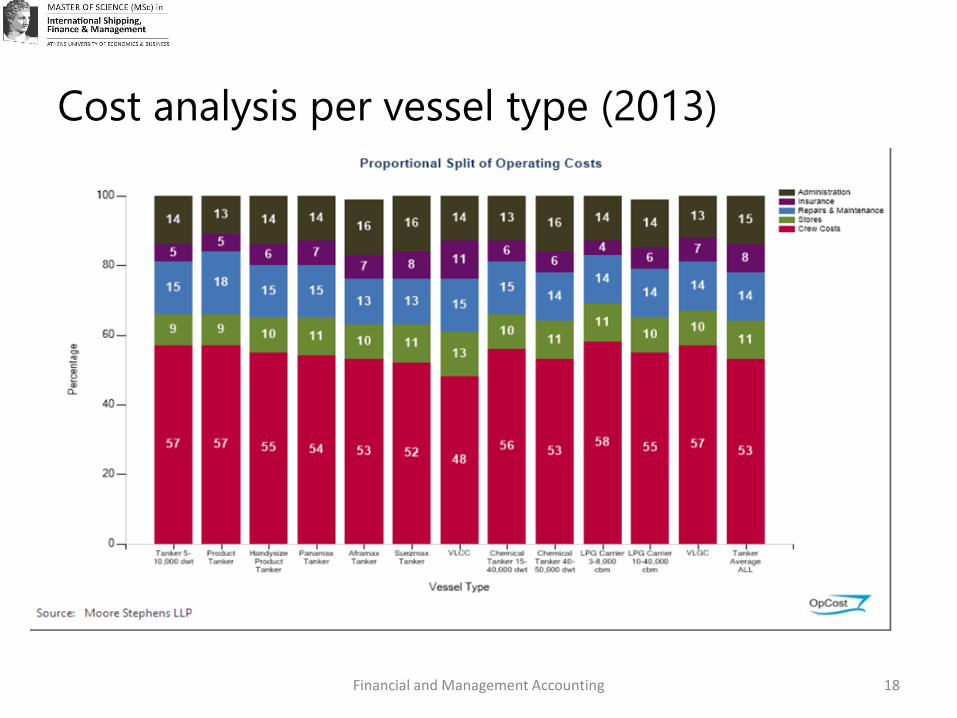
Cost analysis per vessel type (2013)
Financial and Management Accounting 18
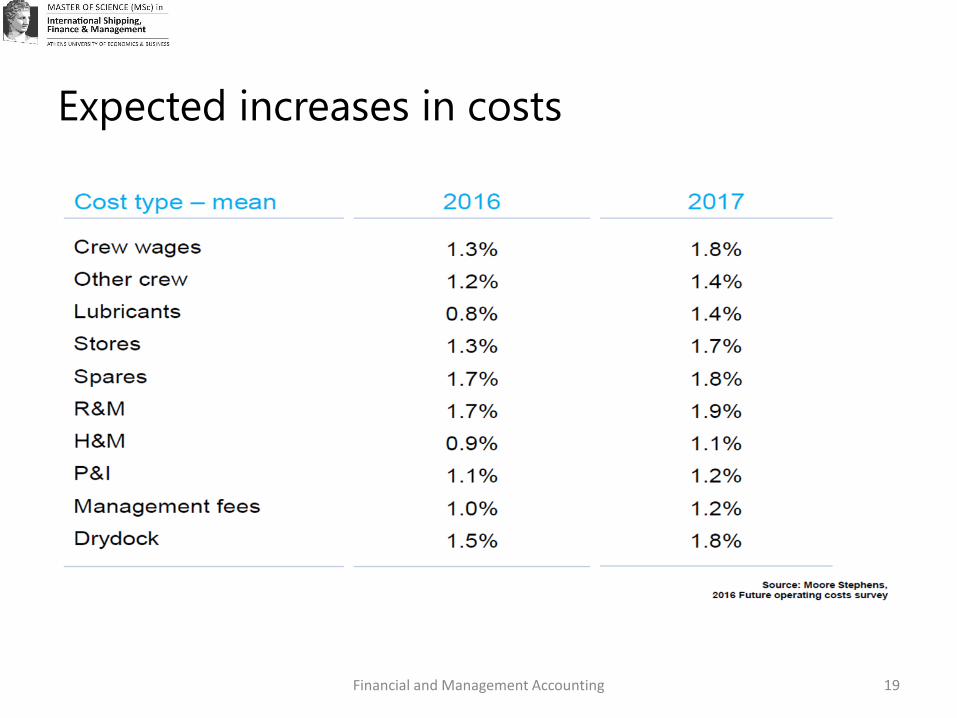
Expected increases in costs
Financial and Management Accounting 19
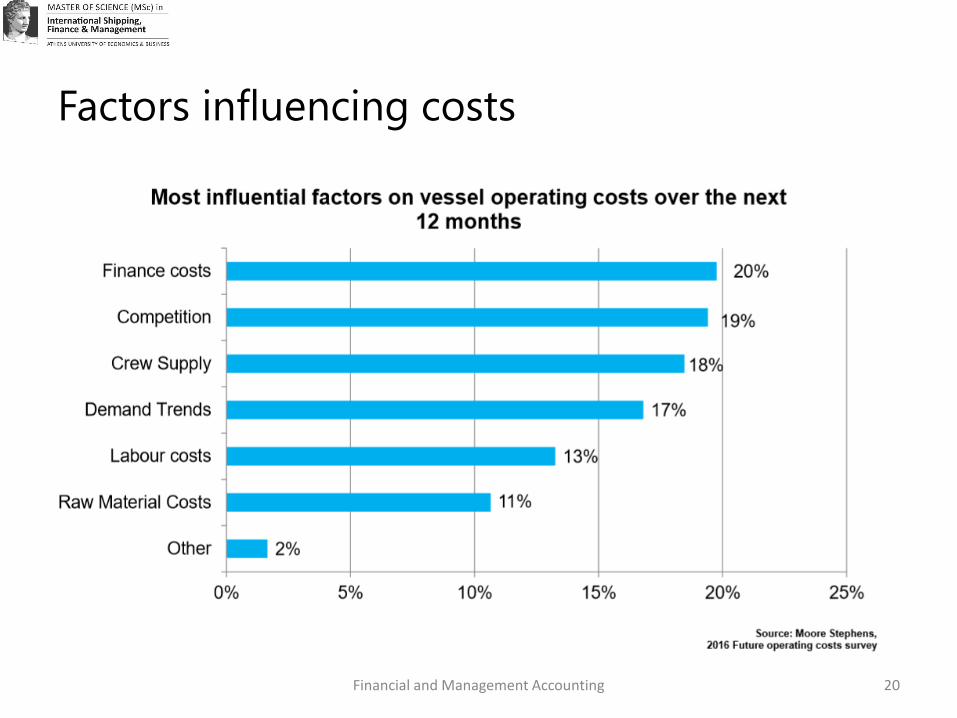
Factors influencing costs
Financial and Management Accounting 20
Cost Behavior
Financial and Management Accounting
▪ Cost behavior means how a cost will react to changes in the level of business
activity.
▪ Total variable costs change when activity level changes.
▪ Total fixed costs remain unchanged when activity level changes.
▪ Major assumptions:
▪ Costs are defined as variable or fixed with respect to a specific cost
object.
▪ The time span must be specified.
▪ Total costs are linear (i.e., an unbroken straight line).
▪ There is only one cost driver.
▪ Variations in the level of the cost driver are within a relevant range.
21
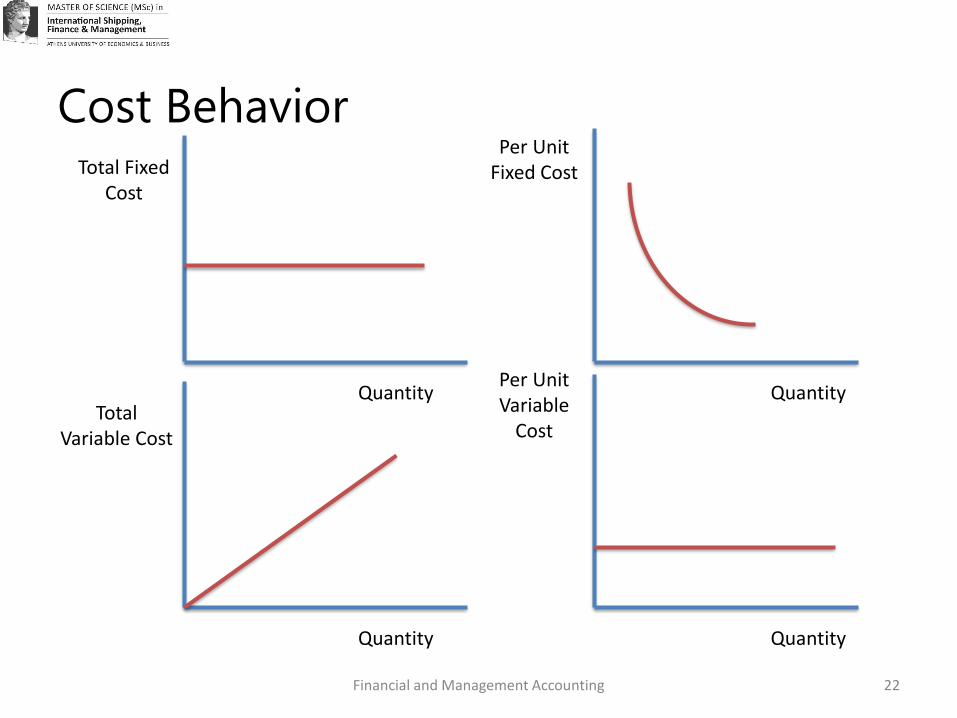
Cost Behavior
Financial and Management Accounting
Total Fixed Cost
Quantity Quantity
Per Unit Fixed Cost
Total Variable Cost
Quantity Quantity
Per Unit Variable
Cost
22
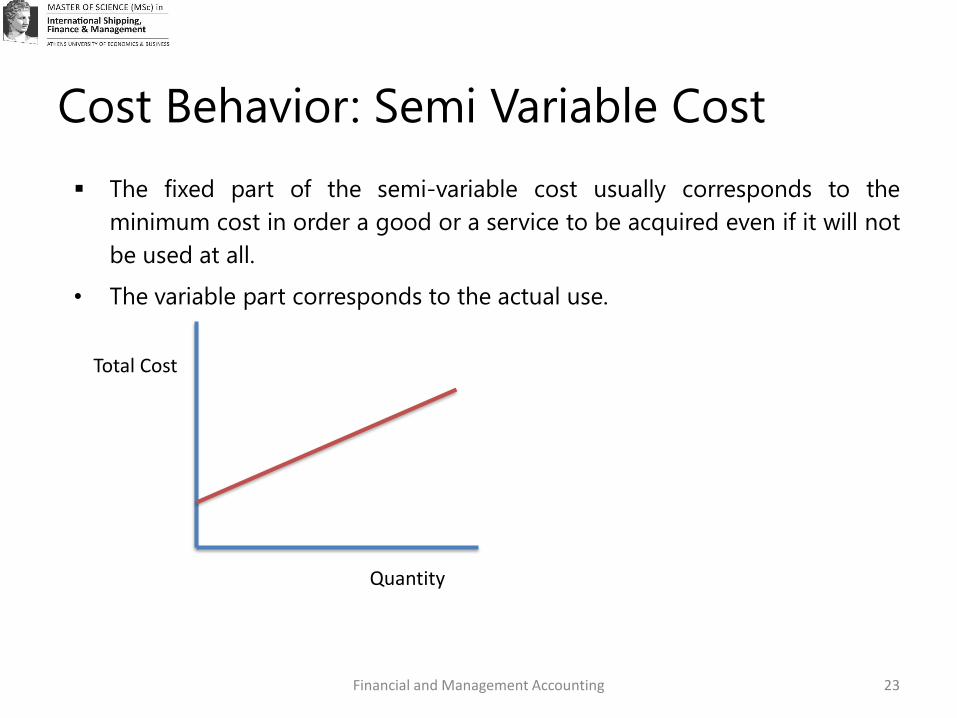
Cost Behavior: Semi Variable Cost
Financial and Management Accounting
▪ The fixed part of the semi-variable cost usually corresponds to the
minimum cost in order a good or a service to be acquired even if it will not
be used at all.
• The variable part corresponds to the actual use.
Total Cost
Quantity
23
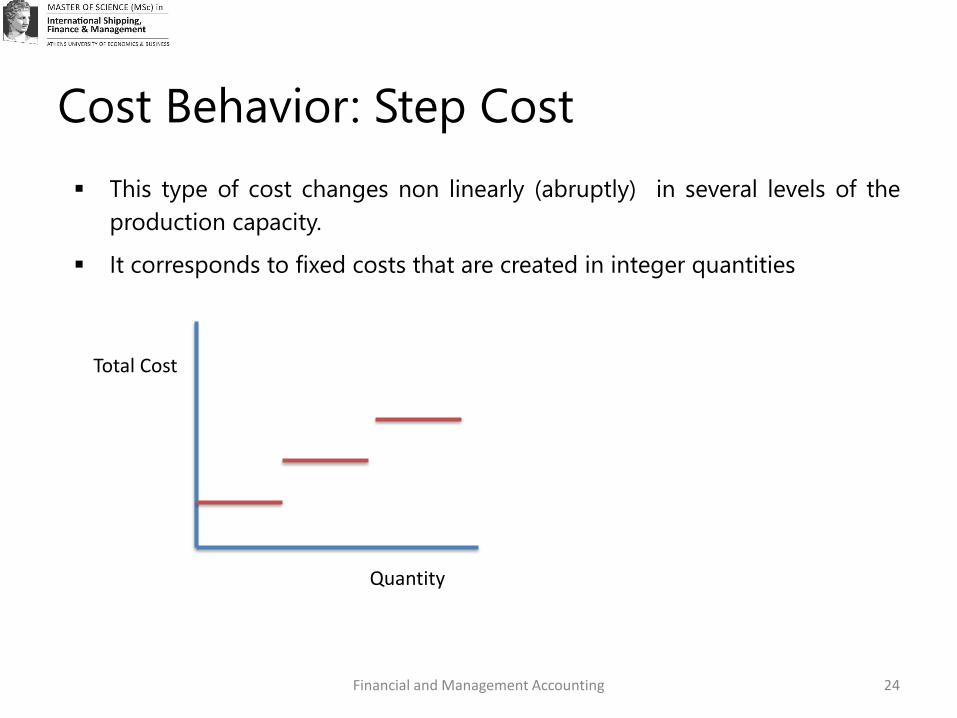
Cost Behavior: Step Cost
Financial and Management Accounting
▪ This type of cost changes non linearly (abruptly) in several levels of the
production capacity.
▪ It corresponds to fixed costs that are created in integer quantities
Total Cost
Quantity
24
Cost Behavior: Example
25
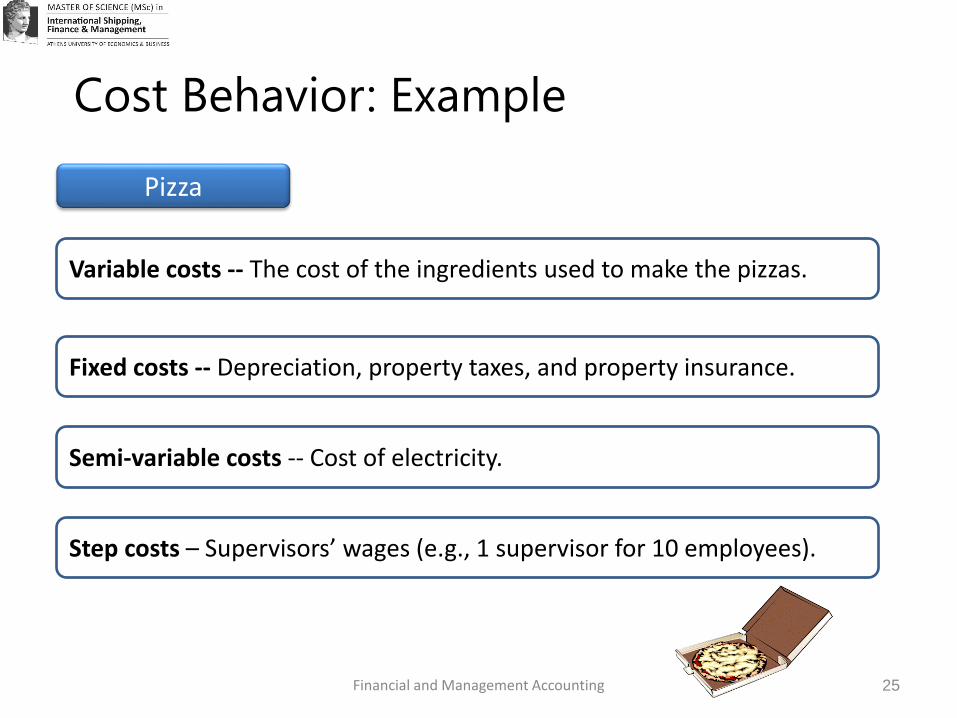
Pizza
Variable costs -- The cost of the ingredients used to make the pizzas.
Fixed costs -- Depreciation, property taxes, and property insurance.
Semi-variable costs -- Cost of electricity.
Step costs – Supervisors’ wages (e.g., 1 supervisor for 10 employees).
Financial and Management Accounting
26
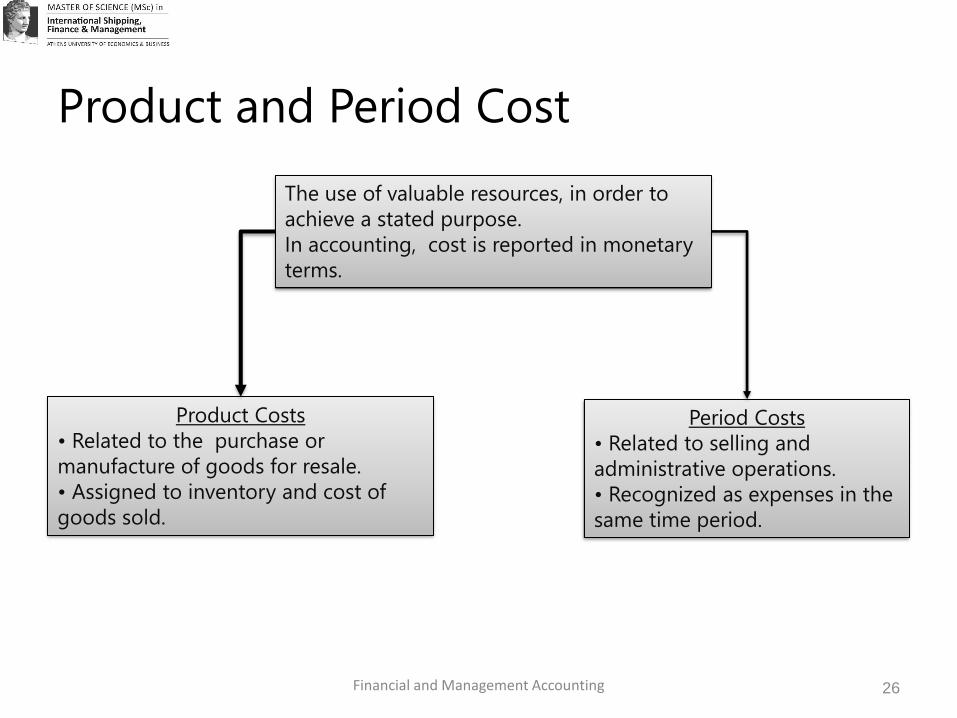
Product Costs
• Related to the purchase or
manufacture of goods for resale.
• Assigned to inventory and cost of
goods sold.
Period Costs
• Related to selling and
administrative operations.
• Recognized as expenses in the
same time period.
The use of valuable resources, in order to
achieve a stated purpose.
In accounting, cost is reported in monetary
terms.
Product and Period Cost
Financial and Management Accounting
27
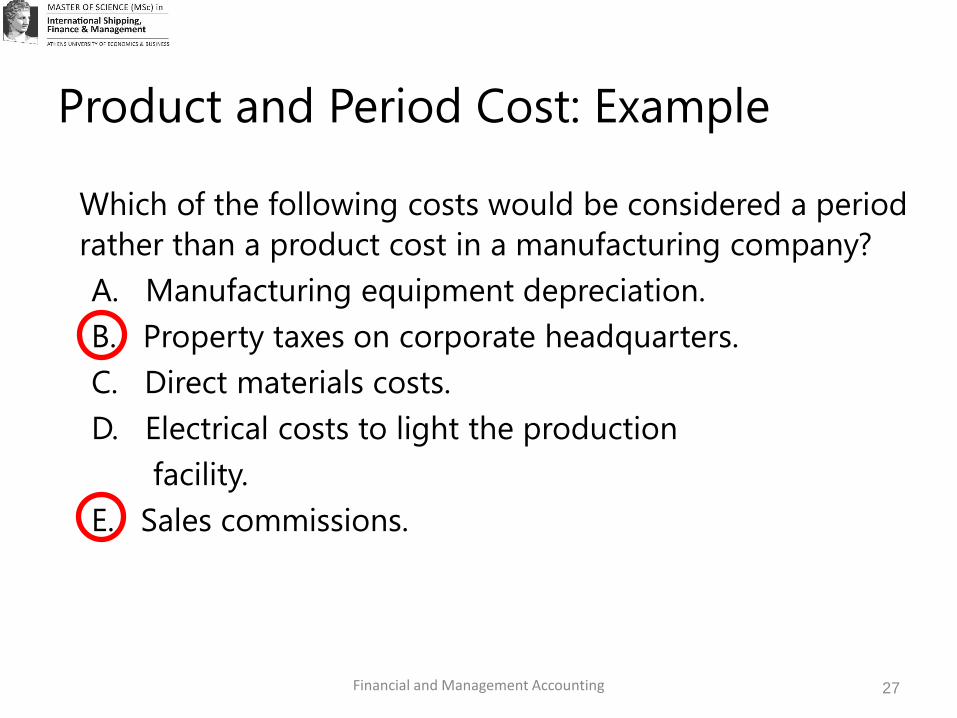
Which of the following costs would be considered a period
rather than a product cost in a manufacturing company?
A. Manufacturing equipment depreciation.
B. Property taxes on corporate headquarters.
C. Direct materials costs.
D. Electrical costs to light the production
facility.
E. Sales commissions.
Financial and Management Accounting
Product and Period Cost: Example
Other Types of Costs
Financial and Management Accounting
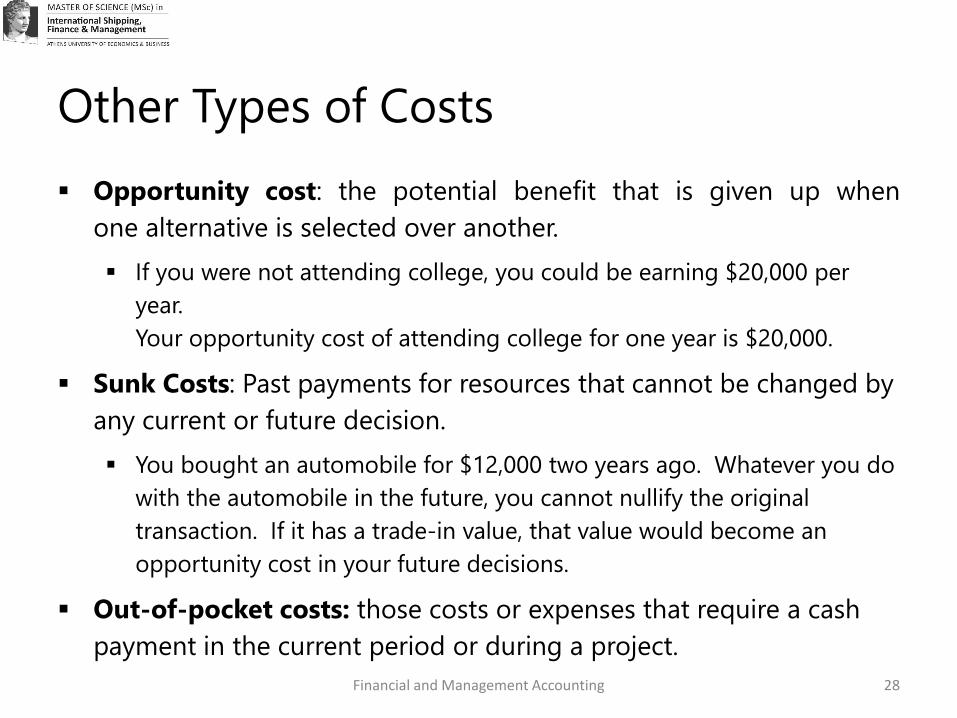
▪ Opportunity cost: the potential benefit that is given up when
one alternative is selected over another.
▪ If you were not attending college, you could be earning $20,000 per
year.
Your opportunity cost of attending college for one year is $20,000.
▪ Sunk Costs: Past payments for resources that cannot be changed by
any current or future decision.
▪ You bought an automobile for $12,000 two years ago. Whatever you do
with the automobile in the future, you cannot nullify the original
transaction. If it has a trade-in value, that value would become an
opportunity cost in your future decisions.
▪ Out-of-pocket costs: those costs or expenses that require a cash
payment in the current period or during a project.
28
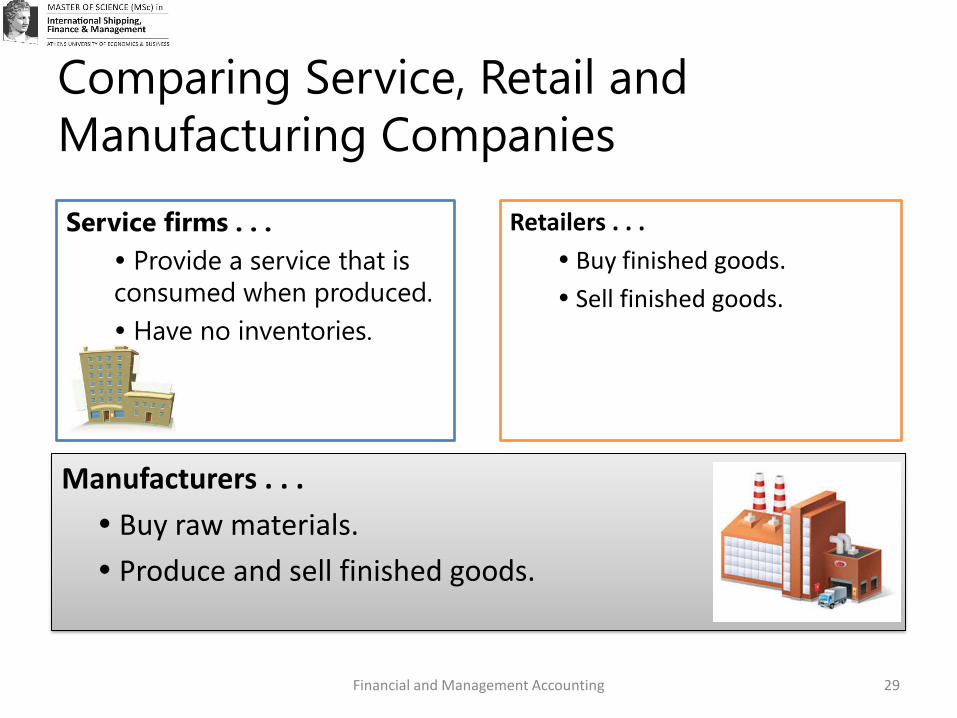
Comparing Service, Retail and
Manufacturing Companies
Retailers . . .
Buy finished goods.
Sell finished goods.
Manufacturers . . .
Buy raw materials.
Produce and sell finished goods.
Service firms . . .
Provide a service that is
consumed when produced.
Have no inventories.
Financial and Management Accounting 29
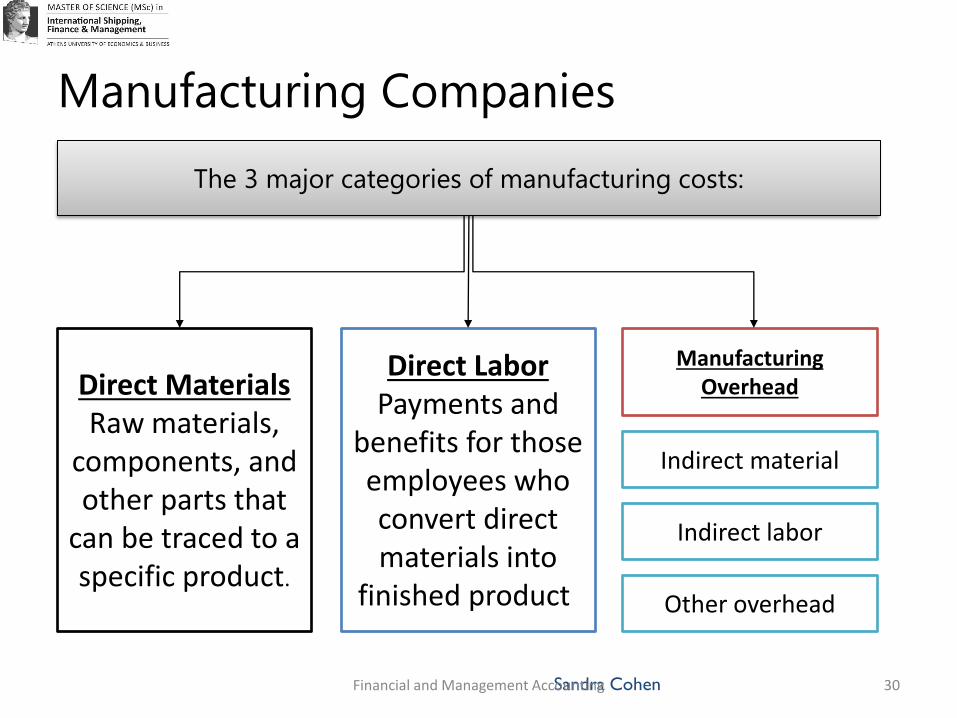
Manufacturing Companies
The 3 major categories of manufacturing costs:
Direct MaterialsRaw materials,
components, and other parts that
can be traced to a specific product.
Direct LaborPayments and
benefits for those employees who convert direct materials into
finished product.
Manufacturing Overhead
Indirect material
Indirect labor
Other overhead
Sandra Cohen Financial and Management Accounting 30
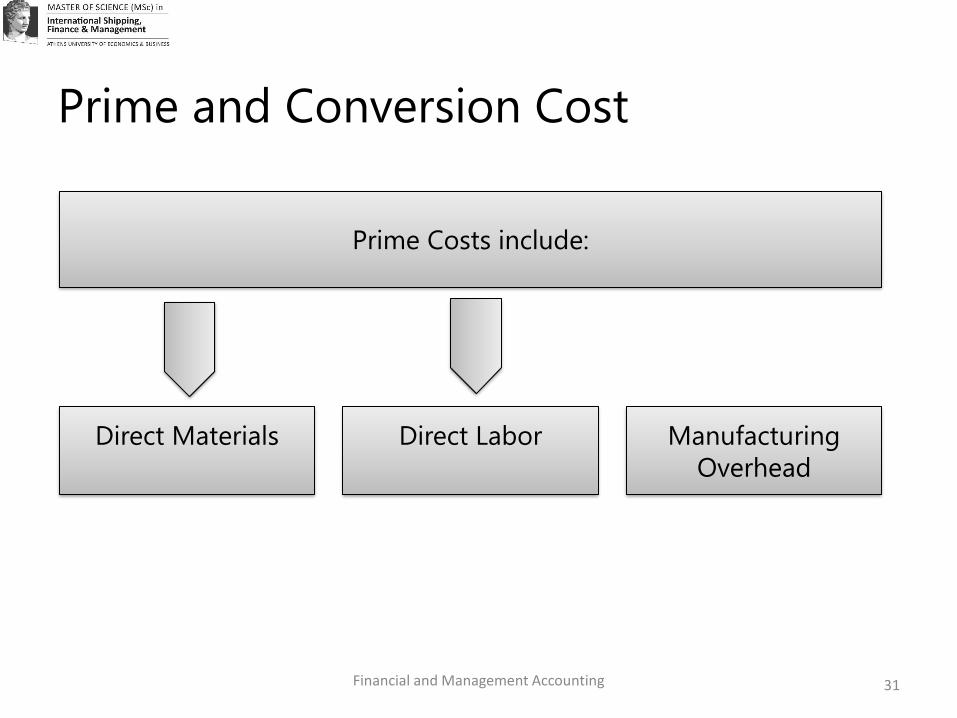
Prime and Conversion Cost
Financial and Management Accounting
Prime Costs include:
Direct Materials Direct Labor Manufacturing
Overhead
31
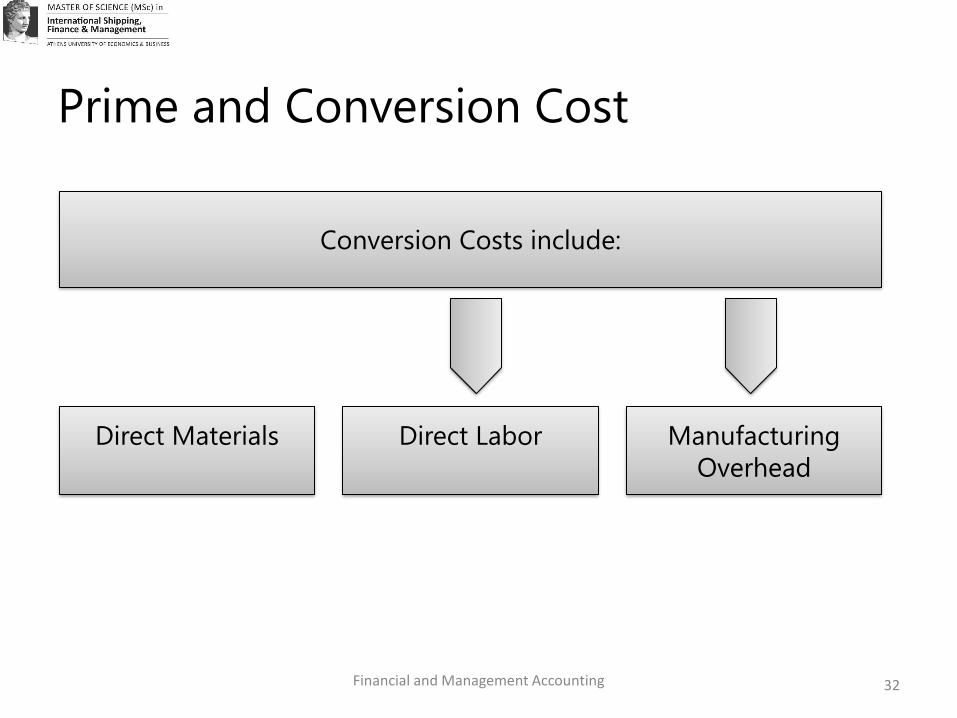
Prime and Conversion Cost
Financial and Management Accounting
Conversion Costs include:
Direct Materials Direct Labor Manufacturing
Overhead
32
Financial and Management Accounting
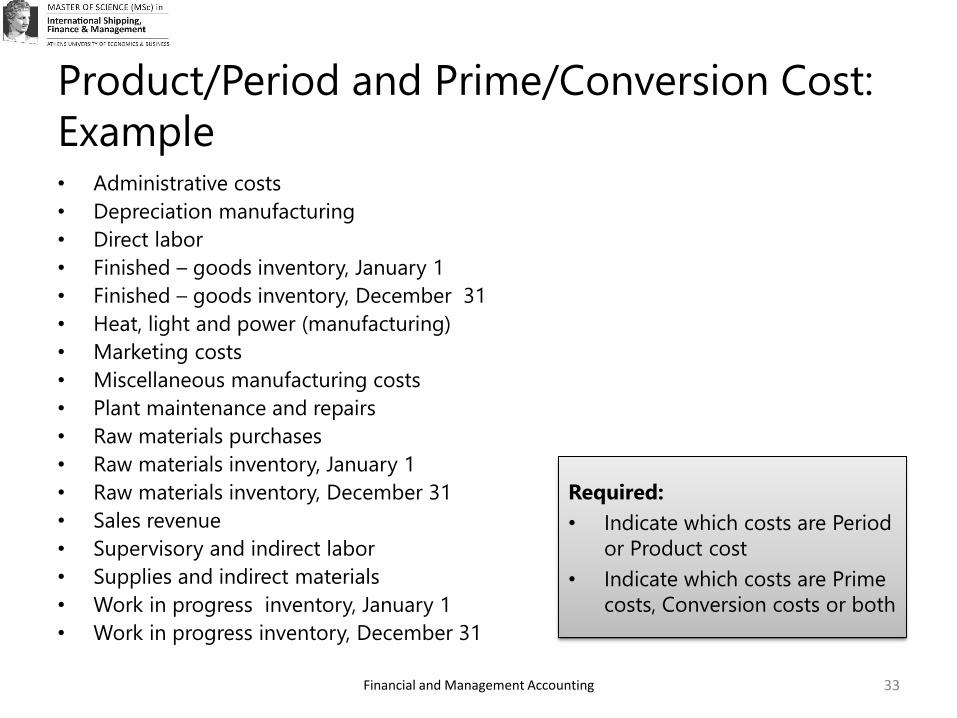
• Administrative costs
• Depreciation manufacturing
• Direct labor
• Finished – goods inventory, January 1
• Finished – goods inventory, December 31
• Heat, light and power (manufacturing)
• Marketing costs
• Miscellaneous manufacturing costs
• Plant maintenance and repairs
• Raw materials purchases
• Raw materials inventory, January 1
• Raw materials inventory, December 31
• Sales revenue
• Supervisory and indirect labor
• Supplies and indirect materials
• Work in progress inventory, January 1
• Work in progress inventory, December 31
33
Product/Period and Prime/Conversion Cost:
Example
Required:
• Indicate which costs are Period
or Product cost
• Indicate which costs are Prime
costs, Conversion costs or both
Financial and Management Accounting
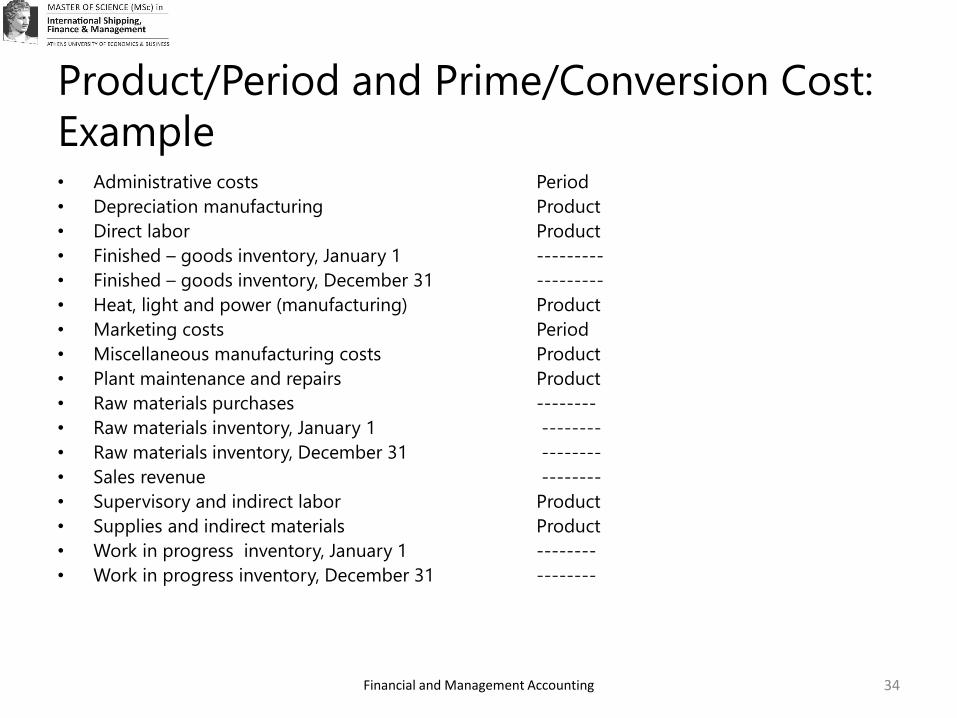
• Administrative costs Period
• Depreciation manufacturing Product
• Direct labor Product
• Finished – goods inventory, January 1 ---------
• Finished – goods inventory, December 31 ---------
• Heat, light and power (manufacturing) Product
• Marketing costs Period
• Miscellaneous manufacturing costs Product
• Plant maintenance and repairs Product
• Raw materials purchases --------
• Raw materials inventory, January 1 --------
• Raw materials inventory, December 31 --------
• Sales revenue --------
• Supervisory and indirect labor Product
• Supplies and indirect materials Product
• Work in progress inventory, January 1 --------
• Work in progress inventory, December 31 --------
34
Product/Period and Prime/Conversion Cost:
Example
Financial and Management Accounting
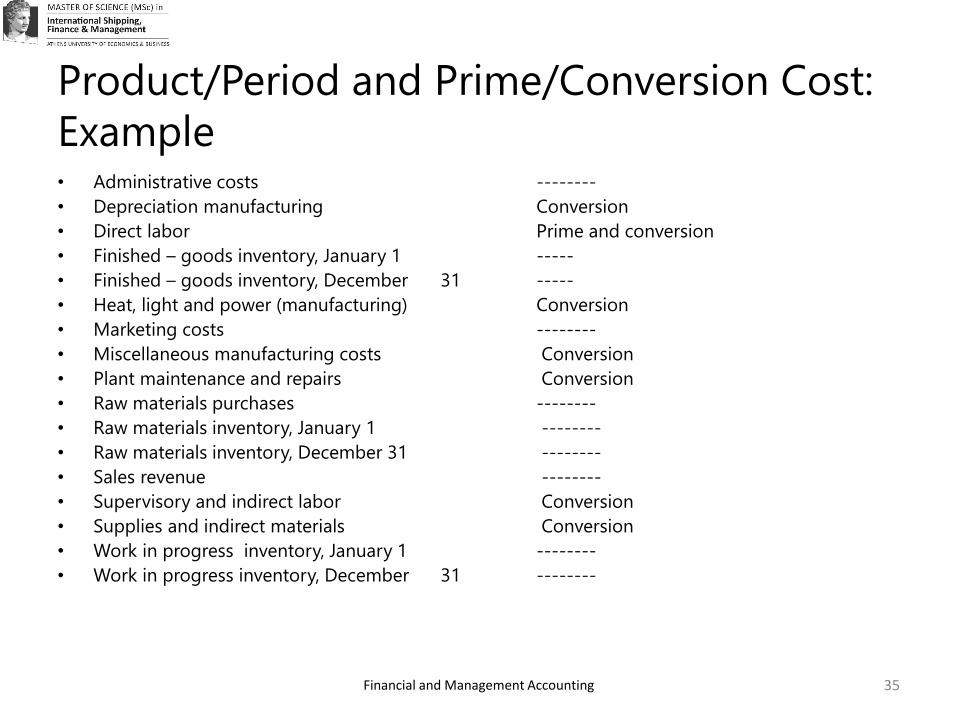
• Administrative costs --------
• Depreciation manufacturing Conversion
• Direct labor Prime and conversion
• Finished – goods inventory, January 1 -----
• Finished – goods inventory, December 31 -----
• Heat, light and power (manufacturing) Conversion
• Marketing costs --------
• Miscellaneous manufacturing costs Conversion
• Plant maintenance and repairs Conversion
• Raw materials purchases --------
• Raw materials inventory, January 1 --------
• Raw materials inventory, December 31 --------
• Sales revenue --------
• Supervisory and indirect labor Conversion
• Supplies and indirect materials Conversion
• Work in progress inventory, January 1 --------
• Work in progress inventory, December 31 --------
35
Product/Period and Prime/Conversion Cost:
Example
Cost accumulation and cost assignment
Financial and Management Accounting
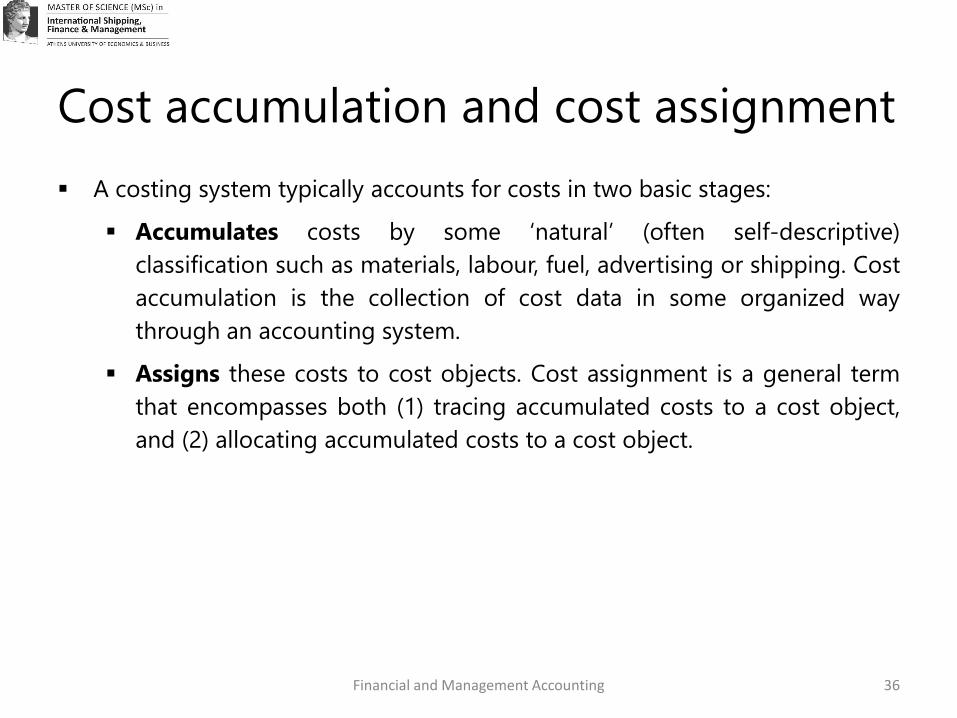
▪ A costing system typically accounts for costs in two basic stages:
▪ Accumulates costs by some ‘natural’ (often self-descriptive)
classification such as materials, labour, fuel, advertising or shipping. Cost
accumulation is the collection of cost data in some organized way
through an accounting system.
▪ Assigns these costs to cost objects. Cost assignment is a general term
that encompasses both (1) tracing accumulated costs to a cost object,
and (2) allocating accumulated costs to a cost object.
36
Cost Tracing and Cost Allocation
Financial and Management Accounting
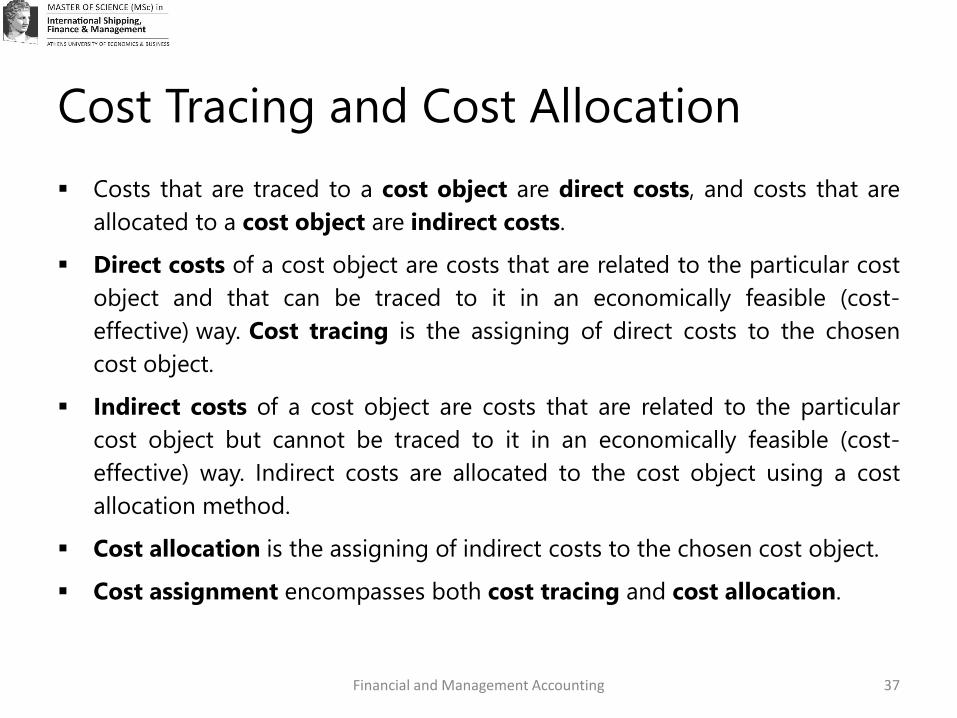
▪ Costs that are traced to a cost object are direct costs, and costs that are
allocated to a cost object are indirect costs.
▪ Direct costs of a cost object are costs that are related to the particular cost
object and that can be traced to it in an economically feasible (cost-
effective) way. Cost tracing is the assigning of direct costs to the chosen
cost object.
▪ Indirect costs of a cost object are costs that are related to the particular
cost object but cannot be traced to it in an economically feasible (cost-
effective) way. Indirect costs are allocated to the cost object using a cost
allocation method.
▪ Cost allocation is the assigning of indirect costs to the chosen cost object.
▪ Cost assignment encompasses both cost tracing and cost allocation.
37
Factors Affecting Direct/Indirect Cost
Classifications
Financial and Management Accounting
▪ The materiality of the cost in question. The higher the cost in question,
the more likely the economic feasibility of tracing that cost to a particular
cost object.
▪ Available information-gathering technology. Improvements in this area
are enabling an increasing percentage of costs to be classified as direct.
▪ Design of operations. Facility design can impact on cost classification.
38
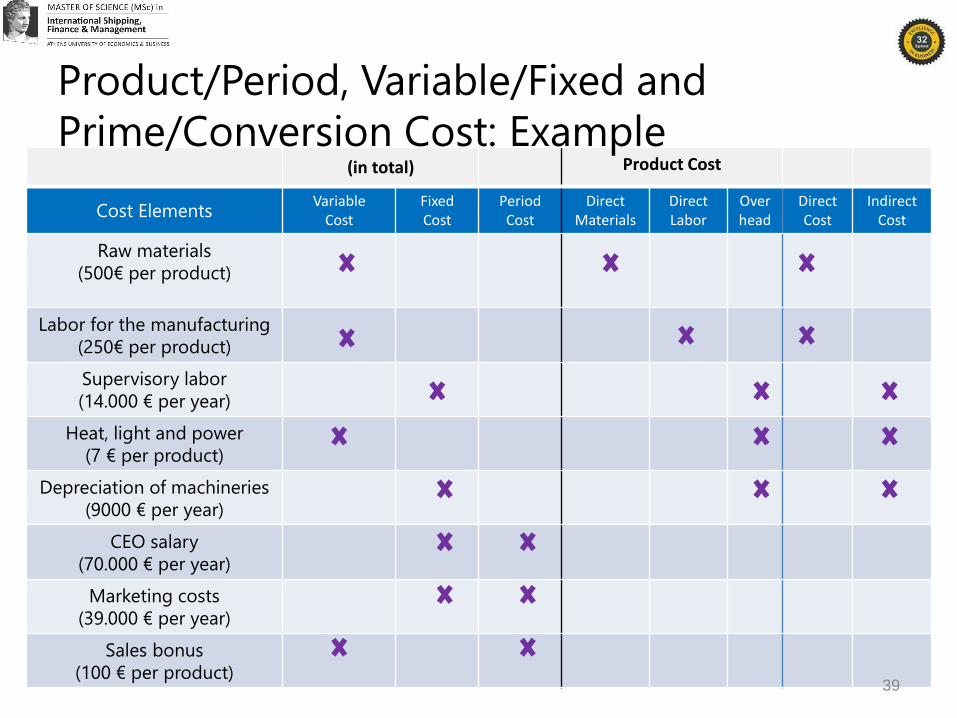
(in total) Product Cost
Cost ElementsVariable
CostFixed Cost
Period Cost
Direct Materials
Direct Labor
Overhead
Direct Cost
Indirect Cost
Raw materials
(500€ per product)
Labor for the manufacturing
(250€ per product)
Supervisory labor
(14.000 € per year)
Heat, light and power
(7 € per product)
Depreciation of machineries
(9000 € per year)
CEO salary
(70.000 € per year)
Marketing costs
(39.000 € per year)
Sales bonus
(100 € per product)39
Product/Period, Variable/Fixed and
Prime/Conversion Cost: Example
Cost accumulation and cost assignment
Financial and Management Accounting
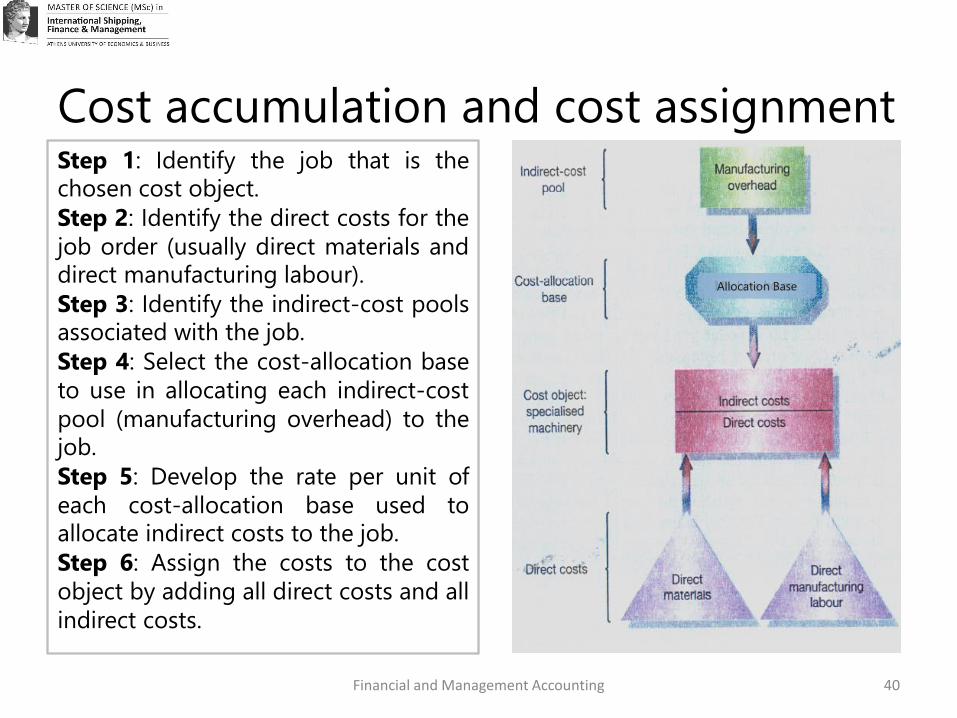
Step 1: Identify the job that is the
chosen cost object.
Step 2: Identify the direct costs for the
job order (usually direct materials and
direct manufacturing labour).
Step 3: Identify the indirect-cost pools
associated with the job.
Step 4: Select the cost-allocation base
to use in allocating each indirect-cost
pool (manufacturing overhead) to the
job.
Step 5: Develop the rate per unit of
each cost-allocation base used to
allocate indirect costs to the job.
Step 6: Assign the costs to the cost
object by adding all direct costs and all
indirect costs.
40
Allocation Base
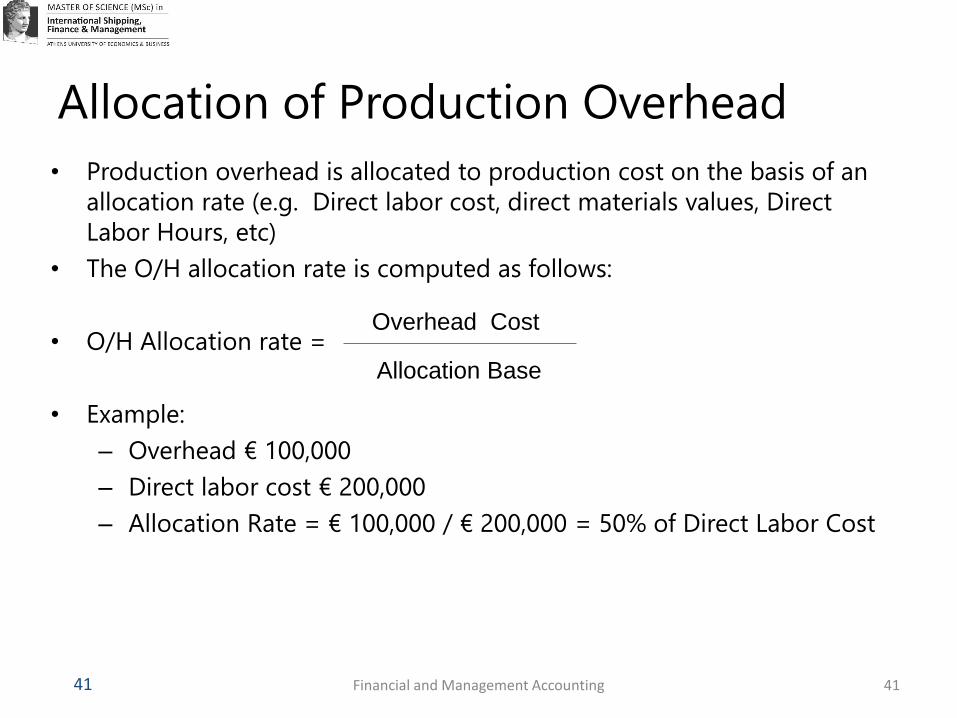
Allocation of Production Overhead
• Production overhead is allocated to production cost on the basis of an
allocation rate (e.g. Direct labor cost, direct materials values, Direct
Labor Hours, etc)
• The O/H allocation rate is computed as follows:
• O/H Allocation rate =
• Example:
– Overhead € 100,000
– Direct labor cost € 200,000
– Allocation Rate = € 100,000 / € 200,000 = 50% of Direct Labor Cost
Financial and Management Accounting
Overhead Cost
Allocation Base
41 41
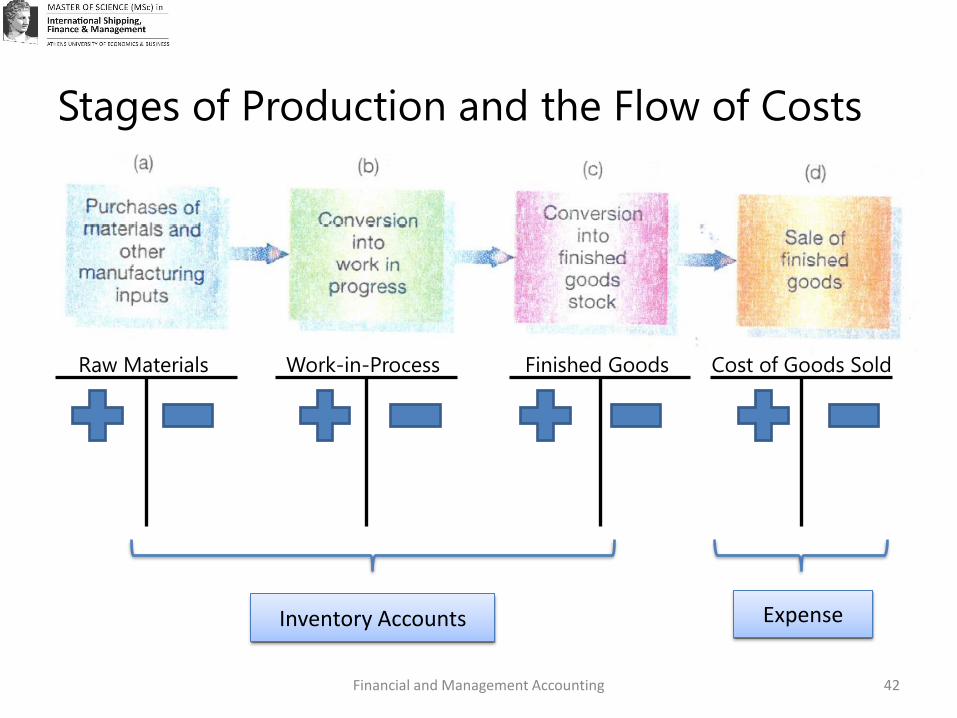
Stages of Production and the Flow of Costs
Financial and Management Accounting
Raw Materials Work-in-Process Finished Goods Cost of Goods Sold
Inventory Accounts Expense
42
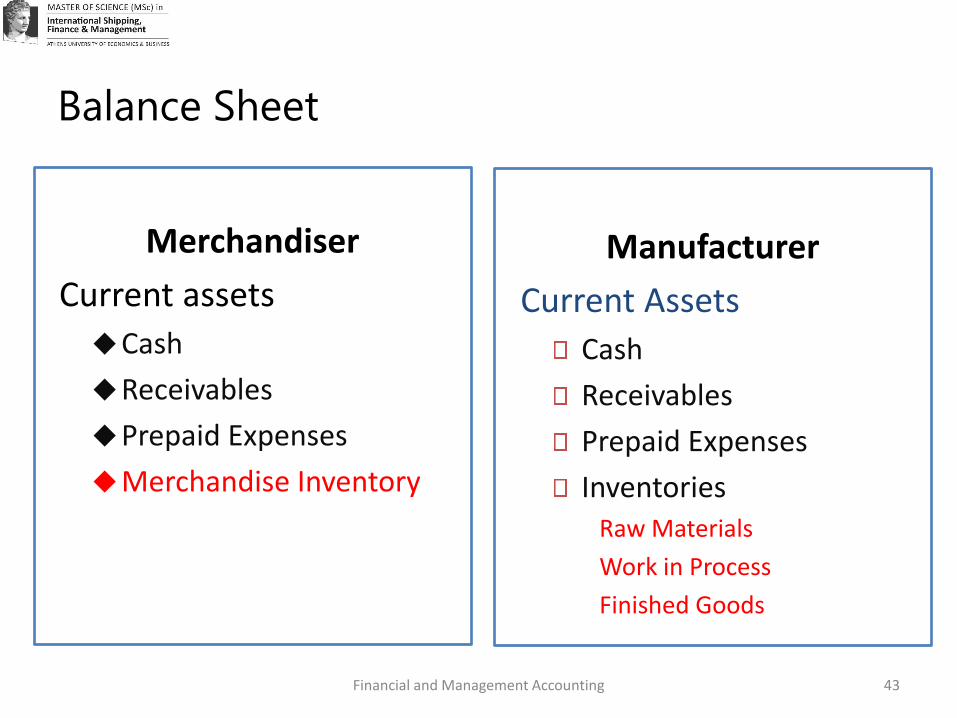
Balance Sheet
Merchandiser
Current assets
◆Cash
◆Receivables
◆Prepaid Expenses
◆Merchandise Inventory
Manufacturer
Current Assets
Cash
Receivables
Prepaid Expenses
InventoriesRaw Materials
Work in Process
Finished Goods
Financial and Management Accounting 43
Financial and Management Accounting
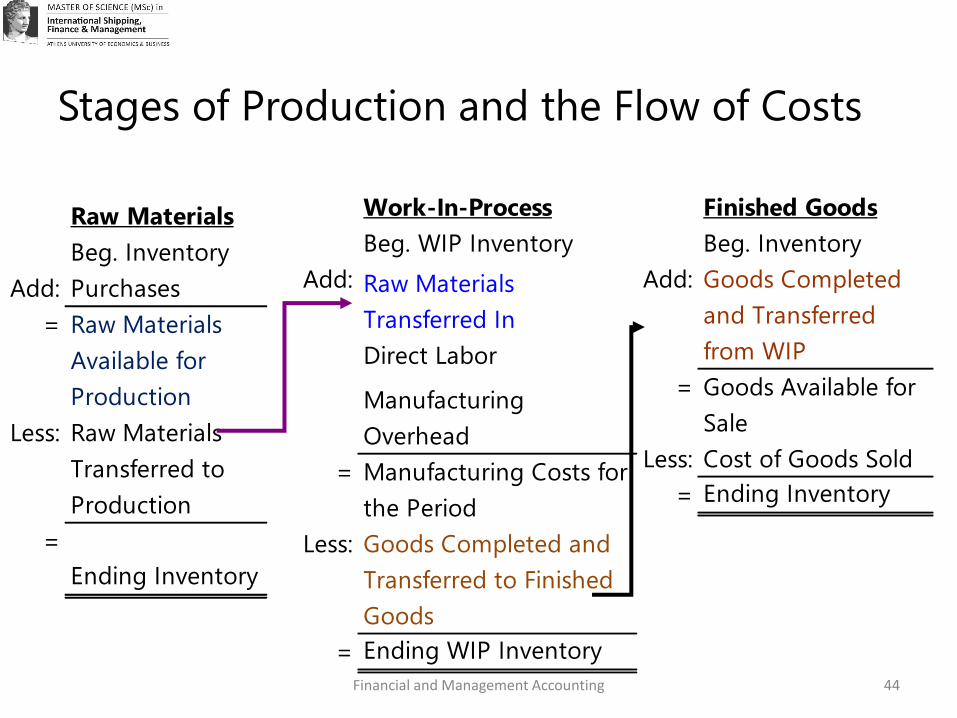
Stages of Production and the Flow of Costs
Raw Materials
Beg. Inventory
Add: Purchases
= Raw Materials
Available for
Production
Less: Raw Materials
Transferred to
Production
=
Ending Inventory
Work-In-Process
Beg. WIP Inventory
Add: Raw Materials
Transferred In
Direct LaborAllocated
Manufacturing
Overhead
= Manufacturing Costs for
the Period
Less: Goods Completed and
Transferred to Finished
Goods
= Ending WIP Inventory
Finished Goods
Beg. Inventory
Add: Goods Completed
and Transferred
from WIP
= Goods Available for
Sale
Less: Cost of Goods Sold
= Ending Inventory
44
Financial and Management Accounting
Stages of Production and the Flow of Costs -
Example
Raw Materials
Beg. Inventory
Add: Purchases
= Raw Materials
Available for
Production
Less: Raw Materials
Transferred to
Production
= Ending Inventory
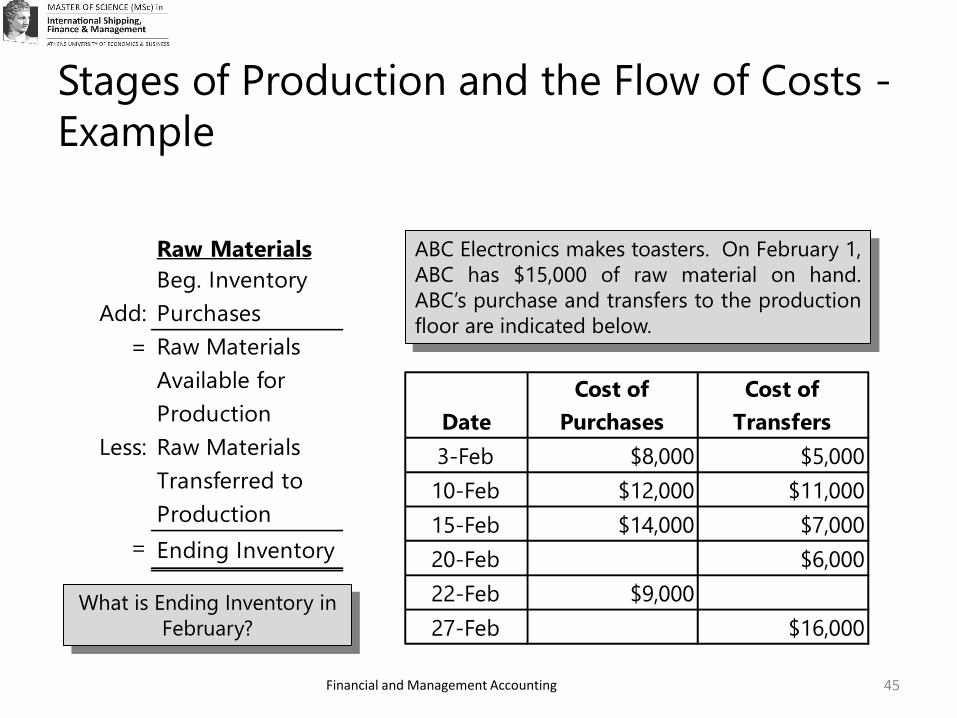
What is Ending Inventory in
February?
ABC Electronics makes toasters. On February 1,
ABC has $15,000 of raw material on hand.
ABC’s purchase and transfers to the production
floor are indicated below.
Date
Cost of
Purchases
Cost of
Transfers
3-Feb $8,000 $5,000
10-Feb $12,000 $11,000
15-Feb $14,000 $7,000
20-Feb $6,000
22-Feb $9,000
27-Feb $16,000
45
Financial and Management Accounting
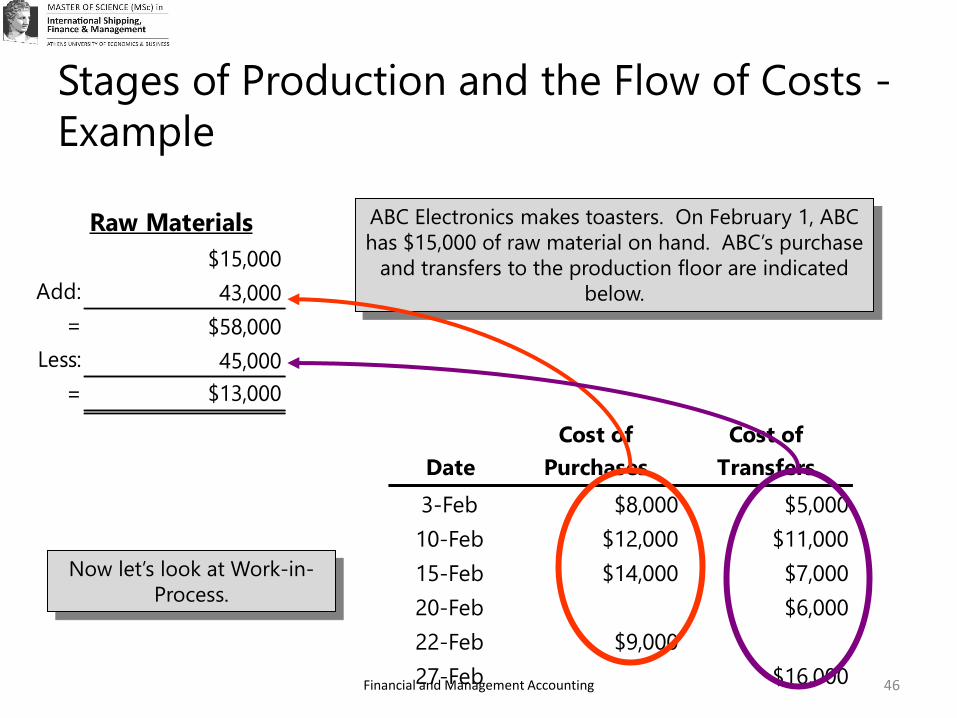
ABC Electronics makes toasters. On February 1, ABC
has $15,000 of raw material on hand. ABC’s purchase
and transfers to the production floor are indicated
below.
Date
Cost of
Purchases
Cost of
Transfers
3-Feb $8,000 $5,000
10-Feb $12,000 $11,000
15-Feb $14,000 $7,000
20-Feb $6,000
22-Feb $9,000
27-Feb $16,000
Stages of Production and the Flow of Costs -
Example
Now let’s look at Work-in-
Process.
Raw Materials
$15,000
Add: 43,000
= $58,000
Less: 45,000
= $13,000
46
Financial and Management Accounting
Stages of Production and the Flow of Costs -
Example
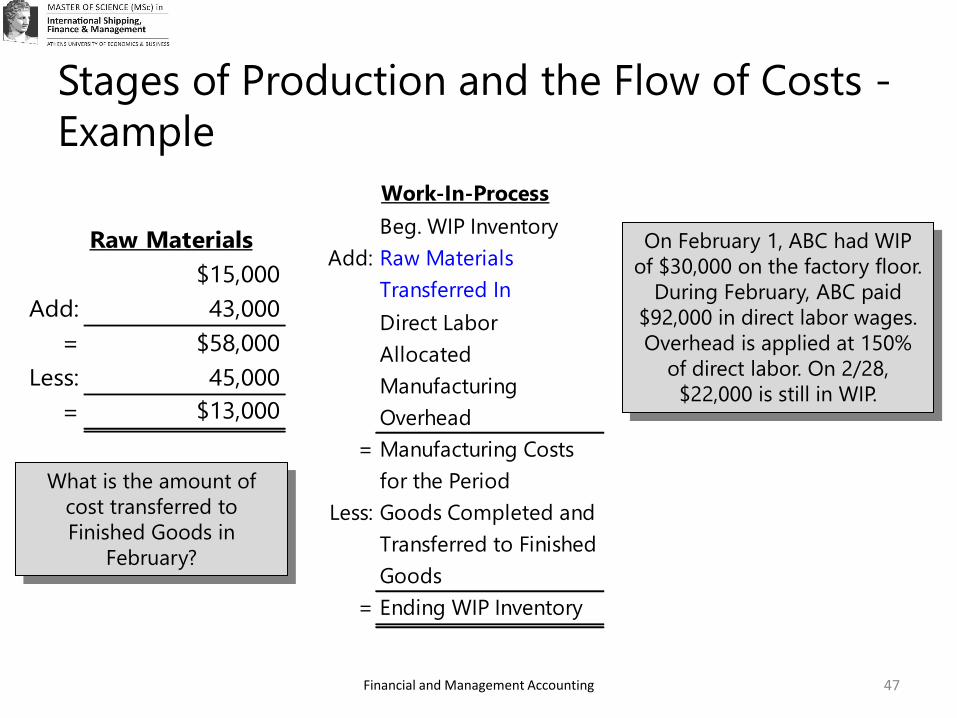
What is the amount of
cost transferred to
Finished Goods in
February?
Work-In-Process
Beg. WIP Inventory
Add: Raw Materials
Transferred In
Direct Labor
Allocated
Manufacturing
Overhead
= Manufacturing Costs
for the Period
Less: Goods Completed and
Transferred to Finished
Goods
= Ending WIP Inventory
Raw Materials
$15,000
Add: 43,000
= $58,000
Less: 45,000
= $13,000
On February 1, ABC had WIP
of $30,000 on the factory floor.
During February, ABC paid
$92,000 in direct labor wages.
Overhead is applied at 150%
of direct labor. On 2/28,
$22,000 is still in WIP.
47
Financial and Management Accounting
Stages of Production and the Flow of Costs -
Example
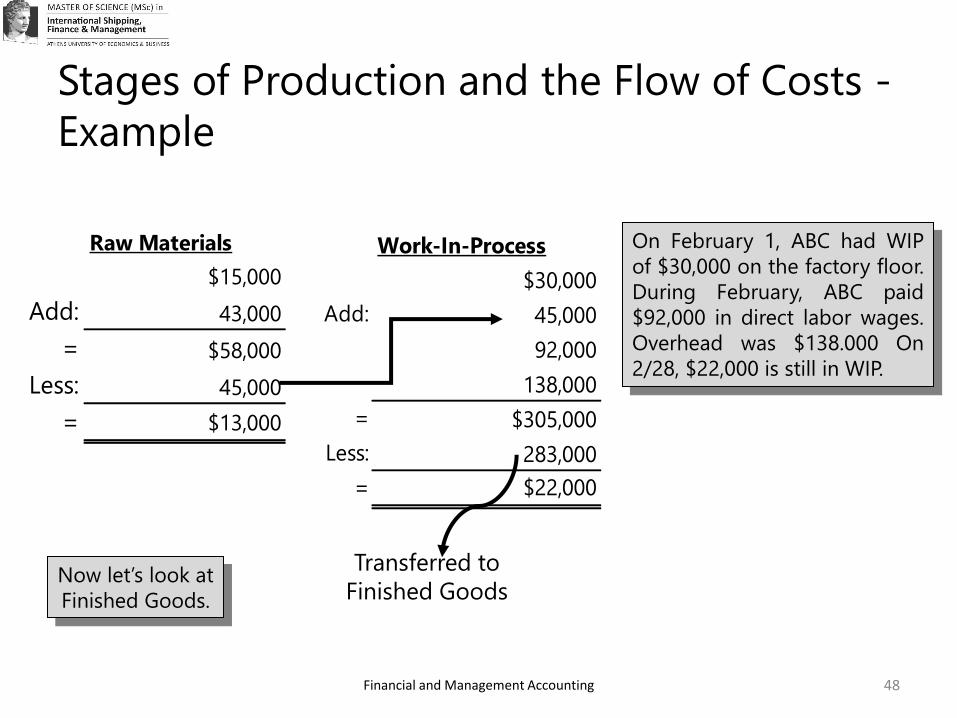
Work-In-Process
$30,000
Add: 45,000
92,000
138,000
= $305,000
Less: 283,000
= $22,000
On February 1, ABC had WIP
of $30,000 on the factory floor.
During February, ABC paid
$92,000 in direct labor wages.
Overhead was $138.000 On
2/28, $22,000 is still in WIP.
Raw Materials
$15,000
Add: 43,000
= $58,000
Less: 45,000
= $13,000
Now let’s look at
Finished Goods.
Transferred to
Finished Goods
48
Financial and Management Accounting
Stages of Production and the Flow of Costs -
Example
Work-In-Process
$30,000
Add: 45,000
92,000
138,000
= $305,000
Less: 283,000
= $22,000
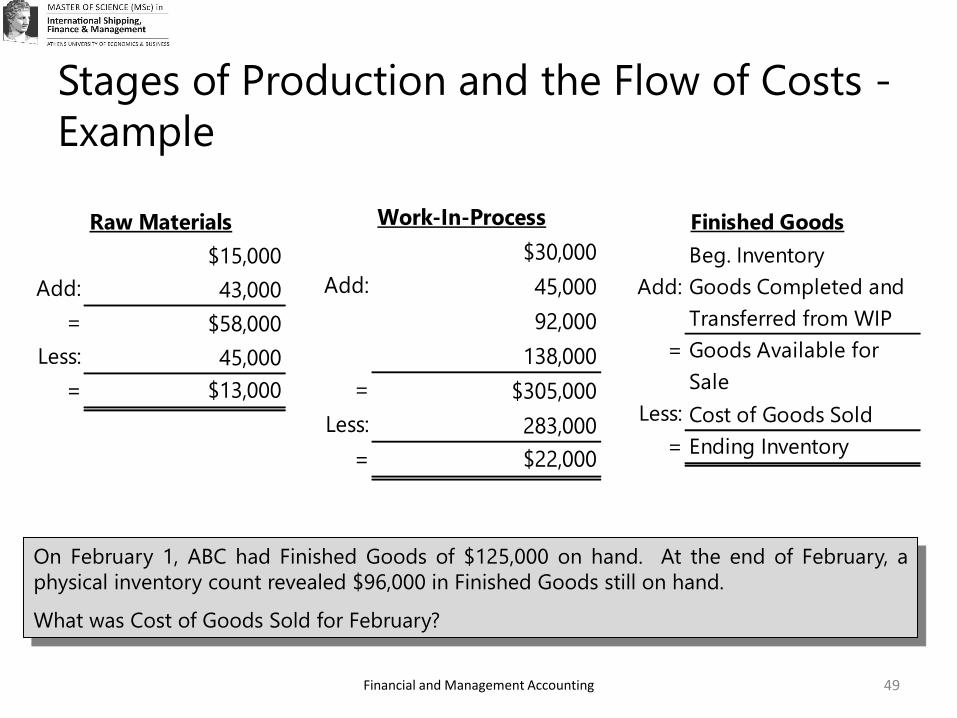
On February 1, ABC had Finished Goods of $125,000 on hand. At the end of February, a
physical inventory count revealed $96,000 in Finished Goods still on hand.
What was Cost of Goods Sold for February?
Raw Materials
$15,000
Add: 43,000
= $58,000
Less: 45,000
= $13,000
Finished Goods
Beg. Inventory
Add: Goods Completed and
Transferred from WIP
= Goods Available for
Sale
Less: Cost of Goods Sold
= Ending Inventory
49
Financial and Management Accounting
Stages of Production and the Flow of Costs -
Example
Work-In-Process
$30,000
Add: 45,000
92,000
138,000
= $305,000
Less: 283,000
= $22,000
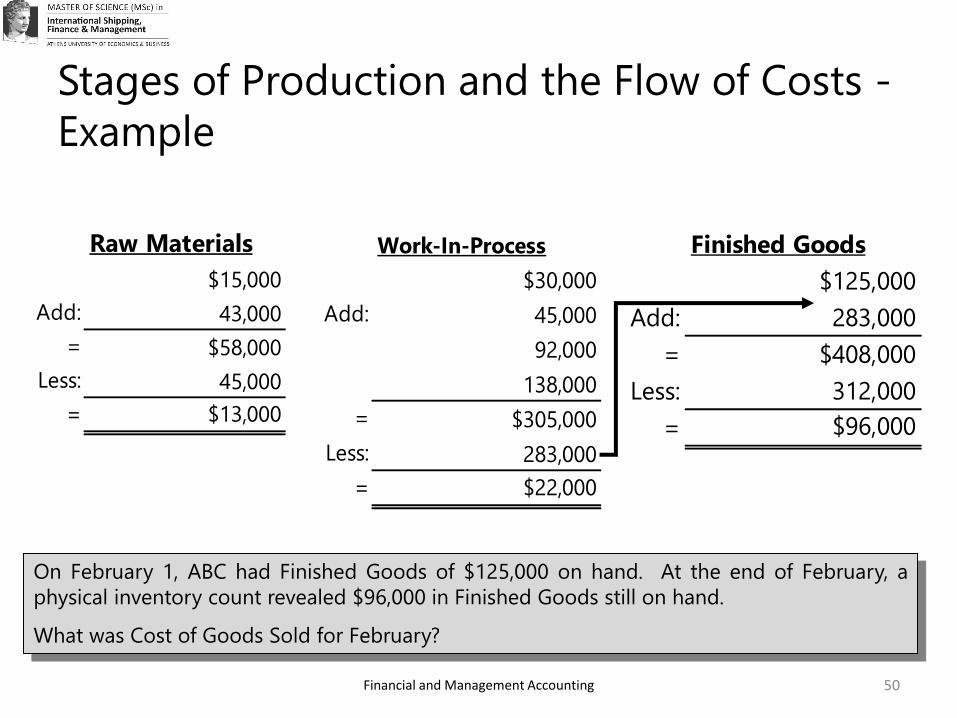
On February 1, ABC had Finished Goods of $125,000 on hand. At the end of February, a
physical inventory count revealed $96,000 in Finished Goods still on hand.
What was Cost of Goods Sold for February?
Raw Materials
$15,000
Add: 43,000
= $58,000
Less: 45,000
= $13,000
Finished Goods
$125,000
Add: 283,000
= $408,000
Less: 312,000
= $96,000
50
Financial and Management Accounting
Schedule of goods manufactured and sold
• A report for internal reporting
• Summarize and reports manufacturing costs for
management use
51
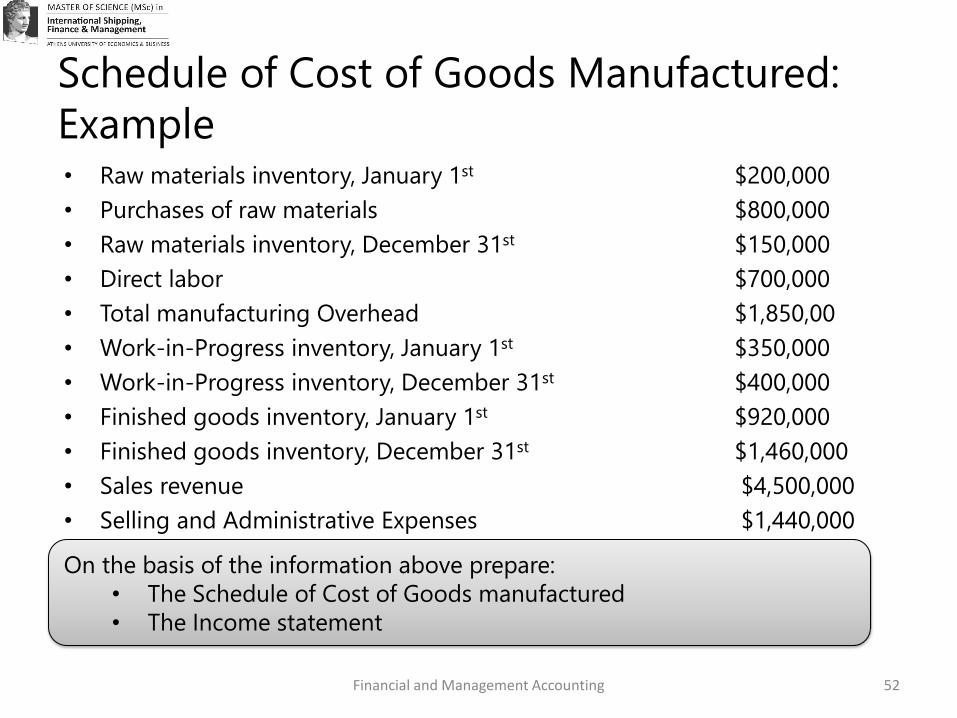
Schedule of Cost of Goods Manufactured:
Example • Raw materials inventory, January 1st $200,000
• Purchases of raw materials $800,000
• Raw materials inventory, December 31st $150,000
• Direct labor $700,000
• Total manufacturing Overhead $1,850,00
• Work-in-Progress inventory, January 1st $350,000
• Work-in-Progress inventory, December 31st $400,000
• Finished goods inventory, January 1st $920,000
• Finished goods inventory, December 31st $1,460,000
• Sales revenue $4,500,000
• Selling and Administrative Expenses $1,440,000
Financial and Management Accounting
On the basis of the information above prepare:
• The Schedule of Cost of Goods manufactured
• The Income statement
52
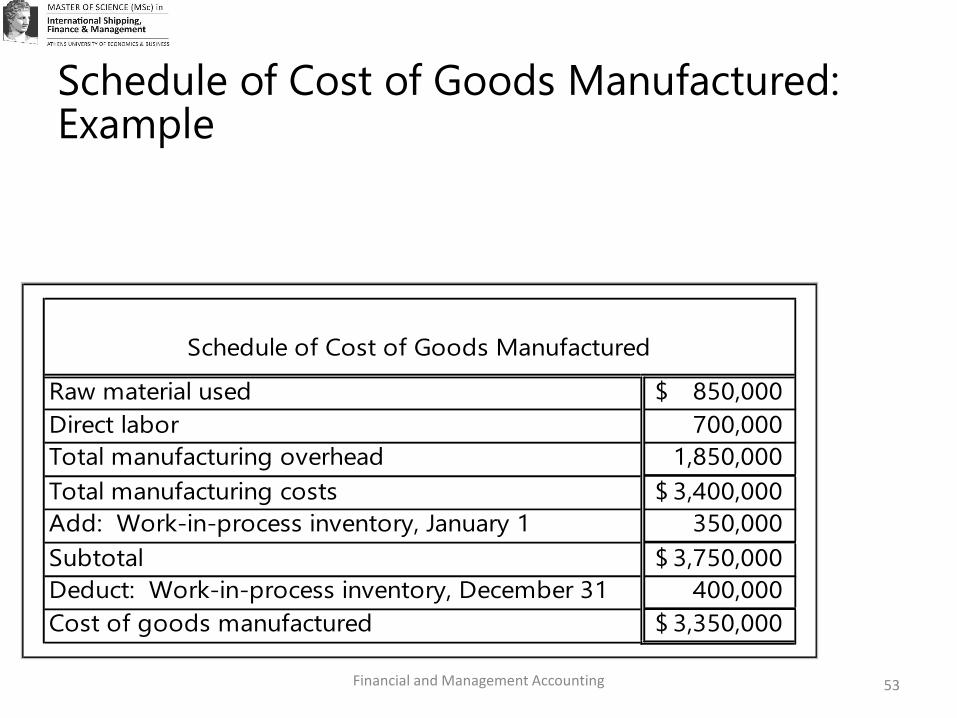
Schedule of Cost of Goods Manufactured
Raw material used 850,000$
Direct labor 700,000
Total manufacturing overhead 1,850,000
Total manufacturing costs 3,400,000$
Add: Work-in-process inventory, January 1 350,000
Subtotal 3,750,000$
Deduct: Work-in-process inventory, December 31 400,000
Cost of goods manufactured 3,350,000$
Schedule of Cost of Goods Manufactured: Example
Financial and Management Accounting 53
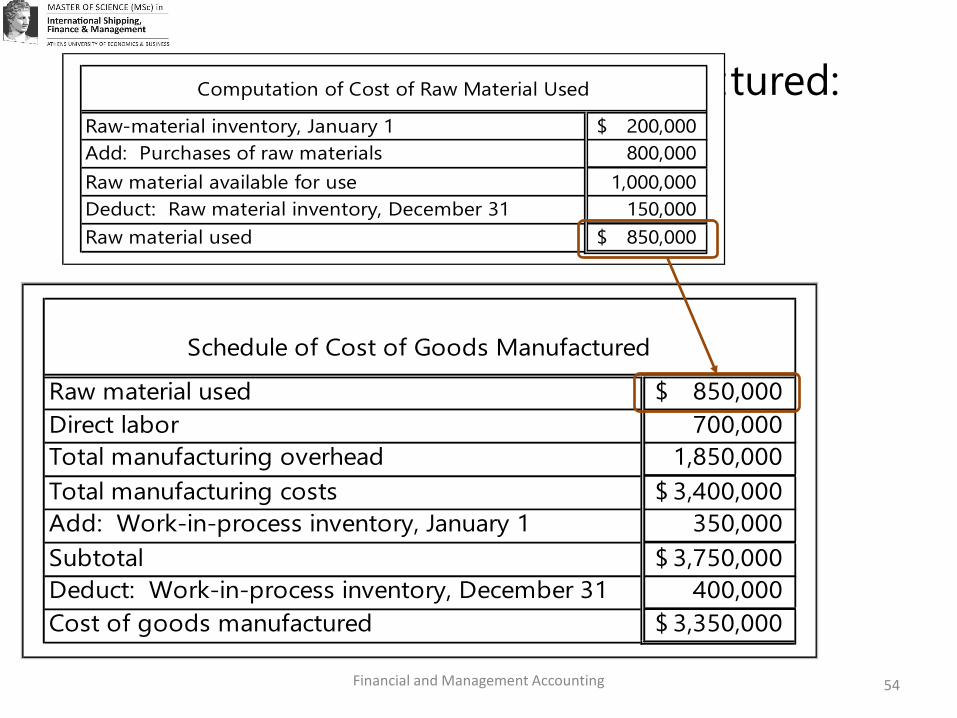
Schedule of Cost of Goods Manufactured
Raw material used 850,000$
Direct labor 700,000
Total manufacturing overhead 1,850,000
Total manufacturing costs 3,400,000$
Add: Work-in-process inventory, January 1 350,000
Subtotal 3,750,000$
Deduct: Work-in-process inventory, December 31 400,000
Cost of goods manufactured 3,350,000$
Schedule of Cost of Goods Manufactured: Example
Computation of Cost of Raw Material Used
Raw-material inventory, January 1 200,000$
Add: Purchases of raw materials 800,000
Raw material available for use 1,000,000
Deduct: Raw material inventory, December 31 150,000
Raw material used 850,000$
Financial and Management Accounting 54
Schedule of Cost of Goods Manufactured
Raw material used 850,000$
Direct labor 700,000
Total manufacturing overhead 1,850,000
Total manufacturing costs 3,400,000$
Add: Work-in-process inventory, January 1 350,000
Subtotal 3,750,000$
Deduct: Work-in-process inventory, December 31 400,000
Cost of goods manufactured 3,350,000$
Schedule of Cost of Goods Manufactured: Example
Financial and Management Accounting 55
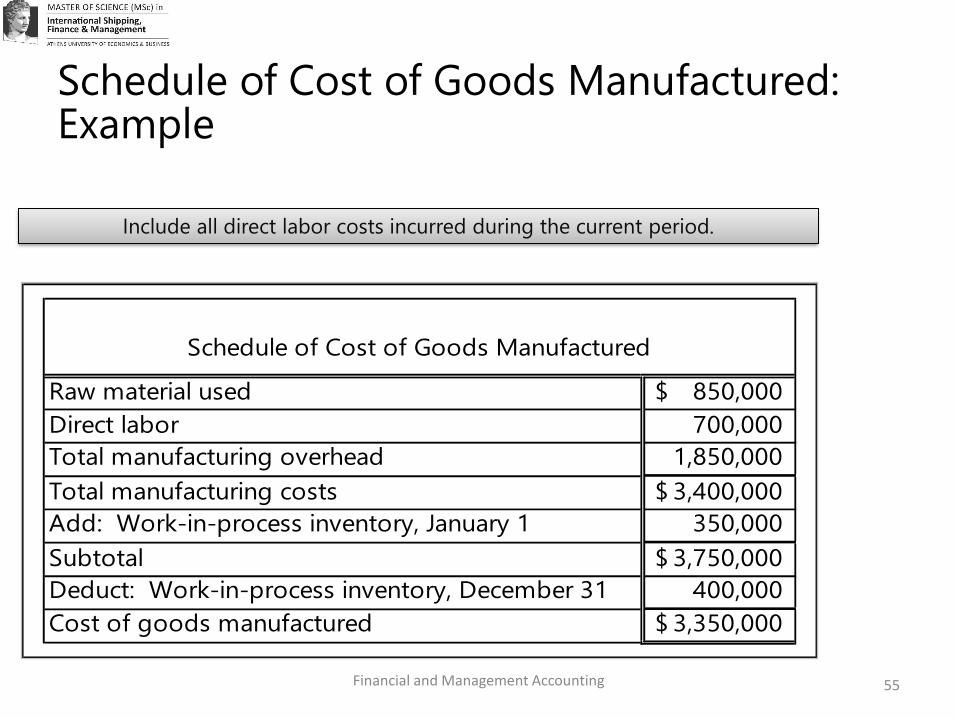
Include all direct labor costs incurred during the current period.
Schedule of Cost of Goods Manufactured
Raw material used 850,000$
Direct labor 700,000
Total manufacturing overhead 1,850,000
Total manufacturing costs 3,400,000$
Add: Work-in-process inventory, January 1 350,000
Subtotal 3,750,000$
Deduct: Work-in-process inventory, December 31 400,000
Cost of goods manufactured 3,350,000$
Schedule of Cost of Goods Manufactured: Example
Financial and Management Accounting 56
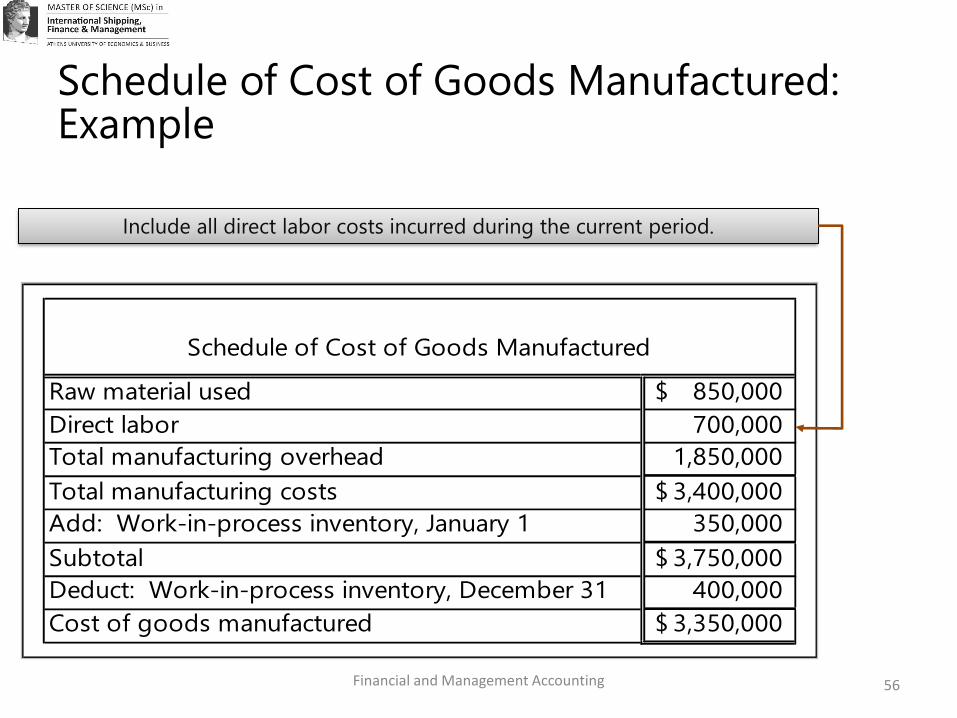
Include all direct labor costs incurred during the current period.
Schedule of Cost of Goods Manufactured
Raw material used 850,000$
Direct labor 700,000
Total manufacturing overhead 1,850,000
Total manufacturing costs 3,400,000$
Add: Work-in-process inventory, January 1 350,000
Subtotal 3,750,000$
Deduct: Work-in-process inventory, December 31 400,000
Cost of goods manufactured 3,350,000$
Schedule of Cost of Goods Manufactured: Example
Financial and Management Accounting 57
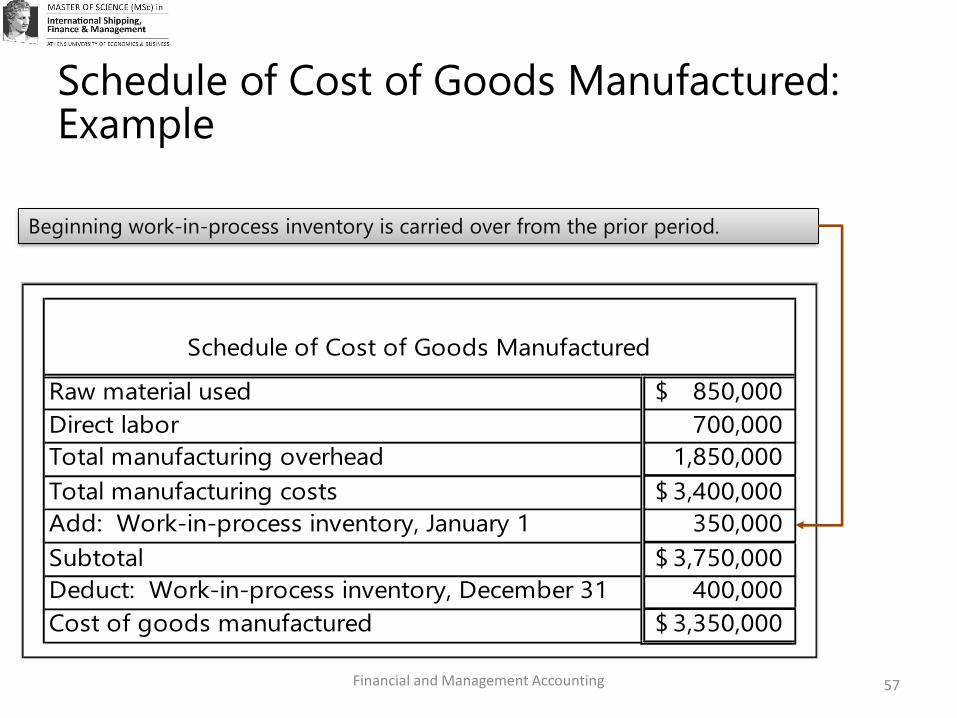
Beginning work-in-process inventory is carried over from the prior period.
Schedule of Cost of Goods Manufactured
Raw material used 850,000$
Direct labor 700,000
Total manufacturing overhead 1,850,000
Total manufacturing costs 3,400,000$
Add: Work-in-process inventory, January 1 350,000
Subtotal 3,750,000$
Deduct: Work-in-process inventory, December 31 400,000
Cost of goods manufactured 3,350,000$
Schedule of Cost of Goods Manufactured: Example
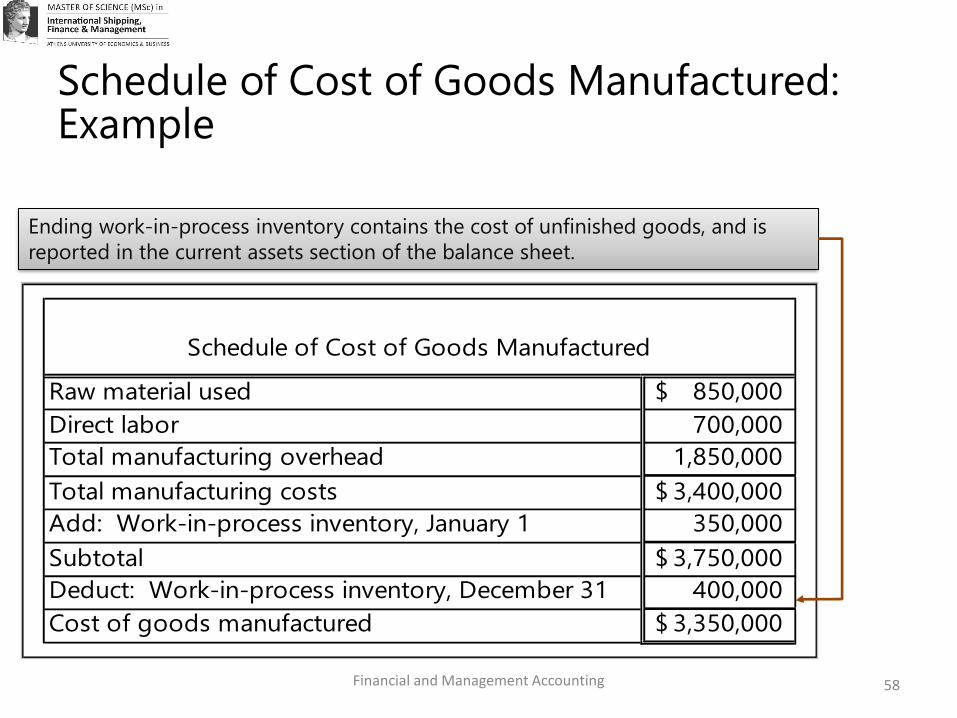
Financial and Management Accounting 58
Ending work-in-process inventory contains the cost of unfinished goods, and is
reported in the current assets section of the balance sheet.
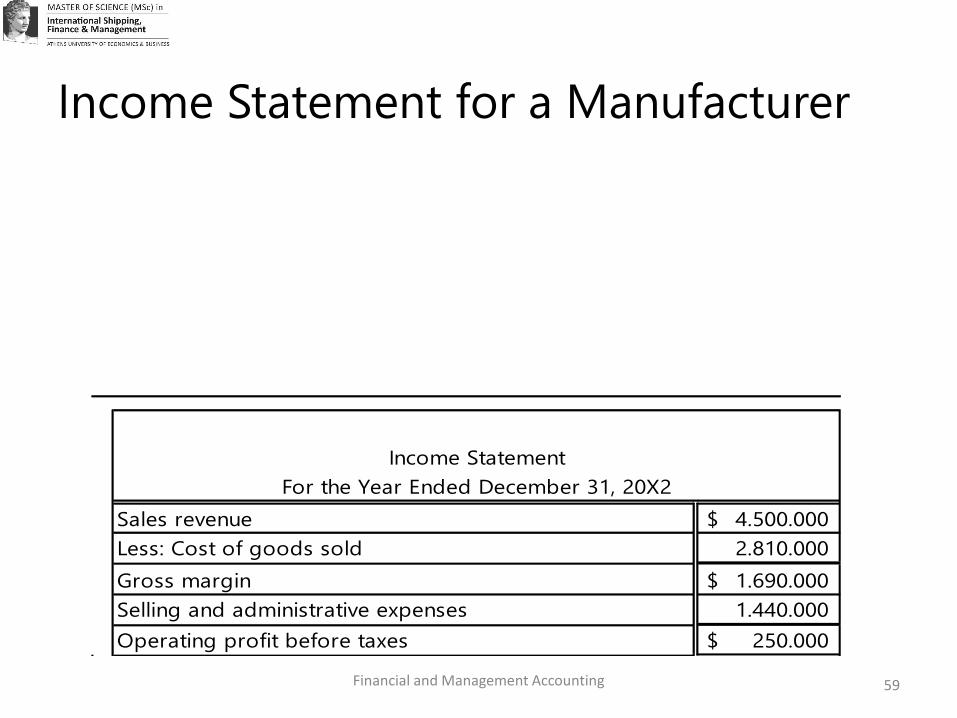
Income Statement for a Manufacturer
Financial and Management Accounting
Income Statement
For the Year Ended December 31, 20X2
Sales revenue 4.500.000$
Less: Cost of goods sold 2.810.000
Gross margin 1.690.000$
Selling and administrative expenses 1.440.000
Operating profit before taxes 250.000$
59
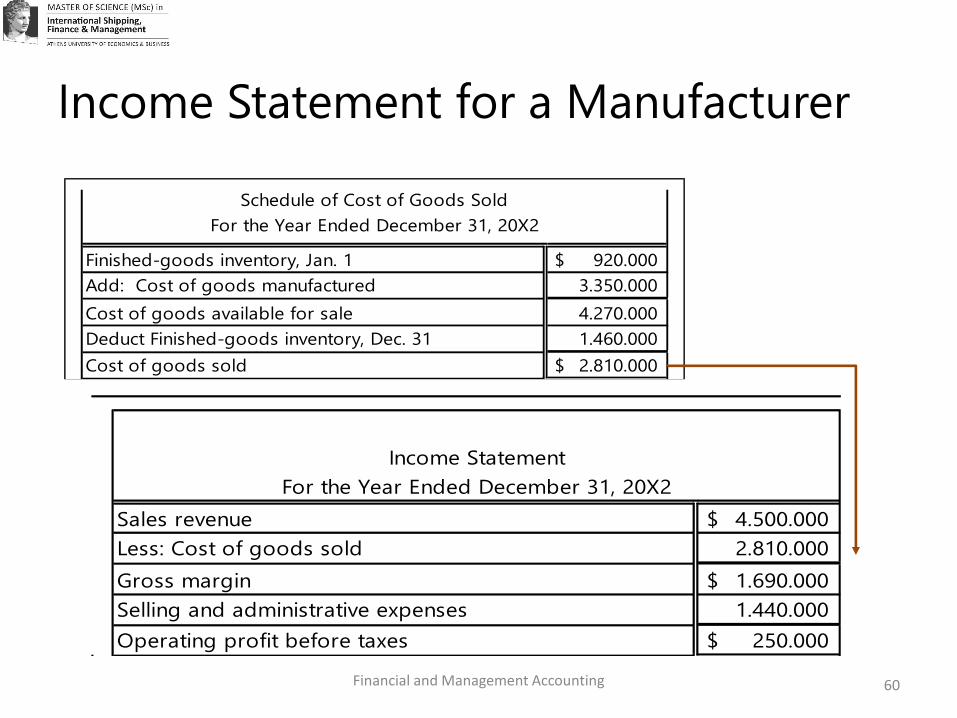
Income Statement for a Manufacturer
Financial and Management Accounting
Income Statement
For the Year Ended December 31, 20X2
Sales revenue 4.500.000$
Less: Cost of goods sold 2.810.000
Gross margin 1.690.000$
Selling and administrative expenses 1.440.000
Operating profit before taxes 250.000$
60
Schedule of Cost of Goods Sold
For the Year Ended December 31, 20X2
Finished-goods inventory, Jan. 1 920.000$
Add: Cost of goods manufactured 3.350.000
Cost of goods available for sale 4.270.000
Deduct Finished-goods inventory, Dec. 31 1.460.000
Cost of goods sold 2.810.000$
Financial and Management Accounting
Job Costing versus Process Costing
61
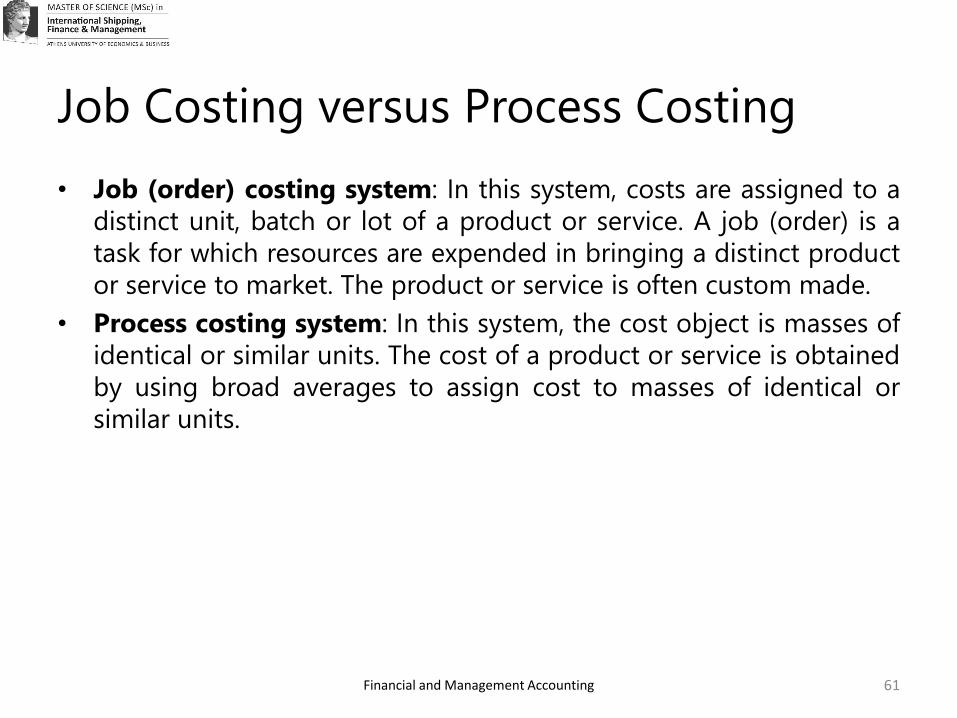
• Job (order) costing system: In this system, costs are assigned to a
distinct unit, batch or lot of a product or service. A job (order) is a
task for which resources are expended in bringing a distinct product
or service to market. The product or service is often custom made.
• Process costing system: In this system, the cost object is masses of
identical or similar units. The cost of a product or service is obtained
by using broad averages to assign cost to masses of identical or
similar units.
Financial and Management Accounting
Job Costing versus Process Costing
62
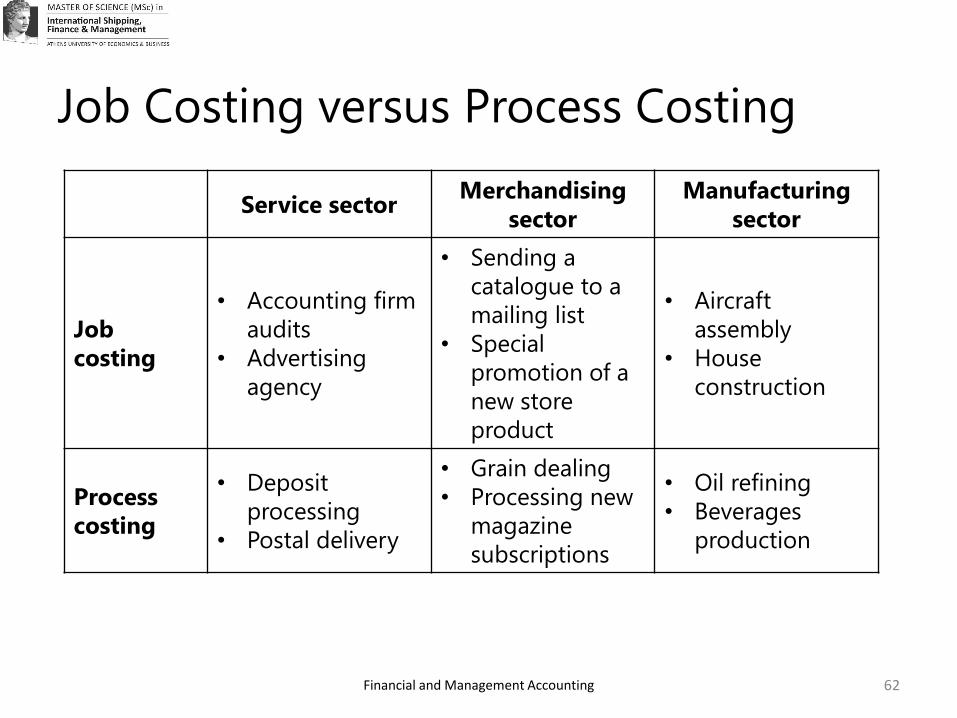
Service sectorMerchandising
sector
Manufacturing
sector
Job
costing
• Accounting firm
audits
• Advertising
agency
• Sending a
catalogue to a
mailing list
• Special
promotion of a
new store
product
• Aircraft
assembly
• House
construction
Process
costing
• Deposit
processing
• Postal delivery
• Grain dealing
• Processing new
magazine
subscriptions
• Oil refining
• Beverages
production
Financial and Management Accounting
An Illustration of a Job-costing System in
Manufacturing: General Ledger
63
Financial and Management Accounting
An Illustration of a Job-costing System in
Manufacturing: Explanation of Transactions
64
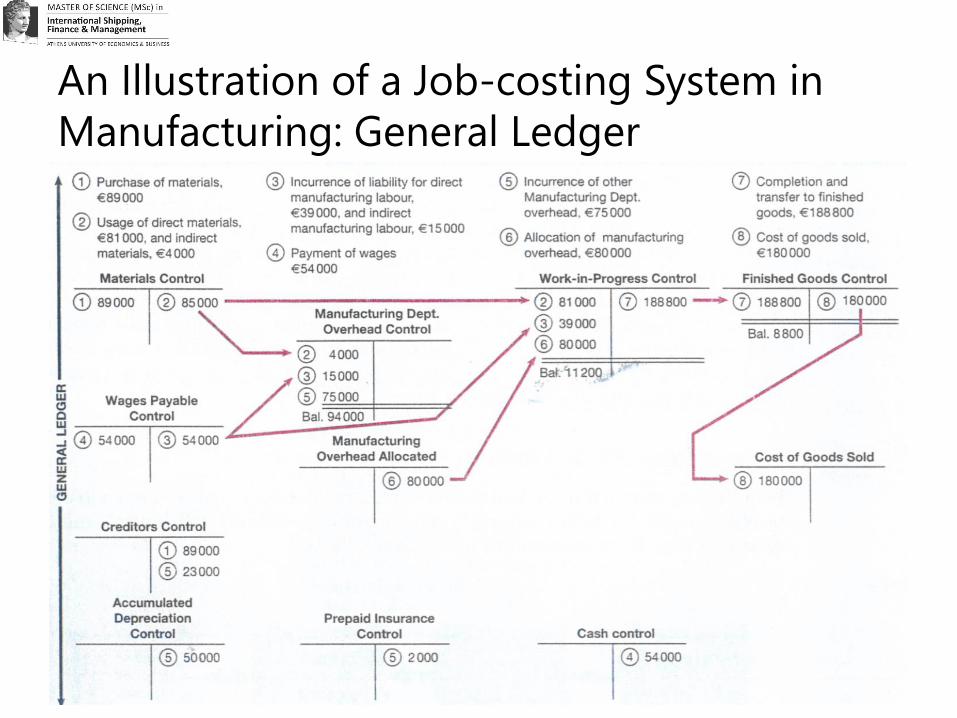
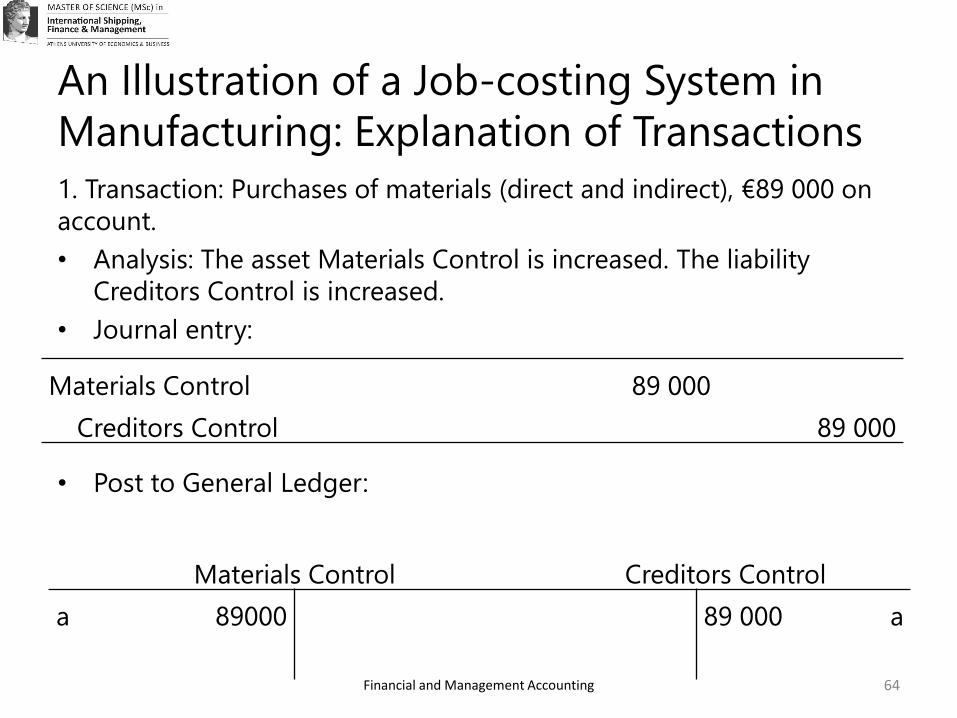
1. Transaction: Purchases of materials (direct and indirect), €89 000 on
account.
• Analysis: The asset Materials Control is increased. The liability
Creditors Control is increased.
• Journal entry:
• Post to General Ledger:
Materials Control 89 000
Creditors Control 89 000
Materials Control Creditors Control
a 89000 89 000 a
Financial and Management Accounting
An Illustration of a Job-costing System in
Manufacturing: Explanation of Transactions
65
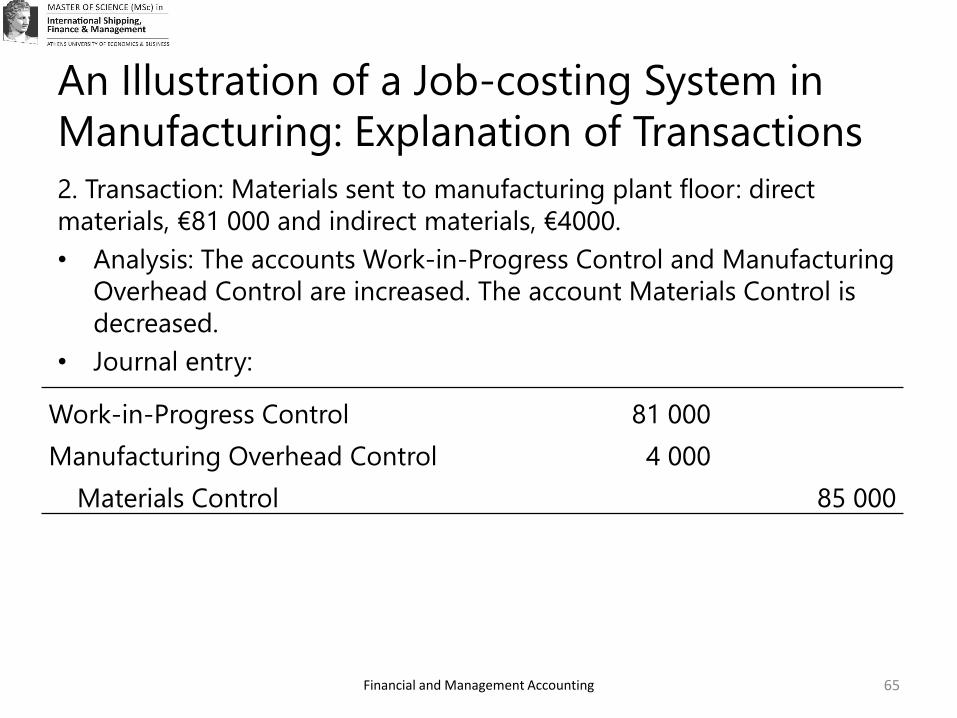
2. Transaction: Materials sent to manufacturing plant floor: direct
materials, €81 000 and indirect materials, €4000.
• Analysis: The accounts Work-in-Progress Control and Manufacturing
Overhead Control are increased. The account Materials Control is
decreased.
• Journal entry:
Work-in-Progress Control 81 000
Manufacturing Overhead Control 4 000
Materials Control 85 000
Financial and Management Accounting
An Illustration of a Job-costing System in
Manufacturing: Explanation of Transactions
66
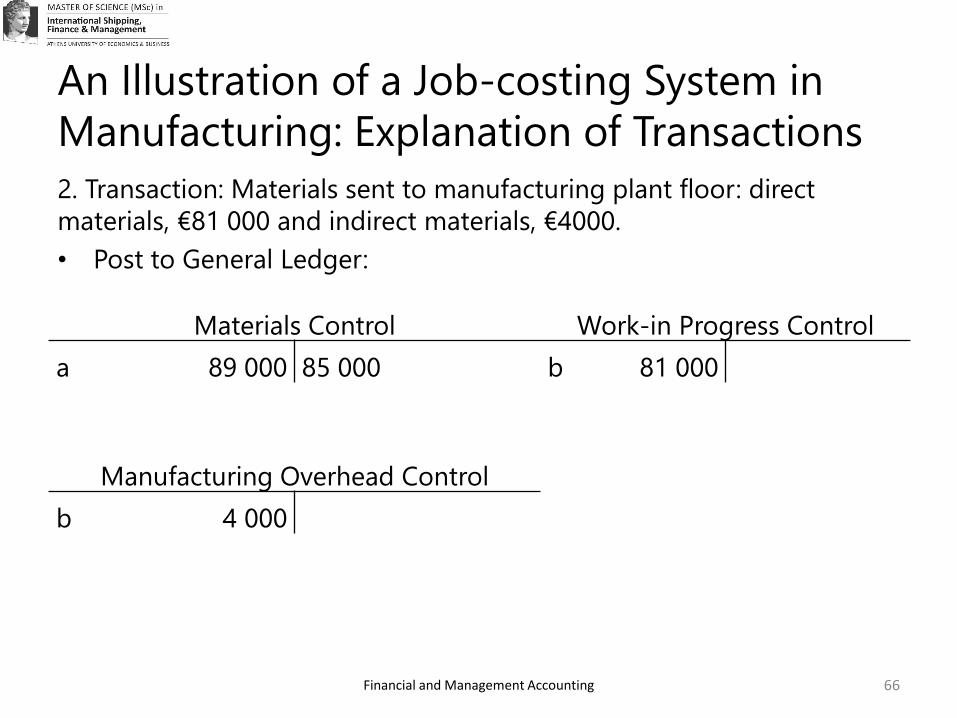
2. Transaction: Materials sent to manufacturing plant floor: direct
materials, €81 000 and indirect materials, €4000.
• Post to General Ledger:
Materials Control Work-in Progress Control
a 89 000 85 000 b 81 000
Manufacturing Overhead Control
b 4 000
Financial and Management Accounting
An Illustration of a Job-costing System in
Manufacturing: Explanation of Transactions
67
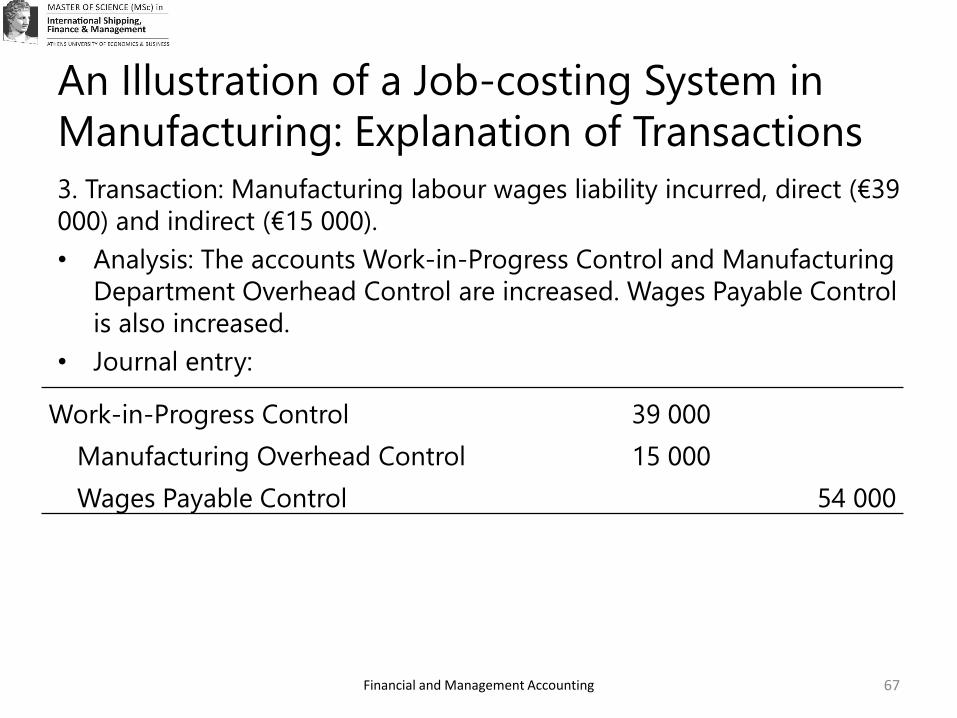
3. Transaction: Manufacturing labour wages liability incurred, direct (€39
000) and indirect (€15 000).
• Analysis: The accounts Work-in-Progress Control and Manufacturing
Department Overhead Control are increased. Wages Payable Control
is also increased.
• Journal entry:
Work-in-Progress Control 39 000
Manufacturing Overhead Control 15 000
Wages Payable Control 54 000
Financial and Management Accounting
An Illustration of a Job-costing System in
Manufacturing: Explanation of Transactions
68
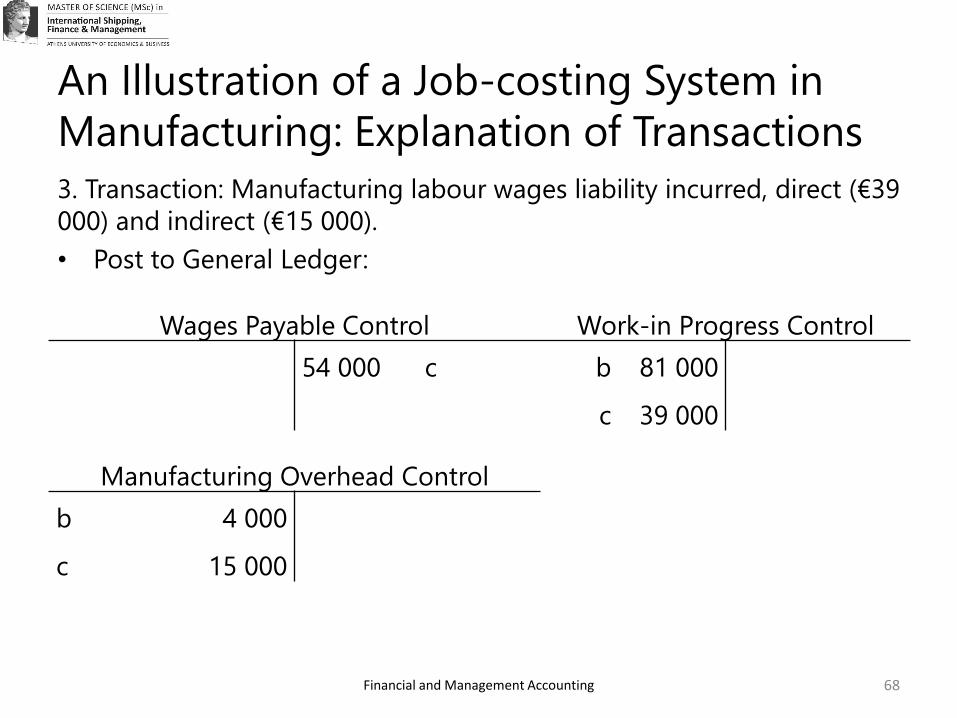
3. Transaction: Manufacturing labour wages liability incurred, direct (€39
000) and indirect (€15 000).
• Post to General Ledger:
Wages Payable Control Work-in Progress Control
54 000 c b
c
81 000
39 000
Manufacturing Overhead Control
b
c
4 000
15 000
Financial and Management Accounting
An Illustration of a Job-costing System in
Manufacturing: Explanation of Transactions
69
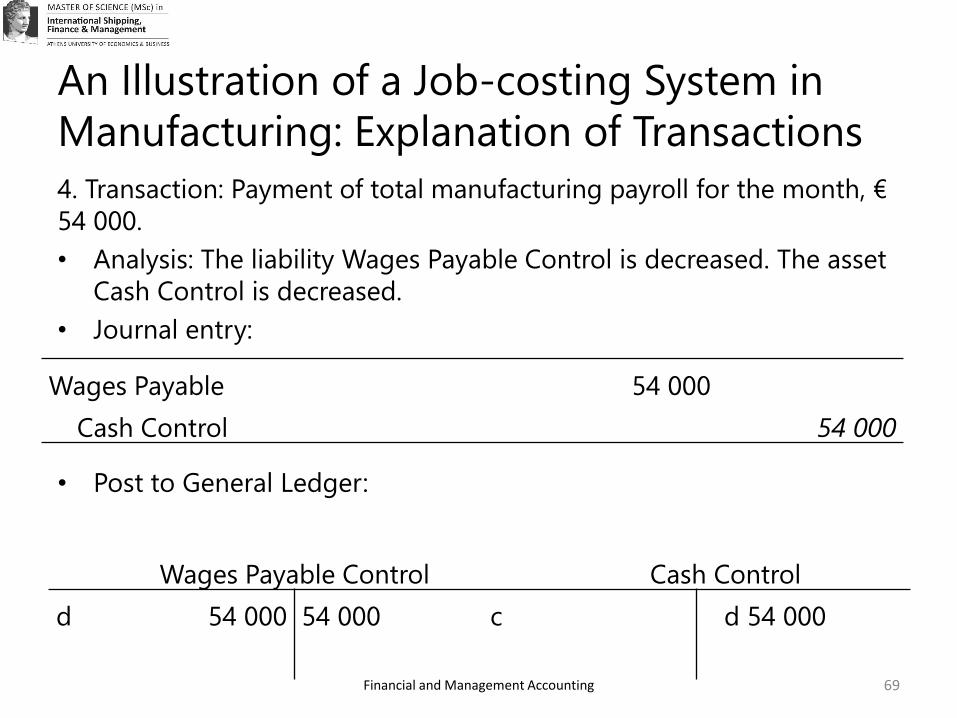
4. Transaction: Payment of total manufacturing payroll for the month, €
54 000.
• Analysis: The liability Wages Payable Control is decreased. The asset
Cash Control is decreased.
• Journal entry:
• Post to General Ledger:
Wages Payable 54 000
Cash Control 54 000
Wages Payable Control Cash Control
d 54 000 54 000 c d 54 000
Financial and Management Accounting
An Illustration of a Job-costing System in
Manufacturing: Explanation of Transactions
70
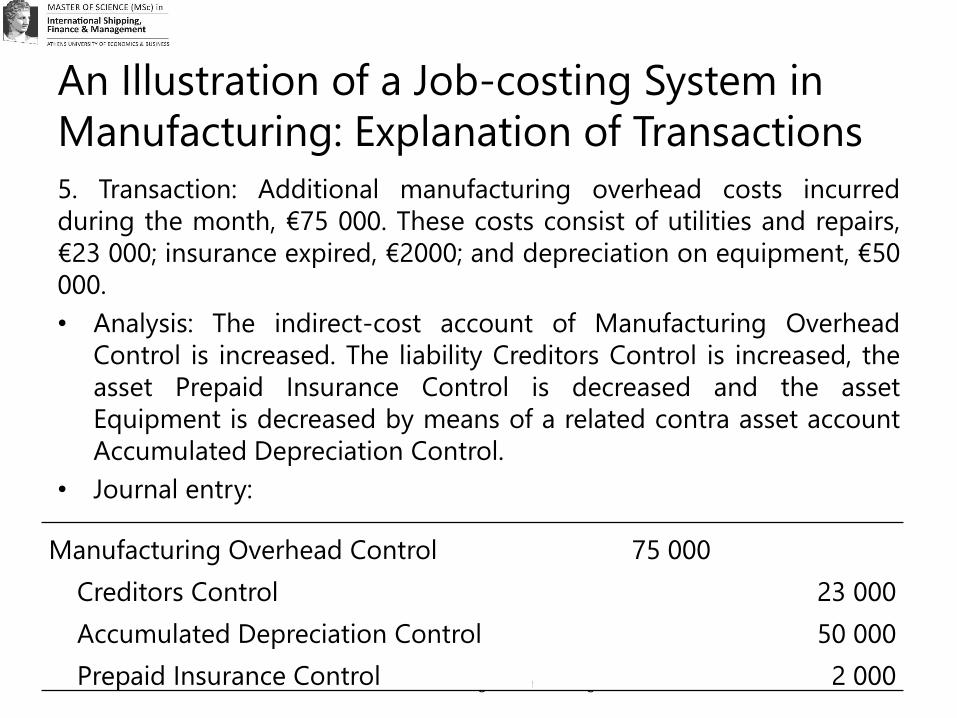
5. Transaction: Additional manufacturing overhead costs incurred
during the month, €75 000. These costs consist of utilities and repairs,
€23 000; insurance expired, €2000; and depreciation on equipment, €50
000.
• Analysis: The indirect-cost account of Manufacturing Overhead
Control is increased. The liability Creditors Control is increased, the
asset Prepaid Insurance Control is decreased and the asset
Equipment is decreased by means of a related contra asset account
Accumulated Depreciation Control.
• Journal entry:
Manufacturing Overhead Control 75 000
Creditors Control 23 000
Accumulated Depreciation Control 50 000
Prepaid Insurance Control 2 000
Financial and Management Accounting
An Illustration of a Job-costing System in
Manufacturing: Explanation of Transactions
71
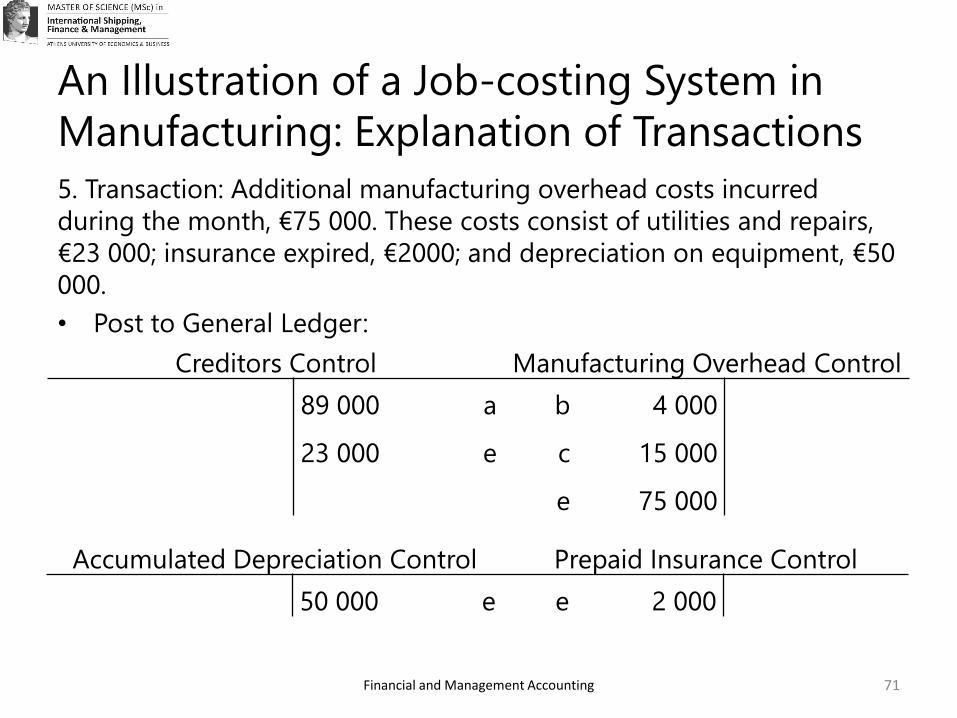
5. Transaction: Additional manufacturing overhead costs incurred
during the month, €75 000. These costs consist of utilities and repairs,
€23 000; insurance expired, €2000; and depreciation on equipment, €50
000.
• Post to General Ledger:
Creditors Control Manufacturing Overhead Control
89 000
23 000
a
e
b
c
e
4 000
15 000
75 000
Accumulated Depreciation Control Prepaid Insurance Control
50 000 e e 2 000
Financial and Management Accounting
An Illustration of a Job-costing System in
Manufacturing: Explanation of Transactions
72
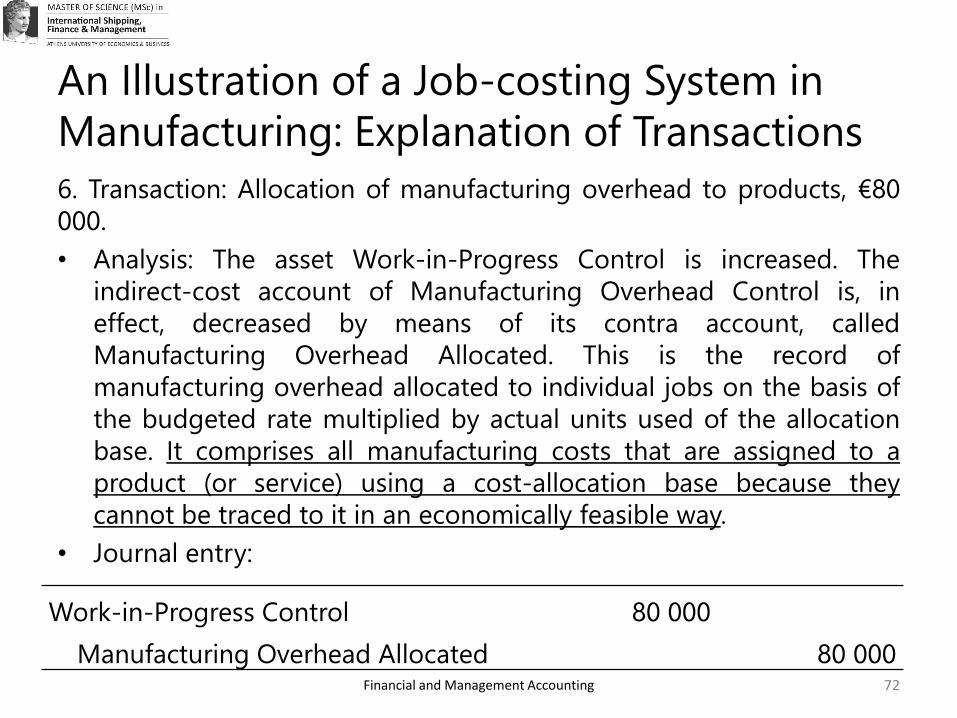
6. Transaction: Allocation of manufacturing overhead to products, €80
000.
• Analysis: The asset Work-in-Progress Control is increased. The
indirect-cost account of Manufacturing Overhead Control is, in
effect, decreased by means of its contra account, called
Manufacturing Overhead Allocated. This is the record of
manufacturing overhead allocated to individual jobs on the basis of
the budgeted rate multiplied by actual units used of the allocation
base. It comprises all manufacturing costs that are assigned to a
product (or service) using a cost-allocation base because they
cannot be traced to it in an economically feasible way.
• Journal entry:
Work-in-Progress Control 80 000
Manufacturing Overhead Allocated 80 000
Financial and Management Accounting
An Illustration of a Job-costing System in
Manufacturing: Explanation of Transactions
73
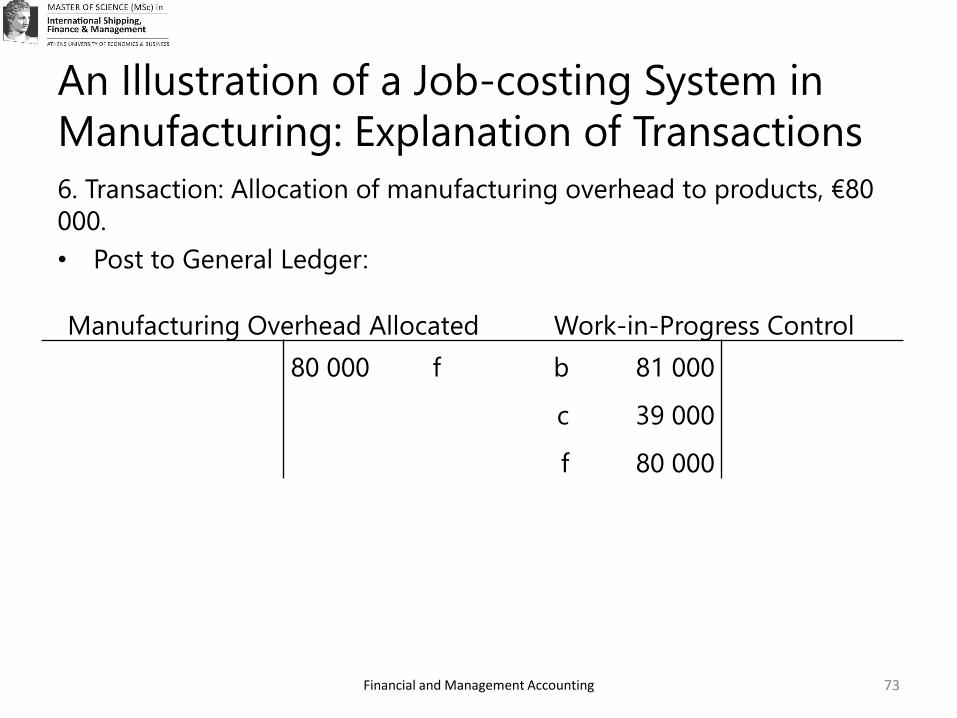
6. Transaction: Allocation of manufacturing overhead to products, €80
000.
• Post to General Ledger:
Manufacturing Overhead Allocated Work-in-Progress Control
80 000 f b
c
f
81 000
39 000
80 000
Financial and Management Accounting
An Illustration of a Job-costing System in
Manufacturing: Explanation of Transactions
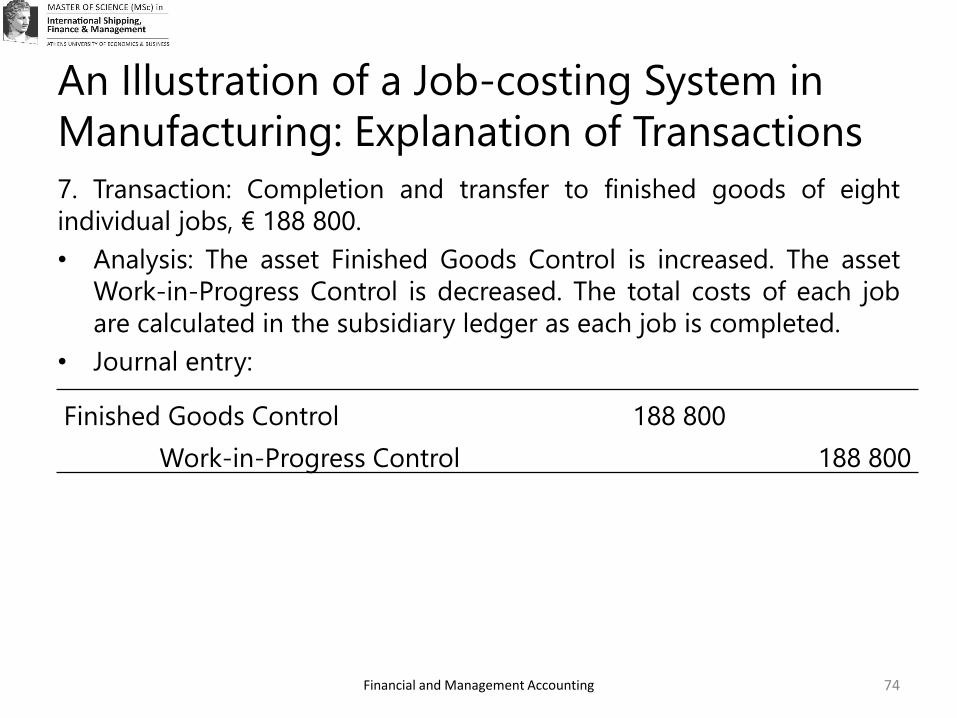
74
7. Transaction: Completion and transfer to finished goods of eight
individual jobs, € 188 800.
• Analysis: The asset Finished Goods Control is increased. The asset
Work-in-Progress Control is decreased. The total costs of each job
are calculated in the subsidiary ledger as each job is completed.
• Journal entry:
Finished Goods Control 188 800
Work-in-Progress Control 188 800
Financial and Management Accounting
An Illustration of a Job-costing System in
Manufacturing: Explanation of Transactions
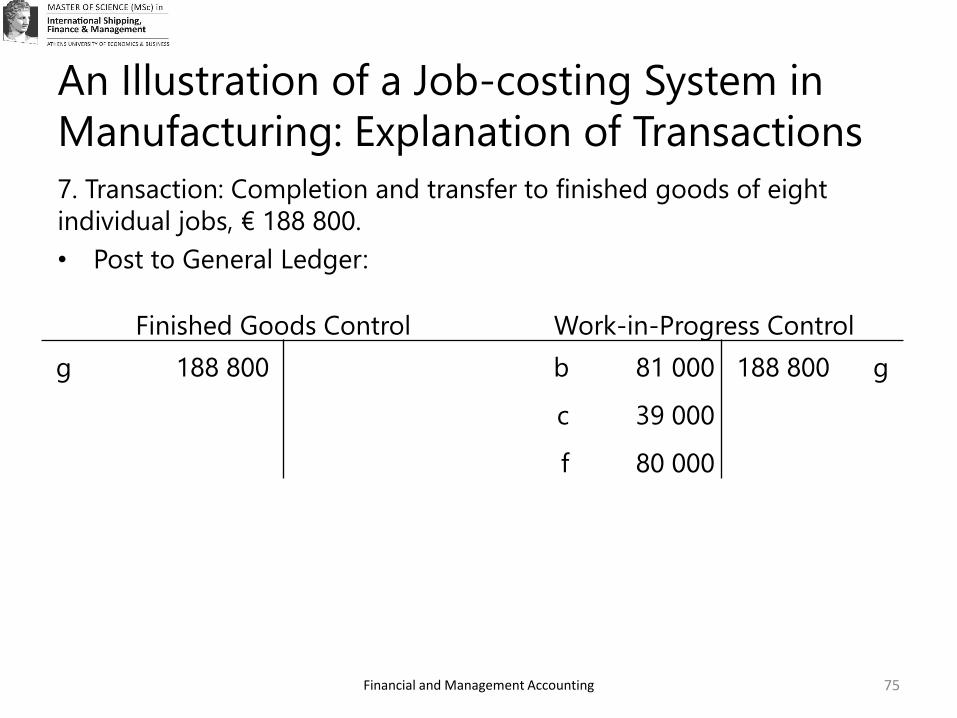
75
7. Transaction: Completion and transfer to finished goods of eight
individual jobs, € 188 800.
• Post to General Ledger:
Finished Goods Control Work-in-Progress Control
g 188 800 b
c
f
81 000
39 000
80 000
188 800 g
Financial and Management Accounting
An Illustration of a Job-costing System in
Manufacturing: Explanation of Transactions
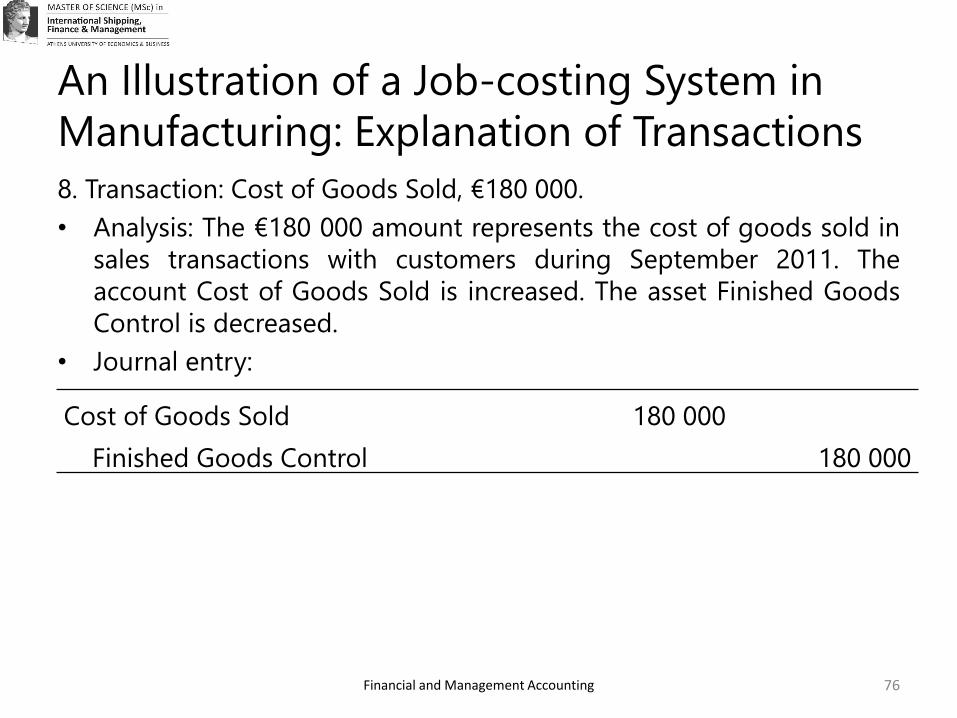
76
8. Transaction: Cost of Goods Sold, €180 000.
• Analysis: The €180 000 amount represents the cost of goods sold in
sales transactions with customers during September 2011. The
account Cost of Goods Sold is increased. The asset Finished Goods
Control is decreased.
• Journal entry:
Cost of Goods Sold 180 000
Finished Goods Control 180 000
Financial and Management Accounting
An Illustration of a Job-costing System in
Manufacturing: Explanation of Transactions
77
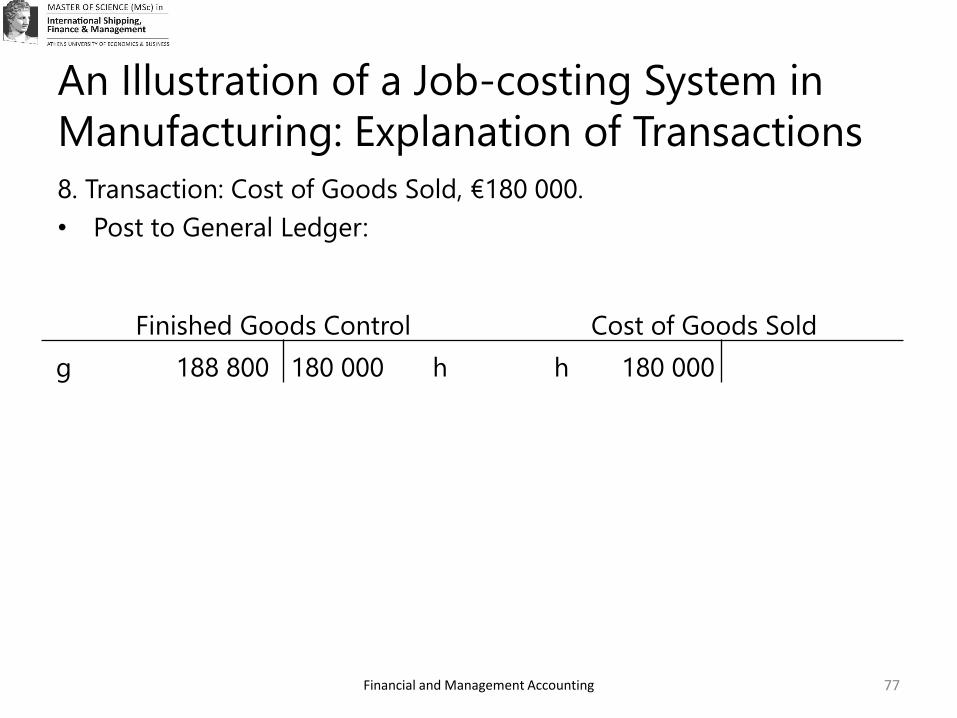
8. Transaction: Cost of Goods Sold, €180 000.
• Post to General Ledger:
Finished Goods Control Cost of Goods Sold
g 188 800 180 000 h h 180 000
Financial and Management Accounting
Ship Costs Assessment: An empirical
approach (Počuča, 2006)
78
Financial and Management Accounting
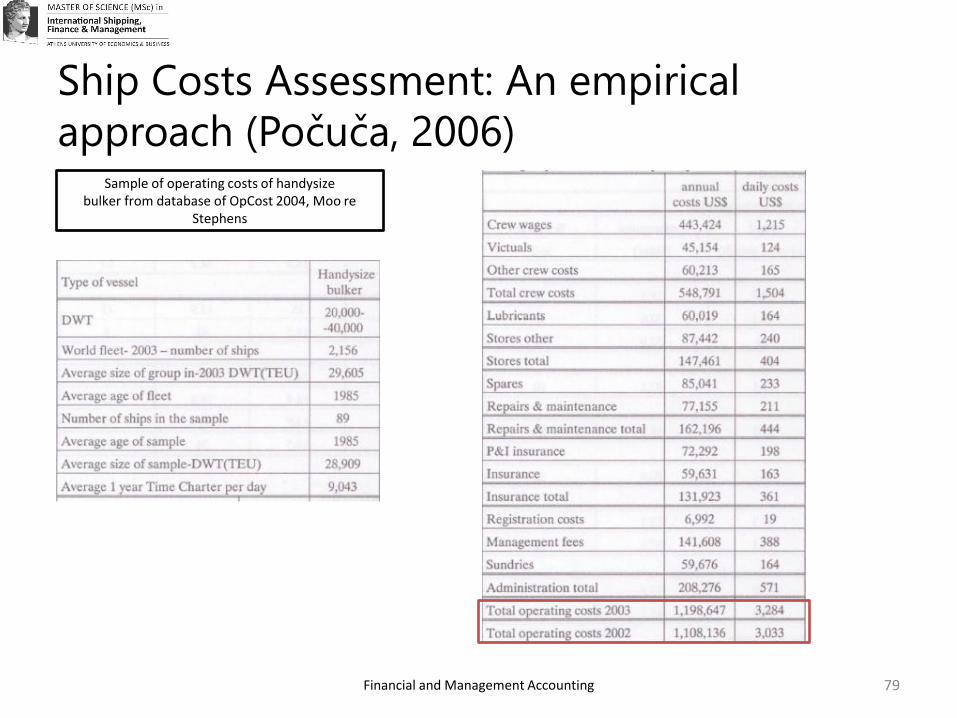
Ship Costs Assessment: An empirical
approach (Počuča, 2006)
79
Sample of operating costs of handysizebulker from database of OpCost 2004, Moo re
Stephens
Financial and Management Accounting
Ship Costs Assessment: An empirical
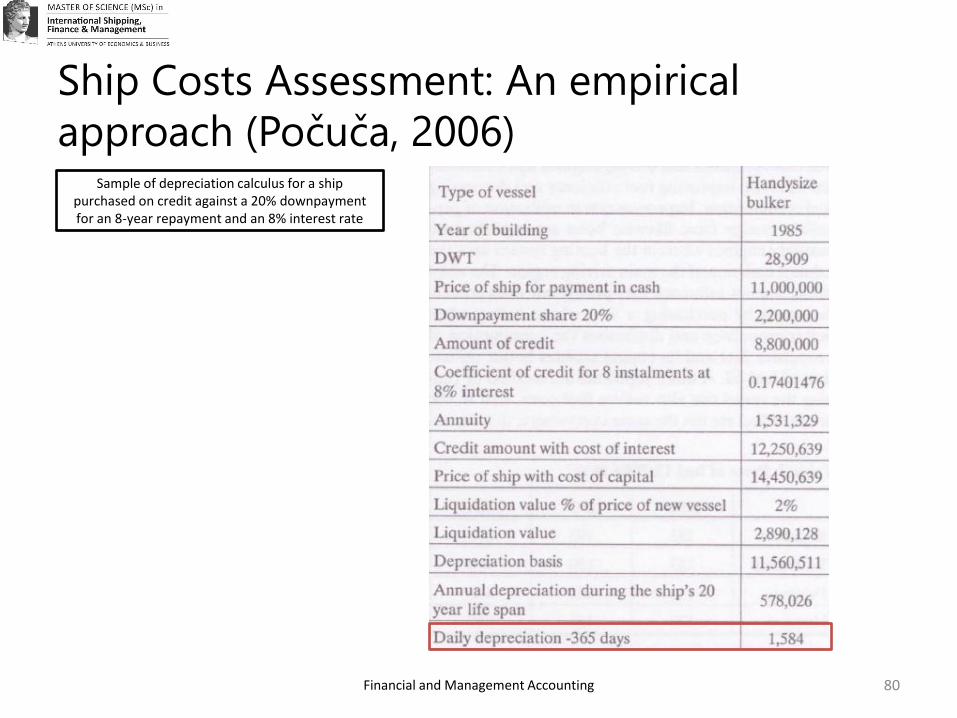
approach (Počuča, 2006)
80
Sample of depreciation calculus for a shippurchased on credit against a 20% downpaymentfor an 8-year repayment and an 8% interest rate
Financial and Management Accounting
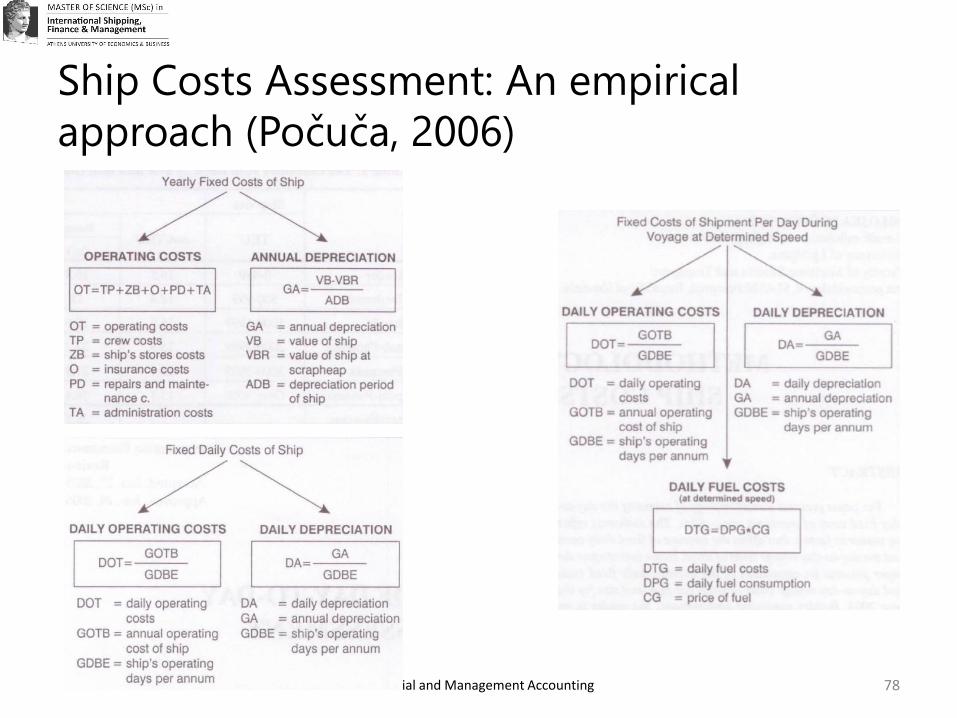
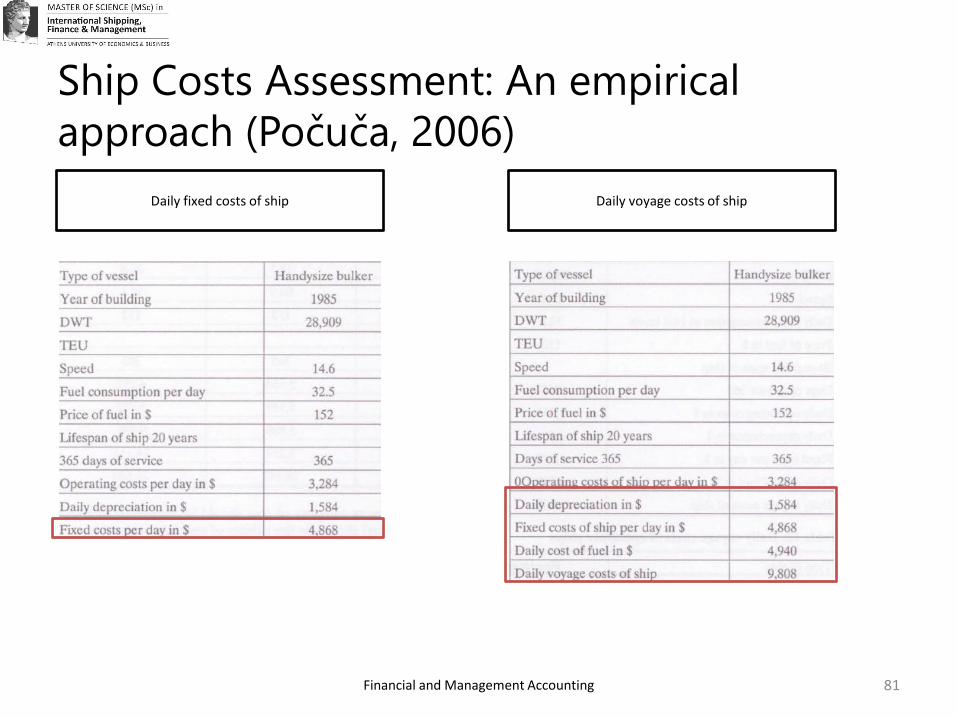
Ship Costs Assessment: An empirical
approach (Počuča, 2006)
81
Daily fixed costs of ship Daily voyage costs of ship