final report the least developed country
TRANSCRIPT
1
FINAL REPORT
THE LEAST DEVELOPED COUNTRY REPORT FOR THE GAMBIA
NOVEMBER 2019
2
TABLE OF CONTENTS
Foreword: ………………………………………………………………………………………………………………….. 4
List of Tables, Figures and Plates: ……………………………………………………………………………….. 5
List of Abbreviations and Acronyms: ………………………………………………………………………….. 8
Executive Summary: ………………………………………………………………………………………………….. 9
I. INTRODUCTION ……………………………………………………………………. 10
I.1. Country Context: ………………………………………………………………………………………………. 10
I.2. Methodology and Process for the Review: ……………………………………………………….. 12
I.3. Scope and Depth of the Review: ……………………………………………………………………… 12
I.4. Limitations of the Review: ……………………………………………………………………………… 13
II. THE NATIONAL DEVELOPMENT PLANNING PROCESS: ………………. 14
III. ASSESSMENT OF PROGRESS AND CHALLENGES IN
IMPLEMENTATION OF THE ISTANBUL PROGRAMME OF ACTION: ….. 15
III.1. Economic development Indicators: …………………………………………… 15
III.1.1. Science, Technology and Innovation ………………………………………………… 15
III.1.2.Infrastructural development and management: ……………………………... 29
III.1.3. Telecommunications services: …………………………………………………………. 43
III.1.4. Agriculture, food and nutritional security & rural development: ……… 52
III.1.5. Tourism development: …………………. ………………………………………………….. 70
III.1.6. Trade and commodities: ………………………………………………………………….. 81
III.1.7. Private sector: …………………………………………………………………………………. 86
III.1.8. Energy capacity and development: ………………………………………………… 88
III.2. Human and social development Indicators: ………………………………. 91
III.2.1. Education and training: ……………………………………………………………….. 91
III.2.2. Population and primary health: ……………………………………………………. 95
III.2.3. Youth development: ……………………………………………………………………. 109
III.2.4.Gender and women empowerment: …………………………………………… 116
3
III.2.5. Water, sanitation and hygiene: ………………………………………………….. 121
III.3. Multiple crises and other emerging challenges: ……………………….. 126
III.3.1. Climate change and environmental sustainability: …………………….. 126
III.3.2. Disaster-risk reduction: ……………………………………………………………… 129
III.4. Mobilizing financial resources for development: ………………………. 136
III.4.1. Domestic resource mobilization: ……………………………………………….. 137
III.4.2. Official development assistance: ……………………………………………… 138
III.4.3. Foreign direct investment: ………………………………………………………… 139
III.4.4. Remittances: …………………………………………………………………………….. 140
III.4.5. Public debt: ………………………………………………………………………………. 140
III.5. Good governance: …………………………………………………………………. 142
III.6. Social Protection: …………………………………………………………………. 144
III.7. Progress towards graduation: ……………………………………………….. 145
IV. COHERENCE WITH THE 2030 AGENDA AND OTHER GLOBAL PROCESSES 158
ANNEX
1. List of individuals who prepared the sector reports: ……………………………………….. 160
2. Contributions of United Nations System Agencies to The Gambia’s development 162
3. List of Participants to the Validation Workshop : ……………………………………………… 173
4
FOREWORD
This national Report is prepared within the framework of the implementation of the Istanbul
Programme of Action (IPoA) for Least Developed Countries (LDCs).
It reflects the desire of the Government of The Gambia to subject itself to benchmarking its
national development efforts against the international standards and indicators set out in the
IPoA document. In that respect, based on the IPoA guidelines, this National Report has
documented the achievements registered and challenges encountered in the country’s
development efforts. The report has shown that there is no doubt that significant strides have
been registered in the country’s development endeavours but much still remains to be done
amidst the enormous challenges the country currently faces.
In responding to the preparation of this National Report, the government has demonstrated that
albeit current difficulties in the country’s development endeavors, it is prepared to measure itself
to international standards and norms as a way of drawing lessons from this initiative to enrich its
development experience. It is expected that participation in the IPoA initiative can also inform
the country’s development strategies so as to enable us to determine what gaps there are in its
development efforts and what strategies need to be put in place to facilitate the country’s
graduation from the .Least Developed Country (LDC) status.
Our special gratitude goes to the Lead Consultant, Mr. Burama Keba Sagnia who worked tirele
ssly to facilitate and coordinate the preparation of seventeen (17) sector reports and pulling them
together into a consolidated National Report. Our gratitude also goes to the authors of the sector
reports for having spared their busy work schedules to prepare such comprehensive accounts of
the development interventions of their respective sectors.
For the fact that the preparation of this National report was accomplished is due to the financial
support of the United Nations Development Programme (UNDP) Country Office for which we
owe a deep sense of gratitude. Technical direction and guidance in the preparation of the
National Report also came from the Office of the United Nations Under-Secretary General for
Least Developed Countries (LDCs) and for this as well we are grateful.
The staff of the Ministry of Trade, Industry, Regional Integration and Employment (MOTIE) and
participants to the Validation Workshop who all contributed their specialist technical knowledge
and experiences to enrich the National Report and improve its quality, is highly commendable.
Mr. Lamin Dampha
Permanent Secretary
Ministry of Trade, Industry, Regional Integration and Employment (MOTIE)
5
LIST OF FIGURES, TABLES, BOXES AND PLATES
List of Figures Page
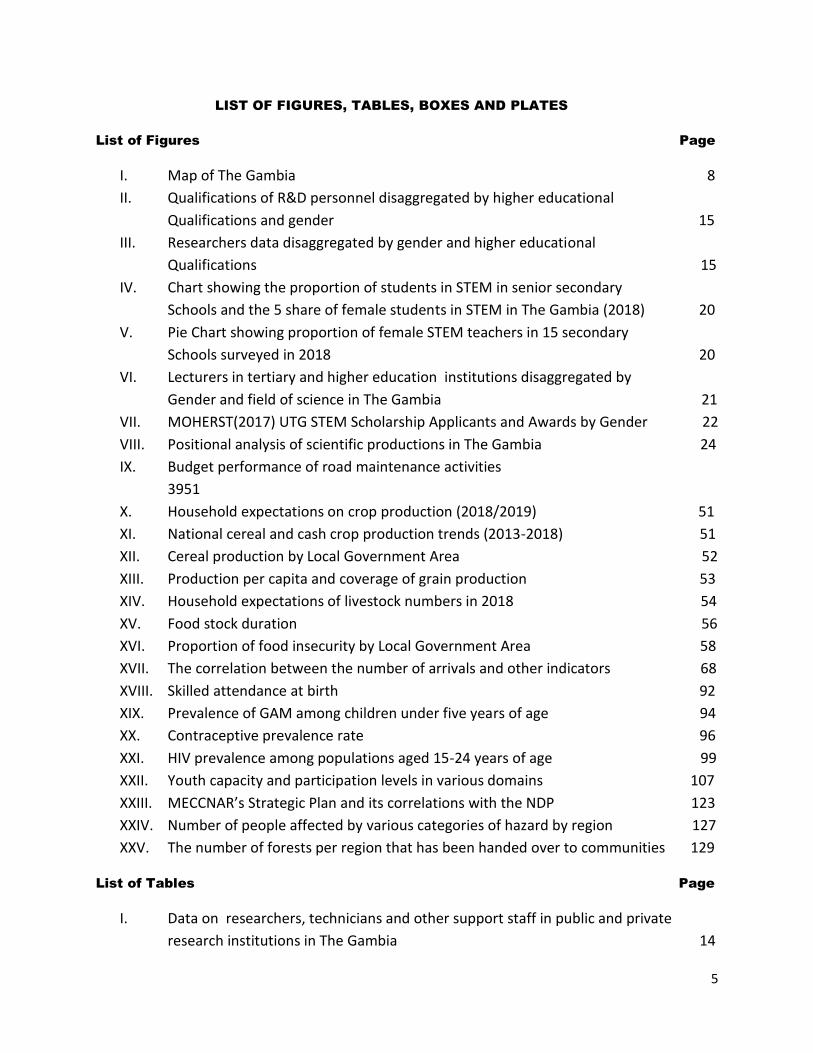
I. Map of The Gambia 8
II. Qualifications of R&D personnel disaggregated by higher educational
Qualifications and gender 15
III. Researchers data disaggregated by gender and higher educational
Qualifications 15
IV. Chart showing the proportion of students in STEM in senior secondary
Schools and the 5 share of female students in STEM in The Gambia (2018) 20
V. Pie Chart showing proportion of female STEM teachers in 15 secondary
Schools surveyed in 2018 20
VI. Lecturers in tertiary and higher education institutions disaggregated by
Gender and field of science in The Gambia 21
VII. MOHERST(2017) UTG STEM Scholarship Applicants and Awards by Gender 22
VIII. Positional analysis of scientific productions in The Gambia 24
IX. Budget performance of road maintenance activities
3951
X. Household expectations on crop production (2018/2019) 51
XI. National cereal and cash crop production trends (2013-2018) 51
XII. Cereal production by Local Government Area 52
XIII. Production per capita and coverage of grain production 53
XIV. Household expectations of livestock numbers in 2018 54
XV. Food stock duration 56
XVI. Proportion of food insecurity by Local Government Area 58
XVII. The correlation between the number of arrivals and other indicators 68
XVIII. Skilled attendance at birth 92
XIX. Prevalence of GAM among children under five years of age 94
XX. Contraceptive prevalence rate 96
XXI. HIV prevalence among populations aged 15-24 years of age 99
XXII. Youth capacity and participation levels in various domains 107
XXIII. MECCNAR’s Strategic Plan and its correlations with the NDP 123
XXIV. Number of people affected by various categories of hazard by region 127
XXV. The number of forests per region that has been handed over to communities 129
List of Tables Page
I. Data on researchers, technicians and other support staff in public and private
research institutions in The Gambia 14
6
II. Data on student enrollment in public tertiary and higher educational institutions 16
III. Data on student enrolment by gender and level of study in tertiary and higher
Educational institutions in 2018 17
IV. Summary of STEM personnel (Lecturers) in T&HEIs by field of science and
Gender in 2018 22
V. Total road networks of The Gambia in a regional perspective 28
VI. Condition of the classified road networks in the Gambia 29
VII. Banjul Port productivity and performance indicators 36
VIII. Summary of funding gap on road maintenance 38
IX. 3 G Services 41
X. 2 G Services 41
XI. Activities registered in terms of Synchronous Transport Module Level 1
(STEM – 1) for the period 2017-20196 42
XII. Tariffs remained the same from 2017 to 2018 to 2019 43
XIII. Table showing the pattern of access to telecommunications services 44
XIV. Agriculture (crop) and livestock productions (‘000Mt) 50
XV. Food sources at household level by region 56
XVI. CARI Reporting 57
XVII. Food insecure and vulnerable population 59
XVIII. The contribution of tourism to the national economy 66
XIX. Comparison of 2018-2019 (January –June) tourist arrivals 71
XX. Thomas Cook Arrivals (2017-2019) 74
XXI. Target: Enhance productive capacities by reducing constraints on the
Private sector and building and diversifying the export base 77
XXII. Data on Gambian export and import partners (2011-2017) 81
XXIII. Institutional and market actors in energy sector in The Gambia 85
XXIV. Target: Build a critical mass of viable and competitive productive capacity
In energy services to achieve structural transformation of the economy 86
XXV. Target: Ensure that by b2015 children everywhere, boys and girls alike,
Will be able to complete a full course of primary schooling 87
XXVI. Target: Ensure universal access to primary education by increasing the
Enrolment and retention rates as well as increase access to secondary,
Tertiary and vocational and skills development training 88
XXVII. Target: Achieve targets under MDGs 4 and 5 by 2015 and building on
These further significantly reduce the infant and under-five mortality
Rates by 2020 91
XXVIII. Target: Achieve target under MDG 4 and 5 and building on these further
Significantly reduce maternal mortality and child under-nutrition by 2020 93

7
XXIX. Target: Provide universal access to reproductive health by 2020, including
Family planning, sexual health and healthcare services in national strategies 96
XXX. Target: Achieve targets under MDG 6 by 2015 and building on this, further
reverse the spread of HIV/AIDS, the incidence of Malaria and other diseases
by 2020 98
XXXI. Ensure the full and effective participation of youth in the life of society and in
decision-making 106
XXXII. Target: Achieve universal access of women and girls to education, basic services
Healthcare, economic opportunities and decision-making at all levels 112
XXXIII. Ratio of Girls to Boys in Primary, Secondary and Tertiary Education 113
XXXIV. Number of elected NAMS 114
XXXV. Target: Provide sustainable access to safe drinking water and basic sanitation
To all by 2020 117
XXXVI. Strengthen the mobilisation of domestic resources 132/133
XXXVII. Overall alignment of NDP Indicators 155
List of Boxes Page
I. Best Practice Case: Providing resilience to rural farmers 60
II. Best Practice Case: “Kabilo Bama Initiative” 104
III. Best Practice Case: Coordination of water and sanitation projects 120
List of Plates Page
I. Interactive session in a lower basic school 14
II. Training session for community Water and Sanitation Committees 42
III. Members of a Community Water and Sanitation Committee after training session 51
IV. An improved village water supply system 69
V. Child immunisation programme in process at a local health facility 97
VI. A school girl drawing water from an Improved Water Source 122
8
LIST OF ACRONYMS AND ABBREVIATIONS
BIA Banjul International Airport
GCCPC Gambia Competition and Consumer protection Commission
GDP Gross Domestic Product
GIEPA Gambia Investment and Export Promotions Agency
GLF Gambia Local Funds
GPA Gambia Ports Authority
GTTI Gambia Technical Training Institute
ICT Information and Communications Technology
LDC Least Developed Country
MDG Millennium Development Goal
MOHERST Ministry of Higher Education, Research, Science & Technology
MOTIE Ministry of Trade, Industry, Regional Integration & Employment
NDMA National Disaster Management Agency
NDP National Development Plan
NAWEC National Water and Electricity Company
PAGE Programme for Accelerated Growth and Employment
PCU Programme Coordination Unit
PHC Primary Health Care
R&D Research and Development
SDG Sustainable Development Goals
STI Science, Technology and Innovation
UNDP United Nations Development Programme
WASH Water, Sanitation and Hygiene
9
EXECUTIVE SUMMARY
The review was commissioned by the Ministry of Trade, Industry, Regional Integration and
Employment (MoTIE) as the national Focal Point for Least Developed Countries (LDCs).
The periodic preparation of National Reports by LDCs is a requirement within the framework of
the Istanbul Programe of Action on LDCs (IPoA). This international framework document has
identified series of international standards and corresponding indicators against which LDC s use
as a benchmark to review and assess national measures in economic, human and social
development, good governance and development finance amongst others.
The review considers progress that LDCs have made in the different sectors of development,
challenges encountered, lessons and best practices or innovative experiences and
recommendations on actions needed to accelerate further progress in the performance of the
sector indicators. The contributions of governments and development partners in supporting
national development initiatives is taken into account with a view to identifying gaps or deficits
and what strategies might be required to address those gaps in such ways that can facilitate the
smooth graduation of the country from LDC status.
In that respect, in all the review solicited seventeen (17) sector reports to constitute the core of
this present National Report in the following domains: energy; telecommunications;
infrastructure; tourism development; science, technology and innovation; agriculture, food and
nutritional security; trade and commodities; privates sector; education and training; population
and primary health; youth development; gender and women empowerment; climate change and
environmental sustainability; disaster-risk reduction; resource mobilisation (domestic resource
mobilisation, official development assistance, foreign direct investment, remittances and public
debt); good governance; and social protection.
Drawing from the review of sector experiences, the report extracted highlights of some key
recommendations proffered to accelerate further progress in the performance of the sector
indicators, with a view to facilitating the smooth graduation of the country from LDC status. There
is no doubt that the country has registered gains in certain specific domains as reflected in the
sector submissions. However, considering the fragility of certain exogenous factors beyond the
control of government, particularly in the mobilisation of development finance, the report has
proposed certain sustainability strategies designed to ensure that gains registered are
consolidated to avoid reversals or stagnation.
To what extent the National Development Plan (NDP) has been aligned to Agenda 2030
(Sustainable Development Goals), Agenda 2063 (African Union Development Framework) and
other global development frameworks and processes, has also been reported on
10
I. INTRODUCTION
I.1. Country Context
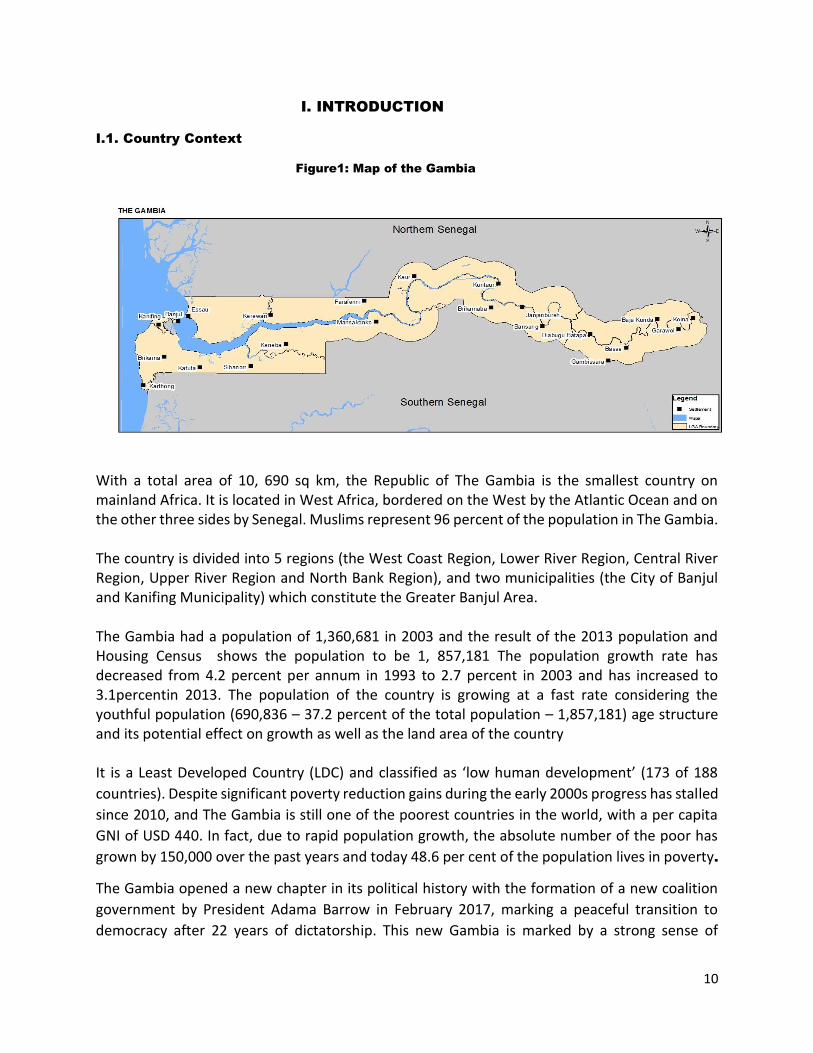
Figure1: Map of the Gambia
With a total area of 10, 690 sq km, the Republic of The Gambia is the smallest country on mainland Africa. It is located in West Africa, bordered on the West by the Atlantic Ocean and on the other three sides by Senegal. Muslims represent 96 percent of the population in The Gambia. The country is divided into 5 regions (the West Coast Region, Lower River Region, Central River Region, Upper River Region and North Bank Region), and two municipalities (the City of Banjul and Kanifing Municipality) which constitute the Greater Banjul Area. The Gambia had a population of 1,360,681 in 2003 and the result of the 2013 population and Housing Census shows the population to be 1, 857,181 The population growth rate has decreased from 4.2 percent per annum in 1993 to 2.7 percent in 2003 and has increased to 3.1percentin 2013. The population of the country is growing at a fast rate considering the youthful population (690,836 – 37.2 percent of the total population – 1,857,181) age structure and its potential effect on growth as well as the land area of the country It is a Least Developed Country (LDC) and classified as ‘low human development’ (173 of 188
countries). Despite significant poverty reduction gains during the early 2000s progress has stalled
since 2010, and The Gambia is still one of the poorest countries in the world, with a per capita
GNI of USD 440. In fact, due to rapid population growth, the absolute number of the poor has
grown by 150,000 over the past years and today 48.6 per cent of the population lives in poverty.
The Gambia opened a new chapter in its political history with the formation of a new coalition
government by President Adama Barrow in February 2017, marking a peaceful transition to
democracy after 22 years of dictatorship. This new Gambia is marked by a strong sense of
11
promise and high expectations of the new political dispensation, matched by an increase in
international goodwill. This presents opportunities for national reconciliation and economic
growth, to help propel the country towards peace and sustainable development. To do so, it must
confront a significant range of economic, social, environmental and political challenges.
Challenges in economic development
The service sector accounts for about 65 per cent of GDP, driven by the wholesale and retail
subsectors (25 per cent), followed by transportation, storage, communications and tourism;
industry contributed less than 20 per cent of GDP for the last decade. Agriculture generates about
75 per cent of household income and provides livelihoods for 70 per cent of the labour force.
However, productivity is low and vulnerable to weather events and climate change. The
impediments to structural transformation: absence of reliable and affordable energy (driven by
significant in inefficient use of finance and land; high taxes; cumbersome administrative
requirements imports of heavy fuel oil); sub-optimal transport infrastructure; poor economic
management resulting; low skills levels; and lack of incentives for emerging sectors such as ICT.
The country has suffered significant and persistent fiscal and balance-of-payments deficits and
poor management of State Owned Enterprises (SOEs). Exponential growth of public expenditure,
arising partly from extra budgetary spending and spending on liabilities of public enterprises, are
the major factors for the widening fiscal deficit.
Credit to the private sector stood at 14.7 per cent of GDP (compared to the regional average of
58.7 per cent). Challenges include limited financial inclusion, a lack of diversity of financial
services, and an underdeveloped and under-exploited financial infrastructure. The bulk of
deposits and credits held by banks have short maturities in contrast to what is needed to support
private sector investment. Interest rates in the Gambia have been amongst the highest in the
world in recent years, with high public sector borrowing for recurrent expenditures crowding out
public and private productive investments (SDG Road Map for the Gambia, 2016)
The formal sector accounts for less than 10 per cent of employment, concentrated in government
institutions, parastatals and a limited number of registered private enterprises. The
nonagricultural informal sector employs 62.8 per cent, including a majority of working-age
women (73.8 per cent compared to 55.3 per cent for men). About a third work in (mostly low
skilled) wholesale and retail trade; 31.5 per cent in agriculture, forestry and fishing; 8.3 per cent
in manufacturing and 5.2 per cent in construction. The private sector space is currently
dominated by micro enterprises; 97 per cent of all businesses have fewer than five employees.
The lack of affordable credit and services and of skilled labour adds to these systemic challenges
Challenges in social development
Poverty reduction has been most significant in the urban Greater Banjul Area. While less than
half the population lives in rural areas, they account for 60 per cent of the total poor. Rural
poverty went up from 64.2% to 69.5% from 2010-2015/2016.

12
Rainfall variability, exacerbated by climate change leads to production shortfalls that must be
complemented by imports. The combined effect of high and fluctuating international food prices
and low national production leads to high inflationary pressure on the domestic food market,
eroding purchasing power
The Gambia ranks seventh among countries with the youngest populations; half of the 1.9 million
population is below 17. Those between 15-24 years account for 19.5 per cent. To aggravate the
situation, youth unemployment is at 38 per cent (13-30 years), with higher unemployment rates
for females than males (44.7 per cent versus 29.5 per cent)(SDG Road Map,2016)
Furthermore, despite the MDG gains in access to basic education, the IHS (2015) estimates
presents a gloomy picture: only four in ten people can read and write; only one in ten (15 years
and above) has completed primary education; three in 100 have completed post-secondary
education; and one in ten of the labour force (15-64 years) has benefited vocational training.
I.2. Methodology and Process for the Review
To facilitate this review exercise, the Ministry of Trade, Industry, Regional Integration and
Employment (MoTIE) as the focal point for LDCs in The Gambia, coordinated the review. In that
position as the focal point, it also served as the Contracting Authority responsible for hiring a
Consultant to guide, facilitate and coordinate the review process.
To effectively guide the process the Ministry (MoTIE) sent a mail to all the sectors reflected in
this present report notifying them of the review exercise and soliciting their full participation on
the process. Thereafter, the Consultant designed the Terms of Reference (TOR) for the review to
guide the sector representatives in the preparation of sector reports. This was followed by the
Consultant visiting the sectors to go through the TOR with the sector representatives for ensuring
clarity and understanding of the assignment and what is required of them. The sector
representatives are either heads of the Planning Units of the sectors concerned or heads of the
particular units relevant to the sector issue.
Once the sectors prepared their reports, these were sent to the Consultant to review and compile
it into the present National Report. The draft report was then sent to the MoTIE as the
Contracting Authority for review. Thereafter, the Ministry organised a Validation Workshop with
the full participation of all the sector representatives who were directly involved in the
preparation of the sector reports, as well as other stakeholders from other sectors of
government and the United Nations System Agencies operating in The Gambia. After the
Validation Workshop the Consultant revised the report once again to produce this final version.
I.3. Scope and Depth of the Review
The review is arranged into five main thematic sections; an introduction, the planning process,
assessment of the progress in the implementation of the Istanbul Programme of Action (IPoA)
on Least Developed Countries (LDCs), establishing the coherence with Agenda 2030 (SDGs) and
other global processes, and proposals for the next LDC agenda.

13
The introduction presents first the country context as the backdrop for the review, the
methodology and process adopted for the review, the scope and depth of the review and a
reporting on the limitations of the review.
Chapter two provides background information on the development planning process in the
country in order to shed light on how the stakeholders were involved and participated in the
development of the country’s development blue print.
The third chapter presents the detailed results of the review as per the sector reports prepared.
This chapter is also divide into seven sub-chapters viz-a-vis the economic development indicators,
human and social development indicators, multiple crises and other emerging challenges,
resource mobilisation for development and capacity building, good governance, social
protection and progress towards graduation
Under the sub-chapter on economic development, the report presents the sector reports on
productive capacity issues in areas such as energy; infrastructure; telecommunications services;
science and technology; agriculture, food and nutritional security and rural development; trade
and commodities; and the privates sector.
The sub-chapter on human and social development dwelled on social sector issues such as;
education and training, population and primary health, youth development and gender equality
and women empowerment.
Multiple crises and other emerging challenges such as climate change and disaster-risk reduction
are dealt with under this sub-chapter
To examine the character of the financing landscape to fund the government’s development
priorities various sources of funding are examined such as domestic resource mobilisation,
official development assistance, foreign direct investment, remittances and public debt
The following three separate sub-chapters dwelt on issues of good governance, social protection
and the country’s progress and graduation from LDC status
Chapter six demonstrates the manner which the National Development Plan, as the national
framework for the review against which the IPoA standards and indicators were assessed, is
aligned to Agenda 2030(SDGs) and Agenda 2063. (African Union Development Agenda).The last
chapter presents proposals towards the next LDC agenda
I.4. Limitations of the Review
The cumbersome procurement left the Consultant with limited time to adequately prepare and
execute the review exercise;
Secondly, data availability posed serious challenges for the preparation of this report; and
The submissions of the sector reports also encountered delays with some of those assigned the
task, hence adding to the delay in the preparation of the consolidated National Report.
14
II. THE NATIONAL DEVELOPMENT PLANNING (NDP) PROCESS
In the development of the current NDP (2018-2021), Thematic Working Groups were established
and provided with guidelines to ensure that the plan was reflective of the “new Gambia”.
To oversee the plan preparation process, a National Development Plan Policy Steering
Committee was set up and comprised of Permanent Secretaries in the Office of the President,
the Office of the Vice President, the Ministry of Finance and Economic Affairs, Personnel
Management Office, Ministry of Higher Education and the Solicitor General.
Plan preparation and validation was through a rigorous and broad participatory process
involving, among other steps:
A Common Country Assessment conducted in 2015, involving consultations across all the
administrative regions and districts of the country, in close collaboration with the United Nations
system in The Gambia;
Setting up of Thematic Working Groups, consultation with key stakeholders and elaboration of a
draft plan. The TWGs comprised of government and key national stakeholders such as, Private
sector, Civil Society, the Youth, National Assembly etc.;
A donor consultation forum;
A national validation workshop with a broad spectrum of the stakeholder community;
Briefing/consultations with the National Assembly members (NAMs), Permanent Secretaries and
development partners prior to plan finalization;
Contributions from the Gambia National Think Tank (GAMNATT); and
A UN MAPS mission that visited the country during the formulation process made suggestions on
the Plan’s alignment with the Sustainable Development Goals (SDGs) and the First Ten Year
Implementation Plan of Agenda 2063 of the African Union
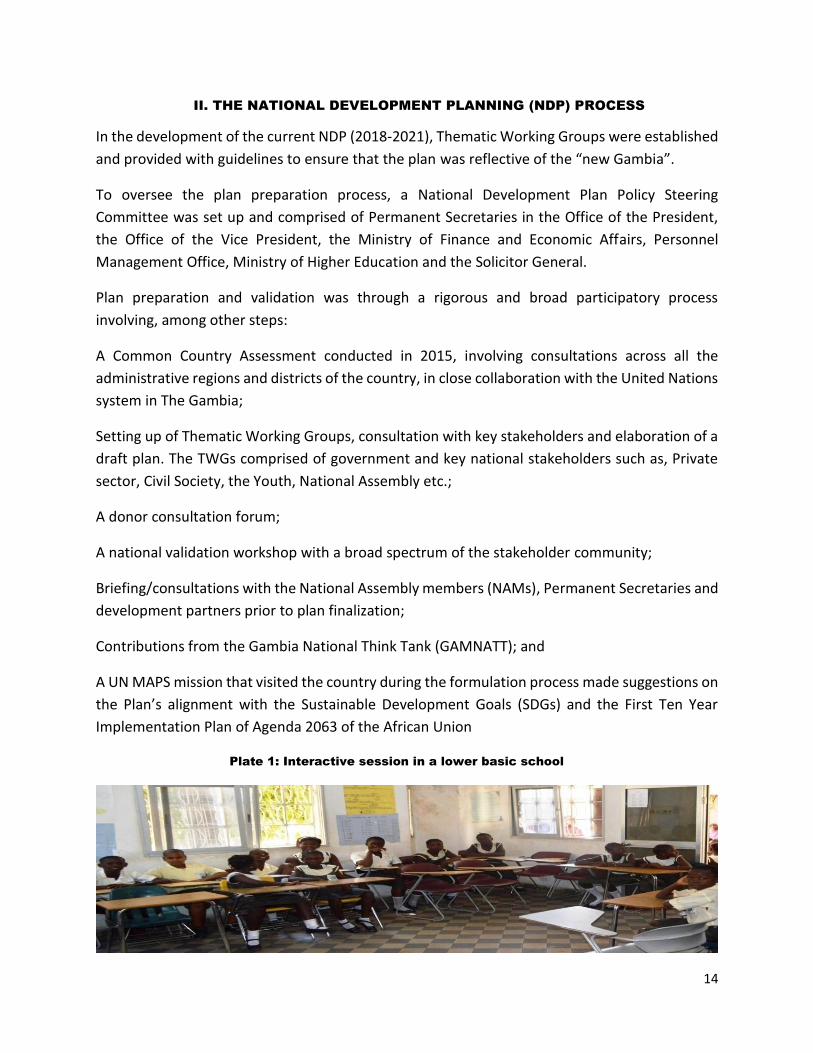
Plate 1: Interactive session in a lower basic school
15
III. ASSESSMENT OF PROGRESS AND CHALLENGES IN
THE IMPLEMENTATION OF THE ISTANBUL PROGRAMME OF ACTION
III.1. ECONOMIC DEVELOPMEN INDICATORS
III.1.1. SCIENCE, TECHNOLOGY AND INNOVATION
INTRODUCTION
The major target for science, technology and innovation in the implementation of the National
Development Plan (2018-2021) is to “build a critical mass of viable and competitive productive
capacity in science, technology and innovation to achieve structural transformation of the
economy”. This report assess the progress made in the achievement of this target. Data on
science, technology and innovation indicators have been collected, analysed and interpreted for
the year 2018.
STATUS OF STI INDICATORS
PERFORMANCE OF STI INDICATORS
In late 2014, the first baseline study on National Science, Technology and Innovation Indicators
was conducted by the Ministry of Higher Education, Research, Science and Technology with
support from the World Bank additional financing to complete the process of the development
of the National STI Policy of The Gambia. In previous years, data on STI indicators were collected
during for the UNESCO Institute’s periodic Research & Development (R&D) Surveys. In recent
years, STI Indicators have been broadened to cover areas in firm level innovations, STEM
education, gender equality in STI and Public Awareness for STI.
During the last three years (2014-2017), The Gambia has also benefitted from capacity building
of policy makers on the development and evaluation of STI indicators from the NEPAD’s Africa
Science and Technology Indicator Initiative (ASTII) and the IsDB supported capacity building on
the development of National STI Indicators. These training led to the development of nationally
relevant and internationally comparable indicators for The Gambia. In September 2018, the
Directorate of Science, Technology and Innovation under the Ministry of Higher Education,
Research, Science and Technology with support from the UIS, undertook the second edition of
the National STI Indicator Survey to collect relevant data on National R&D efforts; innovation in
firms; human resources for STI and a study of gender equality in STI1.
During the 2018 Survey of STI Indicators, data was collected from all major public and private
research institutions. Pipeline HRST data was also collected from all public and private tertiary
and higher education institutions including senior secondary schools. The pipeline HRST is key in
1 A draft report on this survey can be obtained from the Ministry’s website: www.moherst.gov.gm
16
assessing the existence of a critical mass of scientists and researchers in the country as well as
the potential for sustaining a steady supply of the scientific workforce from educational
institutions.
In terms of performance of these indicators, the private research institutions outperformed
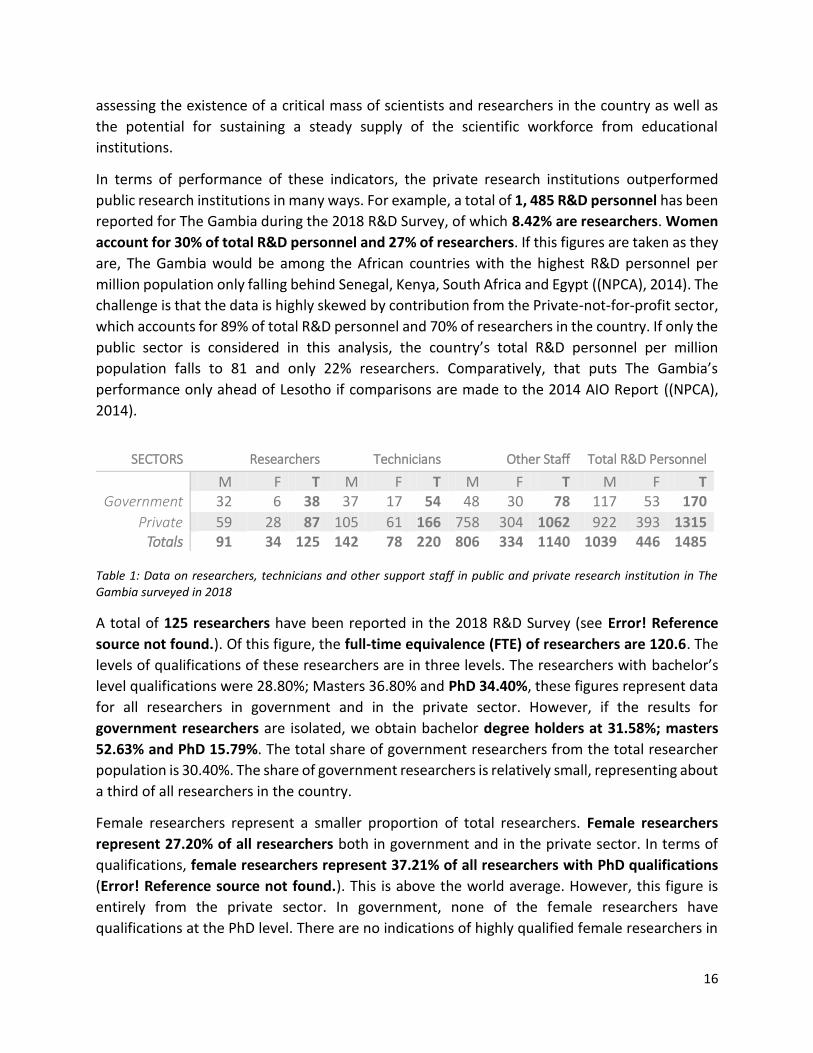
public research institutions in many ways. For example, a total of 1, 485 R&D personnel has been
reported for The Gambia during the 2018 R&D Survey, of which 8.42% are researchers. Women
account for 30% of total R&D personnel and 27% of researchers. If this figures are taken as they
are, The Gambia would be among the African countries with the highest R&D personnel per
million population only falling behind Senegal, Kenya, South Africa and Egypt ((NPCA), 2014). The
challenge is that the data is highly skewed by contribution from the Private-not-for-profit sector,
which accounts for 89% of total R&D personnel and 70% of researchers in the country. If only the
public sector is considered in this analysis, the country’s total R&D personnel per million
population falls to 81 and only 22% researchers. Comparatively, that puts The Gambia’s
performance only ahead of Lesotho if comparisons are made to the 2014 AIO Report ((NPCA),
2014).
SECTORS Researchers Technicians Other Staff Total R&D Personnel
M F T M F T M F T M F T Government 32 6 38 37 17 54 48 30 78 117 53 170
Private 59 28 87 105 61 166 758 304 1062 922 393 1315 Totals 91 34 125 142 78 220 806 334 1140 1039 446 1485
Table 1: Data on researchers, technicians and other support staff in public and private research institution in The Gambia surveyed in 2018
A total of 125 researchers have been reported in the 2018 R&D Survey (see Error! Reference
source not found.). Of this figure, the full-time equivalence (FTE) of researchers are 120.6. The
levels of qualifications of these researchers are in three levels. The researchers with bachelor’s
level qualifications were 28.80%; Masters 36.80% and PhD 34.40%, these figures represent data
for all researchers in government and in the private sector. However, if the results for
government researchers are isolated, we obtain bachelor degree holders at 31.58%; masters
52.63% and PhD 15.79%. The total share of government researchers from the total researcher
population is 30.40%. The share of government researchers is relatively small, representing about
a third of all researchers in the country.
Female researchers represent a smaller proportion of total researchers. Female researchers
represent 27.20% of all researchers both in government and in the private sector. In terms of
qualifications, female researchers represent 37.21% of all researchers with PhD qualifications
(Error! Reference source not found.). This is above the world average. However, this figure is
entirely from the private sector. In government, none of the female researchers have
qualifications at the PhD level. There are no indications of highly qualified female researchers in
17
government. Thus, efforts should consider improving training programmes in STEM for female
researchers especially at the PhD level among government research institutions.
Figure 1: Qualification of R&D Personnel disaggregated by highest qualification and gender
Source: Authors compilation from the 2018 National R&D Survey
The fifth goal of the United Nations Sustainable Development Goals (SDG 5) seeks to “achieve
gender equality and empower all women and girls”. This goal is more relevant in science,
technology and innovation were gender disparities are more prevalent from STEM education to
STEM careers. To ensure success in both national and global development endeavours, it is
important as a key development indicator to measure gender equality in STEM education and
careers. In 2018, a key element of the IsDB & UIS supported capacity building for the collection
of national STI baseline indicators was the participation of girls and women in STEM education
and careers. Part of the report presented here has been borrowed from the STEM and Gender
Advancement Report, which was ran concurrently with the study of National STI Baseline
Indicators.
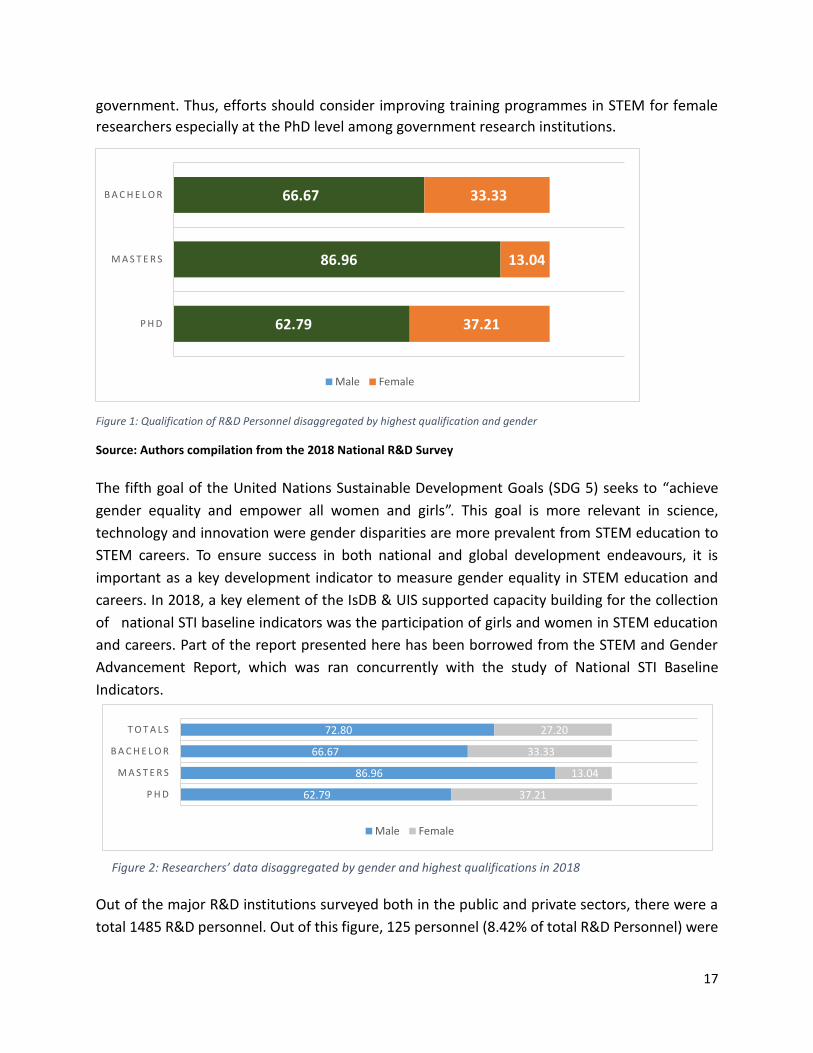
Out of the major R&D institutions surveyed both in the public and private sectors, there were a
total 1485 R&D personnel. Out of this figure, 125 personnel (8.42% of total R&D Personnel) were
62.79
86.96
66.67
37.21
13.04
33.33
P H D
M A S T E R S
B A C H E L O R
Male Female
Figure 2: Researchers’ data disaggregated by gender and highest qualifications in 2018
62.79
86.96
66.67
72.80
37.21
13.04
33.33
27.20
P H D
M A S T E R S
B A C H E L O R
T O T A L S
Male Female
18
classified as researchers (Male researchers72.80%; Female researchers 27.20%). Thus, we
therefore take it that the proportion of the country’s female researchers as of 2018 stands at
27.20%, which is slightly below the global average of 30% 2. According to UNESCO, a global trend
indicate that an increasing number of women are enrolled at universities but many opt out as
they progress through the highest levels required to become researchers (UNESCO, 2019).
When we apply this assumption against data on student enrollment and graduation in tetiary and
higher education institutions in 2018, we observe a different trend. Caution is being applied here
given that all the data was collected the same year and is not disaggregated. Thus, we cannot tell
how much of the student graduating were enrolled in these institutions. A detailed analysis of the
data or further engagement with the institutions will clearly reveal our situation as far as
UNESCO’s indicative global trend is concerned. In this analysis, we take two key indicators; data
on student applicants against data on student enrollment indicates that there are more students
applying to study the sciences and engineering fields, however, only about half or less are enrolled
into these fields of study (Table ).
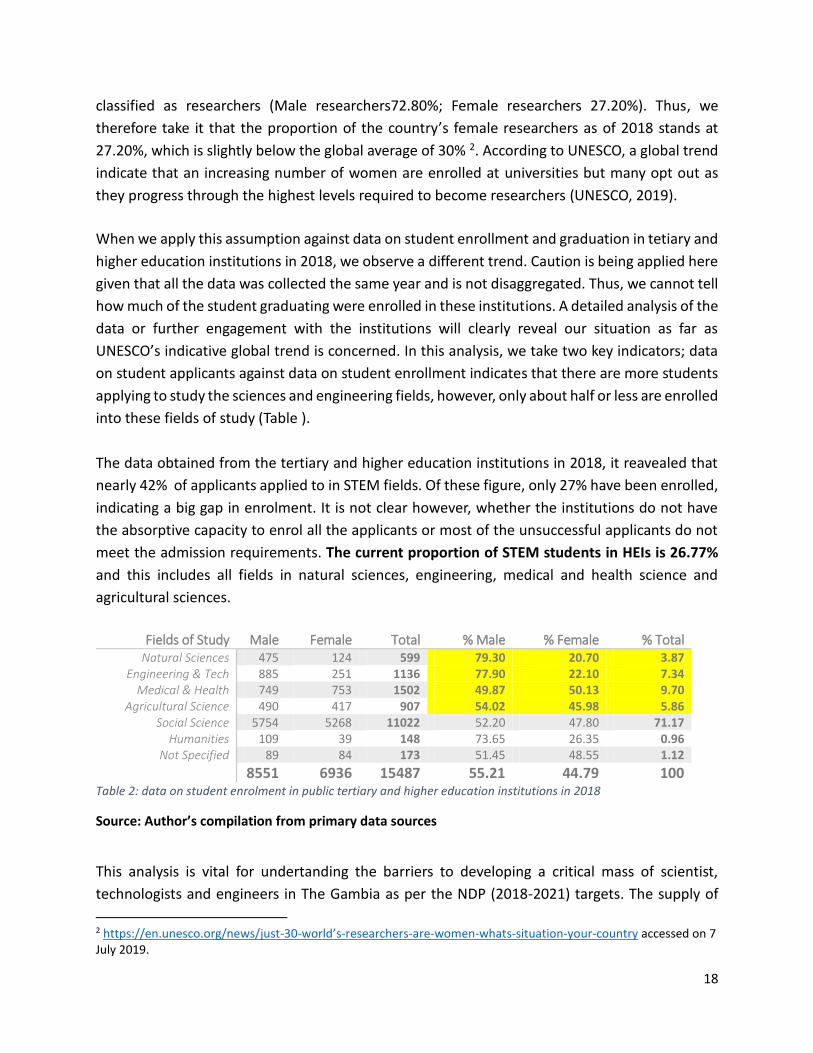
The data obtained from the tertiary and higher education institutions in 2018, it reavealed that
nearly 42% of applicants applied to in STEM fields. Of these figure, only 27% have been enrolled,
indicating a big gap in enrolment. It is not clear however, whether the institutions do not have
the absorptive capacity to enrol all the applicants or most of the unsuccessful applicants do not
meet the admission requirements. The current proportion of STEM students in HEIs is 26.77%
and this includes all fields in natural sciences, engineering, medical and health science and
agricultural sciences.
Fields of Study Male Female Total % Male % Female % Total Natural Sciences 475 124 599 79.30 20.70 3.87
Engineering & Tech 885 251 1136 77.90 22.10 7.34 Medical & Health 749 753 1502 49.87 50.13 9.70
Agricultural Science 490 417 907 54.02 45.98 5.86 Social Science 5754 5268 11022 52.20 47.80 71.17
Humanities 109 39 148 73.65 26.35 0.96 Not Specified 89 84 173 51.45 48.55 1.12
8551 6936 15487 55.21 44.79 100 Table 2: data on student enrolment in public tertiary and higher education institutions in 2018
Source: Author’s compilation from primary data sources
This analysis is vital for undertanding the barriers to developing a critical mass of scientist,
technologists and engineers in The Gambia as per the NDP (2018-2021) targets. The supply of
2 https://en.unesco.org/news/just-30-world’s-researchers-are-women-whats-situation-your-country accessed on 7 July 2019.

19
adequate human resources for science and technology depends to a very large extent on their
supply from tertiary and higher education institutions. If enrolments are low at this level, it is
obvious that we would not be able to meet demand for the critical mass sought in scientific
institutions. There are policy measures in place to help reverse this trend, which includes the
Ministry’s Open Scholarship Programme as one such example that provides tuition for
undergraduate programmes at public institutions. Another such initiative is the World Bank Africa
Centres of Excellence (ACE) Project for Masters and PhD studies. These are all very important
programmes with high impact but are far from adequate to build and maintain the required
critical mass of scientists and engineers.
Male Female Total % Male % Female % Total
ISCED_L8 3 1 4 75.00 25.00 0.03 ISCED_L7 303 64 367 82.56 17.44 2.37 ISCED_L6 2131 1697 3828 55.67 44.33 24.72 ISCED_L5 6057 5231 11288 53.66 46.34 72.89
TOTALS 8494 6993 15487 54.85 45.15 100 Table 3: data on student enrolment by gender and level of study in tertiary and higher education institutions in ‘18
Source: Authors compilation from 2018 Survey of Pipeline HRST
Female students consitute less than half of all enrolments in the natural sciences and engineering,
except in medical and health sciences where they constitute half of all enrolments in that field. It
is a given that student chose medical and health science fields due to the fact that there are no
shortage of employment opportunities and these jobs are likely more lucrative than other
occupations. This calls for policy actions to improve employment opportunities and incentives
that encourage students to opt for other STEM occupations.
Interest however, is in the enrolment of students by level of study (Table). This data reveal that
gender parity has been achieved in terms of gross enrolments at the tertiary and higher education
levels. However, huge gap exist in terms of gender parity in the levels of study. There are fewer
students enrolled at the Masters and PhD levels, and even fewer is the presence of female
students at these levels. Currently, enrolments for Masters and PhDs at this level is under 3% of
all enrolments, and females constitute far less than half of these enrolments. The Minister’s3
agenda for a policy turn-around of 70% enrolment in STEM is a far fetched dream given that not
adequate numbers of student applicants into STEM fields are enrolled. Those enrolled only
constitute a fraction of students in STEM. Additionally existing policy measures are inadequate to
address these trends.
3 Minister responsible for Higher Education, Research, Science and Technology
20
Although there are outliers and rare cases where women make it to PhD in STEM fields in their
numbers and rise through the ranks in their careers, but the majority are confronted with
unmanageable challenges that hinders their career progression in STEM fields. Given these
challenges and the resources requirements to reverse this trend, there are no immediate
solutions in the short term. This in part accounts for the limited number of female researchers in
public research institutions. In The Gambia, non of the full time researchers with PhD degrees in
public institutions are female. Full time female researchers with PhD degrees are only in the
private sector, and it is obvious that most of them received their training from abroad, with little
or no public support towards their training.
The Government has made significant efforts to increase enrolment numbers in all levels of
education despite the rapid population growth and has been successful in reaching near full
gender parity throughout basic and secondary education. Significant efforts have been made to
address quality challenges as well, and, for example, government has made strides in incentive
schemes to even teacher qualification and deployment, introduced a model to integrate public
school curriculum into madrassas, and piloted technology informed teaching approaches, among
others. However, despite these considerable efforts, the sector performance still faces numerous
challenges, in terms of equity, access, and most importantly, quality.
Although universal primary completion has not been achieved, gender parity has been met at all
levels of education. The “traditional” gender disparities have been eliminated from ECD to senior
secondary schools (SSS) and the gender parity rate is more than 100 percent at the preschool,
primary and secondary levels of education. Girls registered a higher GER and net enrolment rate
(NER) at ECD, basic and secondary levels, as well as higher completion rates at lower and upper
basic levels, while gender parity in completion rate at SSS has just been met in 2017. The MoBSE
started to implement the Gender Equity Initiative in 2000 when the gender parity was an issue
by: (i) revising textbooks in a gender sensitive manner; (ii) training teachers in gender responsive
pedagogy; and (iii) conducting sensitization campaigns in communities with teachers, parents,
and students to bring female students into schools.
Of recent, government attention has been slowly but gradually shifting developing and
implementing policies based on economic metrics to the use of science, technology and
innovation. This shift led to the establishment of the Ministry of Higher Education, Research,
Science and Technology in 2007 and the subsequent development of the National STI Policy and
the Tertiary and Higher Education Policy of The Gambia in 2015. In 2015, discussions on the
inclusion of The Gambia to the UNESCO Global Observatory of Science Policy Instruments (GO-
SPIN) has been very strategic in raising questions about the role of women in STI. It is worth noting
that while under Article 28 of the 1997 Constitution (amended in 2002), women in The Gambia
21
are accorded equal rights with men, in practice, women still lag behind men in key STI indicators.
Although most policies recognised these as fundamental there are fewer instruments in place to
ensure equal opportunities for both men and women especially in tertiary and higher education,
research institutions and other STEM career portfolios.
It is also important to note that the relevance of STEM education and STI in the national
development agenda has only been given some level of recognition in recent years with the
establishment of the Directorate of Science and Technology Education at MoBSE in 2003 and of
the Ministry of Higher Education, Research, Science and Technology in 2007.
The acceptancce of The Gambia as a pilot country for SAGA is collectively seen as a new policy
tool to aid these institutions to further advance the course of female participation in STEM
education in The Gambia. Thus, policies will be revised with SAGA Report recommendations in
mind and including development of legal instruments to ensure active and unabridged
participation of women in STI programmes and as well ensure career progression beyond
educational institutions.
Significant effort and resources have been invested at the level of basic and secondary education.
Gender parity has been achieved at general student enrolment and the gap between male and
female students in STEM has been narrowed considerably. In a recent study of 15 senior
secondary schools in The Gambia in 2018, data revealed that there are 55.29% Boys and 44.71
Girls in STEM fields (a significant rise from 58.78% Boys and 41.22% Girls from a similar study
in 2014). In addition, at the Primary and Secondary level, the Ministry of Basic and Secondary
Education established a gender unit at the Basic and Secondary Education Programmes
Directorate to mainstream gender across the education sector and promote gender education in
schools. Similar initiatives are at advanced stages at MoHERST to establish a funcitional gender
unit to mainstream gender issues in STI.
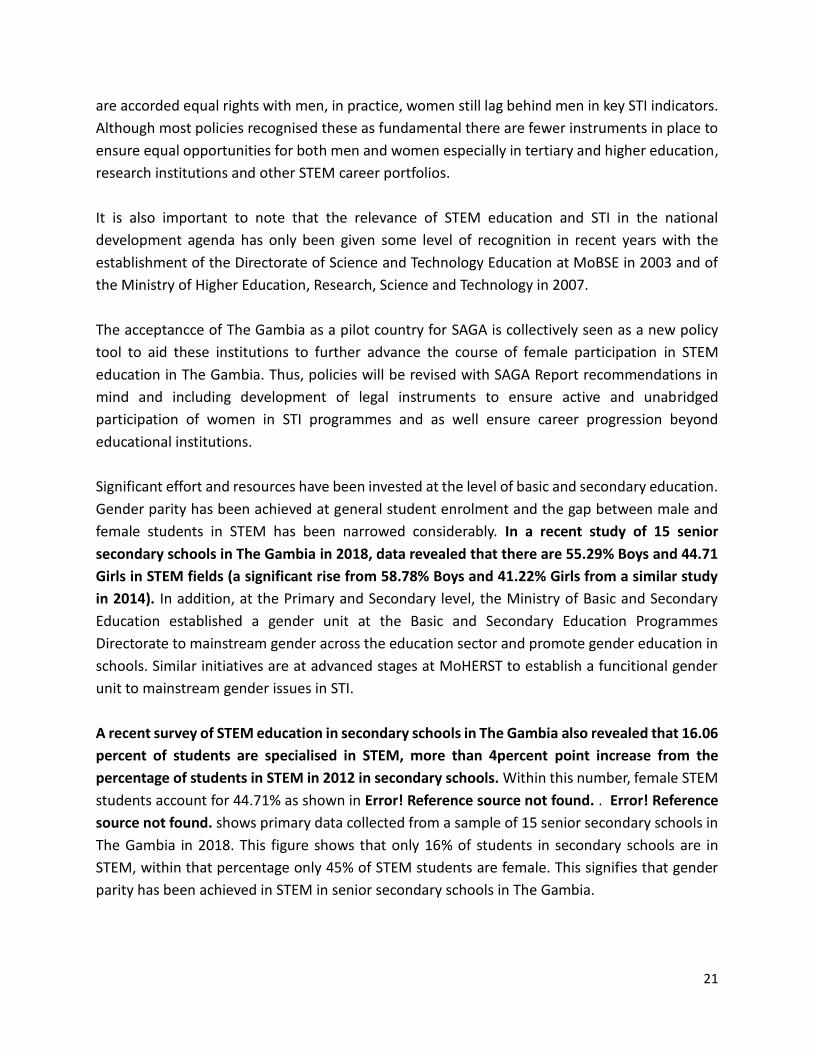
A recent survey of STEM education in secondary schools in The Gambia also revealed that 16.06
percent of students are specialised in STEM, more than 4percent point increase from the
percentage of students in STEM in 2012 in secondary schools. Within this number, female STEM
students account for 44.71% as shown in Error! Reference source not found. . Error! Reference
source not found. shows primary data collected from a sample of 15 senior secondary schools in
The Gambia in 2018. This figure shows that only 16% of students in secondary schools are in
STEM, within that percentage only 45% of STEM students are female. This signifies that gender
parity has been achieved in STEM in senior secondary schools in The Gambia.
22
Figure 4: Chart showing the proportion of students in STEM in senior secondary schools and the percentage share of female students in STEM in The Gambia in 2018.
In terms of general participation of females in STEM from the perspective of general female
student population, only 7.18percent of females are in STEM and for males 8.88percent. The 16%
of students in STEM is far below policy objectives of 60percent STEM enrolments targets in
education institutions.
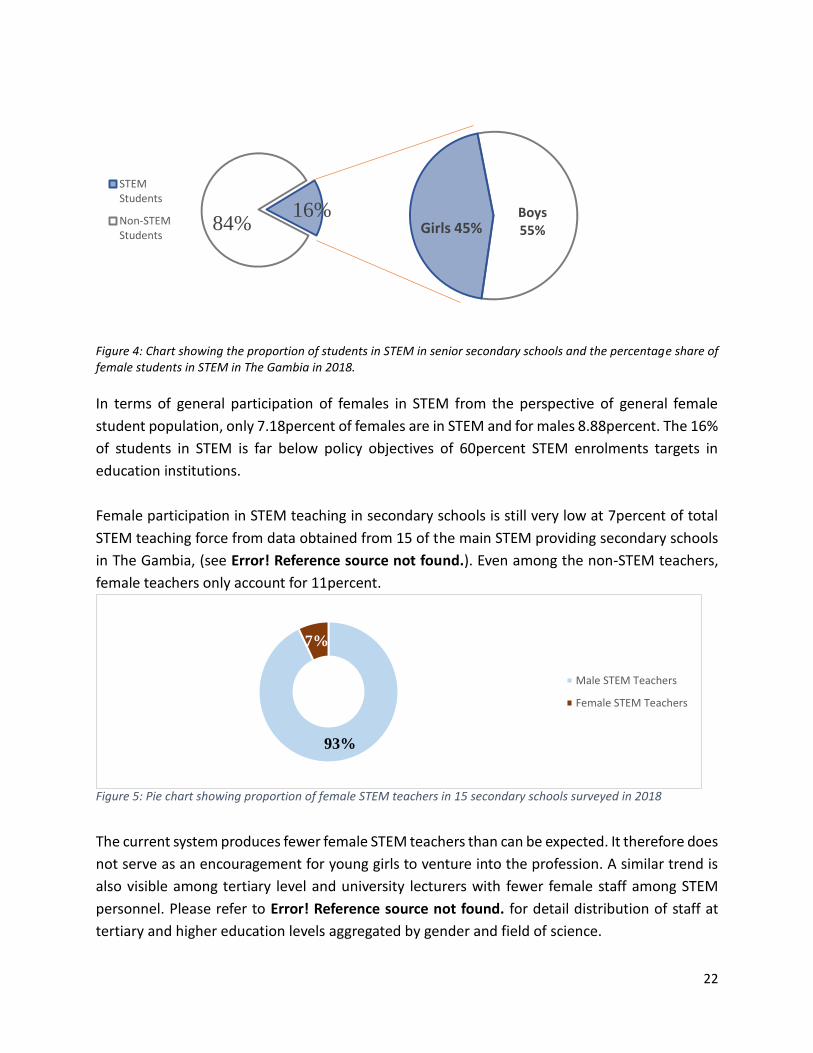
Female participation in STEM teaching in secondary schools is still very low at 7percent of total
STEM teaching force from data obtained from 15 of the main STEM providing secondary schools
in The Gambia, (see Error! Reference source not found.). Even among the non-STEM teachers,
female teachers only account for 11percent.
The current system produces fewer female STEM teachers than can be expected. It therefore does
not serve as an encouragement for young girls to venture into the profession. A similar trend is
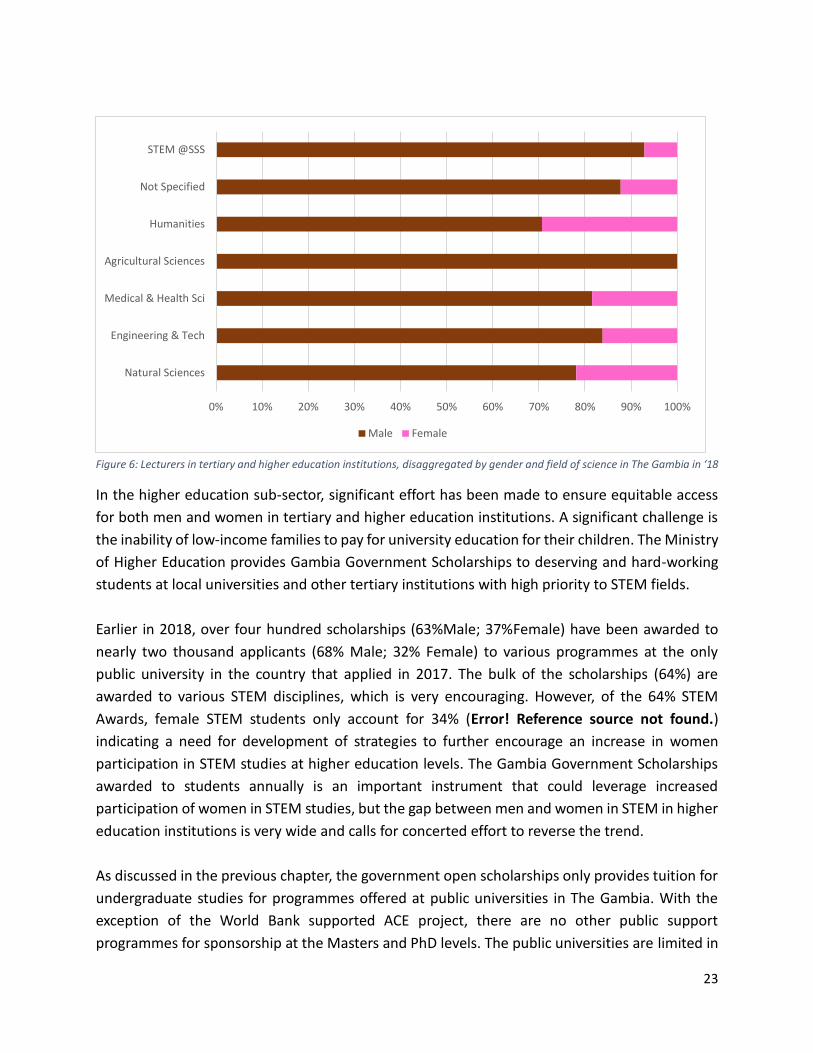
also visible among tertiary level and university lecturers with fewer female staff among STEM
personnel. Please refer to Error! Reference source not found. for detail distribution of staff at
tertiary and higher education levels aggregated by gender and field of science.
16%84%
STEMStudents
Non-STEMStudents
Boys55%Girls 45%
Figure 5: Pie chart showing proportion of female STEM teachers in 15 secondary schools surveyed in 2018
93%
7%
Male STEM Teachers
Female STEM Teachers
23
Figure 6: Lecturers in tertiary and higher education institutions, disaggregated by gender and field of science in The Gambia in ‘18
In the higher education sub-sector, significant effort has been made to ensure equitable access
for both men and women in tertiary and higher education institutions. A significant challenge is
the inability of low-income families to pay for university education for their children. The Ministry
of Higher Education provides Gambia Government Scholarships to deserving and hard-working
students at local universities and other tertiary institutions with high priority to STEM fields.
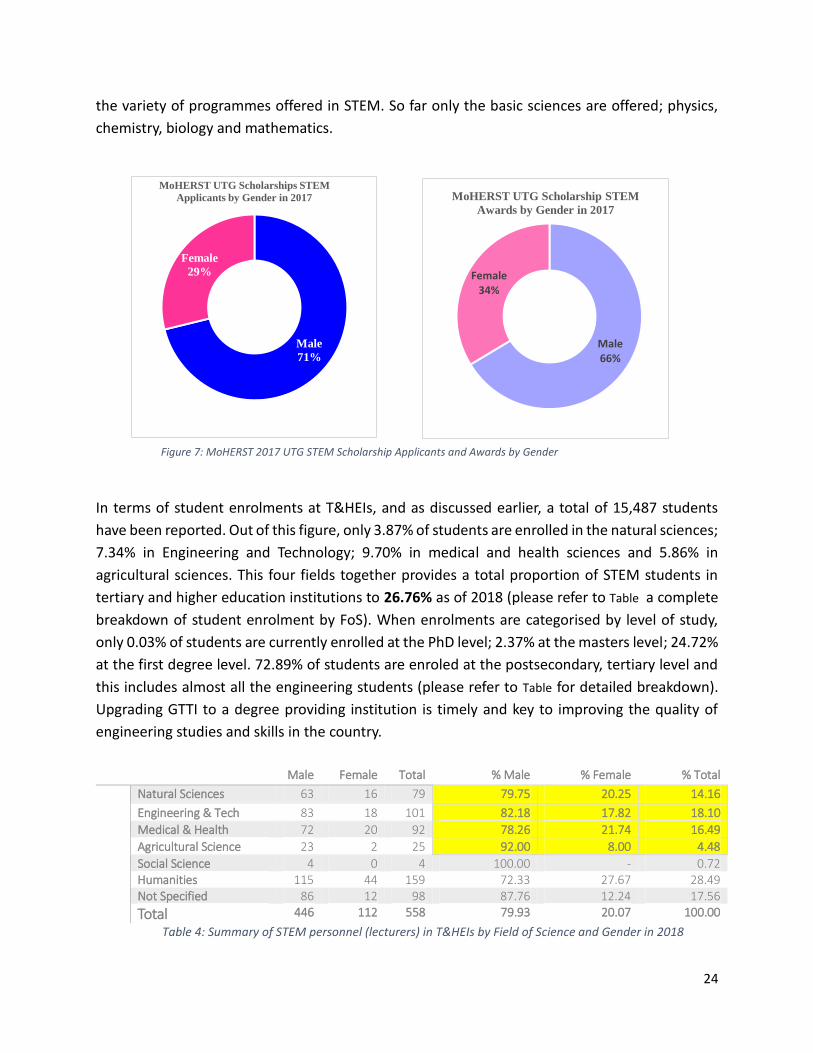
Earlier in 2018, over four hundred scholarships (63%Male; 37%Female) have been awarded to
nearly two thousand applicants (68% Male; 32% Female) to various programmes at the only
public university in the country that applied in 2017. The bulk of the scholarships (64%) are
awarded to various STEM disciplines, which is very encouraging. However, of the 64% STEM
Awards, female STEM students only account for 34% (Error! Reference source not found.)
indicating a need for development of strategies to further encourage an increase in women
participation in STEM studies at higher education levels. The Gambia Government Scholarships
awarded to students annually is an important instrument that could leverage increased
participation of women in STEM studies, but the gap between men and women in STEM in higher
education institutions is very wide and calls for concerted effort to reverse the trend.
As discussed in the previous chapter, the government open scholarships only provides tuition for
undergraduate studies for programmes offered at public universities in The Gambia. With the
exception of the World Bank supported ACE project, there are no other public support
programmes for sponsorship at the Masters and PhD levels. The public universities are limited in
0% 10% 20% 30% 40% 50% 60% 70% 80% 90% 100%
Natural Sciences
Engineering & Tech
Medical & Health Sci
Agricultural Sciences
Humanities
Not Specified
STEM @SSS
Male Female
24
the variety of programmes offered in STEM. So far only the basic sciences are offered; physics,
chemistry, biology and mathematics.
In terms of student enrolments at T&HEIs, and as discussed earlier, a total of 15,487 students
have been reported. Out of this figure, only 3.87% of students are enrolled in the natural sciences;
7.34% in Engineering and Technology; 9.70% in medical and health sciences and 5.86% in
agricultural sciences. This four fields together provides a total proportion of STEM students in
tertiary and higher education institutions to 26.76% as of 2018 (please refer to Table a complete
breakdown of student enrolment by FoS). When enrolments are categorised by level of study,
only 0.03% of students are currently enrolled at the PhD level; 2.37% at the masters level; 24.72%
at the first degree level. 72.89% of students are enroled at the postsecondary, tertiary level and
this includes almost all the engineering students (please refer to Table for detailed breakdown).
Upgrading GTTI to a degree providing institution is timely and key to improving the quality of
engineering studies and skills in the country.
Male Female Total % Male % Female % Total
Natural Sciences 63 16 79 79.75 20.25 14.16
Engineering & Tech 83 18 101 82.18 17.82 18.10
Medical & Health 72 20 92 78.26 21.74 16.49
Agricultural Science 23 2 25 92.00 8.00 4.48 Social Science 4 0 4 100.00 - 0.72 Humanities 115 44 159 72.33 27.67 28.49 Not Specified 86 12 98 87.76 12.24 17.56 Total 446 112 558 79.93 20.07 100.00
Table 4: Summary of STEM personnel (lecturers) in T&HEIs by Field of Science and Gender in 2018
Male 66%
Female34%
MoHERST UTG Scholarship STEM
Awards by Gender in 2017
Male
71%
Female
29%
MoHERST UTG Scholarships STEM
Applicants by Gender in 2017
Figure 7: MoHERST 2017 UTG STEM Scholarship Applicants and Awards by Gender
25
Career progression posed a significant challenge among STEM graduates from the first-degree
level. Since existing higher education institutions lack the instructional capacity and resources to
run masters and PhD programmes in broad STEM fields. Most of the country’s trained personnel
are either trained outside the country through bilateral scholarships from other countries, or
through highly competitive and less available government overseas scholarships, donour funded
capacity building projects and less often through individual funding.
In terms of STEM personnel for tutoring in T&HEIs, a total of 558 personnel have been recorded
for 2018. Out of this figure, 14.16% are in the natural sciences; 18.10% in engineering and
technology; 16.49% in medical and health science fields and 4.48% in agricultural science fields.
The total personnel in these fields constitute more than half of all personnel (53.23%) in tertiary
and higher education institutions. In terms of qualifications (see Error! Reference source not
found.) only 7.98% of lecturers are qualified at the PhD level. There is need to improve the quality
of faculty in these institutions through training and continous professional development.
As highlighted in the previous section, there is urgent need to strengthen existing public
institutions through collaborative/mentoring programmes with more advanced universities to
provide tuition in broad STEM fields beginning with those areas of strategic importance to the
social and economic growth of the country. Current efforts of government to tranform certain
tertiary institutions to universities, such as the GTTI to the University of Science, Engineering and
Technology are laudale and has potential to impact socioeconomic wellbeing provided such
undertakings are backed by strong and sustained government commitment, mentoring from
adequately qualified universities with the prerequisite expertise and experience, and on the
demand side of innovation, government should consider promoting a strong industrial
development support system to sustain demand for such skills and capabilities.
In analysis of the qualifications of R&D Personnel as it relates to the quality and impact of R&D
outputs, we make reference to the bibliometric analysis conducted by the African Observatory
of Science, Technology and Innovation (AOSTI) on scientific production in the ECOWAS Region.
The analyses is based on two major databases, namely: Web of Science by Thompson Reuters
and Scopus by Elsevier (ECOWAS, 2017). The analyses focus on key and relevant indicators:
number of articles published; growth index; specialisation index; average relative impact factor;
average relative citation; and collaboration index. From the analysis of the quality of scientific
production of the ECOWAS Region using positional analyses, most of the research conducted in
The Gambia can be found located at the top right quadrant of the graph (see Error! Reference
source not found.). This quadrant is synonymous with excellence. According to the ECOWAS
Bibliometric Outlook, 2016, “institutions and countries in this quadrant [specializing] in the given
domains and their [respective] activities have a high impact, meaning that their papers are more
26
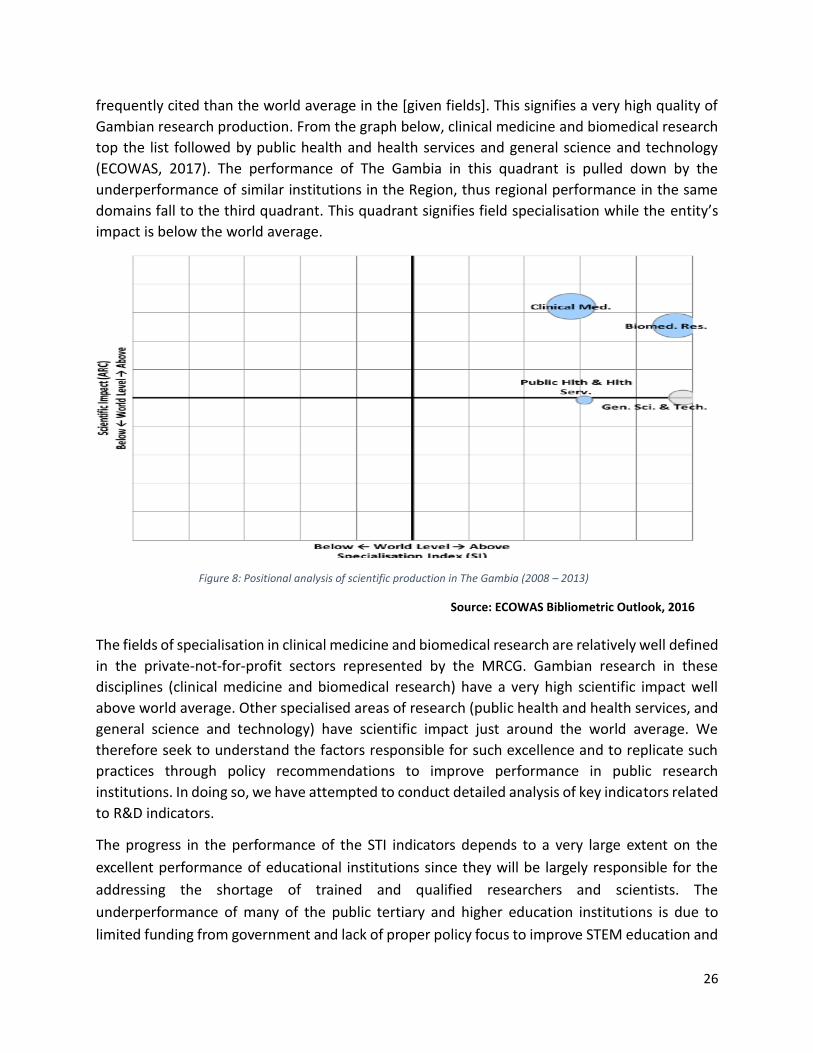
frequently cited than the world average in the [given fields]. This signifies a very high quality of
Gambian research production. From the graph below, clinical medicine and biomedical research
top the list followed by public health and health services and general science and technology
(ECOWAS, 2017). The performance of The Gambia in this quadrant is pulled down by the
underperformance of similar institutions in the Region, thus regional performance in the same
domains fall to the third quadrant. This quadrant signifies field specialisation while the entity’s
impact is below the world average.
Figure 8: Positional analysis of scientific production in The Gambia (2008 – 2013)
Source: ECOWAS Bibliometric Outlook, 2016
The fields of specialisation in clinical medicine and biomedical research are relatively well defined
in the private-not-for-profit sectors represented by the MRCG. Gambian research in these
disciplines (clinical medicine and biomedical research) have a very high scientific impact well
above world average. Other specialised areas of research (public health and health services, and
general science and technology) have scientific impact just around the world average. We
therefore seek to understand the factors responsible for such excellence and to replicate such
practices through policy recommendations to improve performance in public research
institutions. In doing so, we have attempted to conduct detailed analysis of key indicators related
to R&D indicators.
The progress in the performance of the STI indicators depends to a very large extent on the
excellent performance of educational institutions since they will be largely responsible for the
addressing the shortage of trained and qualified researchers and scientists. The
underperformance of many of the public tertiary and higher education institutions is due to
limited funding from government and lack of proper policy focus to improve STEM education and
27
the development of research and innovation capabilities. Currently, support from development
partners largely focus on infrastructual projects that do not necessarily address the quality of
human resources or the performance of education or scientific institutions.
The National STI Policy (2015-2024) advocates for the development of a critical mass of scientists,
technologists and innovators, but beyond the ratification of this policy, no significant measures
have been put in place to support its implementation. Additionally, in order to adequately
monitor the progress of STI Indicators, the NSTIP advocates the establisment of a National STI
Information Centre (NaSTIC) to lead the development of an effective national STI process and
information system. This will, among others, increase the use of metrics, analysis and evaluation
for benchmarking, policy development processes and decision-making as well as the impact of
STI expenditures. So far, implementing this key policy pillar has been rudimentary with periodic
surveys and reporting conducted ah doc with support from development partners.
The Policy has also been clear with the development of strategic partnerships with the private
sector. Recently, efforts are being made to implement a Tech hub as a joint venture with the
private sector to catalyse technology-based start ups. The transformation of GTTI to a university
of science and technology has also witnessed increased partnership with other universities and
organisations such as the World Bank ACE Impact Project and the Kwame Nkurumah University
of Science and Technology (KNUST), De Montford University, Vrije Universiteit Brussel among
others. Significant efforts are being made currently but there is so much room for improvement.
Key Factors Challenging Progress in the Pergormance of Science. Technology anf Onnovation
Almost all of these programmes are implemented with exclusive donor support with limited or
no budgetary support from government. Government investment in science and technology was
measured by the amount funds allocated or spent to support R&D and innovation programmes
for each fiscal year. Both local funding (GLF) and donor support funds as reported by the
institutions were used to calculate funds available to conduct R&D in public and private
institutions. The proportion of this amount against current government budget was calculated
and expressed in percentages. Far from the 1% target set by African governments during the 2006
AU Heads of State Summit, The Gambia’s estimated expenditure for R&D in 2019 stands at 0.04%.
The net spending on R&D for the year 2018 was GMD1,315,770,100.00 (US$27,411,877.08).
government share of this figure is 4.17%; share from the private-not-for-profit sector is 95.76%
and the business sector is 0.07%. This figure is huge as it accounts for 5.20% of planned
government spending from all revenue sources for 2019. However, the government GBARD4 for
4 GBARD – Government Budget Appropriations for R&D
28
2019 is much smaller estimated at 0.084% for revenue sources from GLF only. More than a decade
ago since the 1% of GDP investment target in research and innovation has been proposed,
majority of African countries haven’t been able to translate this into concrete actions. This is
partly due to the fact that most African governments struggle with conflicting priorities including
funding education, health and agriculture among others. However, science and innovation have
solutions to these challenges only if serious government investments are made.
Government investments in tertiary and higher education tends to overshadow any meaningful
investments in science, technology and innovation. At MoHERST, government allocations to the
Ministry from local sources (GLF only) is 2.00% of all allocations and for all revenue sources (GLF
+ grants + loans etc) is 4.34% of all allocations. It is prudent to question this overshadowing
characteristic and ask if STI merits a separate ministry or agency.
Current Government Efforts to Furthet Accelerate Progress for STI in The Gambia
Current efforts from the Ministry of Higher Education, Research, Science and Technology to
address the funding gaps includes the proposal to establish a national innovation fund and to
legislate for the establishment of an STI agency and other regulatory frameworks to support the
growth of the STI sector. However, such efforts are futile if they are not followed by concrete
political will and support to leverage the contributions of STI to nationald development
objectives.
BIBLIOGRAPHY
(NPCA), N. P. (2014). African Innovation Outlook. Pretoria: NEPAD Planning and Coordinating
Agency (NPCA).
Commission, E. (2018). The EU Industrial R&D Investment Scoreboard. Retrieved from
Economics of Industrial Research and Innovation:
http://iri.jrc.ec.europa.eu/scoreboard18.html; accessed ib 15 July 2019
ECOWAS, (. C. (2017). Scientific Research in West Africa: Bibliometric Outlook 2016. Abuja:
ECOWAS. Retrieved from www.ecowas.int
MoHERST. (2018). MoHERST Report on Pipeline Human Resources in Science and Technology.
UNESCO. (2019, 07 07). UNESCO News. Retrieved from UNESCO:
https://en.unesco.org/news/just-30-world’s-researchers-are-women-whats-situation-
your-country
29
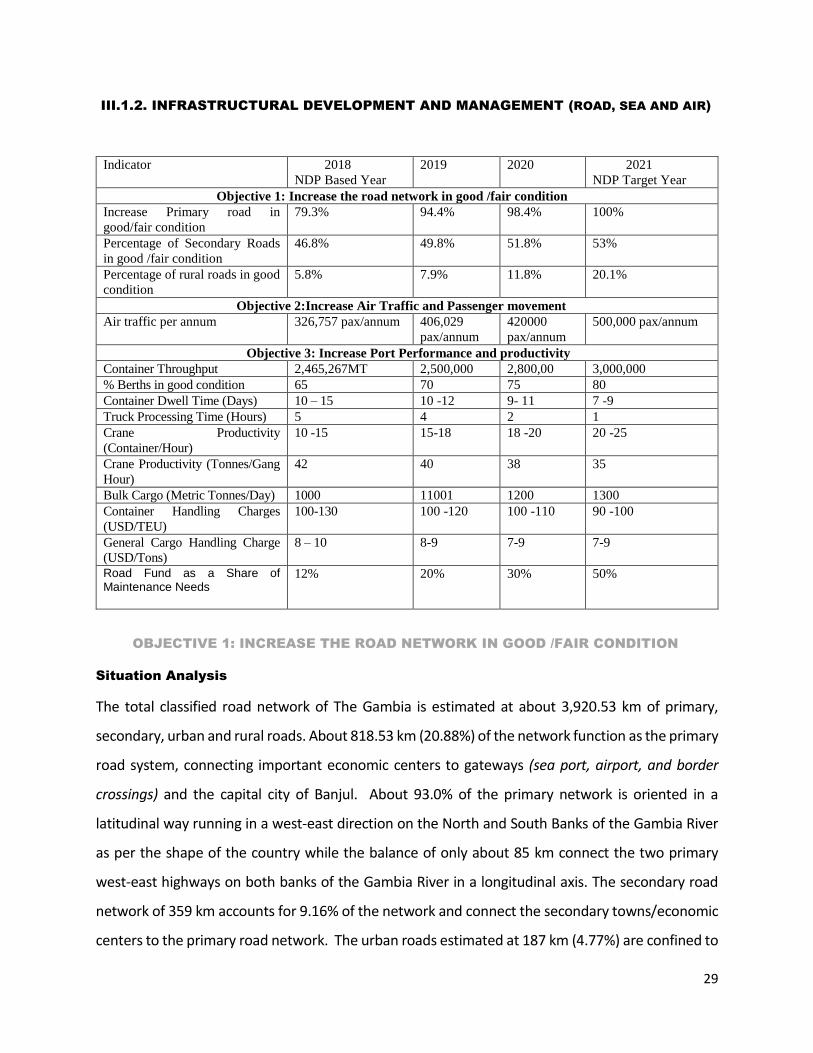
III.1.2. INFRASTRUCTURAL DEVELOPMENT AND MANAGEMENT (ROAD, SEA AND AIR)
Indicator 2018
NDP Based Year
2019 2020 2021
NDP Target Year
Objective 1: Increase the road network in good /fair condition
Increase Primary road in
good/fair condition
79.3% 94.4% 98.4% 100%
Percentage of Secondary Roads
in good /fair condition
46.8% 49.8% 51.8% 53%
Percentage of rural roads in good
condition
5.8% 7.9% 11.8% 20.1%
Objective 2:Increase Air Traffic and Passenger movement
Air traffic per annum 326,757 pax/annum 406,029
pax/annum
420000
pax/annum
500,000 pax/annum
Objective 3: Increase Port Performance and productivity
Container Throughput 2,465,267MT 2,500,000 2,800,00 3,000,000
% Berths in good condition 65 70 75 80
Container Dwell Time (Days) 10 – 15 10 -12 9- 11 7 -9
Truck Processing Time (Hours) 5 4 2 1
Crane Productivity
(Container/Hour)
10 -15 15-18 18 -20 20 -25
Crane Productivity (Tonnes/Gang
Hour)
42 40 38 35
Bulk Cargo (Metric Tonnes/Day) 1000 11001 1200 1300
Container Handling Charges
(USD/TEU)
100-130 100 -120 100 -110 90 -100
General Cargo Handling Charge
(USD/Tons)
8 – 10 8-9 7-9 7-9
Road Fund as a Share of Maintenance Needs
12% 20% 30% 50%
OBJECTIVE 1: INCREASE THE ROAD NETWORK IN GOOD /FAIR CONDITION
Situation Analysis
The total classified road network of The Gambia is estimated at about 3,920.53 km of primary,
secondary, urban and rural roads. About 818.53 km (20.88%) of the network function as the primary
road system, connecting important economic centers to gateways (sea port, airport, and border
crossings) and the capital city of Banjul. About 93.0% of the primary network is oriented in a
latitudinal way running in a west-east direction on the North and South Banks of the Gambia River
as per the shape of the country while the balance of only about 85 km connect the two primary
west-east highways on both banks of the Gambia River in a longitudinal axis. The secondary road
network of 359 km accounts for 9.16% of the network and connect the secondary towns/economic
centers to the primary road network. The urban roads estimated at 187 km (4.77%) are confined to
30
Banjul and Greater Banjul Area; and excludes the primary and secondary roads intercepted by Banjul
urban boundaries. The rural feeder roads consist of 2,556 km and account for 65.19% of the
classified network.
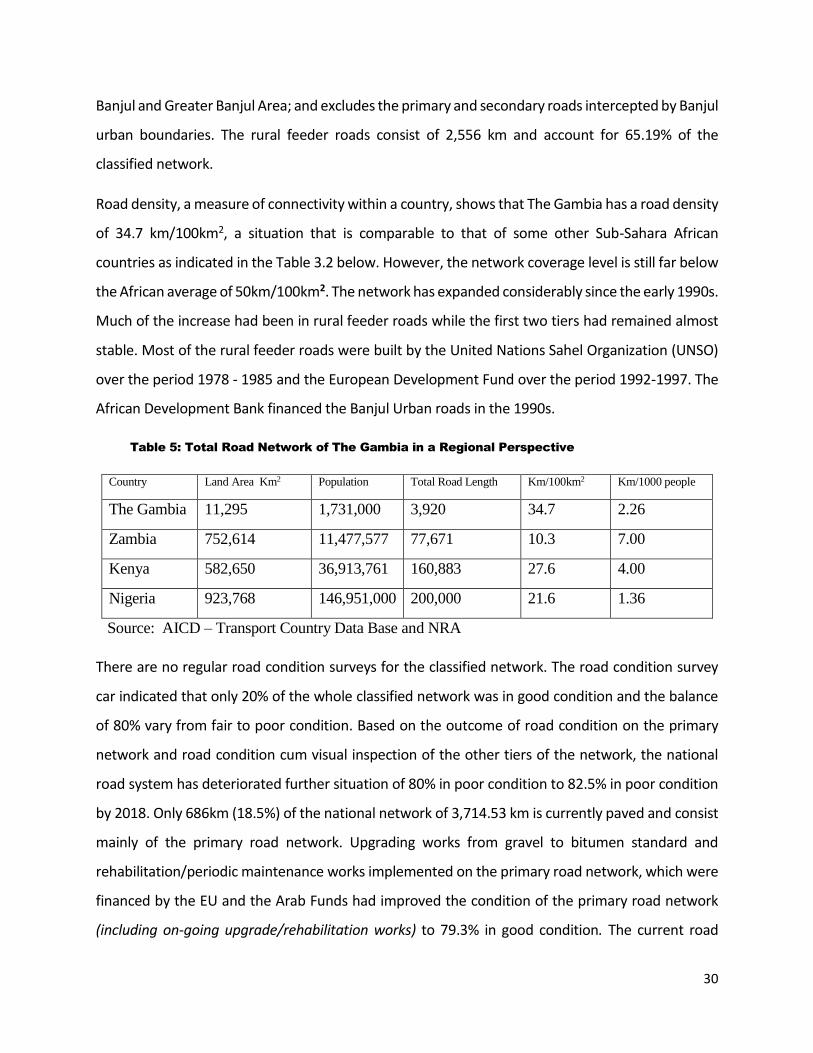
Road density, a measure of connectivity within a country, shows that The Gambia has a road density
of 34.7 km/100km2, a situation that is comparable to that of some other Sub-Sahara African
countries as indicated in the Table 3.2 below. However, the network coverage level is still far below
the African average of 50km/100km2. The network has expanded considerably since the early 1990s.
Much of the increase had been in rural feeder roads while the first two tiers had remained almost
stable. Most of the rural feeder roads were built by the United Nations Sahel Organization (UNSO)
over the period 1978 - 1985 and the European Development Fund over the period 1992-1997. The
African Development Bank financed the Banjul Urban roads in the 1990s.
Table 5: Total Road Network of The Gambia in a Regional Perspective
Country Land Area Km2 Population Total Road Length Km/100km2 Km/1000 people
The Gambia 11,295 1,731,000 3,920 34.7 2.26
Zambia 752,614 11,477,577 77,671 10.3 7.00
Kenya 582,650 36,913,761 160,883 27.6 4.00
Nigeria 923,768 146,951,000 200,000 21.6 1.36
Source: AICD – Transport Country Data Base and NRA
There are no regular road condition surveys for the classified network. The road condition survey
car indicated that only 20% of the whole classified network was in good condition and the balance
of 80% vary from fair to poor condition. Based on the outcome of road condition on the primary
network and road condition cum visual inspection of the other tiers of the network, the national
road system has deteriorated further situation of 80% in poor condition to 82.5% in poor condition
by 2018. Only 686km (18.5%) of the national network of 3,714.53 km is currently paved and consist
mainly of the primary road network. Upgrading works from gravel to bitumen standard and
rehabilitation/periodic maintenance works implemented on the primary road network, which were
financed by the EU and the Arab Funds had improved the condition of the primary road network
(including on-going upgrade/rehabilitation works) to 79.3% in good condition. The current road
31
condition aggravates vehicle operating costs and increases passengers travel time which is a serious
burden on the economy.
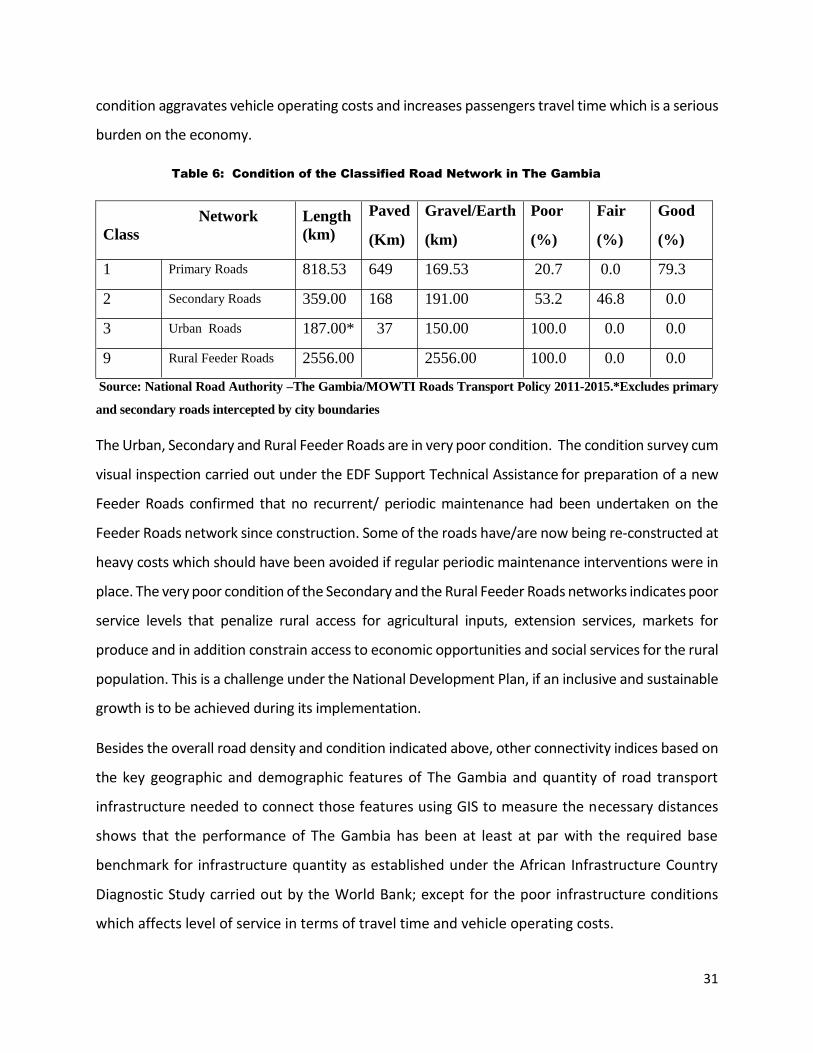
Table 6: Condition of the Classified Road Network in The Gambia
Network
Class
Length
(km)
Paved
(Km)
Gravel/Earth
(km)
Poor
(%)
Fair
(%)
Good
(%)
1 Primary Roads 818.53 649 169.53 20.7 0.0 79.3
2 Secondary Roads 359.00 168 191.00 53.2 46.8 0.0
3 Urban Roads 187.00* 37 150.00 100.0 0.0 0.0
9 Rural Feeder Roads 2556.00 2556.00 100.0 0.0 0.0
Source: National Road Authority –The Gambia/MOWTI Roads Transport Policy 2011-2015.*Excludes primary
and secondary roads intercepted by city boundaries
The Urban, Secondary and Rural Feeder Roads are in very poor condition. The condition survey cum
visual inspection carried out under the EDF Support Technical Assistance for preparation of a new
Feeder Roads confirmed that no recurrent/ periodic maintenance had been undertaken on the
Feeder Roads network since construction. Some of the roads have/are now being re-constructed at
heavy costs which should have been avoided if regular periodic maintenance interventions were in
place. The very poor condition of the Secondary and the Rural Feeder Roads networks indicates poor
service levels that penalize rural access for agricultural inputs, extension services, markets for
produce and in addition constrain access to economic opportunities and social services for the rural
population. This is a challenge under the National Development Plan, if an inclusive and sustainable
growth is to be achieved during its implementation.
Besides the overall road density and condition indicated above, other connectivity indices based on
the key geographic and demographic features of The Gambia and quantity of road transport
infrastructure needed to connect those features using GIS to measure the necessary distances
shows that the performance of The Gambia has been at least at par with the required base
benchmark for infrastructure quantity as established under the African Infrastructure Country
Diagnostic Study carried out by the World Bank; except for the poor infrastructure conditions
which affects level of service in terms of travel time and vehicle operating costs.
32
Regional connectivity refers to the road infrastructure needed to connect national capitals and
all other large cities (those with a population of more than 250,000) to the main international
border crossings and major deep sea ports/airports. The road infrastructure considered
appropriate to achieve this regional connectivity includes 137kms of interurban roads with at
least two paved lanes and hard shoulders of at least 2 meters on each side. This is attained by
the Gambia in terms of infrastructure quantity. However, the Gambia fall short in terms of quality
of infrastructure which should be about 100% as against about 80% for The Gambia for this class
of transport infrastructure.
National connectivity: - National connectivity refers to the road infrastructure needed to connect
provincial capitals and other secondary cities (with a population of at least 25,000) to the regional
network described above. The infrastructure considered appropriate to achieve this national
connectivity for The Gambia consists of a minimum of one-lane paved roads of 564 kms., and
given the length of the two lane paved primary road network of over 500kms excluding the roads
for regional connectivity, this index is about achieved; though fall short in terms of quality of
infrastructure that required infrastructure in good to fair condition to be at about 90 to 100%.
Rural connectivity. Rural connectivity is based on the World Bank’s Rural Accessibility Index (RAI),
which expresses the percentage of the rural population living within two kilometers of an all-
season road. Gambia requires a rural roads network of 1,143km to achieve this target and with a
rural road network of over 2,500kms, the infrastructure quantity target has been achieved;
though the poor condition of infrastructure affect level of and cost of services.
The urban transport infrastructure of the Gambia consist of 187km of road of which 37 km are in
Banjul and 150km are in the Greater Banjul Area. The primary focus in the urban transport sub-
sector is to address the emerging transport crisis in the Greater Banjul Metropolis, which is facing
the challenge of rapid urbanization. A key deficiency in managing urban transport is lack of
institutional authority due to multiplicity of agencies involved. Currently there is a blur with
respect to institutional responsibilities for the hierarchy of urban roads network and regulation
of urban transport services on the arterial, collector and local roads in urban centres. This would
need to be rationalized and strengthened in order to improve efficiency of the urban transport
system and accountability for system failure particularly for the interrelated plans covering road

33
network, bus network and truck routes, and traffic management plan for Central Business District
(CBD) in the city environment.
Key Challenges
The Government has made some progress in developing the transport sector in the past few years.
However, key challenges affecting the sector include: the institutional, policy and regulatory
environment; the absence of a transport sector-wide Master Plan; the quality of infrastructure is
poor due to maintenance neglect and rapid urbanization is creating a transport crisis in the Greater
Banjul Metropolis. The donor funding for financing infrastructure development and management
also appeared to be a challenge constraining the sector
Recommendation for Action
The Government needs to allocate sufficient resources to road infrastructure
development and management. The government of the Gambia fully rely on the donors
for new road investment, and it’s evident that recently there is a donor fatigue in the
sector. Therefore, there is the need to look for new innovative means like PPPs to
accelerate progress in the development of the sector.
There is the need to develop an Integrated National Transport Master plan to allow
integration of various modes of transport.
The policy recommendation in the national transport policy to prioritize road
maintenance over new construction needs to be implemented. Investments in road
transport infrastructure development and management should be based on sound
economic and social criteria.
There is the need to develop of a Prioritized Five-Year Road Development Programme for
the primary and secondary roads network consistent with the macro-economic and fiscal
framework and Medium-Term Expenditure framework for the road sector.
There is the need to develop a Heavy Vehicle Management Programme to prevent pre-
mature damage to road pavements;
34
There is the need to enhance institutional capacity building in road transport sector to
enhance proper planning, programming and execution of road works and managing
contractors and consultants;
There is the need to support programme for the development of the Local Road
Construction Industry; starting with Labour based method in collaboration with ILO and
other development partners and GAMWORKS; and private sector management of heavily
trafficked road corridors
Initiation of a Road Safety Programme with creation of necessary institutional framework-
National Road Safety Council with a secretariat to develop its work programme.
OBJECTIVE 2: INCREASE AIR TRAFFIC AND PASSENGER MOVEMENT
Brief Situation Analysis
Air Transport plays a major role within the Gambia Transport System in providing international
gateways for the business community with the rest of the world and is of critical importance for
the Gambia Tourist Industry. Because of the small size of the country, domestic air transport has
not been part of the internal transport system. Transport by Air into and out of The Gambia is via
the Banjul International Airport (BIA) situated at Yundum, about 24 kilometers to the south-east
of Banjul and it is the only airport. The current capacity at the Banjul International Airport (BIA)
is only optimally utilized during the tourist season of November to April each year; waiting for
new business case for the rest of the year.
Air Traffic Movement
Air Traffic demand at Banjul International Airport continues to grow significantly. In 2018, a total
of 326,757 passengers was handled at the airport depicting an increase of 25% compared to the
preceding year. This figure has increase to 406,029 in 2019.This upward trajectory which is
projected to continue for the foreseeable future was made possible by a massive 60% increase
in regional traffic and a 15.2% rise in European/International traffic during the period.
35
One of the key milestones in our aviation industry in The Gambia is the commencement of
operations at Banjul International Airport by one of the global giants in the airline industry,
Turkish Airlines in last quarter of 2018. This renowned international legacy carrier, which is the
largest airline operator in the world in terms of number of destinations served, operates a
frequency of three weekly flights between Banjul and Istanbul. This is not only enhancing
connectivity between Banjul and the rest of the world but is also putting the country’s aviation
industry on the global stage as it indicates the ability of the country to welcome and serve such
global carriers.
Infrastructure improvement at Banjul International Airport (BIA)
Facilities and infrastructure at the airport continue to be improved in line with the Airport
Improvement Project. Ongoing works at the airport include the rehabilitation of the New
Passenger Terminal Building which is expected to address functionality issues relating to
passenger flow and facilitation whilst ensuring optimal use of terminal floor spaces. At the end
of this phase, the capacity of the terminal building will be increased to handle up to 500,000
passengers per annum. Which means the target of 500,000 passengers per annum by 2021 would
be achieved.
As per international standards, Common User Passenger Processing Systems (CUPPS) including
self-service kiosks amongst others will be introduced in the terminal to enhance service delivery.
The Air Traffic Control Tower is also being refurbished and the works include the installation of
ultramodern communication equipment in the tower. All these interventions will enhance the
productivity of the air transport sector in The Gambia
Challenges
There is the need for further investment in the Airport to enhance its productivity. However,
investment in infrastructure alone is not sufficient to the productivity of the airport. The peak
traffic generated by the tourists during the tourist season is the main determinant of the capacity
requirements of the Banjul International Airport. Thus, there is idle capacity during 6 months of
the year after the tourist season of November to April. However, a hub must have the necessary

36
domestic traffic density and a functional Gambian-based airline both of which are not the case.
Getting all stakeholders to get the business case to make the BIA viable is a major challenge for
the sub-sector. Given current traffic level of less than 500,000 passengers a year, the BIA may not
be attractive for private sector investment.
Recommendations for Further Actions
There is the need for vigorous marketing of the BIA for capacity utilization during the off-
tourist season; an emerging strategy is that of promoting the BIA as an air transport hub
in West Africa. This requires a lot of buy-in from stakeholders both within and outside of
The Gambia to justify any capacity expansion both for the passenger terminal and runway.
Given current traffic level which is less than the break-even of at least 500,000 Pax per
annum, the BIA may only be attractive for private sector investment on a long-term
management contract.
The dimensioning of airport infrastructure and facilities call for marketing the airport for
business during the off-tourist season. With small business travel given the low per capita
income of The Gambia and the small population, other export promotion opportunities
need to be explored including marketing the airport as a hub in the sub-region. There is
the need to have a home-based carrier for the Gambia.
OBJECTIVE 3: INCREASE PORT PERFORMANCE AND PRODUCTIVITY
Situation Analysis
The Port of Banjul is the only maritime port managed by the GPA and is the gateway for the
export/import trade of the Gambia accounting for over 80% of total international trade. The
Gambia Maritime Administration is responsible for the regulation of the maritime transport
sector. The Banjul Port presently has two jetties, the Banjul Wharf and the New Banjul Jetty with
combined quay length of 428 metres. The two installations comprise at inner and outer sides five
berths and a Ro-Ro Ramp facility at the northern end of the New Banjul Jetty.
37
Traffic at the Port of Banjul
Key among the indicators to measure the performance and productivity of the Port is the
throughput of the port per year. Throughput at the Port of Banjul registered 3% growth in 2018
when compared to 2017 (2,465,267MT in 2018 and 2,397,725MT in 2017).
The Port is also investing in necessary infrastructure with the view to improving service delivery,
GPA has finalized the procurement of 8 New Terminal Tractor trailers and 1 Empty Container
Handler. This would go a long way in boosting productivity during vessel operations as well as
enhancing performance at the terminals.
The GoTG is planning for a port expansion with a 200 metre wharf extension with capacity to
handle larger vessels of over 20,000 DWT. But this is on the proviso, that there is concessioning
of the container terminals which will lead to increased efficiency to restore the ports competitive
edge to participate in transit and re-exports trade currently threatened by increased competition
from neighbouring ports of Dakar and Conakry that have moved to landlord model ports. The
Banjul Port is still a public service port model and this has affected its efficiency compared to
these neighbouring ports; resulting in erosion of its competitive position for the same hinterland.
Other infrastructure constraints include additional container storage area needed to improve the
capacity and efficiency of the Port of Banjul, inter-modality in terms of inland transport
connections particularly on regional road networks with trade and transport facilitation
instruments and use of Gambia River complemented with Inland Container Depots. Major
investment in infrastructure however needs to be preceded by port reforms.
Port Productivity and Performance
The GPA is concerned with improving overall performance of the port particularly given the fierce
inter port competition within the sub-region and the impact of inefficiencies on the competitiveness
of The Gambia economy. The key performance indicators as reflected in Table 5.6 below indicated
that based on industry benchmark, the GPA has to work on the Container Dwell time (days) which
is between 10-15 days as against the benchmark of less than 7 days, Truck processing time of 5 hours
against the industry average of less than one hour, and Crane Productivity in terms of containers per

38
hour which is at a low of 10 moves per hour compared to industry average of 20-30 moves per hour.
However for handling of general cargo, the Banjul Port’s achievement of 42 tonnes per gang hour is
comparable to international benchmark of greater than 30 tons per hour (See Table 3.6. below on
the Banjul Port Performance Indicators compared to industry benchmark).
Table 7: Banjul Port Productivity and Performance Indicators
Indicator Banjul Port International Benchmark
% Berths in good condition 65 80 -100
Container Dwell Time (Days) 10 – 15 < 7
Truck Processing Time (Hours) 5 <1
Crane Productivity (Container/Hour) 17 20-30
Crane Productivity (Tonnes/Gang Hour) 42 >30
Bulk Cargo (Metric Tonnes/Day) 1000
Container Handling Charges (USD/TEU) 100-130 80-150
General Cargo Handling Charge (USD/Tons) 8 – 10 7 – 9
Source: Gambia Ports Authority
An extension of the New Banjul wharf by 200 meters, Basic Yard Expansion (Acquisition of Half
Die Area phase II, KG 5 Football Field, GTTI Annex and Muslim High School) and Relocation of GPA
Head Office as well as rehabilitation of existing North and South Container terminals featured
prominently in the GPA’s immediate expansion Projects.
Discussions are ongoing to secure concessionary funding from bilateral friendly countries as well
as the GPA’s traditional partner AfDB for the financing of infrastructure projects identified under
the New Port Master Plan (2011-2038) to the tune of US$142. If things go as planned, the Port
performance and productivity will be greatly enhanced.
Challenges
The Authority’s major constraints and challenges include inadequate space for open container
storage and limited berth availability. The Depth at approach channel and at berth sides are a
constraint to the bigger vessels in the changing trends in the port and shipping industry. Banjul is
a port city and the urban sprawl has led to significant urban development in areas adjacent to
39
the port, leaving little room for port expansion or port service industries to develop in the future.
This will call for development of inland transport connection and effective coordination between
the Banjul Port Master Plan, the Banjul Urban Development Master Plan and National
Transportation Master Plan that require intermodal coordination of surface transport that may
necessitate use of container barges to off port ICD on the bank of the River Gambia outside the
urban boundary.
Recommendations
There is the need to further improve the facilities at the port of Banjul to enhance its
performance and productivity
The role of the private sector in the further development of the Sector calls for
institutional restructuring of the GPA from a public service model to that of a Landlord
model in order to improve operational efficiency and hold its competitive position in the
fierce competition with other regional ports. Globalization has affected the port and
shipping industry in a way that the port management model has moved from public
service ports to landlord model in order to improve efficiency in the face of increasing
containerization of world trade that is growing and has replaced break bulk cargo.
Better handling capacity for bulk cargo and container logistics to improve current
operational performance; and Improved regional road connections with trade and
transport facilitation measures to the hinterland countries of the port.
The Banjul Port needs to be relocated to an expandable area such as Sanyang or Kartong
as expansion in Banjul is almost impossible given the limited land area for expansion
OBJECTIVE 4: ESTABLISH AND SUSTAINABLY MANAGE A NATIONAL ROAD FUND
Situational Analysis
As part of the reform of the road sub-sector, the National Roads Authority established by an Act
of Parliament in 2003 and vested with the responsibility of the administration, control,
construction and maintenance of all roads in The Gambia, also establishes a Road Fund under the
Authority, which shall be used exclusively to finance the operation of the Authority in the
performance of its functions. The target sources of funds for the Road Fund are:
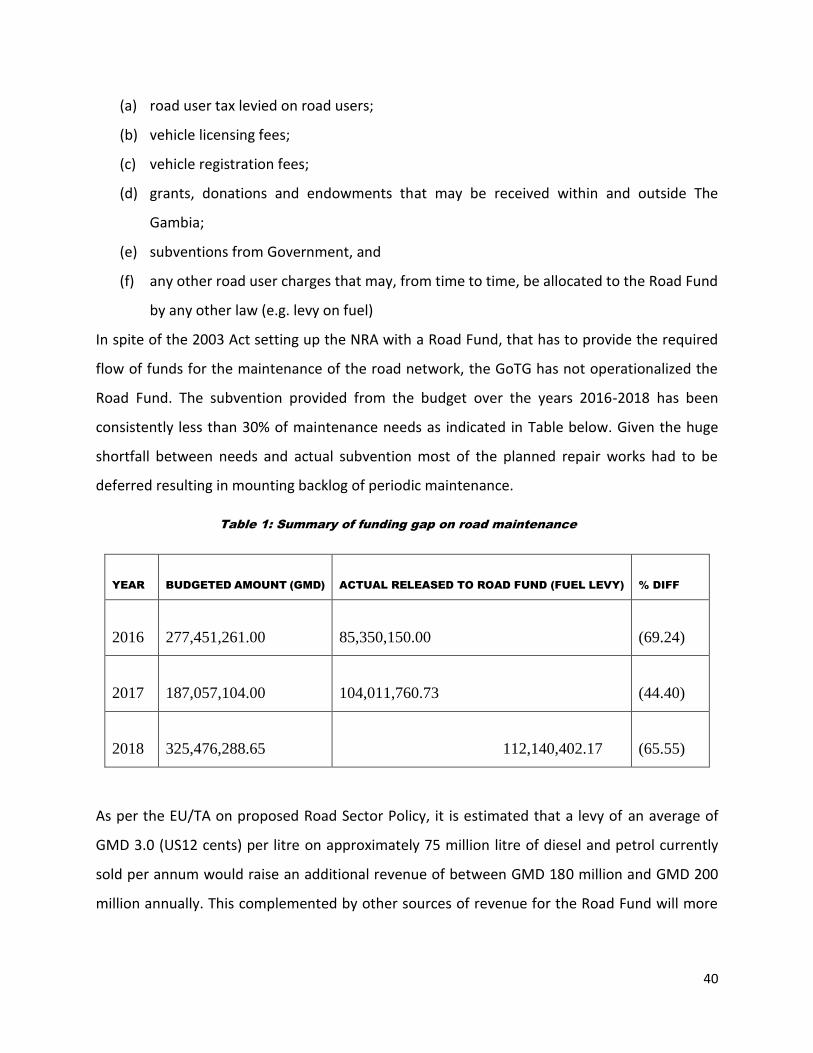
40
(a) road user tax levied on road users;
(b) vehicle licensing fees;
(c) vehicle registration fees;
(d) grants, donations and endowments that may be received within and outside The
Gambia;
(e) subventions from Government, and
(f) any other road user charges that may, from time to time, be allocated to the Road Fund
by any other law (e.g. levy on fuel)
In spite of the 2003 Act setting up the NRA with a Road Fund, that has to provide the required
flow of funds for the maintenance of the road network, the GoTG has not operationalized the
Road Fund. The subvention provided from the budget over the years 2016-2018 has been
consistently less than 30% of maintenance needs as indicated in Table below. Given the huge
shortfall between needs and actual subvention most of the planned repair works had to be
deferred resulting in mounting backlog of periodic maintenance.
Table 1: Summary of funding gap on road maintenance
YEAR BUDGETED AMOUNT (GMD) ACTUAL RELEASED TO ROAD FUND (FUEL LEVY) % DIFF
2016
277,451,261.00 85,350,150.00
(69.24)
2017
187,057,104.00 104,011,760.73
(44.40)
2018
325,476,288.65 112,140,402.17
(65.55)
As per the EU/TA on proposed Road Sector Policy, it is estimated that a levy of an average of
GMD 3.0 (US12 cents) per litre on approximately 75 million litre of diesel and petrol currently
sold per annum would raise an additional revenue of between GMD 180 million and GMD 200
million annually. This complemented by other sources of revenue for the Road Fund will more
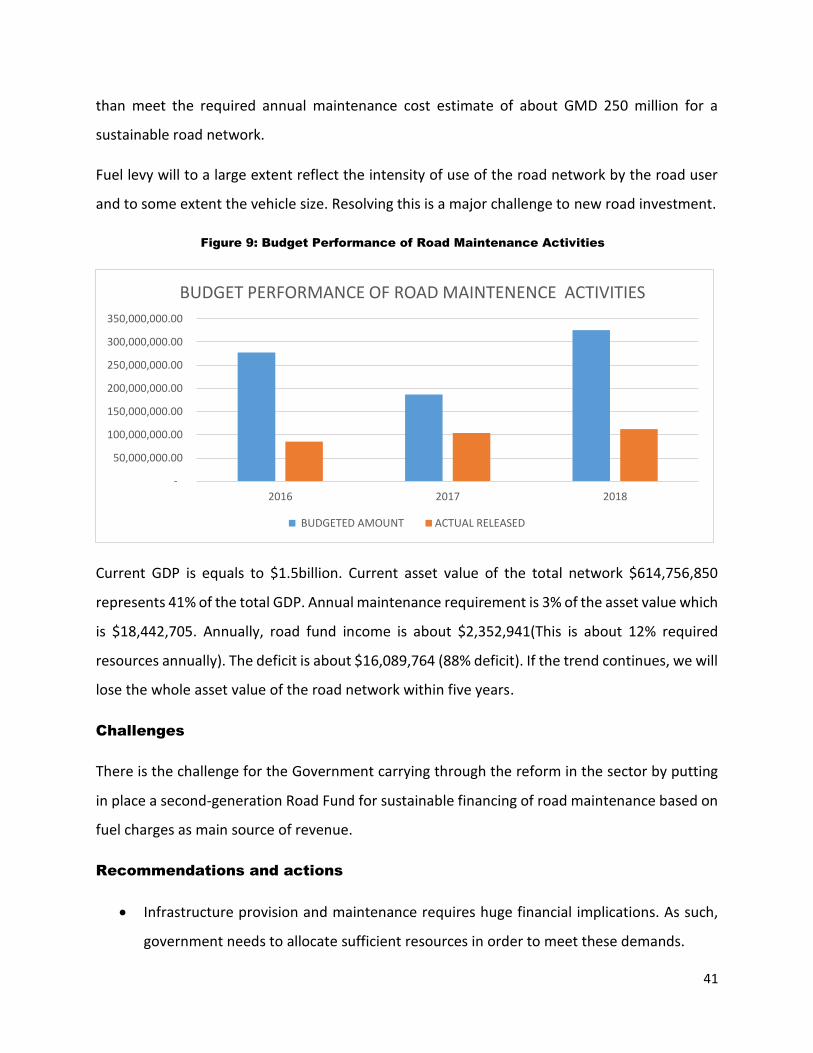
41
than meet the required annual maintenance cost estimate of about GMD 250 million for a
sustainable road network.
Fuel levy will to a large extent reflect the intensity of use of the road network by the road user
and to some extent the vehicle size. Resolving this is a major challenge to new road investment.
Figure 9: Budget Performance of Road Maintenance Activities
Current GDP is equals to $1.5billion. Current asset value of the total network $614,756,850
represents 41% of the total GDP. Annual maintenance requirement is 3% of the asset value which
is $18,442,705. Annually, road fund income is about $2,352,941(This is about 12% required
resources annually). The deficit is about $16,089,764 (88% deficit). If the trend continues, we will
lose the whole asset value of the road network within five years.
Challenges
There is the challenge for the Government carrying through the reform in the sector by putting
in place a second-generation Road Fund for sustainable financing of road maintenance based on
fuel charges as main source of revenue.
Recommendations and actions
Infrastructure provision and maintenance requires huge financial implications. As such,
government needs to allocate sufficient resources in order to meet these demands.
-
50,000,000.00
100,000,000.00
150,000,000.00
200,000,000.00
250,000,000.00
300,000,000.00
350,000,000.00
2016 2017 2018
BUDGET PERFORMANCE OF ROAD MAINTENENCE ACTIVITIES
BUDGETED AMOUNT ACTUAL RELEASED
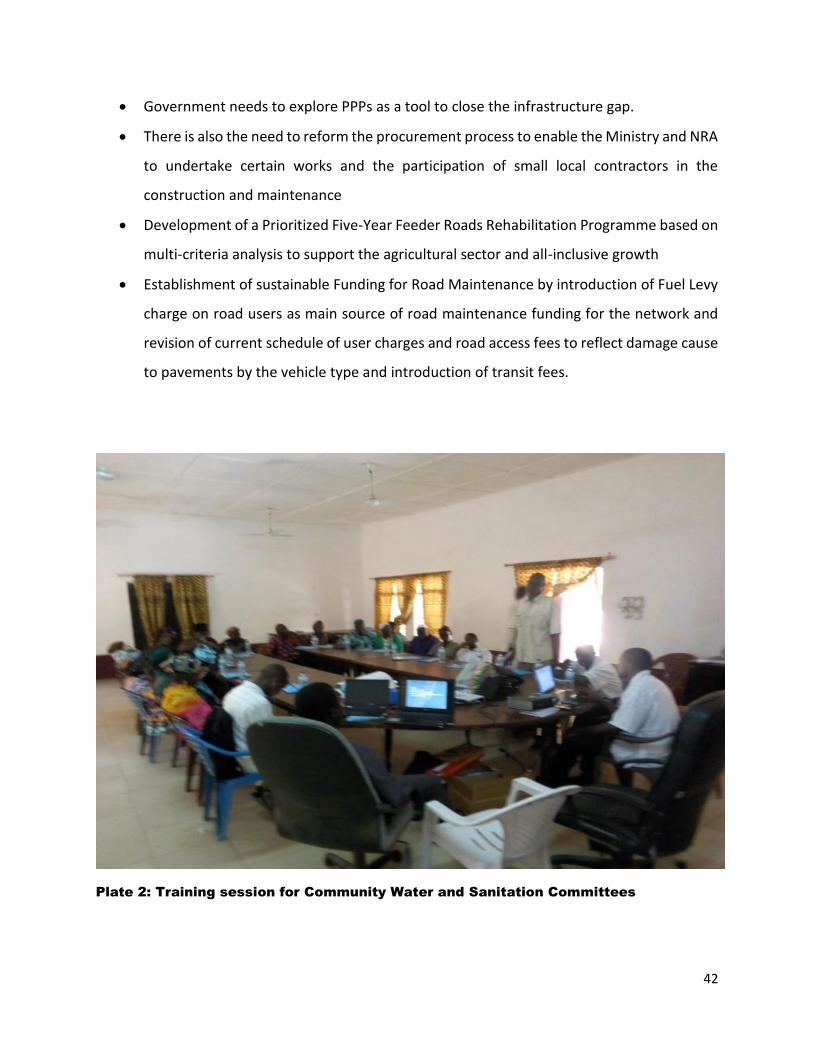
42
Government needs to explore PPPs as a tool to close the infrastructure gap.
There is also the need to reform the procurement process to enable the Ministry and NRA
to undertake certain works and the participation of small local contractors in the
construction and maintenance
Development of a Prioritized Five-Year Feeder Roads Rehabilitation Programme based on
multi-criteria analysis to support the agricultural sector and all-inclusive growth
Establishment of sustainable Funding for Road Maintenance by introduction of Fuel Levy
charge on road users as main source of road maintenance funding for the network and
revision of current schedule of user charges and road access fees to reflect damage cause
to pavements by the vehicle type and introduction of transit fees.
Plate 2: Training session for Community Water and Sanitation Committees
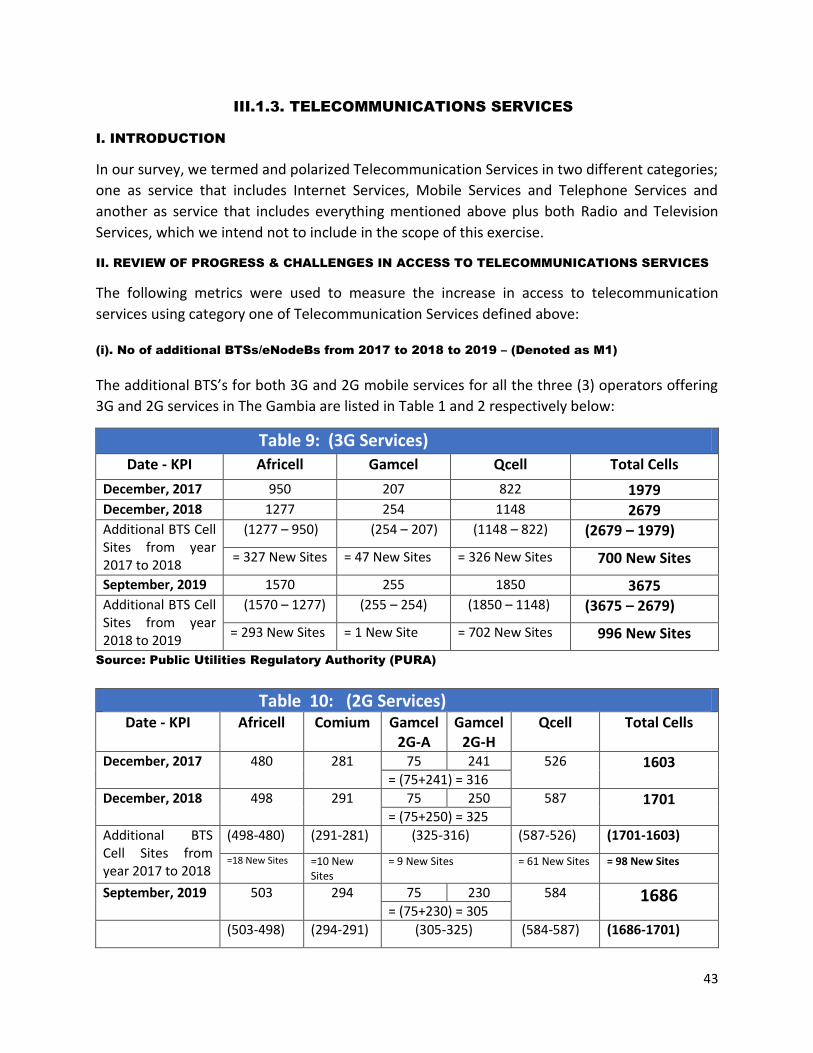
43
III.1.3. TELECOMMUNICATIONS SERVICES
I. INTRODUCTION
In our survey, we termed and polarized Telecommunication Services in two different categories;
one as service that includes Internet Services, Mobile Services and Telephone Services and
another as service that includes everything mentioned above plus both Radio and Television
Services, which we intend not to include in the scope of this exercise.
II. REVIEW OF PROGRESS & CHALLENGES IN ACCESS TO TELECOMMUNICATIONS SERVICES
The following metrics were used to measure the increase in access to telecommunication
services using category one of Telecommunication Services defined above:
(i). No of additional BTSs/eNodeBs from 2017 to 2018 to 2019 – (Denoted as M1)
The additional BTS’s for both 3G and 2G mobile services for all the three (3) operators offering
3G and 2G services in The Gambia are listed in Table 1 and 2 respectively below:
Table 9: (3G Services) Date - KPI Africell Gamcel Qcell Total Cells
December, 2017 950 207 822 1979 December, 2018 1277 254 1148 2679 Additional BTS Cell Sites from year 2017 to 2018
(1277 – 950) (254 – 207) (1148 – 822) (2679 – 1979)
= 327 New Sites = 47 New Sites = 326 New Sites 700 New Sites
September, 2019 1570 255 1850 3675 Additional BTS Cell Sites from year 2018 to 2019
(1570 – 1277) (255 – 254) (1850 – 1148) (3675 – 2679)
= 293 New Sites = 1 New Site = 702 New Sites 996 New Sites
Source: Public Utilities Regulatory Authority (PURA)
Table 10: (2G Services) Date - KPI Africell Comium Gamcel
2G-A Gamcel
2G-H Qcell Total Cells
December, 2017 480 281 75 241 526 1603 = (75+241) = 316
December, 2018 498 291 75 250 587 1701 = (75+250) = 325
Additional BTS Cell Sites from year 2017 to 2018
(498-480) (291-281) (325-316) (587-526) (1701-1603)
=18 New Sites =10 New Sites
= 9 New Sites = 61 New Sites = 98 New Sites
September, 2019 503 294 75 230 584 1686 = (75+230) = 305
(503-498) (294-291) (305-325) (584-587) (1686-1701)
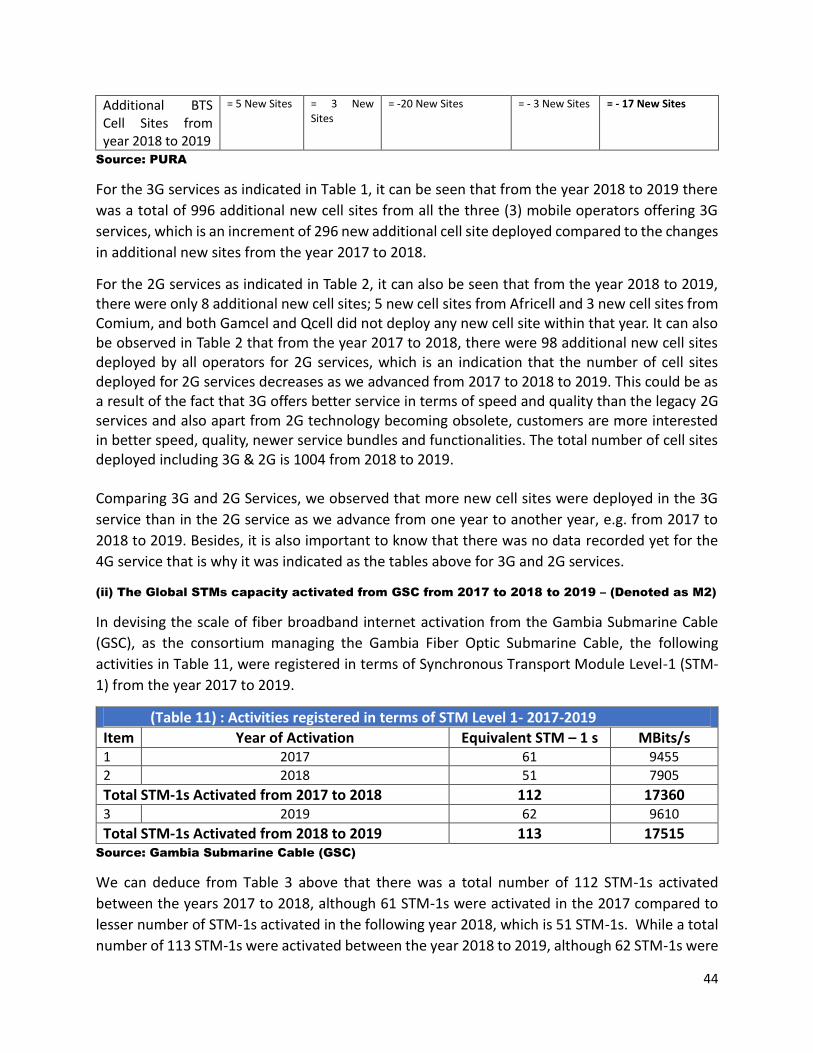
44
Additional BTS Cell Sites from year 2018 to 2019
= 5 New Sites = 3 New Sites
= -20 New Sites = - 3 New Sites = - 17 New Sites
Source: PURA
For the 3G services as indicated in Table 1, it can be seen that from the year 2018 to 2019 there
was a total of 996 additional new cell sites from all the three (3) mobile operators offering 3G
services, which is an increment of 296 new additional cell site deployed compared to the changes
in additional new sites from the year 2017 to 2018.
For the 2G services as indicated in Table 2, it can also be seen that from the year 2018 to 2019, there were only 8 additional new cell sites; 5 new cell sites from Africell and 3 new cell sites from Comium, and both Gamcel and Qcell did not deploy any new cell site within that year. It can also be observed in Table 2 that from the year 2017 to 2018, there were 98 additional new cell sites deployed by all operators for 2G services, which is an indication that the number of cell sites deployed for 2G services decreases as we advanced from 2017 to 2018 to 2019. This could be as a result of the fact that 3G offers better service in terms of speed and quality than the legacy 2G services and also apart from 2G technology becoming obsolete, customers are more interested in better speed, quality, newer service bundles and functionalities. The total number of cell sites deployed including 3G & 2G is 1004 from 2018 to 2019. Comparing 3G and 2G Services, we observed that more new cell sites were deployed in the 3G
service than in the 2G service as we advance from one year to another year, e.g. from 2017 to
2018 to 2019. Besides, it is also important to know that there was no data recorded yet for the
4G service that is why it was indicated as the tables above for 3G and 2G services.
(ii) The Global STMs capacity activated from GSC from 2017 to 2018 to 2019 – (Denoted as M2)
In devising the scale of fiber broadband internet activation from the Gambia Submarine Cable
(GSC), as the consortium managing the Gambia Fiber Optic Submarine Cable, the following
activities in Table 11, were registered in terms of Synchronous Transport Module Level-1 (STM-
1) from the year 2017 to 2019.
(Table 11) : Activities registered in terms of STM Level 1- 2017-2019
Item Year of Activation Equivalent STM – 1 s MBits/s 1 2017 61 9455
2 2018 51 7905
Total STM-1s Activated from 2017 to 2018 112 17360 3 2019 62 9610
Total STM-1s Activated from 2018 to 2019 113 17515 Source: Gambia Submarine Cable (GSC)
We can deduce from Table 3 above that there was a total number of 112 STM-1s activated
between the years 2017 to 2018, although 61 STM-1s were activated in the 2017 compared to
lesser number of STM-1s activated in the following year 2018, which is 51 STM-1s. While a total
number of 113 STM-1s were activated between the year 2018 to 2019, although 62 STM-1s were
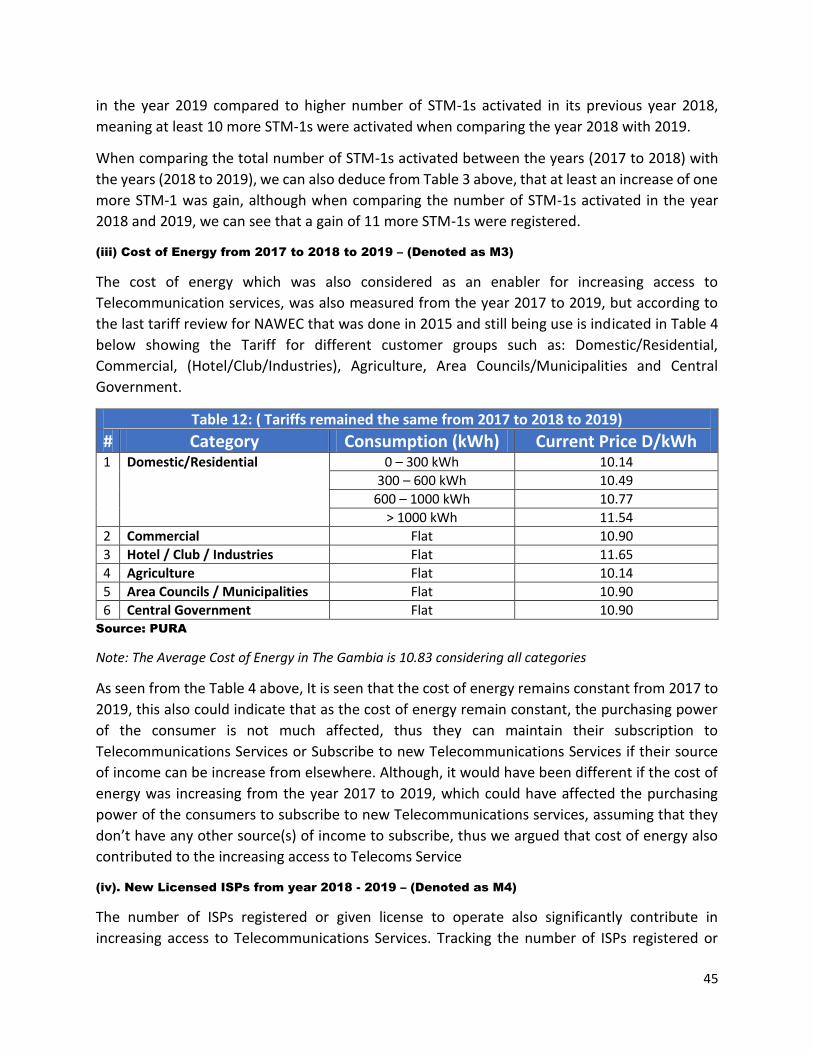
45
in the year 2019 compared to higher number of STM-1s activated in its previous year 2018,
meaning at least 10 more STM-1s were activated when comparing the year 2018 with 2019.
When comparing the total number of STM-1s activated between the years (2017 to 2018) with
the years (2018 to 2019), we can also deduce from Table 3 above, that at least an increase of one
more STM-1 was gain, although when comparing the number of STM-1s activated in the year
2018 and 2019, we can see that a gain of 11 more STM-1s were registered.
(iii) Cost of Energy from 2017 to 2018 to 2019 – (Denoted as M3)
The cost of energy which was also considered as an enabler for increasing access to
Telecommunication services, was also measured from the year 2017 to 2019, but according to
the last tariff review for NAWEC that was done in 2015 and still being use is indicated in Table 4
below showing the Tariff for different customer groups such as: Domestic/Residential,
Commercial, (Hotel/Club/Industries), Agriculture, Area Councils/Municipalities and Central
Government.
Table 12: ( Tariffs remained the same from 2017 to 2018 to 2019)
# Category Consumption (kWh) Current Price D/kWh 1 Domestic/Residential 0 – 300 kWh 10.14
300 – 600 kWh 10.49
600 – 1000 kWh 10.77
> 1000 kWh 11.54
2 Commercial Flat 10.90
3 Hotel / Club / Industries Flat 11.65
4 Agriculture Flat 10.14
5 Area Councils / Municipalities Flat 10.90
6 Central Government Flat 10.90 Source: PURA
Note: The Average Cost of Energy in The Gambia is 10.83 considering all categories
As seen from the Table 4 above, It is seen that the cost of energy remains constant from 2017 to
2019, this also could indicate that as the cost of energy remain constant, the purchasing power
of the consumer is not much affected, thus they can maintain their subscription to
Telecommunications Services or Subscribe to new Telecommunications Services if their source
of income can be increase from elsewhere. Although, it would have been different if the cost of
energy was increasing from the year 2017 to 2019, which could have affected the purchasing
power of the consumers to subscribe to new Telecommunications services, assuming that they
don’t have any other source(s) of income to subscribe, thus we argued that cost of energy also
contributed to the increasing access to Telecoms Service
(iv). New Licensed ISPs from year 2018 - 2019 – (Denoted as M4)
The number of ISPs registered or given license to operate also significantly contribute in
increasing access to Telecommunications Services. Tracking the number of ISPs registered or
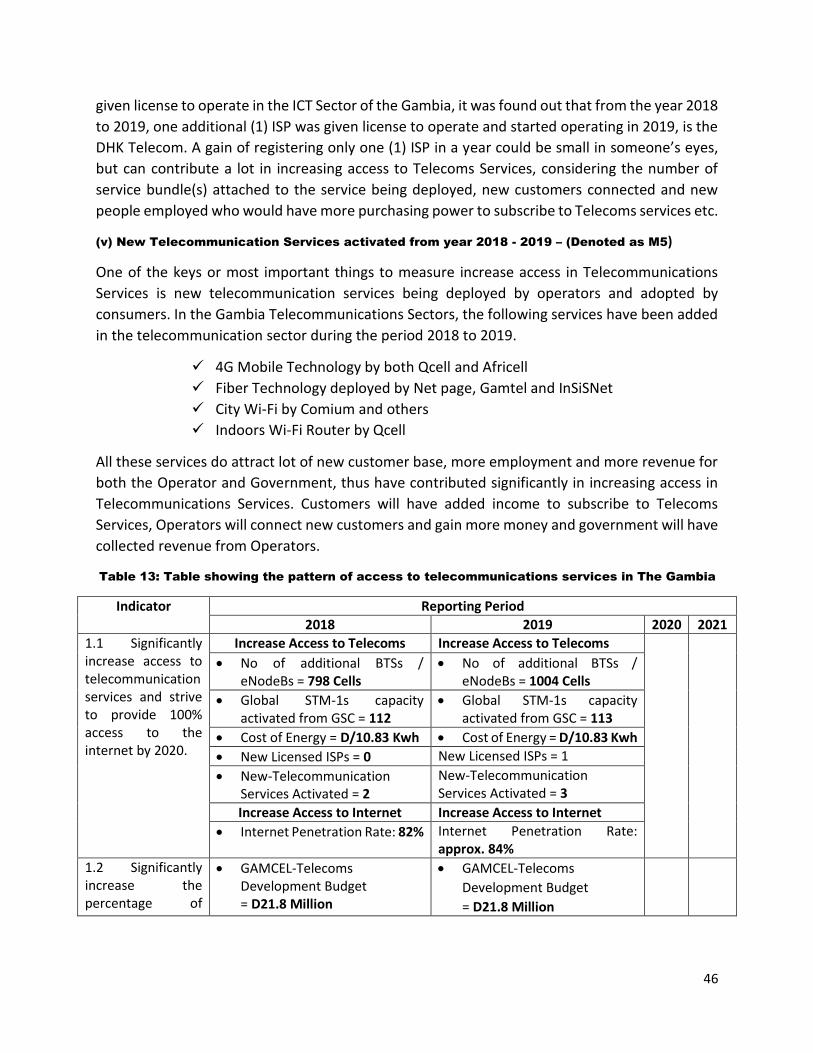
46
given license to operate in the ICT Sector of the Gambia, it was found out that from the year 2018
to 2019, one additional (1) ISP was given license to operate and started operating in 2019, is the
DHK Telecom. A gain of registering only one (1) ISP in a year could be small in someone’s eyes,
but can contribute a lot in increasing access to Telecoms Services, considering the number of
service bundle(s) attached to the service being deployed, new customers connected and new
people employed who would have more purchasing power to subscribe to Telecoms services etc.
(v) New Telecommunication Services activated from year 2018 - 2019 – (Denoted as M5)
One of the keys or most important things to measure increase access in Telecommunications
Services is new telecommunication services being deployed by operators and adopted by
consumers. In the Gambia Telecommunications Sectors, the following services have been added
in the telecommunication sector during the period 2018 to 2019.
4G Mobile Technology by both Qcell and Africell
Fiber Technology deployed by Net page, Gamtel and InSiSNet
City Wi-Fi by Comium and others
Indoors Wi-Fi Router by Qcell
All these services do attract lot of new customer base, more employment and more revenue for
both the Operator and Government, thus have contributed significantly in increasing access in
Telecommunications Services. Customers will have added income to subscribe to Telecoms
Services, Operators will connect new customers and gain more money and government will have
collected revenue from Operators.
Table 13: Table showing the pattern of access to telecommunications services in The Gambia
Indicator Reporting Period
2018 2019 2020 2021
1.1 Significantly increase access to telecommunication services and strive to provide 100% access to the internet by 2020.
Increase Access to Telecoms Increase Access to Telecoms
No of additional BTSs / eNodeBs = 798 Cells
No of additional BTSs / eNodeBs = 1004 Cells
Global STM-1s capacity activated from GSC = 112
Global STM-1s capacity activated from GSC = 113
Cost of Energy = D/10.83 Kwh Cost of Energy = D/10.83 Kwh
New Licensed ISPs = 0 New Licensed ISPs = 1
New-Telecommunication Services Activated = 2
New-Telecommunication Services Activated = 3
Increase Access to Internet Increase Access to Internet
Internet Penetration Rate: 82% Internet Penetration Rate: approx. 84%
1.2 Significantly increase the percentage of
GAMCEL-Telecoms Development Budget = D21.8 Million
GAMCEL-Telecoms
Development Budget
= D21.8 Million
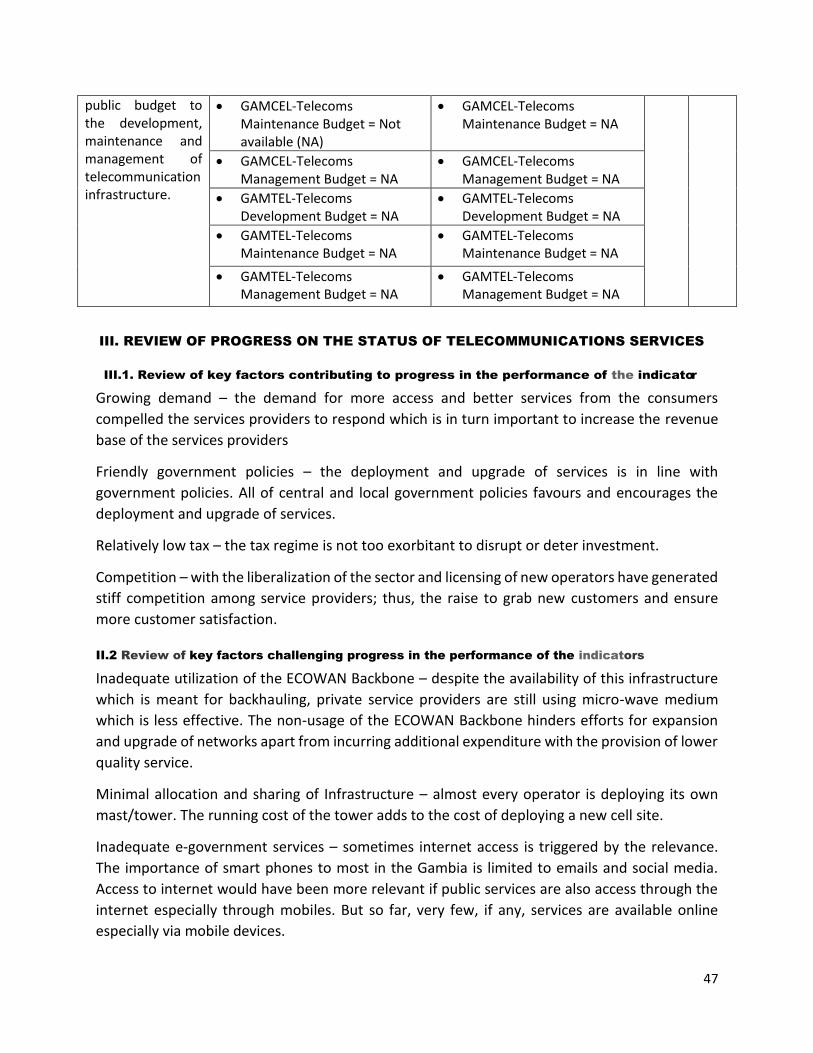
47
public budget to the development, maintenance and management of telecommunication infrastructure.
GAMCEL-Telecoms Maintenance Budget = Not available (NA)
GAMCEL-Telecoms Maintenance Budget = NA
GAMCEL-Telecoms Management Budget = NA
GAMCEL-Telecoms Management Budget = NA
GAMTEL-Telecoms Development Budget = NA
GAMTEL-Telecoms Development Budget = NA
GAMTEL-Telecoms Maintenance Budget = NA
GAMTEL-Telecoms Maintenance Budget = NA
GAMTEL-Telecoms Management Budget = NA
GAMTEL-Telecoms Management Budget = NA
III. REVIEW OF PROGRESS ON THE STATUS OF TELECOMMUNICATIONS SERVICES
III.1. Review of key factors contributing to progress in the performance of the indicator
Growing demand – the demand for more access and better services from the consumers
compelled the services providers to respond which is in turn important to increase the revenue
base of the services providers
Friendly government policies – the deployment and upgrade of services is in line with
government policies. All of central and local government policies favours and encourages the
deployment and upgrade of services.
Relatively low tax – the tax regime is not too exorbitant to disrupt or deter investment.
Competition – with the liberalization of the sector and licensing of new operators have generated
stiff competition among service providers; thus, the raise to grab new customers and ensure
more customer satisfaction.
II.2 Review of key factors challenging progress in the performance of the indicators
Inadequate utilization of the ECOWAN Backbone – despite the availability of this infrastructure
which is meant for backhauling, private service providers are still using micro-wave medium
which is less effective. The non-usage of the ECOWAN Backbone hinders efforts for expansion
and upgrade of networks apart from incurring additional expenditure with the provision of lower
quality service.
Minimal allocation and sharing of Infrastructure – almost every operator is deploying its own
mast/tower. The running cost of the tower adds to the cost of deploying a new cell site.
Inadequate e-government services – sometimes internet access is triggered by the relevance.
The importance of smart phones to most in the Gambia is limited to emails and social media.
Access to internet would have been more relevant if public services are also access through the
internet especially through mobiles. But so far, very few, if any, services are available online
especially via mobile devices.
48
Best Practice: The Case for Collaboration
Collaboration – it is seen that the more the service providers, regulator and government collaborate the better. When the ECOWAN was established, initially it was not been used by the private operators but when they came together and drew up a pricing framework, the reference model, the private started using the ECOWAN infrastructure
IV. Recommendations for actions needed to accelerate further progress
Restructure and reposition Gamtel – the inefficiency of Gamtel, the incumbent and manager of
the Backbone, is delaying the further development of the sector. It needs to be restructured for
better efficiency and repositioned to either wholesale or retail services provider but not both to
ensure fair level playing field among the service providers.
Discontinue duplication of efforts - there is dire need to ensure maximum collocation and sharing
of infrastructure. Government and the private should resolve all bottlenecks and ensure
maximum usage of the backbone and discontinue all micro-wave backhauling where possible.
Introduction of a third party, Tower Operator – to ensure instant nationwide coverage and
maximum collocation, the regulator/gov’t could consider introducing a tower operator to be
solely responsible for tower erection and management. This could be a new operator or given to
Gamtel but after restructuring and repositioning.
Introducing domestic roaming – this will ensure more uptime of services deployed and instill
more competition for more robust networks among service providers.
More e-government services and utilization of ICTs in the public sector – the deployment of more
e-government services and increased utilization of ICTs in the public sector will boost demand
for more broadband service. This will in turn trigger the deployment for more access and better
services.
V. Review of progress on government contribution towards the
development of the telecommunications sector
V.1. Allocate and disburse annually an adequate percentage of the budget
for the development and maintenance of telecommunications
infrastructure.
Government allocates funds for development and maintenance of the submarine fibre cable
infrastructure and support to the Gambia Submarine Cable company on quarterly basis. The
quarterly contribution for maintenance of the submarine cable is somewhat about $ 14, 000;
it’s not consistent. The support to GSC is dependent upon the expected running cost of the
GSC. In addition, through government owned agencies like Gamcel, spent D 28.1 M on
development of telecoms infrastructure.
49
V.2. Develop and implement comprehensive national policies and plans for
the development and maintenance of telecommunications
infrastructure
The National Information and Communication Infrastructure Policy 2012-2015 together with
its strategic implementation plans guided the development and maintenance of telecoms
infrastructure at the time. It was in pursuant to the objectives of the policy statement that
the great achievements in telecoms infrastructural development was achieved.
In addition, the Digital Terrestrial Transition Policy has been developed and endorsed by
cabinet since 2017. This led to the liberalization of the broadcasting sector and the ongoing
transition from analogue to digital broadcasting.
The Gambia ICT for Development Policy statement 2018-2028 has been developed and
endorsed by cabinet. Its 5-year implementation plans are under development.
In the tariffs for access to the ECOWAN Backbone and the Submarine cable capacity,
Government, in addition to reducing the wholesale prices for about 50%, it also distinguishes
tariffs for rural from urban. The tariffs for backhauling from a rural community is cheaper
compared to that of urban area.
Government together with the regulator have developed a new ICTs Fees that spells out the
licensing fees, regulatory fees, etc. responding to the development in the sector.
V.3. Develop modern ICT infrastructure and Internet access, including
expansion into rural and remote areas, including through mobile
broadband and satellite connections
Government has recently developed and launched the National Broadband Network. This
network has extended the backbone by 400 KM of length of fibre to strategic communities and
cell sites to enhance access to rural and remote areas. This network also upgrades and
modernized the backbone.
V.4. Build and expand broadband connectivity, e-networking and e connectivity in
relevant areas, including education, banking, health and governance.
Recently Government through the Ministry of Basic and Secondary Education has initiated
the provision of internet connectivity to all secondary schools via satellite for some that
are relatively far from the reach of the fibre broadband.
V.5. Promote public-private partnerships for the development and maintenance
of ICT infrastructure and their sustainability.
The Government allowed private service providers to buy shares of the international
submarine cable. The submarine cable is public-private partnership investments in
50
the ratios 49:51 respectively.
The digital broadcasting infrastructure being laid is in a public-private partnership
investment form through BOT between Government of the Gambia through the
subsidiary of GRTS called Digital Gambia Ltd and EXCAF of Senegal.
V.6. Promote bilateral, sub regional and regional approaches to improve
connectivity by removing infrastructure bottlenecks.
Government through Gamtel has a bilateral arrangement with Sonatel of Senegal in
the form a cross-Gambia cable. While this cable connects the southern Senegal to its
North Gamtel and some of the private also utilizes this infrastructure in the ECOWAN
Backbone and or to enhance redundancy.
The Gambia is a signatory to the ECOWAS Supplementary Act on cyber-crime which
aims to protect amongst other things telecoms infrastructure.
Being a member of OMVG power project this will further the regional connectivity for
the project will provide overhead fibre optic cables across all countries benefitting in
the OMVG.
VI. Review progress on the contribution of development partners
towards the development of the telecommunication sector
VI.1. Provide enhanced financial and technical support for
telecommunications infrastructure development in line with national
and sectoral development needs and priorities
The People’s Republic of China through the EXIM Bank provided a loan of $ 25 M for
the laying of a 400 KM of fibre to extend the ECOWAN Backbone and upgrade its
capacity.
The World Bank provided to the Government of The Gambia a grant in the tune of $
35 M which funded the submarine cable, establishment of the GSC and other
necessary enabling environment in the form of consultancies for the development of
necessary policies, strategies and regulations.
The Islamic Development Bank also provided a loan of $ 32 M to the Gambia for the

51
establishment of a national fibre backbone called the ECOWAN which spans over
900km across the length and breadth of the country.
The United Nations Development Program supported The Gambia in various activities
under the support to e-Government Initiative. This included the establishment of a
data centre with various e-government services such as emailing system, web portal.
VI.2. Support government efforts to facilitate the transfer of relevant skills,
knowledge and technology for the development of
telecommunications infrastructure under mutually agreed terms
The United Nations Development Program supported the Gambia in providing it with
technical experts in the form of International and Local United Nations Volunteers.
VI.3. Actively support private sector investment, including through public
private partnerships and grant/loans blending, for
telecommunications infrastructure development and maintenance
The World Bank supported the Landing Station of the submarine cable which is
owned on a public-private partnership arrangement. The support included the setting
up of the institutional framework.
Plate 3: Members of a Community Water and Sanitation s Committee after a training session
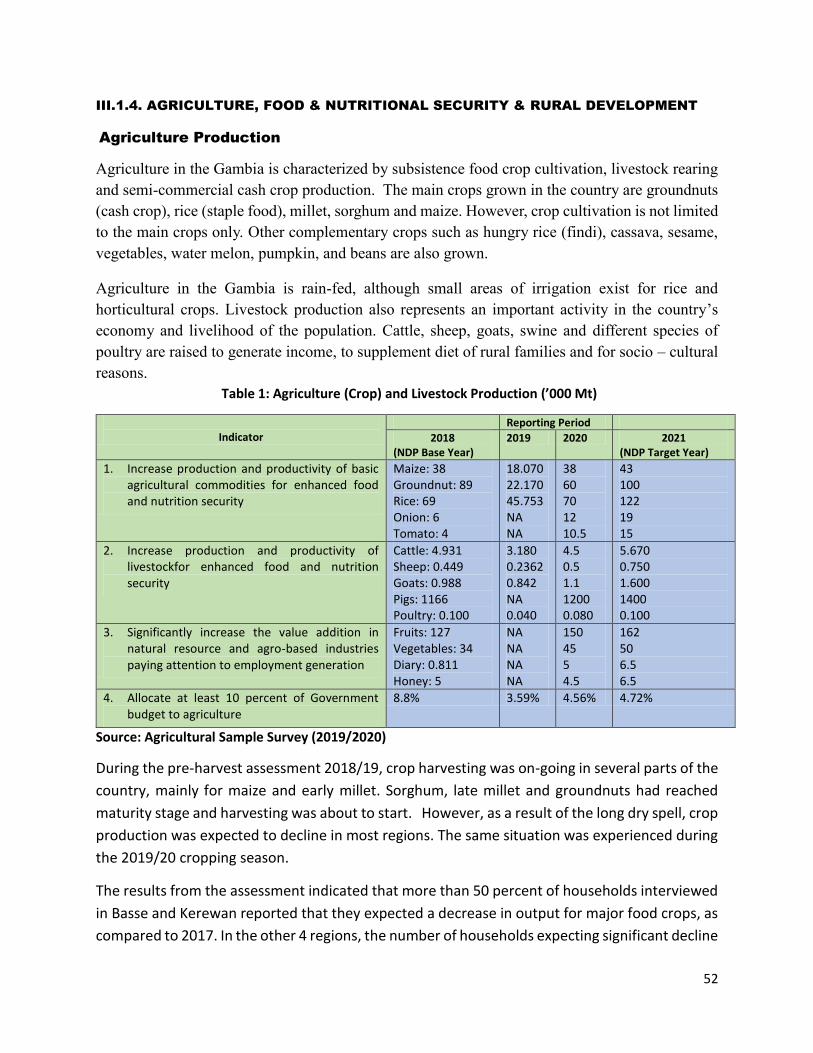
52
III.1.4. AGRICULTURE, FOOD & NUTRITIONAL SECURITY & RURAL DEVELOPMENT
Agriculture Production
Agriculture in the Gambia is characterized by subsistence food crop cultivation, livestock rearing
and semi-commercial cash crop production. The main crops grown in the country are groundnuts
(cash crop), rice (staple food), millet, sorghum and maize. However, crop cultivation is not limited
to the main crops only. Other complementary crops such as hungry rice (findi), cassava, sesame,
vegetables, water melon, pumpkin, and beans are also grown.
Agriculture in the Gambia is rain-fed, although small areas of irrigation exist for rice and
horticultural crops. Livestock production also represents an important activity in the country’s
economy and livelihood of the population. Cattle, sheep, goats, swine and different species of
poultry are raised to generate income, to supplement diet of rural families and for socio – cultural
reasons.
Table 1: Agriculture (Crop) and Livestock Production (’000 Mt)
Indicator
Reporting Period
2018 (NDP Base Year)
2019 2020 2021 (NDP Target Year)
1. Increase production and productivity of basic agricultural commodities for enhanced food and nutrition security
Maize: 38 Groundnut: 89 Rice: 69 Onion: 6 Tomato: 4
18.070 22.170 45.753 NA NA
38 60 70 12 10.5
43 100 122 19 15
2. Increase production and productivity of livestockfor enhanced food and nutrition security
Cattle: 4.931 Sheep: 0.449 Goats: 0.988 Pigs: 1166 Poultry: 0.100
3.180 0.2362 0.842 NA 0.040
4.5 0.5 1.1 1200 0.080
5.670 0.750 1.600 1400 0.100
3. Significantly increase the value addition in natural resource and agro-based industries paying attention to employment generation
Fruits: 127 Vegetables: 34 Diary: 0.811 Honey: 5
NA NA NA NA
150 45 5 4.5
162 50 6.5 6.5
4. Allocate at least 10 percent of Government budget to agriculture
8.8% 3.59% 4.56% 4.72%
Source: Agricultural Sample Survey (2019/2020)
During the pre-harvest assessment 2018/19, crop harvesting was on-going in several parts of the
country, mainly for maize and early millet. Sorghum, late millet and groundnuts had reached
maturity stage and harvesting was about to start. However, as a result of the long dry spell, crop
production was expected to decline in most regions. The same situation was experienced during
the 2019/20 cropping season.
The results from the assessment indicated that more than 50 percent of households interviewed
in Basse and Kerewan reported that they expected a decrease in output for major food crops, as
compared to 2017. In the other 4 regions, the number of households expecting significant decline
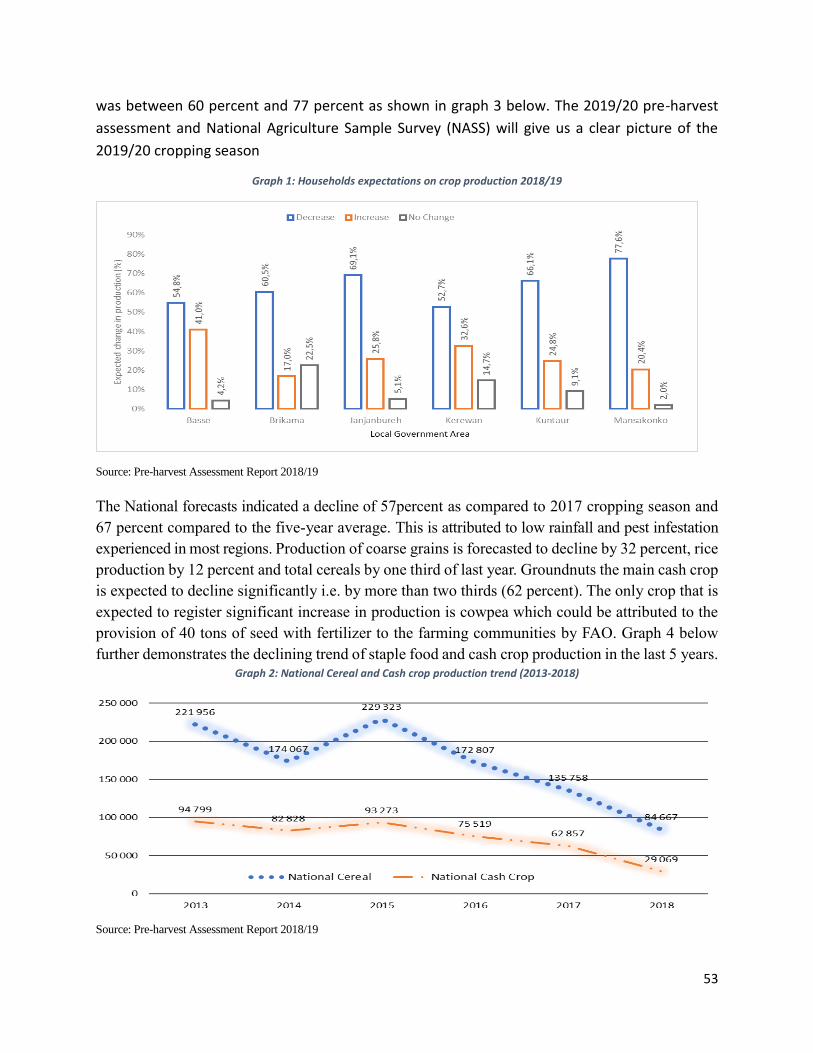
53
was between 60 percent and 77 percent as shown in graph 3 below. The 2019/20 pre-harvest
assessment and National Agriculture Sample Survey (NASS) will give us a clear picture of the
2019/20 cropping season
Graph 1: Households expectations on crop production 2018/19
Source: Pre-harvest Assessment Report 2018/19
The National forecasts indicated a decline of 57percent as compared to 2017 cropping season and
67 percent compared to the five-year average. This is attributed to low rainfall and pest infestation
experienced in most regions. Production of coarse grains is forecasted to decline by 32 percent, rice
production by 12 percent and total cereals by one third of last year. Groundnuts the main cash crop
is expected to decline significantly i.e. by more than two thirds (62 percent). The only crop that is
expected to register significant increase in production is cowpea which could be attributed to the
provision of 40 tons of seed with fertilizer to the farming communities by FAO. Graph 4 below
further demonstrates the declining trend of staple food and cash crop production in the last 5 years. Graph 2: National Cereal and Cash crop production trend (2013-2018)
Source: Pre-harvest Assessment Report 2018/19
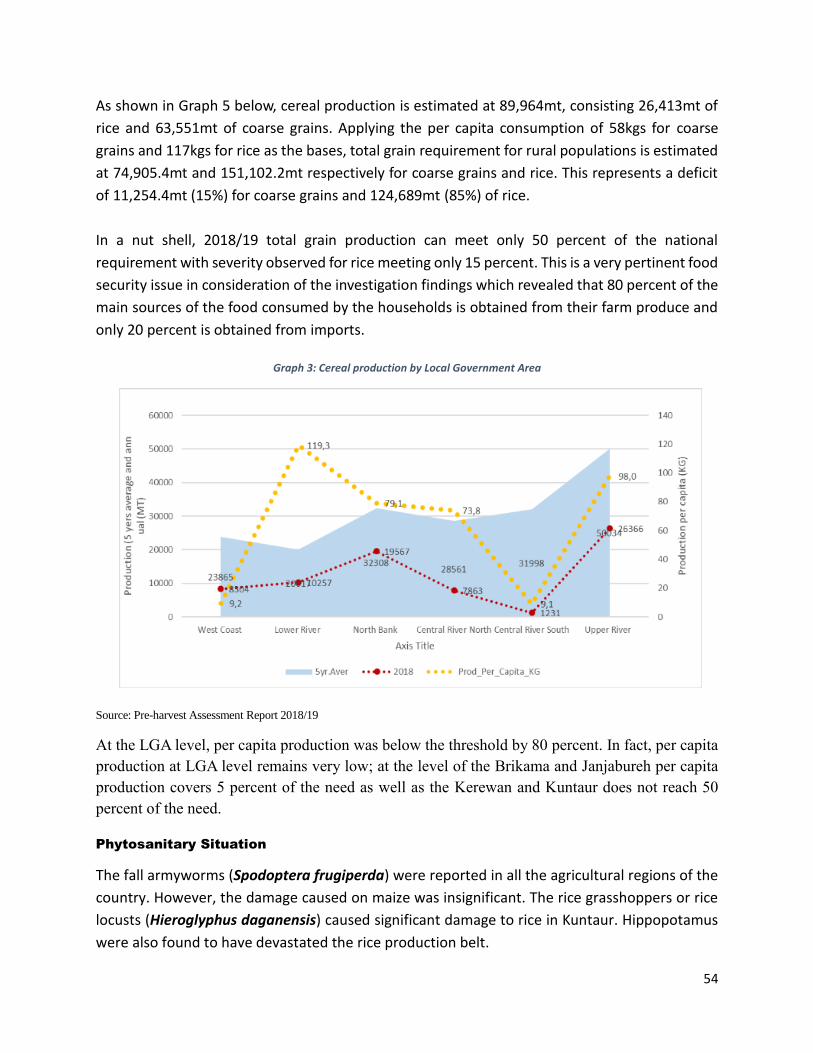
54
As shown in Graph 5 below, cereal production is estimated at 89,964mt, consisting 26,413mt of
rice and 63,551mt of coarse grains. Applying the per capita consumption of 58kgs for coarse
grains and 117kgs for rice as the bases, total grain requirement for rural populations is estimated
at 74,905.4mt and 151,102.2mt respectively for coarse grains and rice. This represents a deficit
of 11,254.4mt (15%) for coarse grains and 124,689mt (85%) of rice.
In a nut shell, 2018/19 total grain production can meet only 50 percent of the national
requirement with severity observed for rice meeting only 15 percent. This is a very pertinent food
security issue in consideration of the investigation findings which revealed that 80 percent of the
main sources of the food consumed by the households is obtained from their farm produce and
only 20 percent is obtained from imports.
Graph 3: Cereal production by Local Government Area
Source: Pre-harvest Assessment Report 2018/19
At the LGA level, per capita production was below the threshold by 80 percent. In fact, per capita
production at LGA level remains very low; at the level of the Brikama and Janjabureh per capita
production covers 5 percent of the need as well as the Kerewan and Kuntaur does not reach 50
percent of the need.
Phytosanitary Situation
The fall armyworms (Spodoptera frugiperda) were reported in all the agricultural regions of the
country. However, the damage caused on maize was insignificant. The rice grasshoppers or rice
locusts (Hieroglyphus daganensis) caused significant damage to rice in Kuntaur. Hippopotamus
were also found to have devastated the rice production belt.
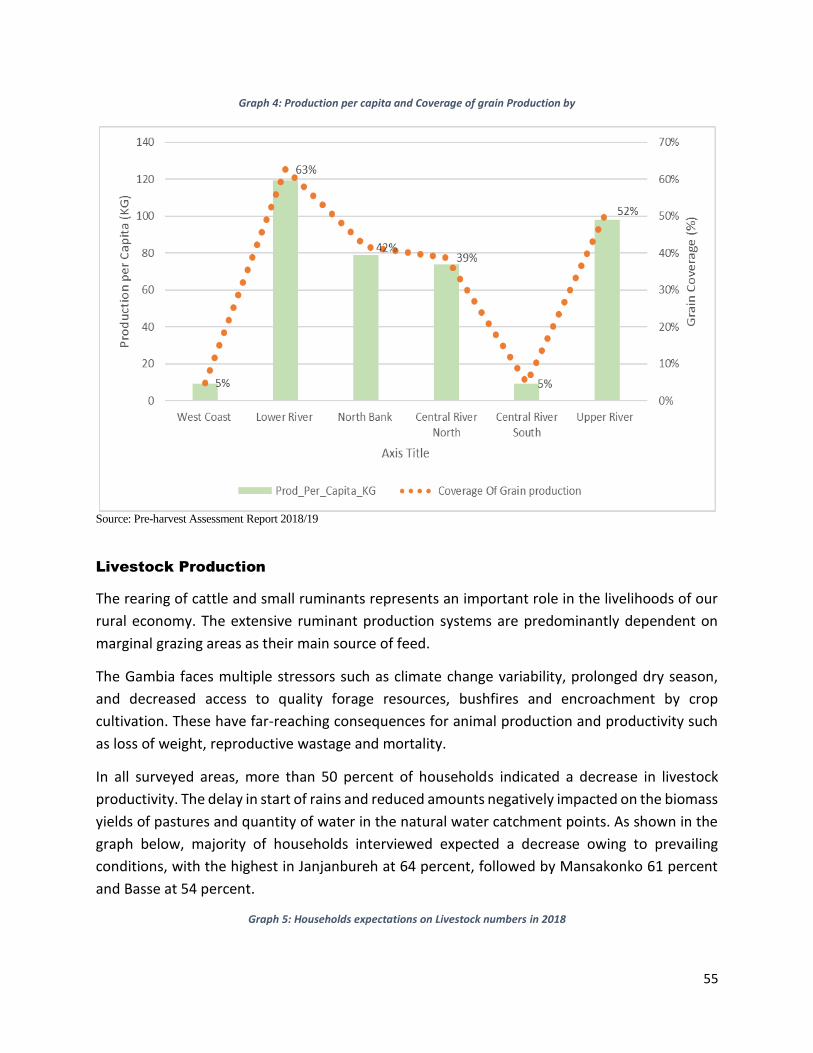
55
Graph 4: Production per capita and Coverage of grain Production by
Source: Pre-harvest Assessment Report 2018/19
Livestock Production
The rearing of cattle and small ruminants represents an important role in the livelihoods of our
rural economy. The extensive ruminant production systems are predominantly dependent on
marginal grazing areas as their main source of feed.
The Gambia faces multiple stressors such as climate change variability, prolonged dry season,
and decreased access to quality forage resources, bushfires and encroachment by crop
cultivation. These have far-reaching consequences for animal production and productivity such
as loss of weight, reproductive wastage and mortality.
In all surveyed areas, more than 50 percent of households indicated a decrease in livestock
productivity. The delay in start of rains and reduced amounts negatively impacted on the biomass
yields of pastures and quantity of water in the natural water catchment points. As shown in the
graph below, majority of households interviewed expected a decrease owing to prevailing
conditions, with the highest in Janjanbureh at 64 percent, followed by Mansakonko 61 percent
and Basse at 54 percent.
Graph 5: Households expectations on Livestock numbers in 2018
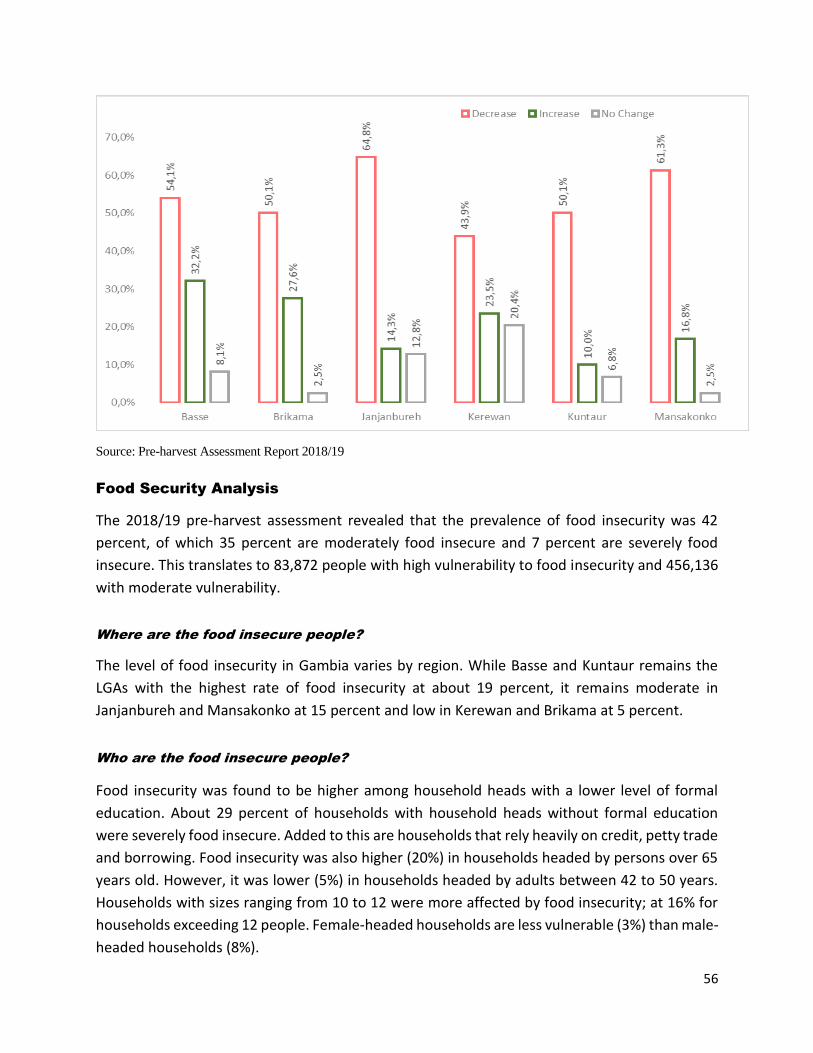
56
Source: Pre-harvest Assessment Report 2018/19
Food Security Analysis
The 2018/19 pre-harvest assessment revealed that the prevalence of food insecurity was 42
percent, of which 35 percent are moderately food insecure and 7 percent are severely food
insecure. This translates to 83,872 people with high vulnerability to food insecurity and 456,136
with moderate vulnerability.
Where are the food insecure people?
The level of food insecurity in Gambia varies by region. While Basse and Kuntaur remains the
LGAs with the highest rate of food insecurity at about 19 percent, it remains moderate in
Janjanbureh and Mansakonko at 15 percent and low in Kerewan and Brikama at 5 percent.
Who are the food insecure people?
Food insecurity was found to be higher among household heads with a lower level of formal
education. About 29 percent of households with household heads without formal education
were severely food insecure. Added to this are households that rely heavily on credit, petty trade
and borrowing. Food insecurity was also higher (20%) in households headed by persons over 65
years old. However, it was lower (5%) in households headed by adults between 42 to 50 years.
Households with sizes ranging from 10 to 12 were more affected by food insecurity; at 16% for
households exceeding 12 people. Female-headed households are less vulnerable (3%) than male-
headed households (8%).
57
How many people are foods insecure?
At the regional level, the analysis of food insecurity using CARI method and vulnerability shows a
prevalence of food insecurity of 42 percent or 540,008 people, which is an average of 67,501
households. Brikama contains the highest number (276,864) of affected people, which is an
average of 34,608 households. The Basse is second most vulnerable in terms of population; about
75,250 people are affected; the lowest population affected is located in Mansakonko(about
35,000 people).
Why are these people food insecure and vulnerable?
The main causes of household food insecurity are the shortfall in cereal production and the
deterioration of livelihoods. Also, the rise in prices of inputs and agricultural commodities, the
decline in prices of products sold by households, including a deterioration of the terms of trade,
thus exposing them to food insecurity. A recurrence of shocks was also observed which
weakened the households in the eastern part of the country, mainly flash floods and windstorms.
Weakness of the productive assets (few livestock and the small area of owned land, inadequate
agricultural equipment) maintains a vicious cycle of poverty that induces food insecurity.
How will the situation evolve?
The adoption of crisis and emergency coping strategies by food-insecure households suggests a
difficult situation during the lean season, and which will appear much sooner than usual. These
behaviors analyzed through the coping strategy index show a deterioration of the food situation
in most parts of the country. This will increase during the lean season due to the depletion of
grain stocks, the disappearance of the herbaceous carpet and rising prices of staple foods. Even
if the most used commodity will remain rice, the dietary diversity will be very poor.
The combination of these factors provides a grim picture of the current situation and also a poor
prognosis for the 2019/20 cropping season. If assistance is not quickly forthcoming, the
populations’ situation will deteriorate, and with potentially dire consequences on health and
nutritional status. Timely assistance will cushion households from hunger, adoption of adverse
coping mechanisms, and depletion of livelihood assets and erosion of resilience.
Food Sources
As a result of the continued decline in food production due to the poor rainfall pattern over the
last three to four years, it was important to investigate the sources of the main food consumed
by households. 79.6 percent of households reported agriculture as their main source of food and
20.4 percent from markets.

58
Brikama reported that 59 percent of the households’ main source of food was from imports,
while in Mansakonko it was 34 percent. Except for Brikama, all the other regions stated the main
source of the food they consumed was coming from agriculture. In Kuntaur, 96 percent of the
households said they consumed food from agriculture with Basse (93.1%), Janjanbureh (90.4 %)
and Brikama (41%).
Table 2: Food sources at household level
Agriculture (%) Imports (%)
The Gambia 79.6 20.4
West Coast Region 41 59
Lower River Region 66 34
North Bank Region 85 15
Central River North Region 95.7 4.3
Central River South Region 90.4 9.6
Upper River Region 93.1 6.9 Source: Pre-harvest Assessment Report 2018/19
Food Stock Duration
At the national level, 45 percent reported that the food produced from their farms would last 1-
2 months while 30 percent said the food would last 3-4 months; with only 11percent indicating
it would last for more than 6 months. At the regional levels, almost 60 percent of households in
Brikama reported that the locally produced food would last 1-2 months, followed by Kerewan
and Basse at 44 percent and 30 percent respectively, as shown in graph below.
Graph 6: Food Stock Duration
Source: Pre-harvest Assessment Report 2018/19
1-2
Mo
nth
s, U
RR
, 30
.40
%
1-2
Mo
nth
s, W
CR
, 58
.10
%
1-2
Mo
nth
s, C
RR
S, 1
1.3
0%
1-2
Mo
nth
s, N
BR
, 44
%
1-2
Mo
nth
s, C
RR
N, 1
8.6
0%
1-2
Mo
nth
s, L
RR
, 16
.80
%
3-4
Mo
nth
s, U
RR
, 27
%
3-4
Mo
nth
s, W
CR
, 31
.60
%
3-4
Mo
nth
s, C
RR
S, 4
0.2
0%
3-4
Mo
nth
s, N
BR
, 20
%
3-4
Mo
nth
s, C
RR
N, 3
0.7
0%
3-4
Mo
nth
s, L
RR
, 36
.90
%
5-6
Mo
nth
s, U
RR
, 18
.30
%
5-6
Mo
nth
s, W
CR
, 7.7
0%
5-6
Mo
nth
s, C
RR
S, 3
6.7
0%
5-6
Mo
nth
s, N
BR
, 16
.90
%
5-6
Mo
nth
s, C
RR
N, 2
3%
5-6
Mo
nth
s, L
RR
, 23
.40
%
Mo
re t
han
6 M
on
ths,
UR
R,
24
.40
%
Mo
re t
han
6 M
on
ths,
WC
R,
2.6
0%
Mo
re t
han
6 M
on
ths,
CR
RS,
1
1.7
0%
Mo
re t
han
6 M
on
ths,
NB
R,
19
.10
%
Mo
re t
han
6 M
on
ths,
CR
RN
, 2
7.7
0%
Mo
re t
han
6 M
on
ths,
LR
R,
22
.90
%
1-2 Months 3-4 Months 5-6 Months More than 6 Months
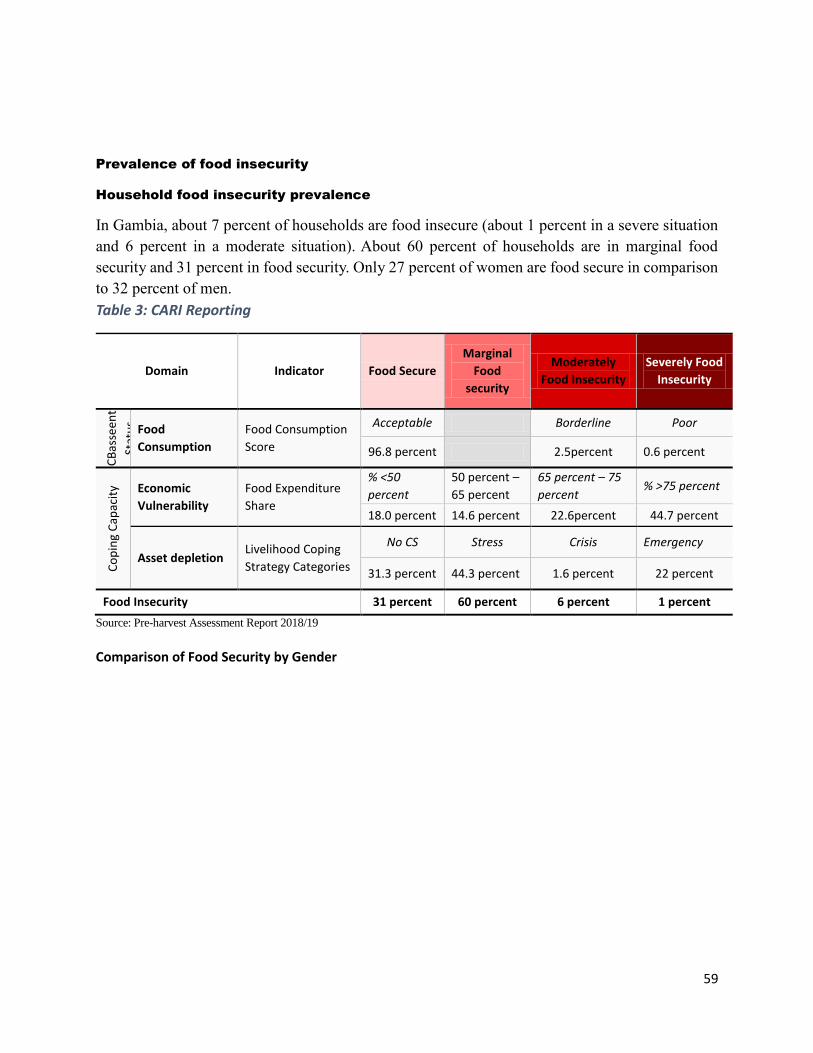
59
Prevalence of food insecurity
Household food insecurity prevalence
In Gambia, about 7 percent of households are food insecure (about 1 percent in a severe situation
and 6 percent in a moderate situation). About 60 percent of households are in marginal food
security and 31 percent in food security. Only 27 percent of women are food secure in comparison
to 32 percent of men.
Table 3: CARI Reporting
Domain Indicator Food Secure
Marginal
Food
security
Moderately
Food Insecurity
Severely Food
Insecurity
CB
asse
ent
Stat
us
Food
Consumption
Food Consumption
Score
Acceptable Borderline Poor
96.8 percent 2.5percent 0.6 percent
Co
pin
g C
apac
ity Economic
Vulnerability
Food Expenditure
Share
% <50
percent
50 percent –
65 percent
65 percent – 75
percent % ˃75 percent
18.0 percent 14.6 percent 22.6percent 44.7 percent
Asset depletion Livelihood Coping
Strategy Categories
No CS Stress Crisis Emergency
31.3 percent 44.3 percent 1.6 percent 22 percent
Food Insecurity 31 percent 60 percent 6 percent 1 percent
Source: Pre-harvest Assessment Report 2018/19
Comparison of Food Security by Gender
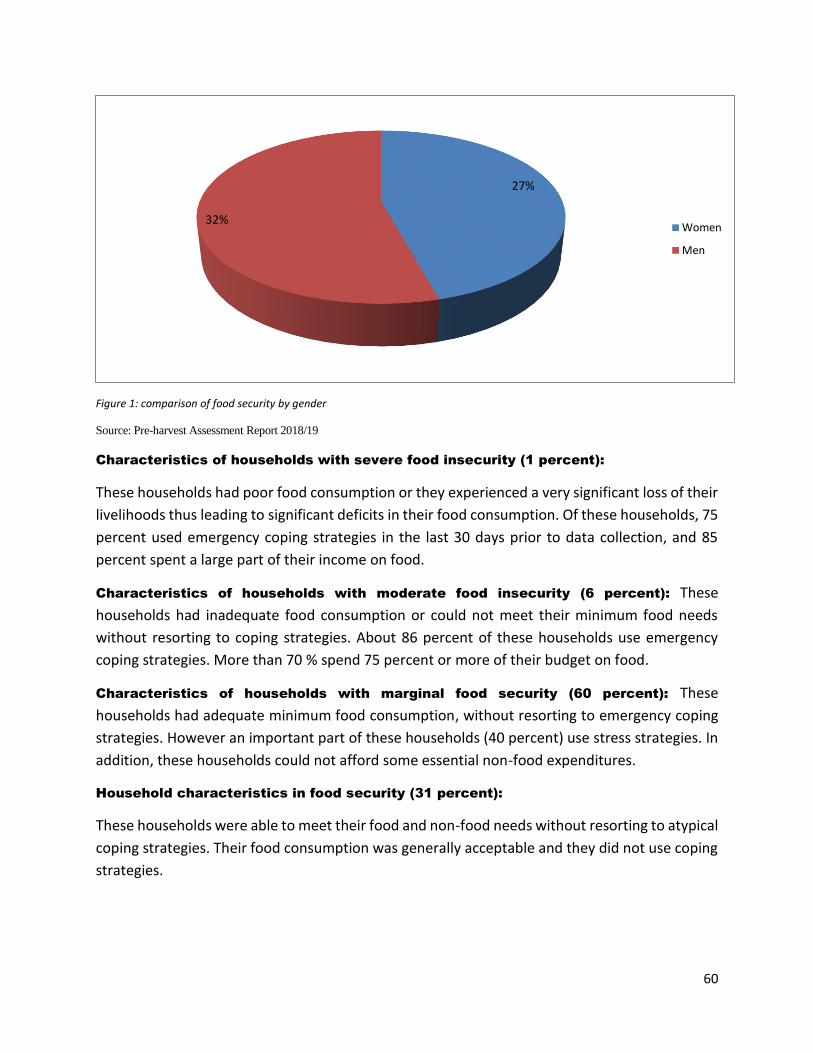
60
Figure 1: comparison of food security by gender
Source: Pre-harvest Assessment Report 2018/19
Characteristics of households with severe food insecurity (1 percent):
These households had poor food consumption or they experienced a very significant loss of their
livelihoods thus leading to significant deficits in their food consumption. Of these households, 75
percent used emergency coping strategies in the last 30 days prior to data collection, and 85
percent spent a large part of their income on food.
Characteristics of households with moderate food insecurity (6 percent): These
households had inadequate food consumption or could not meet their minimum food needs
without resorting to coping strategies. About 86 percent of these households use emergency
coping strategies. More than 70 % spend 75 percent or more of their budget on food.
Characteristics of households with marginal food security (60 percent): These
households had adequate minimum food consumption, without resorting to emergency coping
strategies. However an important part of these households (40 percent) use stress strategies. In
addition, these households could not afford some essential non-food expenditures.
Household characteristics in food security (31 percent):
These households were able to meet their food and non-food needs without resorting to atypical
coping strategies. Their food consumption was generally acceptable and they did not use coping
strategies.
27%
32%Women
Men

61
Otherwise, the low level of food insecurity at the national level hides disparities at the LGA level.
In fact, food insecurity is highest in Basse (18%) and Kuntaur (19%); Kerewan is the region with
the least proportion of household with food insecurity.
There is a limitation in the analysis of the food security level of the country due to the untimely availability of the 2019/20 pre-harvest and cadre harmonize data to be able to make a comparison between the 2018 and 2019 cropping season to determine households levels in terms of food security. The subsequent researches and future researches will give us a taste of the yearly food security for Gambian households’ outlook.
Graph 7: Proportion of Food Insecurity by LGA
Source: Pre-harvest Assessment Report 2018/19
Food Secure, Local Governement Area
Basse, 14.8%
Food Secure, Local Governement Area
Brikama, 37.9%
Food Secure, Local Governement Area Janjanbureh, 14.9%
Food Secure, Local Governement Area
Kerewan, 38.2%
Food Secure, Local Governement Area
Kuntaur, 10.1%
Food Secure, Local Governement Area Mansakonko, 20.6%
Marginally Food Secure, Local Governement Area
Basse, 66.4%
Marginally Food Secure, Local Governement Area
Brikama, 57.0%
Marginally Food Secure, Local Governement Area
Janjanbureh, 70.1%
Marginally Food Secure, Local Governement Area
Kerewan, 58.3%
Marginally Food Secure, Local Governement Area
Kuntaur, 70.4%
Marginally Food Secure, Local Governement Area
Mansakonko, 64.7%
Moderately Food Insecure, Local
Governement Area Basse, 18.5%
Moderately Food Insecure, Local
Governement Area Brikama, 4.3%
Moderately Food Insecure, Local
Governement Area Janjanbureh, 12.8%
Moderately Food Insecure, Local
Governement Area Kerewan, 3.5%
Moderately Food Insecure, Local
Governement Area Kuntaur, 17.0%
Moderately Food Insecure, Local
Governement Area Mansakonko, 13.7%
Severely Food Insecure, Local Governement Area
Basse, 0.3%
Severely Food Insecure, Local Governement Area
Brikama, 0.8%
Severely Food Insecure, Local Governement Area
Janjanbureh, 2.1%
Severely Food Insecure, Local Governement Area
Kuntaur, 2.5%
Severely Food Insecure, Local Governement Area
Mansakonko, 0.9%
Food Secure Marginally Food Secure Moderately Food Insecure Severely Food Insecure
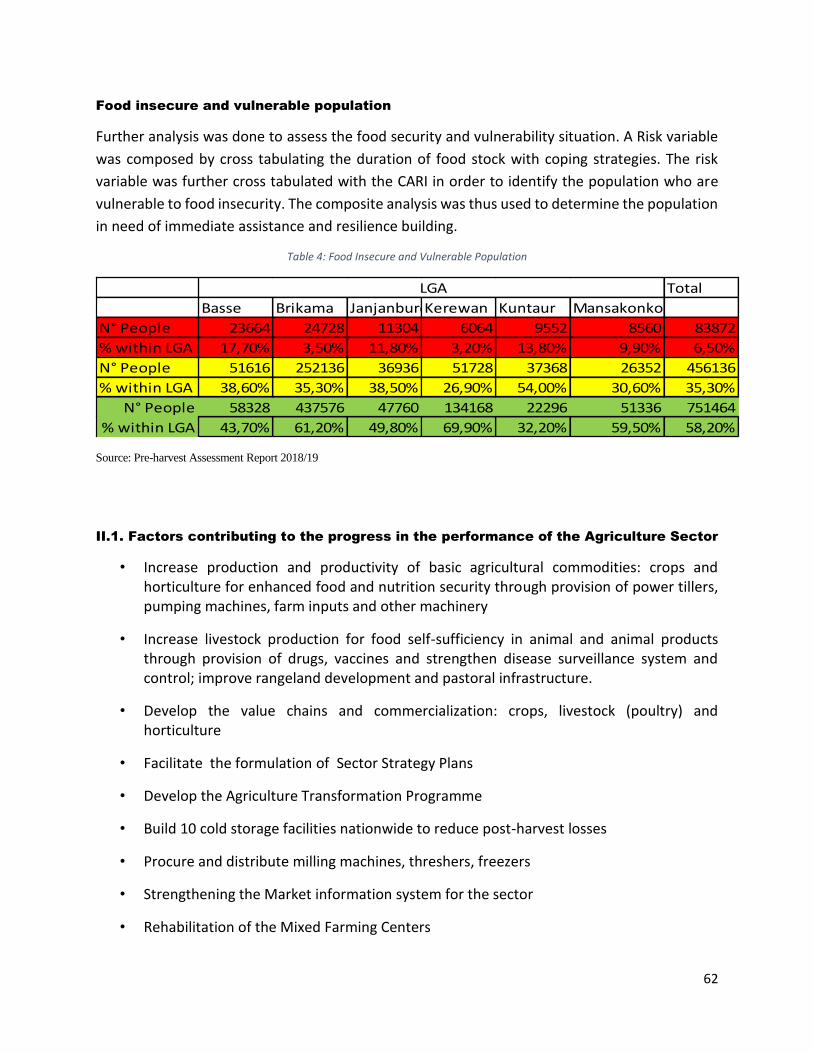
62
Food insecure and vulnerable population
Further analysis was done to assess the food security and vulnerability situation. A Risk variable
was composed by cross tabulating the duration of food stock with coping strategies. The risk
variable was further cross tabulated with the CARI in order to identify the population who are
vulnerable to food insecurity. The composite analysis was thus used to determine the population
in need of immediate assistance and resilience building.
Table 4: Food Insecure and Vulnerable Population
Source: Pre-harvest Assessment Report 2018/19
II.1. Factors contributing to the progress in the performance of the Agriculture Sector
• Increase production and productivity of basic agricultural commodities: crops and horticulture for enhanced food and nutrition security through provision of power tillers, pumping machines, farm inputs and other machinery
• Increase livestock production for food self-sufficiency in animal and animal products through provision of drugs, vaccines and strengthen disease surveillance system and control; improve rangeland development and pastoral infrastructure.
• Develop the value chains and commercialization: crops, livestock (poultry) and horticulture
• Facilitate the formulation of Sector Strategy Plans
• Develop the Agriculture Transformation Programme
• Build 10 cold storage facilities nationwide to reduce post-harvest losses
• Procure and distribute milling machines, threshers, freezers
• Strengthening the Market information system for the sector
• Rehabilitation of the Mixed Farming Centers
Total
Basse Brikama JanjanburehKerewan Kuntaur Mansakonko
N° People 23664 24728 11304 6064 9552 8560 83872
% within LGA 17,70% 3,50% 11,80% 3,20% 13,80% 9,90% 6,50%
N° People 51616 252136 36936 51728 37368 26352 456136
% within LGA 38,60% 35,30% 38,50% 26,90% 54,00% 30,60% 35,30%
N° People 58328 437576 47760 134168 22296 51336 751464
% within LGA 43,70% 61,20% 49,80% 69,90% 32,20% 59,50% 58,20%
LGA
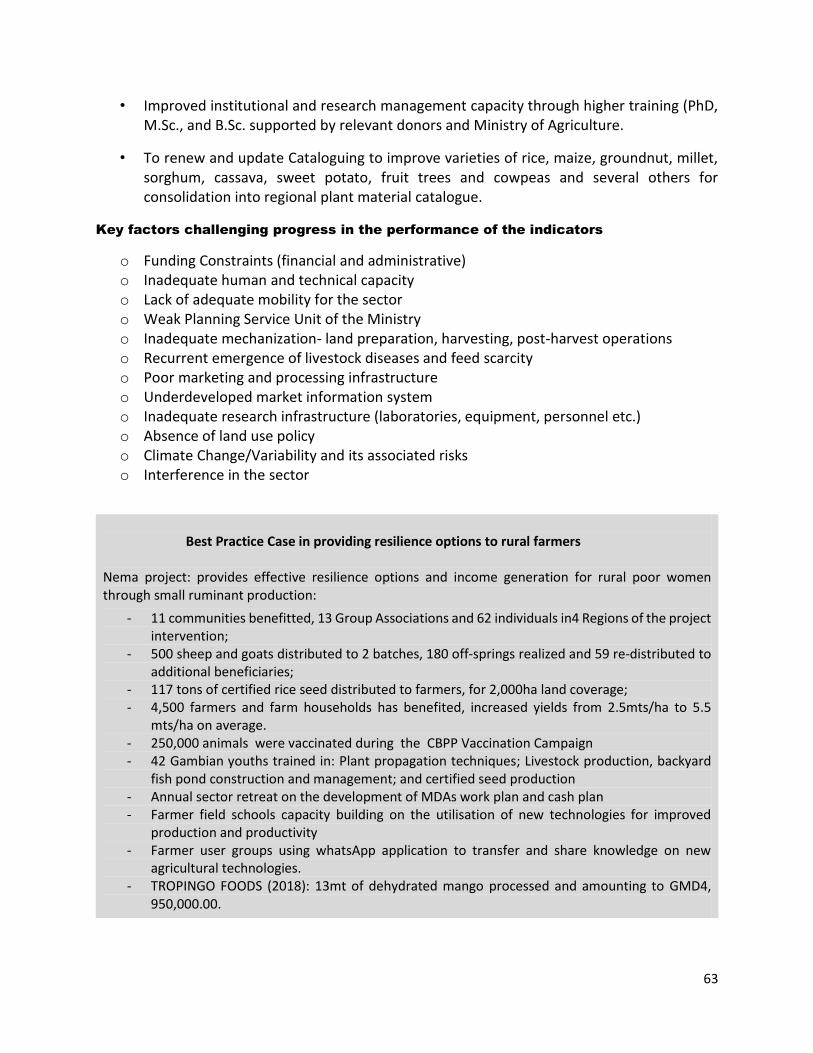
63
• Improved institutional and research management capacity through higher training (PhD, M.Sc., and B.Sc. supported by relevant donors and Ministry of Agriculture.
• To renew and update Cataloguing to improve varieties of rice, maize, groundnut, millet, sorghum, cassava, sweet potato, fruit trees and cowpeas and several others for consolidation into regional plant material catalogue.
Key factors challenging progress in the performance of the indicators
o Funding Constraints (financial and administrative) o Inadequate human and technical capacity o Lack of adequate mobility for the sector o Weak Planning Service Unit of the Ministry o Inadequate mechanization- land preparation, harvesting, post-harvest operations o Recurrent emergence of livestock diseases and feed scarcity o Poor marketing and processing infrastructure o Underdeveloped market information system o Inadequate research infrastructure (laboratories, equipment, personnel etc.) o Absence of land use policy o Climate Change/Variability and its associated risks o Interference in the sector
Best Practice Case in providing resilience options to rural farmers Nema project: provides effective resilience options and income generation for rural poor women through small ruminant production:
- 11 communities benefitted, 13 Group Associations and 62 individuals in4 Regions of the project intervention;
- 500 sheep and goats distributed to 2 batches, 180 off-springs realized and 59 re-distributed to additional beneficiaries;
- 117 tons of certified rice seed distributed to farmers, for 2,000ha land coverage; - 4,500 farmers and farm households has benefited, increased yields from 2.5mts/ha to 5.5
mts/ha on average. - 250,000 animals were vaccinated during the CBPP Vaccination Campaign - 42 Gambian youths trained in: Plant propagation techniques; Livestock production, backyard
fish pond construction and management; and certified seed production - Annual sector retreat on the development of MDAs work plan and cash plan - Farmer field schools capacity building on the utilisation of new technologies for improved
production and productivity - Farmer user groups using whatsApp application to transfer and share knowledge on new
agricultural technologies. - TROPINGO FOODS (2018): 13mt of dehydrated mango processed and amounting to GMD4,
950,000.00.
64
Recommendations for actions needed to accelerate further progress in the
development of the sector
The outcome of the pre-harvest assessment for 2018/19 cropping season has revealed a number
of concerns which are highly critical to the general social welfare of the farming communities. To
this end, several recommendations are proposed below for redress:
1. A quick response plan should be developed by Government of the Gambia (GoTG) and its
partners for immediate assistance to the 83,872 (7 percent) people that are currently
under severe food insecurity and to build resilience for 456,136 (35percent) who are
moderately food insecure.
2. GoTG and its partners to increase support for the Early Warning System (EWS) Technical
Working Group (TWG) for timely planning, implementation and advise on
agricultural/natural resource related activities;
3. Promotion of early maturing and high yielding variety of crops (particularly salt tolerant
rice varieties) to boost food security;
4. Intensification of livestock production and breeding of drought tolerant breeds to conform
with climate smart/sustainable agriculture technologies;
5. GOTG find means to close the deficit of 11,254.4mt (15 percent) for coarse grains and
124,689mt (85 percent) of rice as a measure to fill the rural annual requirement for grains
in 2019 and beyond;
6. Promotion of early maturing and high yielding variety of crops (particularly salt tolerant rice varieties) to boost food security;
7. Timely implementation of mass vaccination campaign against endemic diseases such as Peste Petit de Ruminant (PPR), CBPP, Black Quarter (BQ), HS and Foot and Mouth Disease (FMD);
8. Rehabilitation of all non-functional livestock watering points to ensure uninterrupted supply of water to livestock particularly during the dry season;
9. Promotion of range land development, reseeding grazing lands and propagation of the fodder trees; Aid farmers with feed concentrates, multi-nutrient blocks; and doses of anthelmintic for both small and large ruminants.
Review progress in the contributions of government towards the development
of agriculture, food and nutritional security and rural development
Given the opportunities in the agricultural sector for greater employment creation, increase
incomes, greater export earnings, and food security and on the overall rise in the socio-economic
welfare of the population, the government of The Gambia has renewed its commitment in
developing the agricultural sector by transforming it from its present subsistence level to a
commercial oriented one. This is demonstrated in the National Development Plan where
agriculture is a priority sector, as well as plans to develop agricultural development program in
collaboration with its development partners.
65
In the Gambia, Cooperatives are found to be the largest organization, an autonomous association
of persons united voluntarily to meet their common economic, social and cultural needs and
aspirations through a jointly owned and democratically controlled enterprise. Primarily, there are
four main types of cooperatives in the country namely: Cooperative Produce Marketing Societies
(CPMS) that deals mainly groundnut marketing; Cooperative Credit Union deals with Savings
mobilization and issuing credit to members, Agricultural Cooperatives which deals with
Horticulture and Livestock; and Workers Cooperative mainly skill workers.
All the aforementioned cooperatives have immensely contributed to the socio-economic
development of the country until the liquidation of Gambia Cooperative Union (GCU) and de-
functioning of the Federation of Agricultural Cooperative Societies (FACS) which consequently
led to the formation of Apex bodies such as National Association of Co-operative Credit Union
Gambia (NACCUG) that manage the affairs of all the Credit Union in the country. The CPMS and
Agricultural Cooperatives are run by the committees of individual societies which are regulated
by the Office of the Registrar of Cooperatives who also doubles as the Director of Agribusiness
Service Unit currently.
However, such transformation of agriculture cannot be done without effective participation of
farmers who form the primary pillar as value chain actors in all agricultural commodities, hence
the need for effective and efficient organisations of farmers into strong viable and vibrant
cooperatives. To achieve this, the Ministry of Agriculture through the World Bank, Agriculture
Value Chain Development Project, Food and Agriculture Organization, Agriculture for Economic
Growth Project decided to commission studies on the revitalization of cooperatives to enhance
production and marketing of agricultural produce. The studies include ‘Policy Framework for
Revitalization of Cooperatives – The Road to Commercialization of Agriculture’ and ‘Institutional
Assessment of Agricultural Cooperatives in The Gambia’. The former has been completed and
document validated while the latter is yet to be validated.
In addition, Food and Agriculture Organization of the United Nation The Gambia has contracted
an International Consultant to develop a Comprehensive National Cooperative Policy Document.
The consultancy is in progress and expected to end in November, 2019.
The National Seed Secretariat (NSS) organized two seed fairs in Brikama-ba and Farafenni, so as
to create and facilitate access to good quality seeds by farmers for the 2019 cropping season with
the support from FAO “Agriculture for Economic Growth to Mitigate Food and Nutrition
Insecurity and Migration Flows to Europe” known as Envelop A and in close collaboration with
key stakeholder institutions. Seeds were procured from registered certified seed producers in
the country and distributed to vulnerable farmers during the seed fairs: Groundnut 276 MT,
Maize 33MT, Rice 26 MT Cowpea 6MT and Findi 0.68.
In the mitigation of any shortcoming of poor crop performance in the 2018/2019 rainy season,
the National Seed Secretariat (NSS) embarked on dry season certified rice seed production using
the rice seed producer groups in the tidal irrigated perimeters of Jahally-Pacharr in CRR, South
66
and Niani Sukuta, CRR, and produced 400 tons of certified rice seeds with the support from Nema
project (P2RS).
The annual analysis from NASS estimates revealed that area put to the production of the 6 major cereals has been steadily declining from 234,062 ha in 2014 to 206,300 ha in 2018 and now in 2019 projected at 170,129.91 ha. Similar scenario is being reported for groundnut which has also decline from 100,305 ha in 2014 to 79,923 ha in 2018 and expecting to nose dive to 54,347.64ha in the current year. These decreases in area corresponds to decreases in production since previous analyses have generally revealed 1 or just above 1 ton per hectare for all crops which suggests that any production increase came about as a result of area expansion which compensates for poor yield performance. This general decline in area and production over the five-year period as already explained, is attributed mainly to the late start of rains aggravated by protracted long dry spell and the erratic nature occurring on annual bases which discourages early planting of major crops particularly groundnuts.
Besides the aforesaid, the assessment also simulated the 2019 production through scenarios based
on the past 5 years’ average yield per hectare (early millet 1.3, late millet 1.2, sorghum 1.1, maize
1.2, upland rice 1.7, lowland rice .99 and groundnuts 1.1) to determine the magnitude of the food
deficit. The results further show that 41,275 metric tons of rice and 93,579 metric tons of coarse
grains will be produced. Using the 180kg and 58kg per capital consumption of paddy rice and
coarse grains respectively, national food requirement for the 2.14 million Gambians in 2020 will
be 385,200 metric tons for rice and 124,120 metric tons for coarse grains. This will therefore leave
a deficit of about 343,925 metric tons of rice and 30,541 metric tons of coarse grains in 2020. In a
nut shell the rice production forecast would meet only 11% or the national requirement. However,
due to the changes in the rainfall, the pre-harvest report for 2019/20 and the NASS 2019/2020 will
give us a clear picture of this year’s cropping season.
The Gambia Livestock Marketing Agency (GLMA) carried out construction and rehabilitation
works of existing and new slaughter facilities and livestock markets to ensure that they meet
National food safety and Zoo-sanitary standards such as the construction and rehabilitation of
two and four slaughter houses in Gunjur and Janjanbureh. The Central Abattoir in Abuko has
been refurbished and is fully functional and sanitized.
With assistance from FAO Gambia and CILSS, Livestock Market information system was created
to provide real time information on the livestock number on sales alongside prices in the country.
The Ministry, through Food and Agriculture Sector Development Project (FASDEP) developed
additional 200km feeder roads to enhance access to markets for agricultural produce. The
Gambia Land and Water Management Project (Nema) also develop additional 12,400 hectares
for lowland rice production and 2,000 hectares of tidal irrigation for rice production. On top of
this, Nema’s Resilience project had developed a total of 1,000 hectares of tidal irrigation and 6
schemes of land on water harvesting systems (WHS). In this WHS, women groups cultivated 60
hectares whiles 4 hectares was allocated to youth groups.
67
During GCAV project’s life cycle up to date a total of 2,500 Ha of tidal irrigated rice scheme has
been rehabilitated thus representing 100% achievement as far as project target i.e. 2,500 Ha is
concerned. In addition to the 2,500 Ha rehabilitated to improve irrigation and drainage services
planned by the project, accumulative production of 30,424 metric tons of paddy has been
produced during 2018/2019 cropping season.
This cumulative total i.e. 30,424 metric tons produced during the period under review, represents
25% of the total 122,000 metric tons targeted in the NDP for rice. Rice productivity has also
improved over the 5 years of project implementation, yields/Ha of targeted crops (Rice &
Vegetables).
With regard to vegetable production improvement, a total of 105 Ha of community gardens has
been developed, i.e. provided with a perimeter fence, borehole powered with solar system and
equipped with drip irrigation systems and all are operational. Equally, yield/Ha of key vegetables
has also been improving when compared to their baselines. During the period under review, GCAV
through the Public Private Partnership promoted by the government have succeeded in linking the women
gardens to RADVILLE FARMS to get into contract farming. As a result contractual arrangements, a total of
431, 225 metric tons of baby corn was produced and marketed.
The Project Direct beneficiaries including household members have reached 28,532 out of a
target of 30,000. This achievement has represents 95%. By gender, 56% of the total reached
through project interventions and resources are females. A total of 21 km of access roads within
the tidal irrigated rice fields and between villages has been constructed.
The Ministry of Agriculture’s transformation process will continue to pursue its goal of
mechanization and will seek the support of development partners to secure the required
machinery and expertise to establish a fully functional Agricultural mechanization unit. In
addition, Agriculture will also continue to be a major player in employment and job creation and
the ministry will in partnership with donor and development partners pursue the poultry broiler
self-sufficiency project that seeks to create jobs for more than 10,000 youths.
In order to enhance private participation across the value chain, a number of initiatives have
already commenced through the matching grants in three projects and this will be further
accelerated and expanded to include access to agricultural land and agro-industry processing
equipment through a multi-stakeholder consultative process.
In the quest to improve livestock production and productivity, the Department of livestock
Services will continue to work with her development partners such as FAO in the control of the
most deadly disease like CBPP countrywide. Therefore, this will increase her efforts for the
creation of small ruminant production and productivity and its fattening schemes; targeting
youth hence reduce unemployment among the youth cohort in the country.
68
Furthermore, NARI has been conducting research on nutritive sensitive agriculture on bio-
fortified pearl millet sourced from ICRISAT and are being screened; 8 orange flesh sweet potato
varieties sourced from Senegal, Ghana and United States, screened and 5 are set for release; 12
bio-fortified cassava varieties screened and 2 are set for release; 3 African leafy vegetables
breeder seeds (Amaranthus, Rossel and Cowpea) sourced from Senegal and Tanzania and being
multiplied for supply to farmers; and 1 vitamin A enriched, bio-fortified maize variety sourced
from IITA and being multiplied for the 2019/20 cropping season.
In conclusion, the Ministry of Agriculture was also able to mobilize funds through African
Development Bank to carry out various studies under the conceived Agricultural Transformation
Programme. Similarly, the Ministry of Agriculture has completed the review of the first Gambia
National Investment Programme (GNAIP) 1.0 and currently validated the second generation
GNAIP 2.0. In the same vein, the Ministry of Agriculture is working on hiring a consultant to
develop the new National Agriculture Sector Strategy (NASS) and the Horticulture Sector Strategy
(HSS) to support the sector in fulfilling her mandate.
Review progress in the contributions of development partners towards the
development of science, technology and innovation
The Nema project matching grants supplied a total of 61 items and 10 irrigation structures to the
beneficiaries in the project intervention areas. The items include: Irrigation structures, power
tillers, tractors, refrigerated trucks, processing equipment, storage, transportation and packaging
equipment, value addition-processing equipment, rice and coos milling machines, oil pressing
machine and millet threshers, rice processing machines, multipurpose milling machine, rice
threshers, multi-purpose milling with de-husking.
In Basse, Upper River Region, similar handing over of equipment purchased by Agriculture Value
Chain Development Project (AVCDP) where the Hon. Minister handed over agricultural
equipment to the communities of Mama Sutu, Sotoma Samba Koi, Dampha Kunda, Chagally Lang
Kaddy and Limbambul Bambo. In total 17 power tillers, 20 rice threshers, 8 rice trans-planters
and 4 tractors where handed over to the beneficiaries.
Under Climate Smart Agriculture Initiatives, NARI released the following climate smart seed
varieties for the 2018/19 cropping season: 21 new rice varieties to farmers; 15 lines of groundnut
at final screening stage; 4 varieties of Findi released to farmers; 8 varieties of cassava released to
farmers; and 8 orange flesh varieties of sweet potatoes released to women vegetable growers.
For the conservation practices: 50,716m dykes constructed; 28,830m contour bunds constructed,
182 spillways constructed; 139 bridges constructed; 158km access roads constructed; mangrove
restoration and agroforestry: 400ha & 72ha respectively. In addition, 1,000 energy efficient
cooking stoves for target beneficiaries under Nema-Chosso were constructed. There was also an
introduction of state-of-the-earth drip line irrigation in 21 women vegetable gardens (11 and 10
gardens in WCR and NBR respectively) to mitigate climate change.
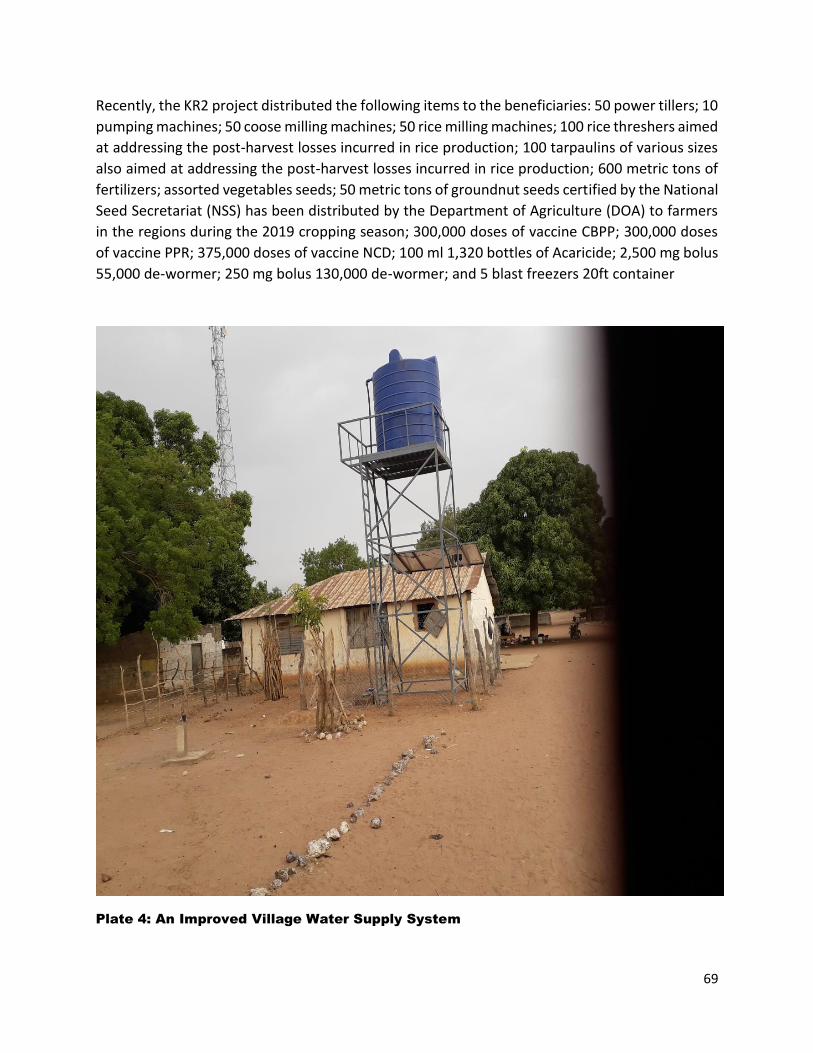
69
Recently, the KR2 project distributed the following items to the beneficiaries: 50 power tillers; 10
pumping machines; 50 coose milling machines; 50 rice milling machines; 100 rice threshers aimed
at addressing the post-harvest losses incurred in rice production; 100 tarpaulins of various sizes
also aimed at addressing the post-harvest losses incurred in rice production; 600 metric tons of
fertilizers; assorted vegetables seeds; 50 metric tons of groundnut seeds certified by the National
Seed Secretariat (NSS) has been distributed by the Department of Agriculture (DOA) to farmers
in the regions during the 2019 cropping season; 300,000 doses of vaccine CBPP; 300,000 doses
of vaccine PPR; 375,000 doses of vaccine NCD; 100 ml 1,320 bottles of Acaricide; 2,500 mg bolus
55,000 de-wormer; 250 mg bolus 130,000 de-wormer; and 5 blast freezers 20ft container
Plate 4: An Improved Village Water Supply System
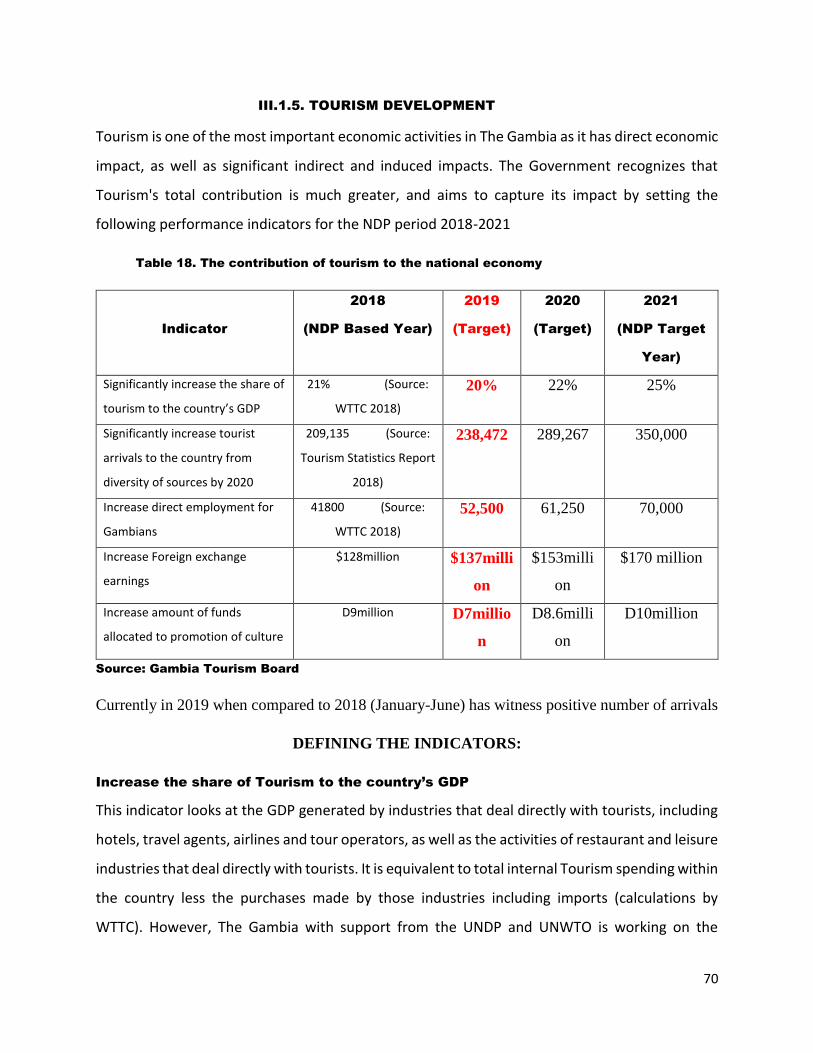
70
III.1.5. TOURISM DEVELOPMENT
Tourism is one of the most important economic activities in The Gambia as it has direct economic
impact, as well as significant indirect and induced impacts. The Government recognizes that
Tourism's total contribution is much greater, and aims to capture its impact by setting the
following performance indicators for the NDP period 2018-2021
Table 18. The contribution of tourism to the national economy
Indicator
2018
(NDP Based Year)
2019
(Target)
2020
(Target)
2021
(NDP Target
Year)
Significantly increase the share of
tourism to the country’s GDP
21% (Source:
WTTC 2018)
20% 22% 25%
Significantly increase tourist
arrivals to the country from
diversity of sources by 2020
209,135 (Source:
Tourism Statistics Report
2018)
238,472 289,267
350,000
Increase direct employment for
Gambians
41800 (Source:
WTTC 2018)
52,500 61,250 70,000
Increase Foreign exchange
earnings
$128million
$137milli
on
$153milli
on
$170 million
Increase amount of funds
allocated to promotion of culture
D9million D7millio
n
D8.6milli
on
D10million
Source: Gambia Tourism Board
Currently in 2019 when compared to 2018 (January-June) has witness positive number of arrivals
DEFINING THE INDICATORS:
Increase the share of Tourism to the country’s GDP
This indicator looks at the GDP generated by industries that deal directly with tourists, including
hotels, travel agents, airlines and tour operators, as well as the activities of restaurant and leisure
industries that deal directly with tourists. It is equivalent to total internal Tourism spending within
the country less the purchases made by those industries including imports (calculations by
WTTC). However, The Gambia with support from the UNDP and UNWTO is working on the
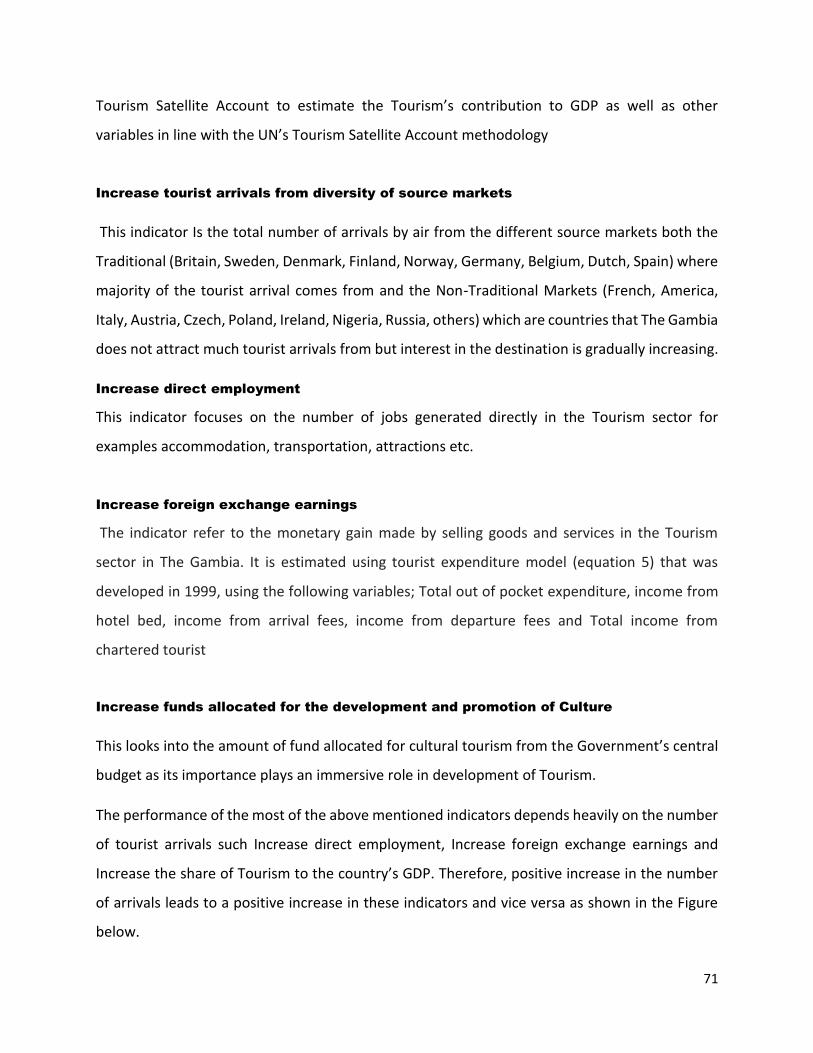
71
Tourism Satellite Account to estimate the Tourism’s contribution to GDP as well as other
variables in line with the UN’s Tourism Satellite Account methodology
Increase tourist arrivals from diversity of source markets
This indicator Is the total number of arrivals by air from the different source markets both the
Traditional (Britain, Sweden, Denmark, Finland, Norway, Germany, Belgium, Dutch, Spain) where
majority of the tourist arrival comes from and the Non-Traditional Markets (French, America,
Italy, Austria, Czech, Poland, Ireland, Nigeria, Russia, others) which are countries that The Gambia
does not attract much tourist arrivals from but interest in the destination is gradually increasing.
Increase direct employment
This indicator focuses on the number of jobs generated directly in the Tourism sector for
examples accommodation, transportation, attractions etc.
Increase foreign exchange earnings
The indicator refer to the monetary gain made by selling goods and services in the Tourism
sector in The Gambia. It is estimated using tourist expenditure model (equation 5) that was
developed in 1999, using the following variables; Total out of pocket expenditure, income from
hotel bed, income from arrival fees, income from departure fees and Total income from
chartered tourist
Increase funds allocated for the development and promotion of Culture
This looks into the amount of fund allocated for cultural tourism from the Government’s central
budget as its importance plays an immersive role in development of Tourism.
The performance of the most of the above mentioned indicators depends heavily on the number
of tourist arrivals such Increase direct employment, Increase foreign exchange earnings and
Increase the share of Tourism to the country’s GDP. Therefore, positive increase in the number
of arrivals leads to a positive increase in these indicators and vice versa as shown in the Figure
below.
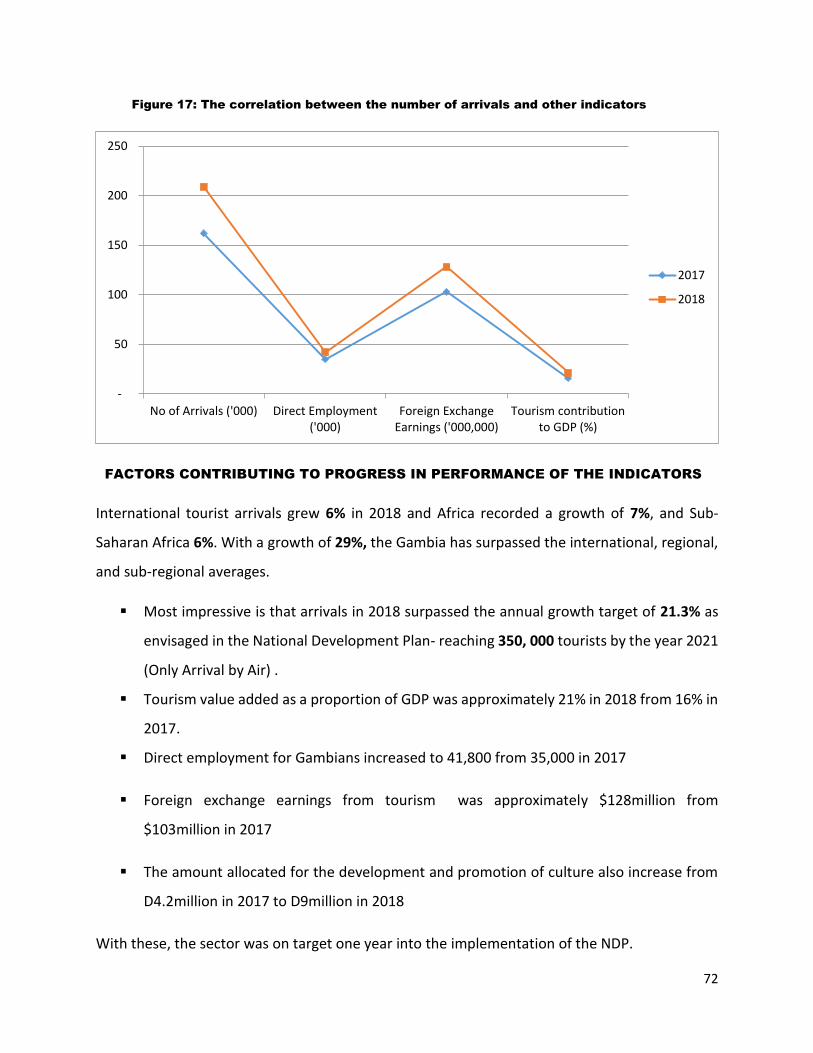
72
Figure 17: The correlation between the number of arrivals and other indicators
FACTORS CONTRIBUTING TO PROGRESS IN PERFORMANCE OF THE INDICATORS
International tourist arrivals grew 6% in 2018 and Africa recorded a growth of 7%, and Sub-
Saharan Africa 6%. With a growth of 29%, the Gambia has surpassed the international, regional,
and sub-regional averages.
Most impressive is that arrivals in 2018 surpassed the annual growth target of 21.3% as
envisaged in the National Development Plan- reaching 350, 000 tourists by the year 2021
(Only Arrival by Air) .
Tourism value added as a proportion of GDP was approximately 21% in 2018 from 16% in
2017.
Direct employment for Gambians increased to 41,800 from 35,000 in 2017
Foreign exchange earnings from tourism was approximately $128million from
$103million in 2017
The amount allocated for the development and promotion of culture also increase from
D4.2million in 2017 to D9million in 2018
With these, the sector was on target one year into the implementation of the NDP.
-
50
100
150
200
250
No of Arrivals ('000) Direct Employment('000)
Foreign ExchangeEarnings ('000,000)
Tourism contributionto GDP (%)
2017
2018
73
Some key factors that contributed to the progress in the performance of the indicators includes
The increased in the number of tourist flights to “destination Gambia” from 50 to 57
flights. Thomas Cook Holland for instance for the first time flew twice a week to the Gambia
as a direct chartered flight with 180 seats to Banjul and also jetted in tourists during the
summer. Destination Gambia registered the first Direct flights (3 times a month with 350
tourists) from Russia to Banjul; while TUI Poland started its all year-round operation during
the summer. TUI Belgium charter flight also started flying to the Gambia after been away for
more than 16 years. From the UK market came 12 flights a week (Thomas Cook 9, Gambia
Experience) while Thomas Cook Scandinavia increased its flight capacity from a load factor of
9,000 to a load factor of 17,000 for 2018/2019 tourism season. The Dutch Market also
operated 11 flights per week. FTI Touristik also resumed its operations to the Gambia after
been away for more than 20 years and it has plans to fly year - round beginning April 2019
from 4 major cities in Germany (Munich, Frankfurt, Leipzig and Dusseldorf) and a weekly flight
from Slovakia. To increase the ease of access to The Gambia using the non-chartered flight
mode, Turkish Airlines started flying twice from Istanbul to Banjul, a daily flight to Nigeria and
Ghana was established with ASKY while Air Peace flew 4 times a week to destinations within
the sub region.
These underpinned strategies has contributed immensely to an increase that surpassed by
8%, the 21% increase in arrivals the target for 2018 and doubled the 2018 Foreign Exchange
earnings target (13%)
Improved marketing strategies were held in enhancing the sector’s performance, such as
the appointment of 4 destination managers in 2018 charged with the management and
promotion of the Gambia’s tourism sector in the United Kingdom, Spain, Scandinavia and
Saudi Arabia. Aggressive marketing strategies characterized by successful trade fairs in
traditional & non- traditional markets; consolidated and improved the E- marketing
platforms; as well as product development and diversification ventures with focus on
Community based Tourism has created new cultural tourism attractions in rural Gambia.
74
The critical product diversification efforts that took place in 2018 included developing
products around The River Gambia, the development and improvement of niche products
such as bird watching, fishing and culinary tourism as well as the development of supportive
infrastructure for community-based tourism and ecotourism enterprises in all five regions of
the country.
The formulation of sound strategies in terms of marketing, product development and quality
assurance for the tourism industry, recruitment of 5 research assistants to be deployed
to the border posts of Giboro, Sabi, Amdalai, Soma and Farafenni to assist in the collection
of data which will help map and strengthen strategic direction
The sector has allocated lands for investments; secured gainful employment for 80% of
graduates from the Gambia Tourism and Hospitality Institute (GTHI) – thus enhancing
service delivery; while also increasing the number of new and refurbished hotels in the
Gambia in 2018/2019. In 2018, over 35 applications (solicited and unsolicited) for the
construction of four and five star hotels were received, out of which 5 credible investors
completed the appraisal process.
During 2018, the sector had pursued a multi-pronged approach in the quest to integrate and
promote cultural assets into the tourism industry.
The funds allocated to promote culture during 2018 stood at D9million (Source: Budget
Estimate 2018) – which is a surge from the D4.2million allocated in 2017 and very close to the
2021 target of D10million. This increase in the amount allocated to the promotion of culture
has given the National Center for Arts and Culture (NCAC), the financial capacity to promote,
nurture and preserve both intangible and tangible cultural assets of the country whilst
integrating it into the tourism industry. This has helped in the product development and
diversification strand of the sector’s strategy, key achievements registered in 2018 includes:
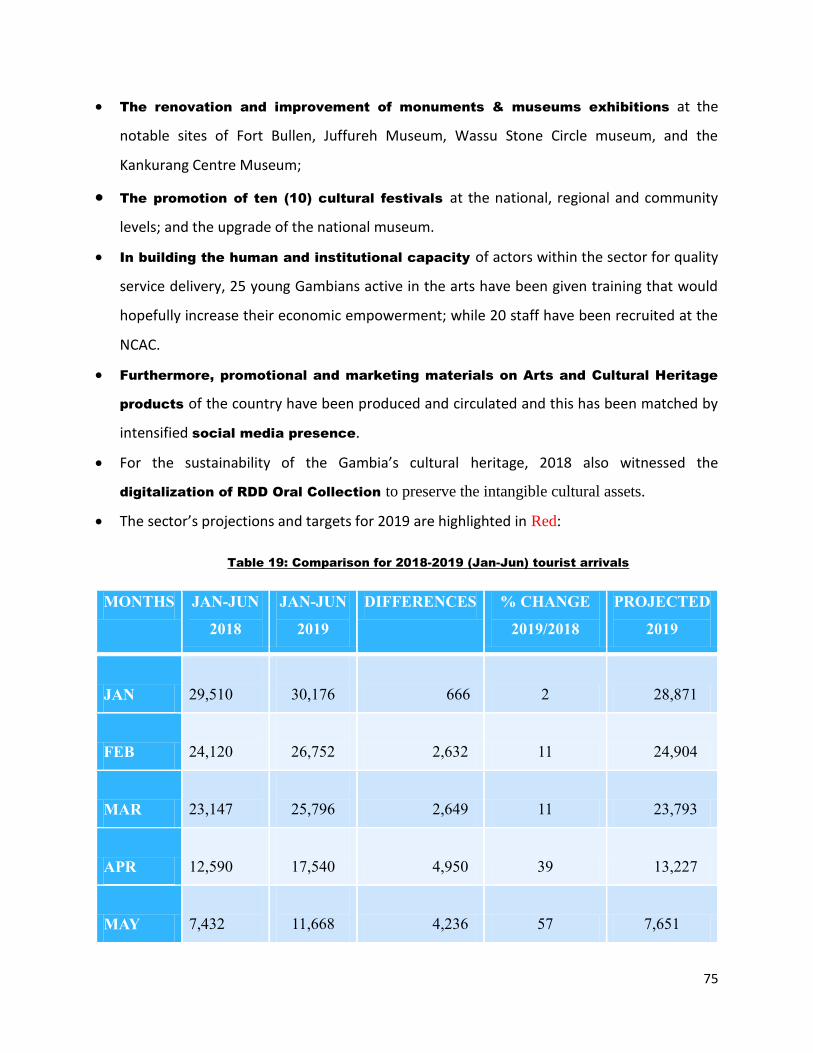
75
The renovation and improvement of monuments & museums exhibitions at the
notable sites of Fort Bullen, Juffureh Museum, Wassu Stone Circle museum, and the
Kankurang Centre Museum;
The promotion of ten (10) cultural festivals at the national, regional and community
levels; and the upgrade of the national museum.
In building the human and institutional capacity of actors within the sector for quality
service delivery, 25 young Gambians active in the arts have been given training that would
hopefully increase their economic empowerment; while 20 staff have been recruited at the
NCAC.
Furthermore, promotional and marketing materials on Arts and Cultural Heritage
products of the country have been produced and circulated and this has been matched by
intensified social media presence.
For the sustainability of the Gambia’s cultural heritage, 2018 also witnessed the
digitalization of RDD Oral Collection to preserve the intangible cultural assets.
The sector’s projections and targets for 2019 are highlighted in Red:
Table 19: Comparison for 2018-2019 (Jan-Jun) tourist arrivals
MONTHS JAN-JUN
2018
JAN-JUN
2019
DIFFERENCES % CHANGE
2019/2018
PROJECTED
2019
JAN
29,510
30,176 666 2 28,871
FEB
24,120
26,752 2,632 11 24,904
MAR
23,147
25,796 2,649 11 23,793
APR
12,590
17,540 4,950 39 13,227
MAY
7,432
11,668 4,236 57 7,651

76
JUN
8,354
11,399 3,045 36 8,601
TOTAL 105,153
123,331 18,178 17 107,047
This increment can be attributed to:
The continuous efforts of marketing the destination and engaging tour operators/ airlines
to make Gambia as a destination of choice
Providing incentives to investor to invest in Hotels, especially high-end hotels
Mark our presence in trade fairs in order to enhance visibility of destination Gambia
Continuously consolidating and improving E- marketing platforms in order to increase
number of online visitors, enquiries, bookings, followers and views
Continuous Product development and diversification: promotion and renovation of
Community based facilities up country (Kartong, Njawara, Berefet, Tumani Tenda)
Hotel classification Document/manual completed and validated- being implemented
Collaborated with YEP to develop CBT in Janjanbureh and Satellite communities resulting
in 42 direct jobs for youths
Just concluded training funded by COMCEC on Muslim Friendly Tourism Standards and
Quality Service Provision where 30 industry stakeholders from Gambia, Senegal and
Nigeria were trained.
Security enhancement: Purchase 2 pick-ups for the TSU in a bid to revamp and strengthen
tourism security as set out in the NDP
human capital and Capacity building
77
Sponsored / support through our corporate social responsibility programs
Plans are also ahead to achieve all-year-round tourism by:
4 flights per week during the summer months of 2019 from German speaking countries.
2 flights from Slovakia during summer months
2 high-end hotels completed and operational in TDA 1
Chartered flights secured for the summer season
FACTORS CHALLENGING PROGRESS IN THE PERFORMANCE OF THE INDICATORS
Encroachment of TDA land due to urban sprawl, fishing, mining and other activities in conflict
with tourism activities such as the Chinese fishing mills and sand mining in Sanyang, Gunjur,
Kartong, Kachumeh and Samosa. These activities especially dropping of waste from fishing
milling to the ocean destroying the Ecosystem with bad smell/odor thereby interrupting
Tourism activities. The sand mining in this areas are also of major causes of sea erosion.
Inability to reenter some of the undeveloped properties in the TDA due to litigation and slow
process of courts. These include lands confiscated by the Janneh Commission of Enquiry
from the former President which are within the TDA.
Continued illegal dumping in the TDA and beach littering as this has been flagged by tourist
and stakeholders despite that fact the GTBoard established Tourism Environmental
Sanitation and Sanitary Unit (TESSU) where people are employed for the sole purpose of
cleaning the beaches
Poor condition of tourism infrastructure i.e. Jetties in Juffureh, Tendaba and Janjanbureh
making tourism products along the River inaccessible and hindering the development of River
Tourism
Low Product quality particularly Upcountry due to inadequate infrastructural development,
unskilled/untrained personnel, lack of high-end tourism facilities
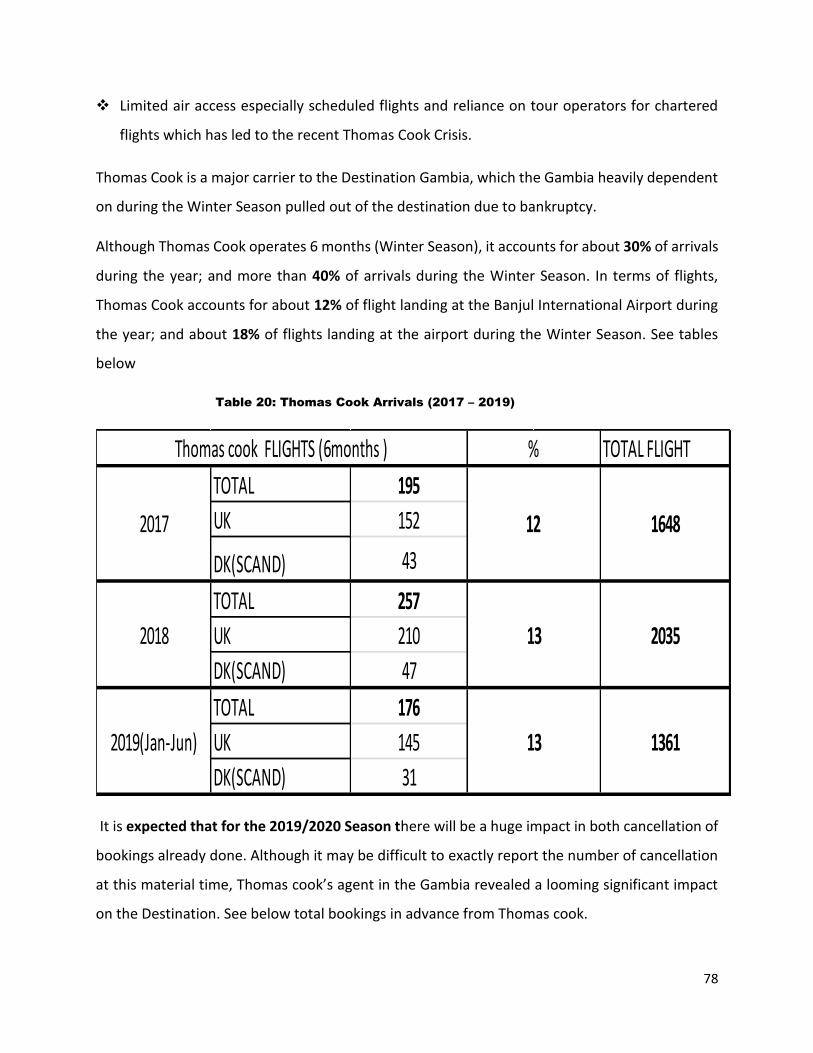
78
Limited air access especially scheduled flights and reliance on tour operators for chartered
flights which has led to the recent Thomas Cook Crisis.
Thomas Cook is a major carrier to the Destination Gambia, which the Gambia heavily dependent
on during the Winter Season pulled out of the destination due to bankruptcy.
Although Thomas Cook operates 6 months (Winter Season), it accounts for about 30% of arrivals
during the year; and more than 40% of arrivals during the Winter Season. In terms of flights,
Thomas Cook accounts for about 12% of flight landing at the Banjul International Airport during
the year; and about 18% of flights landing at the airport during the Winter Season. See tables
below
Table 20: Thomas Cook Arrivals (2017 – 2019)
It is expected that for the 2019/2020 Season there will be a huge impact in both cancellation of
bookings already done. Although it may be difficult to exactly report the number of cancellation
at this material time, Thomas cook’s agent in the Gambia revealed a looming significant impact
on the Destination. See below total bookings in advance from Thomas cook.
TOTAL FLIGHT
TOTAL 195
UK 152
DK(SCAND) 43
TOTAL 257
UK 210
DK(SCAND) 47
TOTAL 176
UK 145
DK(SCAND) 31
%Thomas cook FLIGHTS (6months )
12
13
13
2017
2018
2019(Jan-Jun)
1648
2035
1361
79
Total booking for Thomas Cook is 57,000 tourists
For UK:
7 to 9 flights per week
14,000 booked flight plus hotel
14,000 booked only flights
For Scandinavia:
2 flights per week capacity of 396
Tourists per week is 780
17,000 tourists expected from Scandinavia
The Gambia stands to lose all these if swift alternative measures are not instituted.
“Bumsterism”/ Hustlers continue to be a major issue visitors complain about, accounting for
35 per cent of complaints from the annual Visitor Survey conducted.
Limited Funds to venture into the development and promotion of heavy investment required
tourism products such a Marina, amusement and theme parks, MICE etc.
Though new staff have been employed at NCAC but yet our challenges are inadequate human
resource in some major departments making it difficult to develop and promote cultural
tourism.
Untimely disbursement of Development Budget from the Ministry of Finance and Economics,
is a major challenge leading to uncompleted or unimplemented projects as funds approved
in the Development Budget estimate for Tourism And Culture are sometimes even not
allocated
Lack of mobility posts as challenge as it makes it impossible for NCAC staff to monitor and
visit upcountry sites regularly
80
RECOMMENDATIONS FOR ACTIONS TO FURTHER PROGRESS IN TOURISM DEVELOPMENT
In respect to the Thomas Cook crisis the following contingency measure are recommended
Engage other airlines especially those already flying into the Destination expand
capacity to accommodate the already booked travellers in the immediate period.
Look for a possibility of luring other airlines to consider flying to the Gambia
Continue to critically monitor the situation
Form a crisis management team to engage in damage limitation
Do a thorough impact assessment of the incident on the Destination
construction of Eco Lodges in each region
Demarcation of North-Coast TDA i.e. TDA 6
Development of a Nature Park in the TDA
Appoint Destination Managers in other source markets notably Nigeria, China, Russia
Conduct International Visitor Survey and finalize the establishment of a TSA
Attract more flights and increase frequency of flights to the Destination.
Development of Niche Tourism Cultural products such as festivals
Construction of 5 ecotourism camps (minimum3 star) in rural communities of the country as
per recommendation of the NDP(NBR-Bambali, CRR- Kunkiling Forest, URR – Sotouma
Sambakoi) with; Car park, Jetty, Solar lightening borehole, Fencing
Construction of link roads TDA 1: TDA street lightening link road constructions Palma Rima-
Kunta kinteh, Mansea, Badala, Coco ocean, Senegambia, Palma Rima footpath, Tanji
The creation of a National Fund for Arts and Culture levy from all carriers of copyright works
to support the Culture tourism without relying entirely on Central Government
Revision of regulations for NCAC financial empowerment such as the Non-resident Artistes
licensing, Museums and Galleries licensing, Printers / producers / publishers/ distributors
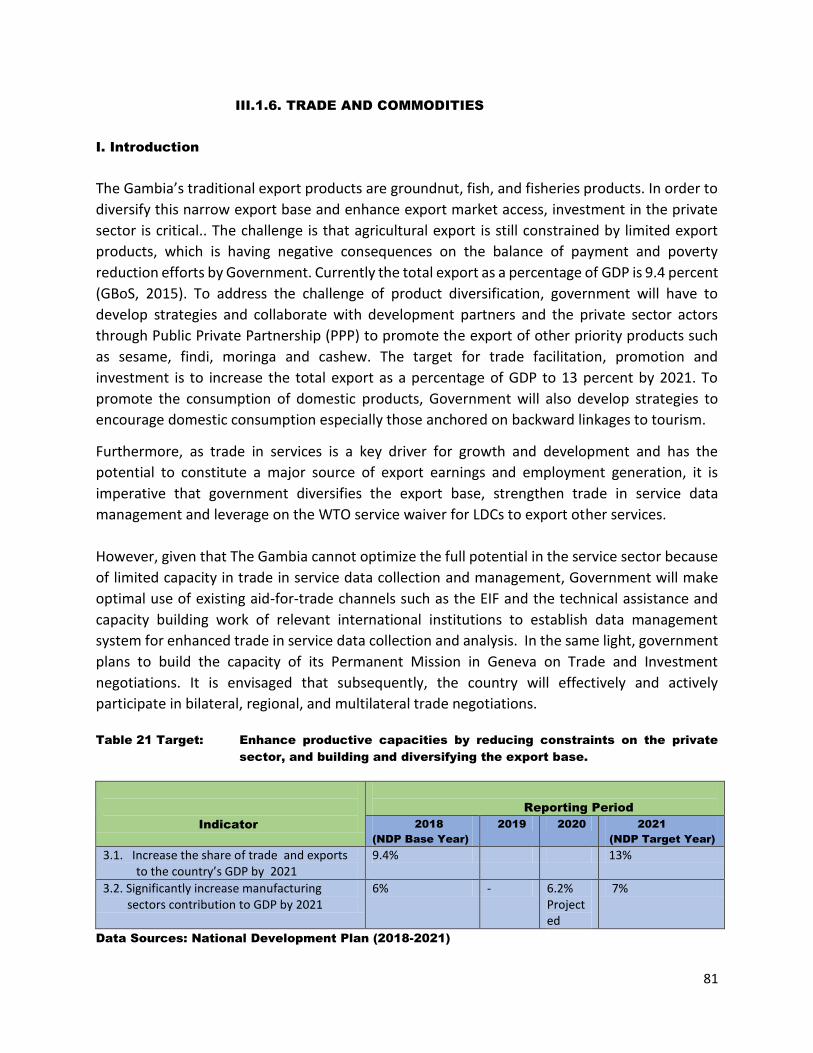
81
III.1.6. TRADE AND COMMODITIES
I. Introduction
The Gambia’s traditional export products are groundnut, fish, and fisheries products. In order to
diversify this narrow export base and enhance export market access, investment in the private
sector is critical.. The challenge is that agricultural export is still constrained by limited export
products, which is having negative consequences on the balance of payment and poverty
reduction efforts by Government. Currently the total export as a percentage of GDP is 9.4 percent
(GBoS, 2015). To address the challenge of product diversification, government will have to
develop strategies and collaborate with development partners and the private sector actors
through Public Private Partnership (PPP) to promote the export of other priority products such
as sesame, findi, moringa and cashew. The target for trade facilitation, promotion and
investment is to increase the total export as a percentage of GDP to 13 percent by 2021. To
promote the consumption of domestic products, Government will also develop strategies to
encourage domestic consumption especially those anchored on backward linkages to tourism.
Furthermore, as trade in services is a key driver for growth and development and has the
potential to constitute a major source of export earnings and employment generation, it is
imperative that government diversifies the export base, strengthen trade in service data
management and leverage on the WTO service waiver for LDCs to export other services.
However, given that The Gambia cannot optimize the full potential in the service sector because
of limited capacity in trade in service data collection and management, Government will make
optimal use of existing aid-for-trade channels such as the EIF and the technical assistance and
capacity building work of relevant international institutions to establish data management
system for enhanced trade in service data collection and analysis. In the same light, government
plans to build the capacity of its Permanent Mission in Geneva on Trade and Investment
negotiations. It is envisaged that subsequently, the country will effectively and actively
participate in bilateral, regional, and multilateral trade negotiations.
Table 21 Target: Enhance productive capacities by reducing constraints on the private
sector, and building and diversifying the export base.
Indicator
Reporting Period
2018
(NDP Base Year)
2019 2020 2021
(NDP Target Year)
3.1. Increase the share of trade and exports to the country’s GDP by 2021
9.4% 13%
3.2. Significantly increase manufacturing sectors contribution to GDP by 2021
6% - 6.2% Projected
7%
Data Sources: National Development Plan (2018-2021)
82
Key factors contributing to progress in the performance of trade indicators
- The Ministry of Trade, Industry, Regional Integration and Employment (MOTIE) reviewed
and updated the National Trade Policy and formulated the Trade Strategy (2018-2022);
- Funding has been secured from ACP TRADE COM 2/ITC to support the formulation of
legal framework for the establishment of a Single Window for Customs Clearance, E-
Trade Readiness Assessment and development of a project proposal for possible support;
- Contract has been signed between Government of Gambia and TAF Africa Global for the
development of a Special Economic Zone and a Special vehicle called GIETAF, designed
to boost the country's export performance;
- The Gambia Competition and Consumer Protection Commission’s (GCCPC) through the
consumer protection tribunal have registered 36 cases, of which 12 have been resolved.
The Commission also received three consumer complaints and did investigations on
them, namely Sardine quality at Serre-Kunda market, water quality and Coca cola, which
were all found to be none defective;
- Weights and Measures have also verified and stamped more than 6000 weighing scales,
weights, petrol dispensing pumps and meter sticks across the country. It has also
developed a building Plan for Office Headquarters, awaiting funding, conducted capacity
building for 10 export Business development advisers;
- The Ministry is currently receiving support from some key partners such as UNCTAD, World Bank, UNDP, EU, IDEP, TRAPCA, ETC. However, of recent, Gambia has not fulfill it contributions to WTO and as a result as not been benefit in most of staff capacity building programmes
- The Directorate of trade is currently implementing two small projects, namely ELF, which
is coming to an end in December, and “She-Trade”, funded by ITC to enhance women
entrepreneurs’ capacity to export. Another project aimed to enhancing trade, called the
“Youth Empowerment Project” (YEP), is jointly coordinated by the Ministries of Trade and
Youth. UNDP is also currently funding a 4 year project called the Entrepreneurship
Support for Private Sector Development Project. In addition The Gambia is currently
developing an Aid for Trade Strategy
- Over the years, trade promotion and trade facilitation are the two key government intervention programmes that have been integrated as part of the government Programme Based Budgeting and among the four key programmes being implemented by the Ministry. In addition, the development of private sector as an engine of growth is one of the key pillars of the National Development Plan, with specific indicators aimed to
83
enhancing GDP growth through promotion of exports, industrialization and value addition.
- - The Ministry of Trade, Industry, Regional Integration and Employment also developed a
Medium term Plan 2017-2022, which was realigned with both the NDP and SDGs , in order to ensure effective coordination and implementation. Several Policy and Research surveys such as the National Trade Policy, Industrial Policy, Small and Medium Scale Enterprise Policy, Entrepreneurship Policy, Export Strategy have all been developed or reviewed in line with the new demographic dispensation. Several coordinating committees have equally been established both at policy and technical leveled. The National Economic Council, chaired by the President.
- The Gambia has adopted the Common External Tariff of the ECOWAS region in 2017. The
country has ratified the AfCFTA and is implementing the ELTS and ISRTS protocols on the
free movement of goods and Services. The country benefits from AGOA and other special
differential treatment mechanisms that developing countries are entitled to. However,
due to its weak capacity, the country is not fully benefiting from most of these schemes
Key factors challenging progress in the performance of trade indicators
- The measures adopted by Senegal to restrict the movement of trucks loaded with cashew
nuts by road from Guinea Bissau, lead to reduction in the cashew trade in 2018;
- The values reported for re-exports trade in 2017/2018 have dropped significantly due to
lack of collection of such data by the transport Union since the previous union trained in
that aspect has been disbanded;
- The Senegalese government introduction of non-tariff barriers on ETLS has affected the
country's export to the sub region and thus our trade performance as the measures tend
to increase cost for businesses and waste lot of time at the borders. These non-tariff
barriers include decision by the Senegalese government to ensure that all Gambian
vehicles involved in re-export trade are escorted by a custom official whilst in Senegalese
territory in order to prevent their free movement within the Senegalese territory. Another
non-tariff barrier imposed on Gambian vehicles involved an order by the Senegalese
Government that cashew cannot be transported by road from Guinea Bissau to The
Gambia through Senegalese territory since the additional vehicle traffic that ensues is
beginning to have a strain on Senegalese roads
- Guinea Bissau has banned cross-border transportation of cashew by land. Timber exports
were also periodically banned both of which have affected the cross-border trade
between The Gambia, Senegal and Guinea Bissau;
84
- Another key export products to the sub-region are soft drinks and alcohol. However,
these are also currently experiencing some serious challenges which almost led the
“Julbrew Company” to almost close down due to excessive tax increases imposed in the
2019 budget. However, as a result of negotiations between the government and the
Company the tax increases were eased and the dispute resolved;
- In regards to improvements to productivity and competitiveness and diversification of production bases into dynamic new products and services, this constitutes a major challenge facing the Gambia. The country has a very small manufacturing base and low level of value addition activities. The local target market is small and not sophisticated while the cost of doing business in the Gambia is very high, particularly electricity. Some of the products produced by our local manufacturers cannot be exported due to inferior standards, due partly to the lack of quality infrastructure on standard. High tax burden at central and local levels also poses serious challenges to the growth and expansion of the country’s manufacturing base
Recommendations for actions needed to accelerate progress in trade development
- Conduct training for businesses and expose them to all the trade opportunities such as
AGOA, ECOWAS CET Protocols, and the AfCFTA;
- Strengthen bilateral trade cooperation between Senegal, Gambia and Guinea Bissau to
promote intra-regional trade and remove none tariff barriers;
- Set up an industrial estate and dry porting facilities at Basse;
- The special Economic Zones in Farafenni and Soma to serve as a trade logistic center;
- Government of the Gambia should work on obtaining the textile visa in order to benefit
from the AGOA scheme and institutions to work on this should be: MOTIE, GEIPA, GRA,
and American Embassy;
- Work with the Ministry of Lands and Regional Government to survey and reassign unused
plots at the Kanifing Industrial Estate;
- Identify key potential industries and design policies to promote their growth such as
cement, flour, agribusiness and processing, tourism services etc.;
- Develop a database that can strengthen data collection on internal trade as well as
capture data on industrial growth, employment and trade, instead of each directorate
maintaining its stand-alone data base;
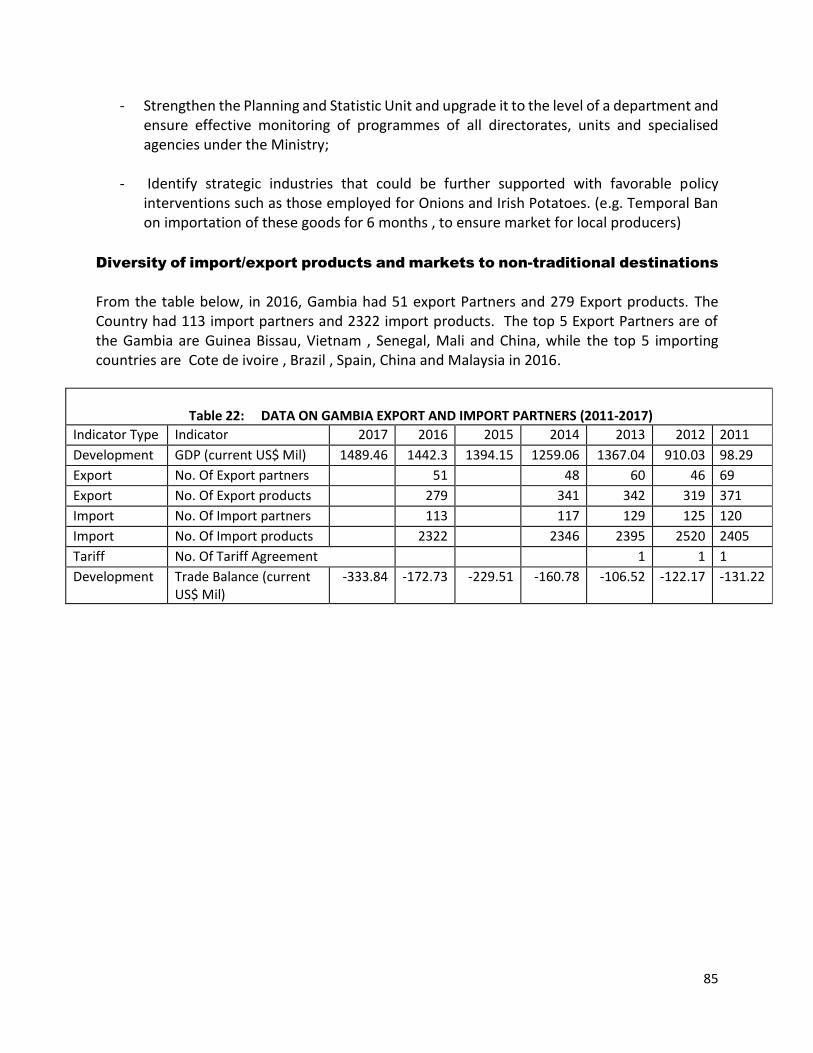
85
- Strengthen the Planning and Statistic Unit and upgrade it to the level of a department and ensure effective monitoring of programmes of all directorates, units and specialised agencies under the Ministry;
- Identify strategic industries that could be further supported with favorable policy interventions such as those employed for Onions and Irish Potatoes. (e.g. Temporal Ban on importation of these goods for 6 months , to ensure market for local producers)
Diversity of import/export products and markets to non-traditional destinations
From the table below, in 2016, Gambia had 51 export Partners and 279 Export products. The Country had 113 import partners and 2322 import products. The top 5 Export Partners are of the Gambia are Guinea Bissau, Vietnam , Senegal, Mali and China, while the top 5 importing countries are Cote de ivoire , Brazil , Spain, China and Malaysia in 2016.
Table 22: DATA ON GAMBIA EXPORT AND IMPORT PARTNERS (2011-2017)
Indicator Type Indicator 2017 2016 2015 2014 2013 2012 2011 2010
Development GDP (current US$ Mil) 1489.46 1442.3 1394.15 1259.06 1367.04 910.03 98.29 951.81
Export No. Of Export partners 51 48 60 46 69 58
Export No. Of Export products 279 341 342 319 371 322
Import No. Of Import partners 113 117 129 125 120 111
Import No. Of Import products 2322 2346 2395 2520 2405 2230
Tariff No. Of Tariff Agreement 1 1 1 1
Development Trade Balance (current US$ Mil)
-333.84 -172.73 -229.51 -160.78 -106.52 -122.17 -131.22 -180.21
86
III.1.7. PUBLIC-PRIVATE PARTNERSHIP (PPP)
I. Introduction
Like several other countries, The Gambia is confronted with a growing population, rapid rate of
urbanization, an aging infrastructure, and inadequate public service delivery. However, due to its
narrow tax base and fiscal imbalances, the Government of The Gambia is encouraging the use of
innovative mode of financing such as Public-Private Partnerships (PPPs) for investments in both
brown-field and green-field infrastructure projects, as well as in public service sectors.
Gambia’s private sector is small and is seriously constrained by an inadequate policy
environment, high taxes and lack of infrastructure and access to finance. As the country seeks to
transition from a predominant agriculture based economy to a modern one linked to global
markets and value chains, with the private sector as the engine of growth and transformation,
significant policy reform would be needed. The NDP goal for private sector development is to:
have a private sector led growth through modernized manufacturing, industrialization, improved
trade and services
II. Key factors contributing to progress in public-private partnerships
One of the key factors contributing to the progress of PPPs is Government’s recognition of its
pervasive challenges in financing infrastructure and other socio-economic projects. To that effect,
a policy on PPPs was adopted in (2015-2020) as a means of leveraging private sector resources
and expertise to close the infrastructure gap, deliver efficient public infrastructure and service
delivery in the country. Also, with the support from the World Bank/PPAIF, a list of projects were
screened and identified as suitable priority projects for PPPs and an operational guideline for the
implementation of PPPs in The Gambia was also developed in (2016) to standardize the process.
The change from an autocratic regime to a more democratically-inclined government boosted the
economic outlook of The Gambia which raised investors’ confidence and willingness to partner
with government in doing business. As a result, we received unprecedented number of PPP
proposals and although the volume of submissions has drastically reduced, investors’ appetite for
PPPs is still relatively high.
Key factors challenging progress in the public-private partnerships
There are several challenges affecting the progress of implementing PPP projects in The Gambia.
Given the complex nature of some PPP arrangements and the potential risk they bear, there is a
need for strong legal and regulatory frameworks to guide and protect the investments. Up to
date, The Gambia does not have an Act or legal document governing PPPs hence as a result, some
investors are reluctant to invest in the absence of a legal regime.
87
Many PPP proposals are stalled and/or cancelled because the procedures set out in the PPP policy
and operational guideline are not followed by many project proponents. Instead, there is a high
degree of political/executive interference in the approval process which at times are contrary to
the advice of the technical staff review on the suitability and viability of a given proposal as a PPP.
The limited availability of financial resources and deficient human capacity are also major
challenges in the progress of PPPs in the Gambia. Government does not have the necessary
capacity or resources to conduct full feasibility studies on proposed projects and is also
constrained in carrying out comprehensive due diligence, preparing PPP projects for tendering,
assessing bankability, and retaining the services experienced advisors (i.e. Lawyers and Bankers).
Another challenge faced in promoting PPPs is the sustained push back from individuals and vested
parties in institutions or sectors that PPPs are being considered. This is partly as a result of
misconceptions people have on PPPs as some see it as synonymous to privatization which is
deemed directly unfavorable to them due to the fear of redundancies. There are also arguments
being put forward against PPPs because of the view that profit maximum objective of a private
company will lead to hike in prices and therefore negatively affect the livelihood of end-users.
PPP contract management and monitoring has also been a challenge in The Gambia. There is
supposed to be a committee set up to monitor the implementation of contractual agreements of
all PPPs signed and being implemented but that is hardly being done. This has resulted in non-
fulfillment of contractual obligations and slow response to remedial measures.
Recommendations for actions needed to accelerate progress in PPPs
The Gambia does not have an approved specific PPP law that addresses all provisions of PPPs projects yet several projects are being implemented in various sectors of the economy. Therefore, approval and enactment of the Draft PPP Bill should be fast-tracked. The Draft PPP Bill stipulates a comprehensive outline to attract private sector investments in infrastructure and the effective implementation of PPPs in the country. The effect of the new bill will provide a transparent, stable and specific legal framework that contributes to:
- Investing and improving communication strategies aimed at increasing the public
awareness and understanding of the value of PPPs will significantly contribute to the pace
of adoption of it as a viable alternative to traditional government procurement mode;
- Human capacity of the relevant parties tasked to promote PPPs, prepare projects,
evaluate proposals, and advice on PPPs should be further developed to meet
international best standards and keep up with evolving sectoral knowledge on PPPs; and
- Ensure equity, transparency, and competition; allow the creation of adequate
institutional capacities for the treatment and regulation of PPP projects; reduce the
development costs of projects and guarantee the adequate protection of the investors
and the lenders.
88
III.1.8. ENERGY CAPACITY AND SUSTAINABILITY
I. Introduction
The Gambia is the smallest country on continental Africa and also the most densely populated.
With so little land and few natural resources, economy relies heavily on tourism, remittances and
the agricultural sector, which employs three-quarters of the labor force. At 48.6% national rate,
poverty is widespread, particularly in rural areas, while unemployment and underemployment
remain high. The economy experienced a number of exogenous shocks in recent years, including
erratic rainfall and spillover effects from the 2014 Ebola crisis, but economic growth has since
rebounded and is projected to stabilize in the medium-term.
II. Electricity access in The Gambia: opportunities and challenges
Access to electricity remains an ongoing challenge. In 2016, about half of the population
(approximately 1 million people) was without access to electricity, amid a significant disparity in
rates of access between urban (66%) and rural (13%) areas. Electricity access doubled nationwide
from 20% in 2001 to 40% in 2010, but most of these gains came in the urbanized Greater Banjul
Area. Even where grid connections exist, power supply is often unreliable, with firms reporting
an average of about 20 power outages per month.
Off-grid electrification is a policy priority for the Government of The Gambia (GoTG), which is
committed to achieving universal electricity access by 2030. With support from the ECOWAS
Center for Renewable Energy and Energy Efficiency (ECREEE), the Government has outlined its
commitments and initiatives to develop renewable energy and meet its electrification targets in
its National Renewable Energy Action Plan (NREAP). Off-grid and micro-grid renewable projects
have existed in The Gambia for decades. The MoPE estimates a current installed capacity of
approximately 2 MW from the off-grid sector, including several off-grid pilot projects that have
been developed with World Bank support. Off-grid solar PV systems have been used for
telecommunications, lighting, and water pumps in rural areas in the country. There are also a few
resort hotels that feature solar-powered micro-grid systems
Given the relative remoteness of some of the rural Gambian communities and the distances from
the grid, off-grid solutions are a practical means of increasing rural electrification until grid
extensions arrive. Although the GoTG has recognized the importance of the off-grid solar in rural
electrification, it has yet to implement specific policies to promote development of the sector.
The 2013-2014 Renewable Energy Act clarified some of The Gambia’s feed-in tariff rules,
including for the off-grid sector. The Act applied a tariff scheme for smaller generation systems
(below 200 kW) in on-grid areas for the off-grid sector and also included provisions for hybrid
systems greater than 200 kW. However, the Act did not fully establish the policies and regulations
necessary to engage the private sector in off-grid market development.
To date, the country’s rural electrification initiatives have focused instead on grid-connected
power. However, off-grid electrification programs and initiatives have also gained momentum in
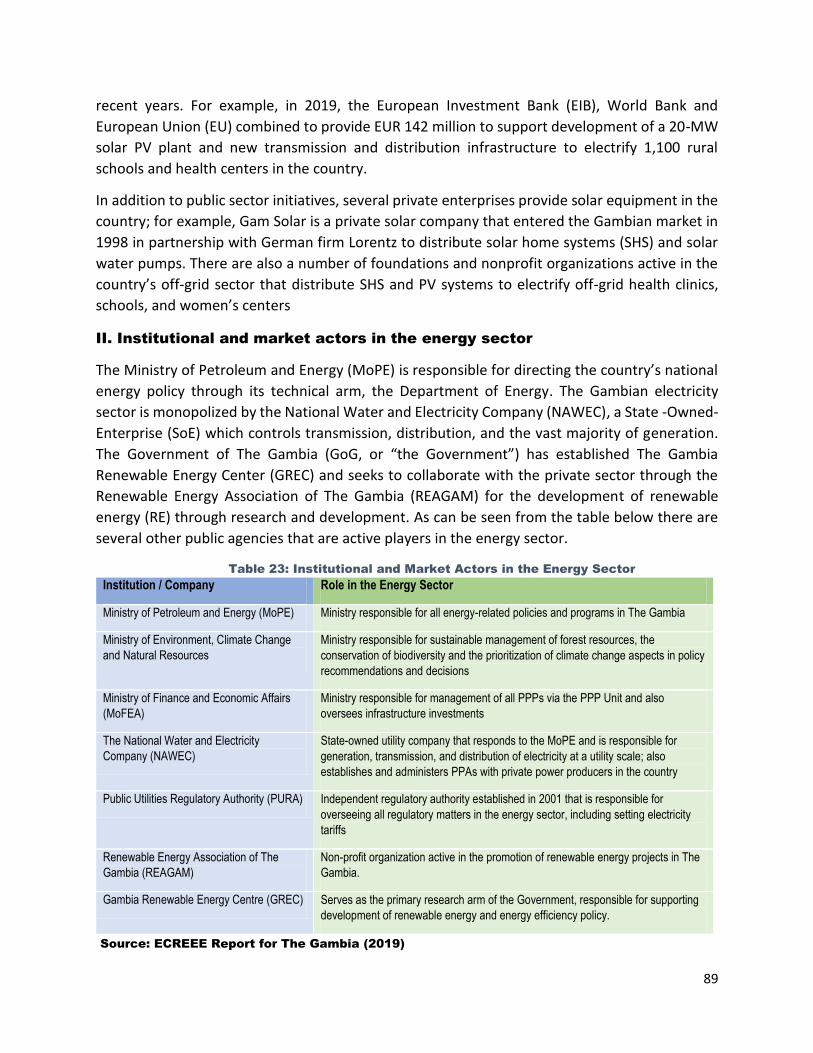
89
recent years. For example, in 2019, the European Investment Bank (EIB), World Bank and
European Union (EU) combined to provide EUR 142 million to support development of a 20-MW
solar PV plant and new transmission and distribution infrastructure to electrify 1,100 rural
schools and health centers in the country.
In addition to public sector initiatives, several private enterprises provide solar equipment in the
country; for example, Gam Solar is a private solar company that entered the Gambian market in
1998 in partnership with German firm Lorentz to distribute solar home systems (SHS) and solar
water pumps. There are also a number of foundations and nonprofit organizations active in the
country’s off-grid sector that distribute SHS and PV systems to electrify off-grid health clinics,
schools, and women’s centers
II. Institutional and market actors in the energy sector
The Ministry of Petroleum and Energy (MoPE) is responsible for directing the country’s national
energy policy through its technical arm, the Department of Energy. The Gambian electricity
sector is monopolized by the National Water and Electricity Company (NAWEC), a State -Owned-
Enterprise (SoE) which controls transmission, distribution, and the vast majority of generation.
The Government of The Gambia (GoG, or “the Government”) has established The Gambia
Renewable Energy Center (GREC) and seeks to collaborate with the private sector through the
Renewable Energy Association of The Gambia (REAGAM) for the development of renewable
energy (RE) through research and development. As can be seen from the table below there are
several other public agencies that are active players in the energy sector.
Table 23: Institutional and Market Actors in the Energy Sector
Institution / Company Role in the Energy Sector
Ministry of Petroleum and Energy (MoPE) Ministry responsible for all energy-related policies and programs in The Gambia
Ministry of Environment, Climate Change
and Natural Resources
Ministry responsible for sustainable management of forest resources, the
conservation of biodiversity and the prioritization of climate change aspects in policy
recommendations and decisions
Ministry of Finance and Economic Affairs
(MoFEA)
Ministry responsible for management of all PPPs via the PPP Unit and also
oversees infrastructure investments
The National Water and Electricity
Company (NAWEC)
State-owned utility company that responds to the MoPE and is responsible for
generation, transmission, and distribution of electricity at a utility scale; also
establishes and administers PPAs with private power producers in the country
Public Utilities Regulatory Authority (PURA) Independent regulatory authority established in 2001 that is responsible for
overseeing all regulatory matters in the energy sector, including setting electricity
tariffs
Renewable Energy Association of The
Gambia (REAGAM)
Non-profit organization active in the promotion of renewable energy projects in The
Gambia.
Gambia Renewable Energy Centre (GREC) Serves as the primary research arm of the Government, responsible for supporting
development of renewable energy and energy efficiency policy.
Source: ECREEE Report for The Gambia (2019)
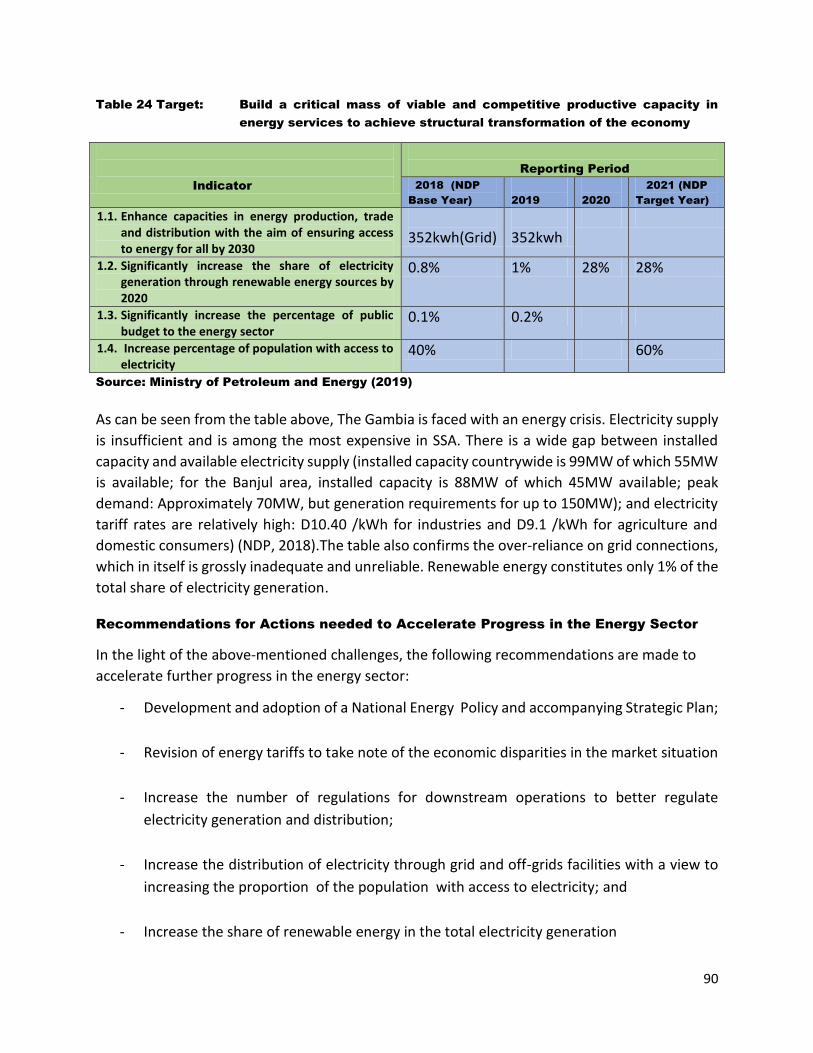
90
Table 24 Target: Build a critical mass of viable and competitive productive capacity in
energy services to achieve structural transformation of the economy
Indicator
Reporting Period
2018 (NDP
Base Year)
2019
2020
2021 (NDP
Target Year)
1.1. Enhance capacities in energy production, trade and distribution with the aim of ensuring access to energy for all by 2030
352kwh(Grid)
352kwh
1.2. Significantly increase the share of electricity generation through renewable energy sources by 2020
0.8% 1% 28% 28%
1.3. Significantly increase the percentage of public budget to the energy sector
0.1% 0.2%
1.4. Increase percentage of population with access to electricity
40% 60%
Source: Ministry of Petroleum and Energy (2019)
As can be seen from the table above, The Gambia is faced with an energy crisis. Electricity supply
is insufficient and is among the most expensive in SSA. There is a wide gap between installed
capacity and available electricity supply (installed capacity countrywide is 99MW of which 55MW
is available; for the Banjul area, installed capacity is 88MW of which 45MW available; peak
demand: Approximately 70MW, but generation requirements for up to 150MW); and electricity
tariff rates are relatively high: D10.40 /kWh for industries and D9.1 /kWh for agriculture and
domestic consumers) (NDP, 2018).The table also confirms the over-reliance on grid connections,
which in itself is grossly inadequate and unreliable. Renewable energy constitutes only 1% of the
total share of electricity generation.
Recommendations for Actions needed to Accelerate Progress in the Energy Sector
In the light of the above-mentioned challenges, the following recommendations are made to
accelerate further progress in the energy sector:
- Development and adoption of a National Energy Policy and accompanying Strategic Plan;
- Revision of energy tariffs to take note of the economic disparities in the market situation
- Increase the number of regulations for downstream operations to better regulate
electricity generation and distribution;
- Increase the distribution of electricity through grid and off-grids facilities with a view to
increasing the proportion of the population with access to electricity; and
- Increase the share of renewable energy in the total electricity generation
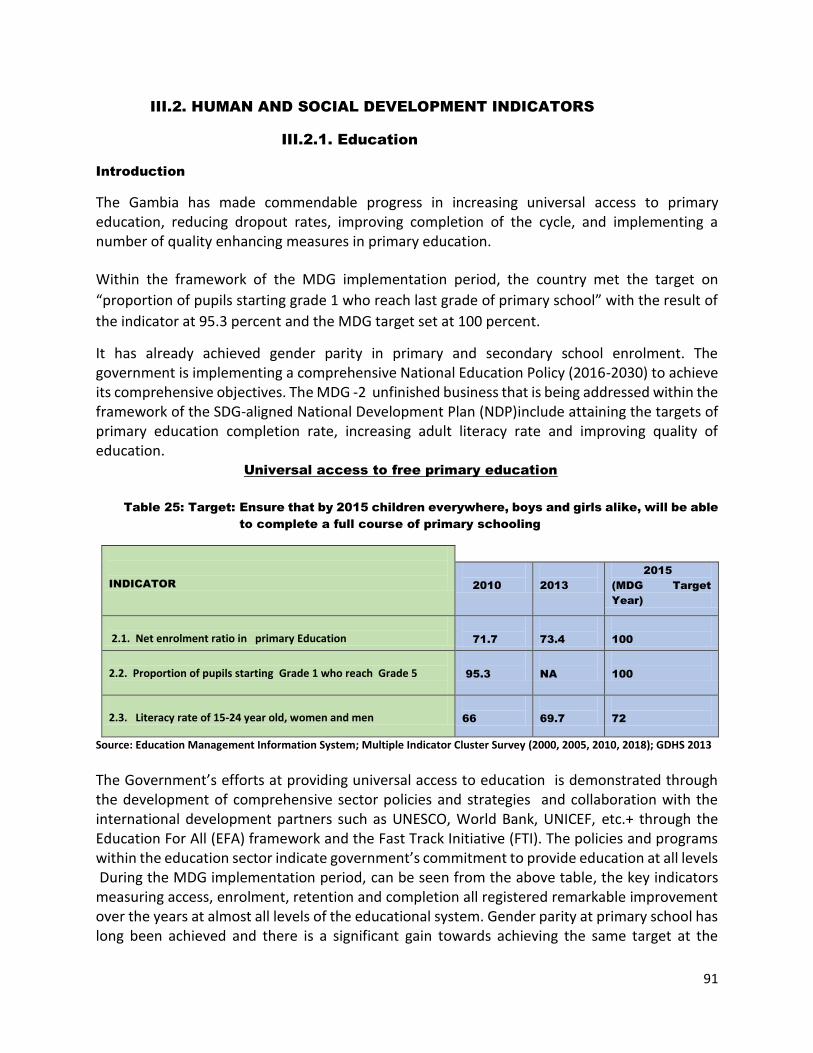
91
III.2. HUMAN AND SOCIAL DEVELOPMENT INDICATORS
III.2.1. Education
Introduction
The Gambia has made commendable progress in increasing universal access to primary education, reducing dropout rates, improving completion of the cycle, and implementing a number of quality enhancing measures in primary education.
Within the framework of the MDG implementation period, the country met the target on
“proportion of pupils starting grade 1 who reach last grade of primary school” with the result of
the indicator at 95.3 percent and the MDG target set at 100 percent.
It has already achieved gender parity in primary and secondary school enrolment. The government is implementing a comprehensive National Education Policy (2016-2030) to achieve its comprehensive objectives. The MDG -2 unfinished business that is being addressed within the framework of the SDG-aligned National Development Plan (NDP)include attaining the targets of primary education completion rate, increasing adult literacy rate and improving quality of education. Universal access to free primary education
Table 25: Target: Ensure that by 2015 children everywhere, boys and girls alike, will be able
to complete a full course of primary schooling
INDICATOR
2010
2013
2015
(MDG Target
Year)
2.1. Net enrolment ratio in primary Education
71.7
73.4
100
2.2. Proportion of pupils starting Grade 1 who reach Grade 5
95.3
NA
100
2.3. Literacy rate of 15-24 year old, women and men
66
69.7
72
Source: Education Management Information System; Multiple Indicator Cluster Survey (2000, 2005, 2010, 2018); GDHS 2013
The Government’s efforts at providing universal access to education is demonstrated through the development of comprehensive sector policies and strategies and collaboration with the international development partners such as UNESCO, World Bank, UNICEF, etc.+ through the Education For All (EFA) framework and the Fast Track Initiative (FTI). The policies and programs within the education sector indicate government’s commitment to provide education at all levels During the MDG implementation period, can be seen from the above table, the key indicators measuring access, enrolment, retention and completion all registered remarkable improvement over the years at almost all levels of the educational system. Gender parity at primary school has long been achieved and there is a significant gain towards achieving the same target at the
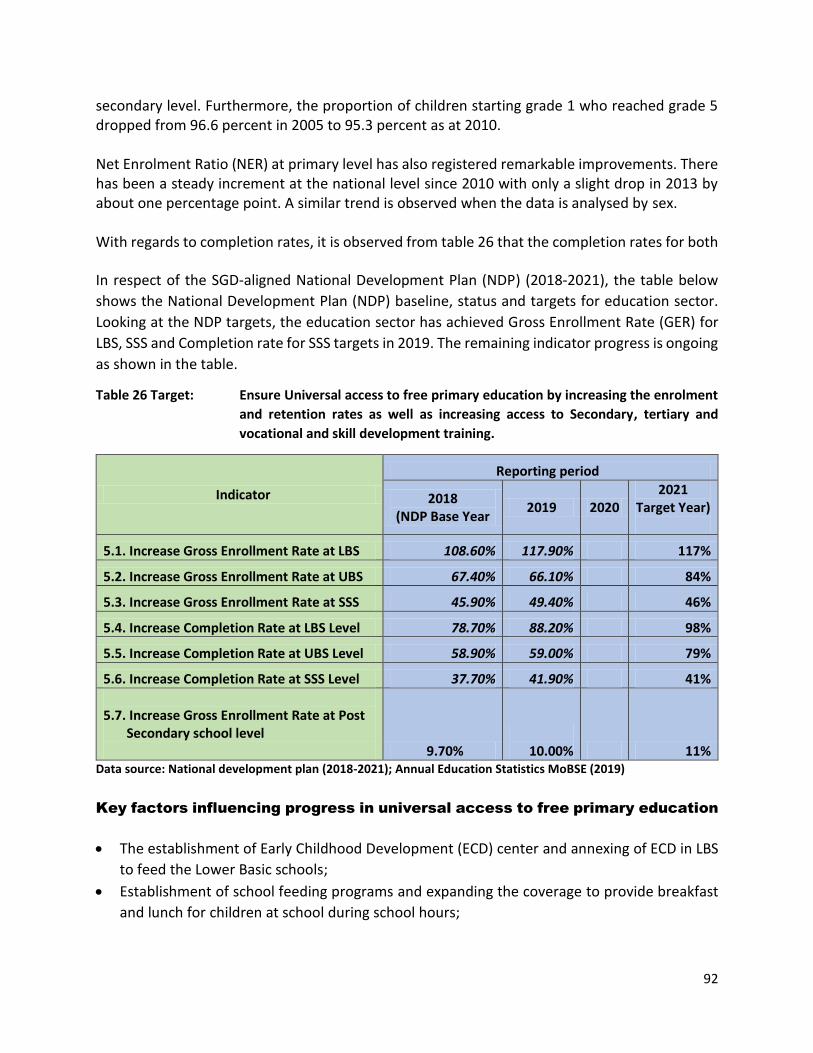
92
secondary level. Furthermore, the proportion of children starting grade 1 who reached grade 5 dropped from 96.6 percent in 2005 to 95.3 percent as at 2010. Net Enrolment Ratio (NER) at primary level has also registered remarkable improvements. There has been a steady increment at the national level since 2010 with only a slight drop in 2013 by about one percentage point. A similar trend is observed when the data is analysed by sex. With regards to completion rates, it is observed from table 26 that the completion rates for both
In respect of the SGD-aligned National Development Plan (NDP) (2018-2021), the table below
shows the National Development Plan (NDP) baseline, status and targets for education sector.
Looking at the NDP targets, the education sector has achieved Gross Enrollment Rate (GER) for
LBS, SSS and Completion rate for SSS targets in 2019. The remaining indicator progress is ongoing
as shown in the table.
Table 26 Target: Ensure Universal access to free primary education by increasing the enrolment
and retention rates as well as increasing access to Secondary, tertiary and
vocational and skill development training.
Indicator
Reporting period
2018 (NDP Base Year
2019 2020 2021
Target Year)
5.1. Increase Gross Enrollment Rate at LBS 108.60% 117.90% 117%
5.2. Increase Gross Enrollment Rate at UBS 67.40% 66.10% 84%
5.3. Increase Gross Enrollment Rate at SSS 45.90% 49.40% 46%
5.4. Increase Completion Rate at LBS Level 78.70% 88.20% 98%
5.5. Increase Completion Rate at UBS Level 58.90% 59.00% 79%
5.6. Increase Completion Rate at SSS Level 37.70% 41.90% 41%
5.7. Increase Gross Enrollment Rate at Post Secondary school level 9.70%
10.00% 11%
Data source: National development plan (2018-2021); Annual Education Statistics MoBSE (2019)
Key factors influencing progress in universal access to free primary education
The establishment of Early Childhood Development (ECD) center and annexing of ECD in LBS
to feed the Lower Basic schools;
Establishment of school feeding programs and expanding the coverage to provide breakfast
and lunch for children at school during school hours;
93
Creation of “Mothers’ Clubs” in communities to help campaigning for the importance of
education. Providing free education for girls subsequently brings in free education for all;
Donkey Cart initiative – Using donkey Cart to transport young children to and from small and
remote areas where schools cannot be established;
Public private partnership such as Czeeh Bike – that’s distributing bicycles to school children
as mean of transportation to school.
Reviewing and synchroning the curriculum of the Madrassas (Islamic education schools) and
the conventional schools - -to help schools have equal opportunities in the world of work
upon graduation;
The “Girls Trust fund”, provides subsidized education cost for female students through Grant Programs and this has helped to boost girls enrolment resulting in eliminating gender disparity against girls;
Elimination of all fees and levies in the basic and secondary education system has accelerated
enrolment growth immensely;
Provision and rehabilitation of school infrastructure;
.Motivation and retention of teachers through improved service conditions;
Pre-service and In-service training for teachers; and
Increased number of schools from basic to tertiary level
Key factors challenging progress in universal access to free primary education
In spite of the noticeable achievement in enrolment and completion rates, the quality of education remains a concern at all levels, particularly in public basic schools. There are also regional disparities in the quantity and quality of education outcomes, with the rural areas being the worst affected. To ensure high educational outcomes, these challenges need to be addressed. Generally, the Pupil Teacher Ratio (PTR) in The Gambia is quite satisfactory but quality of education is a persistent issue. Availability of teachers based on PTR is a necessary but not sufficient condition for ensuring quality. There has been public concern about the degree of absenteeism in schools across the country, particularly in public schools, and this has been attributed to lack of supervision. Availability of teaching and learning materials and quality of infrastructural facilities are also critical inputs in promoting quality of education outcome. Even though the government continues to provide textbooks and other teaching and learning materials as well as decent classrooms, there are still some rural schools that lack these materials and facilities. It is therefore important to go beyond availability of teachers as a measure of quality to address the problems of teacher absenteeism, poor school infrastructure and lack of
94
teaching and learning materials in order to ensure the desired learning outcomes for educational effectiveness. In terms of access, distance to schools is still a challenge for those in remote areas. In addition, the associated non-fee cost of education such as fares to school, uniforms and some other school material continue to pose challenges to many families in sending their children to school. Low incomes, cultural and other domestic factors such as the need for children to support in farming activities, household chores and household based industries still influence parental decision whether or not to send their children to school. Reaching the children in hard to reach areas and overcoming socio-cultural beliefs about education influence enrolment and retention.
Recommendations for actions needed to further progress in access to education
o Maintain the new teacher posting strategy;
o Maintenance of the Coordinators Committee Meetings (CCM)
o Creation of more gender sensitive curriculum and environment;
o Continuing promotion on the community awareness on the benefits of education
o Promote and campaign for performance and completion in the sector.
Contribution of Government towards improving universal access to education
The Government of the Gambia strives to promote standard and quality education service and in
addition to service delivery has created the structures to facilitate this.
Curriculum Directorate: This is responsible of curriculum review and update to meet
international standard. That is why today our grade twelve students’ graduates are admitted in
universities abroad and compete with international students in their home country.
In-Service Teacher Training (INSETT) unit, responsible of teacher training (in-service training and
up grading) to ensure quality lesson delivery
Standard and Quality Assurance Directorate (SQAD) serve as a watch dog for quality and
standard in the Basic and Secondary education sector.
Measurement and Evaluation unit: This unit measure and evaluate the outcome of the
interventions such as the SIG and SIP in the Schools
Assessment Unit: this Unit is responsible of analyzing all examination and Assessment carried
out by the Basic and Secondary education sector.
Adult and Non Formal education Unit: this unit hand adult and non-formal education in the
sector. It also handle technical and vocational skills training
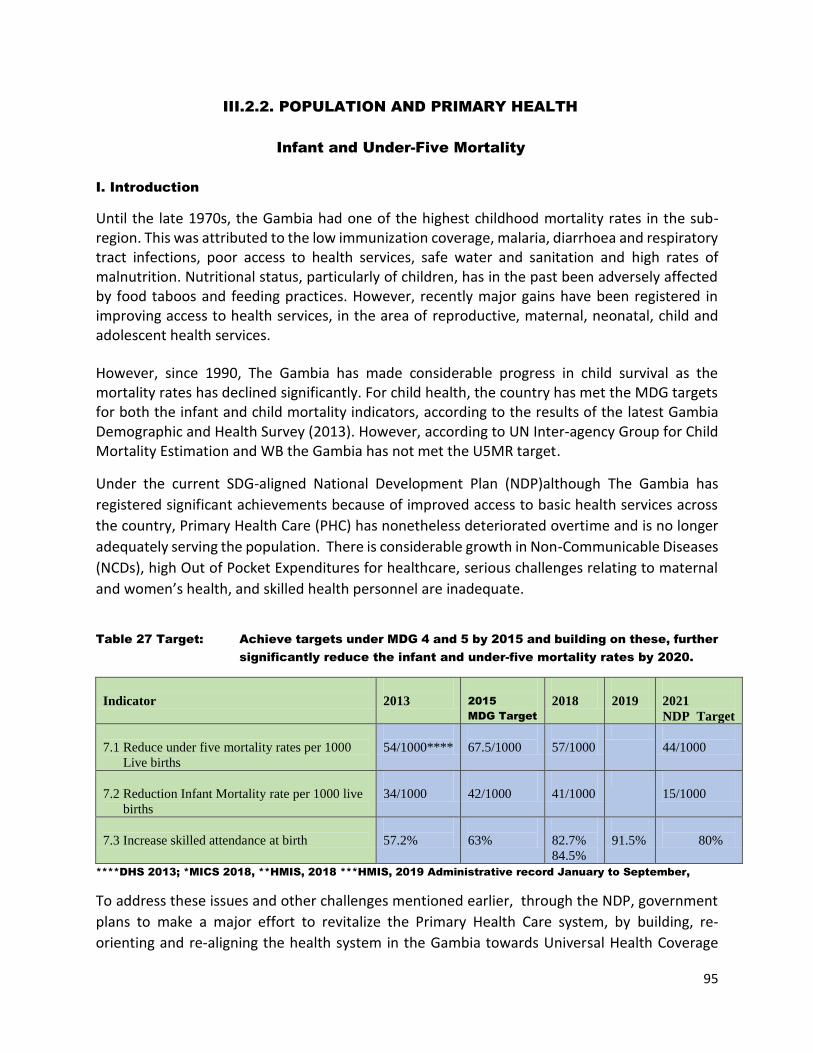
95
III.2.2. POPULATION AND PRIMARY HEALTH
Infant and Under-Five Mortality
I. Introduction
Until the late 1970s, the Gambia had one of the highest childhood mortality rates in the sub-region. This was attributed to the low immunization coverage, malaria, diarrhoea and respiratory tract infections, poor access to health services, safe water and sanitation and high rates of malnutrition. Nutritional status, particularly of children, has in the past been adversely affected by food taboos and feeding practices. However, recently major gains have been registered in improving access to health services, in the area of reproductive, maternal, neonatal, child and adolescent health services.
However, since 1990, The Gambia has made considerable progress in child survival as the mortality rates has declined significantly. For child health, the country has met the MDG targets for both the infant and child mortality indicators, according to the results of the latest Gambia Demographic and Health Survey (2013). However, according to UN Inter-agency Group for Child Mortality Estimation and WB the Gambia has not met the U5MR target.
Under the current SDG-aligned National Development Plan (NDP)although The Gambia has
registered significant achievements because of improved access to basic health services across
the country, Primary Health Care (PHC) has nonetheless deteriorated overtime and is no longer
adequately serving the population. There is considerable growth in Non-Communicable Diseases
(NCDs), high Out of Pocket Expenditures for healthcare, serious challenges relating to maternal
and women’s health, and skilled health personnel are inadequate.
Table 27 Target: Achieve targets under MDG 4 and 5 by 2015 and building on these, further
significantly reduce the infant and under-five mortality rates by 2020.
Indicator
2013
2015
MDG Target
2018
2019
2021
NDP Target
7.1 Reduce under five mortality rates per 1000
Live births
54/1000****
67.5/1000
57/1000
44/1000
7.2 Reduction Infant Mortality rate per 1000 live
births
34/1000
42/1000
41/1000
15/1000
7.3 Increase skilled attendance at birth
57.2%
63%
82.7%
84.5%
91.5%
80%
****DHS 2013; *MICS 2018, **HMIS, 2018 ***HMIS, 2019 Administrative record January to September,
To address these issues and other challenges mentioned earlier, through the NDP, government
plans to make a major effort to revitalize the Primary Health Care system, by building, re-
orienting and re-aligning the health system in the Gambia towards Universal Health Coverage
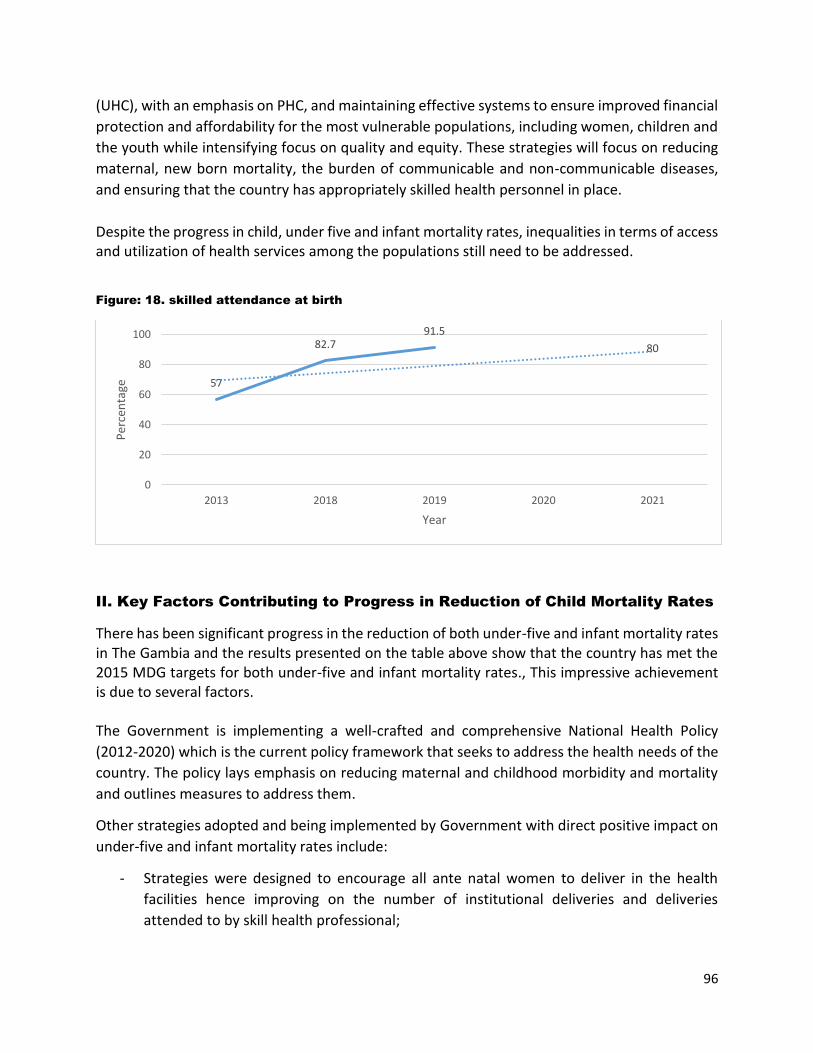
96
(UHC), with an emphasis on PHC, and maintaining effective systems to ensure improved financial
protection and affordability for the most vulnerable populations, including women, children and
the youth while intensifying focus on quality and equity. These strategies will focus on reducing
maternal, new born mortality, the burden of communicable and non-communicable diseases,
and ensuring that the country has appropriately skilled health personnel in place.
Despite the progress in child, under five and infant mortality rates, inequalities in terms of access and utilization of health services among the populations still need to be addressed.
Figure: 18. skilled attendance at birth
II. Key Factors Contributing to Progress in Reduction of Child Mortality Rates
There has been significant progress in the reduction of both under-five and infant mortality rates in The Gambia and the results presented on the table above show that the country has met the 2015 MDG targets for both under-five and infant mortality rates., This impressive achievement is due to several factors. The Government is implementing a well-crafted and comprehensive National Health Policy
(2012-2020) which is the current policy framework that seeks to address the health needs of the
country. The policy lays emphasis on reducing maternal and childhood morbidity and mortality
and outlines measures to address them.
Other strategies adopted and being implemented by Government with direct positive impact on
under-five and infant mortality rates include:
- Strategies were designed to encourage all ante natal women to deliver in the health
facilities hence improving on the number of institutional deliveries and deliveries
attended to by skill health professional;
57
82.791.5
80
0
20
40
60
80
100
2013 2018 2019 2020 2021
Per
cen
tage
Year
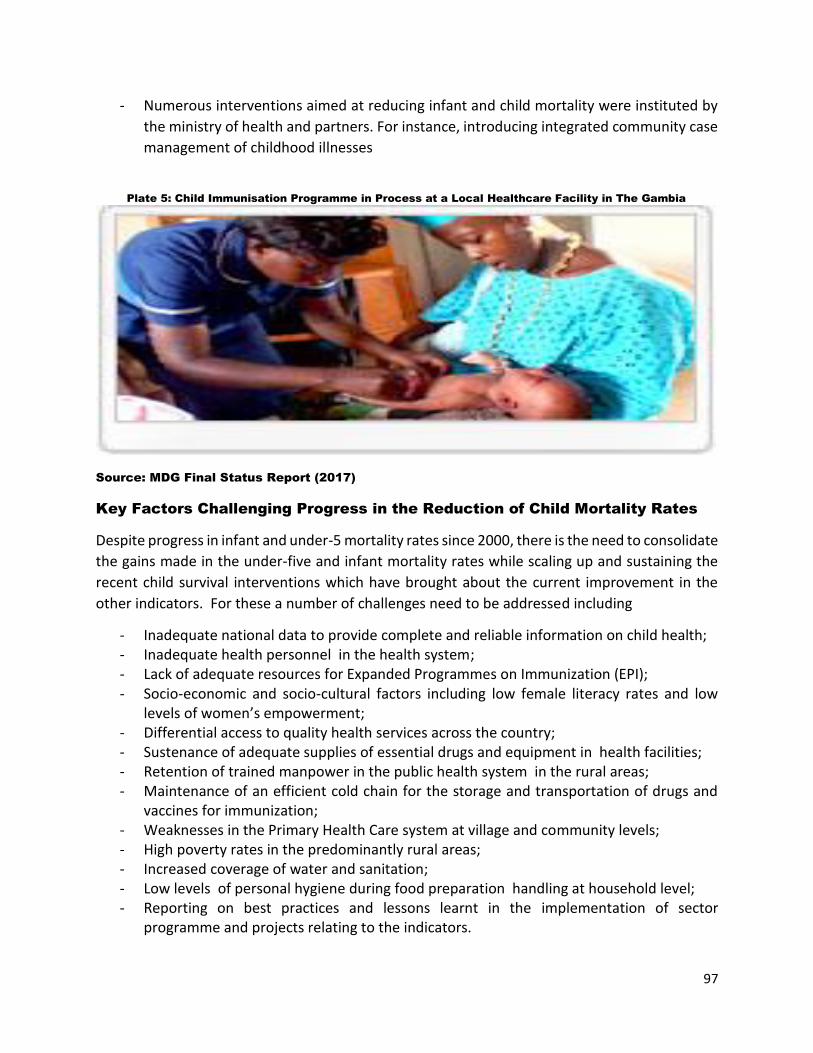
97
- Numerous interventions aimed at reducing infant and child mortality were instituted by
the ministry of health and partners. For instance, introducing integrated community case
management of childhood illnesses
Plate 5: Child Immunisation Programme in Process at a Local Healthcare Facility in The Gambia
Source: MDG Final Status Report (2017)
Key Factors Challenging Progress in the Reduction of Child Mortality Rates
Despite progress in infant and under-5 mortality rates since 2000, there is the need to consolidate
the gains made in the under-five and infant mortality rates while scaling up and sustaining the
recent child survival interventions which have brought about the current improvement in the
other indicators. For these a number of challenges need to be addressed including
- Inadequate national data to provide complete and reliable information on child health; - Inadequate health personnel in the health system; - Lack of adequate resources for Expanded Programmes on Immunization (EPI); - Socio-economic and socio-cultural factors including low female literacy rates and low
levels of women’s empowerment; - Differential access to quality health services across the country; - Sustenance of adequate supplies of essential drugs and equipment in health facilities; - Retention of trained manpower in the public health system in the rural areas; - Maintenance of an efficient cold chain for the storage and transportation of drugs and
vaccines for immunization; - Weaknesses in the Primary Health Care system at village and community levels; - High poverty rates in the predominantly rural areas; - Increased coverage of water and sanitation; - Low levels of personal hygiene during food preparation handling at household level; - Reporting on best practices and lessons learnt in the implementation of sector
programme and projects relating to the indicators.
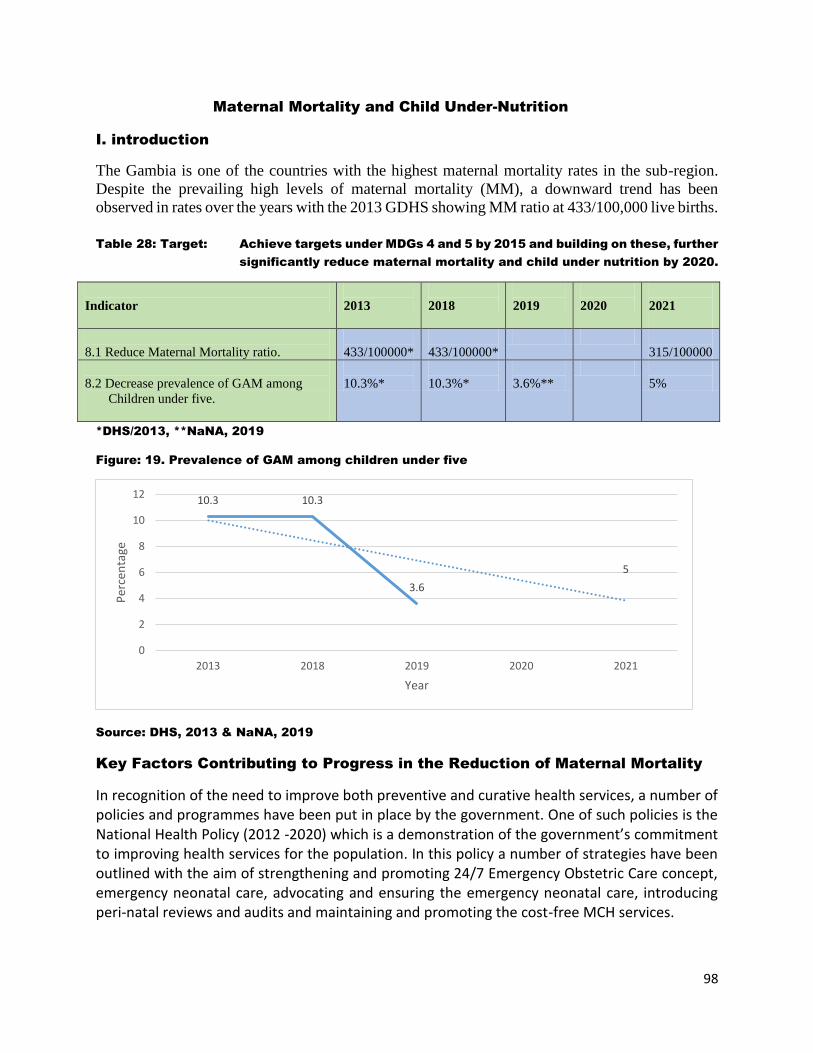
98
Maternal Mortality and Child Under-Nutrition
I. introduction
The Gambia is one of the countries with the highest maternal mortality rates in the sub-region.
Despite the prevailing high levels of maternal mortality (MM), a downward trend has been
observed in rates over the years with the 2013 GDHS showing MM ratio at 433/100,000 live births.
Table 28: Target: Achieve targets under MDGs 4 and 5 by 2015 and building on these, further
significantly reduce maternal mortality and child under nutrition by 2020.
Indicator
2013
2018
2019
2020
2021
8.1 Reduce Maternal Mortality ratio.
433/100000*
433/100000*
315/100000
8.2 Decrease prevalence of GAM among
Children under five.
10.3%*
10.3%*
3.6%**
5%
*DHS/2013, **NaNA, 2019
Figure: 19. Prevalence of GAM among children under five
Source: DHS, 2013 & NaNA, 2019
Key Factors Contributing to Progress in the Reduction of Maternal Mortality
In recognition of the need to improve both preventive and curative health services, a number of policies and programmes have been put in place by the government. One of such policies is the National Health Policy (2012 -2020) which is a demonstration of the government’s commitment to improving health services for the population. In this policy a number of strategies have been outlined with the aim of strengthening and promoting 24/7 Emergency Obstetric Care concept, emergency neonatal care, advocating and ensuring the emergency neonatal care, introducing peri-natal reviews and audits and maintaining and promoting the cost-free MCH services.
10.3 10.3
3.6
5
0
2
4
6
8
10
12
2013 2018 2019 2020 2021
Per
cen
tage
Year
99
In addition, a ‘National Reproductive Health Commodity Security Strategy’ (RHCS), designed to be implemented over the period 2014-2018, has also been developed with the following Vision; ‘A Gambia in which every pregnancy is wanted, every childbirth safe, and every young person's potential fulfilled’. The RHCS strategy has the goal of achieving universal access to reproductive health, promote reproductive rights and reduce maternal mortality by 50 percent by 2018. All these policies / strategies seek to address the inadequacies in the reproductive health services. A number of direct interventions that have also been introduced by the government to improve maternal healthcare include the Implementation of free maternal health services; repositioning family planning and training; implementing a comprehensive Antenatal Clinic Programme in the regional and district healthcare facilities; providing specific training for health workers including midwives in safe motherhood skills, abortion care and lactation management; implementation of Emergency Obstetric and Neonatal Care (EmONC) in all regional health Centres; and ensuring care provided by skilled professionals during pregnancy and childbirth. Most of these policies and strategies have had some positive impacts on reducing the maternal mortality rates and improving upon the antenatal care services. However, recent studies by NaNA (2019) show that the services continue to suffer from the difficulty of providing skilled health
personnel, vital medical supplies and equipment to health facilities at the regional and district
levels.
Another health care intervention that produced a positive impact on maternal mortality is the
BReST intervention. This was introduced to provide cash transfers to pregnant women to
encourage check-in for facility-based pre-natal care. The BReST cash component takes over from
the child’s birth, providing the mothers approximately US$12.5 per month until the child is two
years old. The cash transfer programme targets districts with the highest rates of global acute
malnutrition (GAM). The programme establishes a social protection floor for the most vulnerable
children with the aim to affect nutrition outcomes. The cash transfer was accompanied by a range
of nutrition and social education, such as nutritional best practice (i.e. breastfeeding,
complimentary feeding), gender issues (cash management within the household), micro-savings
and investment.
In addition, strategies to improve access to maternal health services were instituted through
establishing more outreach clinics and provision of quality ante natal and post-natal care services.
Key Factors Challenging Progress in the Reduction of Maternal Mortality
Notwithstanding the gains registered in the health sector, progress towards improvements in maternal health continue to be impeded by a number of .factors:
- Inadequate data on maternal healthcare including late registration of pregnant women in Antenatal Clinics, to facilitate regular and reliable assessment of maternal mortality issues;
100
- Limited deployment of skilled health workers, supply of equipment, logistics, staff accommodation, transportation and ambulance services;
- Slow scaling up of maternal health services, particularly at district level, as well as investments in Community Health Planning Services and related primary health care infrastructure and systems within the context of the Ouagadougou Declaration;
- Ineffective referral system nationwide from communities to healthcare facilities, compounded by transport constraints (especially for women in labour);
- Unmet needs for emergency obstetric care services due mainly to inadequate basic reproductive health equipment, supplies and qualified personnel;
- Inadequate coverage of laboratory and blood transfusion services;
- Inadequate budgetary allocation for maternal and reproductive health services;
- Inadequate life-saving essential medicines and medical supplies;
- Low contraceptive use mainly due to socio-cultural believes and practices that do not promote contraception;
- Early marriage and child bearing resulting in high fertility rates; and and
- Poor nutrition among pregnant and lactating mothers
Universal Access to Sexual and Reproductive Health
I. Introduction
Family planning or contraception is a major determinant of fertility and a factor influencing population growth. It has been established that for the country to make progress in contraceptive prevalence, efforts must be stepped up and focused on the reproductive health of women through active sensitization and awareness-raising campaigns by both state and non-state actors on the benefits of family planning methods. Family planning is a vital indicator of the growth patterns of population. Therefore, access to sexual and reproductive health services, including contraceptives and HIV prevention and treatment, which are fundamental human rights that addresses the needs of adolescent will be emphasized during the plan period in partnership with other stakeholders such as CSOs and private sector actors.

101
Target 29: Provide universal access to reproductive health by 2020, including family
planning, sexual health and health care services in national strategies
Indicator
2013
2015
MDG
Target
2018
2019
2021
NDP
Target
1 Increase contraceptive prevalence Rate.
9%***
30.0%
16.8%*
12.6%**
25%
2 Reduce adolescent birth rate per 1000 women
24.9/1000
N/A
67/1000*
31/1000**
3 Increase Antenatal care coverage at least 1 to 4
98.9%
100.00%
99%*
100%**
.
4 Significantly reduce unmet needs for Family
Planning
24.9%
26.5%*
*MICS 2018; *** DHS, 2013; ** HMIS, 2019 Administrative record January to September.
Figure: 20. Contraceptive Prevalence Rate
Source: MICS 2018; DHS, 2013; & HMIS, 2019 Administrative record January to September
Key Factors that have Improved Access to Sexual and Reproductive Health
In recognition of the need to improve maternal health, several strategies recommended in the National Health Policy are being vigorously pursued such as the establishment of a minimum Reproductive and Child Health (RCH) package, increasing awareness on sexual, reproductive and child health issues and the improving the nutritional status of the vulnerable groups. Other strategies designed to improve maternal health include; a ‘National Reproductive Health Commodity Security Strategy’ (RHCS), which was implemented over the period 2014-2018, has also been developed with the aim of achieving universal access to reproductive health, promote reproductive rights and reduce maternal mortality by 50 percent by 2018. All these policies and strategies seek to address the inadequacies in the reproductive and child health services. In addition, a number of direct interventions have also been introduced by the government to improve maternal healthcare include the Implementation of free maternal health services; repositioning family planning and training; implementing a comprehensive Antenatal Clinic Programme in the regional and district healthcare facilities; providing specific training for health
9
16.812.6
25
0
10
20
30
2013 2018 2019 2020 2021
Per
cen
tage
Year
102
workers including midwives in safe motherhood skills, abortion care and lactation management; implementation of Emergency Obstetric and Neonatal Care (EmONC) in all regional health Centres; and ensuring care provided by skilled professionals during pregnancy and childbirth. Other strategies with a positive impact on improving access to reproductive health include:
- The provision incentives to communities and health facilities through the Maternal
Child Nutrition Health Result Project (MCNHRP) for early registration of antenatal
women during their first trimester has improve on the coverage of ante natal
attendance in the project regions; and
- The procurement of maternal health indicators (number of women accepting family
planning services) from health facilities through the MCNHRP has significantly
increase the contraceptive rate in the project regions.
Key Factors that have Challenged Access to Sexual and Reproductive Health
Notwithstanding the gains registered in the health sector, progress towards improving access to sexual and reproductive health continue to be impeded by several factors related to both the health services and non-health related factors which include:
- Inadequate coverage of laboratory and blood transfusion services; - inadequate budgetary allocation for maternal and reproductive health services; - Inadequate life-saving essential medicines and medical supplies; - low contraceptive used mainly due to socio-cultural believes and practices; - early marriage and child bearing resulting in high fertility rates and poor nutrition
among pregnant and lactating mothers
Reduce the spread of HIV/AIDS & the incidence of Malaria & other diseases
I. Introduction
During the early stages of the appearance of HIV/AIDS in The Gambia, the preferred strategy to combat its spread was centered on Information Education and Communication (IEC) with the assumption that an effective IEC programme will eventually result in the control and stabilization of the epidemic. As it became evident that a wide gap still exists between awareness and compliance, government decided to modify the approach by combining IEC with additional focus on treatment, care and support through Voluntary Counselling and Testing (VCT), PMTCT and Anti-Retroviral (ARV) provision to curb the prevalence rate. In this respect, Behavioural Change Communication (BCC) was adopted and continues to gain prominence. It is also important to note that data is also critical to generating evidence-based decisions, policies and plans on the effective management of the HIV/AIDS epidemic. However, until recently, the only available source of data on the country’s HIV/AIDS situation is from sentinel surveillances and clinical records from urban and peri-urban areas. As a result, the information
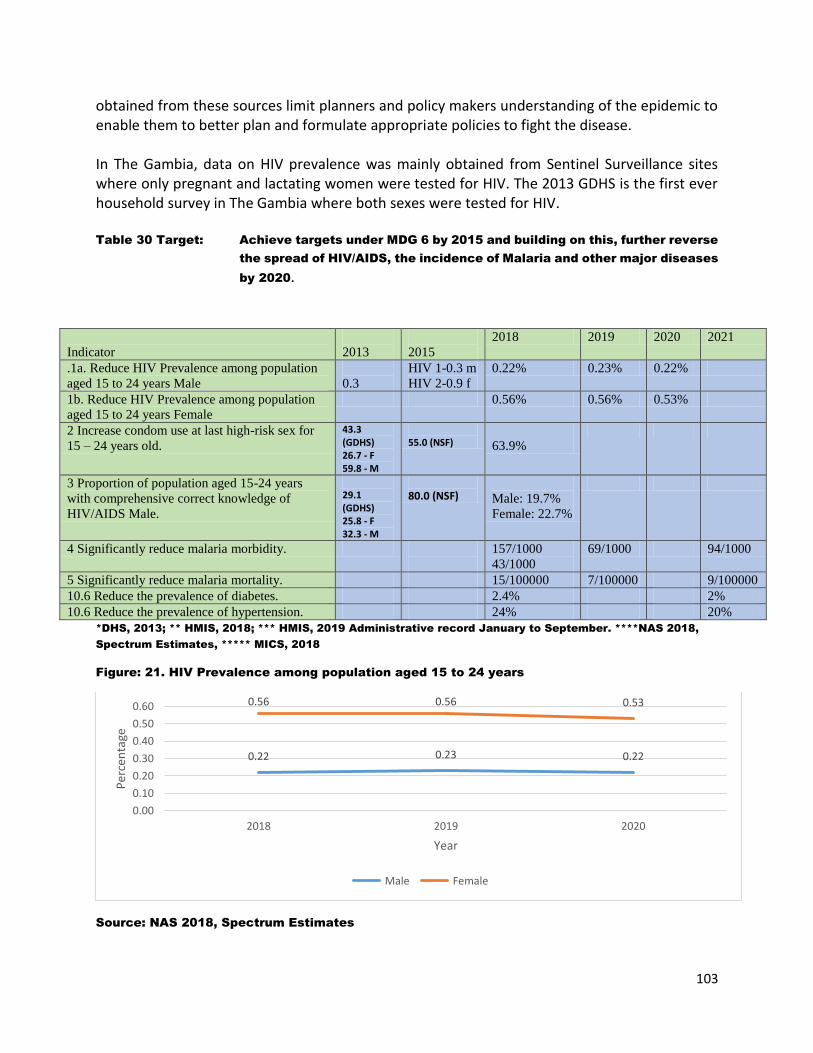
103
obtained from these sources limit planners and policy makers understanding of the epidemic to enable them to better plan and formulate appropriate policies to fight the disease. In The Gambia, data on HIV prevalence was mainly obtained from Sentinel Surveillance sites where only pregnant and lactating women were tested for HIV. The 2013 GDHS is the first ever household survey in The Gambia where both sexes were tested for HIV.
Table 30 Target: Achieve targets under MDG 6 by 2015 and building on this, further reverse
the spread of HIV/AIDS, the incidence of Malaria and other major diseases
by 2020.
Indicator
2013
2015
2018 2019 2020 2021
.1a. Reduce HIV Prevalence among population
aged 15 to 24 years Male
0.3
HIV 1-0.3 m
HIV 2-0.9 f
0.22% 0.23% 0.22%
1b. Reduce HIV Prevalence among population
aged 15 to 24 years Female
0.56% 0.56% 0.53%
2 Increase condom use at last high-risk sex for
15 – 24 years old.
43.3 (GDHS) 26.7 - F 59.8 - M
55.0 (NSF)
63.9%
3 Proportion of population aged 15-24 years
with comprehensive correct knowledge of
HIV/AIDS Male.
29.1 (GDHS) 25.8 - F 32.3 - M
80.0 (NSF)
Male: 19.7%
Female: 22.7%
4 Significantly reduce malaria morbidity.
157/1000
43/1000
69/1000 94/1000
5 Significantly reduce malaria mortality. 15/100000 7/100000 9/100000
10.6 Reduce the prevalence of diabetes. 2.4% 2%
10.6 Reduce the prevalence of hypertension. 24% 20%
*DHS, 2013; ** HMIS, 2018; *** HMIS, 2019 Administrative record January to September. ****NAS 2018,
Spectrum Estimates, ***** MICS, 2018
Figure: 21. HIV Prevalence among population aged 15 to 24 years
Source: NAS 2018, Spectrum Estimates
0.22 0.23 0.22
0.56 0.56 0.53
0.00
0.10
0.20
0.30
0.40
0.50
0.60
2018 2019 2020
Per
cen
tage
Year
Male Female
104
Key Factors Contributing to Progress in Reducing HIV /Malaria/TB Prevalence
The national policy guidelines on HIV/AIDS management developed in 1995 were revised to cover the period 2007-2011 with the goal of providing a framework for action to stabilise and reduce the prevalence of HIV/AIDS in The Gambia. To buttress support for the national efforts, The Global Fund against Tuberculosis and Malaria (GFATM) round 8 funding for HIV/AIDS was secured in 2008 with the aim of accelerating access to HIV/AIDS prevention, treatment, care and support services and to facilitate the implementation of the National Strategic framework for managing the HIV/AIDS epidemic in a multi-sectoral and inclusive approach. The Framework was revised and updated for implementation from 2009 to 2014. In addition, the Programme for Accelerated Growth and Employment (PAGE) which is implemented from 2012 to 2015 and extended to 2016 highlights 3 key HIV intervention areas designed to contribute to the national crusade against HIV/AIDS and include: (1) build capacity of staff in HIV research, Monitoring and Evaluation (M&E) and surveillance; (2) conduct HIV population survey (male and female) aged 15-49 years; and (3) conduct gender analysis study of male and female vulnerability (children, adolescents, adults) to HIV/AIDS . Within the framework of the SDG-aligned National Development Plan (2018-2021) series of programme interventions have been initiated and implemented which led to an intensification of sensitization on HIV/AIDS/STIs; research on the pandemic; the promotion and distribution of condoms alongside education on abstinence; providing nutritional support for People Living with HIV/AIDS (PLHIVs); improvements in blood transfusion and storage and targeting of vulnerable groups; practicing safe sex, especially among the most vulnerable; reducing mother-to-child transmission; promoting voluntary counselling and testing; increasing use of ART for PLHIV; strengthening referrals and collaboration between facilities and communities to increase ART uptake and adherence. Furthermore, Global Fund dedication to HIV serves as a rallying point for HIV programming and financing; and intensified campaign by United Nations System Agencies, other multilateral and bilateral development partners, NGOs and CSOs against stigmatisation and discrimination are some of the measures being undertaken by all stakeholders to contain the spread of the disease.
Other factors that have also contributed to progress made in combatting the spread of HIV/AIDs and managing then situation for those already infected include: The implementation of sound and effective policies and strategies to combat Malaria, HIV/AIDS
and Tuberculosis has significantly reduced the burden of the three diseases through the financial
and technical support of the Global Fund;
Strengthening of the laboratory services for appropriate diagnoses of the three diseases and
other conditions has significantly helped in confirmation and appropriate case management; and
105
Health promotion strategies are developed to create community sensitization and awareness
programmes aimed at reducing the burden of the communicable diseases.
Key Factors Challenging Progress in Reducing the Prevalence of HIV/ Malaria
and Tuberculosis
Notwithstanding gains made in awareness creation towards the prevention and treatment of HV/AIDS, Malaria and Tuberculosis, the country continues to be faced with challenges in the fight against this pandemic. These challenges include among others: Funding challenge
Dwindling resources from development partners is making it increasingly difficult for the country to meet the financial requirements for the national response to the pandemic. Nutrition Support for PLHIV
Limited availability of funds for the procurement of supplementary food for PLHIV and the increase in the number of people living with the disease has continued to be a challenge.
Support to Orphans and Vulnerable Children (OVC)
Interventions aimed at providing support to orphans and vulnerable children (OVC) are increasingly finding it difficult to cope with the funding needs of these group. Early Infant Diagnosis
The primary goal of early infant diagnosis is to identify the HIV-infected child during the first months of life prior to the development of clinical disease. It provides a critical opportunity to strengthen follow-up of HIV-exposed children, assure early access to ARV treatment for infected children and provide reassuring information to families. Attitude and Behaviour Change
Despite concerted national efforts aimed at increasing awareness on HIV/AIDS, there continues to exist gaps in levels of knowledge about the pandemic. These gaps continue to be evident in the persistence of stigma and discrimination against PLHIV. Other challenges relating to the three include amongst others:
- The use of bed nets has proven to be quite effective in the prevention of malaria. However, despite continuous sensitization on the need to use such nets, coverage continue to be below set targets, especially in urban areas where mosquitoes can be found throughout the year. Access to ITN has improve significantly. However, the utilization remains a major challenge.
- Poor sanitation habits of many city dwellers, inadequate waste disposal nationwide, poor drainage systems in the key growth Centres and weak coordination of waste management system provide breeding ground for mosquitoes;
106
- Inadequate laboratory services (staff, equipment, consumable and supplies) for the diagnosis of the diseases; and
- Lack of appropriate health promotion interventions and strategies aimed at reducing the burden of non-communicable diseases.
Recommendations for Actions Needed to Further Progress in Population and
Health Care Delivery
- Provide adequate laboratory services (staff, equipment, consumable and supplies) to
all the public health facilities;
- Develop and implement effective health promotion interventions to reduce the
burden of non-communicable disease;
- Institutionalized “Kabilo Bama Initiatives” across all the communities in the country;
- Institutionalized men involvement in reproductive and child health services;
- Develop strategies to improve and strengthen gains made in maternal health services;
- Enforce the children’s Act to prevent/ reduce child marriage in the country; and
- Provision of free and universal access to quality maternal health services.
Government Contributions to Strengthening Population & Health Care Delivery
- The national health policy (2012 - 2020) and the national health sector strategic plan
(2012 - 2020) calls for an integrated approach to reproductive, maternal, neonatal,
child and adolescent health services;
- Introduced youth friendly reproductive health environments in the health facilities;
- Introduced universal access to maternal health care and social insurance scheme;
- Increased access to health services through establishing more community health
clinics, reproductive and child health outreach clinics and primary health care villages;
- The Ministry of Health has institutionalized quarterly quality assessment of the public
health facilities aimed at improving quality of health service provision;
- A Medical and Dental Council has been established to regulate medical practice and
standards in the Gambia;
107
- A Nursing and Midwifery Council has been established to regulate nursing and
midwifery practice and standards in the Gambia;
- A Public Health Council has been established to regulate public health practice and
standards in the Gambia;
- A Pharmacy Council has been established to regulate pharmacy practice and
standards in the Gambia; and
- The 15% Abuja Declaration of the national budget to health has never been achieved
Key Challenges in Improving the Quality of Population and Health Care Delivery
The out of pocket expenditure for health is very high, impacting negatively on the population
hence pushing majority of the population into poverty and depriving them access to quality
health services;
No special incentives have been provided by the government for the health workers except the
one introduced by the MCNHRP where the project provide incentives through buying agreed
indicators for the health facilities in the project regions. Sixty percent of the monies are invested
in the health facilities through maintenance work, procurement of medicines, equipment,
salaries for contracted staff and construction of staff quarters. Whereas the remaining forty
percent are shared among the staff of the health facilities;
The goal of the national health policy 2012 - 2020 and national health sector strategic plan 2012
- 2020 is to reduce morbidity and mortality to contribute significantly to quality of life in the
population. Although morbidity and mortality rates due to communicable diseases have
decreased over the years but they became more pronounced in non-communicable diseases
especially among youths and women.
In addition, the main factors contributing to this high morbidity in the population include social
determinants and related factors such as poverty, unhealthy environment, unsafe working
conditions, poor sanitation, poor nutrition, road traffic accidents, poor access to safe water and
poor housing for many. The main causes of mortality on the other hand within the population
are: Malaria, Pneumonia, Anaemia, Diarrhoeal Diseases, road traffic accidents, pregnancy
complications and Cardiovascular Diseases. Of increasing concern are the incidences of
Tuberculosis and HIV/AIDS in the population.
Contributions of Development Partners in Population & Health Care Delivery
The Global Fund has been supporting in the procurement and distribution of anti-malaria, ARVs,
and Tuberculosis medicines as well as antibiotics and laboratory materials for the Health Ministry
The GAVI has been investing in immunization services and health system strengthening;
108
World Health Organization has been providing technical and financial support to improve quality
health services;
UNFPA has been providing technical and financial support for reproductive, maternal, neonatal,
child and adolescent health services;
UNICEF has been supporting maternal and child health services including child protection;
World Bank, African Development Bank and Islamic Development Bank has been providing grants
and loans to support and improve quality health service development;
.University of Oslo has been supporting the Ministry of Health through providing technical
support in the management of the national health information system (DHIS2) database;
The West African Health Organization has been providing technical support for capacity building
of the national health information system;
The Shifo Foundation has been supporting the Immunization programme with Smart Paper
Technology to improve the quality of the Immunization data; and
The UNFPA has been supporting the National Pharmaceutical Services to improve data quality of
the Logistic Management Information System.
Box 2: Best Practice Case: “ Kabilo Bama Initiatives”
“Kabilo Bama Initiative” is a strategy developed by the Ministry of Health, with the objective to improve maternal and child health services at the community level. The strategy involved identifying elderly women in the communities who would be trained on quality maternal, neonatal, child and adolescent health care. After the training, these elderly women would provide counselling and health promotion services to the women in the communities. They would advise young women on early ante natal registration, identification of danger signs in pregnancy, immunization schedule for children, engaging men to support maternal and child health services as well as providing social and financial support to improve maternal, neonatal, child and adolescent health services. Since its adoption, men involvement in maternal, neonatal, child and adolescent health services has improved significantly in the communities
References of Documents Consulted
(i) Health Management Information System. 2018./2019 Health Services Statistics
Report. Banjul, The Gambia. Ministry of Health;
(ii) National Nutrition Agency. 2019. The Gambia National Nutrition Surveillance
Programme Report, 67th Edition February / March 2019. National Nutrition Agency,
(iii) The Gambia Bureau of Statistics. 2019. MICS(2018); DHS (2013)
(iv) National AIDS Secretariat, 2018. Spectrum Estimate for the prevalence of AIDS. Banjul,
109
III.2.3. YOUTH DEVELOPMENT AND EMPOWERMENT
I.Introduction
The Gambia remains on the list of least developed countries. It has a small economy that relies
primarily on agriculture, tourism, and remittances. While about 60% of the population is under
the age of 25 years, there are high levels of youth unemployment and underemployment. Poverty
and a lack of employment opportunities are among the major reasons driving an increasing
number of people to leave the country.
Irregular migration flows to Europe – commonly known as ‘taking the backway’ – are putting
Gambians at risk and harming the country’s social cohesion and economy. In spite of its
comparatively small population of 1.9 million people, The Gambia is among the countries with
the highest numbers of irregular migrants and tops the list on a per-capita basis. To address the
migration movement, more jobs and opportunities need to be created at home.
Despite substantial improvements in access to basic education and steady economic growth, The
Gambia still faces considerable challenges in respect to reducing poverty. As the result of its
narrow economic base and its reduced internal market, the country will continue to rely heavily
on the productivity of its citizens to reverse the cycle that keeps families in poverty generation
after generation. Poverty reduction is a complex equation that involves improvements in job
creation, especially for high-skilled and productive employment, as well as improvements in
human capital levels to ensure that citizens are able to take advantage of employment
opportunities.
Currently, however, low human capital levels greatly limit the productivity and employment
outcomes of the population, as evidenced by the fact that a majority continues to work in
subsistence agriculture, especially in rural areas. Nearly 60 percent of the poor in The Gambia
are under the age of 20 years. Youth face significant challenges with respect to employment
outcomes, such as a very difficult transition from school to work and very low levels of education
and training.
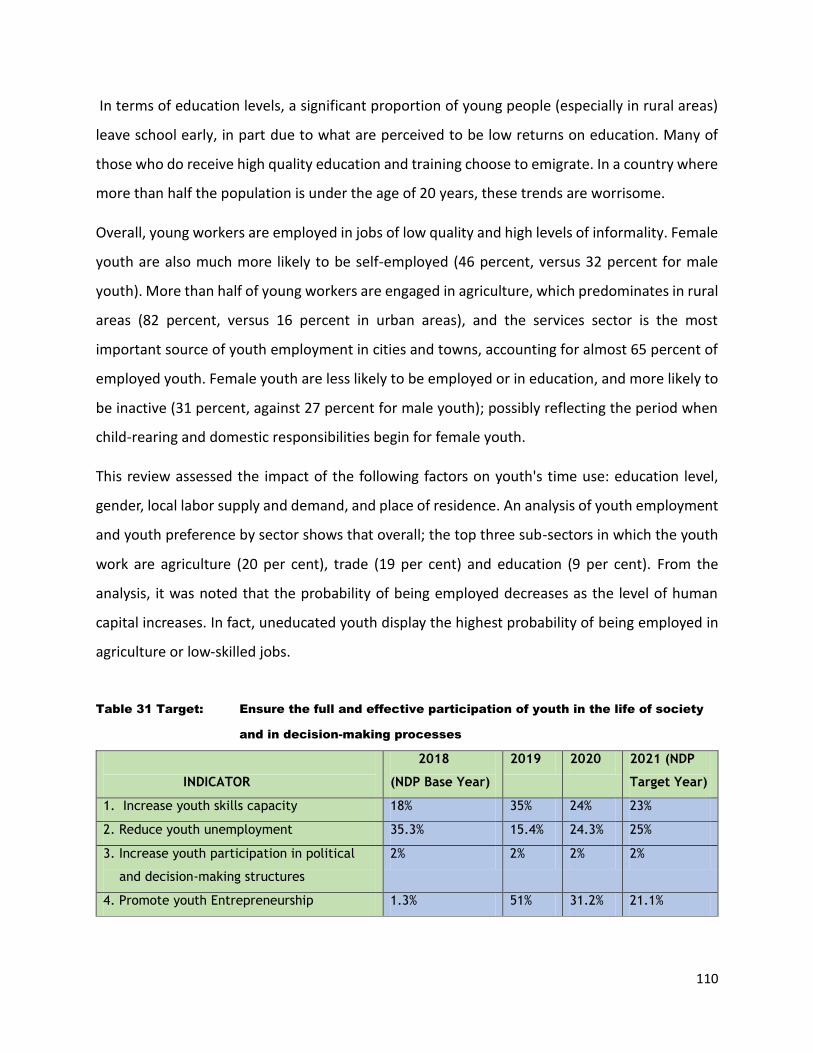
110
In terms of education levels, a significant proportion of young people (especially in rural areas)
leave school early, in part due to what are perceived to be low returns on education. Many of
those who do receive high quality education and training choose to emigrate. In a country where
more than half the population is under the age of 20 years, these trends are worrisome.
Overall, young workers are employed in jobs of low quality and high levels of informality. Female
youth are also much more likely to be self-employed (46 percent, versus 32 percent for male
youth). More than half of young workers are engaged in agriculture, which predominates in rural
areas (82 percent, versus 16 percent in urban areas), and the services sector is the most
important source of youth employment in cities and towns, accounting for almost 65 percent of
employed youth. Female youth are less likely to be employed or in education, and more likely to
be inactive (31 percent, against 27 percent for male youth); possibly reflecting the period when
child-rearing and domestic responsibilities begin for female youth.
This review assessed the impact of the following factors on youth's time use: education level,
gender, local labor supply and demand, and place of residence. An analysis of youth employment
and youth preference by sector shows that overall; the top three sub-sectors in which the youth
work are agriculture (20 per cent), trade (19 per cent) and education (9 per cent). From the
analysis, it was noted that the probability of being employed decreases as the level of human
capital increases. In fact, uneducated youth display the highest probability of being employed in
agriculture or low-skilled jobs.
Table 31 Target: Ensure the full and effective participation of youth in the life of society
and in decision-making processes
INDICATOR
2018
(NDP Base Year)
2019 2020 2021 (NDP
Target Year)
1. Increase youth skills capacity 18% 35% 24% 23%
2. Reduce youth unemployment 35.3% 15.4% 24.3% 25%
3. Increase youth participation in political
and decision-making structures
2% 2% 2% 2%
4. Promote youth Entrepreneurship 1.3% 51% 31.2% 21.1%
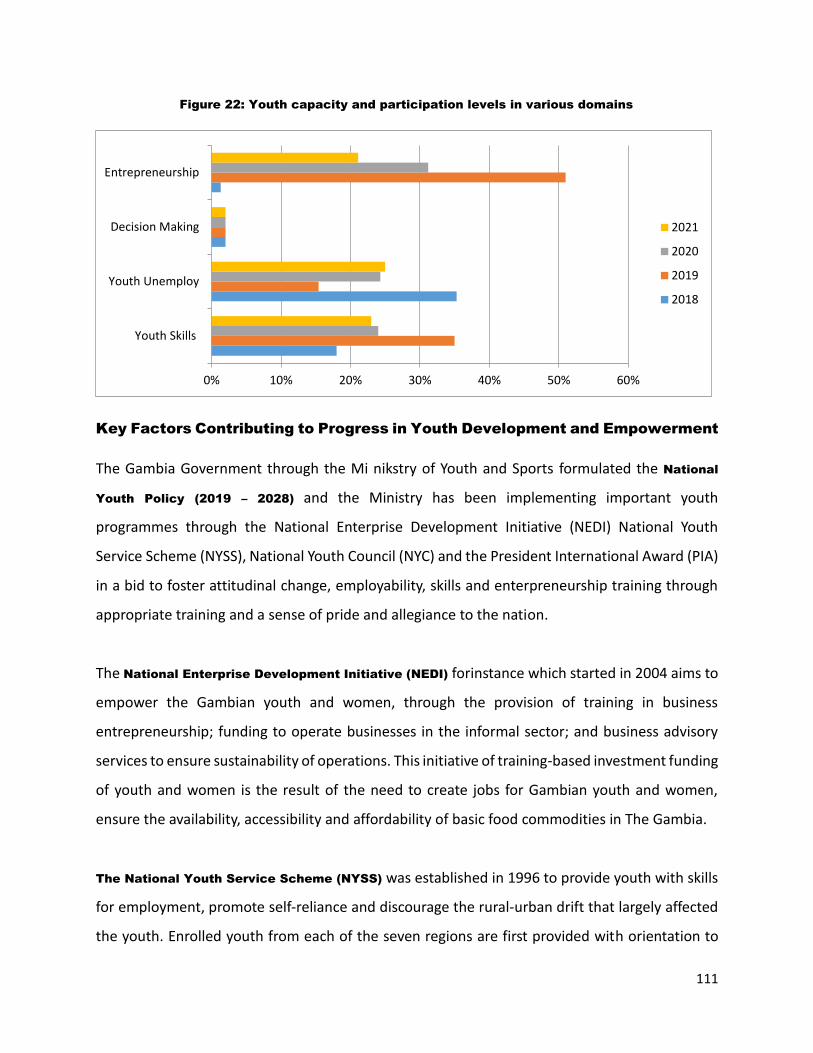
111
Figure 22: Youth capacity and participation levels in various domains
Key Factors Contributing to Progress in Youth Development and Empowerment
The Gambia Government through the Mi nikstry of Youth and Sports formulated the National
Youth Policy (2019 – 2028) and the Ministry has been implementing important youth
programmes through the National Enterprise Development Initiative (NEDI) National Youth
Service Scheme (NYSS), National Youth Council (NYC) and the President International Award (PIA)
in a bid to foster attitudinal change, employability, skills and enterpreneurship training through
appropriate training and a sense of pride and allegiance to the nation.
The National Enterprise Development Initiative (NEDI) forinstance which started in 2004 aims to
empower the Gambian youth and women, through the provision of training in business
entrepreneurship; funding to operate businesses in the informal sector; and business advisory
services to ensure sustainability of operations. This initiative of training-based investment funding
of youth and women is the result of the need to create jobs for Gambian youth and women,
ensure the availability, accessibility and affordability of basic food commodities in The Gambia.
The National Youth Service Scheme (NYSS) was established in 1996 to provide youth with skills
for employment, promote self-reliance and discourage the rural-urban drift that largely affected
the youth. Enrolled youth from each of the seven regions are first provided with orientation to
0% 10% 20% 30% 40% 50% 60%
Youth Skills
Youth Unemploy
Decision Making
Entrepreneurship
2021
2020
2019
2018
112
build their self-esteem and leadership abilities, and then exposed to various types of occupation
from which they chose a specialization. The scheme also introduced an apprenticeship program
in 2002, taking in youth with low levels of prior education.
The National Youth Council (NYC) was formed by an Act of Parliament to empower youths
through: cconducting research on youth development; monitoring the implementation of the
National Youth Policy and decisions of the National Youth Conference; mobilising resources for
youth development; working closely with charitable organisations involved in youth related work
or activities; organising youth conferences and festivals; promoting networking with other
national youth bodies and youth organisations abroad; planning and implementing national
youth programmes; maintaining a databank on youth organisations and activities in the country;
registering national youth organisations; determining the fees for the registration of youth
organisations; supervising and coordinating the activities of Regional Youth Committees; and
carrying out such other functions that may be desired in furtherance of the objectives of the
Council
The President’s International Award Scheme (PIA) started operations in The Gambia in 1979 and
ssince its inception, it has challenged young people aged 14 -25 years to discover hidden
potentials and transform them into productive life and livelihood skills. It provides a balanced
progressive programme of extracurricular activities for young people throughout the world. It
has four mandatory sections namely; Service, Skills and interest, physical recreation and
adventurous journeys divided into three different levels of Awards namely; Bronze, Silver and
Gold. The Award programme has an added value by providing livelihood skills training to young
people as a means for employment creation, one of The Gambia’s challenges to young people,
particularly those who cannot take advantage of higher educational opportunities. This
programme provides livelihood skills in carpentry, welding, electrical installation, home
management, secretariat duties, and computer technology and business studies; including basic
maths and English to enhance their writing skills. The other component is the apprentice training
programme for none schooled young people, which run for three years. However, the Award is
113
still not able to cover the length and breathe of The Gambia. It has started its decentralisation
programme by establishing a regional skills training centres in Kerewan North Bank Region. It is
hoped that similar programmes will be established in other regions within The Gambia.
Key Factors Challenging Progress in Youth Development and Empowerment
The aforesaid achievement s made in youth development and empowerment, the youth sector
is still confronted with challenges that require regular and systematic support from government
and other development partners and society at large and some of these challenges include:
- Women and girls continue to be disadvantaged because of socio-cultural norms and
practices as well as discriminatory provisions in customary law. In 2014, the Gambia
ranked 143 of 155 countries on the gender equality index, despite the closure of the
gender gap in primary education;
- Informal sector is the largest employer, receives limited or no direct support from
government;
- The potential of girls aged 15-19 years is hampered by early marriage (23.8 per cent),
with 18 per cent giving birth, resulting in forced departures from school, despite laws
prohibiting the withdrawal of girls for the purpose of marriage;
- The national HIV prevalence rate is 1.9 per cent. HIV prevalence among the youth
15-24 years is 0.3%. The prevalence was higher among young women (0.4%) than
young men 0.2% (DHS+, 2013). The same study shows that about 8% had sex before
the age of 15. BSS 2012 shows that knowledge on HIV prevention methods among 15-
24 is 57% for males and 47% for females;
- It was observed that the more educated the youth are the more they tend to turn
their back on agriculture. Agriculture sector faces many challenges including high
dependence on erratic rainfall and low productivity.
114
- The majority of youths (42.6%), particularly those living in rural areas (46.5%) and
females (48.3%), are concerned that they cannot find jobs because they are
inadequately trained;
- Private enterprise faces a number of constraints which limit their ability to expand
and generate significant employment for the youth.
Recommendations to Accelerate Progress in Youth Development and Empowerment
In-depth studies should be conducted on the state of employment in the country at
regular intervals to generate the required data for informed policy making and monitoring
of development outcomes particularly on youth employment;
Planning units in the ministries, departments and agencies of government work closely
with the Gambia Bureau of Statistics to regularly update their human resources database;
Adequately resource and equip education and training institutions to address capacity
related constraints that prevent them from effectively delivering on their mandates;
Build effective labour market institutions and systems including strengthening the
Department of Labour, for information dissemination and job-matching on youth;
Advocacy efforts should be intensified to make the youth understand that agriculture is a
business just like any other and not an activity meant for the uneducated;
Appropriate incentive scheme including capital grants, subsidized loans, business advisory
services, entrepreneurship training and mentorship should be provided for youth that
take up agriculture to help them better establish and grow their business;
115
Coordination between the Ministry of Youth and Sports and the Ministry of Trade,
Industry, Regional Integration and Employment; Ministry of Higher Education, Research,
Science and Technology, Ministry of Tourism & Culture and Ministry of Basic & Secondary
Education be strengthened to ensure harmonized policy formulation and implementation,
and better employment outcomes for the youth. In this regard, the Inter-Ministerial
Taskforce on Youth Programmes recently established by Cabinet under the Ministry of
Youth and Sports is a good platform for such cooperation.
. REFERENCES OF DOCUMENTS CONSULTED:
(i) The National Youth Policy and Strategic Plan (2019 – 2028)
(ii) Youth Employment and Skills Development in The Gambia: ((2011)
(iii) National Human Development Report: Youth Employment (2014)
(iv) Gambia Labour Force Survey (2018)
(v) Youth Empowerment Project (2017 – 2021)
(vi) Strategic Plan (2015 – 2019) of The Ministry of Youth and Sports, The Gambia;
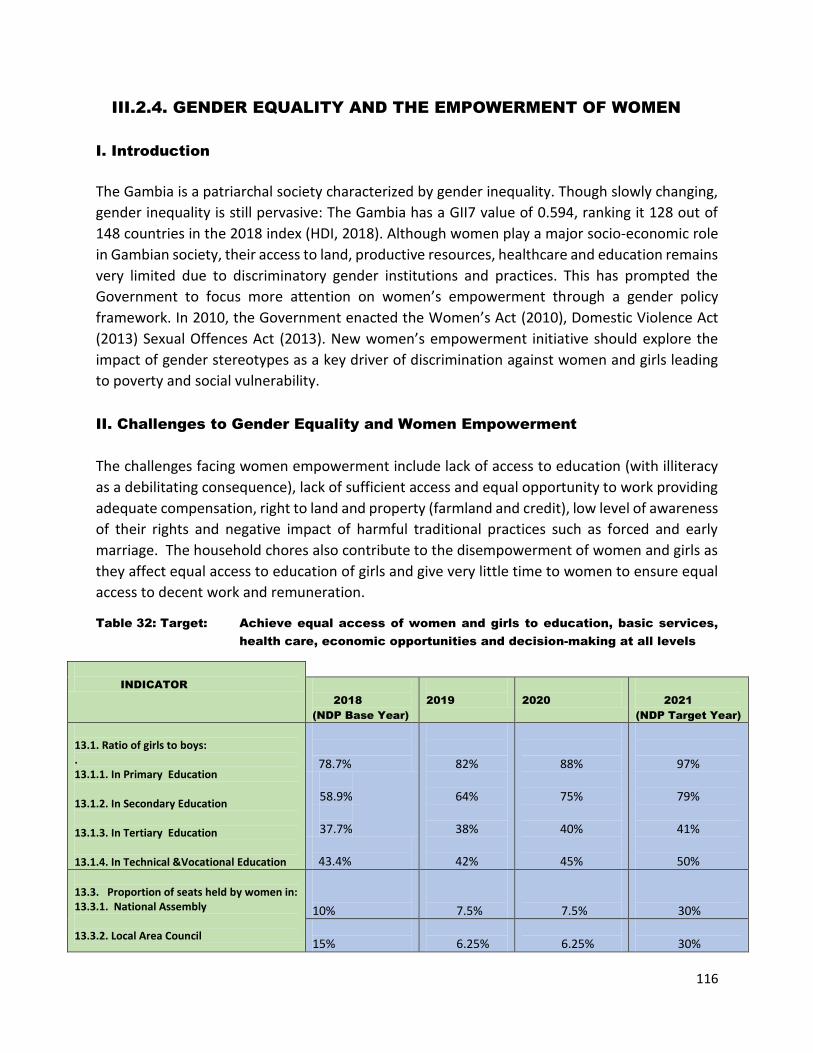
116
III.2.4. GENDER EQUALITY AND THE EMPOWERMENT OF WOMEN
I. Introduction
The Gambia is a patriarchal society characterized by gender inequality. Though slowly changing,
gender inequality is still pervasive: The Gambia has a GII7 value of 0.594, ranking it 128 out of
148 countries in the 2018 index (HDI, 2018). Although women play a major socio-economic role
in Gambian society, their access to land, productive resources, healthcare and education remains
very limited due to discriminatory gender institutions and practices. This has prompted the
Government to focus more attention on women’s empowerment through a gender policy
framework. In 2010, the Government enacted the Women’s Act (2010), Domestic Violence Act
(2013) Sexual Offences Act (2013). New women’s empowerment initiative should explore the
impact of gender stereotypes as a key driver of discrimination against women and girls leading
to poverty and social vulnerability.
II. Challenges to Gender Equality and Women Empowerment
The challenges facing women empowerment include lack of access to education (with illiteracy
as a debilitating consequence), lack of sufficient access and equal opportunity to work providing
adequate compensation, right to land and property (farmland and credit), low level of awareness
of their rights and negative impact of harmful traditional practices such as forced and early
marriage. The household chores also contribute to the disempowerment of women and girls as
they affect equal access to education of girls and give very little time to women to ensure equal
access to decent work and remuneration.
Table 32: Target: Achieve equal access of women and girls to education, basic services,
health care, economic opportunities and decision-making at all levels
INDICATOR
2018
(NDP Base Year)
2019
2020
2021
(NDP Target Year)
13.1. Ratio of girls to boys: . 13.1.1. In Primary Education 13.1.2. In Secondary Education 13.1.3. In Tertiary Education 13.1.4. In Technical &Vocational Education
78.7%
58.9% 37.7%
43.4%
82%
64%
38%
42%
88%
75%
40%
45%
97%
79%
41%
50% 13.3. Proportion of seats held by women in: 13.3.1. National Assembly 13.3.2. Local Area Council
10%
7.5%
7.5%
30%
15%
6.25%
6.25%
30%

117
To address these challenges, it is imperative to guarantee equal access to land and credit for
women; continuing the awareness raising; providing labour saving devices and protect and
promote equal access to education for girls. Priority actions include the provision of credit
facilities for women, supply of labour saving devices and put in place mechanisms that guarantee
equal participation in decision –making
Ratio of Girls to Boys in Primary, Secondary and Tertiary Education
The Gambia made advances in realizing the SDG targets on education but significant challenges
remain. Under the new national development plan, government will prioritize further
investments to develop the country’s human capital through ensuring quality health and
education, and making basic social services accessible and affordable to all and improving social
and child protection systems for the most vulnerable.
This includes (i) enhancing access to early childhood education, (ii) improving quality learning,
with special emphasis on Science, Technology, Engineering and Mathematics (STEM), Health,
Agriculture and special needs at the basic, post-secondary/tertiary and higher education levels,
promote TVET and other skills enhancing initiatives to match the job market; and (iii) take
measures to enhance access to non-formal education in order to build a more skilled and
productive work force. Goal 4. Ensure inclusive and equitable quality education and promote
lifelong learning opportunities for all.
Table 33: Ratio of Girls to Boys in Primary, Secondary and Tertiary Education
Source: Education Management Information System (EMIS), MoBSE, The Gambia
2010 2011 2012 2013 2014 2015 2016 2017
Grade 6
M 73.3% 71.2% 73.8% 73.3% 73.3% 72.8% 74.7% 77.4%
F 73.9% 70.5% 71.1% 73.4% 73.6% 74.4% 76.0% 80.0%
Both 73.6% 70.9% 72.4% 73.4% 73.4% 73.6% 75.4% 78.7%
Grade 9
M 62.7% 64.7% 65.1% 66.3% 66.0% 66.0% 60.8% 57.5%
F 56.3% 62.0% 64.2% 63.2% 63.3% 63.5% 61.2% 60.2%
Both 59.5% 63.3% 64.7% 64.8% 64.6% 64.7% 61.0% 58.9%
Grade 12
M 31.4% 32.1% 34.1% 33.9% 37.0% 36.4% 37.1% 37.7%
F 56.3% 62.0% 64.2% 63.2% 63.3% 63.5% 61.2% 60.2%
Both 59.5% 63.3% 64.7% 64.8% 64.6% 64.7% 61.0% 58.9%
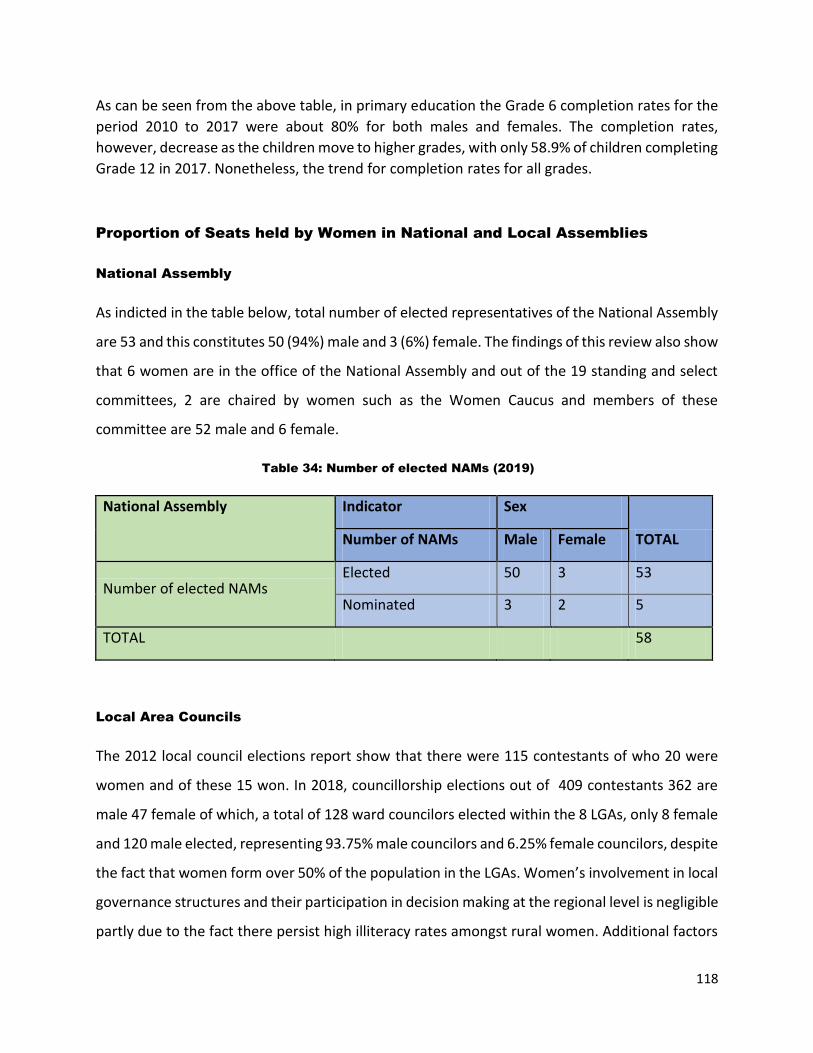
118
As can be seen from the above table, in primary education the Grade 6 completion rates for the
period 2010 to 2017 were about 80% for both males and females. The completion rates,
however, decrease as the children move to higher grades, with only 58.9% of children completing
Grade 12 in 2017. Nonetheless, the trend for completion rates for all grades.
Proportion of Seats held by Women in National and Local Assemblies
National Assembly
As indicted in the table below, total number of elected representatives of the National Assembly
are 53 and this constitutes 50 (94%) male and 3 (6%) female. The findings of this review also show
that 6 women are in the office of the National Assembly and out of the 19 standing and select
committees, 2 are chaired by women such as the Women Caucus and members of these
committee are 52 male and 6 female.
Table 34: Number of elected NAMs (2019)
National Assembly Indicator Sex
TOTAL Number of NAMs Male Female
Number of elected NAMs Elected 50 3 53
Nominated 3 2 5
TOTAL 58
Local Area Councils
The 2012 local council elections report show that there were 115 contestants of who 20 were
women and of these 15 won. In 2018, councillorship elections out of 409 contestants 362 are
male 47 female of which, a total of 128 ward councilors elected within the 8 LGAs, only 8 female
and 120 male elected, representing 93.75% male councilors and 6.25% female councilors, despite
the fact that women form over 50% of the population in the LGAs. Women’s involvement in local
governance structures and their participation in decision making at the regional level is negligible
partly due to the fact there persist high illiteracy rates amongst rural women. Additional factors
119
that contribute to the limited women’s involvement of in decision-making processes are cultural
and traditional factors; some women do not possess the confidence to attempt governance or
decision making.
Factors Hindering Women’s Political Participation
Political
The lack of political skills, education, and experience serve as formidable obstacles to women’s
political participation and representation. Lack of the requisite quality expertise and political
knowledge naturally affects the self-confidence and esteem of women, therefore their inferiority
complex. The advantages that men have in access to both education and the print media (and to a
lesser extent to the news on the radio) go part way toward elucidating why they are cognitively
better ready to involve in political life. In Gambia, men and women have get hold of approximately
equal access to the important resource of education, as it has one of the slightest gender gaps in
participation. This offers further support for the theory that political education, in fact, plays an
essential role in explaining the gender gap in political activism.
Socio-Cultural
Socio cultural barriers included religion, negative attitudes towards women in politics and the fact
that women too easily give up leadership in favour of men. Stereotyping of men and women create
the impression that men are superior and women inferior. This is borne by the fact that when there
is a divorce, the men take the boys and all the assets acquired during the marriage leaving women
and their daughters with nothing.
Women in Africa involved in politics face a variety of social and cultural barriers that significantly
hinders their effective participation. These are manifested in the form of misconceived socio-
cultural beliefs, prejudices and stereotypes which are male-dominated. These beliefs strengthen
cultural values, practices, and structures that pin down women to specific traditional gender roles
and family responsibilities. Society fore-mostly sees women as primary caregivers.
Economic
Lack of resources was identified as a constraint in women’s bid for political power. The number
of key respondents who cited this as a constraint is not very significant. Men control the land;
120
women can only access it if they get permission from the male head of the family. Their lack of
control of land could be the reasons that they engage in horticulture and rice cultivation. Land in
traditional society confers honor and respect and could be used to command loyalty. Governance
is increasingly becoming commercialised and costly. Money is required to participate in politics
and decision making positions at all levels. However, lack of education and access to resources by
women serve as great hindrances.
Socio-Cultural, Religious and Historical Determinants
Religion has often been used as an excuse to suppress women, but the CEDAW Committee on the
1st, 2nd & 3rd reports on the Gambia said: “Religion is not an obstacle to gender equality AND
cultural inhibitions limit women experience or exposure outside the private sphere. These flaws
can be found in various cultural and religious taboos. For example, in Gambia, even the few
women that are educated find it difficult to join politics, because most men will not allow their
wives to join politics. Women in the politics are deemed to be free or loose. Competing and being
a leader often involves travel, spending nights away from home, going to bars to reach people, and
meeting men, all of which put women politicians at risk of being thought of as free. Neither their
husbands nor their male relations have surrendered to the changes ushered in by the era of gender
equality promotion.
Power Dynamics between Women
Patriarchal politics entails the belief that the man is the 'natural' head of household, and that this
decision-making role naturally extends to the public domain of national politics. It is a
manifestation and institutionalization of male dominance over women and children in the family
and the extension of male dominance over women in society in general. In The Gambia, men
overwhelmingly dominate the political landscape. They define and formulate the political games.
They head all major political parties in The Gambia, so they get to decide who should make it to
parliament or local government council.
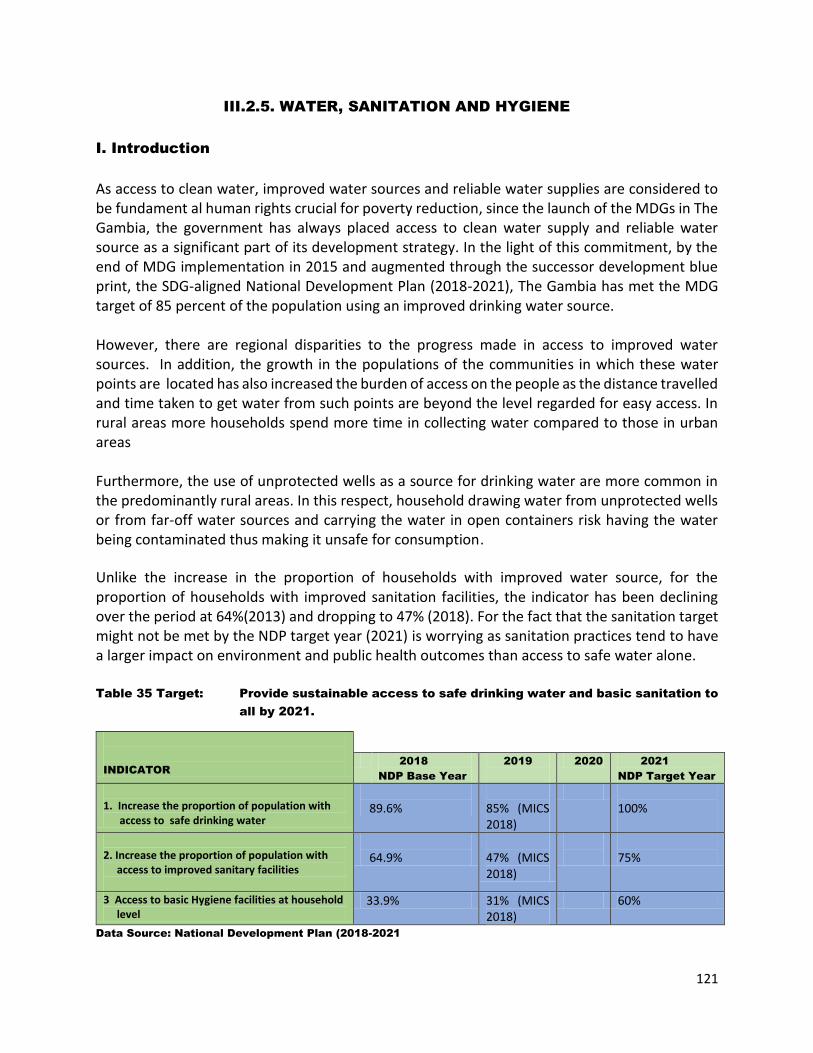
121
III.2.5. WATER, SANITATION AND HYGIENE
I. Introduction
As access to clean water, improved water sources and reliable water supplies are considered to be fundament al human rights crucial for poverty reduction, since the launch of the MDGs in The Gambia, the government has always placed access to clean water supply and reliable water source as a significant part of its development strategy. In the light of this commitment, by the end of MDG implementation in 2015 and augmented through the successor development blue print, the SDG-aligned National Development Plan (2018-2021), The Gambia has met the MDG target of 85 percent of the population using an improved drinking water source. However, there are regional disparities to the progress made in access to improved water sources. In addition, the growth in the populations of the communities in which these water points are located has also increased the burden of access on the people as the distance travelled and time taken to get water from such points are beyond the level regarded for easy access. In rural areas more households spend more time in collecting water compared to those in urban areas Furthermore, the use of unprotected wells as a source for drinking water are more common in the predominantly rural areas. In this respect, household drawing water from unprotected wells or from far-off water sources and carrying the water in open containers risk having the water being contaminated thus making it unsafe for consumption.
Unlike the increase in the proportion of households with improved water source, for the proportion of households with improved sanitation facilities, the indicator has been declining over the period at 64%(2013) and dropping to 47% (2018). For the fact that the sanitation target might not be met by the NDP target year (2021) is worrying as sanitation practices tend to have a larger impact on environment and public health outcomes than access to safe water alone. Table 35 Target: Provide sustainable access to safe drinking water and basic sanitation to
all by 2021.
Data Source: National Development Plan (2018-2021
INDICATOR
2018
NDP Base Year
2019
2020 2021
NDP Target Year
1. Increase the proportion of population with access to safe drinking water
89.6%
85% (MICS 2018)
100%
2. Increase the proportion of population with access to improved sanitary facilities
64.9%
47% (MICS 2018)
75%
3 Access to basic Hygiene facilities at household level
33.9% 31% (MICS 2018)
60%
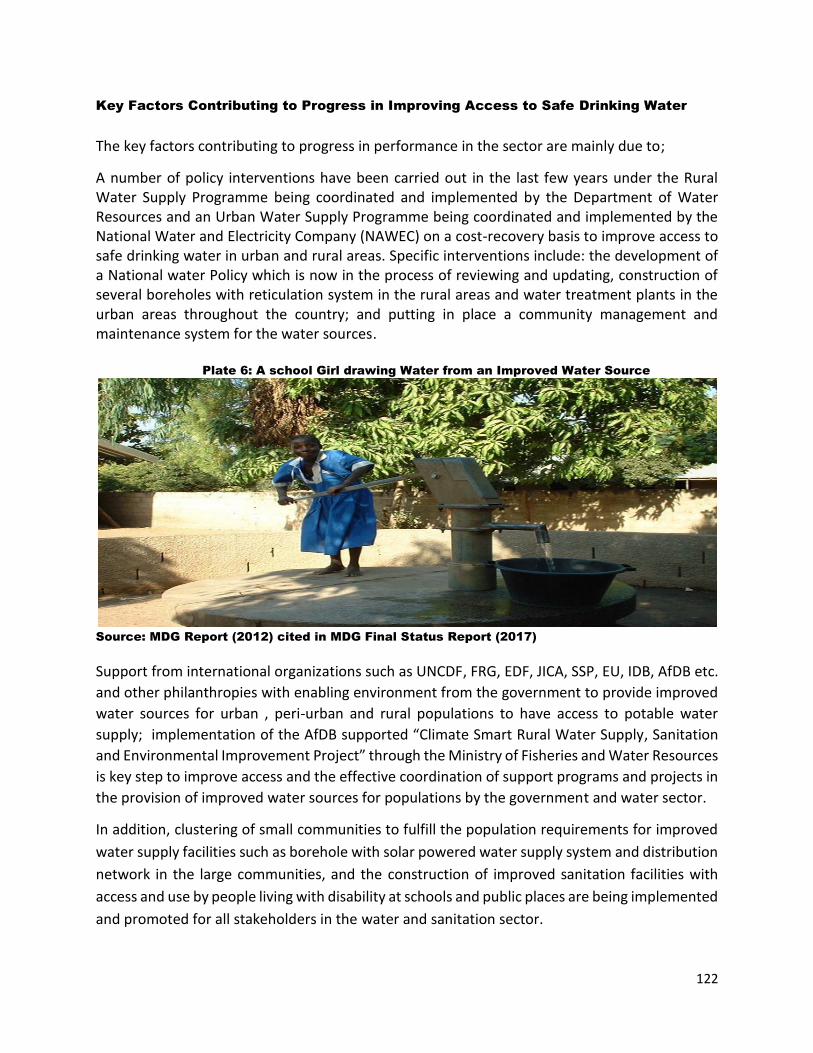
122
Key Factors Contributing to Progress in Improving Access to Safe Drinking Water
The key factors contributing to progress in performance in the sector are mainly due to;
A number of policy interventions have been carried out in the last few years under the Rural Water Supply Programme being coordinated and implemented by the Department of Water Resources and an Urban Water Supply Programme being coordinated and implemented by the National Water and Electricity Company (NAWEC) on a cost-recovery basis to improve access to safe drinking water in urban and rural areas. Specific interventions include: the development of a National water Policy which is now in the process of reviewing and updating, construction of several boreholes with reticulation system in the rural areas and water treatment plants in the urban areas throughout the country; and putting in place a community management and maintenance system for the water sources.
Plate 6: A school Girl drawing Water from an Improved Water Source
Source: MDG Report (2012) cited in MDG Final Status Report (2017)
Support from international organizations such as UNCDF, FRG, EDF, JICA, SSP, EU, IDB, AfDB etc.
and other philanthropies with enabling environment from the government to provide improved
water sources for urban , peri-urban and rural populations to have access to potable water
supply; implementation of the AfDB supported “Climate Smart Rural Water Supply, Sanitation
and Environmental Improvement Project” through the Ministry of Fisheries and Water Resources
is key step to improve access and the effective coordination of support programs and projects in
the provision of improved water sources for populations by the government and water sector.
In addition, clustering of small communities to fulfill the population requirements for improved
water supply facilities such as borehole with solar powered water supply system and distribution
network in the large communities, and the construction of improved sanitation facilities with
access and use by people living with disability at schools and public places are being implemented
and promoted for all stakeholders in the water and sanitation sector.
123
Key Factor Contributing to Progress in Improving Access to Basic Sanitation
In an effort to enhance access to improved basic sanitation, a number of interventions have been
undertaken over the years, including: development of a draft National Policy and Strategic Plan
on Sanitation and Hygiene (2011 – 2016); provision in the current United Nations Development
Assistance Framework(UNDAF) for The Gambia to develop Urban Waste Management Plans;
establishment of a National Water and Sanitation Committee (WATSAN) housed at the
Department of Water Resources and supported by The United Nations Children Fund (UNICEF)
among other development partners to expand improved sanitation and hygiene facilities
throughout the country, particularly in the rural communities; establishment of a Water,
Sanitation and Hygiene (WASH) Project by UNICEF and appointment of a WASH Project Officer
on full-time at UNICEF Country Office and WASH Units at the Ministries of Health and Water
Resources respectively who works closely with the WATSAN Committee through the Department
of Water Resources; enhanced private sector and community participation in sanitation and
waste management; active community and institutional participation in the fortnightly national
cleansing exercise (dubbed “Sett-Settal”)designed to improve environmental sanitation and
public health of the community environment; and construction of a liquid waste (human excreta)
treatment plant at Kotu Oxidisation Pond
Key Factors Challenging Progress in Improving Access to Safe Drinking Water
Notwithstanding the remarkable progress made in the provision of improved water supply to the communities throughout the country, series of challenges still remain and require to be addressed in the SDG-aligned National Development Plan (2018-2021) in order consolidate the gains so far registered and sustain the momentum so that the country does not experience a reversal of the gains or slide back in her development progress, and these challenges include: There is inadequate regulatory and policy environment and weak enforcement of existing policies
and legal instruments for the water sector and as such private investment in the sector is very
low. There is no Water Resources Council for ensuring the effective and efficient supervision,
coordination, management, monitoring and evaluation of the countries water resources system,
especially on the extraction of water supply;
There are whole series of other factors such as inadequate resources to strengthen the Department of Water Resources in their efforts to attain 100 percent access to safe water supply facilities in the rural areas; maintaining adequate supply of safe drinking water to match the rapid population growth and the fast rate of urbanization particularly in urban and peri- urban centers; formulation and implementation of legal and institutional framework that address the competing water demands for human, industrial and agricultural purposes; community participation and ownership of the water infrastructure and ensuring that water wastage is minimized; pollution of water bodies by private service providers in liquid waste disposal, particularly in the urban areas; inadequate financial resources to carry out and maintain major water projects, and against the
124
backdrop of fiscal deficits and a rising debt burden; unreliable supply of electricity to power and pump water to the homes. Furthermore at the institutional and regulatory level, the lack of project a Programs /Projects Coordination Unit (PCU)t to effectively and efficiently supervise, coordinate and monitor all water projects within the country; inadequate human resources to ensure effective and efficient project implementation and coordination of programs; low capacity of the work force to enhance quality service delivery at all levels; inadequate decentralized structure for improved service delivery at the sub-national level a; and inadequate resource allocation the public budget of the government to the water and sanitation sector.
Key Factors Challenging Progress in Improving Access to Basic Sanitation
There has been a significant reduction in water and sanitation indicators for the NDP base line.
Poor Sanitation in the country is dependent on several factors. Fundamentally, population has to
change their behavior towards sanitation which is time demanding and challenging. Secondly,
the people’s financial ability to provide improve sanitation facilities in their households also
contribute to the downward trend of the sanitation indicator. The government did not allocate
any financial resources to implement sanitation activities so as to serve as catalyst to change
behavior of the population towards good sanitation practices. Although there has been
significant progress in the water sector as indicated in the NDP base line, but there are still
disparities on the ground in terms of improved access to water supply especially in the urban,
peri=urban and some of the rural communities, this is due to increase of population in urban and
peri-urban areas such that most urban slums do not have adequate access to potable water
supply and the water facilities installed in most of the rural communities are dilapidated,
population increase and expanded as such the existing water systems in most communities are
neither functioning or inadequate to serve the population, therefore most people resort to
drinking from unprotected water sources.
Actions Needed to Accelerate Progress in Accessing Safe Drinking Water
Conduct institutional reform and establish a Program / Project Coordination Unit for the Ministry
of Fisheries and Water Resources;
Establish decentralized structures at the regions to enhance quality service delivery at all levels;
Strengthen the human resource capacity of the water and sanitation sector through trainings and
essential resource support for quality service delivery; and
Ensure the review , updating and adoption of the National Water Policy, development of a
Strategic Plan to operationalise the Policy and the enactment of the new Water Bill drafted
within the framework of the Water Sector Reform Program
125
Box 3: Best Practice Cases in the coordination of Water and Sanitation Projects
To improve the coordination of water supply programs and avoid duplication and waste of resources, areas of intervention are allocated for each supported project in the provision of improved water sources for the population. In this respect, the NAWEC (National Water and Electric Company) for example is responsible for the provision of water supply and management in the urban and peri-urban areas, while the Department of Water Resources under the Ministry of Fisheries and Water Resources is responsible for the provision of improved water sources for the rural communities through donor supported projects that promotes the involvement, participation and sustainability of the water supply facilities by the beneficiary communities. This avoids conflicts between two water service providers
Actions Needed to Accelerate Progress in Improving Access to Basic Sanitation.
There is need for additional resources mobilization to improve access to basic sanitation, water
supply and good hygiene practices promoted to all the sectors of the population especially the
urban, peri-urban and rural communities expanding and increasing in population. In this respect,
Government should provide both political and financial commitment towards sanitation by
allocating funding for the implementation of water and sanitation activities. In addition,
Government and internal organizations should provide capacity development for the WASH
workforce to ensure quality delivery of services;
Secondly, there is the need review the contributions of government towards the development of
water and sanitation sector at the Ministries of Water Resources and Health respectively. The
Ministry of health as the coordinating body of sanitation and hygiene in the country, has
established a Water Sanitation and Hygiene Promotion Unit under the Directorate of Public
Health Service. This unit works with relevant stakeholders to implement sanitation activities in
the country. Their collaborative efforts has so far yielded remarkable results by taking
communities away from open defecation status to open defecation free status. The Government
has prioritised water and sanitation in the national development plan but failed to allocate
required resources for the realization of the national development plan targets on sanitation and
hygiene. Basically, in water and sanitation sector. The Government only takes care of the
overhead of the institutions
In addition, the inadequate policy and regulatory framework on basic sanitation and environmental management has contributed to poor management of waste and lack waste treatment plants. Private participation and investment in the sanitation and hygiene sub-sector are very low due largely to weak enforcement of the existing policies and regulations
126
III.3. MULTIPLE CRISES AND OTHERF EMERGING CHALLENGES
III.3.1.CLIMATE CHANGE AND ENVIRONMWNTAL SUSTAINABILITY
I. Introduction
The Gambia is among the 197 countries that ratified United Nation Framework on Climate
Change Convention. The Ministry of Environment Climate Change and Natural Resources
(MECCNAR) is mandated among other duties, to develop climate change policies and to oversee
the implementation of climate related policies by the line departments (Department of Forestry
and Department of Parks and Wildlife Management) and National Environment Agency (NEA).
MECCNAR, through collaboration with NEA developed and validated the National Climate Change
Policy (NCCP), through the GCCA project that was funded by European Union in 2016.
The vision of NCCP is to ensure climate resilient society, through systems and strategies that
mainstream climate change, disaster risk reduction, gender and environmental management, for
sustainable social, political and economic development.
The policy target / goal of the policy is to achieve the mainstreaming of climate change into
national planning, budgeting, decision making and programme implementation, through
effective institutional mechanisms, coordinated financial resources management, and enhanced
human resources capacity (Uqurhart, 2016).
As part of the effort to implement the NCCP, MECCNAR is working on establishing a National
Climate Change Secretariat, which will serve as the technical arm of the recommended
institutional arrangement recommended in the NCCP, and to coordinate and/ or oversee the
mainstreaming and the overall implementation of sector climate change policies.
Furthermore, MECCNAR has also developed a four-year strategic plan that cut across all and
include the implementation plans of its line departments and agency.
The vision of the policy is to ensure that the Gambia’s Environment and natural resources are
sustainably managed for the benefit of all citizens in a coordinated manner (Touray, 2018).
II. Factors that Contributed to Government Response to Climate Change Issues
In the strategic document, there are four closely- linked critical that MECCNAR as the lead
Ministry for Responsible for the environment, natural resources and climate change, stands a
chance to directly contribute to the achievement of three NDP outcomes through the following
strategic document (Touray, 2018):
1. Strategic Objective 1: Promote well-being of Gambians through socially responsive
integrated environmental management
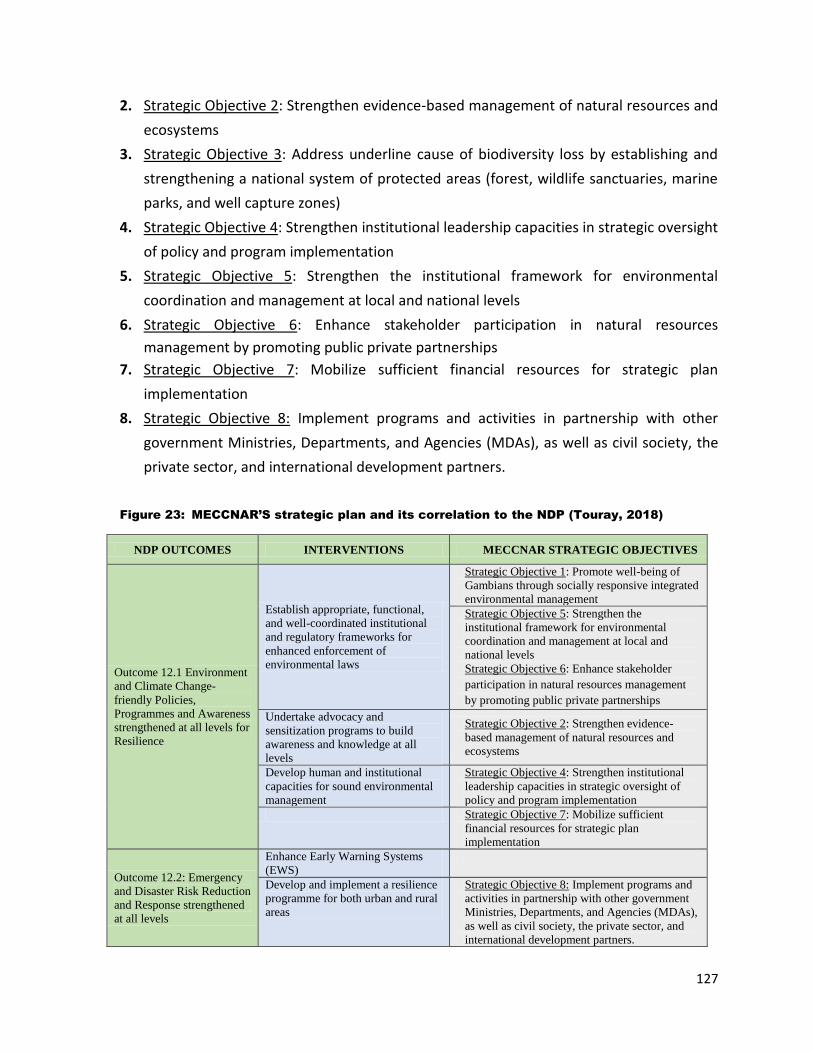
127
2. Strategic Objective 2: Strengthen evidence-based management of natural resources and
ecosystems
3. Strategic Objective 3: Address underline cause of biodiversity loss by establishing and
strengthening a national system of protected areas (forest, wildlife sanctuaries, marine
parks, and well capture zones)
4. Strategic Objective 4: Strengthen institutional leadership capacities in strategic oversight
of policy and program implementation
5. Strategic Objective 5: Strengthen the institutional framework for environmental
coordination and management at local and national levels
6. Strategic Objective 6: Enhance stakeholder participation in natural resources
management by promoting public private partnerships
7. Strategic Objective 7: Mobilize sufficient financial resources for strategic plan
implementation
8. Strategic Objective 8: Implement programs and activities in partnership with other
government Ministries, Departments, and Agencies (MDAs), as well as civil society, the
private sector, and international development partners.
Figure 23: MECCNAR’S strategic plan and its correlation to the NDP (Touray, 2018)
NDP OUTCOMES INTERVENTIONS MECCNAR STRATEGIC OBJECTIVES
Outcome 12.1 Environment
and Climate Change-
friendly Policies,
Programmes and Awareness
strengthened at all levels for
Resilience
Establish appropriate, functional,
and well-coordinated institutional
and regulatory frameworks for
enhanced enforcement of
environmental laws
Strategic Objective 1: Promote well-being of
Gambians through socially responsive integrated
environmental management
Strategic Objective 5: Strengthen the
institutional framework for environmental
coordination and management at local and
national levels
Strategic Objective 6: Enhance stakeholder
participation in natural resources management
by promoting public private partnerships
Undertake advocacy and
sensitization programs to build
awareness and knowledge at all
levels
Strategic Objective 2: Strengthen evidence-
based management of natural resources and
ecosystems
Develop human and institutional
capacities for sound environmental
management
Strategic Objective 4: Strengthen institutional
leadership capacities in strategic oversight of
policy and program implementation
Strategic Objective 7: Mobilize sufficient
financial resources for strategic plan
implementation
Outcome 12.2: Emergency
and Disaster Risk Reduction
and Response strengthened
at all levels
Enhance Early Warning Systems
(EWS)
Develop and implement a resilience
programme for both urban and rural
areas
Strategic Objective 8: Implement programs and
activities in partnership with other government
Ministries, Departments, and Agencies (MDAs),
as well as civil society, the private sector, and
international development partners.
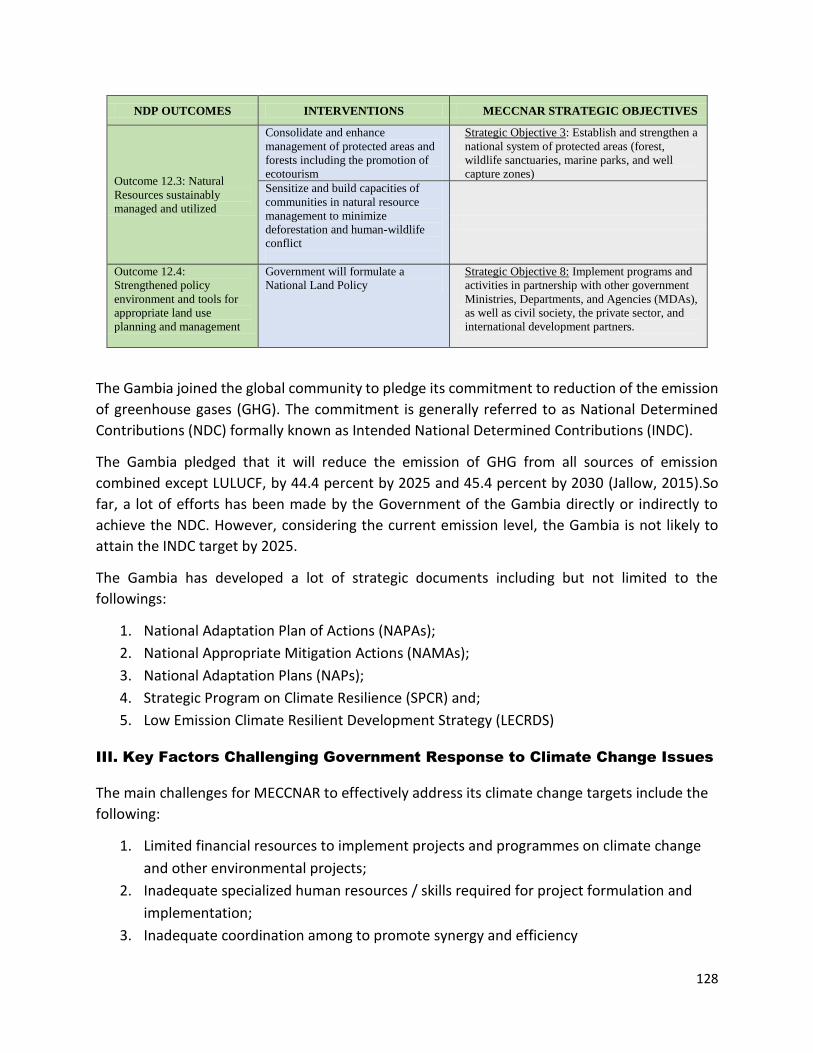
128
NDP OUTCOMES INTERVENTIONS MECCNAR STRATEGIC OBJECTIVES
Outcome 12.3: Natural
Resources sustainably
managed and utilized
Consolidate and enhance
management of protected areas and
forests including the promotion of
ecotourism
Strategic Objective 3: Establish and strengthen a
national system of protected areas (forest,
wildlife sanctuaries, marine parks, and well
capture zones)
Sensitize and build capacities of
communities in natural resource
management to minimize
deforestation and human-wildlife
conflict
Outcome 12.4:
Strengthened policy
environment and tools for
appropriate land use
planning and management
Government will formulate a
National Land Policy
Strategic Objective 8: Implement programs and
activities in partnership with other government
Ministries, Departments, and Agencies (MDAs),
as well as civil society, the private sector, and
international development partners.
The Gambia joined the global community to pledge its commitment to reduction of the emission
of greenhouse gases (GHG). The commitment is generally referred to as National Determined
Contributions (NDC) formally known as Intended National Determined Contributions (INDC).
The Gambia pledged that it will reduce the emission of GHG from all sources of emission
combined except LULUCF, by 44.4 percent by 2025 and 45.4 percent by 2030 (Jallow, 2015).So
far, a lot of efforts has been made by the Government of the Gambia directly or indirectly to
achieve the NDC. However, considering the current emission level, the Gambia is not likely to
attain the INDC target by 2025.
The Gambia has developed a lot of strategic documents including but not limited to the
followings:
1. National Adaptation Plan of Actions (NAPAs);
2. National Appropriate Mitigation Actions (NAMAs);
3. National Adaptation Plans (NAPs);
4. Strategic Program on Climate Resilience (SPCR) and;
5. Low Emission Climate Resilient Development Strategy (LECRDS)
III. Key Factors Challenging Government Response to Climate Change Issues
The main challenges for MECCNAR to effectively address its climate change targets include the
following:
1. Limited financial resources to implement projects and programmes on climate change
and other environmental projects;
2. Inadequate specialized human resources / skills required for project formulation and
implementation;
3. Inadequate coordination among to promote synergy and efficiency
129
Recommendation for Further Action to Accelerate Progress on Climate Change Issues
1. The Gambia should endeavour to establish a National Climate Change Fund as
recommended in the National Climate Change Policy;
2. The Ministry should promote capacity building of its staff in specialized areas relevant to
environment and natural resources management; and
3. The Ministry should enhance its coordination mechanisms and promote cooperation with
relevant stakeholders to avoid overlaps and duplication of efforts.
III.3.2. DISASTER-RISK REDUCTION
I. Introduction
Like many countries, the Gambia is among the countries faced with different types of disasters.
Its vulnerability to naturally occurring disasters is exacerbated by the climate change.
Climate change induced disasters are very common nowadays in the Gambia. Different
geographical regions in the world are characterised by different environmental factors. Hence,
each region in the world has its set of characteristics, type, magnitude and frequency of natural
disaster that it is affected with. The same is true for the factors that influence and / or are
responsible for both natural and human induced disasters.
For the Gambia, a disaster profiling is conducted annually to determine which disaster is most
common in a particular year. So far, on average, windstorm and flash flood are the most common
disasters in the Gambia. Or at least, for the disasters that are considered climate induced.
Also, wind/dust storm is increasing both in frequency and magnitude, registering cases of
damage of properties, livestock, and infrastructure and in worst case scenarios, loss of lives.
II. Factors Contributing to Progress in Disaster-Risk Reduction
It is against this backdrop that the Government of the Gambia established the National Disaster
Management Agency by an Act of Parliament to oversee disaster management in the country,
which include but not limited to prevention, mitigation and response to disasters / hazards in the
country.
Further to its establishment, a National Disaster Management Policy as well as National Disaster
Risk Reduction Strategy have also been developed. The development of the policy and strategy
is geared towards ensuring, among others, the development of regulations pertaining to disaster
management, interventions and implementations in the Gambia. However, both the National
Disaster Management Policy and National Disaster Risk Reduction Strategy are outdated and
need to be reviewed and updated in order to include updates in international Disaster Risk
Reduction (DRR) frameworks, conventions and regulations, particularly the updates in the Sendai
130
Framework. The need to mainstream climate change into disaster management policy further
necessitate reviewing and updating the policy and strategic documents, such that it will include
the National Adaptation Plan of Actions (NAPAs) and the National Appropriate Mitigation Actions
(NAMAs).
It must be noted that even though NAPAs and the NAMAs need to be captured in NDMA strategic
documents, it is important to note that NDMA’s activities are mostly geared towards climate
change adaptation and not necessarily mitigation, which is reserved for partner institutions such
as the Ministry of Environment, Climate Change and Natural Resources.
In the National Development Plan of the Gambia (NDP), NDMA outlined two key indicators that
it targets to meet.
1. Number of communities that develop and implement Community Action Plan (CAP) and;
2. Number of Communities that are implementing Early Warning (EW) and Action Plan.
As for the former indicator, the baseline before 2018 was, 10 communities that had and were
implementing (CAPs). In 2018 up to now, 6 additional communities have also developed and/ or
are implementing CAPs – summing up to 16 communities nationwide. The total number of
communities implementing the CAP is far less than the 100-community target.
Contributions of Government towards Disaster-Risk Reduction
The main and most apparent contribution of the Government of The Gambia (GoTG) towards
DRR is the establishment of institutions particularly NDMA to oversee implementations of DRR
projects and programs. It also allocated budgetary support to NDMA as well as provided the
necessary human resources required in the up keeping NDMA.
The government has also ensured that there is decentralization of NDMA facilities and resources
across the five provincial regions of the Gambia.
Although the government through NDMA has set up task force to increase resilience against
crises and disasters as well as to mitigate vulnerabilities, the facilities and equipment that are
available for inter-agency response are very limited, and are only deployed to affected areas
when the need arise. Even though this works to an extent, but it seriously affects rapid and timely
response to disasters.
In order to create the enabling environment for the augmentation of government’s effort, NDMA
has already put in place relevant policy and institutional frameworks that would allow funding
and complementary supports from donor agencies as well as national and international partners.
The only limitation in this respect is inadequate specialized skills and staffing of the agency that
is required to fully support the independent development of policies and strategies internally,
without the need for contracting consultant from outside the agency, much more internationally.

131
Disaster Profiling:
Based on the 2018 data that was generated by NDMA, the main types / categories of disaster/
hazard that are registered are as follows:
1. Fire outbreak (domestic / bush fire)
2. Flash flood
3. Riverine flood
4. Bird invasion
5. Invasion of farmlands by Hippos
6. Windstorm and,
7. Thunderstorm
Of all the identified hazards, the most prominent disasters in the Gambia are windstorm and flash
flood. Regions differ in their vulnerabilities to different hazards or disasters and the regions are
affected differently as well in terms the effects on the local populace.
The chart below indicates the number of people that are affected by various categories of hazards
and the number of people that are affected by those hazards regionally.
Figure 24: Number of people affected by various categories of hazards and by region
The chart indicates that
Central River Region (CRR) is most prone to windstorm than all the other regions,
followed by Upper river region.
CRR is as well the most prone region to flash floods followed by Lower River Region (LRR).
Windstorm is the hazard that affects most people in the Gambia, particularly in those in
URR
22 59 55 0 61 442240 1363 900 724 1902
3952
25 20 0 0 0 01103 470
10913
805 5
11523
0 0 0 0 0 380
2000
4000
6000
8000
10000
12000
14000
LRR WCR URR NBR KM CRR
nU
MB
ER O
F P
EOP
LE A
FFEC
TED
REGIONS
Domestic Fire Flashflood Riverine Flood Windstorm Thurnderstorm
132
Ozone Depleting Substances
Ozone Depleting Substances (ODS) are chemical or gases that causes damage to the ozone layer,
whose primary role is to protect the earth from harmful rays of the sun.
The Gambia is among the countries that curtail the consumption of ODS and has ratified
international conventions to this effect.
The level of consumption of HCFC has significantly reduced from 6 tons in 2017 to 4 tons in 2019.
The level of reduction in the consumption of ODS has not been quantified at the time of this write
up, but there are indicators for further reduction in ODS consumption due to introduction of
alternative refrigerants such as 290. There is at least an anticipation of 1-ton reduction by the
end of 2019.
The key factors that led to the reduction of consumption of ODS include the following:
1. Awareness creation
2. Trainings on refrigeration and air conditioning techniques on how to handle refrigerant
particularly the ones that depletes the ozone layer and / or contribute to the warming of
the earth.
3. Introduction of alternative refrigerants into the Gambia market that are more ozone
friendly;
III. Key Factors Challenging Government Efforts in Disaster-Risk Reduction
Despite the progress made in efforts to curtail the use of ODS in the Gambia, the challenges
of illegal trade of ODS, limitation of funds to organize more training for custom officers and
refrigeration and air conditioning technician as well as limited tools and equipment –
particularly the one used in recovery, recycling and retrofitting serve as limiting factors.
IV. Country experience in curtailing ODS as refrigerants in The Gambia
The best practices employed in curtailing the use of ODS as refrigerant in the Gambia include:
1. Training of refrigeration and air conditioning technicians on a regular basis
2. Monitoring of entry points on a regular basis to minimize illegal trading of ODS
3. Yearly collecting of Data on importation and consumption of refrigerants in the Gambia.
The National Environment Agency implemented the following projects and or program in an
effort to reduce the consumption refrigerants that work on ODS.
1. Refrigerants Management Plan (RMP)
2. This project initiated the phasing out of chlorofluorocarbons (CFCs) and it ended in 2005.
3. Terminal Phase-out management plan (TPMP) As the name implies the project completed
the phasing out of CFCs, in January 2010
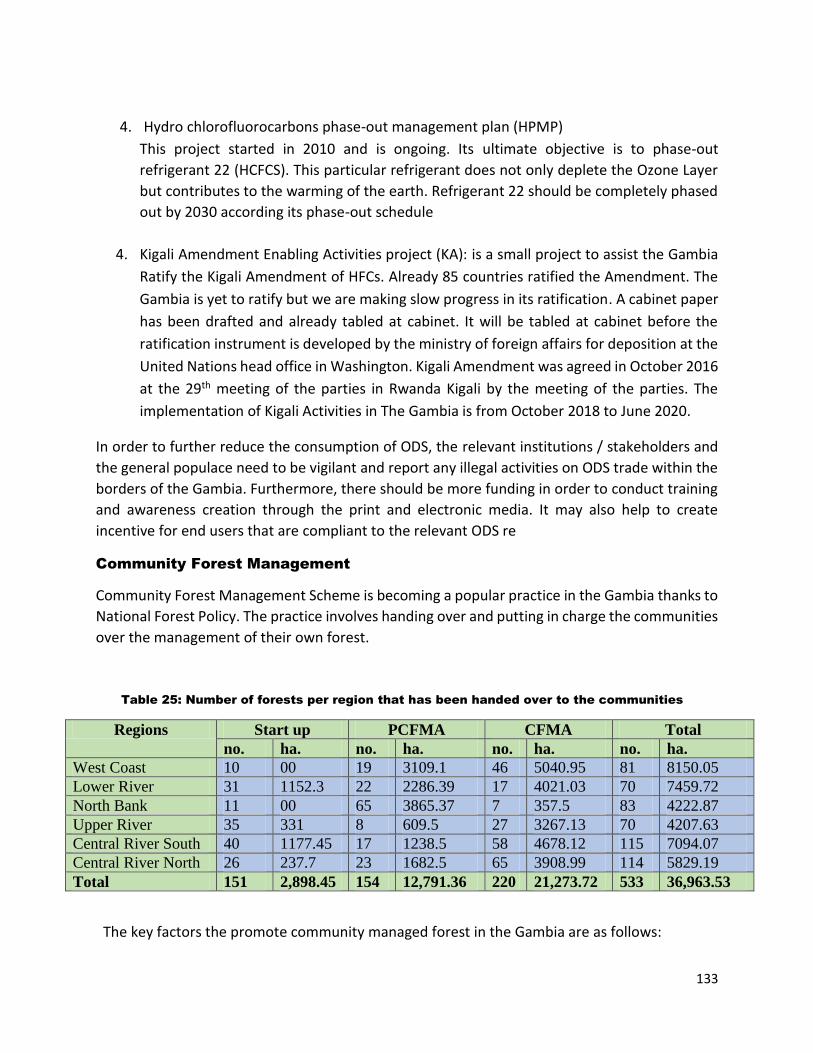
133
4. Hydro chlorofluorocarbons phase-out management plan (HPMP)
This project started in 2010 and is ongoing. Its ultimate objective is to phase-out
refrigerant 22 (HCFCS). This particular refrigerant does not only deplete the Ozone Layer
but contributes to the warming of the earth. Refrigerant 22 should be completely phased
out by 2030 according its phase-out schedule
4. Kigali Amendment Enabling Activities project (KA): is a small project to assist the Gambia
Ratify the Kigali Amendment of HFCs. Already 85 countries ratified the Amendment. The
Gambia is yet to ratify but we are making slow progress in its ratification. A cabinet paper
has been drafted and already tabled at cabinet. It will be tabled at cabinet before the
ratification instrument is developed by the ministry of foreign affairs for deposition at the
United Nations head office in Washington. Kigali Amendment was agreed in October 2016
at the 29th meeting of the parties in Rwanda Kigali by the meeting of the parties. The
implementation of Kigali Activities in The Gambia is from October 2018 to June 2020.
In order to further reduce the consumption of ODS, the relevant institutions / stakeholders and
the general populace need to be vigilant and report any illegal activities on ODS trade within the
borders of the Gambia. Furthermore, there should be more funding in order to conduct training
and awareness creation through the print and electronic media. It may also help to create
incentive for end users that are compliant to the relevant ODS re
Community Forest Management
Community Forest Management Scheme is becoming a popular practice in the Gambia thanks to
National Forest Policy. The practice involves handing over and putting in charge the communities
over the management of their own forest.
Table 25: Number of forests per region that has been handed over to the communities
Regions Start up PCFMA CFMA Total
no. ha. no. ha. no. ha. no. ha.
West Coast 10 00 19 3109.1 46 5040.95 81 8150.05
Lower River 31 1152.3 22 2286.39 17 4021.03 70 7459.72
North Bank 11 00 65 3865.37 7 357.5 83 4222.87
Upper River 35 331 8 609.5 27 3267.13 70 4207.63
Central River South 40 1177.45 17 1238.5 58 4678.12 115 7094.07
Central River North 26 237.7 23 1682.5 65 3908.99 114 5829.19
Total 151 2,898.45 154 12,791.36 220 21,273.72 533 36,963.53
The key factors the promote community managed forest in the Gambia are as follows:
134
1. Forest policy is user friendly that give users right to communities to own a forest
2. Trust between forestry and the communities is good
3. Capacity development of communities in Community forest management
4. Awareness creation/sensitization on the importance of forest and it benefit clearly to
communities
5. Use of forest enterprise development that easily provide short- and long-term benefit of
forest to communities.
As successful as it is, putting the communities in charge of their own forest also comes with its
challenges. The challenges include conservative forest management, little to no control on
logging, inability or lack of will to put out bush fires among others.
As part of the best practices employed by the department of forestry, participatory forest
management was subsequently introduced and promoted. The department also developed
practicable forest enterprises schemes to further promote judicious use of forest produce.
The Department of Forestry has implemented many forest management projects and
programmes, among which include.
1. Community forest management project
2. Joint forest park management project
3. Woodlot, plantation, orchard management project
4. Fire management project
To further promote community forest management, the following recommendations should be
taken onboard.
1. Forest enterprise development to be introduced in all community forest sites
2. Continuous sensitization on forest management
3. Law enforcement on illegal logging
4. Provision of resource, materials and mobility to Staff
5. Farmer to farmer contact/ study tour
6. Fast track the Community forest designation procedure
Community-Based Forest Enterprise
Similar to the community forest management scheme, the department of forestry has taken
strides in advocating community-based forest enterprise regionally. As at the time of writing this
report, 40 forest enterprises were developed in 2018 and that number has increased significantly
to 55 developed forest enterprises in 2019 alone.
The main reasons for successful venture into community-based forestry include the following:
1. Awareness and capacity development in forest management
135
2. Realization of immediate income
3. Ownership over forest resource and products
4. Forest policy been friendly to forest users
5. Trust between forestry and Communities in Community Forest Management
The limitation to the success registered in the community-based forest enterprise include the
following:
1. Lack of certification for processed products e.g., honey, Jam, Juice and fruits
2. Inadequate standard processing materials and equipment
3. Low capacity in use of new technology for the processing of forest produce.
4. Constraints in accessing grant or loan for the initial capital to start implementation of
enterprise development plan
5. Inadequate government-established infrastructures to promote forest enterprise
development
6. Frequent forest fires
The projects being implemented so far in respect to community-based forest enterprise are:
1. Training on forest enterprise development
2. Skill training in fruit and nut processing and honey processing
In order to promote community-based forestry enterprise, the following recommendation
should be taken into consideration.
1. Transferring forest and land ownership from state to the communities
2. Introduction of Market analysis and Development of Forest products and services
methodology
3. Capacity development of communities in community forest management
4. Decentralization
5. Provision of initial capital to start the business
6. Linkage to the service providers
7. Improvement of government infrastructures
8. Facilitate the ownership transfer of forest cover to the communities
9. Certification of forest products
10. Capacity development in business skills
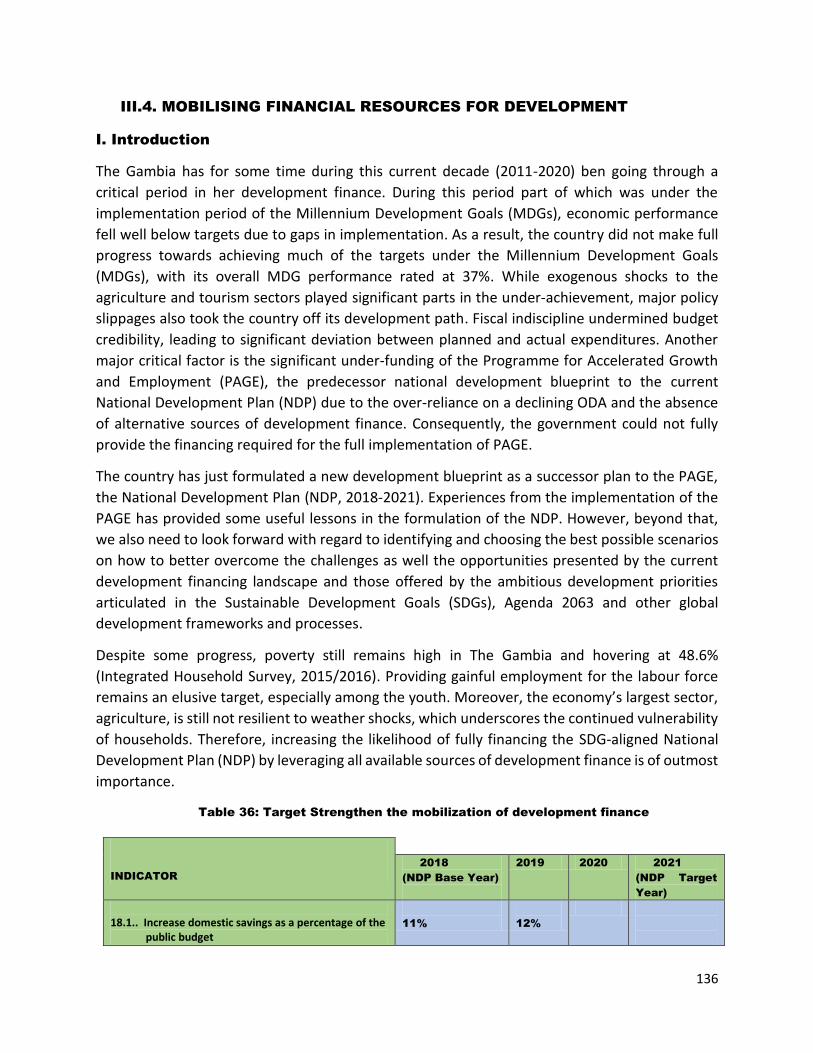
136
III.4. MOBILISING FINANCIAL RESOURCES FOR DEVELOPMENT
I. Introduction
The Gambia has for some time during this current decade (2011-2020) ben going through a
critical period in her development finance. During this period part of which was under the
implementation period of the Millennium Development Goals (MDGs), economic performance
fell well below targets due to gaps in implementation. As a result, the country did not make full
progress towards achieving much of the targets under the Millennium Development Goals
(MDGs), with its overall MDG performance rated at 37%. While exogenous shocks to the
agriculture and tourism sectors played significant parts in the under-achievement, major policy
slippages also took the country off its development path. Fiscal indiscipline undermined budget
credibility, leading to significant deviation between planned and actual expenditures. Another
major critical factor is the significant under-funding of the Programme for Accelerated Growth
and Employment (PAGE), the predecessor national development blueprint to the current
National Development Plan (NDP) due to the over-reliance on a declining ODA and the absence
of alternative sources of development finance. Consequently, the government could not fully
provide the financing required for the full implementation of PAGE.
The country has just formulated a new development blueprint as a successor plan to the PAGE,
the National Development Plan (NDP, 2018-2021). Experiences from the implementation of the
PAGE has provided some useful lessons in the formulation of the NDP. However, beyond that,
we also need to look forward with regard to identifying and choosing the best possible scenarios
on how to better overcome the challenges as well the opportunities presented by the current
development financing landscape and those offered by the ambitious development priorities
articulated in the Sustainable Development Goals (SDGs), Agenda 2063 and other global
development frameworks and processes.
Despite some progress, poverty still remains high in The Gambia and hovering at 48.6%
(Integrated Household Survey, 2015/2016). Providing gainful employment for the labour force
remains an elusive target, especially among the youth. Moreover, the economy’s largest sector,
agriculture, is still not resilient to weather shocks, which underscores the continued vulnerability
of households. Therefore, increasing the likelihood of fully financing the SDG-aligned National
Development Plan (NDP) by leveraging all available sources of development finance is of outmost
importance.
Table 36: Target Strengthen the mobilization of development finance
INDICATOR
2018
(NDP Base Year)
2019 2020 2021
(NDP Target
Year)
18.1.. Increase domestic savings as a percentage of the public budget
11%
12%
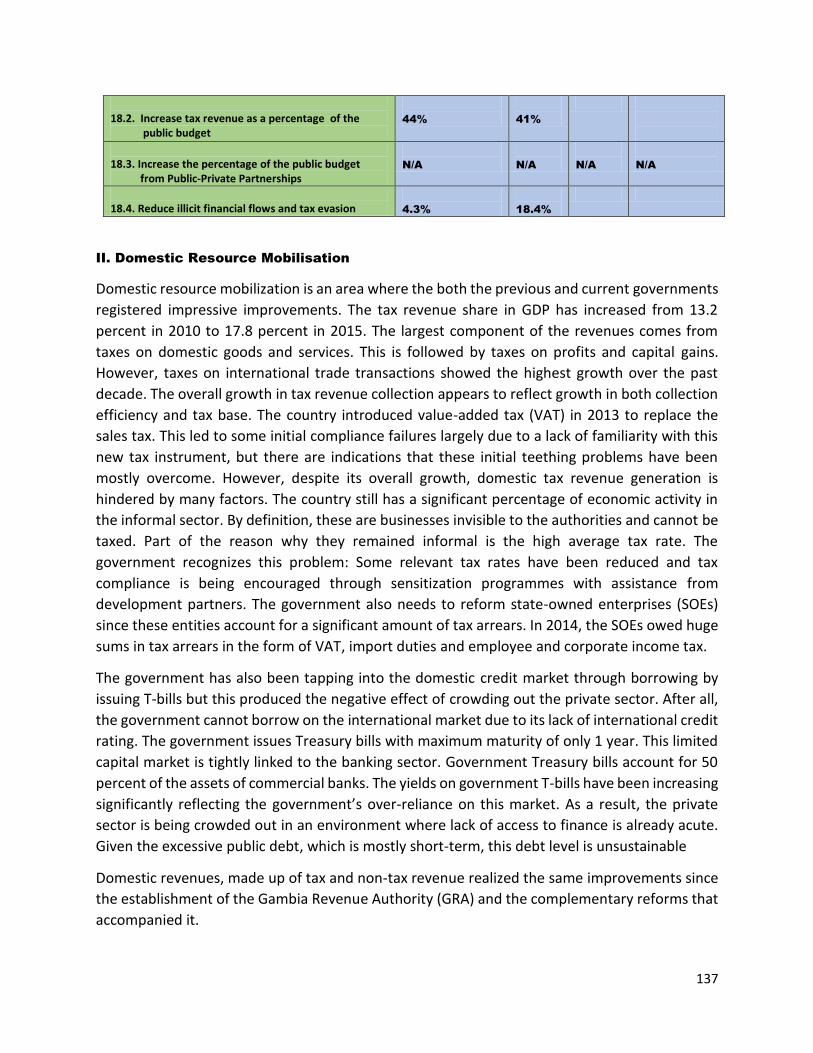
137
18.2. Increase tax revenue as a percentage of the public budget
44%
41%
18.3. Increase the percentage of the public budget from Public-Private Partnerships
N/A
N/A
N/A
N/A
18.4. Reduce illicit financial flows and tax evasion
4.3%
18.4%
II. Domestic Resource Mobilisation
Domestic resource mobilization is an area where the both the previous and current governments
registered impressive improvements. The tax revenue share in GDP has increased from 13.2
percent in 2010 to 17.8 percent in 2015. The largest component of the revenues comes from
taxes on domestic goods and services. This is followed by taxes on profits and capital gains.
However, taxes on international trade transactions showed the highest growth over the past
decade. The overall growth in tax revenue collection appears to reflect growth in both collection
efficiency and tax base. The country introduced value-added tax (VAT) in 2013 to replace the
sales tax. This led to some initial compliance failures largely due to a lack of familiarity with this
new tax instrument, but there are indications that these initial teething problems have been
mostly overcome. However, despite its overall growth, domestic tax revenue generation is
hindered by many factors. The country still has a significant percentage of economic activity in
the informal sector. By definition, these are businesses invisible to the authorities and cannot be
taxed. Part of the reason why they remained informal is the high average tax rate. The
government recognizes this problem: Some relevant tax rates have been reduced and tax
compliance is being encouraged through sensitization programmes with assistance from
development partners. The government also needs to reform state-owned enterprises (SOEs)
since these entities account for a significant amount of tax arrears. In 2014, the SOEs owed huge
sums in tax arrears in the form of VAT, import duties and employee and corporate income tax.
The government has also been tapping into the domestic credit market through borrowing by
issuing T-bills but this produced the negative effect of crowding out the private sector. After all,
the government cannot borrow on the international market due to its lack of international credit
rating. The government issues Treasury bills with maximum maturity of only 1 year. This limited
capital market is tightly linked to the banking sector. Government Treasury bills account for 50
percent of the assets of commercial banks. The yields on government T-bills have been increasing
significantly reflecting the government’s over-reliance on this market. As a result, the private
sector is being crowded out in an environment where lack of access to finance is already acute.
Given the excessive public debt, which is mostly short-term, this debt level is unsustainable
Domestic revenues, made up of tax and non-tax revenue realized the same improvements since
the establishment of the Gambia Revenue Authority (GRA) and the complementary reforms that
accompanied it.

138
This revenue-increasing effect was further enhanced with the introduction of the value added
tax (VAT) in 2013. It was raised from 14.6 percent of GDP in 2010 a year before the GRA to its
highest level of 18.9 percent in 2015 before tapering off to 17.7 percent of GDP in 2016 and 16.7
percent in 2017. It must be noted that the drop in 2016 and 2017 were due mainly to a dip in
overall economic performance associated with the poor agricultural output due to poor rains and
the impact of the political impasse on both years’ performances.
III. Official Development Assistance (ODA)
Up until the change of government in 2017, the country faced the biggest challenges in the area
of Official Development Assistance (ODA) Gambia. Despite its recent categorization as a fragile
state by the World Bank in 2014, ODA had been declining over the last half decade of the previous
regime.
The decline had been driven mostly by falling bilateral aid from traditional donors. Many
development partners had expressed concerns about the previous government t’s poor
governance and human rights records, coupled with poor fiscal management and erratic policy
choices by the then-government. As a result, ODA flows to The Gambia became dominated by
multilateral sources, but not enough to stem the overall decline in bilateral aid or to better
address the overall financing gap. With the inauguration of the current third Republic regime,
this trend is now expected to reverse given the willingness of traditional donors to engage with
the new regime.
ODA inflows are influenced by a host of factors including but not restricted to both political and
economic governance for both multilateral and bilateral sources, portfolio performance for
mainly multilateral sources and the warming up of diplomatic ties for bilateral sources. The
Gambia after 2010 had performed badly on all these determinants of ODA hence the drying up
of ODA in the recent past. ODA inflow into The Gambia was $129.03 million in 2006 and reached
its highest level of $156 million and $161million in 2011 and 2012 respectively before falling to
about $93 million in 2016 and picking up slightly in 2017 with the change of government and the
ushering in of a new Republic, which re-invigorated more donor confidence
The major source of ODA in 2016 was multilateral institutions followed by the Development
Assistance Committee with a contribution of $28.3 million, but mainly from OECD members. The
bilateral sources claim third position with their contribution of $19.8 million and then the UN
Systems with $10.3 million and others with $0.5 million. It is worth noting that a distinction is
made between bilateral sources and funds from DAC as the latter resources are not captured in
the national budget and pass through non-government organizations (NGOs) and other civil
society organizations (CSOs) while the former is the inflows that pass through the national
budget. This has something to do with the poor governance and human rights records complaints
that some of these countries had of the former regime. (O, Gagigo, 2017-Development Finance
Assessment)
139
IV. Foreign Direct Investment (FDI)
Like ODA, Foreign Direct Investment (FDI) has also been on a downward trajectory due to poor
investment climate and high risk perception. At a time when FDI in Sub-Saharan Africa has been
on the increase around 2006, in that of The Gambia it had been on the decline. While The
Gambia’s limited mineral resources is a factor, the country also had a less than favourable
business environment. For instance, while many factors play a part in this low ranking, poor
infrastructure and low access, notably in terms of energy and roads, have been identified as
major hindrances.
The country has been making reforms, including the creation of the Gambia Investment and
Export Promotion Agency (GIEPA) and the Secretariat of the Public-Private Partnership (PPP) to
improve the investment and private sector participation climate and attract investors and private
participation in the country’s development endeavour. However, more concerted effort is
needed to increase investor and private sector confidence to reverse the decline in FDI. This is of
urgent importance given the decision by the country to embark on Private-Public Partnership
(PPP) projects’ implementation. PPPs provide an important and innovative source of
development finance. There has been a tremendous increase in financing through this
arrangement, across sectors such as energy, transport and sanitation in other parts of the world.
Given that the implementation of projects envisaged through PPP includes major infrastructures
that require long-term investments, the above concerns about investment climate are
particularly relevant. Such undertakings are risky for private investors given the long period of
cost recovery. As a result, a favourable investment climate is even more critical as the country
seeks to attract private capital to finance development plans.
FDI was at its highest peak at 12 percent in 2006 and at its lowest ebb (0%) in 2015/2016 when
no FDI or very small amounts of FDI was recorded, with only slight rebounds in 2012 and 2013
when it moved up to above 4 percent in 2012 and close to 8 percent of GDP in 2013. Investments
in this period were mainly in the energy sector, telecommunications, increased number of
commercial banks and hotels and related infrastructural developments among others. It is an
established fact that while political and economic governance were relatively better, human
rights were not. The Gambia lost virtually every gain in the years succeeding that period. This was
accentuated by the election impasse. ..
FDI has been declining since 2007 but played a vital role in the development of The Gambia as it
represents about 30 percent of GDP in terms of stock according to the recently UNCTAD
Investment Policy Review. It has contributed immensely in funding investments in the
development of the services sector and until 2010 the bulk of FDI went to real estate and
construction. The second largest beneficiary was the tourism sector with FDI inflows from
Nigeria, the Middle East and North Africa. The financial sector has also seen a significant boost
as the banking sector grew from 6.4 percent of GDP to 10 percent of GDP in 2013 and the number
of banks stood at about 12 commercial banks due to notable increases of Nigerian banks.
140
Overall the FDI contribution is weak and its areas of intervention should be prioritized in the
sectors where it is lowest. From the UNCTAD review, The Gambia attracted about $52 million
between 2007 and 2017 out of the total FDI into the ECOWAS zone of $13.3 billion which was
better than only Guinea-Bissau at $20 million. The country has a lot of catching up to do to pursue
lead performers like Mali, Guinea Conakry and Senegal with $393 million, $363 million and $342
million respectively (M.Seck, 2018-Development Finance Assessment)
V. Remittances
Remittances are financial inflows sent by Gambians who reside and work in foreign countries
(Gambian diaspora). These resources are used for a range of purposes from support to family
members, purchase or construction of assets such as real estate to support to community and
national initiatives.
Migration of Gambians was relatively high before the 1994 coup d’état but the numbers of
Gambian migrants increased substantially in response to the 22 years of dictatorship. Some left
for fear of political persecution and others left for either economic or other reasons. The mass
departure of seasoned public servants and intellectual asset of the country became extremely
worrisome. Though a disturbing factor in development, the Gambian diaspora continued to
demonstrate its love for family and country by sending in hard-earned monies in support of
national development. These development finance inflows are so meaningful that they account
for about 22 percent of GDP in 2016, according to the US Treasury Department. In this respect,
The Gambia ranks second to Liberia in the ECOWAS region, which receives 26.1 percent of GDP.
Therefore, remittances was and continues to be the single most important development finance
inflow for the Gambia, after 2012 when both ODA and FDI flows almost dried up.
While the value of remittances is high and it has been an important source of external funds to
help recipient households, the country has not focused yet on identifying opportunities to also
leverage it for development finance. As a result, while the remittances are financing present
consumption, funding from the diaspora is not going towards long-term capital expenditures
such as major infrastructure projects. Key enabling factors such as the lack of capital markets and
targeted programmes are major hindrances.
VI. Public Debt
The Gambia’s debt stock of 130 percent of GDP that the new government inherited is a serious
challenge. The total public debt stock increased from 83.3 percent of GDP to 120.3 percent
between 2013 and 2016. This increase in the public debt has been fuelled by fiscal dominance.
The external public debt stock is estimated at 52.4 percent of GDP and is largely concessional.
However, the domestic debt stock rose from 37.1 percent of GDP in 2013 to 53.9 in 2015 and
reached 67.9 percent in 2016. Rollover risks are high, as more than 62.4 percent of domestic debt
consists of T-bills with maturities of less than one year and the short-term foreign currency debt
to reserve ratio is also high at 31.6 percent, due to external obligations. In December 2016,
central government liabilities to the CBG were consolidated into a single 30-year bond at a 5
141
percent interest rate to be paid off in 60 biannual instalments starting in March 2017. The total
debt stock as at end 2016 stood at GMD48.2 billion, equivalent to $1.102 billion.
As a proportion of total debt service, the external component declined from 36.6 percent to 22
percent while the domestic portion increased from 63.3 percent in 2015 to 78 percent in 2016.
This indicates a decline in external debt service payment for the past year whereas the debt
service payment on domestic debt for the same period increased drastically.
Total debt service as a percentage of total domestic revenue increased from 47.8 percent in 2015
to 52.3 percent in 2016. The percentage change in the proportion of debt service to revenue was
due to an increase in debt service payments over the year from GMD 3.6 billion to GMD 3.99
billion while total revenue remained almost the same for 2015 and 2016.
IV. Recommendations for Actions Needed to Accelerate Progress in Resource Mobilisation
In the light of the aforesaid challenges and opportunities for mobilising resources to finance the
development priorities of government t, the following recommendations are put forward:
- It is important to re-channel ODA inflows that were directed to civil society due to
governance and human rights issues that afflicted the previous government, back to
the public budget for better targeting and more impact. This will help in broadening
and diversifying the resource envelope of government for development financing;
- Establish a Public Private Dialogue (PPD), under the auspices of the Business Council
and the Gambia Chamber of Commerce and Industry (GCCI) with backstopping from
GIEPA, to bring together the private sector and the government at the highest level
to identify and remove critical bottlenecks to PPP and local competitiveness;
- GIEPA’s investment promotion activities should focus on attracting FDI in agro
processing mainly for groundnuts and cashew processing, fisheries and ICT and other
value chain services as well as in glass manufacturing for more impact, as
recommended by the 2017 UNCTAD Investment Policy Review in The Gambia;
- Although remittances are expected to decline due to deportation schemes and the
reversal of migrations due to improved governance in The Gambia, it should be better
organized and restructured with the establishment of a “Diaspora Fund” and a
“Diaspora Bond” to maximize its use, considering the fact that remittances constitute
The Gambia’s most influential source of development finance;
- There have been coordination concerns in mobilizing ODA for the Gambia from the
Office of the President, the Ministry of Foreign Affairs and the Ministry of Finance and
Economic Affairs. To tackle this conflict the latter should assume the lead in all aid
mobilization and coordination to avoid the existing conflicts and overlaps in mandate
142
III.5. GOOD GOVERNANCE
Good governance, justice and respect for fundamental human rights are important national
objectives set out in the 1997 Constitution of The Gambia. This constitutional right
notwithstanding, over the past two decades the country witnessed widespread deterioration of
governance and the rule of law, leading to gross human rights violations, political fragility,
economic instability, growth volatility and widening inequality. During 22 years of authoritarian
rule, average Gambians were held hostage to a deplorable system of governance where
intimidation and coercion, favoritism across ethnic lines and diversion of public resources
(especially through State Owned Enterprises - SOEs) for political purposes reigned supreme.
Not surprisingly, the country observed declining trends across various governance indicators. The
Global Competitiveness Report 2015/2016 ranks The Gambia at 123 out of 138 countries and in
the Mo Ibrahim index, the country’s ranking declined from 19th to 35th of 54 African countries
between 2009 and 2016, with scores below the regional average for both rule of law and
accountability.
Key features of the political and economic governance environment under the previous regime
include the following:
A dominant Executive that subjugated the legislative and judiciary branches of Government,
unlawfully influenced their decisions, and rendered ineffective the checks and balances to
authority inherent in modern societies;
The National Assembly during the years of dictatorship was a ‘de facto’ extension of the Executive
Branch; it exercised limited power and served essentially to sustain the repressive governance
that prevailed;
The 1997 constitution grants financial and administrative autonomy to the judiciary, but in
practice it was subjected to political interference in all aspects of its work – to the extent that
public confidence declined, justice delivery was perverted and slow, and there was a marked
deficit in access to justice. Other alternative sources of justice such as the Ombudsman, National
Agency for Legal Aid and the Alternative Dispute Resolution Secretariat were not properly funded
resulting in weak execution of their respective mandates;
Although freedom of expression and assembly were guaranteed by the 1997 Constitution, but in
reality restrictive laws and coercive legislations limited and stifled these fundamental freedoms.
The 2016 Freedom House Index rated The Gambia as “not free” with a score of 6.5 out of 7 (7
worst) in civil liberties and political rights. Access to information was limited which impeded the
capacity of citizens, including some 180 registered NGOs, to substantively engage in policy
dialogue and oversight;

143
The quality and effectiveness of all public institutions deteriorated and weakened and this
impacted negatively on service delivery and the government’s ability to attract private sector
investment. Closely related to this tendency is the poor economic governance which had a
significant impact on the macro-fiscal stability of the country. The undisciplined fiscal practices
were evidenced by uncontrolled domestic borrowing to fund Government excesses, frequent use
of supplementary budgets to access significantly higher levels of total revenues than initially
appropriated in the original budget, and outright theft and the plunder of public resources.
At the level of State-Owned-Enterprises (SoEs), poor oversight, management, corporate
governance, and accounting practices resulted in wastage of state resources, while providing a
platform for corruption and political patronage. According to Transparency International, The
Gambia’s ranking on the Corruption Perception Index fell from 91st (out of 178 countries) in 2010
to 123rd (out of 168 countries) in 2015.
To address the aforesaid good governance challenges that the country encountered during the
22 years of brutal dictatorship, the current government through its development blueprint (NDP),
has programmed the following interventions:
- To revise the 1997 Constitution with a view to guaranteeing the fundamental human and people rights of its citizenry;
- Effect the necessary amendments to the Criminal Code and Public Order Act with a view to ensuring fair dispensation of justice to the citizenry;
- Effect the necessary amendments to repressive laws that stifle the fundamental freedoms of the citizenry such as Communications Act, Children’s Act, Women’s Act, District Tribunal Act, and Elections Act, Ombudsman’s Act and ensure that agencies responsible for the administration of these laws are fully functional and established in al the regions of the country;
- Ensure the establishment of a fully functional Human Rights and Anti- Corruption Commissions in conformity with International standards an full compliance with reporting obligations under ratified Human Rights Treaties;
- Ensure the establishment of a Truth, Reconciliation, and Reparations Commission to ensure accountability for crimes and human rights violations committed under the former repressive regime
- Ensure the establishment of fully functional Ombudsman, NALA and ADRS offices,
Courts and Tribunals in all the Administrative Regions
144
III.6. SOCIAL PROTECTION
Government aspires for a modernized and expanded social protection system that provides
reliable and effective protection from multifaceted shocks and stresses and which builds people’s
resilience to adversity and hardship. While pursuing broad based economic growth, it recognizes
the inequality and limitations and consequently promotes social protection programmes for the
poorest and most marginalized segments of society.
To this end, government has placed social protection at the heart of its poverty reduction
strategies, backed it with the first National Social Protection Policy (2015-25), while executing
various initiatives, such as a cash transfer for pregnant women in poor regions, maternal and
child health package, scholarships and school feeding programs, the Government-run Family
Strengthening Program, disability and health care services for children, and pension schemes for
those in the formal sector, as well as support to returning migrants including the support to
communities to build the resilience of those communities.
However, the current social protection system in The Gambia is fragmented and focuses on social
assistance and promotional activities, particularly schemes designed to improve food security,
address malnutrition, and promote access to education. There is less focus on healthcare and
reliable income support through cash transfers to extremely poor and vulnerable households and
individuals. For example, the country does not have a universal social pension for the elderly or
a child support allowance. Furthermore, preventative social protection is highly limited in the
country, given that social security schemes are reduced to those employed in the formal sector.
Most of the population works in the informal sector, thus lacking any form of social security. A
notable gap includes the absence of national health insurance program, while the social security
package excludes unemployment and paid maternity leave benefits. Although agricultural
households face an ongoing risk of natural disasters with considerable effects on their livelihoods
and food security, state-led crop insurance schemes for farmers is underdeveloped but the
country is one of the pilots taking part in the Africa Risk Capacity (ARC) of the African Union.
Long-term and predictable institutionalized social transfers and promotion initiatives, targeting
the extremely poor, are rare. Many social transfers are transitory and project-based,
characterized by unreliable funding that jeopardizes their sustainability. The legislative
framework has notable gaps, including the absence of a national minimum wage or disability bill
and the coverage and level of support to particularly vulnerable groups (the elderly PWDs, PLHIV)
is inadequate and sporadic.
Migrants, refugee families, single parents, widows, and child headed households rarely feature
in social protection programming and projects rarely consider the social risks and vulnerabilities,
lifecycle challenges and/or needs of specific excluded groups.
Another important area in the social protection agenda is Child Protection, which seeks to
guarantee the rights of all children to a life free from violence, abuse, exploitation, and neglect
in both emergency and non-emergency setting.
145
III.7. PROGRESS TOWARDS GRADUATION
In this section the report dwells on progress made by the country towards graduation by
highlighting the smooth transition strategies including national development plans and
institutional arrangements for graduation, and identified support measures to achieve
sustainable and irreversible graduation.
To do that the sector reports presented here shall serve the basis of the recommendation for the
graduation strategies proposed:
Science, technology and innovation
The progress in the performance of the STI indicators depends to a very large extent on the
excellent performance of educational institutions since they will be largely responsible for the
addressing the shortage of trained and qualified researchers and scientists. The
underperformance of many of the public tertiary and higher education institutions in STI is due
to limited funding from government and lack of proper policy focus to improve STEM education
and the development of research and innovation capabilities. Currently, support from
development partners largely focus on infrastructual projects that do not necessarily address the
quality of human resources or the performance of education or scientific institutions.
The Policy has been clear with the development of strategic partnerships with the private sector.
Recently, efforts are being made to implement a Tech hub as a joint venture with the private
sector to catalyse technology-based start ups. The transformation of GTTI to a university of
science and technology has also witnessed increased partnership with other universities and
organisations such as the World Bank ACE Impact Project and the Kwame Nkurumah University
of Science and Technology (KNUST), De Montford University, Vrije Universiteit Brussel.
Almost all of these programmes are implemented with exclusive donor support with limited or
no budgetary support from government. Government and donor investment in science and
technology was measured by the amount of funds allocated or spent to support R&D and
innovation programmes for each fiscal year. Far from the 1% target set by African governments
during the 2006 AU Heads of State Summit, The Gambia’s estimated expenditure for R&D in 2019
stands at 0.04%.The net spending on R&D for the year 2018 was US$27,411,877.08. Government
share of this figure is 4.17%; share from the private-not-for-profit sector is 95.76% and the
business sector is 0.07%.
Current efforts from the Ministry of Higher Education, Research, Science and Technology to
address the funding gaps includes the proposal to establish a National Innovation Fund and to
legislate for the establishment of an STI Agency and other regulatory frameworks to support the
growth of the STI sector. There is the need to translate these proposla into concrete action.
146
Infrastructural development and management
Road transport
Improvements to the infrastructure has been mentioned in several reports to be a priority for
government as a way of improving the environment for attracting investment and business
opportunities in the country. To that effect this review has highlighted certain key issues
requiring intervention with a view to enhancing the country’s graduation from LDC status.
Development and adoption of an Integrated National Transport Master plan to allow the
integration of various modes of transport, i.e. road, sea and air. This could be aligned to
the national transport networks of neighboring countries with the framework of ECOWAS
region al transport network;
Ensure the implementation of the transport policy’s recommendation to prioritize road
maintenance over new constructions. This is necessary as new roads once constructed
hardly have any scheduled maintenance plans and within a matter of few years their
condition deteriorates to point that makes them hardly usable. To that effect,
establishment of sustainable Funding for Road Maintenance is called for through the
introduction of Fuel Levy charge on road users as main source of road maintenance
funding for the network ;
Support the development of the Local Road Construction Industry; starting with Labour
based method in collaboration with ILO and other development partners and
GAMWORKS; and private sector management of heavily trafficked road corridors. This is
necessary as almost all the big road construction contracts are given out to foreign
construction firms and building a local construction industry will not only save vital foreign
exchange for the country but it will enhance the development of the local construction
industry and building a critical mass of local road constructors;
In view of the increase in road accidents recently causing untold loss to life and property,
it is necessary to develop a Road Safety Programme and create a National Road Safety
Council with a secretariat to provide the institutional framework for the implementation
of the programme.
Air transport
Banjul International Airport as the only airport in the country is largely utilised to almost
maximum capacity during the tourist season. During the off-season (May-September) the
147
airport is under-utilised. Considering the massive infrastructural developments going on at
the airport coupled with its strategic location in West Africa, there is the need to undertake
an aggressive marketing of the airport as a regional air transport hub in West Africa. This is
expected to bring immense financial returns for the country.
Sea Transport
The role of the private sector in the further development of sea transport calls for
institutional restructuring of the Gambia Ports Authority (GPA) from a public service
model to that of a Landlord model in order to improve operational efficiency and hold its
competitive position in the face of fierce competition with other regional ports.
Globalization has affected the port and shipping industry in a way that the port
management model has moved from public service ports to landlord model in order to
improve efficiency in the face of increasing containerization of world trade that is growing
and has replaced break bulk cargo.
Better handling capacity for bulk cargo and container logistics to improve current
operational performance; and Improved regional road connections with trade and
transport facilitation measures to the hinterland countries of the port.
Telecommunications sector
The deregulation of the telecommunications sector has evidenced the proliferation of
telecommunications service providers of which one is public and three private. The deregulation
has come with its advantages and disadvantages and the landscape needs to be reviewed and
streamlined to improve efficiency and competitiveness at the national ad international levels
respectively. Some of the key issues requiring attention include the following:
- Restructure and reposition Gamtel (the state telecommunications Company since the
management inefficiency of Company as the incumbent and manager of the
Backbone, is delaying the further development of the sector. It needs to be
restructured for better efficiency and repositioned to either wholesale or retail
services provider but not both to ensure fair level playing field among the service
providers;
- Discontinue duplication of efforts - there is dire need to ensure maximum allocation
and sharing of infrastructure. Government and the private service providers should
resolve all bottlenecks and ensure maximum usage of the backbone and discontinue
all micro-wave backhauling where possible;
148
- Introduction of a third party, Tower Operator – to ensure instant nationwide coverage
and maximum allocation, the regulator/gov’t could consider introducing a tower
operator to be solely responsible for tower erection and management. This could be
a new operator or given to Gamtel but after restructuring and repositioning;
- Introduction of domestic roaming – this will ensure more uptime of services deployed
and instill more competition for more robust networks among service providers; and
- More e-government services and utilization of ICTs in the public sector – the
deployment of more e-government services and increased utilization of ICTs in the
public sector will boost demand for more broadband service. This will in turn trigger
the deployment for more access and better services
Agriculture, food and nutritional security and rural development
The outcome of the pre-harvest assessment for 2018/19 cropping season has revealed a number
of concerns which are highly critical to the general social welfare of the farming communities. To
this end, several recommendations are proposed below for redress for sustainable outcomes
1. A quick response plan should be developed by Government of the Gambia (GoTG) and its
partners for immediate assistance to the 83,872 (7 percent) people that are currently
under severe food insecurity and to build resilience for 456,136 (35percent) who are
moderately food insecure.
2. GoTG and its partners to increase support for the Early Warning System (EWS) Technical
Working Group (TWG) for timely planning, implementation and advise on
agricultural/natural resource related activities;
3. Promotion of early maturing and high yielding variety of crops (particularly salt tolerant
rice varieties) to boost food security;
4. Intensification of livestock production and breeding of drought tolerant breeds to conform
with climate smart/sustainable agriculture technologies;
5. Close the deficit of 11,254.4mt (15 percent) for coarse grains and 124,689mt (85 percent)
of rice as a measure to fill the rural annual requirement for grains in 2019 and beyond;
6. Timely implementation of mass vaccination campaign against endemic diseases such as Peste Petit de Ruminant (PPR), CBPP, Black Quarter (BQ), HS and Foot and Mouth Disease;
7. Rehabilitation of all non-functional livestock watering points to ensure uninterrupted supply of water to livestock particularly during the dry season;
8. Promotion of range land development, reseeding grazing lands and propagation of the fodder trees; Aid farmers with feed concentrates, multi-nutrient blocks; and doses of anthelmintic for both small and large ruminants.

149
Tourism development
The Gambia relies heavily o Thomas Cooks Travel Agency to transport tourist mainly from England and otherf European destinations. With the collapse of the travel agency, the country’s tourist season for 2019/2020 was put in jeopardy. The crises has nt only affeceted tourist arrivals for this season b ut rthe ciuntry can craw signkificant ,lessons fron this to broaden ansd divefrsify its carriers clientele. As tourism is one of fhe major foreign exchange earnerstr for the country, the Thoams Cok crises and other factors require that cerftain measures be undertaken with a view to ensuring a sustainable futurev for the industry:
- Engage other airlines especially those already flying into the Destination to expand their capacity to accommodate more visitors;
- Look for a possibility of attracting more airlines to fly to the Gambia, with increse in the number and frequency of flights ;
- Construction of ecotourism camps and ldges in all the administrative regions of the country as a way of ensuring the decentralisation of tourisnm invfrastructure to all the parts of the country and thereby reduce the overconcentration of toujrist facilitis in the Greater Banjul Area and oter coastal sites;
- Development of mre Nature Park in all the admiknistrative rfegion s of tgbhe countgry with a view to providing diversified product for nature tourists;
- Development of Niche Tourism Cultural products such as festivals
- Appoint Destination Managers in other source markets notably Nigeria, China, Russia;
- Conduct International Visitor Survey and finalize the establishment of a TSA
Trade and Commodities
- Conduct training for businesses and expose them to all the trade opportunities such as
AGOA, ECOWAS CET Protocols, and the AfCFTA;
- Strengthen bilateral trade cooperation between Senegal, Gambia and Guinea Bissau to
promote intra-regional trade and remove none tariff barriers;
- Set up an industrial estate and dry porting facilities at Basse in the Upper River Region
150
- The special Economic Zones in Farafenni and Soma to serve as a trade logistic center;
- Government of the Gambia should work on obtaining the textile visa in order to benefit
from the AGOA scheme and institutions to work on this should be: MOTIE, GEIPA, GRA,
and American Embassy;
- Identify key potential industries and design policies to promote their growth such as
cement, flour, agribusiness and processing, tourism services etc.;
- Establish a directorate of internal trade within the Ministry of Trade, Industry, Regional
Integration and Employment, with the primary mandate of promoting local businesses
and seeking market access for them;
- Develop an information management system on trade and commodities that can
strengthen data collection on internal trade as well as capture data on industrial growth,
employment and trade, instead of each directorate maintaining its stand-alone data base;
- Identify strategic industries that could be further supported with favorable policy
interventions such as those employed for Onions and Irish Potatoes. (e.g. Temporal Ban on importation of these goods for 6 months , to ensure market for local producers)
Public-private partnerships
The Gambia does not have an approved specific PPP law that addresses all provisions of PPP projects yet several projects are being implemented in various sectors of the economy. Therefore, approval and enactment of the Draft PPP Bill should be fast-tracked. The Draft PPP Bill stipulates a comprehensive outline to attract private sector investments in infrastructure and the effective implementation of PPPs in the country
Investing and improving communication strategies aimed at increasing the public awareness and
understanding of the value of PPPs will significantly contribute to the pace of adoption of it as a
viable alternative to traditional government procurement mode;
Human capacity of the relevant parties tasked to promote PPPs, prepare projects, evaluate
proposals, and advice on PPPs should be further developed to meet international best standards
and keep up with evolving sectoral knowledge on PPPs; and
Ensure equity, transparency, and competition; allow the creation of adequate institutional
capacities for the treatment and regulation of PPP projects; reduce the development costs of
projects and guarantee the adequate protection of the investors and the lenders.
151
Energy capacity and sustainability
Access to electricity remains an ongoing challenge for The Gambia. In 2016, about half of the
population (approximately 1 million people) was without access to electricity, amid a significant
disparity in rates of access between urban (66%) and rural (13%) areas. Electricity access doubled
nationwide from 20% in 2001 to 40% in 2010, but most of these gains came in the urbanized
Greater Banjul Area. Even where grid connections exist, power supply is often unreliable, with
firms reporting an average of about 20 power outages per month
Accessible and reliable sources of electricity is considered to be one of the key determinants for
attracting investment and business opportunities to any particular country. In the light of this
situation, for the Gambia to graduate from the LDC status, it needs to address certain
fundamental issues in the energy sector:
- Development and adoption of a National Energy Policy and accompanying Strategic Plan;
- Revision of energy tariffs to take note of the economic disparities in the market situation
- Increase the number of regulations for downstream operations to better regulate
electricity generation and distribution;
- Increase the distribution of electricity through grid and off-grids facilities with a view to
increasing the proportion of the population with access to electricity; and
- Increase the share of renewable energy in the total electricity generation
Education and training
A critical factor in promoting the growth and development of the national economy is for
government to invest heavily in the country’s human capital. As education is a critical component
of this capital since the era of the previous regime, access to education at the primary and
secondary level in particular has tremendously increased. However, whilst access has improved,
quality and equity on the other hand lagged behind. For the country to graduate from LDC status,
it needs to address the gaps in the educational system by addressing the following:
- Maintain the new teacher posting strategy to ensure equity in teacher availability;
- Maintain the work of the Coordinators Committee Meetings to enhance monitoring;
- Creation of more gender sensitive curriculum and environment;
- Continuing community awareness campaigns on the benefits of education; and
- Promote and campaign for performance and completion in the sector
152
Population and primary health
Like education, health care is another component of human capital development as “a health
nation is a wealth nation”. Since the era of the previous government the country has invested
heavily in the construction of health infrastructures across the country. However, like the
education sector while access to health care facilities has improved but this is not matched by
concern for quality. Several healthcare facilities have struggled with even the basic health
equipment, materials and supplies to perform even the normal health care delivery service. In
the light of the above, to facilitate the country’s graduation from LDC status it is recommended
that government addresses the following:
- Provide adequate laboratory services (staff, equipment, consumable and supplies) to all
the public health facilities;
- Develop and implement effective health promotion interventions to reduce the burden
of non-communicable disease;
- Institutionalized “Kabilo Bama Initiatives” across all the communities in the country;
- Institutionalized men involvement in reproductive and child health services;
- Develop strategies to improve and strengthen gains made in maternal health services;
- Enforce the children’s Act to prevent/ reduce child marriage in the country; and
- Provision of free and universal access to quality maternal health services.
Youth development and empowerment
The youth constitutes significant proportion of then Gambian population yet they are at a
disadvantage when it comes to employment and participation in political processes and decision-
making at the formal and community levels.
For the Gambia to graduate from LDC status, it needs to address certain fundamental challenges
confronting the country’s youth and this include the following:
- In-depth studies should be conducted on the state of employment in the country at
regular intervals to generate the required data for informed policy making and monitoring
of development outcomes particularly on youth employment and empowerment;

153
- Planning units in the ministries, departments and agencies of government work closely
with the Gambia Bureau of Statistics to regularly update their human resources database;
- Adequately resource and equip education and training institutions to address capacity
related constraints that prevent them from effectively delivering on their mandates;
- Build effective labour market institutions and systems including strengthening the
Department of Labour, for information dissemination and job-matching on youth;
- Advocacy efforts should be intensified to make the youth understand that agriculture is a
business just like any other and not an activity meant for the uneducated; and
- Appropriate incentive scheme including capital grants, subsidized loans, business advisory
services, entrepreneurship training and mentorship should be provided for youth that
take up agriculture to help them better establish and grow their busines.
Gender equality and the empowerment of women
The Gambia is a patriarchal society characterized by gender inequality. Though slowly changing,
gender inequality is still pervasive: The Gambia has a GII7 value of 0.594, ranking it 128 out of
148 countries in the 2018 index (HDI, 2018).
The challenges facing women empowerment include lack of access to education (with illiteracy
as a debilitating consequence), lack of sufficient access and equal opportunity to work providing
adequate compensation, right to land and property (farmland and credit), low level of awareness
of their rights and negative impact of harmful traditional practices such as forced and early
marriage and female genital mutilation and cutting. The household chores also contribute to the
disempowerment of women and girls as they affect equal access to education of girls and give
very little time to women to ensure equal access to decent work and remuneration.
For the Gambia to progress and graduate out of the current LDC status, conscientious efforts are
needed on the part of all arms of government, the business community, CSOs and society at large
to address the aforesaid inequalities, engendered by discrimination and marginalization
Water, sanitation and hygiene
The provision of water and sanitation are not on equal footing. Water being an essential
commodity has shown a remarkable improvement on access.

154
Sanitation and hygiene on the other hand suffered from very limited funding opportunities hence
limiting access to basic sanitation and hygiene. In the light of these considerations the following
actions are called for as part of the country’s efforts to progress and graduate from its current
LDC status:
- Conduct institutional reform and establish a Program / Project Coordination Unit for the
Ministry of Fisheries and Water Resources;
- Establish decentralized structures at the sub-national levels to enhance quality service
delivery for water, sanitation an d hygiene at all levels;
- Strengthen the human resource capacity of the water, sanitation and hygiene sector
through trainings and essential resource support for quality service delivery;
- Provide additional resources for the provision of water, sanitation and hygiene facilities
for the growing and expanding population;
- Ensure the review , updating and adoption of the National Water Policy, development of
a Strategic Plan to operationalise the Policy and the enactment of the new Water Bill
drafted within the framework of the Water Sector Reform Program;
- Ensure the review and updating of the National Policy and Strategic Plan on Sanitation
and Hygiene and support the implementation of the Plan;
- In addition, the inadequate policy and regulatory framework on basic sanitation and environmental management has contributed to poor management of waste and lack waste treatment plants. Private participation and investment in the sanitation and hygiene sub-sector are very low due largely to weak enforcement of current regulations.
- Climate change and disaster-risk reduction
Climate change and disaster-risk reduction being system-wide issues makes it nobody’s business as the saying that what is “everybody’s business is nobody’s business”. This sis the fate that most system-wide issues encounter unless very solid and effective coordination mechanisms are put in place to avoid conflicts, duplication and overlaps in institutional mandates:
- The Gambia should endeavour to establish a National Climate Change Fund as
recommended in the National Climate Change Policy;
- The Ministry should promote capacity building of its staff in specialized areas relevant to
environment and natural resources management;
155
- The Ministry should enhance its coordination mechanisms and promote cooperation with
relevant stakeholders to avoid overlaps and duplication of efforts:
- Despite the progress made in efforts to curtail the use of ODS in the Gambia, the
challenges of illegal trade of ODS, limitation of funds to organize more training for custom
officers and refrigeration and air conditioning technician as well as limited tools and
equipment – particularly the one used in recovery, recycling and retrofitting serve as
limiting factors which should be addressed.
Mobilising financial resources for development
During the era of the previous regime, due to poor governance and human rights record,
mobilising financial resources from external sources reduced significantly. As a result the then
government had to resort to massive borrowing form the domestic credit market mainly through
the issuance of treasury Bills, which are considered to be more attractive and carries les risk by
the private commercial Banks, hence resulting in the crowding out of the private sector, denying
them access to much needed investment finance to develop and grow their businesses and
create more job opportunities for the population
For the Gambia to progress and graduate from the current LDC status, the country need to
address the following issues:
- It is important to re-channel ODA inflows that were directed to civil society due to
governance and human rights issues that afflicted the previous government, back to the
public budget for better targeting and more impact. This will help in broadening and
diversifying the resource envelope of government for development financing;
- Establish a Public Private Dialogue (PPD), under the auspices of the Business Council and
the Gambia Chamber of Commerce and Industry (GCCI) with backstopping from GIEPA,
to bring together the private sector and the government at the highest level to identify
and remove critical bottlenecks to PPP and local competitiveness;
- GIEPA’s investment promotion activities should focus on attracting FDI in agro processing
mainly for groundnuts and cashew processing, fisheries and ICT and other value chain
services as well as in glass manufacturing for more impact, as recommended by the 2017
UNCTAD Investment Policy Review in The Gambia;
- Although remittances are expected to decline due to deportation schemes and the
reversal of migrations due to improved governance in The Gambia, it should be better
organized and restructured with the establishment of a “Diaspora Fund” and a “Diaspora
156
Bond” to maximize its use, considering the fact that remittances constitute The Gambia’s
most influential source of development finance;
- There have been coordination concerns in mobilizing ODA for the Gambia from the Office
of the President, the Ministry of Foreign Affairs and the Ministry of Finance and Economic
Affairs. To tackle this conflict the latter should assume the lead in all aid mobilization and
coordination to avoid the existing conflicts and overlaps in mandate
Good governance
Good governance, justice and respect for fundamental human rights are important national
objectives set out in the 1997 Constitution of The Gambia. This constitutional right
notwithstanding, over the past two decades the country witnessed widespread deterioration of
governance and the rule of law, leading to gross human rights violations, political fragility,
economic instability, growth volatility and widening inequality.
To address the aforesaid good governance challenges that the country encountered during the
22 years of brutal dictatorship, the current government through its development blueprint (NDP),
needs to address the following issues to facilitate its graduation from LDC status::
- To revise the 1997 Constitution with a view to guaranteeing the fundamental human and people rights of its citizenry;
- Effect the necessary amendments to the Criminal Code and Public Order Act with a
view to ensuring fair dispensation of justice to the citizenry;
- Effect the necessary amendments to repressive laws that stifle the fundamental freedoms of the citizenry such as Communications Act, Children’s Act, Women’s Act, District Tribunal Act, Elections Act, Ombudsman’s Act and ensure that agencies responsible for the administration of these laws are fully functional and established in all the regions of the country;
- Ensure the establishment of a fully functional Human Rights and Anti- Corruption Commissions in conformity with International standards and facilitate full compliance with reporting obligations under ratified Human Rights Treaties;
- Encourage and support the work of a Truth, Reconciliation, and Reparations Commission to ensure accountability for crimes and human rights violations committed under the former repressive regime
- Ensure the establishment of fully functional Ombudsman, NALA and ADRS offices,
Courts and Tribunals in all the Administrative Regions of the country.
157
Social protection
Government aspires for a modernized and expanded social protection system that provides reliable and effective protection from multifaceted shocks and stresses and which builds people’s resilience to adversity and hardship.
However, the current social protection system in The Gambia is fragmented and focuses on social
assistance and promotional activities, particularly schemes designed to improve food security,
address malnutrition, and promote access to education. There is less focus on healthcare and
reliable income support through cash transfers to extremely poor and vulnerable households and
individuals.
Furthermore, preventative social protection is highly limited in the country, given that social
security schemes are reduced to those employed in the formal sector. Most of the population
works in the informal sector, thus lacking any form of social security. A notable gap includes the
absence of national health insurance program, while the social security package excludes
unemployment and paid maternity leave benefits.
Although agricultural households face an ongoing risk of natural disasters with considerable
effects on their livelihoods and food security, state-led crop insurance schemes for farmers is
underdeveloped but the country is one of the pilots taking part in the Africa Risk Capacity (ARC)
of the African Union.
In the light of the above challenges, for the Gambia to progress and graduate from the current
LDC status, it needs to address the deficiencies in the current social protection scheme.
SUSTAINABILITY STRATEGIES
To sustain the gains so far registered in the country’s development endeavours as well as
smoothen its path to graduation, the following measures need to be augmented:
(i) The country needs to invest heavily in the productive sectors of the economy,
particularly the two key foreign exchange earners; agriculture and tourism, which are
susceptible to exogenous shocks; an erratic and unreliable rainfall and an
unpredictable travel industry as occasioned by the recent collapse of the Thomas
Cook Travel Agency this year, negatively affecting tourist arrivals to the country;
(ii) There is the need to invest in the human capital, education and health, as during the
era of the previous regime emphasis was placed on access through the construction
of multitude of educational and health facilities. These facilities are today suffering
from inadequacy of quality and equity considerations with the inadequacy of teaching
and learning material and qualified teachers necessary to produce the desired
158
learning outcomes that the country badly needs. In the health sector, the healthcare
facilities are equally suffering from inadequacy of basic medical equipment, qualified
medical personnel(doctors, nurses, midwives, laboratory technicians, etc.), materials
and supplies/consumables to make them effectively and efficiently useful to the
populations they serve;
(iii) For the country to progress in its development endeavours and facilitate its
graduation from LDC status, equal focus needs to be placed on the creation of a
conducive and enabling environment for attracting investment and business
opportunities. Here again the current condition of the infrastructure (roads, sea and
air transport), energy and telecommunications services are in such state that they
require improvements to address the bottlenecks they currently encounter and bring
them to international standards;
(iv) The country has a very narrow resource and export base. For ensuring the
sustainability of the gains so far registered, there is the need to broaden and diversify
the commodity and export base by investing in value addition ventures through
investments in agribusiness, service industry and other soft skills for which the
country can have a comparative advantage to be competitive;
(v) The Sustainable Development Goals (SDGs) calls on national governments that in the
design and implementation of their development programs and projects, they should
ensure that “no one is left behind”. Therefore, no country that wants to genuinely
ensure a holistic approach to its development can afford to have a large proportion
of its population marginalised, discriminated and stereotyped thus inhibiting them
from tapping their full potential for self-actualisation. This requires that the country
invests in its vulnerable group population such as women, youth, children, the elderly
and the disabled in order to provide them with equal opportunities like the non-
vulnerable sectors of the population;
(vi) The country’s public budget is heavily dependent on foreign finance through grants
and loans and through ODA and FDI. This over-dependence is not sustainable and the
country will require taking certain practical measures to develop, broaden and
diversify the domestic resource base. This would require that the government
exercises fiscal discipline to reduce the mounting fiscal deficit by reducing the size of
government, reducing the escalating recurrent government expenditure, undertake
the reform and restructuring of the State-Owned Enterprises (SoEs) to enhance their
management and operational efficiency, productivity and profitability.
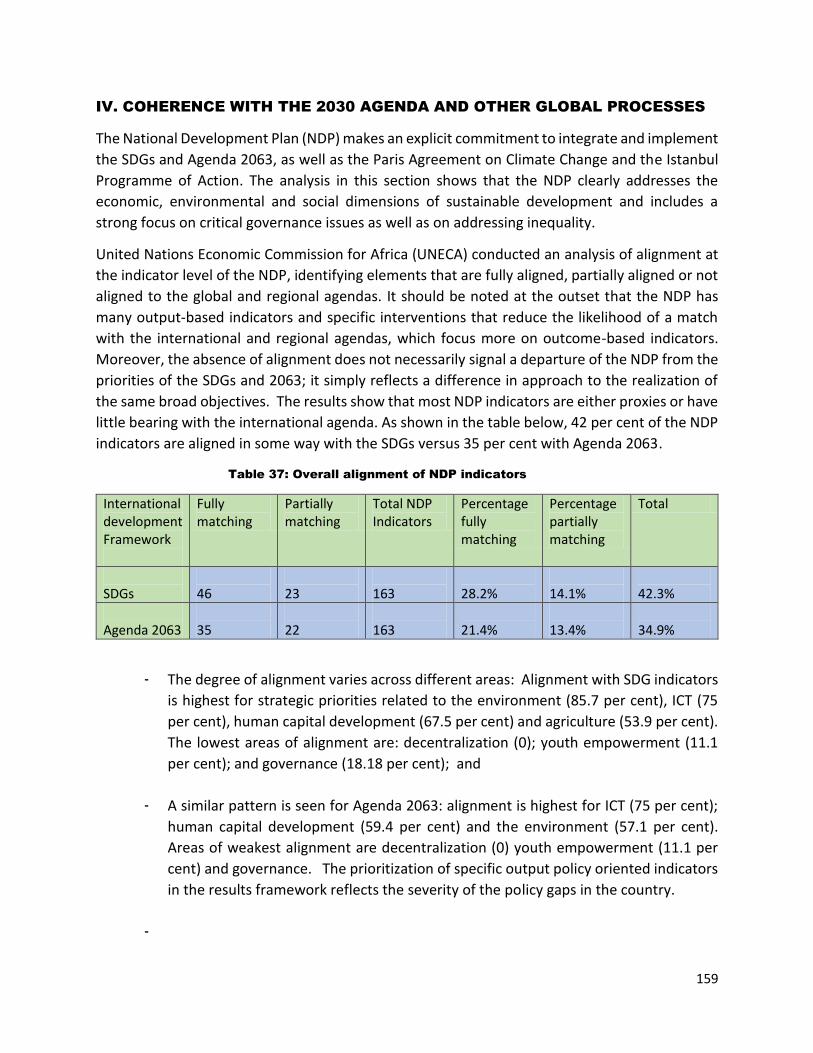
159
IV. COHERENCE WITH THE 2030 AGENDA AND OTHER GLOBAL PROCESSES
The National Development Plan (NDP) makes an explicit commitment to integrate and implement
the SDGs and Agenda 2063, as well as the Paris Agreement on Climate Change and the Istanbul
Programme of Action. The analysis in this section shows that the NDP clearly addresses the
economic, environmental and social dimensions of sustainable development and includes a
strong focus on critical governance issues as well as on addressing inequality.
United Nations Economic Commission for Africa (UNECA) conducted an analysis of alignment at
the indicator level of the NDP, identifying elements that are fully aligned, partially aligned or not
aligned to the global and regional agendas. It should be noted at the outset that the NDP has
many output-based indicators and specific interventions that reduce the likelihood of a match
with the international and regional agendas, which focus more on outcome-based indicators.
Moreover, the absence of alignment does not necessarily signal a departure of the NDP from the
priorities of the SDGs and 2063; it simply reflects a difference in approach to the realization of
the same broad objectives. The results show that most NDP indicators are either proxies or have
little bearing with the international agenda. As shown in the table below, 42 per cent of the NDP
indicators are aligned in some way with the SDGs versus 35 per cent with Agenda 2063.
Table 37: Overall alignment of NDP indicators
International development Framework
Fully matching
Partially matching
Total NDP Indicators
Percentage fully matching
Percentage partially matching
Total
SDGs
46
23
163
28.2%
14.1%
42.3%
Agenda 2063
35
22
163
21.4%
13.4%
34.9%
- The degree of alignment varies across different areas: Alignment with SDG indicators
is highest for strategic priorities related to the environment (85.7 per cent), ICT (75
per cent), human capital development (67.5 per cent) and agriculture (53.9 per cent).
The lowest areas of alignment are: decentralization (0); youth empowerment (11.1
per cent); and governance (18.18 per cent); and
- A similar pattern is seen for Agenda 2063: alignment is highest for ICT (75 per cent);
human capital development (59.4 per cent) and the environment (57.1 per cent).
Areas of weakest alignment are decentralization (0) youth empowerment (11.1 per
cent) and governance. The prioritization of specific output policy oriented indicators
in the results framework reflects the severity of the policy gaps in the country.
-
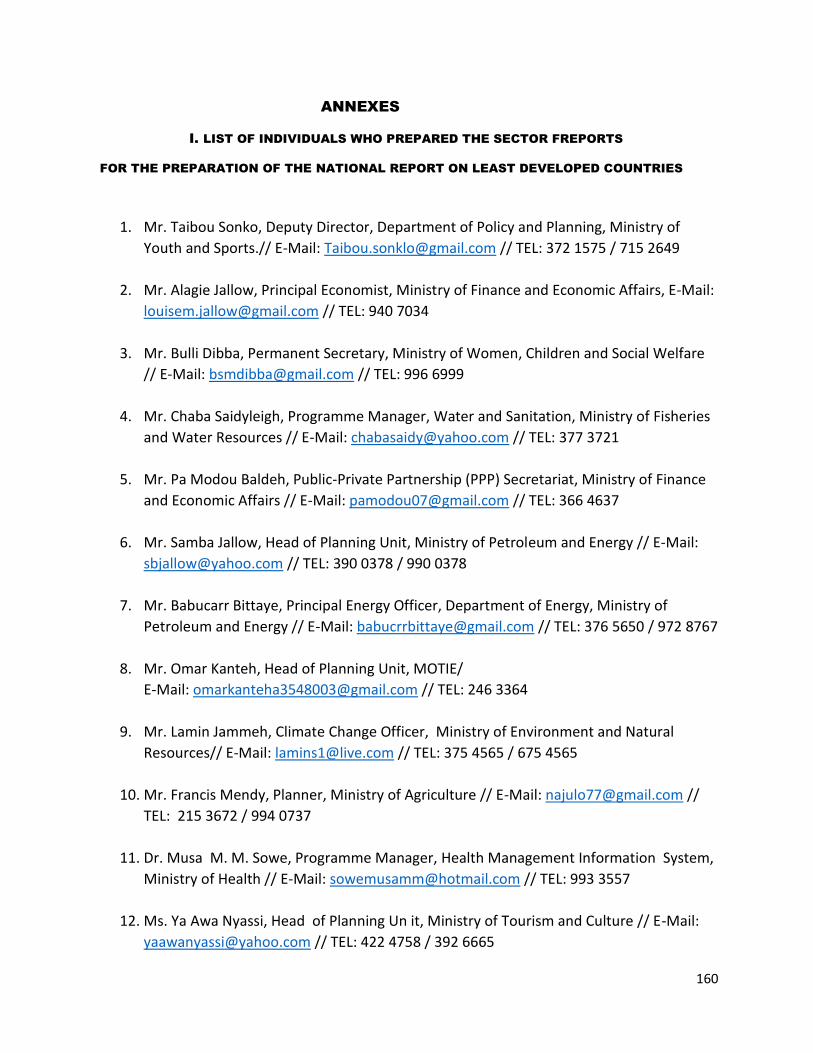
160
ANNEXES
I. LIST OF INDIVIDUALS WHO PREPARED THE SECTOR FREPORTS
FOR THE PREPARATION OF THE NATIONAL REPORT ON LEAST DEVELOPED COUNTRIES
1. Mr. Taibou Sonko, Deputy Director, Department of Policy and Planning, Ministry of
Youth and Sports.// E-Mail: [email protected] // TEL: 372 1575 / 715 2649
2. Mr. Alagie Jallow, Principal Economist, Ministry of Finance and Economic Affairs, E-Mail:
[email protected] // TEL: 940 7034
3. Mr. Bulli Dibba, Permanent Secretary, Ministry of Women, Children and Social Welfare
// E-Mail: [email protected] // TEL: 996 6999
4. Mr. Chaba Saidyleigh, Programme Manager, Water and Sanitation, Ministry of Fisheries
and Water Resources // E-Mail: [email protected] // TEL: 377 3721
5. Mr. Pa Modou Baldeh, Public-Private Partnership (PPP) Secretariat, Ministry of Finance
and Economic Affairs // E-Mail: [email protected] // TEL: 366 4637
6. Mr. Samba Jallow, Head of Planning Unit, Ministry of Petroleum and Energy // E-Mail:
[email protected] // TEL: 390 0378 / 990 0378
7. Mr. Babucarr Bittaye, Principal Energy Officer, Department of Energy, Ministry of
Petroleum and Energy // E-Mail: [email protected] // TEL: 376 5650 / 972 8767
8. Mr. Omar Kanteh, Head of Planning Unit, MOTIE/
E-Mail: [email protected] // TEL: 246 3364
9. Mr. Lamin Jammeh, Climate Change Officer, Ministry of Environment and Natural
Resources// E-Mail: [email protected] // TEL: 375 4565 / 675 4565
10. Mr. Francis Mendy, Planner, Ministry of Agriculture // E-Mail: [email protected] //
TEL: 215 3672 / 994 0737
11. Dr. Musa M. M. Sowe, Programme Manager, Health Management Information System,
Ministry of Health // E-Mail: [email protected] // TEL: 993 3557
12. Ms. Ya Awa Nyassi, Head of Planning Un it, Ministry of Tourism and Culture // E-Mail:
[email protected] // TEL: 422 4758 / 392 6665
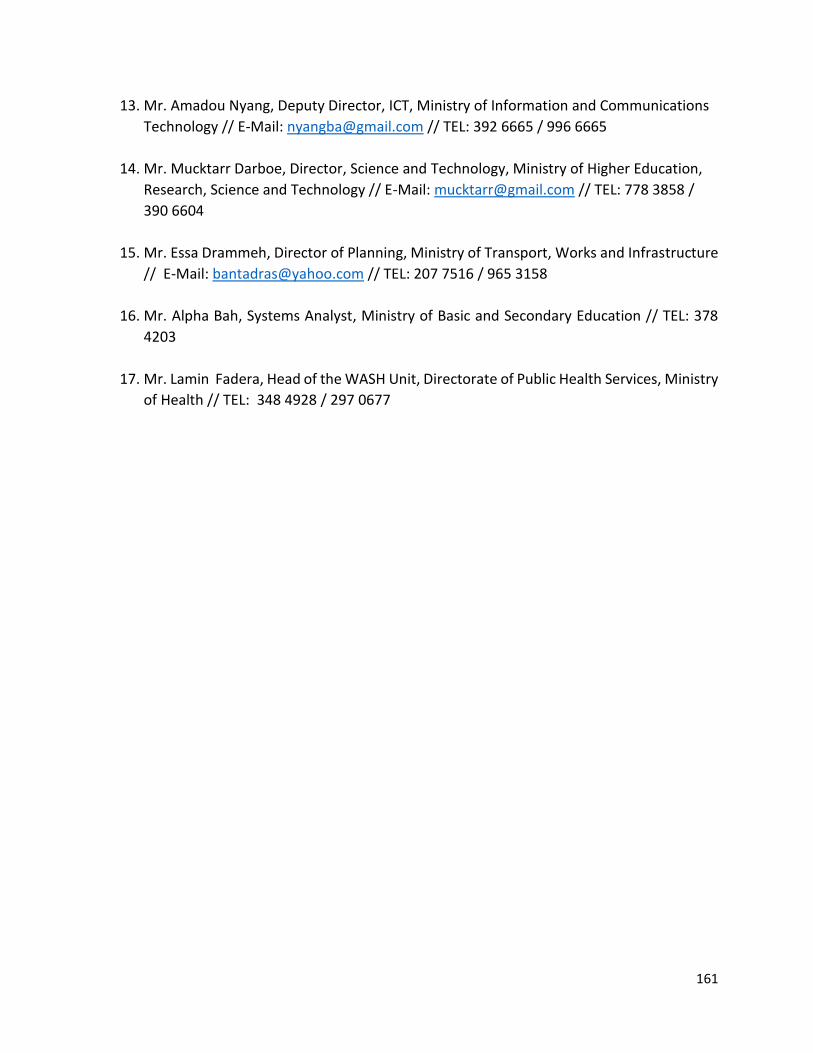
161
13. Mr. Amadou Nyang, Deputy Director, ICT, Ministry of Information and Communications
Technology // E-Mail: [email protected] // TEL: 392 6665 / 996 6665
14. Mr. Mucktarr Darboe, Director, Science and Technology, Ministry of Higher Education,
Research, Science and Technology // E-Mail: [email protected] // TEL: 778 3858 /
390 6604
15. Mr. Essa Drammeh, Director of Planning, Ministry of Transport, Works and Infrastructure
// E-Mail: [email protected] // TEL: 207 7516 / 965 3158
16. Mr. Alpha Bah, Systems Analyst, Ministry of Basic and Secondary Education // TEL: 378
4203
17. Mr. Lamin Fadera, Head of the WASH Unit, Directorate of Public Health Services, Ministry
of Health // TEL: 348 4928 / 297 0677
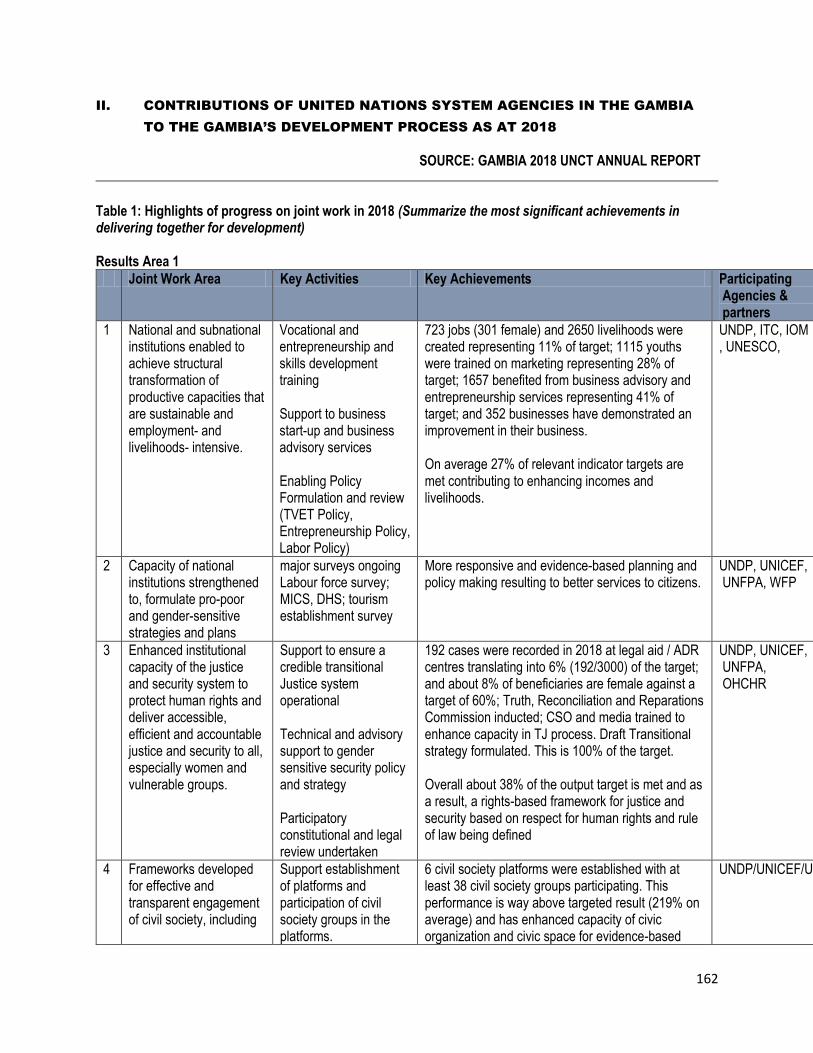
162
II. CONTRIBUTIONS OF UNITED NATIONS SYSTEM AGENCIES IN THE GAMBIA
TO THE GAMBIA’S DEVELOPMENT PROCESS AS AT 2018
SOURCE: GAMBIA 2018 UNCT ANNUAL REPORT
Table 1: Highlights of progress on joint work in 2018 (Summarize the most significant achievements in delivering together for development) Results Area 1
Joint Work Area Key Activities Key Achievements Participating Agencies & partners
Expenditure USD
1 National and subnational institutions enabled to achieve structural transformation of productive capacities that are sustainable and employment- and livelihoods- intensive.
Vocational and entrepreneurship and skills development training Support to business start-up and business advisory services Enabling Policy Formulation and review (TVET Policy, Entrepreneurship Policy, Labor Policy)
723 jobs (301 female) and 2650 livelihoods were created representing 11% of target; 1115 youths were trained on marketing representing 28% of target; 1657 benefited from business advisory and entrepreneurship services representing 41% of target; and 352 businesses have demonstrated an improvement in their business. On average 27% of relevant indicator targets are met contributing to enhancing incomes and livelihoods.
UNDP, ITC, IOM , UNESCO,
1,700,000.00
2 Capacity of national institutions strengthened to, formulate pro-poor and gender-sensitive strategies and plans
major surveys ongoing Labour force survey; MICS, DHS; tourism establishment survey
More responsive and evidence-based planning and policy making resulting to better services to citizens.
UNDP, UNICEF, UNFPA, WFP
2,050,800.00
3 Enhanced institutional capacity of the justice and security system to protect human rights and deliver accessible, efficient and accountable justice and security to all, especially women and vulnerable groups.
Support to ensure a credible transitional Justice system operational Technical and advisory support to gender sensitive security policy and strategy Participatory constitutional and legal review undertaken
192 cases were recorded in 2018 at legal aid / ADR centres translating into 6% (192/3000) of the target; and about 8% of beneficiaries are female against a target of 60%; Truth, Reconciliation and Reparations Commission inducted; CSO and media trained to enhance capacity in TJ process. Draft Transitional strategy formulated. This is 100% of the target. Overall about 38% of the output target is met and as a result, a rights-based framework for justice and security based on respect for human rights and rule of law being defined
UNDP, UNICEF, UNFPA, OHCHR
2,622,338
4 Frameworks developed for effective and transparent engagement of civil society, including
Support establishment of platforms and participation of civil society groups in the platforms.
6 civil society platforms were established with at least 38 civil society groups participating. This performance is way above targeted result (219% on average) and has enhanced capacity of civic organization and civic space for evidence-based
UNDP/UNICEF/UNESCO/ITC/UNDAIDS
100,000
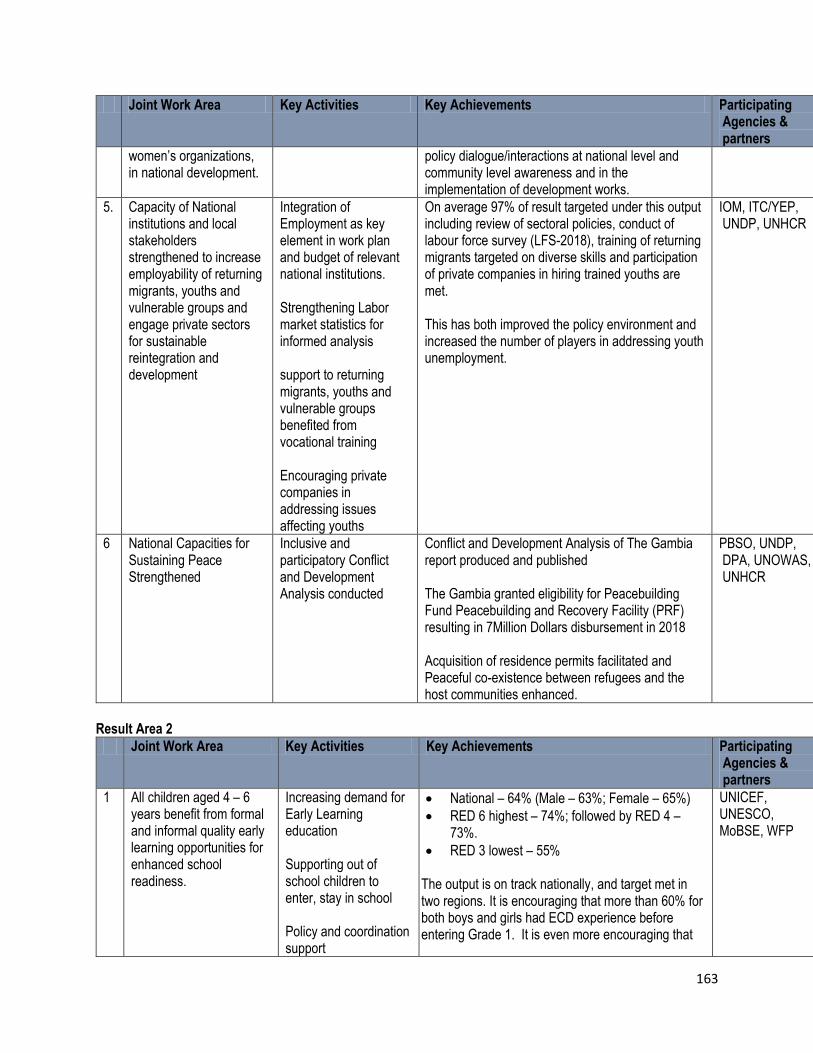
163
Joint Work Area Key Activities Key Achievements Participating Agencies & partners
Expenditure USD
women’s organizations, in national development.
policy dialogue/interactions at national level and community level awareness and in the implementation of development works.
5. Capacity of National institutions and local stakeholders strengthened to increase employability of returning migrants, youths and vulnerable groups and engage private sectors for sustainable reintegration and development
Integration of Employment as key element in work plan and budget of relevant national institutions. Strengthening Labor market statistics for informed analysis support to returning migrants, youths and vulnerable groups benefited from vocational training Encouraging private companies in addressing issues affecting youths
On average 97% of result targeted under this output including review of sectoral policies, conduct of labour force survey (LFS-2018), training of returning migrants targeted on diverse skills and participation of private companies in hiring trained youths are met. This has both improved the policy environment and increased the number of players in addressing youth unemployment.
IOM, ITC/YEP, UNDP, UNHCR
1,512,632
6 National Capacities for Sustaining Peace Strengthened
Inclusive and participatory Conflict and Development Analysis conducted
Conflict and Development Analysis of The Gambia report produced and published The Gambia granted eligibility for Peacebuilding Fund Peacebuilding and Recovery Facility (PRF) resulting in 7Million Dollars disbursement in 2018 Acquisition of residence permits facilitated and Peaceful co-existence between refugees and the host communities enhanced.
PBSO, UNDP, DPA, UNOWAS, UNHCR
177,000
Result Area 2
Joint Work Area Key Activities Key Achievements Participating Agencies & partners
Expenditure
1 All children aged 4 – 6 years benefit from formal and informal quality early learning opportunities for enhanced school readiness.
Increasing demand for Early Learning education
Supporting out of school children to enter, stay in school Policy and coordination support
National – 64% (Male – 63%; Female – 65%)
RED 6 highest – 74%; followed by RED 4 – 73%.
RED 3 lowest – 55%
The output is on track nationally, and target met in two regions. It is encouraging that more than 60% for both boys and girls had ECD experience before entering Grade 1. It is even more encouraging that
UNICEF, UNESCO, MoBSE, WFP
181,861
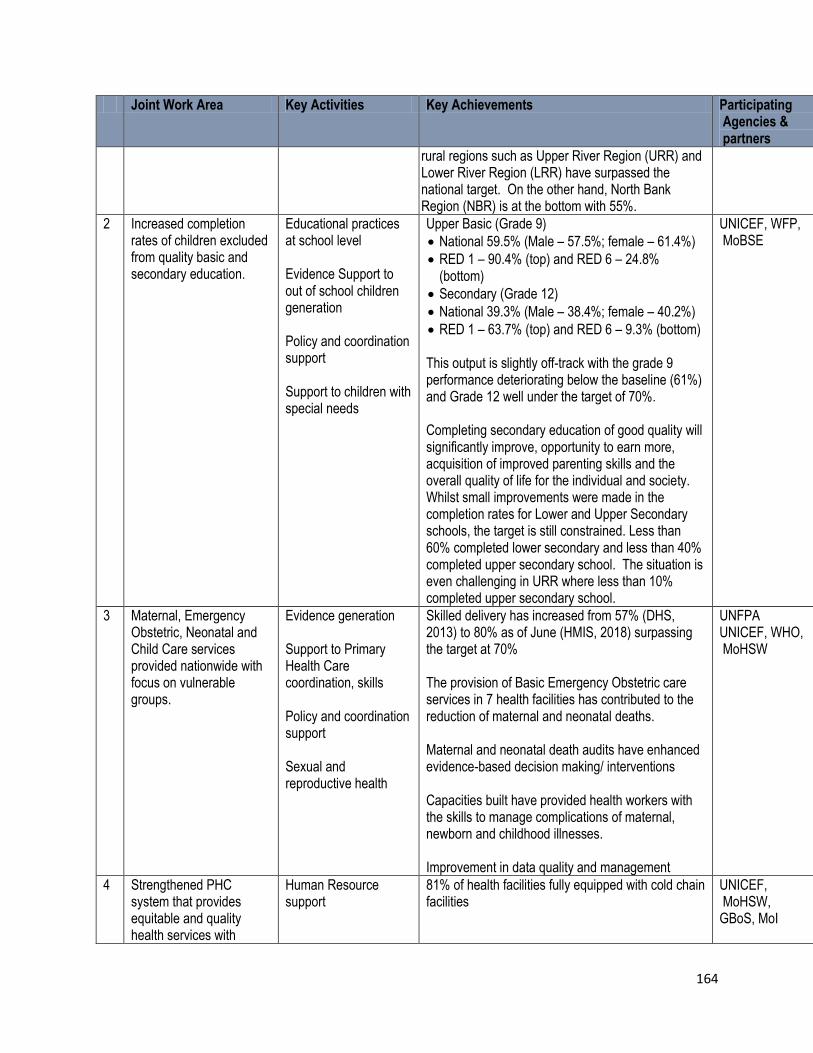
164
Joint Work Area Key Activities Key Achievements Participating Agencies & partners
Expenditure
rural regions such as Upper River Region (URR) and Lower River Region (LRR) have surpassed the national target. On the other hand, North Bank Region (NBR) is at the bottom with 55%.
2 Increased completion rates of children excluded from quality basic and secondary education.
Educational practices at school level Evidence Support to out of school children generation Policy and coordination support Support to children with special needs
Upper Basic (Grade 9)
National 59.5% (Male – 57.5%; female – 61.4%)
RED 1 – 90.4% (top) and RED 6 – 24.8% (bottom)
Secondary (Grade 12)
National 39.3% (Male – 38.4%; female – 40.2%)
RED 1 – 63.7% (top) and RED 6 – 9.3% (bottom) This output is slightly off-track with the grade 9 performance deteriorating below the baseline (61%) and Grade 12 well under the target of 70%. Completing secondary education of good quality will significantly improve, opportunity to earn more, acquisition of improved parenting skills and the overall quality of life for the individual and society. Whilst small improvements were made in the completion rates for Lower and Upper Secondary schools, the target is still constrained. Less than 60% completed lower secondary and less than 40% completed upper secondary school. The situation is even challenging in URR where less than 10% completed upper secondary school.
UNICEF, WFP, MoBSE
843,038
3 Maternal, Emergency Obstetric, Neonatal and Child Care services provided nationwide with focus on vulnerable groups.
Evidence generation Support to Primary Health Care coordination, skills Policy and coordination support Sexual and reproductive health
Skilled delivery has increased from 57% (DHS, 2013) to 80% as of June (HMIS, 2018) surpassing the target at 70% The provision of Basic Emergency Obstetric care services in 7 health facilities has contributed to the reduction of maternal and neonatal deaths. Maternal and neonatal death audits have enhanced evidence-based decision making/ interventions Capacities built have provided health workers with the skills to manage complications of maternal, newborn and childhood illnesses. Improvement in data quality and management
UNFPA UNICEF, WHO, MoHSW
149,026.96
4 Strengthened PHC system that provides equitable and quality health services with
Human Resource support
81% of health facilities fully equipped with cold chain facilities
UNICEF, MoHSW, GBoS, MoI
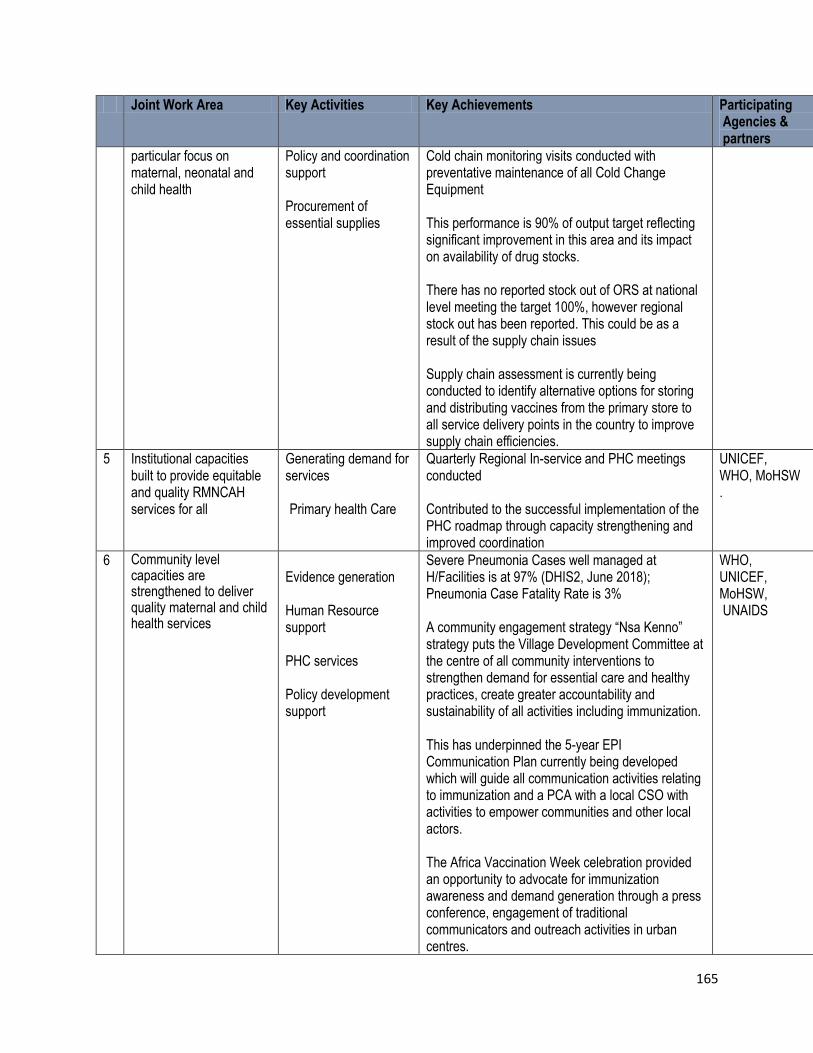
165
Joint Work Area Key Activities Key Achievements Participating Agencies & partners
Expenditure
particular focus on maternal, neonatal and child health
Policy and coordination support Procurement of essential supplies
Cold chain monitoring visits conducted with preventative maintenance of all Cold Change Equipment This performance is 90% of output target reflecting significant improvement in this area and its impact on availability of drug stocks. There has no reported stock out of ORS at national level meeting the target 100%, however regional stock out has been reported. This could be as a result of the supply chain issues Supply chain assessment is currently being conducted to identify alternative options for storing and distributing vaccines from the primary store to all service delivery points in the country to improve supply chain efficiencies.
5 Institutional capacities built to provide equitable and quality RMNCAH services for all
Generating demand for services Primary health Care
Quarterly Regional In-service and PHC meetings conducted Contributed to the successful implementation of the PHC roadmap through capacity strengthening and improved coordination
UNICEF, WHO, MoHSW .
6 Community level capacities are strengthened to deliver quality maternal and child health services
Evidence generation Human Resource support PHC services Policy development support
Severe Pneumonia Cases well managed at H/Facilities is at 97% (DHIS2, June 2018); Pneumonia Case Fatality Rate is 3% A community engagement strategy “Nsa Kenno” strategy puts the Village Development Committee at the centre of all community interventions to strengthen demand for essential care and healthy practices, create greater accountability and sustainability of all activities including immunization. This has underpinned the 5-year EPI Communication Plan currently being developed which will guide all communication activities relating to immunization and a PCA with a local CSO with activities to empower communities and other local actors.
The Africa Vaccination Week celebration provided an opportunity to advocate for immunization awareness and demand generation through a press conference, engagement of traditional communicators and outreach activities in urban centres.
WHO, UNICEF, MoHSW, UNAIDS
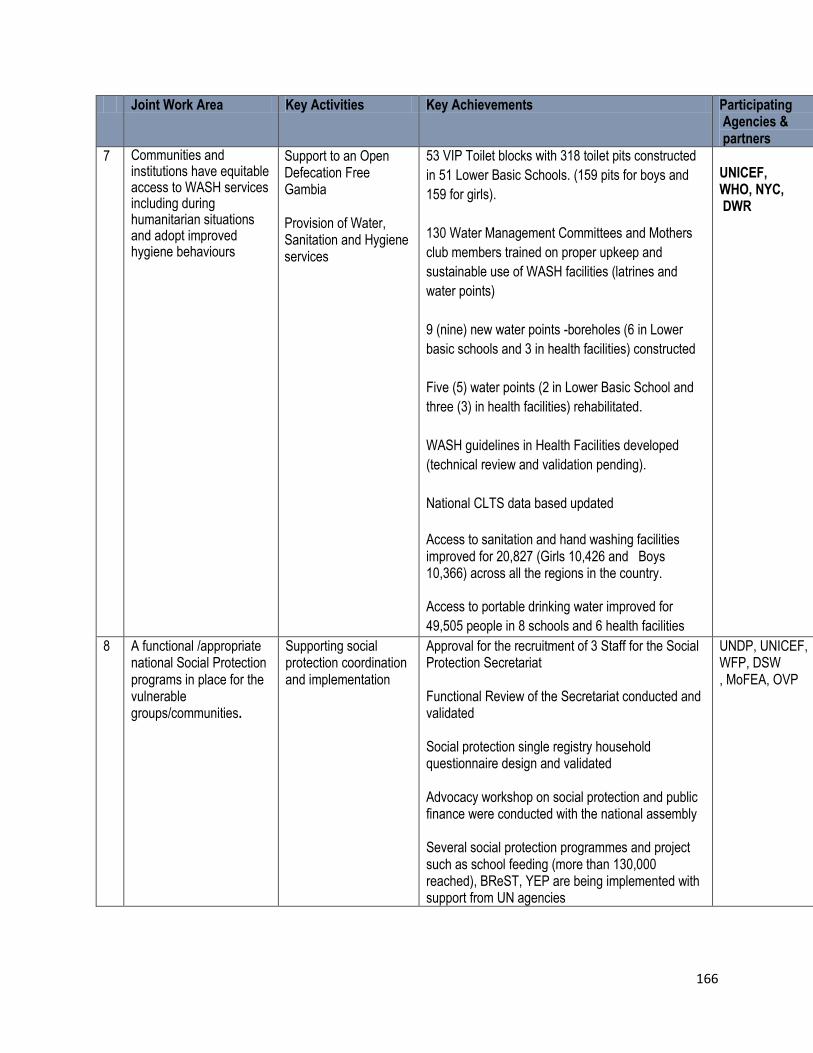
166
Joint Work Area Key Activities Key Achievements Participating Agencies & partners
Expenditure
7 Communities and institutions have equitable access to WASH services including during humanitarian situations and adopt improved hygiene behaviours
Support to an Open Defecation Free Gambia Provision of Water, Sanitation and Hygiene services
53 VIP Toilet blocks with 318 toilet pits constructed
in 51 Lower Basic Schools. (159 pits for boys and
159 for girls).
130 Water Management Committees and Mothers
club members trained on proper upkeep and
sustainable use of WASH facilities (latrines and
water points)
9 (nine) new water points -boreholes (6 in Lower
basic schools and 3 in health facilities) constructed
Five (5) water points (2 in Lower Basic School and
three (3) in health facilities) rehabilitated.
WASH guidelines in Health Facilities developed
(technical review and validation pending).
National CLTS data based updated
Access to sanitation and hand washing facilities improved for 20,827 (Girls 10,426 and Boys 10,366) across all the regions in the country. Access to portable drinking water improved for
49,505 people in 8 schools and 6 health facilities
UNICEF, WHO, NYC, DWR
8 A functional /appropriate national Social Protection programs in place for the vulnerable groups/communities.
Supporting social protection coordination and implementation
Approval for the recruitment of 3 Staff for the Social Protection Secretariat Functional Review of the Secretariat conducted and validated Social protection single registry household questionnaire design and validated Advocacy workshop on social protection and public finance were conducted with the national assembly Several social protection programmes and project such as school feeding (more than 130,000 reached), BReST, YEP are being implemented with support from UN agencies
UNDP, UNICEF, WFP, DSW , MoFEA, OVP
446,213
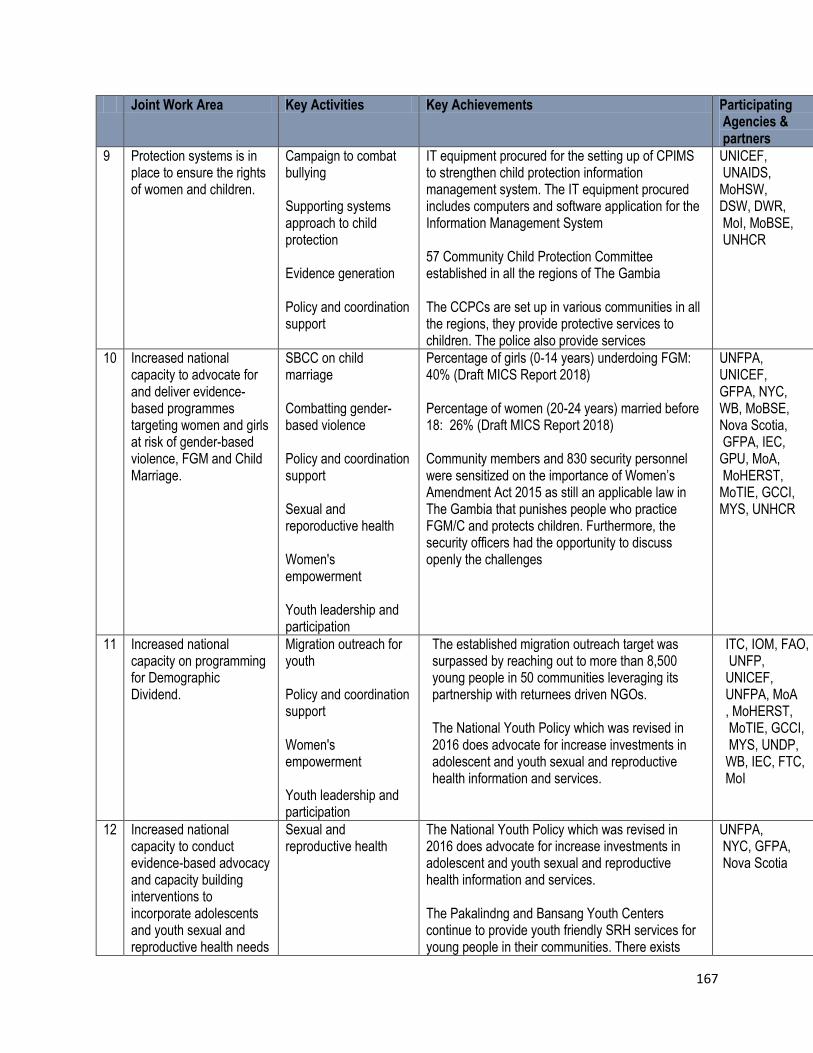
167
Joint Work Area Key Activities Key Achievements Participating Agencies & partners
Expenditure
9 Protection systems is in place to ensure the rights of women and children.
Campaign to combat bullying Supporting systems approach to child protection Evidence generation Policy and coordination support
IT equipment procured for the setting up of CPIMS to strengthen child protection information management system. The IT equipment procured includes computers and software application for the Information Management System 57 Community Child Protection Committee established in all the regions of The Gambia The CCPCs are set up in various communities in all the regions, they provide protective services to children. The police also provide services
UNICEF, UNAIDS, MoHSW, DSW, DWR, MoI, MoBSE, UNHCR
10 Increased national capacity to advocate for and deliver evidence-based programmes targeting women and girls at risk of gender-based violence, FGM and Child Marriage.
SBCC on child marriage Combatting gender-based violence Policy and coordination support Sexual and reporoductive health Women's empowerment Youth leadership and participation
Percentage of girls (0-14 years) underdoing FGM: 40% (Draft MICS Report 2018) Percentage of women (20-24 years) married before 18: 26% (Draft MICS Report 2018) Community members and 830 security personnel were sensitized on the importance of Women’s Amendment Act 2015 as still an applicable law in The Gambia that punishes people who practice FGM/C and protects children. Furthermore, the security officers had the opportunity to discuss openly the challenges
UNFPA, UNICEF, GFPA, NYC, WB, MoBSE, Nova Scotia, GFPA, IEC, GPU, MoA, MoHERST, MoTIE, GCCI, MYS, UNHCR
11 Increased national capacity on programming for Demographic Dividend.
Migration outreach for youth Policy and coordination support Women's empowerment Youth leadership and participation
The established migration outreach target was surpassed by reaching out to more than 8,500 young people in 50 communities leveraging its partnership with returnees driven NGOs. The National Youth Policy which was revised in 2016 does advocate for increase investments in adolescent and youth sexual and reproductive health information and services.
ITC, IOM, FAO, UNFP, UNICEF, UNFPA, MoA , MoHERST, MoTIE, GCCI, MYS, UNDP, WB, IEC, FTC, MoI
148,048.85
12 Increased national capacity to conduct evidence-based advocacy and capacity building interventions to incorporate adolescents and youth sexual and reproductive health needs
Sexual and reproductive health
The National Youth Policy which was revised in 2016 does advocate for increase investments in adolescent and youth sexual and reproductive health information and services. The Pakalindng and Bansang Youth Centers continue to provide youth friendly SRH services for young people in their communities. There exists
UNFPA, NYC, GFPA, Nova Scotia
93,454.57
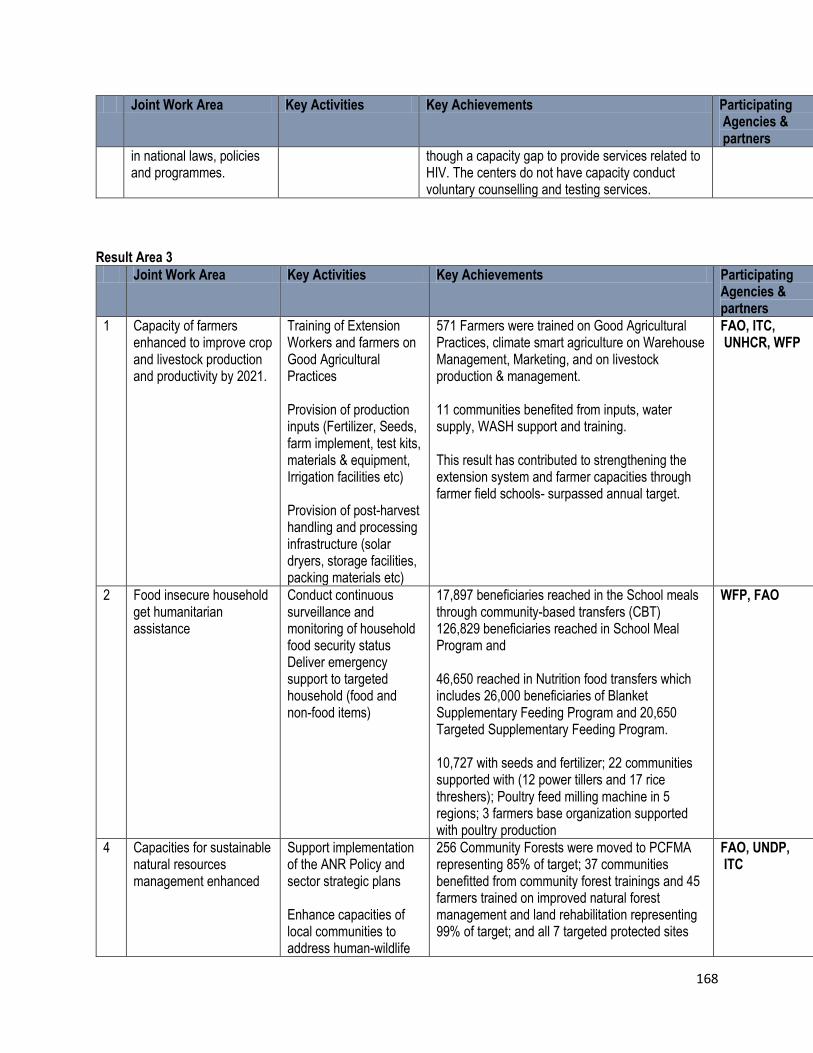
168
Joint Work Area Key Activities Key Achievements Participating Agencies & partners
Expenditure
in national laws, policies and programmes.
though a capacity gap to provide services related to HIV. The centers do not have capacity conduct voluntary counselling and testing services.
Result Area 3
Joint Work Area Key Activities Key Achievements Participating Agencies & partners
Expenditure
1 Capacity of farmers enhanced to improve crop and livestock production and productivity by 2021.
Training of Extension Workers and farmers on Good Agricultural Practices Provision of production inputs (Fertilizer, Seeds, farm implement, test kits, materials & equipment, Irrigation facilities etc) Provision of post-harvest handling and processing infrastructure (solar dryers, storage facilities, packing materials etc)
571 Farmers were trained on Good Agricultural Practices, climate smart agriculture on Warehouse Management, Marketing, and on livestock production & management. 11 communities benefited from inputs, water supply, WASH support and training. This result has contributed to strengthening the extension system and farmer capacities through farmer field schools- surpassed annual target.
FAO, ITC, UNHCR, WFP
516,273.87
2 Food insecure household get humanitarian assistance
Conduct continuous surveillance and monitoring of household food security status Deliver emergency support to targeted household (food and non-food items)
17,897 beneficiaries reached in the School meals through community-based transfers (CBT) 126,829 beneficiaries reached in School Meal Program and 46,650 reached in Nutrition food transfers which includes 26,000 beneficiaries of Blanket Supplementary Feeding Program and 20,650 Targeted Supplementary Feeding Program. 10,727 with seeds and fertilizer; 22 communities supported with (12 power tillers and 17 rice threshers); Poultry feed milling machine in 5 regions; 3 farmers base organization supported with poultry production
WFP, FAO
1,252,443
4 Capacities for sustainable natural resources management enhanced
Support implementation of the ANR Policy and sector strategic plans Enhance capacities of local communities to address human-wildlife
256 Community Forests were moved to PCFMA representing 85% of target; 37 communities benefitted from community forest trainings and 45 farmers trained on improved natural forest management and land rehabilitation representing 99% of target; and all 7 targeted protected sites
FAO, UNDP, ITC
170,000
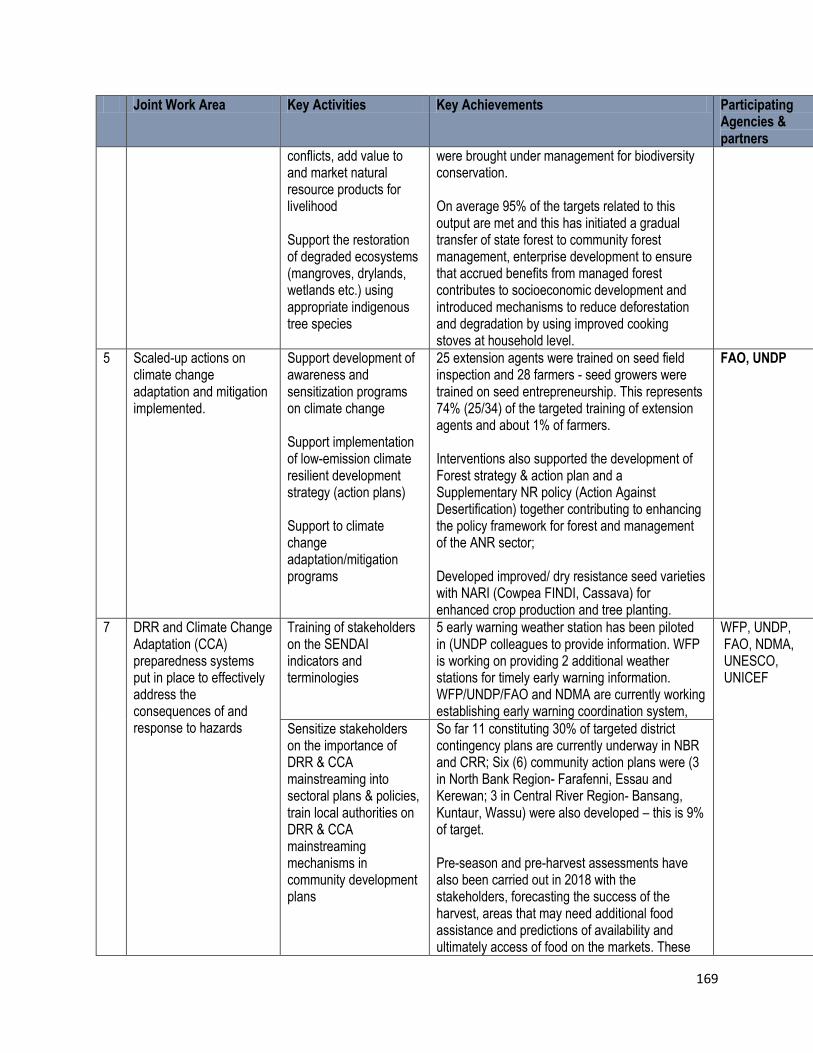
169
Joint Work Area Key Activities Key Achievements Participating Agencies & partners
Expenditure
conflicts, add value to and market natural resource products for livelihood Support the restoration of degraded ecosystems (mangroves, drylands, wetlands etc.) using appropriate indigenous tree species
were brought under management for biodiversity conservation. On average 95% of the targets related to this output are met and this has initiated a gradual transfer of state forest to community forest management, enterprise development to ensure that accrued benefits from managed forest contributes to socioeconomic development and introduced mechanisms to reduce deforestation and degradation by using improved cooking stoves at household level.
5 Scaled-up actions on climate change adaptation and mitigation implemented.
Support development of awareness and sensitization programs on climate change Support implementation of low-emission climate resilient development strategy (action plans) Support to climate change adaptation/mitigation programs
25 extension agents were trained on seed field inspection and 28 farmers - seed growers were trained on seed entrepreneurship. This represents 74% (25/34) of the targeted training of extension agents and about 1% of farmers. Interventions also supported the development of Forest strategy & action plan and a Supplementary NR policy (Action Against Desertification) together contributing to enhancing the policy framework for forest and management of the ANR sector; Developed improved/ dry resistance seed varieties with NARI (Cowpea FINDI, Cassava) for enhanced crop production and tree planting.
FAO, UNDP 280,000
7 DRR and Climate Change Adaptation (CCA) preparedness systems put in place to effectively address the consequences of and response to hazards
Training of stakeholders on the SENDAI indicators and terminologies
5 early warning weather station has been piloted in (UNDP colleagues to provide information. WFP is working on providing 2 additional weather stations for timely early warning information. WFP/UNDP/FAO and NDMA are currently working establishing early warning coordination system,
WFP, UNDP, FAO, NDMA, UNESCO, UNICEF
Sensitize stakeholders on the importance of DRR & CCA mainstreaming into sectoral plans & policies, train local authorities on DRR & CCA mainstreaming mechanisms in community development plans
So far 11 constituting 30% of targeted district contingency plans are currently underway in NBR and CRR; Six (6) community action plans were (3 in North Bank Region- Farafenni, Essau and Kerewan; 3 in Central River Region- Bansang, Kuntaur, Wassu) were also developed – this is 9% of target.
Pre-season and pre-harvest assessments have also been carried out in 2018 with the stakeholders, forecasting the success of the harvest, areas that may need additional food assistance and predictions of availability and ultimately access of food on the markets. These
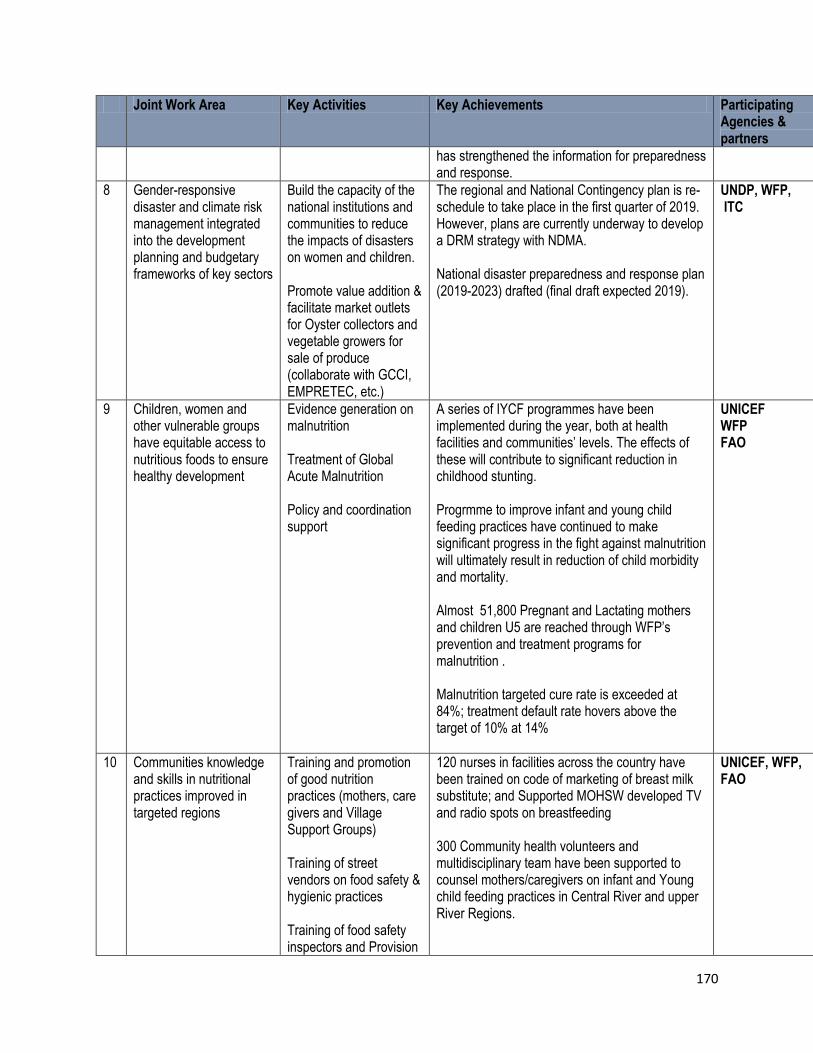
170
Joint Work Area Key Activities Key Achievements Participating Agencies & partners
Expenditure
has strengthened the information for preparedness and response.
8 Gender-responsive disaster and climate risk management integrated into the development planning and budgetary frameworks of key sectors
Build the capacity of the national institutions and communities to reduce the impacts of disasters on women and children. Promote value addition & facilitate market outlets for Oyster collectors and vegetable growers for sale of produce (collaborate with GCCI, EMPRETEC, etc.)
The regional and National Contingency plan is re-schedule to take place in the first quarter of 2019. However, plans are currently underway to develop a DRM strategy with NDMA. National disaster preparedness and response plan (2019-2023) drafted (final draft expected 2019).
UNDP, WFP, ITC
9 Children, women and other vulnerable groups have equitable access to nutritious foods to ensure healthy development
Evidence generation on malnutrition Treatment of Global Acute Malnutrition Policy and coordination support
A series of IYCF programmes have been implemented during the year, both at health facilities and communities’ levels. The effects of these will contribute to significant reduction in childhood stunting. Progrmme to improve infant and young child feeding practices have continued to make significant progress in the fight against malnutrition will ultimately result in reduction of child morbidity and mortality. Almost 51,800 Pregnant and Lactating mothers and children U5 are reached through WFP’s prevention and treatment programs for malnutrition . Malnutrition targeted cure rate is exceeded at 84%; treatment default rate hovers above the target of 10% at 14%
UNICEF WFP FAO
459,773
10 Communities knowledge and skills in nutritional practices improved in targeted regions
Training and promotion of good nutrition practices (mothers, care givers and Village Support Groups) Training of street vendors on food safety & hygienic practices Training of food safety inspectors and Provision
120 nurses in facilities across the country have been trained on code of marketing of breast milk substitute; and Supported MOHSW developed TV and radio spots on breastfeeding 300 Community health volunteers and multidisciplinary team have been supported to counsel mothers/caregivers on infant and Young child feeding practices in Central River and upper River Regions.
UNICEF, WFP, FAO
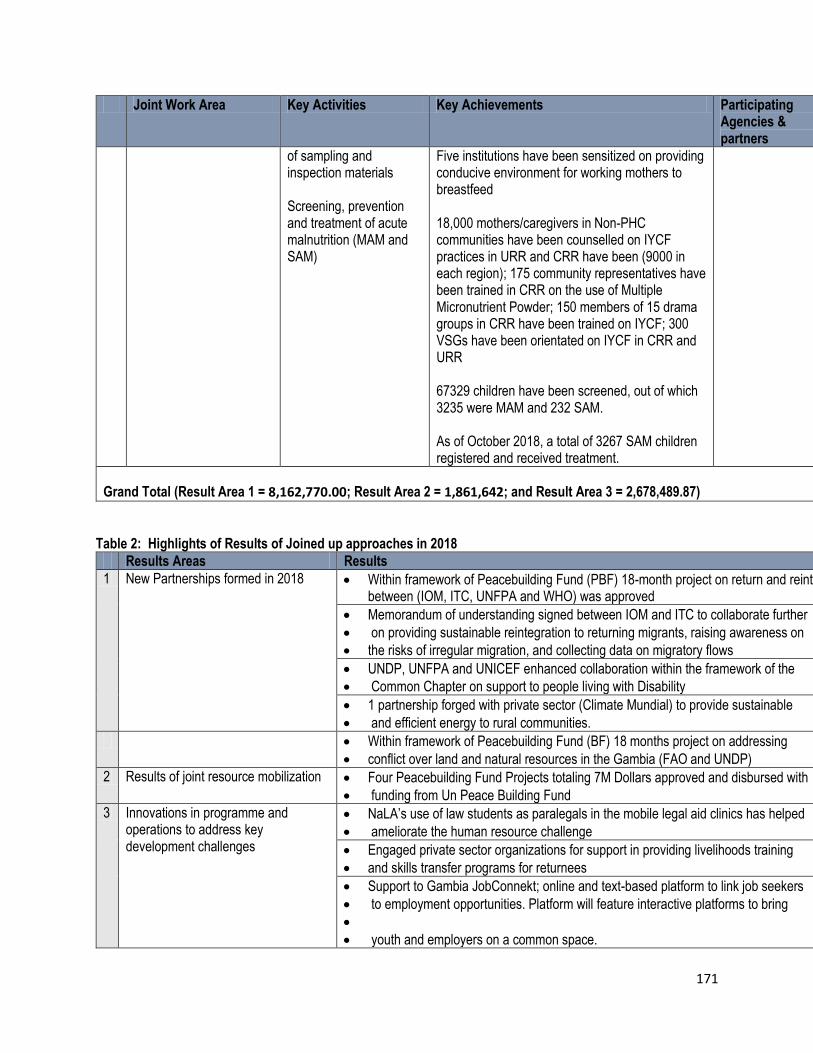
171
Joint Work Area Key Activities Key Achievements Participating Agencies & partners
Expenditure
of sampling and inspection materials Screening, prevention and treatment of acute malnutrition (MAM and SAM)
Five institutions have been sensitized on providing conducive environment for working mothers to breastfeed 18,000 mothers/caregivers in Non-PHC communities have been counselled on IYCF practices in URR and CRR have been (9000 in each region); 175 community representatives have been trained in CRR on the use of Multiple Micronutrient Powder; 150 members of 15 drama groups in CRR have been trained on IYCF; 300 VSGs have been orientated on IYCF in CRR and URR 67329 children have been screened, out of which 3235 were MAM and 232 SAM. As of October 2018, a total of 3267 SAM children registered and received treatment.
Grand Total (Result Area 1 = 8,162,770.00; Result Area 2 = 1,861,642; and Result Area 3 = 2,678,489.87) 12,702,902.25
Table 2: Highlights of Results of Joined up approaches in 2018
Results Areas Results Comments
1 New Partnerships formed in 2018 Within framework of Peacebuilding Fund (PBF) 18-month project on return and reintegration new partnership between (IOM, ITC, UNFPA and WHO) was approved
Memorandum of understanding signed between IOM and ITC to collaborate further
on providing sustainable reintegration to returning migrants, raising awareness on
the risks of irregular migration, and collecting data on migratory flows
UNDP, UNFPA and UNICEF enhanced collaboration within the framework of the
Common Chapter on support to people living with Disability
1 partnership forged with private sector (Climate Mundial) to provide sustainable
and efficient energy to rural communities.
Within framework of Peacebuilding Fund (BF) 18 months project on addressing
conflict over land and natural resources in the Gambia (FAO and UNDP)
2 Results of joint resource mobilization Four Peacebuilding Fund Projects totaling 7M Dollars approved and disbursed with
funding from Un Peace Building Fund
3 Innovations in programme and operations to address key development challenges
NaLA’s use of law students as paralegals in the mobile legal aid clinics has helped
ameliorate the human resource challenge
Engaged private sector organizations for support in providing livelihoods training
and skills transfer programs for returnees
Support to Gambia JobConnekt; online and text-based platform to link job seekers
to employment opportunities. Platform will feature interactive platforms to bring
youth and employers on a common space.
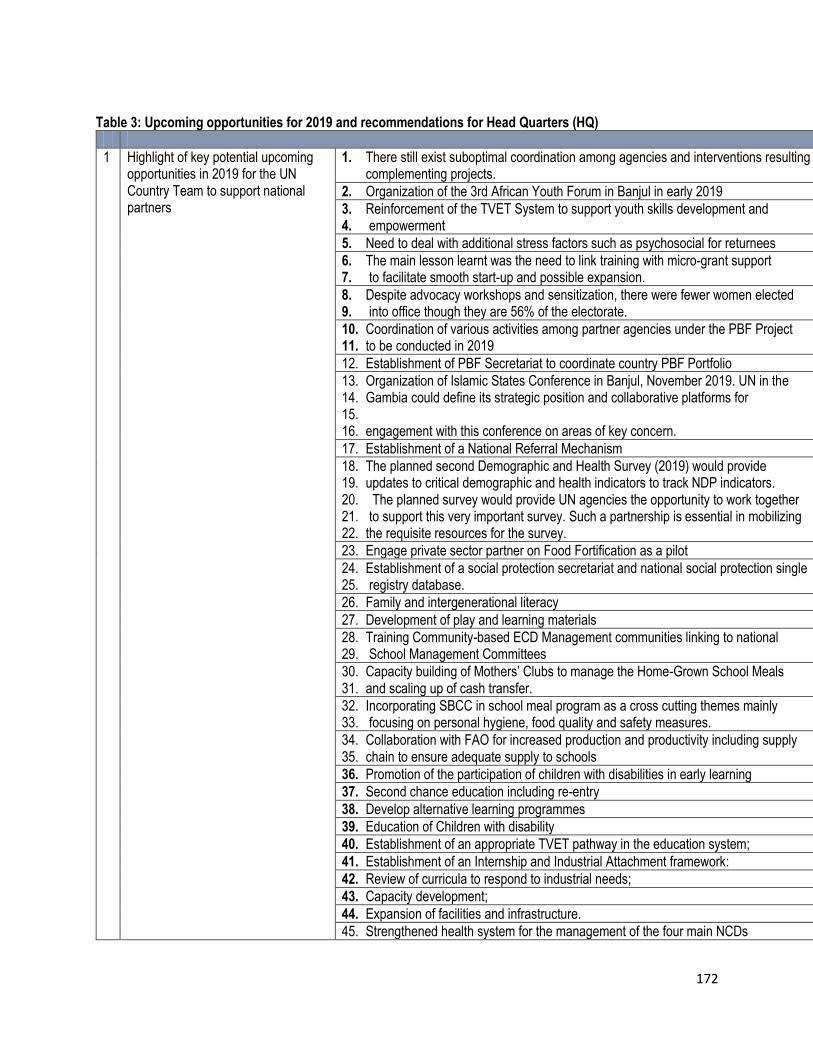
172
Table 3: Upcoming opportunities for 2019 and recommendations for Head Quarters (HQ)
1 Highlight of key potential upcoming opportunities in 2019 for the UN Country Team to support national partners
1. There still exist suboptimal coordination among agencies and interventions resulting in overlaps and loss of synergies among complementing projects.
2. Organization of the 3rd African Youth Forum in Banjul in early 2019
3. Reinforcement of the TVET System to support youth skills development and 4. empowerment
5. Need to deal with additional stress factors such as psychosocial for returnees
6. The main lesson learnt was the need to link training with micro-grant support 7. to facilitate smooth start-up and possible expansion.
8. Despite advocacy workshops and sensitization, there were fewer women elected 9. into office though they are 56% of the electorate.
10. Coordination of various activities among partner agencies under the PBF Project 11. to be conducted in 2019
12. Establishment of PBF Secretariat to coordinate country PBF Portfolio
13. Organization of Islamic States Conference in Banjul, November 2019. UN in the 14. Gambia could define its strategic position and collaborative platforms for 15. 16. engagement with this conference on areas of key concern.
17. Establishment of a National Referral Mechanism
18. The planned second Demographic and Health Survey (2019) would provide 19. updates to critical demographic and health indicators to track NDP indicators. 20. The planned survey would provide UN agencies the opportunity to work together 21. to support this very important survey. Such a partnership is essential in mobilizing 22. the requisite resources for the survey.
23. Engage private sector partner on Food Fortification as a pilot
24. Establishment of a social protection secretariat and national social protection single 25. registry database.
26. Family and intergenerational literacy
27. Development of play and learning materials
28. Training Community-based ECD Management communities linking to national 29. School Management Committees
30. Capacity building of Mothers’ Clubs to manage the Home-Grown School Meals 31. and scaling up of cash transfer.
32. Incorporating SBCC in school meal program as a cross cutting themes mainly 33. focusing on personal hygiene, food quality and safety measures.
34. Collaboration with FAO for increased production and productivity including supply 35. chain to ensure adequate supply to schools
36. Promotion of the participation of children with disabilities in early learning
37. Second chance education including re-entry
38. Develop alternative learning programmes
39. Education of Children with disability
40. Establishment of an appropriate TVET pathway in the education system;
41. Establishment of an Internship and Industrial Attachment framework:
42. Review of curricula to respond to industrial needs;
43. Capacity development;
44. Expansion of facilities and infrastructure.
45. Strengthened health system for the management of the four main NCDs
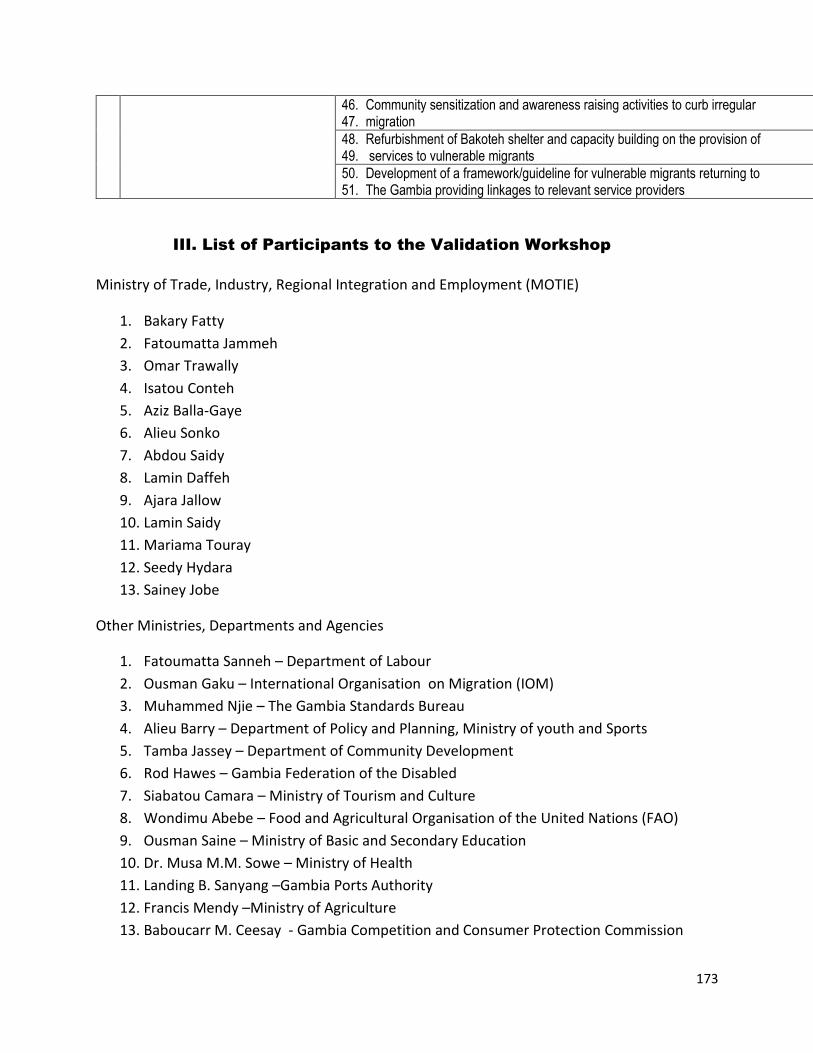
173
46. Community sensitization and awareness raising activities to curb irregular 47. migration
48. Refurbishment of Bakoteh shelter and capacity building on the provision of 49. services to vulnerable migrants
50. Development of a framework/guideline for vulnerable migrants returning to 51. The Gambia providing linkages to relevant service providers
III. List of Participants to the Validation Workshop
Ministry of Trade, Industry, Regional Integration and Employment (MOTIE)
1. Bakary Fatty
2. Fatoumatta Jammeh
3. Omar Trawally
4. Isatou Conteh
5. Aziz Balla-Gaye
6. Alieu Sonko
7. Abdou Saidy
8. Lamin Daffeh
9. Ajara Jallow
10. Lamin Saidy
11. Mariama Touray
12. Seedy Hydara
13. Sainey Jobe
Other Ministries, Departments and Agencies
1. Fatoumatta Sanneh – Department of Labour
2. Ousman Gaku – International Organisation on Migration (IOM)
3. Muhammed Njie – The Gambia Standards Bureau
4. Alieu Barry – Department of Policy and Planning, Ministry of youth and Sports
5. Tamba Jassey – Department of Community Development
6. Rod Hawes – Gambia Federation of the Disabled
7. Siabatou Camara – Ministry of Tourism and Culture
8. Wondimu Abebe – Food and Agricultural Organisation of the United Nations (FAO)
9. Ousman Saine – Ministry of Basic and Secondary Education
10. Dr. Musa M.M. Sowe – Ministry of Health
11. Landing B. Sanyang –Gambia Ports Authority
12. Francis Mendy –Ministry of Agriculture
13. Baboucarr M. Ceesay - Gambia Competition and Consumer Protection Commission

174
14. Hamey B. Jawara – Gambia Investment and Export Promotion Agency
15. Yankuba Ceesay – Ministry of Finance and Economic Affairs (MOFEA) (PPP Secretariat
16. Pa Modou Baldeh - MOFEA / PPP Secretariat
17. Chaba Saidy Leigh – Department of Water Resources
18. Adama Cham – Gambia Tourism Board
19. Adama Njie – Gambia Tourism Board