fermentation pathway kinetics and metabolic flux control in suspended and immobilized saccharomyces...
TRANSCRIPT
Fermentation pathway kinetics and metabolic flux control in suspended and immobilized Saccharomyces cerevisiae Jorge L. Galazzo and James E. Bailey
Department o f Chemical Engineering, California Institute o f Technology, Pasadena, CA
Measurements of rates of glucose uptake and of glycerol and ethanol formation combined with knowl- edge of the metabolic pathways involved in S. cerevisiae were employed to obtain in vivo rates of reaction catalysed by pathway enzymes for suspended and alginate-entrapped cells at pH 4.5 and 5.5. lntracellular concentrations of substrates and effectors for most key pathway enzymes were estimated from in vivo phosphorus-31 nuclear magnetic resonance measurements. These data show the validity in vivo of kinetic models previously proposed for phosphofructokinase and pyruvate kinase based on in vitro studies. Kinetic representations of hexokinase, glycogen synthetase, and glyceraldehyde 3- phosphate dehydrogenase, which incorporate major regulatory properties of these enzymes, are all consistent with the in vivo data. This detailed model of pathway kinetics and these data on intracellular metabolite concentrations allow evaluation of flux-control coefficients for all key enzymes involved in glucose catabolism under the four different cell environments examined. This analysis indicates that alginate entrapment increases the glucose uptake rate and shifts the step most influencing ethanol production from glucose uptake to phosphofructokinase. The rate of ATP utilization in these nongrowing cells strongly limits ethanol production at pH 5.5 but is relatively insignificant at pH 4.5.
Keywords: Immobilized cells; NMR; metabolic control; glucose fermentation
Introduction
The rate of production of a cell metabolite is often the most important property of a bioprocess. This produc- tion rate is determined by the intracellular rates of reactions in the metabolic pathway. These rates depend both on the levels of the participating enzymes and on metabolite concentrations, which in turn are dictated by the cell's genetic constitution and its environment. To optimize the environment and the cell genome for maximum metabolite production, it is important to un- derstand how pathway flux is controlled by individual pathway reactions and how this control changes in response to environmental and genetic changes.
Application of the principles of the metabolic control theory (MCT) developed in the 1970s by Kacser and Burns I and by Heinrich and Rapoport 2 provides a quan- titative method to determine the extent to which differ- ent pathway steps control overall flux. The MCT is related to another approach called Biochemical System
Address reprint requests to Dr. Bailey at the Department of Chemical Engineering, California Institute of Technology, Pasadena, CA 91125 Received 9 December 1988; revised 24 February 1989
Theory (BST) developed in the late 1960s by Sav- ageau. 3-5 MCT assumes that the rate law of each step is independent of any other step and a linear function of enzyme levels. In BST those assumptions are not needed. BST provides a general approach to deal with cases when an overall enzymatic reaction depends on gene dose, enzyme concentration, or molecular activ- ity in a nonlinear fashion. (See refs. 4 and 5 for a detailed discussion.)
The MCT requires the calculation of control coeffi- cients for each step in the pathway being studied. The magnitudes of such coefficients give the extent of con- trol exerted by each step on the overall flux throughout the pathway. The calculation of control coefficients requires a detailed knowledge of the intracellular state as well as in vivo values of system parameters such as intracellular pH and allosteric effector levels.
In this work MCT is applied to characterize the response of the yeast Saccharomyces cerevisiae to two different types of environmental manipulations. The first is external pH, which influences the proton con- centration difference across the outer cell membrane. The second manipulation considered is entrapment of yeast in calcium alginate. This immobilized configura- tion has several potential process advantages that have been discussed previously. 6-8
162 Enzyme Microb. Technol., 1990, vol. 12, March © 1990 Butterworth Publishers
Metabolic control in Saccha romyces cerev is iae : J. L. Galazzo and J. E. Bailey
Many differences between suspended and immobi- lized cell metabolism have been determined experi- mentally by several independent investigations. Altered cellular composition, 9,~° unusual cell morphol- ogy, ]°-i3 and productivity and substrate uptake en- hancement 1°'14'~5 are among the differences most often reported in the literature. However, all these studies provide only a qualitative explanation of the possible causes of such alterations. A more quantitative descrip- tion of immobilization effects upon cell metabolism is needed in order to be able to manipulate the output of immobilized cell systems, either to optimize a particu- lar process or to intensify the production of any product of interest.
In a previous paper i6 a comparison of glucose metab- olism between suspended and alginate-entrapped S. cereoisiae cells is reported. Nuclear magnetic reso- nance (NMR) spectroscopy, a noninvasive technique, was used to monitor the intracellular state of both sus- pended and immobilized cells during anaerobic conver- sion of glucose to ethanol. Temperature was main- tained at 20°C in all the experiments. Phosphorus-31 NMR of fermenting immobilized and suspended cells shows differences in intermediate metabolite levels such as fructose-l,6-diphosphate, glucose-6-phos- phate, and 3-phospho-glycerate and in intracellular pH. Carbon-13 NMR shows an increase in polysaccharide production. Glucose uptake and ethanol and glycerol production are approximately two times faster in im- mobilized cells than in suspended cells.
The experimental results obtained i6 are summarized in Table 1. In this paper, these results are used together with in vitro information from the literature to obtain
VIn I outside
Inside
61ucose
I~ ATP
H K ATP ADP ADP
s,.cose-6-r = ~ .ors [stvcostN [
ATP AOP fructose-6-P
IN; I~J
I (,,,--- ATP z z m ~
z *
Fructose-l,5-P . ] 2 GLYCEROL ] ZSa0*-- -~ I ( ~ 2 . n P
) l k S n , o 2NAOH ~i --~ ~ ~ 2 R T P
8 T P l l i 2 Phosphoenol-pyruvato ATIP ~ AOP
2NRDH-~ [~2ADP
AK 2NRO*41~ ''4~2ATP- ATP AMP ~ • L 2 ADP
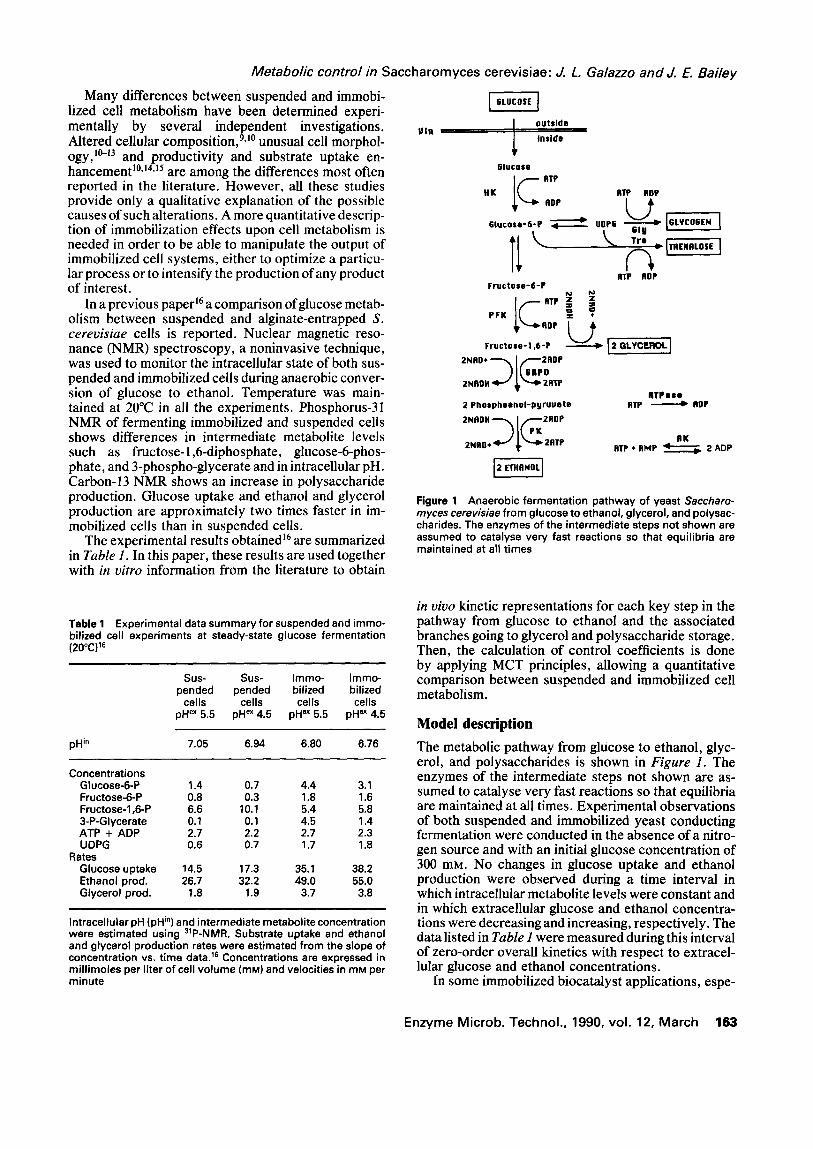
Figure 1 Anaerobic fermentation pathway of yeast Saccharo- rnyces cerevisiae from glucose to ethanol, glycerol, and polysac- charities. The enzymes of the intermediate steps not shown are assumed to catalyse very fast reactions so that equilibria are maintained at all times
Table I Experimental data summary for suspended and immo- bilized cell experiments at steady-state glucose fermentation (20°C) TM
Sus- Sus- Immo- Immo- pended pended bilized bilized
cells cells cells cells pH ex 5.5 pH ex 4.5 pH ex 5.5 pH ex 4.5
pH in 7.05 6.94 6.80 6.76
Concentrations Glucose-6-P 1.4 0.7 4.4 3.1 Fructose-6-P 0.8 0.3 1.8 1.6 Fructose-l,6-P 6.6 10.1 5.4 5,8 3-P-Glycerate 0.1 0.1 4.5 1.4 ATP + ADP 2.7 2.2 2.7 2.3 UDPG 0.6 0.7 1.7 1.8
Rates Glucose uptake 14.5 17.3 35.1 38.2 Ethanol prod. 26.7 32.2 49.0 55.0 Glycerol prod. 1.8 1.9 3.7 3.8
Intracellular pH (pH ~n) and intermediate metabolite concentration were estimated using 31P-NMR. Substrate uptake and ethanol and glycerol production rates were estimated from the slope of concentration vs. time data. TM Concentrations are expressed in millimoles per liter of cell volume (mM) and velocities in mM per minute
in vivo kinetic representations for each key step in the pathway from glucose to ethanol and the associated branches going to glycerol and polysaccharide storage. Then, the calculation of control coefficients is done by applying MCT principles, allowing a quantitative comparison between suspended and immobilized cell metabolism.
Model description The metabolic pathway from glucose to ethanol, glyc- erol, and polysaccharides is shown in Figure 1. The enzymes of the intermediate steps not shown are as- sumed to catalyse very fast reactions so that equilibria are maintained at all times. Experimental observations of both suspended and immobilized yeast conducting fermentation were conducted in the absence of a nitro- gen source and with an initial glucose concentration of 300 mM. No changes in glucose uptake and ethanol production were observed during a time interval in which intracellular metabolite levels were constant and in which extracellular glucose and ethanol concentra- tions were decreasing and increasing, respectively. The data listed in Table I were measured during this interval of zero-order overall kinetics with respect to extracel- lular glucose and ethanol concentrations.
In some immobilized biocatalyst applications, espe-
Enzyme Mic rob . Techno l . , 1990, vo l . 12, M a r c h 1 6 3
Papers
ciaUy those involving charged or hydrophobic supports or matrices, significant partitioning of reactants or products can occur between the bulk liquid solution and the intraparticle fluid contacting the biocatalyst sites. Such partitioning is not expected to any signifi- cant degree for glucose and ethanol in a process with alginate particles. Even if it did, the zero-order overall kinetic behavior observed with respect to bulk fluid glucose and ethanol concentrations clearly indicates that any partitioning of these species has no influence on the observed kinetic behavior and therefore will not be considered in this model. Furthermore, the absence of line broadening of the inorganic phosphate peak in phosphorus-3 1 NMR of immobilized yeast without glu- cose ~6 indicates that proton partitioning is also insig- nificant so that the pH inside the entrapped yeast beads is essentially the same as the pH in the surrounding bulk fluid.
Glucose enters the cell by facilitated diffusion ~7'~8 where it then enters the cell enzymatic network. The rate of this step is denoted by Vi,. Glucose is then phosphorylated by hexokinase, producing glucose-6- phosphate at rate VnK. The flow ofglucose-6-phosphate into the oxidative and nonoxidative pentose pathways is not included in the model, since experimental evi- dence ~9'2° under the same conditions as used in the experiments reported in Table 1 shows that the flow through those pathways is not significant. Trehalose and glycogen production are considered important, since an increase in polysaccharide storage is one of the observed differences between suspended and im- mobilized cells. 10,16 WTre and VGly are the rates of treha- lose and glycogen production, respectively. Glucose- 6-phosphate is considered to be at equilibrium with fructose-6-phosphate. Fructose-6-phosphate is then phosphorylated by phosphofructokinase at rate VpFK. A futile cycle between fructose-6-phosphate and fruc- tose-1,6-diphosphate is possible if the enzyme fructose- 1,6-diphosphatase is active. However, this enzyme is mostly inactive under the experimental conditions used in this study. 2° Glycerol production is also included as a branch at the fructose-1,6-diphosphate level with rate V~ov Glyceraldehyde 3-phosphate dehydrogenase has some degree of control in the pathway 2~ and is included in the model to connect the phosphofructokinase and pyruvate kinase steps. The rate of this step is denoted by VGAPD. Finally, pyruvate kinase produces ethanol at rate VpK.
Other important reactions taking place in glucose metabolism are adenylate kinase, which exchanges ATP, ADP, and AMP levels, and a generalized ATPase functioning as an ATP-sink reaction with rate VATPasc, which represents ATP consumption due to any mainte- nance requirements by the cell.
Quasi-steady-state flux relationships
The comparison between suspended and immobilized cells has been done at steady-state conditions of inter- mediate metabolite concentrations. After 10-15 min of feeding glucose to either suspended or immobilized
cells, a quasi-steady state is observed during which intermediate metabolite concentrations are relatively constant. 16 This is confirmed by observing in a 3~p_ NMR experiment an approximate time-invariant shape of the peak corresponding to the sugar phosphates.
At this steady state the rates through each step are related through the following relationships:
Vln = VHK = WTr e if- WGly d- WpF K
I VpF K = "~" (VEtoH q- VGol)
(1) 1
VFo I ~- VTr e -1- VGty = Wln -- ~ " (VEtoH "t- VGol)
VATPase = 2 " (VEtoH -- Vln )
Thus, measurement of glucose uptake (Vln), glycerol production (VGo0 and ethanol production (VEton) rates provides most of the internal reaction rates at the steady-state conditions.
Estimation of in v ivo rate parameters for key pathway reactions
Processes that change the total amount of adenine nu- cleotides are considered negligible in the time span of the experiments and are not included in the model. Therefore, the sum of adenine nucleotides (AN) is as- sumed to be constant:
AN = ATP + ADP + AMP (2)
AN is a free parameter of the model, but the same value is used for both suspended and immobilized cells in all the experimental conditions shown in Table 1 because the cells are at the same initial state. A lower bound for AN is known from the information available from NMR:
A N > A T P + ADP (3)
and, since AMP concentration is lower than the ATP and ADP concentrations in glucose-metabolizing cells, 22-24 the upper bound is conservatively assumed to be:
A N < ( 1 ) . ( A T P + ADP) (4)
ATP + ADP intracellular levels are between 2.7 and 2.2 mM (Table 1), thus, the bounds of AN are:
2.7 mM < AN < 3.3 mM (5)
AN was varied within this range in order to detect any significant sensitivity of the final results to the assumed AN value. No qualitative differences in any conclu- sions of this analysis resulted from changes of AN over this range. A value of 3 mM was assumed for the total adenine nucleotide concentration in all the experi- ments.
At steady state the adenylate kinase reaction pro- vides the following relationship:
164 Enzyme Microb. Technol., 1990, vol. 12, March
Table 2
Metabol ic control in Saccharomyces cerevisiae: J. L. Galazzo and J. E. Bailey
ATP, ADP and AMP concentrations Hcxokinase (HK) catalyses a two-substrate reaction
Suspended Suspended Immobilized Immobilized cells cells cells cells
pH *x 5.5 pH ex 4.5 pH ex 5.5 pH ex 4.5 (mM) (mM) (raM) (mM)
ATP 2.02 1.19 1.94 1.35 ADP 0.72 0.99 0.76 0.96 AMP 0.26 0.82 0.30 0.69
ATP, ADP and AMP concentrations (mmol/Lce,~) calculated using NMR information from T a b l e I and equations (2) and (6) from the text (AN = 3 mM)
Table 3 Hexokinase kinetic expression
VHK = V'~ X" K~ KAmTp . \ G 'n- ATP + ~1~ + ~- f f + 1
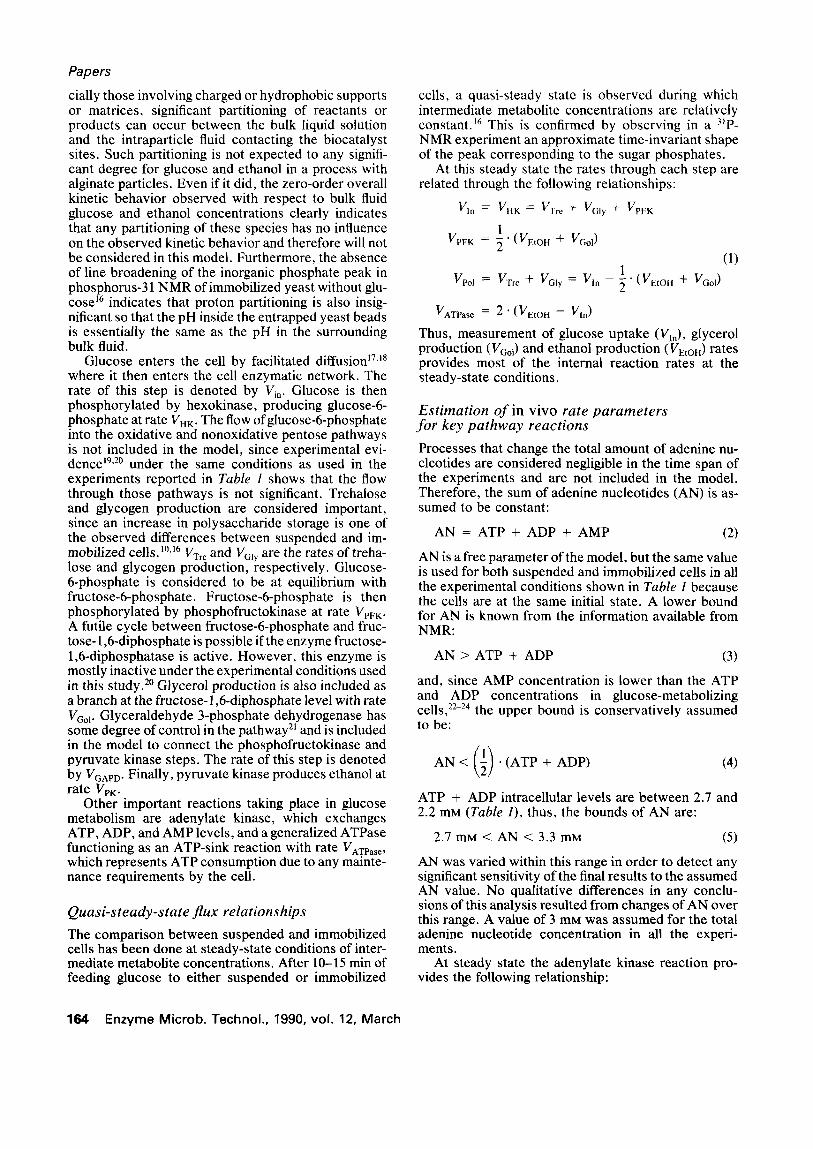
with ordered single-displacement mechanism. 29 ATP and intracellular glucose are the two enzyme sub- strates. The analytical rate expression for this enzyme is shown in Table 3. The binding constants of glucose and ATP were estimated by curve-fitting in oitro experi- ments from the literature) ~ The least-squares fitting shown in Figure 2 produced the parameter values listed in Table 3.
There is evidence that hexokinase activity is affected by changes in pH, but this influence is negligible in t h e presence of ATP in the range of p H values observed experimentally. 3: Therefore no pH dependence is in- cluded in this model. The maximal velocity of HK is
m a x taken from ref. 30: VHK = 68.5 mM min-L This value was obtained for the same yeast strain used in this work and under similar growth conditions. V ~ is assumed to be the same for both suspended and immobilized cells.
parameter values:
V~¢, x = 68,5 K~ = 0.0062
K~ = 0.11 K~T P = 0.1
Two-substrate reaction with an ordered single-displacement mechanism. 2e Concentration units are in (mmol/Lce,s), rate units are in (mmol/Lce,Jmin), and binding-constant units are in (mmol/ Lee,s). V~ x from ref. 30 and K~, K~, and K~Tp were estimated by curve-fitting experimental data of ref. 31. G 'n is the intracellular glucose concentration (adjustable parameter)
ADP 2 • =
g e q = ATP" AMP ' K¢q 1 from ref. 25 (6)
The values of ATP, ADP, and AMP shown in Table 2 are obtained using equations (2) and (6) together with the NMR information of Table 1 regarding ATP + ADP concentration.
Regulation of sugar transport in S. cerevisiae in- volves changes in the apparent affinity of the transport carrier controlled by glucose-6-phosphate concentra- tion. 26-2s Glucose-6-phosphate appears to be bound to a part of the monosaccharide transport system that is not accessible from the cell exterior, impairing both the transport capacity of the system and its affinity. 26 Therefore, the glucose uptake rate (VI,) is assumed to have a feedback mechanism regulated by the intracellu- lar glucose-6-phosphate level. A linear functionality is assumed between VIa and glucose-6-phosphate concen- tration as suggested experimentally in the literature 27 and by the data of Table 1:
Vin = V~I n + KG6 p " G6P (7)
The parameter values obtained from the data of Table 1 are:
Kc6p = - 2,1 min- i, V~I. = 19.7 mmol/(Lc~,s • min) for suspended cells and V~n = 45.7 mmol/(L¢~,s • min) for immobilized cells,
S i ~ i i I ,
0 0.5
Glucose (raM)
0.4
0.2
I 13
/ 0.5
, , , , i , , , , 0 0 0.5
ATP (raM)
Figure 2 Comparison of in vitro kinetic experiments from ref. 31 with the hexokinase kinetic model of Table3. (r l) Experimental values; ( - - ) model prediction using parameter values of Table 3
Enzyme Microb. Technol., 1990, vol. 12, March 1 6 5
P a p e r s
Table4 Glycogen synthetase is represented by Michae l i s -Men- ten kinetics w i th Glucose-6-P as effector of the UDPG binding constant and of the enzyme m a x i m u m veloc i ty 34'3~
Gty " "J'J" ' K m VGIy = (KGw)N + G6pN" K~ n 1 + + 1
\UDPG
parameter values:
K~ = 1 V~× = 14.31
K rn = 1.1 N = 8.26
KGI Y = 2
V~l~ x and N est imated f rom exper imenta l data of Table 1. Kr~, K m, and Kglv f rom ref. 34 and 35. Units as in Table 3. UDPG: ur id ine d iphospho-g lucose concentrat ion
Table 5 Phosphofructok inase kinetic expression 24'37
where:
= max. VpFK(hl, h2 ' ~) VpFK VpFK
gRXIX2R n-1 + qLgTClXlC2X2T n-1 VpFK = - R" + L T n
h 1 = F6P/KR,FSp
h 2 = ATP/K&ATP
31 = AMP/KR,AM P
c i = KR,i/KT, i
q = VT, m~#V. . . . .
parameter values:
KR,Fep = 1.
K&ATP = 0.06
KR,AM P = 0.025
L = L o . \ 1 + 3 , ]
R = 1 + ,k 1 + X2 + gRhlh2
T = 1 + c~X~ + c2h 2 + gTC~X~C2X2
L 0 is pH dependent
q = 0. CFSp = 0.0005
gR = 10. CAT P = 1.
gT = 1. CAMP = 0.019 max VpFK = 31.7
Parameter values f rom ref. 37. L0 value as a funct ion of pH taken f rom the in v i t ro re lat ionship shown in Figure 4. VpmF~ est imated f rom exper imenta l data of Table I. Units as in Table 3
Trehalose is generally produced at 10-20% of the glycogen production rate. 33 In this model it is assumed that Vxr e = 0.1 • V G l y .
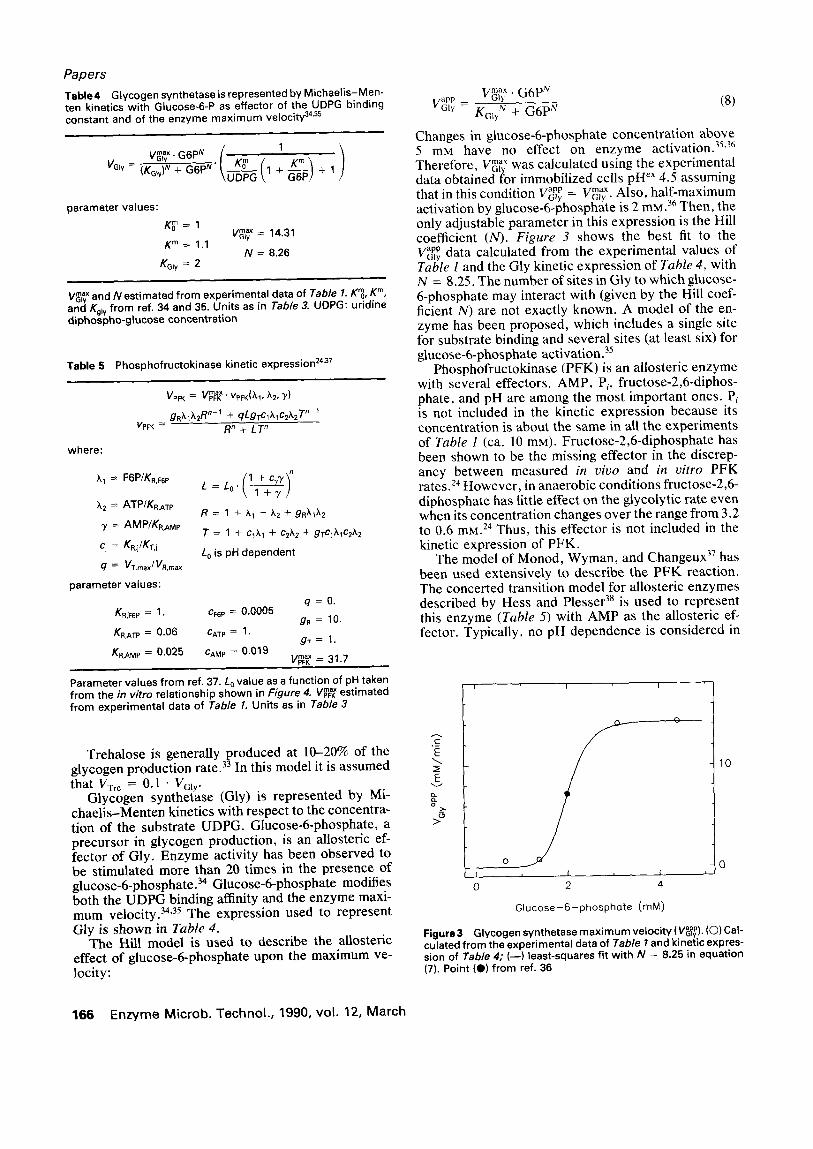
Glycogen synthetase (Gly) is represented by Mi- chaelis-Menten kinetics with respect to the concentra- tion of the substrate UDPG. Glucose-6-phosphate, a precursor in glycogen production, is an allosteric ef- fector of Gly. Enzyme activity has been observed to be stimulated more than 20 times in the presence of glucose.6.phosphate. 34 Glucose-6-phosphate modifies both the UDPG binding affinity and the enzyme maxi- mum velocity. 34'35 The expression used to represent Gly is shown in Table 4.
The Hill model is used to describe the allosteric effect of glucose-6-phosphate upon the maximum ve- locity:
vapp v~lay x ' G 6 P N
Gly = KGlyN 4_-'G--~N (8)
Changes in glucose-6-phosphate concentration above 5 mM have no effect on enzyme activation. 35'36 Therefore, V ~ was calculated using the experimental data obtained for immobilized cells pH eX 4.5 assuming that in this condition w a p p = max -~ly Vo)r. Also, half-maximum activation by glucose-6-phosphate is 2 mM.36 Then, the only adjustable parameter in this expression is the Hill coefficient (N). Figure 3 shows the best fit to the Vapp data calculated from the experimental values of
G l y
Table 1 and the Gly kinetic expression of Table 4, with N = 8.25. The number of sites in Gly to which glucose- 6-phosphate may interact with (given by the Hill coef- ficient N) are not exactly known. A model of the en- zyme has been proposed, which includes a single site for substrate binding and several sites (at least six) for glucose-6-phosphate activation. 35
Phosphofructokinase (PFK) is an allosteric enzyme with several effectors. AMP, Pi, fructose-2,6-diphos- phate, and pH are among the most important ones. Pi is not included in the kinetic expression because its concentration is about the same in all the experiments of Table 1 (ca. 10 mM). Fructose-2,6-diphosphate has been shown to be the missing effector in the discrep- ancy between measured in vivo and in vitro PFK rates. 24 However, in anaerobic conditions fructose-2,6- diphosphate has little effect on the glycolytic rate even when its concentration changes over the range from 3.2 to 0.6 mM. 24 Thus, this effector is not included in the kinetic expression of PFK.
The model of Monod, Wyman, and Changeux 37 has been used extensively to describe the PFK reaction. The concerted transition model for allosteric enzymes described by Hess and Plesser 38 is used to represent this enzyme (Table 5) with AMP as the allosteric ef- fector. Typically, no pH dependence is considered in
E
E v
& o_>,
c9 >
O
i L i
0 2 4
G l u c o s e - 6 - p h o s p h a t e (mM)
Figure 3 Glycogen synthetase m a x i m u m ve loc i ty ( V ~ ) . (O) Cal- culated f rom the exper imenta l data of Table I and kinetic expres- sion of Table 4; (--) least-squares f i t w i th N = 8.25 in equat ion (7). Point (0) f rom ref. 36
O
10
0
166 Enzyme Microb. Technol., 1990, vol. 12, March
i i i I i i
7 , , I , = , , t
7.5 8
Metabo l i c cont ro l in S a c c h a r o m y c e s c e r e v i s i a e : J. L. Galazzo and J, E, Ba i ley
. . . . j . . . . ~ 4x10 5
2x10 s
pH
0
Figure 4 Model for dependence of phosphofructokinase allo- steric constant L0 on pH obtained using the kinetic expression of Table 5 and in vitro data from refs. 24 and 40
I I
0 n,"
0
II
0 _.1
4o I = I ,
0 20
40
20
E
E v
%-
0 D o 0 O
v
Q. >
VpF K (experimental) (raM/rain)
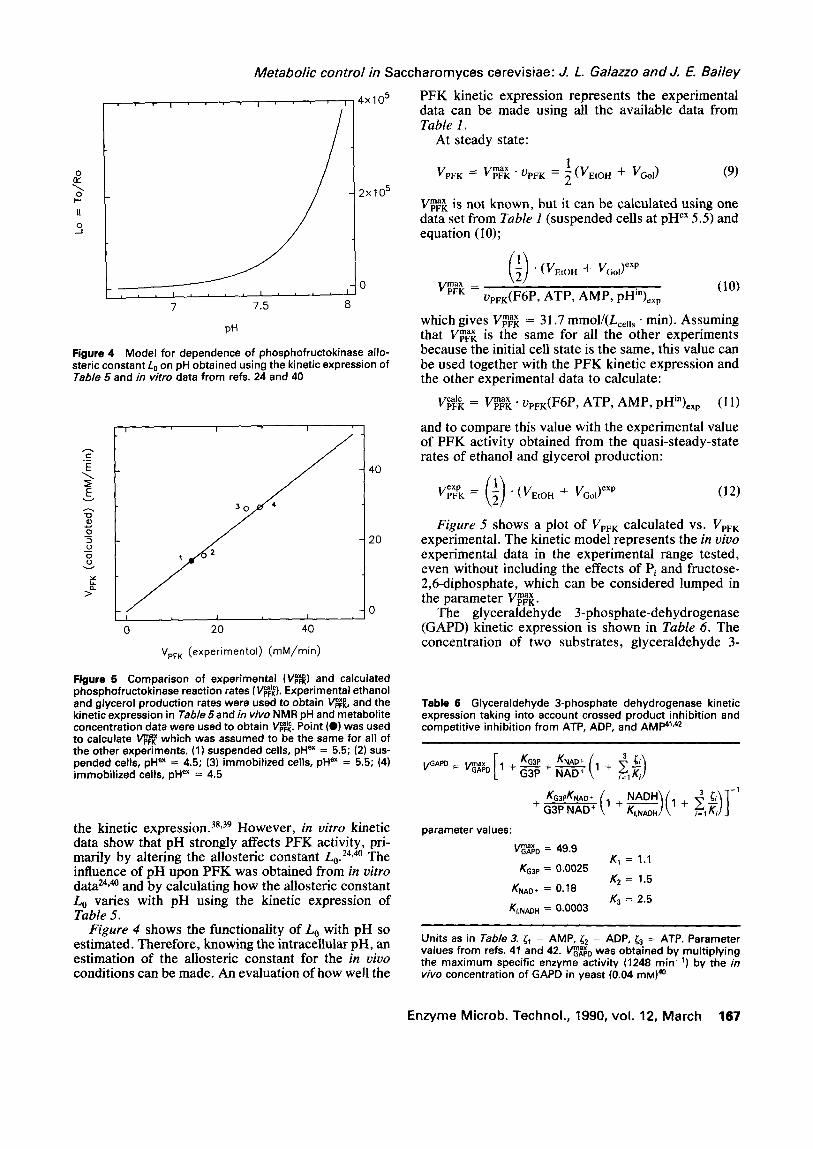
Figure 5 Comparison of experimental (V~) and calculated phosphofructokinase reaction rates (V~). Experimental ethanol and glycerol production rates were used to obtain V~ , and the kinetic expression in Table 5and in viva NMR pH and metabolite concentration data were used to obtain V~ . Point (Q) was used
msx to calculate VpFK which was assumed to be the same for all of the other experiments. (1) suspended cells, pH ex = 5.5; (2) sus- pended cells, pH ex = 4.5; (3) immobilized cells, pH ex = 5.5; (4) immobilized cells, pH ex = 4.5
the kinetic expression, s8'39 However, in vitro kinetic data show that pH strongly affects PFK activity, pri- marily by altering the allosteric constant Lo. 24,4° The influence of pH upon PFK was obtained from in vitro data 24"4° and by calculating how the allosteric constant Lo varies with pH using the kinetic expression of Table 5.
Figure 4 shows the functionality of Lo with pH so estimated. Therefore, knowing the intracellular pH, an estimation of the aUosteric constant for the in vivo conditions can be made. An evaluation of how well the
PFK kinetic expression represents the experimental data can be made using all the available data from Table 1.
At steady state:
max 1 VpF K = VpFK " VpF K ---- ~ (VEtoH + Vool) (9)
max VpF K is not known, but it can be calculated using one data set from Table 1 (suspended cells at pH ex 5.5) and equation (10);
Vpm~K UpFK(F6P, ATP, AMP, pHin)ex p (10)
which gives VpmF~ = 31.7 mmol/(Lce,s • min). Assuming that Vp~F~ is the same for all the other experiments because the initial cell state is the same, this value can be used together with the PFK kinetic expression and the other experimental data to calculate:
v c a l c max PFK = VpFK" VpFK(F6P, ATP, AMP, pHin)ex p (I 1)
and to compare this value with the experimental value of PFK activity obtained from the quasi-steady-state rates of ethanol and glycerol production:
PFK = " ( V E t o H + V G o l ) exp ( 1 2 )
Figure 5 shows a plot of VpFK calculated vs. VpF K experimental. The kinetic model represents the in vivo experimental data in the experimental range tested, even without including the effects of Pi and fructose- 2,6-diphosphate, which can be considered lumped in
max the parameter VpFK. The glyceraldehyde 3-phosphate-dehydrogenase
(GAPD) kinetic expression is shown in Table 6. The concentration of two substrates, glyceraldehyde 3-
Table 6 Glyceraldehyde 3-phosphate dehydrogenase kinetic expression taking into account crossed product inhibition and competitive inhibition from ATP, ADP, and AMP 4t42
V GAPD=VGm#D I ÷ ~ + ~ V ÷
( NADH'~ (I KG3pKNAD + 1 ÷ ÷
+ G3P NAD + K=,NAOH] \
parameter values: max VGAPD = 49.9
r1= 1.1 KG3 P = 0.0025
Kz= 1.5 KNAD+ = 0 . 1 8
K3 = 2.5 KI, NADH = 0.0003
i= l K i / J
Units as in Table 3. t~ I = AMP, ~2 = ADP, ~3 = ATP. Parameter values from refs. 41 and 42. V~G~O was obtained by multiplying the maximum specific enzyme activity (1248 rain -1) by the in viva concentration of GAPD in yeast (0.04 mM) 4°
E n z y m e M i c r o b . T e c h n o l . , 1990, vo l . 12, M a r c h 167
where:
( v;. x .) VPK = 1 + KpH/H+/
_v~¢ x VpK = ('I + KpH/H+/" VpK(L'I' h2" y)
gRXlk2 Rn-1 + qLgtc lh lc2h2T n-1 VpK = R n + L T n
X7 = PEP/KR,pE P
h2 = ADP/KB,ADP
7 = FDP/KR, FDP
Cj = KR.j/KT. j
q = VT . . . . /V . . . . .
parameter values:
KR,PE P pH dependent
KR,AD P = 5.
KR,FD e = 0 .2
L = L 0 ° \ 1 + y /
R = 1 + ~.~ + h 2+gAk~x2
T = 1 + c~x~ + c2,k2 + glcl,k.lC2,k2
L0 is pH dependent
CpEP = KR,PEp/50' gR = 0.1
CAD P = 1. gT = 1.
CFD P = 0.01 PKpH = 8.02
q = 1. Vp~ x = 3440.
Simi lar model as phosphof ruc tok inase (Tab le 5) with fructose- 1,6-d iphosphate as al loster ic activatorf1,38 Parameter values f rom refs. 38 and 43. The pH dependencies of L 0 and KR,pE P were determined f rom in v i t ro data = and are shown in F igure 6. Vp~ x est imated f rom exper imenta l data of Table I. Units as in Table 3
phosphate and NAD + , are involved in the rate equa- tion. Product inhibition by NADH is also included, as are the inhibitory effects of AMP, ADP, and A T P f '42 The maximal velocity (V~,D) of this enzyme is as- sumed to be the same for both suspended and immobi- lized cells. The ratio NADH/NAD + is an adjustable parameter of the model, as no experimental data on this ratio were obtained.
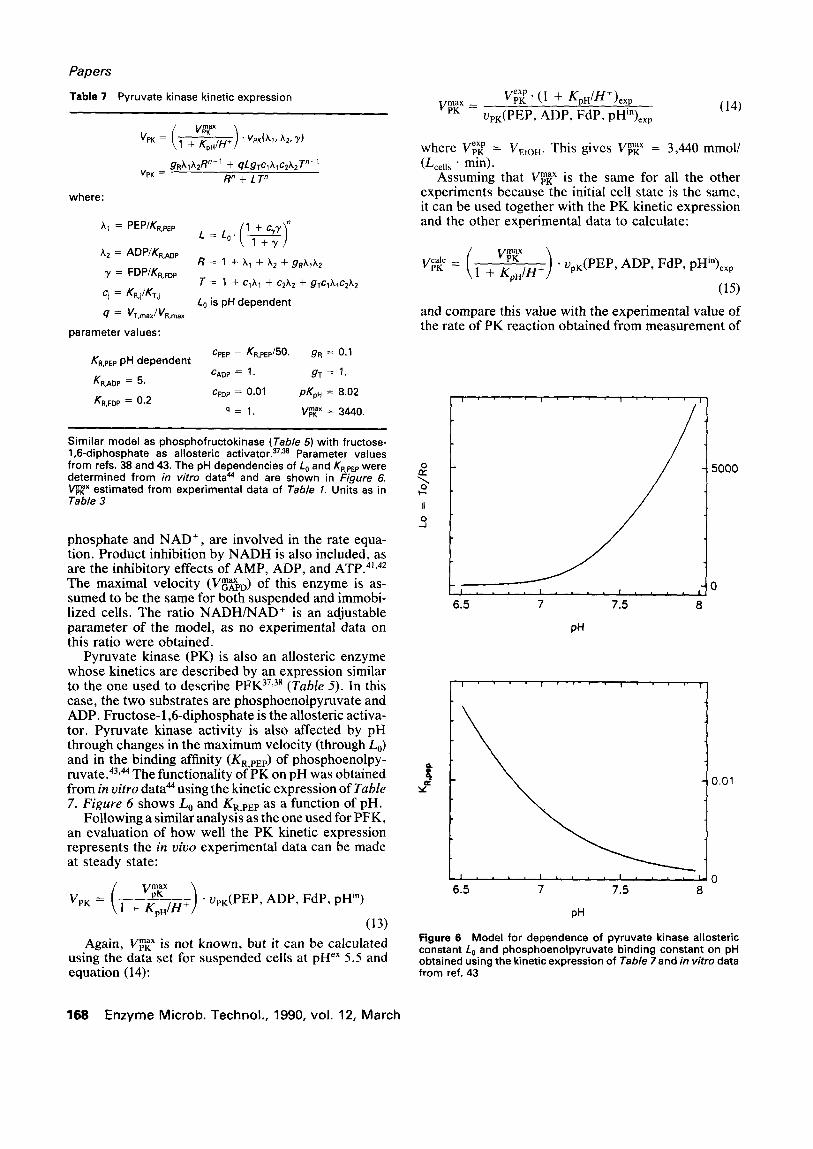
Pyruvate kinase (PK) is also an aUosteric enzyme whose kinetics are described by an expression similar to the one used to describe P F K 37,38 (Table 5). In this case, the two substrates are phosphoenolpyruvate and ADP. Fructose-1,6-diphosphate is the allosteric activa- tor. Pyruvate kinase activity is also affected by pH through changes in the maximum velocity (through L0) and in the binding affinity (KR,PEp) of phosphoenolpy- ruvate. 43'44 The functionality of PK on pH was obtained from in vitro data 44 using the kinetic expression of Table 7. Figure 6 shows L 0 and KR,PE P as a function of pH.
Following a similar analysis as the one used for PFK, an evaluation of how well the PK kinetic expression represents the in viuo experimental data can be made at steady state:
• vpK(PEP, ADP, FdP, pH i")
(13)
l , l , , I t , I I l | l
6.5 7 7.5 8
A g a i n , Vpml~ x is not known, but it can be calculated using the data set for suspended cells at pH ex 5.5 and equation (14):
vexp PK " (1 + KpH[H+)exp (14)
m a x = in VpK vpK(PEP, ADP, FdP, pH )e,,p
where vexp --PK = VEtOH" This gives Vp~ x = 3,440 mmol/ (Lceil S ' min).
Assuming that Vp~ x is the same for all the other experiments because the initial cell state is the same, it can be used together with the PK kinetic expression and the other experimental data to calculate:
/ V~'~ x \ wcalc__pK = ~k 1 + KpHIH+jI • vpK(PEP, ADP, FdP, pHin)exp
(15)
and compare this value with the experimental value of the rate of PK reaction obtained from measurement of
0
0
II 0
_ J
Q .
v
!
6.5
I ' ' ' ' I ' ' ' ,
I = = , = f I
7 7.5 8
pH
5000
I ' " ' ' 1 . . . . I ' ' ' '
P a p e r s
Table 7 Pyruvate kinase kinetic express ion
0.01
pH
Figure 6 Mode l fo r dependence of pyruvate kinase al loster ic constant L 0 and phosphoeno lpy ruva te b ind ing constant on pH obta ined using the kinetic express ion o f Table 7 and in v i t ro data f rom ref. 43
168 Enzyme Microb. Techno l . , 1990, vol. 12, March
Metabol ic cont ro l in S a c c h a r o m y c e s c e r e v i s i a e : J. L. Galazzo and J, E. Bai ley
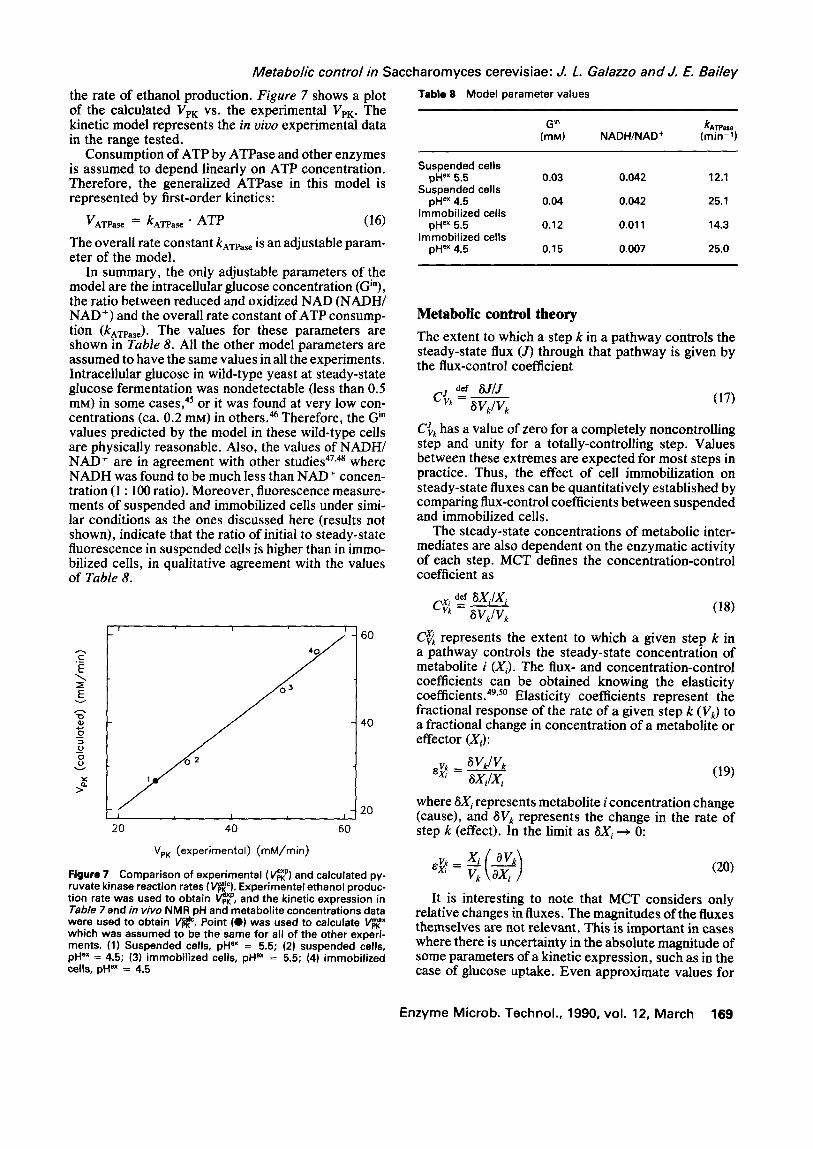
the rate of ethanol production. Figure 7 shows a plot of the calculated Vpr vs. the experimental VpK. The kinetic model represents the in vivo experimental data in the range tested.
Consumption of ATP by ATPase and other enzymes is assumed to depend linearly on ATP concentration. Therefore, the generalized ATPase in this model is represented by first-order kinetics:
VArl, as e = kATPase • ATP (16)
The overall rate constant k^rp~,~ is an adjustable param- eter of the model.
In summary, the only adjustable parameters of the model are the intracellular glucose concentration (Gi"), the ratio between reduced and oxidized NAD (NADH/ NAD ÷) and the overall rate constant of ATP consump- tion (kArp~). The values for these parameters are shown in Table 8. All the other model parameters are assumed to have the same values in all the experiments. Intracellular glucose in wild-type yeast at steady-state glucose fermentation was nondetectable (less than 0.5 mM) in some cases, 45 or it was found at very low con- centrations (ca. 0.2 mM) in others. ~ Therefore, the G ~" values predicted by the model in these wild-type cells are physically reasonable. Also, the values of NADH/ NAD ÷ are in agreement with other studies 47,~ where NADH was found to be much less than NAD + concen- tration (1 : 100 ratio). Moreover, fluorescence measure- ments of suspended and immobilized cells under simi- lar conditions as the ones discussed here (results not shown), indicate that the ratio of initial to steady-state fluorescence in suspended cells is higher than in immo- bilized cells, in qualitative agreement with the values of Table 8.
i , i i 6 0
%,_ 40
E
O 3 E
40
o o o
>=
20 I ~ I ~ I
20 40 60
VpK (experimentol) (mM/min)
Figure 7 Comparison of experimental (V~e~ p) and calculated py- ruvate kinase reaction rates (V~C). Experimental ethanol produc- tion rate was used to obtain V~p~< p, and the kinetic expression in Table 7 and in vivo NMR pH and metabolite concentrations data were used to obtain V~ c. Point (0) was used to calculate V~p~ x which w a s a s s u m e d to be the s a m e f o r all of the other experi- ments. (1) Suspended cells, pH ex = 5.5; (2) suspended cells, pH "x = 4.5; (3) immobilized cells, pHe" = 5.5; (4) immobilized cells, pH ~x = 4.5
T a b l e 8 Model parameter v a l u e s
G i" kArp=, (raM) NADH/NAD + (rain -1)
Suspended cells pH ex 5.5 0.03 0.042 12.1
Suspended cells pH ex 4.5 0.04 0.042 25.1
Immobil ized cells pH ex 5.5 0.12 0.011 14.3
Immobil ized cells pH ex 4.5 0.15 0.007 25.0
Metabolic control theory
The extent to which a step k in a pathway controls the steady-state flux (J) through that pathway is given by the flux-control coefficient
C, def ~J/J ~,k = ~ (17)
~VdVk
C~k has a value of zero for a completely noncontrolling step and unity for a totally-controlling step. Values between these extremes are expected for most steps in practice. Thus, the effect of cell immobilization on steady-state fluxes can be quantitatively established by comparing flux-control coefficients between suspended and immobilized cells.
The steady-state concentrations of metabolic inter- mediates are also dependent on the enzymatic activity of each step. MCT defines the concentration-control coefficient as
CX,, dof 8Xi/Xi = ~Vk/V, (18)
cX~ represents the extent to which a given step k in a pathway controls the steady-state concentration of metabolite i (Xi). The flux- and concentration-control coefficients can be obtained knowing the elasticity coefficients? 9,5° Elasticity coefficients represent the fractional response of the rate of a given step k (Vk) to a fractional change in concentration of a metabolite or effector (Xi):
~f = ~vdv , ~Xi/Xi ( 1 9 )
where ~X i represents metabolite i concentration change (cause), and 8Vk represents the change in the rate of step k (effect). In the limit as 8Xi -* O:
= V, / (20)
It is interesting to note that MCT considers only relative changes in fluxes. The magnitudes of the fluxes themselves are not relevant. This is important in cases where there is uncertainty in the absolute magnitude of some parameters of a kinetic expression, such as in the case of glucose uptake. Even approximate values for
E n z y m e M i c r o b . T e c h n o l . , 1990, vo l . 12, M a r c h 169
Papers the elasticity coefficients will provide quantitative in- formation regarding flux-control coefficients. In all the calculations that follow, parameters such as V~x, and Kc6 F of equation (6) were varied from the in vivo estima- tion by +-- 10%. No considerable qualitative differences regarding flux-control coefficients were obtained with such variations.
Using the enzyme kinetics described previously with the indicated parameter values and the measured intra- cellular levels of substrates, products and effectors, it is possible to calculate the elasticity coefficients, and, subsequently, to calculate the flux-control coefficients, applying connectivity and summation theorems for the case of a branched pathway. 49'5°
The enzymes in the model pathway have been classi- fied into enzymes catalysing irreversible reactions and those catalysing equilibrium reactions. The steps that are very fast and close to equilibrium can be treated regarding the input and output substances as "joint" metabolites. 5° Obviously, the flux-control coefficients of the equilibrium enzymes are zero, and only the flux- control coefficients of the nonequilibrium steps (In, HK, PFK, GAPD, PK, Pol, Gol, ATPase) are import- ant. Here Pol refers to total polysaccharide production (Vpo I = VTr e + VGIy).
The elasticity coefficients for each step are calcu- lated according to equation (19) using its respective kinetic expression. The flux- and concentration-coef- ficients are calculated using equation (21)49:
C = E -1 (21)
assuming E to be nonsingular. C is the matrix of control coefficients (fluxs and concentrations) and E is the elas- ticity matrix which has 1 s in the first row, the elasticity coefficients in the following rows, and the branch rela- tionships in the last two r o w s . 49'5°
Results and discussion
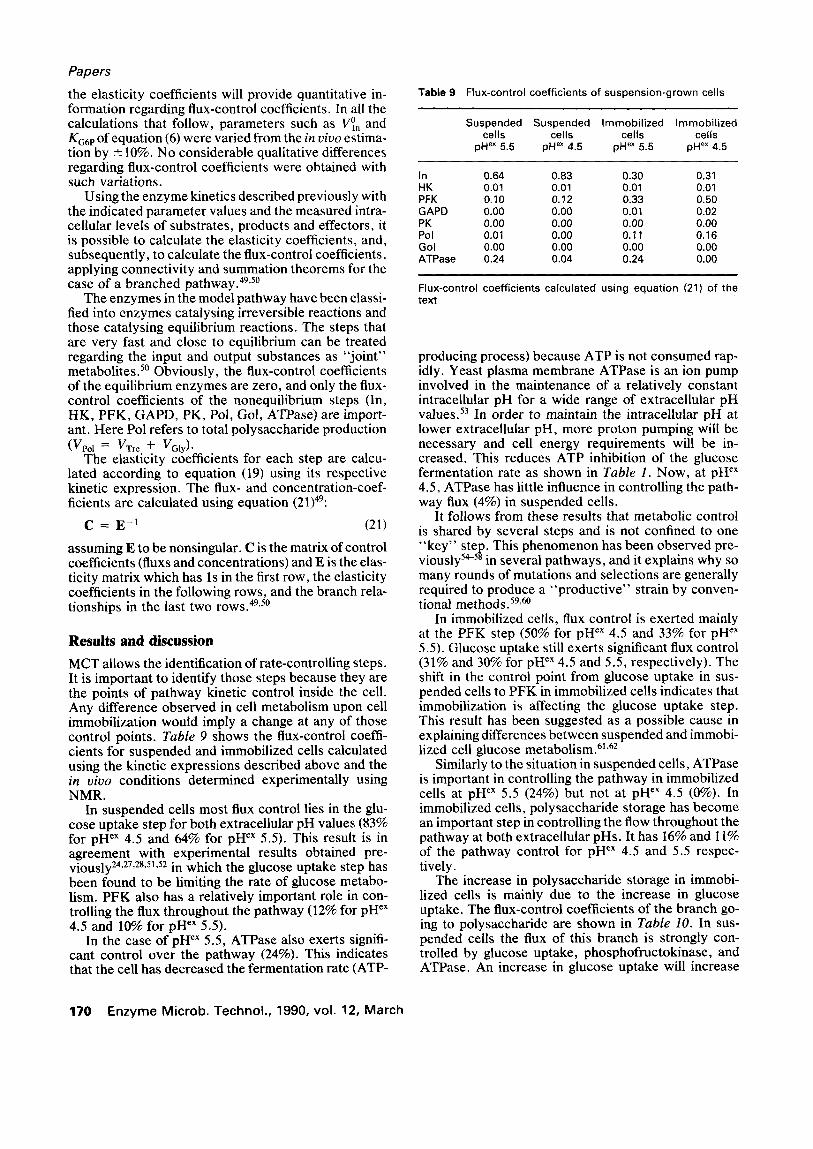
MCT allows the identification of rate-controlling steps. It is important to identify those steps because they are the points of pathway kinetic control inside the cell. Any difference observed in cell metabolism upon cell immobilization would imply a change at any of those control points. Table 9 shows the flux-control coeffi- cients for suspended and immobilized cells calculated using the kinetic expressions described above and the in vioo conditions determined experimentally using NMR.
In suspended cells most flux control lies in the glu- cose uptake step for both extracellular pH values (83% for pH ~x 4.5 and 64% for pH *x 5.5). This result is in agreement with experimental results obtained pre- viously za'zT'28,51'Sz in which the glucose uptake step has been found to be limiting the rate of glucose metabo- lism. PFK also has a relatively important role in con- trolling the flux throughout the pathway (12% for pH ex 4.5 and 10% for pH *x 5.5).
In the case of pH ~ 5.5, ATPase also exerts signifi- cant control over the pathway (24%). This indicates that the cell has decreased the fermentation rate (ATP-
Table 9 Flux-control coefficients of suspension-grown cells
Suspended Suspended Immobil ized Immobil ized cells cells cells cells
pH ex 5.5 pH ex 4,5 pH e× 5.5 pH ex 4.5
In 0.64 0.83 0.30 0.31 HK 0.01 0.01 0.01 0.01 PFK 0.10 0.12 0.33 0.50 GAPD 0.00 0.00 0.01 0.02 PK 0.00 0.00 0.00 0.00 Pol 0.01 0.00 0.11 0.16 Gol 0.00 0.00 0.00 0.00 ATPase 0.24 0.04 0.24 0.00
Flux-control coefficients calculated using equation (21) of the text
producing process) because ATP is not consumed rap- idly. Yeast plasma membrane ATPase is an ion pump involved in the maintenance of a relatively constant intracellular pH for a wide range of extracellular pH values: 3 In order to maintain the intracellular pH at lower extracellular pH, more proton pumping will be necessary and cell energy requirements will be in- creased. This reduces ATP inhibition of the glucose fermentation rate as shown in Table 1. Now, at pH ex 4.5, ATPase has little influence in controlling the path- way flux (4%) in suspended cells.
It follows from these results that metabolic control is shared by several steps and is not confined to one "key" step. This phenomenon has been observed pre- viously 54-58 in several pathways, and it explains why so many rounds of mutations and selections are generally required to produce a "productive" strain by conven- tional methods. 59'6°
In immobilized cells, flux control is exerted mainly at the PFK step (50% for pH ex 4.5 and 33% for pH ex 5.5). Glucose uptake still exerts significant flux control (31% and 30% for pH ex 4.5 and 5.5, respectively). The shift in the control point from glucose uptake in sus- pended cells to PFK in immobilized cells indicates that immobilization is affecting the glucose uptake step. This result has been suggested as a possible cause in explaining differences between suspended and immobi- lized cell glucose metabolism. 6t'62
Similarly to the situation in suspended cells, ATPase is important in controlling the pathway in immobilized cells at pH ex 5.5 (24%) but not at pH ¢x 4.5 (0%). In immobilized cells, polysaccharide storage has become an important step in controlling the flow throughout the pathway at both extracellular pHs. It has 16% and 11% of the pathway control for pH ex 4.5 and 5.5 respec- tively.
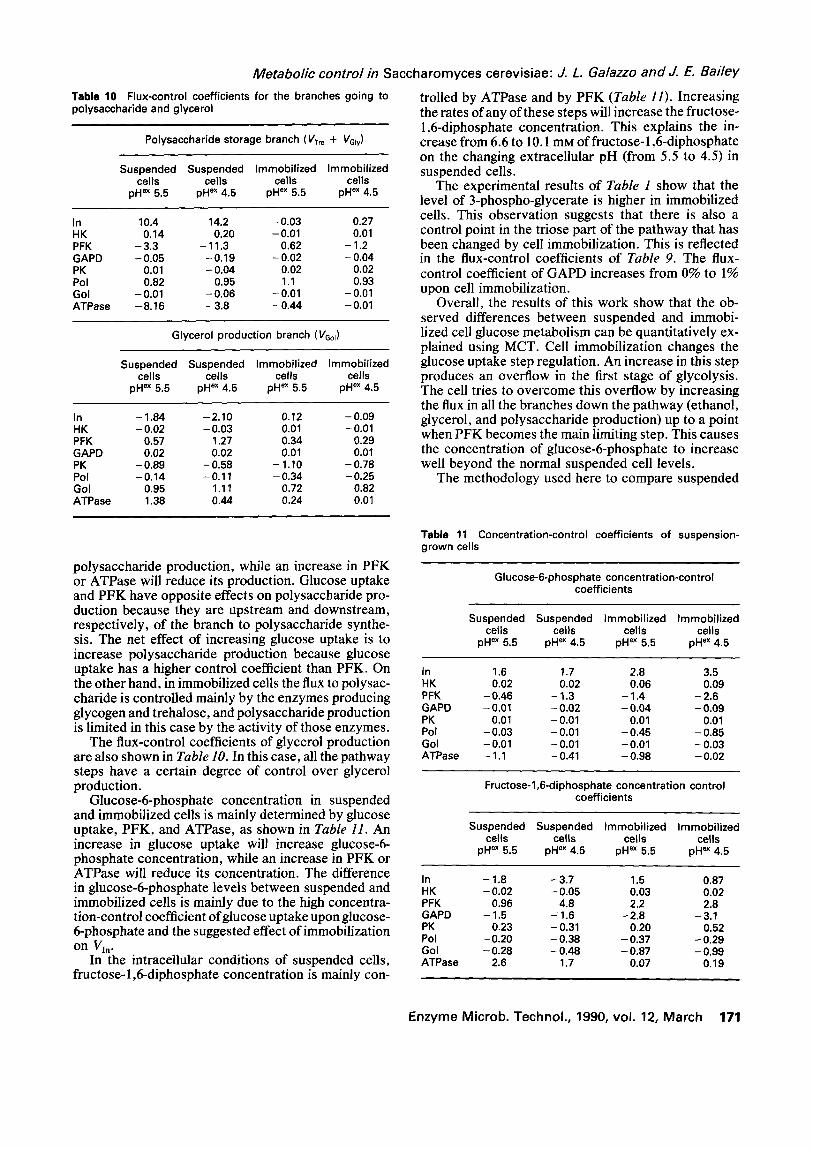
The increase in polysaccharide storage in immobi- lized cells is mainly due to the increase in glucose uptake. The flux-control coefficients of the branch go- ing to polysaccharide are shown in Table 10. In sus- pended cells the flux of this branch is strongly con- trolled by glucose uptake, phosphofructokinase, and ATPase. An increase in glucose uptake will increase
170 Enzyme M ic rob . Techno l . , 1990, vo l . 12, Ma rch
Metabolic control in S a c c h a r o m y c e s c e r e v i s i a e : J. L. Galazzo and J. E, Bailey
T a b l e 10 Flux-control coef f ic ients for the branches going to p o l y s a c c h a r i d e and glycerol
Polysaccharide storage branch (Vrr e + VGfy)
Suspended Suspended Immobil ized Immobil ized cells cel ls cells cells
pH ex 5.5 pH ex 4.5 pH ex 5.5 pH ex 4.5
In 10.4 14.2 -0 .03 0.27 HK 0.14 0.20 -0.01 0.01 PFK - 3.3 - 11.3 - 0.62 - 1.2 GAPD -0 .05 -0 .19 -0 .02 -0 .04 PK 0.01 - 0.04 0.02 0.02 Pol 0 .82 0 .95 1.1 0.93 Gol -0.01 -0 .06 -0.01 -0.01 A T P a s e -8 .16 - 3 .8 -0 .44 -0.01
Glycerol product ion branch (VGol)
Suspended Suspended Immobil ized Immobil ized cells cel ls cells cells
pH ex 5.5 pH ex 4.5 pH ex 5.5 pH ex 4.5
In - 1.84 -2 .10 0.12 -0 .09 HK - 0.02 - 0.03 0.01 - 0.01 PFK 0.57 1.27 0.34 0.29 GAPD 0.02 0.02 0.01 0.01 PK - 0 . 8 9 - 0 . 5 8 - 1.10 - 0 . 7 8 Pol -0 .14 -0.11 -0 .34 -0 .25 Gol 0.95 1.11 0.72 0.82 ATPase 1.38 0.44 0.24 0.01
trolled by ATPase and by PFK (Table 11). Increasing the rates of any of these steps will increase the fructose- 1,6-diphosphate concentration. This explains the in- crease from 6.6 to 10.1 mM offructose-l,6-diphosphate on the changing extracellular pH (from 5.5 to 4.5) in suspended cells.
The experimental results of Table 1 show that the level of 3-phospho-glycerate is higher in immobilized cells. This observation suggests that there is also a control point in the triose part of the pathway that has been changed by cell immobilization. This is reflected in the flux-control coefficients of Table 9. The flux- control coefficient of GAPD increases from 0% to 1% upon cell immobilization.
Overall, the results of this work show that the ob- served differences between suspended and immobi- lized cell glucose metabolism can be quantitatively ex- plained using MCT. Cell immobilization changes the glucose uptake step regulation. An increase in this step produces an overflow in the first stage of glycolysis. The cell tries to overcome this overflow by increasing the flux in all the branches down the pathway (ethanol, glycerol, and polysaccharide production) up to a point when PFK becomes the main limiting step. This causes the concentration of glucose-6-phosphate to increase well beyond the normal suspended cell levels.
The methodology used here to compare suspended
polysaccharide production, while an increase in PFK or ATPase will reduce its production. Glucose uptake and PFK have opposite effects on polysaccharide pro- duction because they are upstream and downstream, respectively, of the branch to polysaccharide synthe- sis. The net effect of increasing glucose uptake is to increase polysaccharide production because glucose uptake has a higher control coefficient than PFK. On the other hand, in immobilized cells the flux to polysac- charide is controlled mainly by the enzymes producing glycogen and trehalose, and polysaccharide production is limited in this case by the activity of those enzymes.
The flux-control coefficients of glycerol production are also shown in Table 10. In this case, all the pathway steps have a certain degree of control over glycerol production.
Glucose-6-phosphate concentration in suspended and immobilized cells is mainly determined by glucose uptake, PFK, and ATPase, as shown in Table 11. An increase in glucose uptake will increase glucose-6- phosphate concentration, while an increase in PFK or ATPase will reduce its concentration. The difference in glucose-6-phosphate levels between suspended and immobilized cells is mainly due to the high concentra- tion-control coefficient of glucose uptake upon glucose- 6-phosphate and the suggested effect of immobilization on Via.
In the intracellular conditions of suspended cells, fructose-1,6-diphosphate concentration is mainly con-
T a b l e 11 C o n c e n t r a t i o n - c o n t r o l coe f f ic ien ts o f s u s p e n s i o n - g r o w n cells
Glucose-6-phosphate concentrat ion-control coef f ic ien ts
Suspended Suspended Immobi l ized Immobi l ized cells cel ls cel ls cel ls
pH ex 5.5 pH ex 4.5 pH ex 5.5 pH ex 4.5
In 1.6 1.7 2.8 3.5 HK 0.02 0.02 0.06 0.09 PFK -0 .46 - 1.3 - 1.4 - 2 .6 GAPD - 0.01 - 0.02 - 0.04 - 0.09 PK 0.01 -0.01 0.01 0.01 Pol - 0 .03 - 0.01 - 0 .45 - 0 .85 Gol -0.01 -0.01 -0.01 -0 .03 A T P a s e - 1.1 - 0.41 - 0 .98 - 0.02
Fructose-l ,6-diphosphate concentrat ion control coef f ic ien ts
Suspended Suspended Immobi l ized Immobi l ized cells cel ls cel ls cel ls
pH ex 5.5 pH ex 4.5 pH ex 5.5 pH ex 4.5
In - 1.8 - 3 .7 1.5 0 .87 HK - 0.02 - 0.05 0.03 0.02 PFK 0.96 4.8 2.2 2.8 GAPD -1 .5 - 1 .6 - 2 .8 -3 .1 PK 0.23 - 0.31 0.20 0.52 Pol - 0 .20 - 0 .38 - 0 .37 - 0.29 Gol - 0 .28 - 0 .48 - 0 .87 - 0.99 A T P a s e 2.6 1.7 0.07 0.19
E n z y m e M i c r o b . T e c h n o l . , 1990 , v o l . 12, M a r c h 1 7 1
Papers
and immobilized cell metabolism can also be used in other contexts. For instance, one can find the best strategy to "design" a pathway, originally present in the cell (and optimized) to fulfill a given task, by chang- ing those controlling steps identified by MCT using metabolic engineering, aiming to maximize the produc- tion of a product or the intracellular concentration of any intermediate.
Acknowledgements
This research was sponsored by the National Science Foundation and by the Energy Conversion and Utiliza- tion Technologies (ECUT) Program of the U.S. Depart- ment of Energy.
References 1 Kacser, H. and Burns, J. Syrup. Sot'. Exp. Biol. 1973, 27,
65-104 2 Heinrich, R. and Rapoport, T. Eur. J. Biochem. 1974, 42,
89-95 3 Savageau, M. J. Theoret. Biol. 1969, 25, 365-369 4 Savageau, M., Voit, E. and lrvine, D. Math. Biosci. 1987, 86,
127-145 5 Savageau, M., Voit, E. and Irvine, D. Math. Biosci. 1987, 86,
147-169 6 Linko, P. and Linko, Y. CRC Crit. Rev. Biotechnol. 1983, 1,
289-338 7 Margaritis, A. and Merchant, F. CRC Crit. Rev. Biotechnol,
1983, 1, 339-393 8 Karel, S., Libiki, S. and Robertson, C. Chem. Eng. Sci. 1985,
40, 1321-1354 9 Siess, M. and Divies, C. Eur. J. Appl. Microbiol. Biotechnol
1981, 12, 10-15 10 Doran, P. and Bailey, J. Biotechnol. Bioeng. 1986, 28, 73-87 11 Inloes, D., Smith, W., Taylor, D., Cohen, S., Michaels, A. and
Robertson, C. Biotechnol. Bioeng. 1981, 23, 79-95 12 Jirku, V., Turkora, J. and Krumphanzl, V. Biotechnol. Left.
1980, 2, 509-513 13 Koshcheyenko, K., Turkina, M. and Skryabin, G. Enzyme
Microb. Technol. 1983, 5, 14-21 14 Brodelius, P., Deus, B., Mosbach, K. and Zenk, M. FEBS
Lett. 1979, 103, 93-97 15 Larsson, P. and Mosbach, K. Biotechno/. Lett. 1979, 1,
501-506 16 Galazzo, J. and Bailey, J. Biotechnol. Bioeng. 1989, 33,
1283-1289 17 Lang, J. and Cirillo, V. J. Bacteriol. 1987, 169, 2932-2937 18 Kotyk, A. Fol. Microbiol. 1967, 12, 121-131 19 Campbell-Burk, S., den Hollander, J., Alger, J. and Shulman,
R. Biochemistry 1987, 26, 7493-7500 20 den Hollander, J., Ugurbil, K., Brown, T., Bednar, M. and
Shulman, R. Biochemistry 1986, 25, 203-221 21 Hess, B., Boiteux, A. and Kruger, J. Adv. Enzyme Regul. 1969,
7, 149-167 22 Betz, A. and Moore, C. Arch. Biochem. Biophys. 1967, 120,
268-273 23 Betz, A. and Becket, J. Physiol. Plant. 1975, 33, 285-289 24 Reibstein, D., den Hollander, J., Pilkis, S. and Shulman, R.
Biochemistry 1986, 25, 219-227
25 Su, S. and Russel, P. J. Biol. Chem. 1968, 243, 3826-3833 26 Kotyk, A. and Leinzeller, A. Biochim. Biophys. Acta 1967,
135, 106-111 27 Azam, F. and Kotyk, A. FEBS Lett. 1969, 2, 333-335 28 Serrano, R. and DeLaFuente, G. Mol. Cell. Biochem. 1974, 5,
161-171 29 Wilkinson, K. and Rose, 1. J. Biol. Chem. 1979, 254,
12567-12572 30 Grosz, R. Ph.D. Dissertation, California Institute of Technol-
ogy, Pasadena, California, 1987, 211-212 31 Danenberg, K. and Cleland, W. Biochemistry 1975, 14, 28-39 32 Kosov, D. and Rose, 1. J. Biol. Chem. 1971, 246, 2618-2625 33 Kuenzi, M. andFiechter, A. Arch. Microbiol. 1972, 84, 254-265 34 Rothman, L. and Cabib, E. Biochemistry 1967, 6, 2098-2106 35 Rothman, L. and Cabib, E. Biochemistry 1967, 6, 2107-2112 36 Becket, J. Arch. Microbiol. 1977, 115, 181-184 37 Monod, J., Wyman, J. and Changeux, J. J. Mol. Biol. 1965,12,
88-118 38 Hess, B. and Plesser, T. Ann. N YAcad. Sci. 1978, 316,203-213 39 Eschrich, K., Schellenberger, W. and Hofman, E. Arch. Bio-
chem. Biophys. 1980, 205, 114-121 40 Bafiuelos, M., Gancedo, C. and Gancedo, J. J. Biol. Chem.
1977, 252, 6394-6398 41 Doran, P. Ph.D. Dissertation, California Institute of Technol-
ogy, Pasadena, California, 1985, 122-137 42 Yang, S. and Deal, W. Biochemistry 1969, 8, 2806-2813 43 Brown, C., Taylor, J. and Chan, L. Biochim. Biophys. Acta
1985, 829, 342-347 44 Wieker, H. and Hess, B. Biochemistry 1971, 10, 1243-1248 45 Hofer, M. and Nassar, F. J. Gen. Microbiol. 1987, 133,
2163-2172 46 Becker, J. and Betz, A. Biochim. Biophys. Acta 1972, 274,
584-597 47 Hess, B., Kleinhans, H. and Kuschmitz, D. in Biological and
Biochemical Oscillations (Chance, B., Pye, E., Ghosh, A. and Hess, B., eds.) Academic Press, New York, 1973, pp. 229-241
48 Heinrich, R., Rapoport, S. and Rapoport, T. Prog. Biophys. Molec. Biol. 1977, 32, 1-83
49 Westerhoff, H. and KeU, D. Biotechnol. Bioeng. 1987, 30, 101-107
50 Fell, D. and Sauro, H. Eur. J. Biochem. 1985, 148, 555-561 51 Kotyk, A. and Kleinzeller, A. Biochim. Biophys. Acta 1%7,
135, 106-111 52 Becket, J. and Betz, A. Biochim. Biophys. Acta 1972, 274,
584-597 53 Willsky, G. J. Biol. Chem. 1979, 254, 3326-3332 54 Rapoport, T., Heinrich, R., Jacobash, G. and Rapoport, S.
Eur. J. Biochem. 1974, 42, 107-120 55 Ottaway, J. and McMinn, C. in Enzyme Regulation andMecha-
nism o f Action (Midler and Hess, eds.) Pergamon Press, New York, 1980, pp. 69-82
56 Flint, H., Tateson, R., Barthelmess, I., Porteous, D., Dona- chie, W. and Kacser, H. Biochem. J. 1981, 200, 231-241
57 Bohnensack, R., Kuster, U. and Letko, G. Biochim. Biophys. Acta 1982, 680, 271-280
58 Westerhoff, H., Groen, A. and Wanders, R. Biochem. Soc. Trans. 1983, 11, 90-91
59 Westerhoff, H., Groen, A. and Wanders, R. Biosci. Rep. 1984, 4, 1-22
60 Kell, D. and Westerhoff, H. FEMS Microbiol. Rev. 1986, 39, 305-320
61 Suzuki, S. and Karube, 1. Am. Chem. Soc. Syrup. Ser. 1979, 106, 59-72
62 D'Sousa, S. and Nadkarni, G. Biotechnol. Bioeng. 1980, 22, 2191-2205
172 Enzyme Microb. Technol., 1990, vol. 12, March