fate&transport modeling for determination
TRANSCRIPT
fled]
r
-W
>.r~I ' s
T;
R-49-11-9M2
FATE&TRANSPORT MODELING FORDETERMINATION OFSOIITCLEANUP
GOALS PROTECTIVEOe jGROUNDVWVTERii f
GREENWOOD CHEMICALSITEALBEMARLECOUNTY, VIRGINIA;
&&•' CONTRAGTNUMBER6&W8-0037SkVV.V "'- - ' „.- - ,-.*:• --• "' . ". " -. -.' ' . - , - . . ' -' •
-. J 5 fc>'-"':":', -• o.*''" '1- :-T:"':.'..'-. v-; -.•• ''-~:"-" '•'•'-''* ''V- -'*.-*-'-::'•' ::-' "'.'
" ^ : HALUBURTONNUSPROJECTNUMBER2752:
FEBRUARY
Environmental Corporation*: : flR00029l

HALLIBURTON NUSVIBf Environmental Corporation
661 ANDERSEN DRIVE PITTSBURGH, PENNSYLVANIA 15220 (412) 921-7090
R-49-11-91-12
FINAL
FATE AND TRANSPORT MODELING FOR DETERMINATION OFSOIL CLEANUP GOALS PROTECTIVE OF GROUNDWATER
VOLUME!
GREENWOOD CHEMICAL SITEALBEMARLE COUNTY, VIRGINIA
EPA WORK ASSIGNMENT NUMBER 37-17-39P5CONTRACT NUMBER 68-W8-0037
HALLIBURTON NUS PROJECT NUMBER 2752
FEBRUARY 1993
SUBMITTED FOR HALLIBURTON NUS BY: APPROVED:
C 7<UulPAULALESSIO,P.E.PROJECT MANAGER ARCS III PROGRAM MANAGER
technologies and sen-ices for a cleaner and
AR000292
ORIGINALTABLfc OF CONTENTS
SECTION PAGE
EXECUTIVE SUMMARY ........................;.......w............................... ES-1
1.0 INTRODUCTION .............................................,....*............... .1-11.1 . BACKGROUND ..... ...•.-.-:"..•;-;.;.............v;...,./,.,................. 1-1
2.0 6ROUNDWATERTRANSPORTMODEUNGINPUTS .................................... 2-12.1 CHEMICALS OF CONCERN ...;,.......,................................ 2-12.1.1 GroundwaterARARs or Health-Based Criteria ........................... ,2-12.2 CHEMICAL-SPECIFIC PARAMETERS ...................................... 2-32.2.1 BiodegradationCoefficient ............................................ 2-32.2.2 Solid and Liquid Phase Decay Coefficients .............................. 2-112.2.3 Calculated Inputs .................................................... 2-112.2.4 Modeling Considerations for Chemical Data ............................ 2-122.3 DATA HANDLING .................................................... 2-122.3.1 Army Corps of Engineers Data Handling ............................... '2-172.3.2 REM III NAA and THF Data ............................................. 2-192.3.3 REM III Data for Drum Disposal Area ................................... 2-192.4 HYDROGEOLOGICALAND GEOTECHNICALPARAMETERS ................ 2-192.4.1 Geology ....,....;..........;t.,....................;...............; 2-192.4.2 Hydrogeology ......... i'.;..................)........................ 2-242.4.3 Modeling Considerations .;..........................................; 2-272.5 AREAL EXTENT OF CONTAMINATION AND REPRESENTATIVE ............. 2-27
CONCENTRATIONS :
3.0 GROUNDWATERMODELING ................,.................................;, 3-13.1 SCREENING PROCEDURE ............................................... 3-13.1.1 Source and Northern Warehouse Areas ................................. 3-13.1.2 Drum Disposal Area .................................................. 3-103.1.3 Screening ProcedureSummary i"....................................... ; 3-173.2 HALLIBURTON NUS MODELING ....................................... 3-173.3 DISCUSSION OF RESULTS V..;...,........................,............. 3-203.3.1 Main Source and North Warehouse Areas ..............:.,............. 3-253.3.2 Drum Disposal Area ..;;./;........,...................,;............. 3-25
APPENDICESA HALLIBURTON NUS CONTAMINANT FATE AND TRANSPORT .............. A-1
MODEL DESCRIPTION ' ;
B CHEMICAL SPECIFIC PARAMETER DERIVATIONS AND .................... B-1SAMPLE CALCULATIONS V : r
C ARSENIC DISTRIBUTION COEFFICIENT CALCULATIONS ........:........... C-1
D / TOTAL SEMI-VOLATILE TIC ANALYTICAL DATA ........,............../.. D-1
E UNCONSOUDATED MATERIAL MODEL DATA CALCULATIONS ............ E-1
F INFILTRATION RATE CALCULATIONS (HELP MODEL) ........*............... M
G MODEUNG RESULTS AND ISOCONCENTRATION MAPS ............ VOLUME II
• i 'R-49-11-91-12
AR000293

TABLES
NUMBER PAGE
ES-1 Unsaturated Zone -Soil Cleanup Goals ....................................... ES-32-1 SummaryofGroundwaterARARsorHealth-BasedCriteria ...................... 2-22-2 Chemical-Specific Parameters ................................................ 2-42-3 Saturated Zone Biodegradation Coefficients .................................. 2-72-4 Hydrolysis Rate Constants ................................................... 2-92-5 Distribution Coefficient and Mass Fraction of Solute .......................... 2-102-6 Saturated Zone Soils Analytical Data .................>.................,..... 2-132-7 Average Characteristics of the U neon soli dated and Saprolite Layers ............ 2-252-8 Hydraulic Conductivity Summary ................... 4........................ 2-262-9 Maximum Groundwater Table Elevations for Army Corps Sampling Locations ... 2-282-10 Average Saturated Zone Soil Concentrations Used for Areal Extent ............. 2-31
Determination2-11 Average Unsaturated Zone Soil Concentrations Used for Areal Extent ........... 2-32
Determination2-12 Maximum Soil Concentrations (mg/kg) Encountered in REM III Rl or ....;........ 2-35
ACE Pre-Design Sampling2-13 Average Saturated Zone Soil Contamination ................................. 2-362-14 Average Unsaturated Zone Soil Contamination ............................... 2-383-1 Comparison of Water Criteria with Maximum Theoretical Groundwater ......... 3-3
Concentrations for Saturated Zone Soils3-2 Comparison of Summer's Model Cleanup Goal with Maximum .................. 3-5
Saturated Zone Soil Concentration3-3 Comparison of Water Criteria with Maximum Theoretical Groundwater ......... 3-6
Concentration for Unsaturated Zone Soils3-4 Comparison of Summer's Model Cleanup Goal with Maximum Unsaturated ...... 3-7
Zone Soil Concentration3-5 Summary of Chemicals in the Unsaturated Zone That May Exceed Summer's ...... 3-8
Model Cleanup Goals3-6 Comparison of Median Soil Concentrations with Summer's Model ............... 3-9
Cleanup Goals3-7 Chemicals Requiring Remediation Based on Halliburton NUS Model Run ........ 3-11
Using Soil Concentrations3-8 Comparison of Maximum and Median Measured Groundwater Concentrations .. 3-123-9 Comparison of Water Criteria with Maximum Measured Groundwater .......... 3-13
Concentrations3-10 Comparison of Preliminary Soil dean Up Goal with Maximum Calculated ....... 3-14
Saturated Zone Soil Concentration3-11 Comparison of Water Criteria with Maximum Calculated Leachate ............. 3-15
Concentration for Unsaturated Zone3-12 Comparison of Summer's Model Cleanup Goal with Maximum Unsaturated ..... 3-16
Zone Soil Concentration3-13 Comparison of Median Soil Concentration with Preliminary .................... 3-18
Cleanup Goals3-14 Comparison of Water Criteria with Modeled Maximum Saturated Zone ......... 3-19
Concentration for Chemicals which Exceed the Preliminary Cleanup Goals3-15 Soil CleanupGoalsSummary .. *............................................. 3-21
R-49-11-91-1J ' ' • , . - iii
ORIGINAL
FIGURES
NUMBER PAGE
2-1 Cross-Section Location Map ................................................. 2-213-1 Schematic of Cleanup Goals Screening Process ................................. 3-2
DRAWINGS
2752-1 Geological CrossSections ............................................ BackPocket2752-2 Geological CrossSections ............................................ Back Pocket2752-3 Potentiometric Surface Map ......................................... Back Pocket
R-49-11-91-12 IV flR000295

OKiCXmo
mtnis
flR000296
EXECUTIVE SUMMARY
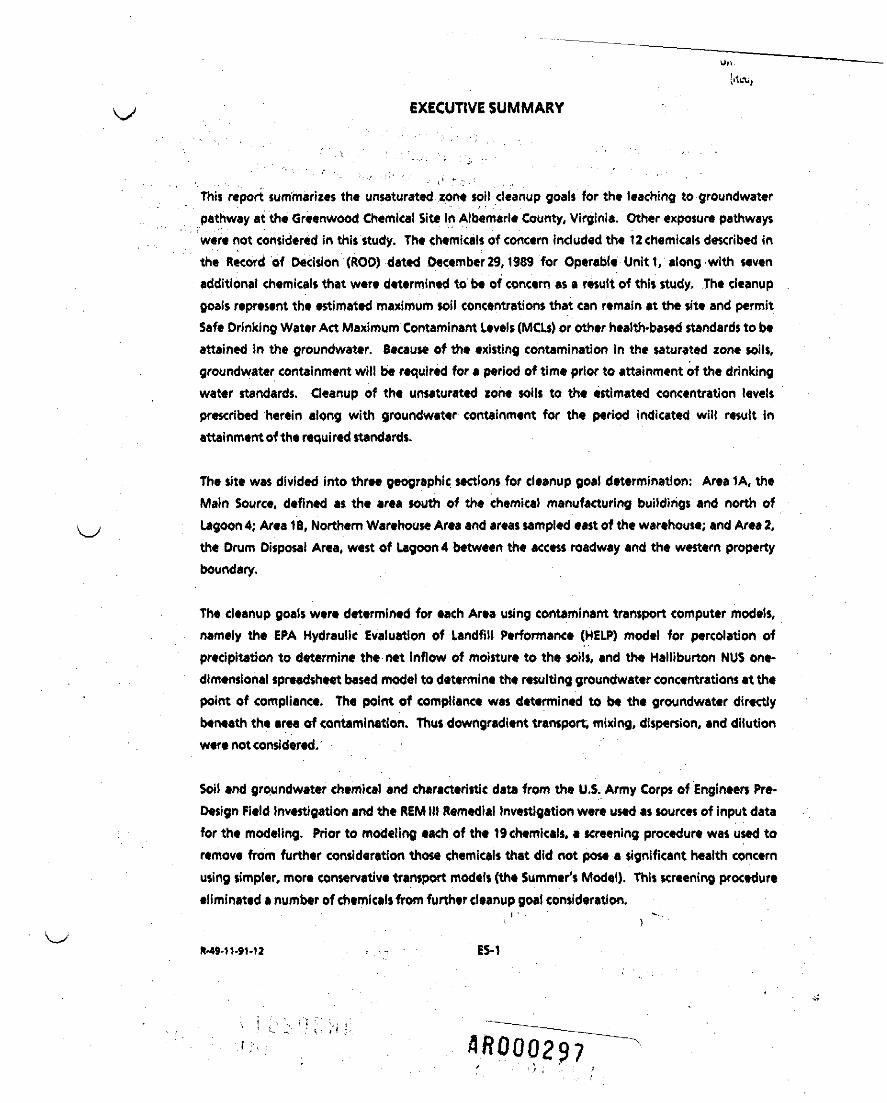
This report summarizes the unsaturated zone soil cleanup goals for the teaching to groundwaterpathway at the Greenwood Chemical Site In Al be marie County, Virginia. Other exposure pathwayswere not considered in this study. The chemicals of concern included the 12 chemicals described inthe Record of Decision (ROD) dated December29,1989 for Operable Unitl, along with sevenadditional chemicals that were determined to be of concern as a result of this study. The cleanupgoals represent the estimated maximum soil concentrations that can remain at the site and permitSafe Drinking Water Act Maximum Contaminant Levels (MCLs) or other health-based standards to beattained in the groundwater. Because of the existing contamination In the saturated zone soils.groundwater containment will be required for a period of time prior to attainment of the drinkingwater standards. Cleanup of the Unsaturated zone soils to the estimated concentration levelsprescribed herein along with groundwater containment for the period indicated will result Inattainment of the required standards.
The site was divided into three geographic sections for cleanup goal determination: Area 1 A, theMain Source, defined as the area south of the chemical manufacturing buildings and north of
, , Lagoon 4; Area 1B, Northern Warehouse Area and areas sampled east of the warehouse; and Area 2,the Drum Disposal Area, west of Lagoon 4 between the access roadway and the western propertyboundary.
The cleanup goals were determined for each Area using contaminant transport computer models,namely the EPA Hydraulic Evaluation of Landfill Performance (HELP) model for percolation ofprecipitation to determine the net Inflow of moisture to the soils, and the Halliburton NUS one-dimensional spreadsheet based model to determine the resulting groundwater concentrations at thepoint of compliance. The point of compliance was determined to be th* groundwater directlybeneath the area of contamination. Thus downgradient transport, mixing, dispersion, and dilutionwere not considered.
Soil and groundwater chemical and characteristic data from the U.S. Army Corps of Engineers Pre-Design Field Investigation and the REM 111 Remedial Investigation were used as sources of Input datafor the modeling. Prior to modeling each of the 19 chemicals, • screening procedure was used toremove from further consideration those chemicals that did not pose a significant health concernusing simpler, more conservative transport models (the Summer's Model). This screening procedureeliminated a number of chemicals from further cleanup goal consideration.
R-49-11-91-12 i •-- ES-1
flfi000297
The results are summarized in Table ES-1. These chemical concentrations are the cleanup goals if thegroundwater containment period indicated is provided. Only those chemicals for which soilremediation is necessary are included in this table. At the direction of the ERA, the concentrationgiven in Table ES-1 is total concentration (Ct), which includes contributions from the chemical sorbedto the soil particles (Cj) and chemical concentration present in the soil pore water (CJ. Results ofchemical analysis from various investigations summarized in tables in Section 2, as well as screeningand modeling results shown in tables in Sections and in appendices are indicated as sorbedconcentrations (CJ.
R-49-11-91-12 ES-2
SR000298
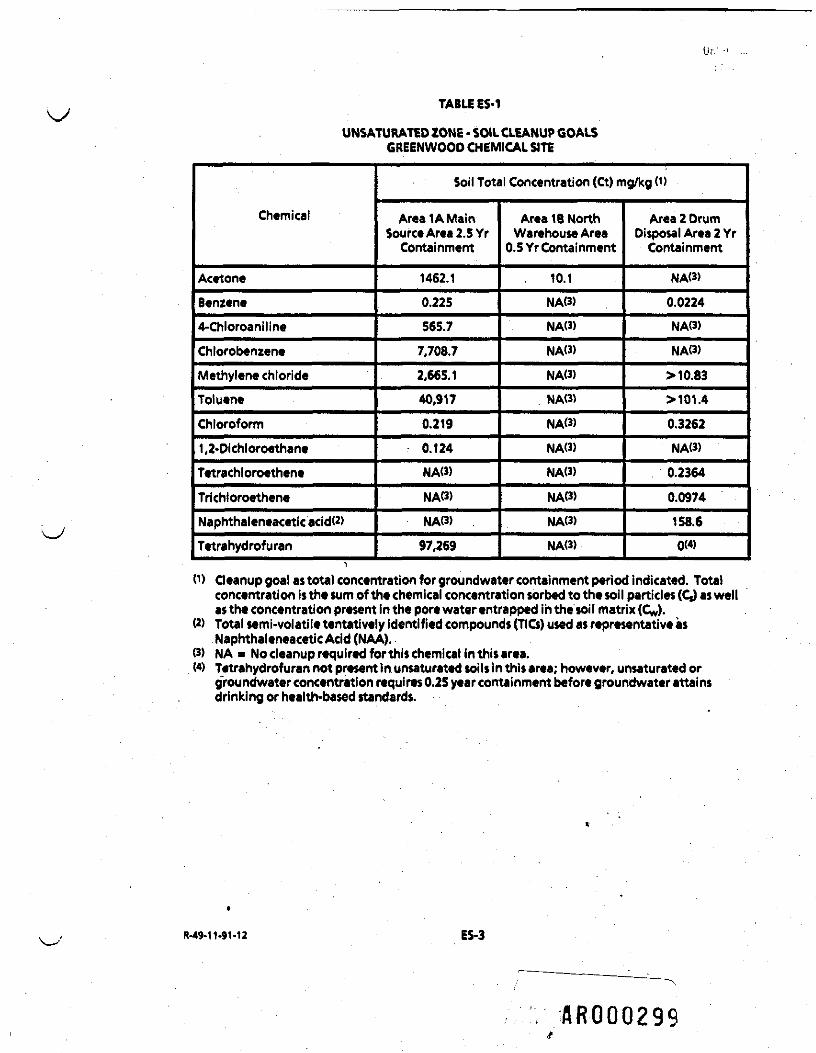
TABLE ES-1
UNSATURATED ZONE - SOIL CLEANUP GOALSGREENWOOD CHEMICAL SITE
Chemical
AcetoneBenzene4-ChloroanilineChlorobenzeneMethylene chlorideTolueneChloroform1,2-DichloroethaneTetrachloroetheneTrlchloroetheneNaphtha! eneacetic acidW)Tetrahydrofuran
Soil Total Concentration (Ct) mg/kg (D
Areal A MainSource Area 2.5 YrContainment
1462.10.225565.7
7,708.72,665.1
40,917
0.219
0.124NAO)NAO)
NAO) .
97,269
Area 1B NorthWarehouse Area
0.5 Yr Containment
. 10.1NAO)NAO)NAO)
NAO)
NAO)
NAO)NAO)
NAO)
NAO)
NAO)
NAO)
Area 2 DrumDisposal Area 2 YrContainment
NAO)0.0224NAO)
NAO)
> 10.83>101.4
0.3262NAO)
0.2364
0.0974
158.60(4)
(i) Cleanup goal as total concentration for groundwater containment period indicated. Totalconcentration is the sum of the chemical concentration sorbed to the soil particles (CO as wellas the concentration present in the pore water entrapped in the soil matrix (Cw).
U) Total semi-volatile tentatively identified compounds (TIG) used as representative asNaphthaleneacetic Acid (NAA).
0) NA • Nocleanuprequiredforthischemicalinthisarea.W Tetrahydrofuran not present in unsaturated soils in this area; however, unsaturated or
groundwater concentration requires 0.25 year containment before groundwater attainsdrinking or health-based standards.
M9-11-9M2 ES-3
AR000299
AROD0323

ORIGINAL(Red)
This page is left intentionally blank
ftROOb322
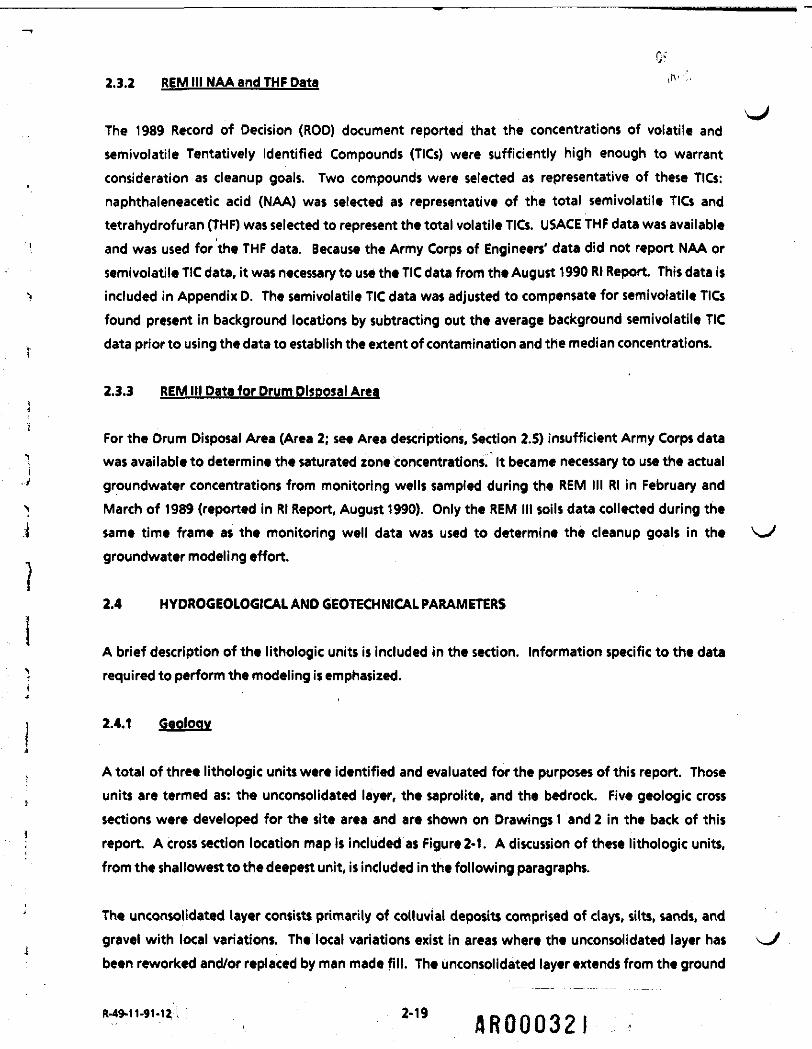
2.3.2 REM III NAA and THF Data iv
The 1989 Record of Decision (ROD) document reported that the concentrations of volatile andsemivolatile Tentatively Identified Compounds (TICs) were sufficiently high enough to warrantconsideration as cleanup goals. Two compounds were selected as representative of these TICs:naphthaleneacetic acid (NAA) was selected as representative of the total semivolatile TICs andtetrahydrofuran (THF) was selected to represent the total volatile TICs. USAGE THF data was available
• and was used for the THF data. Because the Army Corps of Engineers' data did not report NAA orsemivolatile TIC data, it was necessary to use the TIC data from the August 1990 Rl Report. This data is
> included in Appendix D. The semivolatile TIC data was adjusted to compensate for semivolatile TICsfound present in background locations by subtracting out the average background semivolatile TICdata prior to using the data to establish the extent of contamination and the median concentrations.\
2.3.3 REM III Data for Drum Disposal Area
'iFor the Drum Disposal Area (Area 2; see Area descriptions, Section 2.5) insufficient Army Corps data
". was available to determine the saturated zone concentrations. It became necessary to use the actualy groundwater concentrations from monitoring wells sampled during the REM III Rl in February and> March of 1989 (reported in Rl Report, August 1990). Only the REM III soils data collected during thej same time frame as the monitoring well data was used to determine the cleanup goals in the
groundwater modeling effort.
2.4 HYDROGEOLOGICAL AND GEOTECHNICAL PARAMETERS
A brief description of the lithologic units is included in the section. Information specific to the data1 required to perform the modeling is emphasized.
j 2.4.1 Geology
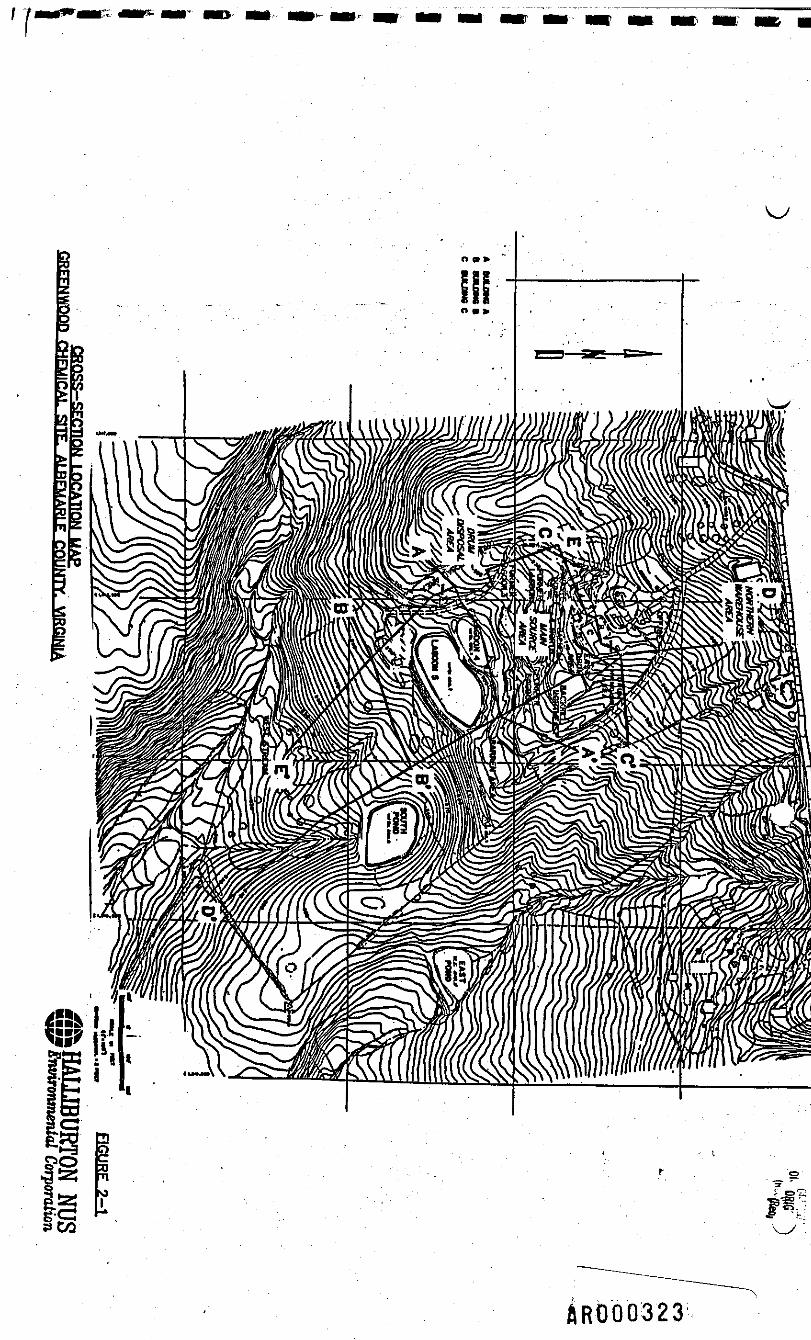
} A total of three lithologic units were identified and evaluated for the purposes of this report. Those. units are termed as: the unconsolidated layer, the saprofite, and the bedrock. Five geologic cross
sections were developed for the site area and are shown on Drawings 1 and 2 in the back of this; report. A cross section location map is included as Figure 2-1. A discussion of these lithologic units,
from the shallowest to the deepest unit, is included in the following paragraphs.
The unconsolidated layer consists primarily of col I u vial deposits comprised of clays, silts, sands, andgravel with local variations. The local variations exist in areas where the unconsolidated layer hasbeen reworked and/or replaced by man made fill. The unconsolidated layer extends from the ground
flR00032l

ORIGINAL
AR000300

ORIGIN-1.0 INTRODUCTION (Red)
In response to a request from Darius Ostrauskas, former EPA Remedial Project Manager for theGreenwood Chemical Site in Albemarle County, Virginia, HALLIBURTON NUS has prepared this reportsummarizing the results of groundwater modeling performed to determine revised soil cleanup goalsbased on attaining Safe Drinking Water Act (SDWA) Maximum Contaminant Levels (MCLs), SDWAProposed Maximum Contaminant Levels (PMCLs) and/or protective levels based on reference doseconcentrations in the aquifer(s) underlying contaminant source(s) at the site.
1.1 BACKGROUND
A Remedial Design for Operable Unit One (OU-1) is currently being prepared by the U.S. Army Corpsof Engineers (USACE) to address contaminated soils associated with the site. The remedy of concernwas selected in a Record of Decision (ROD) dated December 29,1989 and include the excavation andoffsite incineration, stabilization and/or disposal of soils exceeding cleanup levels protective ofhuman health and the environment. Contaminants of concern in OU-1 soils include arsenic, benzene,chlorobenzene, cyanide, methytene chloride, semivolatile tentatively identified compounds (TICs),PCE, TCE and tetrahydrofuran (a volatile TIC). The ROD for OU-1 included soil cleanup levelsprotective of potable groundwater. Based on the results of sampling conducted during the RD, aswell as new MCLs and PMCLs, it was determined that soil cleanup levels protective of groundwatershould be re-evaluated.
In response, additional fate and transport modeling has been conducted to develop revised soilcleanup goals for site-related contaminants. In addition to soils of concern identified in the ROD forOU-1, this modeling effort addresses all other contaminated soils at the site.
R-49-H.9M2 flR00030;f
ORIGINAL(Red)
UR0003Q2

I
0
i
\\-
2.0 GROUNDWATER TRANSPORT MODELING INPUTS
The mechanism for exposure involves incident precipitation and surface water runoff infiltrating intoareas containing chemicals of concern, and the formation of leachate containing these chemicalsdischarging into the aquifer, which may be Used as a potable water source by residents downgradientof the site. The recently finalized Multimed model (developed under the auspices of EPA) was initiallyexpected to be used to determine soil cleanup levels based on attainment of health-based criteria inaquifer(s) underlying the site. However, EPA determined that a one-dimensional spreadsheet-basedcontaminant flow and transport model developed by Halliburton NUS could better simulate
. - ' - • • !; ' t -- . '•
site-specific conditions. The model utilized in this case is described in Appendix A. The model analysiswas conducted by EPA Region III and Halliburton NUS for 19 chemicals determined to be oflexicological concern. . , ; •'• - -
This document summarizes the inputs to the model and the results of the modeling effort. Many ofthe input parameters are required for both the Multimed and Halliburton NUS models. The inputparameters have been separated into three areas, including chemical-specific parameters,hydrogeologic and geotechnical parameters, and source parameters.
2.1 CHEMICALS OF CONCERN > . /
The chemicals Of concern were established following a review of the cleanup goals established in theROD for OU-1 (EPA, December, 1989), and the results of ACE pre-design soil sampling conducted In1991. The 1989 ROD established soil cleanup goals for 12chemicals, including'arsenic, cyanide,benzene, 4-chloroaniline, chlorobenzene, methylene chloride, tetrachloroethene (PCE), trichloro-
J ethylene (TCE) toluene, naphthalene, naphthalene acetic acid, and tetrahydrofuran, as determinedI J by the REM III contractor. Based on further review of the ACE data, Halliburton NUS recommended| the addition of seven chemicals to the list, including acetone, 1,2-dichloroethane (1,2-DCA),] 9 di-n-butylphthalate, bis(2-ethylhexyl)phthalate, 2,4,6-trichlorophenol, chloroform/and xylenes.
:; -1 2.1.1 Groundwater ARARs or Health-Based Criteria , . I
3: Table 2-1 identifies groundwater concentrations of site-related contaminants which are protectivefor drinking water purposes. This table identifies former criteria (utilized to calculate soil cleanuplevels Identified in the ROD) and new criteria developed in response to new SDWA MCLs and PMCLs.
flROQ03Q3

OWGIHM.TABLEM
SUMMARY OF GROUNDWATER ARARs OR HEALTH-BASED CRITERIAGREENWOOD CHEMICAL SITE
Chemical
ArsenicCyanideAcetoneBenzene '4-ChloroanilineChlorobenzeneMethylene chlorideTetrachloroetheneTrichloroetheneTolueneNaphthaleneNaphthaleneacetlc acid<5>TetrahydrofuranBisU-ethylhexyOphthalate"Chloroform1,2-DichloroethaneDi-n-butyl phthalateXylene2,4,6-Trichlorophenol
Former ARARs/ Criteria(Vg/L)0><2)50 (MCL)5.2 (WQQ-
5(MCL)TT
488(WQQ1 0-5 ca. risk0.8 (WQC)5 (MCL)
2,000 (PMCLG)TTTT<3»TT
: — . ; . •---
--
NewARARs/Criteria(ug/L)(7>SO (MCL)200 (PMCL)3,500 (RFD)5 (MCL)140 (RFD)100 (MCL)5 (MCL)5 (MCL)5 (MCL)
1,000 (MCL)140 (RFD)305(RFD)W73(RFD)W4 (PMCL)100 (MCL)5 (MCL)
3,500 (RFD)10,000 (MCL)
3.2(1 0-5 ca. risk)0) These values are consistent with the Record of Decision (ROD) dated Dec. 31, 1989.(2) Basis for guideline in parentheses:
MCL m SDWA Maximum Contaminant Level _WQC « Water Quality Criteria IPMCLG « SDWA Proposed MCL Goak ' '"• 1PMCL -SDWA Proposed MCLRFD « Risk Reference Dose . ITT » Threshold Toxicity •' |
(3) ldentifiedasrepresentativeofsemi-volatileTIC$inDecember31,(4) per draft, document entitled "Selecting Exposure Routes and Contaminants of I
Concern by Risk-Based Screening," dated March 17, 1992, EPA Region III Hazardous IWaste Management Division, Contact: Dr. Roy L Smith.
(5) As noted in the ROD, thetoxicity of total semivolatile TICS Is assumed equivalent to Inaphthalene acetic acid (NAA). As a result, health-based criteria for NAA in |groundwater is also considered to bt the health-based criteria for total semivolatileTICs in groundwater. •
$> EPA memorandum from R.Brunker and D. Ostrauskas, February 5* 1992. |(7) These ARARs/criteria used as standards for the groundwater modeling in this report ,
IR-49-M-91-12 2-2 AR000301*

1 ORIGIN/L
In addition, certain criteria have been revised to reflect consistency with existing MCLs (i.e., if an MCLis available, this is identified as the new criteria. The objective of the modeling effort is to predictestimated contaminant concentrations in soil (i.e., soil cleanup levels) that will facilitate meetingthese groundwater criteria. ... ,
'-. -f i ' - .2.2 CHEMICAL SPECIFICPARAMETERS;''t i•"•• : ; 'f - " * " - . • ' ' - -
1 ', ' i - ' 'The following is a description of the methods used to develop three tables of chemical-specific
; properties for the 19 chemicals for which the soil cleanup goals were derived. Details concerning' ' > v -- - ' ' ' ' , ' ' • ' *
special calculations and derivations and a list of sources follow the tables. The parameters weredeveloped based on the requirements for the Multimed model; however, many of the parameterswere used for the Halliburton NUS model. \ J ''• • j
e Chemical-specific parameters are summarized in Table 2-2, and include Koc, air diffusioncoefficient, molecular weight, Henry's Law constant and vapor pressure constants.
, •' .' ,. -. i. - i • , • '•. \ '<-•..'. " . j - • ' . ' ,
• Decay Constants, are summarized in Table 2-3 and 2-4, and include values determined forbiodegradation and hydrolysis rate Constants, respectively. j ; ; " '
• Calculated Values (Table 2-5) includes the results of calculation of the distributionCoefficient KO and mass fraction of solute.
i : i •; ' , •2.4.1 Blodeoradation Coefficient i.' i ' \
3
For each compound, the biodegradation rate constant is used as the biodegradation coefficient (1/yr,saturated zone). Biodegradation rate constants were derived using equations found inDragun, 1988: \ \ \ \' •
i 0.693/k
where: k » rate constant i' t * time ' • ,i l' t(1/2) -half-life r ; ,
.a • » . Initial concentrationx • amountdegradedintimet
R-49-11-91-12 . '. ', ^f \\!. ' ' •* .* 2-3' " h : " H - ;flROOOSOS

ORIGINAL
ft
*
hIs- $i?
J ?
i 1
Solute va
p.pressure
(mmHg)<2>
43 eSS
O.Qe^StSs5
j{_>.
v 9
1io
|
1(372 Q0>
»S
*
•
•
1
i
i
io<0M
i
*
i
•81
inUlmm
27CK30QW
270(20Q
••*
SSS
fli rn i9 en NAON
odd
1
~
1
u\IA
g
„od
•2"
2xS?S
§| Koo n 55 dd d dd
a -
1
inUl
o
g2in
,IN
i
i
S(NUl
C— .
4-Chloro
Hi
Ci -p*.
S^
2SS
§o3odd
im
c2V
5
S3<N
362(20Q
3
Mk
is
6oo
!
41•o'5"5S
i
Ulmin
g
m09 .Ul
2S3
* of *
dd d
I
1T)X1I
m
gtA
0.
m
2SS
inodd
1
«w58
^
Ul
28(250(8)
28.7(20C)
-S
SSS
IIIodd
in
'
Toluene
tUl
jjfmUlpo-od
•
it
«
f
R-49-11-91-12 ' : . ' • ' , - i\ ,"• 2-4 flR000306

£1 ggJ fS
5Qi K!
ifu* ST fn"r" 5 E
x IX "
s £isi?HtjS9 x
H
iC
• "Si M
s*c
'•5 """*
A
*1•
.1X
^o<s*~
$.01E-6(25Q
(M
N
S
,
i
0
I"
s1
1e
!
Nf"^
Ul
r
m S"
'
R
§<N
id
*•e*X
19
15
JTetrahydro
M
111
LV
g
,
'
.i
ts
JBis(2-ethyl»
[Phthalate
mLi,!
g(N
1
An
=
o o o*- m in
in g Nillodd
i
^*•'
• • £•
i ^6
tUl2ff*
1..
- jif
r*j• ;'•
2SS/
K< pvg •*d d d
- •••-. ''•* " -
1 ;.;^ -
• • .;
' i: '' » *•:!i- :-
1,2-Dichlor
»OSIN
ainN_nu
**
g
«
i
«inUl
«S£j
5Js
(V>Ulmm .^
6.5(200 (p-
«o
i
ess
N K U)« OV 9!•» kA -8fN abo oodd
. .• -—,
N . •
., *
I
TU
fi?
nd
in
2
i <
;
*
K~X
S
•5
1O
2.4>Trichl
<?*MU2C -fe SJST% T5 38) i= .V^<^^^£^£«^3U>Z3O2
|g|{ f * 55 s * J i ' r: I
Sfi .2 S S =i -, Z S * - „
i-i^iiilfvt ^5^n-»z^o5
^ 0i
I ii "1 II«• -5 - *i
w ^II Sm •*ra» - - S•- .2 Eo- S ' S3 ".si«; --
-, - 3-2 S< J5° ? 3 S 3 e BX * B « ' t
"5 X f W W5 E 3° *c c •? *fe x4 41 A 5c ^ •§ I a «
E-g
1- l2Ei S»-ID § O IB g '2 N€ 4* *» C S* (Q<«* - S i * g 33=S 5 5 £"•= ^^tills |.l1 *iSi nb "5 S S i s: O
!||1.!* 'Agja -gi£•s *ias. i«g, l|yw a I1 is^g".«
cal A. A. re h York.
A, 19
un, J.
land.
(a 0) <2> (3) W (5) (6)
R-49-11-91-12 M ' • ' i i1 ' -2-5' . . , * . / * ( ' &RQQ0307

ORIGINAL
<53*
. iS>
S||£1 IS* 2
w*5*!8wlllliaego.w
s
% ,
llfll I I i?|ls « f
^ 5
"*"*•" '' 2'6 , .-W000308
iI
••
i I" •
a •*• Sw'tt'as •* i 5S is I Is •? g'S ?° s •iigg i ! l ^ i s . Iaw 5 ss«JS'3S=u'« s^°-si« *3-4 >iB* i^-Scf'3vO<0 .^18*01S5< • 'S •s> S3fi>*?'-* o-S^S I8 , 5<<3u-?>|ju.!.l
i
(Ps-JJ
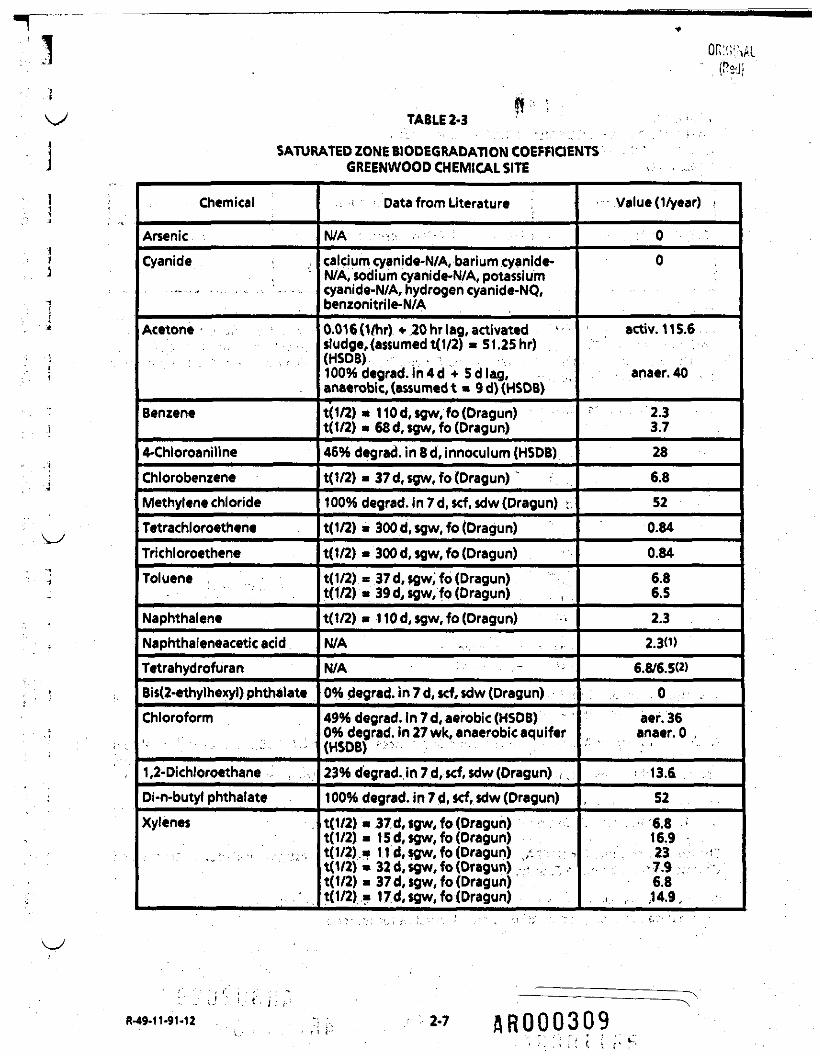
TABLE 2-3
SATURATED ZONE BIODEGRADATION COEFFICIENTSGREENWOOD CHEMICAL SITE
Chemical
ArsenicCyanide > ,
Acetone ,
Benzene
4-ChloroanilineChlorobenzeneMethylene chlorideTetrachloroetheneTrichloroetheneToluene
NaphthaleneNaphthaleneacetic acidTetrahydrofuranBis(2-ethylhexyl) phthalateChloroform
1,2-Dichloroethane .Di-n-butyl phthalateXylenes
> Data from Literature .
N/A ••••-calcium cyanide-N/A, barium cyanide*N/A, sodium cyanide-N/A, potassiumcyanide-N/A, hydrogen cyanide-NQ,benzonitrile-N/A0.016(1/hr) + 20 hr lag, activatedsludge, {assumed t(1/2) • 51.25hr)(HSDB)100%d«grad.in4d + Sdlag,anaerobic, (assumed t • 9 d) (HSDB)t(1/2) * 1 10 d, sgw, fo (Dragun)t(1/2) m 68 d, sgw, fo (Dragun)46% degrad. in 8d, innoculum (HSDB)t(1/2) » 37 d, sgw, fo (Dragun) *100% degrad. In 7 d, scf, sdw(Dragun) :t(1/2) * 300 d, sgw, fo (Dragun)t(1/2) » 300 d, sgw, fo (Dragun)t<1/2) « 37 d, sgw, fo (Dragun)t(1/2) » 39 d, sgw, fo (Dragun)t(t/2) * 1 10 d, sgw, fo (Dragun)N/AN/A •• • .-0% degrad. in 7 d,scf,$dw (Dragun)49% degrad. in 7 d, aerobic (HSDB)0% degrad. In 27 wk, anaerobic aquifer(HSDB)23% degrad. in 7 d, set sdw (Dragun)1 00% degrad. in 7 d, scf, sdw (Dragun)t(1/2) « 37 d, sgw, fo (Dragun)t(1/2)« 1 5 d, sgw, fo (Dragun)t(1/2) » 11 d, sgw, fo (Dragun) /. : ; • -,t(1/2) m 32 d, sgw, fo (Dragun)t(1/2) m 37 d, sgw, fo (Dragun)t(1/2) » 17,d, sgw, fo (Dragun)
Valued/year)
00
activ. 115.6
anaer. 40
2.33.7286.8520.84
0.846.86.52.32.30)
6.8/6.5(2)
0aer. 36anaer. 0 .
' 13.6. ,
526.816.9
: - : . - ,23. -, ; --rj-. - '• .-7.9 .- -.--,
6.8,. ... ,14.9,
.- . .M9.114M2 :;, 2-7 ft R 00 03 09

ORIGINAL
TABLE 2-3SATURATED ZONE BIODEGRADATION COEFFICIENTSGREENWOOD CHEMICAL SITEPAGE TWO
Chemical
2,4, 6-Tri ch 1 orophenol
Data from Literature
95% degrad. in 3 d, aerobic, clay loam(HSDB)28% degrad. in 80 d, anaerobic, clayloam (HSDB) ;
Valued/year)
aer. 360.9
anaer. 1.5
IIIIIi
Those chemicals with multiple coefficients can be treated in the following ways: (1) use the most IIconservative (lowest) coefficient, (2) use the least conservative (highest) coefficient, or (3) use the ™arithmetic mean of the coefficients. It is recommended that (3) bt used because the coefficientsare not dissimilar. This is not recommened for coefficients for which both anaerobic and aerobiccoefficients have been derived. '
Example calculations and derivations are included in Appendix B. m
Abbreviations: HSDB * Hazardous Substances Data BankCalc. » calculatedN/A » not applicable IINQ * notquantitated ™d * dayssgw a soil-groundwater system •fo a field observation ^ ||hr a hoursdegrad. a degradation _scf a static-culture flask biodegradation test, original culture IIsdw a settled domestic wastewater used as microbial innoculumwk a weeksactiv. a activated flanaer. a anaerobic . IIaer. a aerobic
Dragun, J., 1988. The Soil Chemistry of Hazardous Materials. Hazardous Materials Control ||Research Institute, Silver Springs^Maryland. ;
National Library of Medicine. Hazardous Substances Data Bank (HSDB). Records for calcium «cyanide, barium cyanide, sodium cyanide, potassium cyanide, hydrogen cyanide, benzonitrile, •acetone, 4-chloroaniline, tetrahydrofuran, chloroform, and 2,4,6-trichlorophenol, August 5,1991.
Ebasco Services, Inc. for USEPA, August 1989. Final Focused Feasibility Study Report - Operable IIUnit 1. Appendix B - Clean Up Goals for Greenwood Chemical Sitt.
Ebasco Services, Inc. for USEPA, August 1990. Final Remedial Investigation Report: Greenwood |lChemical Site, Albemarlt County, Virginia.8 r
.._ __._ _._..„.,, ——,,.,, „ „ „,„.. „ .»,», ,w, „,»»..,.
2-8 , 4R000310

j
13 -. (M\y ' -• -: TABLE 2-4 ^ '
1 HYDROLYSIS RATE CONSTANTSJ GREENWOOD CHEMICAL SITE
Chemical •'-\ :
Arsenic ... .;Cyanide - ; -Acetone :Benzene ;4-ChloroanilineChlorobenzene sMethylene chlorideTetrachloroetheneTrichloroetheneToluene ,Naphthalene ., • • •Naphthaleneacetic acidTetrahydrofuran ,. ;Bis(2-€thylhexyl)phthaiate
Chloroform . .1,2-DichloroethaneDi-n-butyl phthalate \Xylene ; f2,4,6-Trichlorophenol '
Neutral<yr'>
NS. ' ^. .....-,
;NS .. ";NS.T. ',
'. ";NS ;;.;,.•: : NS. .:,;':
; 0• - 0 ' : V . '
0 ,:":...'NS.;::1-;NS...NS
. ,NS';, -3.5E-1 V
' ,0, ;.;•'..
069.4
'".. N* .'..-:.;;.. ,JNS. :;.,;:
Base-Catalyzed*(UM-yr)
NS." ~ . - . '
NS
," NS
NS
NS
» NR }0o
; ... .NS. • ..NS
; • NS ;
\ NS. .
3504 .
2E3i ' NRi 6.9E5
- NS
.,- NS ...
Acid-Catalyzed(UM-yr)
NS•...,'-,. ... •
NS „
NS
NS
; NS-•..-';- '0 ,.- -
0
oNS ...
NS
NS
NS -
.'" ,02.19E-5
1.58E-5o
.i: :NS• NS •.;...
ReferenceTemperature
(0
.... . '-- '. ..;
- • -• .
"-... - ••
"
25- . . .. . -'
.. ."• •• '.
- - - :V ' ' '
302525
30
' " " ' • :., - , • ;
* foralkylhalides,pH>11 ' :' . : : " • . . , . ' . ' • '
Abbreviations ,
NS « not significantNR m notreported , ; ,
Mabey, W. R., J. H. Smith, R. T. Podoll, H. L Johnson, T. Mill, T. W. Chou, J. Gates, I. WrightPartridge, J.Jaber, and D. Vandenbcrg, 1982. "Aquatic Fate'Process Data for Organic PriorityPollutants." Office of Water Regulations and Standards, Washington, D.C EPA 440/4-81-014.
flROOD3f

ORIGINAL(Red)
ITABLE 2-5
DISTRIBUTION COEFFICIENT AND MASS FRACTION OF SOLUTEGREENWOOD CHEMICAL SITE
Chemical
ArsenicCyanideAcetoneBenzene4-ChtoroanilineChlorobenzeneMethylene chlorideTetrachloroetheneTrichloroethentTolueneNaphthalene*")Naphthalene<WNaphthalene AA«TetrahydrofuranDEHPChloroform1,2-DichloroethaneDi-n-butyl phthalateXylene2,4,6-Trichiorophenol
Unsaturated Zone
Kd(min)
'-• - .
0.003680.03320.02080.1320.003520.14560.05040.120.3760.520.064
0.0169568E50.01760.05663
0.09921.208
Kd(max)
- '-
0.23922.1581.3528.580.22889.4643.2767.824.4423.64.16
1.102145.2E71.1440.3644,4206.44878.52
Kd(mean)
9241,7000.044160.3984Q.24961.5840.042241.74720.60481.444.5126.240.7680.20359.6E60.21120.06728161.190414.496
Saturated Zone
Kd(min)
- «- •
0.00460.04150.0260.1650.00440.1820.0630.150.470.650.08
0.211951E60.0220.00785
0.1241.51
Kd(max)
•-- -
0.043240.39010.24441.5510.041361.71080.59221.414.4186.110.752
0.1992339.4E6'0.20680.06587991.165614.194
Kd(mean)
9241,7000.01380.12450.0780.4950.01320.5460.1890.451.411.950.24
0.063583.0E60.0660.0212550.3724.53
MassFraction(geo. m«»n)
3.1 E-63.1 E-77.4 E-65.7 E-91.5 E-69.1 E-95.3 E-92.3 E-92.3 E-92.5 E-73.6 E-73.6 E-7'-
1.1 E-63 E-74 E-94.6 E-93.2 E-71.8E-84.9 E-7
iiiiiii
iii
<•> Based on Koc » 940. "<b> Based on Koc » 1,300.(c> Based on Koc * 160. IAbbreviations:
Kd a Distribution coefficientMin a Minimum IMax • Maximum |Naphthalene AA » naphthalene acetic acid (represents total semivolatile Tentatively
Identified Compounds, TICs) .DEHP a bis(2-ethylhexyl)phthalatff IKoc a Organic carbon partition coefficient i
R-49-11-91-12 :^ 2-10 AROQ03I2

i „* V1*• - ' • ' • ORIGU
The rate constants were then adjusted to the units of (1/yr). Sample calculations and derivations ofthe half-life are included in Appendix B. '
I $ &*&$'•* 1 ~ ' h-'
The sources of the half-lives or times and concentrations were Dragun, 1988, and HazardousSubstances Data Bank (HSDB), Augusts, 1991. • Preferentially, soil-groundwater field 'observationswere used. In absence of such data, laboratory Systems data were used, with preference given tosystems using groundwater, soil, and natural mkrobial flora.
When x « 100 percent in time t, it was assumed that time was required for all degradation, and thenumber of time periods of length t in a year were used for the rate constant, since the equations willnot accept a- x a 0.
2.2.2 Solid and Liquid Phase Decay Coefficients
These will be derived by the code; input required (e.g., hydrolysis constants) are supplied.
2.2.3 Calculated Inputs
Mole Fraction of Solute (mol/mol)
For this Input, mass fraction was used instead of mole fraction. This method is believed to result in abetter estimation than mole fraction because when using mole fraction, a molecular formula for soilwould have to be estimated. Using silicon dioxide (sand, Si02) would not be appropriate based onthe soil types at this site, with the potential for underestimating mole fraction. The use of massfraction (g/g) eliminates the necessity for deriving a molecular formula for the soil.
The distribution coefficient, KD, was calculated from the following:
• '"-'••- J < ^K0« KocxFOC '
where: Koc • organic carbon partition coefficientFOC • fraction organic carbon
Koc values were obtained from the literature. In two cases, Koc was Calculated from Kow (seeTable 2-2 and its support documentation in Appendix B). FOC was determined from TOC (totalorganic carbon), which was obtained from Army Corps of Engineers field data. FOC was determined
K-49-1141-12 << •• • ' 2-11 flR0003!3

ORIGINAL(Red)
for the saturated and unsaturated zones; the minimum, maximum, geometric means weredetermined (see Appendix C). The K0 values are listed in Table 2-5.
It was intended that KD values for arsenic would be obtained through mass balance calculations usingthe ACE analytical results of constituent and TC leaching procedure samples. Results (see Appendix C)of calculations of the K0 values for arsenic using the saturated zone soil and leachate data indicatedthe geometric mean KD value was 8,258, while use of the unsaturated zone data resulted in ageometric mean KD of 3,242. The arsenic KD value calculated by Ebasco and reported in the FocusedFeasibility Study report for Operable Unit 1 using ASTM shake test and constituent analysis resultsindicated a value of 924. Because the use of the lower value would bt more conservative (i.e., wouldresult in higher aqueous phase arsenic concentration), the Ebasco value was used, the KD calculatedby Ebasco for cyanide (1,700) was also used in the modeling effort.
Average soil concentrations in the saturated zone were converted to mass fraction by dividing the soilconcentration (mg/kg) by 1x10*. Geometric means from saturated soil analytical results were used assoil concentrations. The mass fractions are summarized in Table 2-5.
2.2.4 Modeling Considerations for Chemical Data
Due to uncertainties in the degradation coefficients described in Table 2-3 for modeling purposes, afactor of safety was used with the data. The degradation half-lives were multiplied by 2 and theproduct was used as the decay coefficient in the model for values derived from soil groundwaterenvironment. For values derived aerobic environments, such as from wastewater treatment plants, orlaboratory studies, the values were multiplied by 10 and the product used as the decay coefficient.
Generally, the distribution coefficient KD was calculated by the Halliburton NUS model internallyusing the Koc and mean Foe values. The Foe values were calculated using ACE data collected fromonsite soils during the pre-design investigation. Separate geometric means were calculated for thesaturated and unsaturated soil zones. KD values for arsenic and cyanide were used directly in themodel.
2.3 DATA HANDLING
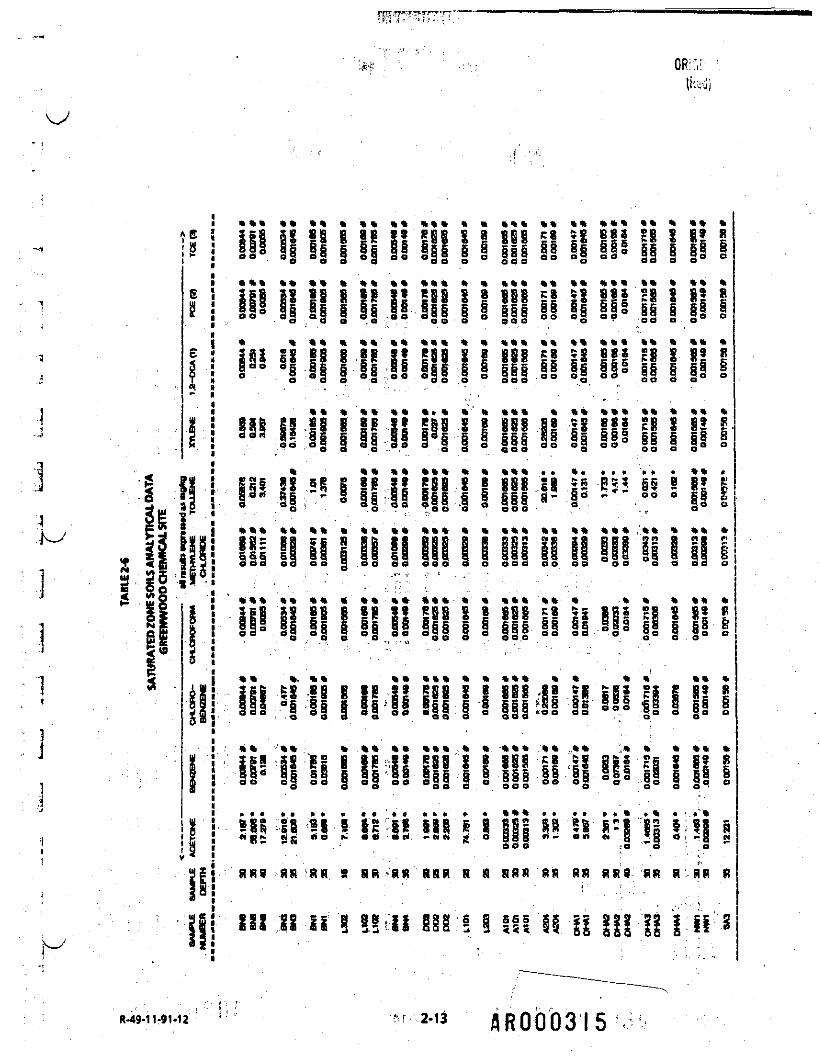
This section describes the methods used in handling blank contamination and below detectable limitanalytical results in the calculation of statistical values for tht analytical results. Table 2-6 summarizesthe results of saturated zone analytical data for soil samples collected by the ACE.
R-49-11-91-12 2-12t
OR::,;- •.
3
" "" 15 I* -SS i I'-II i88 -•! i *8i 5* IS -B52 §5 S S*3rt 81;-' I ll -II III I I III <- -1- - -00 ° IIgJ i !
*** ** «* * «* ** *«* * * «** ** ** *** «* * ** *eo° If 1| I l| §§ g|| I § HI gg §| lo° || I |o o
* ft ft ft* * * * ft* ** ft ft ft ft ft ftft* ** «* ***** * ft ft ft
11 ii i i§ ii ill i i §§§ ii ii ii° ii i ii i• 3 , 3 a . 3 ° w o 3 3 ° Soo °° ° o ° oo o 5° °
* ** * ** «* *** * * *** ftft ft* **• «ft ft ftft *2 IS 88 fi 88 3» *88 S 8 888 *8 *S «*a £8 5 8* »4 bo E "* a E P DC E ** ? a £ Baa EC E * K & K ^ * 5 5s E0 s! Il I Il:II III I I iii.il II IIs II I l! I
** *%* ** **% *'« **« ft »% %*ft «« * ** %g gs eg G 8B $9 legs s 8 ess 88 *£ sss g§ s S* R^ fi S • K « n E D K tt P *» * E W« » ' H E II * ECC ^ •" 5 *" S C" «- ii g is Si iss I i 555 3s sg §33 gg § gs sotf 3 S'lS 3 S 35 S So0 «> ooo a o
* * *« ft ft * ft « *** . * ft • * • . «• • ftft *9 e'a T d T - T d o a w o b b
*** ** ft* * ** ft* *** * * *** ** ft* *** ft* ft ft* *
o b o oo oe S oo o a eeo 3 o o o a bo be ob o b o o a
*** ** ** « ** *'* *** * * *** ftft ft ft ft * ftft *• E9 B i E « 8 E P Ze E • B a e B«» ce e» D D £ ^* S a Jl c tIP ii In ll il Hi 11 III H is--"8 il! M sft ft ft. ft ft * * * * * * * * * * ** ft* ***2SE Si .<8 E >£ J* RSS S * B8S -88 -I c8> £3 £ S' *• SB T * E * » E ^ B C E • * * & flan 'Q E. ePI fe D E "Q B " C C
ill:6 I i'll t I til Ii s« I § Ift* ft* .;; * ft* ** »*» * * •*** .ftft Lft* .,* * ft ftft ft
B O a HE CD K SC'Bfl Bee E B E C C SB Be 8 t 5 eo e B Q BH B u BO b P B M B P O Qfifi'fi P MKK q B Q B a o o HP fi Ho »33 SM n 3 B 3 q n a S Q ~ «t 5 P o P oo o a "3 Q Pa o3 3 3 B ** Boo a B oao ™° **o H o° o o • a
* « ftftft •• •* . . ft • ft . « ft
600 ; O ~ O O *"
8H Rfi 5 8R -R« SfiR R A SSfi flR RR RK9 RR R flfi R
ii 1 !!;;ii ggg ! § Hi il If
flROOlD3l5

's
s
883 88 88 i ii ii iii i i sas si ss 888 ii i. i
*** * * * ** * * * * * * *8 Be n *. *! B d ffi o( ^9 0*9)0 9 R P E P b £ ft fi * B B BE B C ID Kl*. ™< i! d 3 f ~ n° r- ™ *r Q • [*5 9 B R B S S 85 S 8 8 28 8 9 BQ <fl M O O O {f O O O g£ O *T O "^ OO OO O •* O d *f O O Q C)o o a
*** ** »* * ** ** *** * * •«* ft* "ft* *** ftft ft ft*" I 18 S r SS ?** S 1 "IS 89 88 115 IS 9 98 S*"*" •~ 9 ~ ~ «*"*" »•• T-» w« oo SSO — b a o o o
S3! if Si g §| IS S§§ 1 | iig ig M p| i| s ISooo ** ob d o "o o**° ** o SSo efi °3 d o 2' 32 2 2r
«** ft* ** * ** ** *** * * *** ** **. ftftft ftft ft ftft ft
bo b bb ei
*********.***** * * * * * * * * ft ft * *BN8 88 88 8 88 88 888 9 8 888 §§ 88 t=5 «« R 85 8° bd dd b d d dd dd odd ** d 2 b b bd dd *~ *• •• 0 g Q 9 °
M «« '
5.„ ?. ? .. ., ,.. . . ... .. ** **? .? ?8» 28 3 sa 5? S^ ? R 818 SIS 88 ill 88 i Soe °3 ° ao d3 -do d o 5|5 »g gg ||g ;8 g 8
b • - bd o
Q 01 tttt ttO B *0 *ft fl^O •f^tf) O fl ** ** *ta A«Ai fttaflB «!«•% — M Ai MM •*! ••
5 d| |S I |g 35 S§5 | 3
999 99 99 i 99 99 9§i 9 8 999 99 £8 999 85 9 SS 90 ° 33 ?« _
HWW ww w H *• cipi ww n PV n H H BIHH HH HH MWV ww B ww PI
a@ ii SSS s i BBS S3 i? 333 22 3 ii-- 32 SHB 3 3 555 gg jj gjj jj j ss i^irM9.ii-9i.i2 • 2-14 •onnn'Jic |flR0003!6
i

w ur
1 H•' .5
iiii
iI
!§ij|
SS»B|l
W?3v c
d d d P o d Po o
ddd°d oSo o
oorigd og
d d d g b b g
bod
d d d so
II1!!fliilil
,- ORIGINA;(Red)
MS ARQ003J7

ORIGINAL;Rsd)
S
2
IP ii<a !*33 val *LNQ - , I
,11
o 8b
n 3 pip
s
- -O O Gi
1 * >O w Wfl» a a K ig«ss^
£III(1• » P ain1,
H,"1
« p 6II 1
S
8
j
ljii"it"*!l*
*lS||||4|||j]||
S "5 ^IjiJIJjJIJ — I
MS 3R0003I8 I

2.3,1 Armv Corps of Engineers Data HandlingV> " • • .. - i i - . . , , . . .,.._ . *-,^iX—* . :»,V ».*
; ; • Raw data obtained by Halliburton NUS on or before August 27,1991 were used.
j - The arithmetic mean of duplicates was used where duplicate or split samples were'• taken. - • .•--"".'. ,: ,,. ", ." '
' • ' ' - • ' ' ' 1 ' . • ' : -
• 3 : - . - , - . , • • • .;-, , , ; . - ; ' -i . - F o r each stage, blanks were averaged. When averaging blanks, the arithmetic mean
4was used, using one-half the detection limit for non-detects for chemicals for which
* . both positive results and non-detects were found. This average concentration wassubtracted from every positive sample of the same stage. The result of this subtraction*
' was then substituted for the positive result. If the result was a negative number, thenthe result was treated as a non-detect Asof Augu$t27,1991, cyanide blanks were not
1 provided for Stages 1 and 2. The Stage 1 BNA blank also applied to Stage 2. Because of* time constraints, blank adjustment of data was applied only to the saturated zone* • ' . " " ' data. ' ' • • " • • , ' - , . . - • . - • . , • • • • i .* ' . . ' ( - , . ' • ' , „ ' • . ' • , - . -
- for non-detects, one-half the detection limit was used. CRDls were not used because| . • they apply to CLP data; these data were not produced under the CLP. This was applied
to saturated zone data so that average chemical concentrations in the saturated zone} • could be calculated. Because of time constraints, this adjustment was only applied to
the saturated zone data.,; ' ;
'' • Arsenic, arsenic concentrations Were compared to reported background concentrations.. The source of the background concentrations was Ebasco Services, Inc. for USEPA,:' August 1990, p. 6-6. The maximum of the arsenic background concentration range (<2 to
. 10.9 mg/kg) was used. Any result greater than 10.9 mg/kg was considered to be abovev . ; background, '. ,; • •3 • * • - - , . , < '
• Calculations for blanks:
•' ;. - " ;-; - *-.•' Stage 1 _ \Methylene chlorideAcetone (ppm) • *-\ ••- . . ;Di-n-butyl phthalate (ppm)
not positively detected in samples; therefor* no effect.(Q.Q2548>: 0.0005 + 0.0005)/3 « 0.00883 ppm(0.51)/1 » 0.51 ppm
R-49-11-91-12 2-17
AR0003I9

ORIGINAL(Red) I
Stage 2Methylene chlorideAcetone (ppm)
Toluene (ppm)
Xylene (ppm)
Di-n-butyl phthalate (ppm)
not positively detected in samples; therefore no effect(0.0005 + 0.0005 + 0.00655 + 0.01056 + 0.01393 +0.0005 + 0.02702 + 0.000 5)/8 » 0.0075
(0.00025 + 0.00025 + 0.00313 + 0.00298 + 0.00463 +0.00299 + 0.00568 + 0.00025)78 » 0.0025 ppm
(0.00025 + 0.00025 + 0.00025 + 0.00025 + 0.00025 +0.00025 + 0.00235 + 0.00569)/8 * 0.0012
(0.51)71 - 0.51 ppm
Stage 3Methylene chloride (ppm)
Acetone (ppm)
Toluene (ppm)
Oi-n-butyi phthalate (ppm)
Bis(2-ethylhexyi)phtha!ate(ppm)
(0.00184 + 0.0072 + 0.00266 + 0.0005 + 0.00442 +0.02549 + 0.0075 + 0.0005 + 0.0005 + 0.00499 +0.00498 + 0.0005 + 0.00935 + 0.01509 + 0.0005 +0.0005 + 0.0005 + 0.00597 + 0.00386 + 0.00522 +0.00526 + 0.0438 + 0.00445 + 0.0057 + 0.02164 +0.00714 + 0.01902 + 0.01516 + 0.00324 + 0.0005 +0.00372)731 » 0.0062 ppm
(0.01354 + 0.0091 + 0.02643 + 0.0005 + 0.00372 +0.03519 + 0.00544 + 0.0005 + 0.00642 + 0.0005 +0.0005 + 0.0005 + 0.01708 + 0.01258 + 0.0005 +0.02169 + 0.0005 + 0.00648 + 0.0216 + 0.01347 +0.0005 + 0.0005 + 0.00547 + 0.0005 + 0.01067 +0.00614 + 0.02091 + 0.0005 + 0.0005 + 0.0005 +0.01277)731 » 0.0082 ppm(0.00025 + 0.00025 + 0.00025 + 0.00025 + 0.00508 +0.00025 + 0.00025 * 0.00025 + 0.00025 + 0.00025 +0.00025 + 0.00025 + 0.00025 + 0.00025 + 0.00025 +0.00106 + 0.00108 + 0.00025 + 0.00025 + 0.00025 +0.00025 + 0.00025 + 0.00025 + 0.00025 + 0.00025 +0.00025 + 0.00025 + 0.00025 + 0.00025 + 0.00025 +0.00025)731 a 0.00046 ppm
(0.56 + 0.664 + 0.866 + 2.076 + 1.434 + 0.377 + 0.632+ 0.344 + 0.437 + 0.686 + 0.659 + 2.7 + 0.05 + 0.05 +0.05 + 0.05 + 0.027 + 0.018 + 0.05 + 0.05 + 0.05 +0.05)722- 0.54 ppm(0.15 -t- 0.366 + 0.413 + 0.196 + 0.226 + 0.272 + 0.15 +0.15 + 0.15 + 0.15 + 18.524 + 0.15 + 0.05 + 0.05 + 0.05+ 0.05 + 0.05 + 0.191 + 0.05 + 0.05 + 0.05 + 0.05)722a 0.979 ppm
FM9-11-91-12 < 2-18 « « * «flR000320

1j ^j surface to a depth greater tharvlSfeet beneath the main source area of the site and is nonexistent in
some isolated locations in the western portion of the site.iThe saprolite consists generally of a silty clay that is the by-product of in-situ chemical weathering of
] the bedrock. The surface of the saprolite can be found at the ground surface in the western portionof the site, where fill Is non-existent, to depths greater than 15 feet beneath the ground surface in
i the north central portion of the site. The saprolite has an overall thickness of greater than 70 feet in• '• the northern portion of the site and thins generally to the south. In isolated southern and western
areas of the site, the saprolite is nonexistent and the bedrock comes in direct contact with the3 unconsolidated layer. A gradational contact exists between the saprolite and the underlying
bedrock. • • • =. • r v .; ' " . " • •j . .'- - • •' - ,• > , • . .. ,. • . . ,-. ,, • ,.
' The bedrock consists of a gneiss of the Pedlar formation. Moderate to high degrees of fracturing' exist within the upper portion of the bedrock. The depth to the bedrock surface is highly variable•'/ . . •
ranging from less than 10 feet beneath the ground surface in the western portion of the site, to a1 depthofgreaterthanlOOfeetinthenorthemportionofthesite. . : <•* ", At the request of the EPA, the unconsolidated layer was further subdivided into individual subunitsl ~S for two areas at the site; the drum disposal area and the main source area. The purpose of the
subdivision was to develop more specific Input parameters for,the modeling activity. The subunitsi • • identified are fill, reworked unconsolidated material, and the undisturbed unconsolidated material.
The identification of these subunits within a vertical and horizontal profile is highly interpretativedue to the limited amount of data that exists within these areas in addition to the relatively similarvisual appearance that exists between each subunit A discussion of the characteristics ;of each
: subunitbeneaththetwoareaslsincludedlnthefollowingparagraphs... ; • . - . - - - . . • ' . •
The fill beneath the main source area consists primarily of a silty sand with some clay and a trace of• gravel and construction debris. The fill is nonexistent in sporadic locations and is more infrequent in
" the northern portion of the main storage area than In the southern portion. The fill extends from theground surface to an average depth of 1 foot beneath the ground surface.
Reworked unconsolidated material underlies the fill beneath the main storage area and consists ofdisturbed unconsolidated material mixed with a trace of root material and construction debris. Theaverage thickness of the reworked Unconsolidated material is 5 f«et^,;
R-49-11-91-12 '' »' . " \2-23 : •' ' 'J . . ! '" .'
BR00032U
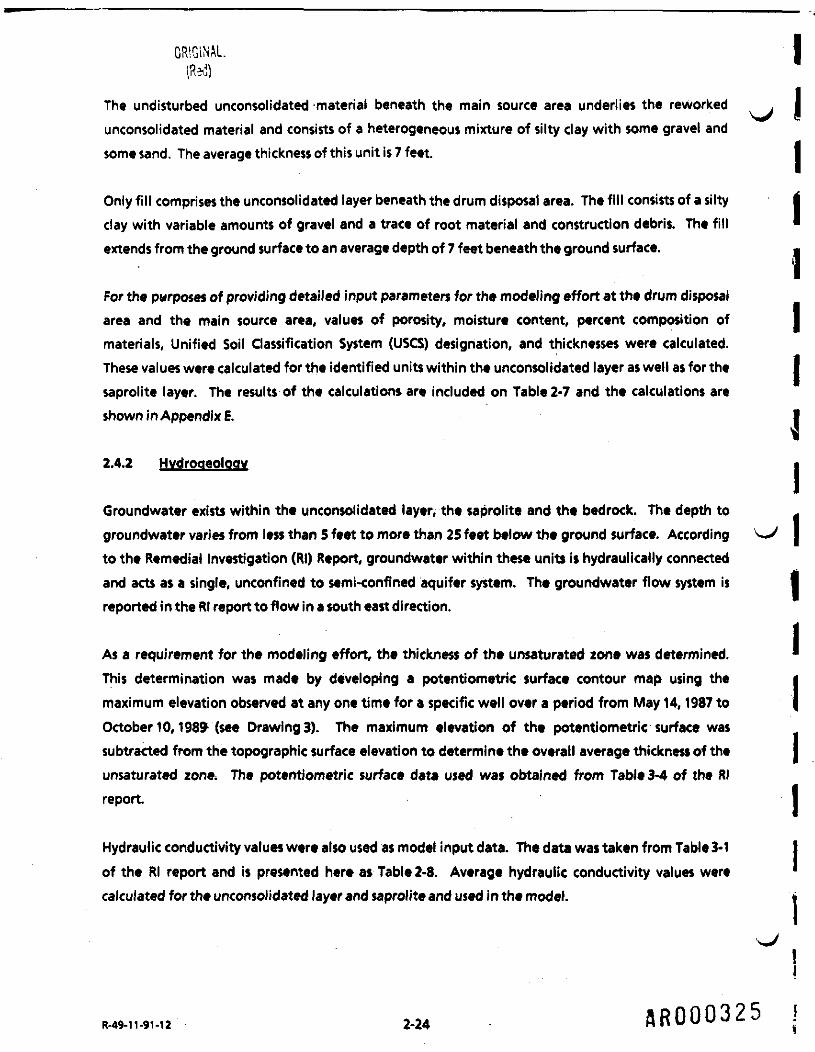
ORIGINAL. IThe undisturbed unconsolidated -material beneath the main source area underlies the reworked . Iunconsolidated material and consists of a heterogeneous mixture of silty clay with some gravel andsome sand. The average thickness of this unit is 7 feet. I
Only fill comprises the unconsolidated layer beneath the drum disposal area. The fill consists of a silty fclay with variable amounts of gravel and a trace of root material and construction debris. The fill •extends from the ground surface to an average depth of 7 feet beneath the ground surface. .
iFor the purposes of providing detailed input parameters for the modeling effort at the drum disposalarea and the main source area, values of porosity, moisture content, percent composition of Imaterials. Unified Soil Classification System (USCS) designation, and thicknesses were calculated.These values were calculated for the identified units within the unconsolidated layer as well as for the Isaprolite layer. The results of the calculations are included on Table 2-7 and the calculations areshown in Appendix E. I
2.4.2 Hvdroaeoloav •
Groundwater exists within the unconsolidated layer, the saprolite and the bedrock. The depth to -groundwater varies from less than 5 feet to more than 25 feet below the ground surface. According ^ Ito the Remedial Investigation (Rl) Report, groundwater within these units is hydraulically connectedand acts as a single, unconfined to semi-confined aquifer system. The groundwater flow system is Ireported in the Rl report to flow in a south east direction.
As a requirement for the modeling effort, the thickness of the unsaturated zone was determined. •This determination was made by developing a potentiometric surface contour map using the |maximum elevation observed at any one time for a specific well over a period from May 14,1987 to |October 10,198$ (see Drawings). The maximum elevation of the potentiometric surface wassubtracted from the topographic surface elevation to determine the overall average thickness of the Iunsaturated zone. The potentiometric surface data used was obtained from Table 3-4 of the Rlreport. I
Hydraulic conductivity values were also used as model input data. The data was taken from Table 3-1 Iof the Rl report and is presented here as Table 2-8. Average hydraulic conductivity values were 'calculated for the unconsolidated layer and saprolite and used in the model. \
2.24 ft R 0003 2 5

v~x
3i,
i i.iJ
1 ' :1 B.
>
1 ^j- g
I
.1 S<
. O uii n c! ^ •J 0 =!
if,iw § ||
i~ iu S; M
s!j J.
; I., <£ "* s<
i /
g'9 <*
ri 1.2
i |:;50••
a :,a :
1 : ••1 -tp , ..JHo*». '
!ti1 ;-1 -1 \
Iff|£g
1 '"• 1
S i
82
in in
p inm m•-tn pN S
• , .
dd
»-(N m
."""
f^ Md d
N O
I'*5 = 1I**"2
I i^ -i i
mo *n o
•»B; » «
Sff! ? :> •
,. . . -•.*^ (N ..( 1C
* • *
, . . , „
$J - d ; d
'•
-v . • "
4J Ul IO- Ift
* v:*S, •' ' '>•' • -- - '
If f 'ft} - ffd d d . d
«- in P* i m
-. . '' ..
•••-;;-•••..•:,,i..J,,
8 llfllL i • *•§ i &•i2
1o'S . . 'JS , .
i . -'S „>4-Ul . -
±g . . . . . . . .X - ,9* '<1 . 1
•'..5 ' '. •' " ' '..'-3 ' . ' • - : • . . . . :1 . . iI 1 •o H > • ' - . ' '!S "I I .-•-•• •i i -v."1 'S "" : I ' '•1 1 :
1 J . '' •
ff i5 E „. - -•E L'S t* 5 Siniiu' •i i s s :llll •• ;Ipl ;; : ;; ,:11 |SSos > .SSS£
j~~ ~~ — ~ ——R-49-11-9MZ , -, . 2-25
AR000326

ORIGINAL
TABLE 2-8
HYDRAULIC CONDUCTIVITY SUMMARYGREENWOOD CHEMICAL SITE
Monitoring Well
MW-1MW-2SMW-2DMW-2D**MW-3MW-4MW-5MW-7SMW-7DMW-10MW-10DMW-11MW-12SMW-14SMW-14DMW-16SMW-16DMW-17SMW-19*MW-20S**
Unit
08OB08OBOB08OBOBOBOBOBOBROCKROCKROCKROCKROCKOB
OB/ROCKOB
Average Overburden
Hydraulic Conductivitycm/secO)
4.1x1(K4.8x10-42.6x1(H7.6x10-51.4x10-47.6x10-57.6x10-59.4x10-58.5x10-53.8x10-51.9x10-54.3x10-32.6x10-34.1x10-49.3x10-53.7x10-34.3x10-*4.3x10-61.9x10-53.8x10-54.08x10-4
IIIIIIIIiIIIOB Overburden Well (includes both unconsolidated material and the
saprolite).ROCK Bedrock Well. I<1> Data from Table 3-1 in "Final Remedial Investigation Report," |
Greenwood Chemical Site, August 1990. Ebasco Services, Inc.
* Well is screened just below or across the weathered bedrock and joverburden contact.
** Pumping test . .
Note: All results are based on rising head or falling head tests unless 'otherwise noted. ^J
2.26 AR000327
2.4.3 Modeling Considerations .,
An infiltration rate was determined using a water budget and infiltration rate program, the HydraulicEvaluation of Landfill Performance (HELP) Model. The specific soils information required to run the
• HELP model included thickness, porosity, moisture content/soil classification, and composition. Thevalues used for these parameters in the HELP model are summarized in Table 2-7. .
Meteorological data required for the calculation were obtained from Table 3-8 of the Rl report.Calculations and the results of the HELP model run are included in "Appendix F. The resultinginfiltration rates used in the Halliburton NUS modeling were 0.973 feet per year (Main Source Area)and 0.903 feet per year (Drum Storage Area).
The potentiometric surface map (Drawings jrt the back of this report) was used to discern whichsamples were collected from the saturated zone and which were collected from the unsaturatedzone. Sample locations and the corresponding depth to maximum water table elevation aresummarized in Table 2-9. ' ' :;;T , '
The average overburden hydraulic conductivity value was determined to be4x 10-4 cm/sec. This value'\_J was used In Halliburton NUS model to calculate groundwater flow velocity in the aquifer.
2.5 AREAL EXTENT OF CONTAMINATION AND REPRESENTATIVE CONCENTRATIONS
The last information developed for the modellnput was the areat extent of contamination and therepresentative concentration. The analytical soil data from the USACE pre-design field investigation
. was used for this purpose to generate mean values for each chemical at each sampling site. REM III(Rl Report, Ebasco Services, Inc., August 1990) soil analysis results were used as required tosupplement the mapping procedure where Insufficient USACE data was available (in the DrumDisposal Area and total semivolatiles as representative of naphthalene acetic acid). Separate meanvalue sets were generated for the saturated and unsaturated soil zones. In the Drum Disposal Area,groundwater analysis results from samples collected at the monitoring wells MW01 and MW04' - ' • ' , • - • • • " • _ - - . . ' , . ' . < «.during the REM III Rl were used to Calculate the saturated zone soil concentrations because soilsamples were not collected from the saturated zone. The groundwater concentrations weremultiplied by the distribution coefficient XKD, see Table2-5) to generate the saturated zone soil
: - - 1 A : •concentrations used In the modeling effort • The mean values determined for the saturated and.unsaturated sot! zones are summarized in TafalesZ-10 and 2-11, respectively, the mean values were- -- * • •• , •• >.plotted on sample location maps, and the median concentration was determined after examining theIsoconcentration contours for each chemical in each zone. These maps are included in Volume II of
R-49-11-91-12 ' ''• f l ' f • " ; -2-27

(fcd)TABLE 2-9
MAXIMUM GROUNDWATER TABLE ELEVATIONS FOR ARMY CORPS SAMPLING LOCATIONSGREENWOOD CHEMICAL SITE
SampleIdentification
L101L102L103L201L202L203L204SA01SA02L301L302L303L305DD01DD02DD03DD04DD05BN01BN02BN03BN04BN05BN06BN07BN08L105L106L107
MaximumGroundwater
SurfaceElevation
902902905903898898899912915893893892898904901886884887911901912910912913910913906906900
SurfaceElevation
925.6A925.4 A926.2 A921. 2 A920.2 A920.2 A920.3 A943.8 A945.3 A909.5905907918924918911907903938927942
940.1 A940942935942930929920
ElevationDifference
23.623.421.218.222.222.221.331.830.316.5121520201725231627263030.128292529242320
DTS
25*30*5NS20251010NS515*551030*520535*25*35*35*NS151540*220.5
R-49-n.9t.i2 2-28 AR000329

1•i
TABLE2-9 > t '•-*•{MAXIMUM GROUNDWATER TABLE ELEVATIONS FOR ARMY CORPS SAMPLING LOCATIONSGREENWOOD CHEMICAL SITEPAGETWO
SampleIdentification
L108- L109
L306L307;L308
' L309.L310L311:
L312L313L314BNE6
: BNE7BNE8A401A402A403A404
< A405A406A407BNE1STOtST02ST03NED1NED2NED3
MaximumGroundwater
SurfaceElevation
90189889989889889789689689489489290289589091881891991591091892490793t ;
933932941936935
SurfaceElevation
92092091891?91791491491391291t909927920915
r 947H 947
947946947945
; 951932.7
. 9 5 7958957962958955
ElevationDifference
19221919191718171817172525252912928
. 31; 37
272725.7262525212220
*
DTS (
22
; 0.5 ;1.5.2
, . " - : 2 ;; 0.8
0.822 ,
•-
13 '4 -
3 ,13 !17
-/- 10, 10
105
- 12132511111
R-49-11:91-12 2-29 HR000330
GftC'.NALIP-*J1
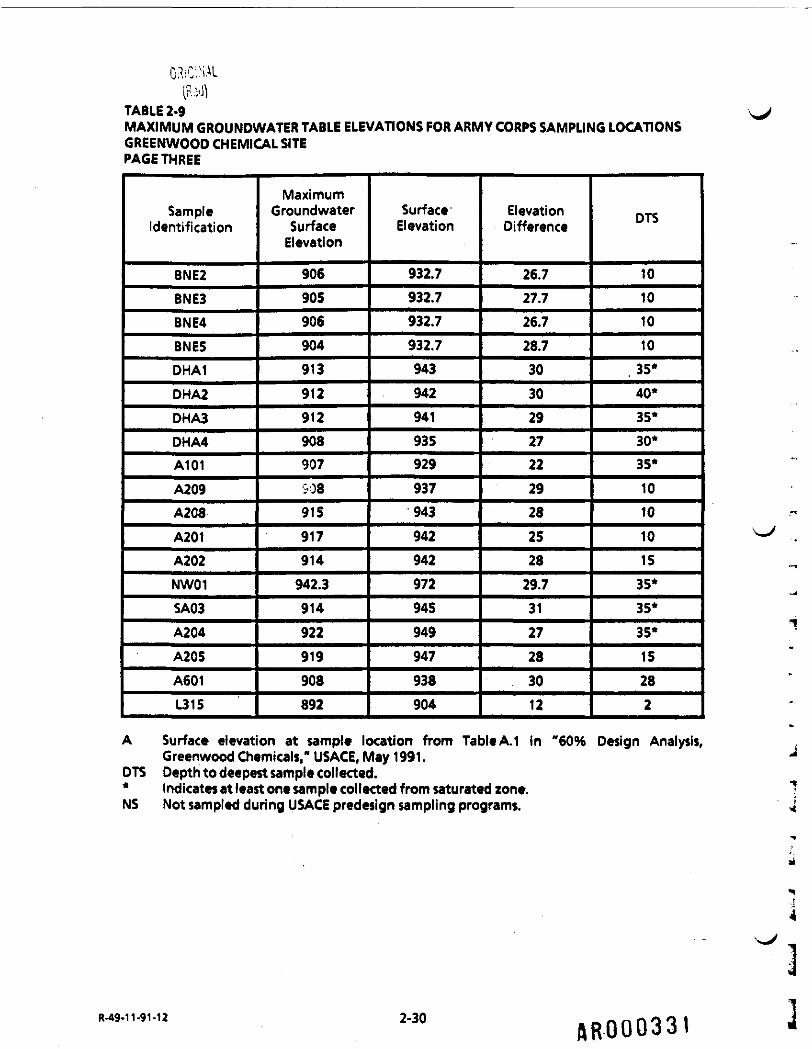
TABLE 2-9MAXIMUM GROUNDWATER TABLE ELEVATIONS FOR ARMY CORPS SAMPLING LOCATIONSGREENWOOD CHEMICAL SITEPAGE THREE
SampleIdentification
BNE2BNE3BNE4BNE5DHA1DHA2DHA3DHA4A101A209A208A201A202NW01SA03A204A205A601L315
MaximumGroundwater
SurfaceElevation
90690590690491391291290890790S915917914942.3914922919908892
SurfaceElevation
932.7932.7932.7932.7943942941935929937943942942972945949947938904
ElevationDifference
26.727.726.728.730302927222928252829.73127283012
DTS
10101010
. 35*40*35*30*35*1010101535*35*35*15282
A Surface elevation at sample location from Table A. 1 in "60% Design Analysis,Greenwood Chemicals." USACE, May 1991.
DTS Depth to deepest sample collected.* Indicates at least one sample collected from saturated zone.NS Not sampled during USACE predesign sampling programs.
R-49-11-91-12 2-30 SR00033I

ORIGINAL(Red]
Ih §*
<
Ante
Add
fr-tftfll"
!
11
i
3
so
a
3
o
3
a
i3s
§
3
s
3
o
3§i
i
g
a
3
3
S
a
S
s
3
S
ei
i
S
Z
a
3
i
f4
3
s3
3
3
S
ei
s
3
3
S
3
3
1
i
$a
i
e
S
3
3
3
3
s
3
3
3
3
3
3
3
3
3
3
a
a
3
a
1
3
8
3
3
a
3
3
I
2
1 i t
——————-. ....-.—————————N1 ' t, i» " " * "
2-31 ,?flR000332

ORIGINAL
siw P '
*1»|HI a
Bf
Is
• !
ss
R-49-11-91-12 2-32
: aROQ0333

1-V , ' .
J
J].1 . .3i
t J*
; f!&£
'
PJpTJIFlE F1*
- " '• •• - 4 ?' ;* »> , ORIGINAL•'V', :-"*1 •*'*"*" (R ;
IIIIif
ijl1!in111illK{e|
11S|
|!It *hj!il*ibll18i
ii!i
i>
SI10
Rma
K5
I3
3
3
8
8
S
!*~3
sua
3
SD•
9if
Sj
«9
*»
!«nB
n*
a
3
3
3
3
3
I
3
s
3
*
3
*
3
va
:a
m3—
e
3
2
Sj2
2
2
t
2
2
2
2
2
2
t
2
2
2
4
16
V
\
I^
J
2
[
2
2
2
2
2
2
2
2
2
2
2
2
2
2
$%
* ", « is,
;-""i - i ! • ! 1 2 « "•5 i ! S ? i 5 i i :
223838838222222
22 1 i i II ! ! i : : .
223338838222222
22SSSS888222222
223333333222222
223833333222222
223333388222222
223388383222222
;;ii*i*iM""*m r>> a
: j i
.M —— MIIIIIII
M i i i i i i 1 M ! M 2
R - l ^ S B *ii^a^^s<«i«
22SS 833 ^222222
< < * 8 S ¥ ' * ^ S < < « < < <r^ m f t • f a
! ? i J S ! ! M ! ! ; i S i
'.•^^E.^.^'M^^
* "• "•
33 " *
< « < < < < a
2222333333333
22222223388^3^ ' '
2 2 2 2 2 2 8 8 3 8 3 ?
2 2 2 2 2 2 2 3 3 3 S 2 S S |a R a S ^
2 2 2 2 2 2 2 8 3 8 3 8 a i i
! 'i-•••••--"••-- j22223338^888^ |
2 S 2 2 2 2 2 8 3 J 8 | B g |
5 '3
R 1 '
_ _ _ _ _ _ _ _ _ _ _ _ _
*SS* B" '*SiJS!8i.,.28.a |
«nS3M"m2|<«<*<<<^!(tS8afl!;' -1?-*' i lit-5§!5iiiiiliil|jil
. ^ . _ _ . _ _ . ™ ^ ^S5S!S2SS£SES £85
2-33 AR-00033U

ORIGINAL(Red)
this report. The maximum soil concentration encountered at any sample depth for each chemical ineach zone was also determined for use in the modeling screening procedure described in Section 3.0.These maximum soit concentrations observed are included in Table 2-12.
The area! extent of contamination was also determined from the isoconcentration plots. The zerocontour was plotted at the outside edge of the concentration contour, beyond the location ofpositive detection of the chemicals. The width (in tht direction perpendicular to groundwater flow)and length (in the direction parallel to groundwater flow) were determined from the maps using thezero contour as the outer boundary of the contamination. These length and width dimensions werethen used as inputs to the model.
Based on the mapping exercise, up to three distinct zones of contamination were identified for eachchemical, including:
• Area 1 A, Main Source Area, which includes the areas south of the chemical manufacturingbuildings and north of Lagoon 4;
• ArealB, Northern Warehouse Area, which includes samples collected at the NorthernWarehouse and the area east of the warehouse (" NWH and " NE" series samples). This areawas separated from the Main Source Area determination because of the horizontaldistance of separation and the lack of analysis results in the area between Area 1A and IB.In many cases, only one data point was available for mapping in this area, so that thissource area was not analyzed for all chemicals where the results indicated no positivedetections.
e Area 2, Drum Disposal Area, the area west of Lagoon 4 between the access road and thewestern property boundary, where drum removal actions occurred previously.
The areal extent of contamination and the median soil concentrations for each aree are summarizedin Table 2-13 (Saturated Zone Soils) and 2-14 (Unsaturated Zone Soils).
R-49-11-9M2 , 2-34 ~^rtrtrtrrflR000335

OR1G
r TABLE 2-12
MAXIMUM SOIL CONCENTRATIONS (mg/kg)ENCOUNTERED IN REM III Rl OR ACE PRE-DESIGN SAMPLING
GREENWOOD CHEMICAL SITE
Chemical
ArsenicCyanideAcetoneBenzene4-Chioroaniline .ChlorobenzeneMethylene ChloridePCETCEtolueneNaphthaleneNaphthaleneaceticacidTetrahydrafuranBis(2-ethylh«xyl)phthalateChloroform1,2-DCADi-n-butyl phthalateXyl«ne2,4,6-Trichlorophenbl :,
Area 1 A \
Unsaturated
2,470.01,000.0201.3
0.166.31
. 5.120.597.20.14
0.0235125.8
757,2
17.0
9.0
104.4
0.041
0.05139.41834.02 :•0.468 .
Saturated
J3.51.6874.8 >0.130.18,0.48ND
ND
ND
20.6
10.56
ND
*.76
8.41
0.0630.942.293f.96ND
, Area IB
Unsaturated
33.412.8
17,03
ND
ND
. ND
ND
ND
ND
ND
556.9
ND
ND
ND
ND
ND
1.484
ND
ND
Saturated
16.29.2
1.4
ND
ND
ND
ND
ND
ND
ND
ND
ND
ND
1.76
ND
ND
ND
ND
ND
Area 2
Unsaturated
70180.3d)73,910.2
230(D
0.23
0.191. 305.5(D0.14932(D264.25
32.18
37800)
ND
2.04
16(D0.026(D1.74
64.24
ND
Saturated
2.620.4(2)
2.80.029(2)
ND
ND
0.013(2)
ND
0.019(2)
10.350)
0.12
2.64(2)
0.053(2)
0.61
0.038(2)
ND
1.23
0.027
ND
Maximum • Highest concentration encountered at any sample location and depth.(D REM III Rl Report Data ! > ' : j • ;(2) Determined from groundwater concentrations reported in REM III Rl Report.
MC1MM2 "' '•?•'-. . ; ' . - . 2-35 HROD.033JS
ORIGINAL
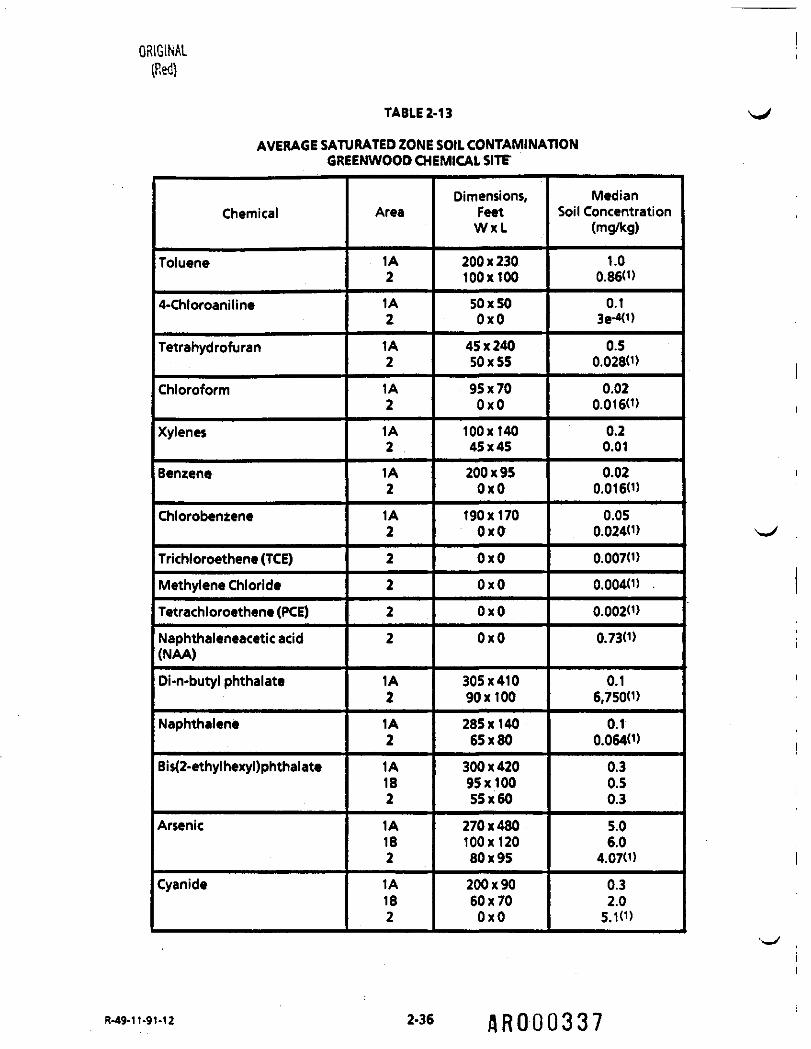
TABLE 2-13
AVERAGE SATURATED ZONE SOIL CONTAMINATIONGREENWOOD CHEMICAL SITE
Chemical
Toluene
4-Chloroaniline
Tetrahydrofuran
Chloroform
Xylenes
Benzene
Chlorobenzene
Trichloroethene (TCE)Methylene ChlorideTetrachloroethene (PCE)Naphthaleneacetic acid(NAA)
Di-n-butyl phthalate
Naphthalene
Bis(2-ethylhexyl)phthalate
Arsenic
Cyanide
Area
1A2
1A2
1A2
1A2
1A2
1A2
1A2
2
2
2
2
1A21A21A182
1A1B21A182
Dimensions,FeetWxL
200x230100x10050x500x0
45x24050x55
95x700x0
100x14045x45
200x950x0
190x1700x0
0x00x00x00x0
305x41090x100285x14065x80300x42095x10055x60
270x480100x12080x95
200x9060x700x0
MedianSoil Concentration
(mg/kg)
1.00.86(D0.1
3e-40)0.5
0.0280)
0.020.0160)
0.20.01
0.020.0160)0.05
0.024(1)
0.007(D
0.004(D .
0.002d>
0.73(D
0.16,750(D
0.10.064(D0.30.50.35.06.0
4.07(D
0.32.05.KD
R-49-1t.9M2 2-36 ARQ00337

(Red)
TABLE 2-13AVERAGE SATURATED ZONE SOIL CONTAMINATIONGREENWOOD CHEMICAL SITEPAGE TWO ' '
Chemical
1,2-DCA
\ i -Acetone
i• Area)...,... ...\ 1A1 IB
2. ,, 1A! 18
2
Dimensions,FeetWxL
50x500x0
. 0x0
50x500x0
MedianSoil Concentration
mg/kg
0.2 .ND' ND
0.30.0130)
(D Median saturated soil, concentration calculated by multiplying the meangroundwater concentration (data from MW01 and MW04 found in the 1990 RlReport) by the distribution eoeffici«nt, Kd. Other data from USACE Pre-b«signSampling Work. « - : , >
:1•*4
.1
R-49-11-9i-12 • , ' . , ! 2-37 aRO00338
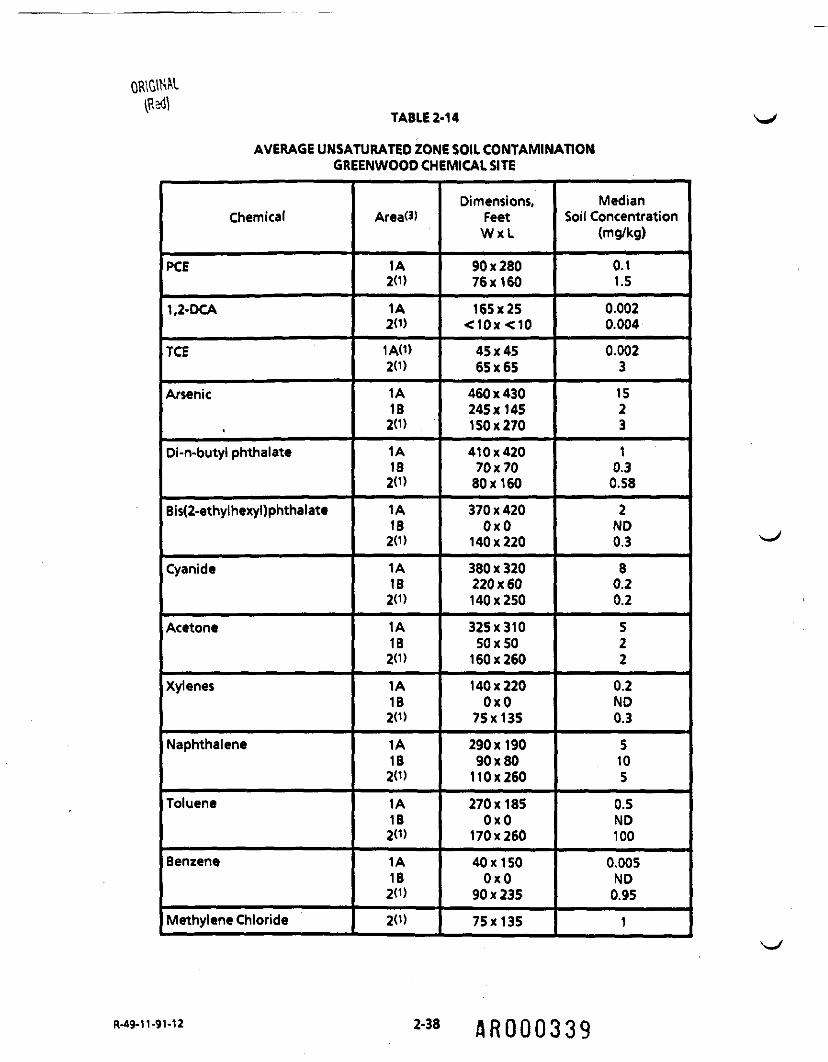
OWGWMTABLE 2-1 4
AVERAGE UNSATURATED ZONE SOIL CONTAMINATIONGREENWOOD CHEMICAL SITE
Chemical
PCE
1,2-DCA
TCE
Arsenic
Di-n-butyl phthalate
Bis(2-ethylhexyl)phthalate
Cyanide
Acetone
Xylenes
Naphthalene
Toluene
Benzene
Methylene Chloride
Area(3)
1A2(D1A20)1AO)2(D
1A1B2(D
1A1B2(D
1A1B2(D
1A1B2(D
1AIB2(D
1A1B20)
1A1B20)
1A1B20)
1AIB20)
20)
Dimensions,FeetWxL
90x28076x160165x25<10x<10
45x4565x65
460x430245x145150x270
410x42070x7080x160
370x4200x0
140x220
380x320220x60140x250
325x31050x50160x260
140x2200x0
75x135
290x19090x80110x260
270x1850x0
170x260
40x1500x0
90x235
75x135
MedianSoil Concentration
(mg/kg)
0.11.50.0020.0040.00231523
10.3
0.58
2ND0.3
80.20.2
522
0.2ND0.3
5105
0.5ND100
0.005ND0.95
1
2-38 /JR000339

ORIGINAL(Red)
TABLE 2-14AVERAGE UNSATURATED ZONE SOIL CONTAMINATIONGREENWOOD CHEMICAL SITEPAGE TWO
Chemical
4-Chloroaniline
Chlorobenzene
Naphthaleneacetic Acid
Tetrahydrofuran
Chloroform
AreaO)
1A
IB20)1A1B20)1AW1B«>20)
1A1821A1B20)
Dimensions, FtWXL
60x26060x1800x0
85x160
130x2000x075x80
325x325110x85130x250120x2300x00x040x400x075x80
MedianSoil Concentration
(mg/kg)
0.10.1ND2
0.01ND2.5
500(2)20(2)100(2)
0.05NDND
0.003ND1.5
(i) Median Soit Concentration and Dimensions of Drum Disposal Area estimated fromEbasco Services data (Rl Report, August, 1990); other data from Army Corps ofEngineers.
(2) Assumed to be the sum of semi volatile TICs.(3) Definitions:
Area 1A « Main Source Area; Area 16 • Northern Warehouse AreaArea 2 • Drum Disposal Area
W REM III Rl Report semivolatile TICs used to determine contaminant distribution.Areal distribution adjusted by subtracting average background concentration(25 mg/kg) from each data point.
ND • Not Detected.
R-49-11-91-12 2-39 flR0003l*0

ORIGINAL(Red)

3.0 GROUNDWATER MODELING
* After determination of the inputs required for modeling, a screening procedure was used to' minimize the computer runs necessary. This screening procedure included the use of the theoreticali distribution of a chemical between the soil and aqueous phases, using the distribution coefficient K0• to determine the theoretical maximum concentration that may be observed, as well as the Summer's
leaching model as a conservative estimate of the cleanup goals for comparison with the maximum] groundwater concentrations that may occur.
- 3.1 SCREENING PROCEDUREa . • ' ' • " ! , . . •
| The screening procedure used for the cleanup goafs determination is shown schematically inFigure 3-1. The procedure includes the steps described in the following sections.
• •• - . • • - i•* ' .• j. " . . ' ' " . - -3 The screening procedure is separated into the procedure used for the Source (1A) and the Northern
Warehouse (IB) Areas, and that used for the Drum Disposal Area (2). The first two steps of bothv_y sections are designed to evaluate the saturated zone soil concentrations, while the remaining steps
are designed to evaluate the unsaturated zone soil concentrations.
,1 - • " . - * ' . • . ' ! • :3.1.1 Source and Northern Warehouse Areas
.1 ' , i1 The screening procedure used for these areas consists of the following steps:
X .-., . ' • . - -< " " ' » " '• ^ • : • ' • - , r .
'* . . ' - " . j..*;. \ •' • ' ""• • "" ' ' '"'• 1. The first step in this procedure is to calculate the maximum theoretical groundwater
concentration as a result of the saturated zone soil contamination. These maximumj groundwater concentrations were determined by dividing the maximum saturated zone soil
concentration by the distribution coefficient The resulting values were compared to the watercriteria (SDWA MCLs or toxicity based values). If the resulting aqueous concentration was lessthan the criteria, no further analysis of the saturated zone soils was required, because no
. exceedance would occur even at the maximum saturated soil concentration. The results of thiscalculation are summarized in Table 3-1, which includes the maximum soil concentrationsobserved in each area, and the result of the comparison between the theoretical maximumaqueous chemical concentration and the water criteria. A "yes" in the last two columns of the
v_y table indicate that further evaluation of the saturated zone soil contamination is necessary.
3-1 :AR0003U2

OWGIML(Red)
NO
IS MAX.GWCONC> WATERCRITERIA?
FIGURE M
SCHEMATIC OF CLEANUPGOALS SCREENING PROCESSGREENWOOD CHEMICAL SITE
YES
V >WATER /^\CMTSMM./r
I YES
DETERMINECONTAMINANT
AREA
I '
DETERMINE PRELIMINARY •SATURATED ZONECLEANUP GOAL
(SUMMER'S MODEL)
DETERMINE PRELIMINARYUNSATURATED ZONI CLEANUPGOAL (SUMMER'S MODEL)
ISMAXGWCOMC > IITHERPREUMINARY
GOAL?
DETERM1NICONTAMINANT PLUM!
MEDIAN CONC
ISMTOAMGWCONC> EITHER
PRBJM.GOAL?
YES
RUN HALLHUftTON NUS,MOOaWITHMEDIAN CONC
NO IS PREDICTEDMAX.GW
CONC > WATERCMTEMAT
YES
DETERMINE CLEANUP GOALUSING HALUBURTON NUS
MODEL —— — **<
flR0003li3

ItI
ILI
IIIIIII
ORIGINS(Red)
TABLE 3-1
COMPARISON OF WATER CRITERIA WITH MAXIMUM THEORETICALGROUNDWATER CONCENTRATIONS FOR SATURATED ZONE SQILS
GREENWOOD CHEMICAL SITE
Chemical
ArsenicCyanideAcetoneBenzene4-Chloroaniline -,ChlorobenzeneMethylene chlorideTetrachlbroetheneTrichloroetheneTolueneNaphthaleneNaphthaleneaceticacidTetrahydrofuranBis(2-ethylhexyl>phthalateChloroform
1,2-pichloroethaneDi-n-butyl phthalateXylene2,4,6-Trichlorophenol
Koc(orK0)
924
1,700
9.2
8352 „,
330
8.8
364126
300
940
160
42.39
2e9
44
14
170,000
248
3,020
WaterCriteria(wg/D
50
2003,500, 5, 140
1005
55
1,000140
- 305
- 73
1 x- ;*
1005
3,50010,000
3.2
Maximum SaturatedSoil (mg/kg)FOC -0.0015
Area1A
13.5001.680
74.800
„ 0.130
0.1800.480
ND
ND
ND
20.600
10.560
ND
7.760
8.410
0.063
0.9402.2903.960ND
Area18
16.2009.2001.400ND
ND
ND
ND ,
ND
ND
ND
ND
ND
ND
1.760
NDND
ND
ND ,
ND
Maximum GroundwaterConcentration Exceeds
Criteria
'Area1A
NO
NO
YES
YES
YES
YES
NO
NO
1 NO
YES
YES
NO
YES
NO -
YES
YES
NO
YES
NO
AreaIB
NONO
YES
NO
NO
NO
NO
NO
NO
NO
NO
. NO
NO
' NO
NO
NO
NO
NO
NO
Groundwater Cone. » Soil Cone./KDND , Nondetect t :N/C , No Criteria AvailableAreal A Main Source Area
j Area IB Northern Warehouse Area

ORIGINAL I(Red)2. The second step consists of calculating saturated soil cleanup goals using the Summer's Model, \ j
which is a conservative method to estimate groundwater concentrations from soilcontamination. Summer's Model cleanup goals for the saturated zone soil are equal to the Iwater criteria multiple by Ko for each chemical, respectively. Table 3-2 illustrates the maximumsaturated zone soil concentrations and the results of the Summer's Method cleanup goals. No Igoals are calculated for areas where no detections of a particular chemical are observed. 'Chemicals whose maximum theoretical concentrations were observed not to exceed the water .criteria in Table 3-1 were not evaluated in Table 3-2. I
3. The third step in this procedure is to calculate the maximum theoretical leachate concentrationthat could result from the unsaturated zone soil contamination. Similar to Step 1, thesemaximum leachate concentrations were determined by dividing the maximum unsaturated ;zone soil concentration by the distribution coefficient The resulting values were compared tothe water criteria (SDWA MCLs or toxicity based values). The results of this calculation aresummarized in Table 3-3, which includes the maximum unsaturated soil concentrationsobserved in each area, and the result of the comparison between the theoretical maximumaqueous chemical concentration and the water criteria. A "yes" in the last two columns of thetable indicate that further evaluation of the unsaturated zone soil contamination is necessaryforthe chemical. \ J
4. The fourth step consists of calculating unsaturated zone Summer's Model soil cleanup goalsand comparing these goals with the maximum unsaturated zone soil concentrations for eacharea of contamination. .Table 3-4 illustrates the maximum unsaturated zone soil concentra-tions and the results of the Summer's Model cleanup goals. No goals are calculated for areaswhere no detections of a particular chemical are observed. Chemicals whose maximumtheoretical concentrations were observed not to exceed the water criteria in Table 3-3 werenot evaluated in Table 3-4.
5. Table 3-5 is a reproduction of Table 3-4 with the three chemicals (cyanide, chloroform, and2,4,6-trichlorophenol) omitted, because the maximum soil concentrations are less than the .Summer's Model soil cleanup goals.
6. Step 6 is a comparison of the Summer's Model cleanup goals, for both zones developedpreviously, with the median soil concentrations determined from the isoconcentration contourmapping for both zones at the two areas. This comparison is illustrated in Table 3-6. The lasttwo columns of the table indicate with a "yes" instances where the-median saturated or \_>
R-49-11-91-12 3-4 RROQ03U5

TABLE 3-2 |'•;«,
COMPARISON OF SUMMER'S MODEL CLEANUP GOAL WITHMAXIMUM SATURATED ZONE SOIL CONCENTRATION
GREENWOOD CHEMICAL SITE
Chemical
AcetoneBenzene4-ChloroanilineChlorobenzeneToluene rNaphthaleneTetrahydrofuranChloroform1,2-DichloroethaneXylene
Koc(orK0)
9.28352
330 f.
300
940
42.39
44
14
248
iWate^Criteria(v9/L)
• j
3,500S
140
100
1,000140731005
10,000
Maximum SaturatedSoil (mg/kg)
' FOC = 0.001 5
Area1A
74.8000.1300.1800.48020.600
10.560
7.76
0.0630.940
-3.960
Area18 ,
1.400
ND
ND
ND ;
ND
ND
ND
ND -
ND
ND
Saturated Zone CleanupGoal (mg/kg) ;
Based on Summer's Model
Area1A
0.048
0.001
0.0110.050
0.450
0.197
0.0046
0.007
0.000
3.720
AreaIB
0.048
N/A
N/A
N/A
N/A
; N/A
N/A
N/A
:N/A
N/A
ND NondetectN/A Not Applicable
Area 1A Main Source AreaArea IB Northern Warehouse Area

ORIGINAL
TABLE 3-3
COMPARISON OF WATER CRITERIA WITH MAXIMUM THEORETICALGROUNDWATER CONCENTRATION FOR UNSATURATED ZONE SOILS
GREENWOOD CHEMICAL SITE
Chemical
ArsenicCyanideAcetoneBenzene4-ChloroanilineChlorobenzeneMethylene chlorideTetrachloroetheneTrichloroetheneTolueneNaphthaleneNaphthaleneaceticacidTetrahydrofuranBis(2-ethylhexyl)phthatateChloroform1,2-DichloroethaneDi-n-butyl phthalateXylene2,4,6-Trichlorophenol
Koc(orKD)
9241,700
9.2
83
52
330
8.8
364
12$300940
160
42.39
2e9
44
14
170,000248
3,020
WaterCriteria(wg/L)
50200
3,500
5140
100555
1,000140
305
73
4
100
53,50010,000
3.2
Maximum UnsaturatedSoil (mg/kg)FOC = 0.0045
Area1A
2,470.000
1,000.000
201,300
0.160
6.3105,1200.597
20.140
0.024125.800
757.200
17.000
9.000
104.400
0.041
0.051
9.418
34.020
0.468
Area1B
33.40012.800
17.030
ND
ND
ND
ND
ND
ND
ND
556.900
ND
ND
ND
ND
ND'
1.484
ND
ND
Maximum LeachateConcentrationExceeds Criteria
Area1A
YES
YES
YES
YES
YES
YES
YES
YES
YES
YES
YES
YES
YES
NO
YES
YES
NO
YES
YES
Area18
NONOYESNO
NO
NO
NO
NO
NO
NO
YES
NO
NO
NO
NO
NO
NO
NO
NO
Leach Cone. * Soil Cone. / KDND NondetectN/C No Criteria AvailableArea 1A Main Source AreaArea 1B Northern Warehouse Area
R-49.U.9M2 3-6 ft ROD 03^7

* *5 • ' ' ;'J|* l ', "• i TABLE 3-4 J
COMPARISON OF SUMMER'S MODEL CLEANUP GOAL WITHMAXIMUM UNSATURATED ZONE SOIL CONCENTRATION
GREENWOOD CHEMICAL SITE
Chemical
Arsenic .CyanideAcetoneBenzene4-Chloroaniline ,ChlorobenzeneMethylene chlorideTetrachloroetheneTrichloroetheneToluene ;NaphthaleneNaphthaleneaceticacidTetrahydrofuranChloroform1,2-DichloroethaneXylene2,4,6-Trichlorophenol
Koc(orKD)
9241,700
9.28352
3308.8
364
126300940
160
42.3944
14
248
3,020
WaterCriteria(vg/L)
; , 50;200
3,500
.; 5 -
'40
100555
,1,000;140.305 _,
r, 73i 100
5
10,0003.2
Maximum Unsaturated* Soil (mg/kg); FOC = 0.0045
Area1A
2,470.000
1,000.000201.300
0.160* 6.310
| 5.120
? 0.597
J 20.140
0.024
: 125.800
757.200
: 17
9( r 0.041
0.051
34.020
0.468
Area18
33.400
12.800
17.030
ND
ND
ND
ND
ND
ND
ND
556.900
ND
ND
ND
ND
ND
ND
Unsaturated ZoneCleanup Goal (mg/kg)
Based on Summer's Model
Area1A
136.1371,332.811
0.582
0.014
0.150
0.842
0.004
0.0360.0568.169
, 3.5050.22
T 0.014
0.482
0.012
58.560
0.856
Area1B
N/A
N/A
2.853N/AN/A
N/A
N/A
N/A;N/A
: N/A
7.509
, N/A
N/A
N/A
N/A
N/A
N/A
ND NondetectNA NotApplicable
Area 1A Main Source AreaArea 1B Northern Warehouse Area
R-49-11-9M2 i; !• v 3-7 BR 00 031*8
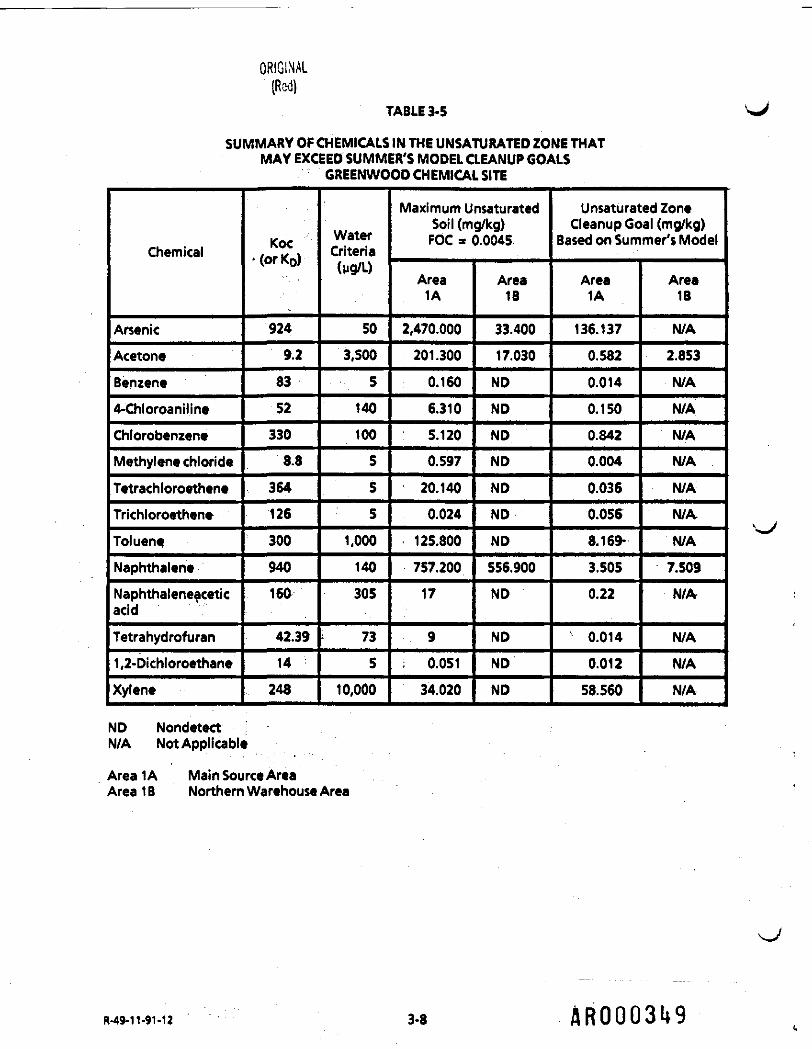
ORIGINAL(Red)
TABLE 3-5
SUMMARY OF CHEMICALS IN THE UNSATURATED ZONE THATMAY EXCEED SUMMER'S MODEL CLEANUP GOALS
GREENWOOD CHEMICAL SITE
Chemical
ArsenicAcetoneBenzene4-ChloroanilineChlorobenzeneMethylene chlorideTetrachloroetheneTrichloroethene
TolueneNaphthaleneNaphthaleneaceticacidTetrahydrofuran1,2-DichloroethaneXylene
Koc•<orKD)
9249.28352330
8.8
364
126
300940160
42.3914
248
WaterCriteria(vg/L)
503,500
51401005
5
5
1,000140
305
73
510,000
Maximum UnsaturatedSoil (mg/kg)FOC » 0.0045
Area1A
2,470.000
201.300
0.160
6.3105.120
0.597
20.140
0.024
125.800
757.20017
9
; 0.051
34.020
AreaIB
33.40017.030
ND
ND
ND
ND
ND
ND
ND
556.900
ND
ND
ND
ND
Unsaturated ZoneCleanup Goal (mg/kg)
Based on Summer's Model
Area1A
136.1370.5820.014
0.1500.842
0.004
0.0360.0568.169-3.505
0.22
1 0.014
0.012
58.560
Area1B
N/A
2.853
N/A
N/A
N/A
N/A
N/A
N/A
N/A
7.509
N/A
N/A
N/A
N/A
ND NondetectN/A Not Applicable
Area 1A Main Source AreaArea 1B Northern Warehouse Area
R-49-n.9i.i2 3-8 ARQOQ3t*9

OR1
-
,
."*^
(" i • .,
i . ' .
-j If gO 2 aj rt ft
? W JE _^ H> **> 5! w £v • Mil/ s i s"i f • h"
ifI 5' , ; .5 : •-j ••• " •'••
1*-
' •- ' •
w
if''j
,
1jic1?jjJ"
/.
sii
Median
Soil C
<mg
a
1
ArealA
to
I
:
*
521
<
1
|
I
123
1
]S3
iturated
#
!4
I
]1mg3
,,.;'
O
o
2
2
2
Ki
|
|w
ui
§in^
1
i
i
2
2
i
i
fi
gd
d
§d
1i7
g
u
d
n**"
id
d
1d
1ft
d
§w
"
'
011
i4J
2
2
I
io
o
d
io" *
~ifJi
§u
*
2
5d
Sd
O
o
8
8o
1^12
§«
2
j
d
§d
O
§!
d
eed• ;
jB
13
§u
*
*2
i
id•
i
a
z
Id
tchloride
fI
1u
2
2
*d
o
o
!,
a
So
t
oethene
.;•
»'Ji5
oz
o
2
2
i
d
i
a
o
o5e
g• i|:tj|h-
g12
2
2
d
S
a
az
.!d
|
2
u
I/IUJ
2
•A"
d
S
i
§e
§d
§tA
?I
1
t
Oz
i
2
2
*b
3
OZ
O
1o
o
•i
|
t
E
>.
2
2
d
55d
a
o
§d
ge
.•5f
s
§i2
2
1
i
d
1o
d
1IN
i]r
CI
>
Mj
2
2
Id
i
E
OZ
d
§e
i1s
iifLl
2
2
d
M3d
az
az
Id
§a
i4ji^
J
>
2
2
i
i
3
IO
§d
§w
phthalate
i
"£.|
2
e
3
*
"
2
3m
I
s
Oz
d
Id
;
|
J
E
i
*
2
i
i
z
§
a
fo
|?5*
: . ' '
i
si., epll
Is: i.
1 '-"• r . " :- '
" • •
1 «
illIIzz*i
,«M,-;f ,3-9 AR000350r'

ORIGINAL g(Pad) •
unsaturated soil concentration is greater than the conservative Summer's Model cleanup goals. , BA "no" in these columns indicates that remediation is not necessary.
I7. Step? is the final phase of the screening procedure. The median unsaturated and saturated
soil concentration of each chemical is used in the Halliburton NUS Model, and the need for Bremediation in a particular contaminated area of the site for a particular chemical is indicated ™by a yes in the last two columns of Table 3-7. The "yes1* indicates that the modeled maximum £groundwater concentrations exceed the water criteria for tht particular chemical. At this Ipoint, a set of cleanup goals calculated using the Halliburton NUS Model will be determined.
3.1.2 Drum Disposal Area .- •
The Drum Disposal Area screening was performed in the same manner as described in Section 3.1.1,with the exception that actual groundwater data was used in Step 1. This data was used because of •the lack of saturated zone soil analytical data available in this area. The groundwater data used was •from REM III sampling of monitoring wells MW01 and MW04 during May of 1988 and •»
nFebruary of 1 989, as reported in the August 1 990 Rl Report (see Table 3-8). •
I 1
groundwater concentrations to the water criteria (MCLs or toxicity based values). A "yes* inthe last column of Table 3-9 indicates that further evaluation of the saturated zone fl
U;contamination is necessary'
2. In Table 3-10, the results of the saturated zone soil cleanup goals calculated using the **Summer's Model are presented. Chemicals whose maximum groundwater concentrations were Mobserved not to exceed the water criteria in Table 3-9 werenot evaluated in Table 3-10. It
contamination are calculated and summarized in Table 3-11. These calculated leachateconcentrations are compared with the water criteria. If the calculated leachate concentration His greater than the water criteria, a YES is in the last column of Table 3-11. n
4. Table 3-1 2 summarizes the results of the unsaturated zone soil cleanup goals calculated using,• '• • '. ithe Summer's Model.: Only those chemicals for which the calculated leachate concentration niexceeded the water criteria in Table 3-1 1 are included in Table 3-12. ™
3-10 AR00035
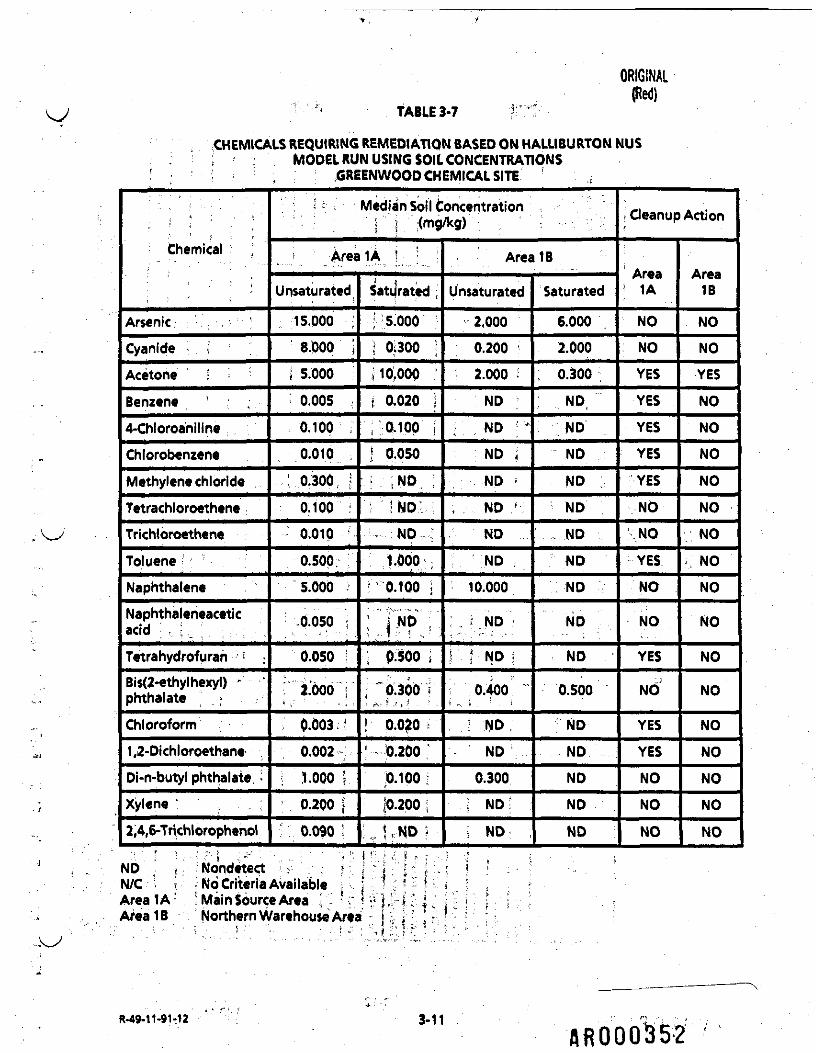
ORIGINAL(Red)
' TABLE3-7 !"."••
CHEMICALS REQUIRING REMEDIATION BASED ON HALLIBURTON NUS, MODEL RUN USING SOIL CONCENTRATIONS• : . • • : GREENWOOD CHEMICAL SITE
Chemical : ;
Arsenic ; " 'Cyanide • . 1Acetone ;Benzene !4-ChloroanilineChlorobenzeneMethylene chloride .TetrachloroetheneTrichloroetheneToluene ; 'NaphthaleneNaphthaleneaceticacid • ; L , :Tetrahydrofuran ; ;Bis(2*ethylhexyl) - 'phthalateChloroform1,2-DichloroethaneDi-n-butyl phthalate. -Xylene ; ; , , ;2,4,6-Trichlorophenol
•; Median Soil Concentration ,l" j XmoAg) ;
.. .' . ' ArealA !• • ;
Unsaturated
15.000 ;8-000 j
•i s.ooo; o.oos ;0.100 ,0.010 ,0.300 f0.100 !
0.0100.500;5.000 :
0.050 i
0.050 i
•" looo Y* 1 ' ' • , '
0.003- f0.002
; i.ooo ;0.200 S
:' 0.090 I
J JSaturated .
: 5.000 ;I Oi300 ;{16,000 '\ 0.020, ;:fciop jI 0.050
: . i ND , ;; !ND:1 .- ND ;1.000;
; ! 0.100 s
' i NO :!- - 1 '• : -,
; p.soo i; * 0;306 "i,*•*;**
1 0.0 0 f: 0.200 :
0.100 ?|o.2oo ;
: , i -ND ?
Area IB
Unsaturated
2,0000.2002.000 -ND
. ND ; "
ND ,
ND •
ND .'-:
ND ...
ND ,,
10.000
; , . NDr ? NO ;
0.400 "'
• ND ;ND
0.300ND
- ND
Saturated
6.0002.000
, 0.300 ;
; ND,ND
ND
ND
ND
, ND
ND
NO
ND
ND
0.500
ND
. ND
ND
ND
ND
>Cleanup Action
Area1A
NONO
YESYES
YES
YES
YES
NO
: NOYES
NO
NO
YES
NO
YES
YES
NO
NO
NO
AreaIB
NONOYES
NO
NO
NO
NO
NO
NO
- NO
NO
NO
NO
NO
NO
NO
NO
NO
NO
ND ' j. i Nondetect v ; * •N/C i; No Criteria Available \Area 1A: . ! Main Source Area.\ -• ' -;• I r ]ArealB Northern Warehouse Area : 1
R.49-11-91-,t2 , 3-11 ^L 'flR000352

ORIGINAL
2
I3 3a 2
a
So
!*iilUs|i|>5 5 si
11s
I
i
33
02/
41
o
ae
oc.
S
OO
ofN
O
d
m
i
neor
s
s
8o
CD
d
00
chl
d
3
e>
3
d
3
n
d
m
00o
o
ono
d
S
pht
M9.
i
i
all^ A *™
l'El3 u ik
fl 12 u Na«
y
oE N Not
Not
~°aSc z z z
R-49-11-91-12 3-12RR000353 ^

ORIGINAL(Red)
- TABLE 3-9 j ;
COMPARISON OF WATER CRITERIA WITH MAXIMUM'MEASURED GROUNDWATER CONCENTRATIONS
GREENWOOD CHEMICAL SITE
I
Chemical
Arsenic \CyanideAcetone . fBenzene4-Chloroaniline :Chlorobenzene '._Methylene chloride .Tetrachloroethene ;TrichloroetheneToluene ...1 .NaphthaleneNaphthaleneacetic acidTetrahydrofuranBis(2-ethylhexyl)phthalateChloroform1,2-DichloroethaneDi-n-butyl phthalateXylene2,4,6-Trichlorophenol
Water Criteria(yg/L)
' 50:o20o: .3,500; ,
• - 5, , ; 140, .: ; , 100; ,
• ' . : • • < 5 t
-- ': 5j '. .- - 5;
.. .. J.OOQ ..!.-;. .1.40-.
305734
1005
3,50010,000
3.2
Maximum Measured*1 >Groundwater
;(yg/L)t• 4.400 ,
12.000
2.2e3: 230.000
• 13.000 ;
97.000
1,000.0008.00098.000 i
5,100.000, 70.000
11,000.000830.000 .6.000
570.000
ND
ND
N/A
N/A
MaximumGroundwaterConcentrationExceeds Water
Criteria
NONO
- NO : . ;
YES ;NO
NO
YES
YESYES ,
,YES
NO
YES ,
YES
YES
YES
NO
NO
N/A
N/A
0) Ebasco Data for Area 2 (Drum Disposal Area)ND NondetectNA Not AnalyzedN/A NotApplicable
R-49-li-91-12 3-13

ORIGINAL
TABLE 3*10
COMPARISON OF PRELIMINARY SOIL CLEAN UP GOAL WITH MAXIMUMCALCULATED SATURATED ZONE SOIL CONCENTRATION
GREENWOOD CHEMICAL SITE
Chemical
BenzeneMethylene chlorideTetrachloroetheneTrichloroetheneTolueneNaphthaleneacetic acidTetrahydrofuranBis(2-ethyihexyl)phthalateChloroform
Koc
338.8
364
126
300160
42.39
2e9
44
WaterCriteria(ug/U
55
55
1,000
305
73
4
100
Maximum SaturatedZone Concentrations*!)
MeasuredGroundwater
(mg/L)
0.2301.0000.0080.0985.10011.0000.830
0.006
0.570
CalculatedSoilW(mg/kg)
0.0290.0130.0040.0192.295
2.640
0.053
18,000.000
0.038
Saturated ZoneCleanup GoalBased on
EquilibriumPartition! ng<3)
(mg/kg)
0.00060.00010.00270.00090.4500
0.16800.0046
12,000.0000
0.0066
0> Ebasco Data for Area 2 (Drum Disposal Area)(2) Soil Cone, » Groundwater Cone* KD(3) Cleanup Goal * Water Criteria * KDSaturated Zone FOC = 0.0015
R-49-11-9M2 3-14 A ROOD 355

ORIGINAL(Red)
TABLE 3-11
COMPARISON OF WATER CRITERIA WITH MAXIMUM CALCULATED LEACHATECONCENTRATION FOR UNSATURATED ZONE
GREENWOOD CHEMICAL SITE
: ' .1
Chemical •
Arsenic .CyanideAcetone • •Benzene s , y4-ChloroanilineChlorobenzeneMethylene chlorideTetrachloroetheneTrichloroetheneTolueneNaphthaleneNaphthaleneacetic acidO)TetrahydrofuranBis(2-ethylhexyl)phthalateChloroform , :1,2-DichloroethaneDi-n-butyl phthalateXylene2,4,6-Trichlorophenol
Koc -.<orK0)>
i924
; 1,700
d.283
.."52 ':33Q :
8.8;364 . '.
126
300 ,940
16042.392e9
-- i "44,-14
.170,000
248
3,020
WaterCriteriaCvg/U
50200
> 3,5005
140
100
•i 5 :'.-'- •'• 5 •
3
,. 1*000, ,140
305-..,,,. 73. --
4
<:.:•„ 1005
3,500
10,0003.2
Maximum UnsaturatedZone Concentration*1)
MeasuredSoil
(mg/kg)
29.00080.30019.000
230.00032.30016.000305.50015.00032.000
6,000.00755.000
3,780.000
ND
17.000
16.0000.0261.8004.700
NA
iCalculatedLeachate<2>(mg/L)
0.0310.047458.937
615.797
138.034
10.774
7,714.646
9.158
56.437
4.444.444
178.487
5,250.000
... ND
1.89e-6
80.808
0.413
0.002
4.211
NA
MaximumLeachate
ConcentrationExceeds Water
Criteria
NO
NO
YES
YES
YES
YES
YES
YES
YES
YES
YES
YES
NO
NO
YES
YES
NO
NO
N/A
i 0) Ebasco Data for Area 2 (Drum Disposal Area)i (2) Leach Cone, m Soil ConcVKo
(3) AssumedtobetheSumofSemivolatileTICsUnsaturatedZoneFOC » 0.0045ND Nondetect
\ NA Not AnalyzedN/A Not Applicable
3-15 AR000356

• ORIGINAL
TABLE 3-12
COMPARISON OF SUMMER'S MODEL CLEANUP GOAL WITH-MAXIMUM UNSATURATED ZONE SOIL CONCENTRATION
GREENWOOD CHEMICAL SITE
Chemical
AcetoneBenzene4-ChloroanilineChlorobenzeneMethylene chlorideTetrachloroetheneTrichloroethen*Toluene -NaphthaleneNaphthaleneaceticacid<3>Chloroform1,2-Dichloroethan*
Koc(orK0)
9.28352
330
8.8364
126
300
940
160 .
44
14
WaterCriteria(yg/L)
3,500
5140
100
5
5
5
1,000140
305
100
5
Maximum UnsaturatedZone Concentration*1 >
MeasuredSoil
(mg/kg)
19.000230.00032.30016.000305.50015.00032.000
6,000.00755.000
3,780.000
16.0000.026
CalculatedLeachate(2>(mg/L)
458.937615.797138.034
10.774
7,714.646
9.158
56.437
4,444.444
178.487
5,250.000
80.808
0.413
UnsaturatedZone CleanupGoal Based onSummer'sModel(mg/kg)
0.7340.0100.249
2.110
0.0020.062
0.049
6.838.
3.000
2.635
0.2810.034
MaximumSoil Cone.ExceedsCleanupGoal
YESYES
YES
YES
YES
YES
YES
YES
YES
YES
YES
NO
0) Ebasco Data for Area 2 (Drum Disposal Area) •(2) Leach Core, a Soil Gonc/lfo(3) AssumedtobetheSumofSemivolatileTICsUnsaturatedZoneFOC » 0.0045ND Nondetect
R-49-11-9M21
AR000357

* ?•: - ? - ' ' - 'ORIGINAL< • • ? ' ? ' ' * 'r.'*- - (Ni
. , 5. Table 3-13 is a comparison of the calculated Summer's Model cleanup goals with the mediansoil concentrations determined from the isoconcentration contour maps. A YES in the last
! column indicates that'the median soil concentrations,will-jfexceed the Summer's Model soilcleanup goals.
6. Table 3-14 summarizes the results of analysis using the median soil concentrations in thei Halliburton NUS Model. The predicted maximum groundwater concentration is compared' " i .• - ? ' , ; - . . - . ' • ' i• with the water criteria. If * YES is present in the last column, remediation of soil containing this
chemical is required. . . •' ' . ' - ' . ; ,
3.1.3 Screening Procedure Summary ' . ;! . - - . . • i • . . ; . . • ; ' ; . ' . " 'i . • i • • . ' ' • ' , - " • ' • • . • " ' .
> ' • ' • ' ! } . , • • 'The screening procedure was used to reduce the number of chemicals which require modeling. Based
i on the screening, arsenic, cyanide, 'naphthalene, bis(2-ethylh«xyl)phthalate, and xylene wereremoved from further consideration, as the concentrations of these chemicals found in soils at the sitewould not warrant remedial action to 'protect groundwater via the leaching to groundwaterpathway. Safe Drinking Water Act MCLs in groundwater would not be exceeded for these chemicalsvia this exposure route. ; ! ; ;
' ' t • . . ' * . ' ' . 'x_> " : '• • - . • • ' > i , .; • ; • • ' • '3.2 HALLIBURTON NUS MODELING <
t • : ,. .,. ../ . ,: .. , '• ....'.. ;. . . • .' - : _ '' it- ; ;. . :: ~.'*:.;.•' .'. I i : • . • : - i ;: . ;
For the chemicals passing the screening procedure, the computer modeling procedure was conductedusing the median soil concentrations, the areal extent of contamination, and the site and chemicaldata described in the earlier sections of this report. For a given groundwater containment period, thecleanup goals for the unsaturated soil zone were determined using an iterative process whereby a soilcleanup goal is selected, the model run, and the resulting maximum groundwater concentration atthe end of the groundwater containment period compared with the water criteria. If thegroundwater concentration at the end of the containment period Is greater than the criteria, thecleanup goal is decreased and the model run 1$ repeated. This procedure is repeated until thegroundwater concentration at the end of the containment period is less than the criteria and thedifference between the groundwater concentration and the criteria is less than 2.5 percent of thecriteria. It was determined that only the unsaturated ione contaminants could be affected by aremediation action. The saturated izone contaminants were assumed to be changed only via
; • ; ;• .-, - ', ; ". .. - | J • i • j ': ; ' ' ' " ':contaminant washout The Output of the (nodeling are'included In Appendix G (Volume II).
MM.MWI i . i . . ; 3-17 AR000358
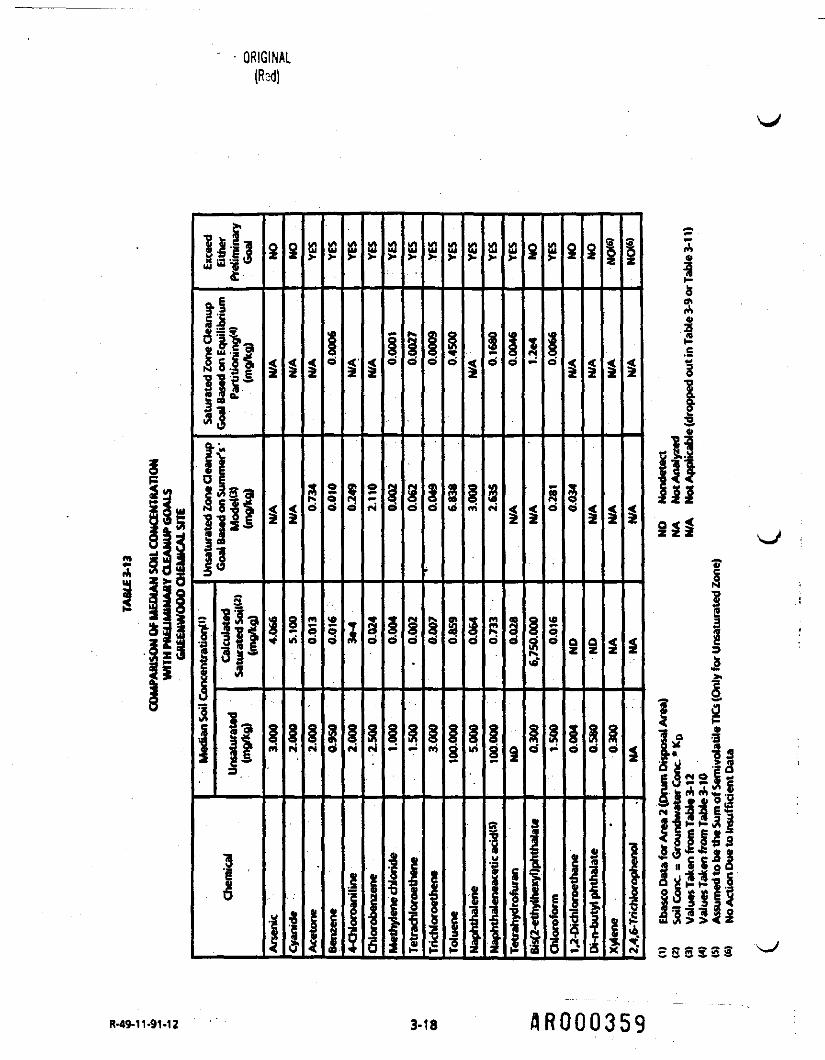
II
m
i
ORIGINAL
lit
*" e isi*f
O
i i
3
i
o
o
s i
I" 111I 1 A .B
i
o
3-18 flR000359
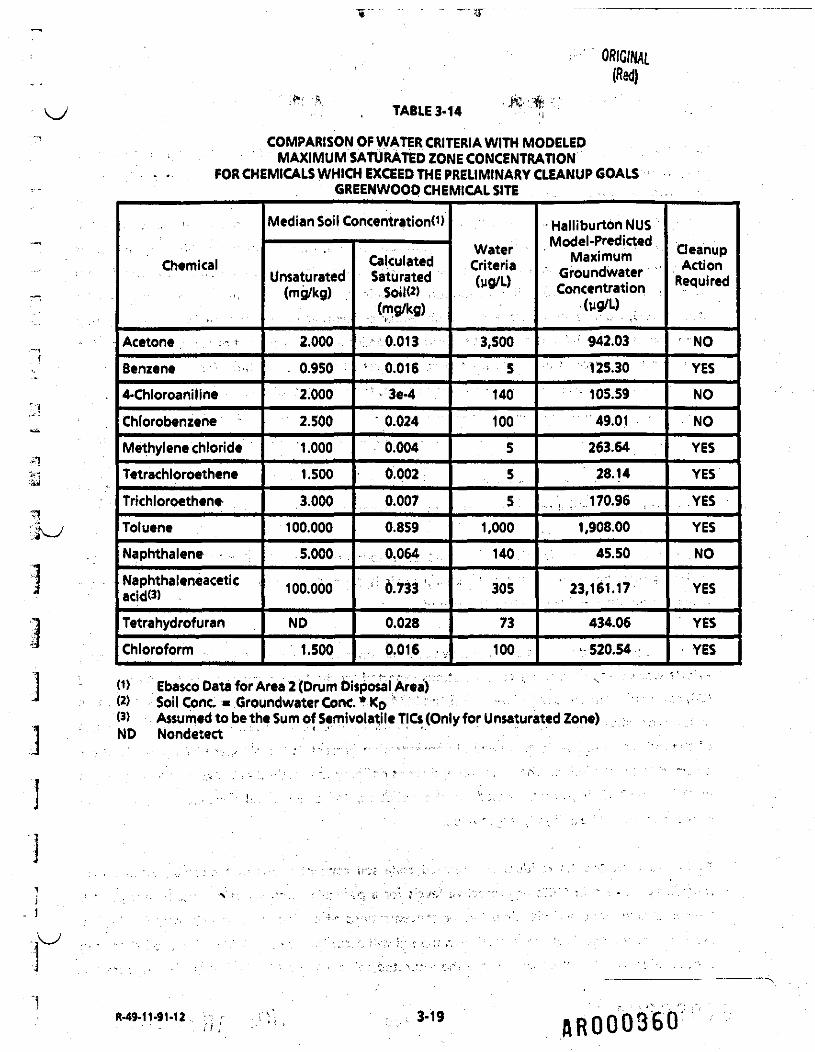
v*j
•?*
ORIGINAL(Red)
TABLE 3-14
COMPARISON OF WATER CRITERIA WITH MODELEDMAXIMUM SATURATED ZONE CONCENTRATION
FOR CHEMICALS WHICH EXCEED THE PRELIMINARY CLEANUP GOALSGREENWOOD CHEMICAL SITE
Chemical
Acetone • .- - -Benzene4-ChloroanilineChforobenzeneMethylene chlorideTetrachloroetheneTrichloroetheneTolueneNaphthalene •Naphthaleneacetic .,acid(3)TetrahydrofuranChloroform
Median Soil Concentration )
Unsaturated(mg/kg) ,
2.0000.9502.0002.5001.0001.500
3.000100.0005.000
100.000
ND
1.500
CalculatedSaturated.Soil<2)(mg/kg)"." »•,' .. - - '0.013
••0.016f 3e-4
'"0.0240.0040.0020.0070.8590,064
6.733
0.028
0,01.6
WaterCriteria(wg/L)
3,5005
140
100
55
5
1,000
140
305
73
100
Halliburton NUSModel-Predicted
MaximumGroundwaterConcentration
(yg/U
942.03"•125.30105.5949.01263.64
28-14i r 170.96 ;
1,908.0045.50
23,161.17
434.06
-520.54
CleanupActionRequired
NOYES
NO
NO
YES
YES
YES
YES
NO
YES
YES
YES
(D Ebasco Data for Area 2 (Drum Disposal Area)W Soil Cone, « Groundwater Cone.* KO ;?(3) Assumed to be the Sum of Semivolatile TICs (Only for Unsaturated Zone)ND Nondetect : * '' ' " " v" "'
R-49-11-91-12 , ^ \'\\ , 3-19 HR0003BO
ORIGINAL(Red)
3.3 DISCUSSION OF RESULTS
Based on concentrations of some contaminants in the saturated zone (e.g., acetone and toluene), itwas determined that the groundwater concentrations are in excess of the water criteria, asdetermined by the distribution coefficient. Therefore, groundwater containment and treatment isrequired. Using this assumption, the modeling was used to determine the unsaturated zone soilcleanup goal for a corresponding remediation time period, during which continued groundwatercontainment and treatment would be required after the initial unsaturated zone soil remediationwas completed. Where soil remediation is required, the output from the model runs (SeeAppendix G, Volume II) illustrate the groundwater concentrations versus time for various cleanuptime frames. Table 3-7 indicated that soil remediation is required as a result of contaminant leachingto groundwater from the unsaturated zone in excess of the water criteria for acetone, benzene,4-chloroaniline, chlorobenzene, methylehe chloride, toluene, chloroform, and 1,2-dichloroethane inArea 1A (Main Source Area) and for acetone in Area IB (Northern Warehouse Area). The results ofthe Drum Disposal Area (Area 2) screening procedure summarized in Table 3-14 indicate remediationis required for benzene, methylene chloride, tetrachloroethene, trichloroethene, toluene,naphthaleneacetic acid, tetrahydrofuran, and chloroform. No action is required for other chemicalsof concern, based on soil concentrations measured during the pre-design sampling. jThe soil cleanup goals for the unsaturated zone soils are summarized in Table 3-15. The tableindicates that the value of the soil cleanup goals is dependent upon the period of groundwatercontainment after the cleanup goal is attained.
The values presented in Table3-15 are given as total concentration (Ct). The modeling and screeningefforts were completed using concentrations reported by the laboratory as sorbed concentrations(Q), as described in the USACE Pre-Design and REM III Rl Reports. The soil cleanup goals in Table 3-15include contributions from solid (C,) and liquid phases (chemical concentration in the pore water, C^)of the individual soil sample. Chemical concentration present in the air space of the soil voids isassumed to be negligible. The equation and terms defining the method of conversion are describedin the Table 3-15 footnotes. Based on the equation, for a given soil concentration, the totalconcentration will be a slightly larger value.
Table 3-15 indicates the residual unsaturated zone soil concentrations that must be attained viaremediation to attain MCLs or protective levels for a particular groundwater containment period.Longer containment periods allow higher concentrations of chemicals to be left in the soil. Thereduction of the chemical concentration in the soil will occur in any event via leaching to infiltratingprecipitation which will percolate into the saturated soil zone, washing out of chemicals from the
R-49-H-9.-.2 3-20 ARC 003 6 I

T3
1
1
1
* "'' ; " ' •« ORIGINAL(Red)
>aIi!
3 S
55°8g
I
ioi
tu
u in
»nm
inri
md
«'
S1
u uZ.z,
to"-*
<-Sa
fi
C
ei
e> • «* / i «. & i A - i Z
o
J
illZ *3 "
ac
«O
ml td'
188*— «- "
i
^ <o «III• «i w"iSiS1 £ £"! .2 2
o oo e2ZZ» i a • — — i — — •— •— •— ^ • —- — i ^ *
§
U Uz ,,z
u uz .z
N
oea
Oo.
s
u uz z
**» t=o\ X!fN O1•su
O
u uz z
u
S u3.*
ilsa
i M* *O
• o
i i
<9 flll
<1a aSnvOOo o
a
a <an^S o
112
a a..
ooo
st ig
s
3-21 AR000362
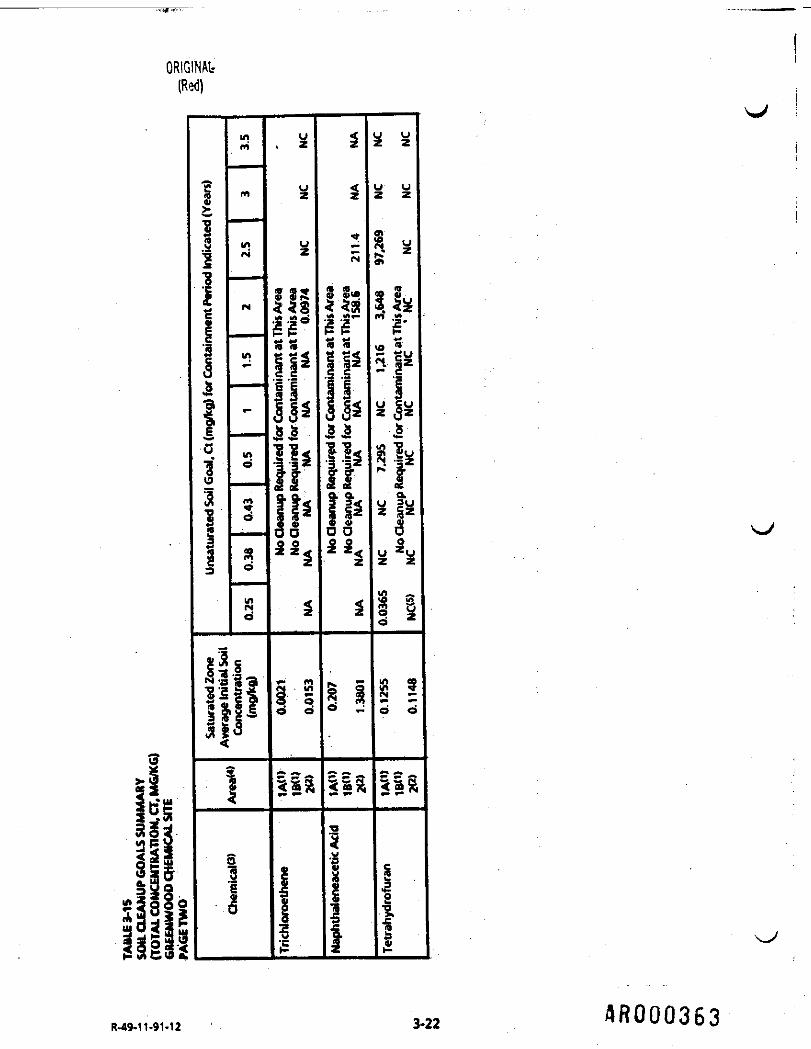
ORSGINAL-(Red)
3-22 AR000363

•
j
5sIc
fex5
13 ? £ B wssiis
isa|5
W8oIN
O
ORIGINAL(Red)
st<n
u uz z
u uz z
u uz z
u uzz
"S<j uz z
s00
s"
lis
-
O Uz z
5'1
ip o'sS » !
<J
U
sigc
11
'a
IsooISo
u
u
w
IS
lla a
ii
u uz z
u uz z
g "sisIA
«
O |[Uz |zE
U £U
1u lyz STzen
is s
sISft
u uZ 2
u wz z
s s(0is
u
I
s s
-
s kllg
z
s
Z o
u uz <z
z z
a
0
s s
- S
s
9 <9ll
y
4
|1ftsQ. Q.3 3
^ § ,ob o Oo oz zu
u
S
a nU
S CII*O Om^_-11f" '3wgzKa a
S
£
R49:11.9M2' i 3-23 AR000361*

O
>> 5
ips°i§i|5§s'III
ORIGINAL(Red)
m a
III
1
3
u
!
o
en
in
2
1!»M lA
gg« tt« «««j •• at
<?<?11^^ao;£3
u
u
55'
z* 2
2
z <J
u uz z
K u
y 50z <zM
5'8is
_'1sa
2
2 2
£ *
£ *
•B
'
3 s i? 15If I .1I 1 88
| 1 | §I! I.I" 1 1
ir i f *if! l!j lllie * 8 3 « -6 j T - e 9 s
Ss 1 ' "
* •
-.
.
i
•sllf^l ,i'i! g M " » B »"
aallsfllli I s223llJi5§i J I"3 *
3SS £3 3^3
R.49-11-91-12 3-24 AROQ0365
ORIGINAL' '"\f ; (Red)
. saturated zone soils into the groundwater, and downgradient transport. Remedial action allowsgroundwater standards to be attained in a shorter time period. The volume of soil to be remediatedvaries depending on the containment period selected. To provide for compliance with thegroundwater standards in the containment time period indicated, soils with concentrations greaterthan those shown on the table must be removed or otherwise treated to the concentration leveldisplayed. An "NA" entry for a particular chemical in the Table indicates that the groundwaterstandard cannot be attained due to existing concentrations of the chemical present in either thesaturated soil or the groundwater.
3.3.1 Main Source and North Warehouse Areas
The Main Source Area and the North Warehouse Area are referenced as areas 1A and 1B, respectivelyin Table 3-15. Cleanup for 9 chemicals is required in the Main Source Area, including acetone,benzene, 4-chloroaniline, chlorobenzene, methylene chloride, toluene, chloroform,1,2-dichloroethane and tetrahydrofuran. A minimum of two and a half years of groundwater
; • containment is required because the groundwater standards cannot be met for 1,2-dichloroethane(OCA) in a shorter time period. Thus, if It is desirable to attain groundwater standards in 2.5 years, theresulting DCA concentration must be reduced to 0.124 mg/kg (total concentration), acetone must be
: W reduced to 1,462 mg/kg, benzene reduced to 0.225 mg/kg, and so on.
In the North Warehouse Area, remediation is required for only acetone. A minimum groundwatercontainment period of 0.5 years must be provided before the groundwater standards are met if the
..." soil concentrations are reduced to 10.1 mg/kg acetone. Table ES-1 summarizes the soil cleanup goalsfor the Main Source and North Warehouse Areas.
j-i
i 3.3.2- Drum Disposal Area
J The Drum Disposal Area is denoted as Area 2 in Table 3-15. For the 11 chemicals modeled, only 7require unsaturated zone remediation, including benzene, methylene chloride, toluene, chloroform,ri'«
, tetrachloroethene (PCE), trichloroethene (TCE), and naphthaleneacetic acid (NAA). No cleanup oftetrahydrofuran in the unsaturated zone soils is necessary because it was undetected in the samples
1 collected during investigations. However, existing concentrations in the saturated zone require anJ 0.25 year period of containment before groundwater standards are met. The minimum groundwater- containment period for the Drum Disposal Area is 2 years. For this time frame, benzenej concentrations in soil must be reduced to 0.0224 mg/kg, methylene chloride reduced to 1.42 mg/kg%_> (1.5 year containment period), and so on. The cleanup goals for some chemicals may be greater than> the actual concentrations found in the field, so that no soil cleanup may need be performed for a
R-49-11-9MZ - '; ' -•-'-" 3-25 fl ROD 0-3 66
ORIGINAL.(Red)
2 year groundwater containment period. Comparison of the actual unsaturated zone soilconcentrations is required for each chemical prior to determining the need for cleanup for thecontainment period selected. Table ES-1 summarizes the soil cleanup goals for the Drum DisposalArea.
R-49-11-9M2 UR000367

EPA REGION IIISUPERFUND DOCUMENT MANAGEMENT SYSTEM
DOC IDPAGE *
IMAGERY COVER SHEETUNSCANNABLE ITEM
SITE NAME.
OPERABLE UNIT.
ADMINISTRATIVE RECORDS* SECTION //.VOLUMEIL
REPORT OR DOCUMENT TITLE.
DATE OF DOCUMENT.
DESCRIPTON OF IMAGERY.
NUMBER AND TYPE OF IMAGERY ITEM(S).

EPA REGION IIISUPERFUND DOCUMENT MANAGEMENT SYSTEM
DOC IDPAGE n
IMAGERY COVER SHEETUNSCANNABLE ITEM
SITE NAME
OPERABLE UNIT
ADMINISTRATIVE RECORDS* SECTION.]! .VOLUME.
REPORT OR DOCUMENT TITLE ""IH3 I
DATE OF DOCUMENT 01" / 93
DESCRIPTON OF IMAGERY. Cross
ArJLj .rf-r rcNUMBER AND TYPE OF IMAGERY ITEM(S).

EPA REGION IIISUPERFUND DOCUMENT MANAGEMENT SYSTEM
DOC IDPAGE #_
IMAGERY COVER SHEETUNSCANNABLE ITEM
SITE NAME.
OPERABLE UNIT.
ADMINISTRATIVE RECORDS* SECTION )L VOLUME
REPORT OR DOCUMENT TITLE p "VFlO/ll &
DATE OF DOCUMENT
DESCRIPTON OF IMAGERY 1 /T*VS T g ioor
NUMBER AND TYPE OF IMAGERY ITEM(S)_A

monS3
SR000371

A
&R000372

ORIGINAL(Red)
"1
' APPENDIX A
HALLIBURTON NUS CONTAMINANT FATEAND TRANSPORT MODEL DESCRIPTION
flR000373
fcdj
DEVELOPMENT AND APPLICATION OF A SPREADSHEET-BASEDMULTIMEDIA CONTAMINANT FATE AND TRANSPORT MODEL
Jyh-Dong Chiou and Robert HubbardHALLIBURTON NUS Environmental Corporation
Pittsburgh, Pennsylvania
INTRODUCTION
A spreadsheet-based, multimedia contaminant, fate and transport model was developed to supportscreening-level risk assessment, remediation goal, and simple remedial alternative selection forhazardous waste treatment, storage, and disposal facilities. This pap«r provides a discussion of thismodel system consisting of analytical models used to simulate contaminant washout from the sourcearea, a model used to simulate downgraditnt solute transport, and the models used to estimatereceptor concentrations under various types of exposure scenarios. A PC spreadsheet was used toimplement and link the various simulation modules and to simplify the model input, interactiveexecution, and output presentation processes. The model also, guides the user regarding theinfluence of various processes on the contaminant concentration at the point of compliance and,therefore, which variables should be focused on to improve the remediation or data collectionefforts. h " "'- '" ""• ' '. '' '' '•""" -•-' .-•-•• . ' . " . . - . . . . .
MODEL DEVELOPMENT
Contaminant Source Module . _ . - . . ; •
A system of analytical models which describes various aspects of source loading and contaminantwashout from both the unsaturated and saturated zones was configured via straightforward massbalances. Although several simplifying assumptions were made, the model can simulate very complexsource-loading scenarios. For example, any combinations of the following aspects of source loadingand contaminant washout can be simulated: • • ' : • .
e Surface infiltration and percolation . ' .e Contaminant loading via infiltration . • .,; .e Sorption in the unsaturated zonev . - •e Upgradient groundwater flow j •• Contaminant loading via upgradient flowe Sorption in the saturated zone-^ .:
p.49-10-91-1 ••'•',' • . A «A1 AR00037i«
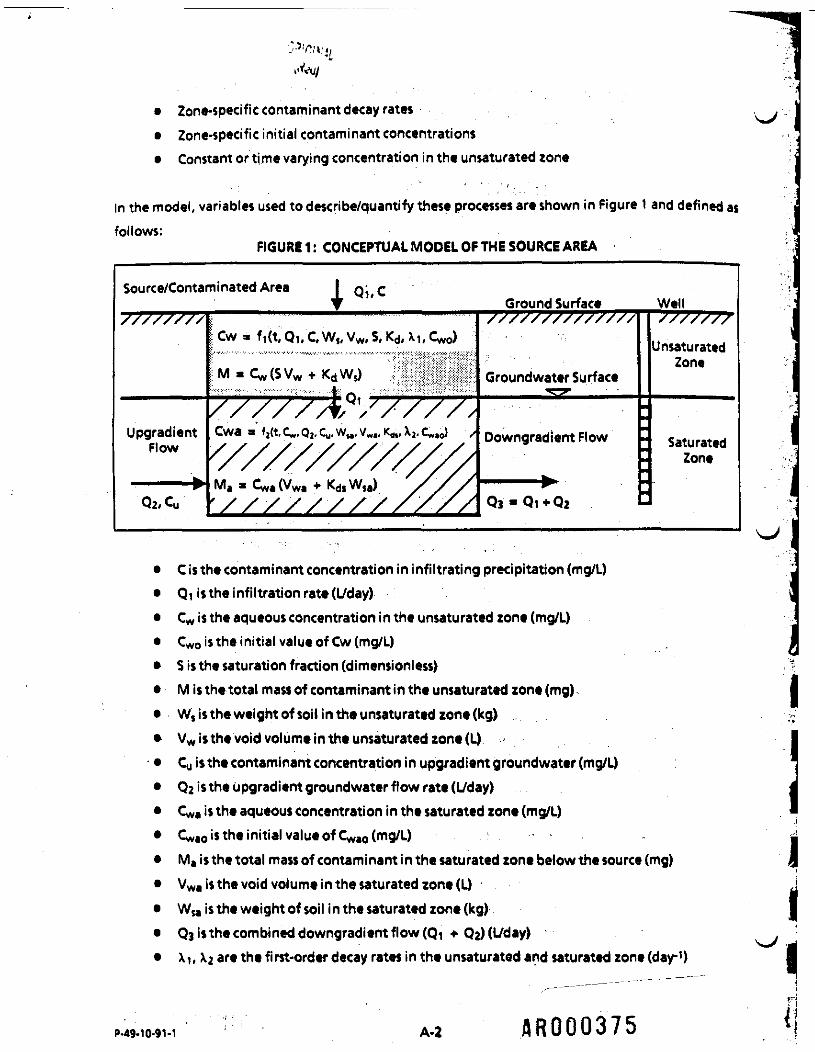
• Zone-specific contaminant decay rates , ,• Zone-specific initial contaminant concentrations• Constant or time varying concentration in the unsaturated zone
in the model, variables used to describe/quantify these processes are shown in Figure 1 and defined asfollows:
FIGURE 1: CONCEPTUAL MODEL OF THE SOURCE AREA
Source/Contaminated Area J_ Qi,CV ' Ground Surface Well
UpgradientFlow
Cw , f,(t, Q,, C.W,, VW. S, Kd, x,. Cwo) UnsaturattdZone
Groundwater Surface
Downgradient Flow
Qs * Qt + Q2
SaturatedZone
• C is the contaminant concentration in infiltrating precipitation (mg/L)• Qi is the infiltration rated/day)e Cw is the aqueous concentration in the unsaturated zone (mg/L)• Cwo '*tn* initial value of Cw (mg/L)• S is the saturation fraction (dimensionless) 1;e Mis the total mass of contaminant in the unsaturated zone (mg) I• Ws is the weight of soil in the unsaturated zone (kg) .,e- Vw is the void volume in the unsaturated zone (L) <e Cu is the contaminant concentration in upgradient groundwater (mg/L)e Q2 is the upgradient groundwater flow rate(Uday)• Cw, is the aqueous concentration in the saturated zone (mg/L)• Cwao is the initial value of Cwao (mg/L) .e Ma is the total mass of contaminant in the saturated zone below the source (mg) \e Vwa is the void volume in the saturated zone (L) Ae W» is the weight of soil i n the saturated zone (kg) 1e Q3 is the combined downgradient flow (Qi + Q2)(L/day) ' , :e x,, X2 art the first-order decay rates in the unsaturated and saturated zone (day1) 1
P-49-10-91-1 A-2 AR000375

ORIGINAL
• Kd, Kds are the aqueous/solid phase distribution coefficients in the unsaturated andsaturated zone, respectively (Ukg)
• t is the time (day)
1. Unsaturated Zone
A mass balance for the wash out of contaminants from an unsaturated source area, assuming that theinfiltrating precipitation contains background contamination and that dispersion in the unsaturatedzone is negligible, yields the following expression for the time-dependent concentration in theunsaturated zone: ... . . : . .
dcw • "' 'c-c -x.c (Ddt I SV -hw*
w
For an initial condition of Cw * Cwo, this equation may be solved via direct integration to yield the1 - . . " ' - ' ' • - *
following solution: :
c-|c- ifo.+ Xift) cwo|exP[-t ;Vw;Ki;;;'*!Cw = —————————————
2. Saturated Zone
Using a similar approach, a general case for the saturated zone which includes a time-dependentsource loading term (C* as above) and an upgradient contribution as a result of backgroundcontamination may be written in the following form:
(S/I
dCwa K2 Ki K. f** . *n *. 3 j_ * __. 1 tr *. f>\At ' K^ *• 1C^ 5f^ ^ I ~~ 5 i
Where: KI » Vwa Kd$W$a
K3 » QiC /[1 + (SVW + KdW X Q,)] + Q2CU<4 - Qi Cwo-Qi C/[1 + (SVW + KdW,)(Xi/Qi)]K5 » [Q! + (SVW + KdW»)Xt]/(SVw
A-3 AR000376

This equation is of the general form:
C'wa * P(t)Cwa =» r(t)
and has a general solution as follows:
Cw, a exp[-h]*[/exp(h)r(t)dt * K]
Where: h x J*p(t)dt and K is a constant of integration
This equation may be solved for the initial condition of Cw, * Cwao using the preceding integratingfactor approach or the method of undetermined coefficients to yield the following:
K, K. / \ r Ka K* i / Kzi\- sriz - M -E-i zl-'l-K:1) (4)
3. Special Case
In addition to this standard form of the solution, the following two special cases were alsoconsidered:
e For a constant-concentration unsaturated zone (i.e., Q aC), the saturated zone equationbecomes:
QtC + Q2CU - Q,C + Q2CU - K^ exp -wm _
»
in the case of K2 * Ki<5, the solution of Eq. (3) and thus the saturated zone equation 'becomes:
K3C = — *_ K4 1 / \^r-si^rW'V) (6)
A-4 flR000377

ORIGINAL
Downqradient Solute Transport Module "* ^ ,,--.,
A simplified version of a general solution to a three-dimensional advection/dispersion/sorption/decayequation was used to sfmulate solute transport. It provides an estimate of the contaminantconcentration at a receptor location or discharge area downgradient of the source area underdifferent source-loading conditions. As a result of the complexity of this model, a separate,executable file was required to perform the calculations. The linkage between the main spreadsheetand this executable file was accomplished by using macro commands in the spreadsheet,
The basic equation, a modified version of a general constant-source equation developed byDomenico (1987), for the plume centerline is as follows:
erfc ————;——r————I erf._
(7)
Where: C = the downgradient concentration along the plume ctnterline (mg/L)C0 s the constant groundwater concentration at/below the source (mg/L) .x s the distance downgradient of the source (ft) . .V « the contaminant velocity (ft/year)t * elapsed time since the beginning of the source loading (years)
I '• ; . ': ' - ' t • • - . • • • • . - ' -. -Ox * the principle value of the Dispersion tensor in the x (longitudinal) direction (ftf/year)Y » source dimension in they (lateral) direction (ft)Dy m the principle value of the Dispersion tensor in the y (lateral) direction (fttyear)Xj * decay rate (years-i)
- ' . - i .c .%<; -- ? - 7'.-. irj „ J • . , »In the preceding expression, erf and erfc are the error function and the complimentary error function,respectively. The vertical dispersion was not considered in equation (7) in order to provide a/ . iconservative estimate of the exposure pblnt concentration. The contaminant velocity is determinedas the groundwater interstitial pore velocity divided by the retardation factor. This retardation factorcan be estimated by using distribution coefficient, bulk density, and porosity of the soil. Equation(7)was applied using superposition to simulate the time-dependent source loading. For this time*
AR000378
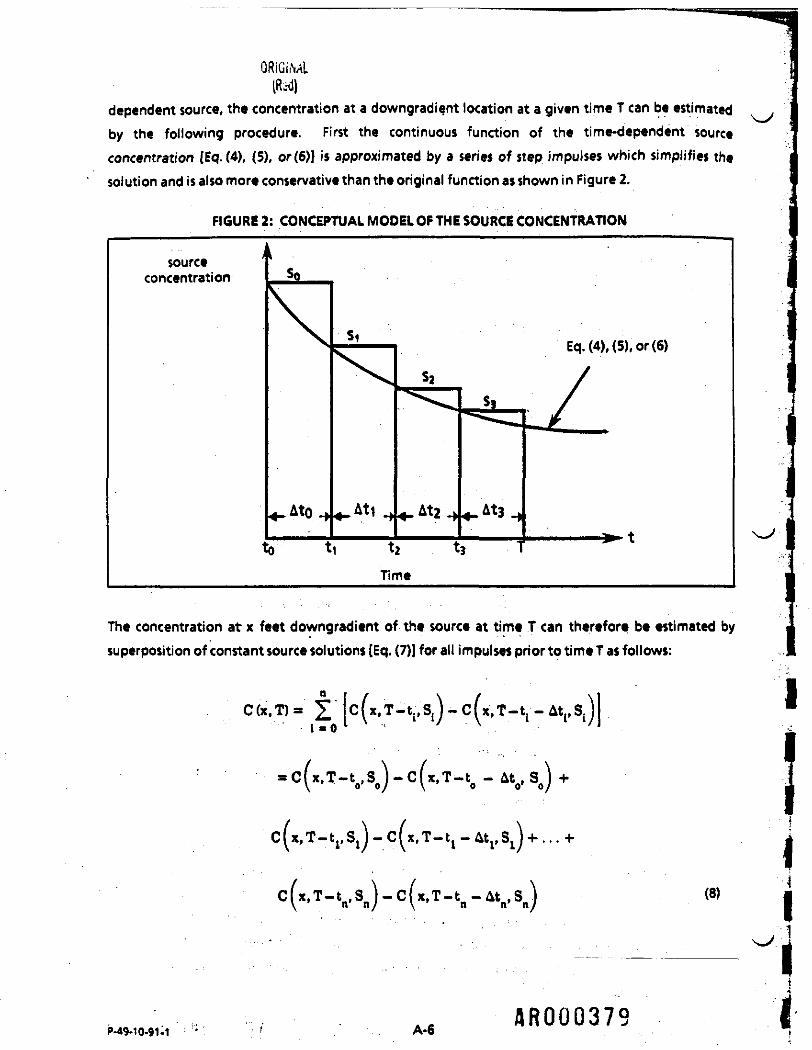
ORIGilML(RaJ)
dependent source, the concentration at a downgradient location at a given time T can be estimated ,by the following procedure. First the continuous function of the time-dependent sourceconcentration [Eq.(4), (5), or(6)l is approximated by a series of step impulses which simplifies thesolution and is also more conservative than the original function as shown in Figure 2.
FIGURE 2: CONCEPTUAL MODEL OF THE SOURCE CONCENTRATION
sourceconcentration
AtQ At!
Eq.(4),(5),or(6)
At2
to t, t2Time
The concentration at x feet downgradient of the source at time T can therefore be estimated bysuperposition of constant source solutions [Eq. (7)] for all impulses prior to time T as follows:
Q /- ip\ = x i r«f - i» *. c i m _ m i. AI. e u •
1-0
ij
AR000379P-49-10-91-1 ' f A-6
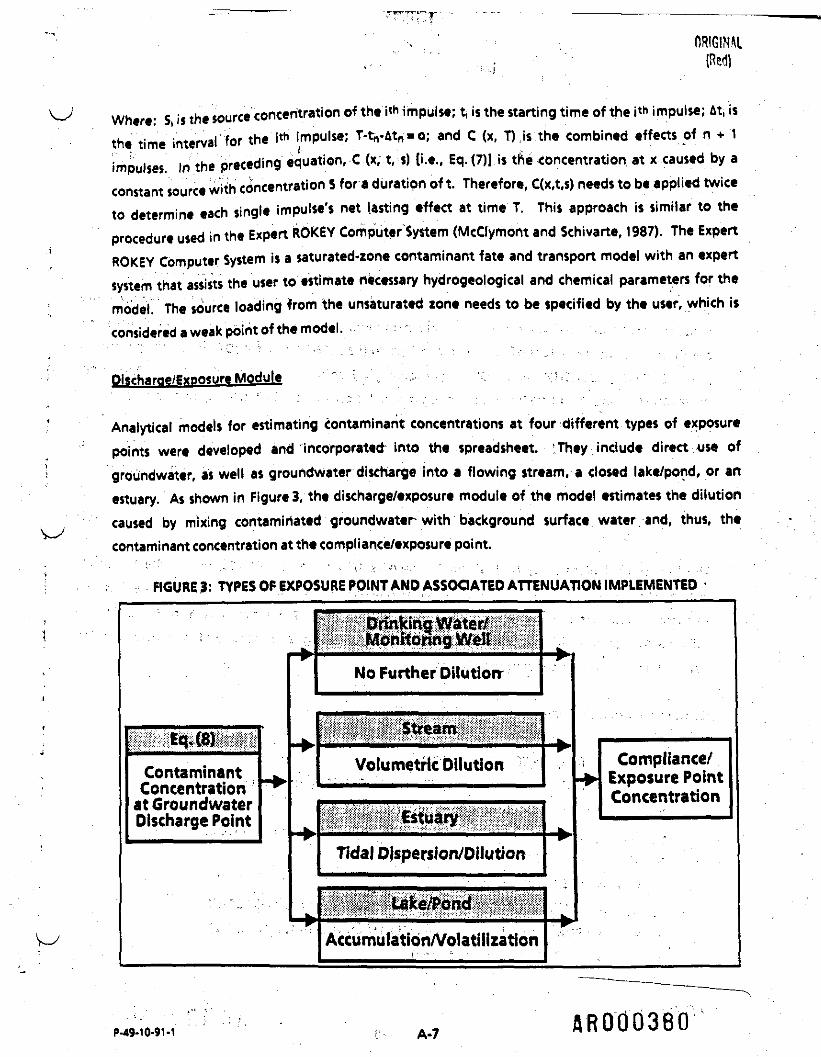
- —— . -, - - ..... . ._ ——— ., ———————————————————— • • • — — —————— — -, ——— . —— . —————— . ———— ___ ——— .
' ' ORIGINAL
Where* S is the source concentration of the 'i«h impulse; tj is the starting time of the W impulse; M, isthe time interval for the i* impulse; T-tn-Atn*o; and C (x, T),is the combined effects of n + 1impulses In the preceding equation, C (x, t, s) (i.e., Eq.(7)l is the concentration at x caused by aconstant source with concentration S for a duration of t. Therefore, C(x,t,s) needs to be applied twiceto determine each single impulse's net lasting effect at time T. This approach is similar to theprocedure used in the Expert ROKEY Computer System (McCfymont and Schivarte, 1987). The ExpertROKEY Computer System is a saturated-zone contaminant fate and transport model with an expertsystem that assists the user to estimate necessary hydrogeological and chemical parameters for themodel The source loading from the unsaturated zone needs to be specified by the user, which isconsidered a weak point of the model. • ..- •
Module •• _
- Analytical models for estimating contaminant concentrations at four different types of exposurepoints were developed and 'incorporated into the spreadsheet. They include direct use of
' groundwater, as well as groundwater discharge into a flowing stream, a closed lake/pond, or artestuary. As shown in Figures, the discharge/exposure module of the model estimates the dilutioncaused by mixing contaminated groundwater with background surface water/and, thus, thecontaminant concentration at the compliance/exposure point.
: FIGURE?: TYPES OF EXPOSURE POINT AND ASSOCIATED ATTENUATION IMPLEMENTED -
; • ,. ' . .
ContaminantConcentrationat GroundwaterDischarge Point
^
H»
-
-*
-*
III:pl! u iStiil il ^ ^
No Further Dilution
Volumetric Dilution
Tidal Dispersion/Dilution
Accumulation/Volatilizationi • •" '-
-+
-*»
-*
-
i Compliance/•> Exposure Point
Concentration
-K
AR000360
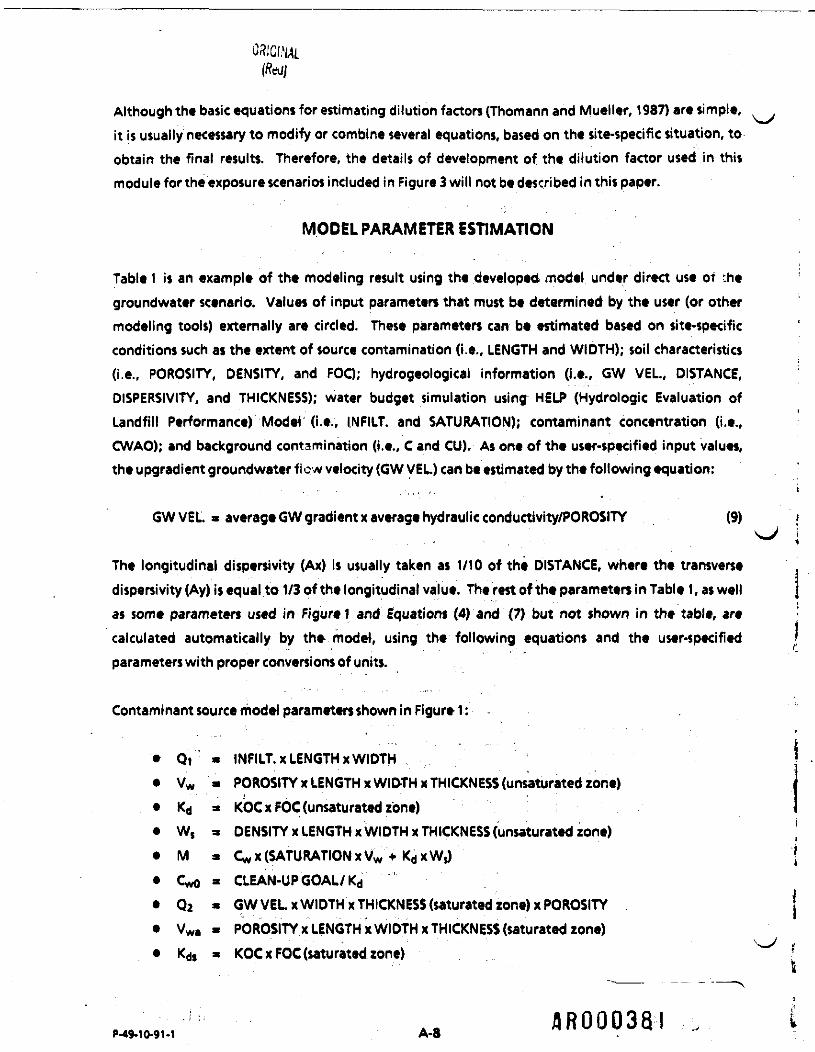
Although the basic equations for estimating dilution factors (Thomann and Mueller, 1987) are simple,it is usually necessary to modify or combine several equations, based on the site-specific situation, toobtain the final results. Therefore, the details of development of the dilution factor used in thismodule for the exposure scenarios included in Figure 3 will not be described in this paper.
MODEL PARAMETER ESTIMATION
Table 1 is an example of the modeling result using the developed model under direct use of :h«groundwater scenario. Values of input parameters that must be determined by the user (or othermodeling tools) externally are circled. These parameters can be estimated based on site-specificconditions such as the extent of source contamination (i.e., LENGTH and WIDTH); soil characteristics(i.e., POROSITY, DENSITY, and FOO; hydrogeotogical information (i.e., GW VEL, DISTANCE,DISPERSIVITY, and THICKNESS); water budget simulation using HELP (Hydrologic Evaluation ofLandfill Performance) Model (i.e., INFILT. and SATURATION); contaminant concentration (i.e.,CWAO); and background contamination (i.e., C and CU). As one of the user-specified input values,the upgradient groundwater flow velocity (GW VEL) can be estimated by the following equation:
GWVEL a average GW gradient x average hydraulic conductivity/POROSITY (9) *
The longitudinal dispersivity (Ax) is usually taken as 1/10 of the DISTANCE, where the transversedispersivity (Ay) is equal to 1/3 of the longitudinal value. The rest of the parameters in Table 1, as well Jas some parameters used in Figure 1 and Equations (4) and (7) but not shown in the table, arecalculated automatically by the model, using the following equations and the user-specified (parameters with proper conversions of units.
Contaminant source model parameters shown in Figure 1:
• Qt » INFILT. x LENGTH x WIDTH• Vw * POROSITY x LENGTH x WIDTH x THICKNESS (unsaturated zone)• Kd a KOC x FOC (unsaturated zone)• W, a DENSITY x LENGTH x WIDTH x THICKNESS (unsaturated zone) j• Ma Cw x (SATURATION x Vw + KdxW$) j• Cwo » CLEAN-UP GOAL/Kd• Q2 a GWVELxWIDTHxTHICKNESS(saturatedzone)xPOROSITY j• Vwl . POROSITY x LENGTH x WIDTH x THICKNESS (saturated zone)• Kd» * KOC x FOC (saturated zone) ?
I
. _ f111N^*l««tf ** A t j •
P-49-10-91-1 A-8

v y ' ' ' v*. '. V ' ""• -"" • - "•" • f •• ;VTABLE 1: EXAMPLE OF MODEL OUTPUT
Copy rt ant 1991 HALUIURTON HUS ENVIRONMENTAL CORPORATION ,SCREEN ING -LEVEL MULTIMEDIA CONTAMINANT FATI AND TRANSPORT MODEL
EXPOSURE SCENARIO *1| TIME VARYING SOURCE AND DIRECT USE OP UOUNOWATU
SUPERFUNO SITE XOC (L/KO)t QSj£>HALF LIFC (YRS)t
• ' UNSATURATIDl C3I5IHVESTGATORi J. D. CHtOU SATURATEDl S3i>
ALLOWA6LI EXPOSURE CONC. (U8A)iC S.IL:
UHSATURATED ZONE MILCLEAN UP GOAL (MO/KG): &J5K '
SOURCE AREAl UN SATURATED ZONE SATURATED ZONE
LENGTH (FT)l SrfiiE?WIDTH (FT) I QJflp
POROSITYr ' . .^pDENSITY <G/CM3)t C 3>
INFILT. (FT/YR)) CBS?GW VI L. (FT/YR)) t_JtIP
ELAPSED TIME - VRS DAYS
0 02 7304 14606 21908 292010 365012 438014 511016 984018 657020 730022 803024 876026 949028 1022030 1095032 1168034 1241036 1314038 1387040 1460042 1533044 1606046 1679048 17520
• . SO 1825052 1898054 1971096 2044058 2117060 2190062 2263064 2336066 2409068 2482070 2559072 2628074 2701076 2774078 2847080 2920082 2993084 3066086 3139088 3212090 3285092 3358094 3431096 3504098 35770100 36500
MAXIMUM!
FOC (tt/x<m C3EDKD (LAO) I .065SATURATION) ' '.*&THICKNESS (FT)) CI3PDECAY (1/OAVn 3.8»-4CWO (PPI)i 4.69t4C (PPt)) . C^ PQ1 (L/DAY>| 245.80
UNSATUUTEO ZONE CONC.(UC/L)
46523.0834168.8225095.2518431.1713536.799942.097301.935362.893938.772892.822124.611960.431146.06841.72
'" 618.20454.04
i 333.47244.91179.18132.1197.0371.2652.3438.4428.2320.7413.2311.16
.. 8.11•6.03
4.433.2S2.39
.1.761.29.95
1 .70.91
- M'" .28 '•' '
.20
.19, .11 r
- i .08 j i '' ' • • • '• .06 : • :'
.04
.03
.02
.02
.01, .01 :
46523.08
FOC (Koyni)t O3SE&XD <l/K8)i .065SATURATtON) 1.00THtCXNKSS (FT)t CQB>BECAY (1/0 AT) i 3.798«-4CWAO (PM>t g. uaCU (PPD) g_ to02 a/OAT)l 1216.60
SATURATED ZONE CONC.(UG/L)
100.00631.62846.07883.06
4 827.72730.59
• - , 620.37913.28416.36332.79262.89209.69199,72123.2394.5672.23
; •• -. 54.9541.6631.4923.74 -17.89
, 13.4010.047.30
'•• - ' • ' 1.60 - "4.18
• • • • ; - - . 3.112.32
._- - „ 1.72f.28 -.9$.70.52
... .39- • p ',29 • '
.21
!l2"i ,. .08
.06
.03
.03
.03, . .02
, ' '•- : - -.01 - - -..01.01.01.00.00.00
8B3.06
DOWN QRADKNT AREA / EXPOSURE POINT
03 (L/QAY)! 1462.40 FOC (KO/KG)t fLWV^W V.(FT/YR)t 48.09 CT (L/«)l .06501 STANCE (FT)! qtfOJP RfTAWATIONt 1.316
DECAY (1/Y«>t t.386«-1 ACCEPTOISPERSWITYt THI GOAL!
Ay (PT)) 37.30
EXPOSURE POINT CMC. . ' 70-YEAR AVERAG8(UQ/L) : (UQ/L)
.0000
.0000,0000 ..0003.0069.0600.2621.7179.4400.3340 ..2480.0400.6140.9310.9990.8960.5940.1490.6870.2090 ..7430.3090 .., ,T.9180 '1.3740
. 1.2780 '1.0290.8213.6509.5129
J .4011.3123.2421.1868.1436.1099.0839.0639.0485.0367.0277.0209.0197.0118.0089.0066
' .0090.0037.0028.0021.0019.0011
4.999
'
1 ;. -, ; .. t
* - " • , ,
1
1.70621.70801.70931.71031.71111.7113.7103.7033.6836.6438.3791.4890.3769.2487.1118.9730
1.7113
A.9 flR000382

i• W« a DENSITY x LENGTH x WIDTH x THICKNESS (saturated zone)• Ma » Cwa x (Vwa + Kdj x WM)• Q3 a Q, + Q2• DECAY RATE * -ln(O.S)/ HALF LIFE (zone specific)
Downgradient solute transport module parameters used in Equation (7):
• RETARDATION a 1 + DENSITY x Kd$/ POROSITY• Co » $o, Si, $2, or S3 as shown in Figure 2.» x » DISTANCE (distance from the downgradient edge of the source area to the
exposure point)• GWV. « Qs/ (POROSITY x WIDTH x THICKNESS)• V = GW V. / RETARDATION
• Y a WIDTH• Ox a V x DISPERSIVITY (Ax) m V x 0. 1 x DISTANCE• Dy = V x DISPERSIVITY (Ay) » Dx/3• DECAY RATE » -ln(O.S)/ HALF LIFE (zone specific)
Although the contaminant source module assumes a homogeneous unsaturated zone, the use of theHELP Model to determine the infiltration rate and the degree of saturation externally can allow thelayered structure of the unsaturated zone to be considered, if necessary. The percolation from thebottom layer and the weighted average of saturations in each layer estimated by the HELP Model canbe used as the infiltration rate and the unsaturated zone saturation rate in this model. The thicknessof the saturated zone, which represents the vertical extent of contamination in the model, is usuallyderived from the minimum of the following three possible values: ]•
•*'• The thickness of the entire saturated zone.• The lowest position of detected contaminants of concern.e The mixing zone depth calculated by the following equation (Salhotra et al., 1990):
= B[I-CXP(-VIOL/(BVI))]
where: H is the mixing zone depth (ft); B is the total saturated zone thickness (ft); Vzo is the vertical 9seepage velocity (ft/yr); L is the length of the source area (ft); Vx is the horizontal seepage velocity(ft/yr); and av is the vertical dispersivity (ft).
P-49-10-91-1 A-10 flR000383
With all the parameters determined (either direct inputs or calculated internally by the model),Eqs. (2), (4) (or (5) and (6)1 and (8) are,then used in the model to calculate Cw, CM, and.C, respectively.
APPLICATION• I*
Following are three case studies describing instances in which the developed model has been utilizedto select cleanup goals. : ;
Cleanup Goal falectten • EPA Superfund Site .
The model is being used to determine soil Cleanup goals at an EPA Superfund site in Virginia. At thesite, soil media in localized areas is contaminated within the saturated and unsaturated zones. Themodel is being run under an interactive approach to determine the maximum unsaturated zone soilconcentrations that will allow the Safe Drinking Water Act (SDWA) .Maximum Contaminant Levels(MCU)tobeatwinedatthedowngradientedgeofthesaturatedzonebeneaththesite. .
> . - • ' . - *For this particular application, existing contamination is being input from actual chemical analysisdata from the saturated zone only. Infiltration rate (Qi) is estimated using the HELP Model, based onlocal meteorological conditions. Soil mechanical and hydraulic properties, which were determinedfrom samples collected from the site, are used as model inputs to simulate contaminant washout fromthe unsaturated zone and contaminant transport in the saturated zone. The model will be ryn for19 different compounds and for varying contaminant concentration levels. From the results of themodeling efforts, a variety of potential cleanup conditions will be established, and remedialalternatives for each condition will be developed for EPA review. ;
' ' •' •'•J : .- - • •Cleanup Coal Selection • POD Facility : ••<
• - ' ' i - 1 '••.•-'•' ." • ; •"'•:,, % ' ' - v - ; ' •..'"' ' : .
This model was used to develop remedial goals for contaminated areas in a DOD facility' in Texasaccording to specific remediation objectives. Figure 4 shows the contaminated zone in the facilityand contaminants of concern. The overall remediation objective used to establish the remediationgoals was to protect human health and the environment and achieve Applicable, or Relevant andAppropriate Requirements (ARARs). The goals were established based on EPA and TWC (Texas WaterCommittee) "acceptable" risk levels and assumptions regarding ultimate land uses and contaminantexposure pathways, based on existing site information, EPA guidance, regulatory requirements, andprofessional judgment '
A R 00 03814

P-49-10-91-1HR000385A-12
(Red)
^ Leachate generation, dilution in the aquifer beneath the si|eis,;and downgradient transport,including hydrodynamk dispersion and sorption, were considered to determine soil concentrationsthat correspond to the groundwater remediation goals at the point of exposure (i.e., the baseboundary or a stream flowing through the facility as appropriate). Although many of the soilcontaminants at the various sites are subject to environmental degradation via hydrolysis or microbialdegradation, these decay mechanisms were not considered. Model input parameters weredetermined based on available site information and on professional judgment if site-specific valueswere not available. ; .•• ~o ••;;;;• : ; . , • ^
. Two other models were also used to determine certain input parameters for this model. Thegroundwater velocity for each site was determined from a calibrated, particle-tracking, groundwatermodel completed in support of a remedial investigation study at the facility. This model was used todelineate ffow paths and to predict the travel time of a particle from the various sources to the stream
< or other exposure points. The lengths of the flow paths from each site (or discrete site-specificsources) were divided by the simulated travel times to determine an interstitial pore velocity. The
• annual recharge (Qt) for each site was determined using the HELP Model.
• . Soil remediation goals were determined based on the assumption that the groundwater was either' i i ' • _ > - . ' " • - • • • • • . f . , ' ' . . ' ; ' •
uncontaminated or that it would be restored to acceptable concentrations. Therefore, for modelexecution, C (the concentration in infiltrating precipitation), Cy (the concentration in upgradient
> groundwater, and Cw, (the concentration in groundwater beneath the site) were all set equal to zeroat time t « 0. Furthermore, the concentration in infiltrating precipitation and the upgradient
. concentration remain at zero throughout the model execution. The saturated zone groundwater. concentration is contingent upon loading from the source and fluctuates as a function of time.
Once the input parameters had been established for each site and contaminant, an interactive,trial-and-error approach was used to determine acceptable source concentrations. A soilconcentration was entered and adjusted until the maximum downgradient concentration at thepoint of exposure did not exceed the groundwater remediation goal. The model suggests a new goalwhenever the criteria is exceeded or when a higher goal may be acceptable.
ACL Demonstration * Major Chemical Manufacturer
In an.ACL (Alternate Concentration Limit) demonstration study, exposure to groundwatercontaminants Jhat have discharged to surface waters in the vicinity of a major chemicalmanufacturer's facility is considered the only realistic potential route of contaminant exposure.Incidental ingestion of surface water and ingestion of aquatic organisms that have accumulatedi———,—————^
- ^ ;P-4$-lb-91-1 ' ' . , ' A_j3 " "

discharged groundwater contaminants are considered the exposure routes of concern for humanreceptors. These points of exposure and exposure routes are considered to develop MaximumAllowable Exposure Concentrations (MAECs). ACLs are then determined via contaminant fate andtransport analysis so that the MAECs are not exceeded.
Several unsuccessful attempts to develop a complex, numerical, groundwater flow and transportsimulation of the facility have been completed to date by two other consultant firms. In view of thecomplexity of the site hydrologic conditions, HALLIBURTON NUS deemed it more appropriate toemploy simplified analytical solutions to simulate contaminant migration. Nevertheless, theseprevious studies provided values for most of the required parameters in this more efficient modelingapproach.
Figure 5 depicts the conceptualized cross section of the study site. Two of the three surface waterbodies in the vicinity of the site were treated as quiescent bodies with virtually no dilution potential.An accumulation/volatilization model was developed and incorporated into the spreadsheet tosimulate the exposure point concentrations in these two surface water bodies. A tidal dilution modelwas developed for the third surface water body to estimate chemical concentration distribution inthe tidal lake. Based on groundwater discharge rate, chemical concentrations in the groundwater,and a tidal amplitude, the model can be used to estimate the steady-state daily maximum or averagechemical concentrations in the lake. Therefore, the dilution factor between groundwater and eachmodel segment resulting from mixing and tidal movement was determined.
ACLs were eventually developed for each of the chemicals of concern using the developed model.The observed concentrations of some chemicals exceed the ACLs derived based on the exposurepathways of concern. The fact that some of the protective ACLs have been exceeded indicates thatcontainment efforts (interceptor trenches) are necessary and were implemented in a timely manner.Continued interception of groundwater plume is planned until acceptable concentrations (ACLs) areattained at the unit boundary.
SUMMARY
Several advantages of a spreadsheet-based model over a traditional "pre/post-processor and mainprogram approach" are apparent. Because the simulation is implemented by a spreadsheet, themodel input and output data are contained tn the same file. It is extremely easy for the user tochange values of any specific input parameters, and the effects of various input values can be seen on, . .the computer screen. The graphical and statistical capability provided by the spreadsheet makespresentation of the model results very efficient and flexible. _ _ _ . . _._---- — —

P-49-TO-9M ' A-1S AR000388

IN)
REFERENCE
Domenico, P.A., 1987, "An Analytical Model for Multidimensional Transport of a DecayingContaminant Species," J. Hydrol., Vol. 91, pp. 49-58,
McClymont, G. L, and F.W. Schivartz 1987, "Development and Application of an Expert System inContaminant Hydrogeology - The Expert ROKEY Computer System," prepared for National HydrologyResearch Institute, Environment Canada, Alberta Environmental Research Trust
Salhotra, A. M., P. Mineant, S. Sharp-Hansen, and T. Alltson, 1990, "Multimedia Exposure AssessmentModel (Multimed) for the Evaluating the Land Disposal of Wastes - Model Theory." EPA ContractNo. 68-03-3S13and No. 63-03-6304, USEPA, Athens, GA, pp. 124-126.
Thomann, R. V and J. A. Mueller, 1987, "Principles of Surface Water Quality Modeling and Control,"Harper & Row, Publishers, New York.
ll
P-49-10-91-1 ' A-16 AROOQ389

B
AROD0390
ONVOldI03dS 1VOIW3HO
flR00039
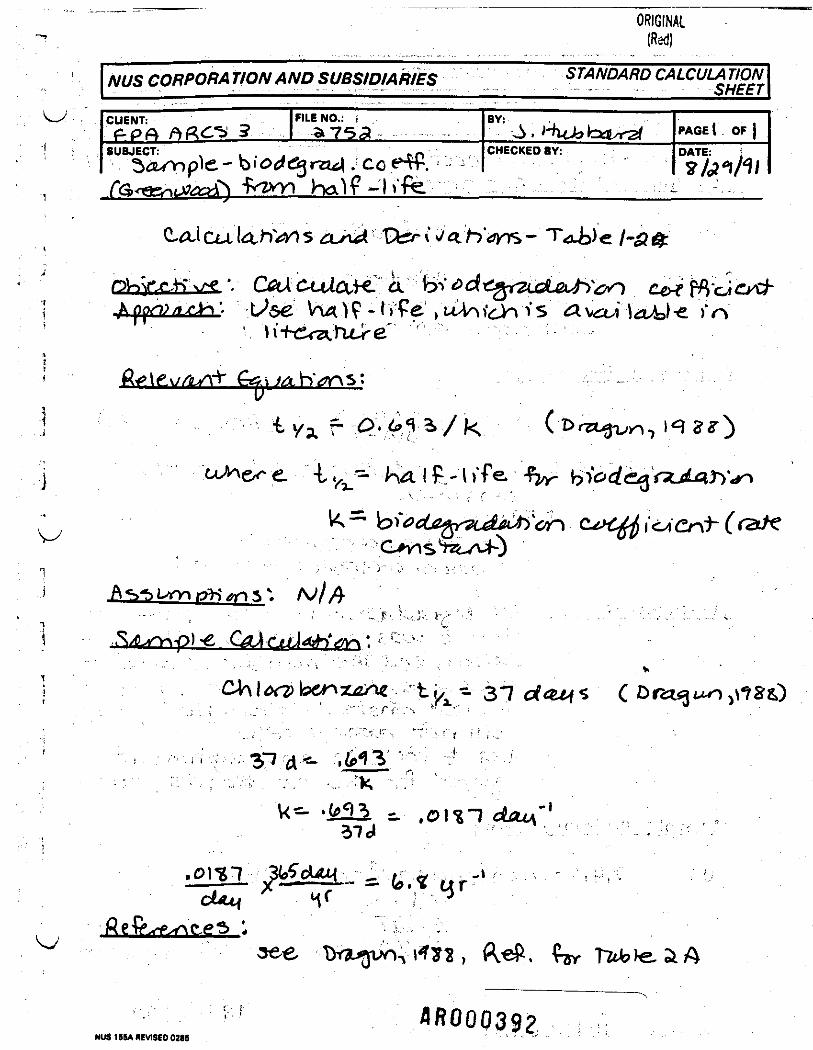
ORIGINAL
NUS CORPORATION AND SUBSIDIARIES STANDARD CALCULATION.
CUENT: FILE NO.:
SUBJECT: rt !. coeW."
BY:
CHECKED BY:PAGE I OF |
DATE:
'- t/>se V\4)9-t):fe j
x - 31
^ ,01-8-?
^
NUS 18SAHC VISED 0285

/W/S CORPORATION AND SUBSIDIARIES STANDARD CALCULATION
CLIENT: FILE NO.
SUBJECT:
BY:
CHECKED BY
- on
-fer
0)
NUS 1SBA REVISED 0285 ' ) '
^^- \ * i- \) noe
I
Ii

ORIGINAL(Red)
NUS CORPORATION AND SUBSIDIARIES v r, - STANDARD CALCULATION
3FILE NO. 8Y: PAGE J
SUBJECT: CHECKED BY: DATE:
K - .
NUS 18SAMVISED 0285 AR00039U

A/te CORPORATION AND SUBSIDIARIES STANDARD CALCULATION
CLIENT:
SUBJECT: /(SrefiAU-Wd /CdJc.
FILE NO.:
«vrf K*c
BY:
CHECKED BY:
PAGE / OF f"
DATE:
THF
t-rfc n
CTref/ier
Sec Kef . /. T- -feJitfUPi'A^i Aef. io avxi H
4R000395NUS 1S5A REVISED 0285
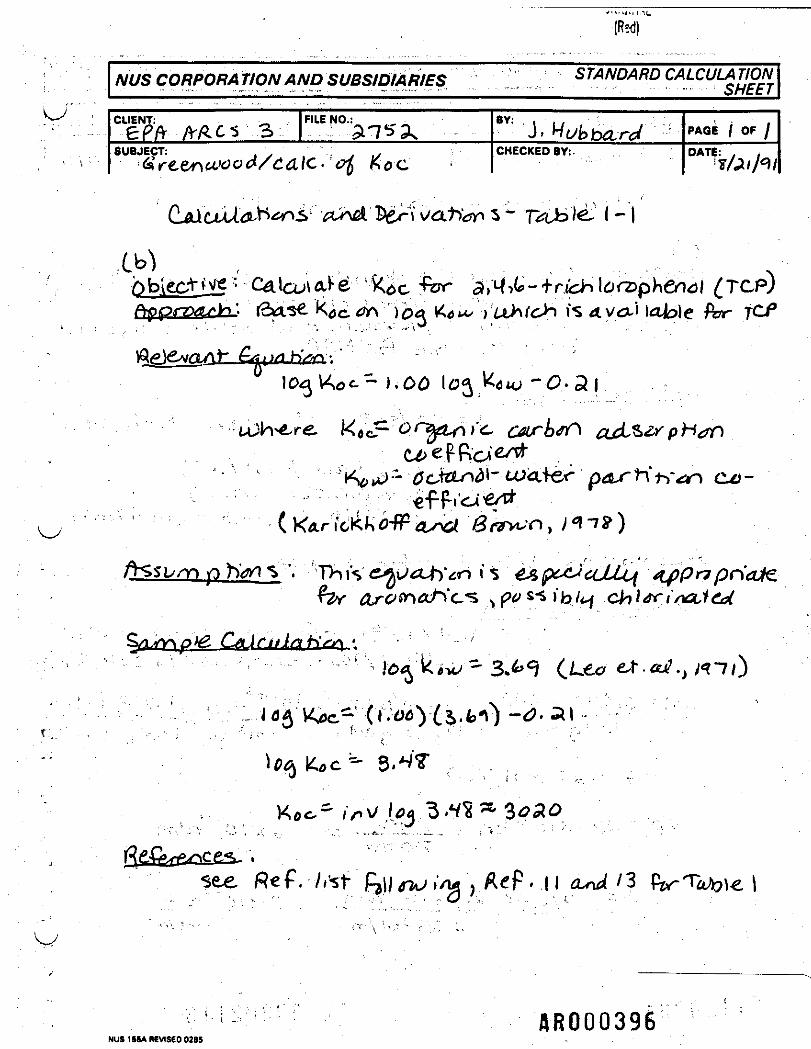
NUSCORPORATION AND SUBSIDIARIES STANDARD CALCULATION" ' '•'• • - ~ - - - . . ...,_.. ...... ,.-,.,... ,.- • • . . . . . SHcc f- ,. ... .._ .... . .
CLIENT.£P*•» i ft /VAC 3 3 FILE NO.:
SUBJECT:- rCC-nct' CJ£*/c^£/C • oi\ n0C
BY:J» nt/bbtftr /
CHECKED BY:.
PAGE / OF /
DATE: , i
see
: rSa-se K c.< i Kou^ >a>>i'c>» is
a i
AR000396NUS 15BAHEVISEO 0285

OR
NUS CORPORATION AND SUBSIDIARIES STANDARD CALCULATION
ARCS 5 FILE NO. BY:PAGE
SUBJECT: CHECKED BY:
H-
H - - Y * a.l»x
DATE:
C
Wr
Nus,5™ora,, • • ' • AR000397r
*ia&d

ORIGINAL(Red)
NUS CORPORATION AND SUBSIDIARIES STANDARD CALCULATE
CLIENT: -
SUBJECT: .Arf>0r\ tiJD&A I T-&.
FILE NO.:
4c • &A ^ e ^
J , )JLW?fc> UO/CHECKED BY:
PAGE AOF |DATE: .
BR000398NUS 155A flfV1SED02B5

3AMPL" -SAMPLE "TZ-C,NUMBER ScPTH.fc '-.(fl ._canon
A101 '• f.S7C 5.549371 . saturated C.CC£97A1C1 5 16.000 '0-16555 uneatufated 2.028A101 10 750 6.533313 --rwaturatea ''.00078A131 <S . i27 S.OS5734 . ureaturatsd O.QCC427A101 10 '..390; 7.237059 ~' -j-watiraiea C.QQ153A209 i -3.000 9.733127 uneaturatea 0.018.=209 Id 17,800 9.2356C9 uncaturited 3.C1CSA2Q9 5 7.S60 3.943767 *waauf«ed 0.00766A209 10 3.360 $.283939 rwaturated O.G03963NE2 1- '.22C ".'35337. .. unsaflurated 0.00132SN22 5 1,210 .7.033375 unaaiurattd 0.001213NE2 10 1.300 7.17012 _rwaiur«»d 0.0013•NE2 TOd 1.130 7.C55173 -jrwatLir»»d 0.00115DMA1 l 25,1C9 10.13082 ..rwafljrated 0.0231DHA1 ld< -7,000 - .740969 urwawrated 0.0175HA1 5 4.330 5.S03Q94 . .jn«_turat*d O.OC4932HA1 rd ?.C5C 8.522S37 Teaturated'/ 0 OCSC5DHA1 15 313 6.31S738 urwafljr««i O.C00913DHA1 iSd 1,090 5.993933 unsawra»a 0.00109
OCDHAI 2C :,i30 7.329973 nsatursted 0.00113£CCHA1 20d ' .040 S.346975 uraaurand 0.00104
DHA1 25 1.450 7.279313 unsaurawd 0.00145DHA2 1 3.010 3.383448 urwatirated C.00301DHA2 5 2.380 7.788417 uneaturated 0.00238OHA2 10 3.390 5.12358S . umaajrawd 0.00339DHA2 15 2.490 7.320038 uraaiurawd 0.00249DHA2 20 3,340 3.113728 uneaturatea O.C0334DHA2 25 1,300 7.17012 •uneaturated 0.0013OHA3 1 7,990 8.985948 unoaturawd C.00799OHA3 ? 3,310 5.271293 -Teaturated O.C0391DHA3 10 3,330 3.28359 unsafljrat*d D.C0333DM. 3 15 " 1.470 7.293018 unsatirattd 0.00147DMAS 20 M9G 7,;CSS31. saturated C.00143DHA3 i5 1.S30 7.38515 . naaBurawa C.C0153OHM 1 3.370 3.26101 uncaflurated 0.00387DHA4 5 2.900 7.S72488 'unsaturated 0.0029OHA4 10 1.110 7.012115 unsatirattd 0.00111OHA4 10d 1,240 7.122387 Lnaaurated 0.00124DHA4 IS 304 6.689599 unvaturatvd 0.000804DHA4 20 1,160 7.0S817S unaaturated 0.00118
OCDH4 20 728 6.58755 maturated 0.000726NW01 1 M.800 9.35378 - rwaturattd O.OH8NW01 3 15,800 9.655028 jneaturat*d 0.0155NW01 5d 15,800 3.655028 urwaturKaa 0.0156NW01 10 3,720 8.221479 -jrsaturated 0.00372NW01 15 553 5,74878 uneaturattd 0.000353
OCNVV01 15 1.730 7.455877 urwafcirated 0.00173QCNW01 1Sd 1.880 7.414573 unsaturated 0.00168
NW01 20 1,570 7.353831 .jwaeurated 0.001S7NW01 25 550 S.33Q123 .-noaflurated 0.00059
-*a of data c-eints 50 (x) ' 50maximum value 25,000 0.028average 4.648 7.37289 0.0048minimum value 427 0.0004standard delation 8188.S63 1.CS6549 O.OQ6163S6geometric mean 4,986.35 0.00458geometricetd 6572.29
flR000399

ORIGINS
Greenwood Chemical Statistical Summaryof TOO and Foe Values - Saturated Zone Samples
SAMPLE SAMPLE TQC.NUMBER DEPTH, ft ug-g LNTOC location Foe LN Foe
A101 25 1,460 7.2793 saturated 0.00145 -6.53619A101 30 630 6.4457 saturated 0.00063 -7.36979A101 35 2,290 7.7363 saturated 0.00229 -6.0792DHA1 ' 30 939 6.8448 saturated 0.000939 -6.9707DHA1 35 544 6.2969 saturated 0.000544 -7.51656DHA2 30 1,660 7.4146 saturated 0.00166 -6.40094DHA2 35 4,680 8.4511 saturated 0.00468 -5.36446DHA2 40 2.360 7.7664 saturated 0.00236 -6.04909OHA3 30 I.480 7.2998saturated 0.00148 -6.51571DKA3 35 2.250 7.7187 saturated 0.00225 -6.09683DHA4 25 917 6.8211 saturated 0.000917 -6.9944DHA4 30 1,130 7.0300 saturated 0.00113 -6.78554NW01 30 668 6.5043 saturated 0.000668 -7.31122NW01 35 467 6.1463 saturated 0.000467 -7.66918NW01 35d 580 6.3630 saturated 0.00058 -7.45248
no of data points 15 15maximum value 4,680 8.4511 0.0047 -5.3645average 1,470 7.0747 0.0015 -6.7408minimum value 467 6.1463 0.0005 -7.6692standard deviation 1068.374 0.6452 0.001068 0.6452geomeiric mean 1455.07 0.00146geometric std dev 1045.48 0.00105
AROOOl»OQ
ftBOOQUO
ORIGINAL(Rsd)
APPENDIX C
ARSENIC DISTRIBUTION COEFFICIENT CALCULATIONS
HROOO'lrO'2

NUS CORPORATION AND SUBSIDIARIES STANDARD CALCULATION_____ _ _ - - - - ' . • - orrcc /
NUS 1MA REVISED CMS

13-NQV-91 ' *t "*- e-P 5
Greenwood Chemical Site • Arsenic Kd calculations iArmy Corps' data)Unsaturated Zone Kd =8,258 (geo mean)
. final .Sample ' initial TCLP soil log KdLocation TCLP (mg/l> soil (mg/kg) cone, (mg/kg) Kd, L/Kg L/Kg
BN01 . 0..1432 205 202.136 1,4120.0111 119 118.778 10,701 4.0290.0011 ft 50.5 50.478 45,889 4.6620.0011 ft 1.5 1.478 1,344 3.1280.0011 ft 1.6 1.578 1,435 3.157
D 0.0011 # 1.5 1.478 1,344 3.128L302 0.0011 ft 12.3 12.278 1 162 4,048
0.0011 # 8.3 8.278 7,525 3.8770.0011 ft 4.2 4.178 3,798 3.580
L301 0.0011 ft . 88.2 88.178 80,162 4.9040.0011 ft. 3.7 3.678 3,344 3.524
L102 0.0011 * 67.1 67.078 60,980 4.7850.0011 ft 63 62.978 57,253 4.7580.0011 ft 19.6 19.578 17,798 4.2500.0011 ft 9.4 9.378 8,525 3.9310.0011 ft 6.4 6.378 5,798 3.763
BN06 O.OOU ft 0.27 0,248 225 2.3530.0011 ft 0.55 0.528 480 2.681O.OOU ft 1.4 1.378 1,253 3.098
BN03 0.0011 ft 3.7 3.678 3,344 3.524D 0.0011 * 4.1 4.078 3,707 3.569BN03 0.0011 ft 196 195.978 178,162 5.251
0.0011 ft 7.6 7.57B 6,889 3.8390.0011 ft 95.6 95.578 86,889 4.9390.0011 ft 7 6.978 6,344 3.802
BN03 0.0011 ft 6.2 6.178 5,616 3.7490. 0044 149 148. 912 33, 844 4. 529O.OOU t 43.3 43.278 39,344 4.595
D O.OOU ft 12.2 12.178 11,071 4.044D O.OOU * 6.55 6.528 5,935 3.773
O.OOU ft 5.3 5.278 4,798 3.681L305 0.003 2.8 2.74 913 2.961D 0.00605 16.65 16.529 2,732 3.436SA01 O.OOIT* : 3.4 3.378 3,071 3.487
0.0011 ft 2,1 2.078 1,889 3.2760.429 701 692.42 1,614 3.208
L101 O.OOU * 5.3 5.278 4,798 3.6810.003 31.6 31.54 10,513 4.022O.OOU * 1.5 1.478 1,344 3.128
D O.OOU ft 1.265 1.243 1,130 3.0530.0423 0.82 -0.026 -0.615 0.000
A401-D 0.0046 12.2 12.108 2,632 3.420O.OOU ft 1.5 1.478 1,344 3.128
A402-D 0.4085 38.9 30.73 75 1.876BNE1 0. 136 1 10 107. 28 789 2. 897
0.656 74.5 61.38 94 1.971D 0.04075 83.75 82.935 2,035 3.309BNE4 0.0067 13 12.866 1,920 3.283SA03 0.0391 99.9 99.118 2,535 3.404
1.14 1000 977.2 857 2.9330.731 538 523.38 716 2.855
A208-D O.OOU ft 6.6 6.578 ___„ 5*380 _ _ .3.777

13-Nov-91 ~ mc J
Greenwood Chemical Site Arsenic Kd calculations (Army Corps' data)Unsaturated Zone Kd *8,258 (geo mean)
final .Sample . initial TCLP soil -. . log KdLocation TCLP (mg/1) soil (mg/kg) cone, (mg/kg) Kd, L/Kg L/Kg
A209 0.0011 ft 41.7 41.678 37,889 ,4.579
average 14,929 3.543- 3,493maximum 178,162 5.251 =» 178,162minimum -0.615 0 » 1standard d»v. 30,231 0.8645 7.3205
arithmetic logorithmic antilog cvalues values log value
average • 8,258maximum = ,minimum »standard dev. ' 17,692
geometric' mean
Analysis result was not detected; value indicated is1/2 of the detection limit.
0276
°-rC-
ft.
flROOOUOS

027« 13-NOV-91
ORIGINALftei)
Greenwood Chemical Site Arsenic Kd calculations (Army Corps' data)Saturated Zone Kd = 3,242 (geo mean)
Sample initial TCLP soil log KdLocation TCLP (mg/1) soil <mg/kg) cone, (mg/kg) Kd, L/Kg L/Kg
BN01 O.OOU ft 1.7 1.678 1,525 3.183D O.OOU ft 2.06 2.038 1,853 3.268L302 0.0011 ft 6.2 6.178 5,616 3.749L102-D O.OOU ft 4.65 4.628 4,207 3.624D O.OOU ft 6.84 6.818 6,198 3.792BNOS-D O.OOU ft 2.31 2.288 2,080 3.318
O.OOU ft 1.6 1.578 1,435 3.157BN03 0.0011 ft 2.8 2.778 2,525 3.402
O.OOU ft 2.6 2.578 2,344 3.370BN08 O.OOU ft 13.5 13.478 12,253 4.088L101 0.0011 ft 1.8 1.778 1,616 3.209
average 3,787 3.469maximum 12,253 4.088minimum 1,435 0standard dev 3,114
arithmetic logarithmicvalues values
average 2,945 3,242maximum 12,253minimum 1standard dav 1,489
antilog of geometriclog values mean
ft * Analysis result was not detected; value indicated is 1/2 of thedetection limit.
0271
5) i, ftROOOitO'6
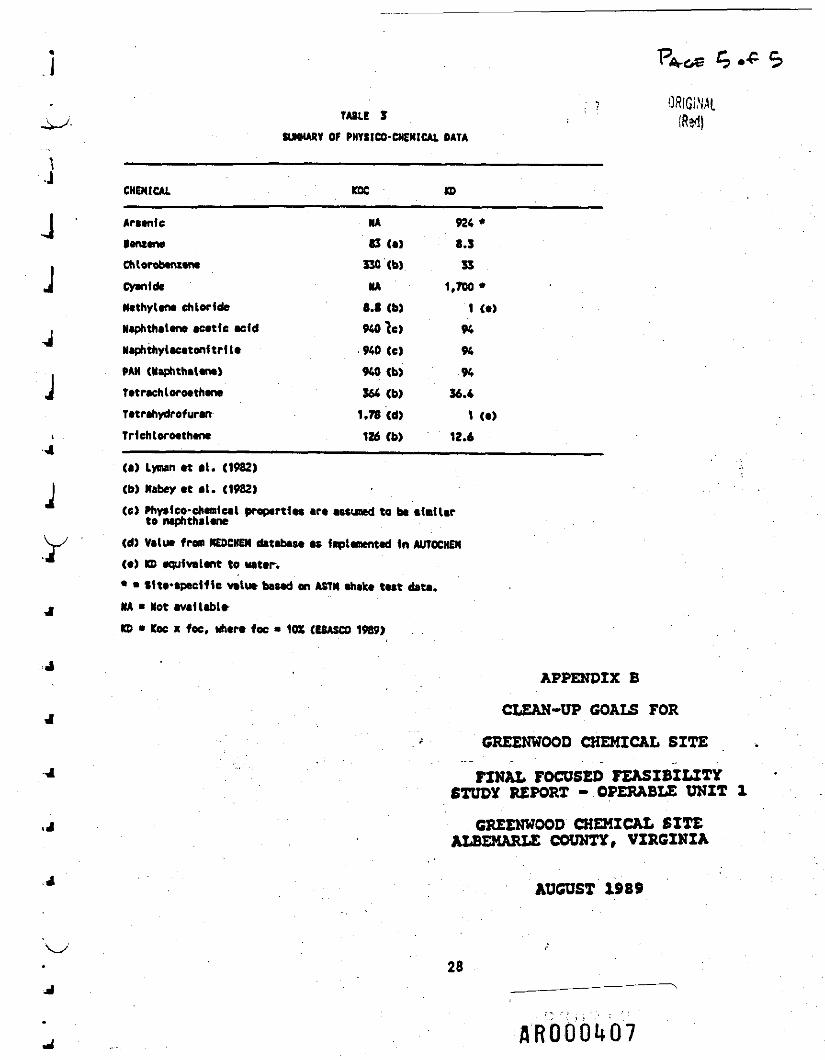
JJ
J
: 7 ORIGiMLTAB" J • ' (Red)
SUMMARY OF PHYSICO-CHEMICAL DATA
CHEMICAL
Aritnlc•enzeneChlerobtnztrwCyanideMcthylene chlorideNaphthalene acetic acidNaphthylacetonl tritePAH (Naphthalene)TatrachloroetheneTetrahydrofuranTrlchloroethene
KOC
NA
S3 (a)330 (b)NA
C.S (b)940 lc)940 (c)940 (b)36£ (b)1.78 (d)126 (b)
KD
924 *8.333
1,700 *1 (a)949494
36.4
1 (a)12.6
(a) Lynan at at. (1982)J <b> Kabay et at. (1982)J (e> »hy»tco-chemlcal properties are assuned to be •Inllarto naphthaleney. (d) Value from NEDCHEN database as tip lamented In AUTOCHEM
(•) KD equivalent to water.* • S1ta*apeclf1c velue based on ASTK aheke teat data.
j MA » Not availableKD » Koc x foe, whtre foe * 10X CiBASCO 1989}
APPENDIX B
CLEAN-UP GOALS FOR
GREENWOOD CHEMICAL SITE
FINAL FOCUSED FEASIBILITYSTUDY REPORT - OPERABLE UNIT 1
GREENWOOD CHEMICAL SITEALBEKARLC COUNTY, VIRGINIA
AUGUST 1989
28
flROOD407

D
IROOO.U08

ORIGINALIRsfl
APPENDIX D
TOTAL SEMIVOLATILETENTATIVELY IDENTIFIED COMPOUND (TIC)
ANALYTICAL DATA(from REM III Rl Report)
fl ROD 01*0 9

HALUBURTON NUS Environmental STANDARD GAQCULA TIONCorporation and Subsidiaries SHEET
• • -• • - .CUENT: ,
\J<>£P}\FILE NO.:
- £-7C3. >o*V 'SUBJECT: — .' — _
£jr*«-«iv*»«£ C*Ac«».W •5**ys/"5 '£«****• *y
BY:TJ
CHECKED BY:
PAGE / OF y
DATE: ,.//'f/92
;0.r-/3.r A6-0"3-«»'» ^*——v E- ^ r .S J23»OO=>
'M*
-n yy0.-» \, st ; ,, /- <?-/,? /3i»tr»• •' •'' - - V- 57 /rt.oo^
v-r //9.9W; . , > ~*7 35" .«"
73aa>oi>3
o.-w a
HALUtuaroH MIS iu aevntD em
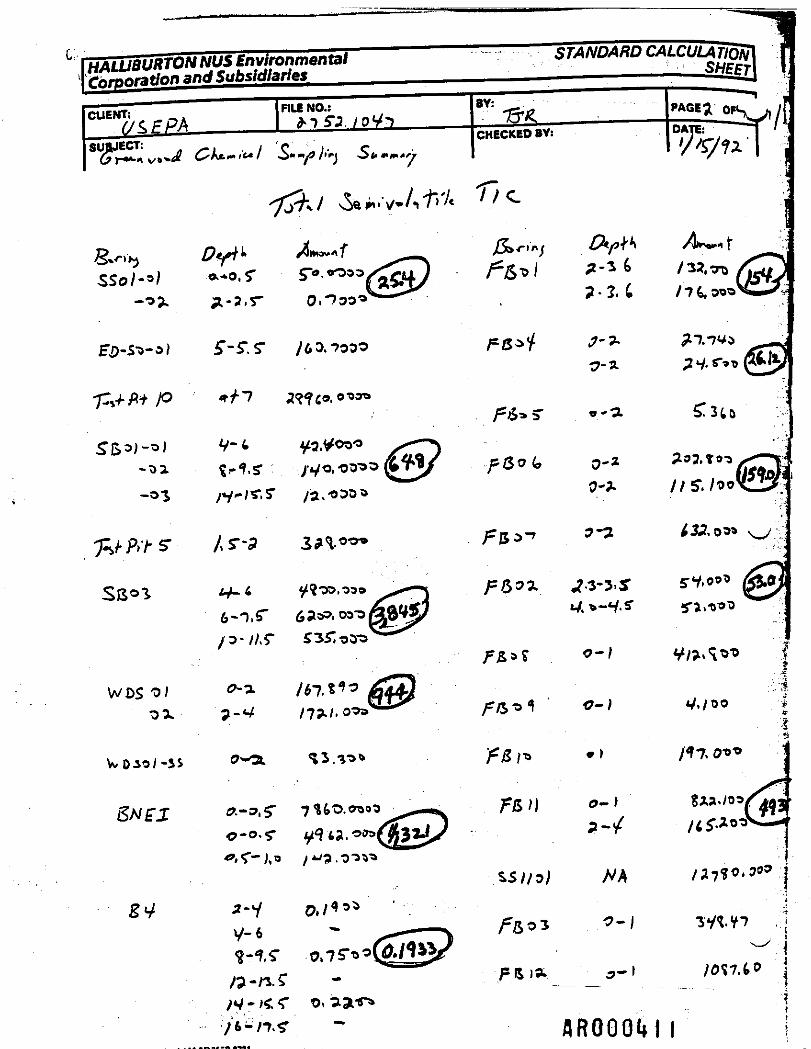
o-} Sza''0Y#3fp-/ /i$-w
/*7*0.3*»•J
i
3V*. V? .'iV-6 * >*--T"" /o-- • J7^T i
^^ \; 7.t.o i
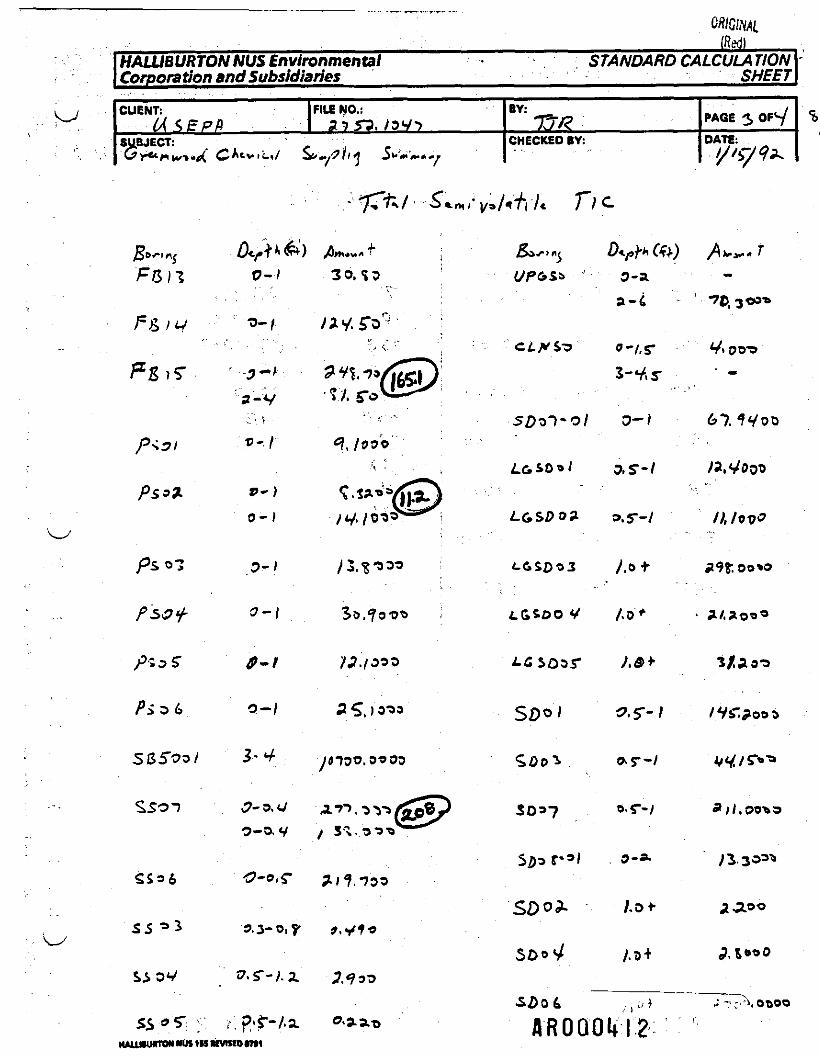
ORIGINAL(Red)
HALUBURTON NUS Environmental * STANDARD CALCULATIONCorporation and Subsidiaries SHEETCUENT:
(ASEPt) _ .FILE NO.:37 5"P, /DV>
SUBJECT:Gr**Mi*-"»»^ CAtvtt.,/ S'-y i'cf 5f*w*-/
BY: I3veCHECKED BY:
PAGE OF4-/
DATE:>/'s7?*
o-
uo/ 3-' 67.
as-/
.o t
V /.O*
soor
$2)3
HALUHHITON HOT tU MVKID mi
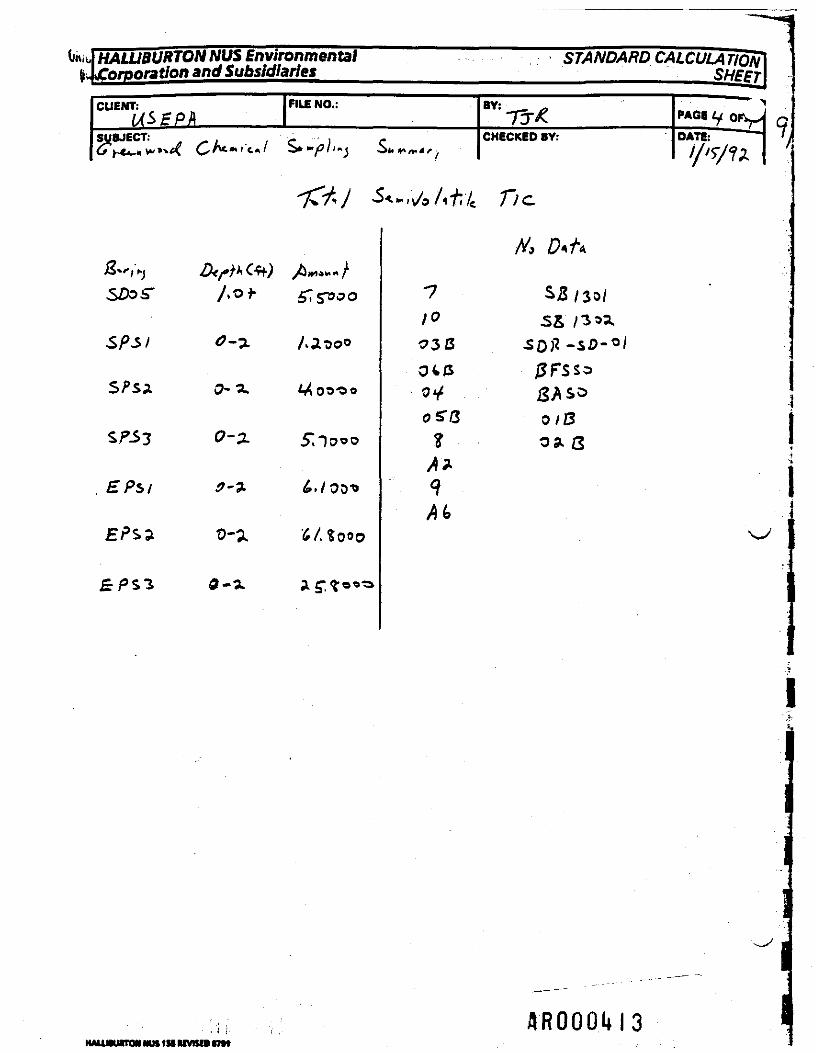
HALU3URTONNUS Environmental STANDARD CALCULATIOand Subsidiaries _________________________ SHEPT\
FILE NO.:
SyBJECT:O
CHECKED BY:
EPS a
A*1At
JR00014I3HALUKUITON NU» iM UVTSCD im
i

27-Jan-92 Page (
-no0(fbJ)
Greenwood Chefllcal Site ;.. . . .Semi-volatile TIC Data iron Ebamco REH III Investigation . .Adlustment to account for background concentrations found in,Ueit StreamAveraoe background teal volatile TIC* > (43.3 •*• 6.9) 23.1,
Boring Average Average .AverageCone. Back. Cone. Site Cone.ng/kg mg/kg "" mg/kg•'"
A-3 927 29.1 901.9A-ll 1472 25.1 1.446.9B-ll 270 25,1:, 244,9A-3 876 23.1 * '830.9B-8 463 23,1. 437.9A-4 41.6 23,1 16.3A-l 18.7 23.1 .' (6.4>A-8 46.1 23,1 , 21.0B-10 133 23.1"-,' 109.9B-12 36.8 23.1. 11.7A-7 167 23.1; 141.9B-9 10.2 23.1 U4.9)A-9 1.7 23.1 1 (23.4)A-10 190 23.1 164,90H1-SO-01 7322 23.1 7.296.9, -,
i , DH1-SO-02 9680 23,i 9.634.9SS01 23.4 23.1 , 0.3 :ED-SO-01 160.7 23.1 133.6TP-10 28960 23.1 28.934:9SB01-01 64.8 23.r. 39.7TP-3 328 23.1 '.: 302.9SB-03 3845 25.1 3.819:9WDS01 & 02 944 23,1 918.9W0S01-SS 83.3 23.1 . 38.2BNE1 4321 23.1 4.293:9B-4 0.1933 23.1 (24.9)FB-01 134 23,i; ; 128.9FB-04 26.12 23.1 , 1.0FB-03 3.36 23,i, (19.7)FB-06 159 23.1; 133.9FB-07 632 25.1 606.9FB-02 33 23.1 27.9FB-08 412.8 25.1 387.7FB-09 4.1 23.1 (21.0)FB-10 197 23.1 171.9FB-11 493.7 23.1 468.6SS1101 12780 23.1 12.734.9FB-03 348.47 23.1 323.4FB-12 1087.6 23.1 1.062.3FB-13 30.8 25.1 3.7FB-14 124.3 23.1 99.4
W FB-13 165.1 25.1 140.0PS01 9.1 23.1 (16.0)PS02 11.2 25.1 (13.9)PS03 13.8 23.1 (11.3)PS04 30.9 23.1 3.8
AROQOMti

27-Jan-92 Page , ,
Greenwood Chemical SiteSemi-volatile TIC Data from Ebasco REH III InvestigationAdjustment to account for background concentrations found in West Stream Uporad*i«M.1-Average background semi volatile TICs - (43.3 + 6.9) 25.1
Boring Average Average AverageCone. Back. Cone. Site Cone.mg/kg nig/kg mg/kg !
PS03PS06SB3001SS07SS06SS03SS04SS05UPG50CLNSOSD07-01LGSD01LGSD02LGSD03LGSD04LQSD05SD01SD03SD07SD08-01SD02SD04SD06SD05SPS1SPS2SPS3EPS1EPS2EPS3
12.125.110700208
219.70.492.90.2270.3
467.9412.411.129821.231.2.143.244.1521113.32.22.827005.31.24
5.76.161.823.8
25.123.125.125.125.125.123.125.125.125.125.125.125.123.125.125.125.123.125.125.125.125.125.123.123.125.125.125.123.123.1
(13.0)0.0
10,674.9182.9194.6(24.6)(22.2)(24.9)45.2(21.1)42.8(12.7)(14.0)272.9(3.9)6.1
120.119.1185.9(11.8)(22.9)(22.3)
2.674.9(19.6)(23.9)(21.1)(19.4)(19.0)36.70.7 uj
f
)c't
A R O O O U I 5

ORIGINAL(Red)
A R O O O b I B

APPENDIX E
UNCONSOLIDATED MATERIAL MODEL DATA CALCULATIONS
AROOOIH7*

(Red)
1 ———————— ' ——— ——— 1 _,,aMnM o«re STANDARD CALCULA TION \NUS CORPORATION AND SUBSIDIARIES SHEET\
CLIENT:" . EP4- ~- -
SUBJECT: ' _ . - . •£fcE^N'-UJ<
FILE NO.:.
SOb ;
BY:. n*r
CHECKED BY:. WA4-,
PAGE / OF j
DATE:H-vlW !
y/e> COn\Pv*> \T-\o**' CAL.CL^C AT
FILL-
1 fers'e.ng. >Qu»ftt'J? CLAY *//; ^AUQ % <U1 T
,) LlOl ZM*^ *H.lMt.M IH.2 ,.-5*i IH.l .
aw SOIL" .I*j"ntC
M O.l , ; 70-4.
30-H
40 2f "50
15 . 3d . .15" 10
-v' tf

WUS CORPORATION AND SUBSIDIARIES STANDARD CALCULATION^Uvi ,
CLIENT: _ .e PA.SUBJECT:
6ft t £"AJ t>.^
FILE NO.:
;OoX>
BY: ft.Vo's rCHECKED BY:
PAGE 2. OF "2DATE: |tl-U^|
O/ , K . x */o c o bA p<? *> / TVO/^ c^^-c^cAr/
c0*es OF
NUS ISM REVISED 02U
STO i o** sAMpce 0 2-5 IH•STDi
30 zS
Of

ORIGINAL
NUS CORPORATION AND SUBSIDIARIES * STANDARD CALCULATION. . . . . . ,.. «.„,._.„., .. - . . . , - . . . -- --. OrTCC /
. .
CLIENT: _EPASUBJECT: ;
O &E £ flJ U,
. . . . , , , , * - , H , , . - , . .
FILE NO.:v • . ' . . ........ ", .
too 0 '
BY:
CHECKED^: ,PAGE 3 OF J
DATE: •n'-fi-T/
ftguM SToRAf,g flflffl
OF *r
OM me &oRi*j'<. to e
Trac« 0- to percent • " ,•Some, it- 30 percent McTt tAnd - 31 -SOpercent ^ fcuRMe »s
Foft UKAM^L^ : IP me -SOIL w,s* tic^CRiftdO AS cuw AW& Sat6fiAUfc-(, , CLA^ AMti ^-LT tuo L ) fie
JO 7VM=
AROOOk20

NUS CORPORATION AND SUBSIDIARIES ~ STANDARD CALCULATION-- - ; - . - OrrCC /
CUE NT:
SUBJECT:O ft-0 £ rU Ui
, - ,.FILE NO.:
;oo0
B\ oo4>rCHECKED BY:
/WJ-itPAGE j OF^
DATE:ll il' t
ft RUMI Cr~?' Fin
31" I3). I
OHO
30-1A 66* Z<\.5
NUS ISSAMVISEO 0288
1.- pui (Q-i'J - 7z»*. AJO DAT/A
"2- ft£.vo6«ICEO WATuMt. /WArcataU 1-4
AROOOl»2l

ORIGINAL
NUS CORPORA TION AND SUBSIDIARIES STANDARD CALCULATION• - - - . -.. ... . ., ,... ... . . , . - , . . , . . .., ... . once/
CLIENT:
SUBJECT: j
.FILE NO.:...,, j
CO *-/T£" *V7" : C A
BY: !
CHECKED BY:PAGE'2 OF ZDATE:
«,OI>RCE AfteCOJUT. i
^ :" .." i
NUSt56ANEVISE0028S
. i
. Z.*/
37.6
nau f*JuV
3-7.C,
n-i• :•' t ; >*•-•'*-. ** ..*- f - - ' DMA? * i .'"'
' i "* f -' t ' L ' t "" . ' - ' < '
317
Vl-o
JBAA?
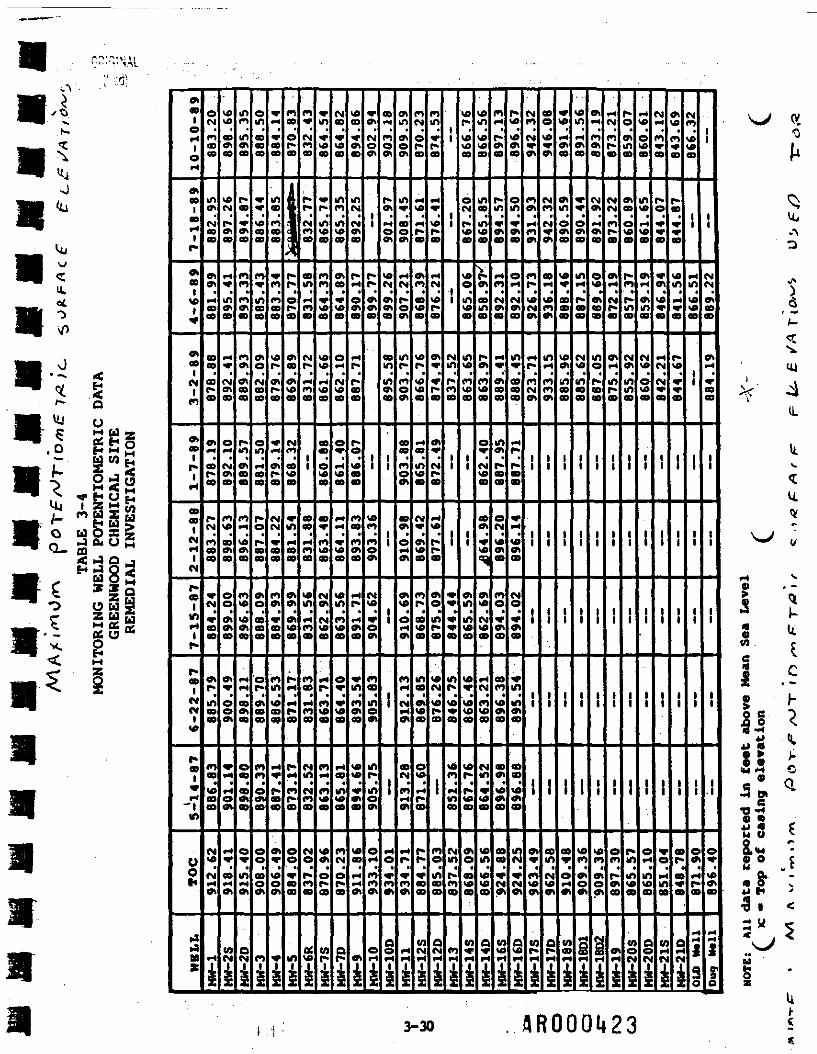
0
Vt,
mrj
VH W
mm
Qo.
£ fc*iO O U £r; Z U ut *•* OS n
< M
' A«D1OH1OpH
A00
•9r41r*
A001w1*
A00
N1m
Aaolr*iH
00flO1«*-t1N
r*OS
inHir*
p-aoCMCMttO
C**wH'1in
UoH
»9»4
*
oNnaeo
inACMeo9
enen*499
99
9r-9
Aft9r-9
t-N
m99
»M»99
Ap-m99
m9W99
NtoCM*Hm
iH
tOtO
9m9
4CM
r*en9
i-(»in*9
ft»
CMA9
OiH
CMen9
cnSO
9en9
ooenA9
en*•ooA
«•4
MOen
ft«r9•Hen
V)N1
incnmcn9
r*9
«ren9
cncncnen9
menen99
f**ft
en99
nfitoen9
cnUft
toen9
f*f4
eoen9
oeo00ena»
om"iA
ONi
em999
»*•
tO99
n*in99
AO
M99
Omft99
r*op"99
Ao999
OP»A99
«cnoA9
OO
9OA
n
i
»ft*•99
in9
m99
«rcncn99
10r*Ar*9
»fl
Af*9
<MCM»99
cnA
»99
ininto909
fl»
r*99
A»
tOOA
»
i
M9
Or»9
J1
I-p-p-or*9
A9
Ato9
CMW
9SO9
»infl99
AA
A109
r-r4
rtP*9
f*r*«1*9
Oev99
in
1
n»CMn9
r-t*CMm9
9inftcn9
CMr**H*n9
1
99r*n9
10tn*-icn9
cn9*4PIO
NinNcn9
WO
r-cn9
awi
»in«rS09
«*f»in**9
cncnvto9
1010
•H*09
99
O109
9»
cnu>9
CMA
CMS09
fHr*cn»09
cncnw»9
«*A
OP*»
Wt*
i
CM9
«r\oto
incnin109
A9
»\O9
OrH
CMSO9
O"
i-l\09
*4^
*•ve9
«0incn<«9
e»w«09
i-t9
m109
cnCM
ec9
Of*
«9
»A9
inCM
CMA9
f**4
OA9
<Hr*r-99
r*o1099
cn9
cnA9
*4r*ftA9
»mcnA9
<*W»
*A9
W9<H*4A
A
«A
CMOA
1
r-r*AA9
l
10cncnoA
CM10
VOA
cnooineA
int*inoA
ef-4
cncnA
OiH
9r*
cnoA
r*Ai-toA
<«CMAA9
9ininA9
1
1
!
!
*4e»cnA
ae•H
1
AinAeA
Ut*•
9OA
•HCM
r*oA
incnoA
99
cnoA
9A
Or4A
AW
O*HA
cnH
M*4A
9CM
cn•-4A
vlr*VcnA
*H
i
cnCM
oc*9
f-lM>*4
9
Acn9<09
VD
«vo9
r*9
inw9
CMW
AV09
cnp-9W9
in9
«09
ewf«r*0
f*c*»99
WCM
i
cninwc*9
MW
S0
9
«-tCM**r*9
A
»c*9
A*
CMt*9
t-l\0
r*c*9
Aoinr*9
M>CM
r*9
!
cnem99
QCM
i
ii
i
i
CM
r*cn9
1
'
W»
*»9
inr*»00
«cn•H«00
Nine*cn00
cn
i
•Af*t0<A9
OCMC*9
*0Omv»9
in
cn«9
1
1
Ainin109
10»
469
*0P-
P»W9
AOau»9
n•*
i
u»mve«9
l/t9in9
f*A
9in9
r*cn«09
O*•
CM««9
9A
*W<•:A10
CMU>9
•HCM
W9
(M<n»«09
WtnwU3O
Q*
i
en
*9
r-m«9
1-4cnCMA9
i-l
A99
inA
r-99
oCM10A9
cno*A9
9cnA9
9A
10A9
9a»CM*»
nu>
i
r*voA9
Oin»9
O
CMA9
in999
ftf*r-99
V*4
40A9
CMO
»A9
»inmA9
99toAa
>oM
*CMA
U
i
CM
M»A
cnA
••4
A
cn
VOCMA
<-«
cnCMA
'
'
1
11
!
AV
cnto
10r*
i
9
U»»A
CMcnCM
A
9
\0cnA
mcncnA
1
1
!
11
1
eoinCMto
Qr-
i
«>*A9
Aino9
to
999
to
in99
1
1
1
!
1
9»Ofl
tn9
i
to
ftA9
*»
O
9
m
r*9eo
CM
in99
t
1
1
11
!
tocnAO
i1
A
cnA09
CMA«H
9
O
A99
int*99
1
1
1
11
1
tocnAO•
i
1
r*4
nD
CMCMcn9
A
CMC*9
A
inp*9
1
1
1
!
1
Ocnr*A9
A
1
Ain9
A9
O
9
I*
r*in9
CM
inin9
1
1
1
1
I
r*mint0A
(0Oe
*
oto9
into•-»9
A
Ain9
CM
Oto9
1
!
1
ii
!
ein(Oo
QOM
i
CMnw9
9^00
»
tow9
fi
(N»eo
I
1
!
11
1
VO
•HinQO
w»HCM
A
n*9
ev9
to
i-t»eo
r-
»*re
l
1
1
l1
1
00r*
a
tct
ft
M9wa>
!
fl
10tOao
t
1
'
1
1
i
eCft
c-ao
3t\
ii
ii
MNAaoeo
at
«r9eo
1
1
1
1t
O*toA9
5i<
w42S
4J4J «
2« J-«M« O5; <iTJ-H* SLl U X
o ou &283"• W•4 *< I
3-30 ..AROOOI*23

ORIGINAL(Red)

APPENDIX F
INFILTRATION RATE CALCULATIONS(HELP MODEL)
BROOOU236

11i1Ii\
I
TABLE 3-8WEATHER DATA FOR THE PERIOD 1941-1979
CHARLOTTESVILLE, VAGREENWOOD CHEMICAL SITEREMEDIAL INVESTIGATION
MONTH
JanuaryFebruaryMarchAprilMay
• JuneJuly
AugustSeptemberOctoberNovemberDecemberAnnual*
\ AVrRAGITEMPERATURE <°F )
36.1
37.8
,,46.5 -, 57.7
66.3
73.5 .77.3
-76.269.9
59.549.1
38.457.1
TOTALPRECIPITATION (IN*
3.212.94
3.97 ,,e .
3.194.19
3.69
4.78
4.73
4.43
4.023.12 -
• "-.. ; 3.54 •,.-:,..-;-43.74
* Average of annual averages and,totals for period.Source: Commonwealth of Virginia, State Water .Control Board,
of Mb<*rmarlg gftunt-y. ViryiniB. 1980, p, 6
L3-44

.'''01
**********************************************************************************************************************************************
—»••«•
E
GREENWOOD CHEMICALCLEANUP GOAL SELECTION9/3/91
/I fen !> - M AIM Sconce Aw*
EXCELLENT GRASS
LAYER 1 .
VERTICAL PERCOLATION LAYERTHICKNESS » 12.00 INCHESPOROSITY - 0.4370 VOL/VOEFIELD CAPACITY . . . . . . . . . - 0.1053 VOL/VOLWILTING POINT - 0.0466 VOL/VOLINITIAL SOIL WATER CONTENT - 0.3000 VOL/VOLSATURATED HYDRAULIC CONDUCTIVITY - 0.008500000462 CM/SEC
LAYER 2
- VERTICAL PERCOLATION1 LAYER ^THICKNESS « 60.00 INCHESPOROSITY » 0.4200 VOL/VOLFIELD CAPACITY - 0.3104 VOL/VOLWILTING POINT » 0.1875 VOL/VOLINITIAL SOIL WATER CONTENT^ » 0.3050 VOL/VOLSATURATED HYDRAULIC CONDUCTIVITY » 0.000064000000 CM/SEC
LAYER
VERTICAL PERCOLATION LAYERTHICKNESS - 84.00 INCHESPOROSITY - 0.3500 VOL/VOLFIELD CAPACITY - 0.3104 VOL/VOLWILTING POINT - 0.1875 VOL/.VOLINITIAL SOIL WATER CONTENT - 0.2620 VOL/VOLSATURATED HYDRAULIC CONDUCTIVITY - 0.000064000000 CM/SEC
LAYER 4

VERTICAL PERCOLATION LAYERTHICKNESS -r : * 156.00 INCHESPOROSITY * OV4200 VOL/VOLFIELD CAPACITY " 0.3418 VOL/VOLWILTING POINT * 0.2099 VOL/VOLINITIAL SOIL WATER CONTENT » ; 0.3380 VOL/VOLSATURATED HYDRAULIC CONDUCTIVITY « 0.000042000000 CM/SEC
GENERAL SIMULATION DATA
SCS RUNOFF CURVE NUMBER - ^^^J2*45^ „«TOTAL AREA OF:COVER . m. - 102000. SQ FT - . - -EVAPORATIVE ZONE DEPTH < . <. <'• - 30.00 INCHESPOTENTIAL RUNOFF FRACTION " » 0.900000UPPER LIMIT VEG. STORAGE : - 12.8040 INCHESINITIAL VEG. STORAGE » 9.0900 INCHESINITIAL SNOW WATER CONTENT » 0.0000 INCHESINITIAL TOTAL WATER STORAGE INSOIL AND WASTE LAYERS , » .96.6360 INCHES
: SOIL WATER CONTENT INITIALIZED BY USER.
CLIMATOLOGICAL DATA
SYNTHETIC RAINFALL WITH SYNTHETIC DAILY TEMPERATURES ANDSOLAR RADIATION FOR RICHMOND VIRGINIA
MAXIMUM LEAF AREA INDEX "" » 4.50START OF GROWING SEASON (JULIAN DATE) - 103END OF GROWING SEASON (JULIAN DATE) " - 303
NORMAL MEAN MONTHLY TEMPERATURES, DEGREES FAHRENHEIT
JAN/JUL FEB/AUG MAR/SEP APR/OCT MAY/NOV JUN/DEC/. • '• • "'• v % J. ? . ' *' '• ' *'
36.10 37.80 46.50 57.70 66.30 73,5077.30 76.20 . 69.90 .: ;59.50... 49.10 ,„ 38.40
AVERAGE MONTHLY VAtUES IN INCHES FOR YEARS 1 THROUGH 20
JAN/JUL FEB/AUG MAR/SEP APR/OCT MAY/NOV JUN/DECPRECIPITATION ' ""*""
TOTALS ' 3.37 3.10 ' 3.82 2.90 4.18 3.76,-v 4'92 4.46 4.01 4.79 3.37 3.71
STD. DEVIATIONS 1.57 1.60 2.02 ,1.48 2.20 1.82.2.51 2.09 1.84 3.82 1.58 2.21
RUNOFF
TOTALS , 0,000 0.000 0.0 0( 70 n n TT==== ~ > 000; ;•_-.- ,0.000 o.ooo o.oo< flnU00^ c-ooo

STD. DEVIATIONS 0.000 0.000 0.000 0.000 0.000 0.0000.000 0.000 0.000 0.000 0.000 0.000
EVAPOTRANSPIRATION
"TOTALS" 1.450 1.764 2.717 2.665 5.196 4.0004.490 4.195 3.062 2.273 1.678 1.370
STD. DEVIATIONS 0.212 0.319 0.640 0.807 0.979 1.5731.455 1.826 1.195 0.618 0.388 0.209
PERCOLATION FROM LAYER 4
TOTALS 0.9112 1.0217 1.2800 1.3038 1.2824 1.08950.9656 0.8335 0.7113 0.6654 0.7715 0.8409
STD. DEVIATIONS 0.6457 0.7652 0.8949 0.6835 0.5848 0.41650.3003 0.2129 0.1527 0.1455 0.8568 0.8868
AVERAGE ANNUAL TOTALS & (STD. DEVIATIONS) FOR YEARS 1 THROUGH 20 I
(INCHES) (CU. FT.) PERCENT .-1
PRECIPITATION 46.37 ( 8.031) 394111. 100.00 j
RUNOFF 0.000 ( 0.000) 0. 0.00 •• iEVAPOTRANSPIRATION 34.859 ( 3.586) 296305. 75.18
PERCOLATION FROM LAYER 4 11.6767 ( 4.8282) 99252. 25.18
CHANGE IN WATER STORAGE -0.170 ( 4.383) . -1446. -0.37
PEAK DAILY VALUES FOR YEARS 1 THROUGH 20
(INCHES) (CU. FT.)PRECIPITATION 4.48 38080.0RUNOFF 0.000 0.0PERCOLATION FROM LAYER 4 0.1775 1508.5
SNOW WATER 1.65 14025.0
MAXIMUM VEG. SOIL WATER (VOL/VOL) 0.3841
MINIMUM VEG. SOIL WATER (VOL/VOL) 0.1311***********************************************************************

******************************************************************* **-FINAL WATER STORAGE AT END OF YEAR 20 ^
-—————— ----- 7lNCHES)| iY Y l
;; "; :; ""I" 0.84 0.07022 18.18 0.3030
• • " • V , " / ,.'; V- 3 ..-•";.' ' ' . - "22^63'j-y_\ •' •" 0.2694;. , •" -". '.- •". -'
4 51.59 0.3307i •
,. . - : SNOW WATER 0.00 , .
***********************************************************************i *****WAiHHHHHHHk********************************************************

CP1GINAI
**********************************************************************************************************************************************
GREENWOOD CHEMICAL A@£A P * Dl7.i,*A T)CLEANUP GOAL SELECTION /j'\C/l - UX ICUf V9/3/91
GOOD GRASS
LAYER 1
VERTICAL PERCOLATION LAYERTHICKNESSPOROSITYFIELD CAPACITYWILTING POINTINITIAL SOIL WATER CONTENTSATURATED HYDRAULIC CONDUCTIVITY
84.00 INCHES0.3800 VOL/VOL0.3104 VOL/VOL0.1875 VOL/VOL0.2590 VOL/VOL0.000268799980 CM/SEC
LAYER 2
VERTICAL PERCOLATION LAYERTHICKNESS m 120.00 INCHESPOROSITY - 0.4300 VOL/VOL iFIELD CAPACITY - 0.3418 VOL/VOL ftWILTING POINT - 0.2099 VOL/VOL |INITIAL SOIL WATER CONTENT - 0.3310 VOL/VOL ~SATURATED HYDRAULIC CONDUCTIVITY » 0.000042000000 CM/SEC
GENERAL SIMULATION DATA
SCS RUNOFF CURVE NUMBER =• 81.59TOTAL AREA OF COVER - 32000. SQ FTEVAPORATIVE ZONE DEPTH * 30.00 INCHESPOTENTIAL RUNOFF FRACTION - 0.900000UPPER LIMIT VEG. STORAGE * 11.4000 INCHESINITIAL VEG. STORAGE * 7.7700 INCHESINITIAL SNOW WATER CONTENT » 0.0000 INCHESINITIAL TOTAL WATER STORAGE INSOIL AND WASTE LAYERS - 61.4760 INCHES
SOIL WATER CONTENT INITIALIZED BY USER. _—~~~1
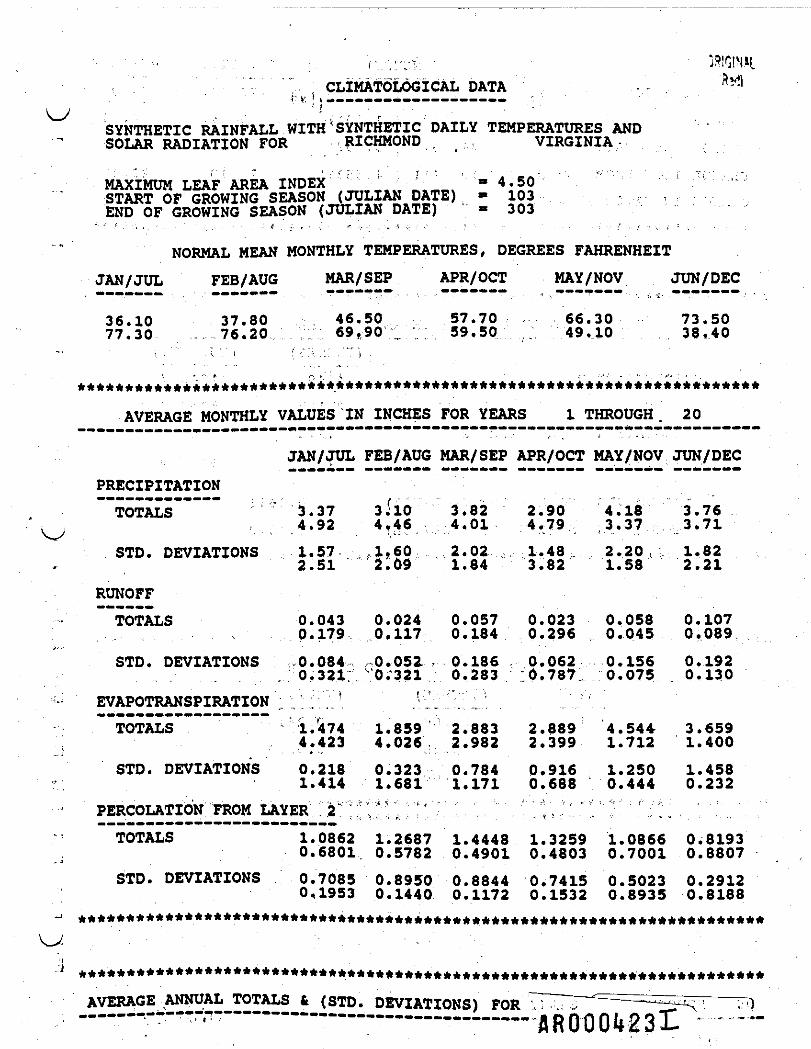
< - " CLIMATOiOGICAL DATA - -. ' ' r v; i s ———————————-———— -
.; .. , -{.^,:^ - ,- -- • - , -SYNTHETIC RAINFALL WITH'SYNTHETIC DAILY TEMPERATURES ANDSOLAR RADIATION FOR .RICHMOND VIRGINIA-
MAXIMUM LEAF AREA INDEX ' w\! '•'„,' " 4;52 "START OF GROWING SEASON (JULIAN DATE) » 103 . . . . . . . . .END OF GROWING SEASON (JULIAN DATE) » 303
NORMAL MEAN MONTHLY TEMPERATURES, DEGREES FAHRENHEIT
JAN/JUL FEB/AUG MAR/SEP APR/OCT MAY/NOV JUN/DEC
36.10 37.80 46.50 57.70 , 66.30 73.5077.30 .76.20 69*90", 59.50 .;. 49,10 38,40
***********************************************************************
AVERAGE MONTHLY VALUES'IN INCHES FOR YEARS 1 THROUGH. 20
JAN/JUL FEB/AUG MAR/SEP APR/OCT MAY/NOV JUN/DEC
PRECIPITATIONTOTALS " 3.37 3; 10 3.82 2.90 4.18 3.76
;, 4-92 4.46 4,01 4.79 3,37 3.71
STD. DEVIATIONS 1.57 1.60 2.02 ..-1.48. 2.20, 1.822.51 2.09 1.84 3.82 1.58 2.21
RUNOFFTOTALS 0.043 0.024 0.057 0.023 0.058 0.107
0.179 0,117 0,184 0.296 0.045 0.089
STD. DEVIATIONS .0.084 ,-0.051 , 0.186 0.062 0.156 0.192,0.321; 0.321 0.283 :0.787. 0.075 0.130
EVAPOTRANSPIRATION 1TOTALS 1.474 1.859 2.883 2.889 4.544 3.659
4.423 4.026 2.982 2.399 1.712 1.400STD. DEVIATIONS 0.218 0.323 0.784 0.916 1.250 1.458
1.414 1.681 1.171 0.688 0.444 0.232PERCOLATION; FROM 'TOTALS 1.0862 1.2687 1.4448 1.3259 1.0866 0.8193
0.6801 0.5782 0.4901 0.4803 0.7001 0.8807STD. DEVIATIONS 0.7085 0.8950 0.8844 0.7415 0.5023 0,2912
0,1953 0.1440 0.1172 0.1532 0.8935 0.8188***********************************************************************
AVERAGE ANNUAL TOTALS 6 (STD. DEVIATIONS) FOR

1 '"I (INCHES) (CU. FT.) PERCENT- ,ji ___«_«••___«»«_ »«___««•«• ««••••••»PRECIPITATION 46.37 ( 8.031) 123643. 100.00
RUNOFF . 1.220 ( 1.101) 3254. 2.63
EVAPOTRANSPIRATION 34.251 ( 3.457) 91337. 73.87
PERCOLATION FROM LAYER 2 10.8411 ( 4.5531). 28910. 23.38
CHANGE IN WATER STORAGE 0.054 ( 3.475) 143. 0.12
PEAK DAILY VALUES FOR YEARS 1 THROUGH 20
(INCHES) (CU. FT.)
PRECIPITATION 4.48 11946.7
RUNOFF 2.197 5857.8
PERCOLATION FROM LAYER 2 0.1737 463.3SNOW WATER 1.65 4400.0
MAXIMUM VEG. SOIL WATER (VOL/VOL) 0.3641
MINIMUM VEG. SOIL WATER (VOL/VOL) 0.1872
FINAL WATER STORAGE AT END OF YEAR 20• •••«••• •.«••••••«•• »«•«•»»«_*»•••« ••«•«••»•••«••••••«•
LAYER (INCHES) (VOL/VOL)
1 22.00 0.2619
- 2 40.55 0.3379
SNOW WATER ,0.00

OR!GINAi
8
WOODED AREAS
EXISTING BARBEDWIRE FENCE
WOODED AREAS
~~\
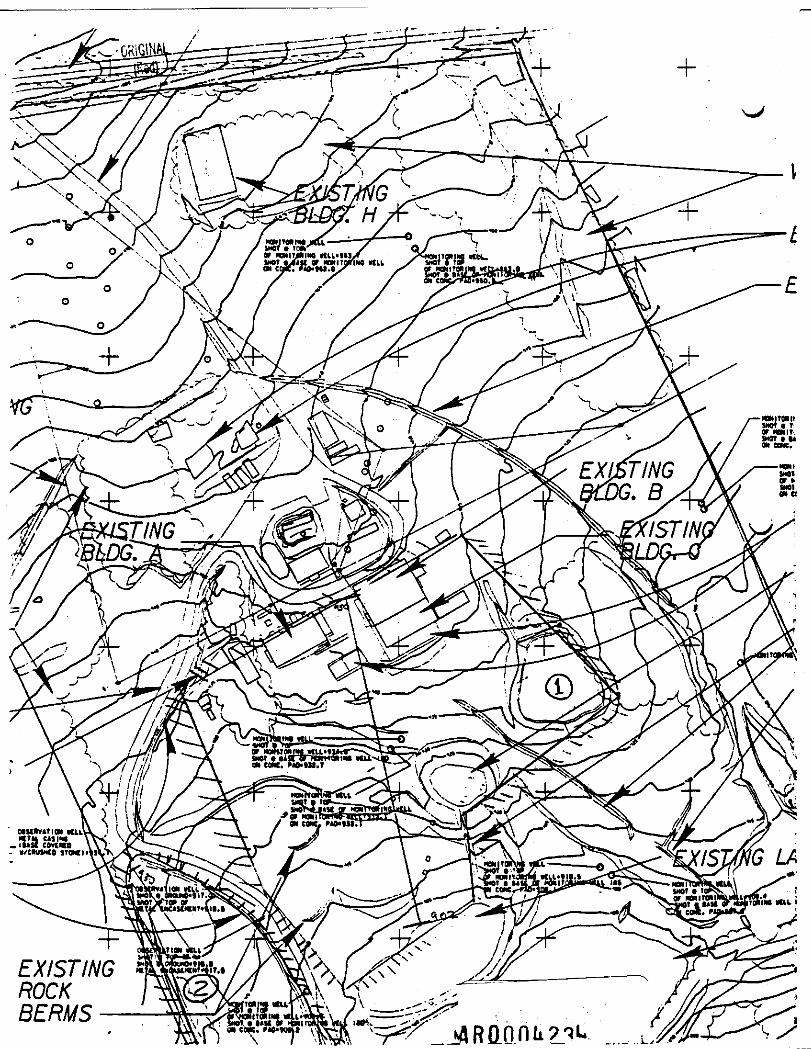
+
^•L
£
-NONITOMItSHOT • TOf NONIT.SHOT • UW COM.

„,, | Author's Draftj i Do Not Cite Without Permission
the program responds withTHERE ARE HO DEFAULT VALUES FOR
and asks question 3.4. In most cases, only the first four letters of thecity are needed; however, for San Diego and San Francisco, the entire cityname is needed. If the entire city name Is needed but not supplied, theprogram responds
PLEASE TYPE ENTIRE NAME OF CITY.
and returns to question 3.6.Once the city name has been entered correctly, control passes to
subroutine 7. TRHCF (question 7.1), where temperature, radiation andrainfall coefficients are read from a data file.
After reading.the coefficients, the program computes dally temperaturesand solar radiation values and stores them on a data file. If the locationwas not changed (a NO response to question 3.3), the program prints, forexample,
3.7 CURRENT MAXIMUM LEAF AREA INDEX IS 4.20.
DO YOU WANT TO SELECT A NEW MAXIMUM" LEAF AREA INDEX?ENTER YES OR NO.
The program skips this question if a nev location has been chosen. The useranswers YES to question 3.7 if it is desired to change the vegetative cover,and the program responds
3.8 ENTER THE MAXIMUM LEAF AREA INDEX.
TYPICAL VALUES ARE:0 FOR BARE GROUND,
1.0 FOR POOR CRASS,2.0 FOR FAIR GRASS,3.3 FOR GOOD GRASS, AND5.0 FOR EXCELLENT GRASS,
The value entered in question 3.8 is used in computing the daily leaf areaindices. If the user enters a value greater than the maximum LAI valuestored on the default data base, the program responds
LOCATION CANNOT SUPPORT THIS LEAF AREA INDEX UNLESS IRRIGATEDDUE TO LOW RAINFALL AND SHORT GROWING SEASON.
TYPICAL MAXIMUM FOR TULSA OKLAHOMA ' IS 2.50.
3.9 DO YOU WANT TO SELECT A DIFFERENT LEAF AREA INDEX?ENTER YES OR HO.
28 "fl R 000 k Z k