farther and faster - cebu holdings
TRANSCRIPT

F A R T H E R A N D F A S T E R
Cebu Holdings, Inc. • 2017 Integrated Report
FA
RT
HE
R A
ND
FA
ST
ER
CK M Y RED 80K 40K K C 80C 40CM CY K C40M K M Y 80Y 40Y PaperM Y BLUE 80MGREEN CK M Y RED 80K 40K K C 80C 40CM CY K C40M K M Y 80Y 40Y PaperM Y BLUE 80MGREEN CK M Y RED 80K 40K K C 80C 40CM CY K C40M K M Y 80Y 40Y PaperM Y BLUE 80MGREEN CK M Y RED 80K 40K K C M Y GREEN


FARTHER AND FASTER 1
C E B U H O L D I N G S I S M O V I N G F A R T H E R A N D F A S T E R
Farther and Faster reflects the spirit of collaboration that propels the work of Cebu Holdings to expand to emerging
economic centers at a pace like never before.
2017 INTEGRATED REPORT
KEY FEATURES AND SCOPE 102-12, 102-45, 102-50, 102-52, 102-54
» 11th combined report and 1st Integrated Report covering our performance on the financial, corporate governance, economic, social, and environment aspects
» Insights into our programs and initiatives that contribute to the 17 United Nations (UN) Sustainable Development Goals and the Four Focus Areas of our parent company, Ayala Land
» This Report is prepared in accordance with GRI Standards and ASEAN Corporate Governance Scorecard (ACGS) – see pages 138-139 for the ACGS Index.
» Presents consolidated data from fiscal year January 1 to December 31, 2017 coming from our internal business units and those of our general contractors for property management (Ayala Property Management Corporation) and construction (Makati Development Corporation)
» Where possible, this report provides three years of historical information so that there is sufficient basis for comparison.
ADDITIONAL REFERENCE 102-55
The company’s operational and financial performance filed with the Securities and Exchange Commission
(SEC) is reflected in the Information Statement sent to stockholders and is available at our corporate website, viawww.cebuholdings.com.
As in our past five reports, this report has successfully completed the GRIMateriality Disclosures Service which verifies that GRI 102: General Standard Disclosures 2016 102-40 to 102-49 were correctly located in both the GRI Content Index (see pages 132-137) and in the pages of this report.
FEEDBACK 102-53
Feedback and comments about our report can be emailed [email protected].
Cebu Holdings, Inc. 2017 Integrated Report2
ABOUT THIS REPORTOur pursuit to operate as a sustainable company guides us to move farther, reaching more people and becoming more inclusive than ever. This year, we reaffirm our commitment to delivering shared value among our stakeholders by publishing a report that follows both Integrated Reporting
<IR> Framework and the Global Reporting Initiative (GRI) Standards. Our newly-adopted integrated thinking to reporting gives us a broader perspective on the capitals that we utilize, our key activities and outputs, the value we deliver, and the outcomes and impacts that we have on the environment and
society. We address current and future risks to our organization, recognize the industry’s outlook and growth opportunities, and align our corporate and managerial strategies to gain more stability and increase our significant contribution to sustainable development.
FARTHER AND FASTER 3
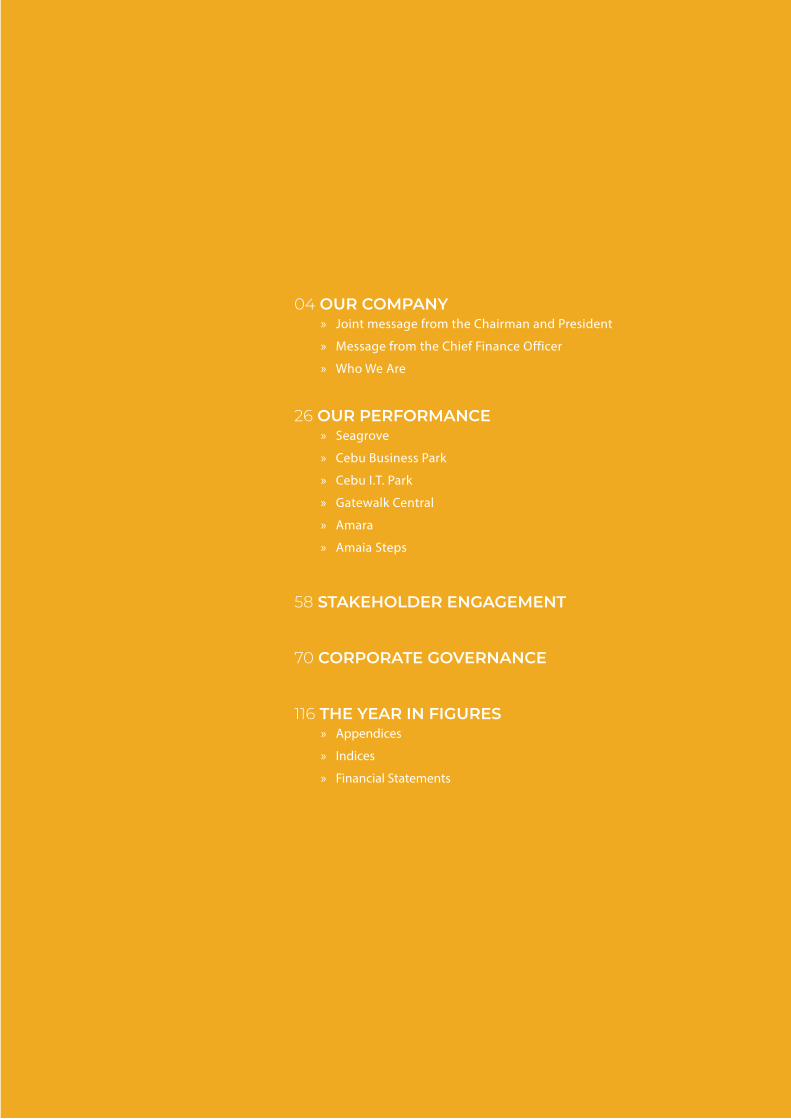
04 OUR COMPANY » Joint message from the Chairman and President
» Message from the Chief Finance Officer
» Who We Are
26 OUR PERFORMANCE » Seagrove
» Cebu Business Park
» Cebu I.T. Park
» Gatewalk Central
» Amara
» Amaia Steps
»
»
»
»
»
58 STAKEHOLDER ENGAGEMENT
70 CORPORATE GOVERNANCE
116 THE YEAR IN FIGURES » Appendices
» Indices
» Financial Statements
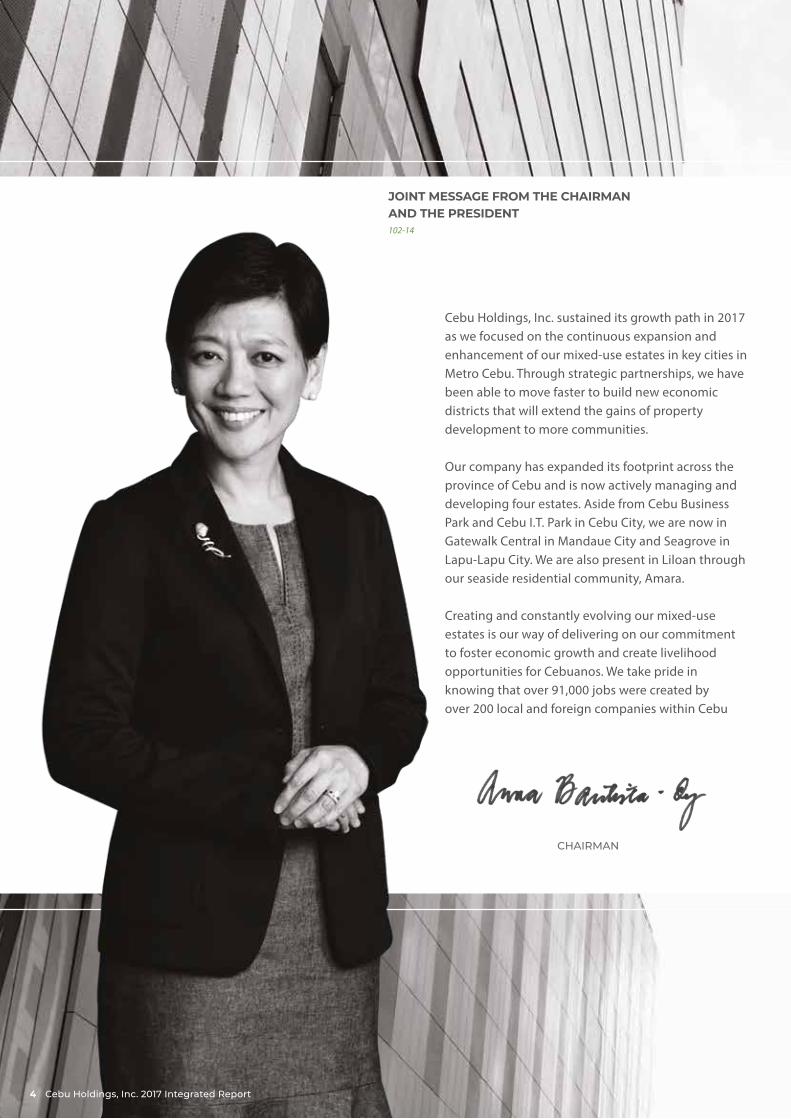
JOINT MESSAGE FROM THE CHAIRMANAND THE PRESIDENT102-14
Cebu Holdings, Inc. sustained its growth path in 2017 as we focused on the continuous expansion and enhancement of our mixed-use estates in key cities in Metro Cebu. Through strategic partnerships, we have been able to move faster to build new economic districts that will extend the gains of property development to more communities.
Our company has expanded its footprint across the province of Cebu and is now actively managing and developing four estates. Aside from Cebu Business Park and Cebu I.T. Park in Cebu City, we are now in Gatewalk Central in Mandaue City and Seagrove in Lapu-Lapu City. We are also present in Liloan through our seaside residential community, Amara.
Creating and constantly evolving our mixed-use estates is our way of delivering on our commitment to foster economic growth and create livelihood opportunities for Cebuanos. We take pride in knowing that over 91,000 jobs were created by over 200 local and foreign companies within Cebu
Cebu Holdings, Inc. 2017 Integrated Report4
ANNA MA. MARGARITA B. DY CHAIRMAN
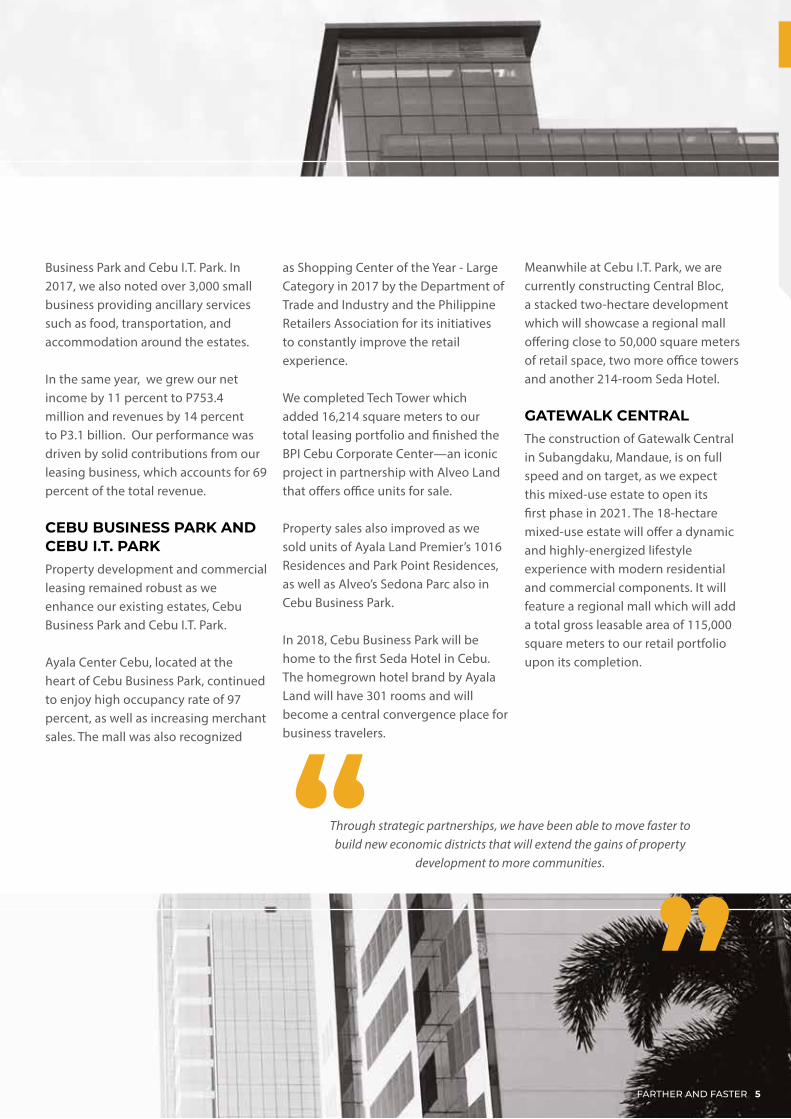
Through strategic partnerships, we have been able to move faster to build new economic districts that will extend the gains of property
development to more communities.“ “Business Park and Cebu I.T. Park. In 2017, we also noted over 3,000 small business providing ancillary services such as food, transportation, and accommodation around the estates.
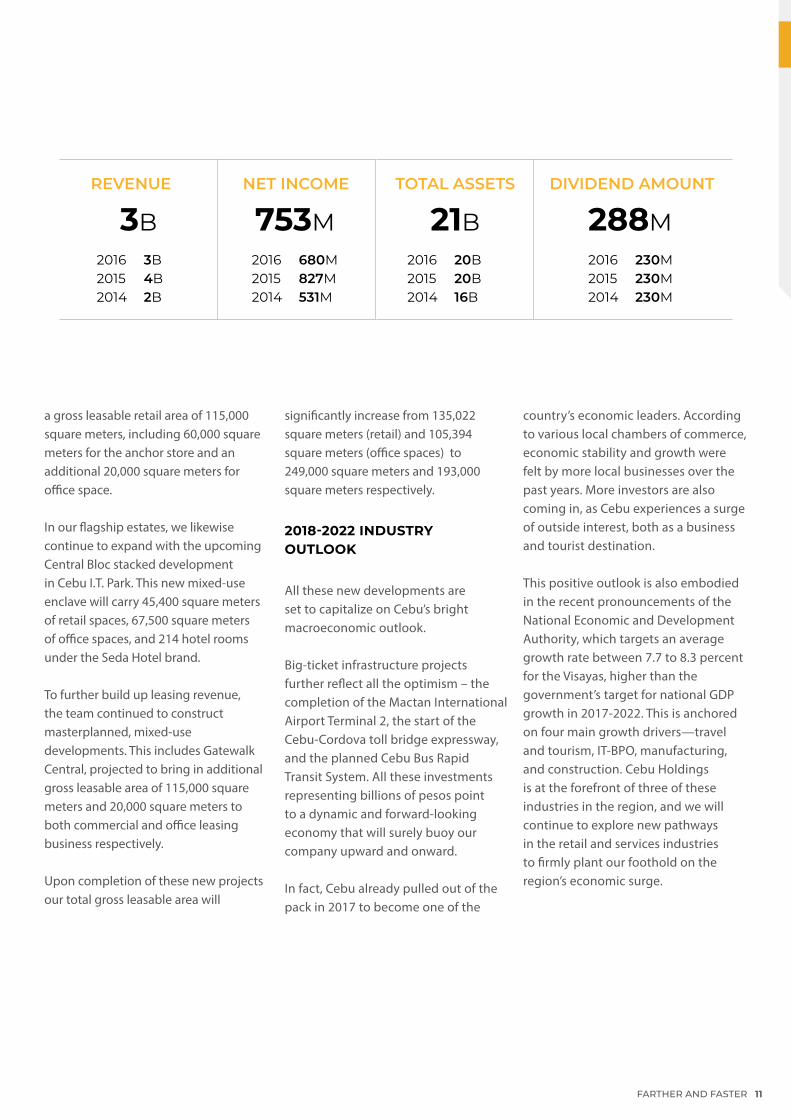
In the same year, we grew our net income by 11 percent to P753.4 million and revenues by 14 percent to P3.1 billion. Our performance was driven by solid contributions from our leasing business, which accounts for 69 percent of the total revenue.
CEBU BUSINESS PARK AND CEBU I.T. PARKProperty development and commercial leasing remained robust as we enhance our existing estates, Cebu Business Park and Cebu I.T. Park.
Ayala Center Cebu, located at the heart of Cebu Business Park, continued to enjoy high occupancy rate of 97 percent, as well as increasing merchant sales. The mall was also recognized
as Shopping Center of the Year - Large Category in 2017 by the Department of Trade and Industry and the Philippine Retailers Association for its initiatives to constantly improve the retail experience.
We completed Tech Tower which added 16,214 square meters to our total leasing portfolio and finished the BPI Cebu Corporate Center—an iconic project in partnership with Alveo Land that offers office units for sale.
Property sales also improved as we sold units of Ayala Land Premier’s 1016 Residences and Park Point Residences, as well as Alveo’s Sedona Parc also in Cebu Business Park.
In 2018, Cebu Business Park will be home to the first Seda Hotel in Cebu. The homegrown hotel brand by Ayala Land will have 301 rooms and will become a central convergence place for business travelers.
Meanwhile at Cebu I.T. Park, we are currently constructing Central Bloc, a stacked two-hectare development which will showcase a regional mall offering close to 50,000 square meters of retail space, two more office towers and another 214-room Seda Hotel.
GATEWALK CENTRALThe construction of Gatewalk Central in Subangdaku, Mandaue, is on full speed and on target, as we expect this mixed-use estate to open its first phase in 2021. The 18-hectare mixed-use estate will offer a dynamic and highly-energized lifestyle experience with modern residential and commercial components. It will feature a regional mall which will add a total gross leasable area of 115,000 square meters to our retail portfolio upon its completion.
FARTHER AND FASTER 5
As a result of meaningful collaborations, CHI has lived up to its promise as a catalyst for progress in the Visayas, driven mainly
by local talent. Through our mixed-use estates, we concretize our commitment to nation-building and sustainable development.“ “
SEAGROVEThe year 2017 was highlighted by the launch of our newest mixed-use estate in Punta Engaño, Lapu-Lapu City. Located near Cebu’s airport and seaports, the 14-hectare Seagrove is expected to become an exciting bayside, eco-fun destination, adding a new dimension to the leisure and tourism industry in Cebu.
Its initial phase includes the development of the first Holiday Inn Resort in the Philippines, as well as a boardwalk promenade with retail and entertainment concepts. We will be pouring in about P4 billion in investment for land cost and development, as well as the hotel and retail components during this period.
SUSTAINABILITY AND INNOVATIONAs we accomplish our goals as a company, it is important that the values of innovation and sustainability are well-established in our operations.
Our mixed-use estates strive to become models for sustainable development and introduce
innovations in line with the four focus areas of Ayala Land, namely Site Resilience, Pedestrian Mobility and Transit Connectivity, Eco-efficiency and Local Economic Development.
We plan and design our developments to make it more resilient to changes in the environment by creating a healthy balance of green open spaces and built-up areas.
As we prepare for our bayside development, Seagrove, in Lapu-Lapu, we initiated environment protection activities such as coastal cleanups with employees and coral reef studies to determine possible areas for nursery and rehabilitation sites in the area. We likewise collected wildings and seedlings of existing native and endemic beach forest tree species which we will propagate and use for future landscaping requirements.
We also introduced innovations that push for pedestrian mobility and transit connectivity, such as the completion of new bus stops within Cebu Business Park and Cebu I.T. Park, serving passengers of a scheduled bus service that travels to Northern and Southern Cebu.
In the management of our estates, we constantly strive for efficient resource use and effective waste management. In 2017, we invested in various improvements including a new wastewater treatment facility to serve the growing community in Cebu I.T. Park. Our efforts in line with sustainability were featured in a publication of the United Nations Development Programme and the Philippine Business for the Environment. The book called Transformational Business cites Cebu Business Park as the top example of how large-scale infrastructure in provincial capitals can bring inclusive economic growth while driving business forward. According to the book, “CHI has poured in over P55 billion in land and infrastructure investments to grow and expand Cebu Business Park and Cebu I.T. Park—now two of the leading economic hubs in the south.” It also cites our shared-value program, Agbayay para sa Kalikupan, as a “sustainable solid waste management model that bridges waste management with entrepreneurship, and CSR with inclusive development.”
Cebu Holdings, Inc. 2017 Integrated Report6
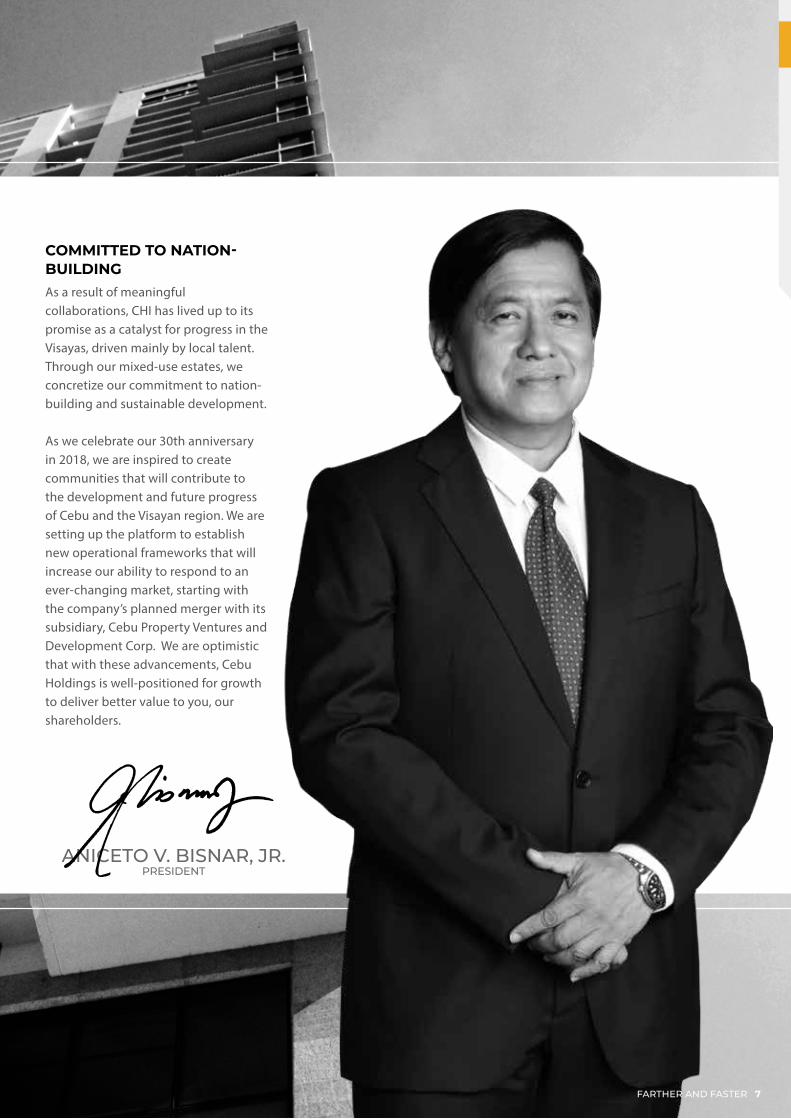
ANICETO V. BISNAR, JR. PRESIDENT
COMMITTED TO NATION-BUILDINGAs a result of meaningful collaborations, CHI has lived up to its promise as a catalyst for progress in the Visayas, driven mainly by local talent. Through our mixed-use estates, we concretize our commitment to nation-building and sustainable development.
As we celebrate our 30th anniversary in 2018, we are inspired to create communities that will contribute to the development and future progress of Cebu and the Visayan region. We are setting up the platform to establish new operational frameworks that will increase our ability to respond to an ever-changing market, starting with the company’s planned merger with its subsidiary, Cebu Property Ventures and Development Corp. We are optimistic that with these advancements, Cebu Holdings is well-positioned for growth to deliver better value to you, our shareholders.
7FARTHER AND FASTER

The prudent use of resources. Tight internal controls. A sharp long-term vision guided by adherence to the highest governance standards.
These were the touchstones of Cebu Holdings’ 2017 fiscal and growth strategies, resulting in an outstanding year of financial growth for our company.
MESSAGE FROM THE
CHIEF FINANCE OFFICER
MA. LUISA D. CHIONG CHIEF FINANCE OFFICER
KEY FIGURES
Nearly 30 years of experience and a strong foundation served our company well as we hit a net income growth of 11 percent—from P679.7 million in 2016 to P753.4 million in 2017. This success was driven mainly by our leasing business, the sale of residential lots in Amara, the sale of developmental rights, savings in operating expenses, and lower interest expenses through wise resource management.
Cebu Holdings, Inc. 2017 Integrated Report8
Our total revenues reached P3.1 billion, higher than last year’s P2.7 billion by 15 percent. This total is comprised of commercial and office space leasing (69%), sale of residential condominiums and lots (11%), sale of development rights and other income (15%), and theater income (5%).
A total of P2.1 billion was spent for the development of projects, land acquisition, improvements and priming of our current estates (Cebu Business Park and Cebu I.T. Park) and investment in an affiliate. Meanwhile, dividends to our stockholders significantly increased, from P230 million or P0.12 per share in 2016, to P288 million or P0.15 per share for this reporting year. By managing our talent and resources wisely, we were also able to standardize processes, integrate front and back offices, and eliminate silos. All these enabled us to respond faster to customer demands and changing market forces.
GROWTH SEGMENTS
Our leasing business—office spaces and merchant space rentals—continues to lead the pack among our income streams. It now accounts for 69 percent of our total revenue this year. The main drivers for this high figure are the higher occupancy rate and higher sales from various merchants of Ayala Center Cebu and The Walk. Our average occupancy rate for our office leasing, meanwhile, is at 86 percent (lease out rate at 100%), while Ayala Center Cebu is at 97 percent.
Our investments on the residential front, meanwhile, enable us to extend our geographic reach outside Cebu and increase our income sources.
Through Amaia Southern Properties, Inc. we now have projects in Bacolod. Our income from this stream picked up speed, with the sales at Amara’s
last phase by the end of the year. Sales from our other residential segments, such as the condominium units at 1016 Residences, Park Point Residences, and Sedona Parc also continued on a steady pace by year end.
SOLID GROWTH AND EXPANSION
To further build up leasing revenues in the years ahead, CHI continued to construct major flagship, mixed-use estates. These are Gatewalk Central in Mandaue and Seagrove in Lapu-Lapu, Mactan.
Seagrove is a 13.6-hectare mixed-use eco-fun destination anchored on a boardwalk concept with a network of central pools and a Holiday Inn Resort. Gatewalk Central, on the other hand, has been on steady development over the past years and is expected to have
9FARTHER AND FASTER
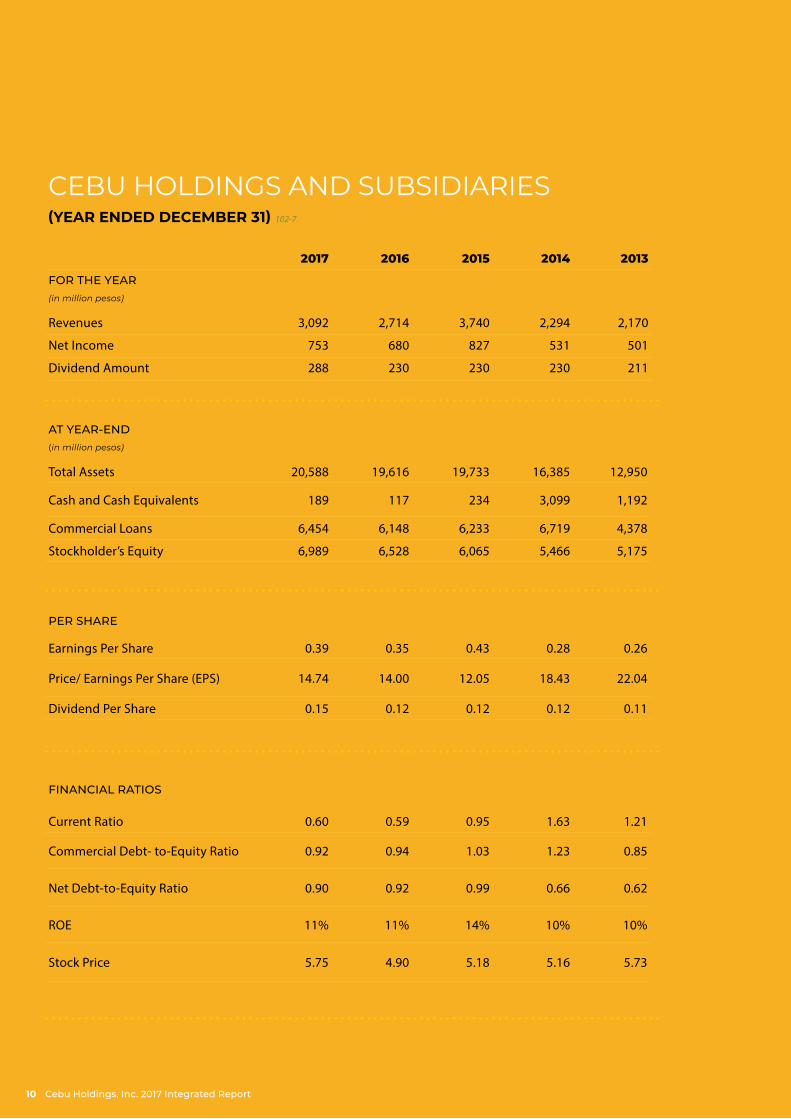
FINANCIAL RATIOS
Current Ratio 0.60 0.59 0.95 1.63 1.21
Commercial Debt- to-Equity Ratio 0.92 0.94 1.03 1.23 0.85
Net Debt-to-Equity Ratio 0.90 0.92 0.99 0.66 0.62
ROE 11% 11% 14% 10% 10%
Stock Price 5.75 4.90 5.18 5.16 5.73
2017 2016 2015 2014 2013
FOR THE YEAR(in million pesos)
Revenues 3,092 2,714 3,740 2,294 2,170
Net Income 753 680 827 531 501
Dividend Amount 288 230 230 230 211
PER SHARE
Earnings Per Share 0.39 0.35 0.43 0.28 0.26
Price/ Earnings Per Share (EPS) 14.74 14.00 12.05 18.43 22.04
Dividend Per Share 0.15 0.12 0.12 0.12 0.11
AT YEAR-END(in million pesos)
Total Assets 20,588 19,616 19,733 16,385 12,950
Cash and Cash Equivalents 189 117 234 3,099 1,192
Commercial Loans 6,454 6,148 6,233 6,719 4,378
Stockholder’s Equity 6,989 6,528 6,065 5,466 5,175
CEBU HOLDINGS AND SUBSIDIARIES (YEAR ENDED DECEMBER 31) 102-7
Cebu Holdings, Inc. 2017 Integrated Report10
a gross leasable retail area of 115,000 square meters, including 60,000 square meters for the anchor store and an additional 20,000 square meters for office space.
In our flagship estates, we likewise continue to expand with the upcoming Central Bloc stacked development in Cebu I.T. Park. This new mixed-use enclave will carry 45,400 square meters of retail spaces, 67,500 square meters of office spaces, and 214 hotel rooms under the Seda Hotel brand.
To further build up leasing revenue, the team continued to construct masterplanned, mixed-use developments. This includes Gatewalk Central, projected to bring in additional gross leasable area of 115,000 square meters and 20,000 square meters to both commercial and office leasing business respectively.
Upon completion of these new projects our total gross leasable area will
significantly increase from 135,022 square meters (retail) and 105,394 square meters (office spaces) to 249,000 square meters and 193,000 square meters respectively.
2018-2022 INDUSTRY OUTLOOK
All these new developments are set to capitalize on Cebu’s bright macroeconomic outlook.
Big-ticket infrastructure projects further reflect all the optimism – the completion of the Mactan International Airport Terminal 2, the start of the Cebu-Cordova toll bridge expressway, and the planned Cebu Bus Rapid Transit System. All these investments representing billions of pesos point to a dynamic and forward-looking economy that will surely buoy our company upward and onward.
In fact, Cebu already pulled out of the pack in 2017 to become one of the
country’s economic leaders. According to various local chambers of commerce, economic stability and growth were felt by more local businesses over the past years. More investors are also coming in, as Cebu experiences a surge of outside interest, both as a business and tourist destination.
This positive outlook is also embodied in the recent pronouncements of the National Economic and Development Authority, which targets an average growth rate between 7.7 to 8.3 percent for the Visayas, higher than the government’s target for national GDP growth in 2017-2022. This is anchored on four main growth drivers—travel and tourism, IT-BPO, manufacturing, and construction. Cebu Holdings is at the forefront of three of these industries in the region, and we will continue to explore new pathways in the retail and services industries to firmly plant our foothold on the region’s economic surge.
REVENUE
3B3B4B2B
201620152014
DIVIDEND AMOUNT
288M230M230M230M
201620152014
NET INCOME
753M680M827M531M
201620152014
TOTAL ASSETS
21B20B20B16B
201620152014
FARTHER AND FASTER 11

SUSTAINABILITY AS AN ECONOMIC DRIVER
While our outlook continues to be optimistic, we cannot sustain economic growth for our companies if we do not step back now to look at development comprehensively.
Proper urban planning, sustainable transport, solid waste and wastewater management, and coastal habitat and biodiversity protection – these are the critical sustainability areas that CHI is investing on more significantly today to prepare us for the challenges of the future.
Our new estates—Seagrove and Gatewalk Central—are now being built around high standards of sustainable development. Our flagship estates at Cebu Business Park and Cebu I.T. Park also continue to invest heavily on the latest technology, such as our sequencing batch reactor to treat wastewater—another model of wastewater management and an environmental milestone for Cebu.
In terms of corporate governance, we have also revised our charters to bring our standards at par with ASEAN standards. We likewise institutionalized changes in accord with the new Securities and Exchange Commision code.
BUILDING ON PAST GAINS
This is my first year to take on the role of CFO for CHI and I am heartened to report that we have the challenging but inspiring task of managing a company that has been built on strong ideals and principles.
For nearly 30 years, Cebu Holdings has been a solid partner of Cebu in growing our economy and creating more jobs and opportunities for our people. We have been able to constantly generate income for many stakeholders, supported the growth of many local businesses, and enriched the value of land. But what matters most is what we do next.
The bigger challenge today for our teams is how to continue innovating while building on past gains and foreseeing any disruptive changes that may affect our sustainability and viability. We are confident that with the able support of our employees and stakeholders, we will be able to reach greater heights in the years ahead.
For nearly 30 years, Cebu Holdings has been a solid partner of Cebu in growing our economy and creating more jobs
and opportunities for our people. “ “
Cebu Holdings, Inc. 2017 Integrated Report12
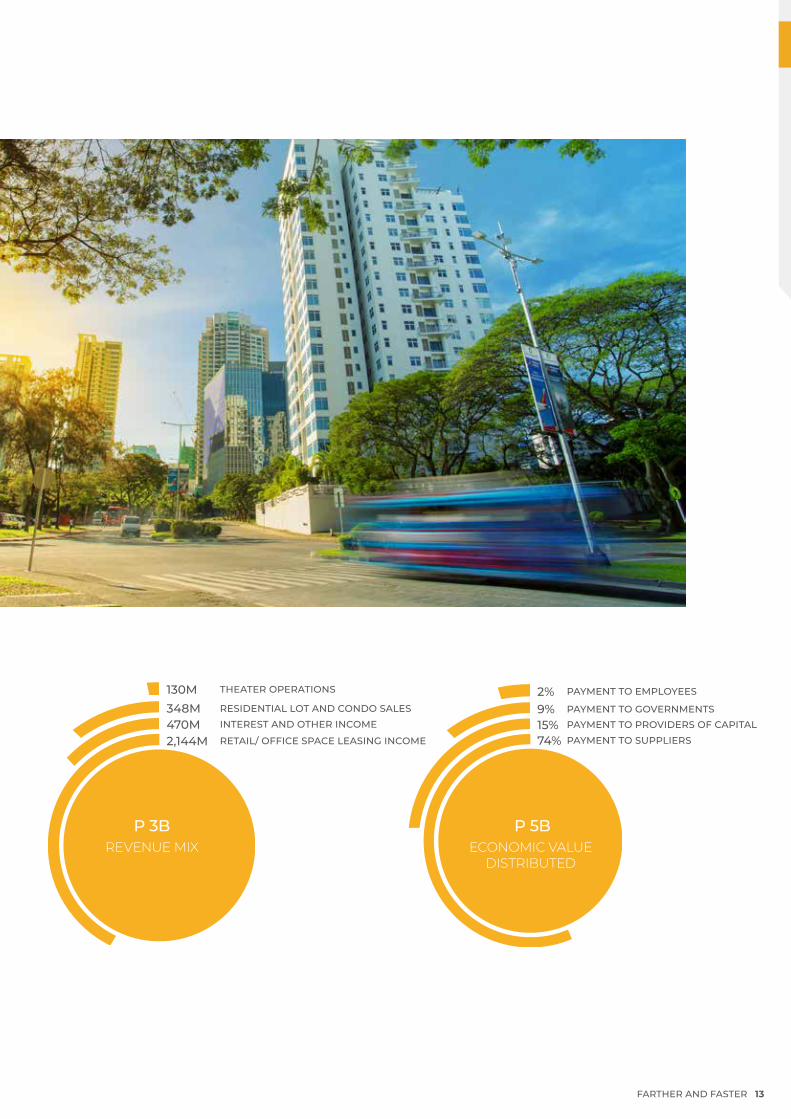
P 5BECONOMIC VALUE
DISTRIBUTED
74%15%9%2%
PAYMENT TO SUPPLIERS
PAYMENT TO GOVERNMENTSPAYMENT TO PROVIDERS OF CAPITAL
PAYMENT TO EMPLOYEES
2,144M470M348M130M
RETAIL/ OFFICE SPACE LEASING INCOME
RESIDENTIAL LOT AND CONDO SALESINTEREST AND OTHER INCOME
THEATER OPERATIONS
P 3BREVENUE MIX
FARTHER AND FASTER 13

WHO WE ARECebu Holdings, Inc. (CHI) is a listed company with the Philippine Stock Exchange (PSE) since 1994. CHI is compliant with all the rules and regulations of the PSE and the Securities and Exchange Commission (SEC), and to applicable rules and regulations relating to the development of the Philippine capital market.
VISION AND MISSION STATEMENT 102-16
We shall be the premier real estate company in the region, creating and enhancing integrated, masterplanned, and sustainable mixed-use developments through a customer-focused and empowered team of professionals.
We ensure the trust and confidence of our stakeholders with sustainable growth while improving the quality of life of the communities we serve with passion and integrity.
CORE VALUES 102-16
» Focus on Customer
» Bias for Results
» Entrepreneurial Drive
» Teamwork
» Concern for People
» Empowerment of People
» Pursuit of Excellence
» Love of God
» Responsibility to the Community
» Enhancement of Quality of Life
102-1
Cebu Holdings, Inc. 2017 Integrated Report14
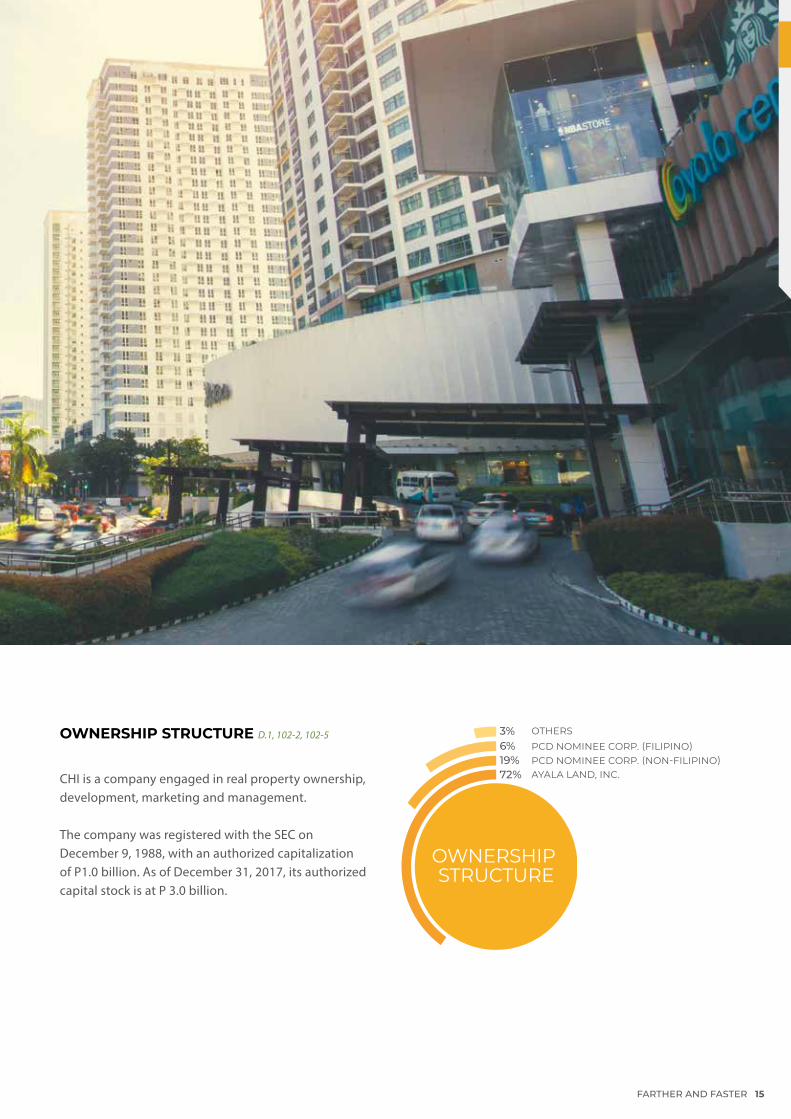
OWNERSHIP STRUCTURE D.1, 102-2, 102-5
CHI is a company engaged in real property ownership, development, marketing and management.
The company was registered with the SEC on December 9, 1988, with an authorized capitalization of P1.0 billion. As of December 31, 2017, its authorized capital stock is at P 3.0 billion.
OWNERSHIP STRUCTURE
3% 6%19%72% AYALA LAND, INC.
PCD NOMINEE CORP. (FILIPINO)PCD NOMINEE CORP. (NON-FILIPINO)
OTHERS
FARTHER AND FASTER 15
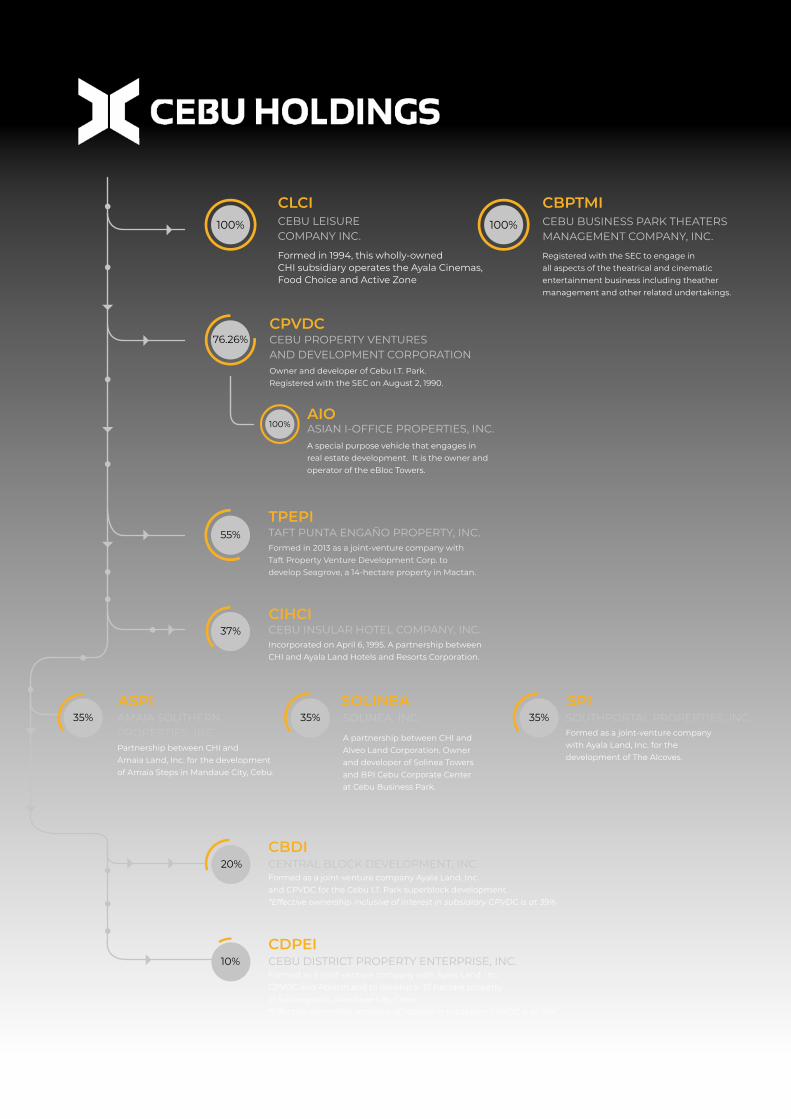
76.26%CPVDCCEBU PROPERTY VENTURES AND DEVELOPMENT CORPORATIONOwner and developer of Cebu I.T. Park. Registered with the SEC on August 2, 1990.
55%TPEPITAFT PUNTA ENGAÑO PROPERTY, INC.Formed in 2013 as a joint-venture company withTaft Property Venture Development Corp. to develop Seagrove, a 14-hectare property in Mactan.
37%CIHCICEBU INSULAR HOTEL COMPANY, INC.Incorporated on April 6, 1995. A partnership between CHI and Ayala Land Hotels and Resorts Corporation.
20%CBDICENTRAL BLOCK DEVELOPMENT, INC.Formed as a joint-venture company Ayala Land, Inc. and CPVDC for the Cebu I.T. Park superblock development*Effective ownership inclusive of interest in subsidiary CPVDC is at 39%
10%CDPEICEBU DISTRICT PROPERTY ENTERPRISE, INC.Formed as a joint-venture company with Ayala Land, Inc. CPVDC and AboitizLand to develop a 17-hectare property in Subangdaku, Mandaue City, Cebu*Effective ownership, inclusive of interest in subsidiary CPVDC is at 14%
35%ASPIAMAIA SOUTHERNPROPERTIES, INC.Partnership between CHI and Amaia Land, Inc. for the development of Amaia Steps in Mandaue City, Cebu.
CEBU LEISURE COMPANY INC.
CLCI
Formed in 1994, this wholly-owned CHI subsidiary operates the Ayala Cinemas, Food Choice and Active Zone
100%
AIOASIAN I-OFFICE PROPERTIES, INC.A special purpose vehicle that engages in real estate development. It is the owner andoperator of the eBloc Towers.
100%
SOLINEASOLINEA, INC.
A partnership between CHI andAlveo Land Corporation. Ownerand developer of Solinea Towersand BPI Cebu Corporate Centerat Cebu Business Park.
35%SPISOUTHPORTAL PROPERTIES, INC.Formed as a joint-venture companywith Ayala Land, Inc. for the development of The Alcoves.
35%
100%
CBPTMICEBU BUSINESS PARK THEATERS MANAGEMENT COMPANY, INC.
Registered with the SEC to engage in all aspects of the theatrical and cinematicentertainment business including theather management and other related undertakings.
Cebu Holdings, Inc. 2017 Integrated Report16
76.26%CPVDCCEBU PROPERTY VENTURES AND DEVELOPMENT CORPORATIONOwner and developer of Cebu I.T. Park. Registered with the SEC on August 2, 1990.
55%TPEPITAFT PUNTA ENGAÑO PROPERTY, INC.Formed in 2013 as a joint-venture company withTaft Property Venture Development Corp. to develop Seagrove, a 14-hectare property in Mactan.
37%CIHCICEBU INSULAR HOTEL COMPANY, INC.Incorporated on April 6, 1995. A partnership between CHI and Ayala Land Hotels and Resorts Corporation.
20%CBDICENTRAL BLOCK DEVELOPMENT, INC.Formed as a joint-venture company Ayala Land, Inc. and CPVDC for the Cebu I.T. Park superblock development*Effective ownership inclusive of interest in subsidiary CPVDC is at 39%
10%CDPEICEBU DISTRICT PROPERTY ENTERPRISE, INC.Formed as a joint-venture company with Ayala Land, Inc. CPVDC and AboitizLand to develop a 17-hectare property in Subangdaku, Mandaue City, Cebu*Effective ownership, inclusive of interest in subsidiary CPVDC is at 14%
35%ASPIAMAIA SOUTHERNPROPERTIES, INC.Partnership between CHI and Amaia Land, Inc. for the development of Amaia Steps in Mandaue City, Cebu.
CEBU LEISURE COMPANY INC.
CLCI
Formed in 1994, this wholly-owned CHI subsidiary operates the Ayala Cinemas, Food Choice and Active Zone
100%
AIOASIAN I-OFFICE PROPERTIES, INC.A special purpose vehicle that engages in real estate development. It is the owner andoperator of the eBloc Towers.
100%
SOLINEASOLINEA, INC.
A partnership between CHI andAlveo Land Corporation. Ownerand developer of Solinea Towersand BPI Cebu Corporate Centerat Cebu Business Park.
35%SPISOUTHPORTAL PROPERTIES, INC.Formed as a joint-venture companywith Ayala Land, Inc. for the development of The Alcoves.
35%
100%
CBPTMICEBU BUSINESS PARK THEATERS MANAGEMENT COMPANY, INC.
Registered with the SEC to engage in all aspects of the theatrical and cinematicentertainment business including theather management and other related undertakings.
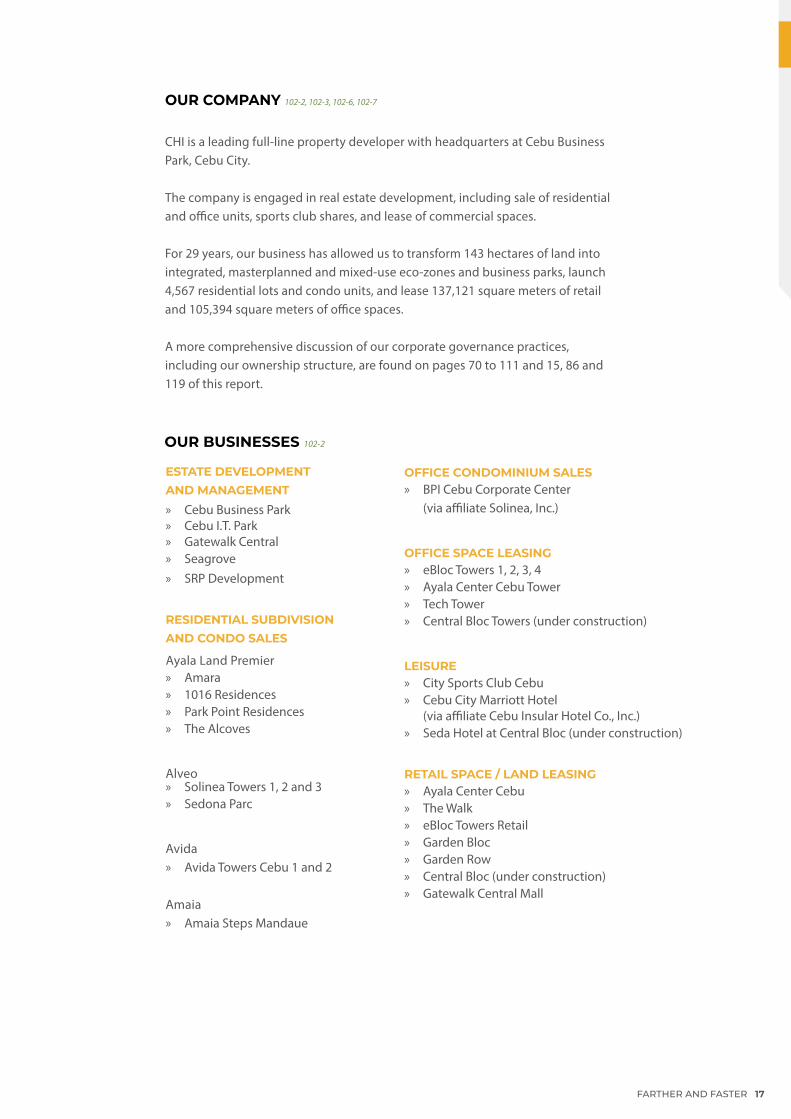
ESTATE DEVELOPMENT AND MANAGEMENT » Cebu Business Park » Cebu I.T. Park » Gatewalk Central » Seagrove » SRP Development
RESIDENTIAL SUBDIVISION AND CONDO SALES
Ayala Land Premier » Amara » 1016 Residences » Park Point Residences » The Alcoves
Alveo » Solinea Towers 1, 2 and 3 » Sedona Parc
Avida » Avida Towers Cebu 1 and 2
Amaia » Amaia Steps Mandaue
OFFICE CONDOMINIUM SALES » BPI Cebu Corporate Center
(via affiliate Solinea, Inc.)
OFFICE SPACE LEASING » eBloc Towers 1, 2, 3, 4 » Ayala Center Cebu Tower » Tech Tower » Central Bloc Towers (under construction)
LEISURE » City Sports Club Cebu » Cebu City Marriott Hotel
(via affiliate Cebu Insular Hotel Co., Inc.) » Seda Hotel at Central Bloc (under construction)
RETAIL SPACE / LAND LEASING » Ayala Center Cebu » The Walk » eBloc Towers Retail » Garden Bloc » Garden Row » Central Bloc (under construction) » Gatewalk Central Mall
OUR BUSINESSES 102-2
OUR COMPANY 102-2, 102-3, 102-6, 102-7
CHI is a leading full-line property developer with headquarters at Cebu Business Park, Cebu City.
The company is engaged in real estate development, including sale of residential and office units, sports club shares, and lease of commercial spaces.
For 29 years, our business has allowed us to transform 143 hectares of land into integrated, masterplanned and mixed-use eco-zones and business parks, launch 4,567 residential lots and condo units, and lease 137,121 square meters of retail and 105,394 square meters of office spaces.
A more comprehensive discussion of our corporate governance practices, including our ownership structure, are found on pages 70 to 111 and 15, 86 and 119 of this report.
FARTHER AND FASTER 17
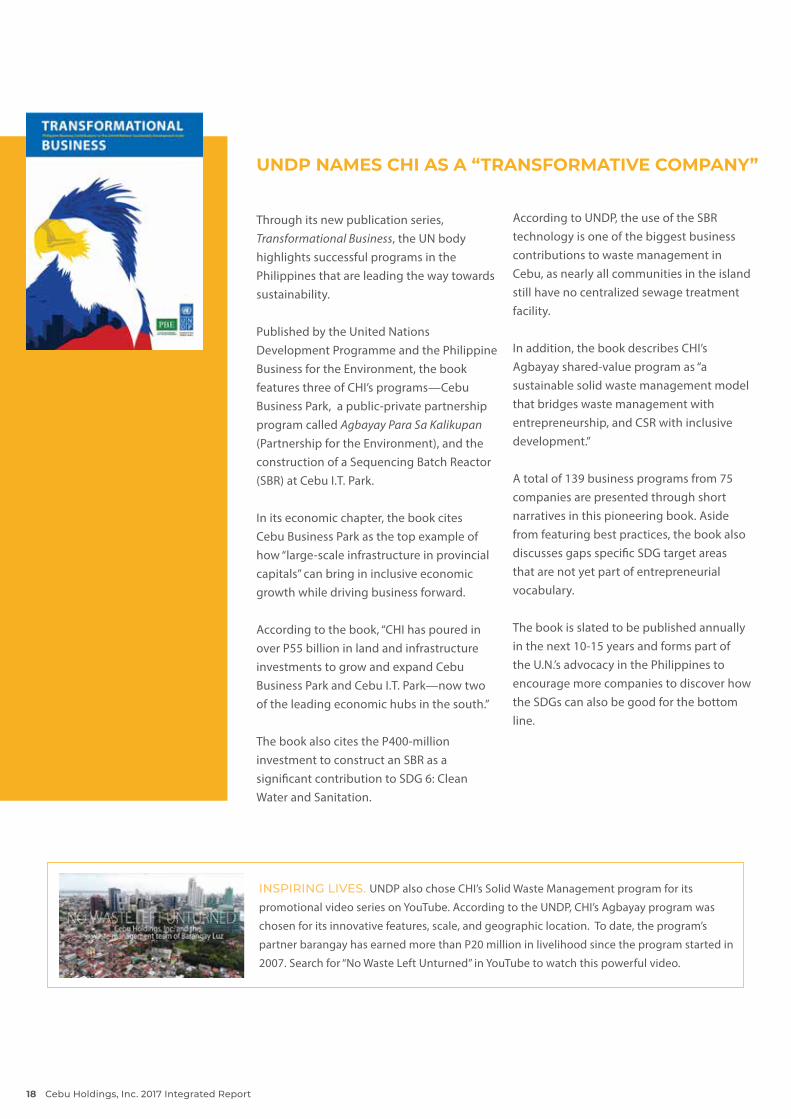
UNDP NAMES CHI AS A “TRANSFORMATIVE COMPANY”
Through its new publication series, Transformational Business, the UN body highlights successful programs in the Philippines that are leading the way towards sustainability. Published by the United Nations Development Programme and the Philippine Business for the Environment, the book features three of CHI’s programs—Cebu Business Park, a public-private partnership program called Agbayay Para Sa Kalikupan (Partnership for the Environment), and the construction of a Sequencing Batch Reactor (SBR) at Cebu I.T. Park. In its economic chapter, the book cites Cebu Business Park as the top example of how “large-scale infrastructure in provincial capitals” can bring in inclusive economic growth while driving business forward. According to the book, “CHI has poured in over P55 billion in land and infrastructure investments to grow and expand Cebu Business Park and Cebu I.T. Park—now two of the leading economic hubs in the south.” The book also cites the P400-million investment to construct an SBR as a significant contribution to SDG 6: Clean Water and Sanitation.
According to UNDP, the use of the SBR technology is one of the biggest business contributions to waste management in Cebu, as nearly all communities in the island still have no centralized sewage treatment facility.
In addition, the book describes CHI’s Agbayay shared-value program as “a sustainable solid waste management model that bridges waste management with entrepreneurship, and CSR with inclusive development.” A total of 139 business programs from 75 companies are presented through short narratives in this pioneering book. Aside from featuring best practices, the book also discusses gaps specific SDG target areas that are not yet part of entrepreneurial vocabulary. The book is slated to be published annually in the next 10-15 years and forms part of the U.N.’s advocacy in the Philippines to encourage more companies to discover how the SDGs can also be good for the bottom line.
INSPIRING LIVES. UNDP also chose CHI’s Solid Waste Management program for its
promotional video series on YouTube. According to the UNDP, CHI’s Agbayay program was
chosen for its innovative features, scale, and geographic location. To date, the program’s
partner barangay has earned more than P20 million in livelihood since the program started in
2007. Search for “No Waste Left Unturned” in YouTube to watch this powerful video.
Cebu Holdings, Inc. 2017 Integrated Report18
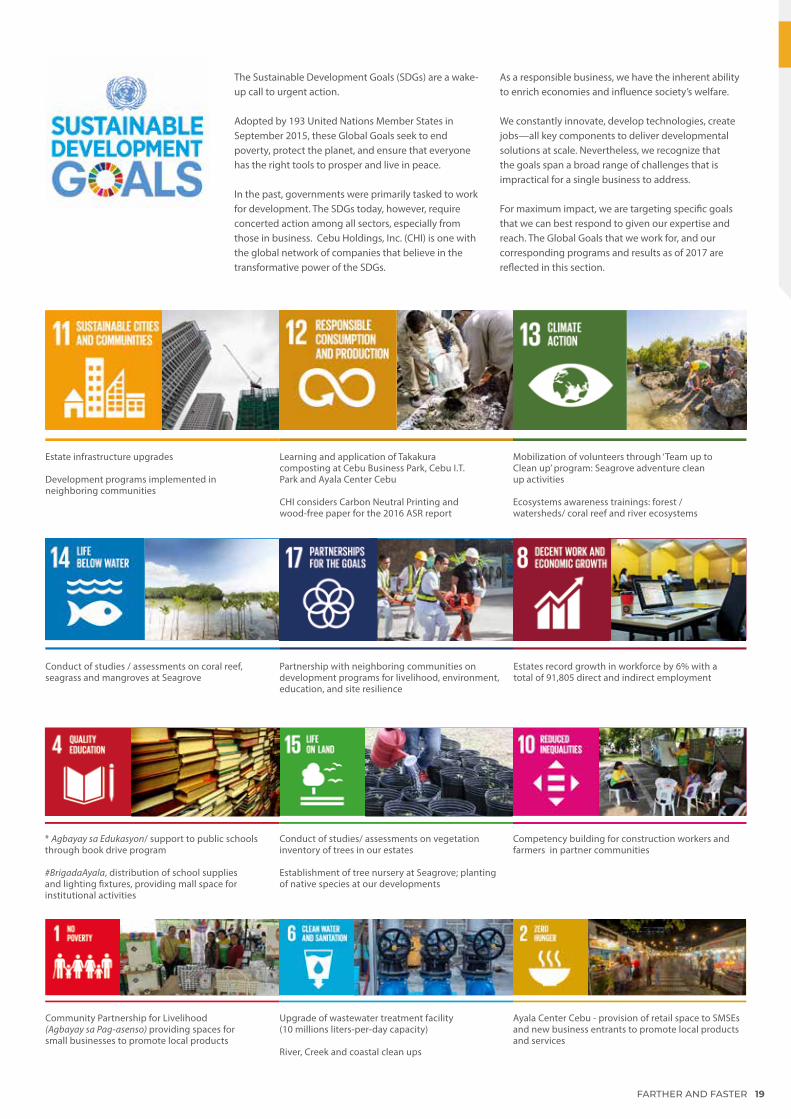
The Sustainable Development Goals (SDGs) are a wake-up call to urgent action. Adopted by 193 United Nations Member States in September 2015, these Global Goals seek to end poverty, protect the planet, and ensure that everyone has the right tools to prosper and live in peace. In the past, governments were primarily tasked to work for development. The SDGs today, however, require concerted action among all sectors, especially from those in business. Cebu Holdings, Inc. (CHI) is one with the global network of companies that believe in the transformative power of the SDGs.
As a responsible business, we have the inherent ability to enrich economies and influence society’s welfare.
We constantly innovate, develop technologies, create jobs—all key components to deliver developmental solutions at scale. Nevertheless, we recognize that the goals span a broad range of challenges that is impractical for a single business to address. For maximum impact, we are targeting specific goals that we can best respond to given our expertise and reach. The Global Goals that we work for, and our corresponding programs and results as of 2017 are reflected in this section.
Community Partnership for Livelihood(Agbayay sa Pag-asenso) providing spaces for small businesses to promote local products
* Agbayay sa Edukasyon/ support to public schools through book drive program
#BrigadaAyala, distribution of school supplies and lighting fixtures, providing mall space for institutional activities
Conduct of studies / assessments on coral reef, seagrass and mangroves at Seagrove
Estates record growth in workforce by 6% with a total of 91,805 direct and indirect employment
Partnership with neighboring communities on development programs for livelihood, environment, education, and site resilience
Upgrade of wastewater treatment facility (10 millions liters-per-day capacity)
River, Creek and coastal clean ups
Conduct of studies/ assessments on vegetation inventory of trees in our estates
Establishment of tree nursery at Seagrove; planting of native species at our developments
Competency building for construction workers and farmers in partner communities
Ayala Center Cebu - provision of retail space to SMSEs and new business entrants to promote local products and services
Estate infrastructure upgrades
Development programs implemented in neighboring communities
Learning and application of Takakura composting at Cebu Business Park, Cebu I.T. Park and Ayala Center Cebu
CHI considers Carbon Neutral Printing and wood-free paper for the 2016 ASR report
Mobilization of volunteers through ‘Team up to Clean up’ program: Seagrove adventure clean up activities
Ecosystems awareness trainings: forest / watersheds/ coral reef and river ecosystems
FARTHER AND FASTER 19

We have nurtured long-term relationships with key stakeholders that support us in delivering our value proposition – investors, business partners, suppliers and consultants.
We source our human capital for construction projects and property management from reliable human resource providers that have the best standards for employee management.
We maintain a team of management and technical experts within the company who look after our key business operations.
MANUFACTURED
NATURAL
SOCIAL ANDRELATIONSHIP
INTELLECTUAL
HUMAN
As a developer, our fundamental capital is land. As of 2017, we have developed and continued to optimally use 143 hectares of land. We also ensure we continue to have reliable access to fresh water to meet about 242,639 cubic meters of water needs per year. We also rely on the grid power to meet 48,727.01 gigajoules of energy requirement to run our estates, malls, and buildings.
Our expertise and track record in master-planning and developing mixed-use, integrated growth centers is an important capital that drives our success.
Our strong and trusted brand helps us keep our position in the market.
For 29 years, we have builta reputation for quality, reliability, and sustainability which are important to maintaining our relationship with the key stakeholders we serve: our locators, merchants, and customers.
77 hectares of developed estates as the platform for our office and retail spaces with 261,416 square meters of leasable area that drive our revenue.
We uphold the highest standards of corporate governance and compliance and ensure good relations with government.
We have a reliable operational cash flow and we are able to access affordable financing from debt or equity. In 2015, we successfully issued P5 billion in bonds for our expansion projects.
In addition, investments put in by our locators reached an estimated P25.6 billion.
Since 1988 we have put to work an estimated P55 billion in capital (Cebu Holdings and Ayala Land projects in Cebu) of which P 2 billion was deployed in 2017.
A portion of our financial capital (P0.70 billion) is invested in subsidiaries and affiliates to more effectively reach diverse market segments.
FINANCIAL
OPTIMIZING LAND USE Strategic Land Management
(Evaluation, Negotiation, Due Diligence, Acquisition)� STRATEGIC LAND MANAGEMENT
(Development plans, permits)� ESTATE MASTER-PLANNING
� CONSTRUCTION & MONITORING
ENTERING DIVERSE MARKETSTHROUGH PARTNERSHIPS
Investments / Equity Holdings
Office and retail leasing
CREATING SPACES FOR BUSINESS AND LIFESTYLE
� OPERATIONS AND PROPERTY MANAGEMENT
By end of 2017, 92% of these spaces are leased out, whichdrives our leasing income.
Since our entry into the Cebu market in 1988, we have created a total of 261,416 sqm - total GLA of offices and retail spaces combined which makes us the leading full-line developer in the province.
We have invested in Ayala Land residential brands which delivered to meet growing and diverse demand in Cebu. These products promised to deliver:
844 units – high end residential (Ayala Land Premier); 504 lots - high end residential subdivision1,886 units - mid-market residential (Alveo); 1,333 units – affordable residential (Avida and Amaia)
165,000 GLA – regional malls (under construction) 301 hotel rooms – operational214 hotel rooms – under construction *figures reflect entire inventory
We have optimised the use of our space — at 1.4 Gross Floor Area (GFA)per square meter of land in 2017, while keeping open spaces at 30% of thetotal land area of our estates.
We have master-planned and developed mixed-use estateswith a total of 143 hectares and ensured that land is used optimally.
Our master-planned mixed-use estates have hosted a vast range of businesses in Cebu. To date, our estates have more than 70 (building) locators and over 200 foreign and local companies.
Notwithstanding the influx of foreign investments in Cebu, our developments cater to the needs of local brands. In 2017, 50 percent of our mall merchants are Philippine brands; while 14 percent are homegrown Cebuano brands. 204.1
In addition, our developments have raised the estate value of land by a thousandfold from 1988 to 2017. Land value appreciation contributes to LGU’s revenue in the form of real property taxes. In 2017, over P300 million was paid to the local government, 57 percent higher than the previous year.
Consequently, this has also raised the rental rates from P400 per square meter to P900 per square meter for office space
Our locators support employment of 91,805 individuals. Based on median salary rates across various key industry locators we have estimated over P16 billion worth of economic value that flows to this workforce annually. This economic value also flows back to the economy in consumer spending which then supports small businesses in the immediate vicinity of our estates. In 2017, we have accounted over 3,000 small businesses providing ancillary services such as food, transportation, accommodation, and laundry and other services.
The growth in businesses inside our estates has also fueled the emergence of allied businesses such as hotels that have located around our business districts. To date, there are 2,365 rooms that support accommodation requirements of the area.
Overall, the emergence of business within and around the estates has contributed significantly to LGU’s revenue in the form of business taxes and licenses.
Other investors, including foreign locators come in imputing new money
Locators / local businesses / start-ups are afforded opportunity to thrive
Due to thriving economic activity, neighboring communities are given opportunities to do ancillary businesses
CHI imputes investments into the area for creating the estates
CAPITALS / RESOURCES ACTIVITES OUTPUTS OUTCOMES
INTEGRATED REPORTINGF R A M E W O R K
O U R
CH
I'S V
ALU
E C
REA
TIO
N P
RO
CES
S
We have nurtured long-term relationships with key stakeholders that support us in delivering our value proposition – investors, business partners, suppliers and consultants.
We source our human capital for construction projects and property management from reliable human resource providers that have the best standards for employee management.
We maintain a team of management and technical experts within the company who look after our key business operations.
MANUFACTURED
NATURAL
SOCIAL ANDRELATIONSHIP
INTELLECTUAL
HUMAN
As a developer, our fundamental capital is land. As of 2017, we have developed and continued to optimally use 143 hectares of land. We also ensure we continue to have reliable access to fresh water to meet about 242,639 cubic meters of water needs per year. We also rely on the grid power to meet 48,727.01 gigajoules of energy requirement to run our estates, malls, and buildings.
Our expertise and track record in master-planning and developing mixed-use, integrated growth centers is an important capital that drives our success.
Our strong and trusted brand helps us keep our position in the market.
For 29 years, we have builta reputation for quality, reliability, and sustainability which are important to maintaining our relationship with the key stakeholders we serve: our locators, merchants, and customers.
77 hectares of developed estates as the platform for our office and retail spaces with 261,416 square meters of leasable area that drive our revenue.
We uphold the highest standards of corporate governance and compliance and ensure good relations with government.
We have a reliable operational cash flow and we are able to access affordable financing from debt or equity. In 2015, we successfully issued P5 billion in bonds for our expansion projects.
In addition, investments put in by our locators reached an estimated P25.6 billion.
Since 1988 we have put to work an estimated P55 billion in capital (Cebu Holdings and Ayala Land projects in Cebu) of which P 2 billion was deployed in 2017.
A portion of our financial capital (P0.70 billion) is invested in subsidiaries and affiliates to more effectively reach diverse market segments.
FINANCIAL
OPTIMIZING LAND USE Strategic Land Management
(Evaluation, Negotiation, Due Diligence, Acquisition)� STRATEGIC LAND MANAGEMENT
(Development plans, permits)� ESTATE MASTER-PLANNING
� CONSTRUCTION & MONITORING
ENTERING DIVERSE MARKETSTHROUGH PARTNERSHIPS
Investments / Equity Holdings
Office and retail leasing
CREATING SPACES FOR BUSINESS AND LIFESTYLE
� OPERATIONS AND PROPERTY MANAGEMENT
By end of 2017, 92% of these spaces are leased out, whichdrives our leasing income.
Since our entry into the Cebu market in 1988, we have created a total of 261,416 sqm - total GLA of offices and retail spaces combined which makes us the leading full-line developer in the province.
We have invested in Ayala Land residential brands which delivered to meet growing and diverse demand in Cebu. These products promised to deliver:
844 units – high end residential (Ayala Land Premier); 504 lots - high end residential subdivision1,886 units - mid-market residential (Alveo); 1,333 units – affordable residential (Avida and Amaia)
165,000 GLA – regional malls (under construction) 301 hotel rooms – operational214 hotel rooms – under construction *figures reflect entire inventory
We have optimised the use of our space — at 1.4 Gross Floor Area (GFA)per square meter of land in 2017, while keeping open spaces at 30% of thetotal land area of our estates.
We have master-planned and developed mixed-use estateswith a total of 143 hectares and ensured that land is used optimally.
Our master-planned mixed-use estates have hosted a vast range of businesses in Cebu. To date, our estates have more than 70 (building) locators and over 200 foreign and local companies.
Notwithstanding the influx of foreign investments in Cebu, our developments cater to the needs of local brands. In 2017, 50 percent of our mall merchants are Philippine brands; while 14 percent are homegrown Cebuano brands. 204.1
In addition, our developments have raised the estate value of land by a thousandfold from 1988 to 2017. Land value appreciation contributes to LGU’s revenue in the form of real property taxes. In 2017, over P300 million was paid to the local government, 57 percent higher than the previous year.
Consequently, this has also raised the rental rates from P400 per square meter to P900 per square meter for office space
Our locators support employment of 91,805 individuals. Based on median salary rates across various key industry locators we have estimated over P16 billion worth of economic value that flows to this workforce annually. This economic value also flows back to the economy in consumer spending which then supports small businesses in the immediate vicinity of our estates. In 2017, we have accounted over 3,000 small businesses providing ancillary services such as food, transportation, accommodation, and laundry and other services.
The growth in businesses inside our estates has also fueled the emergence of allied businesses such as hotels that have located around our business districts. To date, there are 2,365 rooms that support accommodation requirements of the area.
Overall, the emergence of business within and around the estates has contributed significantly to LGU’s revenue in the form of business taxes and licenses.
Other investors, including foreign locators come in imputing new money
Locators / local businesses / start-ups are afforded opportunity to thrive
Due to thriving economic activity, neighboring communities are given opportunities to do ancillary businesses
CHI imputes investments into the area for creating the estates
CAPITALS / RESOURCES ACTIVITES OUTPUTS OUTCOMES
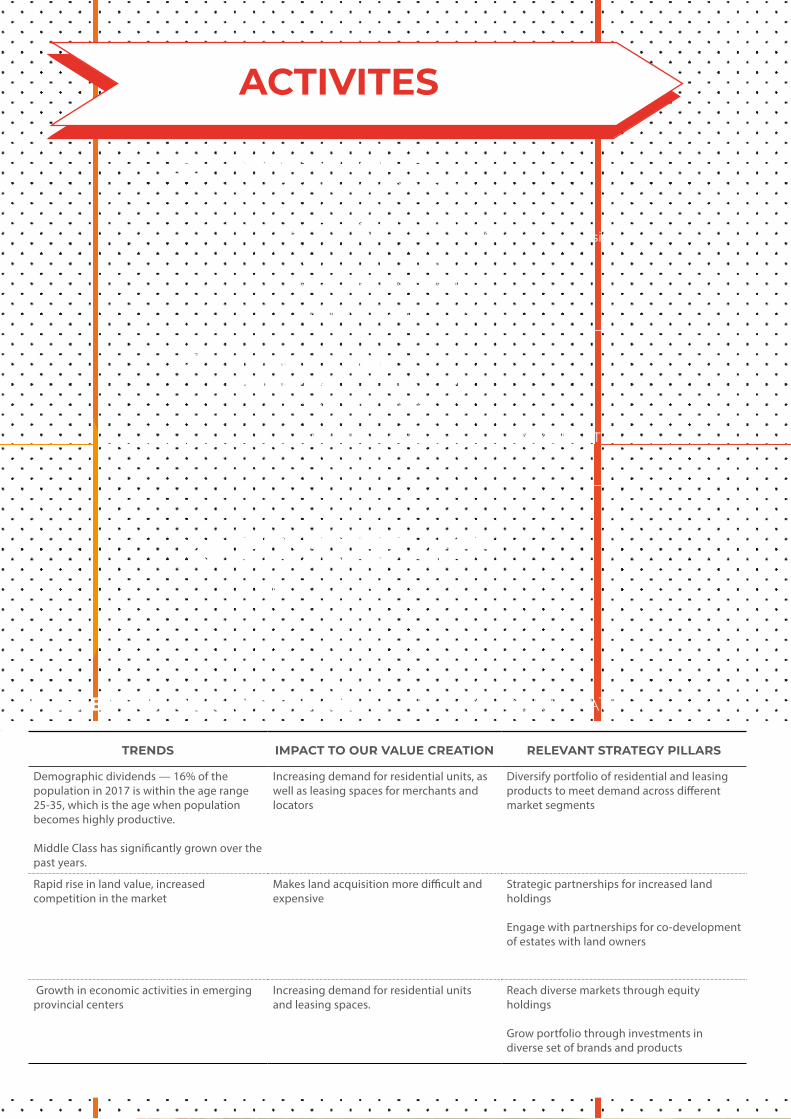
MARKET OUTLOOK AND TRENDS THAT INFORM OUR STRATEGY
TRENDS IMPACT TO OUR VALUE CREATION RELEVANT STRATEGY PILLARS
Demographic dividends — 16% of the population in 2017 is within the age range 25-35, which is the age when population becomes highly productive.
Middle Class has significantly grown over the past years.
Increasing demand for residential units, as well as leasing spaces for merchants and locators
Diversify portfolio of residential and leasing products to meet demand across different market segments
Rapid rise in land value, increased competition in the market
Makes land acquisition more difficult and expensive
Strategic partnerships for increased land holdings
Engage with partnerships for co-development of estates with land owners
Growth in economic activities in emerging provincial centers
Increasing demand for residential unitsand leasing spaces.
Reach diverse markets through equity holdings
Grow portfolio through investments in diverse set of brands and products
We have nurtured long-term relationships with key stakeholders that support us in delivering our value proposition – investors, business partners, suppliers and consultants.
We source our human capital for construction projects and property management from reliable human resource providers that have the best standards for employee management.
We maintain a team of management and technical experts within the company who look after our key business operations.
MANUFACTURED
NATURAL
SOCIAL ANDRELATIONSHIP
INTELLECTUAL
HUMAN
As a developer, our fundamental capital is land. As of 2017, we have developed and continued to optimally use 143 hectares of land. We also ensure we continue to have reliable access to fresh water to meet about 242,639 cubic meters of water needs per year. We also rely on the grid power to meet 48,727.01 gigajoules of energy requirement to run our estates, malls, and buildings.
Our expertise and track record in master-planning and developing mixed-use, integrated growth centers is an important capital that drives our success.
Our strong and trusted brand helps us keep our position in the market.
For 29 years, we have builta reputation for quality, reliability, and sustainability which are important to maintaining our relationship with the key stakeholders we serve: our locators, merchants, and customers.
77 hectares of developed estates as the platform for our office and retail spaces with 261,416 square meters of leasable area that drive our revenue.
We uphold the highest standards of corporate governance and compliance and ensure good relations with government.
We have a reliable operational cash flow and we are able to access affordable financing from debt or equity. In 2015, we successfully issued P5 billion in bonds for our expansion projects.
In addition, investments put in by our locators reached an estimated P25.6 billion.
Since 1988 we have put to work an estimated P55 billion in capital (Cebu Holdings and Ayala Land projects in Cebu) of which P 2 billion was deployed in 2017.
A portion of our financial capital (P0.70 billion) is invested in subsidiaries and affiliates to more effectively reach diverse market segments.
FINANCIAL
OPTIMIZING LAND USE Strategic Land Management
(Evaluation, Negotiation, Due Diligence, Acquisition)� STRATEGIC LAND MANAGEMENT
(Development plans, permits)� ESTATE MASTER-PLANNING
� CONSTRUCTION & MONITORING
ENTERING DIVERSE MARKETSTHROUGH PARTNERSHIPS
Investments / Equity Holdings
Office and retail leasing
CREATING SPACES FOR BUSINESS AND LIFESTYLE
� OPERATIONS AND PROPERTY MANAGEMENT
By end of 2017, 92% of these spaces are leased out, whichdrives our leasing income.
Since our entry into the Cebu market in 1988, we have created a total of 261,416 sqm - total GLA of offices and retail spaces combined which makes us the leading full-line developer in the province.
We have invested in Ayala Land residential brands which delivered to meet growing and diverse demand in Cebu. These products promised to deliver:
844 units – high end residential (Ayala Land Premier); 504 lots - high end residential subdivision1,886 units - mid-market residential (Alveo); 1,333 units – affordable residential (Avida and Amaia)
165,000 GLA – regional malls (under construction) 301 hotel rooms – operational214 hotel rooms – under construction *figures reflect entire inventory
We have optimised the use of our space — at 1.4 Gross Floor Area (GFA)per square meter of land in 2017, while keeping open spaces at 30% of thetotal land area of our estates.
We have master-planned and developed mixed-use estateswith a total of 143 hectares and ensured that land is used optimally.
Our master-planned mixed-use estates have hosted a vast range of businesses in Cebu. To date, our estates have more than 70 (building) locators and over 200 foreign and local companies.
Notwithstanding the influx of foreign investments in Cebu, our developments cater to the needs of local brands. In 2017, 50 percent of our mall merchants are Philippine brands; while 14 percent are homegrown Cebuano brands. 204.1
In addition, our developments have raised the estate value of land by a thousandfold from 1988 to 2017. Land value appreciation contributes to LGU’s revenue in the form of real property taxes. In 2017, over P300 million was paid to the local government, 57 percent higher than the previous year.
Consequently, this has also raised the rental rates from P400 per square meter to P900 per square meter for office space
Our locators support employment of 91,805 individuals. Based on median salary rates across various key industry locators we have estimated over P16 billion worth of economic value that flows to this workforce annually. This economic value also flows back to the economy in consumer spending which then supports small businesses in the immediate vicinity of our estates. In 2017, we have accounted over 3,000 small businesses providing ancillary services such as food, transportation, accommodation, and laundry and other services.
The growth in businesses inside our estates has also fueled the emergence of allied businesses such as hotels that have located around our business districts. To date, there are 2,365 rooms that support accommodation requirements of the area.
Overall, the emergence of business within and around the estates has contributed significantly to LGU’s revenue in the form of business taxes and licenses.
Other investors, including foreign locators come in imputing new money
Locators / local businesses / start-ups are afforded opportunity to thrive
Due to thriving economic activity, neighboring communities are given opportunities to do ancillary businesses
CHI imputes investments into the area for creating the estates
CAPITALS / RESOURCES ACTIVITES OUTPUTS OUTCOMES
STRATEGY, PERFORMANCE, AND PRINCIPAL RISKS
STRATEGY PILLARS
DIVERSIFY PORTFOLIOSTRATEGIC PARTNERSHIPS
FOR INCREASED LAND HOLDINGS
REACH DIVERSE MARKETS THROUGH EQUITY
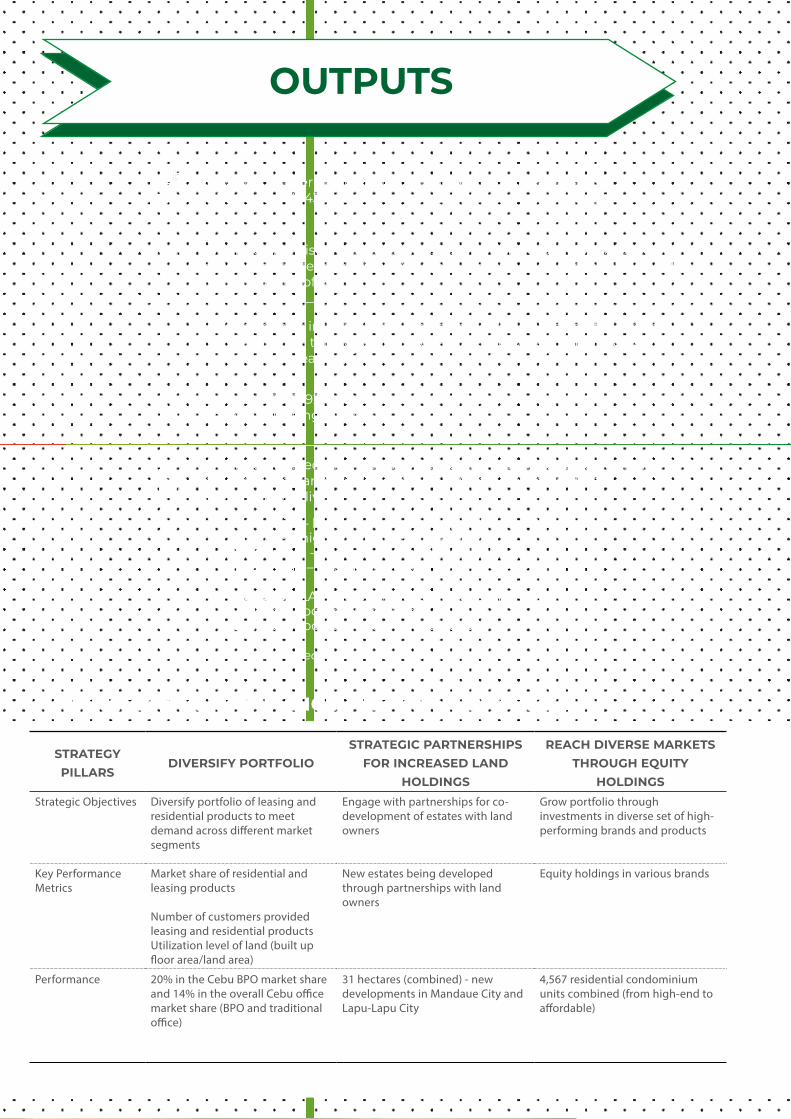
HOLDINGSStrategic Objectives Diversify portfolio of leasing and
residential products to meet demand across different market segments
Engage with partnerships for co-development of estates with land owners
Grow portfolio through investments in diverse set of high-performing brands and products
Key Performance Metrics
Market share of residential and leasing products
Number of customers provided leasing and residential productsUtilization level of land (built up floor area/land area)
New estates being developed through partnerships with land owners
Equity holdings in various brands
Performance 20% in the Cebu BPO market share and 14% in the overall Cebu office market share (BPO and traditional office)
31 hectares (combined) - new developments in Mandaue City and Lapu-Lapu City
4,567 residential condominium units combined (from high-end to affordable)
We have nurtured long-term relationships with key stakeholders that support us in delivering our value proposition – investors, business partners, suppliers and consultants.
We source our human capital for construction projects and property management from reliable human resource providers that have the best standards for employee management.
We maintain a team of management and technical experts within the company who look after our key business operations.
MANUFACTURED
NATURAL
SOCIAL ANDRELATIONSHIP
INTELLECTUAL
HUMAN
As a developer, our fundamental capital is land. As of 2017, we have developed and continued to optimally use 143 hectares of land. We also ensure we continue to have reliable access to fresh water to meet about 242,639 cubic meters of water needs per year. We also rely on the grid power to meet 48,727.01 gigajoules of energy requirement to run our estates, malls, and buildings.
Our expertise and track record in master-planning and developing mixed-use, integrated growth centers is an important capital that drives our success.
Our strong and trusted brand helps us keep our position in the market.
For 29 years, we have builta reputation for quality, reliability, and sustainability which are important to maintaining our relationship with the key stakeholders we serve: our locators, merchants, and customers.
77 hectares of developed estates as the platform for our office and retail spaces with 261,416 square meters of leasable area that drive our revenue.
We uphold the highest standards of corporate governance and compliance and ensure good relations with government.
We have a reliable operational cash flow and we are able to access affordable financing from debt or equity. In 2015, we successfully issued P5 billion in bonds for our expansion projects.
In addition, investments put in by our locators reached an estimated P25.6 billion.
Since 1988 we have put to work an estimated P55 billion in capital (Cebu Holdings and Ayala Land projects in Cebu) of which P 2 billion was deployed in 2017.
A portion of our financial capital (P0.70 billion) is invested in subsidiaries and affiliates to more effectively reach diverse market segments.
FINANCIAL
OPTIMIZING LAND USE Strategic Land Management
(Evaluation, Negotiation, Due Diligence, Acquisition)� STRATEGIC LAND MANAGEMENT
(Development plans, permits)� ESTATE MASTER-PLANNING
� CONSTRUCTION & MONITORING
ENTERING DIVERSE MARKETSTHROUGH PARTNERSHIPS
Investments / Equity Holdings
Office and retail leasing
CREATING SPACES FOR BUSINESS AND LIFESTYLE
� OPERATIONS AND PROPERTY MANAGEMENT
By end of 2017, 92% of these spaces are leased out, whichdrives our leasing income.
Since our entry into the Cebu market in 1988, we have created a total of 261,416 sqm - total GLA of offices and retail spaces combined which makes us the leading full-line developer in the province.
We have invested in Ayala Land residential brands which delivered to meet growing and diverse demand in Cebu. These products promised to deliver:
844 units – high end residential (Ayala Land Premier); 504 lots - high end residential subdivision1,886 units - mid-market residential (Alveo); 1,333 units – affordable residential (Avida and Amaia)
165,000 GLA – regional malls (under construction) 301 hotel rooms – operational214 hotel rooms – under construction *figures reflect entire inventory
We have optimised the use of our space — at 1.4 Gross Floor Area (GFA)per square meter of land in 2017, while keeping open spaces at 30% of thetotal land area of our estates.
We have master-planned and developed mixed-use estateswith a total of 143 hectares and ensured that land is used optimally.
Our master-planned mixed-use estates have hosted a vast range of businesses in Cebu. To date, our estates have more than 70 (building) locators and over 200 foreign and local companies.
Notwithstanding the influx of foreign investments in Cebu, our developments cater to the needs of local brands. In 2017, 50 percent of our mall merchants are Philippine brands; while 14 percent are homegrown Cebuano brands. 204.1
In addition, our developments have raised the estate value of land by a thousandfold from 1988 to 2017. Land value appreciation contributes to LGU’s revenue in the form of real property taxes. In 2017, over P300 million was paid to the local government, 57 percent higher than the previous year.
Consequently, this has also raised the rental rates from P400 per square meter to P900 per square meter for office space
Our locators support employment of 91,805 individuals. Based on median salary rates across various key industry locators we have estimated over P16 billion worth of economic value that flows to this workforce annually. This economic value also flows back to the economy in consumer spending which then supports small businesses in the immediate vicinity of our estates. In 2017, we have accounted over 3,000 small businesses providing ancillary services such as food, transportation, accommodation, and laundry and other services.
The growth in businesses inside our estates has also fueled the emergence of allied businesses such as hotels that have located around our business districts. To date, there are 2,365 rooms that support accommodation requirements of the area.
Overall, the emergence of business within and around the estates has contributed significantly to LGU’s revenue in the form of business taxes and licenses.
Other investors, including foreign locators come in imputing new money
Locators / local businesses / start-ups are afforded opportunity to thrive
Due to thriving economic activity, neighboring communities are given opportunities to do ancillary businesses
CHI imputes investments into the area for creating the estates
CAPITALS / RESOURCES ACTIVITES OUTPUTS OUTCOMES
STRATEGY, PERFORMANCE, AND PRINCIPAL RISKS
STRATEGY PILLARS
DIVERSIFY PORTFOLIOSTRATEGIC PARTNERSHIPS
FOR INCREASED LAND HOLDINGS
REACH DIVERSE MARKETS THROUGH EQUITY
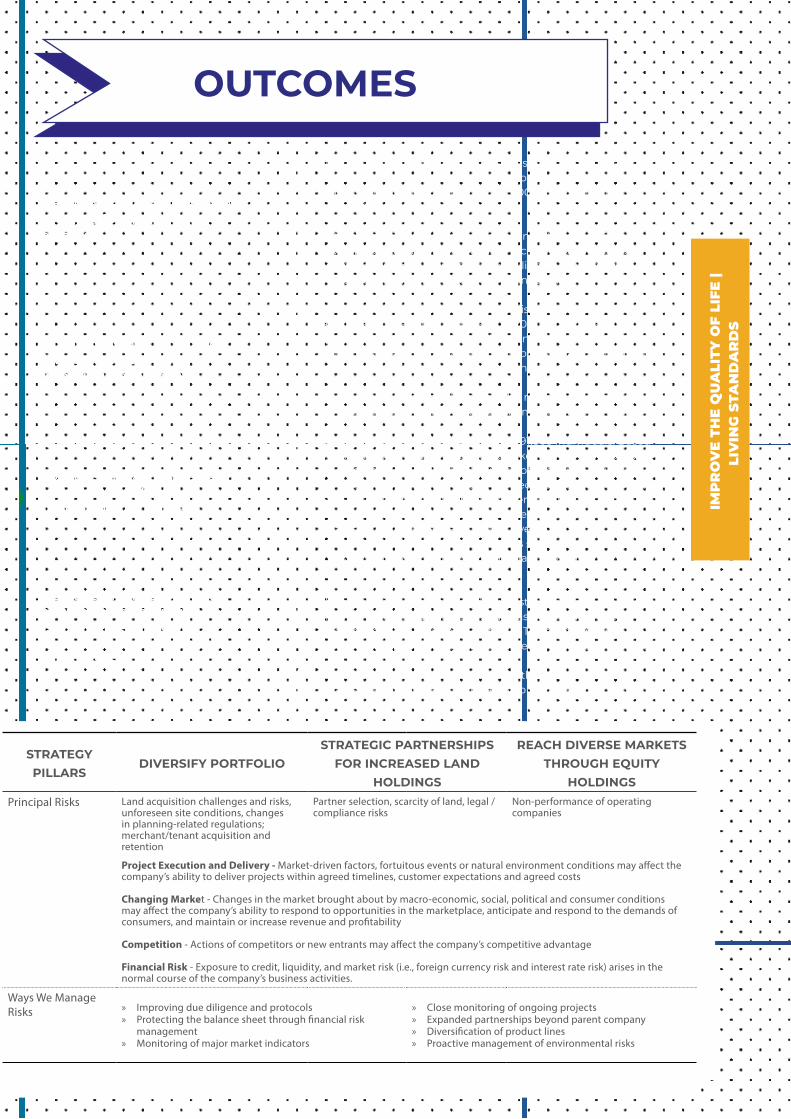
HOLDINGSPrincipal Risks Land acquisition challenges and risks,
unforeseen site conditions, changes in planning-related regulations; merchant/tenant acquisition and retention
Partner selection, scarcity of land, legal /compliance risks
Non-performance of operating companies
Project Execution and Delivery - Market-driven factors, fortuitous events or natural environment conditions may affect the company’s ability to deliver projects within agreed timelines, customer expectations and agreed costs
Changing Market - Changes in the market brought about by macro-economic, social, political and consumer conditions may affect the company’s ability to respond to opportunities in the marketplace, anticipate and respond to the demands of consumers, and maintain or increase revenue and profitability
Competition - Actions of competitors or new entrants may affect the company’s competitive advantage
Financial Risk - Exposure to credit, liquidity, and market risk (i.e., foreign currency risk and interest rate risk) arises in the normal course of the company’s business activities.
Ways We Manage Risks » Improving due diligence and protocols
» Protecting the balance sheet through financial risk management
» Monitoring of major market indicators
» Close monitoring of ongoing projects » Expanded partnerships beyond parent company » Diversification of product lines » Proactive management of environmental risks
IMP
RO
VE
THE
QU
ALI
TY O
F LI
FE |
LIV
ING
STA
ND
AR
DS
As a real estate company creating and enhancing integrated, masterplanned, and sustainable mixed-use developments, we ensure that we continue to create value for all our stakeholders
and the society.
C H I ' S
VALUE CREATION
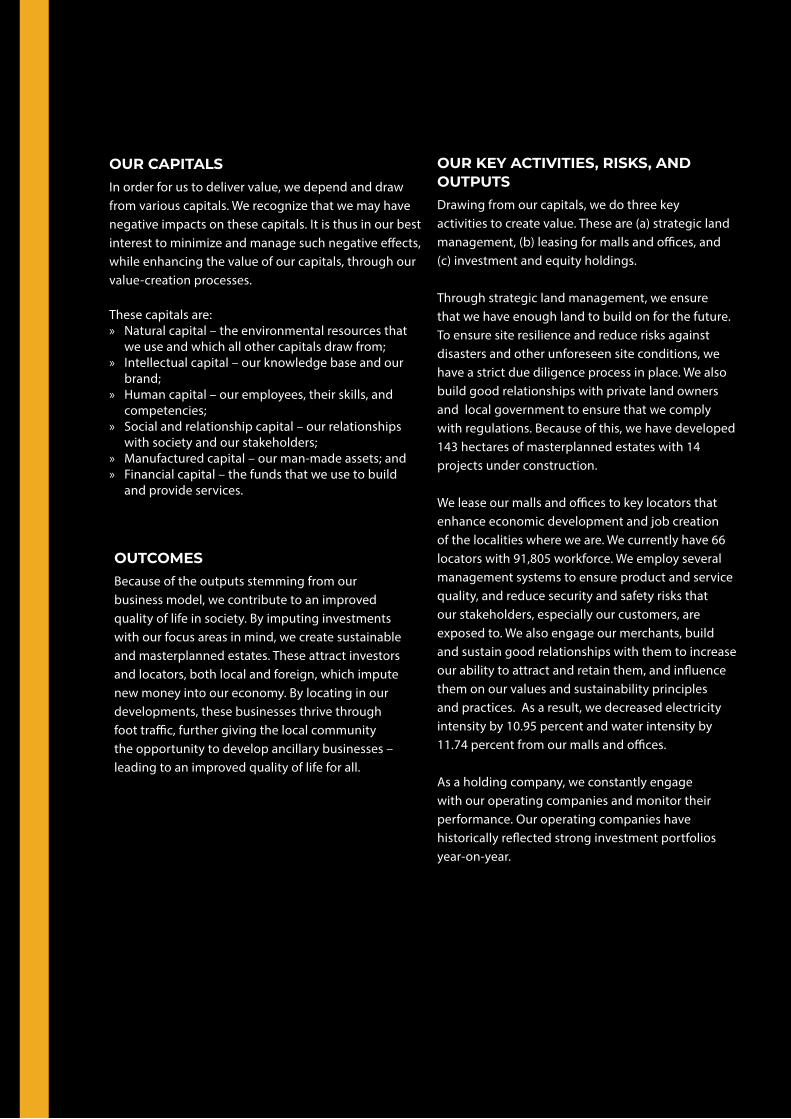
OUTCOMESBecause of the outputs stemming from our business model, we contribute to an improved quality of life in society. By imputing investments with our focus areas in mind, we create sustainable and masterplanned estates. These attract investors and locators, both local and foreign, which impute new money into our economy. By locating in our developments, these businesses thrive through foot traffic, further giving the local community the opportunity to develop ancillary businesses – leading to an improved quality of life for all.
OUR CAPITALSIn order for us to deliver value, we depend and draw from various capitals. We recognize that we may have negative impacts on these capitals. It is thus in our best interest to minimize and manage such negative effects, while enhancing the value of our capitals, through our value-creation processes.
These capitals are: » Natural capital – the environmental resources that
we use and which all other capitals draw from; » Intellectual capital – our knowledge base and our
brand; » Human capital – our employees, their skills, and
competencies; » Social and relationship capital – our relationships
with society and our stakeholders; » Manufactured capital – our man-made assets; and » Financial capital – the funds that we use to build
and provide services.
OUR KEY ACTIVITIES, RISKS, AND OUTPUTSDrawing from our capitals, we do three key activities to create value. These are (a) strategic land management, (b) leasing for malls and offices, and (c) investment and equity holdings.
Through strategic land management, we ensure that we have enough land to build on for the future. To ensure site resilience and reduce risks against disasters and other unforeseen site conditions, we have a strict due diligence process in place. We also build good relationships with private land owners and local government to ensure that we comply with regulations. Because of this, we have developed 143 hectares of masterplanned estates with 14 projects under construction.
We lease our malls and offices to key locators that enhance economic development and job creation of the localities where we are. We currently have 66 locators with 91,805 workforce. We employ several management systems to ensure product and service quality, and reduce security and safety risks that our stakeholders, especially our customers, are exposed to. We also engage our merchants, build and sustain good relationships with them to increase our ability to attract and retain them, and influence them on our values and sustainability principles and practices. As a result, we decreased electricity intensity by 10.95 percent and water intensity by 11.74 percent from our malls and offices.
As a holding company, we constantly engage with our operating companies and monitor their performance. Our operating companies have historically reflected strong investment portfolios year-on-year.
OUR PERFORMANCEThe year 2017 was a turning point for our company as we expanded further to new geographic capitals.
In Lapu-Lapu City, Cebu we broke ground for our latest estate, Seagrove.
In Mandaue City, we continued to push onward with the development of Mandaue’s new dynamic city center, Gatewalk Central.
Our flagship estates, Cebu Business Park and Cebu I.T. Park, likewise moved from strength to strength, as we opened new office and residential towers and expanded our retail offerings with fresh concepts.
In this section, we discuss our performance in 2017 towards developing more livable and sustainable growth centers that uplift entire communities and strengthen our local economy.
Cebu Holdings, Inc. 2017 Integrated Report26
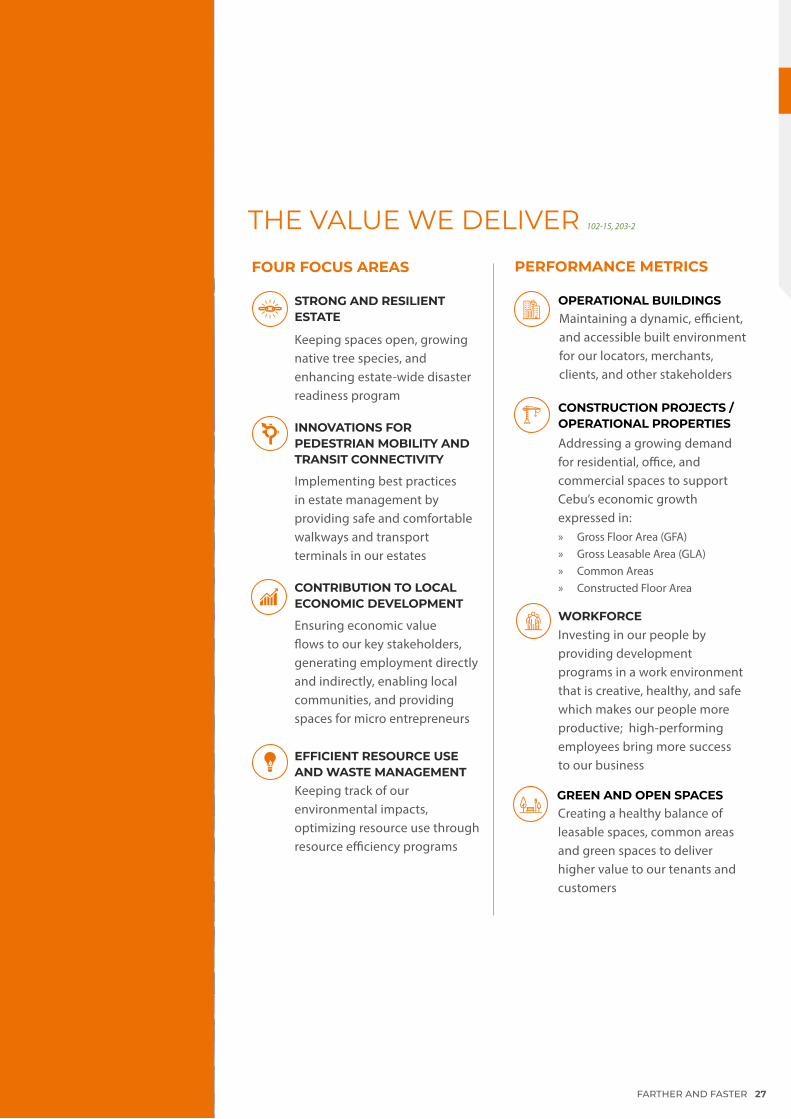
Maintaining a dynamic, efficient, and accessible built environment for our locators, merchants, clients, and other stakeholders
THE VALUE WE DELIVER
OPERATIONAL BUILDINGS
FOUR FOCUS AREAS PERFORMANCE METRICS
Addressing a growing demand for residential, office, and commercial spaces to support Cebu’s economic growth expressed in: » Gross Floor Area (GFA) » Gross Leasable Area (GLA) » Common Areas » Constructed Floor Area
CONSTRUCTION PROJECTS / OPERATIONAL PROPERTIES
Investing in our people by providing development programs in a work environment that is creative, healthy, and safe which makes our people more productive; high-performing employees bring more success to our business
WORKFORCE
Keeping spaces open, growing native tree species, and enhancing estate-wide disaster readiness program
STRONG AND RESILIENT ESTATE
Implementing best practices in estate management by providing safe and comfortable walkways and transport terminals in our estates
INNOVATIONS FOR PEDESTRIAN MOBILITY AND TRANSIT CONNECTIVITY
Creating a healthy balance of leasable spaces, common areas and green spaces to deliver higher value to our tenants and customers
GREEN AND OPEN SPACES
Ensuring economic value flows to our key stakeholders, generating employment directly and indirectly, enabling local communities, and providing spaces for micro entrepreneurs
CONTRIBUTION TO LOCAL ECONOMIC DEVELOPMENT
Keeping track of our environmental impacts, optimizing resource use through resource efficiency programs
EFFICIENT RESOURCE USE AND WASTE MANAGEMENT
102-15, 203-2
FARTHER AND FASTER 27
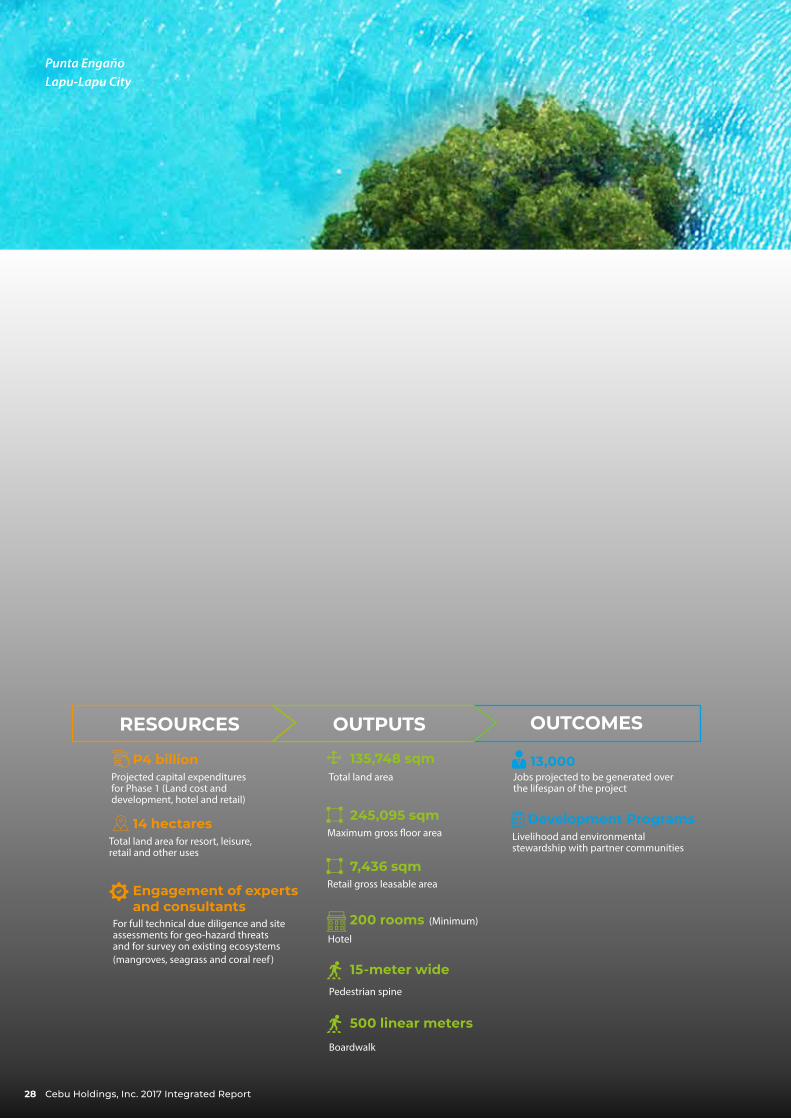
Punta EngañoLapu-Lapu City
OUTPUTS OUTCOMESRESOURCES
14 hectares
P4 billion
For full technical due diligence and site assessments for geo-hazard threats and for survey on existing ecosystems (mangroves, seagrass and coral reef )
Projected capital expenditures for Phase 1 (Land cost and development, hotel and retail)
Total land area for resort, leisure, retail and other uses
Engagement of experts and consultants
13,000
Development Programs
Jobs projected to be generated over the lifespan of the project
Livelihood and environmental stewardship with partner communities
245,095 sqm
7,436 sqm
135,748 sqm
Hotel
Total land area
Maximum gross floor area
Retail gross leasable area
200 rooms
Pedestrian spine
15-meter wide
Boardwalk
500 linear meters
(Minimum)
Cebu Holdings, Inc. 2017 Integrated Report28
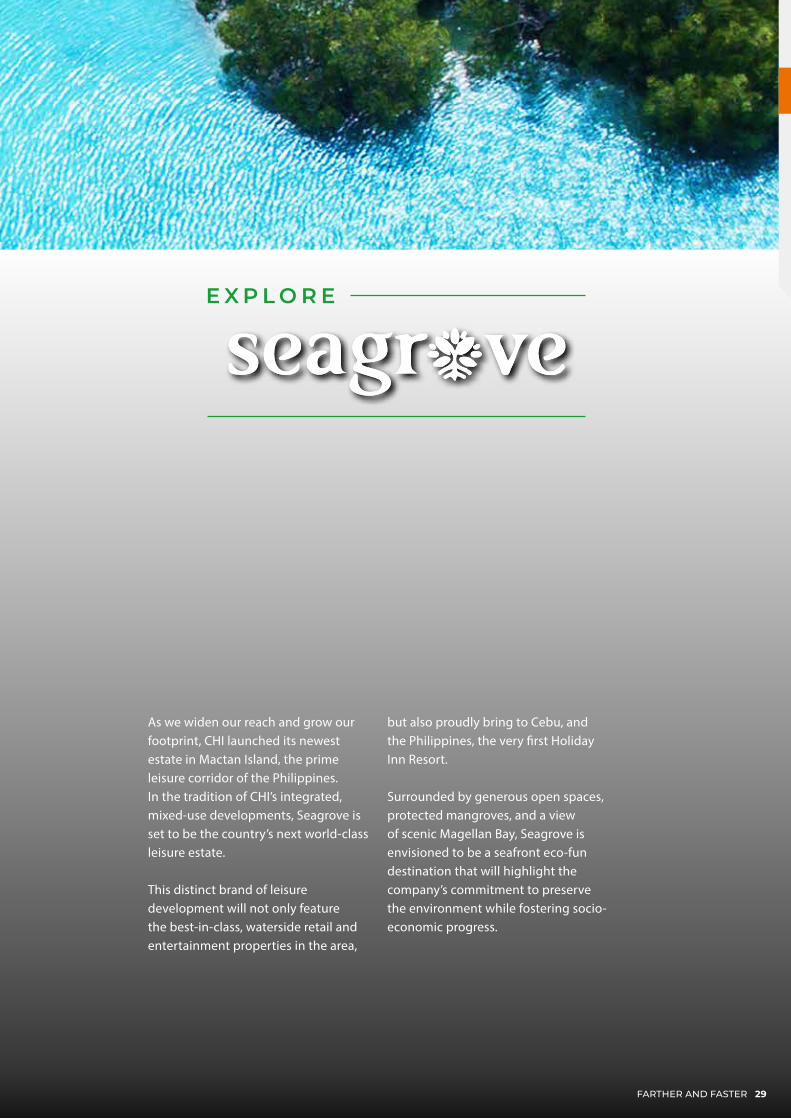
As we widen our reach and grow our footprint, CHI launched its newest estate in Mactan Island, the prime leisure corridor of the Philippines. In the tradition of CHI’s integrated, mixed-use developments, Seagrove is set to be the country’s next world-class leisure estate.
This distinct brand of leisure development will not only feature the best-in-class, waterside retail and entertainment properties in the area,
E X P L O R E
but also proudly bring to Cebu, and the Philippines, the very first Holiday Inn Resort.
Surrounded by generous open spaces, protected mangroves, and a view of scenic Magellan Bay, Seagrove is envisioned to be a seafront eco-fun destination that will highlight the company’s commitment to preserve the environment while fostering socio-economic progress.
29FARTHER AND FASTER

THE SEAGROVE BOARDWALK
This 500-meter seafront promenade will bring in an exciting and fresh mix of retail and entertainment concepts to Cebu. Reminiscent of the great boardwalks of the world, travelers will be treated to top shops and dining options—from the best in Cebuano cuisine, to iconic handicraft shops, to top global lifestyle and adventure brands.
SEAGROVE LAGOON
The Seagrove Lagoon brings new adventures and fun with its network of interconnected nature-inspired themed pools—truly an attraction for all ages. This watercourse will run through the center of Seagrove and will serve as the focal point of the estate.
MANGROVE FOREST
Nature’s majesty is on full display as Seagrove opens a panorama of Magellan Bay and its lush mangrove forest. The mangrove forest will allow visitors to kayak, kitesurf, paddle board, and snorkel to fully appreciate this grand stage of aquatic wildlife and biodiversity.
PROJECT HIGHLIGHTS
Cebu Holdings, Inc. 2017 Integrated Report30
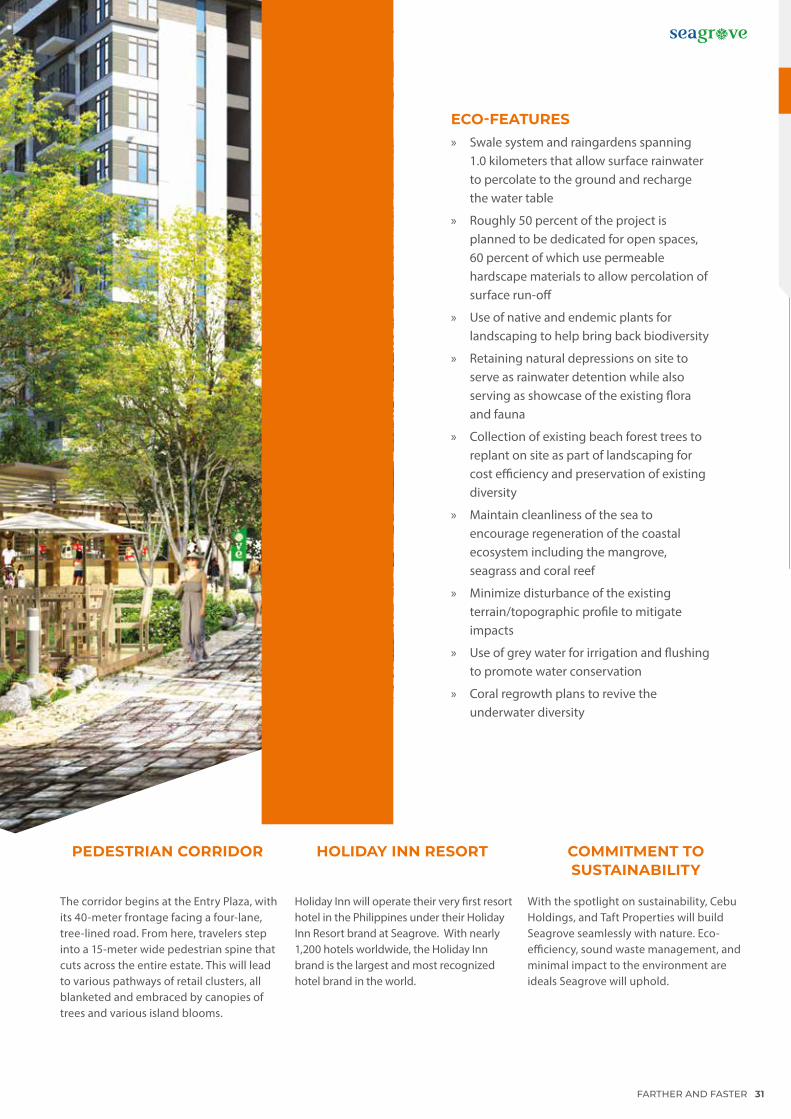
ECO-FEATURES » Swale system and raingardens spanning
1.0 kilometers that allow surface rainwater to percolate to the ground and recharge the water table
» Roughly 50 percent of the project is planned to be dedicated for open spaces, 60 percent of which use permeable hardscape materials to allow percolation of surface run-off
» Use of native and endemic plants for landscaping to help bring back biodiversity
» Retaining natural depressions on site to serve as rainwater detention while also serving as showcase of the existing flora and fauna
» Collection of existing beach forest trees to replant on site as part of landscaping for cost efficiency and preservation of existing diversity
» Maintain cleanliness of the sea to encourage regeneration of the coastal ecosystem including the mangrove, seagrass and coral reef
» Minimize disturbance of the existing terrain/topographic profile to mitigate impacts
» Use of grey water for irrigation and flushing to promote water conservation
» Coral regrowth plans to revive the underwater diversity
PEDESTRIAN CORRIDOR
The corridor begins at the Entry Plaza, with its 40-meter frontage facing a four-lane, tree-lined road. From here, travelers step into a 15-meter wide pedestrian spine that cuts across the entire estate. This will lead to various pathways of retail clusters, all blanketed and embraced by canopies of trees and various island blooms.
HOLIDAY INN RESORT
Holiday Inn will operate their very first resort hotel in the Philippines under their Holiday Inn Resort brand at Seagrove. With nearly 1,200 hotels worldwide, the Holiday Inn brand is the largest and most recognized hotel brand in the world.
COMMITMENT TO SUSTAINABILITY
With the spotlight on sustainability, Cebu Holdings, and Taft Properties will build Seagrove seamlessly with nature. Eco-efficiency, sound waste management, and minimal impact to the environment are ideals Seagrove will uphold.
FARTHER AND FASTER 31
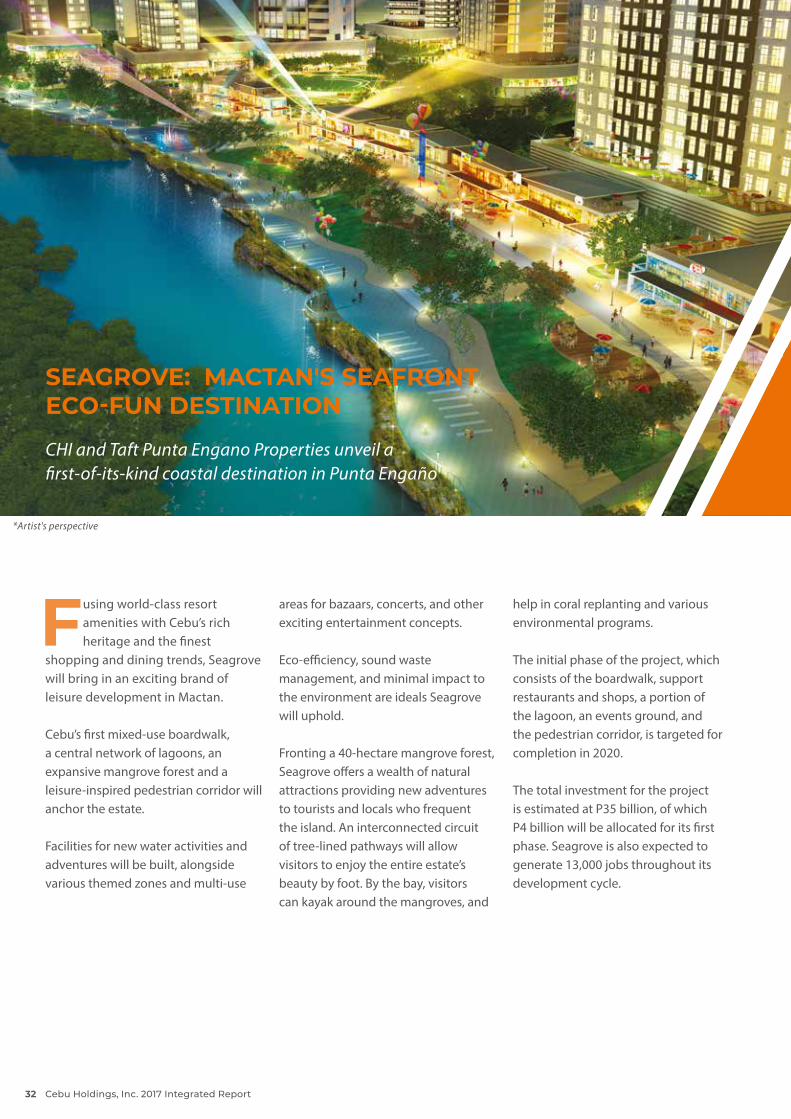
Fusing world-class resort amenities with Cebu’s rich heritage and the finest
shopping and dining trends, Seagrove will bring in an exciting brand of leisure development in Mactan.
Cebu’s first mixed-use boardwalk, a central network of lagoons, an expansive mangrove forest and a leisure-inspired pedestrian corridor will anchor the estate.
Facilities for new water activities and adventures will be built, alongside various themed zones and multi-use
areas for bazaars, concerts, and other exciting entertainment concepts.
Eco-efficiency, sound waste management, and minimal impact to the environment are ideals Seagrove will uphold.
Fronting a 40-hectare mangrove forest, Seagrove offers a wealth of natural attractions providing new adventures to tourists and locals who frequent the island. An interconnected circuit of tree-lined pathways will allow visitors to enjoy the entire estate’s beauty by foot. By the bay, visitors can kayak around the mangroves, and
help in coral replanting and various environmental programs.
The initial phase of the project, which consists of the boardwalk, support restaurants and shops, a portion of the lagoon, an events ground, and the pedestrian corridor, is targeted for completion in 2020.
The total investment for the project is estimated at P35 billion, of which P4 billion will be allocated for its first phase. Seagrove is also expected to generate 13,000 jobs throughout its development cycle.
CHI and Taft Punta Engano Properties unveil afirst-of-its-kind coastal destination in Punta Engaño
SEAGROVE: MACTAN'S SEAFRONT ECO-FUN DESTINATION
*Artist's perspective
Cebu Holdings, Inc. 2017 Integrated Report32
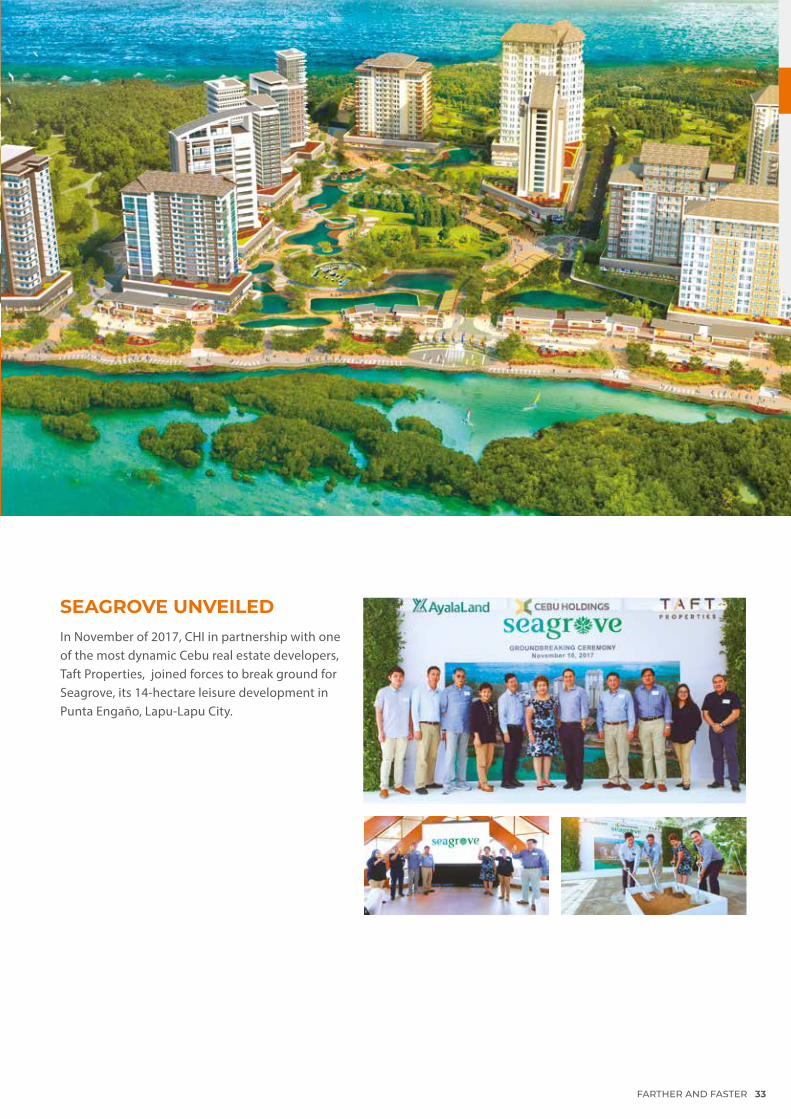
SEAGROVE UNVEILEDIn November of 2017, CHI in partnership with one of the most dynamic Cebu real estate developers, Taft Properties, joined forces to break ground for Seagrove, its 14-hectare leisure development in Punta Engaño, Lapu-Lapu City.
FARTHER AND FASTER 33

We use native and endemic plant and tree species for landscaping and preserving the existing special natural site features to help bring back biodiversity.
MANAGING BIODIVERSITY
22 Species tree biodiversity with 17 Species of native and endemic trees which can be reproduced and propagated
Collection of existing native and endemic species (wildlings and saplings) for production of the landscaping planting requirements
Establishment of a tree nursery and recovery chamber
304-3
Cebu Holdings, Inc. 2017 Integrated Report34

In 2017, assessments were conducted on the following areas:
ECO-INITIATIVES
» Coral reef survey was conducted to determine existing conditions of the coral’s biophysical characteristics and to determine possible areas for coral collection, nursery and rehabilitation sites
» 10.3 hectares of seagrass bed fronting the property to determine seagrass vegetation cover and species
» 6-hectare stretch of mangrove vegetation fronting the property to determine population density and identify species of mangrove-associated flora and fauna
In addition, mangrove and underwater clean ups were conducted by employee volunteers at Seagrove in 2017.
304-3
FARTHER AND FASTER 35

Cardinal Rosales AvenueCebu Business Park
OUTPUTS OUTCOMESRESOURCES
Close to P 50 B
50 hectaresTotal land area
41 Operational Buildings
50 hectares
With 210,801 sqm GFA
Masterplanned integrated estate
With 656, 773 sqm GFA
9 Under Construction
39,390
4%
Provided spaces
Jobs generated
Increase in workforce
For small, medium enterprises and farmers from partner communities
Increase in property valueFrom P14,000 per sqm in 1990 to P170,000 per sqm (based on the last closed sale)
Local suppliers, communities, and stakeholders
Partnership
3,123 Ancillary Services
Small business providing ancillary services such as food, transportation, accommodation, laundry and other services around the estate within the five neighboring communities
Capital for land development, CHI projects and other locators since 1990
Cebu Holdings, Inc. 2017 Integrated Report36

E N G A G E
As we move farther to build new estates, we continue to enhance our established developments. CHI’s flagship development, Cebu Business Park, remains the central business and lifestyle district in Cebu.
With 41 existing developments and nine buildings under construction, this 50-hectare estate is home to regional headquarters, banking institutions, IT and BPO multi-national companies, upscale residential condominiums, and the iconic Ayala Center Cebu.
In 2017, we completed two office towers – Tech Tower and the BPI Cebu Corporate Center – expected to bring in more jobs in addition to over 39,000 workers within Cebu Business Park.
To enhance mobility and pedestrian experience within the estate, we established transit stops and built covered walkways connecting key areas. In addition, the estate strengthened signature events to establish its position as the premier lifestyle destination in the city.
37FARTHER AND FASTER

18%Ongoing Constructions(9 buildings)
3 Residential
6 Office/ retail82%
Operational Buildings (41 buildings)
28 BPO Offices
8 Residential
3 Retail
2 Hotel/ recreational
Cebu Holdings, Inc. 2017 Integrated Report38
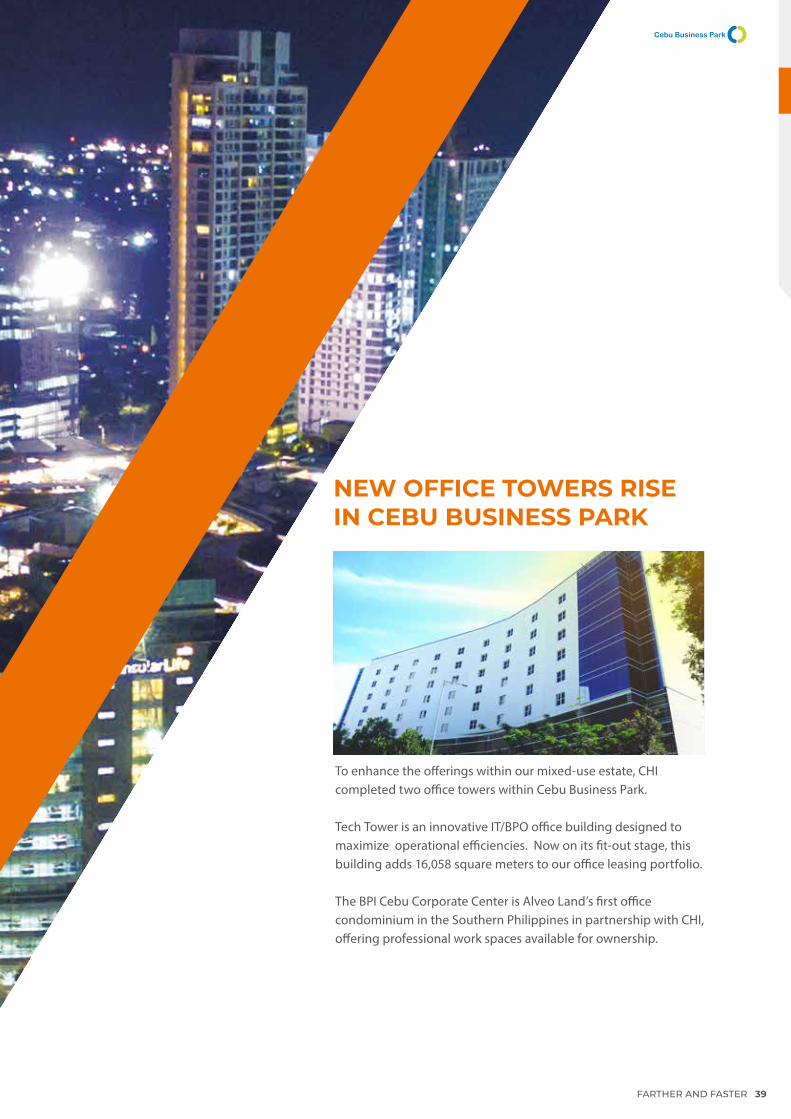
To enhance the offerings within our mixed-use estate, CHI completed two office towers within Cebu Business Park.
Tech Tower is an innovative IT/BPO office building designed to maximize operational efficiencies. Now on its fit-out stage, this building adds 16,058 square meters to our office leasing portfolio.
The BPI Cebu Corporate Center is Alveo Land’s first office condominium in the Southern Philippines in partnership with CHI, offering professional work spaces available for ownership.
NEW OFFICE TOWERS RISE IN CEBU BUSINESS PARK
FARTHER AND FASTER 39
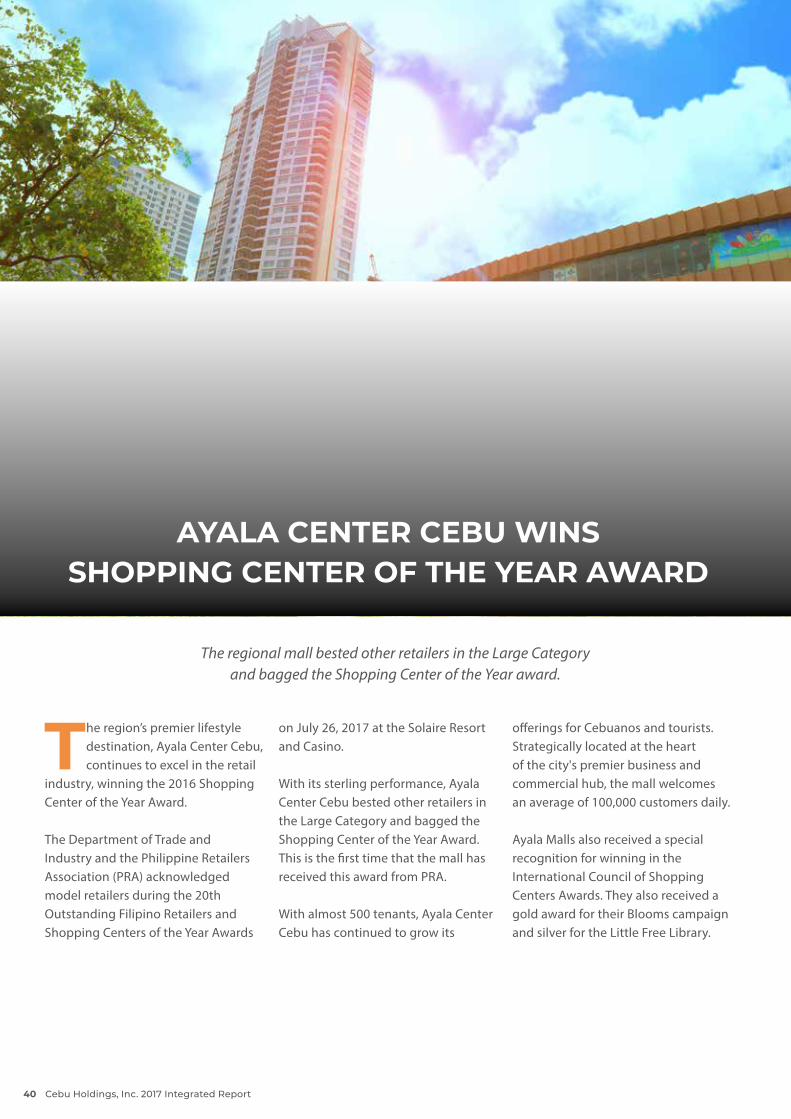
The region’s premier lifestyle destination, Ayala Center Cebu, continues to excel in the retail
industry, winning the 2016 Shopping Center of the Year Award.
The Department of Trade and Industry and the Philippine Retailers Association (PRA) acknowledged model retailers during the 20th Outstanding Filipino Retailers and Shopping Centers of the Year Awards
on July 26, 2017 at the Solaire Resort and Casino.
With its sterling performance, Ayala Center Cebu bested other retailers in the Large Category and bagged the Shopping Center of the Year Award. This is the first time that the mall has received this award from PRA.
With almost 500 tenants, Ayala Center Cebu has continued to grow its
The regional mall bested other retailers in the Large Category and bagged the Shopping Center of the Year award.
AYALA CENTER CEBU WINS SHOPPING CENTER OF THE YEAR AWARD
offerings for Cebuanos and tourists. Strategically located at the heart of the city's premier business and commercial hub, the mall welcomes an average of 100,000 customers daily.
Ayala Malls also received a special recognition for winning in the International Council of Shopping Centers Awards. They also received a gold award for their Blooms campaign and silver for the Little Free Library.
Cebu Holdings, Inc. 2017 Integrated Report40
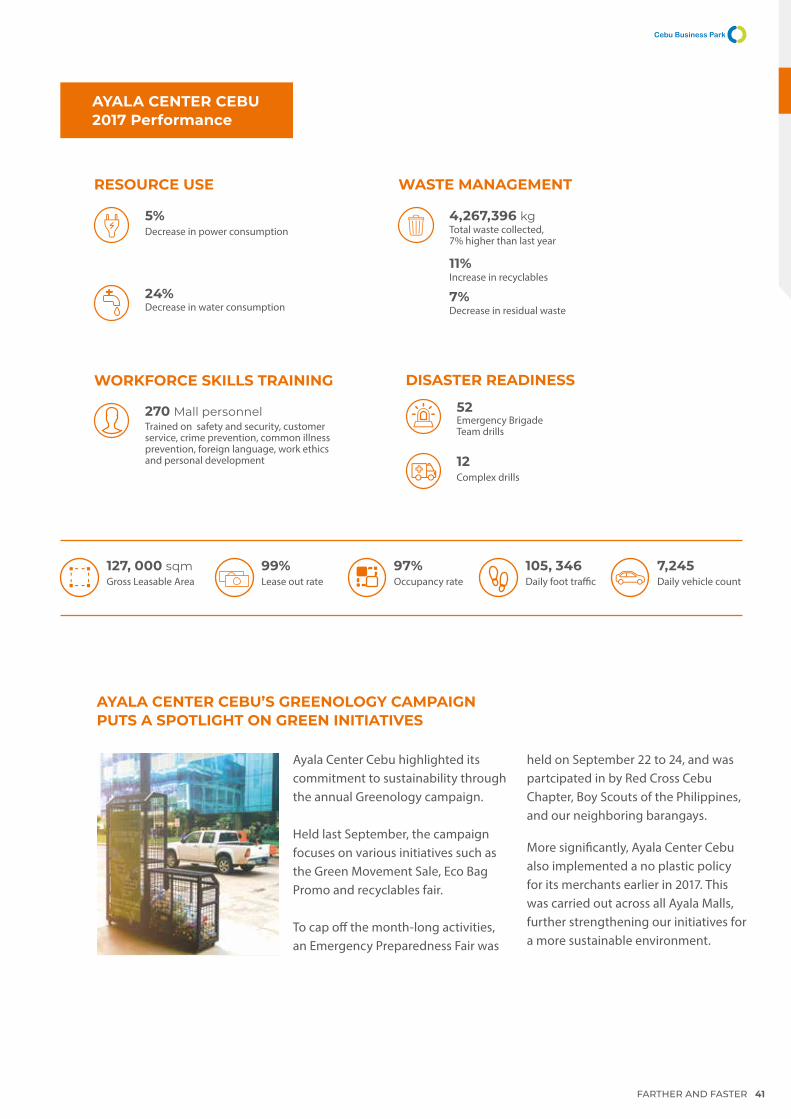
AYALA CENTER CEBU’S GREENOLOGY CAMPAIGN PUTS A SPOTLIGHT ON GREEN INITIATIVES
Ayala Center Cebu highlighted its commitment to sustainability through the annual Greenology campaign.
Held last September, the campaign focuses on various initiatives such as the Green Movement Sale, Eco Bag Promo and recyclables fair.
To cap off the month-long activities, an Emergency Preparedness Fair was
RESOURCE USE
5%Decrease in power consumption
WASTE MANAGEMENT
4,267,396 kg
11%
7%
Total waste collected,7% higher than last year
Increase in recyclables
Decrease in residual waste24%Decrease in water consumption
DISASTER READINESS
52Emergency Brigade Team drills
12Complex drills
held on September 22 to 24, and was partcipated in by Red Cross Cebu Chapter, Boy Scouts of the Philippines, and our neighboring barangays.
More significantly, Ayala Center Cebu also implemented a no plastic policy for its merchants earlier in 2017. This was carried out across all Ayala Malls, further strengthening our initiatives for a more sustainable environment.
WORKFORCE SKILLS TRAINING
270 Mall personnelTrained on safety and security, customer service, crime prevention, common illness prevention, foreign language, work ethics and personal development
127, 000 sqmGross Leasable Area
99%Lease out rate
97%Occupancy rate
105, 346Daily foot traffic
7,245Daily vehicle count
AYALA CENTER CEBU2017 Performance
FARTHER AND FASTER 41
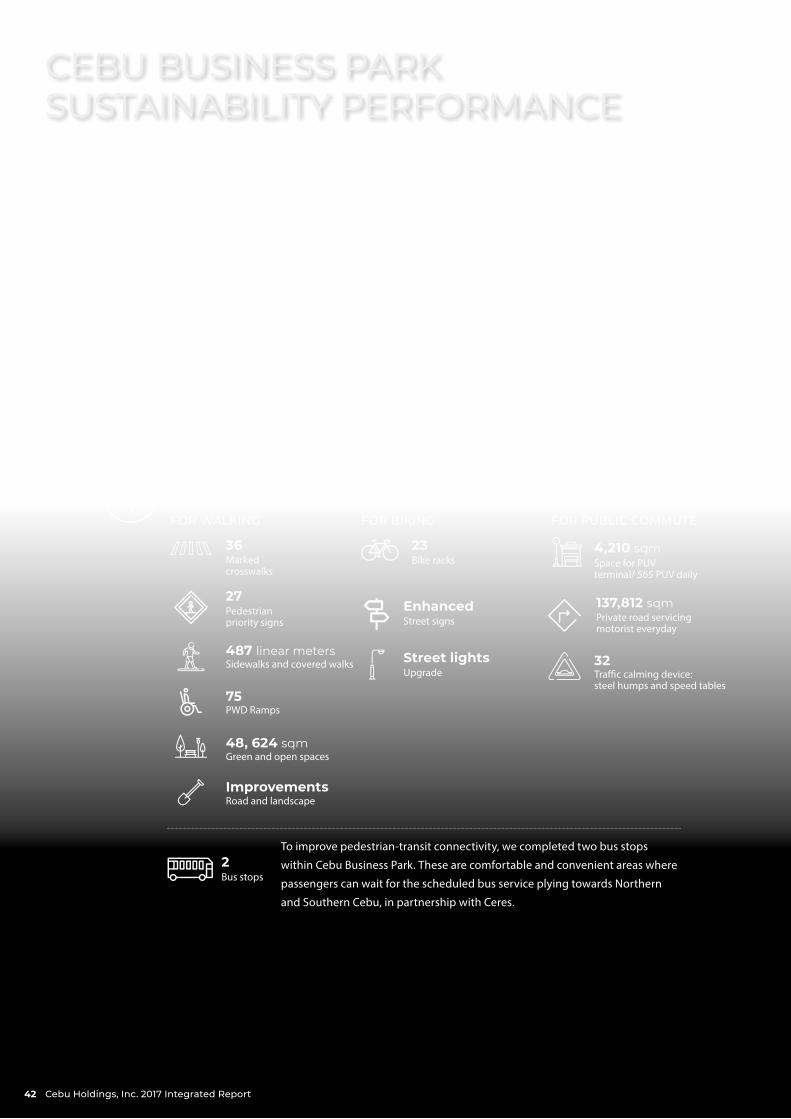
CEBU BUSINESS PARK SUSTAINABILITY PERFORMANCEDespite our continued expansion of Cebu Business Park, we continue to abide by the belief that upholding planetary boundaries and conserving natural resources is the only way to further grow our estate.
This is evident in our achievements in waste management, pedestrianization and mass transport, and the provision of green open spaces throughout the estate.
Our management of resources in the areas of energy, water, reduction of emissions, and reuse of materials also continue to yield good results despite the construction of new commercial buildings and the expansion of our malls.
84,727 sqmSpace used as evacuation area
2,715Number of trees
55Native Species
52Emergency brigade drills, complex drills and 2 park-wide drills
STRONG AND RESILIENT ESTATE
To improve pedestrian-transit connectivity, we completed two bus stops
within Cebu Business Park. These are comfortable and convenient areas where
passengers can wait for the scheduled bus service plying towards Northern
and Southern Cebu, in partnership with Ceres.
23Bike racks
INNOVATIONS FOR PEDESTRIAN MOBILITY AND TRANSIT CONNECTIVITY
FOR WALKING FOR BIKING FOR PUBLIC COMMUTE
48, 624 sqmGreen and open spaces
27Pedestrian priority signs
487 linear metersSidewalks and covered walks
75PWD Ramps
36Marked crosswalks
ImprovementsRoad and landscape
4,210 sqmSpace for PUV terminal/ 565 PUV daily
Street lightsUpgrade
EnhancedStreet signs
2Bus stops
137,812 sqmPrivate road servicingmotorist everyday
32Traffic calming device:steel humps and speed tables
Cebu Holdings, Inc. 2017 Integrated Report42

Workforce increasedto 39,390,6% higherthan in 2016
EFFICIENT RESOURCE USE AND WASTE MANAGEMENT
WASTE
ENERGY Total Energy consumption 17% increase vs. 2016
1,197 gigajoules
EMISSIONEmission intesity17% increase vs. 2016
0.001 tonnes CO2/ sqm
cu.m1,922 WATER
CONTRIBUTION TO LOCAL ECONOMIC DEVELOPMENT
5,344Ongoing construction
Residential
Retail
Hotel/ Leisure
BPO/ IT/ Telco
164
9,547
207
16,454
Traditional offices/ banks7,674
17% increase vs. 20160.0062 gigajoules/sqm
Reduction vs. 20162%
Workforcebreakdown
102-8
301-2 , 302-1, 302-3, 305-4
17% increase vs. 2016201 tonnes CO2
Reduction in waste generated in common areas
21%Total recyclable waste collected in common areas
16,309 kg
Total water consumption
43FARTHER AND FASTER
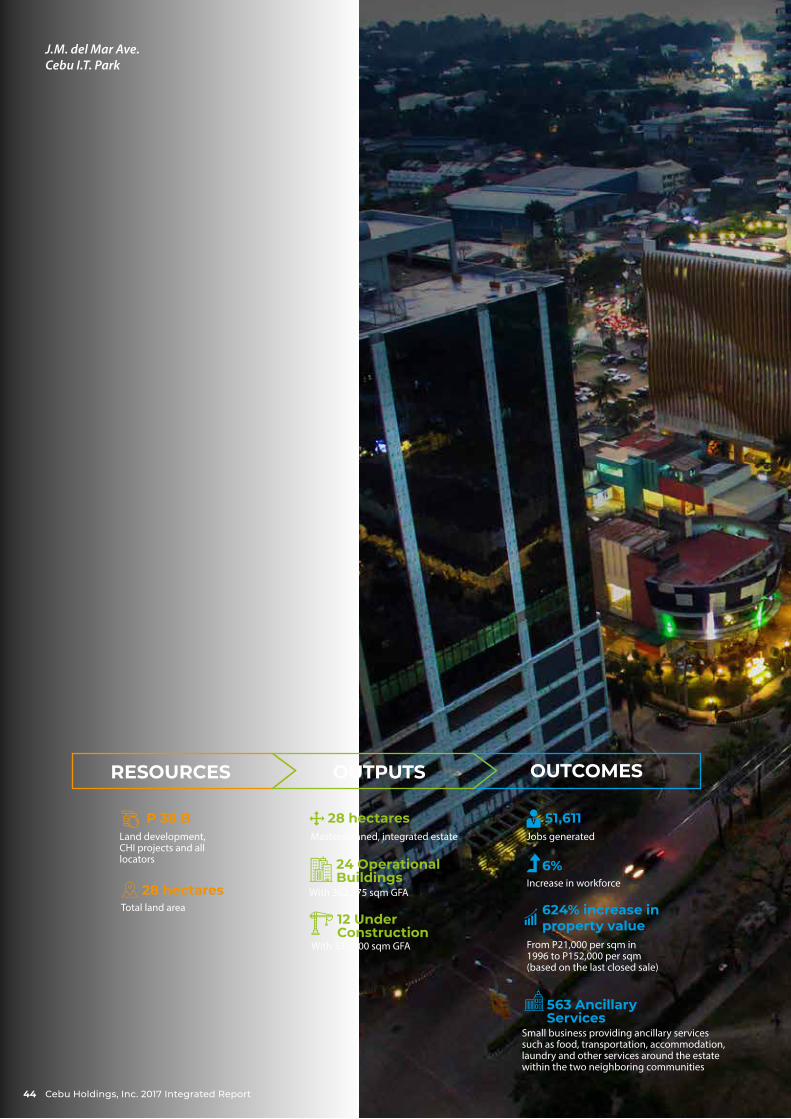
J.M. del Mar Ave.Cebu I.T. Park
P 38 BLand development, CHI projects and all locators
28 hectaresTotal land area
24 Operational Buildings
28 hectares
With 337,000 sqm GFA
Masterplanned, integrated estate
With 362,375 sqm GFA
12 Under Construction
51,611
6%
Jobs generated
Increase in workforce
624% increase in property value
From P21,000 per sqm in1996 to P152,000 per sqm (based on the last closed sale)
563 Ancillary Services
Small business providing ancillary services such as food, transportation, accommodation, laundry and other services around the estate within the two neighboring communities
OUTPUTS OUTCOMESRESOURCES
Cebu Holdings, Inc. 2017 Integrated Report44
We continue to capitalize on the fast-moving information technology industry as an agile organization ready to address market needs.
Build-up continues at Cebu I.T. Park with 12 buildings in construction, in addition to the park’s 24 buildings. This increased the workforce in the IT Park to 51,611, a six percent increase from the previous year.
Subsidiary Cebu Property Ventures and Development Corporation’s eBloc Tower series continues to be the address of choice of multi-national IT and BPO companies and are fully leased-out.
In 2017, we focused on diversifying our portfolio with a larger retail play with the continuing construction of Central Bloc. We also added more dining and entertainment options at the Garden Bloc and the new Garden Row.
As the community at the IT Park continues to grow, we enhanced support facilities such as established transit stops and pedestrian crossings. We also invested in an enhanced sewage treatment plant and wastewater management system.
45FARTHER AND FASTER
E X P E R I E N C E
eBLOC TOWERS
Subsidiary Cebu Property Ventures and Development Corporation’s eBloc Tower series continues to be the address of choice of multi-national IT and BPO companies. All four eBloc Towers are fully leased out, while their retail shops at the ground level add to the vibrant atmosphere in the IT Park.
CENTRAL BLOC AND GARDEN ROW
The Central Bloc is a stacked two-hectare superblock, which will include a regional mall, a hotel, and office towers. This new project will also enhance the pedestrian experience, connecting the growing number of buildings within the park.
Progress on construction as of the end of 2017 was at 59 percent, with the mall set to be completed in 2019. Connecting Central Bloc to The Walk is the Garden Row – a landscaped promenade punctuated by popular dining outlets. The first store on the strip, 10 Dove Street, opened in December 2017.
GARDEN BLOC
The refreshed Garden Bloc continues to be a popular destination among the growing IT Park community. New dining and entertainment choices including Park Social, The Pyramid, Buffalo Brad’s Hot Wings, Sushi Boy, Baguio Brewery and Shaka opened in 2017.
Cebu Holdings, Inc. 2017 Integrated Report46
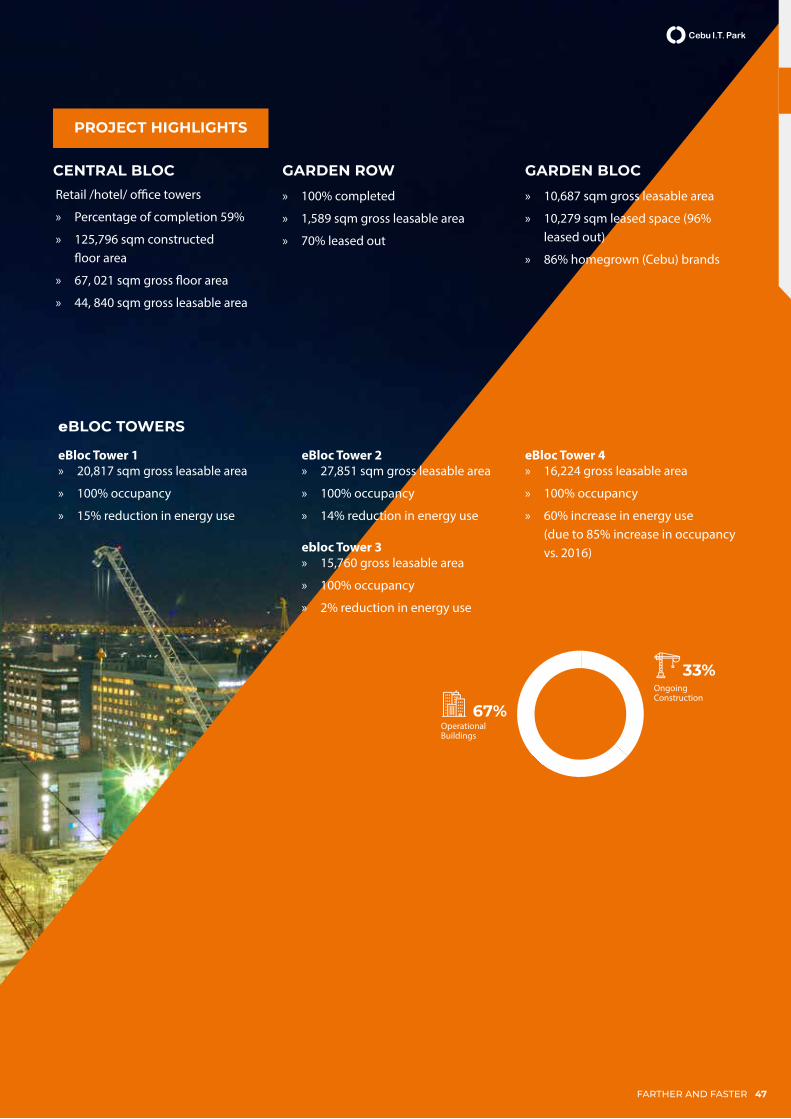
eBloc Tower 1 » 20,817 sqm gross leasable area
» 100% occupancy
» 15% reduction in energy use
PROJECT HIGHLIGHTS
Retail /hotel/ office towers
» Percentage of completion 59%
» 125,796 sqm constructed floor area
» 67, 021 sqm gross floor area
» 44, 840 sqm gross leasable area
CENTRAL BLOC
» 100% completed
» 1,589 sqm gross leasable area
» 70% leased out
GARDEN ROW
eBLOC TOWERS
eBloc Tower 2 » 27,851 sqm gross leasable area
» 100% occupancy
» 14% reduction in energy use
ebloc Tower 3 » 15,760 gross leasable area
» 100% occupancy
» 2% reduction in energy use
eBloc Tower 4 » 16,224 gross leasable area
» 100% occupancy
» 60% increase in energy use (due to 85% increase in occupancy vs. 2016)
67%Operational Buildings
33%OngoingConstruction
» 10,687 sqm gross leasable area
» 10,279 sqm leased space (96% leased out)
» 86% homegrown (Cebu) brands
GARDEN BLOC
47FARTHER AND FASTER

CEBU IT PARKSUSTAINABILITY PERFORMANCECebu I.T. Park continues to shine as a model of sustainable development in the Visayas.
Our recent and larger investments in wastewater facilities, and support facilities for public transport and pedestrian mobility, are testaments to our commitment to continue growing our estate alongside the preservation of the planet.
As we move at an even faster pace, we will remain as active advocates of sustainability, always mindful of our impacts on society and our natural environment.
Cebu Holdings, Inc. 2017 Integrated Report48
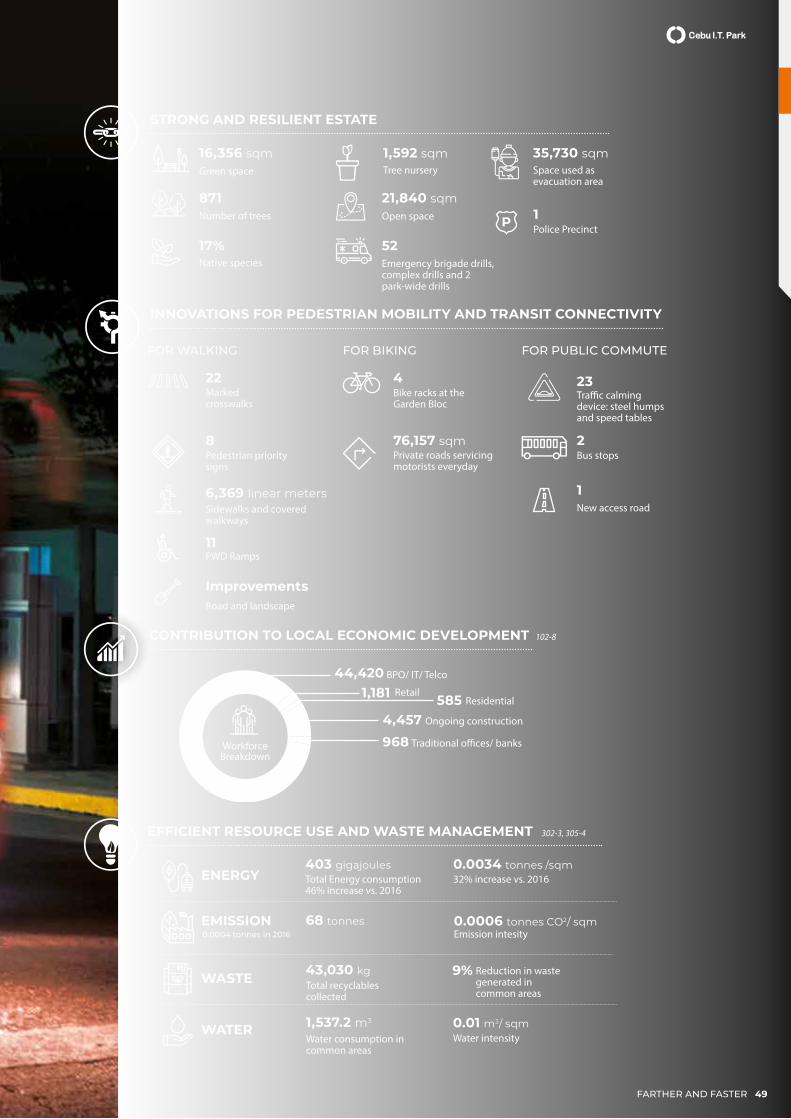
35,730 sqmSpace used as evacuation area
871Number of trees
17%Native species
16,356 sqmGreen space
52Emergency brigade drills, complex drills and 2park-wide drills
21,840 sqmOpen space
1,592 sqmTree nursery
INNOVATIONS FOR PEDESTRIAN MOBILITY AND TRANSIT CONNECTIVITY
STRONG AND RESILIENT ESTATE
RetailResidential
Ongoing construction
WorkforceBreakdown
BPO/ IT/ Telco
Traditional offices/ banks
1,181 5854,457
44,420
968
EFFICIENT RESOURCE USE AND WASTE MANAGEMENT
WASTE
ENERGY Total Energy consumption 46% increase vs. 2016
403 gigajoules32% increase vs. 20160.0034 tonnes /sqm
EMISSION0.0004 tonnes in 2016
68 tonnes
WATER
CONTRIBUTION TO LOCAL ECONOMIC DEVELOPMENT
23Traffic calming device: steel humps and speed tables
76,157 sqmPrivate roads servicingmotorists everyday
4Bike racks at theGarden Bloc
1New access road
1Police Precinct
2Bus stops
8Pedestrian prioritysigns
6,369 linear metersSidewalks and covered walkways
11PWD Ramps
22Marked crosswalks
ImprovementsRoad and landscape
FOR WALKING FOR BIKING FOR PUBLIC COMMUTE
102-8
302-3, 305-4
Water intensity0.01 m3/ sqm
Water consumption in common areas
1,537.2 m3
Reduction in waste generated in common areas
9%Total recyclables collected
43,030 kg
Emission intesity0.0006 tonnes CO2/ sqm
49FARTHER AND FASTER

In 2017, CHI conducted training workshops on Takakura composting among the maintenance personnel of Cebu IT Park, including those of Cebu Business Park and Ayala Center Cebu.
This initiative aims to further reduce residual waste and to make use of yard waste to generate good quality soil enhancers and fertilizers for the estates' landscaping.
SOLID WASTE MANAGEMENT AT CEBU I.T. PARK
» 1,592 sqm tree nursery
» 34 sqm composting area
» 582 bamboo propagated
» 20,597 kgs of biodegradable waste for compost production
Cebu Holdings, Inc. 2017 Integrated Report50
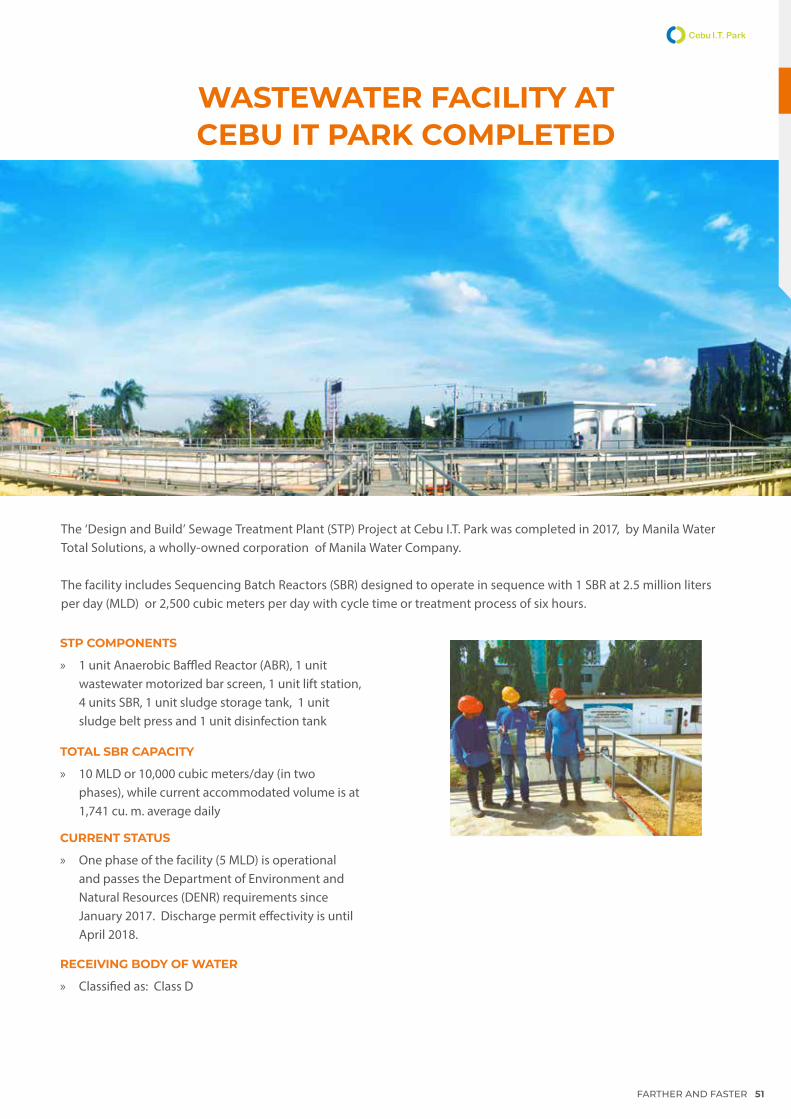
TOTAL SBR CAPACITY
» 10 MLD or 10,000 cubic meters/day (in two phases), while current accommodated volume is at 1,741 cu. m. average daily
STP COMPONENTS
» 1 unit Anaerobic Baffled Reactor (ABR), 1 unit wastewater motorized bar screen, 1 unit lift station, 4 units SBR, 1 unit sludge storage tank, 1 unit sludge belt press and 1 unit disinfection tank
RECEIVING BODY OF WATER
» Classified as: Class D
CURRENT STATUS
» One phase of the facility (5 MLD) is operational and passes the Department of Environment and Natural Resources (DENR) requirements since January 2017. Discharge permit effectivity is until April 2018.
The ‘Design and Build’ Sewage Treatment Plant (STP) Project at Cebu I.T. Park was completed in 2017, by Manila Water Total Solutions, a wholly-owned corporation of Manila Water Company.
The facility includes Sequencing Batch Reactors (SBR) designed to operate in sequence with 1 SBR at 2.5 million liters per day (MLD) or 2,500 cubic meters per day with cycle time or treatment process of six hours.
WASTEWATER FACILITY AT CEBU IT PARK COMPLETED
FARTHER AND FASTER 51

Gatewalk CentralMandaue City
Workforce
9,000 workers
(Land development) as of end of 2017
1,300 workersRequirement at construction
Requirement at operations
101 workers
OUTPUTS OUTCOMES
P 10 billionProjected Capital Expenditures (Phase 1)
18 hectaresTotal land area
RESOURCES
174,589 sqm
169,795 sqm GFAMall and office
Developable lots, roads, utilities and open spaces
Mall structure (For construction)
BERDE standards-compliant
Cebu Holdings, Inc. 2017 Integrated Report52

Gatewalk Central, launched in June of 2016, was CHI’s first venture outside Cebu City. This project is a collaboration with parent company, Ayala Land, and AboitizLand.
Located in Subangdaku, Mandaue, this 18-hectare masterplanned estate will provide a highly-energized lifestyle experience with office buildings, residential spaces, family-
friendly parks, refreshing retail selections and an Ayala Mall. These components will be seamlessly anchored on the development’s main feature – a 30-meter pedestrian-only spine which runs through the entire estate.
The development is currently under construction with the mall set to open in 2021.
53FARTHER AND FASTER
E X C I T E

ESPLANADEThe Esplanade is a long, open space of intersecting crosswalks that provide more opportunity for socialization. The tree-lined lawn showcasing public art acts as a major pedestrian corridor that encourages visitors to move freely between the other districts of the site.
GATEWALK PLAZAThe Plaza is the estate's focal point for vibrant leisure concepts and bright celebrations. This designated recreational environment encourages the mental and physical health of the individual while also providing large audiences a constant venue for entertainment.
GARDEN DISTRICTThe Garden District is a more intimate space that provides a smooth transition between the indoor and outdoor circulation of the site. Visitors enjoy ample seating while conversing or simply watching the recreational activities of others on the lawn. Ample street space offers safe movement for all users and features continuous shade on either edge, provided by the buildings and tree canopy.
GATEWALK AVENUELocated in an industrial area, Gatewalk Avenue contextually reflects its surroundings with its repurposed shipping containers that house a mix of dining and retail shops. These containers are boutique spaces that will encourage the growth of small business and start-ups. This community-centered district is an alternative to the crowded, oversaturated city climate.
PROJECT HIGHLIGHTS
Cebu Holdings, Inc. 2017 Integrated Report54
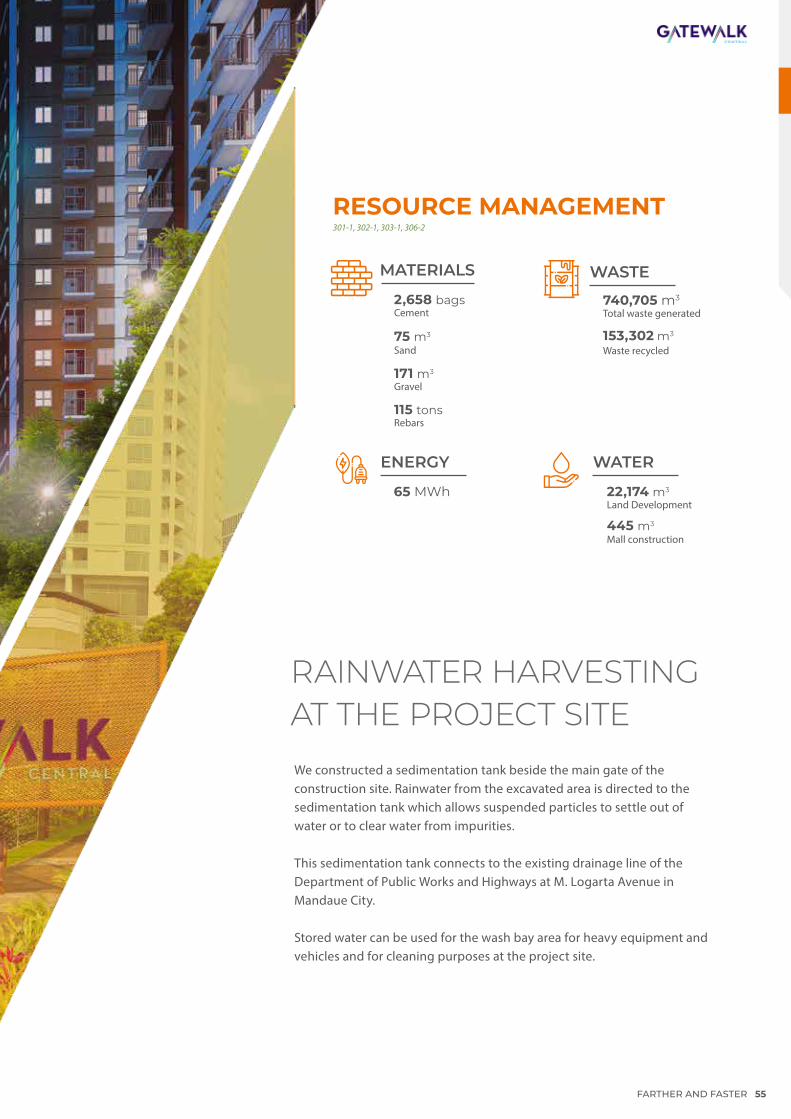
We constructed a sedimentation tank beside the main gate of the construction site. Rainwater from the excavated area is directed to the sedimentation tank which allows suspended particles to settle out of water or to clear water from impurities.
This sedimentation tank connects to the existing drainage line of the Department of Public Works and Highways at M. Logarta Avenue in Mandaue City.
Stored water can be used for the wash bay area for heavy equipment and vehicles and for cleaning purposes at the project site.
RAINWATER HARVESTING AT THE PROJECT SITE
RESOURCE MANAGEMENT301-1, 302-1, 303-1, 306-2
WASTE
Total waste generated740,705 m3
Waste recycled153,302 m3
ENERGY
65 MWh
Mall construction445 m3
Land Development22,174 m3
WATER
Rebars
MATERIALS
115 tons
Cement2,658 bags
Sand75 m3
Gravel171 m3
FARTHER AND FASTER 55

Our premier seaside residential development, Amara, launched a new phase towards the end of 2016.
Designed as a truly distinctive community, it complements the first-class resort amenities of earlier sold out phases including the grand clubhouse which features infinity pools, a Jacuzzi, social hall, function room, a beach bar and view decks with spectacular views of the Mactan channel.
This latest phase was 69 percent sold as of the end of 2017.
Amara, an Ayala Land Premier community, is a joint development project of CHI with Coastal Highpoint Ventures Development Inc. (CHVI). This scenic community sits on a 46-hectare property located at Barangay Catarman Liloan, Cebu, approximately 18 kilometers from the city.
Cebu Holdings, Inc. 2017 Integrated Report56
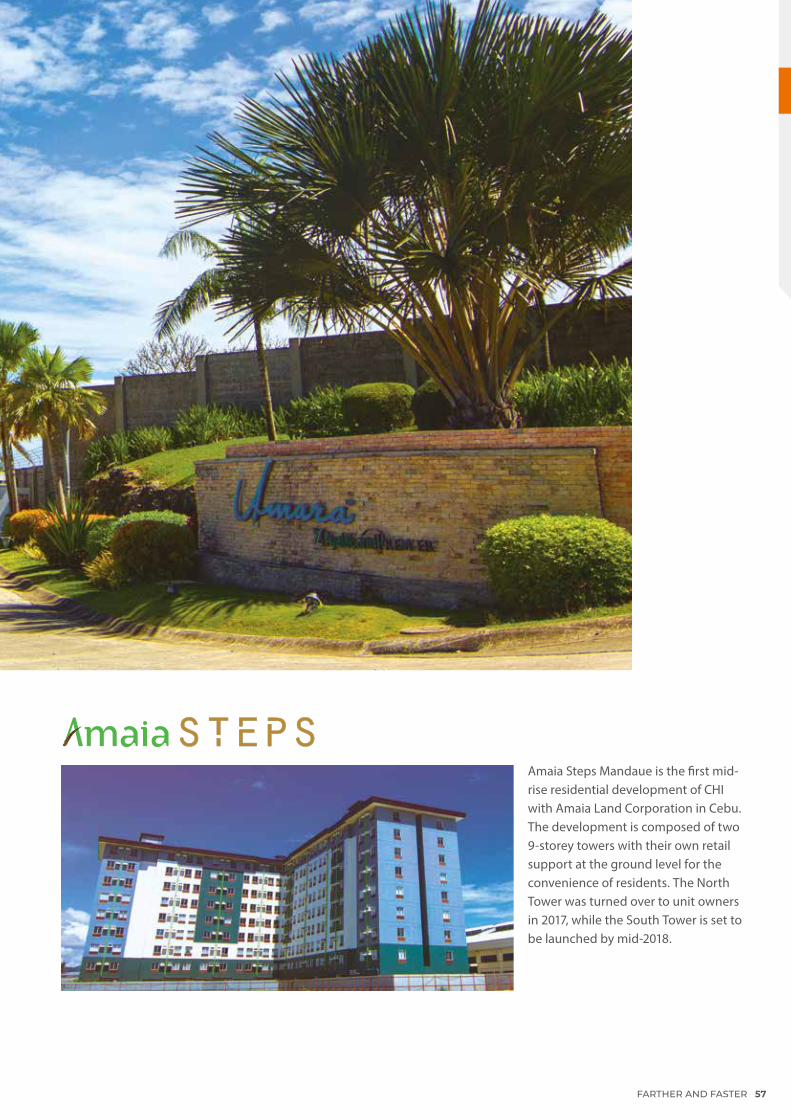
Amaia Steps Mandaue is the first mid-rise residential development of CHI with Amaia Land Corporation in Cebu. The development is composed of two 9-storey towers with their own retail support at the ground level for the convenience of residents. The North Tower was turned over to unit owners in 2017, while the South Tower is set to be launched by mid-2018.
FARTHER AND FASTER 57
STAKEHOLDERENGAGEMENT
CHI views its leadership role in Cebu as an opportunity to engage a wide host of groups to work for a more sustainable province.
We develop enduring and meaningful relationships with our stakeholders to enrich our economy and extend inclusive growth to more Cebuanos.
In 2017, we held a diverse series of stakeholder sessions to open transparent communicationchannels, inspire a clearer understanding of our work, and explore more areas of collaboration.
In this section, we discuss in detail our stakeholder engagement process, our supply chain management and value delivery chain, and our core programs for our employees and other key publics.
Cebu Holdings, Inc. 2017 Integrated Report58 Cebu Holdings, Inc. 2017 Integrated Report58
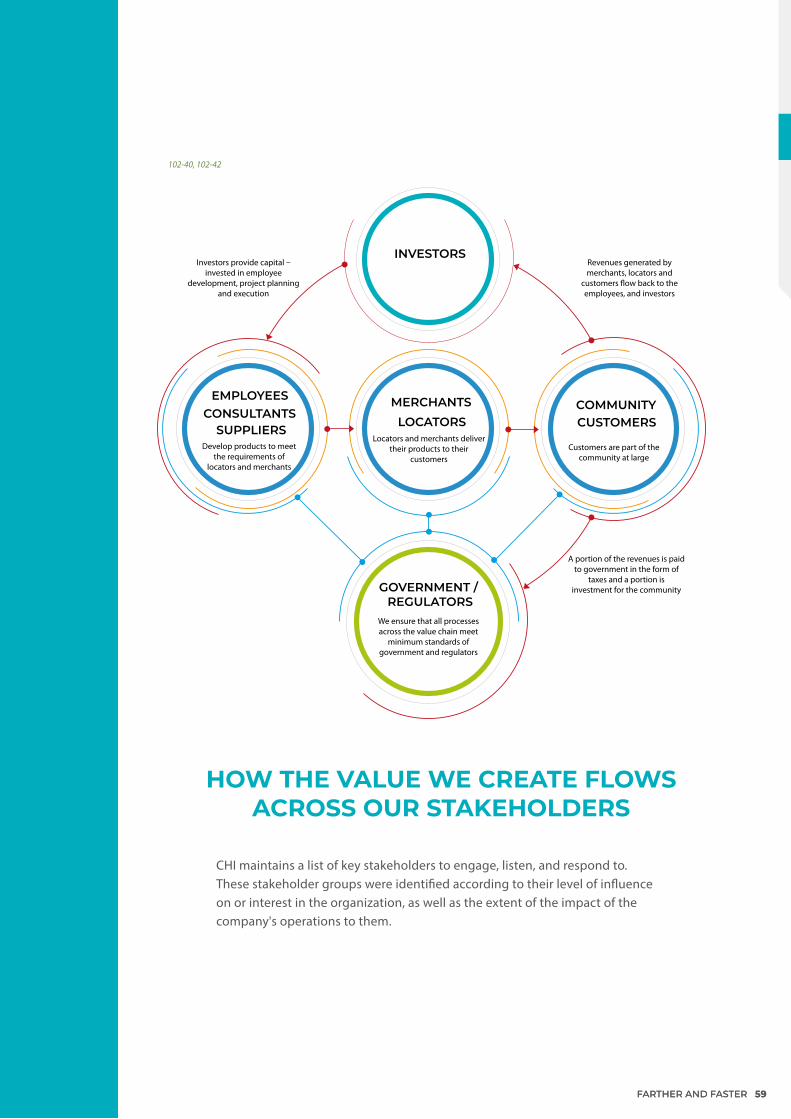
CHI maintains a list of key stakeholders to engage, listen, and respond to.These stakeholder groups were identified according to their level of influence on or interest in the organization, as well as the extent of the impact of the company's operations to them.
HOW THE VALUE WE CREATE FLOWS ACROSS OUR STAKEHOLDERS
102-40, 102-42
EMPLOYEES
SUPPLIERS
MERCHANTSLOCATORS
INVESTORS
GOVERNMENT / REGULATORS
COMMUNITYCUSTOMERS
CONSULTANTS
Develop products to meet the requirements of
locators and merchants
We ensure that all processes across the value chain meet
minimum standards of government and regulators
Locators and merchants deliver their products to their
customers
Investors provide capital – invested in employee
development, project planning and execution
Revenues generated by merchants, locators and
customers �ow back to the employees, and investors
A portion of the revenues is paid to government in the form of
taxes and a portion is investment for the community
Customers are part of the community at large
FARTHER AND FASTER 5959FARTHER AND FASTER
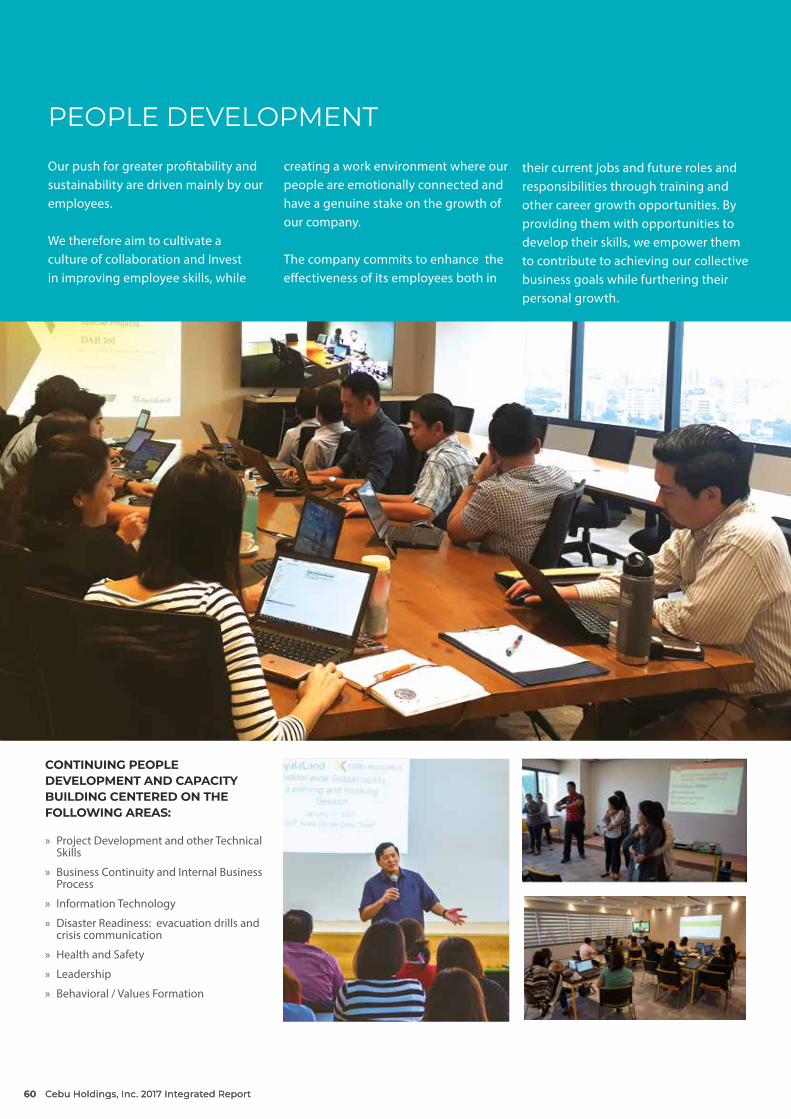
CONTINUING PEOPLE DEVELOPMENT AND CAPACITY BUILDING CENTERED ON THE FOLLOWING AREAS:
» Project Development and other Technical Skills
» Business Continuity and Internal Business Process
» Information Technology
» Disaster Readiness: evacuation drills and crisis communication
» Health and Safety
» Leadership
» Behavioral / Values Formation
PEOPLE DEVELOPMENT
Our push for greater profitability and sustainability are driven mainly by our employees.
We therefore aim to cultivate a culture of collaboration and Invest in improving employee skills, while
creating a work environment where our people are emotionally connected and have a genuine stake on the growth of our company.
The company commits to enhance the effectiveness of its employees both in
their current jobs and future roles and responsibilities through training and other career growth opportunities. By providing them with opportunities to develop their skills, we empower them to contribute to achieving our collective business goals while furthering their personal growth.
Cebu Holdings, Inc. 2017 Integrated Report60 Cebu Holdings, Inc. 2017 Integrated Report60
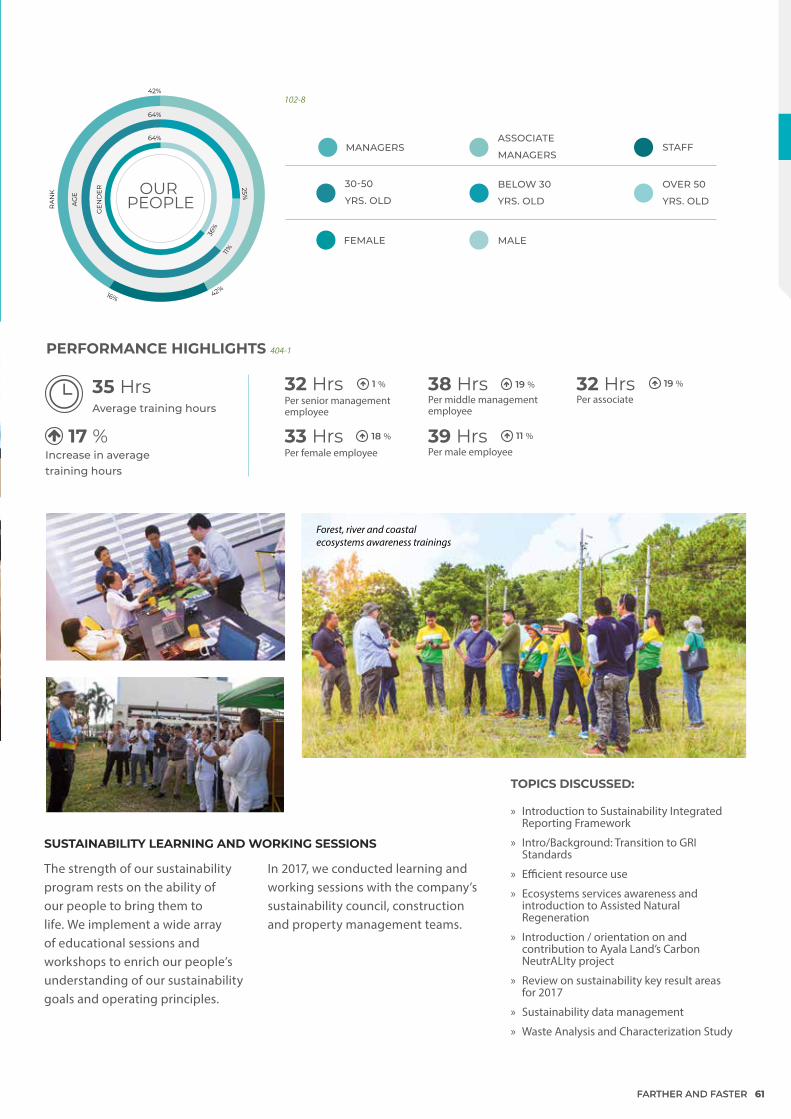
64%
64%
36%
25%
11%
16% 42%
OUR PEOPLE
42%
RA
NK
AG
E
GE
ND
ER
Per male employee39 Hrs 11 %18 %33 Hrs
Per female employeeIncrease in average training hours
17 %
35 HrsAverage training hours
19 %32 HrsPer associate
19 %38 HrsPer middle management employee
1 %32 HrsPer senior management employee
PERFORMANCE HIGHLIGHTS 404-1
The strength of our sustainability program rests on the ability of our people to bring them to life. We implement a wide array of educational sessions and workshops to enrich our people’s understanding of our sustainability goals and operating principles.
SUSTAINABILITY LEARNING AND WORKING SESSIONS
TOPICS DISCUSSED:
» Introduction to Sustainability Integrated Reporting Framework
» Intro/Background: Transition to GRI Standards
» Efficient resource use
» Ecosystems services awareness and introduction to Assisted Natural Regeneration
» Introduction / orientation on and contribution to Ayala Land’s Carbon NeutrALIty project
» Review on sustainability key result areas for 2017
» Sustainability data management
» Waste Analysis and Characterization Study
Forest, river and coastal ecosystems awareness trainings
OVER 50
YRS. OLD
30-50
YRS. OLD
BELOW 30
YRS. OLD
STAFFASSOCIATE
MANAGERSMANAGERS
FEMALE MALE
In 2017, we conducted learning and working sessions with the company’s sustainability council, construction and property management teams.
102-8
FARTHER AND FASTER 6161FARTHER AND FASTER

LIVING THE VALUESCHI’s entry won in parent company Ayala Land’s, ‘Who is your Leader’ photo contest. This initiative is in line with ALI’s 29th anniversary celebration. The entry was submitted by the Business Development Team’s Romulo M. Alajid.
#GREENOVATIONGreening the workplace with CHI Rethink Recycling Plastic Waste Collection Program and maximizing the use of the company's video conferencing facility to reduce business travel.
EMPLOYEE ENGAGEMENT
MOOD WALL Encourage sharing of employees' ideas and interest by participating in activities posted in the mood wall.Aside from organizational announcements and corporate updates, the moodwall also serves as a venue for employees to express ideas and interest by participating in activities posted in the moodwall.
GREEN MEETINGS
We focus on issues that matter most to our employees. We genuinely value their opinion, and commit to honest, open communication lines that support both their personal and professional paths in life.
Our ultimate goal is to retain the best talents while ensuring that their best interests are upheld.
Cebu Holdings, Inc. 2017 Integrated Report62 Cebu Holdings, Inc. 2017 Integrated Report62
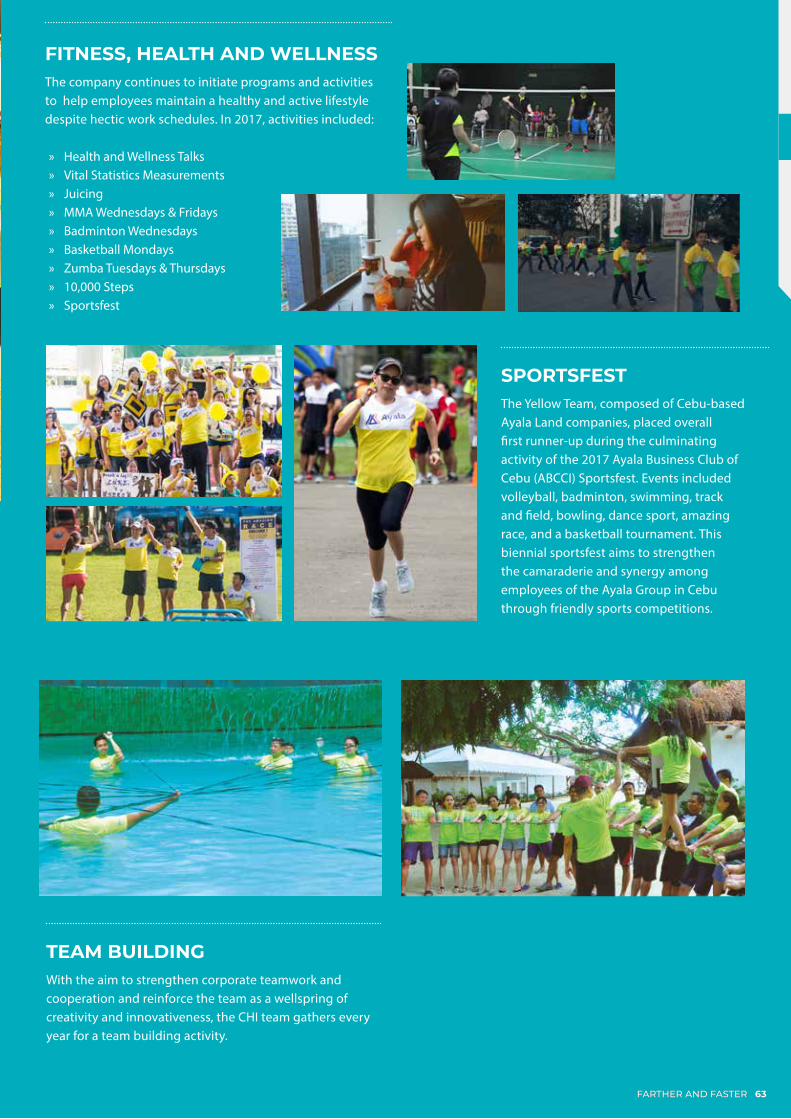
SPORTSFESTThe Yellow Team, composed of Cebu-based Ayala Land companies, placed overall first runner-up during the culminating activity of the 2017 Ayala Business Club of Cebu (ABCCI) Sportsfest. Events included volleyball, badminton, swimming, track and field, bowling, dance sport, amazing race, and a basketball tournament. This biennial sportsfest aims to strengthen the camaraderie and synergy among employees of the Ayala Group in Cebu through friendly sports competitions.
FITNESS, HEALTH AND WELLNESSThe company continues to initiate programs and activities to help employees maintain a healthy and active lifestyle despite hectic work schedules. In 2017, activities included:
» Health and Wellness Talks » Vital Statistics Measurements » Juicing » MMA Wednesdays & Fridays » Badminton Wednesdays » Basketball Mondays » Zumba Tuesdays & Thursdays » 10,000 Steps » Sportsfest
TEAM BUILDINGWith the aim to strengthen corporate teamwork and cooperation and reinforce the team as a wellspring of creativity and innovativeness, the CHI team gathers every year for a team building activity.
FARTHER AND FASTER 6363FARTHER AND FASTER
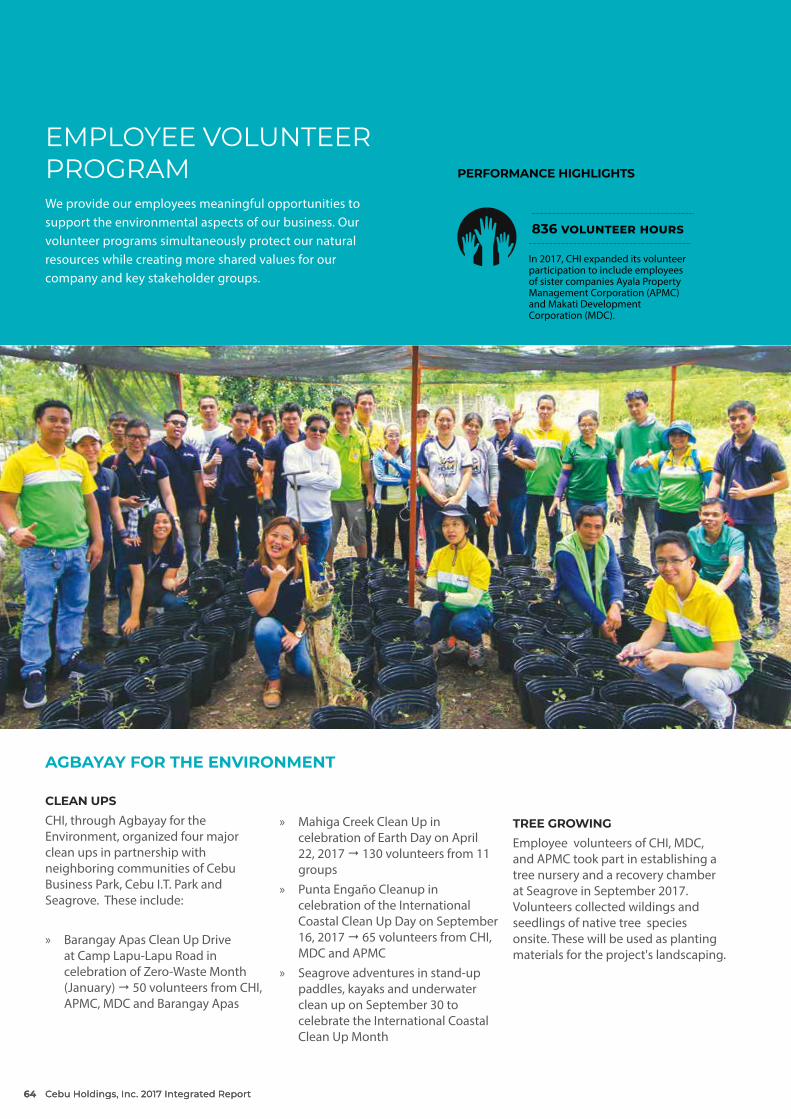
AGBAYAY FOR THE ENVIRONMENT
EMPLOYEE VOLUNTEER PROGRAMWe provide our employees meaningful opportunities to support the environmental aspects of our business. Our volunteer programs simultaneously protect our natural resources while creating more shared values for our company and key stakeholder groups.
CLEAN UPSCHI, through Agbayay for the Environment, organized four major clean ups in partnership with neighboring communities of Cebu Business Park, Cebu I.T. Park and Seagrove. These include:
» Barangay Apas Clean Up Drive at Camp Lapu-Lapu Road in celebration of Zero-Waste Month (January) 50 volunteers from CHI, APMC, MDC and Barangay Apas
» Mahiga Creek Clean Up in celebration of Earth Day on April 22, 2017 130 volunteers from 11 groups
» Punta Engaño Cleanup in celebration of the International Coastal Clean Up Day on September 16, 2017 65 volunteers from CHI, MDC and APMC
» Seagrove adventures in stand-up paddles, kayaks and underwater clean up on September 30 to celebrate the International Coastal Clean Up Month
836 volunteer hours
PERFORMANCE HIGHLIGHTS
TREE GROWINGEmployee volunteers of CHI, MDC, and APMC took part in establishing a tree nursery and a recovery chamber at Seagrove in September 2017. Volunteers collected wildings and seedlings of native tree species onsite. These will be used as planting materials for the project's landscaping.
In 2017, CHI expanded its volunteer participation to include employees of sister companies Ayala Property Management Corporation (APMC) and Makati DevelopmentCorporation (MDC).
Cebu Holdings, Inc. 2017 Integrated Report64 Cebu Holdings, Inc. 2017 Integrated Report64

FARTHER AND FASTER 65
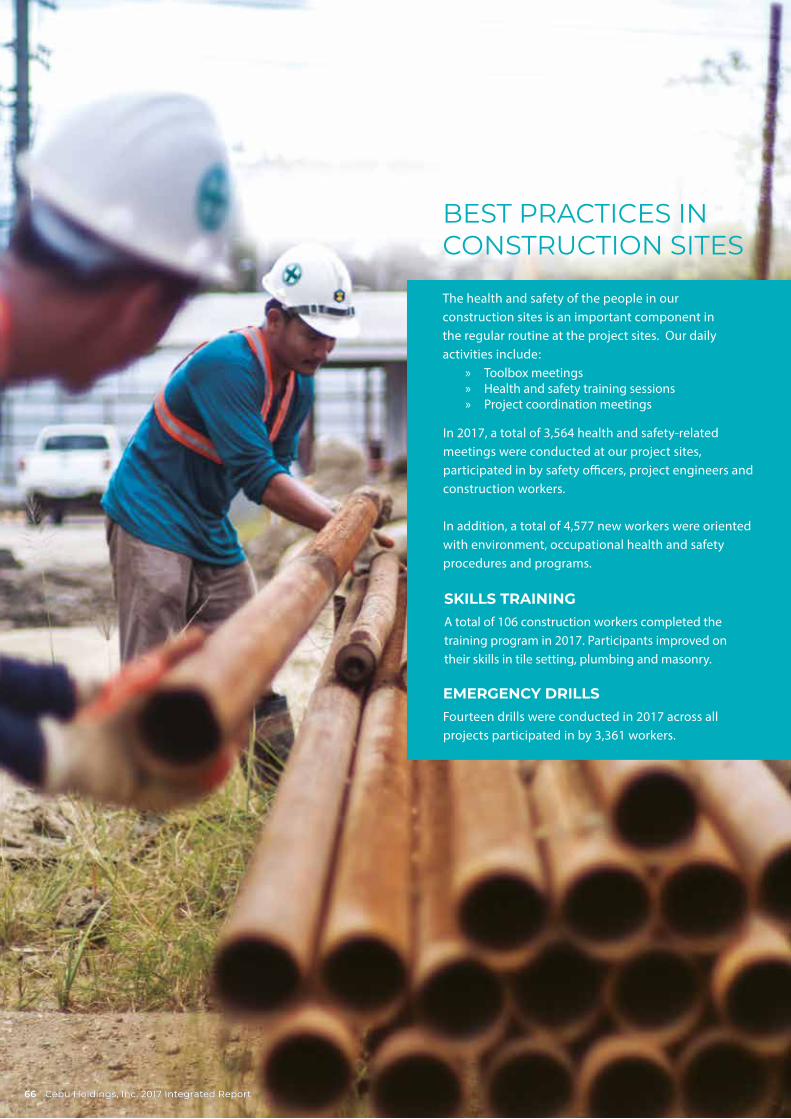
The health and safety of the people in our construction sites is an important component in the regular routine at the project sites. Our daily activities include :
» Toolbox meetings » Health and safety training sessions » Project coordination meetings
SKILLS TRAININGA total of 106 construction workers completed the training program in 2017. Participants improved on their skills in tile setting, plumbing and masonry.
BEST PRACTICES IN CONSTRUCTION SITES
In 2017, a total of 3,564 health and safety-related meetings were conducted at our project sites, participated in by safety officers, project engineers and construction workers.
In addition, a total of 4,577 new workers were oriented with environment, occupational health and safety procedures and programs.
EMERGENCY DRILLSFourteen drills were conducted in 2017 across all projects participated in by 3,361 workers.
Cebu Holdings, Inc. 2017 Integrated Report66 Cebu Holdings, Inc. 2017 Integrated Report66
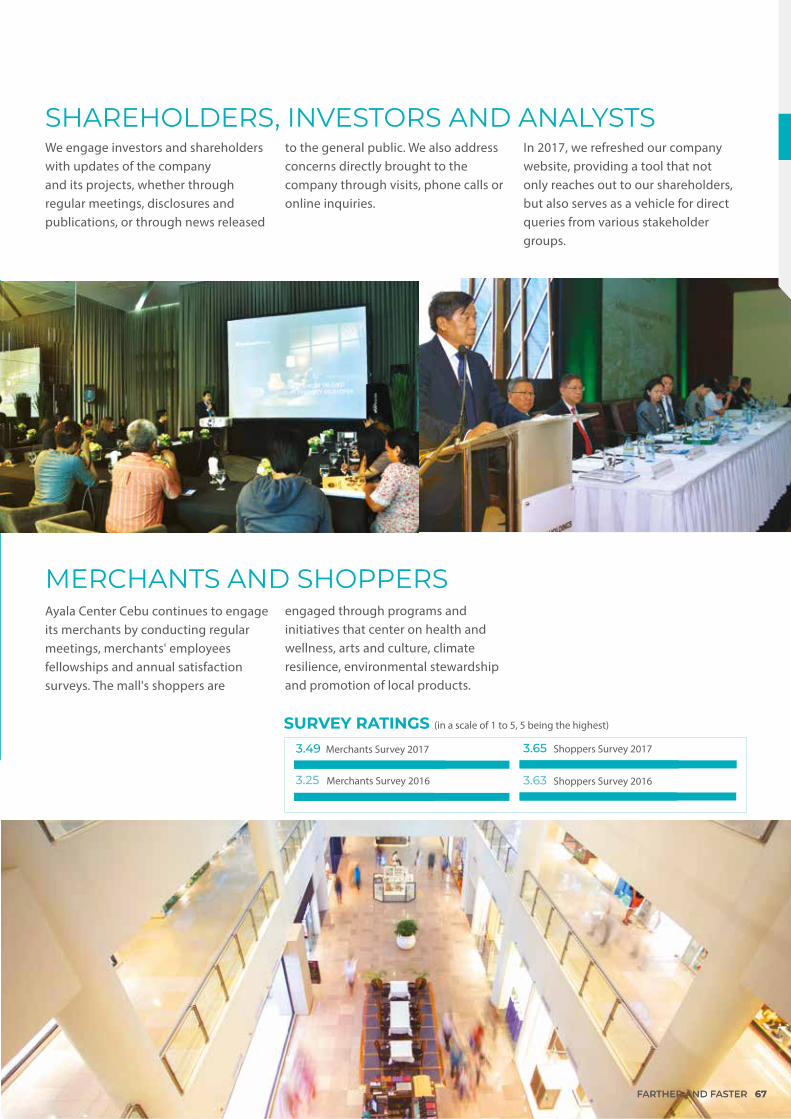
Ayala Center Cebu continues to engage its merchants by conducting regular meetings, merchants' employees fellowships and annual satisfaction surveys. The mall's shoppers are
MERCHANTS AND SHOPPERSengaged through programs and initiatives that center on health and wellness, arts and culture, climate resilience, environmental stewardship and promotion of local products.
3.49 3.65
3.633.25
Merchants Survey 2017 Shoppers Survey 2017
Shoppers Survey 2016Merchants Survey 2016
SHAREHOLDERS, INVESTORS AND ANALYSTSWe engage investors and shareholders with updates of the company and its projects, whether through regular meetings, disclosures and publications, or through news released
to the general public. We also address concerns directly brought to the company through visits, phone calls or online inquiries.
In 2017, we refreshed our company website, providing a tool that not only reaches out to our shareholders, but also serves as a vehicle for direct queries from various stakeholder groups.
SURVEY RATINGS (in a scale of 1 to 5, 5 being the highest)
FARTHER AND FASTER 6767FARTHER AND FASTER
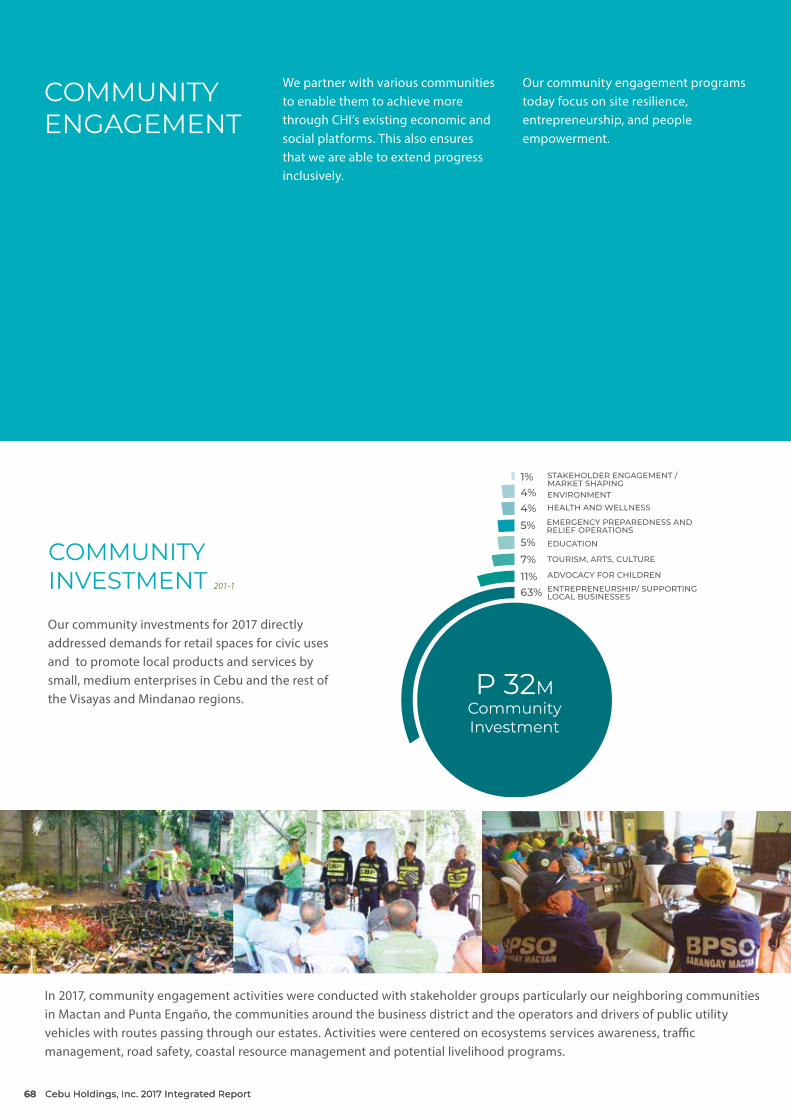
P 32MCommunityInvestment
COMMUNITY ENGAGEMENT
We partner with various communities to enable them to achieve more through CHI’s existing economic and social platforms. This also ensures that we are able to extend progress inclusively.
COMMUNITY INVESTMENT 201-1
Our community investments for 2017 directly addressed demands for retail spaces for civic uses and to promote local products and services by small, medium enterprises in Cebu and the rest of the Visayas and Mindanao regions.
In 2017, community engagement activities were conducted with stakeholder groups particularly our neighboring communities in Mactan and Punta Engaño, the communities around the business district and the operators and drivers of public utility vehicles with routes passing through our estates. Activities were centered on ecosystems services awareness, traffic management, road safety, coastal resource management and potential livelihood programs.
ADVOCACY FOR CHILDREN
TOURISM, ARTS, CULTURE
ENTREPRENEURSHIP/ SUPPORTING LOCAL BUSINESSES
EDUCATION
STAKEHOLDER ENGAGEMENT / MARKET SHAPING
EMERGENCY PREPAREDNESS AND RELIEF OPERATIONS
ENVIRONMENTHEALTH AND WELLNESS
1%4%4%5%5%7%11%63%
Our community engagement programs today focus on site resilience, entrepreneurship, and people empowerment.
Cebu Holdings, Inc. 2017 Integrated Report68 Cebu Holdings, Inc. 2017 Integrated Report68
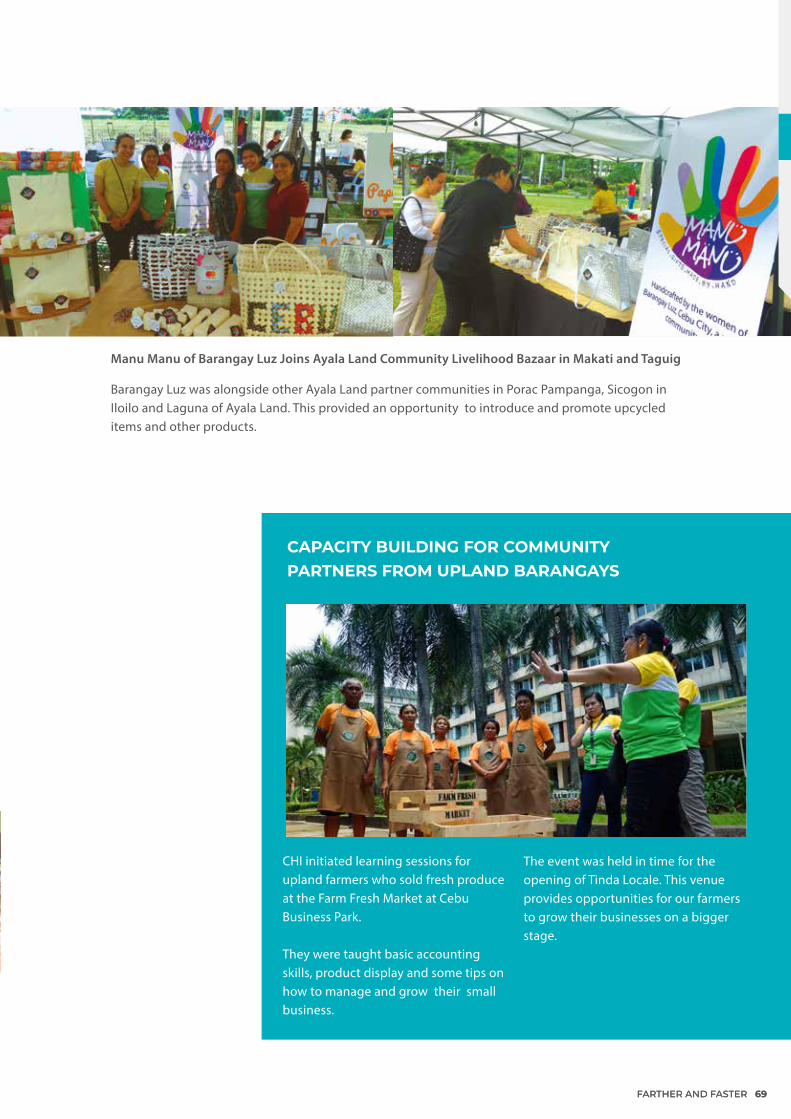
Manu Manu of Barangay Luz Joins Ayala Land Community Livelihood Bazaar in Makati and Taguig
Barangay Luz was alongside other Ayala Land partner communities in Porac Pampanga, Sicogon in Iloilo and Laguna of Ayala Land. This provided an opportunity to introduce and promote upcycled items and other products.
CHI initiated learning sessions for upland farmers who sold fresh produce at the Farm Fresh Market at Cebu Business Park. They were taught basic accounting skills, product display and some tips on how to manage and grow their small business.
CAPACITY BUILDING FOR COMMUNITY PARTNERS FROM UPLAND BARANGAYS
The event was held in time for the opening of Tinda Locale. This venue provides opportunities for our farmers to grow their businesses on a bigger stage.
FARTHER AND FASTER 6969FARTHER AND FASTER
CORPORATEGOVERNANCE
Given the large impact of Cebu Holdings, Inc.’s (CHI’s) operations on Cebu, our company’s governance should always be inclusive and responsive to the needs of all stakeholders.
Toward this end, CHI maximizes the capacity of good governance to guarantee that stakeholder rights and the company’s core values are upheld over short-term gains.
CHI follows a comprehensive set of oversight controls to achieve these goals. We also advance shared-value strategies and have voluntarily embedded global sustainability frameworks in our operations.
Cebu Holdings, Inc. 2017 Integrated Report70
Corporate Governance Practices
Governance Structure
Board of Directors
Management Committee
Management Team
Enterprise-wide Risk Management
Mechanisms for Enforcement and Compliance
FARTHER AND FASTER 71

CHI has been listed with the Philippine Stock Exchange (PSE) since 1994. The company fully complies with the Code of Corporate Governance as mandated by the Securities and Exchange Commission (SEC). This code specifies the role, duties, and responsibilities of our Board of Directors in line with Philippine laws, and is fully consistent with the recognized principles of good corporate governance. D.2.12, 102-5
We regard corporate governance as the primary system of stewardship and control to guide CHI in fulfilling its long-term economic, moral, legal, and social obligations. By constantly aiming for high governance standards, the company’s Board and Management are held accountable for upholding ethical behavior at all times. This in turn guarantees CHI’s long-term ability to create value for shareholders, stakeholders, and the nation.
We adopt the ASEAN Corporate Governance Scorecard for assessing our performance and reporting on other matters related to governance. The scorecard allows us to communicate our practices related to upholding shareholder rights, fostering equitable treatment of shareholders, promoting the role of stakeholders, advancing transparency in disclosure, and streamlining board responsibilities and processes.
Further information on our corporate governance may be accessed through our company website.
Cebu Holdings, Inc. 2017 Integrated Report72
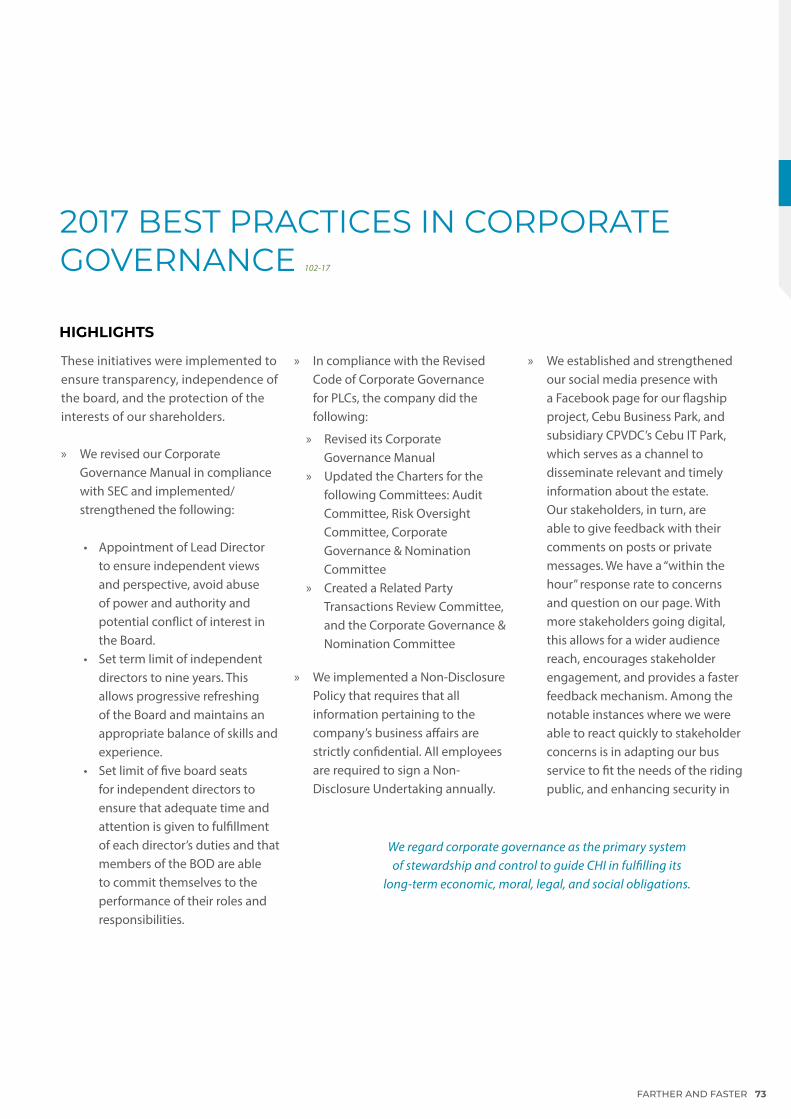
2017 BEST PRACTICES IN CORPORATE GOVERNANCE 102-17
HIGHLIGHTS
These initiatives were implemented to ensure transparency, independence of the board, and the protection of the interests of our shareholders.
» We revised our Corporate Governance Manual in compliance with SEC and implemented/strengthened the following:
• Appointment of Lead Director to ensure independent views and perspective, avoid abuse of power and authority and potential conflict of interest in the Board.
• Set term limit of independent directors to nine years. This allows progressive refreshing of the Board and maintains an appropriate balance of skills and experience.
• Set limit of five board seats for independent directors to ensure that adequate time and attention is given to fulfillment of each director’s duties and that members of the BOD are able to commit themselves to the performance of their roles and responsibilities.
» In compliance with the Revised Code of Corporate Governance for PLCs, the company did the following:
» Revised its Corporate Governance Manual
» Updated the Charters for the following Committees: Audit Committee, Risk Oversight Committee, Corporate Governance & Nomination Committee
» Created a Related Party Transactions Review Committee, and the Corporate Governance & Nomination Committee
» We implemented a Non-Disclosure Policy that requires that all information pertaining to the company’s business affairs are strictly confidential. All employees are required to sign a Non-Disclosure Undertaking annually.
» We established and strengthened our social media presence with a Facebook page for our flagship project, Cebu Business Park, and subsidiary CPVDC’s Cebu IT Park, which serves as a channel to disseminate relevant and timely information about the estate. Our stakeholders, in turn, are able to give feedback with their comments on posts or private messages. We have a “within the hour” response rate to concerns and question on our page. With more stakeholders going digital, this allows for a wider audience reach, encourages stakeholder engagement, and provides a faster feedback mechanism. Among the notable instances where we were able to react quickly to stakeholder concerns is in adapting our bus service to fit the needs of the riding public, and enhancing security in
We regard corporate governance as the primary system of stewardship and control to guide CHI in fulfilling its
long-term economic, moral, legal, and social obligations.
FARTHER AND FASTER 73
poorly lit areas at the perimeter of our property for the safety of the community.
» To encourage collaboration and creativity in the workplace, we introduced the activity-based workplace in our new corporate office. The open space concept allows employees to easily interact, thus resulting in better productivity.
» As a real estate company, we realize that our impacts to the economic, social and physical environments are significant and long lasting. We strictly monitor compliance to reporting and disclosure requirements of bodies that regulate the industry.
» We ensure the privacy of customer data entrusted to us as part of our business transactions – whether it is personal data in relation to buying property, shopper data or details of corporations we deal with.
IMPROVEMENTS IN GOVERNANCE PROCESSES
We enhanced our existing systems and processes to further strengthen the governance framework that leads our organization.
CHI strives to maintain a culture of transparency, compliance with regulatory requirements andobservance of best practices in corporate governance in the ASEAN region.
With our position as the leading real estate developer in Cebu, we hope to be able to influence our partners and stakeholders to maintain the same standards in conducting their businesses as well.
» To ensure transparency with our shareholders and timeliness of information disclosed, we adhere to the required timelines in disclosure to the Securities and Exchange Commission and the Philippine Stock Exchange and uploaded on the company website within three trading days from date of event. In addition, information is disclosed in the SEC ACGR within five trading days from date of event.
» We used technology to our advantage in actively engaging the company’s shareholders. We developed an electronic Registration and Voting System during Annual Stockholders Meeting to determine quorum and vote on items on the agenda. The system, which was designed in-house, allows shareholders to see voting turnout for significant items in the agenda in real time while the meeting is being conducted.
We enhanced our existing systems and processes to further strengthen the governance framework that leads our
organization.
Cebu Holdings, Inc. 2017 Integrated Report74
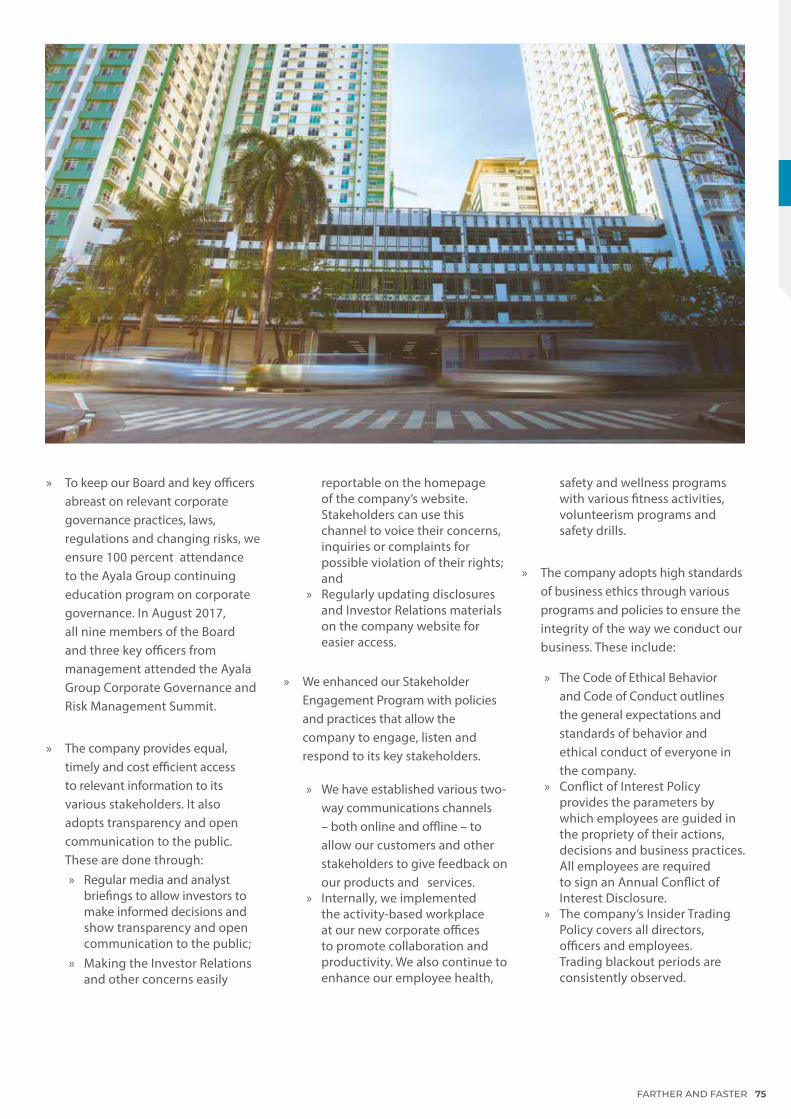
» To keep our Board and key officers abreast on relevant corporate governance practices, laws, regulations and changing risks, we ensure 100 percent attendance to the Ayala Group continuing education program on corporate governance. In August 2017, all nine members of the Board and three key officers from management attended the Ayala Group Corporate Governance and Risk Management Summit.
» The company provides equal, timely and cost efficient access to relevant information to its various stakeholders. It also adopts transparency and open communication to the public. These are done through:
» Regular media and analyst briefings to allow investors to make informed decisions and show transparency and open communication to the public;
» Making the Investor Relations and other concerns easily
reportable on the homepage of the company’s website. Stakeholders can use this channel to voice their concerns, inquiries or complaints for possible violation of their rights; and
» Regularly updating disclosures and Investor Relations materials on the company website for easier access.
» We enhanced our Stakeholder Engagement Program with policies and practices that allow the company to engage, listen and respond to its key stakeholders.
» We have established various two-way communications channels – both online and offline – to allow our customers and other stakeholders to give feedback on our products and services.
» Internally, we implemented the activity-based workplace at our new corporate offices to promote collaboration and productivity. We also continue to enhance our employee health,
safety and wellness programs with various fitness activities, volunteerism programs and safety drills.
» The company adopts high standards of business ethics through various programs and policies to ensure the integrity of the way we conduct our business. These include:
» The Code of Ethical Behavior and Code of Conduct outlines the general expectations and standards of behavior and ethical conduct of everyone in the company.
» Conflict of Interest Policy provides the parameters by which employees are guided in the propriety of their actions, decisions and business practices. All employees are required to sign an Annual Conflict of Interest Disclosure.
» The company’s Insider Trading Policy covers all directors, officers and employees. Trading blackout periods are consistently observed.
FARTHER AND FASTER 75
» Non-Disclosure Policy requires that all information pertaining to the company’s business affairs are strictly confidential. All employees are required to sign annually a Non-Disclosure Undertaking.
» Vendor Integrity Program. As a major real estate player in the region, we acknowledge that we can influence the industry in upholding the highest standard of quality and business integrity. Thus, we have implemented the Vendor Code of Ethics applicable to the vendors of CHI and its subsidiaries. We enhanced the program by integrating the Vendor Code of Ethics into our purchasing process so that violations are flagged before any further transaction with possible erring suppliers.
» The company’s Whistleblowing Policy encourages transparency and empowers all employees, third-party business partners and stakeholders to report any suspected or known illegal or unethical activity. Our Online Whistleblowing Report allows reporting through the website making it open and easily accessible to all stakeholders. We have an identified Ethics Committee at both the management and Board level to handle complaints.
We observe best practices in the composition of Board committees. CHI’s Audit Committee is comprised entirely of independent directors.
The company has a Related Party Transactions Review Committee to review material and significant Related Party Transactions to determine whether these are in the best interest of the company.
To ensure that the company is on track with its goals and compliances, the Board of Directors undergoes an annual Performance Appraisal as a body as part of its regular assessment process.
In growing globally as a company, we benchmark with best practices in corporate governance not only in the Philippines, but with the rest of the ASEAN. We conducted self-checks and implemented policies and programs to align with corporate governance standards within the ASEAN region.
SUSTAINABILITYWe continue to develop programs and initiatives that contribute to sustainable development, always keeping in mind the well-being of all our stakeholders. These include:
» Promoting local hiring to address manpower requirements
» Forging partnerships beyond the parent company
» Conducting intensified disaster readiness program
» Implementing sustainability impact projects based on Four Focus Areas namely: Site resilence, Pedestrian Mobility and Transit Connectivity, Eco-efficiency and Local Economic Development.
Read more from pages 28 to 57 of this report.
Cebu Holdings, Inc. 2017 Integrated Report76
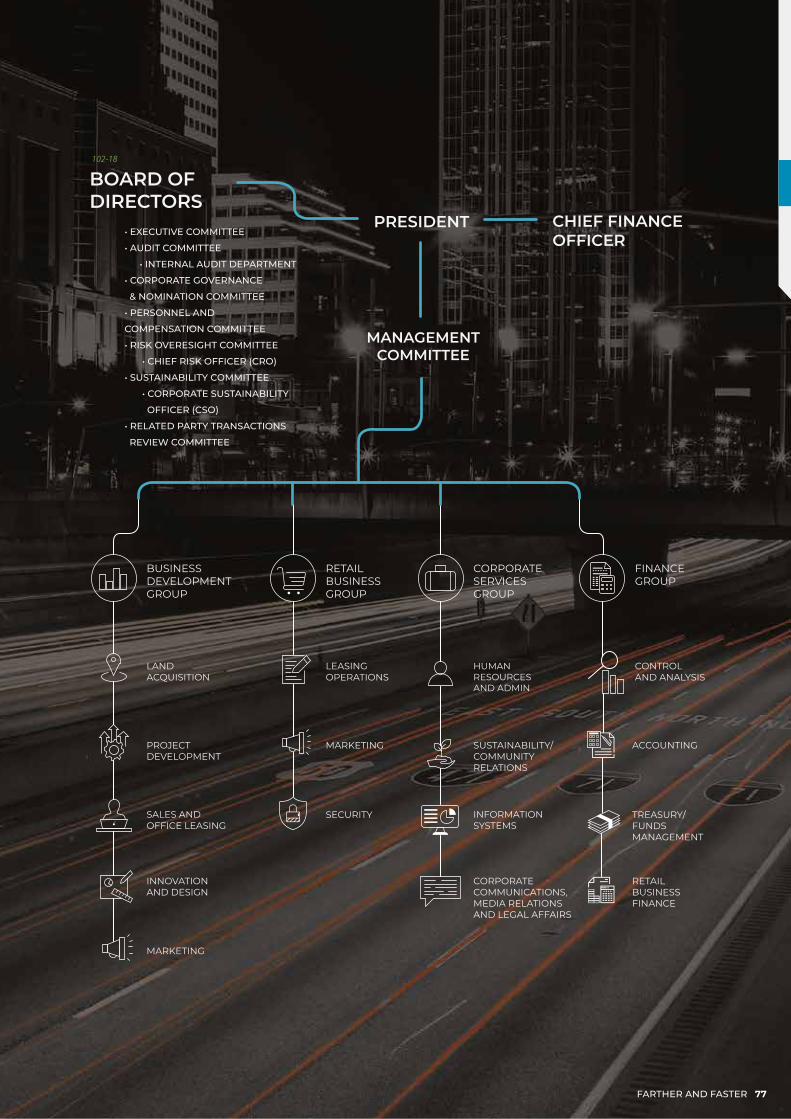
BOARD OFDIRECTORS
PRESIDENT CHIEF FINANCE OFFICER
MANAGEMENTCOMMITTEE
LEASINGOPERATIONS
MARKETING
RETAILBUSINESSGROUP
SECURITY
FINANCEGROUP
TREASURY/FUNDSMANAGEMENT
RETAILBUSINESSFINANCE
ACCOUNTING
CONTROLAND ANALYSIS
INFORMATIONSYSTEMS
SUSTAINABILITY/COMMUNITYRELATIONS
HUMANRESOURCES AND ADMIN
CORPORATECOMMUNICATIONS,MEDIA RELATIONSAND LEGAL AFFAIRS
CORPORATESERVICESGROUP
BUSINESS DEVELOPMENTGROUP
PROJECTDEVELOPMENT
MARKETING
INNOVATION AND DESIGN
SALES ANDOFFICE LEASING
LANDACQUISITION
• EXECUTIVE COMMITTEE
• AUDIT COMMITTEE
• INTERNAL AUDIT DEPARTMENT
• CORPORATE GOVERNANCE
& NOMINATION COMMITTEE
• PERSONNEL AND
COMPENSATION COMMITTEE
• RISK OVERESIGHT COMMITTEE
• CHIEF RISK OFFICER (CRO)
• SUSTAINABILITY COMMITTEE
• CORPORATE SUSTAINABILITY
OFFICER (CSO)
• RELATED PARTY TRANSACTIONS
REVIEW COMMITTEE
102-18
FARTHER AND FASTER 77
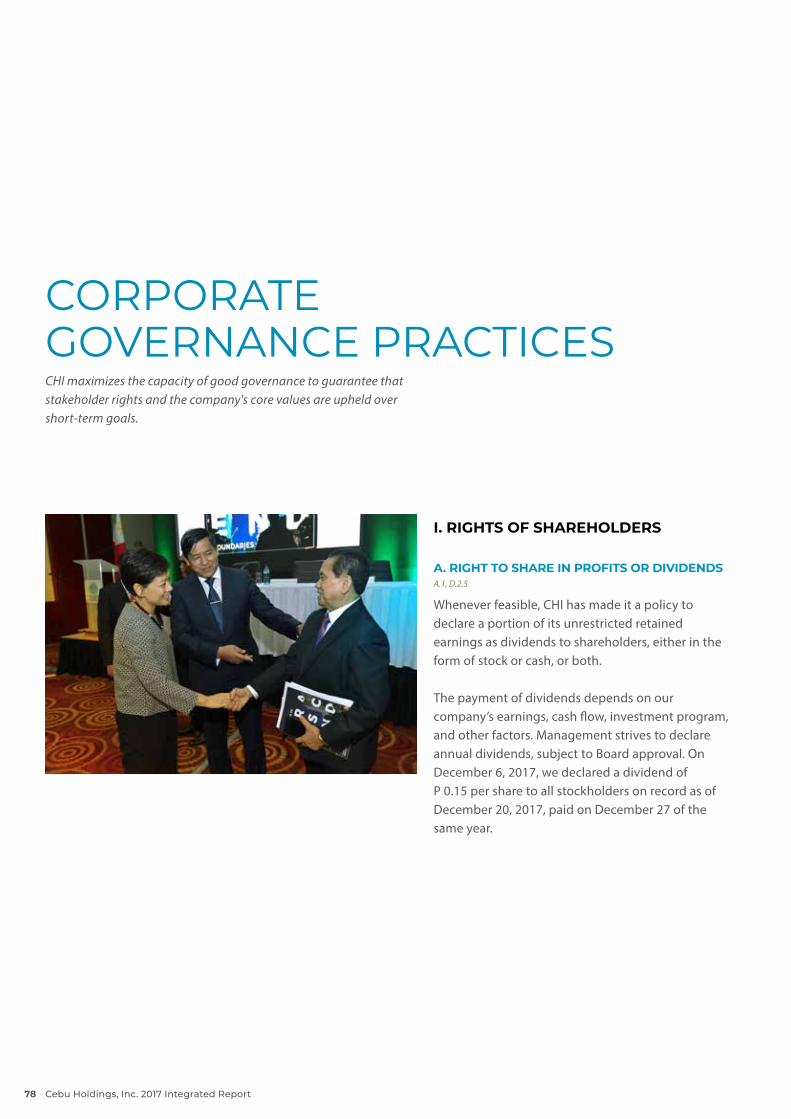
CORPORATE GOVERNANCE PRACTICES CHI maximizes the capacity of good governance to guarantee that stakeholder rights and the company's core values are upheld over short-term goals.
I. RIGHTS OF SHAREHOLDERS
A. RIGHT TO SHARE IN PROFITS OR DIVIDENDS A.1, D.2.5
Whenever feasible, CHI has made it a policy to declare a portion of its unrestricted retained earnings as dividends to shareholders, either in the form of stock or cash, or both.
The payment of dividends depends on our company’s earnings, cash flow, investment program, and other factors. Management strives to declare annual dividends, subject to Board approval. On December 6, 2017, we declared a dividend of P 0.15 per share to all stockholders on record as of December 20, 2017, paid on December 27 of the same year.
Cebu Holdings, Inc. 2017 Integrated Report78
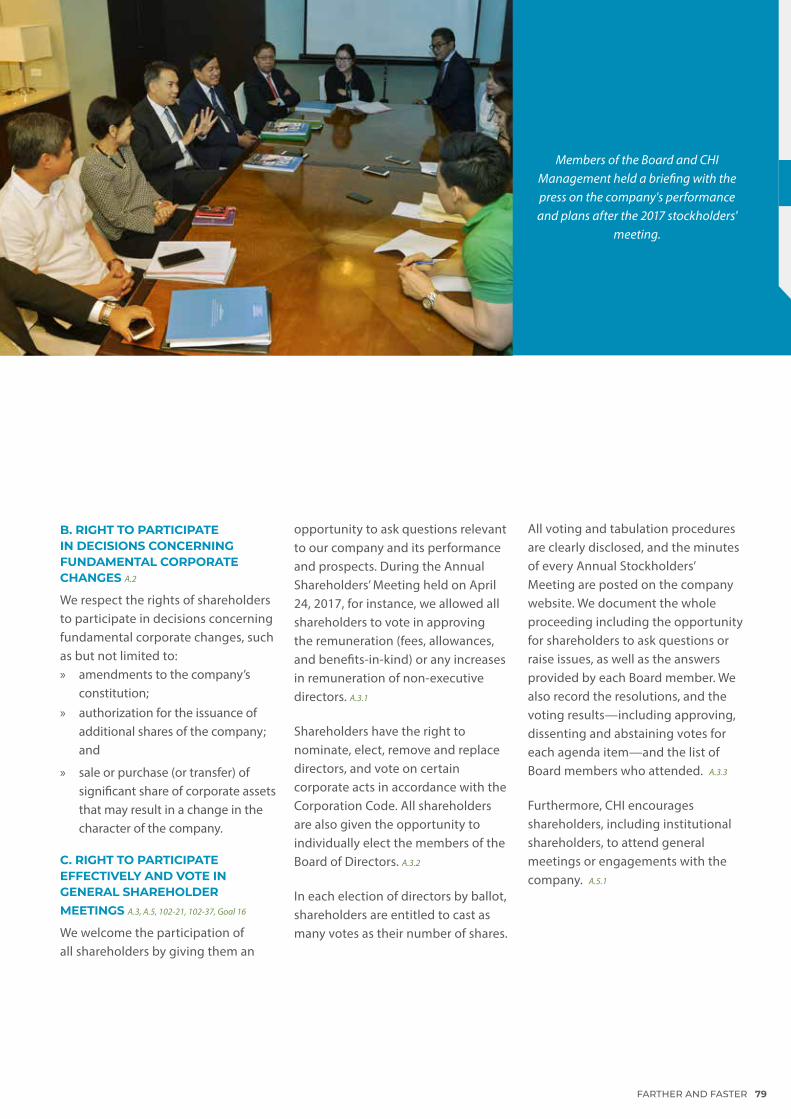
Members of the Board and CHI Management held a briefing with the press on the company's performance and plans after the 2017 stockholders'
meeting.
B. RIGHT TO PARTICIPATE IN DECISIONS CONCERNING FUNDAMENTAL CORPORATE CHANGES A.2
We respect the rights of shareholders to participate in decisions concerning fundamental corporate changes, such as but not limited to: » amendments to the company’s
constitution; » authorization for the issuance of
additional shares of the company; and
» sale or purchase (or transfer) of significant share of corporate assets that may result in a change in the character of the company.
C. RIGHT TO PARTICIPATE EFFECTIVELY AND VOTE IN GENERAL SHAREHOLDER MEETINGS A.3, A.5, 102-21, 102-37, Goal 16
We welcome the participation of all shareholders by giving them an
opportunity to ask questions relevant to our company and its performance and prospects. During the Annual Shareholders’ Meeting held on April 24, 2017, for instance, we allowed all shareholders to vote in approving the remuneration (fees, allowances, and benefits-in-kind) or any increases in remuneration of non-executive directors. A.3.1
Shareholders have the right to nominate, elect, remove and replace directors, and vote on certain corporate acts in accordance with the Corporation Code. All shareholders are also given the opportunity to individually elect the members of the Board of Directors. A.3.2
In each election of directors by ballot, shareholders are entitled to cast as many votes as their number of shares.
All voting and tabulation procedures are clearly disclosed, and the minutes of every Annual Stockholders’ Meeting are posted on the company website. We document the whole proceeding including the opportunity for shareholders to ask questions or raise issues, as well as the answers provided by each Board member. We also record the resolutions, and the voting results—including approving, dissenting and abstaining votes for each agenda item—and the list of Board members who attended. A.3.3
Furthermore, CHI encourages shareholders, including institutional shareholders, to attend general meetings or engagements with the company. A.5.1
FARTHER AND FASTER 79
II. EQUITABLE TREATMENT OF SHAREHOLDERSWe treat all shareholders equitably, and recognize, protect, and facilitate the exercise of their rights through constant and open communication. Adequate protection is given to minority shareholders against any unfair conduct on the part of the majority. We impose well-defined rules and explicitly prohibit any shareholder, officer or employee from unfairly gaining advantages by withholding information from minority shareholders and the general public.
A. SHARES AND VOTING RIGHTS B.1
We respect each of our shareholder’s right to participate and vote in the Annual Stockholders’ Meeting. Shareholders are entitled to one vote per common share of stock. CHI adopts and observes the basic principle of “one vote per one common share.” B.1.1
The vote may be made in person, in proxy, or electronically. Strict adherence to applicable rules and regulations is followed in cases of proxy voting or voting in absentia.
B. NOTICE OF ANNUAL STOCKHOLDERS’ MEETINGA.3, B.2.4, E.3.11
We mail a Notice of Annual Stockholders’ Meeting to shareholders
at least 21 days before the scheduled date. In 2017, the notice was sent 62 calendar days prior to the meeting date, well ahead of the standard number of days required. For the convenience of stockholders, we held the meeting at Sinulog Ballrooms 1 and 2 of the City Sports Club Cebu, located at the Cebu Business Park of Cebu City, Philippines. A.3.18
The notice specifies the agenda and rationale for each item, and the date, time and place for validation of proxies, which should be no later than five business days prior to the Annual Stockholders’ Meeting. A proxy form is attached to every notice. The notice likewise includes the profiles of directors seeking election or re-election. Our Board’s Audit Committee clearly identified and recommended our principal accountant and external auditor of the company, SyCip, Gorres, Velayo & Company (SGV& Co.), for re-election at the meeting. A.3.19, B.2.3, B.2.4,
E.3.11
C. PROHIBITION OF INSIDER TRADING B.3, D.4
We adhere to a uniform Insider Trading Policy in all securities dealings. This means that directors, officers and employees who are considered to have knowledge of material facts or changes in the affairs of CHI that have not been disclosed to the public—including any information
Cebu Holdings, Inc. 2017 Integrated Report80
likely to affect the market price of the securities of the company—are prohibited from buying or selling the company’s securities during trading blackout periods.
Trading blackouts are required covering 10 trading days before, and three trading days after, the disclosure of quarterly and annual reports. CHI’s shares of stocks, options to purchase stocks, bonds and other evidence of indebtedness are all covered under this policy, as are all members of the Board of Directors, key officers (including their immediate families), consultants, advisers and employees who are made aware of undisclosed material information.
In 2017, our company required all directors and officers to disclose their transactions in shares of the company within five trading days from the date of the transaction. Our company also
requires employees to accomplish an annual disclosure statement. We were in full compliance with all laws and regulations, and thus no case was found of any violation of the company’s policy in 2017.
D. RELATED PARTY TRANSACTIONS B.4, B.5, D.3
Related party transactions (RPTs) are conducted on an arm’s length basis and in a manner that ensures fairness to the company’s best interest, and no less favorable than those generally available to non-related parties under the same or similar circumstances. We require directors and key management personnel to inhibit themselves from participating in discussions on a particular agenda when they are conflicted.
All directors and employees of CHI and its subsidiaries are required to promptly disclose any business and
family related transactions to the company and/or its subsidiaries to ensure that potential conflicts of interest are immediately brought to the attention of management. The company also prohibits the grant of loans to directors.
Should there be any related party transaction, it is identified, reviewed, and approved by the Related Party Transactions Review Committee. Material or significant related party transactions will have to be endorsed to the Board for approval. The Board may, at its option, also require that a related party transaction that has been approved be also submitted to the stockholders for consideration and ratification. In 2017, no RPTs were classified as financial assistance to entities other than wholly owned subsidiary companies. More details on this subject can be found on Note 20 of our Audited Financial Statement found on pages 200 to202.
Resolution of DisputesCHI abides by Republic Act No. 9285, otherwise known as the Alternative Dispute Resolution Act of 2004, as a way to settle disputes without resorting to excessive litigation. The company has a team that handles investor relations to ensure constant engagement with its shareholders. This sets up an avenue to receive feedback, complaints, and queries from shareholders and assures their active participation with regard to activities and policies of the company.
FARTHER AND FASTER 81

Cebu Holdings, Inc. 2017 Integrated Report82 Cebu Holdings, Inc. 2017 Integrated Report82

III. ROLE OF STAKEHOLDERS C.1, C.3, C.4, 102-40, 102-42, 102-43, 205-3, 307-1, 419-1, Goal 16
We honor all our legal and voluntary commitments to stakeholder rights and provide all our key stakeholders with the opportunity to obtain effective and prompt redress whenever their rights are at risk or violated.
Furthermore, our sustainability framework, strategy, and policy ensure that the company’s growth is geared towards conscientious and inclusive development.
More details of our stakeholder engagement outcomes are found on pages 126 to 127.
EMPLOYEES
» Our employees are integral to our corporate governance processes. For instance, our Health, Safety and Welfare Policy keeps our people well-informed about CHI’s policies on hiring, employee engagement, training, health, safety, and welfare.
» The highlights of our 2017 CHI Personality and Lifestyle Upliftment Strategy (PLUS) Program and other human capital initiatives are outlined in pages 62 to 63.
CUSTOMERS » The company has a Customer
First Policy that prioritizes added value in the delivery of products and services to continually satisfy the changing expectations of customers.
» Details of our customer engagement programs conducted in 2017 are found on page 67.
CREDITORS
» CHI presents creditors with all the information required to properly evaluate our credit standing.
SUPPLIERS AND CONTRACTORS
» The company implements standard procurement policies and procedures across its business units. Regular supplier accreditation and annual performance evaluation are observed.
» Data on local sourcing and workforce count of all our units are on page 126.
LOCAL COMMUNITIES
» We strive to be socially responsible in all our dealings in the areas we operate. We ensure that our interactions serve our environment and stakeholders in a positive and progressive manner, fully supportive of comprehensive and balanced development.
» We regularly engage representatives from our local communities to assess their needs, pursue possible areas of collaboration, and use shared resources as leverage for programs that benefit our larger community.
COMPLIANCE
» The company complies with all legal, consumer, and financial reporting requirements against corruption, including extortion and bribery.
» The company is in compliance with all applicable laws and regulations. To this end, there has been no reported incident of any violation.
FARTHER AND FASTER 83
IV. SUSTAINABILITY REPORTING To ensure transparency and availability of information, we adopt the GRI Standards Sustainability Reporting Guidelines and publish an Integrated Report.
V. RIGHT TO VOICE CONCERNS AND COMPLAINTSContact details are provided on the inside back cover of this report and on the company website for stockholders and stakeholders to access in the event of concerns and/or complaints of possible violation of rights.
VI. WHISTLEBLOWING POLICY 102-17, 102-33, Goal 16
We adopt a Whistleblowing Policy to encourage and empower all our employees, third-party business partners, and other stakeholders to report any suspected or known illegal or unethical activity.
This policy covers any of the following concerns: » conflicts of interest; » misconduct or policy violations; » theft, fraud or misappropriation; » falsification of documents; » financial reporting concerns, and » retaliation complaints.
Our business integrity channels are spearheaded by our company’s Ethics Committee. These channels enable our stakeholders to freely report fraud, violations of laws, rules and regulations, or misconduct, without fear of retaliation. Our ultimate goal is to give all stakeholders every possible means to come forward so that they provide information directly to top management or the Board of Directors.
Whistleblowers may report via our website, face-to-face meetings, email, or this link: http://chiwhistle.cebuholdings.com/chiwhistle/.
No grievances related to our environmental performance and labor practices were filed in 2017.
Cebu Holdings, Inc. 2017 Integrated Report84
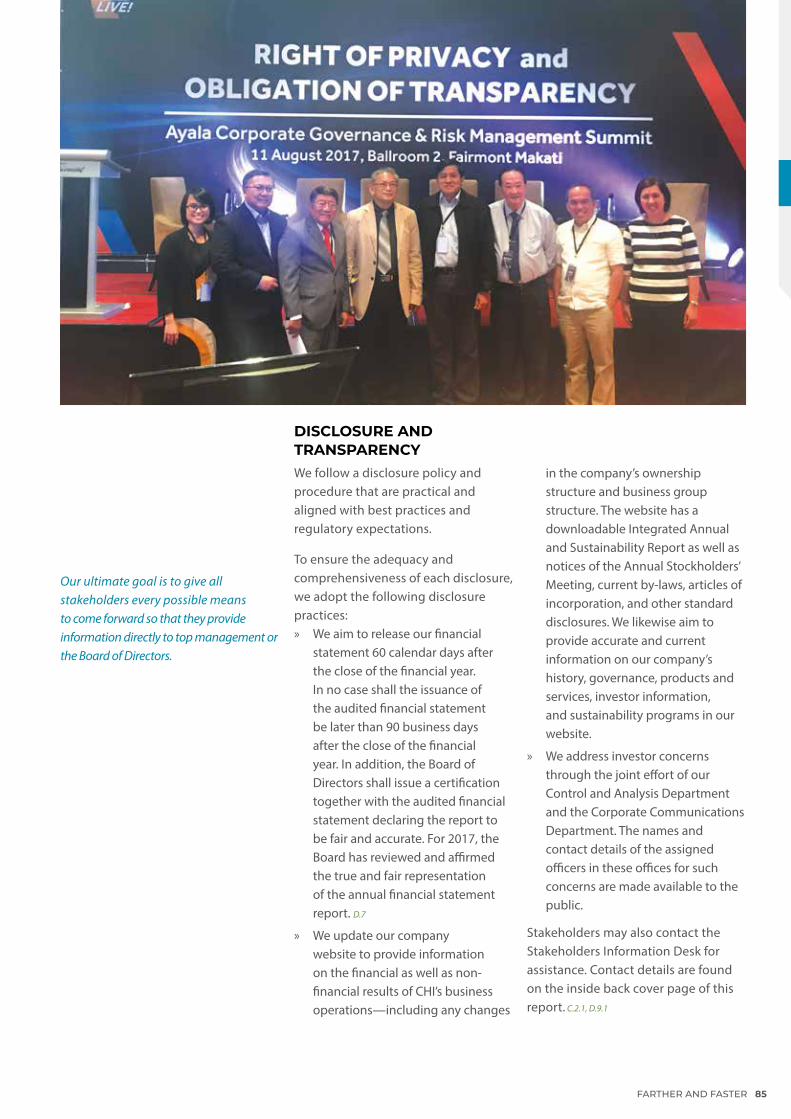
DISCLOSURE AND TRANSPARENCY We follow a disclosure policy and procedure that are practical and aligned with best practices and regulatory expectations.
To ensure the adequacy and comprehensiveness of each disclosure, we adopt the following disclosure practices: » We aim to release our financial
statement 60 calendar days after the close of the financial year. In no case shall the issuance of the audited financial statement be later than 90 business days after the close of the financial year. In addition, the Board of Directors shall issue a certification together with the audited financial statement declaring the report to be fair and accurate. For 2017, the Board has reviewed and affirmed the true and fair representation of the annual financial statement report. D.7
» We update our company website to provide information on the financial as well as non-financial results of CHI’s business operations—including any changes
in the company’s ownership structure and business group structure. The website has a downloadable Integrated Annual and Sustainability Report as well as notices of the Annual Stockholders’ Meeting, current by-laws, articles of incorporation, and other standard disclosures. We likewise aim to provide accurate and current information on our company’s history, governance, products and services, investor information, and sustainability programs in our website.
» We address investor concerns through the joint effort of our Control and Analysis Department and the Corporate Communications Department. The names and contact details of the assigned officers in these offices for such concerns are made available to the public.
Stakeholders may also contact the Stakeholders Information Desk for assistance. Contact details are found on the inside back cover page of this report. C.2.1, D.9.1
Our ultimate goal is to give all stakeholders every possible means to come forward so that they provide information directly to top management or the Board of Directors.
FARTHER AND FASTER 85
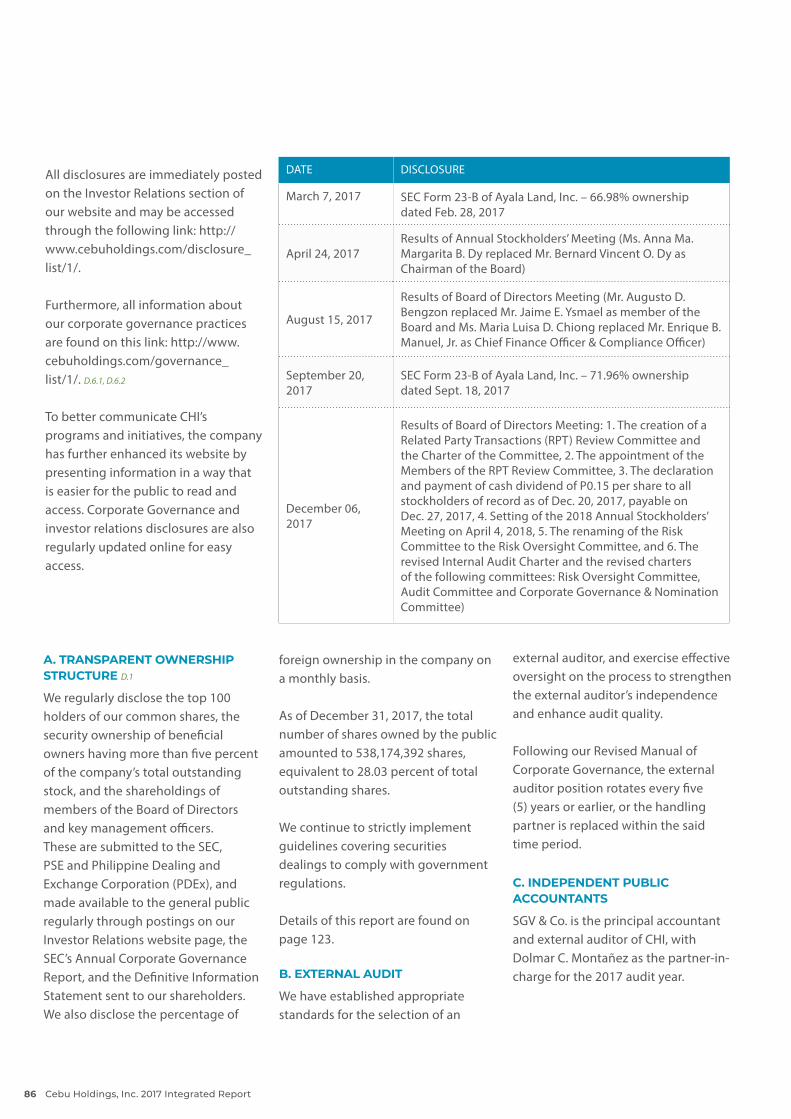
All disclosures are immediately posted on the Investor Relations section of our website and may be accessed through the following link: http://www.cebuholdings.com/disclosure_list/1/.
Furthermore, all information about our corporate governance practices are found on this link: http://www.cebuholdings.com/governance_list/1/. D.6.1, D.6.2
To better communicate CHI’s programs and initiatives, the company has further enhanced its website by presenting information in a way that is easier for the public to read and access. Corporate Governance and investor relations disclosures are also regularly updated online for easy access.
A. TRANSPARENT OWNERSHIP STRUCTURE D.1
We regularly disclose the top 100 holders of our common shares, the security ownership of beneficial owners having more than five percent of the company’s total outstanding stock, and the shareholdings of members of the Board of Directors and key management officers. These are submitted to the SEC, PSE and Philippine Dealing and Exchange Corporation (PDEx), and made available to the general public regularly through postings on our Investor Relations website page, the SEC’s Annual Corporate Governance Report, and the Definitive Information Statement sent to our shareholders. We also disclose the percentage of
DATE DISCLOSURE
March 7, 2017 SEC Form 23-B of Ayala Land, Inc. – 66.98% ownership dated Feb. 28, 2017
April 24, 2017Results of Annual Stockholders’ Meeting (Ms. Anna Ma. Margarita B. Dy replaced Mr. Bernard Vincent O. Dy as Chairman of the Board)
August 15, 2017
Results of Board of Directors Meeting (Mr. Augusto D. Bengzon replaced Mr. Jaime E. Ysmael as member of the Board and Ms. Maria Luisa D. Chiong replaced Mr. Enrique B. Manuel, Jr. as Chief Finance Officer & Compliance Officer)
September 20, 2017
SEC Form 23-B of Ayala Land, Inc. – 71.96% ownership dated Sept. 18, 2017
December 06, 2017
Results of Board of Directors Meeting: 1. The creation of a Related Party Transactions (RPT) Review Committee and the Charter of the Committee, 2. The appointment of the Members of the RPT Review Committee, 3. The declaration and payment of cash dividend of P0.15 per share to all stockholders of record as of Dec. 20, 2017, payable on Dec. 27, 2017, 4. Setting of the 2018 Annual Stockholders’ Meeting on April 4, 2018, 5. The renaming of the Risk Committee to the Risk Oversight Committee, and 6. The revised Internal Audit Charter and the revised charters of the following committees: Risk Oversight Committee, Audit Committee and Corporate Governance & Nomination Committee)
foreign ownership in the company on a monthly basis.
As of December 31, 2017, the total number of shares owned by the public amounted to 538,174,392 shares, equivalent to 28.03 percent of total outstanding shares.
We continue to strictly implement guidelines covering securities dealings to comply with government regulations.
Details of this report are found on page 123.
B. EXTERNAL AUDIT
We have established appropriate standards for the selection of an
external auditor, and exercise effective oversight on the process to strengthen the external auditor’s independence and enhance audit quality.
Following our Revised Manual of Corporate Governance, the external auditor position rotates every five (5) years or earlier, or the handling partner is replaced within the said time period.
C. INDEPENDENT PUBLIC ACCOUNTANTS
SGV & Co. is the principal accountant and external auditor of CHI, with Dolmar C. Montañez as the partner-in-charge for the 2017 audit year.
Cebu Holdings, Inc. 2017 Integrated Report86
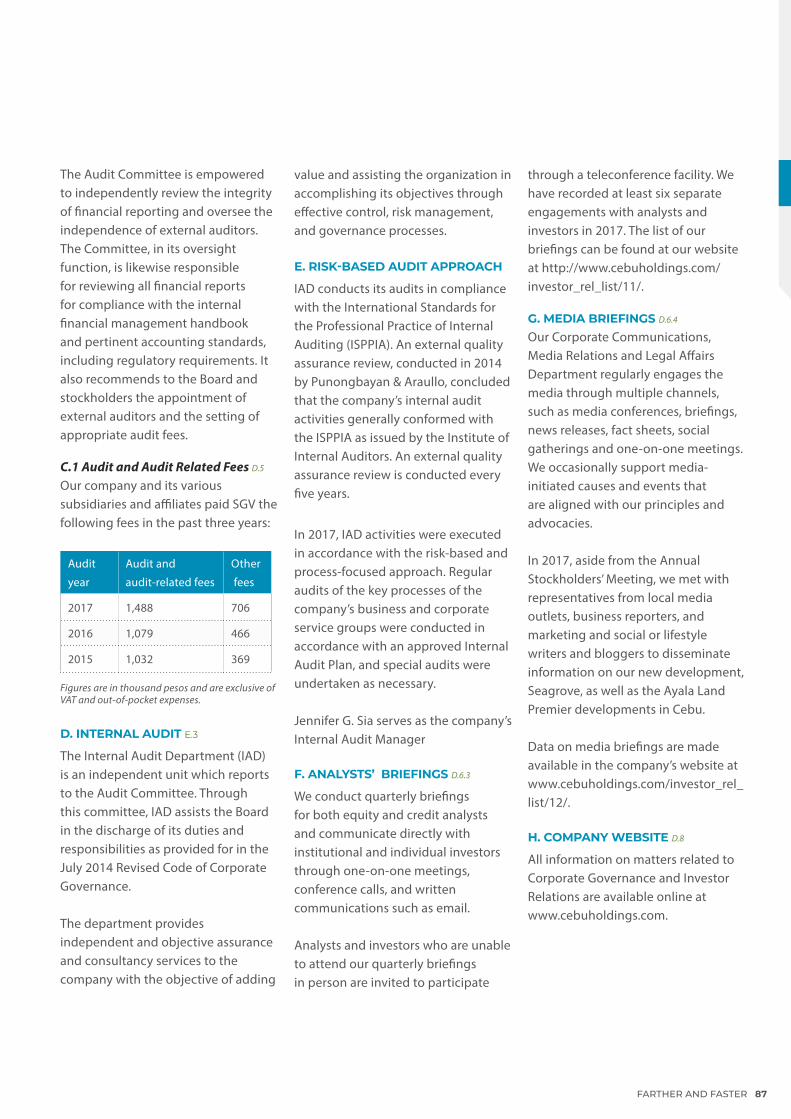
The Audit Committee is empowered to independently review the integrity of financial reporting and oversee the independence of external auditors. The Committee, in its oversight function, is likewise responsible for reviewing all financial reports for compliance with the internal financial management handbook and pertinent accounting standards, including regulatory requirements. It also recommends to the Board and stockholders the appointment of external auditors and the setting of appropriate audit fees.
C.1 Audit and Audit Related Fees D.5
Our company and its various subsidiaries and affiliates paid SGV the following fees in the past three years:
Audit
year
Audit and
audit-related fees
Other
fees
2017 1,488 706
2016 1,079 466
2015 1,032 369
Figures are in thousand pesos and are exclusive of VAT and out-of-pocket expenses.
D. INTERNAL AUDIT E.3
The Internal Audit Department (IAD) is an independent unit which reports to the Audit Committee. Through this committee, IAD assists the Board in the discharge of its duties and responsibilities as provided for in the July 2014 Revised Code of Corporate Governance.
The department provides independent and objective assurance and consultancy services to the company with the objective of adding
value and assisting the organization in accomplishing its objectives through effective control, risk management, and governance processes.
E. RISK-BASED AUDIT APPROACH
IAD conducts its audits in compliance with the International Standards for the Professional Practice of Internal Auditing (ISPPIA). An external quality assurance review, conducted in 2014 by Punongbayan & Araullo, concluded that the company’s internal audit activities generally conformed with the ISPPIA as issued by the Institute of Internal Auditors. An external quality assurance review is conducted every five years.
In 2017, IAD activities were executed in accordance with the risk-based and process-focused approach. Regular audits of the key processes of the company’s business and corporate service groups were conducted in accordance with an approved Internal Audit Plan, and special audits were undertaken as necessary.
Jennifer G. Sia serves as the company’s Internal Audit Manager
F. ANALYSTS’ BRIEFINGS D.6.3
We conduct quarterly briefings for both equity and credit analysts and communicate directly with institutional and individual investors through one-on-one meetings, conference calls, and written communications such as email.
Analysts and investors who are unable to attend our quarterly briefings in person are invited to participate
through a teleconference facility. We have recorded at least six separate engagements with analysts and investors in 2017. The list of our briefings can be found at our website at http://www.cebuholdings.com/investor_rel_list/11/.
G. MEDIA BRIEFINGS D.6.4
Our Corporate Communications, Media Relations and Legal Affairs Department regularly engages the media through multiple channels, such as media conferences, briefings, news releases, fact sheets, social gatherings and one-on-one meetings.We occasionally support media-initiated causes and events that are aligned with our principles and advocacies.
In 2017, aside from the Annual Stockholders’ Meeting, we met with representatives from local media outlets, business reporters, and marketing and social or lifestyle writers and bloggers to disseminate information on our new development, Seagrove, as well as the Ayala Land Premier developments in Cebu.
Data on media briefings are made available in the company’s website at www.cebuholdings.com/investor_rel_list/12/.
H. COMPANY WEBSITE D.8
All information on matters related to Corporate Governance and Investor Relations are available online at www.cebuholdings.com.
FARTHER AND FASTER 87
RESPONSIBILITIES OF THE BOARDThe overall stewardship of our company rests on the Board of Directors, the highest governing authority within CHI’s management structure. The Board is responsible for the company’s long-term success and sustained global competitiveness. It ensures that CHI’s obligations to its stakeholders are met while adhering to the principles of sound corporate governance as a model of best practices in the corporate sector.
Through this report, we attempt to make known to our stockholders and other stakeholders the fiduciary roles, responsibilities, and accountabilities of the Board as provided under the law, the company’s articles and by-laws, and other legal pronouncements and guidelines.
BOARD DUTIES AND RESPONSIBILITIES E.1
The duties and responsibilities of the Board of Directors include, but are not limited to, the following:
» Act on a fully informed basis, in good faith, with due diligence and care, and in the best interest of the corporation, its shareholders and other stakeholders;
» Ensure good governance of the corporation and establish the vision and mission, strategic objectives and key policies and procedures for the management of the corporation, as well as the mechanism for monitoring
and evaluating management’s performance;
» Oversee the development of and approve the corporation’s business objectives and strategy, and monitor their implementation, in order to sustain the corporation’s long-term viability and strength;
» Ensure that it is headed by a competent and qualified chairperson;
» Adopt an effective succession planning program for directors, key officers and management to ensure growth and a continued increase in shareholder value. This includes adopting a policy on the retirement
age for directors and key officers as part of management succession and to promote dynamism in the corporation;
» Align the remuneration of key officers and board members with the long-term interests of the company;
» Be primarily responsible for approving the selection and assessing the performance of the management led by the Chief Executive Officer (CEO), and control functions led by their respective heads (Chief Risk Officer, Compliance Officer, and Chief Audit Executive);
Cebu Holdings, Inc. 2017 Integrated Report88
» Establish an effective performance management framework that will ensure that the management, including the Chief Executive Officer, and personnel’s performance is at par with the standards set by the Board and senior management;
» Guarantee that an appropriate internal control system is in place, and set up a mechanism for monitoring and managing potential conflicts of interest of management, Board members, and shareholders;
» Approve the Internal Audit Charter upon endorsement by the Audit Committee; and
» Oversee that a sound enterprise risk management (ERM) framework is in place to effectively identify, monitor, assess, and manage key business risks. This framework guides the Board in identifying units/business lines and enterprise-level risk exposures, as well as the effectiveness of risk management strategies.
The Board has a charter which contains clear and specific guidelines on internal processes, particularly the types of decisions requiring Board approval.
Thus far, the Board has approved and adopted the company’s mission and core values as well as a Board calendar which allows for a periodic review of the company’s governance charter and its corporate strategy map with its corresponding performance scorecards.
Our management committee keeps the Board updated on issues concerning the company’s strategy, risk management, and compliance, and explains any deviation from the approved plans and targets.
FARTHER AND FASTER 89
A. INDEPENDENT DIRECTORS E.2.5,
E.2.6, E.2.7
The company defines independent directors as having no interests, relationships, or previous engagements with CHI in any capacity that may interfere with their exercise of independent judgment. Independent directors may serve for a period of not more than nine years and may hold only up to five board seats simultaneously.
We comply with the SEC rules on the nomination and election of an independent director, and with the PSE requirement. CHI has three independent directors.
B. BOARD COMMITTEES E.2, E.3, Goal 5, Goal 16
As the Board of Directors is responsible to shareholders in ensuring that value is created and sustained, Committees assist the Board of Directors to fulfill its responsibility for oversight of the corporation’s corporate governance processes, particularly with respect to audit, risk management, related party transactions, and other key corporate governance concerns, such as nomination and remuneration.
The composition, functions, and responsibilities of all committees are contained in their respective
Committee Charters available at our website.
The Board has created committees to which it delegates parts of its rights and responsibilities. The committees are composed of Board members specifically chosen for their particular background and areas of expertise suitable to the functions assigned to the committee.
These committees are: Executive Committee, Audit Committee, Corporate Governance and Nomination Committee, Personnel and Compensation Committee, Risk Oversight Committee, Related Party
BOARD STRUCTURE E.2.4
The Board is composed of nine members, three of whom are independent directors. The Board designated a Lead Director among the independent directors who, as per the Corporate Governance provision, should the Chairman not be an independent director. Consul Enrique L. Benedicto is the Lead Director of CHI. The functions of the lead director include, among others, the following:
» Serve as intermediary between the Chairman and the other directors when necessary;
» Convene and chair meetings of non-executive directors; and
» Contribute to the performance evaluation of the Chairman, as required.
Cebu Holdings, Inc. 2017 Integrated Report90
Transactions Review Committee and Sustainability Committee. They all have free and full access to relevant information, data, records, and personnel of the company.
In 2017, the Board has created a Corporate Governance and Nomination Committee and Related Party Transactions Review Committee with respective charters. The Risk Committee was renamed as Risk Oversight Committee. The Risk Oversight Committee and Audit Committee also updated their respective charters.
C . EXECUTIVE COMMITTEE
Members of the Executive Committee are appointed by the Board, and one of them is designated as chairman. In CHI, the committee is composed of five members with one independent director. The committee is governed by its own charter.
The committee is composed in such a way that it possesses, as a group, the necessary knowledge, skills and experience required to properly perform its duties. It is required to regularly review its composition, taking into account the company’s changing requirements.
The committee meets at such times and frequency as may be necessary,
either in person or via teleconference or video conferencing. The presence of two-thirds of the members constitutes a quorum, and the majority vote of all members is necessary to carry an act or resolution.
The chairman, or his designate, reports to the Board all actions of the committee during their subsequent meeting. Although any act of the committee that is within the scope of its powers does not require approval by the Board, such acts may be subject to revision or alteration by the Board—provided that no rights or acts of third parties shall be affected.
The committee may be granted authority by the Board to act on specific matters on its behalf, except for the following: » those which also require
shareholders’ approval;
» filling of vacancies in the Board or in the Executive Committee;
» amendment or repeal of by-laws, or the adoption of new by-laws;
» amendment or repeal of any resolution by the Board, which is expressly not repealable or amendable;
» distribution of cash dividends; and
» exercise of powers delegated by the Board exclusively to other committees.
D. AUDIT COMMITTEE E.2.21, E.2.22, E.2.23,
E.2.24, E.2.25, E.2.26, E.2.27, E.2.28, E.2.29, Goal 16
CHI’s Audit Committee is composed of three members, all of whom are independent directors. The Chairman of the Audit Committee is not the Chairman of the Board or of any other committee.
The committee meets at least quarterly, either in person or via teleconference or video conferencing. The presence of two-thirds of the members constitutes a quorum, and the majority vote of all members is necessary to carry an act or resolution. The number of meetings and attendance of each member are detailed in page 122.
Governed by its charter, the Audit Committee is responsible for overseeing the senior management in establishing and maintaining an adequate, effective, internal control framework. It ensures that systems and processes are designed to provide assurance in areas including reporting, monitoring compliance with laws, regulations, and internal policies, efficiency and effectiveness of operations, and safeguarding of assets.
FARTHER AND FASTER 91
The Audit Committee is responsible for: » Financial Reporting
• Reviewing the financial statements and all related disclosures and reports certified by the Chief Finance Officer and released to the public and/or submitted to the SEC and for compliance with both the internal financial management handbook and pertinent accounting standards, including legal and regulatory requirements;
• Reviewing the quarterly, half-year and annual financial statements before submission to the Board, focusing on changes in accounting policies and practices, major judgment areas, significant adjustments resulting from the audit, going concern assumptions, compliance with accounting standards, tax, legal, and stock exchange requirements;
• Reviewing and approving management representation letter before submission to the independent auditor;
• Ensuring that a transparent financial management system, supported by a Procedures and Policies Handbook that will be used by the entire organization is established, for the integrity
of internal control activities throughout the corporation;
• Elevating to international standards the accounting and auditing processes, practices and methodologies;
• Ensuring that actions and measures in case of finding of error or fraud in the financial statements and related disclosures are in place and followed;
• Reviewing unusual or complex transactions including all related party transactions; and
• Communicating with legal counsel covering litigation, claims, contingencies or other significant legal issues that impact the financial statements.
Internal audit • Reviewing and approving the
Internal Audit Charter and subsequent revisions thereto for approval of the Board. The Internal Audit Charter shall be periodically reviewed to ensure alignment with the International Standards for the Professional Practice of Internal Auditing (ISPPIA);
• Set up the Internal Audit Division, including the appointment of the Chief Audit Executive (CAE). The Committee
shall establish and identify the reporting line of the CAE so that the reporting levels allow the internal audit activity to fulfill its responsibilities. The CAE shall report directly to the Committee functionally. The Committee, having appointed the CAE, shall also concur in his/her replacement, re-assignment or dismissal. The Committee shall set up the qualification criteria for internal auditors;
• Ensuring that the Internal Auditors have free and full access to all the corporation’s records, properties and personnel relevant to and required by their function and that the Internal Audit Division shall be free from interference in determining its scope, performing its work and communicating its results;
• Ensuring that the Internal Auditors have free and full access to all the corporation’s records, properties and personnel relevant to and required by their function and that the Internal Audit Division shall be free from interference in determining its scope, performing its work and communicating its results;
• Reviewing reports of the Internal Auditors and regulatory agencies, where applicable,
Cebu Holdings, Inc. 2017 Integrated Report92
ensuring that management is taking appropriate corrective actions in a timely manner, including addressing internal control and compliance issues;
• Reviewing the Internal Audit Division’s periodic reports and the Internal Audit Annual Report. Periodic reports shall highlight the status of projects in accordance with the audit plan approved by the Committee, as well as any unplanned projects. Such reports shall include a summary of key findings and recommendations, including the status of implementation. The Annual Report shall discuss the Internal Audit Division’s activities and performance relative to the audit plans and strategies approved by the Committee;
• Conducting separate meetings with the CAE to discuss any matter that the Committee or the auditors may deem necessary to be discussed privately;
• Providing inputs on the performance of the Internal Audit Division and communicating/discussing such inputs with the Chief Finance Officer (CFO) who shall then translate these into a performance appraisal applicable to the CAE and the Internal Auditors taken as a whole;
and scope of the audit, and ensure cooperation when more than one professional service firm is needed. In addition, the Committee shall review compliance of the independent auditor with auditing standards;
• Monitoring the coordination of efforts between the independent and internal auditors;
• Ensuring that the Independent Auditors have free and full access to all the corporation’s records, properties and personnel relevant to and required by their function;
• Reviewing the reports of the Independent Auditors and regulatory agencies, where applicable, and ensuring that management is taking appropriate corrective actions in a timely manner, including addressing control, governance and compliance issues;
• Conducting a separate meeting in executive session, with the Independent Auditors to discuss any matter that the Committee or Independent Auditors believe should be discussed privately, including the results of the audit, year-end financial statements, the quality of management, financial and accounting controls; and
• Instituting special investigations as necessary and, if appropriate, hiring special counsel or experts to provide the necessary assistance; and
• Reviewing the evaluation of compliance with the Code of Conduct for management.
Independent Audit • Recommending the
appointment, reappointment and removal of the Independent Auditors and the fixing of their remuneration to the Board. The Committee shall conduct an assessment of independence and professional qualifications and competence of the independent auditor and ensure that a rotation process is observed in the engagement of independent auditor;
• Reviewing and pre-approving the Independent Auditor’s plans one (1) month before the conduct of external audit to understand the basis for their risk assessment and financial statement materiality, including the scope and frequency of the audit;
• In this regard, the Committee shall discuss with the Independent Auditors, before the audit commences, the nature
FARTHER AND FASTER 93
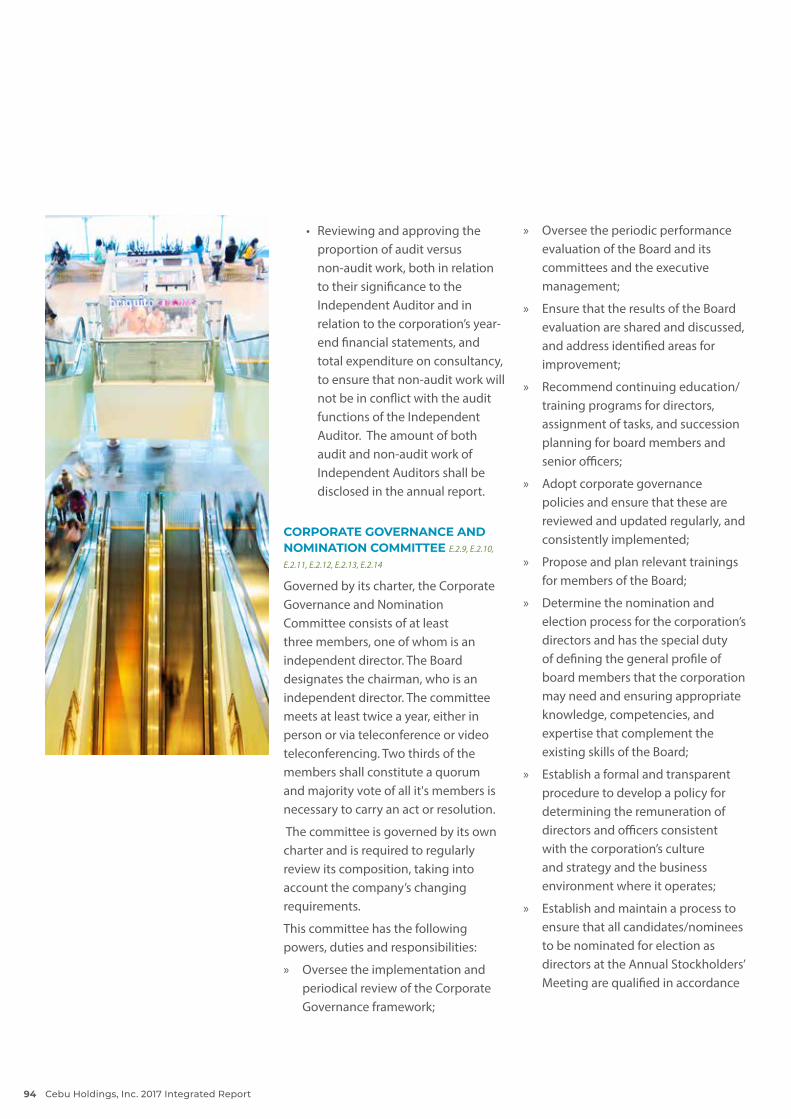
• Reviewing and approving the proportion of audit versus non-audit work, both in relation to their significance to the Independent Auditor and in relation to the corporation’s year-end financial statements, and total expenditure on consultancy, to ensure that non-audit work will not be in conflict with the audit functions of the Independent Auditor. The amount of both audit and non-audit work of Independent Auditors shall be disclosed in the annual report.
CORPORATE GOVERNANCE AND NOMINATION COMMITTEE E.2.9, E.2.10,
E.2.11, E.2.12, E.2.13, E.2.14
Governed by its charter, the Corporate Governance and Nomination Committee consists of at least three members, one of whom is an independent director. The Board designates the chairman, who is an independent director. The committee meets at least twice a year, either in person or via teleconference or video teleconferencing. Two thirds of the members shall constitute a quorum and majority vote of all it's members is necessary to carry an act or resolution.
The committee is governed by its own charter and is required to regularly review its composition, taking into account the company’s changing requirements.
This committee has the following powers, duties and responsibilities:
» Oversee the implementation and periodical review of the Corporate Governance framework;
» Oversee the periodic performance evaluation of the Board and its committees and the executive management;
» Ensure that the results of the Board evaluation are shared and discussed, and address identified areas for improvement;
» Recommend continuing education/training programs for directors, assignment of tasks, and succession planning for board members and senior officers;
» Adopt corporate governance policies and ensure that these are reviewed and updated regularly, and consistently implemented;
» Propose and plan relevant trainings for members of the Board;
» Determine the nomination and election process for the corporation’s directors and has the special duty of defining the general profile of board members that the corporation may need and ensuring appropriate knowledge, competencies, and expertise that complement the existing skills of the Board;
» Establish a formal and transparent procedure to develop a policy for determining the remuneration of directors and officers consistent with the corporation’s culture and strategy and the business environment where it operates;
» Establish and maintain a process to ensure that all candidates/nominees to be nominated for election as directors at the Annual Stockholders’ Meeting are qualified in accordance
Cebu Holdings, Inc. 2017 Integrated Report94
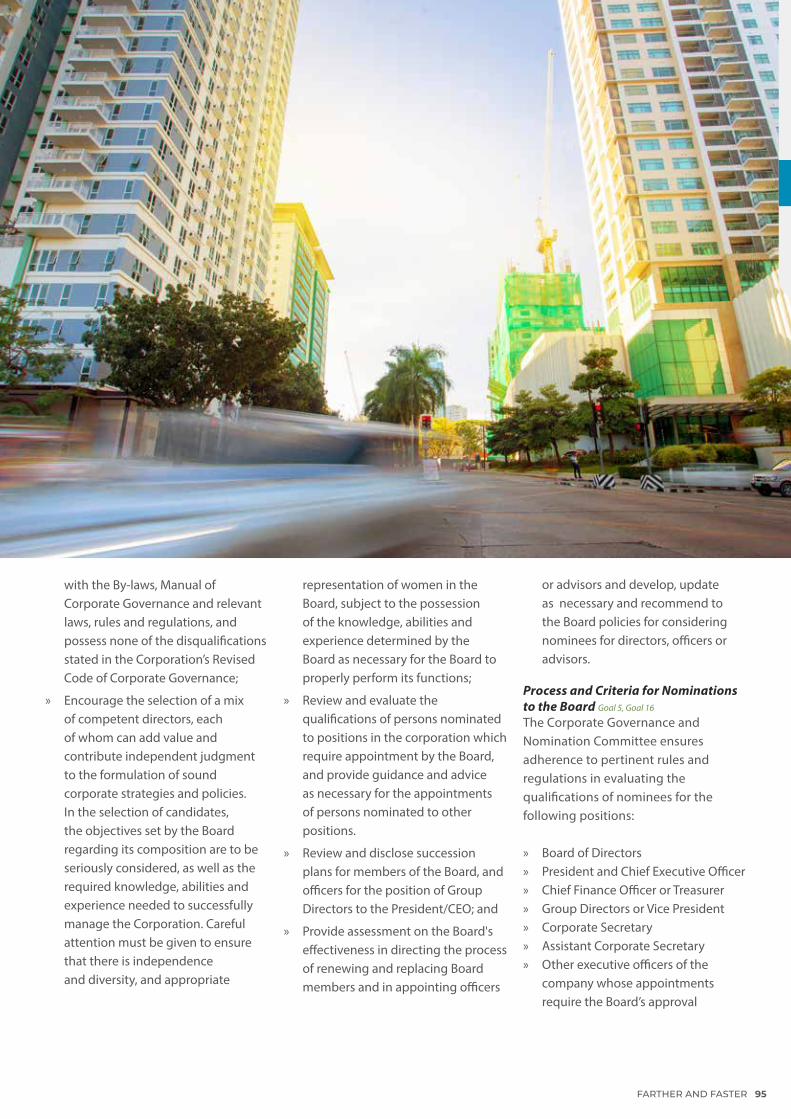
with the By-laws, Manual of Corporate Governance and relevant laws, rules and regulations, and possess none of the disqualifications stated in the Corporation’s Revised Code of Corporate Governance;
» Encourage the selection of a mix of competent directors, each of whom can add value and contribute independent judgment to the formulation of sound corporate strategies and policies. In the selection of candidates, the objectives set by the Board regarding its composition are to be seriously considered, as well as the required knowledge, abilities and experience needed to successfully manage the Corporation. Careful attention must be given to ensure that there is independence and diversity, and appropriate
representation of women in the Board, subject to the possession of the knowledge, abilities and experience determined by the Board as necessary for the Board to properly perform its functions;
» Review and evaluate the qualifications of persons nominated to positions in the corporation which require appointment by the Board, and provide guidance and advice as necessary for the appointments of persons nominated to other positions.
» Review and disclose succession plans for members of the Board, and officers for the position of Group Directors to the President/CEO; and
» Provide assessment on the Board's effectiveness in directing the process of renewing and replacing Board members and in appointing officers
or advisors and develop, update as necessary and recommend to the Board policies for considering nominees for directors, officers or advisors.
Process and Criteria for Nominations to the Board Goal 5, Goal 16
The Corporate Governance and Nomination Committee ensures adherence to pertinent rules and regulations in evaluating the qualifications of nominees for the following positions:
» Board of Directors » President and Chief Executive Officer » Chief Finance Officer or Treasurer » Group Directors or Vice President » Corporate Secretary » Assistant Corporate Secretary » Other executive officers of the
company whose appointments require the Board’s approval
FARTHER AND FASTER 95
Nomination Process for All DirectorsProcess adoptedThe Corporate Governance and Nomination Committee develops and maintains a process that ensures all directors nominated for election at the annual stockholders’ meetings have all the qualifications (and none of the disqualifications) to become directors as required by all applicable rules.
After passing this process, directors are then elected by company stockholders who are entitled to vote. Such shareholders also have the right to elect, remove, and replace directors, and vote on certain corporate acts in accordance with the Corporation Code.
Cumulative voting shall be used in the election of directors. Directors may be removed with or without cause, but directors shall not be removed without cause if it will deny minority shareholder representation in the Board. The removal of directors, moreover, requires an affirmative vote of two-thirds of the outstanding capital of the corporation.
CriteriaTo qualify for nomination, a director must own at least one share of capital stock and be a college graduate or have sufficient understanding of the fundamentals of, or extensive experience in, managing a business. Candidates for directorial posts must also possess relevant qualifications, such as previous business experience, membership in good standing in relevant industries, and membership in
business or professional organizations. They must also possess integrity and diligence.
F. PERSONNEL AND COMPENSATION COMMITTEE E.2.15,
E.2.16, E.2.17, E.2.18, E.2.19, E.2.20, E.3.14
The Compensation Committee is composed of at least three members, one of whom is an independent director. The Board designates the chairman, who is an independent director.
The committee meets at least twice a year, or as often as necessary, either in person or via teleconference or video conference. The presence of two-thirds of the members constitutes a quorum, and the majority vote of all members is necessary to carry an act or resolution. The number of meetings and attendance of each member are detailed on page 122.
Governed by its own charter, the committee has the following powers, duties and responsibilities:
» Designate remuneration packages for corporate executives, officers and directors, and provide oversight over remuneration of senior management and other key personnel, ensuring consistency with the corporate culture, long term interests of the corporate leadership, business competitiveness, and a fair and transparent performance evaluation process;
» Establish a transparent procedure for developing a policy on remuneration packages and provide for the full disclosure of the executive officers’ compensation whenever necessary;
» Enforce full business interest disclosure as a pre-employment requirement for all officers; and
» Review and recommend changes to the Human Resources Development or Personnel Handbook whenever necessary.
No member of the committee is allowed to set their own compensation except for uniform compensation to all directors as members of the Board.
G. RISK OVERSIGHT COMMITTEE E.3.19, E.3.20, E.3.21, E.3.22, Goal 16
The Board established a separate board-level Risk Oversight Committee on its April 24, 2015 meeting to provide assistance in fulfilling the Board’s oversight responsibilities in relation with risk governance.
The committee is composed of three members, and all are independent directors. Its chairman is an independent director, and each member possesses an adequate understanding of the management, assessment and mitigation of risks to which the company is exposed to. The Chairman of the Risk Oversight Committee is not the Chairman of the Board or of any other committee.
Governed by its charter, the committee meets at least quarterly, or as often
Cebu Holdings, Inc. 2017 Integrated Report96
as necessary, either in person or via teleconference or video conferencing. The presence of two-thirds of the members constitutes a quorum. The committee conducted separate executive sessions with the Chief Risk Officer (CRO), Chief Finance Officer (CFO), Chief Audit Executive (CAE), or other members of the management team or external auditors as may be necessary. The number of meetings and attendance of each member are detailed on page 122.
Renamed to Risk Oversight Committee and with an updated charter in 2017, the following constitute its authority, roles and responsibilities: » Develop a formal enterprise risk
management plan which contains: • Common language or register of
risks;• Well-defined risk management
goals, objectives, and oversight;• Uniform processes of assessing
risks and developing strategies to manage prioritized risks;
• Designing and implementing risk management strategies; and
• Continuing assessments to improve risk strategies, processes, and measures.
» Oversee the implementation of the enterprise risk management plan through a Management Risk Oversight Committee;
» Review the adequacy of the corporation’s risk management framework to ensure that an overall set of risk management policies and
FARTHER AND FASTER 97
procedures exist for the corporation, and oversee its implementation through the Risk Management Group.
» Evaluate the risk management plan to ensure its continued relevance, comprehensiveness, and effectiveness. The Board Risk Oversight Committee revisits defined risk management strategies, looks for emerging or changing material exposures, and stays abreast of significant developments that seriously impact the livelihood of harm or loss;
» Advise the Board on its risk appetite levels and risk tolerance limits;
» Review at least annually the corporation’s risk appetite levels and risk tolerance limits based on changes and developments in the business, regulatory framework, external economic and business environment, and other major events considered to have major impacts on the corporation;
» Conduct discussions on the corporation’s prioritized and residual risk exposures, including their impact or potential impact on the corporation and its subsidiaries, and how they are addressing and managing these risks;
» Assess the probability of each identified risk becoming a reality and estimate its possible significant financial impact and likelihood of occurrence;
» Provide oversight over Management’s activities in managing credit, market, liquidity, operational, legal and other risk exposures of the Corporation and evaluate the effectiveness of the risk mitigation strategies and action plans, with the assistance of the internal auditors. This includes ensuring that the corporation maintains a framework for fraud prevention and detection (i.e. Whistleblower Program) and plans for business continuity (i.e. Business Continuity Plan);
» Meet periodically with management to discuss the Committee’s observations on and evaluation of its risk management activities, and
» Report to the Board on a regular basis, or as deemed necessary, the corporation’s material risk exposures, the actions taken to reduce the risks, and recommend further action or plans, as necessary.
This policy notwithstanding, management remains primarily responsible for the development, implementation and reporting the results of the entire risk management framework.
Cebu Holdings, Inc. 2017 Integrated Report98
The committee is governed by a charter, which sets out all policies, responsibilities, and authority of the committee. This charter is reviewed by the committee annually, with any changes or revisions subject to the Board’s approval.
The Committee is responsible for:
» Constantly evaluating existing relations between and among businesses and counterparties to guarantee that all related parties are identified;
» Evaluate material agreements of any kind with a related party and determine any potential reputational risks that may arise as a result of, or in connection with, the transactions;
» Assist the Board in determining whether to approve, ratify, disapprove or reject an RPT;
» Evaluate whether an RPT entered into is on terms no less favorable to the company than terms generally available to an affiliated third party under the same or similar circumstances; and review all information provided by management, including all relevant facts and circumstances;
» Review results of the appraisal, valuation method, and alternative approaches for transactions involving the sale of CHI’s assets;
» Endorse significant or material RPTs to the Board for approval;
» Oversee the implementation of the system for identifying, monitoring, measuring, controlling and reporting RPTs by management, including periodic review of the corporation’s RPT policy and procedures; and
» Annually review the committee’s own performance.
RELATED PARTY TRANSACTIONS REVIEW COMMITTEE
CHI’s Related Party Transactions Review Committee was created in 2017 to provide assistance to the Board in its oversight responsibility, related to the following: » Review of all Related Party
Transactions (RPTs), except those already approved as detailed in CHI’s current RPT Policy;
» Formulation, revision, and approval of policies on RPTs;
» Conduct of any investigation, required to fulfill the Board’s responsibilities on RPTs.
The committee is chaired by an independent director, and is made up of three members, all of whom are independent. It meets as often as necessary, whether in person or through electronic channels. The presence of two-thirds of the members during a meeting constitutes a quorum.
To fulfill these responsibilities, the Committee shall communicate openly and freely with CHI’s management and compliance team.
The committee has the power to investigate any matter brought to its attention, with full access to all records, books of accounts, facilities, and personnel of CHI. It may seek outside counsel or expert opinion in the conduct of such investigations.
FARTHER AND FASTER 99
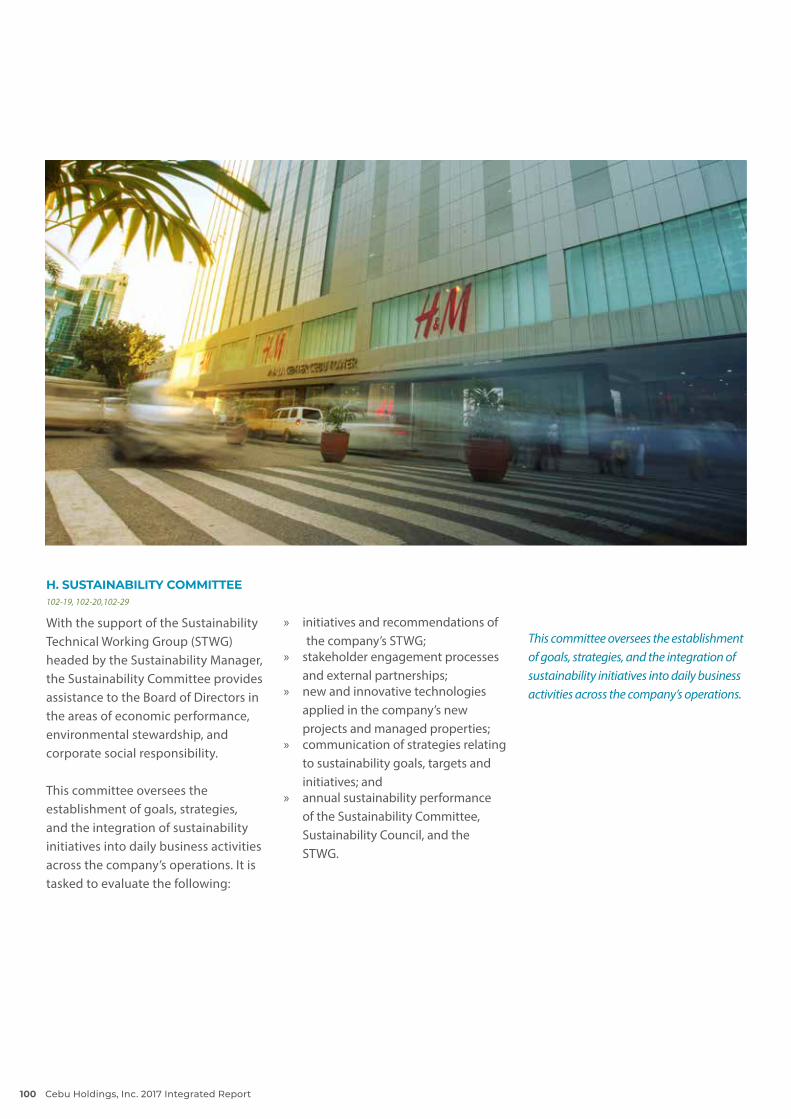
H. SUSTAINABILITY COMMITTEE 102-19, 102-20,102-29
With the support of the Sustainability Technical Working Group (STWG) headed by the Sustainability Manager, the Sustainability Committee provides assistance to the Board of Directors in the areas of economic performance, environmental stewardship, and corporate social responsibility.
This committee oversees the establishment of goals, strategies, and the integration of sustainability initiatives into daily business activities across the company’s operations. It is tasked to evaluate the following:
» initiatives and recommendations of the company’s STWG;
» stakeholder engagement processes and external partnerships;
» new and innovative technologies applied in the company’s new projects and managed properties;
» communication of strategies relating to sustainability goals, targets and initiatives; and
» annual sustainability performance of the Sustainability Committee, Sustainability Council, and the STWG.
This committee oversees the establishment of goals, strategies, and the integration of sustainability initiatives into daily business activities across the company’s operations.
Cebu Holdings, Inc. 2017 Integrated Report100
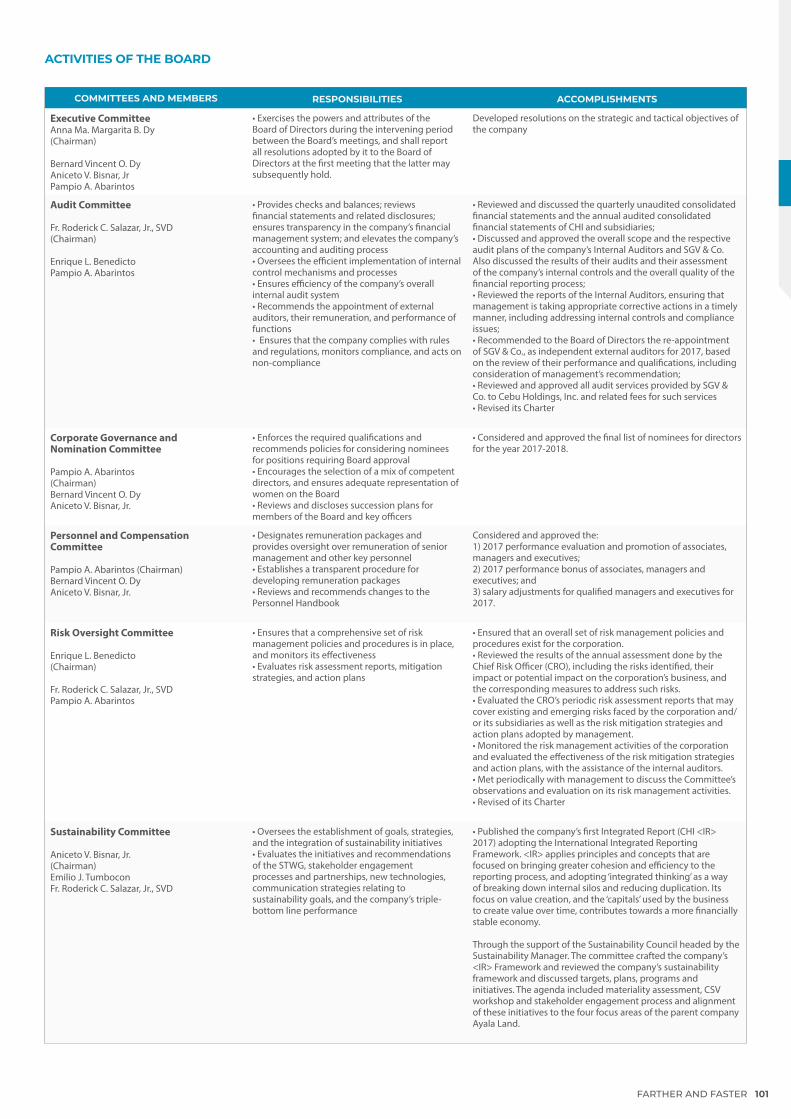
FARTHER AND FASTER 101
ACTIVITIES OF THE BOARD
COMMITTEES AND MEMBERS RESPONSIBILITIES ACCOMPLISHMENTS
Executive CommitteeAnna Ma. Margarita B. Dy(Chairman)
Bernard Vincent O. DyAniceto V. Bisnar, JrPampio A. Abarintos
• Exercises the powers and attributes of the Board of Directors during the intervening period between the Board’s meetings, and shall report all resolutions adopted by it to the Board of Directors at the first meeting that the latter may subsequently hold.
Developed resolutions on the strategic and tactical objectives of the company
Audit Committee
Fr. Roderick C. Salazar, Jr., SVD(Chairman)
Enrique L. BenedictoPampio A. Abarintos
• Provides checks and balances; reviews financial statements and related disclosures; ensures transparency in the company’s financial management system; and elevates the company’s accounting and auditing process• Oversees the efficient implementation of internal control mechanisms and processes• Ensures efficiency of the company’s overall internal audit system• Recommends the appointment of external auditors, their remuneration, and performance of functions• Ensures that the company complies with rules and regulations, monitors compliance, and acts on non-compliance
• Reviewed and discussed the quarterly unaudited consolidated financial statements and the annual audited consolidated financial statements of CHI and subsidiaries;• Discussed and approved the overall scope and the respective audit plans of the company’s Internal Auditors and SGV & Co. Also discussed the results of their audits and their assessment of the company’s internal controls and the overall quality of the financial reporting process;• Reviewed the reports of the Internal Auditors, ensuring that management is taking appropriate corrective actions in a timely manner, including addressing internal controls and compliance issues; • Recommended to the Board of Directors the re-appointment of SGV & Co., as independent external auditors for 2017, based on the review of their performance and qualifications, including consideration of management’s recommendation;• Reviewed and approved all audit services provided by SGV & Co. to Cebu Holdings, Inc. and related fees for such services• Revised its Charter
Corporate Governance and Nomination Committee
Pampio A. Abarintos(Chairman)Bernard Vincent O. DyAniceto V. Bisnar, Jr.
• Enforces the required qualifications and recommends policies for considering nominees for positions requiring Board approval• Encourages the selection of a mix of competent directors, and ensures adequate representation of women on the Board• Reviews and discloses succession plans for members of the Board and key officers
• Considered and approved the final list of nominees for directors for the year 2017-2018.
Personnel and Compensation Committee
Pampio A. Abarintos (Chairman)Bernard Vincent O. DyAniceto V. Bisnar, Jr.
• Designates remuneration packages and provides oversight over remuneration of senior management and other key personnel• Establishes a transparent procedure for developing remuneration packages• Reviews and recommends changes to the Personnel Handbook
Considered and approved the:1) 2017 performance evaluation and promotion of associates, managers and executives;2) 2017 performance bonus of associates, managers and executives; and3) salary adjustments for qualified managers and executives for 2017.
Risk Oversight Committee
Enrique L. Benedicto(Chairman)
Fr. Roderick C. Salazar, Jr., SVDPampio A. Abarintos
• Ensures that a comprehensive set of risk management policies and procedures is in place, and monitors its effectiveness• Evaluates risk assessment reports, mitigation strategies, and action plans
• Ensured that an overall set of risk management policies and procedures exist for the corporation.• Reviewed the results of the annual assessment done by the Chief Risk Officer (CRO), including the risks identified, their impact or potential impact on the corporation’s business, and the corresponding measures to address such risks.• Evaluated the CRO’s periodic risk assessment reports that may cover existing and emerging risks faced by the corporation and/or its subsidiaries as well as the risk mitigation strategies and action plans adopted by management.• Monitored the risk management activities of the corporation and evaluated the effectiveness of the risk mitigation strategies and action plans, with the assistance of the internal auditors.• Met periodically with management to discuss the Committee’s observations and evaluation on its risk management activities.• Revised of its Charter
Sustainability Committee
Aniceto V. Bisnar, Jr.(Chairman)Emilio J. TumboconFr. Roderick C. Salazar, Jr., SVD
• Oversees the establishment of goals, strategies, and the integration of sustainability initiatives• Evaluates the initiatives and recommendations of the STWG, stakeholder engagement processes and partnerships, new technologies, communication strategies relating to sustainability goals, and the company’s triple-bottom line performance
• Published the company’s first Integrated Report (CHI <IR> 2017) adopting the International Integrated Reporting Framework. <IR> applies principles and concepts that are focused on bringing greater cohesion and efficiency to the reporting process, and adopting ‘integrated thinking’ as a way of breaking down internal silos and reducing duplication. Its focus on value creation, and the ‘capitals’ used by the business to create value over time, contributes towards a more financially stable economy.
Through the support of the Sustainability Council headed by the Sustainability Manager. The committee crafted the company’s <IR> Framework and reviewed the company’s sustainability framework and discussed targets, plans, programs and initiatives. The agenda included materiality assessment, CSV workshop and stakeholder engagement process and alignment of these initiatives to the four focus areas of the parent company Ayala Land.
BOARD PROCESSES
BOARD MEETINGS AND ATTENDANCE E.3.1, E.3.2, E.3.3, E.3.4, E.3.5
Board meetings are scheduled at the beginning of the year. The presence of two-thirds of all Board members constitutes a quorum. The dissemination of agenda, presentation materials and items for approval are made available at least three business days prior to the meeting schedule.
In 2017, the Board had five regular and organizational meetings. All the board members attended 100 percent of the meetings for the year. The Executive Committee likewise convenes regularly in lieu of the Board. Attendance of all directors is detailed in the table found on page 122.
THE CORPORATE SECRETARYE.3.7, E.3.8
The Corporate Secretary plays a key role in supporting the Board in the discharge of its functions and must share the visions and decisiveness of the CEO. He or she is a Filipino with excellent legal, financial, accounting, administrative, and interpersonal skills.
The Corporate Secretary is tasked to attend to the correspondences and files of the company, and signs jointly with the president all stock certificates. The position also is tasked to record and process all movements of stock certificates.
The Corporate Secretary is primarily responsible to the Corporation and its stakeholders and has, among others, the following duties and responsibilities:
» Assists the Board and the Board committees in the conduct of their meetings, including preparing an annual schedule of Board and committee meetings and the annual Board calendar, and assisting the chairs of the Board and its committees to set agendas for those meetings.
» Safekeeps and preserves the integrity of the minutes of the meetings of the Board and its committees, as well as other official records of the corporation;
» Keeps abreast on relevant laws, regulations, all governance issuances, relevant industry developments and operations of the corporation, and advises the Board and the Chairman on all relevant issues as they arise;
» Works fairly and objectively with the Board, management and stockholders and contributes to the flow of information between the Board and management, the Board and its committees, and the Board and its stakeholders, including shareholders;
» Advises on the establishment of Board committees and their terms of reference;
» Informs members of the Board, in accordance with the By-Laws, of the agenda of their meetings at least five (5) working days in advance, and ensures that the members have before them accurate information that will enable them to arrive at intelligent decisions on matters that require their approval;
» Attends all Board meetings, except when justifiable causes, such as
illness, death in the immediate family and serious accidents, prevent him/her from doing so;
» Performs required administrative functions;
» Oversees the drafting of the by-laws and ensures that they conform with regulatory requirements; and
» Performs such other duties and responsibilities as may be provided by the SEC.
The Board has separate and independent access to the Corporate Secretary.
BOARD APPOINTMENTS ANDRE-ELECTION E.3.9, E.3.10, E.3.11, 102-24
The directors are elected by ballot, and each shareholder is entitled to cast as many votes as the number of his/her shares, multiplied by the number of slots for election. Pursuant to the Corporation Code, any shareholder—including minority shareholders—shall have the right to nominate candidates to the Board. For the election of directors, it is necessary for one-half plus one of the outstanding shares of stock to be represented.
The Committee of Inspectors of Proxies and Ballots appointed by the Board supervises the election.
Directors hold office for the term of one year or until their successors shall have been elected and qualified, in accordance with the by-laws.
In 2017, SGV & Co. was appointed to validate the records.
Cebu Holdings, Inc. 2017 Integrated Report102
BOARD INDEPENDENCE AND CONFLICT OF INTEREST E.2, 102-25
Members of the Board are obligated to follow high ethical standards while bearing in mind the interests of all stakeholders.
Directors are expected to act only in the best interest of the company and are required to comply with the Code of Ethics. Thus, they are required to disclose annually any conflict of interest through a Disclosure Form. Any material conflict of interest found shall cause disqualification from the Board. Moreover, directors are required to abstain from participating in discussions and voting on any matter where they are in conflict of interest.
In line with the insider trading policy of the company, each director is required to notify the Board at least one day before dealing in the company’s shares of stock.
No person shall qualify or be eligible for nomination or election to the Board if he or she is engaged in any business which competes with, or is antagonistic to, that of the company in accordance with the company’s by-laws.
Directors should keep the information contained in confidential reports or discussions for at least two years, and ensure that all persons who have access to this information on their behalf comply with this rule.
REMUNERATION D.2.11, E.3.12, E.3.13, E.3.14,
E.3.15, 102-35, 102-36
Remuneration PolicyThe Board of Directors determines a level of remuneration for its members that is sufficient to attract and retain those who are competent, and compensate them not only for their performance of numerous responsibilities but also for undertaking certain risks as a Board member.
The compensation is determined through a resolution of the Board, who may provide that only non-executive directors shall be entitled to such compensation. Moreover, the company may purchase insurance coverage for its directors at its own expense.No director should be involved in deciding his or her own remuneration. Furthermore, the company does not have stock rights, options, and warrants for directors, executives, and employees.
Non-executive directors, defined as members of the Board who are neither officers nor consultants of the company, receive a per diem of P40,000 for each Board meeting attended and P20,000 per Board committee meeting actually attended. These amounts were implemented effective April 28, 2006.
Details about remuneration matters are found on page 124.
Remuneration Process Discussion and approval of remuneration for CEO and management officers are done through
the Personnel and Compensation Committee. The committee establishes a formal and transparent procedure for fixing the remuneration packages of corporate officers and directors, and provides oversight over remuneration of senior management and other key personnel.
None of the directors, in their personal capacity, has been contracted and compensated by the company for services other than those provided as a director.
DIVERSITY, SKILLS AND COMPETENCIES E.4.5, E.4.6
The company is headed by a competent, working board that fosters its long-term competitiveness and profitability in a manner consistent with its corporate objectives and the long-term interests of its shareholders and other stakeholders.
The company has a policy ensuring diversity of experience and background of directors in the Board.
The Revised Manual of Corporate Governance reflects the relevant qualifications of directors, including their membership to the Board’s various committees. Apart from educational requirements, a director should have sufficient understanding of business fundamentals and experience in managing a business.
The CHI Board brings to the organization a balanced mix of business, legal, and finance competencies, with each director
FARTHER AND FASTER 103
capable of adding value and rendering independent judgment in relation to the formulation of sound corporate policies on issues of strategy, resources, standards and performance related to corporate social responsibility, and environmental and economic sustainability.
The company also requires that at least one of its non-executive directors should have prior working experience in the sector or broad industry group to which our company belongs.
The Board’s composition must reflect the necessary knowledge, skills and experience required to properly perform its duties. Thus, it regularly reviews its own composition, taking into account the evolving requirements of the company and best practices in corporate governance. CHI encourages the selection of a mix of competent directors, where each can add value and contribute independent judgment to the formulation of sound corporate strategies and policies.
The corporation seriously considers the objectives set by the Board regarding its composition, as well as the required knowledge, abilities and experience needed to successfully manage the corporation. CHI gives careful attention to ensure that there is independence and diversity, and appropriate representation of women in the Board, subject to possession of knowledge, abilities, skills and experience determined by the Board as necessary for the Board to properly perform its functions.
It is important to have Board diversity to avoid groupthink and ensure that
optimal decision-making is achieved. Diversity is not limited to gender and includes age, ethnicity, culture, skills, competence and knowledge.
DEVELOPMENT AND TRAINING D.2.8,
E.5.5, E.5.6, E.5.7, 102-27
The company encourages Board members to participate in continuing professional education programs particularly on corporate governance. An orientation program for new directors is held whenever necessary to properly equip and prepare them for their role as members of the Board.
Aside from the regular corporate governance training facilitated by the ICD, we ensured the perfect attendance of all members of the Board to the Ayala group of companies’ annual SEC-accredited corporate governance summit in 2017. The Corporate Governance and Risk Management Summit was held on August 11, 2017 at the Fairmont Hotel.
PERFORMANCE APPRAISAL E.5.5, E.5.6,
E.5.7, E.5.8, E.5.9, E.5.10, 102-28
Following best practices, the Board measures its assessment process and regularly carries out evaluations to appraise its performance and ensure a balanced composition or mix of backgrounds and competencies.
One of the tools used by the Board to monitor and improve its performance is an annual self-assessment exercise. This peer review is implemented in the form of a formal questionnaire and cuts across each top management group based on four review clusters. The Assessment covers the Board of Directors, the Board Committees, individual directors, and the president and CEO.
The results are compiled by the Compliance Officer and submitted back to the Board for discussion and appropriate action through the corporate secretary. This self-assessment survey basically covers compliance to the Corporate Governance Manual, individual committee charters, and performance scorecard for the president/CEO. The survey questions are reviewed regularly and administered in May each year.
PEOPLE ON THE BOARDCHAIRMAN AND PRESIDENT AND CEO E.4, 102-23
The chairman and the CEO have separate roles to ensure Board independence from management, an appropriate balance of power and increased accountability. Of the nine members of the Board, only the president and CEO is an executive director. The rest are non-executive or independent directors who are neither officers nor consultants of the company.
The current chairman of the Board is Anna Ma. Margarita B. Dy who assumed the position in April 24, 2017. As chairman,she acts as the legal representative of the company and has the following roles and responsibilities:
» Makes certain that the meeting agenda focuses on strategic matters, including the overall risk appetite of the corporation, considering the development in the business and regulatory environments, key governance concerns, and contentious issues that will significantly affect operations;
» Guarantees that the Board receives accurate, timely, relevant, information
Cebu Holdings, Inc. 2017 Integrated Report104

» Facilitates discussions on key issues by fostering an environment conducive for constructive debate and leveraging on skills and expertise of individual directors;
» Ensures that the Board sufficiently challenges and inquires on reports submitted and representations made by management;
» Assures the availability of proper orientation for first-time directors and continuing training opportunities for all directors; and
Makes sure that performance of the Board is evaluated at least once a year Moreover, the chairman shall ensure that all directors are allowed to freely express their opinions about any matter being discussed.
The current president and CEO is Aniceto V. Bisnar, Jr. who assumed the position in January 2015.
The CEO has the following roles and responsibilities:
» Determines the corporation’s strategic direction and formulates and implements its strategic plan on the direction of the business;
» Communicates and implements the corporation’s vision, mission, values and overall strategy and promotes any organization or stakeholder change in relation to the same;
» Oversees the operations of the corporation and manages human and financial resources in accordance with the strategic plan;
» Has a good working knowledge of the corporation’s industry and market and keeps up-to-date with its core business purpose;
» Directs, evaluates and guides the work of the key officers of the corporation;
» Manages the corporation’s resources prudently and ensures a proper balance of the same;
» Provides the Board with timely information and interfaces between the Board and the employees;
» Builds the corporate culture and motivates the employees of the corporation; and
» Serves as the link between internal operations and external stakeholders.
CORPORATE OBJECTIVES D.2
The Board and management committee ensure that the company achieves its objectives with the implementation of set strategies, maximizing efficiency of operations, exploring ways to grow the business, and ensuring the sustainability of the company.
SHAREHOLDER VALUE CREATION D.2
Our company seeks to consistently improve its business fundamentals and prospects to deliver increasing value to our shareholders’ investments. Our strategies, business models, and operating plans are all oriented towards achieving consistent progress in all aspects of the business and the value we create.
We focus on growth, profitability, return on equity, asset efficiency, and total shareholder return as key result areas for our management team on a corporate, divisional, and individual level. These form the basis of incentives such as management promotions, allocation of a performance-based cash bonus, and executive stock ownership plan grants.
COMPLIANCE OFFICER
Ma. Luisa D. Chiong is currently CHI’s Chief Finance Officer and Compliance Officer effective August 15, 2017. She ensures strict adherence to the Code of Corporate Governance and to the rules and regulations of regulatory agencies. He is also responsible for reporting any violations to the Board.
To ensure stricter monitoring and timely compliance with regulations, we have also identified all regulatory requirements of our business operations and put in place an electronic monitoring system for compliance. The system covers all our units, including our business partners or contractors.
CODE OF ETHICAL BEHAVIOR E.2.1,
E.2.2, E.2.3
The Code of Ethical Behavior outlines the general expectations and standards of behavior and ethical conduct of everyone in the company—including that of subsidiaries and affiliates. It is implemented in conjunction with the company’s Human Resources Manual of Personnel Policies, and includes the Code of Conduct on acceptable office behavior for the orderly operation of the company and the protection of the rights, safety and benefit of the entire workforce. Company employees are required to annually disclose any business and family-related transactions to the company by submitting a Conflict of Interest Disclosure Statement to the Human Resources and Admin Division.Our company’s Code of Ethics and Conflict of Interest Policy may be accessed through our website link: http://www.cebuholdings.com/governance_list/12/.
FARTHER AND FASTER 105
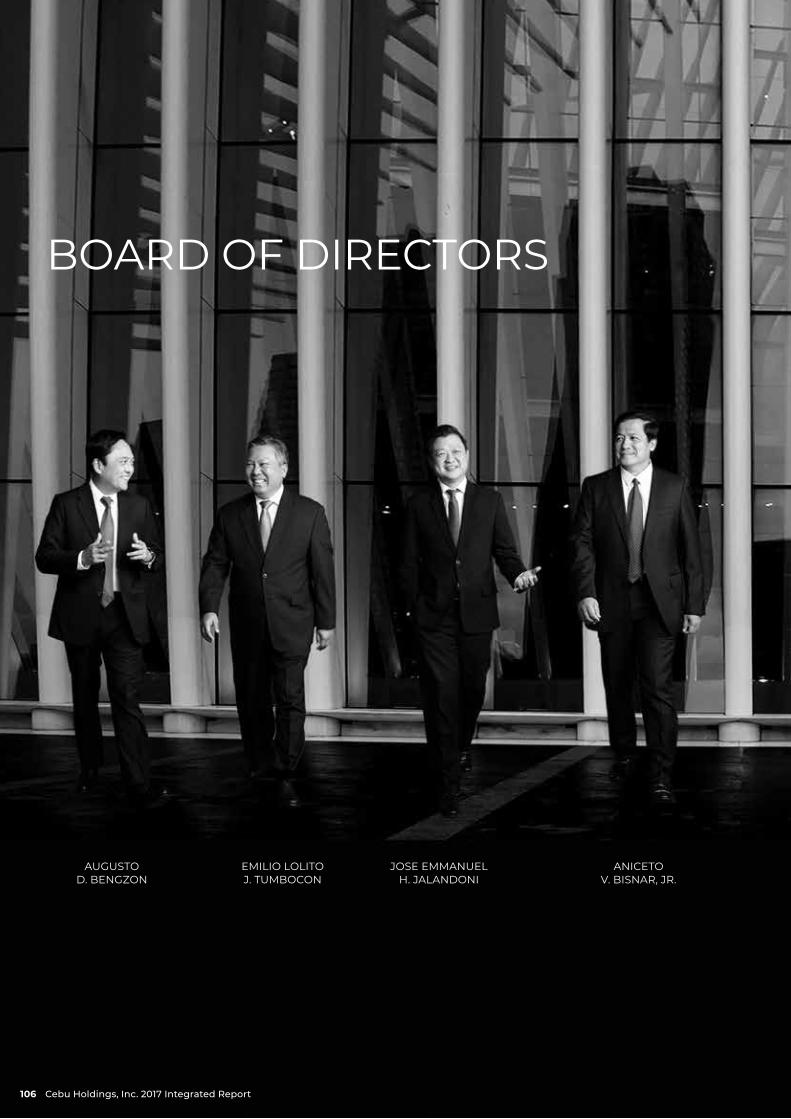
BOARD OF DIRECTORS
JOSE EMMANUEL H. JALANDONI
ANICETOV. BISNAR, JR.
AUGUSTO D. BENGZON
EMILIO LOLITO J. TUMBOCON
Cebu Holdings, Inc. 2017 Integrated Report106
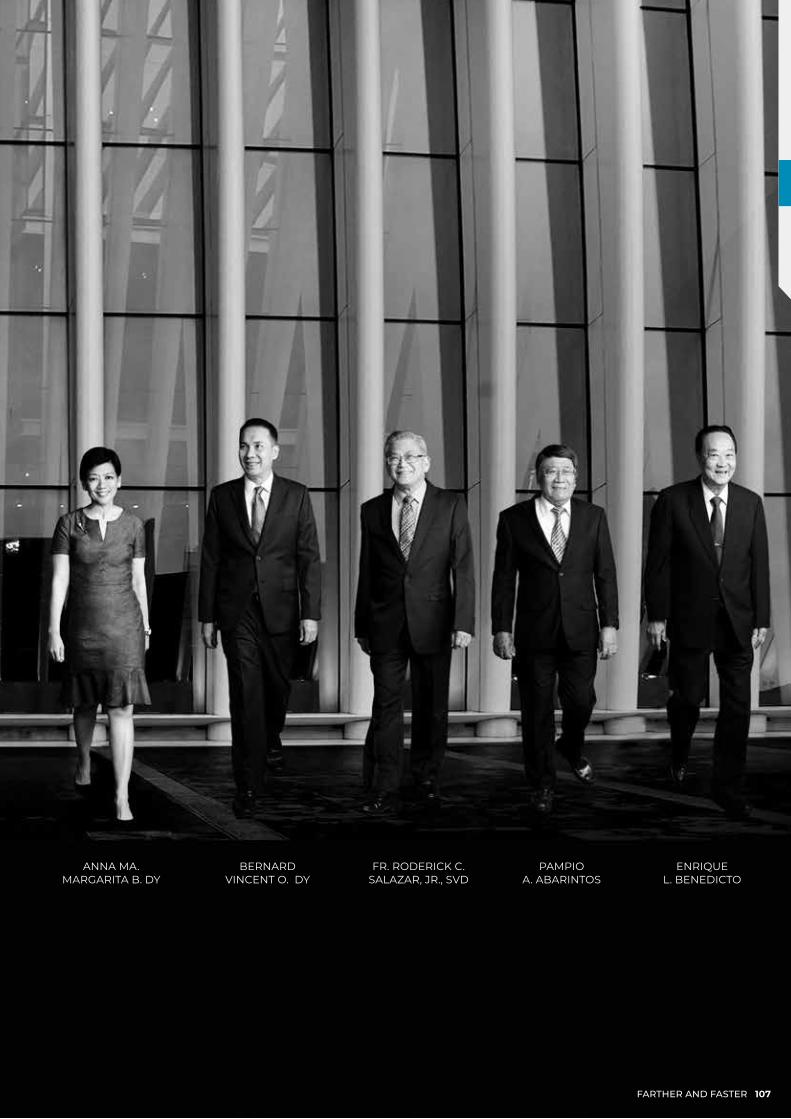
FR. RODERICK C. SALAZAR, JR., SVD
BERNARD VINCENT O. DY
ANNA MA.MARGARITA B. DY
PAMPIO A. ABARINTOS
ENRIQUE L. BENEDICTO
FARTHER AND FASTER 107
1
2
5
3
4
Cebu Holdings, Inc. 2017 Integrated Report108
MANAGEMENT COMMITTEE
1. ANICETO V. BISNAR, JR.Flipino, 53, has been the President of Cebu Holdings, Inc. (CHI) since January 1, 2015. He is also the President of Cebu Property Ventures and Development Corp. (CPVDC) a publicly listed company. Concurrently, he is the Vice President and Chief Operating Officer of the Visayas-Mindanao Group of Ayala Land, Inc. (ALI).
2. MA. LUISA D. CHIONGFilipino, 45, is Chief Finance Officer (CFO) and Compliance Officer of CHI and subsidiary, CPVDC. She assumed the position in August 15, 2017. She is also currently the CFO of the Ayala Land Vismin Group and Strategic Landbank Management Group and an Assistant Vice President in ALI.
3. NERISSA N. JOSEF-MEDIANOFilipino, 46, is the Vice President and Head of the Business Development Group of CHI and CPVDC. Concurrently, she is the Assistant Vice President of ALI.
4. MARIA CLAVEL G. TONGCOFilipino, 50, is the Vice President and Head of the Retail Business Group of CHI and CPVDC. Concurrently, she is an Assistant Vice President of ALI.
5. MA. CECILIA CRISPINA T. URBINAFilipino, 48, is the Assistant Vice President and Head of Corporate Services Group and Human Resources and Administration Division. She is Chairperson of the Health and Safety Committee of CHI.
In addition to the various Board-level committees, the company has established a management committee to guide critical decision-making and key governance processes in overseeing individual business units, projects, and support functions.
FARTHER AND FASTER 109
MANAGEMENT TEAM
Cebu Holdings, Inc. 2017 Integrated Report110
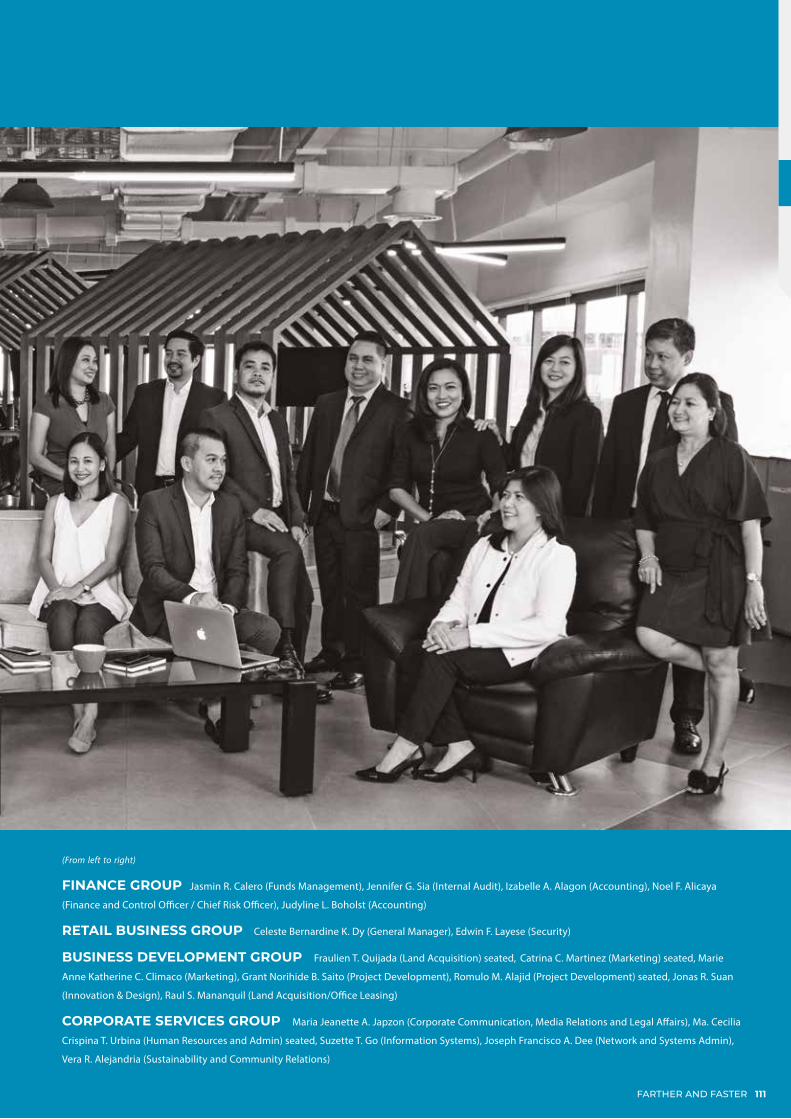
(From left to right)
FINANCE GROUP Jasmin R. Calero (Funds Management), Jennifer G. Sia (Internal Audit), Izabelle A. Alagon (Accounting), Noel F. Alicaya
(Finance and Control Officer / Chief Risk Officer), Judyline L. Boholst (Accounting)
RETAIL BUSINESS GROUP Celeste Bernardine K. Dy (General Manager), Edwin F. Layese (Security)
BUSINESS DEVELOPMENT GROUP Fraulien T. Quijada (Land Acquisition) seated, Catrina C. Martinez (Marketing) seated, Marie
Anne Katherine C. Climaco (Marketing), Grant Norihide B. Saito (Project Development), Romulo M. Alajid (Project Development) seated, Jonas R. Suan
(Innovation & Design), Raul S. Mananquil (Land Acquisition/Office Leasing)
CORPORATE SERVICES GROUP Maria Jeanette A. Japzon (Corporate Communication, Media Relations and Legal Affairs), Ma. Cecilia
Crispina T. Urbina (Human Resources and Admin) seated, Suzette T. Go (Information Systems), Joseph Francisco A. Dee (Network and Systems Admin),
Vera R. Alejandria (Sustainability and Community Relations)
FARTHER AND FASTER 111
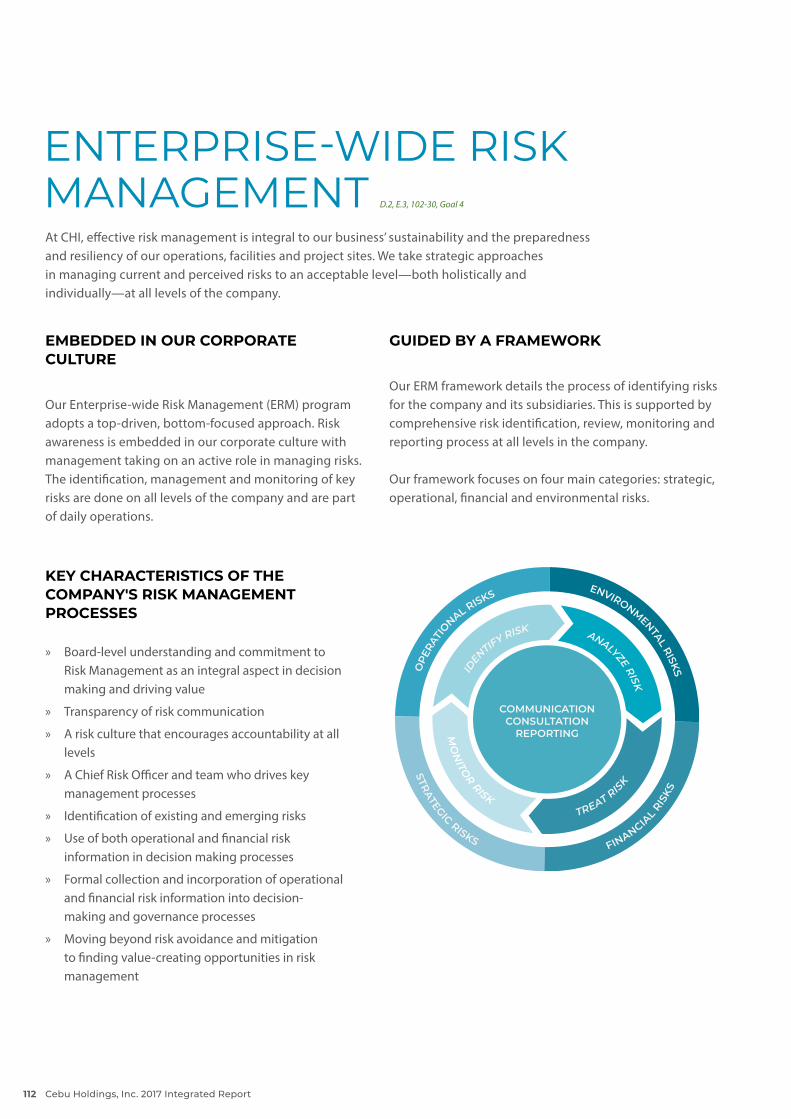
EMBEDDED IN OUR CORPORATE CULTURE
Our Enterprise-wide Risk Management (ERM) program adopts a top-driven, bottom-focused approach. Risk awareness is embedded in our corporate culture with management taking on an active role in managing risks. The identification, management and monitoring of key risks are done on all levels of the company and are part of daily operations.
ENTERPRISE-WIDE RISK MANAGEMENT D.2, E.3, 102-30, Goal 4
At CHI, effective risk management is integral to our business’ sustainability and the preparedness and resiliency of our operations, facilities and project sites. We take strategic approaches in managing current and perceived risks to an acceptable level—both holistically and individually—at all levels of the company.
GUIDED BY A FRAMEWORK
Our ERM framework details the process of identifying risks for the company and its subsidiaries. This is supported by comprehensive risk identification, review, monitoring and reporting process at all levels in the company.
Our framework focuses on four main categories: strategic, operational, financial and environmental risks.
STRATEGIC RISKS
FINANCIA
L RIS
KS
ENVIRONMENTAL RISKSOPE
RATI
ONAL RISKS
COMMUNICATIONCONSULTATION
REPORTINGMO
NITO
R RISKTREAT R
ISK
ANALYZE RISK
IDENTIFY RISK
KEY CHARACTERISTICS OF THE COMPANY'S RISK MANAGEMENT PROCESSES
» Board-level understanding and commitment to Risk Management as an integral aspect in decision making and driving value
» Transparency of risk communication
» A risk culture that encourages accountability at all levels
» A Chief Risk Officer and team who drives key management processes
» Identification of existing and emerging risks
» Use of both operational and financial risk information in decision making processes
» Formal collection and incorporation of operational and financial risk information into decision-making and governance processes
» Moving beyond risk avoidance and mitigation to finding value-creating opportunities in risk management
Cebu Holdings, Inc. 2017 Integrated Report112
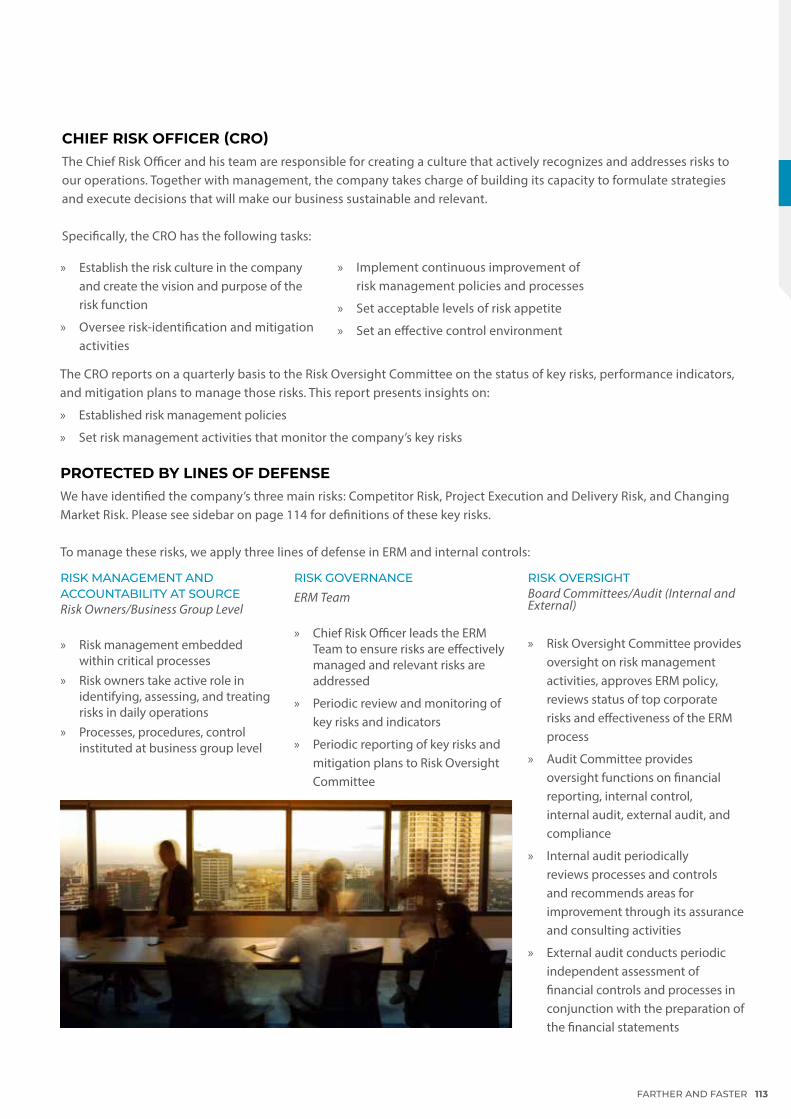
CHIEF RISK OFFICER (CRO)The Chief Risk Officer and his team are responsible for creating a culture that actively recognizes and addresses risks to our operations. Together with management, the company takes charge of building its capacity to formulate strategies and execute decisions that will make our business sustainable and relevant.
Specifically, the CRO has the following tasks:
» Establish the risk culture in the company and create the vision and purpose of the risk function
» Oversee risk-identification and mitigation activities
» Implement continuous improvement of risk management policies and processes
» Set acceptable levels of risk appetite
» Set an effective control environment
The CRO reports on a quarterly basis to the Risk Oversight Committee on the status of key risks, performance indicators, and mitigation plans to manage those risks. This report presents insights on:
» Established risk management policies
» Set risk management activities that monitor the company’s key risks
PROTECTED BY LINES OF DEFENSEWe have identified the company’s three main risks: Competitor Risk, Project Execution and Delivery Risk, and Changing Market Risk. Please see sidebar on page 114 for definitions of these key risks.
To manage these risks, we apply three lines of defense in ERM and internal controls:
RISK MANAGEMENT AND ACCOUNTABILITY AT SOURCERisk Owners/Business Group Level
» Risk management embedded within critical processes
» Risk owners take active role in identifying, assessing, and treating risks in daily operations
» Processes, procedures, control instituted at business group level
RISK GOVERNANCE
ERM Team
» Chief Risk Officer leads the ERM Team to ensure risks are effectively managed and relevant risks are addressed
» Periodic review and monitoring of key risks and indicators
» Periodic reporting of key risks and mitigation plans to Risk Oversight Committee
RISK OVERSIGHTBoard Committees/Audit (Internal and External)
» Risk Oversight Committee provides oversight on risk management activities, approves ERM policy, reviews status of top corporate risks and effectiveness of the ERM process
» Audit Committee provides oversight functions on financial reporting, internal control, internal audit, external audit, and compliance
» Internal audit periodically reviews processes and controls and recommends areas for improvement through its assurance and consulting activities
» External audit conducts periodic independent assessment of financial controls and processes in conjunction with the preparation of the financial statements
FARTHER AND FASTER 113
KEY RISKS 102-15
COMPETITOR RISKS
Actions of competitors or new entrants to the market may affect the company’s competitive advantage and may pose difficulties in achieving our business objective. We manage these risks by regularly monitoring market indicators and use this as basis for informed decisions and possible opportunities. We also analyze current and future situations and develop plans and programs accordingly.
PROJECT EXECUTION AND DELIVERY RISK
Market-driven factors (e.g. costs and availability of labor), fortuitous events (e.g. earthquakes, typhoons) or natural environment conditions (e.g. soil type) may affect the company’s ability to deliver projects within agreed timelines, customer expectations and agreed costs. We regularly monitor the status of our projects to ensure that we meet our customer’s needs and achieve our sales targets.
CHANGING MARKET RISK
Changes in the market brought about by macro-economic, social, political and consumer conditions (e.g. lifestyle demands) may affect the company’s ability to respond to opportunities in the marketplace, anticipate and respond to the demands of our consumers, and maintain or increase our revenue and profitability in the specific business environment where we operate. We respond by pursuing various opportunities to partner with strong local developers and diversify our product lines.
A DRIVER OF KEY STRATEGIC ACTIONSThrough our ERM program, CHI directed the following key strategic actions in 2017:
PROTECTING THE BALANCE SHEET THROUGH FINANCIAL RISK MANAGEMENT
We continue to take advantage of the current low but slowly increasing interest rates by maximizing its leverage and converting our short-term to long-term debt at favorable rates to fund the construction of our leasing projects. This allows us to better balance our debt capacity and maturity with a steady recurring income.
MONITORING OF MAJOR MARKET INDICATORS
We rely on close monitoring of major market indicators for guidance in project investments. Forecasts, industry, and sales reports are regularly monitored and reported to the project teams and senior management to provide them a clearer perspective of prevailing market conditions and issues on the ground for a more informed decision-making process.
CLOSE MONITORING OF ONGOING PROJECTS
The early identification and management of delivery risk allows us to move our projects on the right track, meet our customers’ requirements, and achieve our sales and turnover targets.
EXPANDED PARTNERSHIPS BEYOND PARENT COMPANY
Strong synergies diversify risk and create the opportunity for us to increase our reach and depth in the Cebu market.
In 2017, our continued partnership with strong local developers, Taft Punta Engaño Property, Inc. with Gaisano Group in Mactan, and Cebu District Property Enterprise with Ayala Land and Aboitizland in Mandaue, allowed us to maintain a strong market presence and expand our portfolio through solid synergies, advanced master-planning, stronger combined branding, and deeper market knowledge. These partnerships benefit
from the combined financial strength, technical expertise, and real estate experience of the companies.
DIVERSIFICATION OF PRODUCT LINES
Since 2013, we have been diversifying our portfolio with the introduction of the Amaia brand for affordable housing, and office condominiums for sale, thus extending our market reach.
ACTIVE MANAGEMENT OF ENVIRONMENTAL RISKS 102-11
Our operations have a major impact on the environment and social conditions in the areas where we operate. Together with parent company Ayala Land, we outlined our sustainability focus areas where we can affect positive change through our developments. These include: (1) site resilience, (2) eco-efficiency, (3) pedestrian-transit connectivity and (4) local economic development. Programs have been implemented in 2017 for these focus areas.
We also continue to adapt measures to reinforce our Business Continuity Plan. Our Crisis Management Team ensures continuous operations, or at least minimal disruption, during calamities and unforeseen events. Improvements on our services and facilities have also been implemented to ensure the safety of our stakeholders and enhance our readiness in times of emergencies and calamities. These allow us to protect our assets, especially our employees, customers, and locators in our facilities.
ASSESSING OUR RISK MATURITY Aon PLC, the leading global provider of risk management, insurance and reinsurance brokerage, and human resources solutions and outsourcing services, designed the Aon Risk Maturity Index—an innovative tool to assess an organization’s risk management practices through a Risk Maturity Rating.
Cebu Holdings, Inc. 2017 Integrated Report114
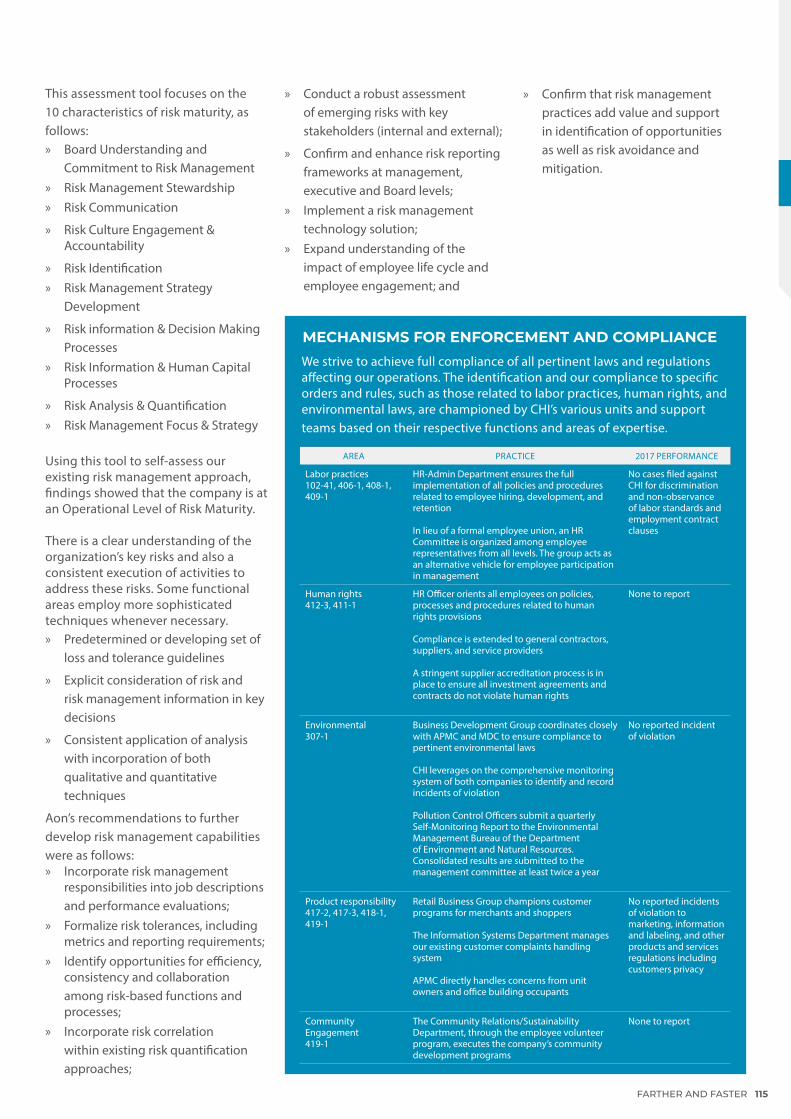
This assessment tool focuses on the 10 characteristics of risk maturity, as follows: » Board Understanding and
Commitment to Risk Management » Risk Management Stewardship » Risk Communication
» Risk Culture Engagement & Accountability
» Risk Identification » Risk Management Strategy
Development
» Risk information & Decision Making Processes
» Risk Information & Human Capital Processes
» Risk Analysis & Quantification » Risk Management Focus & Strategy
Using this tool to self-assess our existing risk management approach, findings showed that the company is at an Operational Level of Risk Maturity.
There is a clear understanding of the organization’s key risks and also a consistent execution of activities to address these risks. Some functional areas employ more sophisticated techniques whenever necessary. » Predetermined or developing set of
loss and tolerance guidelines
» Explicit consideration of risk and risk management information in key decisions
» Consistent application of analysis with incorporation of both qualitative and quantitative techniques
Aon’s recommendations to further develop risk management capabilities were as follows: » Incorporate risk management
responsibilities into job descriptions and performance evaluations;
» Formalize risk tolerances, including metrics and reporting requirements;
» Identify opportunities for efficiency, consistency and collaboration among risk-based functions and processes;
» Incorporate risk correlation within existing risk quantification approaches;
» Conduct a robust assessment of emerging risks with key stakeholders (internal and external);
» Confirm and enhance risk reporting frameworks at management, executive and Board levels;
» Implement a risk management technology solution;
» Expand understanding of the impact of employee life cycle and employee engagement; and
» Confirm that risk management practices add value and support in identification of opportunities as well as risk avoidance and mitigation.
We strive to achieve full compliance of all pertinent laws and regulations affecting our operations. The identification and our compliance to specific orders and rules, such as those related to labor practices, human rights, and environmental laws, are championed by CHI’s various units and support teams based on their respective functions and areas of expertise.
MECHANISMS FOR ENFORCEMENT AND COMPLIANCE
AREA PRACTICE 2017 PERFORMANCE
Labor practices102-41, 406-1, 408-1, 409-1
HR-Admin Department ensures the full implementation of all policies and procedures related to employee hiring, development, and retention
In lieu of a formal employee union, an HR Committee is organized among employee representatives from all levels. The group acts as an alternative vehicle for employee participation in management
No cases filed against CHI for discrimination and non-observance of labor standards and employment contract clauses
Human rights 412-3, 411-1
HR Officer orients all employees on policies, processes and procedures related to human rights provisions
Compliance is extended to general contractors, suppliers, and service providers
A stringent supplier accreditation process is in place to ensure all investment agreements and contracts do not violate human rights
None to report
Environmental 307-1
Business Development Group coordinates closely with APMC and MDC to ensure compliance to pertinent environmental laws
CHI leverages on the comprehensive monitoring system of both companies to identify and record incidents of violation
Pollution Control Officers submit a quarterly Self-Monitoring Report to the Environmental Management Bureau of the Department of Environment and Natural Resources. Consolidated results are submitted to the management committee at least twice a year
No reported incident of violation
Product responsibility 417-2, 417-3, 418-1, 419-1
Retail Business Group champions customer programs for merchants and shoppers
The Information Systems Department manages our existing customer complaints handling system
APMC directly handles concerns from unit owners and office building occupants
No reported incidents of violation to marketing, information and labeling, and other products and services regulations including customers privacy
Community Engagement 419-1
The Community Relations/Sustainability Department, through the employee volunteer program, executes the company’s community development programs
None to report
FARTHER AND FASTER 115

APPENDICES
CORPORATE GOVERNANCE
MATERIAL ASPECT AND BOUNDARIES
ECONOMIC VALUE GENERATION AND DISTRIBUTION
STAKEHOLDER ENGAGEMENT
WORKFORCE SUPPORTED
EMPLOYEE STATISTICS
ECO-EFFICIENCY DATA
GRI CONTENT INDEX
ASEAN CORPORATE GOVERNANCE INDEX
INDICES
Cebu Holdings, Inc. 2017 Integrated Report116
APPENDIX 1.
DIRECTORS' PROFILE
ANNA MA. MARGARITA B. DY,FILIPINO, 48
DIRECTOR OF CEBU HOLDINGS INC. (CHI) SINCE AUGUST 17, 2016 AND CHAIRMAN OF THE BOARD OF DIRECTORS STARTING LAST
APRIL 24, 2017.
EDUCATIONBS of Arts, Degree in Economics Honors Program, Magna Cum Laude, Ateneo De Manila University, Philippines 1990Master’s Degree in Economics, London School of Economics and Political Science, UK (’91)Masters in Business Administration, Harvard Graduate School of Business Administration in Boston, U.S.A 1996
DIRECTORSHIP IN LISTED COMPANIESCHAIRMAN OF THE BOARD OF DIRECTORSCebu Holdings, Inc.Cebu Property Ventures & Development Corp.
OTHER DIRECTORSHIPS/POSITIONSSENIOR VICE PRESIDENTAyala Land, Inc.
MEMBER, MANAGEMENT COMMITTEE,Ayala Land, Inc.
HEAD, STRATEGIC LANDBANK MANAGEMENT GROUP (SLMG)Ayala Land, Inc.
DIRECTOR & PRESIDENTNuevocentro, Inc. Alviera Country Club, Inc.
DIRECTOR & EXECUTIVE VICE PRESIDENTFort Bonifacio Development Corporation DIRECTOR Aurora Properties, Inc.Vesta Properties Holdings, Inc.Ceci Realty, Inc.AyalaLand Medical Facilities Leasing, Inc. Next Urban Alliance Development Corp.Anvaya Cove Beach and Nature Club
PRESIDENT ALI Eton Property Development Corporation
PAST VICE PRESIDENTBenpres Holdings Corporation
ANICETO V. BISNAR, JR.,FILIPINO, 53
PRESIDENT OF CEBU HOLDINGS INC. (CHI) SINCE JANUARY 1, 2015
EDUCATIONPhilippine Military Academy, Bachelor of Science (PMA BS ’85, top 5% of class), Baguio City, PhilippinesMaster’s in Business Management (MBM ‘89), Asian Institute of Management, Makati City, Philippines Master Planning and Mixed-Use Development Program, Harvard University School of Urban Design
DIRECTORSHIP IN LISTED COMPANIESPresident, Cebu Holdings, Inc.President, Cebu Property Ventures & Development Corporation
OTHER DIRECTORSHIPS/ POSITIONSVice President, Ayala Land, Inc.Chief Operating Officer of the Visayas-Mindanao Group, Ayala Land, Inc.
CHAIRMAN AND PRESIDENT North Point Estate Association, Inc.Cebu Leisure Company, Inc.Asian i-Office Properties, Inc.
CHAIRMANAdauge Commercial CorporationAmaia Southern Properties, Inc.
VICE CHAIRMANSouth Portal Properties, Inc.Central Block Developers, Inc.
PRESIDENTCBP Theatre Management Company, Inc.Lagdigan Land Corporation
VICE PRESIDENTSolinea, Inc.
DIRECTORAccendo Commercial CorporationWestview Commercial Ventures CorporationCagayan de Oro Gateway CorporationBonifacio Estates Services CorporationAurora Properties, Inc.Ceci Realty, Inc.Vesta Property Holdings, Inc.Cebu District Property Enterprise, Inc.AvencoSouth CorporationTaft Punta Engano Property, Inc.
AFFILIATIONSCebu Business Park Association, Inc., Chairman and President (January 1, 2015)Asiatown I.T. Park Association, Inc., Chairman and President (January 1, 2015)Hero Foundation, Inc., Board of Trustee
BERNARD VINCENT O. DY, FILIPINO, 54
DIRECTOR OF CEBU HOLDINGS INC. (CHI) SINCE AUGUST 2014 AND CHAIRMAN OF THE BOARD OF DIRECTORS FROM AUGUST 2014
TO APRIL 2017.
EDUCATIONB.B.A Accountancy (BBAA ‘85), University of Notre DameMaster’s Degree in Business Administration (MBA ’89), University of ChicagoMaster’s Degree in International Relations (MIR ’95), University of Chicago
DIRECTORSHIP IN LISTED COMPANIESDirector, President & Chief Executive Officer, Ayala Land, Inc.Director, Cebu Holdings, Inc.Director, Cebu Property Ventures & Development Corp.Chairman of the Board, Prime Orion Philippines, Inc. and MCT Bhd of Malaysia
OTHER DIRECTORSHIPS/ POSITIONSCHAIRMANAyala Property Management CorporationMakati Development CorporationAmaia Land CorporationAyalaland Commercial Reit, Inc.Bellavita Land CorporationAyagold Retailers, Inc.Station Square East Commercial CorporationAviana Development CorporationCagayan De Oro Gateway Corp.BGSouth Properties, Inc.BGNorth Properties, Inc.BGWest Properties, Inc.Portico Land Corp.Philippine Integrated Energy Solutions, Inc.
VICE CHAIRMANAyalaland Estates, Inc.Ayala Greenfield Development CorporationAlviera Country Club, Inc.Junior Golf Association of the Philippines
DIRECTOR AND PRESIDENTBonifacio Land CorporationEmerging City Holdings, Inc.Columbus Holdings, Inc.Berkshires Holdings, Inc.Fort Bonifacio Development CorporationAurora Properties IncorporatedVesta Property Holdings, Inc.Ceci Realty Inc.Alabang Commercial CorporationAccendo Commercial Corporation
PRESIDENTHero Foundation, Inc.Bonifacio Art Foundation, Inc.
DIRECTORAlveo Land CorporationAmicassa Process Solutions, Inc.Whiteknight Holdings, Inc.Ayalaland Medical Facilities Leasing, Inc.Serendra, Inc.Alveo-Federal Land Communities, Inc.ALI Eton Property Development Corp.Nuevocentro, Inc.
BOARD MEMBERAyala Foundation, Inc.Ayala Group Club, Inc.
PAST MEMBERAdvisory Council of the National Advisory Group for the Police Transformation Development of the Philippine National Police-2015
JOSE EMMANUEL H. JALANDONI,
FILIPINO, 50DIRECTOR OF CEBU HOLDINGS INC. (CHI)
SINCE AUGUST 17, 2016
EDUCATIONB.S. in Legal Management (BSLM ’89), Ateneo de Manila University, PhilippinesMaster’s Degree in Business Administration (MBA ‘92), Asian Institute of Management, Makati City, PhilippinesChartered Financial Analyst
B.2, D.2, E.2, E.4, E.4.5
FARTHER AND FASTER 117
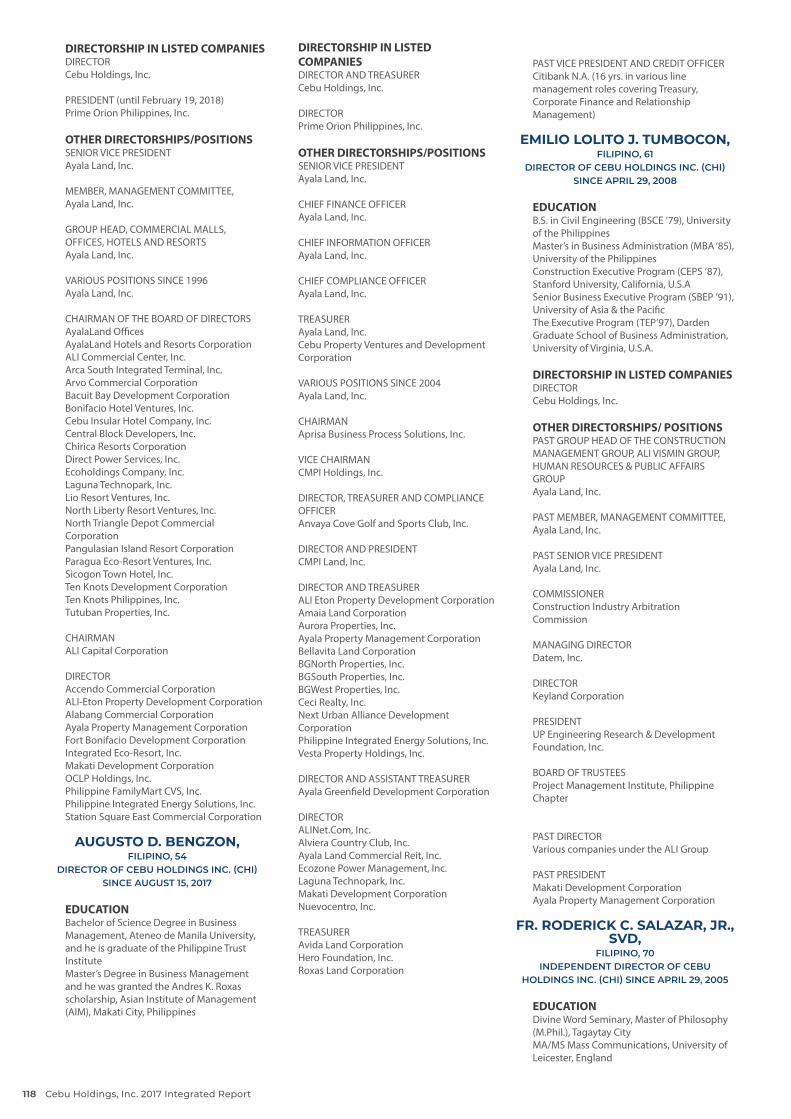
DIRECTORSHIP IN LISTED COMPANIESDIRECTORCebu Holdings, Inc.
PRESIDENT (until February 19, 2018)Prime Orion Philippines, Inc.
OTHER DIRECTORSHIPS/POSITIONSSENIOR VICE PRESIDENTAyala Land, Inc.
MEMBER, MANAGEMENT COMMITTEE,Ayala Land, Inc.
GROUP HEAD, COMMERCIAL MALLS, OFFICES, HOTELS AND RESORTSAyala Land, Inc.
VARIOUS POSITIONS SINCE 1996Ayala Land, Inc.
CHAIRMAN OF THE BOARD OF DIRECTORSAyalaLand OfficesAyalaLand Hotels and Resorts CorporationALI Commercial Center, Inc.Arca South Integrated Terminal, Inc.Arvo Commercial CorporationBacuit Bay Development CorporationBonifacio Hotel Ventures, Inc.Cebu Insular Hotel Company, Inc.Central Block Developers, Inc.Chirica Resorts CorporationDirect Power Services, Inc.Ecoholdings Company, Inc.Laguna Technopark, Inc.Lio Resort Ventures, Inc.North Liberty Resort Ventures, Inc.North Triangle Depot Commercial CorporationPangulasian Island Resort CorporationParagua Eco-Resort Ventures, Inc.Sicogon Town Hotel, Inc.Ten Knots Development CorporationTen Knots Philippines, Inc.Tutuban Properties, Inc.
CHAIRMAN ALI Capital Corporation
DIRECTOR Accendo Commercial CorporationALI-Eton Property Development CorporationAlabang Commercial CorporationAyala Property Management CorporationFort Bonifacio Development CorporationIntegrated Eco-Resort, Inc.Makati Development CorporationOCLP Holdings, Inc.Philippine FamilyMart CVS, Inc.Philippine Integrated Energy Solutions, Inc.Station Square East Commercial Corporation
AUGUSTO D. BENGZON,FILIPINO, 54
DIRECTOR OF CEBU HOLDINGS INC. (CHI) SINCE AUGUST 15, 2017
EDUCATIONBachelor of Science Degree in Business Management, Ateneo de Manila University, and he is graduate of the Philippine Trust InstituteMaster’s Degree in Business Management and he was granted the Andres K. Roxas scholarship, Asian Institute of Management (AIM), Makati City, Philippines
DIRECTORSHIP IN LISTED COMPANIESDIRECTOR AND TREASURERCebu Holdings, Inc.
DIRECTORPrime Orion Philippines, Inc.
OTHER DIRECTORSHIPS/POSITIONSSENIOR VICE PRESIDENTAyala Land, Inc.
CHIEF FINANCE OFFICERAyala Land, Inc.
CHIEF INFORMATION OFFICERAyala Land, Inc.
CHIEF COMPLIANCE OFFICERAyala Land, Inc.
TREASURERAyala Land, Inc.Cebu Property Ventures and Development Corporation
VARIOUS POSITIONS SINCE 2004Ayala Land, Inc.
CHAIRMANAprisa Business Process Solutions, Inc.
VICE CHAIRMANCMPI Holdings, Inc.
DIRECTOR, TREASURER AND COMPLIANCE OFFICERAnvaya Cove Golf and Sports Club, Inc.
DIRECTOR AND PRESIDENTCMPI Land, Inc.
DIRECTOR AND TREASURERALI Eton Property Development CorporationAmaia Land CorporationAurora Properties, Inc.Ayala Property Management CorporationBellavita Land CorporationBGNorth Properties, Inc.BGSouth Properties, Inc.BGWest Properties, Inc.Ceci Realty, Inc.Next Urban Alliance Development CorporationPhilippine Integrated Energy Solutions, Inc.Vesta Property Holdings, Inc.
DIRECTOR AND ASSISTANT TREASURERAyala Greenfield Development Corporation
DIRECTOR ALINet.Com, Inc.Alviera Country Club, Inc.Ayala Land Commercial Reit, Inc.Ecozone Power Management, Inc.Laguna Technopark, Inc.Makati Development CorporationNuevocentro, Inc.
TREASURERAvida Land CorporationHero Foundation, Inc.Roxas Land Corporation
PAST VICE PRESIDENT AND CREDIT OFFICERCitibank N.A. (16 yrs. in various line management roles covering Treasury, Corporate Finance and Relationship Management)
EMILIO LOLITO J. TUMBOCON,FILIPINO, 61
DIRECTOR OF CEBU HOLDINGS INC. (CHI) SINCE APRIL 29, 2008
EDUCATIONB.S. in Civil Engineering (BSCE ’79), University of the PhilippinesMaster’s in Business Administration (MBA ‘85), University of the PhilippinesConstruction Executive Program (CEPS ’87), Stanford University, California, U.S.ASenior Business Executive Program (SBEP ’91), University of Asia & the PacificThe Executive Program (TEP’97), Darden Graduate School of Business Administration, University of Virginia, U.S.A.
DIRECTORSHIP IN LISTED COMPANIESDIRECTORCebu Holdings, Inc.
OTHER DIRECTORSHIPS/ POSITIONSPAST GROUP HEAD OF THE CONSTRUCTION MANAGEMENT GROUP, ALI VISMIN GROUP,HUMAN RESOURCES & PUBLIC AFFAIRS GROUP Ayala Land, Inc.
PAST MEMBER, MANAGEMENT COMMITTEE,Ayala Land, Inc.
PAST SENIOR VICE PRESIDENTAyala Land, Inc.
COMMISSIONERConstruction Industry Arbitration Commission
MANAGING DIRECTORDatem, Inc.
DIRECTORKeyland Corporation
PRESIDENTUP Engineering Research & Development Foundation, Inc.
BOARD OF TRUSTEESProject Management Institute, Philippine Chapter
PAST DIRECTORVarious companies under the ALI Group
PAST PRESIDENTMakati Development CorporationAyala Property Management Corporation
FR. RODERICK C. SALAZAR, JR., SVD,
FILIPINO, 70INDEPENDENT DIRECTOR OF CEBU
HOLDINGS INC. (CHI) SINCE APRIL 29, 2005
EDUCATIONDivine Word Seminary, Master of Philosophy (M.Phil.), Tagaytay CityMA/MS Mass Communications, University of Leicester, England
Cebu Holdings, Inc. 2017 Integrated Report118
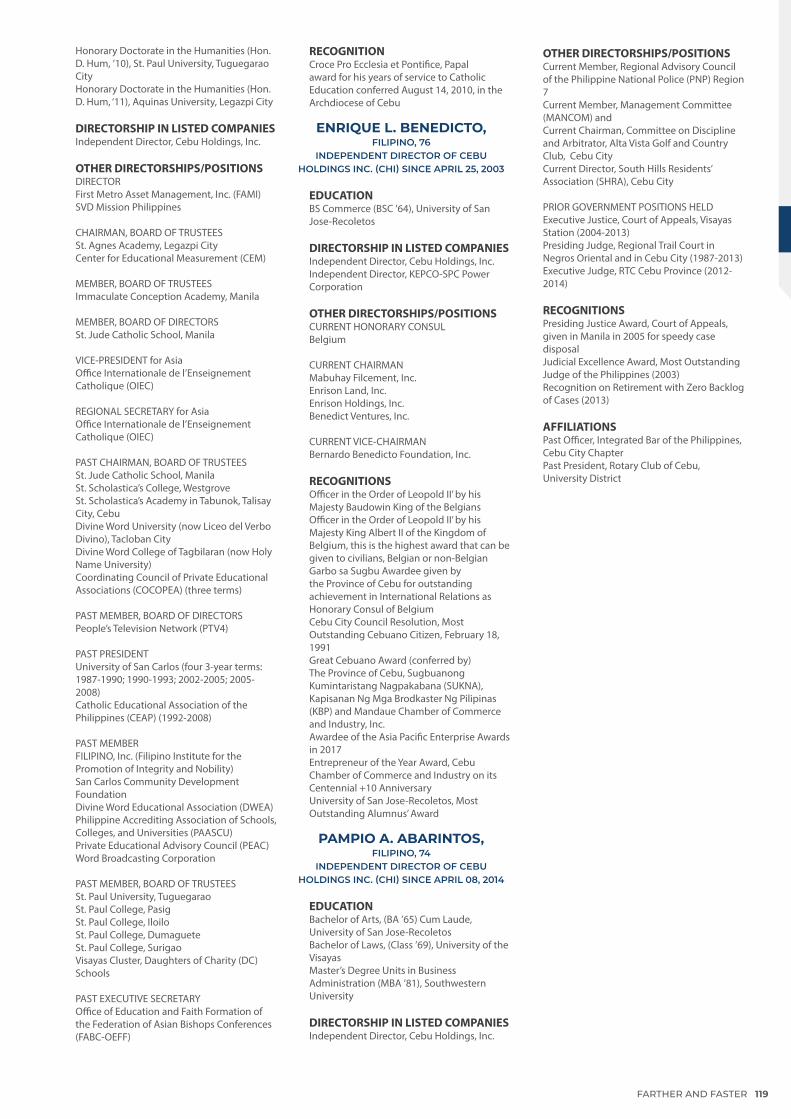
Honorary Doctorate in the Humanities (Hon. D. Hum, ’10), St. Paul University, Tuguegarao CityHonorary Doctorate in the Humanities (Hon. D. Hum, ‘11), Aquinas University, Legazpi City
DIRECTORSHIP IN LISTED COMPANIESIndependent Director, Cebu Holdings, Inc.
OTHER DIRECTORSHIPS/POSITIONS DIRECTORFirst Metro Asset Management, Inc. (FAMI) SVD Mission Philippines
CHAIRMAN, BOARD OF TRUSTEESSt. Agnes Academy, Legazpi CityCenter for Educational Measurement (CEM)
MEMBER, BOARD OF TRUSTEESImmaculate Conception Academy, Manila
MEMBER, BOARD OF DIRECTORSSt. Jude Catholic School, Manila
VICE-PRESIDENT for AsiaOffice Internationale de l’Enseignement Catholique (OIEC)
REGIONAL SECRETARY for AsiaOffice Internationale de l’Enseignement Catholique (OIEC)
PAST CHAIRMAN, BOARD OF TRUSTEESSt. Jude Catholic School, Manila St. Scholastica’s College, WestgroveSt. Scholastica’s Academy in Tabunok, Talisay City, Cebu Divine Word University (now Liceo del Verbo Divino), Tacloban CityDivine Word College of Tagbilaran (now Holy Name University)Coordinating Council of Private Educational Associations (COCOPEA) (three terms)
PAST MEMBER, BOARD OF DIRECTORSPeople’s Television Network (PTV4)
PAST PRESIDENTUniversity of San Carlos (four 3-year terms: 1987-1990; 1990-1993; 2002-2005; 2005-2008)Catholic Educational Association of the Philippines (CEAP) (1992-2008)
PAST MEMBERFILIPINO, Inc. (Filipino Institute for the Promotion of Integrity and Nobility) San Carlos Community Development FoundationDivine Word Educational Association (DWEA)Philippine Accrediting Association of Schools, Colleges, and Universities (PAASCU)Private Educational Advisory Council (PEAC)Word Broadcasting Corporation
PAST MEMBER, BOARD OF TRUSTEESSt. Paul University, TuguegaraoSt. Paul College, PasigSt. Paul College, IloiloSt. Paul College, DumagueteSt. Paul College, SurigaoVisayas Cluster, Daughters of Charity (DC) Schools
PAST EXECUTIVE SECRETARYOffice of Education and Faith Formation of the Federation of Asian Bishops Conferences (FABC-OEFF)
RECOGNITIONCroce Pro Ecclesia et Pontifice, Papal award for his years of service to Catholic Education conferred August 14, 2010, in the Archdiocese of Cebu
ENRIQUE L. BENEDICTO,FILIPINO, 76
INDEPENDENT DIRECTOR OF CEBU HOLDINGS INC. (CHI) SINCE APRIL 25, 2003
EDUCATIONBS Commerce (BSC '64), University of San Jose-Recoletos
DIRECTORSHIP IN LISTED COMPANIESIndependent Director, Cebu Holdings, Inc.Independent Director, KEPCO-SPC Power Corporation
OTHER DIRECTORSHIPS/POSITIONSCURRENT HONORARY CONSULBelgium
CURRENT CHAIRMANMabuhay Filcement, Inc.Enrison Land, Inc.Enrison Holdings, Inc.Benedict Ventures, Inc.
CURRENT VICE-CHAIRMANBernardo Benedicto Foundation, Inc.
RECOGNITIONSOfficer in the Order of Leopold II’ by his Majesty Baudowin King of the BelgiansOfficer in the Order of Leopold II’ by his Majesty King Albert II of the Kingdom of Belgium, this is the highest award that can be given to civilians, Belgian or non-BelgianGarbo sa Sugbu Awardee given by the Province of Cebu for outstanding achievement in International Relations as Honorary Consul of BelgiumCebu City Council Resolution, Most Outstanding Cebuano Citizen, February 18, 1991Great Cebuano Award (conferred by) The Province of Cebu, Sugbuanong Kumintaristang Nagpakabana (SUKNA), Kapisanan Ng Mga Brodkaster Ng Pilipinas (KBP) and Mandaue Chamber of Commerce and Industry, Inc.Awardee of the Asia Pacific Enterprise Awards in 2017Entrepreneur of the Year Award, Cebu Chamber of Commerce and Industry on its Centennial +10 AnniversaryUniversity of San Jose-Recoletos, Most Outstanding Alumnus’ Award
PAMPIO A. ABARINTOS,FILIPINO, 74
INDEPENDENT DIRECTOR OF CEBU HOLDINGS INC. (CHI) SINCE APRIL 08, 2014
EDUCATIONBachelor of Arts, (BA ’65) Cum Laude, University of San Jose-RecoletosBachelor of Laws, (Class ’69), University of the VisayasMaster’s Degree Units in Business Administration (MBA ’81), Southwestern University
DIRECTORSHIP IN LISTED COMPANIESIndependent Director, Cebu Holdings, Inc.
OTHER DIRECTORSHIPS/POSITIONSCurrent Member, Regional Advisory Council of the Philippine National Police (PNP) Region 7Current Member, Management Committee (MANCOM) and Current Chairman, Committee on Discipline and Arbitrator, Alta Vista Golf and Country Club, Cebu CityCurrent Director, South Hills Residents’ Association (SHRA), Cebu City
PRIOR GOVERNMENT POSITIONS HELDExecutive Justice, Court of Appeals, Visayas Station (2004-2013)Presiding Judge, Regional Trail Court in Negros Oriental and in Cebu City (1987-2013)Executive Judge, RTC Cebu Province (2012-2014) RECOGNITIONSPresiding Justice Award, Court of Appeals, given in Manila in 2005 for speedy case disposalJudicial Excellence Award, Most Outstanding Judge of the Philippines (2003)Recognition on Retirement with Zero Backlog of Cases (2013)
AFFILIATIONSPast Officer, Integrated Bar of the Philippines, Cebu City ChapterPast President, Rotary Club of Cebu, University District
FARTHER AND FASTER 119

MA. LUISA D. CHIONGFILIPINO, 45
EDUCATIONBachelor of Science in Commerce Major in Accounting (BSC ’91), De La Salle UniversityCompleted the academic requirements for a Master in Business Administration degree (MBA ’98), De La Salle UniversityCertified Public Accountant (CPA), 5th Place May 1992 CPA Board Examinations
CURRENT POSITIONS HELDChief Finance Officer, Compliance Officer, and Member, Management Committee effective August 15, 2017,Cebu Holdings, Inc.-publicly-listed company Cebu Property Ventures and Development Corporation- publicly-listed company
DIRECTOR AND VICE PRESIDENTIntegrated Eco-resort, Inc.
DIRECTOR AND TREASURERAdauge Commercial CorporationAltaraza Prime Realty CorporationAmorsedia Development CorporationAsian i-Office Properties, Inc.Ayalaland Estates, Inc.Buendia Landholdings, Inc.Crans Montana Property Holdings CorporationCrimsonfield Enterprises, Inc.HLC Development CorporationNext Urban Alliance Development Corp.Red Creek Properties, Incorporated
DIRECTOR AND CHIEF FINANCE OFFICERAlinet.com, Inc.
DIRECTORALI Capital CorporationCebu Leisure Company, Inc.CMPI Holdings, Inc.Directpower Services, Inc.
TREASURER AND CHIEF FINANCE OFFICERTaft Punta Engano Property, Inc.
TREASURERAccendo Commercial CorporationCagayan De Oro Gateway Corporation
CHIEF FINANCE OFFICERLagdigan Land Corporation
COMPTROLLERNuevocentro, Inc.
COMPTROLLER, CHIEF FINANCE OFFICER & COMPLIANCE OFFICERAlviera Country Club, Inc.
CORPORATE FINANCE OFFICERAurora Properties IncorporatedCeci Realty, Inc. Vesta Property Holdings, Inc.
AFFILIATIONSMember of the Philippine Institute of Certified Public Accountants (PICPA)Member of the Lectors and Commentators Guild of Malate Catholic Church
JUNE VEE D. MONTECLARO-NAVARRO,
FILIPINO, 46CORPORATE SECRETARY OF CEBU
HOLDINGS INC. (CHI) SINCE FEBRUARY 27, 2014
EDUCATIONBachelor of Arts with a major in Economics (’93), University of St. La Salle, Bacolod CityBachelor of Commerce with a major in Data Processing (’93), University of St. La Salle, Bacolod CityBachelor of Laws (L.L.B. ’97), University of the Philippines
CURRENT CORPORATE SECRETARYCebu Holdings, Inc. (Publicly-Listed Company)Cebu Property Ventures and Development Corporation (Publicly-Listed Company)Alveo Land Corp.Avida Land Corp.Prime Orion Philippines, Inc. (Publicly-Listed Company)Orion Land, Inc.ALI Eton Property Development Corporation
CURRENT DIRECTOR* AND CORPORATE SECRETARYAG Counselors Corporation*a management position of AG Counselors Corporation
CURRENT ASSISTANT CORPORATE SECRETARY AND GENERAL COUNSELAyala Land, Inc. (Publicly-Listed Company)
CURRENT DIRECTOR AyalaLand Commercial Reit, Inc.
PAST SENIOR ASSOCIATE SyCip Salazar Hernandez & Gatmaitan
NIMFA AMBROSIA L. PEREZ-PARAS,
FILIPINO, 52ASSISTANT CORPORATE SECRETARY OF
CEBU HOLDINGS INC. (CHI) SINCE FEBRUARY 27, 2014
EDUCATIONBachelor of Laws ('90), Manuel L. Quezon School of Law, Philippines
CURRENT ASSISTANT CORPORATE SECRETARYAC Automotive Business Services, Inc.Affinity Express Philippines, Inc.AG Counselors CorporationAlveo Land CorporationAnvaya Cove Golf and Sports Club, Inc.Asiacom (Phils.), IncAvida Land CorporationAutomobile Central Enterprises, Inc.Ayala Aviation CorporationAyala Greenfield Golf & Leisure Club, Inc.Ayala Land, Inc. (Publicly-Listed Company)Ayala Property Management CorporationAYC Finance, Ltd.AYC Holdings, Ltd.Bacuit Bay Development CorporationBGNorth Properties, Inc.BGSouth Properties, Inc.BGWest Properties, Inc.Bonifacio Arts Foundation, Inc.Cebu District Property Enterprise, Inc.Cebu Holdings, Inc. (Publicly-Listed Company)Cebu Property Ventures and Development
Corporation (Publicly-Listed Company)Chirica Resorts CorporationDarong Agricultural Development Corp.DirectPower Services, Inc.Ecoholdings Company, Inc.Fort Bonifacio Development Corp.Honda Cars Cebu, Inc.HRMall, Inc.HCX Technology Partners, Inc.Isuzu Benguet Corporation Lio Resort Ventures, Inc.Makati Development CorporationMichigan Holdings, Inc.MWC Foundation, Inc.Orion Land, Inc.Pameka Holdings, Inc.Pangulasian Island Resort Corp.Paragua Eco-Resort Ventures, Inc.PFIL Ltd.Philippine Integrated Energy Solutions, Inc.PPI Prime Venture, Inc.Prime Orion Philippines, Inc. (Publicly-Listed Company)Regent Horizon Conservation Company, Inc.Technopark Land, Inc.Ten Knots Development CorporationTen Knots Philippines, Inc.
CURRENT CORPORATE SECRETARYAbreeza Central Estate Association, Inc. Accendo Commercial CorporationAdauge Commercial CorporationAlabang Commercial CorporationALI Capital Corp.ALI Commercial Center, Inc.ALI Makati Hotel & Residences, Inc.ALI Makati Hotel Property, Inc.ALI Triangle Hotel Ventures, Inc.ALO Prime Realty CorporationAltaraza Prime Realty CorporationAlveo-Federal Land Communities, Inc.Alviera Country Club, Inc.Amaia Land Corp.Amaia Southern Properties, Inc.Amicassa Process Solutions, Inc.Amorsedia Development Corporation Aprisa Business Process Solutions, Inc.Arca South Integrated Terminal, Inc.Arcasouth Hotel Ventures, Inc.Arvo Commercial CorporationAsian I-Office Properties, Inc.Asterion Technopod IncorporatedAurora Properties, Inc.Avencosouth Corp.Aviana Development CorporationAvida Sales Corp.AyaGold Retailers, Inc. Ayala Hotels, Inc.Ayala Land International Sales, Inc.Ayala Land Sales, Inc.Ayala Theaters Management, Inc.AyalaLand Hotels and Resorts Corp.AyalaLand Malls NorthEast, Inc.AyalaLand Malls Synergies, Inc.AyalaLand Malls VisMin, Inc.AyalaLand Malls, Inc. AyalaLand Medical Facilities Leasing, Inc.AyalaLand Metro North, Inc.AyalaLand Offices, Inc. Bellavita Land Corp. Berkshires Holdings, Inc.Bonifacio Estate Services CorporationBonifacio Global City Estate Association, Inc.Bonifacio Hotel Ventures, Inc.Bonifacio Land CorporationBonifacio Transport CorporationBonifacio Water CorporationBuendia Landholdings, Inc.Buklod Bahayan Realty and Development Corp.Cagayan De Oro Gateway Corp.
APPENDIX 2.
CORPORATE OFFICERS’ PROFILE
Cebu Holdings, Inc. 2017 Integrated Report120
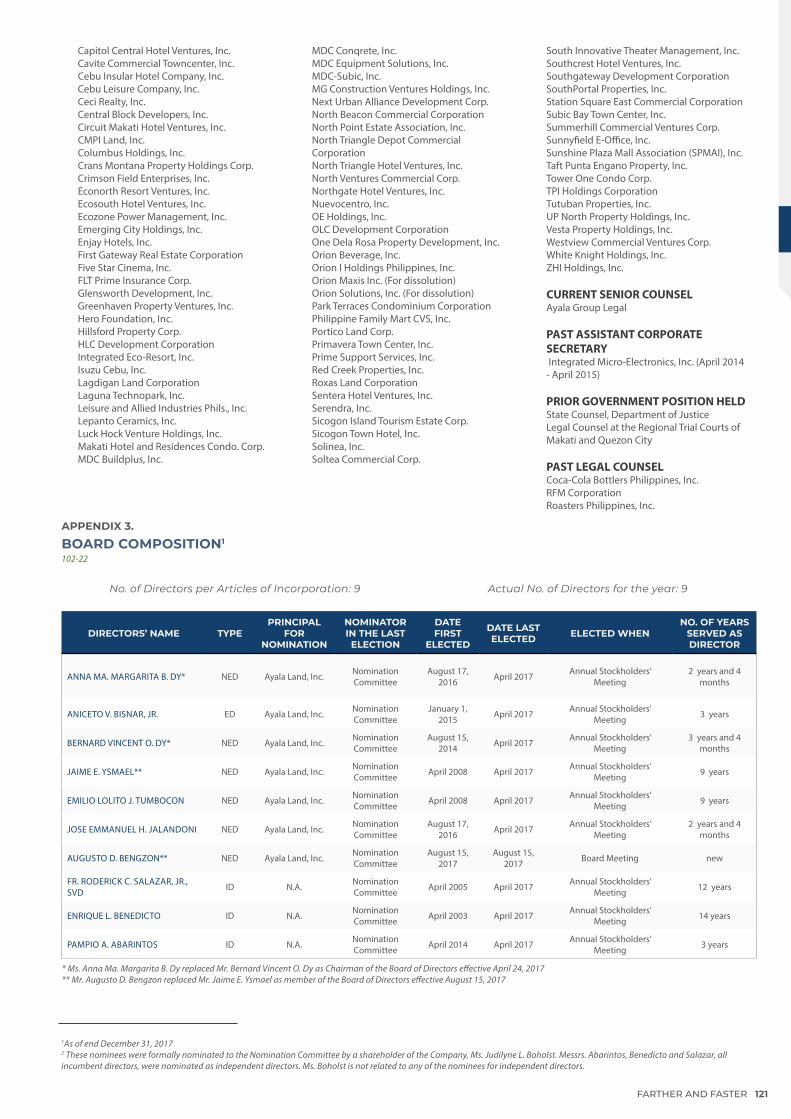
Capitol Central Hotel Ventures, Inc.Cavite Commercial Towncenter, Inc. Cebu Insular Hotel Company, Inc.Cebu Leisure Company, Inc.Ceci Realty, Inc.Central Block Developers, Inc.Circuit Makati Hotel Ventures, Inc.CMPI Land, Inc.Columbus Holdings, Inc.Crans Montana Property Holdings Corp.Crimson Field Enterprises, Inc.Econorth Resort Ventures, Inc.Ecosouth Hotel Ventures, Inc.Ecozone Power Management, Inc.Emerging City Holdings, Inc.Enjay Hotels, Inc.First Gateway Real Estate CorporationFive Star Cinema, Inc.FLT Prime Insurance Corp.Glensworth Development, Inc.Greenhaven Property Ventures, Inc.Hero Foundation, Inc.Hillsford Property Corp. HLC Development CorporationIntegrated Eco-Resort, Inc.Isuzu Cebu, Inc.Lagdigan Land CorporationLaguna Technopark, Inc.Leisure and Allied Industries Phils., Inc.Lepanto Ceramics, Inc.Luck Hock Venture Holdings, Inc.Makati Hotel and Residences Condo. Corp.MDC Buildplus, Inc.
MDC Conqrete, Inc.MDC Equipment Solutions, Inc.MDC-Subic, Inc.MG Construction Ventures Holdings, Inc.Next Urban Alliance Development Corp.North Beacon Commercial CorporationNorth Point Estate Association, Inc.North Triangle Depot Commercial CorporationNorth Triangle Hotel Ventures, Inc.North Ventures Commercial Corp.Northgate Hotel Ventures, Inc.Nuevocentro, Inc.OE Holdings, Inc.OLC Development CorporationOne Dela Rosa Property Development, Inc.Orion Beverage, Inc.Orion I Holdings Philippines, Inc.Orion Maxis Inc. (For dissolution)Orion Solutions, Inc. (For dissolution)Park Terraces Condominium CorporationPhilippine Family Mart CVS, Inc.Portico Land Corp.Primavera Town Center, Inc.Prime Support Services, Inc.Red Creek Properties, Inc.Roxas Land CorporationSentera Hotel Ventures, Inc.Serendra, Inc.Sicogon Island Tourism Estate Corp.Sicogon Town Hotel, Inc.Solinea, Inc.Soltea Commercial Corp.
APPENDIX 3.
BOARD COMPOSITION1
102-22
No. of Directors per Articles of Incorporation: 9 Actual No. of Directors for the year: 9
DIRECTORS’ NAME TYPEPRINCIPAL
FOR NOMINATION
NOMINATOR IN THE LAST
ELECTION
DATE FIRST
ELECTED
DATE LAST ELECTED ELECTED WHEN
NO. OF YEARS SERVED AS DIRECTOR
ANNA MA. MARGARITA B. DY* NED Ayala Land, Inc. Nomination Committee
August 17, 2016 April 2017 Annual Stockholders’
Meeting2 years and 4
months
ANICETO V. BISNAR, JR. ED Ayala Land, Inc. Nomination Committee
January 1, 2015 April 2017 Annual Stockholders’
Meeting 3 years
BERNARD VINCENT O. DY* NED Ayala Land, Inc. Nomination Committee
August 15, 2014 April 2017 Annual Stockholders’
Meeting3 years and 4
months
JAIME E. YSMAEL** NED Ayala Land, Inc. Nomination Committee April 2008 April 2017 Annual Stockholders’
Meeting 9 years
EMILIO LOLITO J. TUMBOCON NED Ayala Land, Inc. Nomination Committee April 2008 April 2017 Annual Stockholders’
Meeting 9 years
JOSE EMMANUEL H. JALANDONI NED Ayala Land, Inc. Nomination Committee
August 17, 2016 April 2017 Annual Stockholders’
Meeting2 years and 4
months
AUGUSTO D. BENGZON** NED Ayala Land, Inc. Nomination Committee
August 15, 2017
August 15, 2017 Board Meeting new
FR. RODERICK C. SALAZAR, JR., SVD ID N.A. Nomination
Committee April 2005 April 2017 Annual Stockholders’ Meeting 12 years
ENRIQUE L. BENEDICTO ID N.A. Nomination Committee April 2003 April 2017 Annual Stockholders’
Meeting 14 years
PAMPIO A. ABARINTOS ID N.A. Nomination Committee April 2014 April 2017 Annual Stockholders’
Meeting 3 years
* Ms. Anna Ma. Margarita B. Dy replaced Mr. Bernard Vincent O. Dy as Chairman of the Board of Directors effective April 24, 2017** Mr. Augusto D. Bengzon replaced Mr. Jaime E. Ysmael as member of the Board of Directors effective August 15, 2017
1As of end December 31, 20172 These nominees were formally nominated to the Nomination Committee by a shareholder of the Company, Ms. Judilyne L. Boholst. Messrs. Abarintos, Benedicto and Salazar, all incumbent directors, were nominated as independent directors. Ms. Boholst is not related to any of the nominees for independent directors.
South Innovative Theater Management, Inc.Southcrest Hotel Ventures, Inc.Southgateway Development CorporationSouthPortal Properties, Inc.Station Square East Commercial CorporationSubic Bay Town Center, Inc.Summerhill Commercial Ventures Corp.Sunnyfield E-Office, Inc.Sunshine Plaza Mall Association (SPMAI), Inc.Taft Punta Engano Property, Inc.Tower One Condo Corp.TPI Holdings CorporationTutuban Properties, Inc.UP North Property Holdings, Inc.Vesta Property Holdings, Inc.Westview Commercial Ventures Corp.White Knight Holdings, Inc.ZHI Holdings, Inc. CURRENT SENIOR COUNSELAyala Group Legal
PAST ASSISTANT CORPORATE SECRETARY Integrated Micro-Electronics, Inc. (April 2014 - April 2015)
PRIOR GOVERNMENT POSITION HELDState Counsel, Department of JusticeLegal Counsel at the Regional Trial Courts of Makati and Quezon City
PAST LEGAL COUNSELCoca-Cola Bottlers Philippines, Inc.RFM CorporationRoasters Philippines, Inc.
FARTHER AND FASTER 121
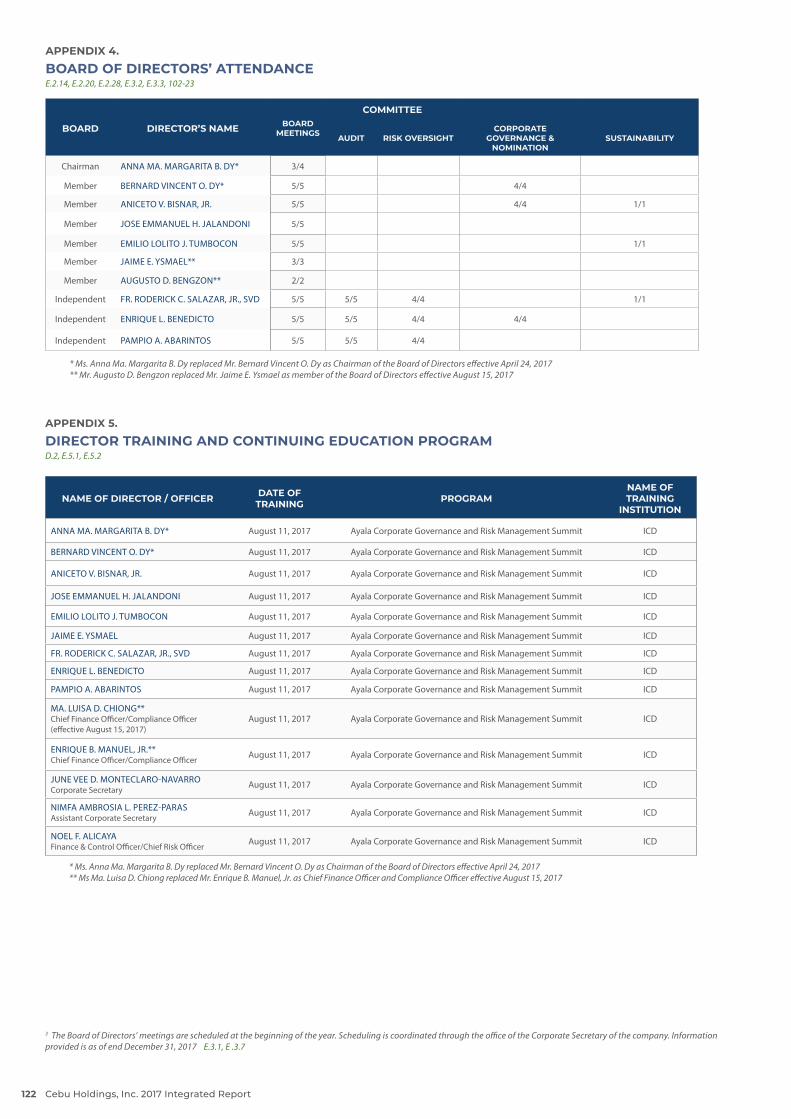
APPENDIX 4.
BOARD OF DIRECTORS’ ATTENDANCE E.2.14, E.2.20, E.2.28, E.3.2, E.3.3, 102-23
BOARD DIRECTOR’S NAME BOARD MEETINGS
COMMITTEE
AUDIT RISK OVERSIGHTCORPORATE
GOVERNANCE & NOMINATION
SUSTAINABILITY
Chairman ANNA MA. MARGARITA B. DY* 3/4
Member BERNARD VINCENT O. DY* 5/5 4/4
Member ANICETO V. BISNAR, JR. 5/5 4/4 1/1
Member JOSE EMMANUEL H. JALANDONI 5/5
Member EMILIO LOLITO J. TUMBOCON 5/5 1/1
Member JAIME E. YSMAEL** 3/3
Member AUGUSTO D. BENGZON** 2/2
Independent FR. RODERICK C. SALAZAR, JR., SVD 5/5 5/5 4/4 1/1
Independent ENRIQUE L. BENEDICTO 5/5 5/5 4/4 4/4
Independent PAMPIO A. ABARINTOS 5/5 5/5 4/4
APPENDIX 5.
DIRECTOR TRAINING AND CONTINUING EDUCATION PROGRAM D.2, E.5.1, E.5.2
NAME OF DIRECTOR / OFFICER DATE OF TRAINING PROGRAM
NAME OF TRAINING
INSTITUTION
ANNA MA. MARGARITA B. DY* August 11, 2017 Ayala Corporate Governance and Risk Management Summit ICD
BERNARD VINCENT O. DY* August 11, 2017 Ayala Corporate Governance and Risk Management Summit ICD
ANICETO V. BISNAR, JR. August 11, 2017 Ayala Corporate Governance and Risk Management Summit ICD
JOSE EMMANUEL H. JALANDONI August 11, 2017 Ayala Corporate Governance and Risk Management Summit ICD
EMILIO LOLITO J. TUMBOCON August 11, 2017 Ayala Corporate Governance and Risk Management Summit ICD
JAIME E. YSMAEL August 11, 2017 Ayala Corporate Governance and Risk Management Summit ICD
FR. RODERICK C. SALAZAR, JR., SVD August 11, 2017 Ayala Corporate Governance and Risk Management Summit ICD
ENRIQUE L. BENEDICTO August 11, 2017 Ayala Corporate Governance and Risk Management Summit ICD
PAMPIO A. ABARINTOS August 11, 2017 Ayala Corporate Governance and Risk Management Summit ICD
MA. LUISA D. CHIONG**Chief Finance Officer/Compliance Officer (effective August 15, 2017)
August 11, 2017 Ayala Corporate Governance and Risk Management Summit ICD
ENRIQUE B. MANUEL, JR.**Chief Finance Officer/Compliance Officer August 11, 2017 Ayala Corporate Governance and Risk Management Summit ICD
JUNE VEE D. MONTECLARO-NAVARROCorporate Secretary August 11, 2017 Ayala Corporate Governance and Risk Management Summit ICD
NIMFA AMBROSIA L. PEREZ-PARASAssistant Corporate Secretary August 11, 2017 Ayala Corporate Governance and Risk Management Summit ICD
NOEL F. ALICAYA Finance & Control Officer/Chief Risk Officer August 11, 2017 Ayala Corporate Governance and Risk Management Summit ICD
* Ms. Anna Ma. Margarita B. Dy replaced Mr. Bernard Vincent O. Dy as Chairman of the Board of Directors effective April 24, 2017** Ms Ma. Luisa D. Chiong replaced Mr. Enrique B. Manuel, Jr. as Chief Finance Officer and Compliance Officer effective August 15, 2017
3 The Board of Directors’ meetings are scheduled at the beginning of the year. Scheduling is coordinated through the office of the Corporate Secretary of the company. Information provided is as of end December 31, 2017
* Ms. Anna Ma. Margarita B. Dy replaced Mr. Bernard Vincent O. Dy as Chairman of the Board of Directors effective April 24, 2017** Mr. Augusto D. Bengzon replaced Mr. Jaime E. Ysmael as member of the Board of Directors effective August 15, 2017
E.3.1, E .3.7
Cebu Holdings, Inc. 2017 Integrated Report122
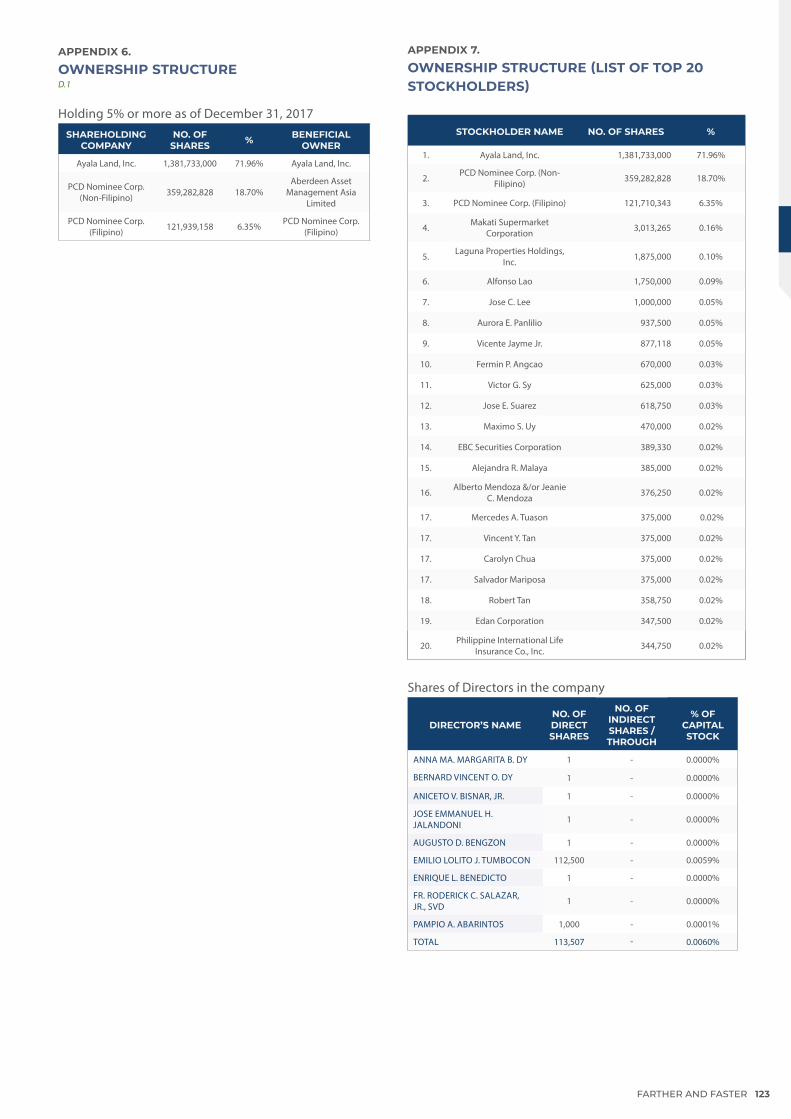
APPENDIX 7.
OWNERSHIP STRUCTURE (LIST OF TOP 20 STOCKHOLDERS)
STOCKHOLDER NAME NO. OF SHARES %
1. Ayala Land, Inc. 1,381,733,000 71.96%
2. PCD Nominee Corp. (Non-Filipino) 359,282,828 18.70%
3. PCD Nominee Corp. (Filipino) 121,710,343 6.35%
4. Makati Supermarket Corporation 3,013,265 0.16%
5. Laguna Properties Holdings, Inc. 1,875,000 0.10%
6. Alfonso Lao 1,750,000 0.09%
7. Jose C. Lee 1,000,000 0.05%
8. Aurora E. Panlilio 937,500 0.05%
9. Vicente Jayme Jr. 877,118 0.05%
10. Fermin P. Angcao 670,000 0.03%
11. Victor G. Sy 625,000 0.03%
12. Jose E. Suarez 618,750 0.03%
13. Maximo S. Uy 470,000 0.02%
14. EBC Securities Corporation 389,330 0.02%
15. Alejandra R. Malaya 385,000 0.02%
16. Alberto Mendoza &/or Jeanie C. Mendoza 376,250 0.02%
17. Mercedes A. Tuason 375,000 0.02%
17. Vincent Y. Tan 375,000 0.02%
17. Carolyn Chua 375,000 0.02%
17. Salvador Mariposa 375,000 0.02%
18. Robert Tan 358,750 0.02%
19. Edan Corporation 347,500 0.02%
20. Philippine International Life Insurance Co., Inc. 344,750 0.02%
Shares of Directors in the company
DIRECTOR’S NAMENO. OF DIRECT SHARES
NO. OF INDIRECT SHARES / THROUGH
% OF CAPITAL STOCK
ANNA MA. MARGARITA B. DY 1 - 0.0000%
BERNARD VINCENT O. DY 1 - 0.0000%
ANICETO V. BISNAR, JR. 1 - 0.0000%
JOSE EMMANUEL H. JALANDONI 1 - 0.0000%
AUGUSTO D. BENGZON 1 - 0.0000%
EMILIO LOLITO J. TUMBOCON 112,500 - 0.0059%
ENRIQUE L. BENEDICTO 1 - 0.0000%
FR. RODERICK C. SALAZAR, JR., SVD 1 - 0.0000%
PAMPIO A. ABARINTOS 1,000 - 0.0001%
TOTAL 113,507 - 0.0060%
APPENDIX 6.
OWNERSHIP STRUCTURE D.1
Holding 5% or more as of December 31, 2017SHAREHOLDING
COMPANYNO. OF
SHARES % BENEFICIAL OWNER
Ayala Land, Inc. 1,381,733,000 71.96% Ayala Land, Inc.
PCD Nominee Corp. (Non-Filipino) 359,282,828 18.70%
Aberdeen Asset Management Asia
Limited
PCD Nominee Corp. (Filipino) 121,939,158 6.35% PCD Nominee Corp.
(Filipino)
FARTHER AND FASTER 123
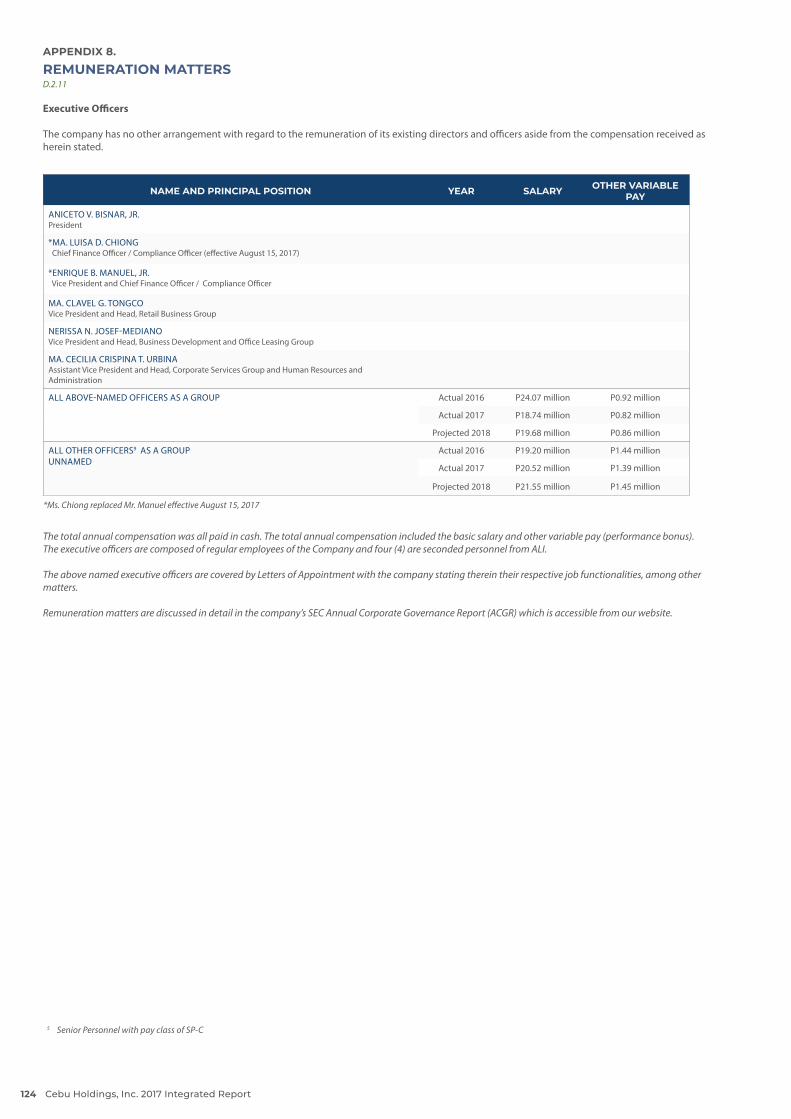
APPENDIX 8.
REMUNERATION MATTERS D.2.11
Executive Officers
The company has no other arrangement with regard to the remuneration of its existing directors and officers aside from the compensation received as herein stated.
NAME AND PRINCIPAL POSITION YEAR SALARY OTHER VARIABLE PAY
ANICETO V. BISNAR, JR.President
*MA. LUISA D. CHIONG Chief Finance Officer / Compliance Officer (effective August 15, 2017)
*ENRIQUE B. MANUEL, JR. Vice President and Chief Finance Officer / Compliance Officer
MA. CLAVEL G. TONGCOVice President and Head, Retail Business Group
NERISSA N. JOSEF-MEDIANOVice President and Head, Business Development and Office Leasing Group
MA. CECILIA CRISPINA T. URBINAAssistant Vice President and Head, Corporate Services Group and Human Resources and Administration
ALL ABOVE-NAMED OFFICERS AS A GROUP Actual 2016 P24.07 million P0.92 million
Actual 2017 P18.74 million P0.82 million
Projected 2018 P19.68 million P0.86 million
ALL OTHER OFFICERS9 AS A GROUP UNNAMED
Actual 2016 P19.20 million P1.44 million
Actual 2017 P20.52 million P1.39 million
Projected 2018 P21.55 million P1.45 million
The total annual compensation was all paid in cash. The total annual compensation included the basic salary and other variable pay (performance bonus).The executive officers are composed of regular employees of the Company and four (4) are seconded personnel from ALI.
The above named executive officers are covered by Letters of Appointment with the company stating therein their respective job functionalities, among other matters.
Remuneration matters are discussed in detail in the company’s SEC Annual Corporate Governance Report (ACGR) which is accessible from our website.
5 Senior Personnel with pay class of SP-C
*Ms. Chiong replaced Mr. Manuel effective August 15, 2017
Cebu Holdings, Inc. 2017 Integrated Report124

APPENDIX 9.
TABLE OF MATERIAL ASPECTS AND THEIR BOUNDARIES 102-46, 102-47, 102-49
MATERIAL TOPICS RELEVANCE AFFECTED ENTITIES
Economic
Capital Investment Delivering returns for our shareholders and remunerating our other key stakeholders is our top responsibility.
Business operations
StockholdersEconomic Value Generated
Economic Value Distributed
Economic Value Retained
Significant Indirect Economic Impacts We rely on two keys to a thriving business: creating shared value and the practice of inclusive growth by helping enable local economic development.
Suppliers
Local communities
Customers
Impacts of use of products or services
Impact on poverty and/or vulnerable group
Products for BOP/low income segment
Impact in supply chain
Jobs supported in supply chain
Shift to local sourcing
Stimulating Foreign Direct Investment
Total Foreign direct investments enabled
Financial Impact to Climate Change We practice due diligence in making sure that our sites are resilient against climate change impacts and other hazards.
Business operations
CustomersDemand of products and services
Social
Employee Management We invest in our people and create a healthy and safe working environment for them. We believe that high per-forming employees bring success to the business.
Business operations
EmployeesAttrition rate (new hires vs. turn-over)
Training & Development
Diversity, Equal Opportunity & Anti-Discrimination
Labor Management Relations
Workplace Conditions & Compliance to Labor Standards, including suppliers
We adhere to labor laws and hold the health and safety of our workers as paramount. We do not tolerate child and forced labor in our operations and suppliers.
Business operations
Employees
Suppliers
Organizational Health and Safety
Child/Forced Labor
Relationship with Community We uphold a healthy relationship with our communities and promote local economic development with them in mind.
Business operations
CommunitiesPolicy on Indigenous Peoples
Human Rights Assessment
Security Practices
Customer Management Our customers are very important to us and their welfare is a priority.
Business operations Customers
Health and Safety
Marketing and Labeling
Privacy
Environmental
Resource Management Resources, such as energy (fuel and electricity), water, and materials are natural capital that we need to construct and run our products.
Business operations
EnvironmentEnergy
Water
Materials
Ecosystems & Biodiversity As a real estate company, especially with some products hinged on tourism, we are dependent on ecosystem services that provide natural capital and aesthetic value to our developments.
Business operations
EnvironmentWatersheds
Marine ecosystems
IUCN/KBA
Environmental Impact We recognize that we have impacts to the environment in every stage of our value chain – from construction all the way to the operations of our estates, buildings, malls and residential projects.
Business operations
EnvironmentGHG Emissions
NOx, SOx, Particulate Matter
Effluents
Solid Wastes
Hazardous Wastes
FARTHER AND FASTER 125
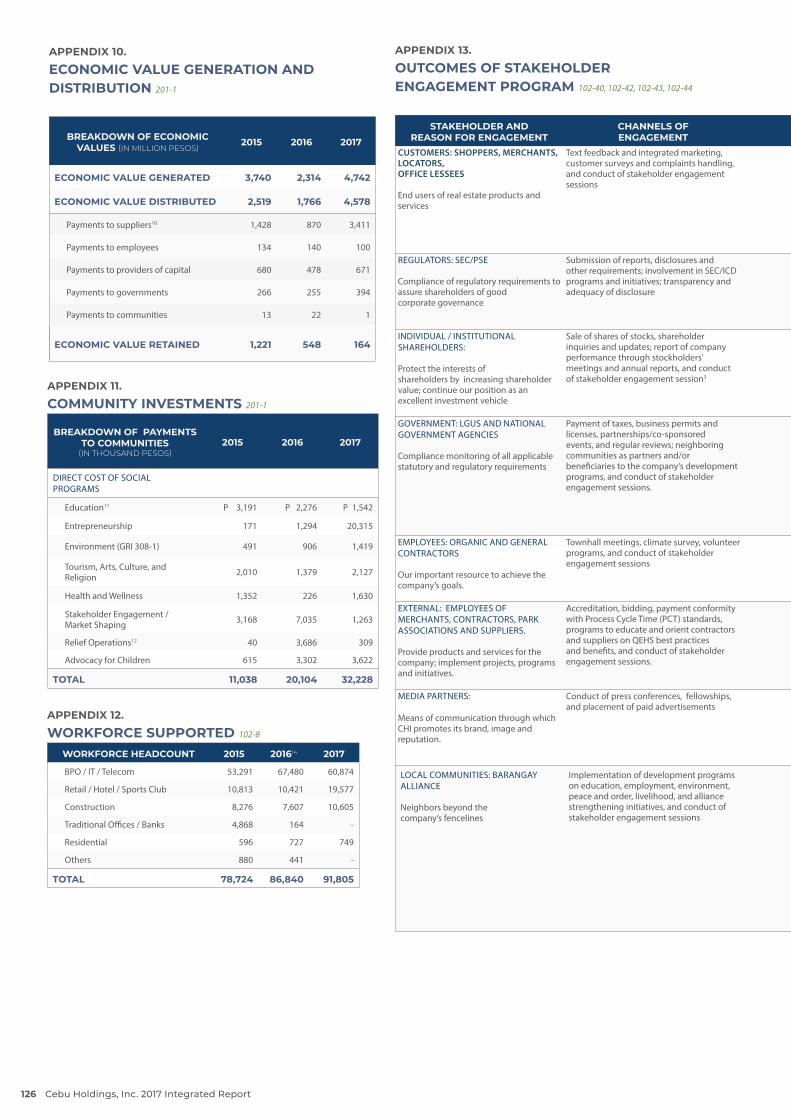
APPENDIX 10.
ECONOMIC VALUE GENERATION AND DISTRIBUTION 201-1
BREAKDOWN OF ECONOMIC VALUES (IN MILLION PESOS)
2015 2016 2017
ECONOMIC VALUE GENERATED 3,740 2,314 4,742
ECONOMIC VALUE DISTRIBUTED 2,519 1,766 4,578
Payments to suppliers10 1,428 870 3,411
Payments to employees 134 140 100
Payments to providers of capital 680 478 671
Payments to governments 266 255 394
Payments to communities 13 22 1
ECONOMIC VALUE RETAINED 1,221 548 164
APPENDIX 11.
COMMUNITY INVESTMENTS 201-1
BREAKDOWN OF PAYMENTS TO COMMUNITIES
(IN THOUSAND PESOS)2015 2016 2017
DIRECT COST OF SOCIAL PROGRAMS
Education11 P 3,191 P 2,276 P 1,542
Entrepreneurship 171 1,294 20,315
Environment (GRI 308-1) 491 906 1,419
Tourism, Arts, Culture, and Religion 2,010 1,379 2,127
Health and Wellness 1,352 226 1,630
Stakeholder Engagement / Market Shaping 3,168 7,035 1,263
Relief Operations12 40 3,686 309
Advocacy for Children 615 3,302 3,622
TOTAL 11,038 20,104 32,228
APPENDIX 12.
WORKFORCE SUPPORTED 102-8
WORKFORCE HEADCOUNT 2015 201614 2017
BPO / IT / Telecom 53,291 67,480 60,874
Retail / Hotel / Sports Club 10,813 10,421 19,577
Construction 8,276 7,607 10,605
Traditional Offices / Banks 4,868 164 -
Residential 596 727 749
Others 880 441 -
TOTAL 78,724 86,840 91,805
APPENDIX 13.
OUTCOMES OF STAKEHOLDER ENGAGEMENT PROGRAM 102-40, 102-42, 102-43, 102-44
STAKEHOLDER AND REASON FOR ENGAGEMENT
CHANNELS OF ENGAGEMENT EXPRESSED NEEDS INTEREST AREAS HOW WE RESPOND
CUSTOMERS: SHOPPERS, MERCHANTS, LOCATORS, OFFICE LESSEES
End users of real estate products and services
Text feedback and integrated marketing, customer surveys and complaints handling, and conduct of stakeholder engagement sessions
• On-time completion of building construction • One-day resolution of complaints• Immediate or time- bound help response• Safety in all areas• Building and site resilience• On-time turnover of residential units• Reliable maintenance of utilities (i.e. water and
electricity)
• Minimizing heavy traffic• Extended market services for C, D, and
E sectors• Venue for family activities• Customer involvement in waste and recycling
efforts• Emergency preparedness• Partnerships and collaboration for
sustainability
• Discounts, promotional offers, and various payment terms• Customer satisfaction surveys, complaints handling process• Farmers’ Market• External customer feedback system• Training for emergency response personnel• Conduct of emergency drills in all our developments and
construction sites• Regular coordination and continuing engagement• Conduct of sustainability learning sessions
REGULATORS: SEC/PSE
Compliance of regulatory requirements to assure shareholders of good corporate governance
Submission of reports, disclosures and other requirements; involvement in SEC/ICD programs and initiatives; transparency and adequacy of disclosure
• Compliance to existing rules, regulations, and environmental laws.
• Beyond compliance on economic, social, and environmental regulations.
• Transparency and full disclosure including the provision of this report
• Prompt submission of requirements• Review of reports prior to submission
INDIVIDUAL / INSTITUTIONAL SHAREHOLDERS:
Protect the interests ofshareholders by increasing shareholder value; continue our position as an excellent investment vehicle
Sale of shares of stocks, shareholder inquiries and updates; report of company performance through stockholders’ meetings and annual reports, and conduct of stakeholder engagement session3
• Improving shareholder value• Increased investment opportunities
• Dividends• Monetizing sustainability (quantifying it as an
indicator of shareholder and company value)• CHI as a green investment• Environmental sustainability
• Analysts and investor briefings; declaration of dividends• Communication of sustainability performance and initiatives
through this report and through stakeholder engagement sessions
GOVERNMENT: LGUS AND NATIONAL GOVERNMENT AGENCIES
Compliance monitoring of all applicable statutory and regulatory requirements
Payment of taxes, business permits and licenses, partnerships/co-sponsored events, and regular reviews; neighboring communities as partners and/or beneficiaries to the company’s development programs, and conduct of stakeholder engagement sessions.
• Communication of sustainability performance through this report and through stakeholder engagement sessions
• Health, safety, employment, environment, and local traffic conditions
• Venue for civic interaction• Availability of new and efficient technology
that minimizes environmental impacts• Job and partnership opportunities for local
farmers, businessmen, and employees• Partnerships and collaboration for
sustainability (urbanizing and greening the city)
• Prompt payment of taxes and submission of reports• Regular reviews of compliance with regulatory requirements• Provision and maintenance of good road networks• Practice transparency and full disclosure including the
provision of this report• Sharing of best sustainability practices• Attendance to seminars, conferences, and meetings• Regular coordination and continuing engagement• Conduct of sustainability learning sessions
EMPLOYEES: ORGANIC AND GENERAL CONTRACTORS
Our important resource to achieve the company’s goals.
Townhall meetings, climate survey, volunteer programs, and conduct of stakeholder engagement sessions
• Proper training, adequate compensation and benefits, health and safety, and employee development
• Wellness and work-life balance• General contractor: Data Management System• Property Management: Uniformity in data
gathering, monitoring, reporting, and presentation
• Benefits upgrade; merit increases• Wellness program (CHI P.L.U.S.)• Competency development programs• Health and safety programs• Conduct of sustainability learning sessions
EXTERNAL: EMPLOYEES OF MERCHANTS, CONTRACTORS, PARK ASSOCIATIONS AND SUPPLIERS.
Provide products and services for the company; implement projects, programs and initiatives.
Accreditation, bidding, payment conformity with Process Cycle Time (PCT) standards, programs to educate and orient contractors and suppliers on QEHS best practices and benefits, and conduct of stakeholder engagement sessions.
• Continuing employment• Training and development• Work tools to enable effective work• Health and safety
• Equal opportunities for local contractors• Identify and develop sustainable water
sources (finite ground water resource)• Solid Waste Management Program• Traffic improvement
• Establishment of and compliance to PCT standards• Implement programs to educate and orient contractors and
suppliers on QEHS best practices and benefits• Conduct of sustainability learning and work sessions
MEDIA PARTNERS:
Means of communication through which CHI promotes its brand, image and reputation.
Conduct of press conferences, fellowships, and placement of paid advertisements
• Truthfulness and usefulness of information shared• High courtesy/reliability rating of media relations• personnel or any company representative• Provide sufficient information about the company’s
projects and understanding of its brands• Open communication lines
• Publicity• Issues-handling• Media relations
• Media briefings• Regular fellowships• Regular updates on new developments
LOCAL COMMUNITIES: BARANGAY ALLIANCE
Neighbors beyond the company’s fencelines
Implementation of development programs on education, employment, environment, peace and order, livelihood, and alliance strengthening initiatives, and conduct of stakeholder engagement sessions
• Local employment• Livelihood assistance• Environmental program• Scholarship program• Encouraging small entrepreneurs by supporting their
products• Increase in barangay income through barangay
permits from mall merchants and locators• Inclusive growth• Child-friendly Cebu
• Stringent selection process/implementation of policy for subcontractors
• Traffic congestion• Sidewalk vendors and fragmented access
roads• Suspected illegal drug use by BPO
employees• High fuel consumption used in waste
collection• Reporting of the number of employees per
barangay• Drainage systems repairs• Solid waste management
• Partnerships with LGU or the local communities for Solid Waste Management (SWM) programs
• Strengthening of the alliance• Implementation of programs aligned to the needs of the
community• Local employment prioritization• Conduct of sustainability learning sessions
Cebu Holdings, Inc. 2017 Integrated Report126
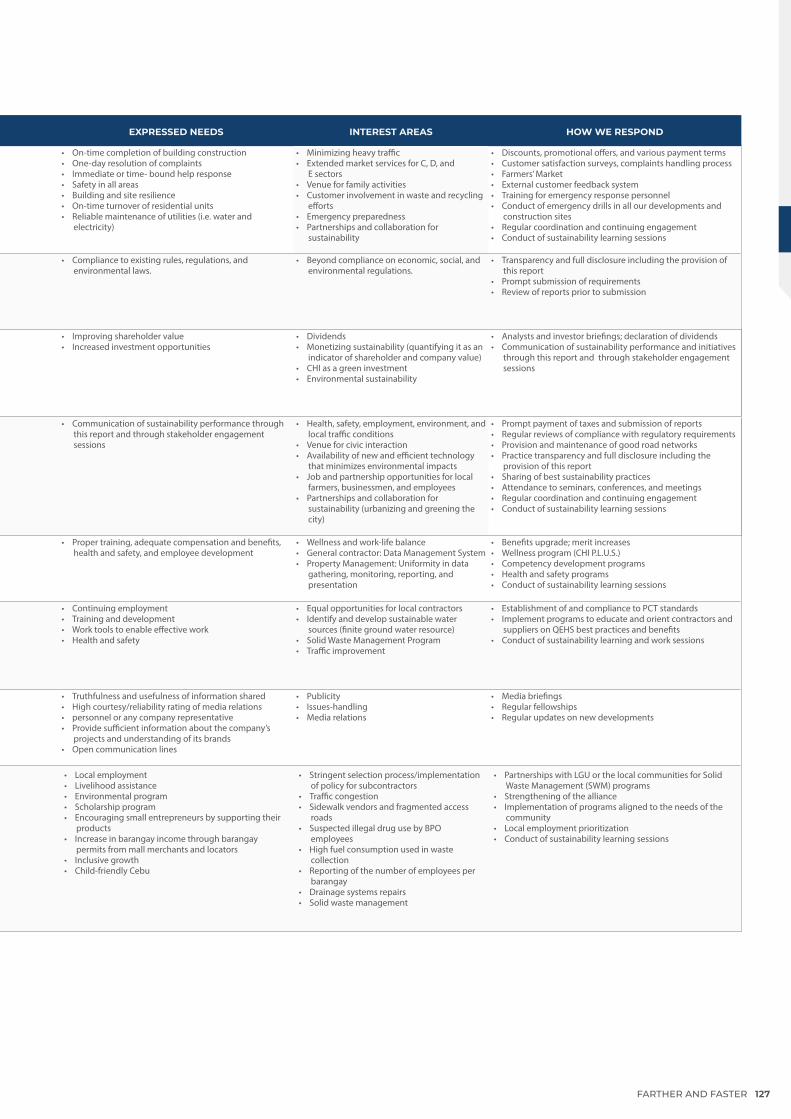
APPENDIX 13.
OUTCOMES OF STAKEHOLDER ENGAGEMENT PROGRAM 102-40, 102-42, 102-43, 102-44
STAKEHOLDER AND REASON FOR ENGAGEMENT
CHANNELS OF ENGAGEMENT EXPRESSED NEEDS INTEREST AREAS HOW WE RESPOND
CUSTOMERS: SHOPPERS, MERCHANTS, LOCATORS, OFFICE LESSEES
End users of real estate products and services
Text feedback and integrated marketing, customer surveys and complaints handling, and conduct of stakeholder engagement sessions
• On-time completion of building construction • One-day resolution of complaints• Immediate or time- bound help response• Safety in all areas• Building and site resilience• On-time turnover of residential units• Reliable maintenance of utilities (i.e. water and
electricity)
• Minimizing heavy traffic• Extended market services for C, D, and
E sectors• Venue for family activities• Customer involvement in waste and recycling
efforts• Emergency preparedness• Partnerships and collaboration for
sustainability
• Discounts, promotional offers, and various payment terms• Customer satisfaction surveys, complaints handling process• Farmers’ Market• External customer feedback system• Training for emergency response personnel• Conduct of emergency drills in all our developments and
construction sites• Regular coordination and continuing engagement• Conduct of sustainability learning sessions
REGULATORS: SEC/PSE
Compliance of regulatory requirements to assure shareholders of good corporate governance
Submission of reports, disclosures and other requirements; involvement in SEC/ICD programs and initiatives; transparency and adequacy of disclosure
• Compliance to existing rules, regulations, and environmental laws.
• Beyond compliance on economic, social, and environmental regulations.
• Transparency and full disclosure including the provision of this report
• Prompt submission of requirements• Review of reports prior to submission
INDIVIDUAL / INSTITUTIONAL SHAREHOLDERS:
Protect the interests ofshareholders by increasing shareholder value; continue our position as an excellent investment vehicle
Sale of shares of stocks, shareholder inquiries and updates; report of company performance through stockholders’ meetings and annual reports, and conduct of stakeholder engagement session3
• Improving shareholder value• Increased investment opportunities
• Dividends• Monetizing sustainability (quantifying it as an
indicator of shareholder and company value)• CHI as a green investment• Environmental sustainability
• Analysts and investor briefings; declaration of dividends• Communication of sustainability performance and initiatives
through this report and through stakeholder engagement sessions
GOVERNMENT: LGUS AND NATIONAL GOVERNMENT AGENCIES
Compliance monitoring of all applicable statutory and regulatory requirements
Payment of taxes, business permits and licenses, partnerships/co-sponsored events, and regular reviews; neighboring communities as partners and/or beneficiaries to the company’s development programs, and conduct of stakeholder engagement sessions.
• Communication of sustainability performance through this report and through stakeholder engagement sessions
• Health, safety, employment, environment, and local traffic conditions
• Venue for civic interaction• Availability of new and efficient technology
that minimizes environmental impacts• Job and partnership opportunities for local
farmers, businessmen, and employees• Partnerships and collaboration for
sustainability (urbanizing and greening the city)
• Prompt payment of taxes and submission of reports• Regular reviews of compliance with regulatory requirements• Provision and maintenance of good road networks• Practice transparency and full disclosure including the
provision of this report• Sharing of best sustainability practices• Attendance to seminars, conferences, and meetings• Regular coordination and continuing engagement• Conduct of sustainability learning sessions
EMPLOYEES: ORGANIC AND GENERAL CONTRACTORS
Our important resource to achieve the company’s goals.
Townhall meetings, climate survey, volunteer programs, and conduct of stakeholder engagement sessions
• Proper training, adequate compensation and benefits, health and safety, and employee development
• Wellness and work-life balance• General contractor: Data Management System• Property Management: Uniformity in data
gathering, monitoring, reporting, and presentation
• Benefits upgrade; merit increases• Wellness program (CHI P.L.U.S.)• Competency development programs• Health and safety programs• Conduct of sustainability learning sessions
EXTERNAL: EMPLOYEES OF MERCHANTS, CONTRACTORS, PARK ASSOCIATIONS AND SUPPLIERS.
Provide products and services for the company; implement projects, programs and initiatives.
Accreditation, bidding, payment conformity with Process Cycle Time (PCT) standards, programs to educate and orient contractors and suppliers on QEHS best practices and benefits, and conduct of stakeholder engagement sessions.
• Continuing employment• Training and development• Work tools to enable effective work• Health and safety
• Equal opportunities for local contractors• Identify and develop sustainable water
sources (finite ground water resource)• Solid Waste Management Program• Traffic improvement
• Establishment of and compliance to PCT standards• Implement programs to educate and orient contractors and
suppliers on QEHS best practices and benefits• Conduct of sustainability learning and work sessions
MEDIA PARTNERS:
Means of communication through which CHI promotes its brand, image and reputation.
Conduct of press conferences, fellowships, and placement of paid advertisements
• Truthfulness and usefulness of information shared• High courtesy/reliability rating of media relations• personnel or any company representative• Provide sufficient information about the company’s
projects and understanding of its brands• Open communication lines
• Publicity• Issues-handling• Media relations
• Media briefings• Regular fellowships• Regular updates on new developments
LOCAL COMMUNITIES: BARANGAY ALLIANCE
Neighbors beyond the company’s fencelines
Implementation of development programs on education, employment, environment, peace and order, livelihood, and alliance strengthening initiatives, and conduct of stakeholder engagement sessions
• Local employment• Livelihood assistance• Environmental program• Scholarship program• Encouraging small entrepreneurs by supporting their
products• Increase in barangay income through barangay
permits from mall merchants and locators• Inclusive growth• Child-friendly Cebu
• Stringent selection process/implementation of policy for subcontractors
• Traffic congestion• Sidewalk vendors and fragmented access
roads• Suspected illegal drug use by BPO
employees• High fuel consumption used in waste
collection• Reporting of the number of employees per
barangay• Drainage systems repairs• Solid waste management
• Partnerships with LGU or the local communities for Solid Waste Management (SWM) programs
• Strengthening of the alliance• Implementation of programs aligned to the needs of the
community• Local employment prioritization• Conduct of sustainability learning sessions
FARTHER AND FASTER 127
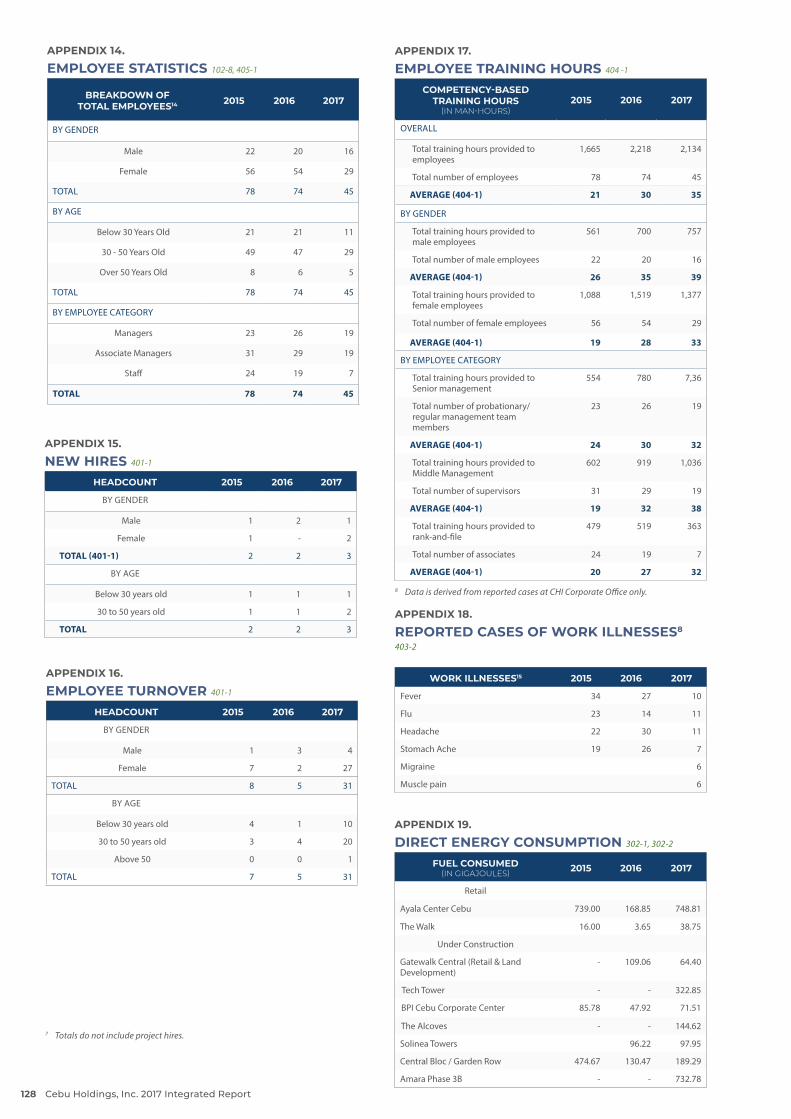
APPENDIX 16.
EMPLOYEE TURNOVER 401-1
HEADCOUNT 2015 2016 2017
BY GENDER
Male 1 3 4
Female 7 2 27
TOTAL 8 5 31
BY AGE
Below 30 years old 4 1 10
30 to 50 years old 3 4 20
Above 50 0 0 1
TOTAL 7 5 31
APPENDIX 15.
NEW HIRES 401-1
HEADCOUNT 2015 2016 2017
BY GENDER
Male 1 2 1
Female 1 - 2
TOTAL (401-1) 2 2 3
BY AGE
Below 30 years old 1 1 1
30 to 50 years old 1 1 2
TOTAL 2 2 3
APPENDIX 14.
EMPLOYEE STATISTICS 102-8, 405-1
BREAKDOWN OF TOTAL EMPLOYEES14 2015 2016 2017
BY GENDER
Male 22 20 16
Female 56 54 29
TOTAL 78 74 45
BY AGE
Below 30 Years Old 21 21 11
30 - 50 Years Old 49 47 29
Over 50 Years Old 8 6 5
TOTAL 78 74 45
BY EMPLOYEE CATEGORY
Managers 23 26 19
Associate Managers 31 29 19
Staff 24 19 7
TOTAL 78 74 45
APPENDIX 17.
EMPLOYEE TRAINING HOURS 404 -1
COMPETENCY-BASED TRAINING HOURS
(IN MAN-HOURS)2015 2016 2017
OVERALL
Total training hours provided to employees
1,665 2,218 2,134
Total number of employees 78 74 45
AVERAGE (404-1) 21 30 35
BY GENDER
Total training hours provided to male employees
561 700 757
Total number of male employees 22 20 16
AVERAGE (404-1) 26 35 39
Total training hours provided to female employees
1,088 1,519 1,377
Total number of female employees 56 54 29
AVERAGE (404-1) 19 28 33
BY EMPLOYEE CATEGORY
Total training hours provided to Senior management
554 780 7,36
Total number of probationary/regular management team members
23 26 19
AVERAGE (404-1) 24 30 32
Total training hours provided to Middle Management
602 919 1,036
Total number of supervisors 31 29 19
AVERAGE (404-1) 19 32 38
Total training hours provided to rank-and-file
479 519 363
Total number of associates 24 19 7
AVERAGE (404-1) 20 27 32
APPENDIX 18.
REPORTED CASES OF WORK ILLNESSES8
403-2
WORK ILLNESSES15 2015 2016 2017
Fever 34 27 10
Flu 23 14 11
Headache 22 30 11
Stomach Ache 19 26 7
Migraine 6
Muscle pain 6
APPENDIX 19.
DIRECT ENERGY CONSUMPTION 302-1, 302-2
FUEL CONSUMED (IN GIGAJOULES) 2015 2016 2017
Retail
Ayala Center Cebu 739.00 168.85 748.81
The Walk 16.00 3.65 38.75
Under Construction
Gatewalk Central (Retail & Land Development)
- 109.06 64.40
Tech Tower - - 322.85
BPI Cebu Corporate Center 85.78 47.92 71.51
The Alcoves - - 144.62
Solinea Towers 96.22 97.95
Central Bloc / Garden Row 474.67 130.47 189.29
Amara Phase 3B - - 732.78
7 Totals do not include project hires.
8 Data is derived from reported cases at CHI Corporate Office only.
Cebu Holdings, Inc. 2017 Integrated Report128
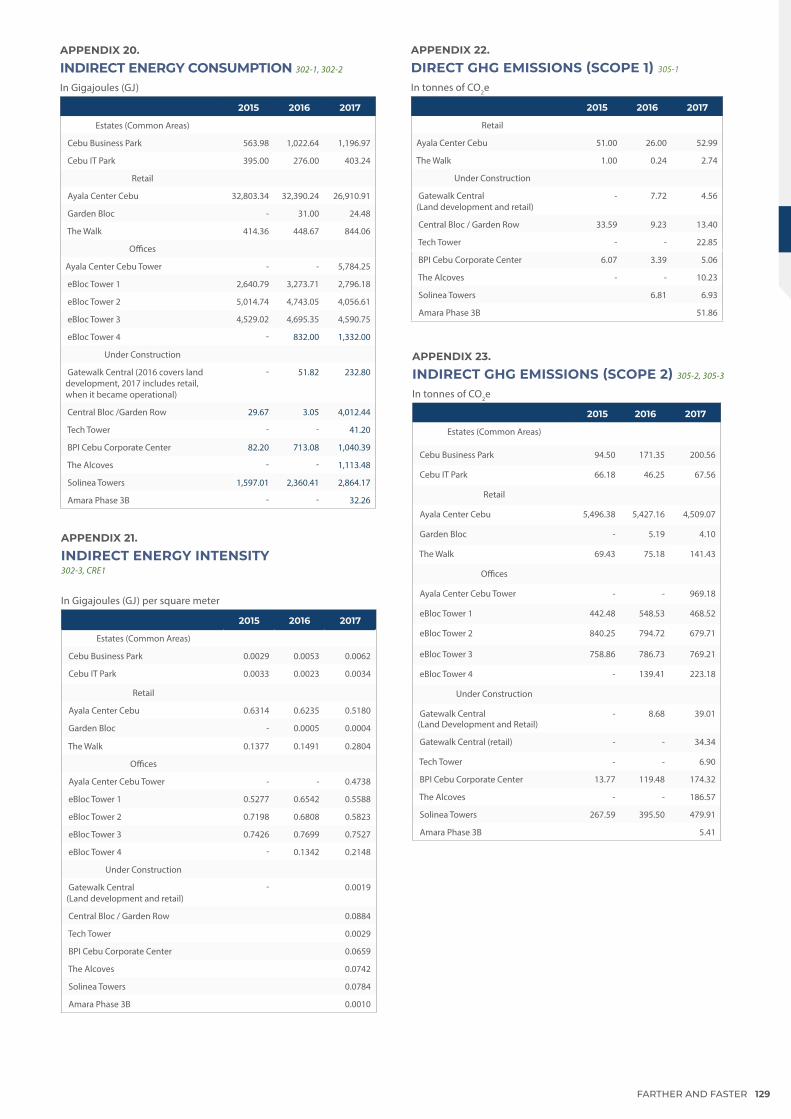
APPENDIX 20.
INDIRECT ENERGY CONSUMPTION 302-1, 302-2
In Gigajoules (GJ)
2015 2016 2017
Estates (Common Areas)
Cebu Business Park 563.98 1,022.64 1,196.97
Cebu IT Park 395.00 276.00 403.24
Retail
Ayala Center Cebu 32,803.34 32,390.24 26,910.91
Garden Bloc - 31.00 24.48
The Walk 414.36 448.67 844.06
Offices
Ayala Center Cebu Tower - - 5,784.25
eBloc Tower 1 2,640.79 3,273.71 2,796.18
eBloc Tower 2 5,014.74 4,743.05 4,056.61
eBloc Tower 3 4,529.02 4,695.35 4,590.75
eBloc Tower 4 - 832.00 1,332.00
Under Construction
Gatewalk Central (2016 covers land development, 2017 includes retail, when it became operational)
- 51.82 232.80
Central Bloc /Garden Row 29.67 3.05 4,012.44
Tech Tower - - 41.20
BPI Cebu Corporate Center 82.20 713.08 1,040.39
The Alcoves - - 1,113.48
Solinea Towers 1,597.01 2,360.41 2,864.17
Amara Phase 3B - - 32.26
APPENDIX 21.
INDIRECT ENERGY INTENSITY302-3, CRE1
In Gigajoules (GJ) per square meter
2015 2016 2017
Estates (Common Areas)
Cebu Business Park 0.0029 0.0053 0.0062
Cebu IT Park 0.0033 0.0023 0.0034
Retail
Ayala Center Cebu 0.6314 0.6235 0.5180
Garden Bloc - 0.0005 0.0004
The Walk 0.1377 0.1491 0.2804
Offices
Ayala Center Cebu Tower - - 0.4738
eBloc Tower 1 0.5277 0.6542 0.5588
eBloc Tower 2 0.7198 0.6808 0.5823
eBloc Tower 3 0.7426 0.7699 0.7527
eBloc Tower 4 - 0.1342 0.2148
Under Construction
Gatewalk Central(Land development and retail)
- 0.0019
Central Bloc / Garden Row 0.0884
Tech Tower 0.0029
BPI Cebu Corporate Center 0.0659
The Alcoves 0.0742
Solinea Towers 0.0784
Amara Phase 3B 0.0010
APPENDIX 22.
DIRECT GHG EMISSIONS (SCOPE 1) 305-1
In tonnes of CO2e
2015 2016 2017
Retail
Ayala Center Cebu 51.00 26.00 52.99
The Walk 1.00 0.24 2.74
Under Construction
Gatewalk Central(Land development and retail)
- 7.72 4.56
Central Bloc / Garden Row 33.59 9.23 13.40
Tech Tower - - 22.85
BPI Cebu Corporate Center 6.07 3.39 5.06
The Alcoves - - 10.23
Solinea Towers 6.81 6.93
Amara Phase 3B 51.86
APPENDIX 23.
INDIRECT GHG EMISSIONS (SCOPE 2) 305-2, 305-3
In tonnes of CO2e
2015 2016 2017
Estates (Common Areas)
Cebu Business Park 94.50 171.35 200.56
Cebu IT Park 66.18 46.25 67.56
Retail
Ayala Center Cebu 5,496.38 5,427.16 4,509.07
Garden Bloc - 5.19 4.10
The Walk 69.43 75.18 141.43
Offices
Ayala Center Cebu Tower - - 969.18
eBloc Tower 1 442.48 548.53 468.52
eBloc Tower 2 840.25 794.72 679.71
eBloc Tower 3 758.86 786.73 769.21
eBloc Tower 4 - 139.41 223.18
Under Construction
Gatewalk Central(Land Development and Retail)
- 8.68 39.01
Gatewalk Central (retail) - - 34.34
Tech Tower - - 6.90
BPI Cebu Corporate Center 13.77 119.48 174.32
The Alcoves - - 186.57
Solinea Towers 267.59 395.50 479.91
Amara Phase 3B 5.41
FARTHER AND FASTER 129
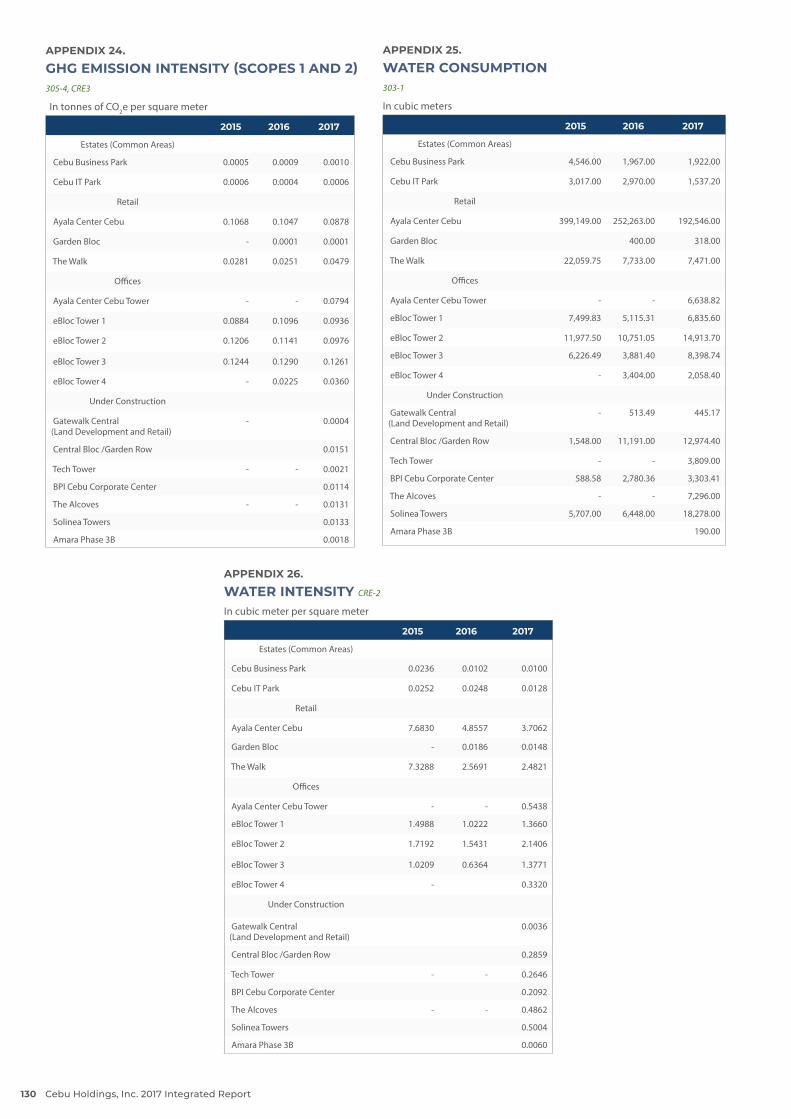
APPENDIX 24.
GHG EMISSION INTENSITY (SCOPES 1 AND 2)305-4, CRE3
In tonnes of CO2e per square meter
2015 2016 2017
Estates (Common Areas)
Cebu Business Park 0.0005 0.0009 0.0010
Cebu IT Park 0.0006 0.0004 0.0006
Retail
Ayala Center Cebu 0.1068 0.1047 0.0878
Garden Bloc - 0.0001 0.0001
The Walk 0.0281 0.0251 0.0479
Offices
Ayala Center Cebu Tower - - 0.0794
eBloc Tower 1 0.0884 0.1096 0.0936
eBloc Tower 2 0.1206 0.1141 0.0976
eBloc Tower 3 0.1244 0.1290 0.1261
eBloc Tower 4 - 0.0225 0.0360
Under Construction
Gatewalk Central (Land Development and Retail)
- 0.0004
Central Bloc /Garden Row 0.0151
Tech Tower - - 0.0021
BPI Cebu Corporate Center 0.0114
The Alcoves - - 0.0131
Solinea Towers 0.0133
Amara Phase 3B 0.0018
APPENDIX 25.
WATER CONSUMPTION303-1 In cubic meters
2015 2016 2017
Estates (Common Areas)
Cebu Business Park 4,546.00 1,967.00 1,922.00
Cebu IT Park 3,017.00 2,970.00 1,537.20
Retail
Ayala Center Cebu 399,149.00 252,263.00 192,546.00
Garden Bloc 400.00 318.00
The Walk 22,059.75 7,733.00 7,471.00
Offices
Ayala Center Cebu Tower - - 6,638.82
eBloc Tower 1 7,499.83 5,115.31 6,835.60
eBloc Tower 2 11,977.50 10,751.05 14,913.70
eBloc Tower 3 6,226.49 3,881.40 8,398.74
eBloc Tower 4 - 3,404.00 2,058.40
Under Construction
Gatewalk Central(Land Development and Retail)
- 513.49 445.17
Central Bloc /Garden Row 1,548.00 11,191.00 12,974.40
Tech Tower - - 3,809.00
BPI Cebu Corporate Center 588.58 2,780.36 3,303.41
The Alcoves - - 7,296.00
Solinea Towers 5,707.00 6,448.00 18,278.00
Amara Phase 3B 190.00
APPENDIX 26.
WATER INTENSITY CRE-2
In cubic meter per square meter
2015 2016 2017
Estates (Common Areas)
Cebu Business Park 0.0236 0.0102 0.0100
Cebu IT Park 0.0252 0.0248 0.0128
Retail
Ayala Center Cebu 7.6830 4.8557 3.7062
Garden Bloc - 0.0186 0.0148
The Walk 7.3288 2.5691 2.4821
Offices
Ayala Center Cebu Tower - - 0.5438
eBloc Tower 1 1.4988 1.0222 1.3660
eBloc Tower 2 1.7192 1.5431 2.1406
eBloc Tower 3 1.0209 0.6364 1.3771
eBloc Tower 4 - 0.3320
Under Construction
Gatewalk Central(Land Development and Retail)
0.0036
Central Bloc /Garden Row 0.2859
Tech Tower - - 0.2646
BPI Cebu Corporate Center 0.2092
The Alcoves - - 0.4862
Solinea Towers 0.5004
Amara Phase 3B 0.0060
Cebu Holdings, Inc. 2017 Integrated Report130

APPENDIX 30.
RECYCLABLES COLLECTED BY COMMUNITY PARTNER FROM MALL OPERATIONS Results of continuing Solid Waste Management Program Partnership of Ayala Center Cebu and Barangay Luz
In tonnes
RECYCLED WASTE 2015 2016 2017
Dry Carton 173.20 331.35 381.81
Mixed Waste 51.93 66.84 93.40
Assorted Plastic 30.33 33.04 32.40
Glass 28.27 25.22 25.39
Tin Cans 26.08 31.72 33.02
Mineral 22.83 30.40 35.03
Cups 22.53 18.83 15.22
Others 58.66 55.92 69.75
Total 413.83 593.32 686.01
Recyclables Collected and Income Generated by community partners
RECYCLED WASTE 2016 2017
Kilos (kg) 593.32 686.01
Income (Php) PHP 2,470,066.00 PHP 2,797,328.00
APPENDIX 27.
SOLID WASTE GENERATED FROM OPERATIONAL PROPERTIES 306-2
In tonnes
SOLID WASTE RECYCLABLES NON-RECYCLABLES TOTAL
Estates (Common Areas)
Cebu Business Park 16.31 7.92 *46.60
Cebu IT Park 43.03 20.70 63.73
Retail
Ayala Center Cebu 818.38 3,449.02 4,267.40
Garden Bloc 15.74 152.70 168.44
The Walk 87.12 856.09 943.21
Offices
ACC Tower 7.88 4.89 12.77
eBloc Tower 1 55.40 79.64 135.04
eBloc Tower 2 7.97 137.32 145.29
eBloc Tower 3 5.50 113.74 119.24
eBloc Tower 4 2.12 35.00 37.12
APPENDIX 28.
SOLID WASTE GENERATED FROM CONSTRUCTION SITES 306-2
In cubic meters
WASTE GENERATED RECYCLED
Under Construction
Gatewalk Central (Land Development) -
Gatewalk Central (retail) 587,430.73 153,274.00
Central Bloc /Garden Row 22,797.52 303.42
Tech Tower 1,127.50 179.00
BPI Cebu Corporate Center 782.50 -
The Alcoves 16.10 8.32
Solinea Towers 5,011.87 1,836.00
Amara Phase 3B 14,862.00 741.95
APPENDIX 29.
TOTAL WASTE GENERATED AND RECYCLED FROM CONSTRUCTION SITES(PER TYPE OF WASTE) 306-2
In cubic meters
WASTE GENERATED RECYCLED
Concrete 1,132.50 28.20
Wood 534.08 307.63
Mixed Waste 24,109.04 1,879.62
Soil 610,562.73 168,866.40
Metal 1,788.84 1,492.67
Paper 27.93 16.98
Plastic 34.59 10.95
Tiles and Ceramics 72.70 1.50
Paver Blocks 202.80 78.30
Acotec Panel 1.00 -
Total 638,466.20 172,682.26
SOLID WASTE RECYCLABLES
Aluminum Cans 16,486.78
Cardboards 369,093.31
Glass 13,728.47
Metal 13,675.64
Papers 250,047.84
Plastic Container 36,266.84
Plastic 261,341.99
Styropor 9,747.00
Textiles 1,683.25
Tin Cans 68,099.00
Wood 23,218.00
* including 22.37 tonnes of unclassified solid waste
MEMBERSHIP IN ASSOCIATIONS
Business and Management » Ayala Business Club Cebu, Inc. » Cebu Business Park and Cebu I.T. Park Neighboring
Barangays Alliance » Cebu Business Park Association, Inc. » Cebu Chamber of Commerce and Industry » Chamber of Real Estate and Builders’ Association, Inc. » Geoplan Cebu Foundation, Inc. » International Council of Shopping Centers » Management Association of the Philippines » Philippine Quality and Productivity Movement – Visayas » Philippine Retailers Association » Philippine Chamber of Commerce and Industry » Financial Executives Institute of Cebu, Inc.
Sustainability Reporting » Global Reporting Initiative GOLD Community
Environmental and Ecosystems Conservation
» Philippine Business for the Environment » Cebu Uniting for Sustainable Water Foundation
FARTHER AND FASTER 131
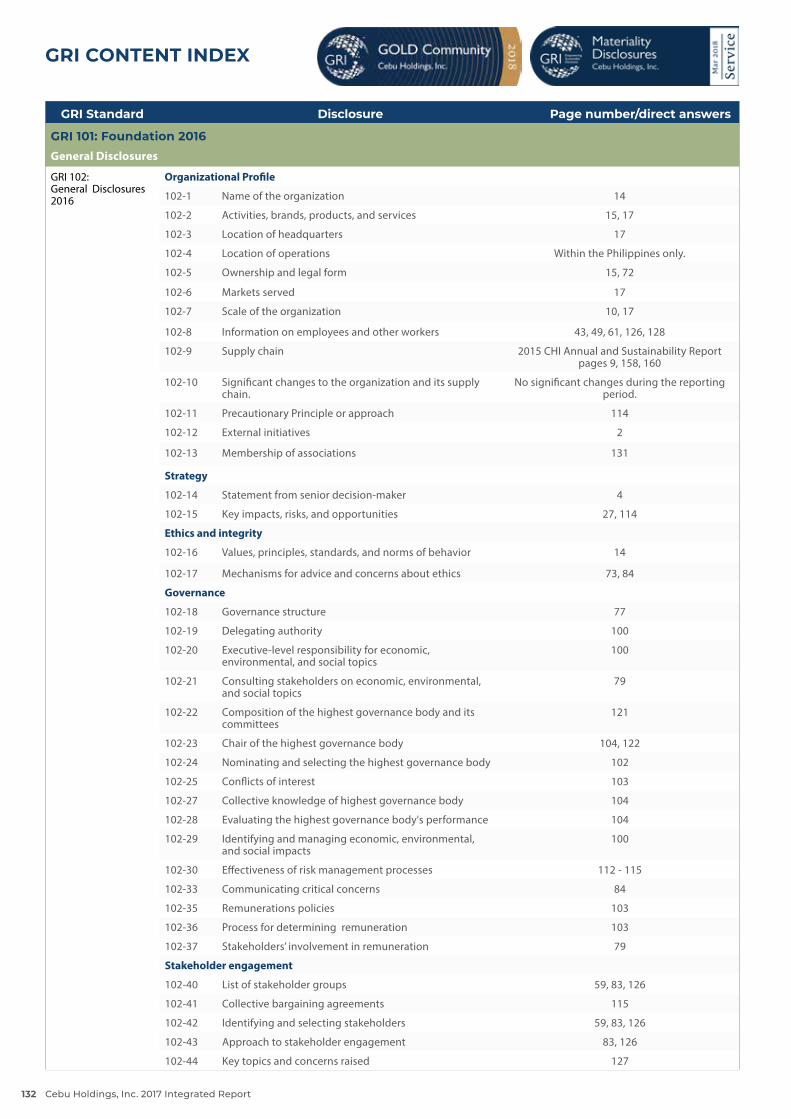
GRI Standard Disclosure Page number/direct answers
GRI 101: Foundation 2016General Disclosures
GRI 102: General Disclosures 2016
Organizational Profile
102-1 Name of the organization 14
102-2 Activities, brands, products, and services 15, 17
102-3 Location of headquarters 17
102-4 Location of operations Within the Philippines only.
102-5 Ownership and legal form 15, 72
102-6 Markets served 17
102-7 Scale of the organization 10, 17
102-8 Information on employees and other workers 43, 49, 61, 126, 128
102-9 Supply chain 2015 CHI Annual and Sustainability Report pages 9, 158, 160
102-10 Significant changes to the organization and its supply chain.
No significant changes during the reporting period.
102-11 Precautionary Principle or approach 114
102-12 External initiatives 2
102-13 Membership of associations 131
Strategy
102-14 Statement from senior decision-maker 4
102-15 Key impacts, risks, and opportunities 27, 114
Ethics and integrity
102-16 Values, principles, standards, and norms of behavior 14
102-17 Mechanisms for advice and concerns about ethics 73, 84
Governance
102-18 Governance structure 77
102-19 Delegating authority 100
102-20 Executive-level responsibility for economic, environmental, and social topics
100
102-21 Consulting stakeholders on economic, environmental, and social topics
79
102-22 Composition of the highest governance body and its committees
121
102-23 Chair of the highest governance body 104, 122
102-24 Nominating and selecting the highest governance body 102
102-25 Conflicts of interest 103
102-27 Collective knowledge of highest governance body 104
102-28 Evaluating the highest governance body's performance 104
102-29 Identifying and managing economic, environmental, and social impacts
100
102-30 Effectiveness of risk management processes 112 - 115
102-33 Communicating critical concerns 84
102-35 Remunerations policies 103
102-36 Process for determining remuneration 103
102-37 Stakeholders’ involvement in remuneration 79
Stakeholder engagement
102-40 List of stakeholder groups 59, 83, 126
102-41 Collective bargaining agreements 115
102-42 Identifying and selecting stakeholders 59, 83, 126
102-43 Approach to stakeholder engagement 83, 126
102-44 Key topics and concerns raised 127
GRI CONTENT INDEX
Cebu Holdings, Inc. 2017 Integrated Report132
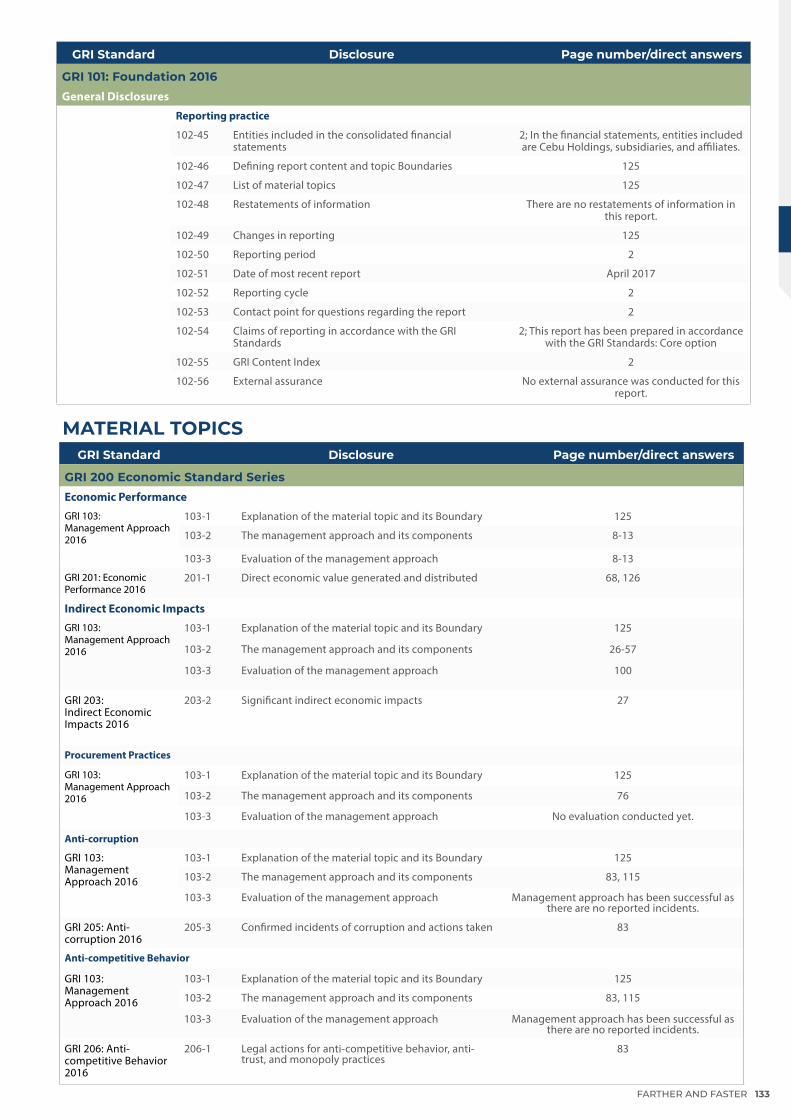
GRI Standard Disclosure Page number/direct answers
GRI 200 Economic Standard SeriesEconomic Performance
GRI 103:Management Approach 2016
103-1 Explanation of the material topic and its Boundary 125
103-2 The management approach and its components 8-13
103-3 Evaluation of the management approach 8-13
GRI 201: Economic Performance 2016
201-1 Direct economic value generated and distributed 68, 126
Indirect Economic Impacts
GRI 103:Management Approach 2016
103-1
103-2
103-3
Explanation of the material topic and its Boundary
The management approach and its components
Evaluation of the management approach
125
26-57
100
GRI 203: Indirect Economic Impacts 2016
203-2 Significant indirect economic impacts 27
Procurement Practices
GRI 103:Management Approach 2016
103-1 Explanation of the material topic and its Boundary 125
103-2 The management approach and its components 76
103-3 Evaluation of the management approach No evaluation conducted yet.
Anti-corruption
GRI 103:Management Approach 2016
103-1 Explanation of the material topic and its Boundary 125
103-2 The management approach and its components 83, 115
103-3 Evaluation of the management approach Management approach has been successful as there are no reported incidents.
GRI 205: Anti-corruption 2016
205-3 Confirmed incidents of corruption and actions taken 83
Anti-competitive Behavior
GRI 103:Management Approach 2016
103-1 Explanation of the material topic and its Boundary 125
103-2 The management approach and its components 83, 115
103-3 Evaluation of the management approach Management approach has been successful as there are no reported incidents.
GRI 206: Anti-competitive Behavior 2016
206-1 Legal actions for anti-competitive behavior, anti-trust, and monopoly practices
83
MATERIAL TOPICS
GRI Standard Disclosure Page number/direct answers
GRI 101: Foundation 2016General Disclosures
Reporting practice
102-45 Entities included in the consolidated financial statements
2; In the financial statements, entities included are Cebu Holdings, subsidiaries, and affiliates.
102-46 Defining report content and topic Boundaries 125
102-47 List of material topics 125
102-48 Restatements of information There are no restatements of information in this report.
102-49 Changes in reporting 125
102-50 Reporting period 2
102-51 Date of most recent report April 2017
102-52 Reporting cycle 2
102-53 Contact point for questions regarding the report 2
102-54 Claims of reporting in accordance with the GRI Standards
2; This report has been prepared in accordance with the GRI Standards: Core option
102-55 GRI Content Index 2
102-56 External assurance No external assurance was conducted for this report.
FARTHER AND FASTER 133
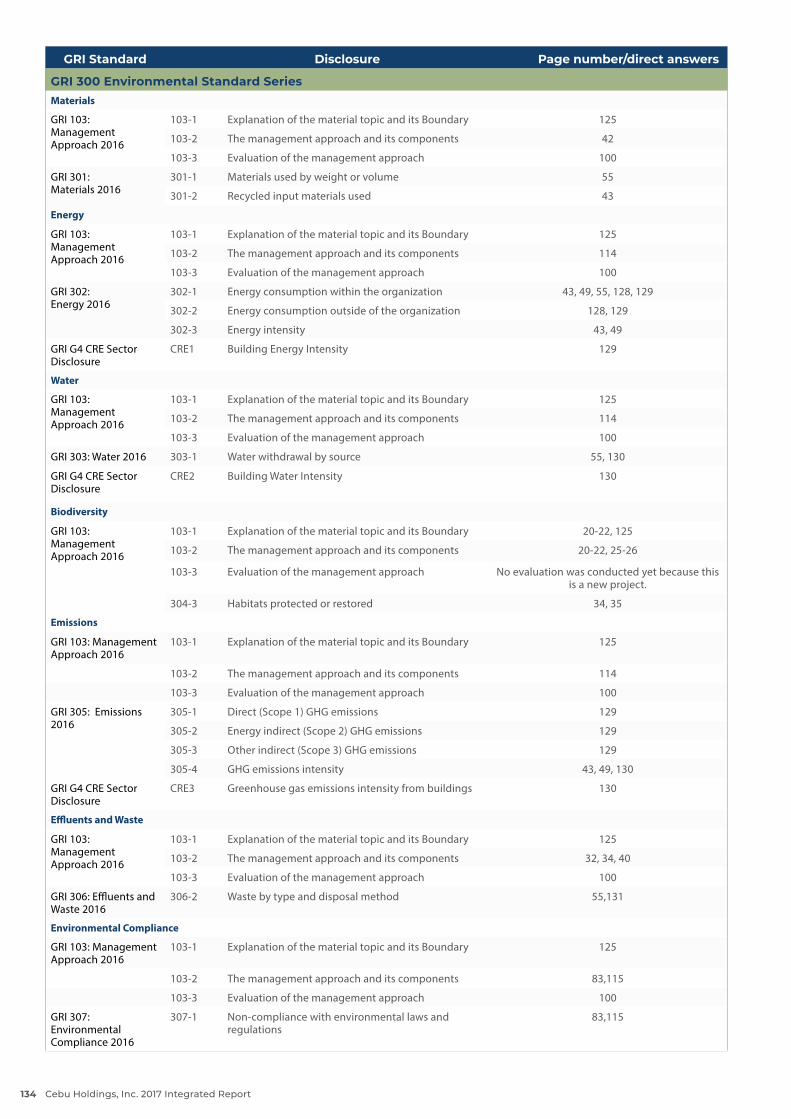
GRI Standard Disclosure Page number/direct answers
GRI 300 Environmental Standard SeriesMaterials
GRI 103:Management Approach 2016
103-1 Explanation of the material topic and its Boundary 125
103-2 The management approach and its components 42
103-3 Evaluation of the management approach 100
GRI 301: Materials 2016
301-1 Materials used by weight or volume 55
301-2 Recycled input materials used 43
Energy
GRI 103:Management Approach 2016
103-1 Explanation of the material topic and its Boundary 125
103-2 The management approach and its components 114
103-3 Evaluation of the management approach 100
GRI 302:Energy 2016
302-1 Energy consumption within the organization 43, 49, 55, 128, 129
302-2 Energy consumption outside of the organization 128, 129
302-3 Energy intensity 43, 49
GRI G4 CRE Sector Disclosure
CRE1 Building Energy Intensity 129
Water
GRI 103:Management Approach 2016
103-1 Explanation of the material topic and its Boundary 125
103-2 The management approach and its components 114
103-3 Evaluation of the management approach 100
GRI 303: Water 2016 303-1 Water withdrawal by source 55, 130
GRI G4 CRE Sector Disclosure
CRE2 Building Water Intensity 130
Biodiversity
GRI 103:Management Approach 2016
103-1 Explanation of the material topic and its Boundary 20-22, 125
103-2 The management approach and its components 20-22, 25-26
103-3 Evaluation of the management approach No evaluation was conducted yet because this is a new project.
304-3 Habitats protected or restored 34, 35
Emissions
GRI 103: Management Approach 2016
103-1 Explanation of the material topic and its Boundary 125
103-2 The management approach and its components 114
103-3 Evaluation of the management approach 100
GRI 305: Emissions 2016
305-1 Direct (Scope 1) GHG emissions 129
305-2 Energy indirect (Scope 2) GHG emissions 129
305-3 Other indirect (Scope 3) GHG emissions 129
305-4 GHG emissions intensity 43, 49, 130
GRI G4 CRE Sector Disclosure
CRE3 Greenhouse gas emissions intensity from buildings 130
Effluents and Waste
GRI 103:Management Approach 2016
103-1 Explanation of the material topic and its Boundary 125
103-2 The management approach and its components 32, 34, 40
103-3 Evaluation of the management approach 100
GRI 306: Effluents and Waste 2016
306-2 Waste by type and disposal method 55,131
Environmental Compliance
GRI 103: Management Approach 2016
103-1 Explanation of the material topic and its Boundary 125
103-2 The management approach and its components 83,115
103-3 Evaluation of the management approach 100
GRI 307: Environmental Compliance 2016
307-1 Non-compliance with environmental laws and regulations
83,115
Cebu Holdings, Inc. 2017 Integrated Report134
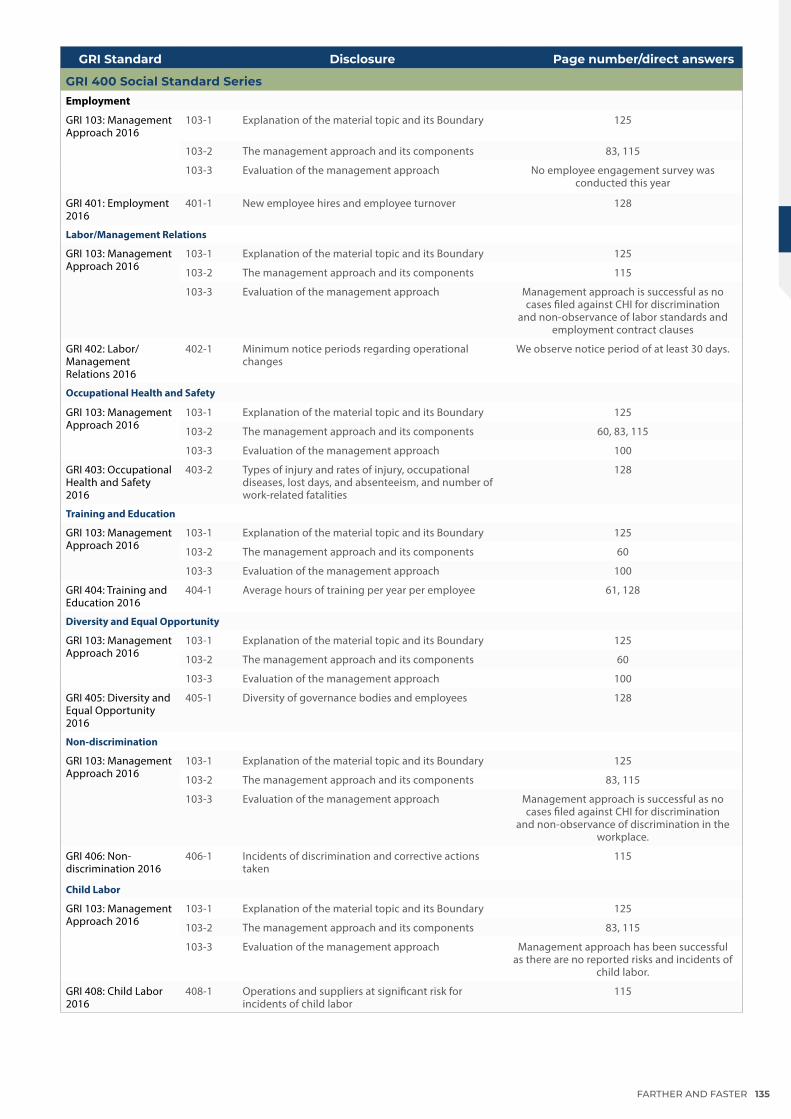
GRI Standard Disclosure Page number/direct answers
GRI 400 Social Standard SeriesEmployment
GRI 103: Management Approach 2016
103-1 Explanation of the material topic and its Boundary 125
103-2 The management approach and its components 83, 115
103-3 Evaluation of the management approach No employee engagement survey was conducted this year
GRI 401: Employment 2016
401-1 New employee hires and employee turnover 128
Labor/Management Relations
GRI 103: Management Approach 2016
103-1 Explanation of the material topic and its Boundary 125
103-2 The management approach and its components 115
103-3 Evaluation of the management approach Management approach is successful as no cases filed against CHI for discrimination
and non-observance of labor standards and employment contract clauses
GRI 402: Labor/ Management Relations 2016
402-1 Minimum notice periods regarding operational changes
We observe notice period of at least 30 days.
Occupational Health and Safety
GRI 103: Management Approach 2016
103-1 Explanation of the material topic and its Boundary 125
103-2 The management approach and its components 60, 83, 115
103-3 Evaluation of the management approach 100
GRI 403: Occupational Health and Safety 2016
403-2 Types of injury and rates of injury, occupational diseases, lost days, and absenteeism, and number of work-related fatalities
128
Training and Education
GRI 103: Management Approach 2016
103-1 Explanation of the material topic and its Boundary 125
103-2 The management approach and its components 60
103-3 Evaluation of the management approach 100
GRI 404: Training and Education 2016
404-1 Average hours of training per year per employee 61, 128
Diversity and Equal Opportunity
GRI 103: Management Approach 2016
103-1 Explanation of the material topic and its Boundary 125
103-2 The management approach and its components 60
103-3 Evaluation of the management approach 100
GRI 405: Diversity and Equal Opportunity 2016
405-1 Diversity of governance bodies and employees 128
Non-discrimination
GRI 103: Management Approach 2016
103-1 Explanation of the material topic and its Boundary 125
103-2 The management approach and its components 83, 115
103-3 Evaluation of the management approach Management approach is successful as no cases filed against CHI for discrimination
and non-observance of discrimination in the workplace.
GRI 406: Non-discrimination 2016
406-1 Incidents of discrimination and corrective actions taken
115
Child Labor
GRI 103: Management Approach 2016
103-1 Explanation of the material topic and its Boundary 125
103-2 The management approach and its components 83, 115
103-3 Evaluation of the management approach Management approach has been successful as there are no reported risks and incidents of
child labor.
GRI 408: Child Labor 2016
408-1 Operations and suppliers at significant risk for incidents of child labor
115
FARTHER AND FASTER 135
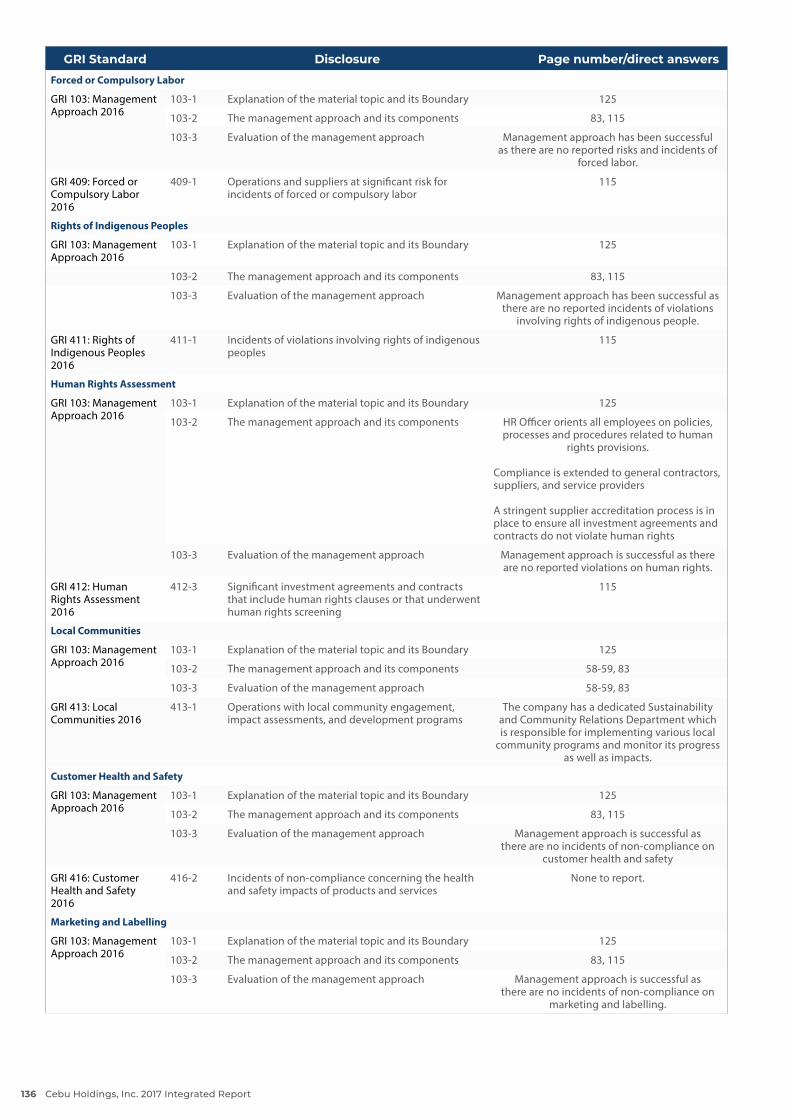
GRI Standard Disclosure Page number/direct answers
Forced or Compulsory Labor
GRI 103: Management Approach 2016
103-1 Explanation of the material topic and its Boundary 125
103-2 The management approach and its components 83, 115
103-3 Evaluation of the management approach Management approach has been successful as there are no reported risks and incidents of
forced labor.
GRI 409: Forced or Compulsory Labor 2016
409-1 Operations and suppliers at significant risk for incidents of forced or compulsory labor
115
Rights of Indigenous Peoples
GRI 103: Management Approach 2016
103-1 Explanation of the material topic and its Boundary 125
103-2 The management approach and its components 83, 115
103-3 Evaluation of the management approach Management approach has been successful as there are no reported incidents of violations
involving rights of indigenous people.
GRI 411: Rights of Indigenous Peoples 2016
411-1 Incidents of violations involving rights of indigenous peoples
115
Human Rights Assessment
GRI 103: Management Approach 2016
103-1 Explanation of the material topic and its Boundary 125
103-2 The management approach and its components HR Officer orients all employees on policies, processes and procedures related to human
rights provisions.
Compliance is extended to general contractors, suppliers, and service providers
A stringent supplier accreditation process is in place to ensure all investment agreements and contracts do not violate human rights
103-3 Evaluation of the management approach Management approach is successful as there are no reported violations on human rights.
GRI 412: Human Rights Assessment 2016
412-3 Significant investment agreements and contracts that include human rights clauses or that underwent human rights screening
115
Local Communities
GRI 103: Management Approach 2016
103-1 Explanation of the material topic and its Boundary 125
103-2 The management approach and its components 58-59, 83
103-3 Evaluation of the management approach 58-59, 83
GRI 413: Local Communities 2016
413-1 Operations with local community engagement, impact assessments, and development programs
The company has a dedicated Sustainability and Community Relations Department which is responsible for implementing various local
community programs and monitor its progress as well as impacts.
Customer Health and Safety
GRI 103: Management Approach 2016
103-1 Explanation of the material topic and its Boundary 125
103-2 The management approach and its components 83, 115
103-3 Evaluation of the management approach Management approach is successful as there are no incidents of non-compliance on
customer health and safety
GRI 416: Customer Health and Safety 2016
416-2 Incidents of non-compliance concerning the health and safety impacts of products and services
None to report.
Marketing and Labelling
GRI 103: Management Approach 2016
103-1 Explanation of the material topic and its Boundary 125
103-2 The management approach and its components 83, 115
103-3 Evaluation of the management approach Management approach is successful as there are no incidents of non-compliance on
marketing and labelling.
Cebu Holdings, Inc. 2017 Integrated Report136
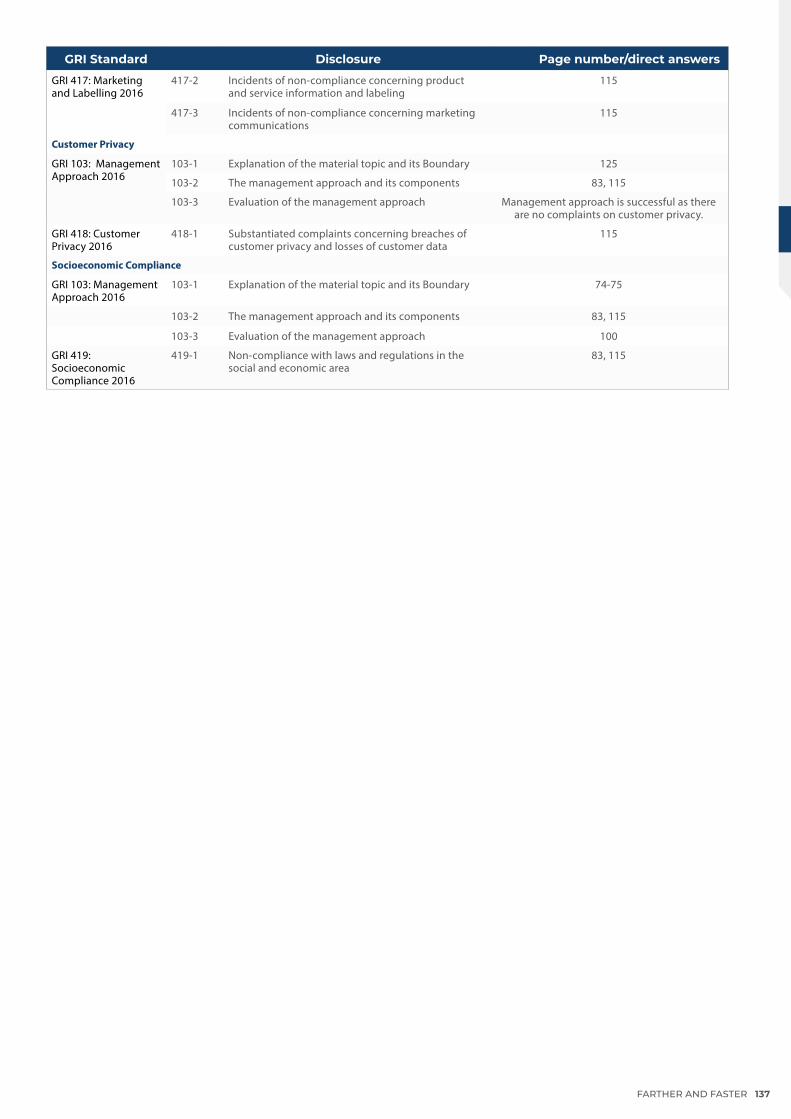
GRI Standard Disclosure Page number/direct answers
GRI 417: Marketing and Labelling 2016
417-2 Incidents of non-compliance concerning product and service information and labeling
115
417-3 Incidents of non-compliance concerning marketing communications
115
Customer Privacy
GRI 103: Management Approach 2016
103-1 Explanation of the material topic and its Boundary 125
103-2 The management approach and its components 83, 115
103-3 Evaluation of the management approach Management approach is successful as there are no complaints on customer privacy.
GRI 418: Customer Privacy 2016
418-1 Substantiated complaints concerning breaches of customer privacy and losses of customer data
115
Socioeconomic Compliance
GRI 103: Management Approach 2016
103-1 Explanation of the material topic and its Boundary 74-75
103-2 The management approach and its components 83, 115
103-3 Evaluation of the management approach 100
GRI 419: Socioeconomic Compliance 2016
419-1 Non-compliance with laws and regulations in the social and economic area
83, 115
FARTHER AND FASTER 137

Description Page no. / Direct answer
A. Rights of Shareholders
A.1 Basic shareholder rights 78
A.2 Right to participate in decisions concerning fundamental corporate changes
79
A.3 Right to participate effectively in and vote in general shareholder meetings and should be informed of the rules, including voting procedures that govern general shareholder meetings
79, 80
A.3.1 Shareholders as having the opportunity, evidenced by an agenda item, to approve remuneration or any increases in remuneration for non-executive directors/commissioners
79
A.3.2 Whether the company provides non-controlling shareholders a right to nominate candidates for board of directors/commissioners
79
A.3.3 Whether the company allow shareholders to elect directors/commissioners individually
79
A.3.18 Whether the company provides at least 21 days’ notice for all resolutions
80
A.3.19 Whether the company provides the rationale and explanation for each agenda item which require shareholders’ approval in the notice of AGM/circulars and/or the accompanying statement
80
A.5 The exercise of ownership rights by all shareholders, including institutional investors, should be facilitated
79
A.5.1 Whether the company publicly disclose its policy/practice to encourage shareholders including institutional shareholders to attend the general meetings or engagement with the company
79
B. Equitable Treatment of Shareholders
B.1 Shares and voting rights 80
B.1.1 Whether the company’s ordinary or common shares have one vote for one share
80
B.2 Notice of AGM 80
B.2.3 Whether the profiles of directors/commissioners in seeking election/re-election are included in the notice of AGM
80
B.2.4 Whether the auditors seeking appointment/re-appointment are clearly identified in the notice of AGM
80
B.3 Policy on insider trading and abusive self-dealing
80
B.4 Related party transactions by directors and key executives
81
B.5 Protecting minority shareholders from abusive actions
81
ASEAN CORPORATE GOVERNANCE INDEX
Description Page no. / Direct answer
C. Role of Stakeholders
C.1 The rights of stakeholders that are established by law or through mutual agreements are to be respected
83
C.2 Where stakeholder interests are protected by law, stakeholders should have the opportunity to obtain effective redress for violation of their rights
84
C.2.1 Contact details via the company’s website or Annual Report which stakeholders can use to voice their concerns and/or complaints for possible violation of their rights
85
C.3 Performance-enhancing mechanisms for employee participation should be permitted to develop
83
C.4 Stakeholders including individual employees and their representative bodies, should be able to freely communicate their concerns about illegal or unethical practices to the board and their rights should not be compromised for doing this
83, 84
D. Disclosure and Transparency
D.1 Transparent ownership structure 15, 86, 123
D.2 Quality of annual report 112, 117, 122
D.2.5 Dividend policy 78
D.2.6 Details of whistle-blowing policy 84
D.2.8 Training and/or continuing education programme attended by each director/commissioner
80
D.2.11 Details of remuneration of each member of the board of directors/commissioners
124
D.2.12 Statement of full compliance with the Code of Corporate Governance
72
D.3 Disclosure of related party transactions 81
D.4 Directors and commissioners dealings in shares of the company
80
D.5 External auditor and auditor report 87
D.6 Medium of communications
D.6.1 Quarterly reporting 86
D.6.2 Company website 86
D.6.3 Analyst's briefing 87
D.6.4 Media briefing/press conferences 87
D.7 Timely filing/release of annual/financial reports
85
D.8 Company website 87
D.9 Investor Relations Inside back cover
D.9.1 Contact details of the officer/office responsible for investor relations
85
Cebu Holdings, Inc. 2017 Integrated Report138
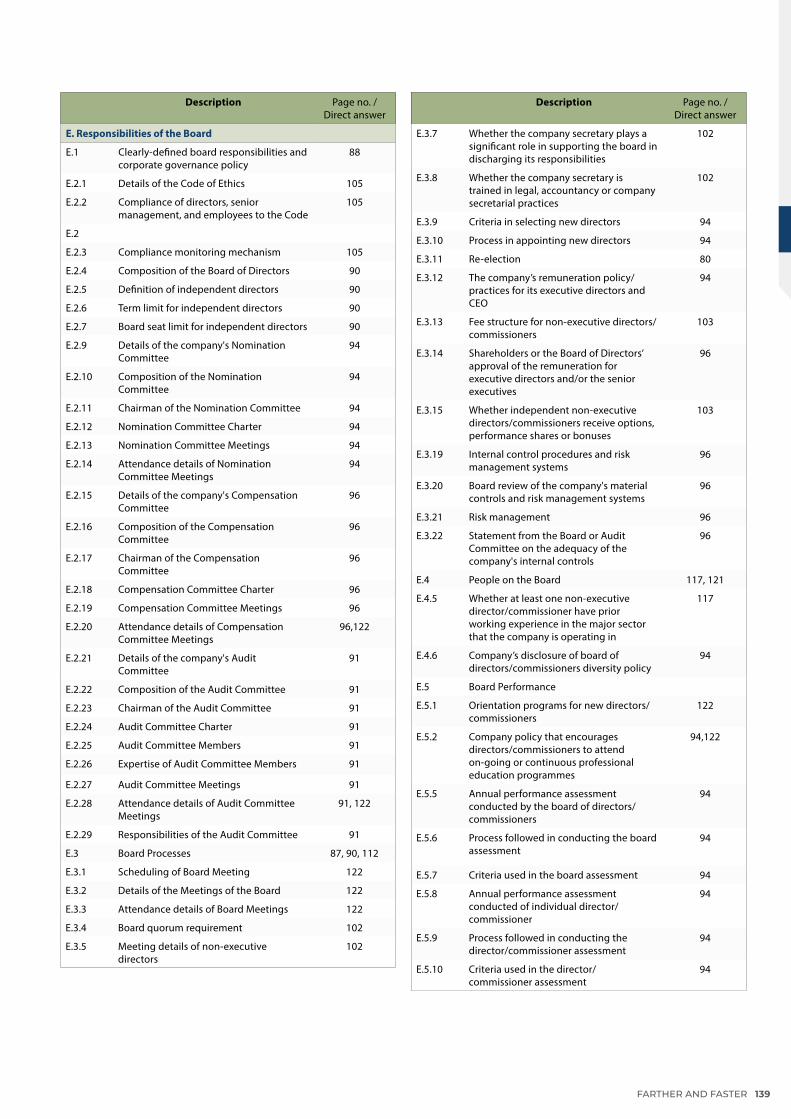
Description Page no. / Direct answer
E. Responsibilities of the Board
E.1 Clearly-defined board responsibilities and corporate governance policy
88
E.2.1 Details of the Code of Ethics 105
E.2.2 Compliance of directors, senior management, and employees to the Code
105
E.2
E.2.3 Compliance monitoring mechanism 105
E.2.4 Composition of the Board of Directors 90
E.2.5 Definition of independent directors 90
E.2.6 Term limit for independent directors 90
E.2.7 Board seat limit for independent directors 90
E.2.9 Details of the company's Nomination Committee
94
E.2.10 Composition of the Nomination Committee
94
E.2.11 Chairman of the Nomination Committee 94
E.2.12 Nomination Committee Charter 94
E.2.13 Nomination Committee Meetings 94
E.2.14 Attendance details of Nomination Committee Meetings
94
E.2.15 Details of the company's Compensation Committee
96
E.2.16 Composition of the Compensation Committee
96
E.2.17 Chairman of the Compensation Committee
96
E.2.18 Compensation Committee Charter 96
E.2.19 Compensation Committee Meetings 96
E.2.20 Attendance details of Compensation Committee Meetings
96,122
E.2.21 Details of the company's Audit Committee
91
E.2.22 Composition of the Audit Committee 91
E.2.23 Chairman of the Audit Committee 91
E.2.24 Audit Committee Charter 91
E.2.25 Audit Committee Members 91
E.2.26 Expertise of Audit Committee Members 91
E.2.27 Audit Committee Meetings 91
E.2.28 Attendance details of Audit Committee Meetings
91, 122
E.2.29 Responsibilities of the Audit Committee 91
E.3 Board Processes 87, 90, 112
E.3.1 Scheduling of Board Meeting 122
E.3.2 Details of the Meetings of the Board 122
E.3.3 Attendance details of Board Meetings 122
E.3.4 Board quorum requirement 102
E.3.5 Meeting details of non-executive directors
102
Description Page no. / Direct answer
E.3.7 Whether the company secretary plays a significant role in supporting the board in discharging its responsibilities
102
E.3.8 Whether the company secretary is trained in legal, accountancy or company secretarial practices
102
E.3.9 Criteria in selecting new directors 94
E.3.10 Process in appointing new directors 94
E.3.11 Re-election 80
E.3.12 The company’s remuneration policy/practices for its executive directors and CEO
94
E.3.13 Fee structure for non-executive directors/commissioners
103
E.3.14 Shareholders or the Board of Directors’ approval of the remuneration for executive directors and/or the senior executives
96
E.3.15 Whether independent non-executive directors/commissioners receive options, performance shares or bonuses
103
E.3.19 Internal control procedures and risk management systems
96
E.3.20 Board review of the company's material controls and risk management systems
96
E.3.21 Risk management 96
E.3.22 Statement from the Board or Audit Committee on the adequacy of the company's internal controls
96
E.4 People on the Board 117, 121
E.4.5 Whether at least one non-executive director/commissioner have prior working experience in the major sector that the company is operating in
117
E.4.6 Company’s disclosure of board of directors/commissioners diversity policy
94
E.5 Board Performance
E.5.1 Orientation programs for new directors/commissioners
122
E.5.2 Company policy that encourages directors/commissioners to attend on-going or continuous professional education programmes
94,122
E.5.5 Annual performance assessment conducted by the board of directors/commissioners
94
E.5.6 Process followed in conducting the board assessment
94
E.5.7 Criteria used in the board assessment 94
E.5.8 Annual performance assessment conducted of individual director/commissioner
94
E.5.9 Process followed in conducting the director/commissioner assessment
94
E.5.10 Criteria used in the director/commissioner assessment
94
FARTHER AND FASTER 139

Cebu Holdings, Inc. 2017 Integrated Report140

FINANCIAL REPORTS
STATEMENT OF MANAGEMENT’S RESPONSIBILITY FOR FINANCIAL STATEMENTS
REPORT OF THE AUDIT COMMITTEE TO THE BOARD OF DIRECTORS
REPORT OF THE RISK OVERSIGHT COMMITTEE TO THE BOARD OF DIRECTORS
INDEPENDENT AUDITOR’S REPORT
NOTES TO CONSOLIDATED FINANCIAL STATEMENTS
SHAREHOLDER INFORMATION
FARTHER AND FASTER 141
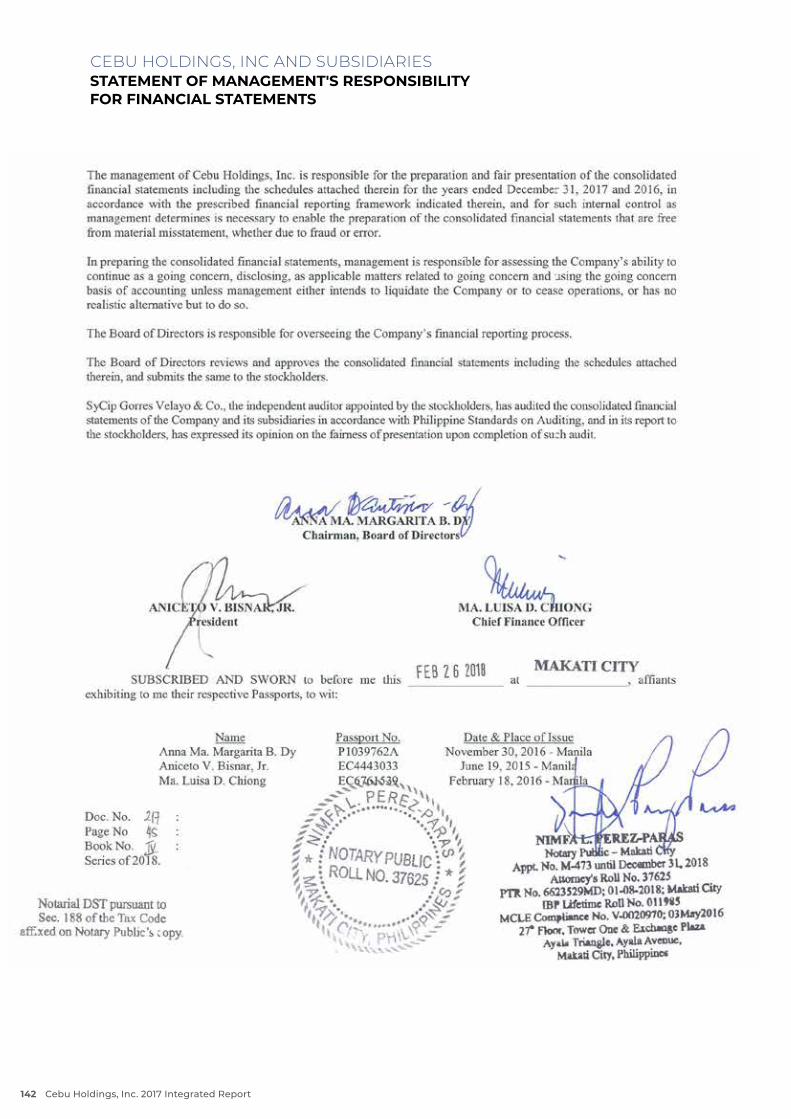
CEBU HOLDINGS, INC AND SUBSIDIARIESSTATEMENT OF MANAGEMENT'S RESPONSIBILITYFOR FINANCIAL STATEMENTS
Cebu Holdings, Inc. 2017 Integrated Report142

Report o f the Audi t Commit tee to the Board of D i rectorsFor the Year Ended December 31, 2017
As Audit Committee members, our roles and responsibilities are defined in the Audit Committee Charter
approved by the Board of Directors. We assist the Board of Directors in fulfilling its oversight responsibility to
the shareholders relating to:
the integrity of Cebu Holdings Inc.’s (the “Company”) financial statements and the financial
reporting process;
the appointment, re-appointment, remuneration, qualifications, independence and performance of
the independent auditors and the integrity of the audit process as a whole;
the effectiveness of the systems of internal control and the risk management process;
the performance and leadership of the internal audit function;
the Company’s compliance with applicable legal and regulatory requirements; and
the preparation of a year-end report of the Committee for approval of the Board and to be
included in the annual report.
In compliance with the Audit Committee Charter, we confirm that:
An independent director chairs the Audit Committee. All members of the Committee are
independent directors.
We had five (5) meetings in 2017, with the following attendance rate:Committee Member No. of Meetings Attended/Held Percent Present
Fr.Roderick C. Salazar, Jr., SVD (Chairman) 5/5 100%
Enrique L. Benedicto 5/5 100%
Pampio A. Abarintos 5/5 100%
We reviewed and revised the Committee’s Charter and endorsed the same for the approval of the
Board of Directors.
We recommended to the Board of Directors the re-appointment of SGV & Co., as independent
external auditors for 2018, based on the review of their performance and qualifications, including
consideration of management’s recommendation. The Committee delegates to management the
negotiation and finalization of fees;
We reviewed and discussed the quarterly unaudited consolidated financial statements and the
annual audited consolidated financial statements of Cebu Holdings, Inc. and subsidiaries,
CEBU HOLDINGS, INC AND SUBSIDIARIESREPORT OF THE AUDIT COMMITTEE TOTHE BOARD OF DIRECTORS
FARTHER AND FASTER 143
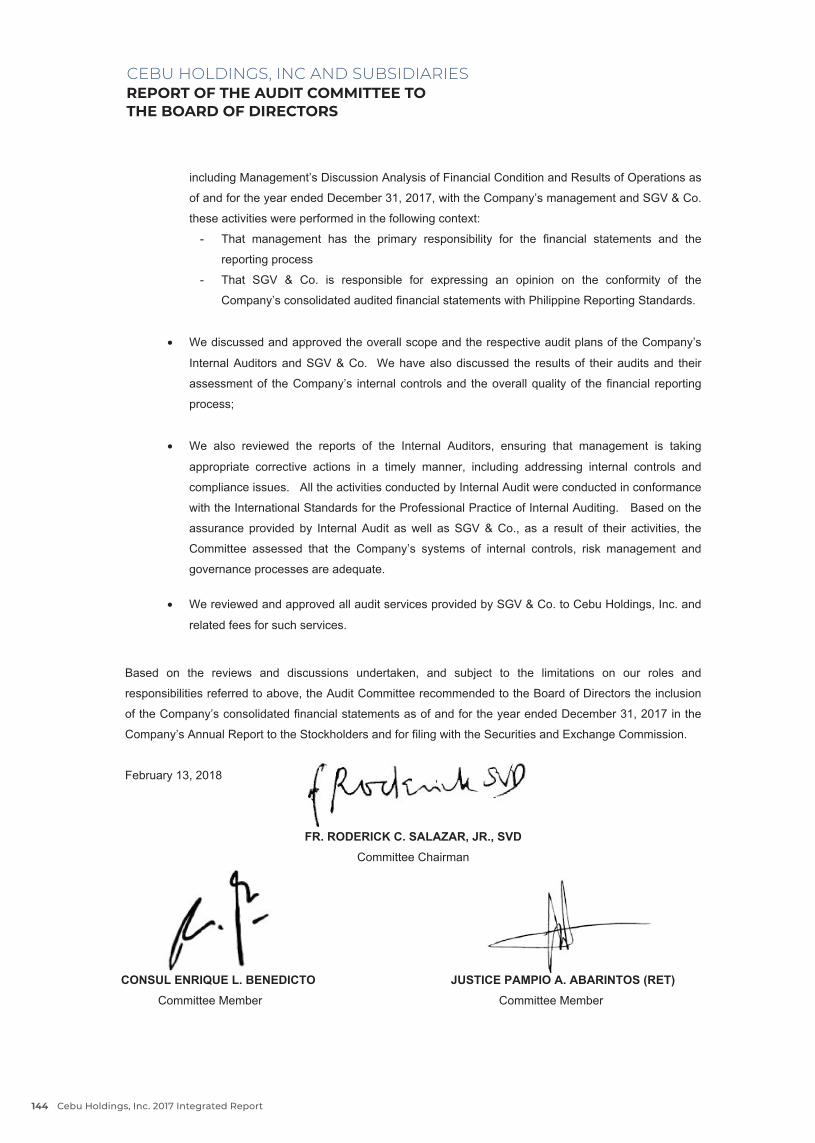
including Management’s Discussion Analysis of Financial Condition and Results of Operations as
of and for the year ended December 31, 2017, with the Company’s management and SGV & Co.
these activities were performed in the following context:
- That management has the primary responsibility for the financial statements and the
reporting process
- That SGV & Co. is responsible for expressing an opinion on the conformity of the
Company’s consolidated audited financial statements with Philippine Reporting Standards.
We discussed and approved the overall scope and the respective audit plans of the Company’s
Internal Auditors and SGV & Co. We have also discussed the results of their audits and their
assessment of the Company’s internal controls and the overall quality of the financial reporting
process;
We also reviewed the reports of the Internal Auditors, ensuring that management is taking
appropriate corrective actions in a timely manner, including addressing internal controls and
compliance issues. All the activities conducted by Internal Audit were conducted in conformance
with the International Standards for the Professional Practice of Internal Auditing. Based on the
assurance provided by Internal Audit as well as SGV & Co., as a result of their activities, the
Committee assessed that the Company’s systems of internal controls, risk management and
governance processes are adequate.
We reviewed and approved all audit services provided by SGV & Co. to Cebu Holdings, Inc. and
related fees for such services.
Based on the reviews and discussions undertaken, and subject to the limitations on our roles and
responsibilities referred to above, the Audit Committee recommended to the Board of Directors the inclusion
of the Company’s consolidated financial statements as of and for the year ended December 31, 2017 in the
Company’s Annual Report to the Stockholders and for filing with the Securities and Exchange Commission.
February 13, 2018
FR. RODERICK C. SALAZAR, JR., SVDCommittee Chairman
CONSUL ENRIQUE L. BENEDICTO JUSTICE PAMPIO A. ABARINTOS (RET) Committee Member Committee Member
CEBU HOLDINGS, INC AND SUBSIDIARIESREPORT OF THE AUDIT COMMITTEE TOTHE BOARD OF DIRECTORS
204 2016 Annual and Sustainability Report FINANCIAL REPORT
CEBU HOLDINGS, INC AND SUBSIDIARIESREPORT OF THE AUDIT COMMITTEE TO THE BOARD OF DIRECTORS
• We discussed and approved the overall scope and the respective audit plans of the Company’s Internal Auditors and SGV & Co. We have also discussed the results of their audits and their assessment of the Company’s internal controls and the overall quality of the financial reporting process;
• We also reviewed the reports of the Internal Auditors, ensuring that management is taking appropriate corrective actions in a timely manner, including addressing internal controls and compliance issues. All the activities conducted by Internal Audit were conducted in conformance with the International Standards for the Professional Practice of Internal Auditing. Based on the assurance provided by Internal Audit as well as SGV & Co., as a result of their activities, the Committee assessed that the Company’s systems of internal controls, risk management and governance processes are adequate.
• We reviewed and approved all audit services provided by SGV & Co. to
Cebu Holdings, Inc. and related fees for such services.
Based on the reviews and discussions undertaken, and subject to the limitations on our roles and responsibilities referred to above, the Audit Committee recommended to the Board of Directors the inclusion of the Company’s consolidated financial statements as of and for the year ended December 31, 2016 in the Company’s Annual Report to the Stockholders and for filing with the Securities and Exchange Commission. February 8, 2016
FR. RODERICK C. SALAZAR, JR., SVD Committee Chairman
CONSUL ENRIQUE L. BENEDICTO JUSTICE PAMPIO A. ABARINTOS (RET) Committee Member Committee Member
Cebu Holdings, Inc. 2017 Integrated Report144
Report o f the Risk Overs ight Commit tee to the Board of D i rectorsFor the Year Ended December 31, 2017
As Risk Committee members, our roles and responsibilities are defined in the Risk Oversight Committee
Charter approved by the Board of Directors. We assist the Board in the performance of its oversight
functions of the Company’s risk management activities through continuous input, evaluation and feedback on
the effectiveness of the Company’s risk management process.
In compliance with the Risk Oversight Committee Charter, we confirm that:
An independent director chairs the Committee. All members of the Committee are independent
directors.
We had four (4) meetings in 2017, with the following attendance rate:
Committee Member No. of Meetings
Attended/Held
Percent
Present
Enrique L. Benedicto (Chairman) 4/4 100%
Fr.Roderick C. Salazar, Jr., SVD 4/4 100%
Pampio A. Abarintos 4/4 100%
We reviewed and revised the Committee’s Charter and endorsed the same for the approval of the
Board of Directors.
We reviewed and discussed the adequacy of the Company’s Enterprise-wide Risk Management
(ERM) Process, including the major risk exposures, the related risk mitigation efforts and
initiatives, and the status of risk mitigation plans. The review was undertaken in the context that
management is primarily responsible for the risk management process.
Based on the reviews and discussions undertaken, and subject to the limitations on our roles and
responsibilities referred to above, the Risk Oversight Committee has been assured that activities are
undertaken by the Company to monitor its key risks and to ensure that management is taking appropriate
actions to mitigate the impact of these key risks. Furthermore, the Committee recommends the inclusion of
this report in the Company’s Annual Report to the Stockholders.
February 13, 2018
CEBU HOLDINGS, INC AND SUBSIDIARIESREPORT OF THE RISK OVERSIGHT COMMITTEE TOTHE BOARD OF DIRECTORS
Report o f the Risk Overs ight Commit tee to the Board of D i rectorsFor the Year Ended December 31, 2017
As Risk Committee members, our roles and responsibilities are defined in the Risk Oversight Committee
Charter approved by the Board of Directors. We assist the Board in the performance of its oversight
functions of the Company’s risk management activities through continuous input, evaluation and feedback on
the effectiveness of the Company’s risk management process.
In compliance with the Risk Oversight Committee Charter, we confirm that:
An independent director chairs the Committee. All members of the Committee are independent
directors.
We had four (4) meetings in 2017, with the following attendance rate:
Committee Member No. of Meetings
Attended/Held
Percent
Present
Enrique L. Benedicto (Chairman) 4/4 100%
Fr.Roderick C. Salazar, Jr., SVD 4/4 100%
Pampio A. Abarintos 4/4 100%
We reviewed and revised the Committee’s Charter and endorsed the same for the approval of the
Board of Directors.
We reviewed and discussed the adequacy of the Company’s Enterprise-wide Risk Management
(ERM) Process, including the major risk exposures, the related risk mitigation efforts and
initiatives, and the status of risk mitigation plans. The review was undertaken in the context that
management is primarily responsible for the risk management process.
Based on the reviews and discussions undertaken, and subject to the limitations on our roles and
responsibilities referred to above, the Risk Oversight Committee has been assured that activities are
undertaken by the Company to monitor its key risks and to ensure that management is taking appropriate
actions to mitigate the impact of these key risks. Furthermore, the Committee recommends the inclusion of
this report in the Company’s Annual Report to the Stockholders.
February 13, 2018
CONSUL ENRIQUE L. BENEDICTOCommittee Chairman
FR. RODERICK C. SALAZAR, JR., SVD JUSTICE PAMPIO A. ABARINTOS (RET.) Committee Member Committee Member
CONSUL ENRIQUE L. BENEDICTOCommittee Chairman
FR. RODERICK C. SALAZAR, JR., SVD JUSTICE PAMPIO A. ABARINTOS (RET.) Committee Member Committee Member
2052016 Annual and Sustainability Report FINANCIAL REPORT
CEBU HOLDINGS, INC AND SUBSIDIARIESREPORT OF THE RISK COMMITTEE TO THE BOARD OF DIRECTORS
Report of the Risk Committee to the Board of Directors
For the Year Ended December 31, 2016 As Risk Committee members, our roles and responsibilities are defined in the Risk Committee Charter approved by the Board of Directors. We assist the Board in the performance of its oversight functions of the Company’s risk management activities through continuous input, evaluation and feedback on the effectiveness of the Company’s risk management process. In compliance with the Risk Committee Charter, we confirm that:
• An independent director chairs the Risk Committee. All members of the Committee are independent directors.
• We had four (4) meetings in 2016, with the following attendance rate:
Committee Member No. of
Meetings Attended/Held
Percent Present
Enrique L. Benedicto (Chairman) 2/4 50%
Fr.Roderick C. Salazar, Jr., SVD 4/4 100%
Pampio A. Abarintos 4/4 100% • We reviewed and discussed the adequacy of the Company’s Enterprise-wide
Risk Management (ERM) Process, including the major risk exposures, the related risk mitigation efforts and initiatives, and the status of risk mitigation plans. The review was undertaken in the context that management is primarily responsible for the risk management process.
Based on the reviews and discussions undertaken, and subject to the limitations on our roles and responsibilities referred to above, the Risk Committee has been assured that activities are undertaken by the Company to monitor its key risks and to ensure that management is taking appropriate actions to mitigate the impact of these key risks. February 8, 2016
CONSUL ENRIQUE L. BENEDICTO Committee Chairman
FR. RODERICK C. SALAZAR, JR., SVD JUSTICE PAMPIO A. ABARINTOS (RET.)
Committee Member Committee Member
FARTHER AND FASTER 145
CEBU HOLDINGS, INC AND SUBSIDIARIES
INDEPENDENT AUDITOR’S REPORT
The Stockholders and Board of DirectorsCebu Holdings, Inc. and Subsidiaries20th Floor, Ayala Center Cebu Tower, Bohol StreetCebu Business Park, Cebu City
Opinion
We have audited the consolidated financial statements of Cebu Holdings, Inc. (the “Parent Company”)and its subsidiaries (collectively referred to as the “Group”), which comprise the consolidatedstatements of financial position as at December31,2017 and 2016, and the consolidated statements ofincome, consolidated statements of comprehensive income, consolidated statements of changes inequity and consolidated statements of cash flows for each of the three years in the period endedDecember31,2017, and notes to the consolidated financial statements, including a summary ofsignificant accounting policies.
In our opinion, the accompanying consolidated financial statements present fairly, in all materialrespects, the consolidated financial position of the Group as at December31,2017 and 2016, and theirconsolidated financial performance and their cash flows for each of the three years in the period endedDecember31,2017 in accordance with Philippine Financial Reporting Standards (PFRSs).
Basis for Opinion
We conducted our audits in accordance with Philippine Standards on Auditing (PSAs). Ourresponsibilities under those standards are further described in the Auditor’s Responsibilities for theAudit of the Consolidated Financial Statements section of our report. We are independent of the Groupin accordance with the Code of Ethics for Professional Accountants in the Philippines (Code of Ethics)together with the ethical requirements that are relevant to our audit of the consolidated financialstatements in the Philippines, and we have fulfilled our other ethical responsibilities in accordance withthese requirements and the Code of Ethics. We believe that the audit evidence we have obtained issufficient and appropriate to provide a basis for our opinion.
Key Audit Matters
Key audit matters are those matters that, in our professional judgment, were of most significance in ouraudit of the consolidated financial statements of the current period. These matters were addressed inthe context of our audit of the consolidated financial statements as a whole, and in forming our opinionthereon, and we do not provide a separate opinion on these matters. For the matter below, ourdescription of how our audit addressed the matter is provided in that context.
We have fulfilled the responsibilities described in the Auditor’s Responsibilities for the Audit of theConsolidated Financial Statements section of our report, including in relation to these matters.Accordingly, our audits included the performance of procedures designed to respond to ourassessment of the risks of material misstatement of the consolidated financial statements. The results ofour audit procedures, including the procedures performed to address the matter below, provide thebasis for our audit opinion on the accompanying consolidated financial statements.
Provisions and Contingencies
As disclosed in Note 33 to the consolidated financial statements, the Group is currently involved in alegal proceeding. This matter is significant to our audit because the recognition and measurement ofprovision related to this legal proceeding require significant judgment by management.
Audit response
We discussed the status of the legal proceeding with the management and the Group’s external legalcounsel for the status of the legal proceeding and obtained opinions of their external legal counsel. Wereviewed management’s assessment on the possible outcome of the legal proceeding and the need torecognize any provision based on the status of the case and considering relevant local rules andregulations.
Recognition of Real Estate Revenue and Costs
The Group is involved in real estate project developments for which it applies the percentage ofcompletion (POC) method in determining real estate revenue and costs. The POC is based on thephysical proportion of work and the cost of sales is determined based on the estimated projectdevelopment costs applied with the project’s POC. The assessment process for the POC and theestimated project development costs requires technical determination by management’s specialists(project engineers). In addition, the Group requires a certain percentage of buyer’s payments of totalselling price (buyer’s equity), to be collected as one of the criteria in order to initiate revenuerecognition. It is the reaching of this level of collection that management has assessed that it isprobable that economic benefits will flow to the Group because of the buyer’s continuing commitmentwith the sales agreement. This matter is significant to our audit because the assessment of the stage ofcompletion, total estimated project development costs and the level of buyer’s equity involvessignificant management judgment.
Refer to Notes 2 and 3 to the consolidated financial statements for the disclosures on revenuerecognition.
Audit response
We obtained an understanding of the Group’s process for determining the POC, including the costaccumulation process, and for determining and updating the total estimated project developmentcosts, and performed tests of the relevant controls. We obtained the certified POC reports prepared bythe project engineers and assessed the competence and objectivity of the project engineers byreference to their qualifications, experience and reporting responsibilities. We traced cost accumulatedto the supporting documents such as invoices. We compared the certified POC reports againstsupporting documents such as the accomplishment reports from the contractor. We performed test ofcomputation of the POC calculation of management. We conducted ocular inspection of the selectedproject, together with the project manager, and made relevant inquiries. We evaluated management’sbasis of the buyer’s equity by comparing this to the historical analysis of sales collections from buyerswith accumulated payments above the collection threshold. We traced the analysis to supportingdocuments. We obtained the project reserve memorandum approved by the Investment Committeeindicating the work breakdown structure and total project development costs as estimated by theproject engineers.
INDEPENDENT AUDITOR'S REPORT
Cebu Holdings, Inc. 2017 Integrated Report146
Provisions and Contingencies
As disclosed in Note 33 to the consolidated financial statements, the Group is currently involved in alegal proceeding. This matter is significant to our audit because the recognition and measurement ofprovision related to this legal proceeding require significant judgment by management.
Audit response
We discussed the status of the legal proceeding with the management and the Group’s external legalcounsel for the status of the legal proceeding and obtained opinions of their external legal counsel. Wereviewed management’s assessment on the possible outcome of the legal proceeding and the need torecognize any provision based on the status of the case and considering relevant local rules andregulations.
Recognition of Real Estate Revenue and Costs
The Group is involved in real estate project developments for which it applies the percentage ofcompletion (POC) method in determining real estate revenue and costs. The POC is based on thephysical proportion of work and the cost of sales is determined based on the estimated projectdevelopment costs applied with the project’s POC. The assessment process for the POC and theestimated project development costs requires technical determination by management’s specialists(project engineers). In addition, the Group requires a certain percentage of buyer’s payments of totalselling price (buyer’s equity), to be collected as one of the criteria in order to initiate revenuerecognition. It is the reaching of this level of collection that management has assessed that it isprobable that economic benefits will flow to the Group because of the buyer’s continuing commitmentwith the sales agreement. This matter is significant to our audit because the assessment of the stage ofcompletion, total estimated project development costs and the level of buyer’s equity involvessignificant management judgment.
Refer to Notes 2 and 3 to the consolidated financial statements for the disclosures on revenuerecognition.
Audit response
We obtained an understanding of the Group’s process for determining the POC, including the costaccumulation process, and for determining and updating the total estimated project developmentcosts, and performed tests of the relevant controls. We obtained the certified POC reports prepared bythe project engineers and assessed the competence and objectivity of the project engineers byreference to their qualifications, experience and reporting responsibilities. We traced cost accumulatedto the supporting documents such as invoices. We compared the certified POC reports againstsupporting documents such as the accomplishment reports from the contractor. We performed test ofcomputation of the POC calculation of management. We conducted ocular inspection of the selectedproject, together with the project manager, and made relevant inquiries. We evaluated management’sbasis of the buyer’s equity by comparing this to the historical analysis of sales collections from buyerswith accumulated payments above the collection threshold. We traced the analysis to supportingdocuments. We obtained the project reserve memorandum approved by the Investment Committeeindicating the work breakdown structure and total project development costs as estimated by theproject engineers.
Other Information
Management is responsible for the other information. The other information comprises the informationincluded in the SECForm20-IS (Definitive Information Statement), SECForm17-A and Annual Reportfor the year ended December31,2017, but does not include the consolidated financial statements andour auditor’s report thereon. The SECForm20-IS (Definitive Information Statement), SECForm17-A andAnnual Report for the year ended December31,2017 are expected to be made available to us after thedate of this auditor’s report.
Our opinion on the consolidated financial statements does not cover the other information and we willnot express any form of assurance conclusion thereon.
In connection with our audits of the consolidated financial statements, our responsibility is to read theother information identified above when it becomes available and, in doing so, consider whether theother information is materially inconsistent with the consolidated financial statements or ourknowledge obtained in the audits, or otherwise appears to be materially misstated.
Responsibilities of Management and Those Charged with Governance for the ConsolidatedFinancial Statements
Management is responsible for the preparation and fair presentation of the consolidated financialstatements in accordance with PFRSs, and for such internal control as management determines isnecessary to enable the preparation of consolidated financial statements that are free from materialmisstatement, whether due to fraud or error.
In preparing the consolidated financial statements, management is responsible for assessing theGroup’s ability to continue as a going concern, disclosing, as applicable, matters related to goingconcern and using the going concern basis of accounting unless management either intends toliquidate the Group or to cease operations, or has no realistic alternative but to do so.
Those charged with governance are responsible for overseeing the Group’s financial reporting process.
Auditor’s Responsibilities for the Audit of the Consolidated Financial Statements
Our objectives are to obtain reasonable assurance about whether the consolidated financial statementsas a whole are free from material misstatement, whether due to fraud or error, and to issue an auditor’sreport that includes our opinion. Reasonable assurance is a high level of assurance, but is not aguarantee that an audit conducted in accordance with PSAs will always detect a material misstatementwhen it exists. Misstatements can arise from fraud or error and are considered material if, individually orin the aggregate, they could reasonably be expected to influence the economic decisions of users takenon the basis of these consolidated financial statements.
As part of an audit in accordance with PSAs, we exercise professional judgment and maintainprofessional skepticism throughout the audit. We also:
· Identify and assess the risks of material misstatement of the consolidated financial statements,whether due to fraud or error, design and perform audit procedures responsive to those risks, andobtain audit evidence that is sufficient and appropriate to provide a basis for our opinion. The risk ofnot detecting a material misstatement resulting from fraud is higher than for one resulting fromerror, as fraud may involve collusion, forgery, intentional omissions, misrepresentations, or theoverride of internal control.
FARTHER AND FASTER 147
· Obtain an understanding of internal control relevant to the audit in order to design auditprocedures that are appropriate in the circumstances, but not for the purpose of expressing anopinion on the effectiveness of the Group’s internal control.
· Evaluate the appropriateness of accounting policies used and the reasonableness of accountingestimates and related disclosures made by management.
· Conclude on the appropriateness of management’s use of the going concern basis of accountingand, based on the audit evidence obtained, whether a material uncertainty exists related to eventsor conditions that may cast significant doubt on the Group’s ability to continue as a going concern.If we conclude that a material uncertainty exists, we are required to draw attention in our auditor’sreport to the related disclosures in the consolidated financial statements or, if such disclosures areinadequate, to modify our opinion. Our conclusions are based on the audit evidence obtained up tothe date of our auditor’s report. However, future events or conditions may cause the Group to ceaseto continue as a going concern.
· Evaluate the overall presentation, structure and content of the consolidated financial statements,including the disclosures, and whether the consolidated financial statements represent theunderlying transactions and events in a manner that achieves fair presentation.
· Obtain sufficient appropriate audit evidence regarding the financial information of the entities orbusiness activities within the Group to express an opinion on the consolidated financial statements.We are responsible for the direction, supervision and performance of the group audit. We remainsolely responsible for our audit opinion.
We communicate with those charged with governance regarding, among other matters, the plannedscope and timing of the audit and significant audit findings, including any significant deficiencies ininternal control that we identify during our audit.
We also provide those charged with governance with a statement that we have complied with relevantethical requirements regarding independence, and to communicate with them all relationships andother matters that may reasonably be thought to bear on our independence, and where applicable,related safeguards.
From the matters communicated with those charged with governance, we determine those mattersthat were of most significance in the audit of the consolidated financial statements of the currentperiod and are therefore the key audit matters. We describe these matters in our auditor’s report unlesslaw or regulation precludes public disclosure about the matter or when, in extremely rarecircumstances, we determine that a matter should not be communicated in our report because theadverse consequences of doing so would reasonably be expected to outweigh the public interestbenefits of such communication.
Other Information
Management is responsible for the other information. The other information comprises the informationincluded in the SECForm20-IS (Definitive Information Statement), SECForm17-A and Annual Reportfor the year ended December31,2017, but does not include the consolidated financial statements andour auditor’s report thereon. The SECForm20-IS (Definitive Information Statement), SECForm17-A andAnnual Report for the year ended December31,2017 are expected to be made available to us after thedate of this auditor’s report.
Our opinion on the consolidated financial statements does not cover the other information and we willnot express any form of assurance conclusion thereon.
In connection with our audits of the consolidated financial statements, our responsibility is to read theother information identified above when it becomes available and, in doing so, consider whether theother information is materially inconsistent with the consolidated financial statements or ourknowledge obtained in the audits, or otherwise appears to be materially misstated.
Responsibilities of Management and Those Charged with Governance for the ConsolidatedFinancial Statements
Management is responsible for the preparation and fair presentation of the consolidated financialstatements in accordance with PFRSs, and for such internal control as management determines isnecessary to enable the preparation of consolidated financial statements that are free from materialmisstatement, whether due to fraud or error.
In preparing the consolidated financial statements, management is responsible for assessing theGroup’s ability to continue as a going concern, disclosing, as applicable, matters related to goingconcern and using the going concern basis of accounting unless management either intends toliquidate the Group or to cease operations, or has no realistic alternative but to do so.
Those charged with governance are responsible for overseeing the Group’s financial reporting process.
Auditor’s Responsibilities for the Audit of the Consolidated Financial Statements
Our objectives are to obtain reasonable assurance about whether the consolidated financial statementsas a whole are free from material misstatement, whether due to fraud or error, and to issue an auditor’sreport that includes our opinion. Reasonable assurance is a high level of assurance, but is not aguarantee that an audit conducted in accordance with PSAs will always detect a material misstatementwhen it exists. Misstatements can arise from fraud or error and are considered material if, individually orin the aggregate, they could reasonably be expected to influence the economic decisions of users takenon the basis of these consolidated financial statements.
As part of an audit in accordance with PSAs, we exercise professional judgment and maintainprofessional skepticism throughout the audit. We also:
· Identify and assess the risks of material misstatement of the consolidated financial statements,whether due to fraud or error, design and perform audit procedures responsive to those risks, andobtain audit evidence that is sufficient and appropriate to provide a basis for our opinion. The risk ofnot detecting a material misstatement resulting from fraud is higher than for one resulting fromerror, as fraud may involve collusion, forgery, intentional omissions, misrepresentations, or theoverride of internal control.
Cebu Holdings, Inc. 2017 Integrated Report148
· Obtain an understanding of internal control relevant to the audit in order to design auditprocedures that are appropriate in the circumstances, but not for the purpose of expressing anopinion on the effectiveness of the Group’s internal control.
· Evaluate the appropriateness of accounting policies used and the reasonableness of accountingestimates and related disclosures made by management.
· Conclude on the appropriateness of management’s use of the going concern basis of accountingand, based on the audit evidence obtained, whether a material uncertainty exists related to eventsor conditions that may cast significant doubt on the Group’s ability to continue as a going concern.If we conclude that a material uncertainty exists, we are required to draw attention in our auditor’sreport to the related disclosures in the consolidated financial statements or, if such disclosures areinadequate, to modify our opinion. Our conclusions are based on the audit evidence obtained up tothe date of our auditor’s report. However, future events or conditions may cause the Group to ceaseto continue as a going concern.
· Evaluate the overall presentation, structure and content of the consolidated financial statements,including the disclosures, and whether the consolidated financial statements represent theunderlying transactions and events in a manner that achieves fair presentation.
· Obtain sufficient appropriate audit evidence regarding the financial information of the entities orbusiness activities within the Group to express an opinion on the consolidated financial statements.We are responsible for the direction, supervision and performance of the group audit. We remainsolely responsible for our audit opinion.
We communicate with those charged with governance regarding, among other matters, the plannedscope and timing of the audit and significant audit findings, including any significant deficiencies ininternal control that we identify during our audit.
We also provide those charged with governance with a statement that we have complied with relevantethical requirements regarding independence, and to communicate with them all relationships andother matters that may reasonably be thought to bear on our independence, and where applicable,related safeguards.
From the matters communicated with those charged with governance, we determine those mattersthat were of most significance in the audit of the consolidated financial statements of the currentperiod and are therefore the key audit matters. We describe these matters in our auditor’s report unlesslaw or regulation precludes public disclosure about the matter or when, in extremely rarecircumstances, we determine that a matter should not be communicated in our report because theadverse consequences of doing so would reasonably be expected to outweigh the public interestbenefits of such communication.
The engagement partner on the audit resulting in this independent auditor’s report is Dolmar C.Montañez.
SYCIP GORRES VELAYO & CO.
Dolmar C. MontañezPartnerCPA Certificate No. 112004SEC Accreditation No. 1561-A (Group A), April 21, 2016, valid until April 21, 2019Tax Identification No. 925-713-249-000BIR Accreditation 08-001998-119-2016 February 15, 2016, valid until February 15, 2019PTR No. 6621303, January 9, 2018, Makati City
February 26, 2018
FARTHER AND FASTER 149
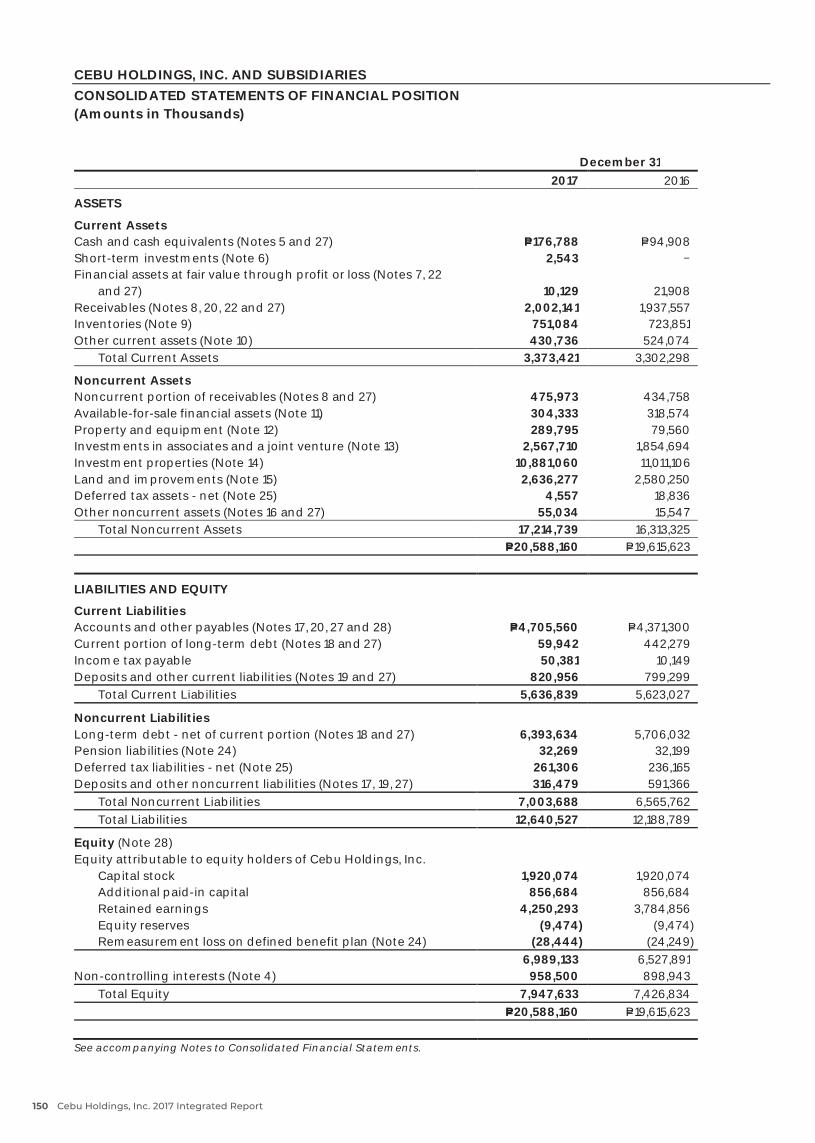
CEBU HOLDINGS, INC. AND SUBSIDIARIESCONSOLIDATED STATEMENTS OF FINANCIAL POSITION(Amounts in Thousands)
December 312017 2016
ASSETS
Current AssetsCash and cash equivalents (Notes 5 and 27) P=176,788 P=94,908Short-term investments (Note 6) 2,543 Financial assets at fair value through profit or loss (Notes7, 22
and27) 10,129 21,908Receivables (Notes 8, 20, 22 and 27) 2,002,141 1,937,557Inventories (Note 9) 751,084 723,851Other current assets (Note 10) 430,736 524,074
Total Current Assets 3,373,421 3,302,298
Noncurrent AssetsNoncurrent portion of receivables (Notes8 and 27) 475,973 434,758Available-for-sale financial assets (Note 11) 304,333 318,574Property and equipment (Note 12) 289,795 79,560Investments in associates and a joint venture (Note 13) 2,567,710 1,854,694Investment properties (Note 14) 10,881,060 11,011,106Land and improvements (Note 15) 2,636,277 2,580,250Deferred tax assets - net (Note 25) 4,557 18,836Other noncurrent assets (Notes 16 and 27) 55,034 15,547
Total Noncurrent Assets 17,214,739 16,313,325P=20,588,160 P=19,615,623
LIABILITIES AND EQUITY
Current LiabilitiesAccounts and other payables (Notes17,20,27and 28) P=4,705,560 P=4,371,300Current portion of long-term debt (Notes18and27) 59,942 442,279Income tax payable 50,381 10,149Deposits and other current liabilities (Notes 19 and 27) 820,956 799,299
Total Current Liabilities 5,636,839 5,623,027
Noncurrent LiabilitiesLong-term debt - net of current portion (Notes18and27) 6,393,634 5,706,032Pension liabilities (Note 24) 32,269 32,199Deferred tax liabilities - net (Note 25) 261,306 236,165Deposits and other noncurrent liabilities (Notes 17, 19, 27) 316,479 591,366
Total Noncurrent Liabilities 7,003,688 6,565,762Total Liabilities 12,640,527 12,188,789
Equity (Note 28)Equity attributable to equity holders of CebuHoldings, Inc.
Capital stock 1,920,074 1,920,074Additional paid-in capital 856,684 856,684Retained earnings 4,250,293 3,784,856Equity reserves (9,474) (9,474)Remeasurement loss on defined benefit plan (Note 24) (28,444) (24,249)
6,989,133 6,527,891Non-controlling interests (Note 4) 958,500 898,943
Total Equity 7,947,633 7,426,834P=20,588,160 P=19,615,623
See accompanying Notes to Consolidated Financial Statements.
Cebu Holdings, Inc. 2017 Integrated Report150
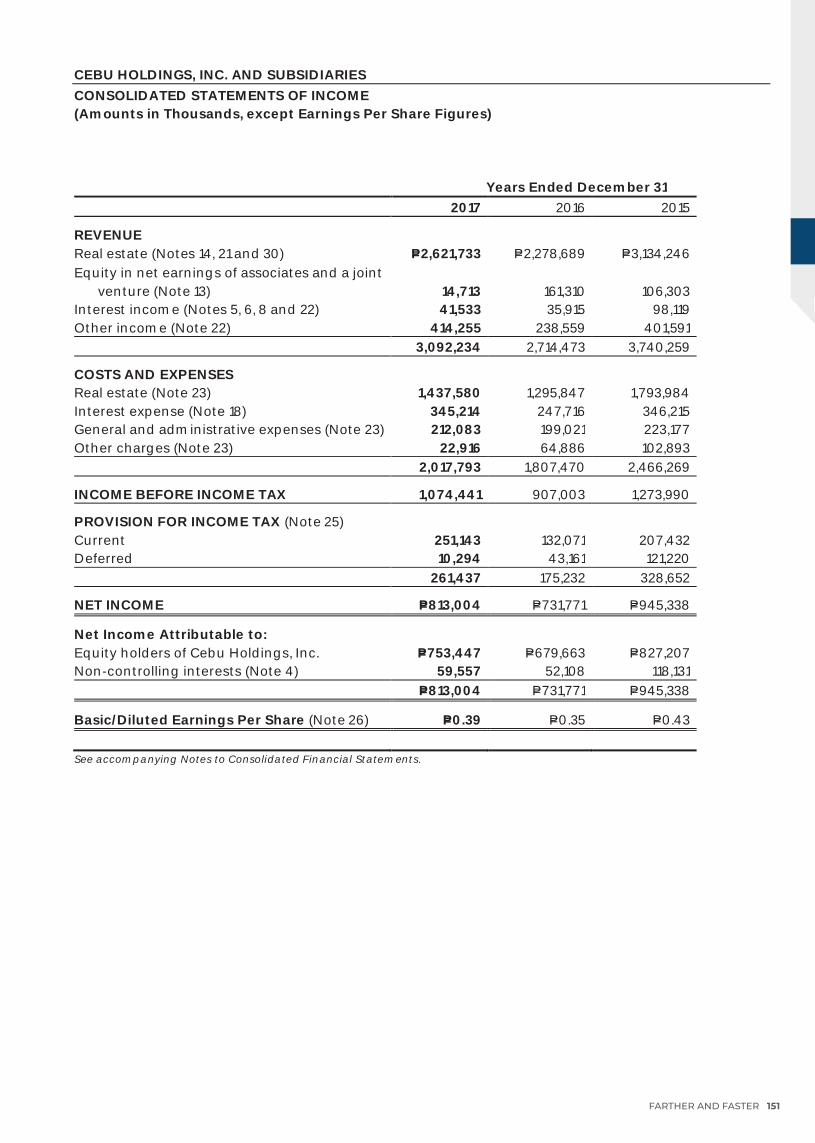
CEBU HOLDINGS, INC. AND SUBSIDIARIESCONSOLIDATED STATEMENTS OF INCOME(Amounts in Thousands, except Earnings Per Share Figures)
Years Ended December 312017 2016 2015
REVENUEReal estate (Notes 14, 21 and 30) P=2,621,733 P=2,278,689 P=3,134,246Equity in net earnings of associates and a joint
venture (Note13) 14,713 161,310 106,303Interest income (Notes 5, 6, 8 and 22) 41,533 35,915 98,119Other income (Note 22) 414,255 238,559 401,591
3,092,234 2,714,473 3,740,259
COSTS AND EXPENSESReal estate (Note23) 1,437,580 1,295,847 1,793,984Interest expense (Note 18) 345,214 247,716 346,215General and administrative expenses (Note23) 212,083 199,021 223,177Other charges (Note23) 22,916 64,886 102,893
2,017,793 1,807,470 2,466,269
INCOME BEFORE INCOME TAX 1,074,441 907,003 1,273,990
PROVISION FOR INCOME TAX (Note25)Current 251,143 132,071 207,432Deferred 10,294 43,161 121,220
261,437 175,232 328,652
NET INCOME P=813,004 P=731,771 P=945,338
Net Income Attributable to:Equity holders of Cebu Holdings, Inc. P=753,447 P=679,663 P=827,207Non-controlling interests (Note 4) 59,557 52,108 118,131
P=813,004 P=731,771 P=945,338
Basic/Diluted Earnings Per Share (Note26) P=0.39 P=0.35 P=0.43
See accompanying Notes to Consolidated Financial Statements.
FARTHER AND FASTER 151
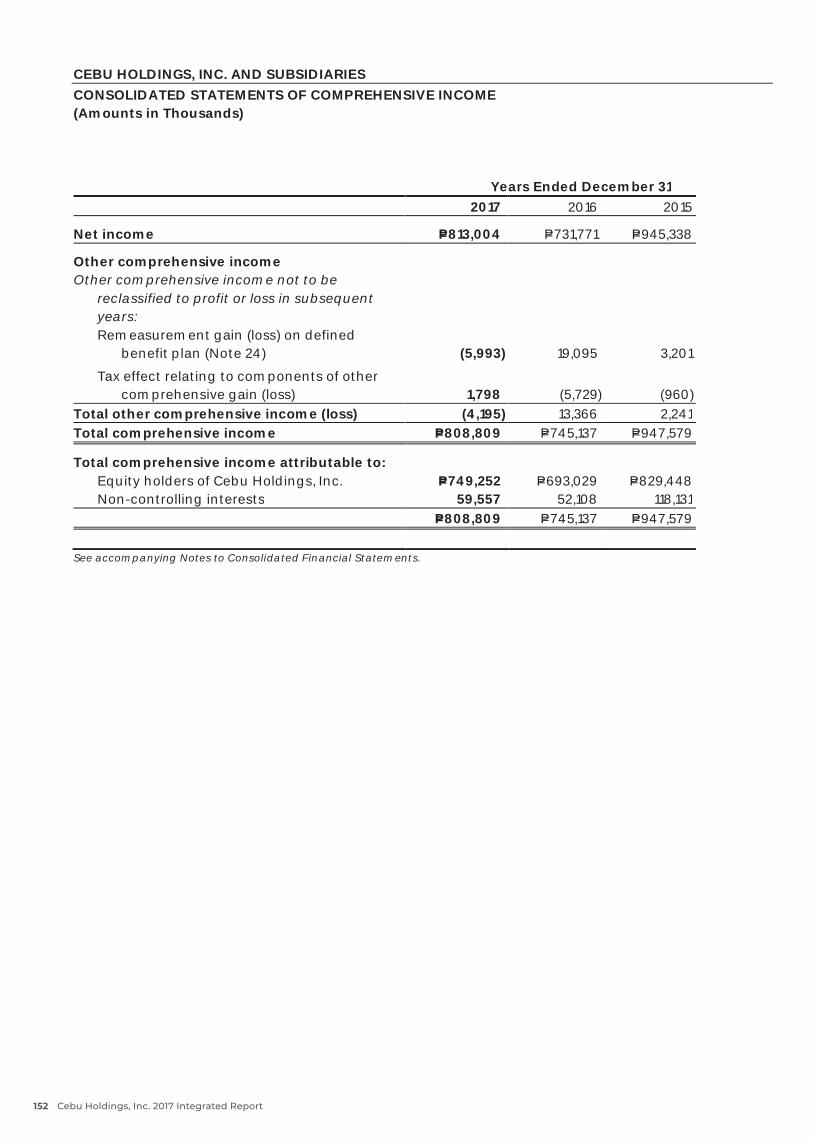
CEBU HOLDINGS, INC. AND SUBSIDIARIESCONSOLIDATED STATEMENTS OF COMPREHENSIVE INCOME(Amounts in Thousands)
Years Ended December 312017 2016 2015
Net income P=813,004 P=731,771 P=945,338
Other comprehensive incomeOther comprehensive income not to be
reclassified to profit or loss in subsequentyears:Remeasurement gain (loss) on defined
benefitplan (Note 24) (5,993) 19,095 3,201
Tax effect relating to components of othercomprehensive gain (loss) 1,798 (5,729) (960)
Total other comprehensive income (loss) (4,195) 13,366 2,241Total comprehensive income P=808,809 P=745,137 P=947,579
Total comprehensive income attributable to:Equity holders of Cebu Holdings, Inc. P=749,252 P=693,029 P=829,448Non-controlling interests 59,557 52,108 118,131
P=808,809 P=745,137 P=947,579
See accompanying Notes to Consolidated Financial Statements.
Cebu Holdings, Inc. 2017 Integrated Report152
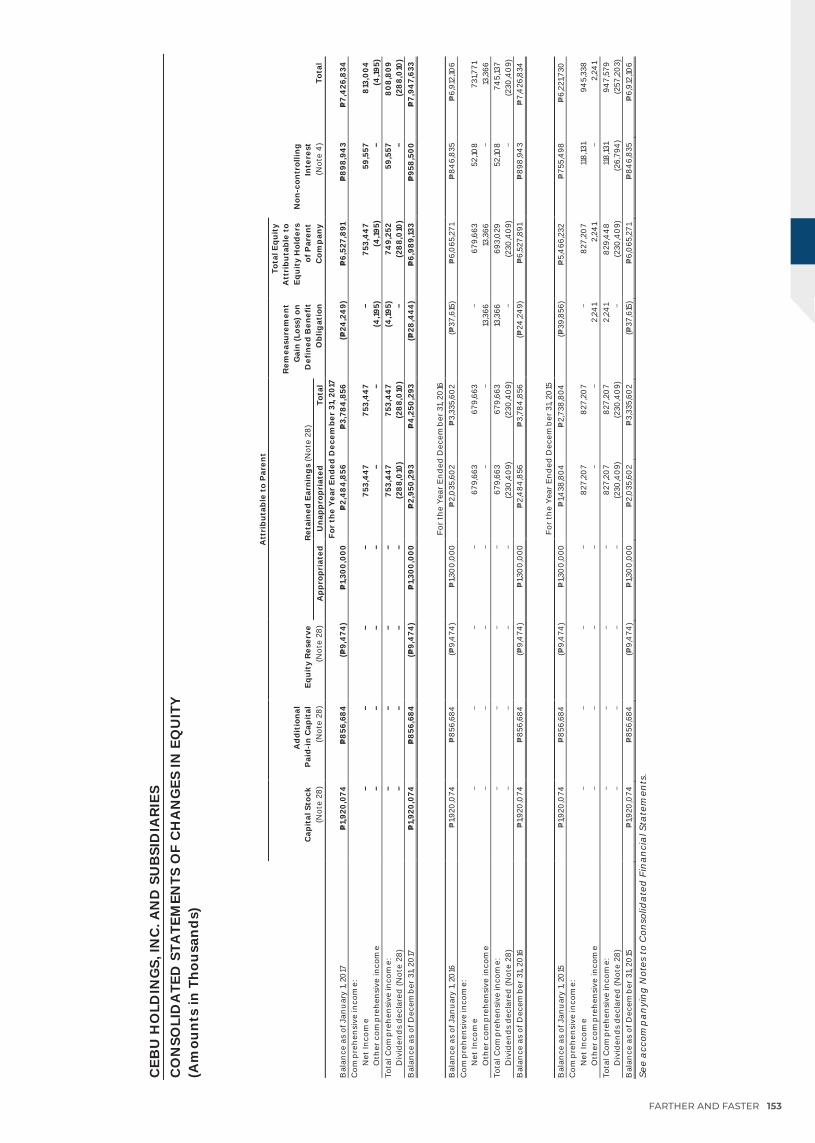
CE
BU
HO
LDIN
GS,
INC
. AN
D S
UB
SID
IAR
IES
CO
NSO
LID
ATE
D S
TATE
MEN
TS O
F C
HA
NG
ES IN
EQ
UIT
Y(A
mou
nts
in T
hou
san
ds)
Att
rib
uta
ble
to
Par
ent
Cap
ital
Sto
ck(N
ote
28)
Ad
dit
ion
alP
aid
-in
Cap
ital
(Not
e 28
)E
qu
ity
Res
erve
(Not
e 28
)R
etai
ned
Ear
nin
gs
(Not
e 28
)
Rem
easu
rem
ent
Gai
n (L
oss)
on
Def
ined
Ben
efit
Ob
ligat
ion
Tota
l Eq
uit
yA
ttri
bu
tab
le t
oE
qu
ity
Hol
der
sof
Par
ent
Com
pan
y
Non
-con
trol
ling
Inte
rest
(Not
e 4
)To
tal
Ap
pro
pri
ated
U
nap
pro
pri
ated
Tota
lFo
r th
e Y
ear
En
ded
Dec
embe
r 31
, 201
7B
alan
ce a
s of
Jan
uar
y 1,
2017
P=1,
920,
074
P=8
56,6
84
(P=9,
474
)P=
1,30
0,0
00
P=2,
484
,856
P=3,
784,
856
(P=24
,24
9)P=
6,52
7,8
91P=
898
,94
3P=
7,4
26,8
34C
omp
reh
ensi
ve in
com
e:N
et In
com
e
75
3,4
47
753,
44
7
753,
44
759
,557
813
,00
4O
ther
com
pre
hen
sive
inco
me
(4,19
5)(4
,195)
(4
,195)
Tota
l Com
pre
hen
sive
inco
me:
753,
44
775
3,4
47
(4,19
5)74
9,25
259
,557
80
8,8
09
Div
iden
ds
dec
lare
d (N
ote
28)
(28
8,0
10)
(28
8,0
10)
(2
88,
010
)
(28
8,0
10)
Bal
ance
as
of D
ecem
ber
31,
2017
P=1,
920,
074
P=8
56,6
84
(P=9,
474
)P=
1,30
0,0
00
P=2,
950
,293
P=4
,250
,293
(P=28
,44
4)
P=6,
989,
133
P=95
8,5
00
P=7,
947,
633
For
the
Yea
r E
nd
ed D
ecem
ber
31,
2016
Bal
ance
as
of J
anu
ary
1, 20
16P=
1,920
,074
P=85
6,68
4(P=
9,4
74)
P=1,3
00
,000
P=2,
035
,60
2P=
3,33
5,60
2(P=
37,6
15)
P=6,
065
,271
P=84
6,83
5P=
6,91
2,10
6C
omp
reh
ensi
ve in
com
e:N
et In
com
e
67
9,66
367
9,66
3
679,
663
52,10
873
1,771
Oth
er c
omp
reh
ensi
ve in
com
e
13
,366
13,3
66
13,3
66To
tal C
omp
reh
ensi
ve in
com
e:
67
9,66
367
9,66
313
,366
693,
029
52,10
874
5,13
7D
ivid
end
s d
ecla
red
(Not
e 28
)
(2
30,4
09)
(230
,40
9)
(230
,40
9)
(230
,40
9)B
alan
ce a
s of
Dec
emb
er 3
1, 20
16P=
1,920
,074
P=85
6,68
4(P=
9,4
74)
P=1,3
00
,000
P=2,
484
,856
P=3,
784
,856
(P=24
,24
9)P=
6,52
7,89
1P=
898,
943
P=7,
426
,834
For
the
Yea
r E
nd
ed D
ecem
ber
31,
2015
Bal
ance
as
of J
anu
ary
1, 20
15P=
1,920
,074
P=85
6,68
4(P=
9,4
74)
P=1,3
00
,000
P=1,4
38,8
04
P=2,
738,
804
(P=39
,856
)P=
5,4
66,2
32P=
755,
498
P=6,
221,7
30C
omp
reh
ensi
ve in
com
e:N
et In
com
e
82
7,20
782
7,20
7
827,
207
118,
131
945,
338
Oth
er c
omp
reh
ensi
ve in
com
e
2,
241
2,24
1
2,24
1To
tal C
omp
reh
ensi
ve in
com
e:
82
7,20
782
7,20
72,
241
829,
44
811
8,13
194
7,57
9D
ivid
end
s d
ecla
red
(Not
e 28
)
(2
30,4
09)
(230
,40
9)
(230
,40
9)(2
6,79
4)
(257
,20
3)B
alan
ce a
s of
Dec
emb
er 3
1, 20
15P=
1,920
,074
P=85
6,68
4(P=
9,4
74)
P=1,3
00
,000
P=2,
035
,60
2P=
3,33
5,60
2(P=
37,6
15)
P=6,
065
,271
P=84
6,83
5P=
6,91
2,10
6
See
acc
omp
an
yin
g N
otes
to
Con
solid
ate
d F
ina
nci
al S
tate
men
ts.
FARTHER AND FASTER 153
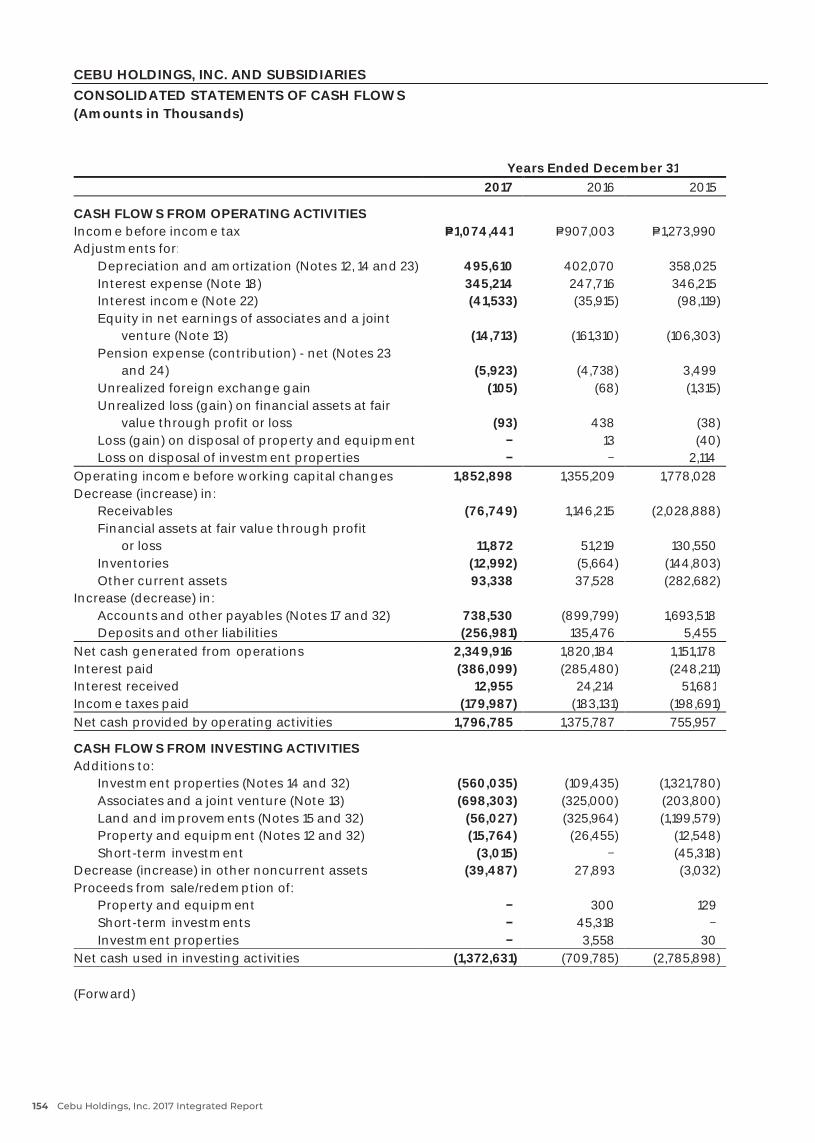
CEBU HOLDINGS, INC. AND SUBSIDIARIESCONSOLIDATED STATEMENTS OF CASH FLOWS(Amounts in Thousands)
Years Ended December 312017 2016 2015
CASH FLOWS FROM OPERATING ACTIVITIESIncome before income tax P=1,074,441 P=907,003 P=1,273,990Adjustments for:
Depreciation and amortization (Notes12,14and23) 495,610 402,070 358,025Interest expense (Note 18) 345,214 247,716 346,215Interest income (Note 22) (41,533) (35,915) (98,119)Equity in net earnings of associates and a joint
venture (Note13) (14,713) (161,310) (106,303)Pension expense (contribution) - net (Notes 23
and 24) (5,923) (4,738) 3,499Unrealized foreign exchange gain (105) (68) (1,315)Unrealized loss (gain) on financial assets at fair
value through profit or loss (93) 438 (38)Loss (gain) on disposal of property and equipment 13 (40)Loss on disposal of investment properties 2,114
Operating income before working capital changes 1,852,898 1,355,209 1,778,028Decrease (increase) in:
Receivables (76,749) 1,146,215 (2,028,888)Financial assets at fair value through profit
or loss 11,872 51,219 130,550Inventories (12,992) (5,664) (144,803)Other current assets 93,338 37,528 (282,682)
Increase (decrease) in:Accounts and other payables (Notes17and32) 738,530 (899,799) 1,693,518Deposits and other liabilities (256,981) 135,476 5,455
Net cash generated from operations 2,349,916 1,820,184 1,151,178Interest paid (386,099) (285,480) (248,211)Interest received 12,955 24,214 51,681Income taxes paid (179,987) (183,131) (198,691)Net cash provided by operating activities 1,796,785 1,375,787 755,957
CASH FLOWS FROM INVESTING ACTIVITIESAdditions to:
Investment properties (Notes 14 and 32) (560,035) (109,435) (1,321,780)Associates and a joint venture (Note13) (698,303) (325,000) (203,800)Land and improvements (Notes 15 and 32) (56,027) (325,964) (1,199,579)Property and equipment (Notes 12 and 32) (15,764) (26,455) (12,548)Short-term investment (3,015) (45,318)
Decrease (increase) in other noncurrent assets (39,487) 27,893 (3,032)Proceeds from sale/redemption of:
Property and equipment 300 129Short-term investments 45,318 Investment properties 3,558 30
Net cash used in investing activities (1,372,631) (709,785) (2,785,898)
(Forward)
Cebu Holdings, Inc. 2017 Integrated Report154
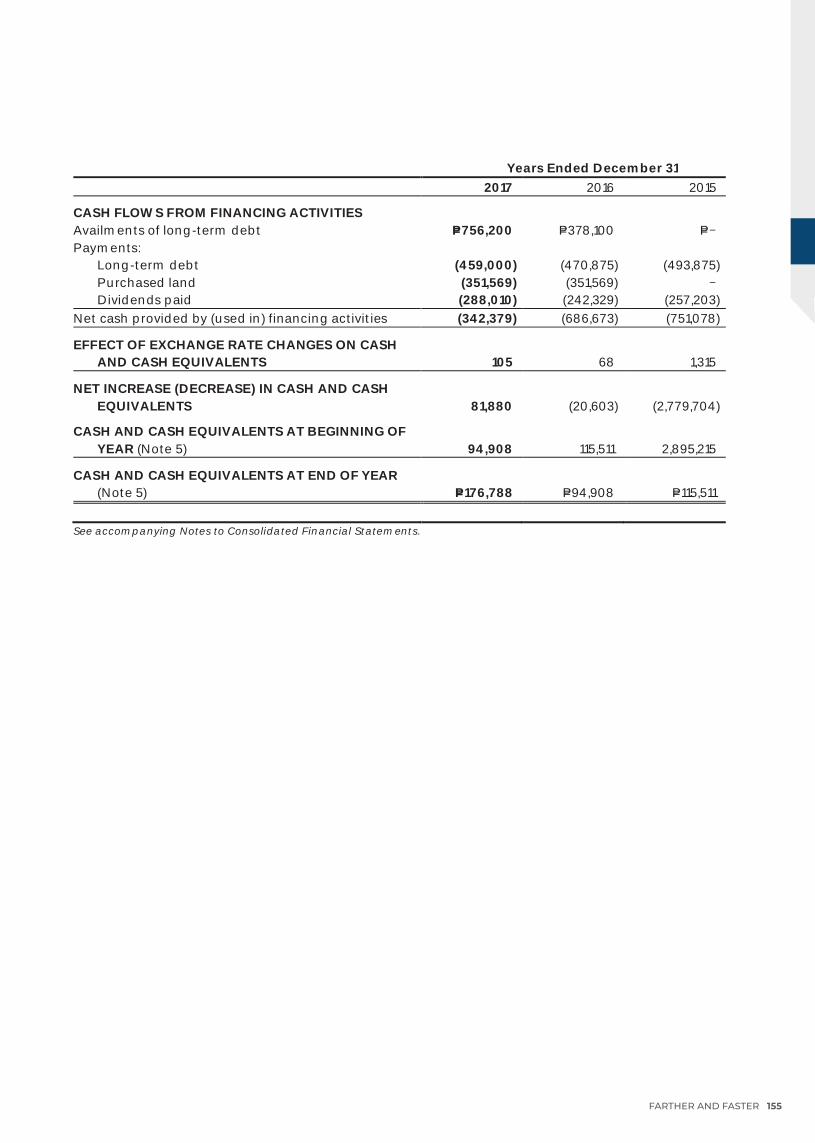
Years Ended December 312017 2016 2015
CASH FLOWS FROM FINANCING ACTIVITIESAvailments of long-term debt P=756,200 P=378,100 P= Payments:
Long-term debt (459,000) (470,875) (493,875)Purchased land (351,569) (351,569) Dividends paid (288,010) (242,329) (257,203)
Net cash provided by (used in) financing activities (342,379) (686,673) (751,078)
EFFECT OF EXCHANGE RATE CHANGES ON CASHAND CASH EQUIVALENTS 105 68 1,315
NET INCREASE (DECREASE) IN CASH AND CASHEQUIVALENTS 81,880 (20,603) (2,779,704)
CASH AND CASH EQUIVALENTS AT BEGINNING OFYEAR (Note 5) 94,908 115,511 2,895,215
CASH AND CASH EQUIVALENTS AT ENDOFYEAR(Note 5) P=176,788 P=94,908 P=115,511
See accompanying Notes to Consolidated Financial Statements.
FARTHER AND FASTER 155
CEBU HOLDINGS, INC. AND SUBSIDIARIESNOTES TO CONSOLIDATED FINANCIAL STATEMENTS
1. Group Information
Cebu Holdings, Inc. (the Parent Company) is domiciled and was incorporated on December 9, 1988in the Republic of the Philippines. The Parent Company is a 71.96%-owned subsidiary of Ayala Land,Inc. (ALI), a publicly listed company. ALI is a subsidiary of Ayala Corporation (AC), a publicly listedcompany which is 48.96%-owned by Mermac, Inc., 10.17%-owned by Mitsubishi Corporation and therest by public.
The Parent Company registered office address is at 20th Floor, Ayala Center Cebu Tower, BoholStreet, Cebu Business Park, Cebu City. The Parent Company is engaged in real estate development,sale of subdivided land, residential and office condominium units, sports club shares, and lease ofcommercial spaces.
The Parent Company’s shares of stock are publicly traded in the Philippine Stock Exchange (PSE).
Details on the Parent Company’s subsidiaries are as follows:
• Cebu Leisure Company, Inc. (CLCI), a wholly owned subsidiary, is engaged in subleasing ofcommercial spaces, food courts and entertainment facilities. The registered office address ofCLCI is at Admin Office, Level 4, Ayala Center Cebu, Cebu Business Park, Cebu City.
• CBP Theatre Management Company, Inc. (CBP Theatre), a wholly owned subsidiary, is engagedin all aspects of the theatrical and cinematographic entertainment business, including theatremanagement and other related undertakings. CBP Theatre has not yet started its operations asof December31, 2017.
• Cebu Property Ventures and Development Corporation (CPVDC), a partially-owned subsidiary, isengaged in real estate development and sale of subdivision land and residential units. Theshares of stocks of CPVDC are also publicly traded in the PSE. The registered office address ofCPVDC is at 20th Floor, Ayala Center Cebu Tower, Bohol Street, Cebu Business Park, Cebu City.
• Asian I-Office Properties, Inc. (AiO), wholly owned by CPVDC, is engaged in all aspects of realestate development and in leasing of corporate spaces. The registered office address of AiO is at20th Floor, Ayala Center Cebu Tower, Bohol Street, Cebu Business Park, Cebu City.
• Taft Punta Engaño Property Inc. (TPEPI), a partially-owned subsidiary, is engaged in real estatedevelopment of mixed-use commercial and residential district within a 12-hectare property inLapu-Lapu City. The registered office address of TPEPI is at Vicsal Bldg., cor. C.D. Seno & W.O.Seno Sts., San Miguel Extension, Barangay Guizo, North Reclamation Area, Mandaue City.
The consolidated financial statements of Cebu Holdings Inc. and its subsidiaries (the Group) as ofDecember 31, 2017 and 2016 and for each of the three years in the period ended December 31, 2017were endorsed for approval by the Audit and Risk Committee on February 13, 2018 and wereapproved and authorized for issue by the Board of Directors (BOD) on February 26, 2018.
Cebu Holdings, Inc. 2017 Integrated Report156
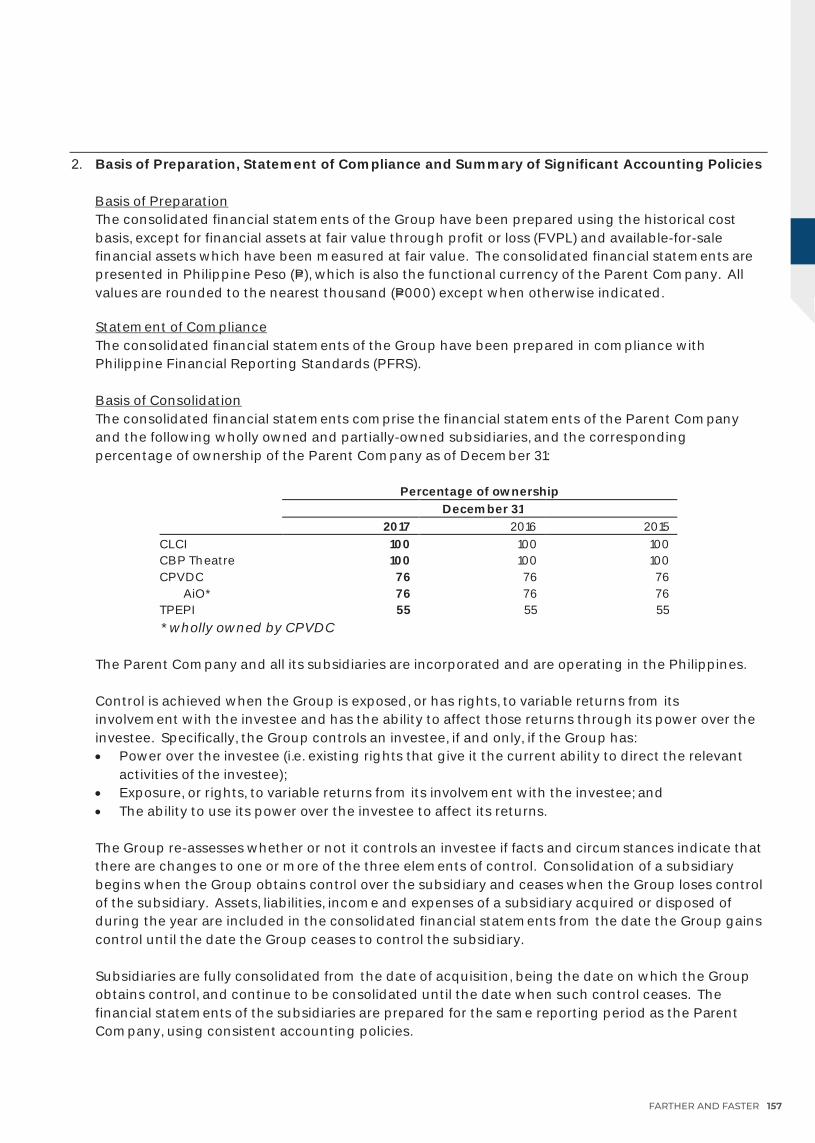
- 2 -
2. Basis of Preparation, Statement of Compliance and Summary of Significant Accounting Policies
Basis of PreparationThe consolidated financial statements of the Group have been prepared using the historical costbasis, except for financial assets at fair value through profit or loss (FVPL) and available-for-salefinancial assets which have been measured at fair value. The consolidated financial statements arepresented in Philippine Peso (P=), which is also the functional currency of the Parent Company. Allvalues are rounded to the nearest thousand (P=000) except when otherwise indicated.
Statement of ComplianceThe consolidated financial statements of the Group have been prepared in compliance withPhilippine Financial Reporting Standards (PFRS).
Basis of ConsolidationThe consolidated financial statements comprise the financial statements of the Parent Companyand the following wholly owned and partially-owned subsidiaries, and the correspondingpercentage of ownership of the Parent Company as of December31:
Percentage of ownershipDecember 31
2017 2016 2015CLCI 100 100 100CBP Theatre 100 100 100CPVDC 76 76 76
AiO* 76 76 76TPEPI 55 55 55
* wholly owned by CPVDC
The Parent Company and all its subsidiaries are incorporated and are operating in the Philippines.
Control is achieved when the Group is exposed, or has rights, to variable returns from itsinvolvement with the investee and has the ability to affect those returns through its power over theinvestee. Specifically, the Group controls an investee, if and only, if the Group has:• Power over the investee (i.e. existing rights that give it the current ability to direct the relevant
activities of the investee);• Exposure, or rights, to variable returns from its involvement with the investee; and• The ability to use its power over the investee to affect its returns.
The Group re-assesses whether or not it controls an investee if facts and circumstances indicate thatthere are changes to one or more of the three elements of control. Consolidation of a subsidiarybegins when the Group obtains control over the subsidiary and ceases when the Group loses controlof the subsidiary. Assets, liabilities, income and expenses of a subsidiary acquired or disposed ofduring the year are included in the consolidated financial statements from the date the Group gainscontrol until the date the Group ceases to control the subsidiary.
Subsidiaries are fully consolidated from the date of acquisition, being the date on which the Groupobtains control, and continue to be consolidated until the date when such control ceases. Thefinancial statements of the subsidiaries are prepared for the same reporting period as the ParentCompany, using consistent accounting policies.
FARTHER AND FASTER 157
- 3 -
All intra-group balances and transactions, including income, expenses and dividends relating totransactions between members of the Group, are eliminated in full on consolidation.
Non-controlling interests (NCI) represent the portion of profit or loss and net assets in subsidiariesnot wholly owned by the Parent Company and are presented separately in the consolidatedstatement of income, consolidated statement of comprehensive income, consolidated statement ofchanges in equity and within equity in the consolidated statement of financial position, separatelyfrom the equity attributable to the Parent Company.
Total comprehensive income within a subsidiary is attributed to the NCI even if that results in adeficit balance.
A change in the ownership interest of a subsidiary, without a loss of control, is accounted for as anequity transaction. If the Group loses control over a subsidiary, it:
• Derecognizes the assets (including goodwill) and liabilities of the subsidiary• Derecognizes the carrying amount of any non-controlling interest• Derecognizes the cumulative translation differences recorded in equity• Recognizes the fair value of the consideration received• Recognizes the fair value of any investment retained• Recognizes any surplus or deficit in profit or loss• Reclassifies the parent’s share of components previously recognized in other comprehensive
income (OCI) to profit or loss or retained earnings, as appropriate, as would be required if theGroup had directly disposed of the related assets or liabilities
Changes in Accounting PoliciesThe accounting policies adopted are consistent with those of the previous financial year, except thatthe Group has adopted the following new accounting pronouncements starting January 1, 2017.Adoption of these pronouncements did not have any significant impact on the Group’s financialposition or performance unless otherwise indicated.
• Amendments to PFRS 12, Disclosure of Interests in Other Entities, Clarification of the Scopeof the Standard (Part of Annual Improvements to PFRSs 2014 2016 Cycle)
• Amendments to Philippine Accounting Standard (PAS) 7, Statement of Cash Flows,Disclosure Initiative
The amendments require entities to provide disclosure of changes in their liabilities arising fromfinancing activities, including both changes arising from cash flows and non-cash changes (suchas foreign exchange gains or losses).
The Group has provided the required information in Note 32 to the consolidated financialstatements. As allowed under the transition provisions of the standard, the Group did notpresent comparative information for the year ended December 31, 2016.
• Amendments to PAS 12, Income Taxes, Recognition of Deferred Tax Assets for UnrealizedLosses
Cebu Holdings, Inc. 2017 Integrated Report158
- 4 -
Standards and interpretation issued but not yet effectiveThe Group will adopt the following new and amended standards and Philippine Interpretation ofInternational Financial Reporting Interpretations Committee (IFRIC) enumerated below when thesebecome effective. Except as otherwise indicated, the Group does not expect that the futureadoption of these new and amended PFRS and Philippine Interpretations to have significant impacton the consolidated financial statements.
Effective beginning on or after January 1, 2018
• Amendments to PFRS 2, Share-based Payment, Classification and Measurement of Share-basedPayment Transactions
The amendments to PFRS 2 address three main areas: the effects of vesting conditions on themeasurement of a cash-settled share-based payment transaction; the classification of a share-based payment transaction with net settlement features for withholding tax obligations; and theaccounting where a modification to the terms and conditions of a share-based paymenttransaction changes its classification from cash-settled to equity-settled.
On adoption, entities are required to apply the amendments without restating prior periods, butretrospective application is permitted if elected for all three amendments and if other criteria aremet. Early application of the amendments is permitted.
The Group has assessed that the adoption of these amendments will not have any impact on the2018 consolidated financial statements since the Group does not have share-based paymenttransactions.
• PFRS 9, Financial Instruments
PFRS 9 reflects all phases of the financial instruments project and replaces PAS 39, FinancialInstruments: Recognition and Measurement, and all previous versions of PFRS 9. The standardintroduces new requirements for classification and measurement, impairment, and hedgeaccounting. Retrospective application is required but providing comparative information is notcompulsory. For hedge accounting, the requirements are generally applied prospectively, withsome limited exceptions.
The Group plans to adopt the new standard on the mandatory effective date and is currentlyassessing the potential impact of adopting PFRS 9 in 2018.
• Amendments to PFRS 4, Insurance Contracts, Applying PFRS 9, Financial Instruments, withPFRS 4
The amendments address concerns arising from implementing PFRS 9, the new financialinstruments standard before implementing the new insurance contracts standard. Theamendments introduce two options for entities issuing insurance contracts: a temporaryexemption from applying PFRS 9 and an overlay approach. The temporary exemption is firstapplied for reporting periods beginning on or after January 1, 2018. An entity may elect theoverlay approach when it first applies PFRS 9 and apply that approach retrospectively tofinancial assets designated on transition to PFRS 9. The entity restates comparative informationreflecting the overlay approach if, and only if, the entity restates comparative information whenapplying PFRS 9.
FARTHER AND FASTER 159
- 5 -
The amendments are not applicable to the Group since none of the entities within the Grouphave activities that are connected with insurance or issue insurance contracts.
• PFRS 15, Revenue from Contracts with Customers
PFRS 15 establishes a new five-step model that will apply to revenue arising from contracts withcustomers. Under PFRS 15, revenue is recognized at an amount that reflects the consideration towhich an entity expects to be entitled in exchange for transferring goods or services to acustomer. The principles in PFRS 15 provide a more structured approach to measuring andrecognizing revenue.
The new revenue standard is applicable to all entities and will supersede all current revenuerecognition requirements under PFRSs.
Either a full retrospective application or a modified retrospective application is required forannual periods beginning on or after January 1, 2018. Early adoption is permitted. The Groupplans to adopt the new standard on the required effective date and is currently assessing thepotential impact of adopting PFRS 15 in 2018.
• Amendments to PAS 28, Measuring an Associate or Joint Venture at Fair Value (Part of AnnualImprovements to PFRSs 2014 2016 Cycle)
The amendments clarify that an entity that is a venture capital organization, or other qualifyingentity, may elect, at initial recognition on an investment-by-investment basis, to measure itsinvestments in associates and joint ventures at fair value through profit or loss. They also clarifythat if an entity that is not itself an investment entity has an interest in an associate or jointventure that is an investment entity, the entity may, when applying the equity method, elect toretain the fair value measurement applied by that investment entity associate or joint venture tothe investment entity associate’s or joint venture’s interests in subsidiaries. This election is madeseparately for each investment entity associate or joint venture, at the later of the date on which(a) the investment entity associate or joint venture is initially recognized; (b) the associate or jointventure becomes an investment entity; and (c) the investment entity associate or joint venturefirst becomes a parent.
The amendments should be applied retrospectively, with earlier application permitted.
These amendments are not expected to have any impact in the Group’s consolidated financialstatements.
• Amendments to PAS 40, Investment Property, Transfers of Investment Property
The amendments clarify when an entity should transfer property, including property underconstruction or development into, or out of investment property. The amendments state that achange in use occurs when the property meets, or ceases to meet, the definition of investmentproperty and there is evidence of the change in use. A mere change in management’sintentions for the use of a property does not provide evidence of a change in use. Theamendments should be applied prospectively to changes in use that occur on or after thebeginning of the annual reporting period in which the entity first applies the amendments.Retrospective application is only permitted if this is possible without the use of hindsight.
Cebu Holdings, Inc. 2017 Integrated Report160
- 6 -
Since the Group’s current practice is in line with the clarifications issued, the Group does notexpect any effect on its consolidated financial statements upon adoption of these amendments.
• Philippine Interpretation IFRIC-22, Foreign Currency Transactions and Advance Consideration
The interpretation clarifies that, in determining the spot exchange rate to use on initialrecognition of the related asset, expense or income (or part of it) on the derecognition of a non-monetary asset or non-monetary liability relating to advance consideration, the date of thetransaction is the date on which an entity initially recognizes the non-monetary asset or non-monetary liability arising from the advance consideration. If there are multiple payments orreceipts in advance, then the entity must determine a date of the transactions for each paymentor receipt of advance consideration. Entities may apply the amendments on a fully retrospectivebasis. Alternatively, an entity may apply the interpretation prospectively to all assets, expensesand income in its scope that are initially recognized on or after the beginning of the reportingperiod in which the entity first applies the interpretation or the beginning of a prior reportingperiod presented as comparative information in the financial statements of the reporting periodin which the entity first applies the interpretation.
Effective beginning on or after January 1, 2019
• Amendments to PFRS 9, Prepayment Features with Negative Compensation
The amendments to PFRS 9 allow debt instruments with negative compensation prepaymentfeatures to be measured at amortized cost or fair value through other comprehensive income.An entity shall apply these amendments for annual reporting periods beginning on or afterJanuary 1, 2019. Earlier application is permitted.
These amendments are not expected to have any impact in the Group’s consolidated financialstatements.
• PFRS 16, Leases
PFRS 16 sets out the principles for the recognition, measurement, presentation and disclosure ofleases and requires lessees to account for all leases under a single on-balance sheet modelsimilar to the accounting for finance leases under PAS 17, Leases. The standard includes tworecognition exemptions for lessees – leases of ’low-value’ assets (e.g., personal computers) andshort-term leases (i.e., leases with a lease term of 12 months or less). At the commencement dateof a lease, a lessee will recognize a liability to make lease payments (i.e., the lease liability) and anasset representing the right to use the underlying asset during the lease term (i.e., the right-of-use asset). Lessees will be required to separately recognize the interest expense on the leaseliability and the depreciation expense on the right-of-use asset.
Lessees will be also required to remeasure the lease liability upon the occurrence of certainevents (e.g., a change in the lease term, a change in future lease payments resulting from achange in an index or rate used to determine those payments). The lessee will generallyrecognize the amount of the remeasurement of the lease liability as an adjustment to the right-of-use asset.
FARTHER AND FASTER 161
- 7 -
Lessor accounting under PFRS 16 is substantially unchanged from today’s accounting underPAS17. Lessors will continue to classify all leases using the same classification principle as inPAS 17 and distinguish between two types of leases: operating and finance leases.
PFRS 16 also requires lessees and lessors to make more extensive disclosures than underPAS 17.
Early application is permitted, but not before an entity applies PFRS 15. A lessee can choose toapply the standard using either a full retrospective or a modified retrospective approach. Thestandard’s transition provisions permit certain reliefs.
The Group is currently assessing the impact of adopting PFRS 16.
• Amendments to PAS 28, Long-term Interests in Associates and Joint Ventures
The amendments to PAS 28 clarify that entities should account for long-term interests in anassociate or joint venture to which the equity method is not applied using PFRS 9. An entityshall apply these amendments for annual reporting periods beginning on or after January 1, 2019.Earlier application is permitted.
These amendments are not expected to have any impact in the Group’s consolidated financialstatements.
• Philippine Interpretation IFRIC-23, Uncertainty over Income Tax Treatments
The interpretation addresses the accounting for income taxes when tax treatments involveuncertainty that affects the application of PAS 12 and does not apply to taxes or levies outsidethe scope of PAS 12, nor does it specifically include requirements relating to interest andpenalties associated with uncertain tax treatments.
The interpretation specifically addresses the following: Whether an entity considers uncertain tax treatments separately; The assumptions an entity makes about the examination of tax treatments by taxation
authorities; How an entity determines taxable profit (tax loss), tax bases, unused tax losses, unused tax
credits and tax rates; and, How an entity considers changes in facts and circumstances.
An entity must determine whether to consider each uncertain tax treatment separately ortogether with one or more other uncertain tax treatments. The approach that better predictsthe resolution of the uncertainty should be followed.
The Group is currently assessing the impact of adopting this interpretation.
Cebu Holdings, Inc. 2017 Integrated Report162
- 8 -
Deferred effectivity
• Amendments to PFRS 10 and PAS 28, Sale or Contribution of Assets between an Investor and itsAssociate or Joint Venture
The amendments address the conflict between PFRS 10 and PAS 28 in dealing with the loss ofcontrol of a subsidiary that is sold or contributed to an associate or joint venture. Theamendments clarify that a full gain or loss is recognized when a transfer to an associate or jointventure involves a business as defined in PFRS 3, Business Combinations. Any gain or lossresulting from the sale or contribution of assets that does not constitute a business, however, isrecognized only to the extent of unrelated investors’ interests in the associate or joint venture.
On January 13, 2016, the Financial Reporting Standards Council deferred the original effectivedate of January 1, 2016 of the said amendments until the International Accounting StandardsBoard completes its broader review of the research project on equity accounting that may resultin the simplification of accounting for such transactions and of other aspects of accounting forassociates and joint ventures.
Current and Noncurrent ClassificationThe Group presents assets and liabilities in the consolidated statement of financial position based oncurrent/noncurrent classification. An asset is current when it is:• Expected to be realized or intended to be sold or consumed in the normal operating cycle;• Held primarily for the purpose of trading;• Expected to be realized within twelve months after the reporting period; or,• Cash and cash equivalents unless restricted from being exchanged or used to settle a liability for
at least twelve months after the reporting period.
All other assets are classified as noncurrent.
A liability is current when:• It is expected to be settled in the normal operating cycle;• It is held primarily for the purpose of trading;• It is due to be settled within twelve months after the reporting period; or,• There is no unconditional right to defer the settlement of the liability for at least twelve months
after the reporting period.
The Group classifies all other liabilities as noncurrent.
Deferred tax assets and liabilities are classified as noncurrent assets and liabilities.
Fair Value MeasurementThe Group measures financial instruments such as financial assets at FVPL at fair value and disclosesthe fair value of its other financial instruments as well as investment properties at each reportingdate.
FARTHER AND FASTER 163
- 9 -
Fair value is the price that would be received to sell an asset or paid to transfer a liability in an orderlytransaction between market participants at the measurement date. The fair value measurement isbased on the presumption that the transaction to sell the asset or transfer the liability takes placeeither:• In the principal market for the asset or liability, or• In the absence of a principal market, in the most advantageous market for the asset or liability.
The principal or the most advantageous market must be accessible to the Group.
The fair value of an asset or a liability is measured using the assumptions that market participantswould use when pricing the asset or liability, assuming that market participants act in theireconomic best interest.
A fair value measurement of a non-financial asset takes into account a market participant’s ability togenerate economic benefits by using the asset in its highest and best use or by selling it to anothermarket participant that would use the asset in its highest and best use.
The Group uses valuation techniques that are appropriate in the circumstances and for whichsufficient data are available to measure fair value, maximizing the use of relevant observable inputsand minimizing the use of unobservable inputs.
All assets and liabilities for which fair value is measured or disclosed in the consolidated financialstatements are categorized within the fair value hierarchy, described as follows, based on the lowestlevel input that is significant to the fair value measurement as a whole.
• Level 1 - Quoted (unadjusted) market prices in active markets for identical assets or liabilities• Level 2 - Valuation techniques for which the lowest level input that is significant to the fair value
measurement is directly or indirectly observable• Level 3 - Valuation techniques for which the lowest level input that is significant to the fair value
measurement is unobservable
For assets and liabilities that are recognized in the consolidated financial statements on a recurringbasis, the Group determines whether transfers have occurred between levels in the hierarchy by re-assessing categorization (based on the lowest level input that is significant to the fair valuemeasurement as a whole) at the end of each reporting period.
The Group’s management determines the policies and procedures for recurring fair valuemeasurement of financial assets at FVPL and investment properties.
External valuers are involved for the valuation of significant assets, such as investment properties.Involvement of external valuers is decided upon annually by management after discussion with andapproval by the Group’s audit committee. Selection criteria include market knowledge, reputation,independence and whether professional standards are maintained. The management decides, afterdiscussions with the Group’s external valuers, which valuation techniques and inputs to use for eachcase.
Cebu Holdings, Inc. 2017 Integrated Report164
- 10 -
At each reporting date, the Group analyzes the movements in the values of assets and liabilitieswhich are required to be re-measured or re-assessed as per the Group’s accounting policies.
For this analysis, the Group verifies the major inputs applied in the latest valuation by agreeing theinformation in the valuation computation to contracts and other relevant documents.
The Group, in conjunction with its external valuers, also compares each of the changes in the fairvalue of each asset and liability with relevant external sources to determine whether the change isreasonable.
For the purpose of fair value disclosures, the Group has determined classes of assets and liabilitieson the basis of the nature, characteristics and risks of the asset or liability and the level of the fairvalue hierarchy as explained above.
Financial Assets and Financial LiabilitiesDate of recognitionThe Group recognizes a financial asset or a financial liability in the consolidated statement offinancial position when it becomes a party to the contractual provisions of the instrument.Purchases or sales of financial assets that require delivery of assets within the time frameestablished by regulation or convention in the marketplace are recognized on the settlement date.
Initial recognitionFinancial assets and financial liabilities are initially recognized at fair value. The initial measurementof all financial assets includes transaction costs except for financial instruments measured at FVPL.
The Group classifies its financial assets within the scope of PAS 39 in the following categories:financial assets at FVPL, loans and receivables, held-to-maturity financial assets, oravailable-for-sale (AFS) financial assets. Financial liabilities are classified into financial liabilities atFVPL or other financial liabilities. The classification depends on the purpose for which the financialassets were acquired or financial liabilities were incurred and whether they are quoted in an activemarket. Management determines the classification of its financial instruments at initial recognitionand, where allowed and appropriate, re-evaluates such designation at every reporting date.
As of December 31, 2017 and 2016, the Group’s financial assets are of the nature of loans andreceivables, financial assets at FVPL and AFS financial assets.
“Day 1” differenceWhere the transaction price in a non-active market is different to the fair value from otherobservable current market transactions in the same instrument or based on a valuation techniquewhose variables include only data from observable market, the Group recognizes the differencebetween the transaction price and fair value (a “Day 1” difference) in the consolidated statement ofincome under “Interest income” and “Other charges” accounts unless it qualifies for recognition assome other type of asset. In cases where variables used are made of data which is not observable,the difference between the transaction price and model value is only recognized in the consolidatedstatement of income when the inputs become observable or when the instrument is derecognized.For each transaction, the Group determines the appropriate method of recognizing the “Day 1”difference amount.
FARTHER AND FASTER 165
- 11 -
Financial assets and financial liabilities at FVPLFinancial assets and financial liabilities at FVPL include financial assets and financial liabilities heldfor trading and financial assets and financial liabilities designated upon initial recognition as at FVPL.
Financial assets and financial liabilities are classified as held for trading if they are acquired for thepurpose of selling and repurchasing in the near term. Derivatives, including separated embeddedderivatives, are also classified as held for trading unless they are designated as effective hedginginstruments or a financial guarantee contract.
Fair value gains or losses on investments held for trading, net of interest income accrued on theseassets, are recognized in the consolidated statement of income under “Other income” or “Othercharges”.
Financial assets may be designated at initial recognition as FVPL if any of the following criteria aremet:• the designation eliminates or significantly reduces the inconsistent treatment that would
otherwise arise from measuring the assets or liabilities or recognizing gains or losses on them ona different basis; or
• the assets are part of a group of financial assets which are managed and their performanceevaluated on a fair value basis, in accordance with a documented risk management orinvestment strategy; or
• the financial instrument contains an embedded derivative that would need to be separatelyrecorded.
As of December 31, 2017 and 2016, the Group holds an investment in Unit Investment Trust Fund(UITF) held for trading and classified these as financial assets at FVPL.
Available-for-sale financial assetsAFS financial assets pertain to equity investments. Equity investments classified as AFS are thosethat are neither classified as held for trading nor designated at FVPL.
After initial measurement, AFS financial assets are subsequently measured at fair value withunrealized gains or losses recognized in OCI and credited to unrealized gain (loss) on AFS financialassets account until the investment is derecognized, at which time the cumulative gain or loss isrecognized in other income, or the investment is determined to be impaired, when the cumulativeloss is reclassified from unrealized gain (loss) on AFS financial assets account to the consolidatedstatement of comprehensive income. Dividend earned whilst holding AFS financial assets isreported as dividend income.
The Group evaluates whether the ability and intention to sell its AFS financial assets in the near termis still appropriate. When, in rare circumstances, the Group is unable to trade these financial assetsdue to inactive markets, the Group may elect to reclassify these financial assets if the managementhas the ability and intention to hold the assets for the foreseeable future or until maturity.
Loans and receivablesLoans and receivables are nonderivative financial assets with fixed or determinable payments thatare not quoted in an active market. They are not entered into with the intention of immediate orshort-term resale and are not designated as AFS financial assets or financial assets at FVPL.
Cebu Holdings, Inc. 2017 Integrated Report166
- 12 -
After initial measurement, the loans and receivables are subsequently measured at amortized costusing the effective interest method, less allowance for impairment. Amortized cost is calculated bytaking into account any discount or premium on acquisition and fees that are an integral part of theeffective interest rate (EIR). The amortization is included in “Interest income” account in theconsolidated statement of income. The losses arising from impairment of such loans andreceivables are recognized under “General and administrative expenses” account in theconsolidated statement of income.
Loans and receivables are included in current assets if maturity is within twelve months from thereporting date. Otherwise, these are classified as noncurrent assets.
As of December 31, 2017 and 2016, the Group’s loans and receivables include cash and cashequivalents, short-term investments and receivables (except advances to contractors).
Other financial liabilitiesOther financial liabilities are financial liabilities not designated as at FVPL where the substance ofthe contractual arrangement results in the Group having an obligation either to deliver cash oranother financial asset to the holder, or to satisfy the obligation other than by the exchange of afixed amount of cash or other financial asset for a fixed number of own equity shares. Thecomponents of issued financial instrument that contain both liability and equity element areaccounted for separately, with the equity component being assigned the residual amount afterdeducting from the instrument as a whole the amount separately determined as fair value of theliability component on the date of issue.
After initial measurement, other financial liabilities are subsequently measured at amortized costusing the effective interest method. Amortized cost is calculated by taking into account anydiscount or premium on the issue and fees that are an integral part of the EIR. The amortization isincluded in the “Other charges” account in the consolidated statement of income.
As of December 31, 2017 and 2016, the Group’s other financial liabilities include accounts and otherpayables, long-term debt, deposits and other liabilities, and excluding statutory liabilities and otherobligations that meet the above definition (other than liabilities covered by other accountingstandards such as income tax payable).
Deposits and Other LiabilitiesDeposits and other liabilities which include tenants’ deposits are measured initially at fair value. Thedifference between the cash received and the fair value of tenants’ deposits is recognized in“Tenants deposits” under “Deposits and other liabilities” in the consolidated statement of financialposition and amortized using the straight-line method under the “Real estate revenue” account inthe consolidated statement of income. After initial recognition, tenants’ deposits are subsequentlymeasured at amortized cost using effective interest method. Accretion of discount is recognizedunder “Other financing charges” in the consolidated statement of income.
FARTHER AND FASTER 167
- 13 -
Derecognition of Financial Assets and Financial Liabilities
Financial assetA financial asset (or, where applicable, a part of a group of financial assets) is derecognized when:a. the right to receive cash flows from the assets has expired;b. the Group retains the right to receive cash flows from the asset, but has assumed an obligation
to pay them in full without material delay to a third-party under a “pass-through” arrangement;or
c. the Group has transferred its right to receive cash flows from the asset and either: (i) hastransferred substantially all the risks and rewards of the asset; or (ii) has neither transferred norretained the risks and rewards of the asset but has transferred control of the asset.
When the Group has transferred its right to receive cash flows from an asset or has entered into a“pass-through” arrangement, and has neither transferred nor retained substantially all the risks andrewards of the asset nor transferred control of the asset, the asset is recognized to the extent of theGroup’s continuing involvement in the asset. Continuing involvement that takes the form of aguarantee over the transferred asset is measured at the lower of the original carrying amount of theasset and the maximum amount of consideration that the Group could be required to repay.
Financial liabilityA financial liability is derecognized when the obligation under the liability is discharged or cancelledor has expired. Where an existing financial liability is replaced by another from the same lender onsubstantially different terms, or the terms of an existing liability are substantially modified, such anexchange or modification is treated as a derecognition of the original liability and the recognition ofa new liability, and the difference in the respective carrying amounts is recognized in theconsolidated statement of income.
Impairment of Financial AssetsThe Group assesses at each reporting date whether there is objective evidence that a financial assetor group of financial assets is impaired. A financial asset or a group of financial assets is deemed tobe impaired if, and only if, there is objective evidence of impairment as a result of one or moreevents that has occurred after the initial recognition of the asset (an incurred ‘loss event’) and thatloss event (or events) has an impact on the estimated future cash flows of the financial asset or thegroup of financial assets that can be reliably estimated. Evidence of impairment may includeindications that the borrower or a group of borrowers is experiencing significant financial difficulty,default or delinquency in interest or principal payments, the probability that they will enterbankruptcy or other financial reorganization and where observable data indicate that there ismeasurable decrease in the estimated future cash flows, such as changes in economic conditionsthat correlate with defaults.
AFS financial assetsThe Group treats AFS financial assets as impaired when there has been a significant or prolongeddecline in fair value below its cost or where other objective evidence of impairment exists. Thedetermination of what is ‘significant’ or ‘prolonged’ requires judgment. The Group treats ‘significant’generally as 20% or more and ‘prolonged’ as greater than 12 months for unquoted securities. Inaddition, the Group evaluates other factors, including normal volatility in secondary price forunquoted equities.
Cebu Holdings, Inc. 2017 Integrated Report168
- 14 -
Loans and receivablesFor loans and receivables carried at amortized cost, the Group first assesses whether objectiveevidence of impairment exists individually for financial assets that are individually significant, orcollectively for financial assets that are not individually significant. If the Group determines that noobjective evidence of impairment exists for individually assessed financial asset, whether significantor not, it includes the asset in a group of financial assets with similar credit risk characteristics andcollectively assesses for impairment. Those characteristics are relevant to the estimation of futurecash flows for groups of such assets by being indicative of the debtors’ ability to pay all amounts dueaccording to the contractual terms of the assets being evaluated. Assets that are individuallyassessed for impairment and for which an impairment loss is, or continues to be, recognized are notincluded in a collective assessment for impairment.
If there is objective evidence that an impairment loss has been incurred, the amount of the loss ismeasured as the difference between the asset’s carrying amount and the present value of theestimated future cash flows (excluding future credit losses that have not been incurred). Thecarrying amount of the asset is reduced through the use of an allowance account and the amountof loss is charged to the consolidated statement of income under the “Costs and expenses” account.Interest income continues to be recognized based on the EIR of the asset. Loans and receivables,together with the associated allowance accounts, are written off when there is no realistic prospectof future recovery. If, in a subsequent year, the amount of the estimated impairment loss increasesor decreases because of an event occurring after the impairment was recognized, the previouslyrecognized impairment loss is increased or reduced by adjusting the allowance account. Anysubsequent reversal of an impairment loss is recognized in the consolidated statement of income, tothe extent that the carrying value of the asset does not exceed its amortized cost at the reversaldate.
For the purpose of a collective evaluation of impairment, financial assets are grouped on the basis ofsuch credit risk characteristics as customer type, credit history, past-due status and term.
Future cash flows in a group of financial assets that are collectively evaluated for impairment areestimated on the basis of historical loss experience for assets with credit risk characteristics similarto those in the group. Historical loss experience is adjusted on the basis of current observable datato reflect the effects of current conditions that did not affect the period on which the historical lossexperience is based and to remove the effects of conditions in the historical period that do not existcurrently.
The methodology and assumptions used for estimating future cash flows are reviewed regularly bythe Group to reduce any differences between loss estimates and actual loss experience.
Offsetting Financial InstrumentsFinancial assets and financial liabilities are offset and the net amount reported in the consolidatedstatement of financial position if, and only if, there is a currently enforceable legal right to offset therecognized amounts and there is an intention to settle on a net basis, or to realize the asset andsettle the liability simultaneously.
The Group assesses that it has a currently enforceable right to offset if the right is not contingent ona future event, and is legally enforceable in the normal course of business, event of default, andevent of insolvency or bankruptcy of the Group.
FARTHER AND FASTER 169
- 15 -
InventoriesProperty acquired or being constructed for sale in the ordinary course of business, rather than to beheld for rental or capital appreciation, is held as inventory and is carried at the lower of cost or netrealizable value (NRV). NRV is the estimated selling price in the ordinary course of business, lessestimated costs to complete and sell.
Cost includes:• Land cost;• Land improvement cost;• Amount paid to contractors for construction and development of the properties (i.e. planning
and design costs, cost of site preparation, professional fees, property transfer taxes, constructionoverheads and other related costs); and,
• Borrowing costs on loans directly attributable to the projects which were capitalized duringconstruction.
The cost of inventory recognized in the consolidated statement of income as disposal is determinedwith reference to the specific costs incurred on the property sold and is allocated to saleable areabased on relative size.
Other AssetsOther assets include input value-added tax (VAT), creditable withholding tax (CWT) and prepaidexpenses.
Input VAT represents taxes due or paid on purchases of goods and services subjected to VAT thatthe Group can claim against any future liability to the Bureau of Internal Revenue (BIR) for outputVAT received from sale of goods and services subjected to VAT. The input VAT can also be recoveredas tax credit against future income tax liability of the Group upon approval of the BIR. A valuationallowance is provided for any portion of the input tax that cannot be claimed against output tax orrecovered as tax credit against future income tax liability.
CWT represents the amount withheld by the payee. These are recognized upon collection of therelated sales and are utilized as tax credits against income tax due.
Prepaid expenses are carried at cost less the amortized portion. These typically compriseprepayments for commissions, marketing fees, advertising and promotion, taxes and licenses,rentals and insurance.
Property and EquipmentProperty and equipment are carried at cost less accumulated depreciation and amortization andany impairment in value. The initial cost of property and equipment comprises its construction costor purchase price and any directly attributable costs of bringing the asset to its working conditionand location for its intended use, including borrowing costs.
Cebu Holdings, Inc. 2017 Integrated Report170
- 16 -
Expenditures incurred after the fixed assets have been put into operations, such as repairs andmaintenance are normally charged to expenses in the period in which the costs are incurred. Insituations where it can be clearly demonstrated that the expenditures have resulted in an increasein the future economic benefits expected to be obtained from the use of an item of property andequipment beyond its originally assessed standard of performance, the expenditures are capitalizedas additional cost of the related property and equipment.
Depreciation and amortization commences once the property and equipment are available for theirintended use and are computed on a straight-line basis over the estimated useful lives as follows:
YearsBuildings and improvements 40Furniture, fixtures and equipment 3 10Transportation equipment 3 5
The useful lives and depreciation and amortization methods are reviewed periodically to ensure thatthe period and method of depreciation and amortization are consistent with the expected patternof economic benefits from items of property and equipment.
When property and equipment are retired or otherwise disposed of, the cost of the relatedaccumulated depreciation and amortization, and accumulated provision for impairment losses, ifany, are removed from the accounts and any resulting gain or loss is credited or charged againstcurrent operations.
Fully depreciated property and equipment are retained in the accounts while still in use although nofurther depreciation is credited or charged to current operations.
Intangible AssetsThe Group’s development rights included under “Other noncurrent assets” pertain to thedevelopment rights purchased by the Group which represents the gross floor area of a structure in aparticular lot which is allowed to be developed in the future.
These are measured on initial recognition at cost. After initial recognition, the intangible assets -development rights are carried at cost less any accumulated impairment losses. The developmentrights are capitalized as additional cost of the structure once the development commences.
Investments in Associates and a Joint VentureAn associate is an entity in which the Group has significant influence and which is neither asubsidiary nor a joint venture. Significant influence is the power to participate in the financial andoperating policy decisions of the investee, but is not control or joint control over those policies.
A joint venture is a type of joint arrangement whereby the parties that have joint control of thearrangement have rights to the net assets of the joint venture. Joint control is the contractuallyagreed sharing of control of an arrangement, which exists only when decisions about the relevantactivities require unanimous consent of the parties sharing control.
FARTHER AND FASTER 171
- 17 -
The considerations made in determining significant influence or joint control are similar to thosenecessary to determine control over subsidiaries.
The Group’s investments in associates and a joint venture is accounted for using the equity method.
Under the equity method, the investment in an associate or a joint venture is initially recognized atcost. The carrying amount of the investment is adjusted to recognize changes in the Group’s shareof net assets of the associate or joint venture since the acquisition date.
Goodwill relating to the associate or joint venture is included in the carrying amount of theinvestment and is not tested for impairment individually.
The consolidated statement of comprehensive income reflects the Group’s share of the results ofoperations of the associate or joint venture. Any change in OCI of those investees is presented aspart of the Group’s OCI. In addition, when there has been a change recognized directly in the equityof the associate or joint venture, the Group recognizes its share of any changes, when applicable, inthe consolidated statement of changes in equity. Unrealized gains and losses resulting fromtransactions between the Group and the associate or joint venture are eliminated to the extent ofthe interest in the associate or joint venture.
The aggregate of the Group’s share of profit or loss of an associate and a joint venture is shown onthe face of the consolidated statement of income and represents profit or loss after tax and non-controlling interests in the subsidiaries of the associate or joint venture.
The financial statements of the associate or joint venture are prepared for the same reporting periodas the Group. When necessary, adjustments are made to bring the accounting policies in line withthose of the Group.
After application of the equity method, the Group determines whether it is necessary to recognizean impairment loss on its investment in an associate or joint venture. At each reporting date, theGroup determines whether there is objective evidence that the investment in associates and a jointventure is impaired. If there is such evidence, the Group calculates the amount of impairment asthe difference between the recoverable amount of the associate and its carrying value, thenrecognizes the loss as ‘Equity in net earnings of associates and a joint venture’ in the consolidatedstatement of comprehensive income.
Upon loss of significant influence over the associate or joint control over the joint venture, the Groupmeasures and recognizes any retained investment at its fair value. Any difference between thecarrying amount of the associate or joint venture upon loss of significant influence or joint controland the fair value of the retained investment and proceeds from disposal is recognized in theconsolidated statement of income.
Investment PropertiesInvestment properties consist of completed properties and properties under construction or re-development that are held to earn rentals and for capital appreciation or both and are not occupiedby the companies in the Group. The Group uses the cost model in measuring investment propertiessince this represents the historical value of the properties subsequent to initial recognition.Investment properties, except for land, are carried at cost less accumulated depreciation andamortization and any impairment in value. Land is carried at cost less any impairment in value.
Cebu Holdings, Inc. 2017 Integrated Report172
- 18 -
The initial cost of investment properties consists of any directly attributable costs of bringing theinvestment properties to their intended location and working condition, including borrowing costs.
Investment properties are depreciated using the straight-line method over their estimated usefullives as follows:
YearsLand and improvements Up to 25Buildings and improvements Up to 40
Expenditure incurred after the investment property has been put in operation, such as repairs andmaintenance costs, are normally charged against income in the period in which the costs areincurred.
Construction in progress is stated at cost. This includes cost of construction and other direct costs.Construction in progress is not depreciated until such time that the relevant assets are available fortheir intended use.
Investment properties are derecognized when either they have been disposed of or when they arepermanently withdrawn from use and no future economic benefit is expected from its disposal. Anygains or losses on the retirement or disposal of an investment property are recognized in theconsolidated statement of income in the year of retirement or disposal.
Transfers are made to investment properties when, and only when, there is a change in use,evidenced by ending of owner-occupation and commencement of an operating lease to anotherparty. Transfers are made from investment properties when, and only when, there is a change inuse, evidenced by commencement of owner-occupation or commencement of development with aview to sale. Transfers between investment properties, owner-occupied properties and inventoriesdo not change the carrying amount of the property transferred and they do not change the cost ofthat property for measurement or disclosure purposes.
Land and ImprovementsLand and improvements are carried at cost less any impairment in value. Land and improvementdeal with land assets that were acquired and will be used as site for future developments. These areassets neither classified as inventories or investment properties since these are undeveloped landand has no definite use as of reporting date and to whether these are held to earn rentals or forcapital appreciation to be classified as investment properties or are held for sale in the ordinarycourse of business. Its use is yet to be determined by management as approved by the BOD.
All capitalizable expenses related to the land acquisition are recorded to “Land and improvements”once a Contract to Sell/Purchase Agreement has been executed between the parties.
Transfers are made to inventories or investment properties when, and only when, there is a definiteuse as evidenced by commencement of development with a view to sale or commencement of anoperating lease to another party, respectively.
Impairment of Nonfinancial AssetsThe Group assesses at each reporting date whether there is an indication that an asset may beimpaired. If any such indication exists, or when annual impairment testing for an asset is required,the Group makes an estimate of the asset’s recoverable amount.
FARTHER AND FASTER 173
- 19 -
An asset’s recoverable amount is the higher of an asset’s or cash-generating unit’s fair value lesscosts to sell and its value in use, and is determined for an individual asset, unless the asset does notgenerate cash inflows that are largely independent of those from other assets or groups of assets.Where the carrying amount of an asset exceeds its recoverable amount, the asset is consideredimpaired and is written down to its recoverable amount. In assessing value in use, the estimatedfuture cash flows are discounted to their present value using a pre-tax discount rate that reflectscurrent market assessments of the time value of money and the risks specific to the asset. Indetermining fair value less costs to sell, recent market transactions are taken into account, ifavailable. If no such transactions can be identified, an appropriate valuation model is used.Impairment losses of continuing operations are recognized in the consolidated statement of incomein those expense categories consistent with the function of the impaired asset.
An assessment is made at each reporting date as to whether there is any indication that previouslyrecognized impairment losses may no longer exist or may have decreased. If such indication exists,the recoverable amount is estimated. A previously recognized impairment loss is reversed only ifthere has been a change in the estimates used to determine the asset’s recoverable amount sincethe last impairment loss was recognized. If that is the case, the carrying amount of the asset isincreased to its recoverable amount. That increased amount cannot exceed the carrying amountthat would have been determined, net of depreciation and amortization, had no impairment lossbeen recognized for the asset in prior years.
Such reversal is recognized in the consolidated statement of income unless the asset is carried atrevalued amount, in which case, the reversal is treated as a revaluation increase. After such reversal,the depreciation charge is adjusted in future periods to allocate the asset’s revised carrying amount,less any residual value, on a systematic basis over its remaining useful life.
For investments in associates and a joint venture, after application of the equity method, the Groupdetermines whether it is necessary to recognize any additional impairment loss with respect to theGroup’s net investment in the investee companies. The Group determines at each reporting datewhether there is any objective evidence that the investment in associates or joint venture isimpaired. If this is the case, the Group calculates the amount of impairment as being the differencebetween the recoverable amount of the investee companies and the carrying value, and recognizesthe amount in the consolidated statement of income.
EquityCapital stock and additional paid-in capitalCapital stock is measured at par value for all shares issued. When the shares are sold at a premium,the difference between the proceeds and the par value is credited to “Additional paid-in capital”account. Direct costs incurred related to equity issuance are chargeable to “Additional paid-incapital” account. If additional paid-in capital is not sufficient, the excess is charged against retainedearnings. When the Group issues more than one class of stock, a separate account is maintained foreach class of stock and the number of shares issued.
Retained earningsRetained earnings represent net accumulated earnings (losses) of the Group less dividends declaredand any adjustments arising from the application of new accounting standards or policies appliedretrospectively. The individual accumulated earnings of the subsidiaries are available for dividendsonly after declared by their respective BOD.
Cebu Holdings, Inc. 2017 Integrated Report174
- 20 -
Unappropriated retained earningsUnappropriated retained earnings represent the portion of retained earnings that is free and can bedeclared as dividends to stockholders.
Appropriated retained earningsAppropriated retained earnings represent the portion of retained earnings which has beenrestricted and therefore is not available for dividend declaration.
Dividend distributionsDividends on common shares are recognized as a liability and deducted from equity when approvedby the BOD of the Group. Dividends for the year that are approved after the reporting date are dealtwith as a non-adjusting event after the reporting date.
Equity reservesEquity reserves pertain to the difference between the consideration transferred and the equityacquired in a common control business combination.
Revenue and Cost RecognitionRevenue is recognized to the extent that it is probable that the economic benefits will flow to theGroup and the revenue can be measured reliably, regardless of when the payment is being made.Revenue is measured at the fair value of the consideration received or receivable, taking intoaccount contractually defined terms of payment and excluding taxes or duties. The Group assessesits revenue arrangements against specific criteria in order to determine if it is acting as a principal oran agent. In arrangements where the Group is acting as a principal to its customers, revenue isrecognized on a gross basis.
The following specific recognition criteria must also be met before revenue is recognized:
Rental incomeRental income from noncancellable and cancellable leases is recognized in the consolidatedstatement of income on a straight-line basis over the lease term and the terms of the lease,respectively, or based on a certain percentage of the gross revenue of the tenants, as provided forunder the terms of the lease contract.
Contingent rents are recognized as revenue in the period in which they are earned.
Real estate salesFor real estate sales, the Group assesses whether it is probable that the economic benefits will flowto the Group when the sales prices are collectible. Collectability of the sales price is demonstratedby the buyer’s commitment to pay, which in turn is supported by substantial initial and continuinginvestments that give the buyer a stake in the property sufficient that the risk of loss throughdefault motivates the buyer to honor its obligation to the seller. Collectability is also assessed byconsidering factors such as the credit standing of the buyer, age and location of the property.Revenue from sales of completed real estate projects is accounted for using the full accrual method.In accordance with PIC No. Q&A 2006-01, the percentage-of-completion method is used torecognize income from sales of projects where the Group has material obligations under the salescontract to complete the project after the property is sold, the equitable interest has beentransferred to the buyer, construction is beyond preliminary stage (i.e., engineering, design work,construction contracts execution, site clearance and preparation, excavation and the buildingfoundation are finished), and the costs incurred or to be incurred can be measured reliably.
FARTHER AND FASTER 175
- 21 -
Under this method, revenue is recognized as the related obligations are fulfilled, measuredprincipally on the basis of the estimated completion of a physical proportion of the contract work.
Any excess of collections over the recognized receivables are included in the “Deposits and othercurrent liabilities” account in the liabilities section of the consolidated statement of financialposition.
If any of the criteria under the full accrual or percentage-of-completion method is not met, thedeposit method is applied until all the conditions for recording a sale are met. Pending recognitionof sale, cash received from buyers are presented under the “Deposits and other current liabilities”account in the liabilities section of the consolidated statement of financial position.
Cost of real estate sales is recognized consistent with the revenue recognition method applied. Costof residential and commercial lots and units sold before the completion of the development isdetermined on the basis of the acquisition cost of the land plus its full development costs, whichinclude estimated costs for future development works, as determined by the Group’s in-housetechnical staff.
Theater incomeTheater income is recognized when earned.
Interest incomeInterest income is recognized as it accrues using the effective interest method.
Other incomeRecoveries are recognized as they accrue.
Net gain or loss from the sale of development rights is recognized when risk and reward aretransferred to the buyer.
Others are recognized when earned.
Cost and Expense RecognitionCost and expenses are recognized in the consolidated statement of income when a decrease in thefuture economic benefit related to a decrease in an asset or an increase in a liability has arisen thatcan be measured reliably.
Cost and expenses are recognized in the consolidated statement of income:• On the basis of a direct association between the costs incurred and the earning of specific items
of income;• On the basis of systematic and rational allocation procedures when economic benefits are
expected to arise over several accounting periods and the association can only be broadly orindirectly determined; or
• Immediately when expenditure produces no future economic benefits or when, and to theextent that, future economic benefits do not qualify or cease to qualify, for recognition in theconsolidated statement of financial position as an asset.
Cebu Holdings, Inc. 2017 Integrated Report176
- 22 -
Borrowing CostsBorrowing costs directly attributable to the acquisition or construction of an asset that necessarilytakes a substantial period of time to get ready for its intended use or sale are capitalized as part ofthe cost of the respective assets (included in “Investment properties” account in the consolidatedstatement of financial position). All other borrowing costs are expensed in the period in which theyoccur. Borrowing costs consist of interest and other costs that an entity incurs in connection withthe borrowing of funds.
The interest capitalized is calculated using the Group’s weighted average cost of borrowings afteradjusting for borrowings associated with specific developments. Where borrowings are associatedwith specific developments, the amounts capitalized is the gross interest incurred on thoseborrowings less any investment income arising on their temporary investment. Interest iscapitalized from the commencement of the development work until the date of practicalcompletion. The capitalization of borrowing costs is suspended if there are prolonged periods whendevelopment activity is interrupted. If the carrying amount of the asset exceeds its recoverableamount, an impairment loss is recorded.
The borrowing costs capitalized as part of “Investment properties” are depreciated using straight-line method over the estimated useful life of the assets.
LeasesThe determination of whether an arrangement is, or contains, a lease is based on the substance ofthe arrangement at inception date whether the fulfillment of the arrangement is dependent on theuse of a specific asset or assets or the arrangement conveys a right to use the asset, even if that rightis not explicitly specified in an arrangement. A reassessment is made after inception of the leaseonly if one of the following applies:
(a) There is a change in contractual terms, other than a renewal or extension of the arrangement;(b) A renewal option is exercised or extension granted, unless the term of the renewal or extension
was initially included in the lease term;(c) There is a change in the determination of whether fulfillment is dependent on a specified
asset;or(d) There is substantial change to the asset.
Where a reassessment is made, lease accounting shall commence or cease from the date when thechange in circumstances gave rise to the reassessment for scenarios (a), (c), or (d) and at the date ofrenewal or extension period for scenario (b).
Group as lessorLeases where the Group retains substantially all the risk and benefits of ownership of the assets areclassified as operating leases. Lease payments received are recognized as an income in theconsolidated statement of income on a straight-line basis over the lease term.
Initial direct costs incurred in negotiating operating leases are added to the carrying amount of theleased asset and recognized over the lease term on the same basis as the rental income.Contingent rents are recognized as revenue in the period in which they are earned.
Group as lesseeLeases where the lessor retains substantially all the risks and benefits of ownership of the asset areclassified as operating leases.
FARTHER AND FASTER 177

- 23 -
Fixed lease payments are recognized as an expense in the consolidated statement of income on astraight-line basis, while the variable rent is recognized as an expense based on terms of the leasecontract.
Pension CostThe Group maintains a defined contribution (DC) plan that covers all regular full-time employees.Under its DC plan, the Group pays fixed contributions based on the employees’ monthly salaries.The Group, however, is covered under Republic Act (RA) No. 7641, The Philippine Retirement Law,which provides for its qualified employees a defined benefit (DB) minimum guarantee. The DBminimum guarantee is equivalent to a certain percentage of the monthly salary payable to anemployee at normal retirement age with the required credited years of service based on theprovisions of RA No. 7641.
In accordance with PIC Q&A No. 2013-03, the obligation for post-employment benefits of an entitythat provides a DC plan as its only post-employment benefit plan, is not limited to the amount itagrees to contribute to the fund, if any. In this case, therefore, the Group’s retirement plan shall beaccounted for as a defined benefit plan. Accordingly, the Group accounts for its retirementobligation under the higher of the DB obligation relating to the minimum guarantee and theobligation arising from the DC plan.
The DC liability is measured at the fair value of the DC assets upon which the DC benefits depend,with an adjustment for margin on asset returns, if any, where this is reflected in the DC benefits.
For the DB minimum guarantee plan, the liability is determined based on the present value of theexcess of the projected DB obligation over the projected DC obligation at the end of the reportingperiod. The DB obligation is calculated annually by a qualified independent actuary using theprojected unit credit method.
Pension costs comprise:• Service cost;• Net interest on the net defined benefit liability or asset; and,• Remeasurements of net defined benefit liability or asset.
Service costs which include current service costs, past service costs and gains or losses on non-routine settlements are recognized as expense in the consolidated statement of income. Pastservice costs are recognized when plan amendment or curtailment occurs. These amounts arecalculated periodically by independent qualified actuaries.
Net interest on the net defined benefit liability or asset is the change during the period in the netdefined benefit liability or asset that arises from the passage of time which is determined byapplying the discount rate based on government bonds to the net defined benefit liability or asset.Net interest on the net defined benefit liability or asset is recognized as an expense or income in theconsolidated statement of income.
Remeasurements comprising actuarial gains and losses, return on plan assets and any change inthe effect of the asset ceiling (excluding net interest on defined benefit liability) are recognizedimmediately in other comprehensive income in the period in which they arise. Remeasurementsare not reclassified to profit or loss in subsequent periods.
Cebu Holdings, Inc. 2017 Integrated Report178
- 24 -
The liability recognized in the consolidated statement of financial position in respect of definedbenefit pension plans is the present value of the defined benefit obligation at the reporting date lessfair value of the plan assets. The present value of the defined benefit obligation is determined byusing risk-free interest rates of long-term government bonds that have terms to maturityapproximating the terms of the related pension liabilities or applying a single weighted averagediscount rate that reflects the estimated timing and amount of benefit payments.
Income TaxCurrent taxCurrent tax assets and liabilities for the current and prior periods are measured at the amountexpected to be recovered from or paid to the taxation authorities. The tax rates and tax laws used tocompute the amount are those that are enacted or substantively enacted at the reporting date.
Deferred taxDeferred tax is provided, using the liability method, on temporary differences at the reporting datebetween the tax bases of assets and liabilities and its carrying amounts for financial reportingpurposes.
Deferred tax liabilities are recognized for all taxable temporary differences with certain exceptions.Deferred tax assets are recognized for all deductible temporary differences with certain exceptions,and carryforward benefits of unused tax credits from excess of minimum corporate income tax(MCIT) over the regular corporate income tax (RCIT) and unused net operating loss carryover(NOLCO), to the extent that it is probable that taxable income will be available against which thedeductible temporary differences and carryforward benefits of unused MCIT and NOLCO can beutilized.
Deferred tax liabilities are not provided on nontaxable temporary differences associated withinvestments in associates and a joint venture.
The carrying amount of deferred tax assets is reviewed at each reporting date and reduced to theextent that it is no longer probable that sufficient taxable income will be available to allow all or partof the deferred tax asset to be utilized. Unrecognized deferred tax assets are reassessed at eachreporting date and are recognized to the extent that it has become probable that future taxableincome will allow the deferred tax asset to be utilized.
Deferred tax assets and liabilities are measured at the tax rates that are expected to apply to theperiod when the asset is realized or the liability is settled, based on tax rates and tax laws that havebeen enacted or substantively enacted as of reporting date. Movements in the deferred income taxassets and liabilities arising from changes in tax rates are charged against or credited to income forthe period.
Deferred tax relating to items recognized outside profit or loss is recognized in OCI. Deferred taxitems are recognized in correlation to the underlying transaction either in OCI or directly in equity.
Deferred tax assets and liabilities are offset, if a legally enforceable right exists to set off current taxassets against current tax liabilities and the deferred taxes relate to the same taxable entity and thesame taxation authority.
Foreign-Currency-Denominated TransactionsThe consolidated financial statements are presented in Philippine Peso, which is the ParentCompany’s functional currency.
FARTHER AND FASTER 179

- 25 -
Each entity in the Group determines its own functional currency and items included in the financialstatements of each entity are measured using that functional currency. Transactions in foreigncurrencies are initially recorded using the exchange rate at the date of the transactions. Monetaryassets and liabilities denominated in foreign currencies are restated using the closing exchange rateprevailing at reporting dates. Exchange gains or losses arising from foreign exchange transactionsare credited to or charged against operations for the year.
Earnings Per Share (EPS)Basic EPS is computed by dividing net income for the year attributable to common stockholders ofthe Parent Company by the weighted average number of common shares issued and outstandingduring the year adjusted for any subsequent stock dividends declared. Diluted EPS is computed bydividing net income for the year attributable to common stockholders of the Parent Company bythe weighted average number of common shares issued and outstanding during the year aftergiving effect to assumed conversion of potential common shares, if any.
Segment ReportingThe Group’s operating businesses are organized and managed separately according to the nature ofthe products and services provided, with each segment representing a strategic business unit thatoffers different products and serves different markets. Financial information on business segmentsis presented in Note 29 of the consolidated financial statements.
ProvisionsProvisions are recognized when the Group has a present obligation (legal or constructive) as a resultof a past event, it is probable that an outflow of resources embodying economic benefits will berequired to settle the obligation and a reliable estimate can be made of the amount of theobligation. Where the Group expects some or all of the provision to be reimbursed, thereimbursement is recognized as a separate asset but only when the reimbursement is virtuallycertain. The expense relating to a provision is presented in the consolidated statement of income,net of any reimbursement. Provisions are reviewed at each reporting date and adjusted to reflectthe current best estimates.
ContingenciesContingent liabilities are not recognized in the consolidated financial statements. These aredisclosed unless the possibility of an outflow of resources embodying economic benefits is remote.Contingent assets are not recognized in the consolidated financial statements but disclosed whenan inflow of economic benefits is probable.
Events after the Reporting DatePost year-end events up to the date of the consolidated financial statements were authorized forissue that provide additional information about the Group’s position at the reporting date (adjustingevents) are reflected in the consolidated financial statements. Post year-end events that are notadjusting events are disclosed in the notes to the consolidated financial statements when material.
3. Significant Accounting Judgments, Estimates and Assumptions
The preparation of the consolidated financial statements of the Group in conformity with PFRSrequires management to make judgments and estimates that affect the amounts reported in theconsolidated financial statements and accompanying notes.
Cebu Holdings, Inc. 2017 Integrated Report180
- 26 -
The judgments and estimates used in the consolidated financial statements are based uponmanagement’s evaluation of relevant facts and circumstances as of the date of the consolidatedfinancial statements. Actual results could differ from such estimates.
Management believes the following represent a summary of these significant judgments, estimatesand assumptions:
JudgmentsIn the process of applying the Group’s accounting policies, management has made the followingjudgments, apart from those involving estimations, which have the most significant effect on theamounts recognized in the consolidated financial statements:
Distinction between investment properties and inventoriesThe Group determines whether a property is classified as investment property or inventory asfollows:
• Investment properties comprises land and buildings (principally offices, commercial and retailproperty) which are not occupied substantially for use by, or in the operations of the Group, norfor sale in the ordinary course of business, but are held primarily to earn rental income andcapital appreciation.
• Inventory comprises property that is held for sale in the ordinary course of business. Principally,this is a residential or industrial property that the Group develops and intends to sell before or oncompletion of construction.
In making this judgment, the Group considers whether the property will be sold in the normaloperating cycle (Inventories) or whether it will be retained as part of the Group’s leasing activities orfor future development or sale which are yet to be finalized by the Group (Investment properties).
Evaluating impairment of nonfinancial assetsThe Group reviews its investment properties and investments in associates and a joint venture forimpairment of value. This includes considering certain indications of impairment such as significantchanges in asset usage, obsolescence or physical damage of an asset, significant underperformancerelative to expected historical or projected future operating results of the investees and significantnegative industry or economic trends.
As of December 31, 2017 and 2016, the Group assessed that there are no indicators of impairment,thus, the Group did not recognize any impairment loss on its nonfinancial assets (see Notes 13 and14).
Assessment of control of an investment and the type of investmentAn investor controls an investee when it is exposed, or has rights, to variable returns from itsinvolvement with the investee and has the ability to affect those returns through its power over theinvestee; thus, the principle of control sets out the following three elements of control:• power over the investee;• exposure, or rights, to variable returns from involvement with the investee; and,• the ability to use power over the investee to affect the amount of the investor's returns.
FARTHER AND FASTER 181
- 27 -
In 2016, management assessed that the Group does not have control over Central Block Developers,Inc. (CBDI) even with 57% effective ownership interest because the Group has no control over CBDI’srelevant activities and it does not have the majority representation in its BOD. In 2017, the Group’seffective ownership in CBDI was down to 48%.
Assessment of joint control of an arrangement and the type of arrangementJoint control is the contractually agreed sharing of control of an arrangement, which exists onlywhen decisions about the relevant activities require the unanimous consent of the parties sharingcontrol. Management assessed that the Group has joint control over Cebu District PropertyEnterprise, Inc. (CDPEI) by virtue of a contractual agreement with other shareholders.
The Group applies judgment when assessing whether a joint arrangement is a joint operation or ajoint venture.
In making this judgment, the Group determines the type of joint arrangement in which it is involvedby considering its rights and obligations arising from the arrangement. The Group assesses itsrights and obligations by considering the structure and legal form of the arrangement, the termsagreed by the parties in the contractual arrangement and, when relevant, other facts andcircumstances. Management assessed that CDPEI is a joint venture arrangement as it is a separatelegal entity and its stockholders have rights to its net assets.
Collectability of the sales priceRevenue and cost recognition on real estate sales and selecting an appropriate revenue recognitionmethod for a particular real estate sale transaction requires certain judgment based on, amongothers:
• Buyer’s commitment on the sale which may be ascertained through the significance of thebuyer’s initial investment; and,
• Stage of completion of the project.
The Group has set a certain percentage (%) of collection over the total selling price in determiningbuyer’s commitment on the sale. It is when the buyer’s investment is considered adequate to meetthe probability criteria that economic benefits will flow to the Group.
Provisions and contingenciesThe Group is involved in a legal proceeding and contingently liable for various claims. The estimateof the probable costs for the resolution of these legal proceeding and claims has been developed inconsultation with the legal counsels and based upon an analysis of potential results. The Groupcurrently does not believe these proceedings will have a material adverse effect on the Group’sfinancial position (see Note 33).
Estimates and AssumptionsThe key assumptions concerning the future and other key sources of estimation and uncertainty atthe reporting date, that have a significant risk of causing a material adjustment to the carryingamounts of assets and liabilities are as follows:
Revenue and cost recognitionThe Group’s revenue recognition policies require management to make use of estimates andassumptions that may affect the reported amounts of revenues and costs.
Cebu Holdings, Inc. 2017 Integrated Report182
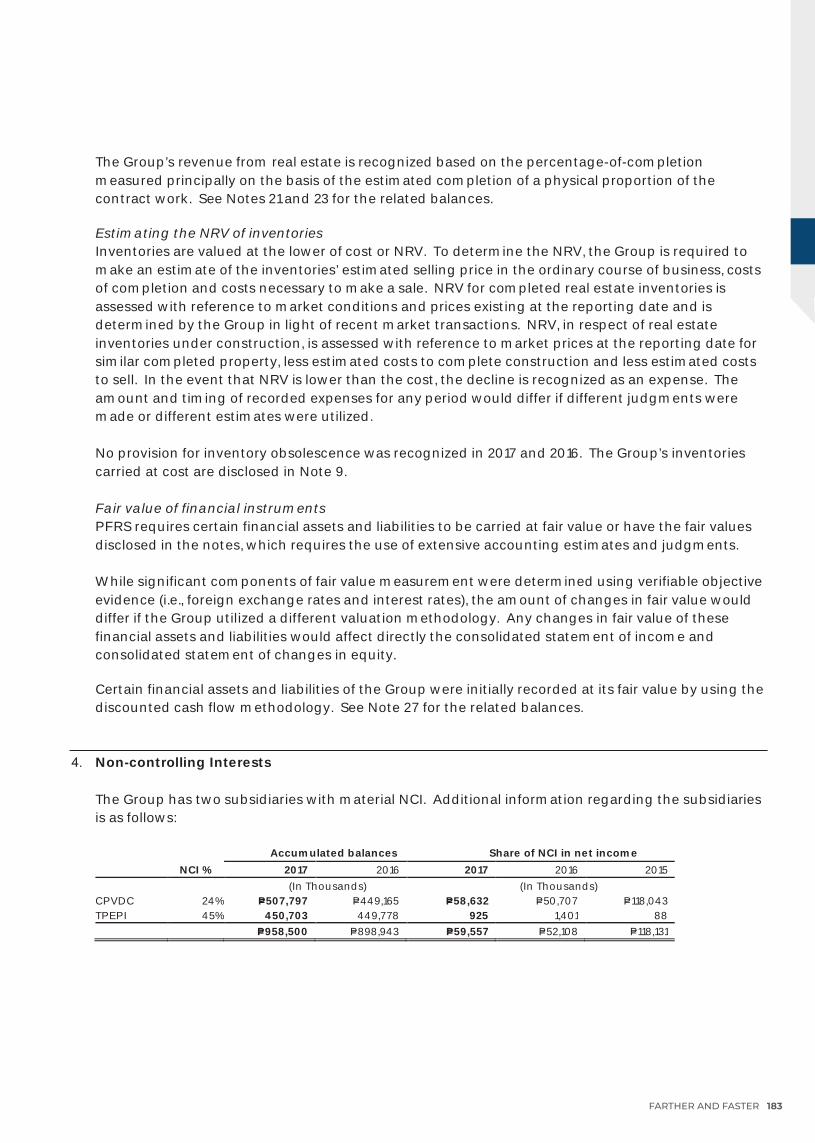
- 28 -
The Group’s revenue from real estate is recognized based on the percentage-of-completionmeasured principally on the basis of the estimated completion of a physical proportion of thecontract work. See Notes 21 and 23 for the related balances.
Estimating the NRV of inventoriesInventories are valued at the lower of cost or NRV. To determine the NRV, the Group is required tomake an estimate of the inventories’ estimated selling price in the ordinary course of business, costsof completion and costs necessary to make a sale. NRV for completed real estate inventories isassessed with reference to market conditions and prices existing at the reporting date and isdetermined by the Group in light of recent market transactions. NRV, in respect of real estateinventories under construction, is assessed with reference to market prices at the reporting date forsimilar completed property, less estimated costs to complete construction and less estimated coststo sell. In the event that NRV is lower than the cost, the decline is recognized as an expense. Theamount and timing of recorded expenses for any period would differ if different judgments weremade or different estimates were utilized.
No provision for inventory obsolescence was recognized in 2017 and 2016. The Group’s inventoriescarried at cost are disclosed in Note 9.
Fair value of financial instrumentsPFRS requires certain financial assets and liabilities to be carried at fair value or have the fair valuesdisclosed in the notes, which requires the use of extensive accounting estimates and judgments.
While significant components of fair value measurement were determined using verifiable objectiveevidence (i.e., foreign exchange rates and interest rates), the amount of changes in fair value woulddiffer if the Group utilized a different valuation methodology. Any changes in fair value of thesefinancial assets and liabilities would affect directly the consolidated statement of income andconsolidated statement of changes in equity.
Certain financial assets and liabilities of the Group were initially recorded at its fair value by using thediscounted cash flow methodology. See Note 27 for the related balances.
4. Non-controlling Interests
The Group has two subsidiaries with material NCI. Additional information regarding the subsidiariesis as follows:
Accumulated balances Share of NCI in net income NCI % 2017 2016 2017 2016 2015
(In Thousands) (In Thousands)CPVDC 24% P=507,797 P=449,165 P=58,632 P=50,707 P=118,043TPEPI 45% 450,703 449,778 925 1,401 88 P=958,500 P=898,943 P=59,557 P=52,108 P=118,131
FARTHER AND FASTER 183
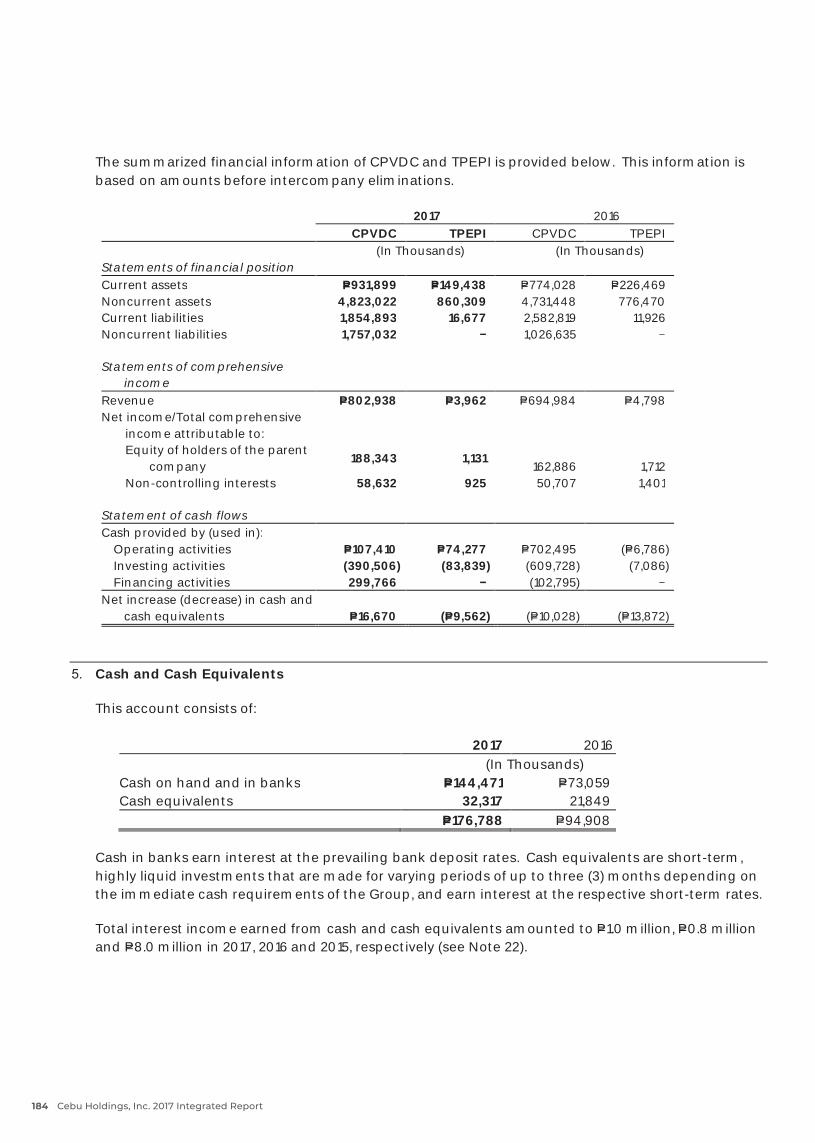
- 29 -
The summarized financial information of CPVDC and TPEPI is provided below. This information isbased on amounts before intercompany eliminations.
2017 2016 CPVDC TPEPI CPVDC TPEPI
(In Thousands) (In Thousands)Statements of financial positionCurrent assets P=931,899 P=149,438 P=774,028 P=226,469Noncurrent assets 4,823,022 860,309 4,731,448 776,470Current liabilities 1,854,893 16,677 2,582,819 11,926Noncurrent liabilities 1,757,032 1,026,635
Statements of comprehensiveincome
Revenue P=802,938 P=3,962 P=694,984 P=4,798Net income/Total comprehensive
income attributable to:Equity of holders of the parent
company188,343 1,131
162,886 1,712Non-controlling interests 58,632 925 50,707 1,401
Statement of cash flowsCash provided by (used in):
Operating activities P=107,410 P=74,277 P=702,495 (P=6,786)Investing activities (390,506) (83,839) (609,728) (7,086)Financing activities 299,766 (102,795)
Net increase (decrease) in cash andcash equivalents P=16,670 (P=9,562) (P=10,028) (P=13,872)
5. Cash and Cash Equivalents
This account consists of:
2017 2016(In Thousands)
Cash on hand and in banks P=144,471 P=73,059Cash equivalents 32,317 21,849
P=176,788 P=94,908
Cash in banks earn interest at the prevailing bank deposit rates. Cash equivalents are short-term,highly liquid investments that are made for varying periods of up to three (3) months depending onthe immediate cash requirements of the Group, and earn interest at the respective short-term rates.
Total interest income earned from cash and cash equivalents amounted to P=1.0 million, P=0.8 millionand P=8.0 million in 2017, 2016 and 2015, respectively (see Note 22).
Cebu Holdings, Inc. 2017 Integrated Report184
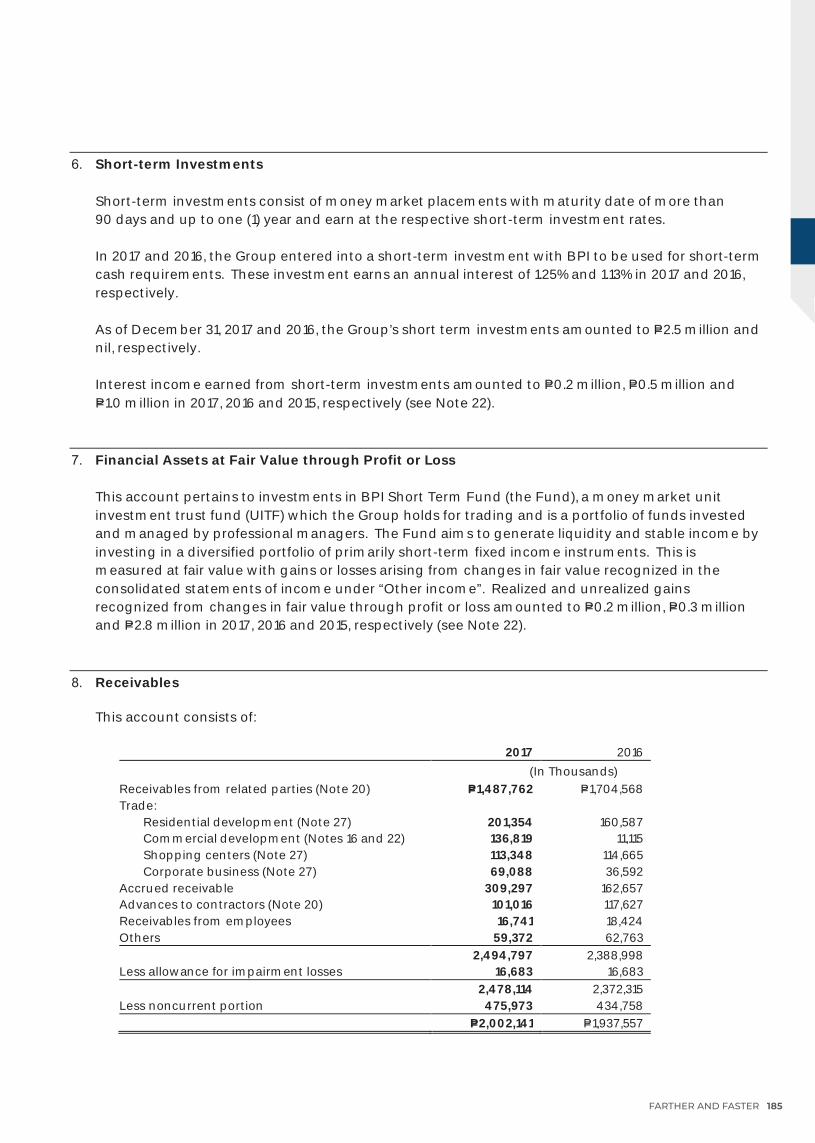
- 30 -
6. Short-term Investments
Short-term investments consist of money market placements with maturity date of more than90 days and up to one (1) year and earn at the respective short-term investment rates.
In 2017 and 2016, the Group entered into a short-term investment with BPI to be used for short-termcash requirements. These investment earns an annual interest of 1.25% and 1.13% in 2017 and 2016,respectively.
As of December 31, 2017 and 2016, the Group’s short term investments amounted to P=2.5 million andnil, respectively.
Interest income earned from short-term investments amounted to P=0.2 million, P=0.5 million andP=1.0 million in 2017, 2016 and 2015, respectively (see Note 22).
7. Financial Assets at Fair Value through Profit or Loss
This account pertains to investments in BPI Short Term Fund (the Fund), a money market unitinvestment trust fund (UITF) which the Group holds for trading and is a portfolio of funds investedand managed by professional managers. The Fund aims to generate liquidity and stable income byinvesting in a diversified portfolio of primarily short-term fixed income instruments. This ismeasured at fair value with gains or losses arising from changes in fair value recognized in theconsolidated statements of income under “Other income”. Realized and unrealized gainsrecognized from changes in fair value through profit or loss amounted to P=0.2 million, P=0.3 millionand P=2.8 million in 2017, 2016 and 2015, respectively (see Note 22).
8. Receivables
This account consists of:
2017 2016(In Thousands)
Receivables from related parties (Note 20) P=1,487,762 P=1,704,568Trade:
Residential development (Note 27) 201,354 160,587Commercial development (Notes 16 and 22) 136,819 11,115Shopping centers (Note 27) 113,348 114,665Corporate business (Note 27) 69,088 36,592
Accrued receivable 309,297 162,657Advances to contractors (Note 20) 101,016 117,627Receivables from employees 16,741 18,424Others 59,372 62,763
2,494,797 2,388,998Less allowance for impairment losses 16,683 16,683
2,478,114 2,372,315Less noncurrent portion 475,973 434,758
P=2,002,141 P=1,937,557
FARTHER AND FASTER 185
- 31 -
The nature of trade receivables of the Group are as follows:
• Residential development pertains to receivables arising from the sale of residential lots andcondominium units.
• Commercial development pertains to receivables arising from the sale of commercial lots anddevelopment rights.
• Shopping centers pertain to receivables arising from the lease of retail space and land therein,movie theaters, food courts, entertainment facilities and carparks.
• Corporate business pertains to receivables arising from the lease of office buildings and accruedrent receivable.
• Other receivables pertain to receivable related to interests.
Terms and conditions of receivables are as follows:
• Sales contract receivables, included under residential development, are noninterest-bearing andare collectible in monthly installments over a period of one (1) to two (2) years. Titles to realestate properties are transferred to the buyers once full payment has been made.
• Leases of retail space and land therein, included under shopping centers, are noninterest-bearing and are collectible monthly based on the terms of the lease contracts. These are unpaidbilled receivables as of reporting date.
• Leases of office spaces, included under corporate business, are noninterest-bearing and arecollectible monthly based on the terms of the lease contracts. These are unpaid billedreceivables as of reporting date.
• Receivables from the sale of commercial lots and development rights, included undercommercial development are noninterest-bearing and are collectible in monthly or quarterlyinstallments over a period ranging from two (2) to four (4) years. Titles to real estate propertiesand development rights are not transferred to buyers until full payment has been made.
• Advances to contractors are recouped every progress billing payment depending on thepercentage of accomplishment.
• Receivables from related parties are both interest and noninterest-bearing, and are due forcollection within one year.
• Receivables from employees are composed of both interest and noninterest-bearing advancesand are collectible over a period of one year through salary deduction.
• Accrued receivable consist of receivables from rental income arising from operating lease oninvestment properties which is accounted for on a straight-line basis over the lease term andaccrual of interest income.
• Other receivables are due and demandable.
As of December 31, 2017 and 2016, “sales contract receivables” under residential development tradereceivables with a nominal amount of P=201.4 million and P=160.6 million, respectively. “Receivablesfrom the sale of development rights” under commercial development trade receivables were initiallyrecorded at fair value as of December 31, 2017. The fair value of the receivables was obtained bydiscounting future cash flows using the applicable rates of similar types of instruments.
As of December 31, 2017 and 2016, the aggregate unamortized discount on “sales contractreceivables” under residential development trade receivables amounted to P=47.5 million andP=50.5 million, respectively, and on “receivables from the sale of development rights” undercommercial development trade receivables amounted to P=7.4 million and nil, respectively.
Cebu Holdings, Inc. 2017 Integrated Report186
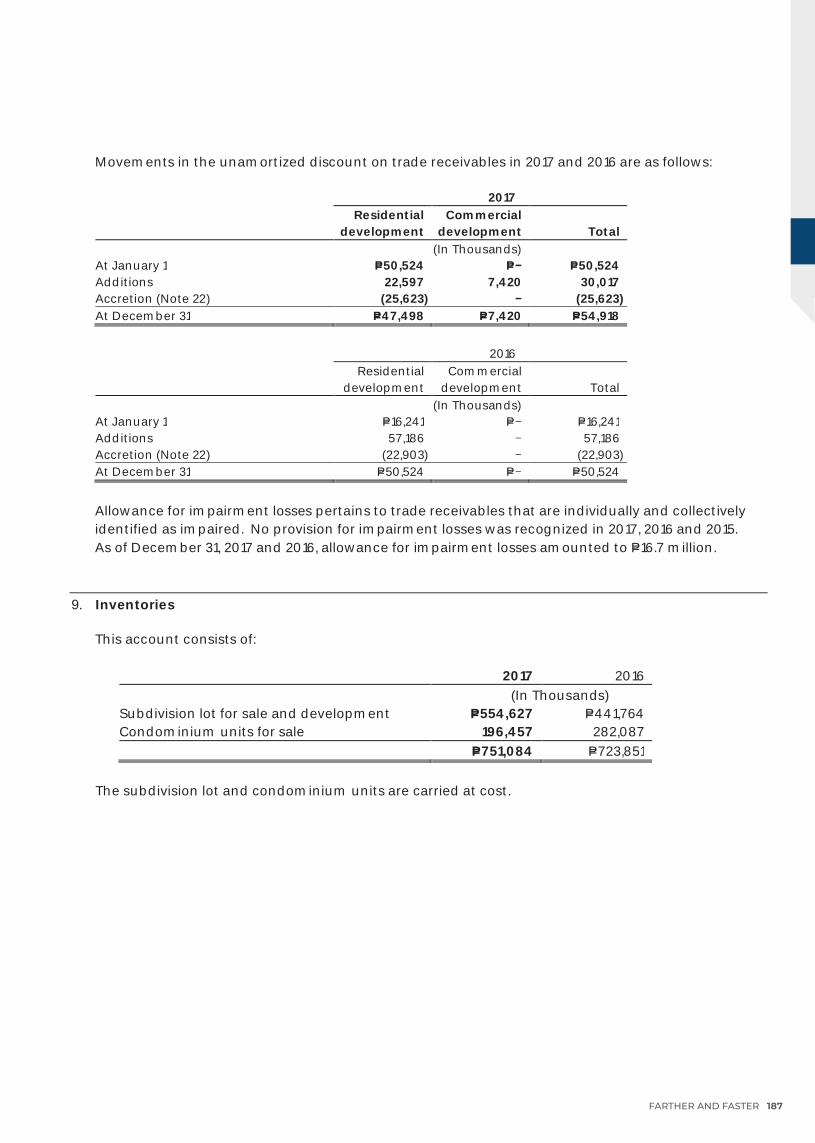
- 32 -
Movements in the unamortized discount on trade receivables in 2017 and 2016 are as follows:
2017Residential
developmentCommercial
development Total(In Thousands)
At January 1 P=50,524 P= P=50,524Additions 22,597 7,420 30,017Accretion (Note 22) (25,623) (25,623)At December 31 P=47,498 P=7,420 P=54,918
2016Residential
developmentCommercial
development Total(In Thousands)
At January 1 P=16,241 P= P=16,241Additions 57,186 57,186Accretion (Note 22) (22,903) (22,903)At December 31 P=50,524 P= P=50,524
Allowance for impairment losses pertains to trade receivables that are individually and collectivelyidentified as impaired. No provision for impairment losses was recognized in 2017, 2016 and 2015.As of December 31, 2017 and 2016, allowance for impairment losses amounted to P=16.7 million.
9. Inventories
This account consists of:
2017 2016(In Thousands)
Subdivision lot for sale and development P=554,627 P=441,764Condominium units for sale 196,457 282,087
P=751,084 P=723,851
The subdivision lot and condominium units are carried at cost.
FARTHER AND FASTER 187
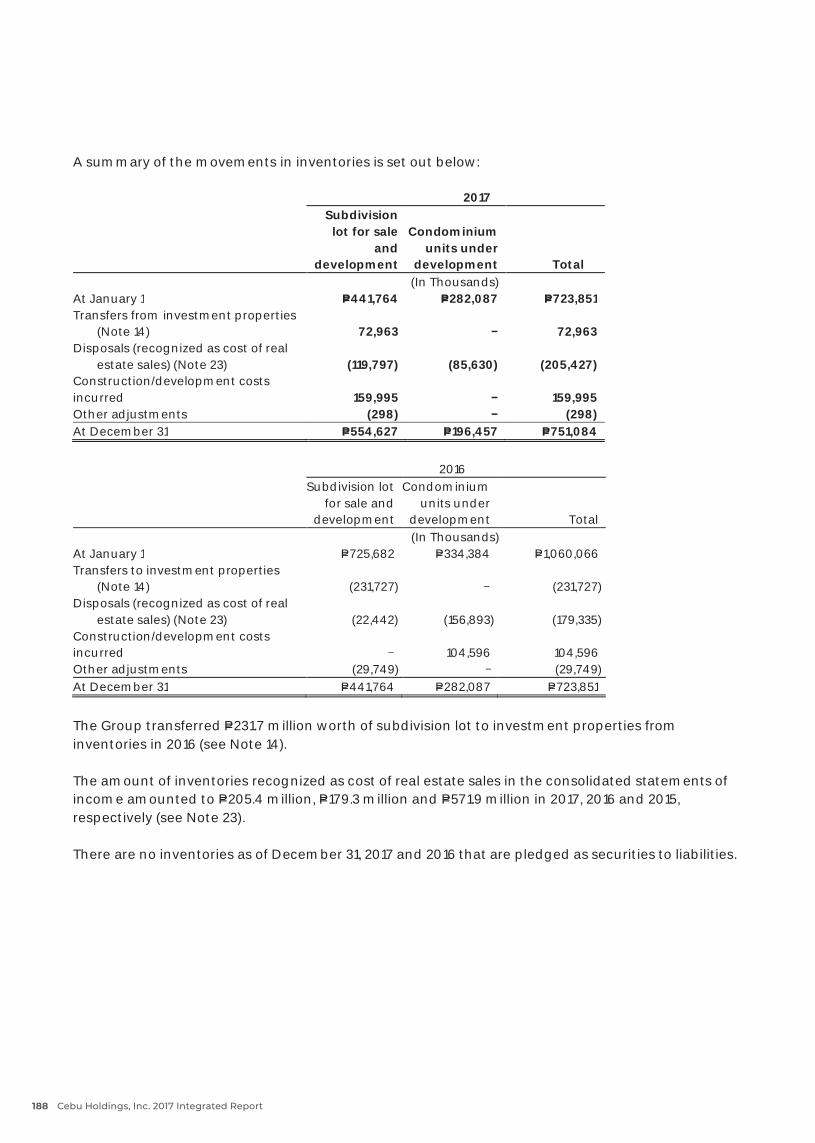
- 33 -
A summary of the movements in inventories is set out below:
2017Subdivision
lot for saleand
development
Condominium units under
development Total(In Thousands)
At January 1 P=441,764 P=282,087 P=723,851Transfers from investment properties
(Note 14) 72,963 72,963Disposals (recognized as cost of real
estate sales) (Note 23) (119,797) (85,630) (205,427)Construction/development costsincurred 159,995 159,995Other adjustments (298) (298)At December 31 P=554,627 P=196,457 P=751,084
2016Subdivision lot
for sale anddevelopment
Condominiumunits under
development Total(In Thousands)
At January 1 P=725,682 P=334,384 P=1,060,066Transfers to investment properties
(Note 14) (231,727) (231,727)Disposals (recognized as cost of real
estate sales) (Note 23) (22,442) (156,893) (179,335)Construction/development costsincurred 104,596 104,596Other adjustments (29,749) (29,749)At December 31 P=441,764 P=282,087 P=723,851
The Group transferred P=231.7 million worth of subdivision lot to investment properties frominventories in 2016 (see Note 14).
The amount of inventories recognized as cost of real estate sales in the consolidated statements ofincome amounted to P=205.4 million, P=179.3 million and P=571.9 million in 2017, 2016 and 2015,respectively (see Note 23).
There are no inventories as of December 31, 2017 and 2016 that are pledged as securities to liabilities.
Cebu Holdings, Inc. 2017 Integrated Report188
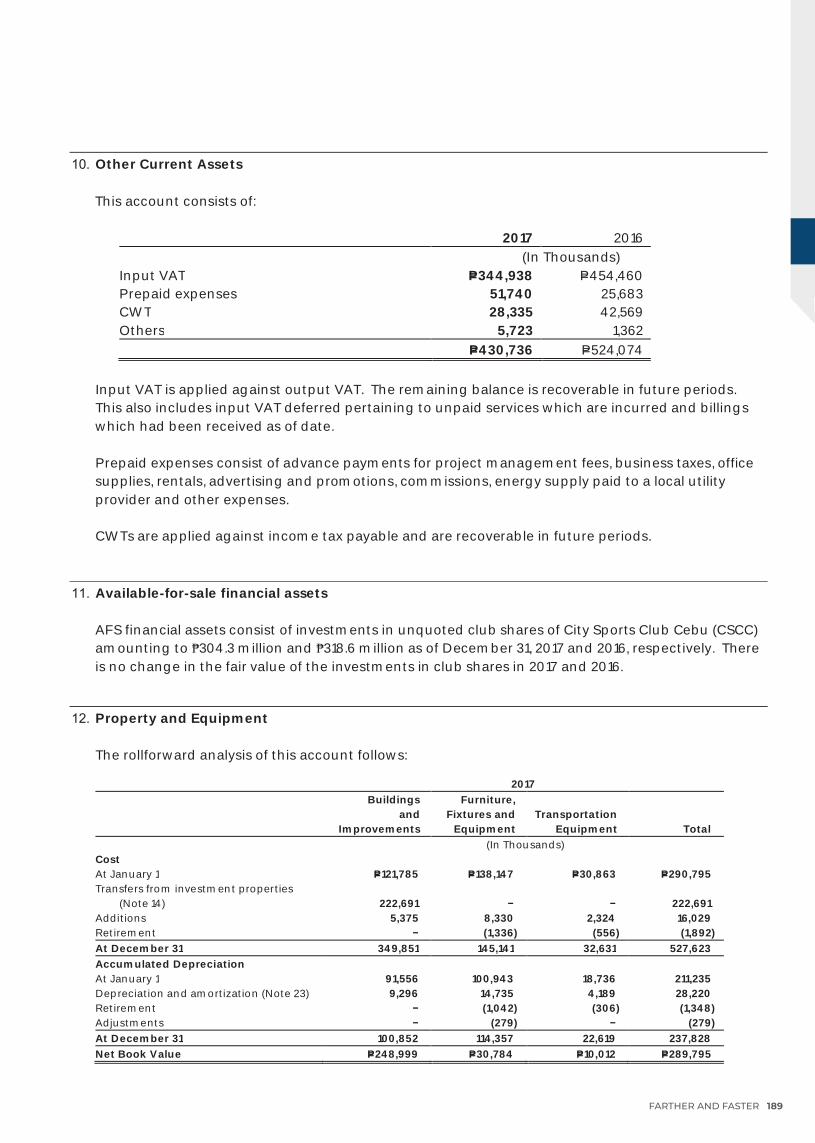
- 34 -
10. Other Current Assets
This account consists of:
2017 2016(In Thousands)
Input VAT P=344,938 P=454,460Prepaid expenses 51,740 25,683CWT 28,335 42,569Others 5,723 1,362
P=430,736 P=524,074
Input VAT is applied against output VAT. The remaining balance is recoverable in future periods.This also includes input VAT deferred pertaining to unpaid services which are incurred and billingswhich had been received as of date.
Prepaid expenses consist of advance payments for project management fees, business taxes, officesupplies, rentals, advertising and promotions, commissions, energy supply paid to a local utilityprovider and other expenses.
CWTs are applied against income tax payable and are recoverable in future periods.
11. Available-for-sale financial assets
AFS financial assets consist of investments in unquoted club shares of City Sports Club Cebu (CSCC)amounting to ₱304.3 million and ₱318.6 million as of December 31, 2017 and 2016, respectively. Thereis no change in the fair value of the investments in club shares in 2017 and 2016.
12. Property and Equipment
The rollforward analysis of this account follows:
2017Buildings
andImprovements
Furniture,Fixtures and
EquipmentTransportation
Equipment Total(In Thousands)
CostAt January 1 P=121,785 P=138,147 P=30,863 P=290,795Transfers from investment properties
(Note14) 222,691 222,691Additions 5,375 8,330 2,324 16,029Retirement (1,336) (556) (1,892)At December 31 349,851 145,141 32,631 527,623Accumulated DepreciationAt January 1 91,556 100,943 18,736 211,235Depreciation and amortization (Note23) 9,296 14,735 4,189 28,220Retirement (1,042) (306) (1,348)Adjustments (279) (279)At December 31 100,852 114,357 22,619 237,828Net Book Value P=248,999 P=30,784 P=10,012 P=289,795
FARTHER AND FASTER 189
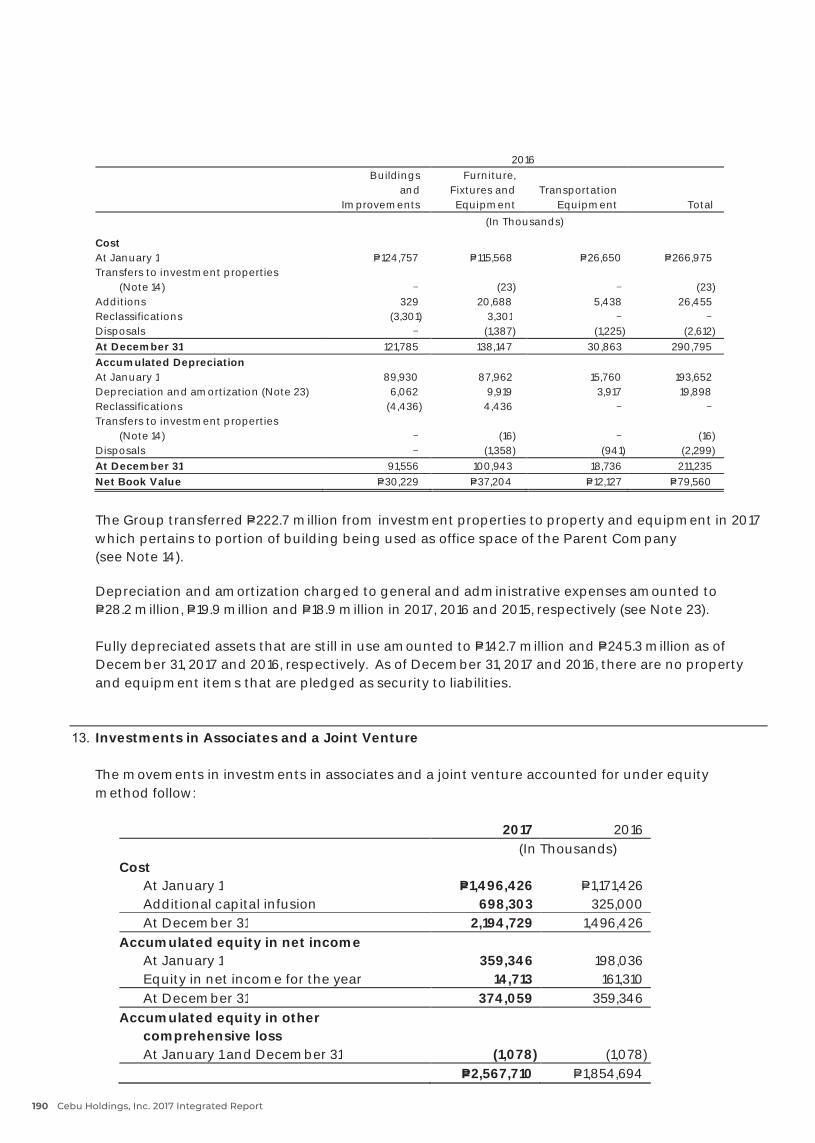
- 35 -
2016Buildings
andImprovements
Furniture,Fixtures andEquipment
TransportationEquipment Total
(In Thousands)
CostAt January 1 P=124,757 P=115,568 P=26,650 P=266,975Transfers to investment properties
(Note14) (23) (23)Additions 329 20,688 5,438 26,455Reclassifications (3,301) 3,301 Disposals (1,387) (1,225) (2,612)At December 31 121,785 138,147 30,863 290,795Accumulated DepreciationAt January 1 89,930 87,962 15,760 193,652Depreciation and amortization (Note23) 6,062 9,919 3,917 19,898Reclassifications (4,436) 4,436 Transfers to investment properties
(Note14) (16) (16)Disposals (1,358) (941) (2,299)At December 31 91,556 100,943 18,736 211,235Net Book Value P=30,229 P=37,204 P=12,127 P=79,560
The Group transferred P=222.7 million from investment properties to property and equipment in 2017which pertains to portion of building being used as office space of the Parent Company(see Note 14).
Depreciation and amortization charged to general and administrative expenses amounted toP=28.2 million, P=19.9 million and P=18.9 million in 2017, 2016 and 2015, respectively (see Note 23).
Fully depreciated assets that are still in use amounted to P=142.7 million and P=245.3 million as ofDecember 31, 2017 and 2016, respectively. As of December 31, 2017 and 2016, there are no propertyand equipment items that are pledged as security to liabilities.
13. Investments in Associates and a Joint Venture
The movements in investments in associates and a joint venture accounted for under equitymethod follow:
2017 2016(In Thousands)
CostAt January 1 P=1,496,426 P=1,171,426Additional capital infusion 698,303 325,000At December 31 2,194,729 1,496,426
Accumulated equity in net incomeAt January 1 359,346 198,036Equity in net income for the year 14,713 161,310At December 31 374,059 359,346
Accumulated equity in othercomprehensive lossAt January 1 and December 31 (1,078) (1,078)
P=2,567,710 P=1,854,694
Cebu Holdings, Inc. 2017 Integrated Report190
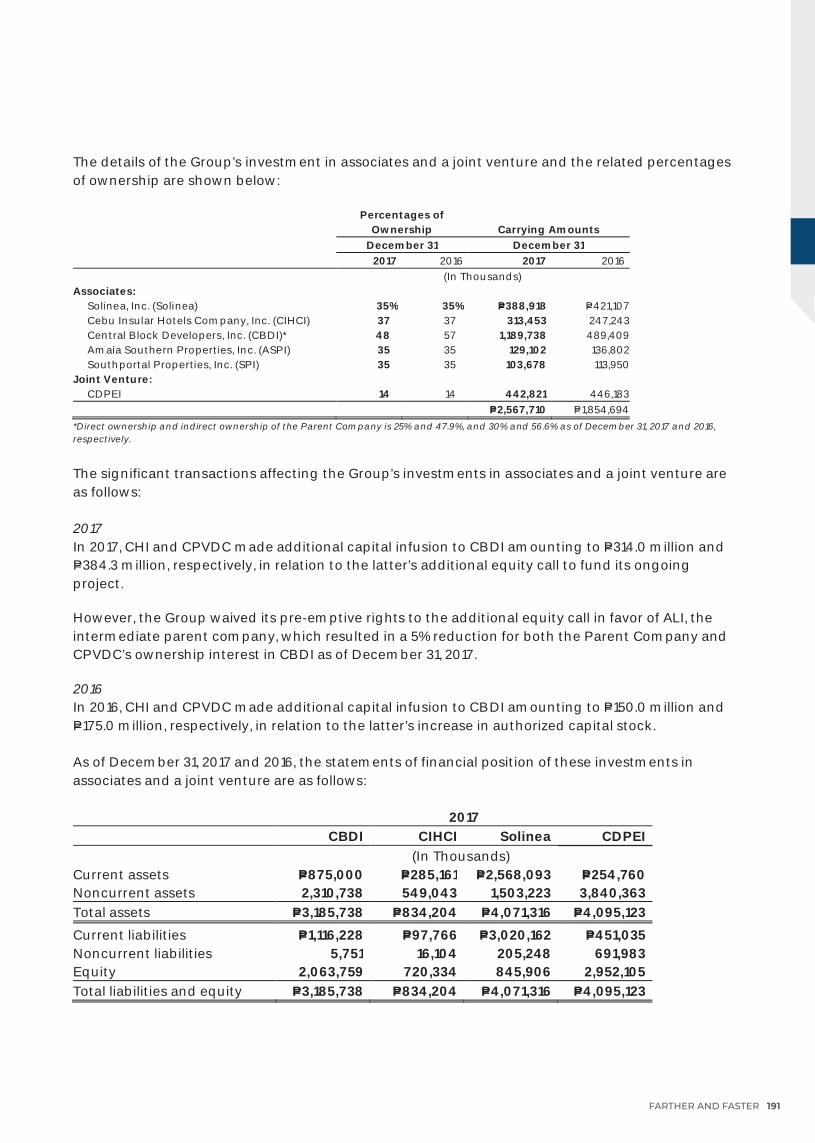
- 36 -
The details of the Group’s investment in associates and a joint venture and the related percentagesof ownership are shown below:
Percentages ofOwnership Carrying Amounts
December 31 December 312017 2016 2017 2016
(In Thousands)Associates:
Solinea, Inc. (Solinea) 35% 35% P=388,918 P=421,107Cebu Insular Hotels Company, Inc. (CIHCI) 37 37 313,453 247,243Central Block Developers, Inc. (CBDI)* 48 57 1,189,738 489,409Amaia Southern Properties, Inc. (ASPI) 35 35 129,102 136,802Southportal Properties, Inc. (SPI) 35 35 103,678 113,950
Joint Venture:CDPEI 14 14 442,821 446,183
P=2,567,710 P=1,854,694*Direct ownership and indirect ownership of the Parent Company is 25% and 47.9%, and 30% and 56.6% as of December 31, 2017 and 2016,respectively.
The significant transactions affecting the Group’s investments in associates and a joint venture areas follows:
2017In 2017, CHI and CPVDC made additional capital infusion to CBDI amounting to P=314.0 million andP=384.3 million, respectively, in relation to the latter’s additional equity call to fund its ongoingproject.
However, the Group waived its pre-emptive rights to the additional equity call in favor of ALI, theintermediate parent company, which resulted in a 5% reduction for both the Parent Company andCPVDC’s ownership interest in CBDI as of December 31, 2017.
2016In 2016, CHI and CPVDC made additional capital infusion to CBDI amounting to P=150.0 million andP=175.0 million, respectively, in relation to the latter’s increase in authorized capital stock.
As of December 31, 2017 and 2016, the statements of financial position of these investments inassociates and a joint venture are as follows:
2017 CBDI CIHCI Solinea CDPEI
(In Thousands)Current assets P=875,000 P=285,161 P=2,568,093 P=254,760Noncurrent assets 2,310,738 549,043 1,503,223 3,840,363Total assets P=3,185,738 P=834,204 P=4,071,316 P=4,095,123
Current liabilities P=1,116,228 P=97,766 P=3,020,162 P=451,035Noncurrent liabilities 5,751 16,104 205,248 691,983Equity 2,063,759 720,334 845,906 2,952,105Total liabilities and equity P=3,185,738 P=834,204 P=4,071,316 P=4,095,123
FARTHER AND FASTER 191
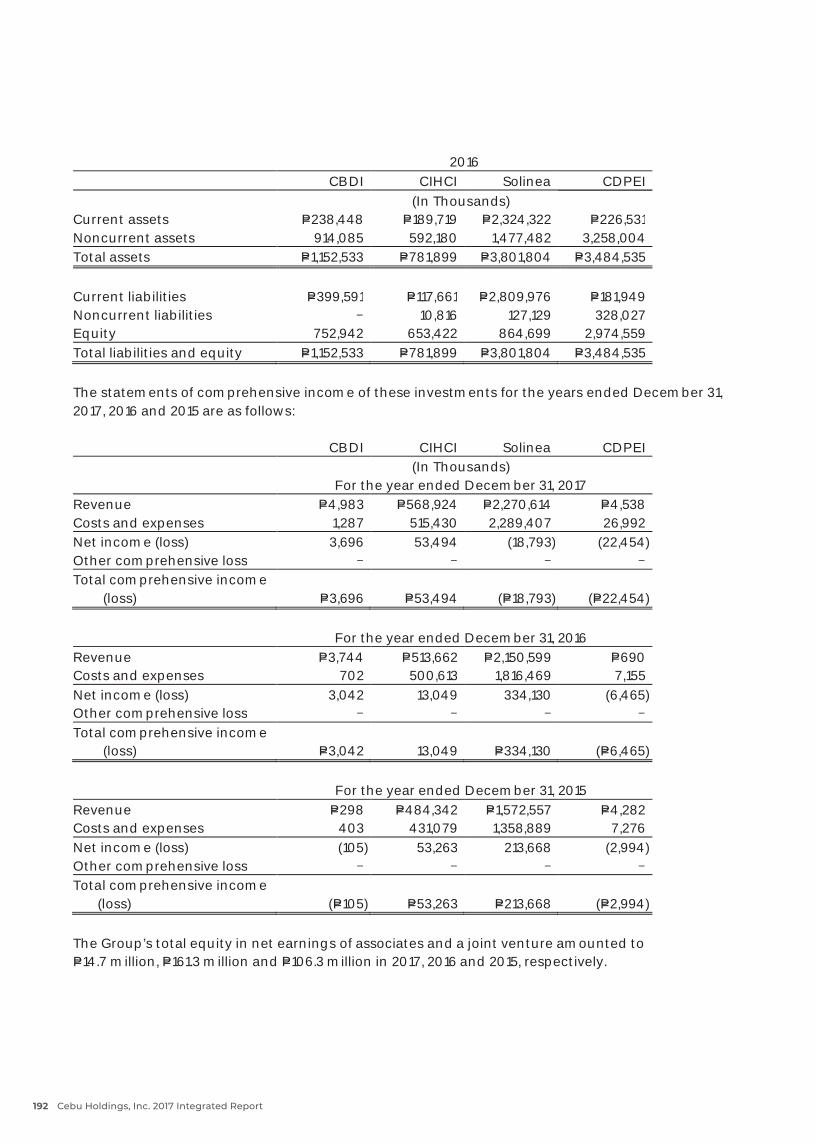
- 37 -
2016 CBDI CIHCI Solinea CDPEI
(In Thousands)Current assets P=238,448 P=189,719 P=2,324,322 P=226,531Noncurrent assets 914,085 592,180 1,477,482 3,258,004Total assets P=1,152,533 P=781,899 P=3,801,804 P=3,484,535
Current liabilities P=399,591 P=117,661 P=2,809,976 P=181,949Noncurrent liabilities 10,816 127,129 328,027Equity 752,942 653,422 864,699 2,974,559Total liabilities and equity P=1,152,533 P=781,899 P=3,801,804 P=3,484,535
The statements of comprehensive income of these investments for the years ended December 31,2017, 2016 and 2015 are as follows:
CBDI CIHCI Solinea CDPEI(In Thousands)
For the year ended December 31, 2017Revenue P=4,983 P=568,924 P=2,270,614 P=4,538Costs and expenses 1,287 515,430 2,289,407 26,992Net income (loss) 3,696 53,494 (18,793) (22,454)Other comprehensive loss Total comprehensive income
(loss) P=3,696 P=53,494 (P=18,793) (P=22,454)
For the year ended December 31, 2016Revenue P=3,744 P=513,662 P=2,150,599 P=690Costs and expenses 702 500,613 1,816,469 7,155Net income (loss) 3,042 13,049 334,130 (6,465)Other comprehensive loss Total comprehensive income
(loss) P=3,042 13,049 P=334,130 (P=6,465)
For the year ended December 31, 2015Revenue P=298 P=484,342 P=1,572,557 P=4,282Costs and expenses 403 431,079 1,358,889 7,276Net income (loss) (105) 53,263 213,668 (2,994)Other comprehensive loss Total comprehensive income
(loss) (P=105) P=53,263 P=213,668 (P=2,994)
The Group’s total equity in net earnings of associates and a joint venture amounted toP=14.7 million, P=161.3 million and P=106.3 million in 2017, 2016 and 2015, respectively.
Cebu Holdings, Inc. 2017 Integrated Report192

- 38 -
The aggregate financial information on associates on which the Group has immaterial interests inASPI and SPI as of and for the years ended December 31 follows:
2017 2016 2015(In Thousands)
Carrying amount P=232,780 P=250,753 P=212,232Share in net income/total
comprehensive income 2,802 38,521 12,297
14. Investment Properties
The rollforward analysis of this account follows:
2017
LandLand
ImprovementsBuildings and
ImprovementsConstruction-in-
Progress Total(In Thousands)
CostAt January 1 P=2,348,305 P=14,059 P=9,506,002 P=1,756,645 P=13,625,011Additions 97,686 326 1,315,308 (780,380) 632,940Transfers to:
Property and equipment(Note 12) (222,691) (222,691)
Inventories (Note 9) (72,963) (72,963)At December 31 2,373,028 14,385 10,821,310 753,574 13,962,297Accumulated DepreciationAt January 1 2,343 2,611,562 2,613,905Depreciation and amortization
(Note 23) 2,812 464,578 467,390Adjustments (58) (58)At December 31 5,155 3,076,082 3,081,237Net Book Value P=2,373,028 P=9,230 P=7,745,228 P=753,574 P=10,881,060
2016
LandLand
ImprovementsBuildings and
ImprovementsConstruction-in-
Progress Total(In Thousands)
CostAt January 1 P=2,113,440 P= P=8,507,125 P=1,947,581 P=12,568,146Additions 3,349 14,059 194,807 641,808 854,023Transfers from inventories
(Note 9) 231,727 231,727Reclassification (211) 832,744 (832,744) (211)Transfers from property and
equipment (Notes 12and 32) 23 23
Disposals (28,697) (28,697)At December 31 2,348,305 14,059 9,506,002 1,756,645 13,625,011Accumulated DepreciationAt January 1 2,256,856 2,256,856Depreciation and amortization
(Note 23) 2,343 379,829 382,172Transfers from property and
equipment (Notes 12 and 32) 16 16Disposals (25,139) (25,139)At December 31 2,343 2,611,562 2,613,905Net Book Value P=2,348,305 P=11,716 P=6,894,440 P=1,756,645 P=11,011,106
The Group’s investment properties consist of land and building held for commercial leasing to earnrentals.
FARTHER AND FASTER 193
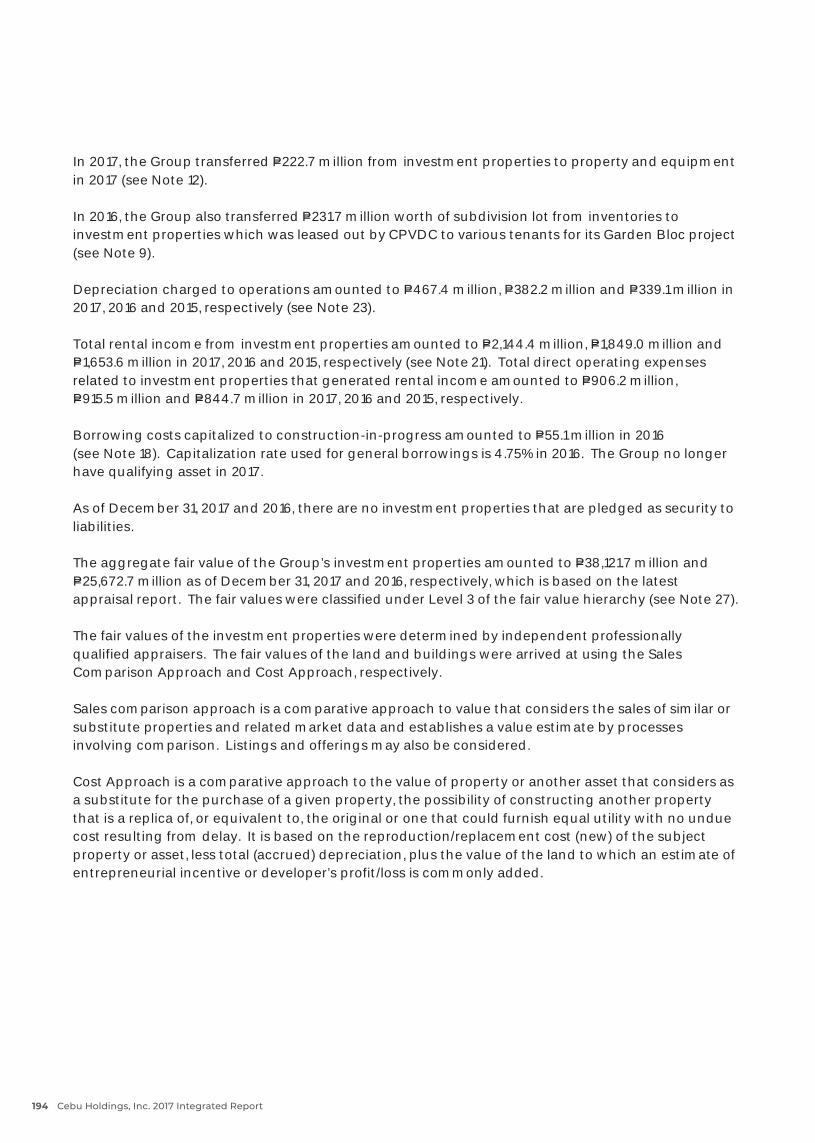
- 39 -
In 2017, the Group transferred P=222.7 million from investment properties to property and equipmentin 2017 (see Note 12).
In 2016, the Group also transferred P=231.7 million worth of subdivision lot from inventories toinvestment properties which was leased out by CPVDC to various tenants for its Garden Bloc project(see Note 9).
Depreciation charged to operations amounted to P=467.4 million, P=382.2 million and P=339.1 million in2017, 2016 and 2015, respectively (see Note 23).
Total rental income from investment properties amounted to P=2,144.4 million, P=1,849.0 million andP=1,653.6 million in 2017, 2016 and 2015, respectively (seeNote21). Total direct operating expensesrelated to investment properties that generated rental income amounted to P=906.2 million,P=915.5 million and P=844.7 million in 2017, 2016 and 2015, respectively.
Borrowing costs capitalized to construction-in-progress amounted to P=55.1 million in 2016(see Note 18). Capitalization rate used for general borrowings is 4.75% in 2016. The Group no longerhave qualifying asset in 2017.
As of December 31, 2017 and 2016, there are no investment properties that are pledged as security toliabilities.
The aggregate fair value of the Group’s investment properties amounted to P=38,121.7 million andP=25,672.7 million as of December 31, 2017 and 2016, respectively, which is based on the latestappraisal report. The fair values were classified under Level 3 of the fair value hierarchy (see Note 27).
The fair values of the investment properties were determined by independent professionallyqualified appraisers. The fair values of the land and buildings were arrived at using the SalesComparison Approach and Cost Approach, respectively.
Sales comparison approach is a comparative approach to value that considers the sales of similar orsubstitute properties and related market data and establishes a value estimate by processesinvolving comparison. Listings and offerings may also be considered.
Cost Approach is a comparative approach to the value of property or another asset that considers asa substitute for the purchase of a given property, the possibility of constructing another propertythat is a replica of, or equivalent to, the original or one that could furnish equal utility with no unduecost resulting from delay. It is based on the reproduction/replacement cost (new) of the subjectproperty or asset, less total (accrued) depreciation, plus the value of the land to which an estimate ofentrepreneurial incentive or developer’s profit/loss is commonly added.
Cebu Holdings, Inc. 2017 Integrated Report194
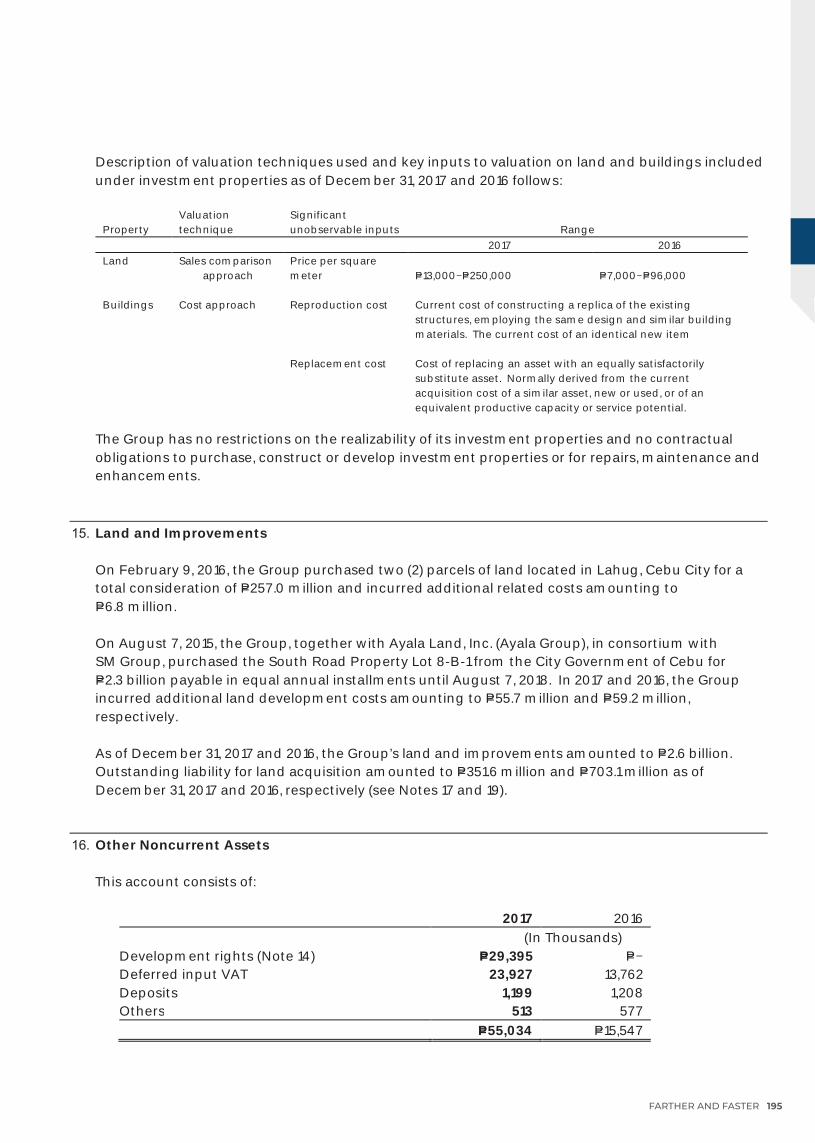
- 40 -
Description of valuation techniques used and key inputs to valuation on land and buildings includedunder investment properties as of December 31, 2017 and 2016 follows:
PropertyValuationtechnique
Significantunobservable inputs Range
2017 2016Land Sales comparison
approachPrice per squaremeter P=13,000 P=250,000 P=7,000 P=96,000
Buildings Cost approach Reproduction cost Current cost of constructing a replica of the existingstructures, employing the same design and similar buildingmaterials. The current cost of an identical new item
Replacement cost Cost of replacing an asset with an equally satisfactorilysubstitute asset. Normally derived from the currentacquisition cost of a similar asset, new or used, or of anequivalent productive capacity or service potential.
The Group has no restrictions on the realizability of its investment properties and no contractualobligations to purchase, construct or develop investment properties or for repairs, maintenance andenhancements.
15. Land and Improvements
On February 9, 2016, the Group purchased two (2) parcels of land located in Lahug, Cebu City for atotal consideration of P=257.0 million and incurred additional related costs amounting toP=6.8 million.
On August 7, 2015, the Group, together with Ayala Land, Inc. (Ayala Group), in consortium withSM Group, purchased the South Road Property Lot 8-B-1 from the City Government of Cebu forP=2.3 billion payable in equal annual installments until August 7, 2018. In 2017 and 2016, the Groupincurred additional land development costs amounting to P=55.7 million and P=59.2 million,respectively.
As of December 31, 2017 and 2016, the Group’s land and improvements amounted to P=2.6 billion.Outstanding liability for land acquisition amounted to P=351.6 million and P=703.1 million as ofDecember 31, 2017 and 2016, respectively (see Notes 17 and 19).
16. Other Noncurrent Assets
This account consists of:
2017 2016(In Thousands)
Development rights (Note 14) P=29,395 P= Deferred input VAT 23,927 13,762Deposits 1,199 1,208Others 513 577
P=55,034 P=15,547
FARTHER AND FASTER 195
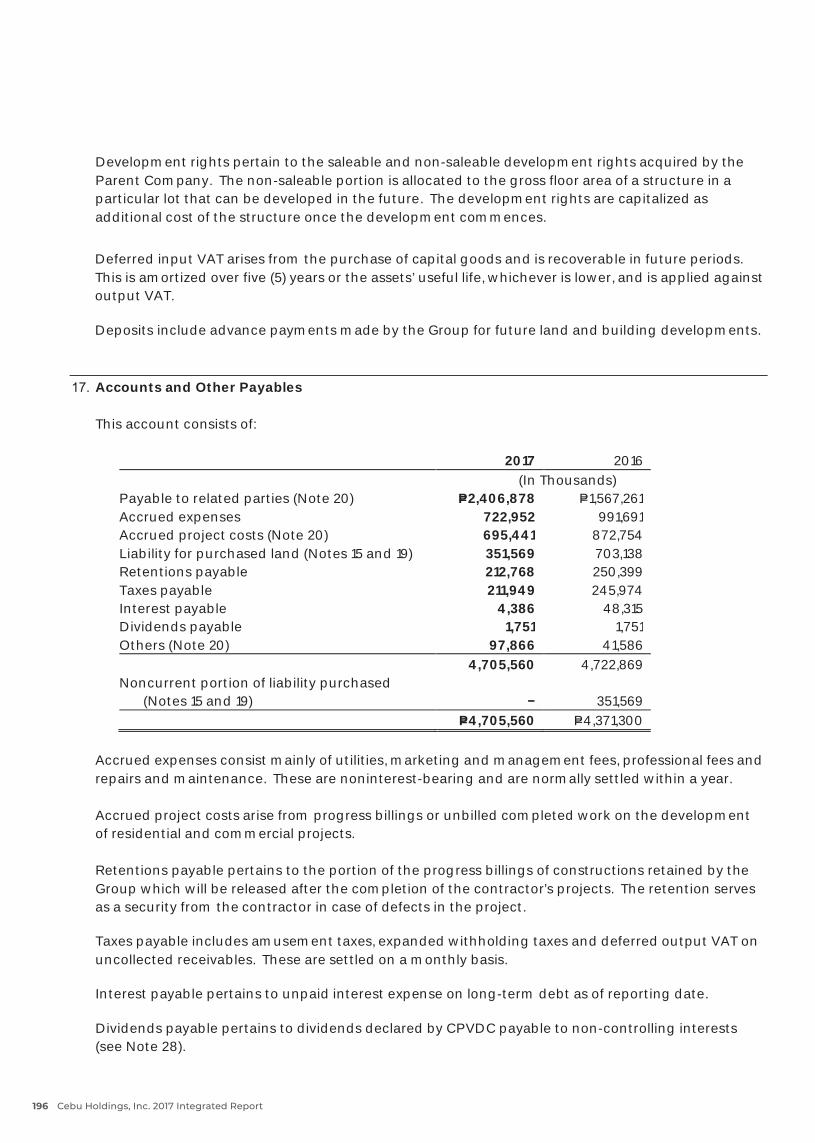
- 41 -
Development rights pertain to the saleable and non-saleable development rights acquired by theParent Company. The non-saleable portion is allocated to the gross floor area of a structure in aparticular lot that can be developed in the future. The development rights are capitalized asadditional cost of the structure once the development commences.
Deferred input VAT arises from the purchase of capital goods and is recoverable in future periods.This is amortized over five (5) years or the assets’ useful life, whichever is lower, and is applied againstoutput VAT.
Deposits include advance payments made by the Group for future land and building developments.
17. Accounts and Other Payables
This account consists of:
2017 2016(In Thousands)
Payable to related parties (Note 20) P=2,406,878 P=1,567,261Accrued expenses 722,952 991,691Accrued project costs (Note 20) 695,441 872,754Liability for purchased land (Notes 15 and 19) 351,569 703,138Retentions payable 212,768 250,399Taxes payable 211,949 245,974Interest payable 4,386 48,315Dividends payable 1,751 1,751Others (Note 20) 97,866 41,586
4,705,560 4,722,869Noncurrent portion of liability purchased
(Notes 15 and 19) 351,569P=4,705,560 P=4,371,300
Accrued expenses consist mainly of utilities, marketing and management fees, professional fees andrepairs and maintenance. These are noninterest-bearing and are normally settled within a year.
Accrued project costs arise from progress billings or unbilled completed work on the developmentof residential and commercial projects.
Retentions payable pertains to the portion of the progress billings of constructions retained by theGroup which will be released after the completion of the contractor’s projects. The retention servesas a security from the contractor in case of defects in the project.
Taxes payable includes amusement taxes, expanded withholding taxes and deferred output VAT onuncollected receivables. These are settled on a monthly basis.
Interest payable pertains to unpaid interest expense on long-term debt as of reporting date.
Dividends payable pertains to dividends declared by CPVDC payable to non-controlling interests(see Note 28).
Cebu Holdings, Inc. 2017 Integrated Report196

- 42 -
Noncurrent portion of liability for land purchased is presented as part of “Deposits and othernoncurrent liabilities” in the consolidated statements of financial position.
Other payables are noninterest-bearing and are normally settled within one year. This also includesthe Parent Company’s payable to a related party for the purchase of commercial units (see Note 20).
18. Long-term Debt
This account consists of long-term bonds and bank loans of the Group as follows:
2017 2016(In Thousands)
Bonds:Due 2021 (Note 18a) P=5,000,000 P=5,000,000
Bank Loans:BSP overnight reverse repurchase
agreement rate plus 0.25% per annum,inclusive of gross receipts tax (Note18b) 404,250
Fixed rate corporate notes with interestrate of 4.75% per annum (Note 18c) 378,000 399,000
BSP Overnight Reverse repurchaseRepurchase Agreement Rate plus0.25% per annum, inclusive of grossreceipts tax (Note 18d) 363,875 378,125
At 0.70% per annum spread over the 90-day PDST-R2 (Note 18e) 340,000
At 0.65% per annum spread over theaverage floating rate of 91-day treasurybill rate; Interest payable every quarter,50% of principal is payable in equalquarterly installment and theremaining 50% is payable on maturitydate (Note 18f) 405,000
At 0.50% per annum spread over theaverage fixed rate of 7-year treasurybond rate on PDST-R2 rate (Notes 18f) 3,000
6,486,125 6,185,125Less unamortized debt issue cost 32,549 36,814
6,453,576 6,148,311Less current portion 59,942 442,279
P=6,393,634 P=5,706,032
The Group’s long-term debt are all unsecured. Debt issue costs are deferred and amortized usingeffective interest method over the term of the loans.
FARTHER AND FASTER 197
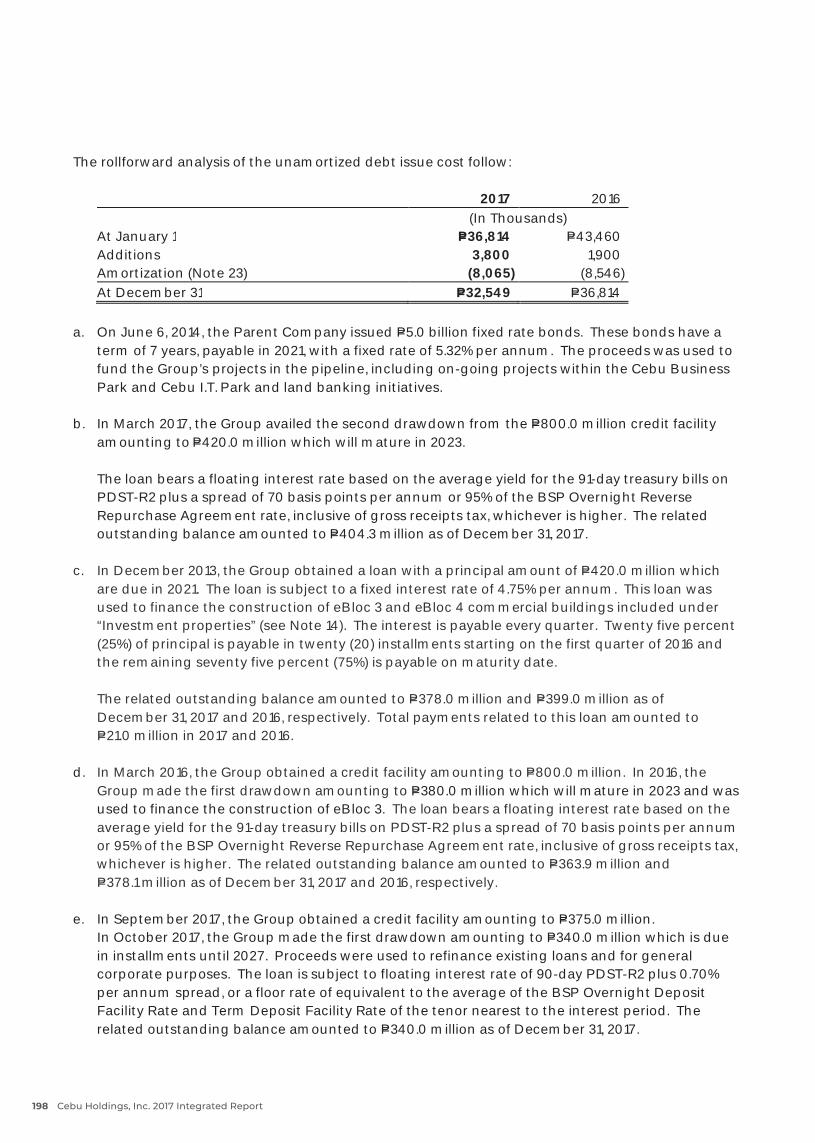
- 43 -
The rollforward analysis of the unamortized debt issue cost follow:
2017 2016(In Thousands)
At January 1 P=36,814 P=43,460Additions 3,800 1,900Amortization (Note 23) (8,065) (8,546)At December 31 P=32,549 P=36,814
a. On June 6, 2014, the Parent Company issued P=5.0 billion fixed rate bonds. These bonds have aterm of 7 years, payable in 2021, with a fixed rate of 5.32% per annum. The proceeds was used tofund the Group’s projects in the pipeline, including on-going projects within the Cebu BusinessPark and Cebu I.T. Park and land banking initiatives.
b. In March 2017, the Group availed the second drawdown from the P=800.0 million credit facilityamounting toP=420.0 million which will mature in 2023.
The loan bears a floating interest rate based on the average yield for the 91-day treasury bills onPDST-R2 plus a spread of 70 basis points per annum or 95% of the BSP Overnight ReverseRepurchase Agreement rate, inclusive of gross receipts tax, whichever is higher. The relatedoutstanding balance amounted toP=404.3 million as of December 31, 2017.
c. In December 2013, the Group obtained a loan with a principal amount of P=420.0 million whichare due in 2021. The loan is subject to a fixed interest rate of 4.75% per annum. This loan wasused to finance the construction of eBloc 3 and eBloc 4 commercial buildings included under“Investment properties” (see Note 14). The interest is payable every quarter. Twenty five percent(25%) of principal is payable in twenty (20) installments starting on the first quarter of 2016 andthe remaining seventy five percent (75%) is payable on maturity date.
The related outstanding balance amounted to P=378.0 million and P=399.0 million as ofDecember 31, 2017 and 2016, respectively. Total payments related to this loan amounted toP=21.0 million in 2017 and 2016.
d. In March 2016, the Group obtained a credit facility amounting to P=800.0 million. In 2016, theGroup made the first drawdown amounting to P=380.0 million which will mature in 2023 and wasused to finance the construction of eBloc 3. The loan bears a floating interest rate based on theaverage yield for the 91-day treasury bills on PDST-R2 plus a spread of 70 basis points per annumor 95% of the BSP Overnight Reverse Repurchase Agreement rate, inclusive of gross receipts tax,whichever is higher. The related outstanding balance amounted to P=363.9 million andP=378.1 million as of December 31, 2017 and 2016, respectively.
e. In September 2017, the Group obtained a credit facility amounting to P=375.0 million.In October 2017, the Group made the first drawdown amounting to P=340.0 million which is duein installments until 2027. Proceeds were used to refinance existing loans and for generalcorporate purposes. The loan is subject to floating interest rate of 90-day PDST-R2 plus 0.70%per annum spread, or a floor rate of equivalent to the average of the BSP Overnight DepositFacility Rate and Term Deposit Facility Rate of the tenor nearest to the interest period. Therelated outstanding balance amounted to P=340.0 million as of December 31, 2017.
Cebu Holdings, Inc. 2017 Integrated Report198
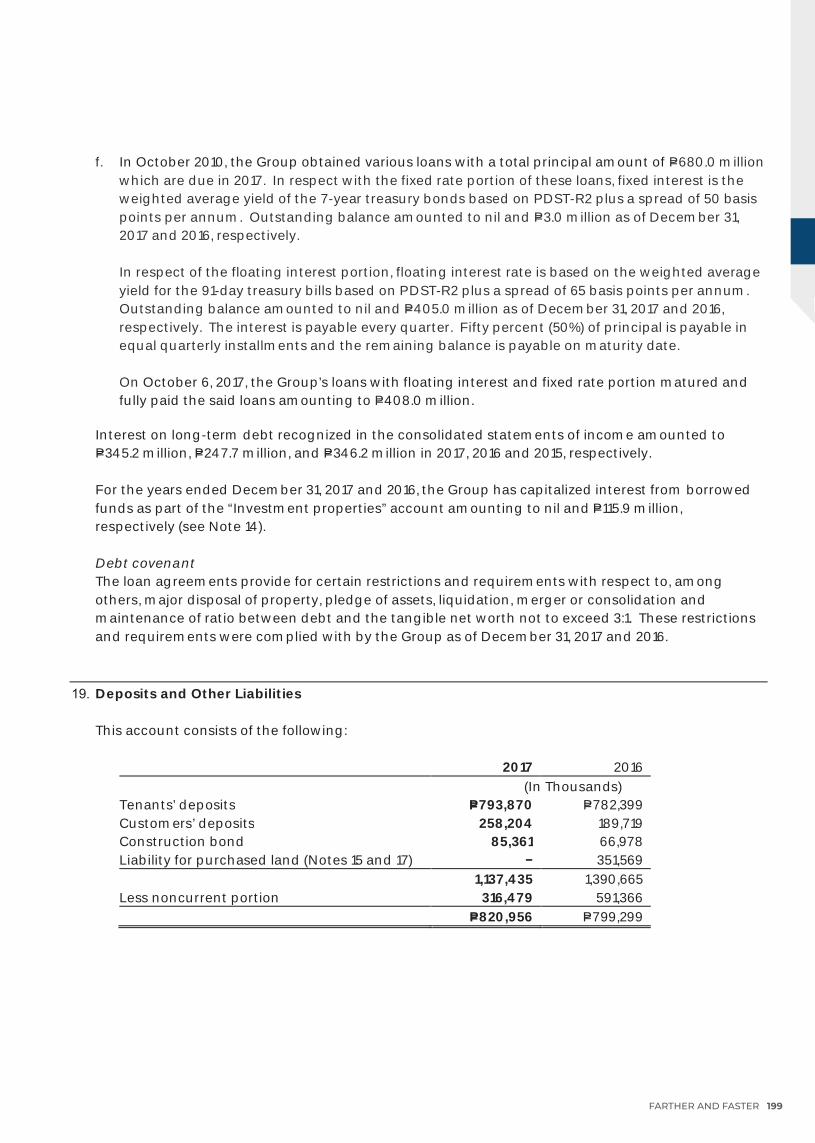
- 44 -
f. In October 2010, the Group obtained various loans with a total principal amount of P=680.0 millionwhich are due in 2017. In respect with the fixed rate portion of these loans, fixed interest is theweighted average yield of the 7-year treasury bonds based on PDST-R2 plus a spread of 50 basispoints per annum. Outstanding balance amounted to nil and P=3.0 million as of December 31,2017 and 2016, respectively.
In respect of the floating interest portion, floating interest rate is based on the weighted averageyield for the 91-day treasury bills based on PDST-R2 plus a spread of 65 basis points per annum.Outstanding balance amounted to nil and P=405.0 million as of December 31, 2017 and 2016,respectively. The interest is payable every quarter. Fifty percent (50%) of principal is payable inequal quarterly installments and the remaining balance is payable on maturity date.
On October 6, 2017, the Group’s loans with floating interest and fixed rate portion matured andfully paid the said loans amounting to P=408.0 million.
Interest on long-term debt recognized in the consolidated statements of income amounted toP=345.2 million, P=247.7 million, and P=346.2 million in 2017, 2016 and 2015, respectively.
For the years ended December 31, 2017 and 2016, the Group has capitalized interest from borrowedfunds as part of the “Investment properties” account amounting to nil and P=115.9 million,respectively (see Note 14).
Debt covenantThe loan agreements provide for certain restrictions and requirements with respect to, amongothers, major disposal of property, pledge of assets, liquidation, merger or consolidation andmaintenance of ratio between debt and the tangible net worth not to exceed 3:1. These restrictionsand requirements were complied with by the Group as of December 31, 2017 and 2016.
19. Deposits and Other Liabilities
This account consists of the following:
2017 2016(In Thousands)
Tenants’ deposits P=793,870 P=782,399Customers’ deposits 258,204 189,719Construction bond 85,361 66,978Liability for purchased land (Notes 15 and 17) 351,569
1,137,435 1,390,665Less noncurrent portion 316,479 591,366
P=820,956 P=799,299
FARTHER AND FASTER 199
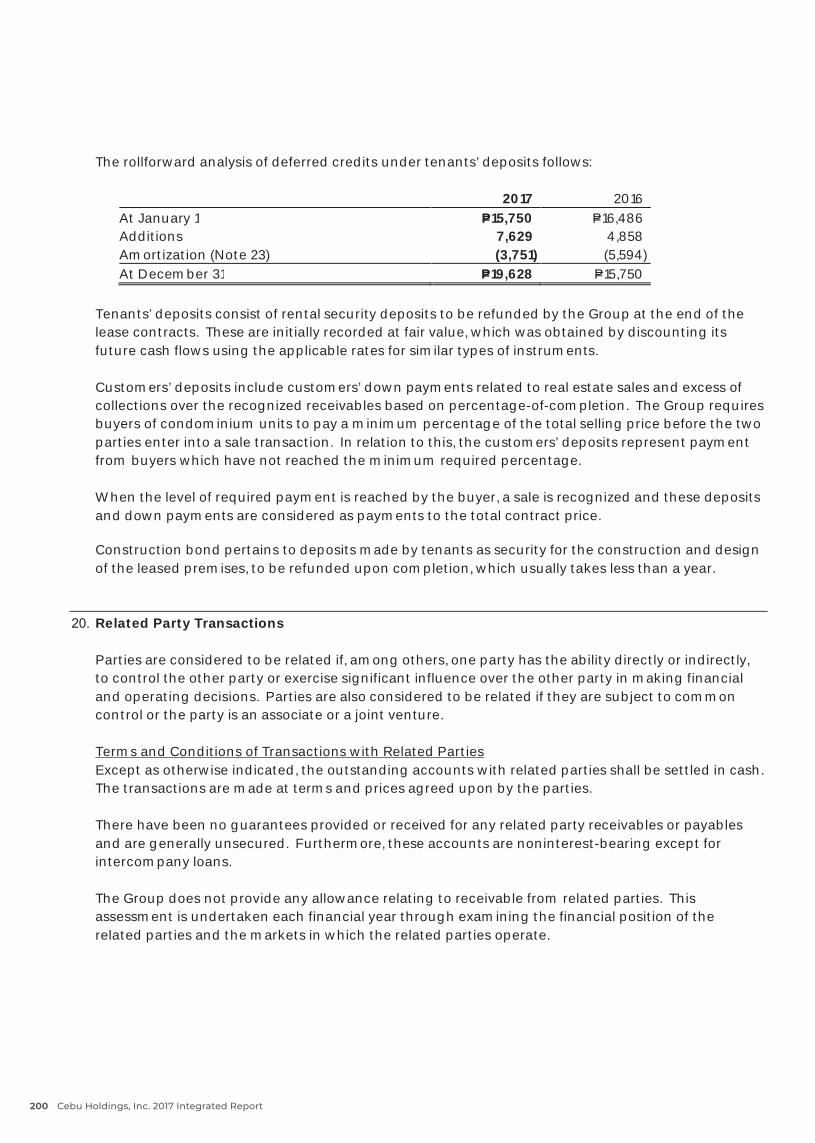
- 45 -
The rollforward analysis of deferred credits under tenants’ deposits follows:
2017 2016At January 1 P=15,750 P=16,486Additions 7,629 4,858Amortization (Note 23) (3,751) (5,594)At December 31 P=19,628 P=15,750
Tenants’ deposits consist of rental security deposits to be refunded by the Group at the end of thelease contracts. These are initially recorded at fair value, which was obtained by discounting itsfuture cash flows using the applicable rates for similar types of instruments.
Customers’ deposits include customers’ down payments related to real estate sales and excess ofcollections over the recognized receivables based on percentage-of-completion. The Group requiresbuyers of condominium units to pay a minimum percentage of the total selling price before the twoparties enter into a sale transaction. In relation to this, the customers’ deposits represent paymentfrom buyers which have not reached the minimum required percentage.
When the level of required payment is reached by the buyer, a sale is recognized and these depositsand down payments are considered as payments to the total contract price.
Construction bond pertains to deposits made by tenants as security for the construction and designof the leased premises, to be refunded upon completion, which usually takes less than a year.
20. Related Party Transactions
Parties are considered to be related if, among others, one party has the ability directly or indirectly,to control the other party or exercise significant influence over the other party in making financialand operating decisions. Parties are also considered to be related if they are subject to commoncontrol or the party is an associate or a joint venture.
Terms and Conditions of Transactions with Related PartiesExcept as otherwise indicated, the outstanding accounts with related parties shall be settled in cash.The transactions are made at terms and prices agreed upon by the parties.
There have been no guarantees provided or received for any related party receivables or payablesand are generally unsecured. Furthermore, these accounts are noninterest-bearing except forintercompany loans.
The Group does not provide any allowance relating to receivable from related parties. Thisassessment is undertaken each financial year through examining the financial position of therelated parties and the markets in which the related parties operate.
Cebu Holdings, Inc. 2017 Integrated Report200
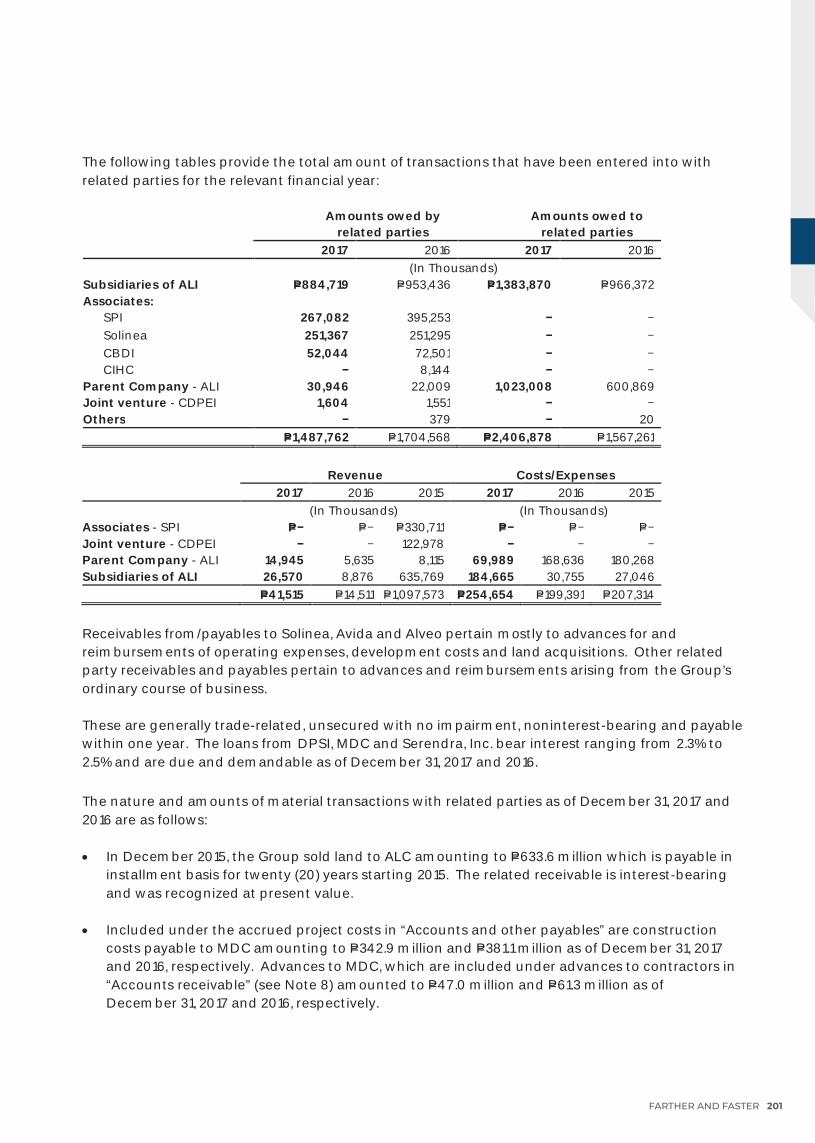
- 46 -
The following tables provide the total amount of transactions that have been entered into withrelated parties for the relevant financial year:
Amounts owed byrelated parties
Amounts owed torelated parties
2017 2016 2017 2016(In Thousands)
Subsidiaries of ALI P=884,719 P=953,436 P=1,383,870 P=966,372Associates:
SPI 267,082 395,253 Solinea 251,367 251,295 CBDI 52,044 72,501 CIHC 8,144
Parent Company - ALI 30,946 22,009 1,023,008 600,869Joint venture - CDPEI 1,604 1,551 Others 379 20 P=1,487,762 P=1,704,568 P=2,406,878 P=1,567,261
Revenue Costs/Expenses 2017 2016 2015 2017 2016 2015
(In Thousands) (In Thousands)Associates - SPI P= P= P=330,711 P= P= P= Joint venture - CDPEI 122,978 Parent Company - ALI 14,945 5,635 8,115 69,989 168,636 180,268Subsidiaries of ALI 26,570 8,876 635,769 184,665 30,755 27,046
P=41,515 P=14,511 P=1,097,573 P=254,654 P=199,391 P=207,314
Receivables from/payables to Solinea, Avida and Alveo pertain mostly to advances for andreimbursements of operating expenses, development costs and land acquisitions. Other relatedparty receivables and payables pertain to advances and reimbursements arising from the Group’sordinary course of business.
These are generally trade-related, unsecured with no impairment, noninterest-bearing and payablewithin one year. The loans from DPSI, MDC and Serendra, Inc. bear interest ranging from 2.3% to2.5% and are due and demandable as of December 31, 2017 and 2016.
The nature and amounts of material transactions with related parties as of December 31, 2017 and2016 are as follows:
• In December 2015, the Group sold land to ALC amounting to P=633.6 million which is payable ininstallment basis for twenty (20) years starting 2015. The related receivable is interest-bearingand was recognized at present value.
• Included under the accrued project costs in “Accounts and other payables” are constructioncosts payable to MDC amounting to P=342.9 million and P=381.1 million as of December 31, 2017and 2016, respectively. Advances to MDC, which are included under advances to contractors in“Accounts receivable” (see Note 8) amounted to P=47.0 million and P=61.3 million as ofDecember 31, 2017 and 2016, respectively.
FARTHER AND FASTER 201
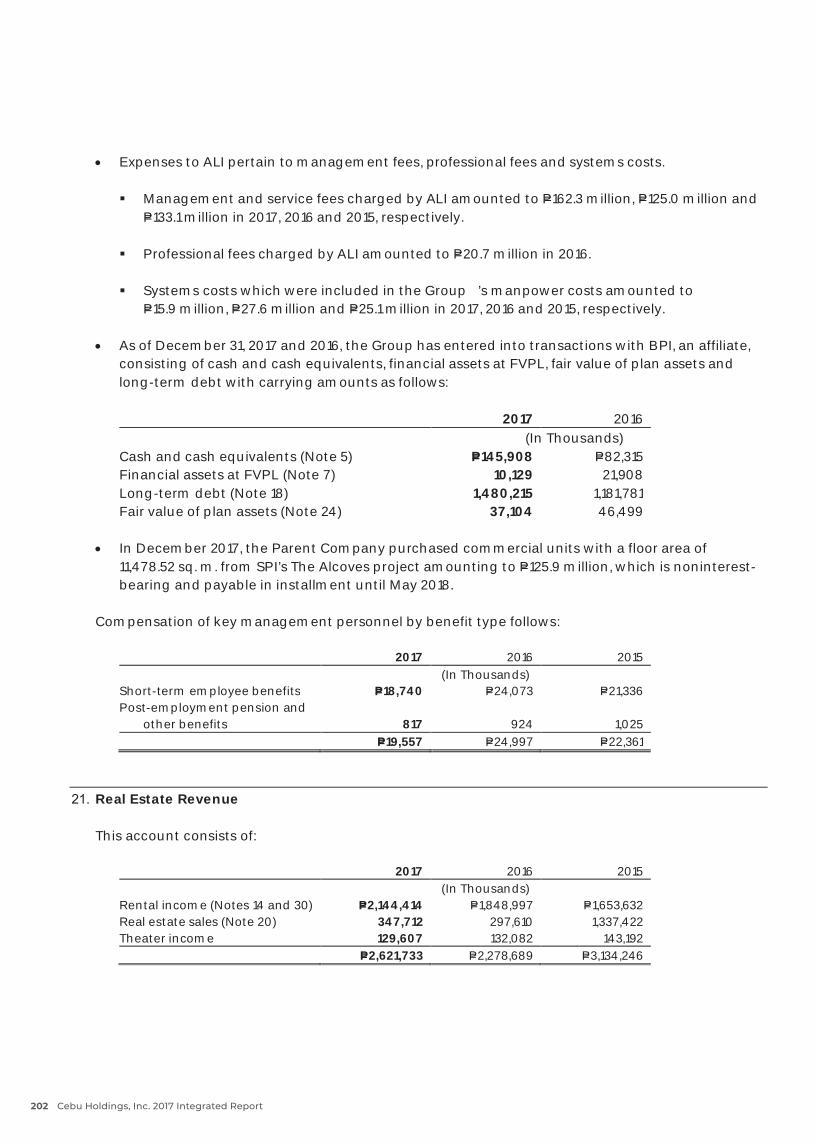
- 47 -
• Expenses to ALI pertain to management fees, professional fees and systems costs.
Management and service fees charged by ALI amounted to P=162.3 million, P=125.0 million andP=133.1 million in 2017, 2016 and 2015, respectively.
Professional fees charged by ALI amounted to P=20.7 million in 2016.
Systems costs which were included in the Group ’s manpower costs amounted toP=15.9 million, P=27.6 million and P=25.1 million in 2017, 2016 and 2015, respectively.
• As of December 31, 2017 and 2016, the Group has entered into transactions with BPI, an affiliate,consisting of cash and cash equivalents, financial assets at FVPL, fair value of plan assets andlong-term debt with carrying amounts as follows:
2017 2016(In Thousands)
Cash and cash equivalents (Note 5) P=145,908 P=82,315Financial assets at FVPL (Note 7) 10,129 21,908Long-term debt (Note 18) 1,480,215 1,181,781Fair value of plan assets (Note 24) 37,104 46,499
• In December 2017, the Parent Company purchased commercial units with a floor area of11,478.52 sq. m. from SPI’s The Alcoves project amounting to P=125.9 million, which is noninterest-bearing and payable in installment until May 2018.
Compensation of key management personnel by benefit type follows:
2017 2016 2015(In Thousands)
Short-term employee benefits P=18,740 P=24,073 P=21,336Post-employment pension and
other benefits 817 924 1,025P=19,557 P=24,997 P=22,361
21. Real Estate Revenue
This account consists of:
2017 2016 2015(In Thousands)
Rental income (Notes 14 and 30) P=2,144,414 P=1,848,997 P=1,653,632Real estate sales (Note 20) 347,712 297,610 1,337,422Theater income 129,607 132,082 143,192
P=2,621,733 P=2,278,689 P=3,134,246
Cebu Holdings, Inc. 2017 Integrated Report202
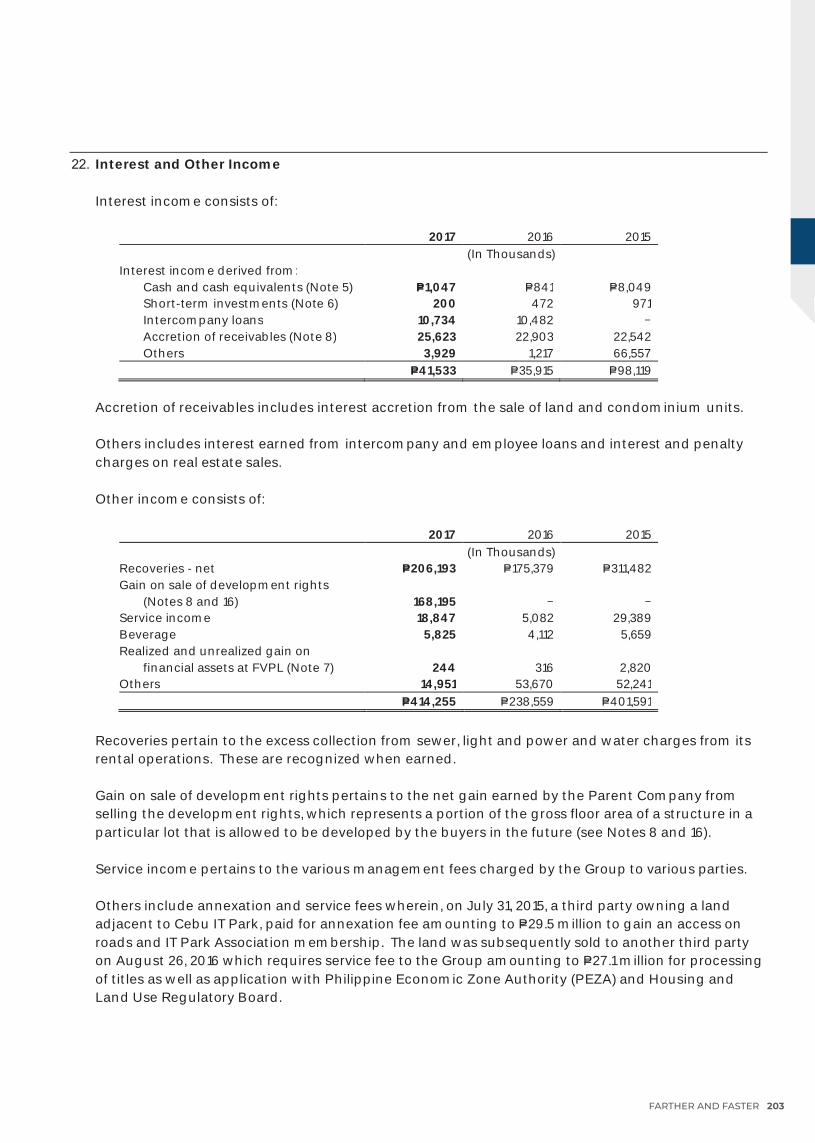
- 48 -
22. Interest and Other Income
Interest income consists of:
2017 2016 2015(In Thousands)
Interest income derived from:Cash and cash equivalents (Note 5) P=1,047 P=841 P=8,049Short-term investments (Note 6) 200 472 971Intercompany loans 10,734 10,482 Accretion of receivables (Note8) 25,623 22,903 22,542Others 3,929 1,217 66,557
P=41,533 P=35,915 P=98,119
Accretion of receivables includes interest accretion from the sale of land and condominium units.
Others includes interest earned from intercompany and employee loans and interest and penaltycharges on real estate sales.
Other income consists of:
2017 2016 2015(In Thousands)
Recoveries - net P=206,193 P=175,379 P=311,482Gain on sale of development rights
(Notes 8 and 16) 168,195 Service income 18,847 5,082 29,389Beverage 5,825 4,112 5,659Realized and unrealized gain on
financial assets at FVPL (Note 7) 244 316 2,820Others 14,951 53,670 52,241
P=414,255 P=238,559 P=401,591
Recoveries pertain to the excess collection from sewer, light and power and water charges from itsrental operations. These are recognized when earned.
Gain on sale of development rights pertains to the net gain earned by the Parent Company fromselling the development rights, which represents a portion of the gross floor area of a structure in aparticular lot that is allowed to be developed by the buyers in the future (see Notes 8 and 16).
Service income pertains to the various management fees charged by the Group to various parties.
Others include annexation and service fees wherein, on July 31, 2015, a third party owning a landadjacent to Cebu IT Park, paid for annexation fee amounting to P=29.5 million to gain an access onroads and IT Park Association membership. The land was subsequently sold to another third partyon August 26, 2016 which requires service fee to the Group amounting to P=27.1 million for processingof titles as well as application with Philippine Economic Zone Authority (PEZA) and Housing andLand Use Regulatory Board.
FARTHER AND FASTER 203

- 49 -
23. Costs and Expenses
Real estate, rental and theater expenses consist of:
2017 2016 2015(In Thousands)
Cost of real estate sales (Note9) P=205,427 P=179,335 P=571,945Depreciation and amortization
(Note 14) 467,390 382,172 339,141Marketing and management
fees (Note20) 230,838 199,567 246,609Producers’ film share 72,830 74,051 79,159Manpower cost (Note20) 23,020 22,838 17,640Rental 1,956 2,540 2,661Direct operating expenses:
Security and janitorial 137,063 101,935 88,830Repairs and maintenance 109,037 100,160 90,292Taxes and licenses 81,510 79,208 55,739Commission 54,445 17,579 28,152Light and water 14,649 86,454 179,159Dues and fees 12,172 11,320 10,537Insurance 8,321 6,188 16,562Professional fees 6,487 6,689 8,763Transportation and travel 647 588 691Representation 177 399 230Provision for impairment loss 36,518Others 11,611 24,824 21,356
P=1,437,580 P=1,295,847 P=1,793,984
General and administrative expenses consist of:
2017 2016 2015(In Thousands)
Manpower cost (Notes20and24) P=105,576 P=120,623 P=119,526Depreciation and amortization
(Note 12) 28,220 19,898 18,884Stockholders' meeting 13,399 11,171 9,948Professional fees 10,330 7,956 5,814Repairs and maintenance 9,850 6,542 7,030Transportation and travel 5,363 5,072 5,414Trainings 4,336 3,336 3,548Postal and communication 4,190 3,625 3,801Dues and fees 4,121 1,082 1,132Utilities 4,028 3,568 2,143Security and janitorial 3,101 2,899 2,029Representation 3,165 1,561 1,163Supplies 2,805 2,844 2,880Advertising 2,615 2,601 2,112Taxes and licenses 746 892 806Insurance 726 510 621Rental 436 2,487 2,370Provision for impairment loss
(Note 8) 3,106Others 9,076 2,354 30,850
P=212,083 P=199,021 P=223,177
Cebu Holdings, Inc. 2017 Integrated Report204
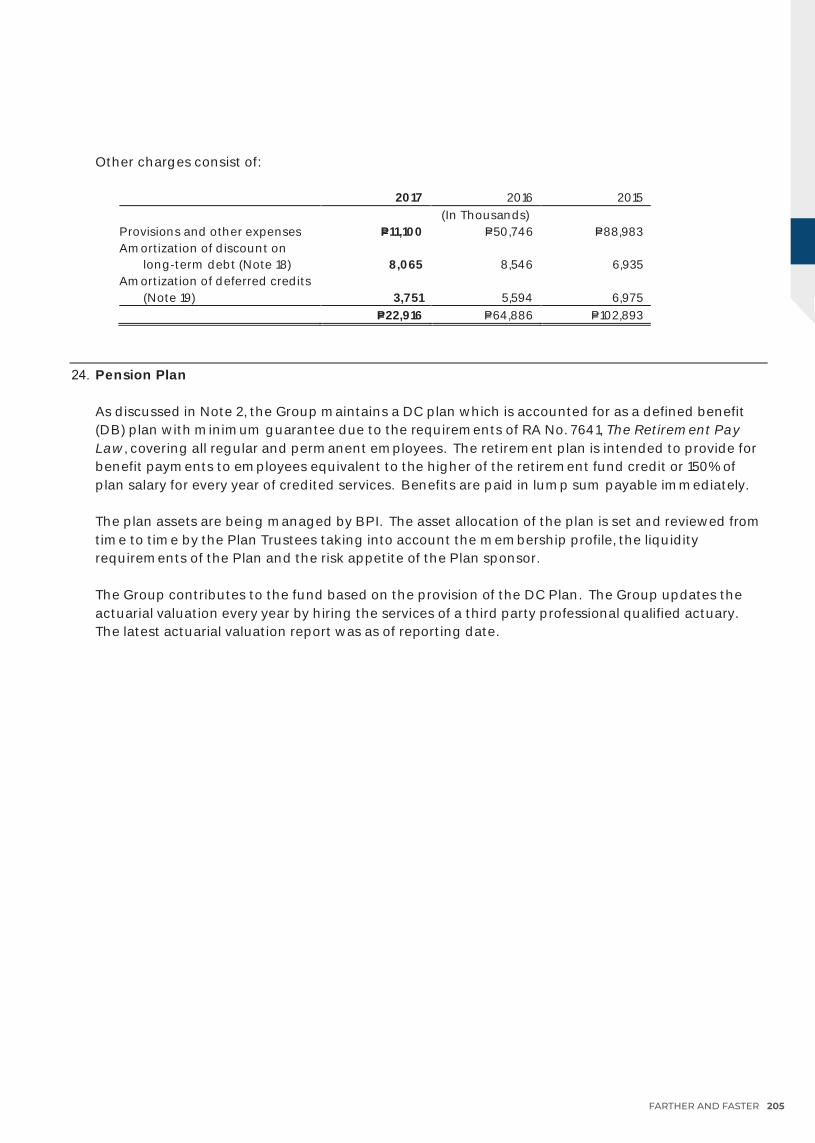
- 50 -
Other charges consist of:
2017 2016 2015(In Thousands)
Provisions and other expenses P=11,100 P=50,746 P=88,983Amortization of discount on
long-term debt (Note 18) 8,065 8,546 6,935Amortization of deferred credits
(Note 19) 3,751 5,594 6,975P=22,916 P=64,886 P=102,893
24. Pension Plan
As discussed in Note 2, the Group maintains a DC plan which is accountedfor as a defined benefit(DB) plan with minimum guarantee due to the requirements of RA No. 7641, The Retirement PayLaw, covering all regular and permanent employees. The retirement plan is intended to provide forbenefit payments to employees equivalent to the higher of the retirement fund credit or 150% ofplan salary for every year of credited services. Benefits are paid in lump sum payable immediately.
The plan assets are being managed by BPI. The asset allocation of the plan is set and reviewed fromtime to time by the Plan Trustees taking into account the membership profile, the liquidityrequirements of the Plan and the risk appetite of the Plan sponsor.
The Group contributes to the fund based on the provision of the DC Plan. The Group updates theactuarial valuation every year by hiring the services of a third party professional qualified actuary.The latest actuarial valuation report was as of reporting date.
FARTHER AND FASTER 205
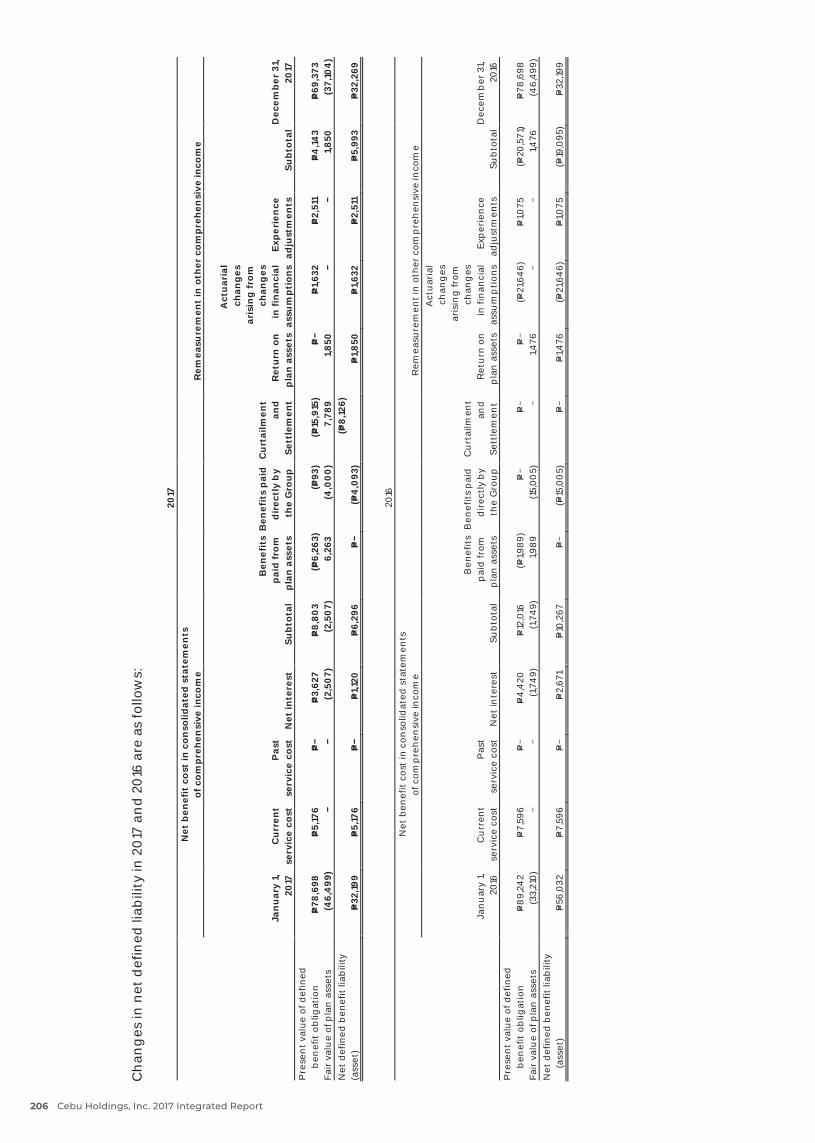
- 51
-
Ch
ang
es in
net
def
ined
liab
ility
in 2
017
an
d 2
016
are
as
follo
ws:
2017
Net
ben
efit
co
st in
con
solid
ated
sta
tem
ents
of c
om
pre
hen
sive
inco
me
Rem
easu
rem
ent
in o
ther
co
mp
reh
ensi
ve in
com
e
Jan
uar
y 1,
2017
Cu
rren
tse
rvic
e co
stP
ast
serv
ice
cost
Net
inte
rest
Sub
tota
l
Ben
efit
sp
aid
fro
mp
lan
ass
ets
Ben
efit
s p
aid
dir
ectl
y b
yth
e G
rou
p
Cu
rtai
lmen
tan
dSe
ttle
men
tR
etu
rn o
np
lan
ass
ets
Act
uar
ial
chan
ges
aris
ing
fro
m c
han
ges
in fi
nan
cial
assu
mp
tion
sEx
per
ien
cead
just
men
tsSu
bto
tal
Dec
emb
er 3
1, 2
017
Pre
sen
t val
ue o
f def
ined
ben
efit
ob
ligat
ion
P=78
,698
P=5,
176
P=
P=3,
627
P=8,
803
(P=6,
263)
(P=93
)(P=
15,9
15)
P=
P=1,6
32P=
2,51
1P=
4,14
3P=
69,3
73Fa
ir v
alu
e of
pla
n a
sset
s(4
6,4
99)
(2,5
07)
(2,5
07)
6,26
3(4
,00
0)
7,78
91,8
50
1,8
50(3
7,10
4)
Net
def
ined
ben
efit
liab
ility
(ass
et)
P=32
,199
P=5,
176
P=
P=1,1
20P=
6,29
6P=
(P=4
,093
)(P=
8,12
6)P=
1,850
P=1,6
32P=
2,51
1P=
5,99
3P=
32,2
69
2016
Net
ben
efit
cos
t in
con
solid
ated
sta
tem
ents
of c
omp
reh
ensi
ve in
com
eR
emea
sure
men
t in
oth
er c
omp
reh
ensi
ve in
com
e
Jan
uar
y 1,
2016
Cu
rren
tse
rvic
e co
stP
ast
serv
ice
cost
Net
inte
rest
Sub
tota
l
Ben
efit
sp
aid
from
pla
n a
sset
s
Ben
efit
s p
aid
dir
ectl
y b
yth
e G
rou
p
Cu
rtai
lmen
tan
dSe
ttle
men
tR
etu
rn o
np
lan
ass
ets
Act
uar
ial
chan
ges
aris
ing
from
ch
ang
esin
fin
anci
alas
sum
pti
ons
Exp
erie
nce
adju
stm
ents
Sub
tota
lD
ecem
ber
31,
201
6P
rese
nt v
alue
of d
efin
edb
enef
it o
blig
atio
nP=
89,
242
P=7,
596
P=
P=4
,420
P=12
,016
(P=1,9
89)
P=
P=
P=
(P=21
,64
6)P=
1,075
(P=20
,571
)P=
78,6
98Fa
ir v
alu
e of
pla
n a
sset
s(3
3,21
0)
(1
,74
9)(1
,74
9)1,9
89
(15,
005)
1,4
76
1,4
76(4
6,4
99)
Net
def
ined
ben
efit
liab
ility
(ass
et)
P=56
,032
P=7,
596
P=
P=2,
671
P=10
,267
P=
(P=15
,00
5)P=
P=1,4
76(P=
21,6
46)
P=1,0
75(P=
19,0
95)
P=32
,199
Cebu Holdings, Inc. 2017 Integrated Report206
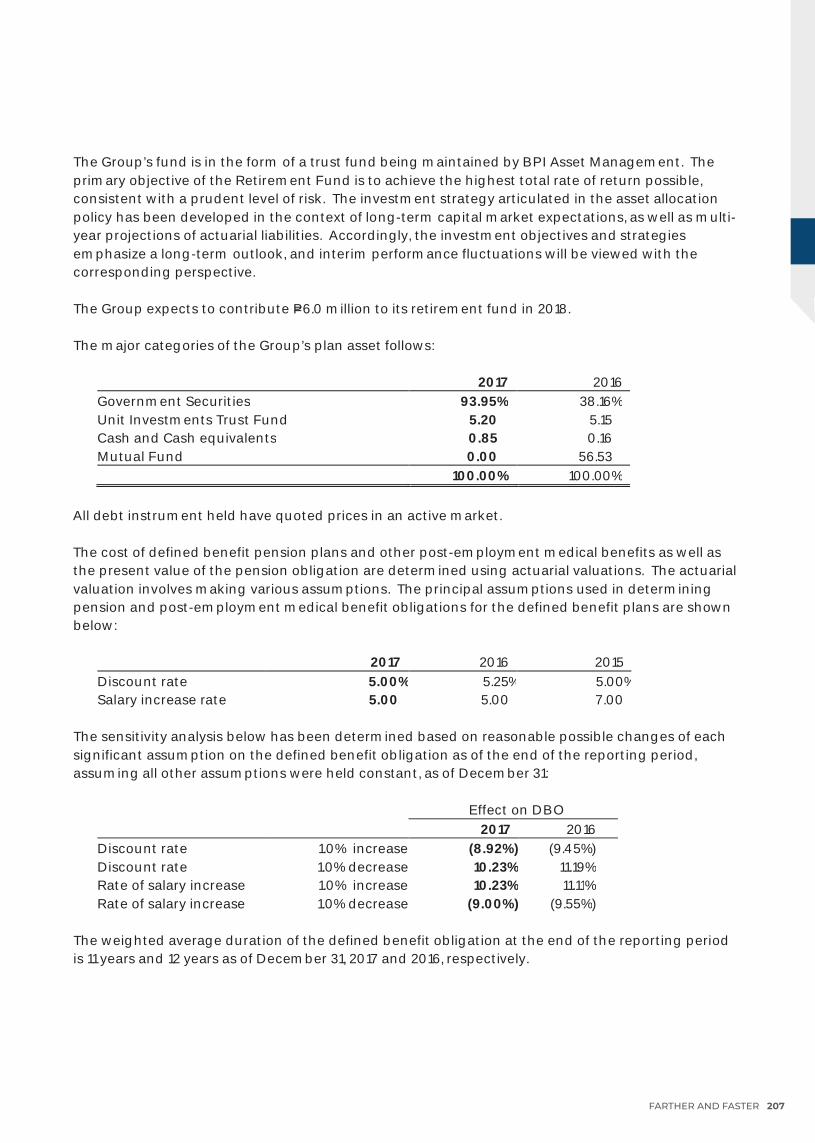
- 52 -
The Group’s fund is in the form of a trust fund being maintained by BPI Asset Management. Theprimary objective of the Retirement Fund is to achieve the highest total rate of return possible,consistent with a prudent level of risk. The investment strategy articulated in the asset allocationpolicy has been developed in the context of long-term capital market expectations, as well as multi-year projections of actuarial liabilities. Accordingly, the investment objectives and strategiesemphasize a long-term outlook, and interim performance fluctuations will be viewed with thecorresponding perspective.
The Group expects to contribute P=6.0 million to its retirement fund in 2018.
The major categories of the Group’s plan asset follows:
2017 2016Government Securities 93.95% 38.16%Unit Investments Trust Fund 5.20 5.15Cash and Cash equivalents 0.85 0.16Mutual Fund 0.00 56.53
100.00% 100.00%
All debt instrument held have quoted prices in an active market.
The cost of defined benefit pension plans and other post-employment medical benefits as well asthe present value of the pension obligation are determined using actuarial valuations. The actuarialvaluation involves making various assumptions. The principal assumptions used in determiningpension and post-employment medical benefit obligations for the defined benefit plans are shownbelow:
2017 2016 2015Discount rate 5.00% 5.25% 5.00%Salary increase rate 5.00 5.00 7.00
The sensitivity analysis below has been determined based on reasonable possible changes of eachsignificant assumption on the defined benefit obligation as of the end of the reporting period,assuming all other assumptions were held constant, as of December 31:
Effect on DBO2017 2016
Discount rate 1.0% increase (8.92%) (9.45%)Discount rate 1.0% decrease 10.23% 11.19%Rate of salary increase 1.0% increase 10.23% 11.11%Rate of salary increase 1.0% decrease (9.00%) (9.55%)
The weighted average duration of the defined benefit obligation at the end of the reporting periodis 11 years and 12 years as of December 31, 2017 and 2016, respectively.
FARTHER AND FASTER 207
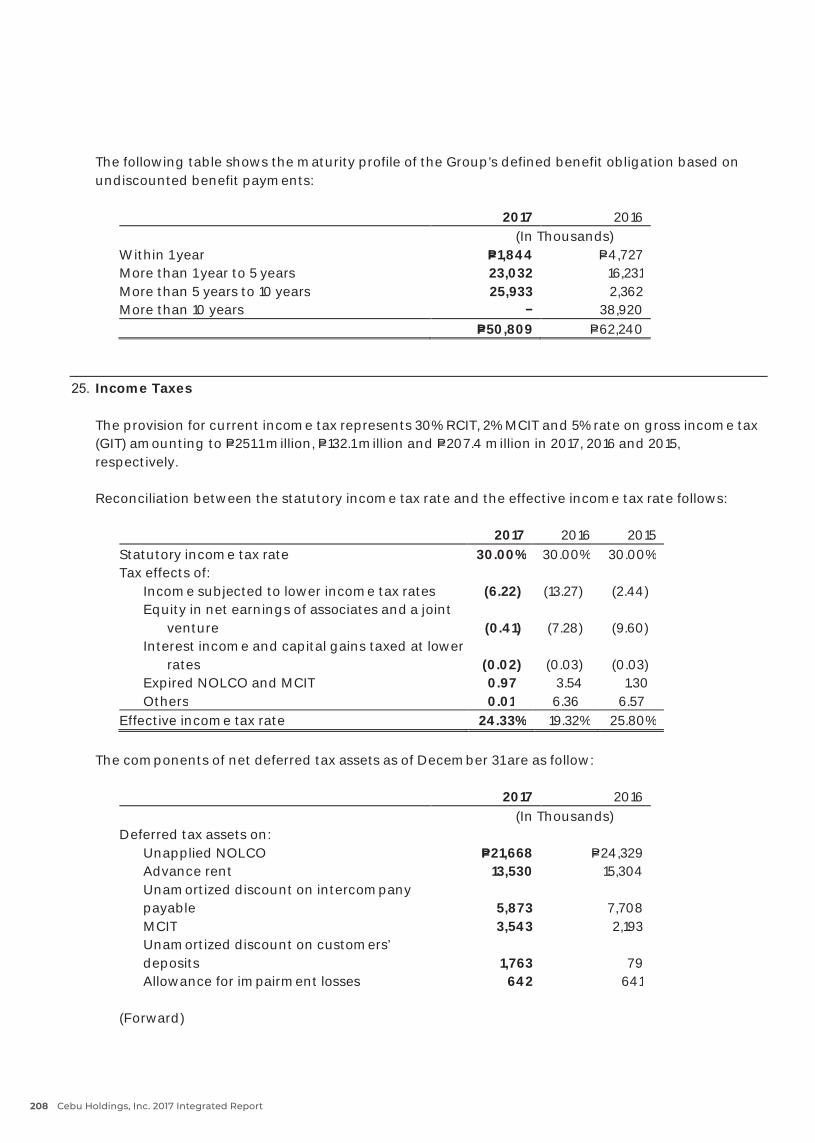
- 53 -
The following table shows the maturity profile of the Group’s defined benefit obligation based onundiscounted benefit payments:
2017 2016(In Thousands)
Within 1 year P=1,844 P=4,727More than 1 year to 5 years 23,032 16,231More than 5 years to 10 years 25,933 2,362More than 10 years 38,920
P=50,809 P=62,240
25. Income Taxes
The provision for current income tax represents 30% RCIT, 2% MCIT and 5% rate on gross income tax(GIT) amounting to P=251.1 million, P=132.1 million and P=207.4 million in 2017, 2016 and 2015,respectively.
Reconciliation between the statutory income tax rate and the effective income tax rate follows:
2017 2016 2015Statutory income tax rate 30.00% 30.00% 30.00%Tax effects of:
Income subjected to lower income taxrates (6.22) (13.27) (2.44)Equity in net earnings of associates anda joint
venture (0.41) (7.28) (9.60)Interest income and capital gains taxed at lower
rates (0.02) (0.03) (0.03)Expired NOLCO and MCIT 0.97 3.54 1.30Others 0.01 6.36 6.57
Effective income tax rate 24.33% 19.32% 25.80%
The components of net deferred tax assets as of December 31 are as follow:
2017 2016(In Thousands)
Deferred tax assets on:Unapplied NOLCO P=21,668 P=24,329Advance rent 13,530 15,304Unamortized discount on intercompanypayable 5,873 7,708MCIT 3,543 2,193Unamortized discount on customers’deposits 1,763 79Allowance for impairment losses 642 641
(Forward)
Cebu Holdings, Inc. 2017 Integrated Report208
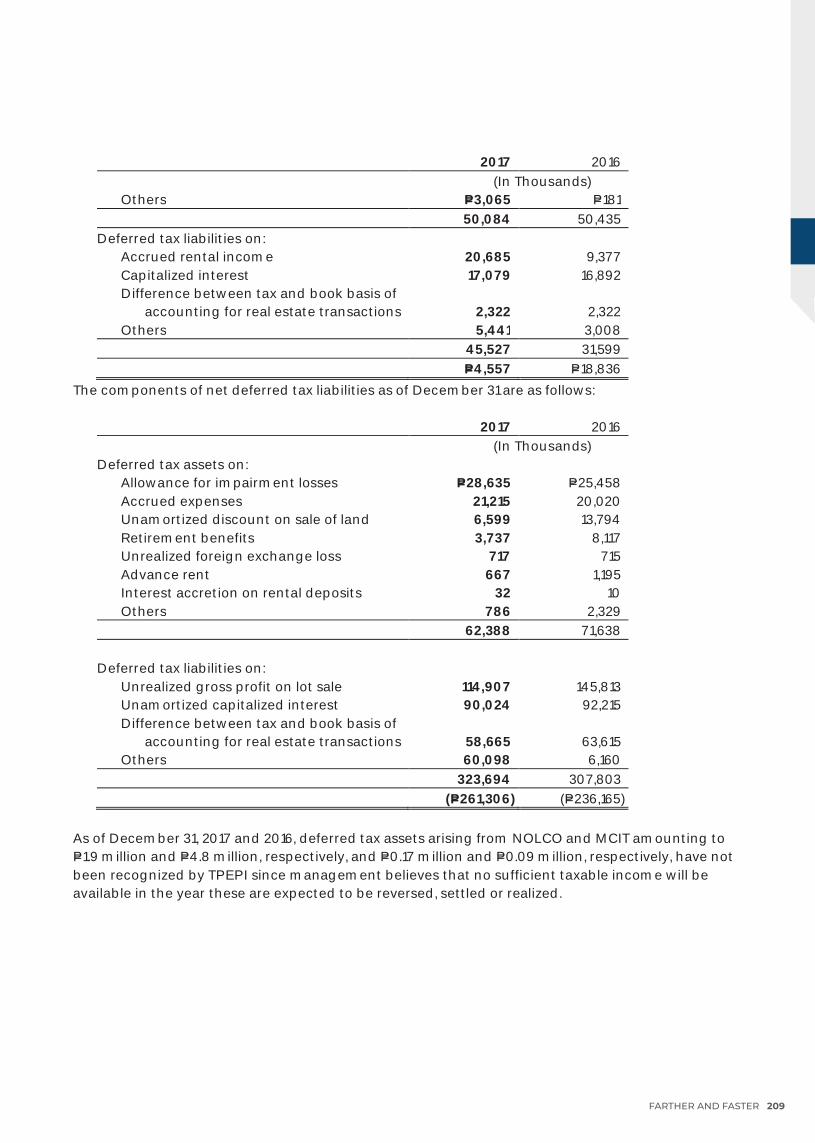
- 54 -
2017 2016(In Thousands)
Others P=3,065 P=18150,084 50,435
Deferred tax liabilities on:Accrued rental income 20,685 9,377Capitalized interest 17,079 16,892Difference between tax and book basis of
accounting for real estate transactions 2,322 2,322Others 5,441 3,008
45,527 31,599P=4,557 P=18,836
The components of net deferred tax liabilities as of December 31 are as follows:
2017 2016(In Thousands)
Deferred tax assets on:Allowance for impairment losses P=28,635 P=25,458Accrued expenses 21,215 20,020Unamortized discount on sale of land 6,599 13,794Retirement benefits 3,737 8,117Unrealized foreign exchange loss 717 715Advance rent 667 1,195Interest accretion on rental deposits 32 10Others 786 2,329
62,388 71,638
Deferred tax liabilities on:Unrealized gross profit on lot sale 114,907 145,813Unamortized capitalized interest 90,024 92,215Difference between tax and book basis of
accounting for real estate transactions 58,665 63,615Others 60,098 6,160
323,694 307,803(P=261,306) (P=236,165)
As of December 31, 2017 and 2016, deferred tax assets arising from NOLCO and MCIT amounting toP=1.9 million and P=4.8 million, respectively, and P=0.17 million and P=0.09 million, respectively, have notbeen recognized by TPEPI since management believes that no sufficient taxable income will beavailable in the year these are expected to be reversed, settled or realized.
FARTHER AND FASTER 209
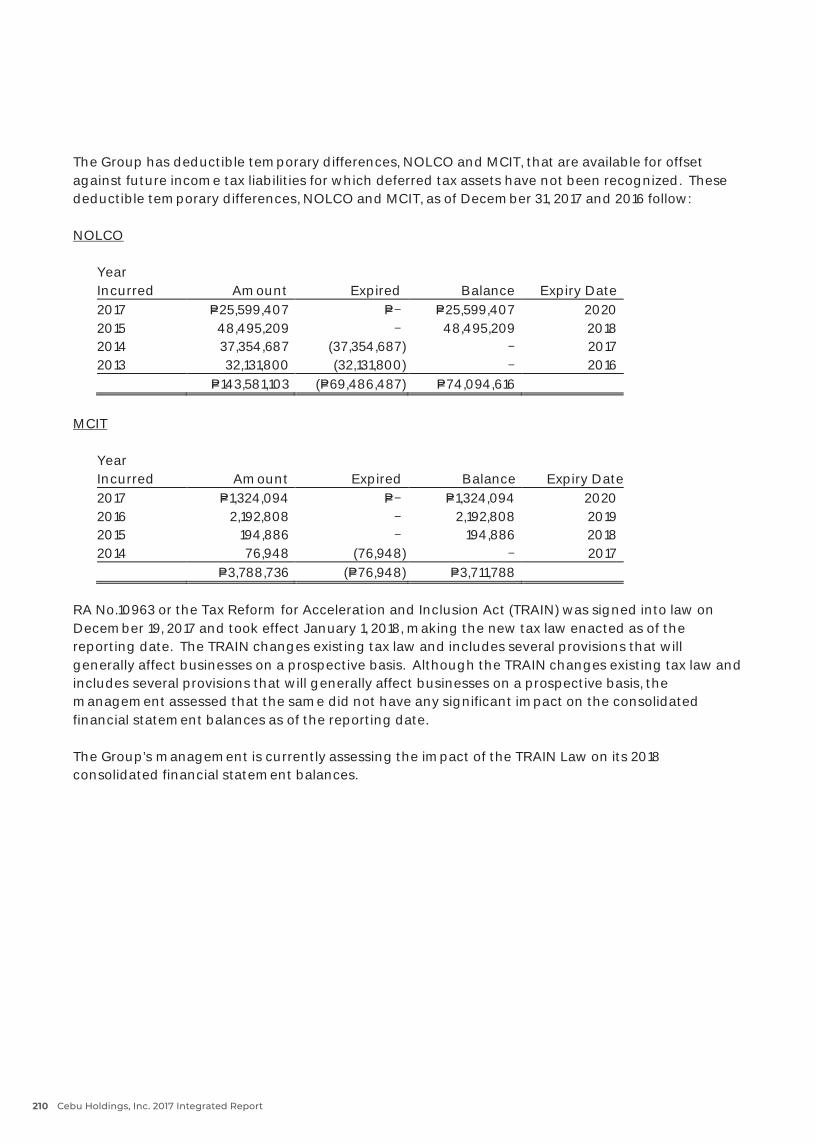
- 55 -
The Group has deductible temporary differences, NOLCO and MCIT, that are available for offsetagainst future income tax liabilities for which deferred tax assets have not been recognized. Thesedeductible temporary differences, NOLCO and MCIT, as of December 31, 2017 and 2016 follow:
NOLCO
YearIncurred Amount Expired Balance Expiry Date2017 P=25,599,407 P= P=25,599,407 20202015 48,495,209 48,495,209 20182014 37,354,687 (37,354,687) 20172013 32,131,800 (32,131,800) 2016
P=143,581,103 (P=69,486,487) P=74,094,616
MCIT
YearIncurred Amount Expired Balance Expiry Date2017 P=1,324,094 P= P=1,324,094 20202016 2,192,808 2,192,808 20192015 194,886 194,886 20182014 76,948 (76,948) 2017
P=3,788,736 (P=76,948) P=3,711,788
RA No.10963 or the Tax Reform for Acceleration and Inclusion Act (TRAIN) was signed into law onDecember 19, 2017 and took effect January 1, 2018, making the new tax law enacted as of thereporting date. The TRAIN changes existing tax law and includes several provisions that willgenerally affect businesses on a prospective basis. Although the TRAIN changes existing tax law andincludes several provisions that will generally affect businesses on a prospective basis, themanagement assessed that the same did not have any significant impact on the consolidatedfinancial statement balances as of the reporting date.
The Group’s management is currently assessing the impact of the TRAIN Law on its 2018consolidated financial statement balances.
Cebu Holdings, Inc. 2017 Integrated Report210
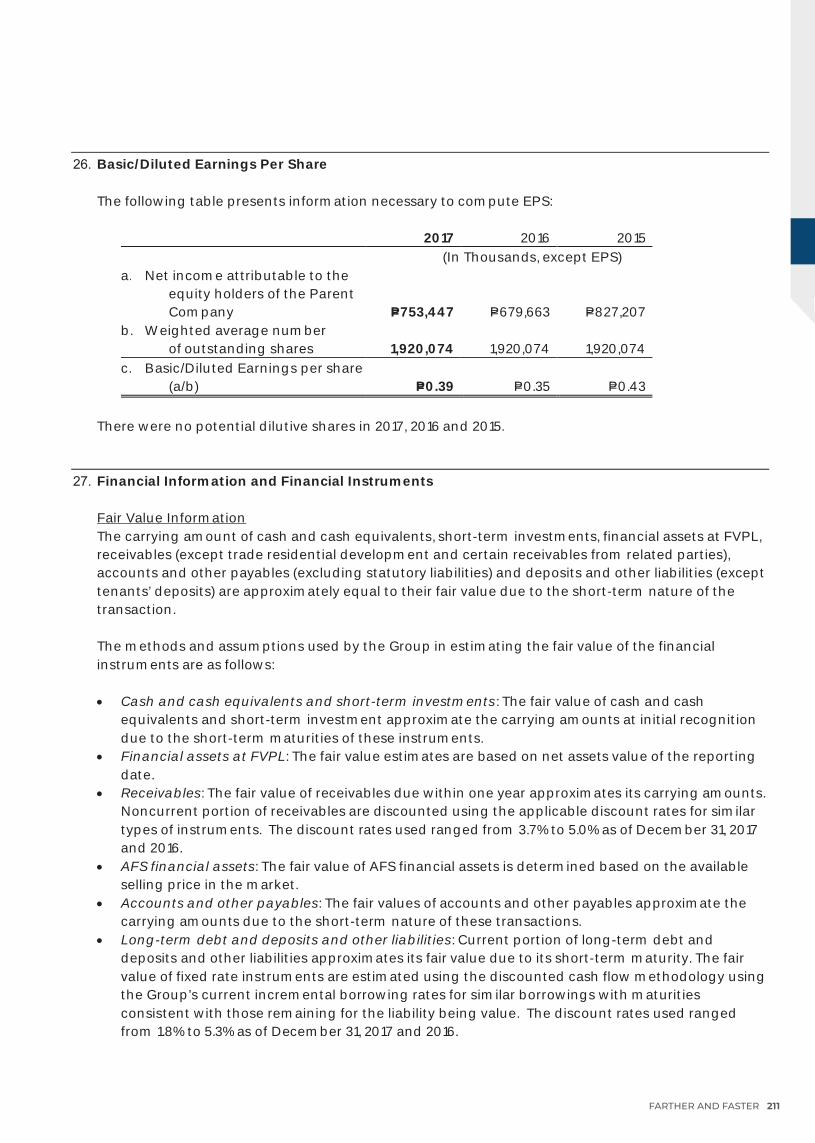
- 56 -
26. Basic/Diluted Earnings Per Share
The following table presents information necessary to compute EPS:
2017 2016 2015(In Thousands, except EPS)
a. Net income attributable to theequity holders of the ParentCompany P=753,447 P=679,663 P=827,207
b. Weighted average numberofoutstanding shares 1,920,074 1,920,074 1,920,074
c. Basic/Diluted Earnings per share(a/b) P=0.39 P=0.35 P=0.43
There were no potential dilutive shares in 2017, 2016 and 2015.
27. Financial Information and Financial Instruments
Fair Value InformationThe carrying amount of cash and cash equivalents, short-term investments, financial assets at FVPL,receivables (except trade residential development and certain receivables from related parties),accounts and other payables (excluding statutory liabilities) and deposits and other liabilities (excepttenants’ deposits) are approximately equal to their fair value due to the short-term nature of thetransaction.
The methods and assumptions used by the Group in estimating the fair value of the financialinstruments are as follows:
• Cash and cash equivalents and short-term investments : The fair value of cash and cashequivalents and short-term investment approximate the carrying amounts at initial recognitiondue to the short-term maturities of these instruments.
• Financial assets at FVPL: The fair value estimates are based on net assets value of the reportingdate.
• Receivables: The fair value of receivables due within one year approximates its carrying amounts.Noncurrent portion of receivables are discounted using the applicable discount rates for similartypes of instruments. The discount rates used ranged from 3.7% to 5.0% as of December 31, 2017and 2016.
• AFS financial assets: The fair value of AFS financial assets is determined based on the availableselling price in the market.
• Accounts and other payables: The fair values of accounts and other payables approximate thecarrying amounts due to the short-term nature of these transactions.
• Long-term debt and deposits and other liabilities: Current portion of long-term debt anddeposits and other liabilities approximates its fair value due to its short-term maturity. The fairvalue of fixed rate instruments are estimated using the discounted cash flow methodology usingthe Group’s current incremental borrowing rates for similar borrowings with maturitiesconsistent with those remaining for the liability being value. The discount rates used rangedfrom 1.8% to 5.3% as of December 31, 2017 and 2016.
FARTHER AND FASTER 211
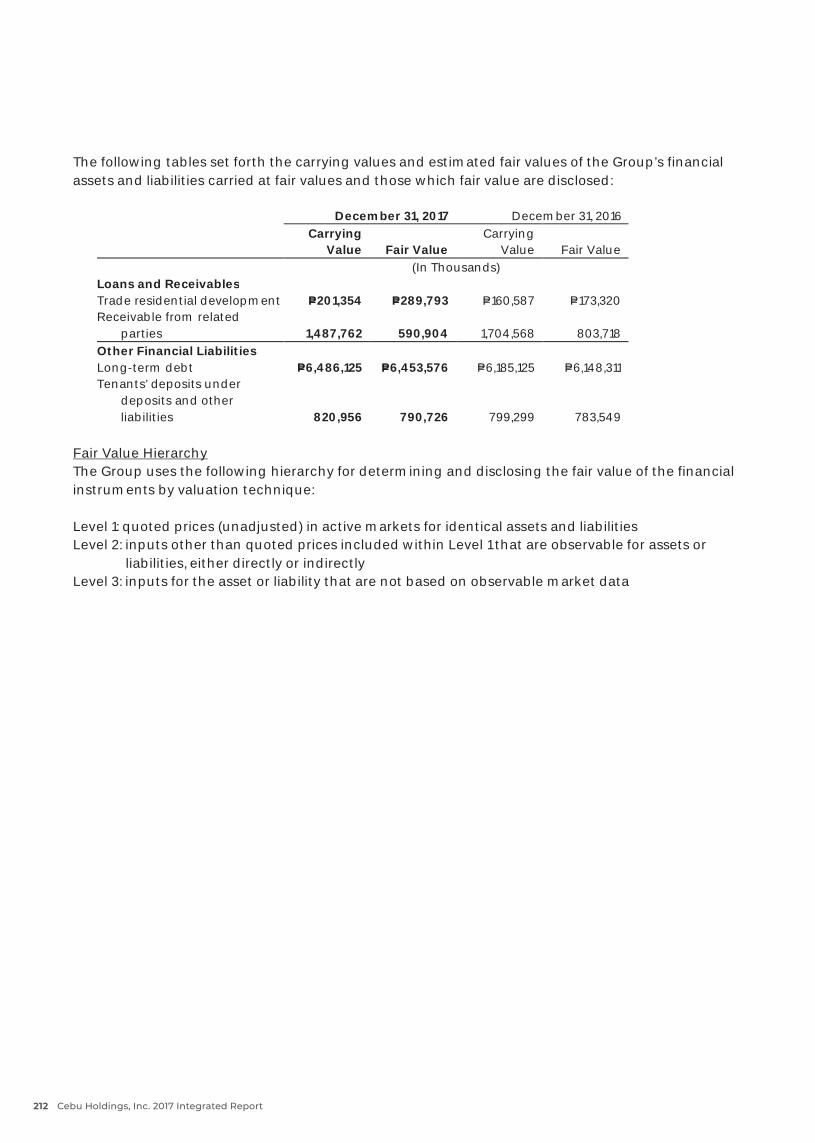
- 57 -
The following tables set forth the carrying values and estimated fair values of the Group’s financialassets and liabilities carried at fair values and those which fair value are disclosed:
December 31, 2017 December 31, 2016Carrying
Value Fair ValueCarrying
Value Fair Value(In Thousands)
Loans and ReceivablesTrade residential development P=201,354 P=289,793 P=160,587 P=173,320Receivable from related
parties 1,487,762 590,904 1,704,568 803,718Other Financial LiabilitiesLong-term debt P=6,486,125 P=6,453,576 P=6,185,125 P=6,148,311Tenants’ deposits under
deposits and otherliabilities 820,956 790,726 799,299 783,549
Fair Value HierarchyThe Group uses the following hierarchy for determining and disclosing the fair value of the financialinstruments by valuation technique:
Level 1: quoted prices (unadjusted) in active markets for identical assets and liabilitiesLevel 2: inputs other than quoted prices included within Level 1 that are observable for assets or
liabilities, either directly or indirectlyLevel 3: inputs for the asset or liability that are not based on observable market data
Cebu Holdings, Inc. 2017 Integrated Report212
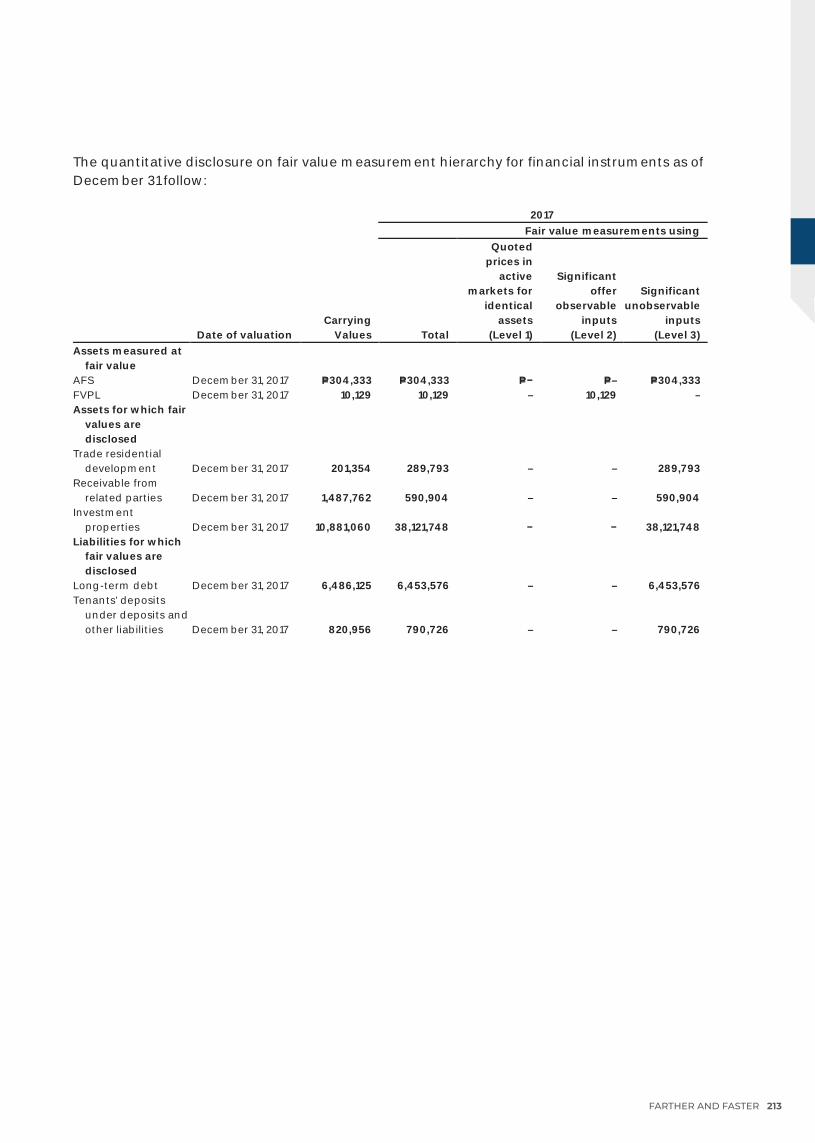
- 58 -
The quantitative disclosure on fair value measurement hierarchy for financial instruments as ofDecember 31 follow:
2017Fair value measurements using
Date of valuationCarrying
Values Total
Quotedprices in
activemarkets for
identicalassets
(Level 1)
Significantoffer
observableinputs
(Level 2)
Significantunobservable
inputs(Level 3)
Assets measured atfair value
AFS December 31, 2017 P=304,333 P=304,333 P= P=– P=304,333FVPL December 31, 2017 10,129 10,129 – 10,129 –Assets for which fair
values aredisclosed
Trade residentialdevelopment December 31, 2017 201,354 289,793 – – 289,793
Receivable fromrelated parties December 31, 2017 1,487,762 590,904 – – 590,904
Investmentproperties December 31, 2017 10,881,060 38,121,748 38,121,748
Liabilities for whichfair values aredisclosed
Long-term debt December 31, 2017 6,486,125 6,453,576 – – 6,453,576Tenants’ deposits
under deposits andother liabilities December 31, 2017 820,956 790,726 – – 790,726
FARTHER AND FASTER 213

- 59 -
2016Fair value measurements using
Date of valuationCarrying
Values Total
Quotedprices in
activemarkets for
identicalassets
(Level 1)
Significantoffer
observableinputs
(Level 2)
Significantunobservable
inputs(Level 3)
Assets measured atfair value
AFS December 31, 2016 P=318,574 P=318,574 P= P= P=318,574FVPL December 31, 2016 21,908 21,908 21,908 Assets for which fair
values aredisclosed
Trade residentialdevelopment December 31, 2016 160,587 173,320 173,320
Receivable fromrelated parties December 31, 2016 1,704,568 803,718 803,718
Investmentproperties December 31, 2016 11,011,106 25,672,676 25,672,676
Liabilities for whichfair values aredisclosed
Long-term debt December 31, 2016 6,185,125 6,148,311 6,148,311Tenants’ deposits
under deposits andother liabilities December 31, 2016 799,299 783,549 783,549
The Group categorized the fair value of long-term debt and deposits and other noncurrent liabilitiesunder Level3 as of December 31, 2017 and 2016. The fair value of these financial instruments wasdetermined by discounting future cash flows using the applicable rates of similar types ofinstruments plus a certain spread. This spread is the unobservable input and the effect of changesto this is that the higher the spread, the lower the fair value.
For land, significant increases (decreases) in the price per square meter, in isolation, would result in asignificantly higher (lower) fair value of the properties.
For buildings, significant increases (decreases) in the replacement and reproduction costs, inisolation, would result in a significantly higher (lower) fair value of the properties.
There have been no reclassifications between Level 1, 2 and 3 categories in 2017 and 2016.
Financial Risk Management Objectives and PoliciesThe Group’s principal financial instruments comprise cash and cash equivalents, financial assets atFVPL, AFS financial assets and long-term debt.
The main purpose of the Group’s financial instruments is to fund its operations, capital expendituresand finance the projects. The Group has various other financial assets and liabilities such as tradereceivables and trade payables, which arise directly from its operations.
Cebu Holdings, Inc. 2017 Integrated Report214
- 60 -
Exposure to credit risk, liquidity risk and market risk (i.e., foreign currency risk and interest rate risk)arises in the normal course of the Group’s business activities. The main objectives of the Group’sfinancial risk management are as follows:• to identify and monitor such risks on an ongoing basis;• to minimize and mitigate such risks; and• to provide a degree of certainty about costs.
The Group’s financing and treasury function operates as a centralized service for managing financialrisks and activities as well as providing optimum investment yield and cost-efficient funding for theGroup. The Group’s BOD reviews and approves policies for managing each of these risks.
Credit riskCredit risk is the risk that one party to a financial instrument will cause a financial loss for the otherparty by failing to discharge an obligation. The Group’s credit risks are primarily attributable tofinancial assets such as cash and cash equivalents, financial assets and FVPL and receivables.
To manage credit risk, the Group maintains defined credit policies and monitors its exposure tocredit risks on a continuous basis.
In respect of receivable from the sale of properties, credit risk is managed primarily through creditreviews and an analysis of receivables on a continuous basis. The Group also undertakessupplemental credit review procedures for certain installment payment structures. The Group’sstringent customer requirements and policies in place contribute to lower customer default than itscompetitors. Customer payments are facilitated through various collection modes including the useof postdated checks and auto-debit arrangements. Exposure to bad debts is not significant as titleto real estate properties are not transferred to the buyers until full payment has been made and therequirement for remedial procedures is minimal given the profile of buyers.
Credit risk arising from rental income from leasing properties is primarily managed through atenant selection process. Prospective tenants are evaluated on the basis of payment track recordand other credit information. In accordance with the provisions of the lease contracts, the lesseesare required to deposit with the Group security deposits and advance rentals which helps reducethe Group’s credit risk exposure in case of defaults by the tenants. For existing tenants, the Grouphas put in place a monitoring and follow-up system. Receivables are aged and analyzed on acontinuous basis to minimize credit risk associated with these receivables. Regular meetings withtenants are also undertaken to provide opportunities for counseling and further assessment ofpaying capacity.
Other financial assets are comprised of cash and cash equivalents excluding cash on hand, short-term investments, financial assets at FVPL and AFS financial assets. The Group adheres to fixedlimits and guidelines in its dealings with counterparty banks and its investment in financialinstruments. Bank limits are established on the basis of an internal rating system that principallycovers the areas of liquidity, capital adequacy and financial stability. The rating system likewisemakes use of available international credit ratings. Given the high credit standing of its accreditedcounterparty banks, management does not expect any of these financial institutions to fail inmeeting their obligations. Nevertheless, the Group closely monitors developments overcounterparty banks and adjusts its exposure accordingly while adhering to pre-set limits.
FARTHER AND FASTER 215
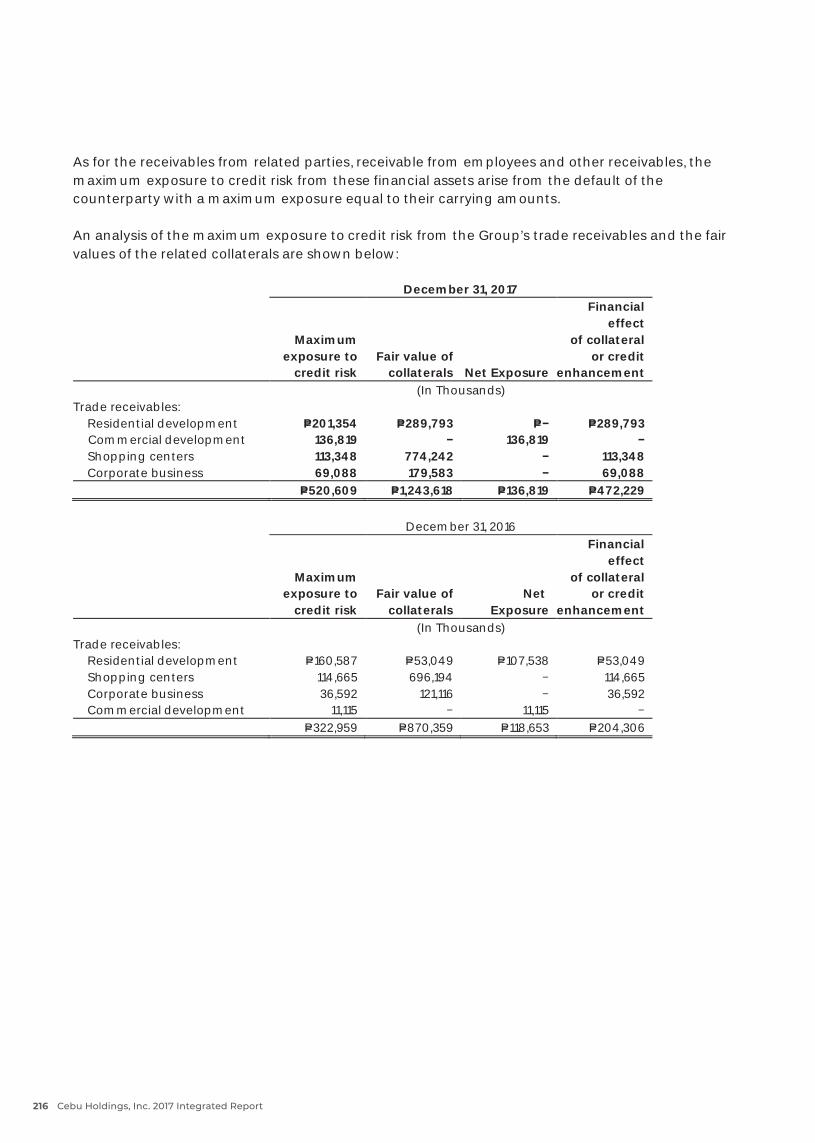
- 61 -
As for the receivables from related parties, receivable from employees and other receivables, themaximum exposure to credit risk from these financial assets arise from the default of thecounterparty with a maximum exposure equal to their carrying amounts.
An analysis of the maximum exposure to credit risk from the Group’s trade receivables and the fairvalues of the related collaterals are shown below:
December 31, 2017
Maximumexposure to
credit riskFair value of
collaterals Net Exposure
Financialeffect
of collateralor credit
enhancement(In Thousands)
Trade receivables:Residential development P=201,354 P=289,793 P= P=289,793Commercial development 136,819 136,819 Shopping centers 113,348 774,242 113,348Corporate business 69,088 179,583 69,088
P=520,609 P=1,243,618 P=136,819 P=472,229
December 31, 2016
Maximumexposure to
credit riskFair value of
collateralsNet
Exposure
Financialeffect
of collateralor credit
enhancement(In Thousands)
Trade receivables:Residential development P=160,587 P=53,049 P=107,538 P=53,049Shopping centers 114,665 696,194 114,665Corporate business 36,592 121,116 36,592Commercial development 11,115 11,115
P=322,959 P=870,359 P=118,653 P=204,306
Cebu Holdings, Inc. 2017 Integrated Report216
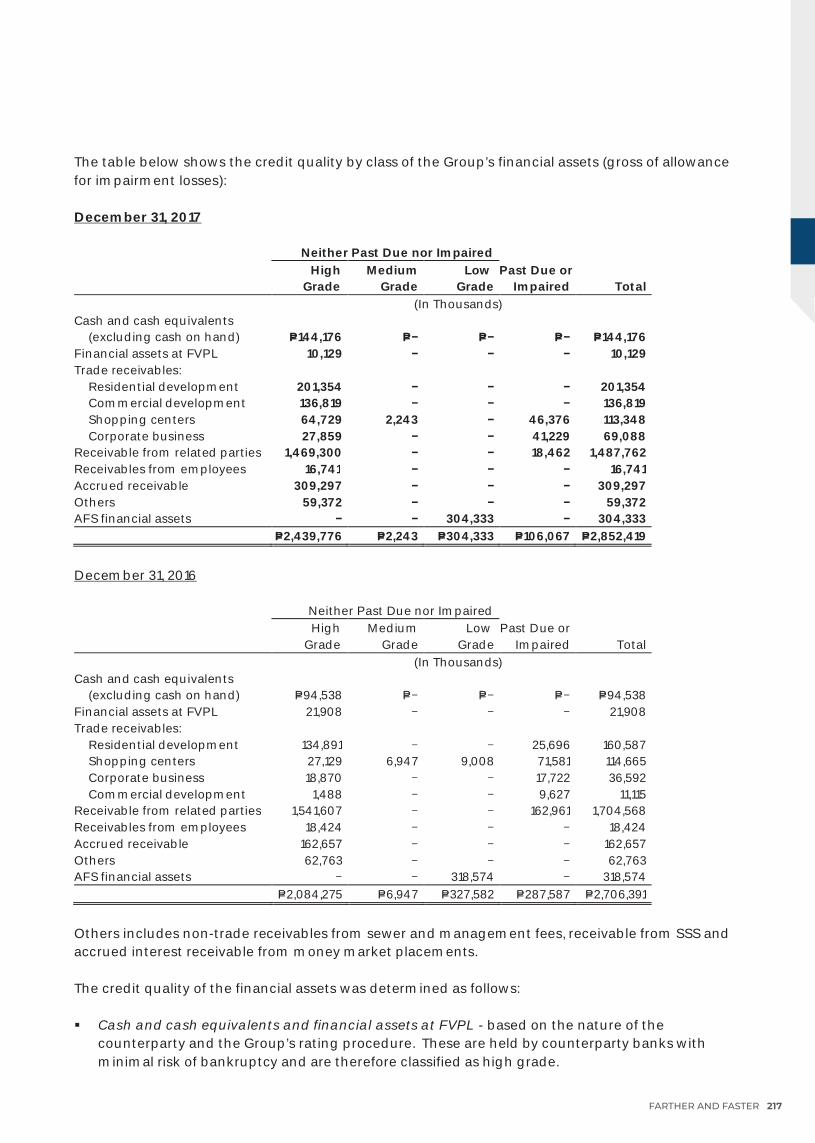
- 62 -
The table below shows the credit quality by class of the Group’s financial assets (gross of allowancefor impairment losses):
December 31, 2017
Neither Past Due nor ImpairedHigh
GradeMedium
GradeLow
GradePast Due or
Impaired Total(In Thousands)
Cash and cash equivalents(excluding cash on hand) P=144,176 P= P= P= P=144,176
Financial assets at FVPL 10,129 10,129Trade receivables:
Residential development 201,354 201,354Commercial development 136,819 136,819Shopping centers 64,729 2,243 46,376 113,348Corporate business 27,859 41,229 69,088
Receivable from related parties 1,469,300 18,462 1,487,762Receivables from employees 16,741 16,741Accrued receivable 309,297 309,297Others 59,372 59,372AFS financial assets 304,333 304,333
P=2,439,776 P=2,243 P=304,333 P=106,067 P=2,852,419
December 31, 2016
Neither Past Due nor ImpairedHigh
GradeMedium
GradeLow
GradePast Due or
Impaired Total(In Thousands)
Cash and cash equivalents(excluding cash on hand) P=94,538 P= P= P= P=94,538
Financial assets at FVPL 21,908 21,908Trade receivables:
Residential development 134,891 25,696 160,587Shopping centers 27,129 6,947 9,008 71,581 114,665Corporate business 18,870 17,722 36,592Commercial development 1,488 9,627 11,115
Receivable from related parties 1,541,607 162,961 1,704,568Receivables from employees 18,424 18,424Accrued receivable 162,657 162,657Others 62,763 62,763AFS financial assets 318,574 318,574
P=2,084,275 P=6,947 P=327,582 P=287,587 P=2,706,391
Others includes non-trade receivables from sewer and management fees, receivable from SSS andaccrued interest receivable from money market placements.
The credit quality of the financial assets was determined as follows:
Cash and cash equivalents and financial assets at FVPL - based on the nature of thecounterparty and the Group’s rating procedure. These are held by counterparty banks withminimal risk of bankruptcy and are therefore classified as high grade.
FARTHER AND FASTER 217
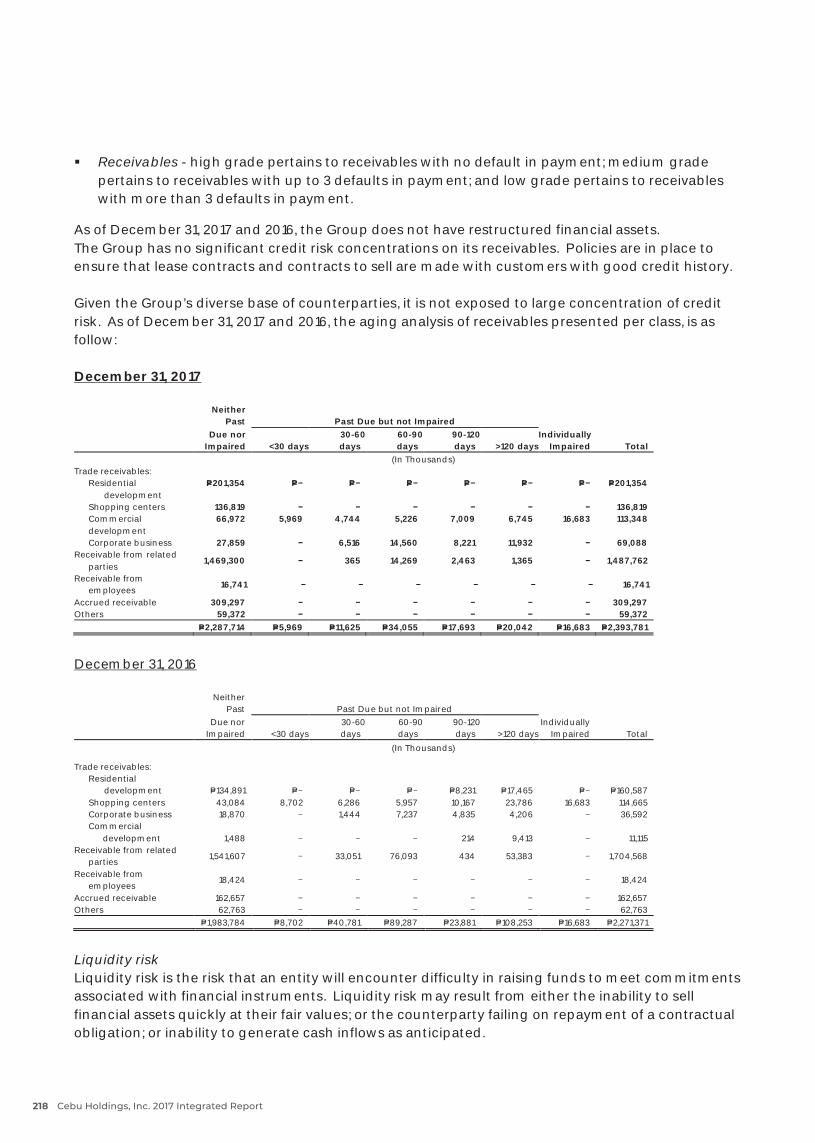
- 63 -
Receivables - high grade pertains to receivables with no default in payment; medium gradepertains to receivables with up to 3 defaults in payment; and low grade pertains to receivableswith more than 3 defaults in payment.
As of December 31, 2017 and 2016, the Group does not have restructured financial assets.The Group has no significant credit risk concentrations on its receivables. Policies are in place toensure that lease contracts and contracts to sell are made with customers with good credit history.
Given the Group’s diverse base of counterparties, it is not exposed to large concentration of creditrisk. As of December 31, 2017 and 2016, the aging analysis of receivables presented per class, is asfollow:
December 31, 2017
NeitherPast Past Due but not Impaired
Due norImpaired <30 days
30-60days
60-90days
90-120days >120 days
IndividuallyImpaired Total
(In Thousands)Trade receivables:
Residentialdevelopment
P=201,354 P= P= P= P= P= P= P=201,354
Shopping centers 136,819 136,819 Commercial
development66,972 5,969 4,744 5,226 7,009 6,745 16,683 113,348
Corporate business 27,859 6,516 14,560 8,221 11,932 69,088Receivable from related
parties1,469,300 365 14,269 2,463 1,365 1,487,762
Receivable fromemployees
16,741 16,741
Accrued receivable 309,297 309,297Others 59,372 59,372
P=2,287,714 P=5,969 P=11,625 P=34,055 P=17,693 P=20,042 P=16,683 P=2,393,781
December 31, 2016
NeitherPast Past Due but not Impaired
Due norImpaired <30 days
30-60days
60-90days
90-120days >120 days
IndividuallyImpaired Total
(In Thousands)
Trade receivables:Residential
development P=134,891 P= P= P= P=8,231 P=17,465 P= P=160,587 Shopping centers 43,084 8,702 6,286 5,957 10,167 23,786 16,683 114,665 Corporate business 18,870 1,444 7,237 4,835 4,206 36,592 Commercial
development 1,488 214 9,413 11,115Receivable from related
parties1,541,607 33,051 76,093 434 53,383 1,704,568
Receivable fromemployees
18,424 18,424
Accrued receivable 162,657 162,657Others 62,763 62,763
P=1,983,784 P=8,702 P=40,781 P=89,287 P=23,881 P=108,253 P=16,683 P=2,271,371
Liquidity riskLiquidity risk is the risk that an entity will encounter difficulty in raising funds to meet commitmentsassociated with financial instruments. Liquidity risk may result from either the inability to sellfinancial assets quickly at their fair values; or the counterparty failing on repayment of a contractualobligation; or inability to generate cash inflows as anticipated.
Cebu Holdings, Inc. 2017 Integrated Report218
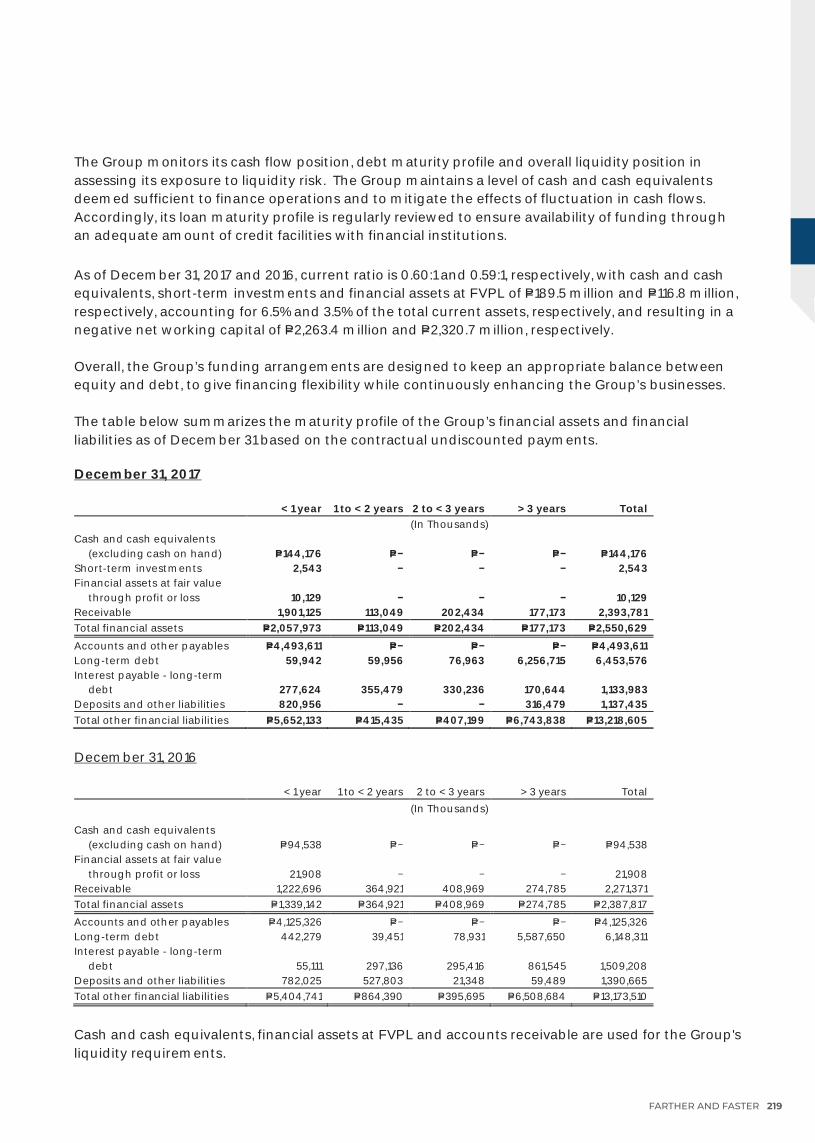
- 64 -
The Group monitors its cash flow position, debt maturity profile and overall liquidity position inassessing its exposure to liquidity risk. The Group maintains a level of cash and cash equivalentsdeemed sufficient to finance operations and to mitigate the effects of fluctuation in cash flows.Accordingly, its loan maturity profile is regularly reviewed to ensure availability of funding throughan adequate amount of credit facilities with financial institutions.
As of December 31, 2017 and 2016, current ratio is 0.60:1 and 0.59:1, respectively, with cash and cashequivalents, short-term investments and financial assets at FVPL of P=189.5 million and P=116.8 million,respectively, accounting for 6.5% and 3.5% of the total current assets, respectively, and resulting in anegative net working capital of P=2,263.4 million and P=2,320.7 million, respectively.
Overall, the Group’s funding arrangements are designed to keep an appropriate balance betweenequity and debt, to give financing flexibility while continuously enhancing the Group’s businesses.
The table below summarizes the maturity profile of the Group’s financial assets and financialliabilities as of December 31 based on the contractual undiscounted payments.
December 31, 2017
< 1 year 1 to < 2 years 2 to < 3 years > 3 years Total(In Thousands)
Cash and cash equivalents(excludingcashon hand) P=144,176 P= P= P= P=144,176
Short-term investments 2,543 2,543Financial assets at fair value
through profit orloss 10,129 10,129Receivable 1,901,125 113,049 202,434 177,173 2,393,781Total financial assets P=2,057,973 P=113,049 P=202,434 P=177,173 P=2,550,629
Accounts and other payables P=4,493,611 P= P= P= P=4,493,611Long-term debt 59,942 59,956 76,963 6,256,715 6,453,576Interest payable - long-term
debt 277,624 355,479 330,236 170,644 1,133,983Deposits and other liabilities 820,956 316,479 1,137,435Total other financial liabilities P=5,652,133 P=415,435 P=407,199 P=6,743,838 P=13,218,605
December 31, 2016
< 1 year 1 to < 2 years 2 to < 3 years > 3 years Total(In Thousands)
Cash and cash equivalents(excludingcashon hand) P=94,538 P= P= P= P=94,538
Financial assets at fair valuethrough profit orloss 21,908 21,908
Receivable 1,222,696 364,921 408,969 274,785 2,271,371Total financial assets P=1,339,142 P=364,921 P=408,969 P=274,785 P=2,387,817
Accounts and other payables P=4,125,326 P= P= P= P=4,125,326Long-term debt 442,279 39,451 78,931 5,587,650 6,148,311Interest payable - long-term
debt 55,111 297,136 295,416 861,545 1,509,208Deposits and other liabilities 782,025 527,803 21,348 59,489 1,390,665Total other financial liabilities P=5,404,741 P=864,390 P=395,695 P=6,508,684 P=13,173,510
Cash and cash equivalents, financial assets at FVPL and accounts receivable are used for the Group'sliquidity requirements.
FARTHER AND FASTER 219
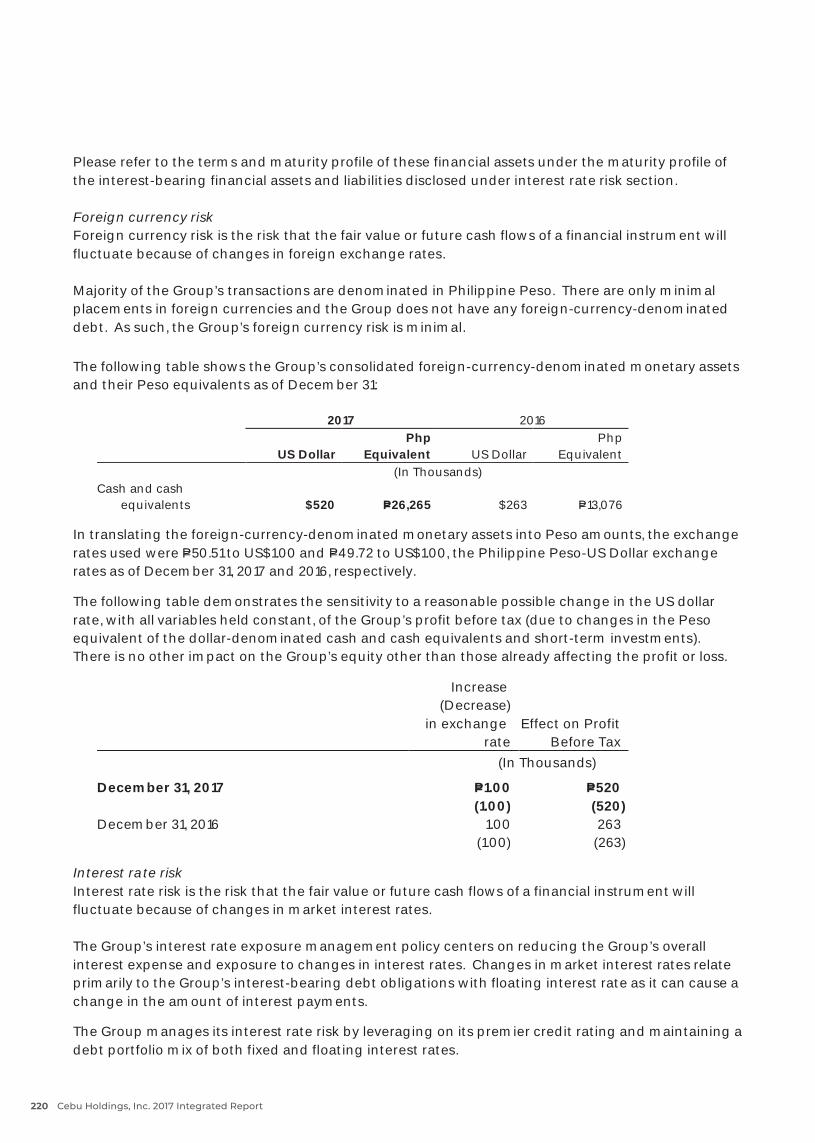
- 65 -
Please refer to the terms and maturity profile of these financial assets under the maturity profile ofthe interest-bearing financial assets and liabilities disclosed under interest rate risk section.
Foreign currency riskForeign currency risk is the risk that the fair value or future cash flows of a financial instrument willfluctuate because of changes in foreign exchange rates.
Majority of the Group’s transactions are denominated in Philippine Peso. There are only minimalplacements in foreign currencies and the Group does not have any foreign-currency-denominateddebt. As such, the Group’s foreign currency risk is minimal.
The following table shows the Group’s consolidated foreign-currency-denominated monetary assetsand their Peso equivalents as of December 31:
2017 2016
US DollarPhp
Equivalent US DollarPhp
Equivalent(In Thousands)
Cash and cashequivalents $520 P=26,265 $263 P=13,076
In translating the foreign-currency-denominated monetary assets into Peso amounts, the exchangerates used were P=50.51 to US$1.00 and P=49.72 to US$1.00, the Philippine Peso-US Dollar exchangerates as of December 31, 2017 and 2016, respectively.
The following table demonstrates the sensitivity to a reasonable possible change in the US dollarrate, with all variables held constant, of the Group’s profit before tax (due to changes in the Pesoequivalent of the dollar-denominated cash and cash equivalents and short-term investments).There is no other impact on the Group’s equity other than those already affecting the profit or loss.
Increase(Decrease)
in exchangerate
Effect on ProfitBefore Tax
(In Thousands)
December 31, 2017 P=1.00 P=520(1.00) (520)
December 31, 2016 1.00 263(1.00) (263)
Interest rate riskInterest rate risk is the risk that the fair value or future cash flows of a financial instrument willfluctuate because of changes in market interest rates.
The Group’s interest rate exposure management policy centers on reducing the Group’s overallinterest expense and exposure to changes in interest rates. Changes in market interest rates relateprimarily to the Group’s interest-bearing debt obligations with floating interest rate as it can cause achange in the amount of interest payments.
The Group manages its interest rate risk by leveraging on its premier credit rating and maintaining adebt portfolio mix of both fixed and floating interest rates.
Cebu Holdings, Inc. 2017 Integrated Report220
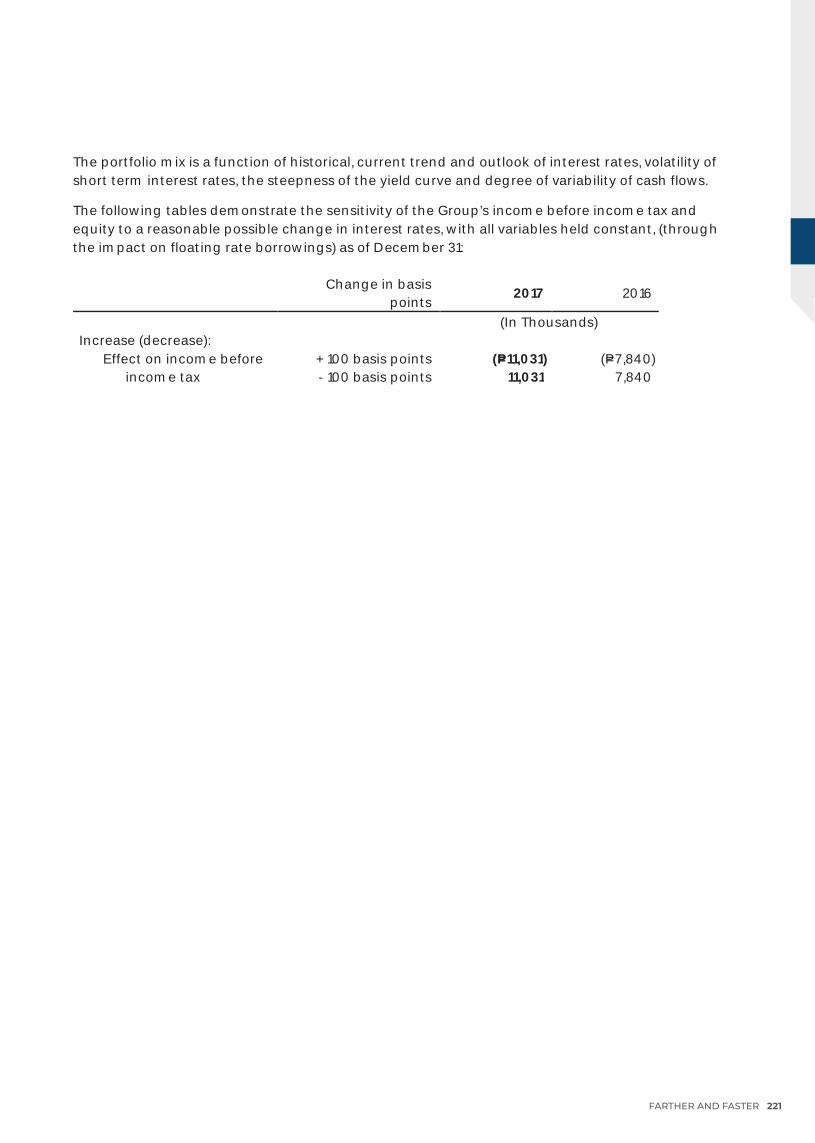
- 66 -
The portfolio mix is a function of historical, current trend and outlook of interest rates, volatility ofshort term interest rates, the steepness of the yield curve and degree of variability of cash flows.
The following tables demonstrate the sensitivity of the Group’s income before income tax andequity to a reasonable possible change in interest rates, with all variables held constant, (throughthe impact on floating rate borrowings) as of December 31:
Change in basispoints
2017 2016
(In Thousands)Increase (decrease):
Effect on income beforeincome tax
+ 100 basis points (P=11,031) (P=7,840)- 100 basis points 11,031 7,840
FARTHER AND FASTER 221
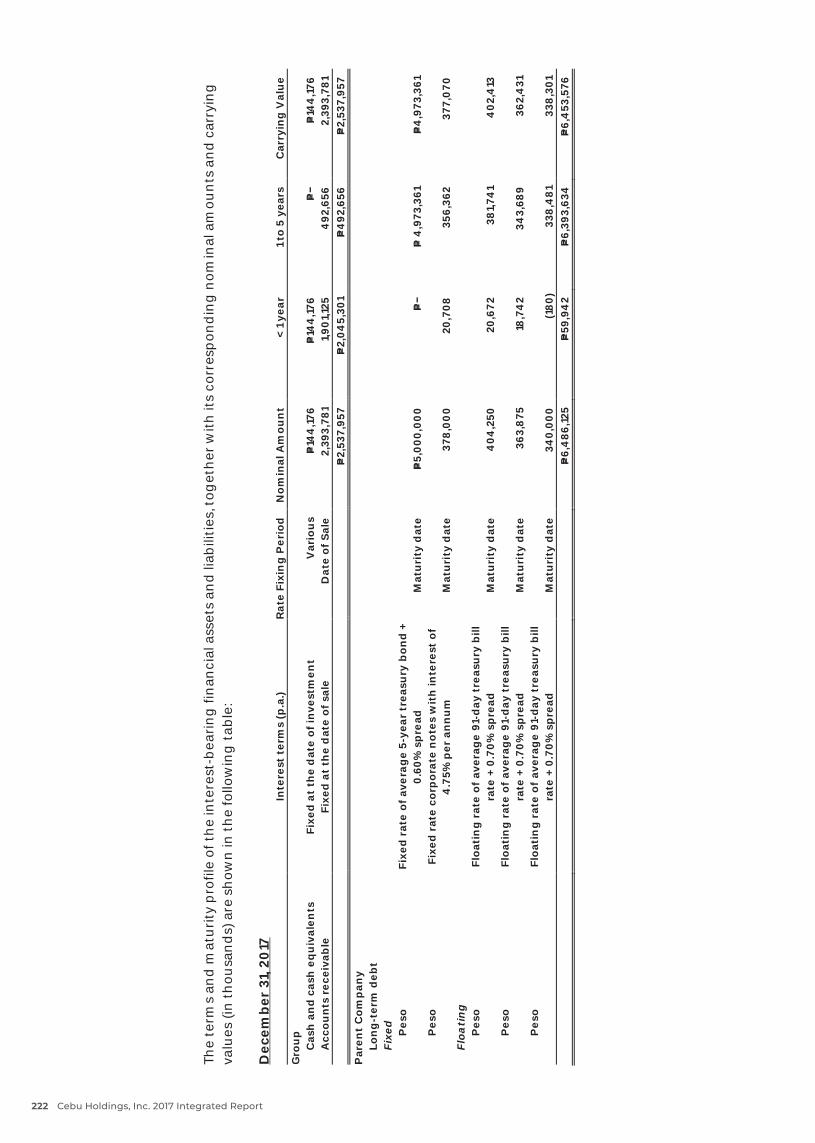
- 67
-
The
term
s an
d m
atu
rity
pro
file
of t
he
inte
rest
-bea
rin
g fi
nan
cial
ass
ets
and
liab
iliti
es, t
oget
her
with
its
corr
esp
ond
ing
nom
inal
am
oun
ts a
nd
car
ryin
gva
lues
(in
th
ousa
nd
s) a
re s
how
n in
th
e fo
llow
ing
tab
le:
Dec
emb
er 3
1, 20
17In
tere
st t
erm
s (p
.a.)
Rat
eFi
xin
g P
erio
dN
omin
al A
mou
nt
< 1 y
ear
1 to
5 ye
ars
Car
ryin
g V
alu
eG
rou
pC
ash
an
d c
ash
eq
uiv
alen
tsFi
xed
at
the
dat
e of
inve
stm
ent
Var
iou
sP=
144
,176
P=14
4,1
76P=
P=14
4,1
76A
ccou
nts
rec
eiva
ble
Fixe
d a
t th
ed
ate
of s
ale
Dat
e of
Sal
e2,
393,
781
1,90
1,125
492
,656
2,39
3,78
1P=
2,53
7,95
7P=
2,04
5,30
1P=
492
,656
P=2,
537,
957
Par
ent
Com
pan
yLo
ng
-ter
m d
ebt
Fixe
dP
eso
Fixe
d r
ate
of a
vera
ge
5-ye
artr
easu
ry b
ond
+0.
60%
sp
read
Mat
uri
ty d
ate
P=5,
000,
000
P=
P= 4
,973
,361
P=4
,973
,361
Pes
oFi
xed
rat
e co
rpor
ate
no
tes
wit
h in
tere
st o
f4
.75%
per
an
nu
mM
atu
rity
dat
e37
8,0
00
20,7
0835
6,36
237
7,0
70Fl
oati
ng
Pes
oFl
oati
ng
rat
e of
ave
rag
e 91
-day
tre
asu
ry b
illra
te +
0.7
0% s
pre
adM
atu
rity
dat
e4
04,2
5020
,672
381,7
41
402
,413
Pes
oFl
oati
ng
rat
e of
ave
rag
e 91
-day
tre
asu
ry b
illra
te +
0.7
0% s
pre
adM
atu
rity
dat
e36
3,8
7518
,74
234
3,68
936
2,4
31P
eso
Floa
tin
g r
ate
ofav
erag
e 91
-day
tre
asu
ry b
illra
te +
0.7
0% s
pre
adM
atu
rity
dat
e34
0,00
0(1
80)
338,
481
338
,301
P=6,
486
,125
P=59
,94
2P=
6,39
3,63
4P=
6,4
53,5
76
Cebu Holdings, Inc. 2017 Integrated Report222
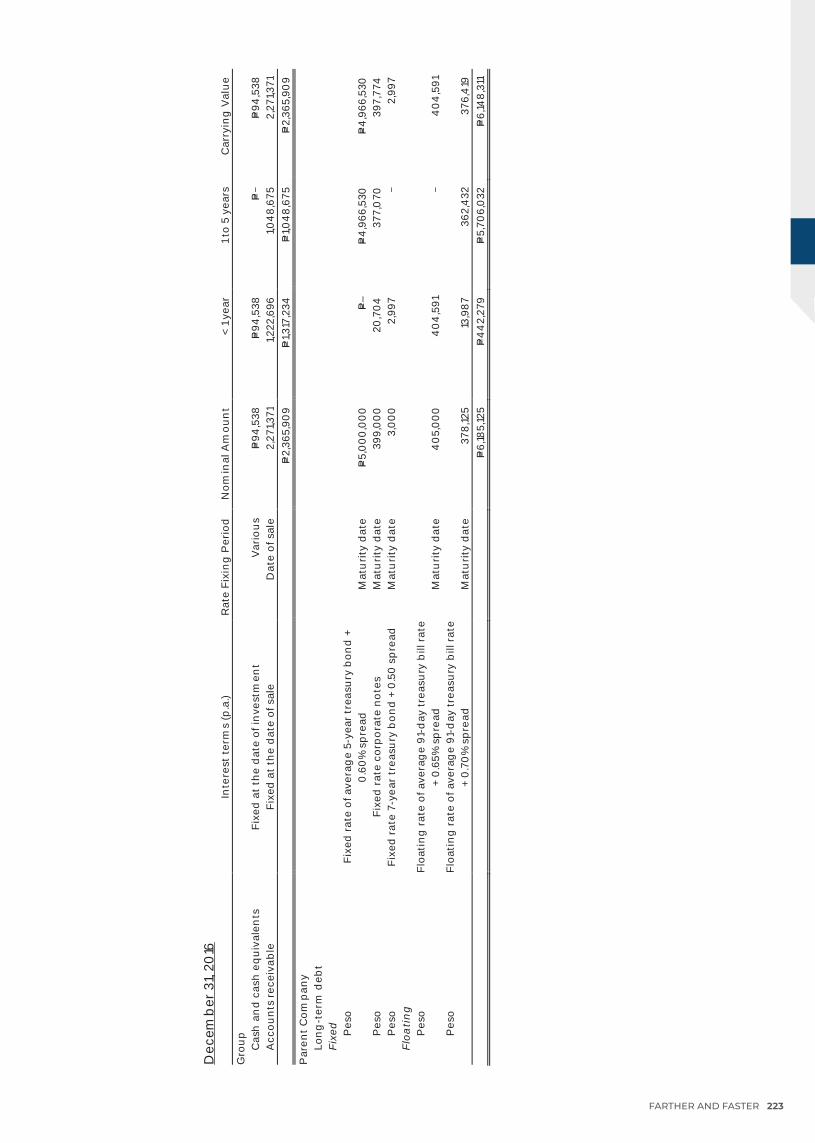
- 68
-
Dec
emb
er 3
1, 20
16In
tere
st t
erm
s (p
.a.)
Rat
e Fi
xin
g P
erio
dN
omin
alA
mou
nt
< 1 y
ear
1 to
5 ye
ars
Car
ryin
g V
alu
eG
rou
pC
ash
an
d c
ash
eq
uiv
alen
tsFi
xed
at
the
dat
e of
inve
stm
ent
Var
iou
sP=
94,5
38P=
94,5
38P=
P=94
,538
Acc
oun
ts re
ceiv
able
Fixe
d a
t th
e d
ate
of s
ale
Dat
e of
sal
e2,
271,3
711,2
22,6
961,0
48,
675
2,27
1,371
P=2,
365,
909
P=1,3
17,2
34P=
1,04
8,67
5P=
2,36
5,90
9
Par
ent
Com
pan
yLo
ng
-ter
m d
ebt
Fixe
dP
eso
Fixe
d ra
te o
f ave
rag
e 5-
year
tre
asu
ry b
ond
+0
.60
% s
pre
adM
atu
rity
dat
eP=
5,0
00
,00
0P=
–P=
4,9
66,5
30P=
4,9
66,5
30P
eso
Fixe
d r
ate
corp
ora
te n
ote
sM
atu
rity
dat
e39
9,0
00
20,7
04
377,
070
397,
774
Pes
oFi
xed
rate
7-y
ear
trea
sury
bo
nd
+ 0
.50
sp
read
Mat
uri
ty d
ate
3,0
00
2,99
7
2,99
7Fl
oati
ng
Pes
oFl
oati
ng
rat
e of
ave
rag
e 91
-day
tre
asu
ry b
ill r
ate
+ 0
.65%
sp
read
Mat
uri
ty d
ate
40
5,0
00
40
4,5
91
40
4,5
91P
eso
Floa
tin
g r
ate
of a
vera
ge
91-d
ay t
reas
ury
bill
rat
e+
0.7
0%
sp
read
Mat
uri
ty d
ate
378,
125
13,9
8736
2,4
3237
6,4
19P=
6,18
5,12
5P=
44
2,27
9P=
5,70
6,0
32P=
6,14
8,31
1
FARTHER AND FASTER 223
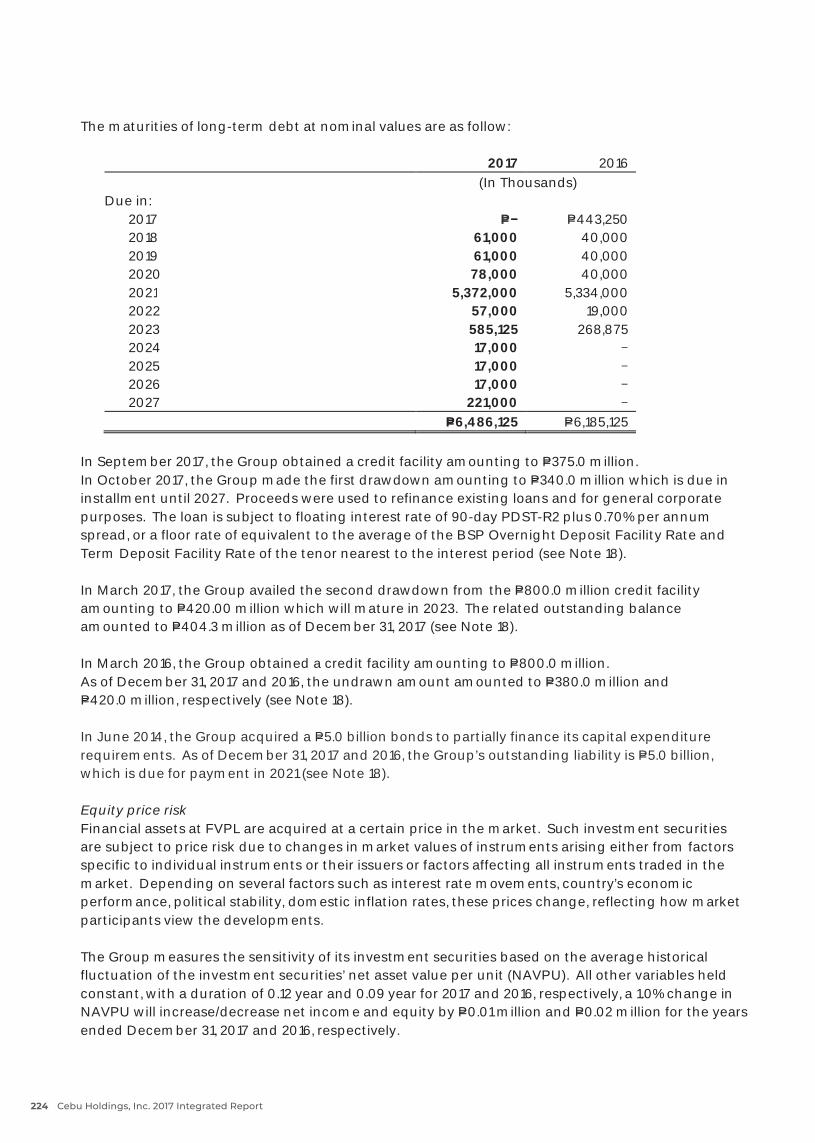
- 69 -
The maturities of long-term debt at nominal values are as follow:
2017 2016(In Thousands)
Due in:2017 P= P=443,2502018 61,000 40,0002019 61,000 40,0002020 78,000 40,0002021 5,372,000 5,334,0002022 57,000 19,0002023 585,125 268,8752024 17,000 2025 17,000 2026 17,000 2027 221,000
P=6,486,125 P=6,185,125
In September 2017, the Group obtained a credit facility amounting to P=375.0 million.In October 2017, the Group made the first drawdown amounting to P=340.0 million which is due ininstallment until 2027. Proceeds were used to refinance existing loans and for general corporatepurposes. The loan is subject to floating interest rate of 90-day PDST-R2 plus 0.70% per annumspread, or a floor rate of equivalent to the average of the BSP Overnight Deposit Facility Rate andTerm Deposit Facility Rate of the tenor nearest to the interest period (see Note 18).
In March 2017, the Group availed the second drawdown from the P=800.0 million credit facilityamounting to P=420.00 million which will mature in 2023. The related outstanding balanceamounted to P=404.3 million as of December 31, 2017 (see Note 18).
In March 2016, the Group obtained a credit facility amounting to P=800.0 million.As of December 31, 2017 and 2016, the undrawn amount amounted to P=380.0 million andP=420.0 million, respectively (see Note 18).
In June 2014, the Group acquired a P=5.0 billion bonds to partially finance its capital expenditurerequirements. As of December 31, 2017 and 2016, the Group’s outstanding liability is P=5.0 billion,which is due for payment in 2021 (see Note 18).
Equity price riskFinancial assets at FVPL are acquired at a certain price in the market. Such investment securitiesare subject to price risk due to changes in market values of instruments arising either from factorsspecific to individual instruments or their issuers or factors affecting all instruments traded in themarket. Depending on several factors such as interest rate movements, country’s economicperformance, political stability, domestic inflation rates, these prices change, reflecting how marketparticipants view the developments.
The Group measures the sensitivity of its investment securities based on the average historicalfluctuation of the investment securities’ net asset value per unit (NAVPU). All other variables heldconstant, with a duration of 0.12 year and 0.09 year for 2017 and 2016, respectively, a 1.0% change inNAVPU will increase/decrease net income and equity by P=0.01 million and P=0.02 million for the yearsended December 31, 2017 and 2016, respectively.
Cebu Holdings, Inc. 2017 Integrated Report224
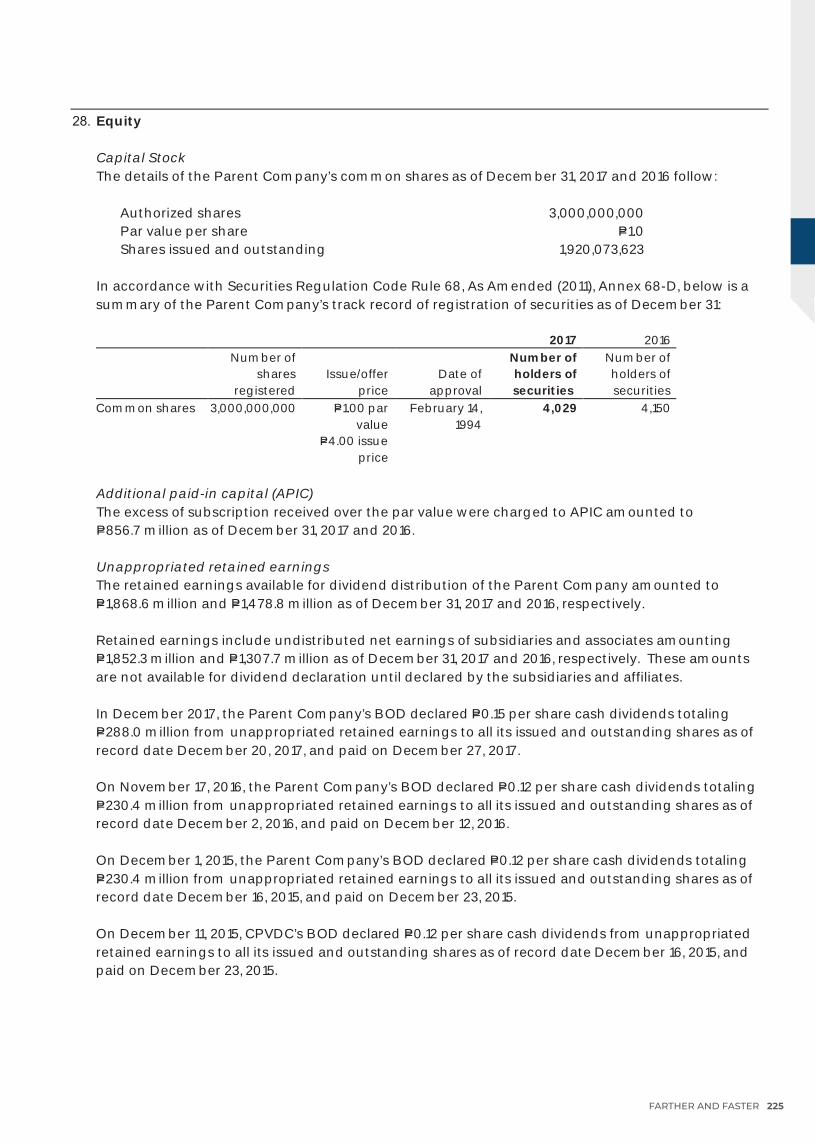
- 70 -
28. Equity
Capital StockThe details of the Parent Company’s common shares as of December 31, 2017 and 2016 follow:
Authorized shares 3,000,000,000Par value per share P=1.0Shares issued and outstanding 1,920,073,623
In accordance with Securities Regulation Code Rule 68, As Amended (2011), Annex 68-D, below is asummary of the Parent Company’s track record of registration of securities as of December 31:
2017 2016Number of
sharesregistered
Issue/offerprice
Date ofapproval
Number ofholders ofsecurities
Number ofholders ofsecurities
Common shares 3,000,000,000 P=1.00 parvalue
P=4.00 issueprice
February 14,1994
4,029 4,150
Additional paid-in capital (APIC)The excess of subscription received over the par value were charged to APIC amounted toP=856.7 million as of December 31, 2017 and 2016.
Unappropriated retained earningsThe retained earnings available for dividend distribution of the Parent Company amounted toP=1,868.6 million and P=1,478.8 million as of December 31, 2017 and 2016, respectively.
Retained earnings include undistributed net earnings of subsidiaries and associates amounting P=1,852.3 million and P=1,307.7 million as of December31, 2017 and 2016, respectively. These amountsare not available for dividend declaration until declared by the subsidiaries and affiliates.
In December 2017, the Parent Company’s BOD declared P=0.15 per share cash dividends totalingP=288.0 million from unappropriated retained earnings to all its issued and outstanding shares as ofrecord date December 20, 2017, and paid on December 27, 2017.
On November 17, 2016, the Parent Company’s BOD declared P=0.12 per share cash dividends totalingP=230.4 million from unappropriated retained earnings to all its issued and outstanding sharesas ofrecord date December 2, 2016, and paid on December 12, 2016.
On December 1, 2015, the Parent Company’s BOD declared P=0.12 per share cash dividends totalingP=230.4 million from unappropriated retained earnings to all its issued and outstanding sharesas ofrecord date December 16, 2015, and paid on December 23, 2015.
On December 11, 2015, CPVDC’s BOD declared P=0.12 per share cash dividends from unappropriatedretained earnings to all its issued and outstanding shares as of record date December 16, 2015, andpaid on December 23, 2015.
FARTHER AND FASTER 225
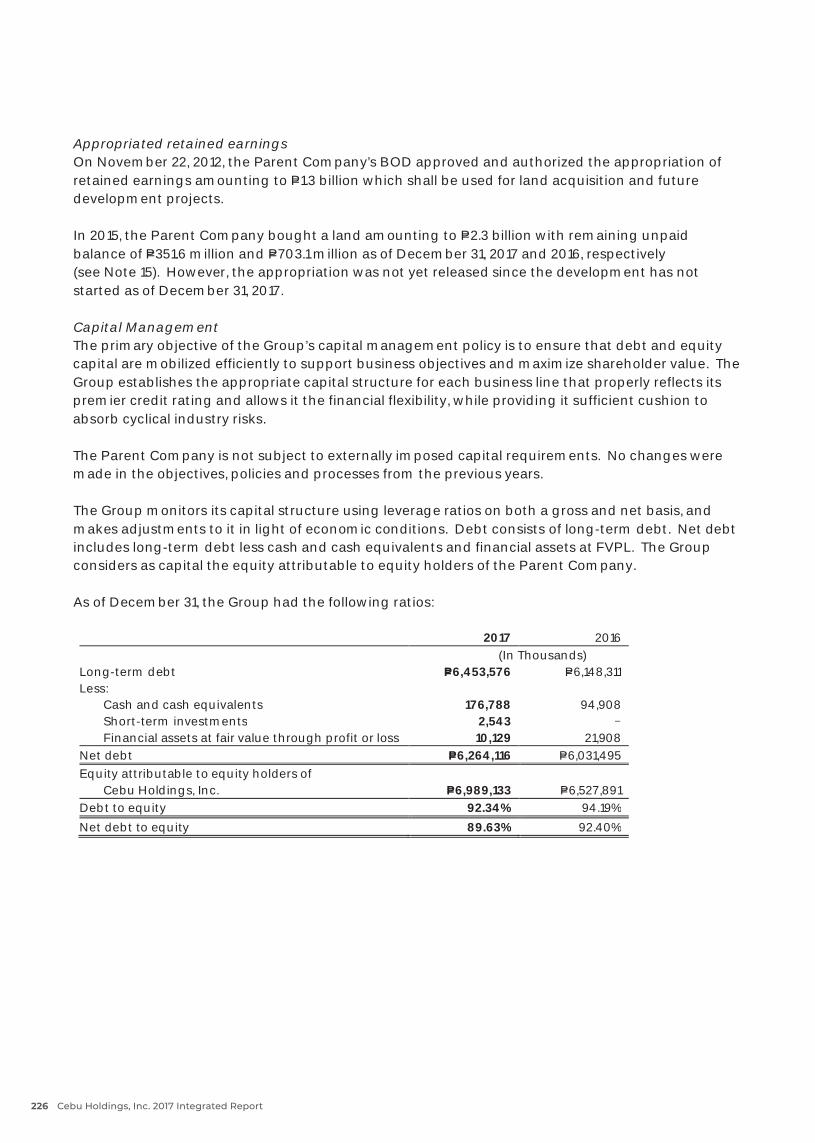
- 71 -
Appropriated retained earningsOn November 22, 2012, the Parent Company’s BOD approved and authorized the appropriation ofretained earnings amounting to P=1.3 billion which shall be used for land acquisition and futuredevelopment projects.
In 2015, the Parent Company bought a land amounting to P=2.3 billion with remaining unpaidbalance of P=351.6 million and P=703.1 million as of December 31, 2017 and 2016, respectively(see Note 15). However, the appropriation was not yet released since the development has notstarted as of December 31, 2017.
Capital ManagementThe primary objective of the Group’s capital management policy is to ensure that debt and equitycapital are mobilized efficiently to support business objectives and maximize shareholder value. TheGroup establishes the appropriate capital structure for each business line that properly reflects itspremier credit rating and allows it the financial flexibility, while providing it sufficient cushion toabsorb cyclical industry risks.
The Parent Company is not subject to externally imposed capital requirements. No changes weremade in the objectives, policies and processes from the previous years.
The Group monitors its capital structure using leverage ratios on both a gross and net basis, andmakes adjustments to it in light of economic conditions. Debt consists of long-term debt. Net debtincludes long-term debt less cash and cash equivalents and financial assets at FVPL. The Groupconsiders as capital the equity attributable to equity holders of the Parent Company.
As of December 31, the Group had the following ratios:
2017 2016(In Thousands)
Long-term debt P=6,453,576 P=6,148,311Less:
Cash and cash equivalents 176,788 94,908Short-term investments 2,543 Financial assets at fair value through profit or loss 10,129 21,908
Net debt P=6,264,116 P=6,031,495Equity attributable to equity holders of
CebuHoldings, Inc. P=6,989,133 P=6,527,891Debt to equity 92.34% 94.19%Net debt to equity 89.63% 92.40%
Cebu Holdings, Inc. 2017 Integrated Report226
- 72 -
29. Segment Information
The business segments where the Group operates are as follows:
Core business:• Commercial development - sale of commercial lots, club shares and development rights• Residential development - sale of residential lots and condominium units• Shopping centers - development of shopping centers and lease to third parties of retail space
and land therein; operation of movie theaters, food courts, entertainment facilities and carparksin these shopping centers; management and operation of malls
• Corporate business - development and lease of office buildings• Others - other investing activities such as investment in joint ventures and sale of non-core
assets
No business segments have been aggregated to form the reportable business segments.
Management monitors the operating results of its business units separately for the purpose ofmaking decisions about resource allocation and performance assessment. The accounting andmeasurement policies used are consistent with the policies used in preparing general-purposefinancial statements.
Sales, costs and expenses include amounts that are directly attributable to each segment. Itemsthat are not directly identified are allocated based on the segment’s proportionate share on the totalrevenue.
FARTHER AND FASTER 227
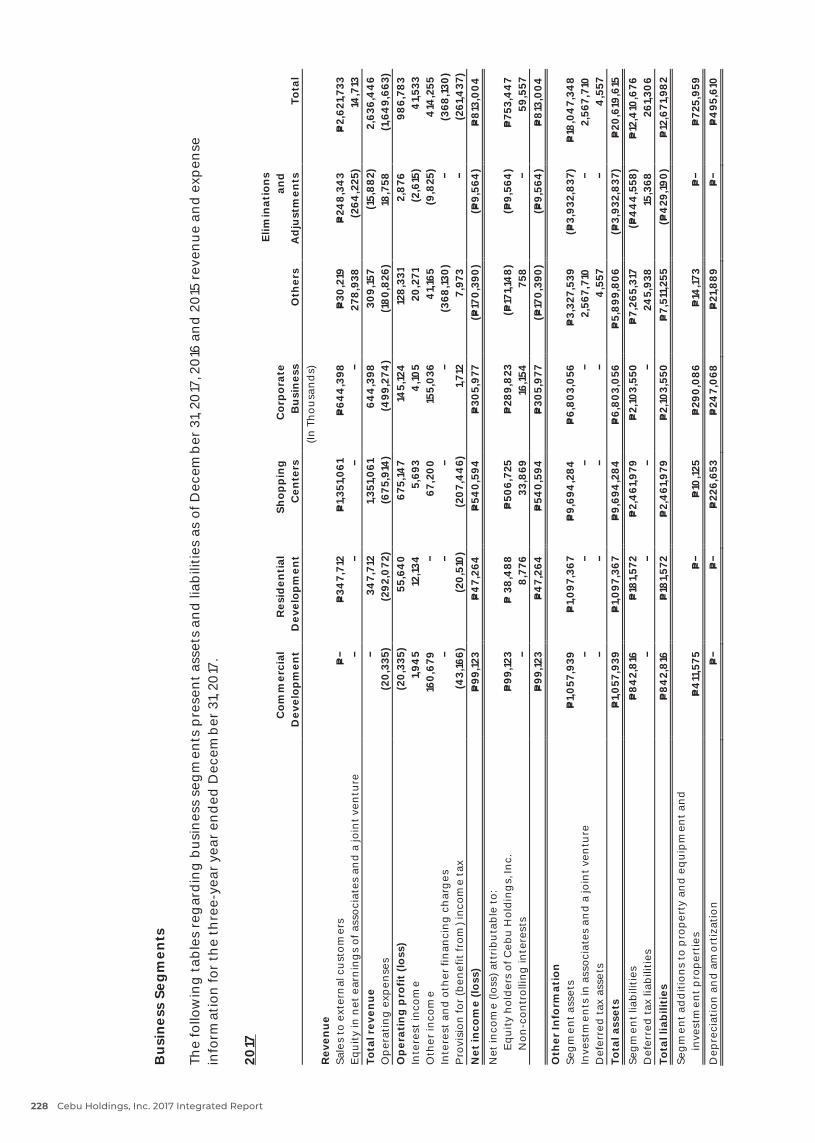
- 73
-
Bu
sine
ss S
egm
ents
The
follo
win
g t
able
s re
gar
din
g b
usin
ess
seg
men
ts p
rese
nt
asse
ts a
nd
liab
iliti
es a
s of
Dec
emb
er 3
1, 20
17, 2
016
an
d 2
015
reve
nu
e an
d e
xpen
sein
form
atio
n fo
r th
e th
ree-
year
yea
r en
ded
Dec
emb
er 3
1, 20
17.
2017
Com
mer
cial
Dev
elop
men
tR
esid
enti
alD
evel
opm
ent
Shop
pin
gC
ente
rsC
orp
ora
teB
usi
nes
sO
ther
s
Elim
inat
ion
san
dA
dju
stm
ents
Tota
l(In
Th
ousa
nd
s)R
even
ue
Sale
s to
ext
ern
al c
ust
om
ers
P=
P=34
7,71
2P=
1,35
1,06
1P=
644
,398
P=30
,219
P=24
8,34
3P=
2,62
1,733
Eq
uit
y in
net
ear
nin
gs
of a
ssoc
iate
s an
d a
join
t ve
ntu
re
27
8,9
38(2
64,2
25)
14,7
13To
tal r
even
ue
34
7,71
21,
351,
061
644
,398
309,
157
(15,
882)
2,63
6,4
46
Op
erat
ing
exp
ense
s(2
0,33
5)(2
92,0
72)
(675
,914
)(4
99,2
74)
(180
,826
)18
,758
(1,6
49,
663)
Op
erat
ing
pro
fit
(loss
)(2
0,33
5)55
,64
067
5,14
714
5,12
412
8,3
312,
876
986,
783
Inte
rest
inco
me
1,94
512
,134
5,69
34
,105
20,2
71(2
,615
)4
1,533
Oth
er in
com
e16
0,67
9
67,2
00
155,
036
41,
165
(9,8
25)
414
,255
Inte
rest
an
d o
ther
fin
anci
ng
ch
arg
es
(3
68,13
0)
(368
,130)
Pro
visi
on fo
r (b
enef
it fr
om) i
nco
me
tax
(43,
166)
(20,
510)
(20
7,4
46)
1,712
7,97
3
(261
,437
)N
et in
com
e (lo
ss)
P=99
,123
P=4
7,26
4P=
540,
594
P=30
5,97
7(P=
170
,390
)(P=
9,56
4)
P=81
3,00
4
Net
inco
me
(loss
) att
rib
uta
ble
to:
Eq
uit
y h
old
ers
of C
ebu
Hol
din
gs,
Inc.
P=99
,123
P=38
,488
P=50
6,72
5P=
289,
823
(P=17
1,14
8)(P=
9,56
4)
P=75
3,4
47
Non
-con
trol
ling
inte
rest
s
8,77
633
,869
16,1
5475
8
59,5
57P=
99,12
3P=
47,
264
P=54
0,59
4P=
305,
977
(P=17
0,39
0)(P=
9,56
4)
P=81
3,00
4O
ther
Info
rmat
ion
Seg
men
t as
sets
P=1,
057,
939
P=1,
097,
367
P=9,
694
,284
P=6,
803,
056
P=3,
327,
539
(P=3,
932,
837
)P=
18,0
47,
348
Inve
stm
ents
in a
ssoc
iate
san
d a
join
t ve
ntu
re
2,
567,
710
2,
567,
710
Def
erre
d t
ax a
sset
s
4
,557
4
,557
Tota
l ass
ets
P=1,
057,
939
P=1,
097,
367
P=9,
694
,284
P=6,
803,
056
P=5,
899,
806
(P=3,
932,
837
)P=
20,6
19,6
15Se
gm
ent
liab
iliti
esP=
842,
816
P=18
1,572
P=2,
461
,979
P=2,
103,
550
P=7,
265,
317
(P=4
44
,558
)P=
12,4
10,6
76D
efer
red
tax
liab
iliti
es
24
5,93
815
,368
261,3
06
Tota
l lia
bili
ties
P=84
2,81
6P=
181,5
72P=
2,4
61,9
79P=
2,10
3,55
0P=
7,51
1,255
(P=4
29,19
0)P=
12,6
71,9
82
Seg
men
t ad
dit
ion
s to
pro
per
ty a
nd
eq
uip
men
t an
din
vest
men
t p
rop
erti
esP=
411
,575
P=
P=10
,125
P=29
0,08
6P=
14,17
3P=
P=72
5,95
9D
epre
ciat
ion
an
d a
mo
rtiz
atio
nP=
P=
P=22
6,65
3P=
247,
068
P=21
,889
P=
P=4
95,6
10
Cebu Holdings, Inc. 2017 Integrated Report228
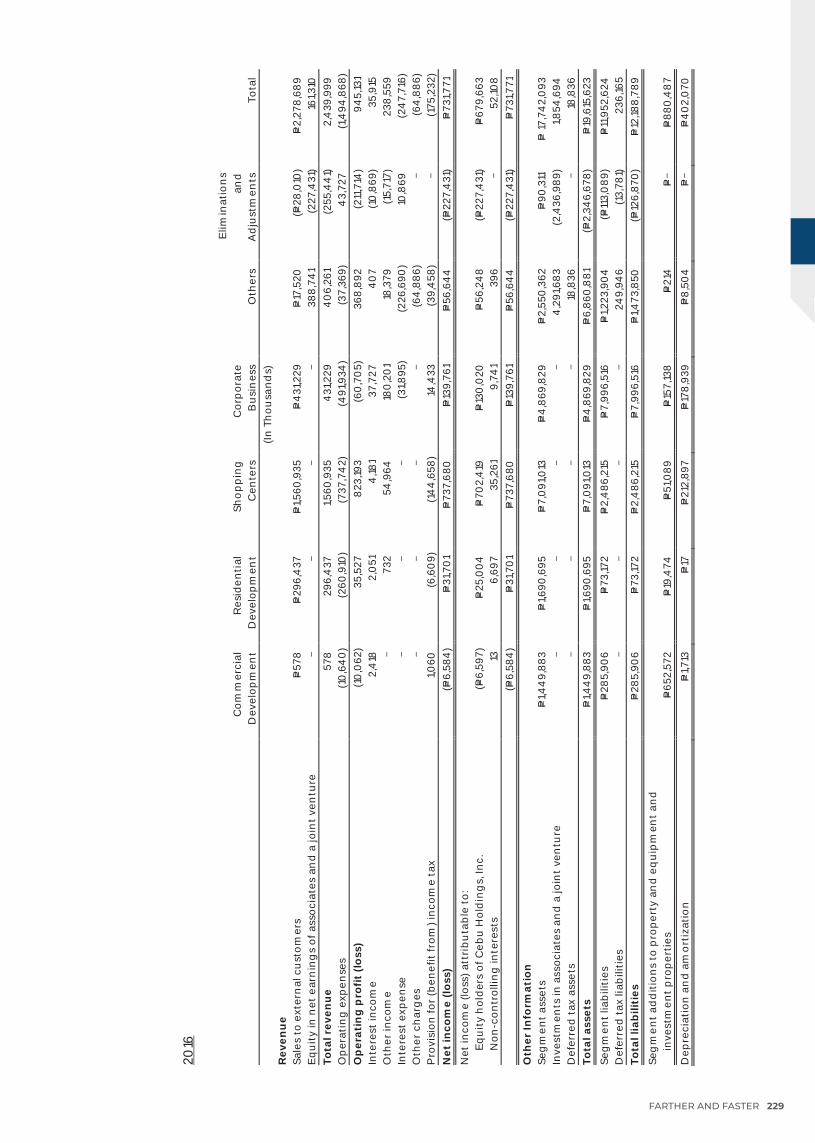
- 74
-
2016
Com
mer
cial
Dev
elop
men
tR
esid
enti
alD
evel
opm
ent
Sho
pp
ing
Cen
ters
Cor
por
ate
Bu
sin
ess
Oth
ers
Elim
inat
ion
san
dA
dju
stm
ents
Tota
l(In
Th
ousa
nd
s)R
even
ue
Sale
s to
ext
ern
al c
ust
om
ers
P=57
8P=
296,
437
P=1,5
60,9
35P=
431
,229
P=17
,520
(P=28
,010
)P=
2,27
8,68
9E
qu
ity
in n
et e
arn
ing
s of
ass
ocia
tes
and
a jo
int
ven
ture
388,
741
(227
,431
)16
1,310
Tota
l rev
enu
e57
829
6,4
371,5
60,9
354
31,2
294
06,
261
(255
,44
1)2,
439
,999
Op
erat
ing
exp
ense
s(1
0,6
40
)(2
60,9
10)
(737
,74
2)(4
91,9
34)
(37,
369)
43,
727
(1,4
94,8
68)
Op
erat
ing
pro
fit
(loss
)(1
0,0
62)
35,5
2782
3,19
3(6
0,7
05)
368,
892
(211
,714
)94
5,13
1In
tere
st in
com
e2,
418
2,0
514
,181
37,7
274
07
(10
,869
)35
,915
Oth
er in
com
e
732
54,9
6418
0,2
01
18,3
79(1
5,71
7)23
8,55
9In
tere
st e
xpen
se
(31,8
95)
(226
,690
)10
,869
(24
7,71
6)O
ther
ch
arg
es
(6
4,8
86)
(6
4,8
86)
Pro
visi
on fo
r (b
enef
it fr
om) i
nco
me
tax
1,060
(6,6
09)
(14
4,6
58)
14,4
33(3
9,4
58)
(1
75,2
32)
Net
inco
me
(loss
)(P=
6,58
4)
P=31
,70
1P=
737,
680
P=13
9,76
1P=
56,6
44
(P=22
7,4
31)
P=73
1,771
Net
inco
me
(loss
) att
rib
uta
ble
to:
Eq
uit
y h
old
ers
of C
ebu
Hol
din
gs,
Inc.
(P=6,
597)
P=25
,00
4P=
702,
419
P=13
0,0
20P=
56,2
48
(P=22
7,4
31)
P=67
9,66
3N
on-c
ontr
ollin
g in
tere
sts
136,
697
35,2
619,
741
396
52
,108
(P=6,
584
)P=
31,7
01
P=73
7,68
0P=
139,
761
P=56
,64
4(P=
227,
431
)P=
731,7
71
Oth
erIn
form
atio
nSe
gm
ent
asse
tsP=
1,44
9,88
3P=
1,690
,695
P=7,
091
,013
P=4
,869
,829
P=2,
550
,362
P=90
,311
P=17
,74
2,0
93In
vest
men
ts in
ass
ocia
tes
and
a jo
int
ven
ture
4,2
91,6
83(2
,436
,989
)1,8
54,6
94D
efer
red
tax
ass
ets
18,8
36
18,8
36To
tal a
sset
sP=
1,44
9,88
3P=
1,690
,695
P=7,
091
,013
P=4
,869
,829
P=6,
860
,881
(P=2,
346,
678)
P=19
,615
,623
Seg
men
t lia
bili
ties
P=28
5,90
6P=
73,17
2P=
2,4
86,2
15P=
7,99
6,51
6P=
1,223
,90
4(P=
113,
089
)P=
11,9
52,6
24D
efer
red
tax
liab
iliti
es
24
9,94
6(1
3,78
1)23
6,16
5To
tal l
iab
iliti
esP=
285,
906
P=73
,172
P=2,
486
,215
P=7,
996,
516
P=1,4
73,8
50(P=
126,
870
)P=
12,18
8,78
9
Seg
men
tad
dit
ion
s to
pro
per
ty a
nd
eq
uip
men
t an
din
vest
men
t p
rop
erti
esP=
652,
572
P=19
,474
P=51
,089
P=15
7,13
8P=
214
P=
P=88
0,4
87
Dep
reci
atio
n a
nd
am
ort
izat
ion
P=1,7
13P=
17P=
212,
897
P=17
8,93
9P=
8,50
4P=
P=4
02,
070
FARTHER AND FASTER 229
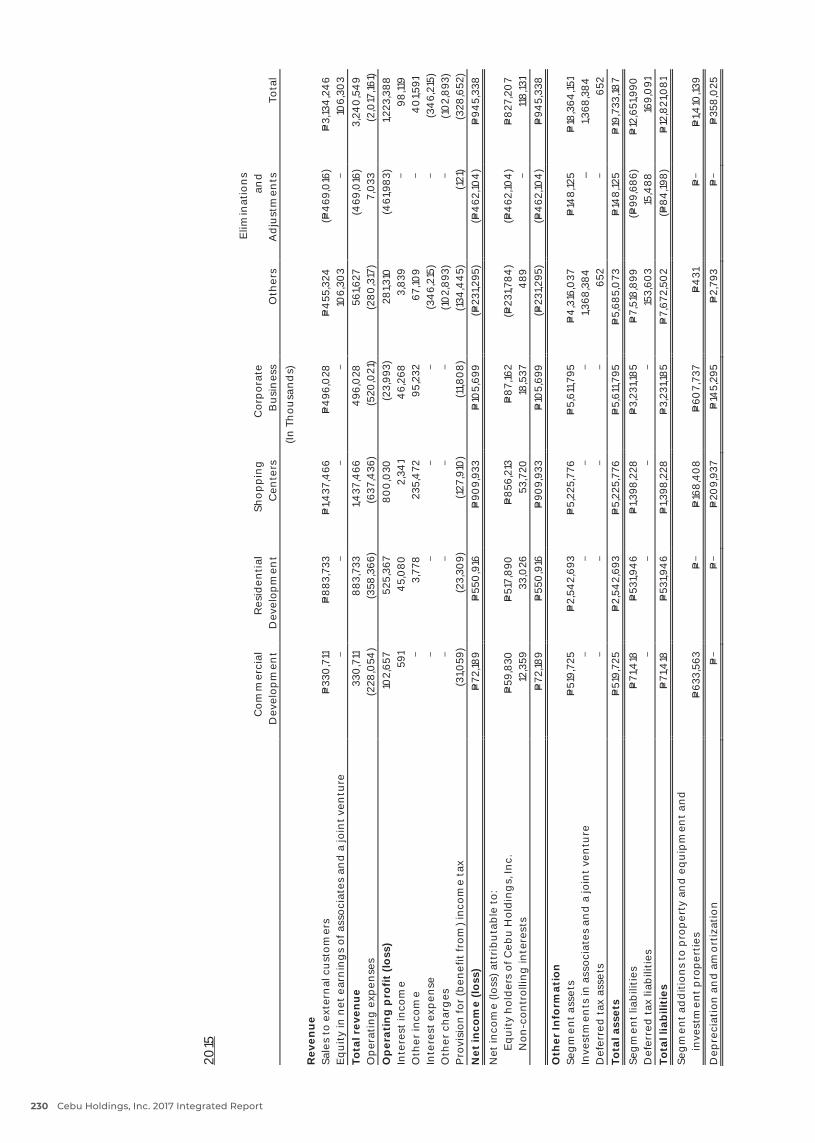
- 75
-
2015
Com
mer
cial
Dev
elop
men
tR
esid
enti
alD
evel
opm
ent
Sho
pp
ing
Cen
ters
Cor
por
ate
Bu
sin
ess
Oth
ers
Elim
inat
ion
san
dA
dju
stm
ents
Tota
l(In
Th
ousa
nd
s)
Rev
enu
eSa
les
to e
xter
nal
cu
sto
mer
sP=
330
,711
P=88
3,73
3P=
1,437
,466
P=4
96,0
28P=
455
,324
(P=4
69,0
16)
P=3,
134
,24
6E
qu
ity
in n
et e
arn
ing
s of
ass
ocia
tes
and
a jo
int
ven
ture
106,
303
10
6,30
3To
tal r
even
ue
330
,711
883,
733
1,437
,466
496
,028
561,6
27(4
69,0
16)
3,24
0,5
49
Op
erat
ing
exp
ense
s(2
28,0
54)
(358
,366
)(6
37,4
36)
(520
,021
)(2
80,3
17)
7,0
33(2
,017
,161)
Op
erat
ing
pro
fit
(loss
)10
2,65
752
5,36
780
0,0
30(2
3,99
3)28
1,310
(461
,983
)1,2
23,3
88In
tere
st in
com
e59
14
5,0
802,
341
46,
268
3,83
9
98,11
9O
ther
inco
me
3,
778
235,
472
95,2
3267
,109
4
01,5
91In
tere
st e
xpen
se
(3
46,
215)
(3
46,
215)
Oth
er c
har
ges
(10
2,89
3)
(10
2,89
3)P
rovi
sion
for
(ben
efit
from
) in
com
e ta
x(3
1,059
)(2
3,30
9)(1
27,9
10)
(11,8
08)
(134
,44
5)(1
21)
(328
,652
)N
et in
com
e (lo
ss)
P=72
,189
P=55
0,9
16P=
909,
933
P=10
5,69
9(P=
231,2
95)
(P=4
62,10
4)
P=94
5,33
8
Net
inco
me
(loss
) att
rib
uta
ble
to:
Eq
uit
y h
old
ers
of C
ebu
Hol
din
gs,
Inc.
P=59
,830
P=51
7,89
0P=
856,
213
P=87
,162
(P=23
1,784
)(P=
462
,104
)P=
827,
207
Non
-con
trol
ling
inte
rest
s12
,359
33,0
2653
,720
18,5
374
89
118,
131
P=72
,189
P=55
0,9
16P=
909,
933
P=10
5,69
9(P=
231,2
95)
(P=4
62,10
4)
P=94
5,33
8
Oth
erIn
form
atio
nSe
gm
ent
asse
tsP=
519,
725
P=2,
542,
693
P=5,
225,
776
P=5,
611,7
95P=
4,3
16,0
37P=
148,
125
P=18
,364
,151
Inve
stm
ents
in a
ssoc
iate
s an
d a
join
t ve
ntu
re
1,3
68,3
84–
1,368
,384
Def
erre
d t
ax a
sset
s
65
2
652
Tota
l ass
ets
P=51
9,72
5P=
2,54
2,69
3P=
5,22
5,77
6P=
5,61
1,795
P=5,
685,
073
P=14
8,12
5P=
19,7
33,18
7
Seg
men
t lia
bili
ties
P=71
,418
P=53
1,94
6P=
1,398
,228
P=3,
231,1
85P=
7,51
8,89
9(P=
99,6
86)
P=12
,651
,990
Def
erre
d t
ax li
abili
ties
153,
603
15,4
8816
9,0
91To
tal l
iab
iliti
esP=
71,4
18P=
531,9
46
P=1,3
98,2
28P=
3,23
1,185
P=7,
672,
502
(P=84
,198)
P=12
,821
,081
Seg
men
t ad
dit
ion
s to
pro
per
ty a
nd
eq
uip
men
t an
din
vest
men
t p
rop
erti
esP=
633,
563
P=
P=16
8,4
08
P=60
7,73
7P=
431
P=
P=1,4
10,13
9
Dep
reci
atio
n a
nd
am
ort
izat
ion
P=
P=
P=20
9,93
7P=
145,
295
P=2,
793
P=
P=35
8,0
25
Cebu Holdings, Inc. 2017 Integrated Report230
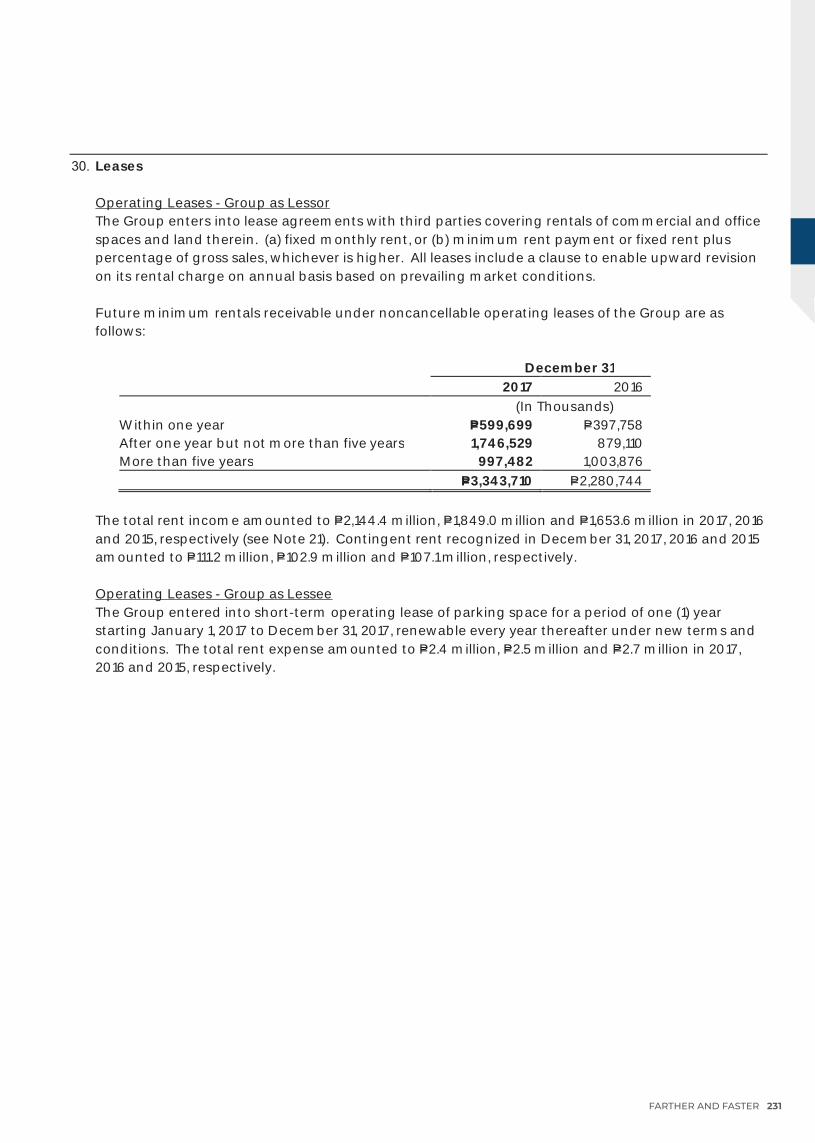
- 76 -
30. Leases
Operating Leases - Group as LessorThe Group enters into lease agreements with third parties covering rentals of commercial and officespaces and land therein. (a) fixed monthly rent, or (b) minimum rent payment or fixed rent pluspercentage of gross sales, whichever is higher. All leases include a clause to enable upward revisionon its rental charge on annual basis based on prevailing market conditions.
Future minimum rentals receivable under noncancellable operating leases of the Group are asfollows:
December 312017 2016
(In Thousands)Within one year P=599,699 P=397,758After one year but not more than fiveyears 1,746,529 879,110More than five years 997,482 1,003,876
P=3,343,710 P=2,280,744
The total rent income amounted to P=2,144.4 million, P=1,849.0 million and P=1,653.6 million in 2017, 2016and 2015, respectively (see Note 21). Contingent rent recognized in December 31, 2017, 2016 and 2015amounted to P=111.2 million, P=102.9 million and P=107.1 million, respectively.
Operating Leases - Group as LesseeThe Group entered into short-term operating lease of parking space for a period of one (1) yearstarting January 1, 2017 to December 31, 2017, renewable every year thereafter under new terms andconditions. The total rent expense amounted to P=2.4 million, P=2.5 million and P=2.7 million in 2017,2016 and 2015, respectively.
31. Philippine Economic Zone Authority (PEZA) Registration
CPVDC was registered with PEZA on April 6, 2000 as an Information Technology (IT) Park developeror operator and was granted approval by PEZA on October 10, 2001. The PEZA registration entitledCPVDC to a four-year tax holiday from the start of approval of registered activities. At the expirationof its four-year tax holiday, CPVDC pays income tax at the special rate of 5% on its gross incomeearned from sources within the PEZA economic zone in lieu of paying all national and local incometaxes.
On December 18, 2007, PEZA approved the registration of AiO, the subsidiary, as an Economic ZoneInformation Technology (IT) Facility Enterprise. As a registered ecozone facilities enterprise, thesubsidiary is entitled to establish, develop, construct, administer, manage and operate a12-storey building and 17-storey building located at Asia Town IT Park, in accordance with the termsand conditions of the Registration Agreement with PEZA. The Group shall pay income tax at thespecial tax rate of 5% on its gross income earned from sources within the PEZA economic zone inlieu of paying all national and local income taxes. Gross income earned refers to gross sales or grossrevenues derived from any business activity, net of returns and allowances, less cost of sales or directcosts but before any deduction is made for administrative expenses or incidental losses. Incomegenerated from sources outside of the PEZA economic zone shall be subject to regular internalrevenue taxes.
FARTHER AND FASTER 231

- 77 -
It is certified by the Bureau of Internal Revenue under Section 4.106-6 and 4 108-6 of RevenueRegulation No. 16-2005 that the enterprise is conducted for purposes of its VAT zero-ratingtransactions with its local suppliers of goods, properties and services.
32. Supplemental Cash Flow Information
Changes in liabilities arising from financing activities follow:
January 1,2017 Cash Flows
Non-cashchanges
Amortizationof DIC Other
December 31,2017
(In Thousands)Current portion of long-
term debt (Note 18)P=442,279 (P=459,000) P=412 P=76,251 P=59,942
Long-term debt - net ofcurrent portion
5,706,032 756,200 7,653 (76,251) 6,393,634
Interest payable 48,315 (181,373) 137,344 4,286Dividends payable 1,751 (288,010) 288,010 1,751Total liabilities from
financing activities P=6,198,377 (172,183) P=8,065 P=425,354 P=6,459,613
The ‘Other’ column includes the effect of reclassification of non-current portion of interest-bearingloans and borrowings and the effect of accrued but not yet paid interest on interest-bearing loansand borrowings. The Group classifies interest paid as cash flows from operating activities.
The noncash investing and financing activities of the Group pertain to:
• Transfers from property and equipment to investment properties with a net book valueamounting to P=0.02 million in 2016;
• Transfers from inventories to investment properties amounting to P=231.7 million in 2016;• Transfers from investment properties to property and equipment and inventories amounting to
P=222.7 million and P=73.0 million, respectively, in 2017; and• Assignment of club shares, classified as "Available-for-sale financial assets", to the condominium
corporation which formed part of the cost of the Group's residential projects amounted toP=14.2 million.
33. Provisions and Contingencies
The Group is currently involved in a legal proceeding and the outcome of this legal proceeding is notpresently determinable.
In the opinion of management and its legal counsel, the eventual liability under this legalproceeding, if any, will not have a material effect on the Group’s financial position and results ofoperations. The information usually required under PAS 37 is not disclosed on the ground that itmay prejudice the outcome of the legal proceeding.
- 76 -
30. Leases
Operating Leases - Group as LessorThe Group enters into lease agreements with third parties covering rentals of commercial and officespaces and land therein. (a) fixed monthly rent, or (b) minimum rent payment or fixed rent pluspercentage of gross sales, whichever is higher. All leases include a clause to enable upward revisionon its rental charge on annual basis based on prevailing market conditions.
Future minimum rentals receivable under noncancellable operating leases of the Group are asfollows:
December 312017 2016
(In Thousands)Within one year P=599,699 P=397,758After one year but not more than fiveyears 1,746,529 879,110More than five years 997,482 1,003,876
P=3,343,710 P=2,280,744
The total rent income amounted to P=2,144.4 million, P=1,849.0 million and P=1,653.6 million in 2017, 2016and 2015, respectively (see Note 21). Contingent rent recognized in December 31, 2017, 2016 and 2015amounted to P=111.2 million, P=102.9 million and P=107.1 million, respectively.
Operating Leases - Group as LesseeThe Group entered into short-term operating lease of parking space for a period of one (1) yearstarting January 1, 2017 to December 31, 2017, renewable every year thereafter under new terms andconditions. The total rent expense amounted to P=2.4 million, P=2.5 million and P=2.7 million in 2017,2016 and 2015, respectively.
31. Philippine Economic Zone Authority (PEZA) Registration
CPVDC was registered with PEZA on April 6, 2000 as an Information Technology (IT) Park developeror operator and was granted approval by PEZA on October 10, 2001. The PEZA registration entitledCPVDC to a four-year tax holiday from the start of approval of registered activities. At the expirationof its four-year tax holiday, CPVDC pays income tax at the special rate of 5% on its gross incomeearned from sources within the PEZA economic zone in lieu of paying all national and local incometaxes.
On December 18, 2007, PEZA approved the registration of AiO, the subsidiary, as an Economic ZoneInformation Technology (IT) Facility Enterprise. As a registered ecozone facilities enterprise, thesubsidiary is entitled to establish, develop, construct, administer, manage and operate a12-storey building and 17-storey building located at Asia Town IT Park, in accordance with the termsand conditions of the Registration Agreement with PEZA. The Group shall pay income tax at thespecial tax rate of 5% on its gross income earned from sources within the PEZA economic zone inlieu of paying all national and local income taxes. Gross income earned refers to gross sales or grossrevenues derived from any business activity, net of returns and allowances, less cost of sales or directcosts but before any deduction is made for administrative expenses or incidental losses. Incomegenerated from sources outside of the PEZA economic zone shall be subject to regular internalrevenue taxes.
Cebu Holdings, Inc. 2017 Integrated Report232
- 77 -
It is certified by the Bureau of Internal Revenue under Section 4.106-6 and 4 108-6 of RevenueRegulation No. 16-2005 that the enterprise is conducted for purposes of its VAT zero-ratingtransactions with its local suppliers of goods, properties and services.
32. Supplemental Cash Flow Information
Changes in liabilities arising from financing activities follow:
January 1,2017 Cash Flows
Non-cashchanges
Amortizationof DIC Other
December 31,2017
(In Thousands)Current portion of long-
term debt (Note 18)P=442,279 (P=459,000) P=412 P=76,251 P=59,942
Long-term debt - net ofcurrent portion
5,706,032 756,200 7,653 (76,251) 6,393,634
Interest payable 48,315 (181,373) 137,344 4,286Dividends payable 1,751 (288,010) 288,010 1,751Total liabilities from
financing activities P=6,198,377 (172,183) P=8,065 P=425,354 P=6,459,613
The ‘Other’ column includes the effect of reclassification of non-current portion of interest-bearingloans and borrowings and the effect of accrued but not yet paid interest on interest-bearing loansand borrowings. The Group classifies interest paid as cash flows from operating activities.
The noncash investing and financing activities of the Group pertain to:
• Transfers from property and equipment to investment properties with a net book valueamounting to P=0.02 million in 2016;
• Transfers from inventories to investment properties amounting to P=231.7 million in 2016;• Transfers from investment properties to property and equipment and inventories amounting to
P=222.7 million and P=73.0 million, respectively, in 2017; and• Assignment of club shares, classified as "Available-for-sale financial assets", to the condominium
corporation which formed part of the cost of the Group's residential projects amounted toP=14.2 million.
33. Provisions and Contingencies
The Group is currently involved in a legal proceeding and the outcome of this legal proceeding is notpresently determinable.
In the opinion of management and its legal counsel, the eventual liability under this legalproceeding, if any, will not have a material effect on the Group’s financial position and results ofoperations. The information usually required under PAS 37 is not disclosed on the ground that itmay prejudice the outcome of the legal proceeding.
FARTHER AND FASTER 233
ADVISER
Aniceto V. Bisnar, Jr. President
EDITORIAL TEAM
Ma. Cecilia Crispina T. Urbina Assistant Vice President and Head, HR and Administration
Noel F. Alicaya Finance and Control Officer / Chief Risk Officer
Vera R. Alejandria Sustainability Officer / Community Relations Manager
Maria Jeanette A. Japzon Corporate Communications, Media Relations and Legal Affairs Manager
Jennifer G. Sia Audit Manager
Archie T. Obeso Control and Analysis Officer
Jonjay O. Camson Control and Analysis Officer
Andrea Denise H. Chua Corporate Communications Assistant
CONTRIBUTORS
CHI Sustainability Council
Makati Development Corporation
Ayala Property Management Corporation
Ayala Land Malls, Inc.
PHOTOGRAPHY
Portraiture Wig Tysmans
Raul Arambulo
Landscape Wig Tysmans
Tonette Jacinto
Crisanto Damo
Paul Gotiong
Events & Activities Grace Carino
Joni Ocasiones
Andrea Denise Chua
COVER
Unified Ayala Group Medium3 Inc. Report Concept
Subject Cebu Poseidon Dragons at Mactan, Cebu
DESIGN AND LAYOUT
Revia Design Grp., Ltd. Co.
SUSTAINABILITY REPORTING CONSULTANT
Philippine Business for the Environment
PUBLICATION TEAM
Post-consumerRecycled Fiber
SHAREHOLDER INFORMATION
CORPORATE HEADQUARTERS20F Ayala Center Cebu TowerBohol St., Cebu Business ParkCebu City, Cebu 6000 Philippines Tel (6332) 888 3700
STAKEHOLDER INFORMATIONFor inquiries from institutional investors, analysts, the financial and business community on the financial report and feedback from our various stakeholder groups on the annual and sustainability report, please write or call:
Cebu Holdings, Inc. 20F Ayala Center Cebu TowerBohol St., Cebu Business ParkCebu City, Cebu 6000 Philippines Tel (6332) 888 3700 www.cebuholdings.com [email protected]
SHAREHOLDER SERVICES AND ASSISTANCEFor inquiries regarding dividend payments, change of address and account status, lost or damaged stock certificates, please write or call:
Stock Transfer Service, Inc.Unit D, 34/F Rufino Pacific Tower6784 Ayala Avenue, Makati City Tel (632) 403 2410 / (632) 403 2412 Fax (632) 403 2414 [email protected]@stocktransfer.com.ph
28F, Vismin GroupTower One & Exchange PlazaAyala Triangle, Ayala Avenue, 1226 Makati City, Metro Manila, PhilippinesTel (632) 750 6647
ABOUT OUR PAPER
The Cebu Holdings, Inc. 2017 Annual and Sustainability Report cover is printed on FSC® Certified, process chlorine-free, 100% post-consumer fibers. The main pages of this report are printed on wood-free paper produced with pulps from PEFC-certified (Programme for the Endorsement of Forest Certification) sustainably-managed forests. The financial statements of this report are also printed on paper made of 100% post-consumer fibers.

F A R T H E R A N D F A S T E R
Cebu Holdings, Inc. • 2017 Integrated Report
FA
RT
HE
R A
ND
FA
ST
ER
CK M Y RED 80K 40K K C 80C 40CM CY K C40M K M Y 80Y 40Y PaperM Y BLUE 80MGREEN CK M Y RED 80K 40K K C 80C 40CM CY K C40M K M Y 80Y 40Y PaperM Y BLUE 80MGREEN CK M Y RED 80K 40K K C 80C 40CM CY K C40M K M Y 80Y 40Y PaperM Y BLUE 80MGREEN CK M Y RED 80K 40K K C M Y GREEN