famines and likelihood of consecutive megadroughts in india
TRANSCRIPT
ARTICLE OPEN
Famines and likelihood of consecutive megadroughts in IndiaVimal Mishra 1,2✉ and Saran Aadhar 1
Consecutive failures in the summer monsoon rainfall led to widespread and severe droughts with profound implications foragricultural activities in India. However, the likelihood of successive megadroughts in India’s past and future climate remain poorlyunderstood. Using Palmer Drought Severity Index (PDSI) from the Monsoon Asia Drought Atlas (MADA), we show that the majorfamines that affected millions of people during 1200–2018 were linked with summer monsoon droughts. Four megadroughtscovering more than 40% of the country occurred for two consecutive summer monsoon seasons during 1200–2018. The mostrecent and severe megadrought occurred in 2002–2003. Simulations from the Community Earth System Model (CESM) for the lastmillennium (850–2005) ensemble (LME) show that the likelihood of two and three-year consecutive megadroughts during thesummer monsoon is about 0.7 and 0.3 events per 100 years, respectively. Large ensemble simulations from CESM (CESM-LE) show adecline in the frequency of megadroughts in the future. Summer monsoon megadroughts are strongly associated with the warmsea surface temperature (SST) anomalies over the Pacific Ocean in the past and future climate. Substantial warming under theprojected future climate can cause megadroughts under near-normal precipitation during the summer monsoon season. Despitethe projected decline in the likelihood of the summer monsoon megadroughts under the warming climate, megadroughts in thefuture can have considerable implications for India’s food production and water availability.
npj Climate and Atmospheric Science (2021) 4:59 ; https://doi.org/10.1038/s41612-021-00219-1
INTRODUCTIONIndian summer monsoon (June–September) accounts for morethan 80% of the total annual rainfall1. Rainfall during the summermonsoon plays a vital role in the Indian economy2,3. The Indiansummer monsoon has a year-to-year variability of about 10% of itslong-term mean1,2. A rainfall deficit of more than 10% isconsidered a drought, while rainfall of more than 10% of thelong-term mean is termed surplus2. A deficit of 19–21% in rainfallin 2002 caused a drought that resulted in an estimated loss ofbillions of dollars, which was about 1% in the Gross DomesticProduct (GDP) of India4. From 1901 through 2010, 17% of the totalyears experienced drought during the summer monsoon season.Characteristics and the occurrence of droughts during the summermonsoon season are well studied1,4–8. About 18 meteorologicaldroughts occurred in India during the 1870–2018 period7. Thesevere meteorological and hydrological droughts occurred in1876, 1899, 1918, 1965, and 20007. While droughts due to summermonsoon failure have implications, consecutive droughts disruptIndia’s socio-economic well-being. For instance, the drought of2015–2018 caused groundwater depletion and affected aboutone-fourth of the total Indian population7,8. Similarly, the droughtof 1875–1876 caused the great famine and affected millions ofpeople in India9,10.The year-to-year variability of the Indian summer monsoon is
influenced by El Nino Southern Oscillation (ENSO11–16). Warm seasurface temperature (SST) anomalies over the Pacific Ocean arenegatively related to the Indian summer monsoon rainfall (ISMR).The negative relationship between summer monsoon rainfall andSST anomalies is the strongest over the eastern Pacific region15.The physical mechanism of the linkage between ENSO and theIndian summer monsoon is associated with atmospheric circula-tion and ENSO-induced SST variability17. The coupled atmosphericand oceanic variability modify Walker circulation and connect therising motion over the central-eastern Pacific during a warm phase
of ENSO with reduced rainfall over India17. While ENSO is one ofthe significant drivers of the year-to-year variability of the Indiansummer monsoon, other forcings are related to SST patterns overthe Indian Ocean, Atlantic Ocean, and other parts of the PacificOcean affect ISMR. For instance, Indian Ocean Dipole (IOD) is adominant mode of coupled ocean-atmospheric variability, influ-encing summer monsoon18–22. A positive phase of IOD is linkedwith the above-normal summer monsoon rainfall23–25. Moreover,IOD modulates the teleconnection between ENSO and ISMR25,26.At the decadal time scale, Pacific decadal oscillation (PDO)influences the summer monsoon through a modification of theWalker circulation and adjustment in the Indian ocean Hadleycell27,28. Similarly, at a multidecadal time scale, Atlantic multi-decadal oscillation (AMO) influences the summer monsoon29,30
through modifying the tropospheric temperature gradient17.India has a long history of famines31–33. Famines caused
significant mortality due to lack of food availability, resultingfrom crop failures and other factors9. The history of famines inIndia reported in the scientific literature goes back to 503–443BC31. Famines occurred in a large number in India during the pre-British era. While the number of local/regional famines thataffected a small part of the country is considerably higher31, Indiawitnessed twenty major famines from 1200 to 1945. Out of thesemajor famines, nine famines were widespread and caused the lossof millions of lives in India. The summer monsoon failures anddroughts9,31,33 caused a majority of the famines. Agriculturaldrought due to soil moisture deficit and crop failure resulted infood insecurity, which primarily caused most famines in Indiaduring the British Era9,10. For instance, out of six major famines(1873–1874, 1876, 1877, 1896-1897, 1899, and 1943) during1870–2018, soil moisture drought9 was the main reason for thefive (1873–74, 1876, 1877, 1896–97, and 1899). On the other hand,summer monsoon failure and drought were not associated withthe Bengal famine of 1943; instead, it occurred due to policy
1Civil Engineering, Indian Institute of Technology (IIT) Gandhinagar, Gandhinagar, India. 2Earth Sciences, Indian Institute of Technology (IIT) Gandhinagar, Gandhinagar, India.✉email: [email protected]
www.nature.com/npjclimatsci
Published in partnership with CECCR at King Abdulaziz University
1234567890():,;
failures and conflict9,34. Therefore, understanding major droughtsand the causes of their occurrence in the long-term historicalrecord is crucial.A relatively short observational record of a century and half
period does not provide crucial information on the megadroughtsthat caused famines before the 1870s in India. Long-termpaleoclimate reconstructions based on the historical documentsand tree ring datasets35–39 have been used to examine droughtsand famine across the globe35–39. Paleoclimate records over theIndian monsoon region showed that the Indian summermonsoon’s year-to-year variability is higher than the estimatesbased on the observations40. Seasonally resolved griddedreconstruction of monsoon failures based on the network of treering chronologies can reveal the occurrence of megadroughtsover the past millennium35. As the past droughts were the leadingcause of most famines that India witnessed9,31, it is crucial toexamine the likelihood of the megadroughts and their drivers inthe past and future. We identify the two critical research gaps: (i)several famines that occurred before the 1870s and affectedmillions of people in India; however, their causes and linkage withthe monsoon failures are not well understood and (ii) the role ofsubstantial projected warming on the occurrence of mega-droughts in India remains unexplored. In consecutive years, awidespread failure of the summer monsoon can cause mega-droughts with profound implications for agriculture and wateravailability. However, estimation of megadrought using a short-term record is challenging due to its low probability of occurrence.To address these gaps, we use Palmer Drought Severity Index(PDSI) based on the Monsoon Asia Drought Atlas (MADA,1200–2012) and Climate Research Unit (CRU, 2013–2018) toexamine the likelihood of megadroughts that occurred for the 2and 3 consecutive years during 1200–2018. Also, we use long-termsimulations from the Community Earth System Model (CESM) toestimate the likelihood of megadroughts during the summermonsoon season in India in the last millennium (850–2005) andthe projected future climate (2021–2100).
RESULTSConsecutive megadroughts in India, 1200–2018We used the PDSI for June–August (JJA) period from MADA35,36
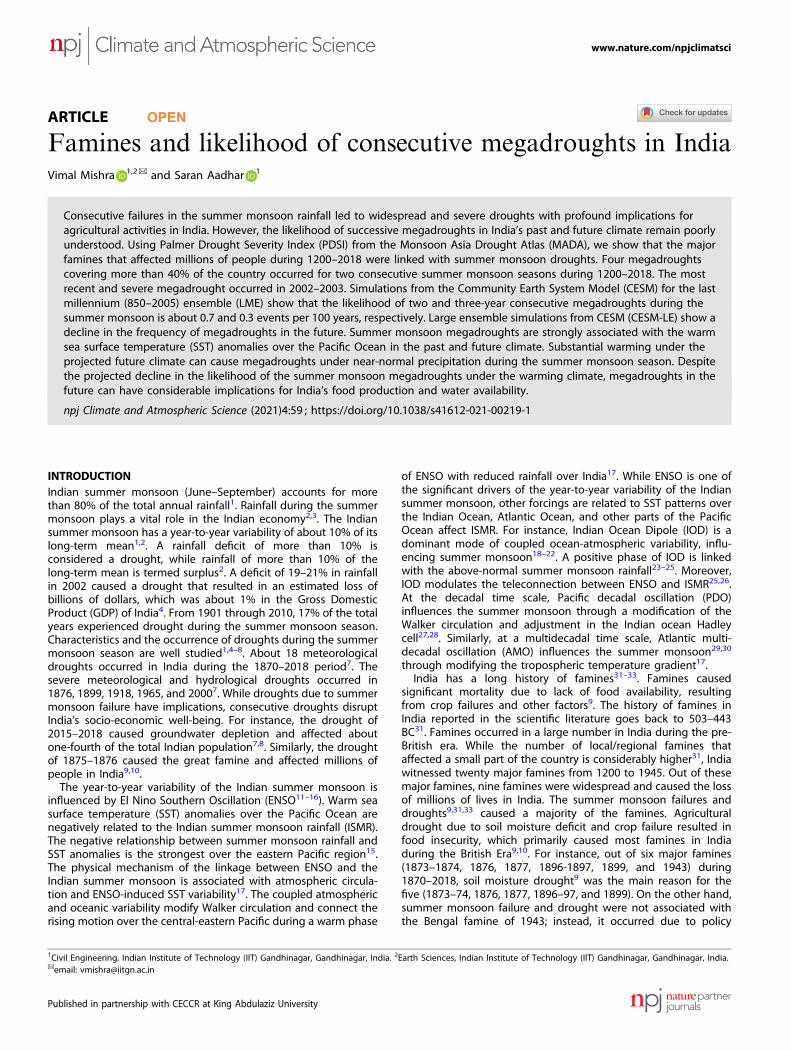
(MADA-PDSI hereafter), which is available at 1° spatial resolutionfor the monsoon Asia domain (see Methods for more details).MADA-PDSI, available for 1200–2012, was extended till 2018 usinggridded observations from Climate Research Units (CRU). SinceMADA-PDSI for 1990–2012 is based on the CRU datasets, we usedCRU observations to construct PDSI for the 2013–2018 period. Weidentified consecutive megadroughts during two or three summermonsoon seasons using the long-term (1200–2018) record of PDSI.As consecutive summer monsoon failures have considerableimplications for water availability and agriculture10,41, mega-droughts were identified if these affected more than 40% of thecountry, and all-India averaged PDSI was less than −1.5 for 2/3consecutive years. We selected only widespread droughts toreduce uncertainty in MADA-PDSI35,42,43, which might be asso-ciated with localized droughts. We identified six megadroughtsthat occurred consecutively for 2 or 3 years during the entirerecord of 1200–2018 (Supplementary Table 1). Four mega-droughts that lasted for 2 consecutive years (JJA) were1256–1257, 1423–1424, 1702–1703, and 2002–2003 (Supplemen-tary Table 1). On the other hand, only two (1431–1433 and1721–1723) megadroughts remained consecutively for 3 years.The mean area for five out of six megadroughts was more than50%, while the maximum area affected by megadrought rangedfrom 48 to 72% of the country (Supplementary Table 1). Weranked these megadroughts based on the overall severity scorethat combines intensity, duration, and area under drought7. Basedon the overall severity score, 1721–1723 was the most severedrought during the monsoon season in India. The peak intensityof the megadroughts occurred in 1721, 1431, 2002, 1257, 1424,and 1703 with the affected area of 72%, 52.5%, 65%, 51.5%, 52%,and 48% of the country, respectively (Fig. 1). 2002–2003 was theonly megadrought that occurred during the recent decades,which affected more than 65% of the country (Fig. 1). The 2002drought was primarily caused by a rainfall deficit (~51%) in themonth of July44,45.
Fig. 1 Occurrence of megadroughts during the monsoon (June–August) in India, 1200–2018. a Area (%) under drought estimated usingPalmer Drought Severity Index (PDSI) less than −1, b summer monsoon PDSI during 1200–2018, c–h years that experienced peak droughtduring the six megadroughts during 1200–2018. Values in parenthesis in (c–h) show the area (%) under drought for the peak intensity for themegadroughts. Vertical pink lines in (a, b) indicate the occurrence of megadroughts. The six megadroughts occurred in 1256–1257,1423–1424, 1431–1433, 1702–1703, 1721–1723, and 2002–2003.
V. Mishra and S. Aadhar
2
npj Climate and Atmospheric Science (2021) 59 Published in partnership with CECCR at King Abdulaziz University
1234567890():,;
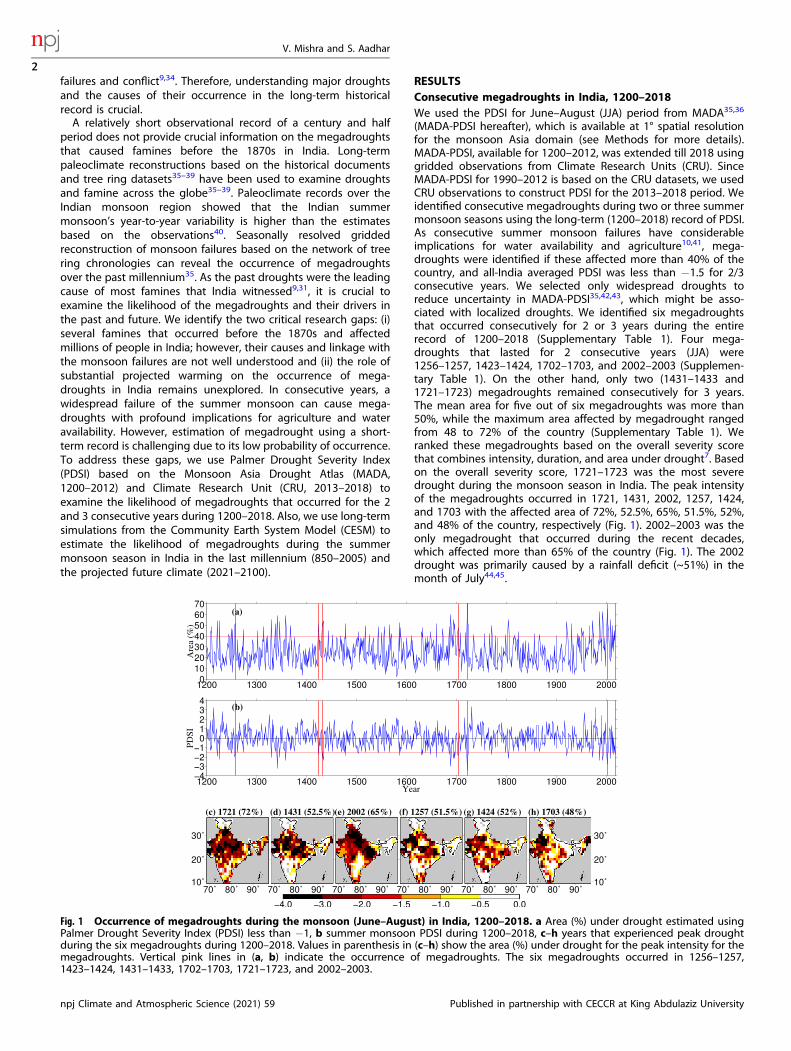
Reconstruction of famines caused by droughtsThe spatiotemporal information from the MADA on the summermonsoon failures provides a long-term context of droughts thatoccurred during the past over Monsoon Asia46. Famines in Indiawere instigated by droughts and caused the death of millions ofpeople9. Instrumental meteorological record in India does not gobeyond 18709,10, which hampers our understanding of theunderlined causes of the famines before 1870. Nine major faminescaused by droughts were identified from the database developedby Walford (1878)31 and other sources47 [Supplementary Table 2,Fig. 2]. These nine major famines occurred during 1344–1345,1630–1632, 1702–1704, 1769–1771, 1802–1804, 1837–1838, 1866,1877, and 1899–190031,47 [Supplementary Table 1]. The lastfamine of 1899–1900 was identified based on the ImperialGazetteer of India (1907)48. As droughts and the summermonsoon failures9 caused most famines in the post-1870 period,we used MADA-PDSI to identify the droughts and affected regionsduring each famine (Fig. 2).India experienced a famine that was extended to the entire
country during 1344–134531,49. The famine of 1344–1345 severelyaffected the Deccan part of India31. The famine was so acute thatthe Mughal emperor could not procure necessary items for hishousehold31,49. MADA-PDSI captured the 1345 drought, whichaffected about 43% of the country (Supplementary Table 2, Fig. 2).The subsequent major famine occurred in 1631. Walford (1878)31
reported that a famine was caused by drought and war in 1631.Moreover, the great drought that occurred in 1631 affected a largepart of India and Asia31. The 1630–1632 famine is also knownas the Deccan famine, which affected Deccan Plateau, Khandesh,and Gujarat50. The famine resulted from staple crops’ failurefor 3 consecutive years and led to intense hunger, diseases,
and migration. 1630–1632 was one of India’s worst famines duringthe Mughal Empire51,52. We find that MADA-PDSI captured thedrought during 1630–1632 peaked in 1632 (Fig. 2). The 1630–1632drought affected about half of the country and was centered inIndia’s central and northwestern parts (Fig. 2). The other majorfamine in India occurred during 1702–170431. The famine affectedwestern India’s parts and was mainly centered in Thar and Parkar(now in Pakistan) districts31. The famine was caused by droughtkilled more than two million people51. We find that 1702–1703 isalso captured using MADA-PDSI as the megadrought of the 2consecutive years (Fig. 2, Supplementary Table 1). The droughtpattern exhibited by MADA-PDSI shows that the 1703 droughtwas more intense in western India31 than in other regions [Fig. 2].India experienced another great famine during 1769–177331,53,
also known as the Great Bengal Famine of 1770. The total reporteddeaths due to the famine ranged between 2 and 10 million53, withan approximate reduction of 7–33% in the total population ofBengal54. Based on the MADA-PDSI, we find that the 1769–1771drought severely affected northern India and the Gangetic Plain,which peaked in 1771, affecting about half of the country(Supplementary Table 2; Fig. 2). The subsequent major famine inIndia occurred during 1802–180431. The drought of 1802–1804peaked in 1804 and affected about 55% of the country, which waswell captured by MADA-PDSI (Fig. 2, Supplementary Table 2). Indiawitnessed another notable famine in 1837–1838, which affectednorthwest provinces31. The 1837-38 famine is also known as theAgra famine of 1837–1838, which involved a large part of UttarPradesh. We find that the MADA-PDSI captured the droughtduring 1837, which affected about 35% of the country (Fig. 2).India witnessed a major famine in 1866, which is also known asthe Orissa famine of 1866. The famine affected Bengal, Orissa, and
010203040506070
Are
a (%
)1200 1300 1400 1500 1600 1700 1800 1900 2000
(a)
1345
1632
1703
1771
1804
1837
1866
1900
−4−3−2−1
01234
PDSI
1200 1300 1400 1500 1600 1700 1800 1900 2000Year
(b)
70˚ 80˚ 90˚10˚
20˚
30˚
(c) 1345 (43%)
70˚ 80˚ 90˚
(d) 1632 (48%)
70˚ 80˚ 90˚
(e) 1703 (48%)
70˚ 80˚ 90˚
(f) 1771 (49%)
70˚ 80˚ 90˚
(g) 1804 (55%)
70˚ 80˚ 90˚10˚
20˚
30˚
(h) 1837 (35%)
70˚ 80˚ 90˚10˚
20˚
30˚
(i) 1866 (41%)
70˚ 80˚ 90˚
(j) 1877 (28%)
70˚ 80˚ 90˚
−4.0 −3.0 −2.0 −1.5 −1.0 −0.5 0.0
(k) 1900 (40%)
Fig. 2 Major famines caused by drought in India during 1200–2018. a Area (%) under drought estimated using Palmer Drought SeverityIndex (PDSI) less than −1, b summer monsoon PDSI during 1200–2018, c–h years that experienced peak drought during the nine majorfamines that occurred in the 1200–2018 period. Values in parenthesis in (c–h) show the area (%) under drought for the peak intensity. Verticalpink lines in (a, b) indicate the occurrence of the nine major famines caused by the summer monsoon failures during 1200–2018.
V. Mishra and S. Aadhar
3
Published in partnership with CECCR at King Abdulaziz University npj Climate and Atmospheric Science (2021) 59
Bihar’s lower provinces, which caused the death of one and halfmillion people31. The famine was caused by the failure of thesummer monsoon rainfall during the late season48. The faminehad an unprecedented influence on the demography as aboutone-third of the total population of Orissa died55. MADA-PDSIcaptured the drought reasonably well (Fig. 2, SupplementaryTable 2).Madras’s Presidency witnessed one of the most extended
famines in 1877 that caused the death of more than 10 millionpeople. MADA-PDSI captured the drought in Bombay (now inMaharashtra), but the drought intensity is weaker in south Indiathan reported in the previous studies9,10. As MADA-PDSI coversonly JJA period, it does not account for the summer monsoonvariability during the late monsoon season (September). Also,MADA-PDSI does not account for the rainfall variability during thenortheast monsoon (October–December), affecting southernIndia56. The last famine of the 19th century occurred in1899–1900, which affected central and western parts of India.The famine caused deaths of about 1–4.5 million people andaffected central India, Hyderabad, and Rajputana agency47. MADA-PDSI captured drought in some famine-affected regions (Fig. 2),which covered about 40% of the country in 1900 (SupplementaryTable 2, Fig. 2). Overall, the famines caused by the summermonsoon droughts in the previously reported studies are capturedby MADA-PDSI, which provides us with a basis to examine theoccurrence and likelihood of the consecutive megadroughtsin India.
The leading mode of variability of droughtsNext, we compared MADA-PDSI based on paleoclimate recordsagainst the PDSI estimated using gridded observations from CRUfor a common period of 1901–1989 (Supplementary Fig. 1). PDSIfrom MADA v2 for the 1200–1989 period is based on thepaleoclimate reconstruction35,36 while the estimates after 1989 arebased on the CRU observations57. The reconstructed PDSI fromthe paleoclimate records compares well (correlation= 0.63, p-value < 0.05) with the CRU-based PDSI (Supplementary Fig. 1). Allthe major droughts during the 1901–1989 period were wellcaptured by the paleoclimate-based reconstructed PDSI (Supple-mentary Fig. 1b). Comparison of PDSI based on paleoclimaterecord and CRU data further demonstrates that reconstruction
based on a network of tree-ring chronologies provides valuableinformation on droughts during the summer monsoon overIndia35. Identifying droughts that caused famines providesconfidence to use the MADA-PDSI to examine the megadroughts’variability and occurrence in India.We used empirical orthogonal function (EOF) analysis to
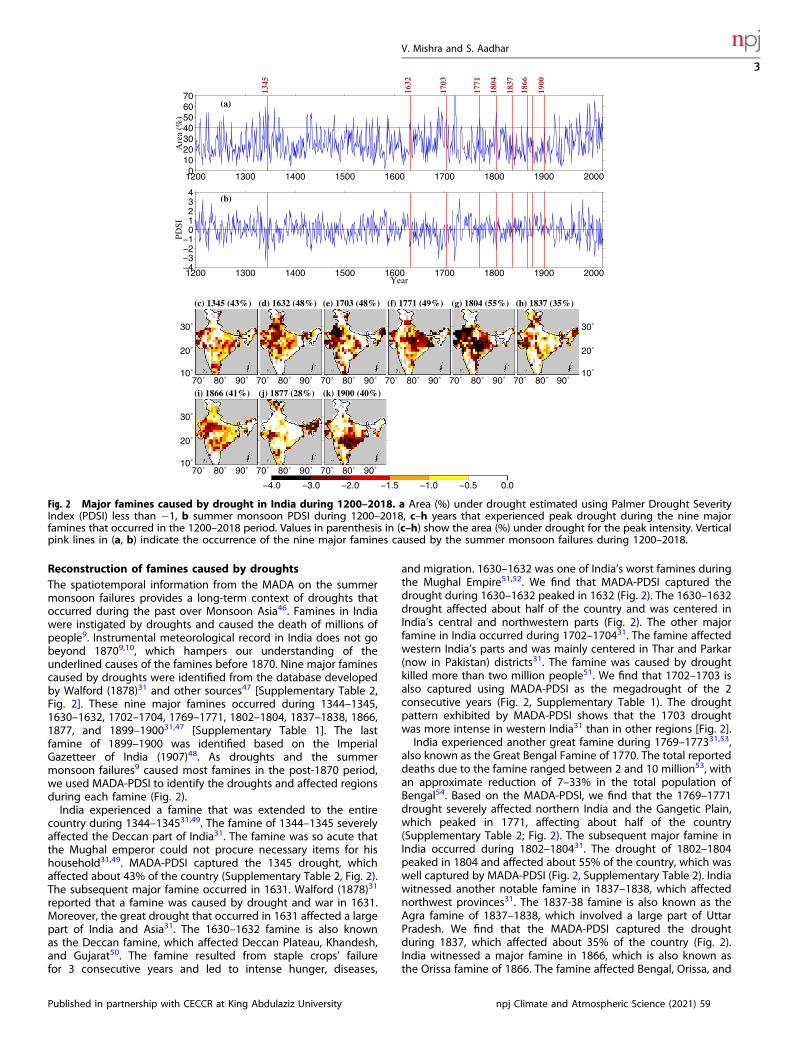
examine the dominant mode of variability in MADA-PDSI for theentire record of 1200–2018 (Fig. 3). The principal component ofthe leading mode (PC-1) of MADA-PDSI is well correlated (r= 0.78,p-value < 0.05) with PDSI. Also, all the six megadroughts were wellcaptured by the PC-1 (Fig. 3a). The leading mode of variability inMADA-PDSI explains about 22.7% of the total variance (Fig. 3b).The spatial pattern of EOF-1 of MADA-PDSI shows positiveloadings in most of India except for the southern peninsula,northeastern regions, and Jammu and Kashmir (Fig. 3b). Since thenegative values of PC-1 co-occur with the megadroughts (PDSI),leading EOF mode (EOF-1) of MADA-PDSI indicates that most ofthe megadroughts were centered in the central and northernparts of the country (Fig. 3b). We constructed the composite ofMADA-PDSI for the six megadroughts (Supplementary Table 1),which exhibits a similar spatial pattern obtained from EOF-1 (Fig.3c). We also identified all the droughts during the summermonsoon (JJA) with PDSI less than −1.5 and covered 40% or moreof the country during 1200–2018. A total of fifty such droughtsoccurred in the record of 819 years (1200–2018). MADA-PDSIcomposite of all the 50 droughts displayed a somewhat identicalspatial pattern that was reflected in EOF-1 and the 6 mega-droughts. Therefore, the leading mode of drought variabilityobtained from the MADA PDSI shows that drought-affectednorthern and central India more than the other parts of thecountry (Fig. 3).We used maximum covariance analysis (MCA58,59) to obtain the
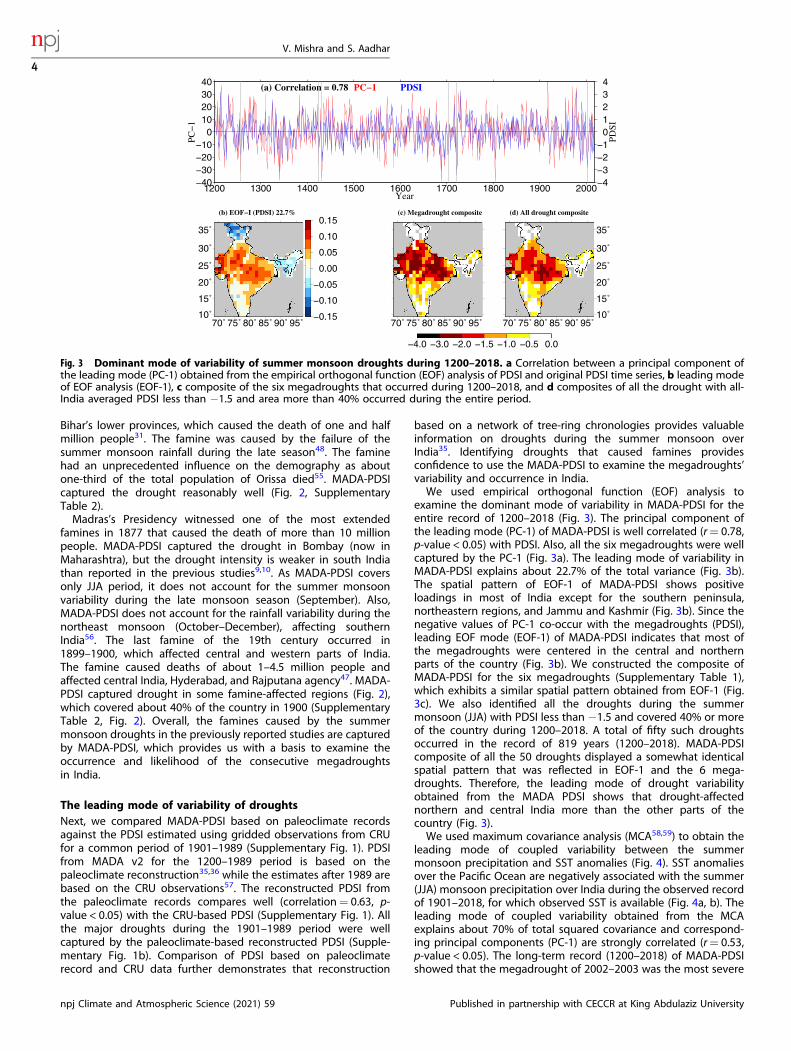
leading mode of coupled variability between the summermonsoon precipitation and SST anomalies (Fig. 4). SST anomaliesover the Pacific Ocean are negatively associated with the summer(JJA) monsoon precipitation over India during the observed recordof 1901–2018, for which observed SST is available (Fig. 4a, b). Theleading mode of coupled variability obtained from the MCAexplains about 70% of total squared covariance and correspond-ing principal components (PC-1) are strongly correlated (r= 0.53,p-value < 0.05). The long-term record (1200–2018) of MADA-PDSIshowed that the megadrought of 2002–2003 was the most severe
−40−30−20−10
010203040
PC−
11200 1300 1400 1500 1600 1700 1800 1900 2000
Year
−4−3−2−1
01234
PDSI
(a) Correlation = 0.78 PC−1 PDSI
70˚ 75˚ 80˚ 85˚ 90˚ 95˚10˚
15˚
20˚
25˚
30˚
35˚
−0.15
−0.10
−0.05
0.00
0.05
0.10
0.15(b) EOF−I (PDSI) 22.7%
70˚ 75˚ 80˚ 85˚ 90˚ 95˚
−4.0 −3.0 −2.0 −1.5 −1.0 −0.5 0.0
(c) Megadrought composite
70˚ 75˚ 80˚ 85˚ 90˚ 95˚10˚
15˚
20˚
25˚
30˚
35˚
(d) All drought composite
Fig. 3 Dominant mode of variability of summer monsoon droughts during 1200–2018. a Correlation between a principal component ofthe leading mode (PC-1) obtained from the empirical orthogonal function (EOF) analysis of PDSI and original PDSI time series, b leading modeof EOF analysis (EOF-1), c composite of the six megadroughts that occurred during 1200–2018, and d composites of all the drought with all-India averaged PDSI less than −1.5 and area more than 40% occurred during the entire period.
V. Mishra and S. Aadhar
4
npj Climate and Atmospheric Science (2021) 59 Published in partnership with CECCR at King Abdulaziz University
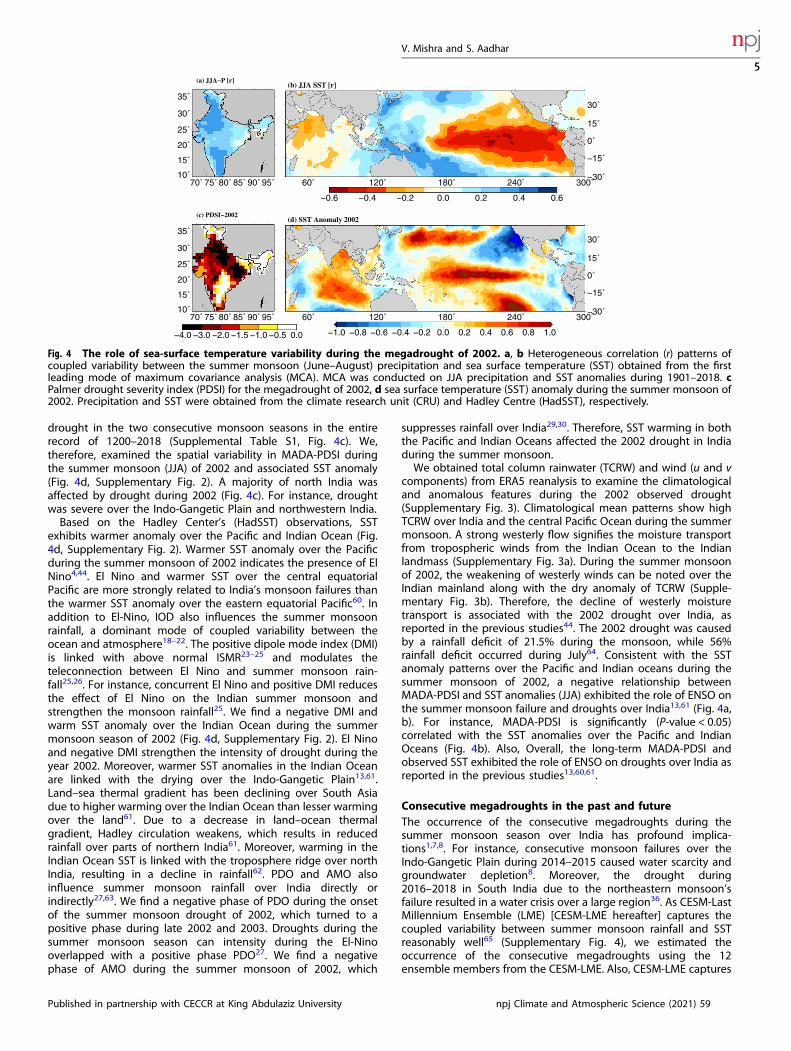
drought in the two consecutive monsoon seasons in the entirerecord of 1200–2018 (Supplemental Table S1, Fig. 4c). We,therefore, examined the spatial variability in MADA-PDSI duringthe summer monsoon (JJA) of 2002 and associated SST anomaly(Fig. 4d, Supplementary Fig. 2). A majority of north India wasaffected by drought during 2002 (Fig. 4c). For instance, droughtwas severe over the Indo-Gangetic Plain and northwestern India.Based on the Hadley Center’s (HadSST) observations, SST
exhibits warmer anomaly over the Pacific and Indian Ocean (Fig.4d, Supplementary Fig. 2). Warmer SST anomaly over the Pacificduring the summer monsoon of 2002 indicates the presence of ElNino4,44. El Nino and warmer SST over the central equatorialPacific are more strongly related to India’s monsoon failures thanthe warmer SST anomaly over the eastern equatorial Pacific60. Inaddition to El-Nino, IOD also influences the summer monsoonrainfall, a dominant mode of coupled variability between theocean and atmosphere18–22. The positive dipole mode index (DMI)is linked with above normal ISMR23–25 and modulates theteleconnection between El Nino and summer monsoon rain-fall25,26. For instance, concurrent El Nino and positive DMI reducesthe effect of El Nino on the Indian summer monsoon andstrengthen the monsoon rainfall25. We find a negative DMI andwarm SST anomaly over the Indian Ocean during the summermonsoon season of 2002 (Fig. 4d, Supplementary Fig. 2). El Ninoand negative DMI strengthen the intensity of drought during theyear 2002. Moreover, warmer SST anomalies in the Indian Oceanare linked with the drying over the Indo-Gangetic Plain13,61.Land–sea thermal gradient has been declining over South Asiadue to higher warming over the Indian Ocean than lesser warmingover the land61. Due to a decrease in land–ocean thermalgradient, Hadley circulation weakens, which results in reducedrainfall over parts of northern India61. Moreover, warming in theIndian Ocean SST is linked with the troposphere ridge over northIndia, resulting in a decline in rainfall62. PDO and AMO alsoinfluence summer monsoon rainfall over India directly orindirectly27,63. We find a negative phase of PDO during the onsetof the summer monsoon drought of 2002, which turned to apositive phase during late 2002 and 2003. Droughts during thesummer monsoon season can intensity during the El-Ninooverlapped with a positive phase PDO27. We find a negativephase of AMO during the summer monsoon of 2002, which
suppresses rainfall over India29,30. Therefore, SST warming in boththe Pacific and Indian Oceans affected the 2002 drought in Indiaduring the summer monsoon.We obtained total column rainwater (TCRW) and wind (u and v
components) from ERA5 reanalysis to examine the climatologicaland anomalous features during the 2002 observed drought(Supplementary Fig. 3). Climatological mean patterns show highTCRW over India and the central Pacific Ocean during the summermonsoon. A strong westerly flow signifies the moisture transportfrom tropospheric winds from the Indian Ocean to the Indianlandmass (Supplementary Fig. 3a). During the summer monsoonof 2002, the weakening of westerly winds can be noted over theIndian mainland along with the dry anomaly of TCRW (Supple-mentary Fig. 3b). Therefore, the decline of westerly moisturetransport is associated with the 2002 drought over India, asreported in the previous studies44. The 2002 drought was causedby a rainfall deficit of 21.5% during the monsoon, while 56%rainfall deficit occurred during July64. Consistent with the SSTanomaly patterns over the Pacific and Indian oceans during thesummer monsoon of 2002, a negative relationship betweenMADA-PDSI and SST anomalies (JJA) exhibited the role of ENSO onthe summer monsoon failure and droughts over India13,61 (Fig. 4a,b). For instance, MADA-PDSI is significantly (P-value < 0.05)correlated with the SST anomalies over the Pacific and IndianOceans (Fig. 4b). Also, Overall, the long-term MADA-PDSI andobserved SST exhibited the role of ENSO on droughts over India asreported in the previous studies13,60,61.
Consecutive megadroughts in the past and futureThe occurrence of the consecutive megadroughts during thesummer monsoon season over India has profound implica-tions1,7,8. For instance, consecutive monsoon failures over theIndo-Gangetic Plain during 2014–2015 caused water scarcity andgroundwater depletion8. Moreover, the drought during2016–2018 in South India due to the northeastern monsoon’sfailure resulted in a water crisis over a large region36. As CESM-LastMillennium Ensemble (LME) [CESM-LME hereafter] captures thecoupled variability between summer monsoon rainfall and SSTreasonably well65 (Supplementary Fig. 4), we estimated theoccurrence of the consecutive megadroughts using the 12ensemble members from the CESM-LME. Also, CESM-LME captures
70˚ 75˚ 80˚ 85˚ 90˚ 95˚10˚
15˚
20˚
25˚
30˚
35˚
(a) JJA−P [r]
60˚ 120˚ 180˚ 240˚ 300˚−30˚
−15˚
0˚
15˚
30˚
−0.6 −0.4 −0.2 0.0 0.2 0.4 0.6
(b) JJA SST [r]
70˚ 75˚ 80˚ 85˚ 90˚ 95˚10˚
15˚
20˚
25˚
30˚
35˚
−4.0 −3.0 −2.0 −1.5 −1.0 −0.5 0.0
(c) PDSI−2002
60˚ 120˚ 180˚ 240˚ 300˚−30˚
−15˚
0˚
15˚
30˚
−1.0 −0.8 −0.6 −0.4 −0.2 0.0 0.2 0.4 0.6 0.8 1.0
(d) SST Anomaly 2002
Fig. 4 The role of sea-surface temperature variability during the megadrought of 2002. a, b Heterogeneous correlation (r) patterns ofcoupled variability between the summer monsoon (June–August) precipitation and sea surface temperature (SST) obtained from the firstleading mode of maximum covariance analysis (MCA). MCA was conducted on JJA precipitation and SST anomalies during 1901–2018. cPalmer drought severity index (PDSI) for the megadrought of 2002, d sea surface temperature (SST) anomaly during the summer monsoon of2002. Precipitation and SST were obtained from the climate research unit (CRU) and Hadley Centre (HadSST), respectively.
V. Mishra and S. Aadhar
5
Published in partnership with CECCR at King Abdulaziz University npj Climate and Atmospheric Science (2021) 59
the critical feature of the Indian summer monsoon and seasonalcycle of rainfall well (Supplementary Fig. 5).First, we estimated PDSI for each ensemble member of the
CESM-LME, drought characteristics were calculated. Out of thefour megadroughts that occurred consecutively for 2 years basedon the MADA-PDSI (Supplementary Table 1), the drought of2002–2003 had the highest overall severity score (274.6), while thedrought of 1702–1703 had the lowest overall severity score(160.6). We considered the overall severity score of the 1702–1703drought as a benchmark (with the lowest overall severity score) toestimate the likelihood (number of megadroughts/total number ofyears) CESM-LME during 850–2005. The likelihood was estimatedusing the number of megadroughts divided by the total numberof years. We first estimated the number of megadroughts in all theensemble members of CESM-LME (12*1156), divided by thenumber of years. The likelihood of such (~1702–1703) mega-droughts (affected area more than 40% and PDSI less than −1.5)during the summer monsoon (JJA) in two consecutive years is lessthan one (~0.73) event in 100 years. On the other hand, thelikelihood of the megadroughts like 2002–2003 is even lesser(~0.34 events in 100 years). Long-term PDSI from the CESM-LMEfor 1156 years (850–2005) from each ensemble member enablesus to estimate the likelihood of megadroughts with a lowprobability of occurrence.The composite MCA patterns of coupled variability between the
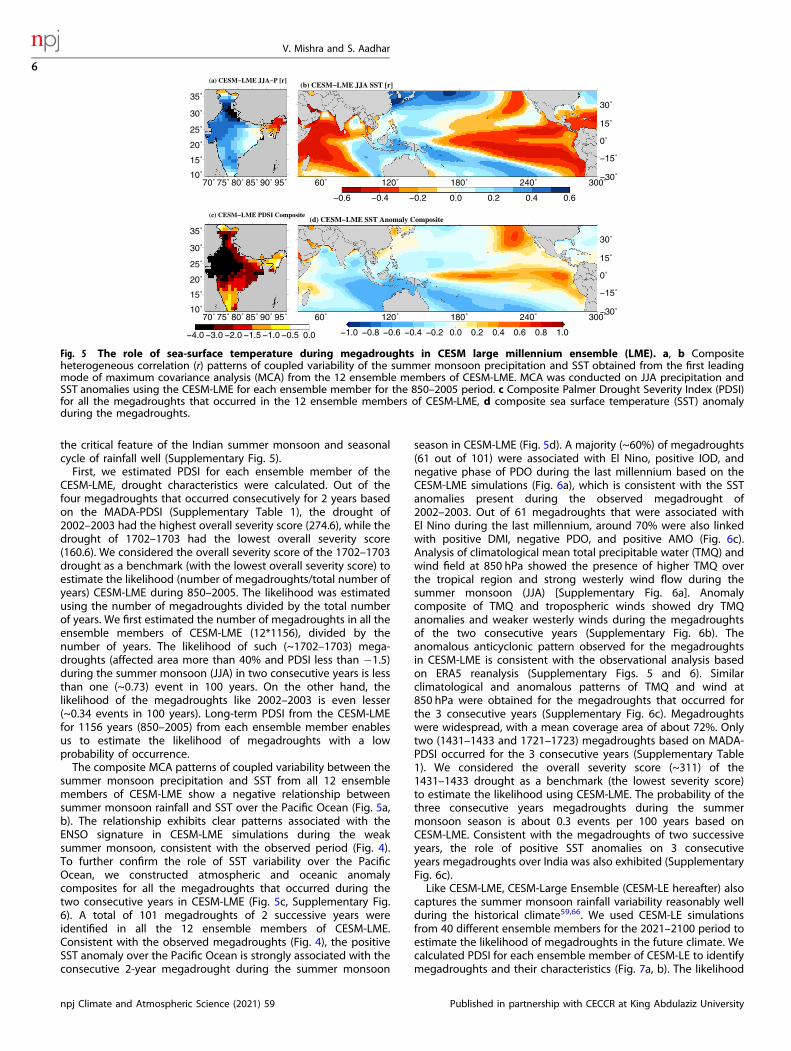
summer monsoon precipitation and SST from all 12 ensemblemembers of CESM-LME show a negative relationship betweensummer monsoon rainfall and SST over the Pacific Ocean (Fig. 5a,b). The relationship exhibits clear patterns associated with theENSO signature in CESM-LME simulations during the weaksummer monsoon, consistent with the observed period (Fig. 4).To further confirm the role of SST variability over the PacificOcean, we constructed atmospheric and oceanic anomalycomposites for all the megadroughts that occurred during thetwo consecutive years in CESM-LME (Fig. 5c, Supplementary Fig.6). A total of 101 megadroughts of 2 successive years wereidentified in all the 12 ensemble members of CESM-LME.Consistent with the observed megadroughts (Fig. 4), the positiveSST anomaly over the Pacific Ocean is strongly associated with theconsecutive 2-year megadrought during the summer monsoon
season in CESM-LME (Fig. 5d). A majority (~60%) of megadroughts(61 out of 101) were associated with El Nino, positive IOD, andnegative phase of PDO during the last millennium based on theCESM-LME simulations (Fig. 6a), which is consistent with the SSTanomalies present during the observed megadrought of2002–2003. Out of 61 megadroughts that were associated withEl Nino during the last millennium, around 70% were also linkedwith positive DMI, negative PDO, and positive AMO (Fig. 6c).Analysis of climatological mean total precipitable water (TMQ) andwind field at 850 hPa showed the presence of higher TMQ overthe tropical region and strong westerly wind flow during thesummer monsoon (JJA) [Supplementary Fig. 6a]. Anomalycomposite of TMQ and tropospheric winds showed dry TMQanomalies and weaker westerly winds during the megadroughtsof the two consecutive years (Supplementary Fig. 6b). Theanomalous anticyclonic pattern observed for the megadroughtsin CESM-LME is consistent with the observational analysis basedon ERA5 reanalysis (Supplementary Figs. 5 and 6). Similarclimatological and anomalous patterns of TMQ and wind at850 hPa were obtained for the megadroughts that occurred forthe 3 consecutive years (Supplementary Fig. 6c). Megadroughtswere widespread, with a mean coverage area of about 72%. Onlytwo (1431–1433 and 1721–1723) megadroughts based on MADA-PDSI occurred for the 3 consecutive years (Supplementary Table1). We considered the overall severity score (~311) of the1431–1433 drought as a benchmark (the lowest severity score)to estimate the likelihood using CESM-LME. The probability of thethree consecutive years megadroughts during the summermonsoon season is about 0.3 events per 100 years based onCESM-LME. Consistent with the megadroughts of two successiveyears, the role of positive SST anomalies on 3 consecutiveyears megadroughts over India was also exhibited (SupplementaryFig. 6c).Like CESM-LME, CESM-Large Ensemble (CESM-LE hereafter) also
captures the summer monsoon rainfall variability reasonably wellduring the historical climate59,66. We used CESM-LE simulationsfrom 40 different ensemble members for the 2021–2100 period toestimate the likelihood of megadroughts in the future climate. Wecalculated PDSI for each ensemble member of CESM-LE to identifymegadroughts and their characteristics (Fig. 7a, b). The likelihood
70˚ 75˚ 80˚ 85˚ 90˚ 95˚10˚
15˚
20˚
25˚
30˚
35˚
(a) CESM−LME JJA−P [r]
60˚ 120˚ 180˚ 240˚ 300˚−30˚
−15˚
0˚
15˚
30˚
−0.6 −0.4 −0.2 0.0 0.2 0.4 0.6
(b) CESM−LME JJA SST [r]
70˚ 75˚ 80˚ 85˚ 90˚ 95˚10˚
15˚
20˚
25˚
30˚
35˚
−4.0 −3.0 −2.0 −1.5 −1.0 −0.5 0.0
(c) CESM−LME PDSI Composite
60˚ 120˚ 180˚ 240˚ 300˚−30˚
−15˚
0˚
15˚
30˚
−1.0 −0.8 −0.6 −0.4 −0.2 0.0 0.2 0.4 0.6 0.8 1.0
(d) CESM−LME SST Anomaly Composite
Fig. 5 The role of sea-surface temperature during megadroughts in CESM large millennium ensemble (LME). a, b Compositeheterogeneous correlation (r) patterns of coupled variability of the summer monsoon precipitation and SST obtained from the first leadingmode of maximum covariance analysis (MCA) from the 12 ensemble members of CESM-LME. MCA was conducted on JJA precipitation andSST anomalies using the CESM-LME for each ensemble member for the 850–2005 period. c Composite Palmer Drought Severity Index (PDSI)for all the megadroughts that occurred in the 12 ensemble members of CESM-LME, d composite sea surface temperature (SST) anomalyduring the megadroughts.
V. Mishra and S. Aadhar
6
npj Climate and Atmospheric Science (2021) 59 Published in partnership with CECCR at King Abdulaziz University
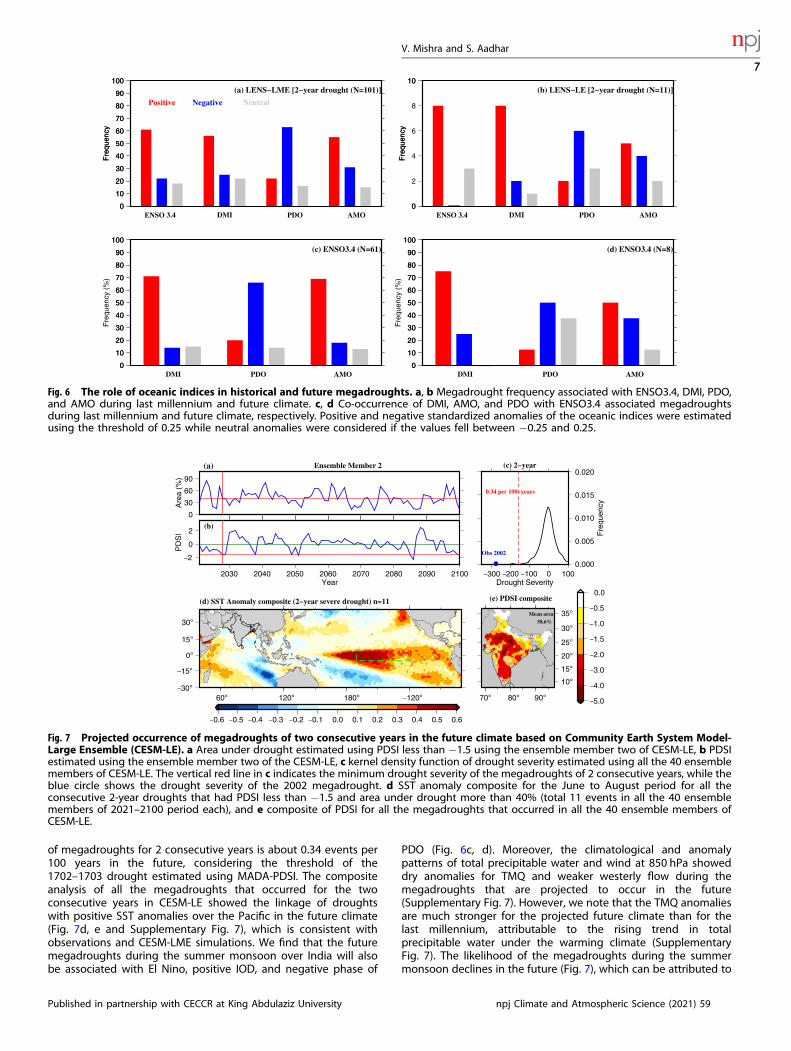
of megadroughts for 2 consecutive years is about 0.34 events per100 years in the future, considering the threshold of the1702–1703 drought estimated using MADA-PDSI. The compositeanalysis of all the megadroughts that occurred for the twoconsecutive years in CESM-LE showed the linkage of droughtswith positive SST anomalies over the Pacific in the future climate(Fig. 7d, e and Supplementary Fig. 7), which is consistent withobservations and CESM-LME simulations. We find that the futuremegadroughts during the summer monsoon over India will alsobe associated with El Nino, positive IOD, and negative phase of
PDO (Fig. 6c, d). Moreover, the climatological and anomalypatterns of total precipitable water and wind at 850 hPa showeddry anomalies for TMQ and weaker westerly flow during themegadroughts that are projected to occur in the future(Supplementary Fig. 7). However, we note that the TMQ anomaliesare much stronger for the projected future climate than for thelast millennium, attributable to the rising trend in totalprecipitable water under the warming climate (SupplementaryFig. 7). The likelihood of the megadroughts during the summermonsoon declines in the future (Fig. 7), which can be attributed to
0
30
60
90
Are
a (%
)
(a) Ensemble Member 2
–2
0
2
PD
SI
2030 2040 2050 2060 2070 2080 2090 2100Year
(b)
0.000
0.005
0.010
0.015
0.020
Fre
quen
cy
–300 –200 –100 0 100Drought Severity
(c) 2−year
0.34 per 100−years
Obs 2002
60° 120° 180° –120°–30°
–15°
0°
15°
30°
(d) SST Anomaly composite (2−year severe drought) n=11
–0.6 –0.5 –0.4 –0.3 –0.2 –0.1 0.0 0.1 0.2 0.3 0.4 0.5 0.6
70° 80° 90°
10°
15°
20°
25°
30°
35°
(e) PDSI composite
58.6%
Mean area
–5.0
–4.0
–3.0
–2.0
–1.5
–1.0
–0.5
0.0
Fig. 7 Projected occurrence of megadroughts of two consecutive years in the future climate based on Community Earth System Model-Large Ensemble (CESM-LE). a Area under drought estimated using PDSI less than −1.5 using the ensemble member two of CESM-LE, b PDSIestimated using the ensemble member two of the CESM-LE, c kernel density function of drought severity estimated using all the 40 ensemblemembers of CESM-LE. The vertical red line in c indicates the minimum drought severity of the megadroughts of 2 consecutive years, while theblue circle shows the drought severity of the 2002 megadrought. d SST anomaly composite for the June to August period for all theconsecutive 2-year droughts that had PDSI less than −1.5 and area under drought more than 40% (total 11 events in all the 40 ensemblemembers of 2021–2100 period each), and e composite of PDSI for all the megadroughts that occurred in all the 40 ensemble members ofCESM-LE.
0
10
20
30
40
50
60
70
80
90
100
Fre
quen
cy
0
10
20
30
40
50
60
70
80
90
100
Fre
quen
cy
ENSO 3.4 DMI PDO AMO
(a) LENS−LME [2−year drought (N=101)]
Positive Negative Neutral
0
2
4
6
8
10
Fre
quen
cy
0
10
Fre
quen
cy
ENSO 3.4 DMI PDO AMO
(b) LENS−LE [2−year drought (N=11)]
0
10
20
30
40
50
60
70
80
90
100
Fre
quen
cy (
%)
0
10
20
30
40
50
60
70
80
90
100
DMI PDO AMO
(c) ENSO3.4 (N=61)
0
10
20
30
40
50
60
70
80
90
100
Fre
quen
cy (
%)
0
10
20
30
40
50
60
70
80
90
100
DMI PDO AMO
(d) ENSO3.4 (N=8)
Fig. 6 The role of oceanic indices in historical and future megadroughts. a, b Megadrought frequency associated with ENSO3.4, DMI, PDO,and AMO during last millennium and future climate. c, d Co-occurrence of DMI, AMO, and PDO with ENSO3.4 associated megadroughtsduring last millennium and future climate, respectively. Positive and negative standardized anomalies of the oceanic indices were estimatedusing the threshold of 0.25 while neutral anomalies were considered if the values fell between −0.25 and 0.25.
V. Mishra and S. Aadhar
7
Published in partnership with CECCR at King Abdulaziz University npj Climate and Atmospheric Science (2021) 59
an increase in the summer monsoon precipitation under thewarming climate66. Moreover, MADA-PDSI is based on theJune–August period, which does not consider the summermonsoon’s variability during the late season. For instance, aconsiderable decline in India’s summer monsoon season pre-cipitation is reported during the late monsoon season in CESM-LE59, affecting the severity and frequency of droughts in India.
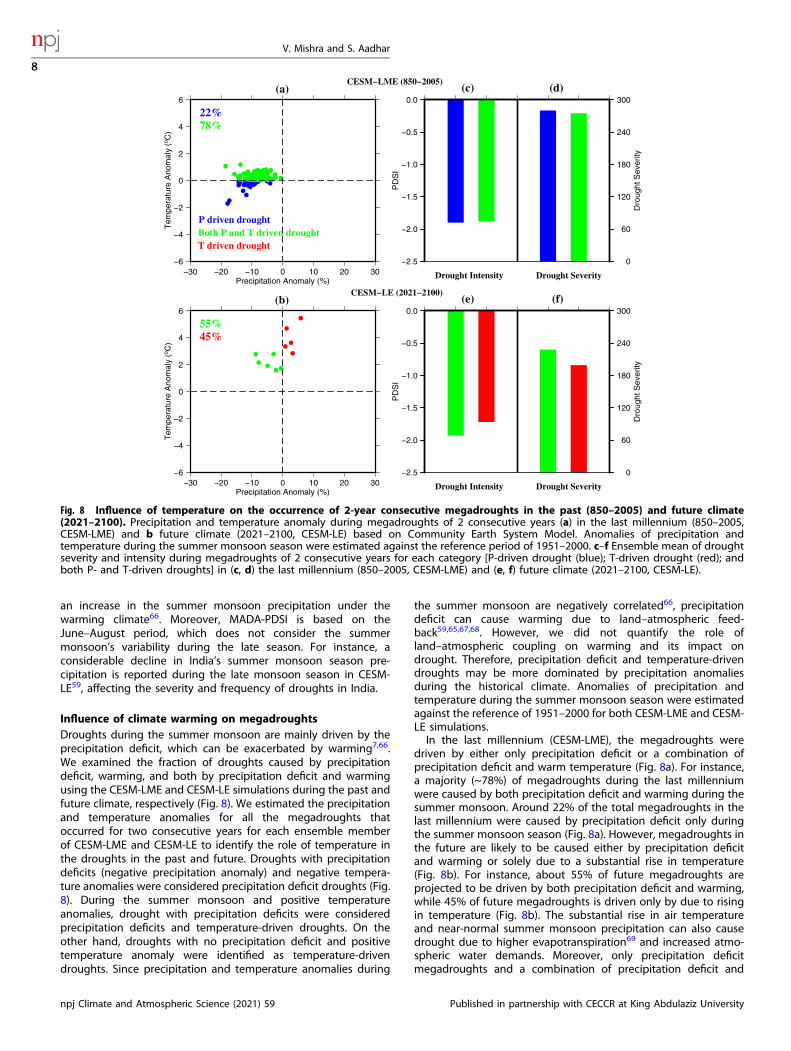
Influence of climate warming on megadroughtsDroughts during the summer monsoon are mainly driven by theprecipitation deficit, which can be exacerbated by warming7,66.We examined the fraction of droughts caused by precipitationdeficit, warming, and both by precipitation deficit and warmingusing the CESM-LME and CESM-LE simulations during the past andfuture climate, respectively (Fig. 8). We estimated the precipitationand temperature anomalies for all the megadroughts thatoccurred for two consecutive years for each ensemble memberof CESM-LME and CESM-LE to identify the role of temperature inthe droughts in the past and future. Droughts with precipitationdeficits (negative precipitation anomaly) and negative tempera-ture anomalies were considered precipitation deficit droughts (Fig.8). During the summer monsoon and positive temperatureanomalies, drought with precipitation deficits were consideredprecipitation deficits and temperature-driven droughts. On theother hand, droughts with no precipitation deficit and positivetemperature anomaly were identified as temperature-drivendroughts. Since precipitation and temperature anomalies during
the summer monsoon are negatively correlated66, precipitationdeficit can cause warming due to land–atmospheric feed-back59,65,67,68. However, we did not quantify the role ofland–atmospheric coupling on warming and its impact ondrought. Therefore, precipitation deficit and temperature-drivendroughts may be more dominated by precipitation anomaliesduring the historical climate. Anomalies of precipitation andtemperature during the summer monsoon season were estimatedagainst the reference of 1951–2000 for both CESM-LME and CESM-LE simulations.In the last millennium (CESM-LME), the megadroughts were
driven by either only precipitation deficit or a combination ofprecipitation deficit and warm temperature (Fig. 8a). For instance,a majority (~78%) of megadroughts during the last millenniumwere caused by both precipitation deficit and warming during thesummer monsoon. Around 22% of the total megadroughts in thelast millennium were caused by precipitation deficit only duringthe summer monsoon season (Fig. 8a). However, megadroughts inthe future are likely to be caused either by precipitation deficitand warming or solely due to a substantial rise in temperature(Fig. 8b). For instance, about 55% of future megadroughts areprojected to be driven by both precipitation deficit and warming,while 45% of future megadroughts is driven only by due to risingin temperature (Fig. 8b). The substantial rise in air temperatureand near-normal summer monsoon precipitation can also causedrought due to higher evapotranspiration69 and increased atmo-spheric water demands. Moreover, only precipitation deficitmegadroughts and a combination of precipitation deficit and
−6
−4
−2
0
2
4
6
Tem
pera
ture
Ano
mal
y (o C
)
−30 −20 −10 0 10 20 30Precipitation Anomaly (%)
CESM−LME (850−2005)(a)
22%78%
P driven droughtBoth P and T driven droughtT driven drought
−2.5
−2.0
−1.5
−1.0
−0.5
0.0
PD
SI
0
60
120
180
240
300
Dro
ught
Sev
erity
Drought Intensity
(c) (d)
Drought Severity
−6
−4
−2
0
2
4
6
Tem
pera
ture
Ano
mal
y (o C
)
−30 −20 −10 0 10 20 30Precipitation Anomaly (%)
CESM−LE (2021−2100)(b)
55%45%
−2.5
−2.0
−1.5
−1.0
−0.5
0.0
PD
SI
0
60
120
180
240
300
Dro
ught
Sev
erity
Drought Intensity
(e) (f)
Drought Severity
Fig. 8 Influence of temperature on the occurrence of 2-year consecutive megadroughts in the past (850–2005) and future climate(2021–2100). Precipitation and temperature anomaly during megadroughts of 2 consecutive years (a) in the last millennium (850–2005,CESM-LME) and b future climate (2021–2100, CESM-LE) based on Community Earth System Model. Anomalies of precipitation andtemperature during the summer monsoon season were estimated against the reference period of 1951–2000. c–f Ensemble mean of droughtseverity and intensity during megadroughts of 2 consecutive years for each category [P-driven drought (blue); T-driven drought (red); andboth P- and T-driven droughts] in (c, d) the last millennium (850–2005, CESM-LME) and (e, f) future climate (2021–2100, CESM-LE).
V. Mishra and S. Aadhar
8
npj Climate and Atmospheric Science (2021) 59 Published in partnership with CECCR at King Abdulaziz University
warm temperature megadroughts showed similar drought sever-ity and intensity during the last millennium (Fig. 8c, d). However,precipitation deficit and warm temperature-driven megadroughtsare projected to be more severe and intense than temperature-driven megadroughts under the projected future climate (Fig. 8e,f). Overall, we find that the likelihood of megadroughtsconsecutively for two years during the monsoon season isrelatively low in future climate, which can be influenced by thesignificant warming that is projected. Therefore, the occurrence ofmegadroughts cannot be neglected under the warming climate.
DISCUSSIONSummer monsoon rainfall is critical for the food and water securityof the large population in India. Understanding the drivers andlikelihood of megadroughts is essential for the future food andwater security of one of the world’s most populated regions.However, the short instrumental record of the Indian summermonsoon underestimates the magnitude of rainfall variability37.Recently gridded rainfall and temperature observations wereextended to 1870, which were used to reconstruct the soilmoisture droughts during the famines of the British Era9. We usedlong-term paleoclimate reconstructions for monsoon Asia, simula-tions from the CESM ensembles for the last millennium, andprojected future climate to examine drivers of the megadroughts.As MADA-PDSI is based on paleoclimate reconstructions, weconsidered the widespread and severe droughts in our analysis.We found that the reported famines due to monsoon failures werewell captured in MADA-PDSI.Failure of the summer monsoon for consecutive years has
detrimental implications for water availability, groundwaterrecharge, and food security. Recent droughts that occurred forthe two successive years (2014–2015) in north India and SouthIndia (2016–2018) had lasting implications8,56. We used a long-term PDSI based on MADA and CRU for the 1200–2018 period toidentify the megadroughts that occurred for the two and threeconsecutive years. The likelihood of megadroughts for 2 and3 successive years during the monsoon season is about 0.5 and0.25 events per 100 years based on MADA-PDSI for 1200–2018.However, the likelihood of megadroughts was slightly increased inthe longer-term record from the CESM-LME simulations. Forinstance, we find that the likelihood of 2- and 3-yearsmegadroughts are about 0.73 and 0.3 events per 100 years inCESM-LME. The likelihood of 2- and 3-year megadroughts isprojected to decline in the future climate, attributed to an increasein summer monsoon precipitation66,70.Summer monsoon failure and droughts played a vital role
during the six significant famines captured using the MADA-PDSI.While most droughts in the past were caused due to thecombination of precipitation deficit and warming, substantialwarming that is projected in the future can cause droughts withnear-normal precipitation during the summer monsoon. Given thedependence of a large population on agriculture and depletion ofgroundwater in several parts of the country71,72, the occurrence ofmegadroughts in the future can have large implications despite itslower likelihood. While the megadroughts in the past caused foodinsecurity and famines in India9, famines are unlikely in the futuredespite the occurrence of megadroughts. India has madetremendous progress in improving crop yields due to enhancedagricultural practices and irrigation. Moreover, there has been aconsiderable growth in transportation and public distributionsystems in the post-independence in India. For instance, despitethe several intense and widespread droughts after the indepen-dence in India, the country did not experience famines9. Theprojected warming can result in a decline in the crop yields73,74,which the hot and dry extremes66 can further worsen. However,the risk of famines in the future remains low due to flood storage,
irrigation, public distribution system, rural employment, andtransportation network75,76.Based on our findings, we conclude the following:
● Based on the long-term PDSI, six megadroughts wereidentified that occurred consecutively for 2 or 3 years during1200–2018. Out of these six, four megadroughts lasted for 2consecutive years and occurred during 1256–1257,1423–1424, 1702–1703, and 2002–2003. Only two(1431–1433 and 1721–1723) megadroughts lasted for 3consecutive years.
● We identified nine major famines caused by droughts during1344–1345, 1630–1632, 1702–1704, 1769–1771, 1802–1804,1837–1838, 1866, 1877, and 1899–1900.
● Based on CESM-LME simulations, the likelihood of 2 and3-year consecutive megadroughts during the summer mon-soon is about 0.7 and 0.3 events per 100 years, respectively. Amajority of the past and future megadroughts are linked withEl Nino. The frequency of megadroughts in the future isprojected to decline due to increased monsoon seasonprecipitation. However, substantial warming that is projectedcan influence the future megadroughts in India, which willhave implications for food and water security.
METHODSObserved data (1200–2018)We used the combined long-term Monsoon Asia Drought Atlas (MADA35)data for the past millennium (1200–2012) and recent Climate ResearchUnit (CRU) data for the period 2013–2018 to examine the occurrence of theconsecutive megadroughts during 1200–2018. The last millennium MADAdata was derived using the tree-ring chronologies of more than 300 sitesacross the forested areas of Monsoon Asia35 to reconstruct the PalmerDrought Severity Index (PDSI77) for the summer monsoon season (June-August). The reconstructed PDSI from MADA (hereafter MADA-PDSI) isavailable for 534 grid points of Monsoon Asia at 1° spatial resolution for1200–2012, which was developed using a correlation-weighted andensemble-based modification of point-by-point regression (PPR)method35,78. Using the PPR method, a well-calibrated and validateddataset of PDSI was reconstructed35. Previously, the PPR method was alsoused to produce a high-quality reconstruction of PDSI over North America[North American Drought Atlas78]. Similarly, the reconstructed PDSI dataover Monsoon Asia was calibrated and validated against the observedglobal PDSI data from Dai et al.79 for 1870–2002. The global PDSI of Daiet al.79 (Dai-PDSI) was developed using the precipitation and temperaturefrom the CRU. Therefore, we used the PDSI from the CRU (https://crudata.uea.ac.uk/cru/data/drought/) at 0.5° spatial resolution for 1901–201880,81,which was further regridded at 1° spatial resolution to validate the MADA-PDSI data. Using PDSI (MADA-PDSI from 1200–2012 and CRU-PDSI from2013–2018), we evaluated the summer monsoon drought severity andoccurrence over India for 1200–2018.We used observed precipitation and sea surface temperature (SST) for
the period 1901–2018. The monthly gridded precipitation was obtainedfrom CRU (version 4.0357) for 1901–2018 at 0.5° spatial resolution overIndia. CRU-precipitation is developed using many observed datasets usingthe angular-distance weighting interpolation at a monthly time scale57.Gridded products from the CRU have been widely used for regional andglobal drought and hydroclimatic extreme studies82,83.We obtained monthly SST from the Hadley Centre’s (HadSST, https://
www.metoffice.gov.uk/hadobs/hadisst/) from 1901 to 2018 to evaluate thelinkage between drought (PDSI and precipitation anomalies) and SST84.The HadSST data were reconstructed using the two-stage reduced-spaceoptimal interpolation of observation data at 1° spatial resolution84. Weestimated oceanic indices, including the ENSO, DMI, AMO, and PDO usingHadSST for the observed period. ENSO was estimated using the area-weighted average SST anomalies over the Niño 3.4 region (5°N‐5°S,120–170°W; Supplementary Fig. 8). Indian Summer Monsoon droughts arehighly correlated with the SST anomalies over the Nino-3.4 regioncompared to the other Nino regions7. DMI was calculated using thedifference between the area-averaged SST anomalies of western (10°S-10°N, 50°E-70°E; Supplementary Fig. 8) and eastern (10°S-0°N, 90°E-110°E)Indian Ocean regions85. Similarly, area-averaged SST anomaly in the North
V. Mishra and S. Aadhar
9
Published in partnership with CECCR at King Abdulaziz University npj Climate and Atmospheric Science (2021) 59
Atlantic region (0°N-60°N, 0–80°W; Supplementary Fig. 8) represents theAMO86,87 while PDO was estimated using the leading pattern of SSTanomalies over Northern Pacific Ocean (north of 20°N)27,88]. We used EOFanalysis to identify the leading principle component over the NorthernPacific Ocean (20°N-60°N, 120°E-100°W; Supplementary Fig. 8), which wasused for estimating PDO. Moreover, we obtained TCRW, and wind (u and vcomponents) at 850hPa from the European Centre for Medium-RangeWeather Forecasts Reanalysis version 5 (ERA-589) for the period 1979–2018to evaluate available moisture content and atmospheric condition duringobserved megadroughts.
Data from CESMCommunity Earth System Model realistically simulates the couplingbetween ISMR and SST variability over the Pacific Ocean66. Moreover,CESM-1 simulations reproduce seasonality and spatial variability insummer monsoon rainfall reasonably well46. Most global climate modelsshow bias in summer monsoon precipitation and do not capture theENSO-monsoon coupling well70,90. We, therefore, selected the CESM-1 forthe present work. Moreover, simulations from many ensemble membersare available for the past, present, and future periods, making CESMsuitable for the analysis to estimate the likelihood of megadroughts inIndia. We used simulations from the CESM-LME91 project (https://www.cesm.ucar.edu/projects/community-projects/LME/) to evaluate the like-lihood of the occurrence of the consecutive droughts over India during theperiod 850–2005. We used 12 runs (out of 13; the first run does not havethe data for the entire period of 850–2005) of CESM-LME for the 850–2005period to estimate monthly PDSI. Monthly precipitation, surface airtemperature (maximum and minimum), specific humidity, wind speed,latent heat flux, sensible heat flux, and surface pressure were used toestimate India’s PDSI. PDSI was calculated using precipitation, atmosphericwater demand (potential evapotranspiration: PET), and available watercontent (AWC) of soil92. Atmospheric water demand (PET) was estimatedusing the Penman-Monteith method93,94, while AWC was obtained fromthe Harmonized World Soil Database (HWSD95). We analyzed theconsecutive droughts and their characteristics over India in the lastmillennium using PDSI from the 12 ensemble members from CESM-LME.We used data from the 40 ensemble members from the Community
Earth System Model- Large Ensemble (CESM-LE96) project (http://www.cesm.ucar.edu/projects/community-projects/LENS/) for the period2021–2100 to examine the drought occurrence in the future climate. Weestimated the atmospheric water demand (PET) using the modifiedPenman-Monteith method97 for the future (2021–2100) using monthlysurface air temperature, wind speed, specific humidity, surface pressure,and latent and sensible heat flux. We used the modified Penman-Monteithmethod since the changes in surface resistance due to the increasedwarming climate were not considered in the Penman-Monteith method,affecting the drought severity in the future climate69. Using the PET,precipitation, and AWC, we estimated PDSI for 2021–2100 using the 40runs of CESM-LE to understand the future drought severity. The CESM-LEsimulations have been widely used to analyze drought and extremeclimate studies under the future climate66,69,98. We used monthly SST, totalprecipitable water (TMQ), and wind at 850hPa from CESM-LME and CESM-LE for 850–2005 and 2021–2100, respectively. As SST and TMQ from CESM-LE for the future period (2021–2100) has a strong warming trend, we usedEnsemble Empirical Mode Decomposition (EEMD99) to remove seculartrend100 from TMQ and SST for the period 2021–2100. Moreover, weexamined the year-to-year variability between the summer monsoon (JJA)precipitation and SST13. The MCA58 method was used to evaluate thecoupled variability between precipitation and SST. We identify the firstleading mode of variation between rainfall and temperature using theMCA, which shows the substantial coupled variability between two fields(precipitation and SST). Similar to observation, we estimated oceanicindices including ENSO (Nino 3.4), DMI, AMO, and PDO from CESM-LMEand CESM-LE simulations for the past and future climate. Moreover, TMQand wind at 850hPa were used to evaluate available moisture content andatmospheric condition during megadroughts in LENS-LME and LENS-LE.
DATA AVAILABILITYAll the datasets used in this study can be obtained from the corresponding author.
CODE AVAILABILITYData processing scripts can be obtained from the corresponding author.
Received: 5 May 2021; Accepted: 5 November 2021;
REFERENCES1. Kumar, K. N., Rajeevan, M., Pai, D. S., Srivastava, A. K. & Preethi, B. On the
observed variability of monsoon droughts over India. Weather Clim. Extrem. 1,42–50 (2013).
2. Gadgil, S. & Gadgil, S. The Indian monsoon, GDP and agriculture. Econ. Polit.Wkly. 41, 4887–4895 (2006).
3. Gadgil, S. & Kumar, K. R. The Asian monsoon—agriculture and economy. in TheAsian Monsoon 651–683 (Springer, Berlin, Heidelberg, 2006).
4. Gadgil, S., Vinayachandran, P. N. & Francis, P. A. Droughts of the Indian summermonsoon: role of clouds over the Indian Ocean. Curr. Sci. 85, 1713–1719 (2003).
5. Sikka, D. R. Monsoon Drought in India. (1999).6. Shah, D. & Mishra, V. Drought onset and termination in India. J. Geophys. Res.
Atmos. 125, e2020JD032871 (2020).7. Mishra, V. Long-term (1870–2018) drought reconstruction in context of surface
water security in India. J. Hydrol. 580, 124228 (2020).8. Mishra, V., Aadhar, S., Asoka, A., Pai, S. & Kumar, R. On the frequency of the 2015
monsoon season drought in the Indo-Gangetic Plain. Geophys. Res. Lett. 43,12,102–12,112 (2016).
9. Mishra, V. et al. Drought and Famine in India, 1870–2016. Geophys. Res. Lett. 46,2075–2083 (2019).
10. Singh, D. et al. Climate and the Global Famine of 1876–78. J. Clim. 31,9445–9467 (2018).
11. Kumar, K. K., Rajagopalan, B. & Cane, M. A. On the weakening relationshipbetween the indian monsoon and ENSO. Science 284, 2156–2159 (1999).
12. Ashok, K., Guan, Z., Saji, N. H. & Yamagata, T. Individual and combined influencesof ENSO and the Indian Ocean Dipole on the Indian summer monsoon. J. Clim.17, 3141–3155 (2004).
13. Mishra, V., Smoliak, B. V., Lettenmaier, D. P. & Wallace, J. M. A prominent patternof year-to-year variability in Indian Summer Monsoon Rainfall. Proc. Natl Acad.Sci. USA 109, 7213–7217 (2012).
14. Singh, D., Ghosh, S., Roxy, M. K. & McDermid, S. Indian summer monsoon:extreme events, historical changes, and role of anthropogenic forcings. WIREsClim. Chang. 10, e571 (2019).
15. Kirtman, B. P. & Shukla, J. Influence of the Indian summer monsoon on ENSO. Q.J. R. Meteorol. Soc. 126, 213–239 (2000).
16. Abid, M. A., Almazroui, M., Kucharski, F., O’Brien, E. & Yousef, A. E. ENSO rela-tionship to summer rainfall variability and its potential predictability over Ara-bian Peninsula region. npj Clim. Atmos. Sci. 1, 1–7 (2018).
17. Kucharski, F. & Abid, M. A. Interannual Variability of the Indian Monsoon and ItsLink to ENSO. Oxford Res. Encycl. Clim. Sci. https://doi.org/10.1093/ACREFORE/9780190228620.013.615 (2017).
18. Ashok, K., Guan, Z. & Yamagata, T. Influence of the Indian Ocean Dipole on theAustralian winter rainfall. Geophys. Res. Lett. 30, 1821 (2003).
19. Cai, W., Cowan, T. & Sullivan, A. Recent unprecedented skewness towardspositive Indian Ocean Dipole occurrences and its impact on Australian rainfall.Geophys. Res. Lett. 36 (2009).
20. Saji, N. H., Goswami, B. N., Vinayachandran, P. N. & Yamagata, T. A dipole modein the tropical Indian ocean. Nature 401, 360–363 (1999).
21. Saji, N. H. & Yamagata, T. Possible impacts of Indian Ocean Dipole mode eventson global climate. Clim. Res. 25, 151–169 (2003).
22. Webster, P. J., Moore, A. M., Loschnigg, J. P. & Leben, R. R. Coupled ocean-atmosphere dynamics in the Indian Ocean during 1997-98. Nature 401, 356–360(1999).
23. Ihara, C., Kushnir, Y., Cane, M. A. & De La Peña, V. H. Indian summer monsoonrainfall and its link with ENSO and Indian Ocean climate indices. Int. J. Climatol.27, 179–187 (2007).
24. Schott, F. A., Xie, S. P. & McCreary, J. P. Indian ocean circulation and climatevariability. Rev. Geophys. 47, RG1002 (2009).
25. Ummenhofer, C. C. et al. Multi-decadal modulation of the El Niño-Indian monsoonrelationship by Indian Ocean variability. Environ. Res. Lett. 6, 34006–34014 (2011).
26. Ashok, K., Guan, Z. & Yamagata, T. Impact of the Indian Ocean dipole on therelationship between the Indian monsoon rainfall and ENSO. Geophys. Res. Lett.28, 4499–4502 (2001).
27. Krishnamurthy, L. & Krishnamurthy, V. Influence of PDO on South Asian summermonsoon and monsoon-ENSO relation. Clim. Dyn. 42, 2397–2410 (2014).
28. Kucharski, F., Molteni, F. & Yoo, J. H. SST forcing of decadal Indian Monsoonrainfall variability. Geophys. Res. Lett. 33, 3709 (2006).
29. Goswami, B. N., Kripalani, R. H., Borgaonkar, H. P. & Preethi, B. Multi-decadalvariability in Indian summer monsoon rainfall using proxy data. World Sci. Ser.Asia Pac. Weather Clim. 6, 327–345 (2016).
V. Mishra and S. Aadhar
10
npj Climate and Atmospheric Science (2021) 59 Published in partnership with CECCR at King Abdulaziz University
30. Naidu, P. D. et al. Coherent response of the Indian Monsoon Rainfall to Atlanticmulti-decadal variability over the last 2000 years. Sci. Rep. 10, 1–11 (2020).
31. Walford, C. The famines of the world: past and present. J. Stat. Soc. Lond. 41, 433(1878).
32. Sen, A. Famines. World Dev. 8, 613–621 (1980).33. Bhalme, H. N. & Mooley, D. A. Large-scale droughts/ floods and monsoon cir-
culation. Mon. Weather Rev. 108, 1197–1211 (1980).34. Devereux, S. Famine in the twentieth century. IDS Work. Pap. 105 1, 40 (2000).35. Cook, E. R. et al. Asian monsoon failure and megadrought during the last mil-
lennium. Science 328, 486–489 (2010).36. Cook, E. R. et al. Old World megadroughts and pluvials during the Common Era.
Sci. Adv. 1, 37 (2015).37. Sinha, A. et al. A 900-year (600 to 1500 A.D.) record of the Indian summer
monsoon precipitation from the core monsoon zone of India. Geophys. Res. Lett.34, L16707 (2007).
38. Brázdil, R. et al. Central Europe, 1531–1540 CE: the driest summer decade of thepast five centuries? Climate 16, 2125–2151 (2020).
39. Lin, K.-H. E., Wang, P. K., Pai, P.-L., Lin, Y.-S. & Wang, C.-W. Historical droughts inthe Qing dynasty (1644–1911) of China. Climate 16, 911–931 (2020).
40. Sinha, A. et al. Trends and oscillations in the Indian summer monsoon rainfallover the last two millennia. Nat. Commun. 6, 6309 (2015).
41. Mishra, V., Aadhar, S., Asoka, A., Pai, S. & Kumar, R. On the frequency of the 2015monsoon season drought in the Indo-Gangetic Plain. Geophys. Res. Lett. 43,12,102–12,112 (2016).
42. Nguyen, H. T. T., Turner, S. W. D., Buckley, B. M. & Galelli, S. Coherent streamflowvariability in monsoon asia over the past eight centuries—links to oceanicdrivers. Water Resour. Res. 56, e2020WR027883 (2020).
43. Yang, B. et al. Drought variability at the northern fringe of the Asian summermonsoon region over the past millennia. Clim. Dyn. 43, 845–859 (2014).
44. Mujumdar, M., Kumar, V. & Krishnan, R. The Indian summer monsoon drought of2002 and its linkage with tropical convective activity over northwest Pacific.Clim. Dyn. 28, 743–758 (2007).
45. Bhat, G. S. The Indian drought of 2002—a sub-seasonal phenomenon? Q. J. R.Meteorol. Soc. 132, 2583–2602 (2006).
46. Ummenhofer, C. C., D’Arrigo, R. D., Anchukaitis, K. J., Buckley, B. M. & Cook, E. R.Links between Indo-Pacific climate variability and drought in the Monsoon AsiaDrought Atlas. Clim. Dyn. 40, 1319–1334 (2013).
47. Fieldhouse, P. Community shared agriculture. Agric. Hum. Values 13, 43–47(1996).
48. Butler, S. H. Famine. in The Imperial Gazetteer of India Vol. III (Clarendon Press,Oxford, 1908).
49. Wilson, I. R. G. Can we predict the next Indian mega-famine? Energy Environ. 20,11–24 (2009).
50. Gráda, C. Ó. Making famine history. J. Econ. Lit. 45, 5–38 (2007).51. Attwood, D. W. Big is ugly? How large-scale institutions prevent famines in
Western India. World Dev. 33, 2067–2083 (2005).52. Winters, R., Hume, J. P. & Leenstra, M. A famine in Surat in 1631 and Dodos on
Mauritius: a long lost manuscript rediscovered. Arch. Nat. Hist. 44, 134–150 (2017).53. Sen, A. Ingredients of famine analysis: availability and entitlements. Q. J. Econ.
96, 433 (1981).54. Jonsson, F. A. Enlightenment’s Frontier. (Yale University Press, London, 2013).55. Patel, D. Viewpoint: How British let one million Indians die in famine. BBC NEWS
(2016).56. Mishra, V., Thirumalai, K., Jain, S. & Aadhar, S. Unprecedented drought in South
India and recent water scarcity. Environ. Res. Lett. 16, 054007 (2021).57. Harris, I., Osborn, T. J., Jones, P. & Lister, D. Version 4 of the CRU TS monthly high-
resolution gridded multivariate climate dataset. Sci. Data 7, 1–18 (2020).58. Bretherton, C. S., Smith, C. & Wallace, J. M. An intercomparison of methods for
finding coupled patterns in climate data. J. Clim. 5, 541–560 (1992).59. Mishra, V., Aadhar, S. & Mahto, S. S. Anthropogenic warming and intraseasonal
summer monsoon variability amplify the risk of future flash droughts in India.npj Clim. Atmos. Sci. 4, 1–10 (2021).
60. Kumar, K. K., Rajagopalan, B., Hoerling, M., Bates, G. & Cane, M. Unraveling themystery of Indian monsoon failure during El Niño. Science 314, 115–119 (2006).
61. Roxy, M. K. et al. Drying of Indian subcontinent by rapid Indian Ocean warmingand a weakening land-sea thermal gradient. Nat. Commun. 6, 7423 (2015).
62. Yadav, R. K. & Roxy, M. K. On the relationship between north India summermonsoon rainfall and east equatorial Indian Ocean warming. Glob. Planet.Change 179, 23–32 (2019).
63. Krishnamurthy, L. & Krishnamurthy, V. Teleconnections of Indian monsoonrainfall with AMO and Atlantic tripole. Clim. Dyn. 46, 2269–2285 (2016).
64. Bhat, G. S. The Indian drought of 2002—a sub-seasonal phenomenon? Q. J. R.Meteorol. Soc. 132, 2583–2602 (2006).
65. Berg, A. et al. Land–atmosphere feedbacks amplify aridity increase over landunder global warming. Nat. Clim. Chang. 6, 869–874 (2016).
66. Mishra, V., Thirumalai, K., Singh, D. & Aadhar, S. Future exacerbation of hot anddry summer monsoon extremes in India. npj Clim. Atmos. Sci. 3, 10 (2020).
67. Zhou, S. et al. Land–atmosphere feedbacks exacerbate concurrent soil droughtand atmospheric aridity. Proc. Natl Acad. Sci. USA 116, 18848–18853 (2019).
68. Dirmeyer, P. A., Balsamo, G., Blyth, E. M., Morrison, R. & Cooper, H. M. Land-atmosphere interactions exacerbated the drought and heatwave over NorthernEurope during summer 2018. AGU Adv. 2, e2020AV000283 (2021).
69. Aadhar, S. & Mishra, V. Increased drought risk in South Asia under warmingclimate: implications of uncertainty in potential evapotranspiration estimates. J.Hydrometeorol. 21, 2979–2996 (2020).
70. Menon, A., Levermann, A., Schewe, J., Lehmann, J. & Frieler, K. Consistentincrease in Indian monsoon rainfall and its variability across CMIP-5 models.Earth Syst. Dyn. 4, 287–300 (2013).
71. Asoka, A., Gleeson, T., Wada, Y. & Mishra, V. Relative contribution of monsoonprecipitation and pumping to changes in groundwater storage in India. Nat.Geosci. 10, 109–117 (2017).
72. Asoka, A., Wada, Y., Fishman, R. & Mishra, V. Strong linkage between pre-cipitation intensity and monsoon season groundwater recharge in India. Geo-phys. Res. Lett. 45, 5536–5544 (2018).
73. Zhao, C. et al. Plausible rice yield losses under future climate warming. Nat.Plants 3, 1–5 (2016).
74. Tigchelaar, M., Battisti, D. S., Naylor, R. L. & Ray, D. K. Future warming increasesprobability of globally synchronized maize production shocks. Proc. Natl Acad.Sci. USA 115, 6644–6649 (2018).
75. Gráda, C. O. Famine is not the problem: a historical perspective. Hist. Res. 88,20–33 (2015).
76. Gráda, C. Ó. Famines past, famine’s future. Dev. Change 42, 49–69 (2011).77. Wells, N., Goddard, S. & Hayes, M. J. A self-calibrating Palmer drought severity
index. J. Clim. 17, 2335–2351 (2004).78. Cook, E. R., Seager, R., Cane, M. A. & Stahle, D. W. North American drought:
reconstructions, causes, and consequences. Earth 81, 93–134 (2007).79. Dai, A., Trenberth, K. E. & Qian, T. A global dataset of Palmer Drought Severity
Index for 1870-2002: relationship with soil moisture and effects of surfacewarming. J. Hydrometeorol. 5, 1117–1130 (2004).
80. Van Der Schrier, G., Barichivich, J., Briffa, K. R. & Jones, P. D. A scPDSI-basedglobal data set of dry and wet spells for 1901-2009. J. Geophys. Res. Atmos. 118,4025–4048 (2013).
81. Barichivich, J., Osborn, T., Harris, I., van der Schrier, G. & Jones, P. Droughtmonitoring global drought using the self-calibrating Palmer Drought SeverityIndex. Bull. Am. Meteorol. Soc. 100, S39–S40 (2019).
82. Asadi Zarch, M. A., Sivakumar, B. & Sharma, A. Droughts in a warming climate: aglobal assessment of Standardized precipitation index (SPI) and Reconnaissancedrought index (RDI). J. Hydrol. 526, 183–195 (2015).
83. Aadhar, S. & Mishra, V. A substantial rise in the area and population affected bydryness in South Asia under 1.5 °C, 2.0 °C and 2.5 °C warmer worlds. Environ. Res.Lett. 14, 114021 (2019).
84. Rayner, N. A. et al. Global analyses of sea surface temperature, sea ice, and nightmarine air temperature since the late nineteenth century. J. Geophys. Res. DAtmos. 108, 4407 (2003).
85. Singh, D. et al. Climate and the global famine of 1876-78. J. Clim. 31, 9445–9467(2018).
86. Zhang, R. & Delworth, T. L. Impact of Atlantic multidecadal oscillations on India/Sahel rainfall and Atlantic hurricanes. Geophys. Res. Lett. 33, L17712 (2006).
87. Enfield, D. B., Mestas-Nuñez, A. M. & Trimble, P. J. The Atlantic multidecadaloscillation and its relation to rainfall and river flows in the continental U.S.Geophys. Res. Lett. 28, 2077–2080 (2001).
88. Mantua, N. J., Hare, S. R., Zhang, Y., Wallace, J. M. & Francis, R. C. A pacificinterdecadal climate oscillation with impacts on salmon production. Bull. Am.Meteorol. Soc. 78, 1069–1079 (1997).
89. Hersbach, H. & Dee, D. ERA5 reanalysis is in production. ECMWF Newsl. 147, 5–6(2016).
90. Ashfaq, M., Rastogi, D., Mei, R., Touma, D. & Leung, L. R. Sources of errors in thesimulation of south Asian summer monsoon in the CMIP5 GCMs. Clim. Dyn. 49,193–223 (2017).
91. Otto-Bliesner, B. L. et al. Climate variability and change since 850 ce anensemble approach with the community earth system model. Bull. Am. Meteorol.Soc. 97, 787–801 (2016).
92. Palmer, W. C. Meteorological Drought. U.S. Weather Bureau, Research Paper No.45, 58 (1965).
93. Penman, H. L. Natural evaporation from open water, bare soil and grass. Proc. R.Soc. A Math. Phys. Eng. Sci. 193, 120–145 (1948).
94. Monteith, J. L. Evaporation and environment. in 19th Symposia of the Society forExperimental Biology 19 205–234 (University Press, Cambridge, 1965).
95. Nachtergaele, F. O. et al. The harmonized world soil database. in Proc. 19thWorld Congress of Soil Science, Soil Solutions for a Changing World 34–37 (2010).
V. Mishra and S. Aadhar
11
Published in partnership with CECCR at King Abdulaziz University npj Climate and Atmospheric Science (2021) 59
96. Kay, J. E. et al. The Community Earth System Model (CESM) Large EnsembleProject: A Community Resource for Studying Climate Change in the Presence ofInternal Climate Variability. Bull. Am. Meteorol. Soc. 96, 1333–1349 (2015).
97. Yang, Y., Roderick, M. L., Zhang, S., McVicar, T. R. & Donohue, R. J. Hydrologicimplications of vegetation response to elevated CO2 in climate projections. Nat.Clim. Chang. 9, 44–48 (2019).
98. Ault, T. R. On the essentials of drought in a changing climate. Science 368,256–260 (2020).
99. Wu, Z. & Huang, N. E. Ensemble empirical mode decomposition: a noise-assisteddata analysis method. Adv. Adapt. Data Anal. 1, 1–41 (2009).
100. Wu, Z., Huang, N. E., Wallace, J. M., Smoliak, B. V. & Chen, X. On the time-varyingtrend in global-mean surface temperature. Clim. Dyn. 37, 759–773 (2011).
ACKNOWLEDGEMENTSAuthors acknowledge the data availability from Monsoon Asia Drought Atlas (MADA),Community Earth System Model’s Last Millennium Ensemble (CESM-LME), and CESMLarge Ensemble (CESM-LE). All the datasets are freely available. The financialassistance for this work was provided by the Ministry of Environment, Forest, andClimate Change (MoEFCC).
AUTHOR CONTRIBUTIONSV.M. designed the study and wrote the paper. S.A. estimated PDSI and contributed tothe analysis.
COMPETING INTERESTSThe authors declare no competing interests.
ADDITIONAL INFORMATIONSupplementary information The online version contains supplementary materialavailable at https://doi.org/10.1038/s41612-021-00219-1.
Correspondence and requests for materials should be addressed to Vimal Mishra.
Reprints and permission information is available at http://www.nature.com/reprints
Publisher’s note Springer Nature remains neutral with regard to jurisdictional claimsin published maps and institutional affiliations.
Open Access This article is licensed under a Creative CommonsAttribution 4.0 International License, which permits use, sharing,
adaptation, distribution and reproduction in anymedium or format, as long as you giveappropriate credit to the original author(s) and the source, provide a link to the CreativeCommons license, and indicate if changes were made. The images or other third partymaterial in this article are included in the article’s Creative Commons license, unlessindicated otherwise in a credit line to the material. If material is not included in thearticle’s Creative Commons license and your intended use is not permitted by statutoryregulation or exceeds the permitted use, you will need to obtain permission directlyfrom the copyright holder. To view a copy of this license, visit http://creativecommons.org/licenses/by/4.0/.
© The Author(s) 2021
V. Mishra and S. Aadhar
12
npj Climate and Atmospheric Science (2021) 59 Published in partnership with CECCR at King Abdulaziz University