family and non-family business resilience in an economic downturn
TRANSCRIPT
Family and non-family business resilience in an economic downturn
Bruno Amanna* and Jacques Jaussaudb
aUniversite de Toulouse, Universite Paul Sabatier Toulouse 3, France; bUniversite de Pau et desPays de l’Adour, France
As widely documented in academic literature, family businesses perform better andenjoy a sounder financial structure than non-family businesses, a trend that applies toJapan as well, which is the context of this paper. Therefore, conventional wisdomsuggests that family businesses should recover better or more easily from an economicdownturn and persist in their stronger performance. This study tests this hypothesis,especially in reference to the current global economic crisis, by drawing lessons fromthe Asian crisis of 1997, for which relevant data are available. The study pertainsspecifically to the case of Japanese family and non-family companies. The empiricalinvestigation uses a matched pair methodology, which allows for strong controls of sizeand industry variables. The sample consists of 98 carefully selected pairs (one familyand one non-family) of firms that are of the same size and from the same industry.According to the results, family businesses achieve stronger resilience both during andafter an economic crisis, compared with non-family businesses. They resist thedownturn better, recover faster, and continue exhibiting higher performance andstronger financial structures over time.
Keywords: Asia; downturn; family business; Japan; organizational resilience
Introduction
Research on family businesses suggests that they perform better and enjoy a sounder
financial structure than do non-family businesses. Recent investigations in Japan confirm
this conclusion (Kurashina 2003, Allouche et al. 2008). The strong performance of family
businesses aligns with several theoretical perspectives, which imply that family businesses
should recover better in the face of an economic downturn. In particular, the theory
regarding the concept of organizational resilience suggests that a resilient firm can take
situation-specific, robust and transformative actions when confronted with unexpected and
powerful events, such as economic recessions (Lengnick-Hall and Beck 2009).
Japan is of particular interest in this setting because of its long tradition of family
businesses, beginning even before the country opened its borders to the rest of the world at
the end of the nineteenth century. During the feudal Tokugawa period (1603–1868),
Japanese firms were owned entirely by families or, perhaps more properly, by clans
(Morck and Nakamura 2007). Following the Meiji Restoration of 1868, rapid
industrialization in Japan promoted the development of Zaibatsu, defined as pyramidal
groups controlled by families, such as the Mitsui family’s control over the Mitsubishi
group. During the first decades of the twentieth century, prior to World War II, the
Japanese economy remained structured around such Zaibatsu.
ISSN 1360-2381 print/ISSN 1743-792X online
q 2011 Taylor & Francis
DOI: 10.1080/13602381.2010.537057
http://www.informaworld.com
*Corresponding author. Email: [email protected]
Asia Pacific Business Review
iFirst, 2011, 1–21
FAIR
US
E O
NLY

However, by the second half of the twentieth century, the dominant position of family
businesses in Japanbegan to falter. First, allied forcesdismantledZaibatsu, andwhenKeiretsu
emerged in the 1950s and 1960s as a new form of inter-firm cooperation, companies had lost
the family dimension (Miyashita and Russell 1994). In addition, according to Morikawa
(1996) andMorck and Yeung (2003), Japanese enterprise ownership has undergone dramatic
changes in recent decades, mainly at the expense of family businesses.
This history raises some key questions for the modern day (see Allouche et al. 2008):
Do family businesses remain a significant force in the Japanese economy? How do they
perform and financially structure themselves compared with non-family businesses? Are
they comparable to parallel firms in Western countries?
A study by Kurashina (2003) found that 42.68%, or 1074, of Japanese listed companies
(1st sector) in 2003 were family businesses. Saito (2008) gives the same percentage. Another
study by the Nihon Keizai Shimbun (2006), shows that, between 29 December 1989 and 15
January 2003, 99 enterprises increased capitalization, and of the top 10 firms, eight were
family businesses. In most countries in the world, family businesses account for a major
share of business, employ a significant portion of total employees and record significant
amounts of turnover, added value, investments, and accumulated capital (Allouche et al.
2008). Beyond that, the question of being a significant force in an economy is closely related
to the comparative performance of family businesses vs. non-family businesses. In the case
of Japan, Allouche et al. (2008) confirm that family businesses in Japan achieve better
performance than non-family businesses, for both profitability and financial structures.
Empirical results from Saito (2008) indicate that family businesses slightly outperform non-
family businesses in Japan, but the family business premium mainly results from the active
founders. After the retirement of the founders, the results become mixed (Saito 2008). Even
if some factors can mitigate the family business premium (founders for Saito 2008,
importance of family control for Allouche et al. 2008) globally speaking, despite the huge
and radical changes in the Japanese economy, family businesses in Japan, as in Western
economies, globally outperform non-family businesses.
Furthermore, the evolution of the Japanese economy and its effects on family
businesses may provide an insight into global economies. For example, without data
regarding the current global economic crisis, we cannot test the effects of the modern
recession. Instead, this study compares the performance of family and non-family
businesses during and after the 1997 Asian financial crisis. The crisis caused the financial
and real estate bubbles to burst, leaving the ailing Japanese economy unable to recover
fully until the 1990s, this period became known as Japan’s ‘lost decade’. By 2003 the
Japanese economy had fully recovered. Therefore, this context provides a long-range view
of the effects of an economic crisis on family and non-family businesses. In Japan, it
implies that family businesses are particularly resilient, both during and after the crisis.
In the next section, we provide an overview of broadly accepted interpretations of why
family businesses tend to enjoy better performance and stronger financial structures than
do non-family businesses. We also extend these interpretations to recovery situations
during and after economic downturns, such as the Asian financial crisis of 1997.
Methodology and data collection are then described, we conclude with test results and a
discussion of the pertinent findings.
Background and hypothesis
As in any emerging field of research, some fundamental questions, both theoretical and
practical, remain unsolved for family business studies. For example, how can we define a
2 B. Amann and J. JaussaudFA
IR U
SE
ON
LY
family business precisely, and to what extent do family businesses differ from non-family
businesses? For this study, we apply the concept of organizational resilience to family
businesses, using the context of the 1997Asian crisis to structure our empirical investigation.
Family business and performance
Defining family business
Academic literature includes family business definitions based on both single and multiple
criteria. The former focuses on ownership or control through management; the latter feature
both these dimensions (Rosenblatt et al. 1985, Handler 1989). For example, Miller and Le
Breton-Miller (2003, p. 127) define a family business as ‘one in which a family has enough
ownership to determine the composition of the board, where the CEO and at least one other
executive is a familymember, andwhere the intent is topass thefirmon to thenextgeneration’.
Regarding the availability of several definitions, without a consensus on any one in
particular, Villalonga and Amit (2004) note that many include three key dimensions:
. A significant part of the capital is held by one or several families.
. Family members retain significant control over the company through the
distribution of capital among non-family shareholders and voting rights, with
possible statutory or legal restrictions.
. Family members hold top management positions.
For this study, in line with prior literature (Kurashina 2003, Villalonga and Amit 2004,
Alllouche et al. 2008), we define a family business as one in which family members hold
top management positions, such as chief executive officer, or sit on the board of directors,
and are among the main shareholders.
Varied interpretations of performance
Most empirical investigations find better performance among family businesses compared
with non-family businesses, largely according to their financial performance (Monsen et al.
1968, Monsen 1969, Charreaux 1991, Gallo and Vilaseca 1996), though some investigations
also consider non-financial performance dimensions such as growth. Accordingly the better
performance by family businesses may be interpreted in several ways.
One explanation relies on agency theory, following Berle and Means (1932) and
Galbraith (1967). According to this perspective, family businesses perform better
because they reduce agency costs by minimizing the separation between ownership and
management. The objectives of owners and managers are similar in family businesses,
which allows for less control over managers (Fama and Jensen 1983).
However, this approach suffers some limits (Arregle et al. 2004). For example, family
businesses may suffer other costs, such as a premium needed to balance the risk for
minority investors and prevent owners from exploiting the business only for their own
profit (Shleifer and Vishny 1997; La Porta et al. 1999). Scholars also have identified several
additional agency costs (Barclay and Holderness 1989, Kets de Vries 1993, Schulze et al.
2001, 2003, McConaughy et al. 2001, Burkart et al. 2003, Morck 2003, Morck and Yeung
2003, Chrisman et al. 2005). Therefore, we cannot exclusively assert that agency costs are
lower or higher for family businesses compared with non-family businesses. Rather,
agency costs vary and must be specified precisely in each case (Morck and Yeung 2003).
Carney (2005) highlights three propensities of a family-based governance system that
could mitigate agency costs: parsimony (capital deployed sparingly and used intensively),
Asia Pacific Business Review 3FA
IR U
SE
ON
LY
personalism (unification of ownership and control in the owner) and particularism (families
can employ decision criteria other than those based on pure economic rationality).
Another explanation takes the perspective of stewardship theory and argues that family
members act as stewards because they strongly identify with the firm (Davis et al. 1997).
According to Miller and Le Breton-Miller (2009), stewardship can take three forms. First,
stewardship over continuity means that family members want to ensure the longevity of the
company and therefore invest to create conditions for the long-lasting benefit of all family
members. Second, stewardship over employees implies that family businesses attempt to
nurture the workforce through motivation and training, as well as by transmitting a set of
constructive values to employees. Third, stewardship over customers means that family
businesses strengthen their connectionswithcustomers to sustain their prosperity and survival.
The better performance of family businesses results from the long-term orientation of
family shareholders. This argument stems from Porter (1986), although he underlines that
pressure from financial markets leads to short-term management by listed companies.
Pressures from financial markets are less for family business, which reduces ‘managerial
myopia’ (Stein 1988, 1989). Perhaps family businesses dominate as a form of organization
because family managers have longer prospects than managers in non-family companies
(Harvey 1999).
Additional interpretations rely on a neo-institutional perspective, inwhich the enterprise
is a social construction. Therefore, success draws on the set of values that family members
share, such as trust (Fukuyama 1995, Chami 1999) and altruism (Van den Berghe and
Carchon 2003). Finally, family businesses might achieve increased efficiency through their
intricate connections, according to the concept of ‘familiness’1 (Habbershon and Williams
1999). Such connections can provide additional resources and competencies, which
eventually should strengthen the firm’s potential competitive advantage (Habbershon and
Williams 1999, Habbershon et al. 2003, Arregle et al. 2004, Chrisman et al. 2005).
Financial structure
Research also emphasises differences in the financial structure between family and non-
family businesses, such that the former tend to take more cautious attitudes toward debt.
The main challenge for family businesses is to promote growth without challenging the
permanence of family control (Goffee 1996, Abdellatif et al. 2010). This approach is
consistent with the proposed longer-term perspectives adopted by family businesses,
according to stewardship theory.
A contingency-based view also suggests the possibility of varied risk preferences
(Gomez-Mejia et al. 2007, Abdellatif et al. 2010). For example, socio-emotional wealth
may be a key goal for family businesses, which would be more likely to perpetuate the
owner’s direct control over the firm’s affairs (Gomez-Mejia et al. 2007). Although owners
want to preserve their socio-emotional wealth and diversification, a strategic choice such
as going international, implies a loss of socio-emotional wealth therefore family owners
are likely to avoid that strategic choice, even if it would confer some risk protection to the
company (Gomez-Mejia et al. 2010). Finally, family businesses in general are developed
and managed for the benefit of current and future generations, therefore, their strategic
decisions are not limited to purely economic considerations.
Organizational resilience and family businesses
The question of organizational resilience involves the relationship between crisis planning
and effective adaptive behaviours during a crisis.
4 B. Amann and J. JaussaudFA
IR U
SE
ON
LY

Definition
The concept of organizational resilience is a generalization of the concept of resilience
from psychology. It refers to a fundamental quality in people, groups, organizations or
systems to respond to a significant change that disrupts the expected pattern of events
without engaging in an extended period of regressive behaviour (Horne and Orr 1998).
Although organizational research lacks a clear consensus about its meaning, resilience
captures the firm’s ability to take situation-specific, robust and transformative actions
when it confronts unexpected and powerful events that have the potential to jeopardize its
long-term survival (Lengnick-Hall and Beck 2009).
Coutu (2002) highlights three characteristics of resilient organizations:
(1) Facing down reality. These organizations are pragmatic, even optimistic, as long
as their optimism does not distort their sense of reality.
(2) The search for meaning, or a propensity to make meaning of terrible times.
(3) Ritualized ingenuity, which is the ability to suffice using whatever is at hand.
Coutu clearly links this characteristic to the French term ‘bricolage’. (This concept
comes from the French anthropologist Claude Levi-Strauss and relates closely
to the concept of resilience.) The term, in its modern sense, means a form of
inventiveness or the ability to improvise a solution to a problem without proper or
obvious tools or materials.
Bridge to family business
The various interpretations of the stronger performance of family businesses clearly link to
the resilient organizations characteristics (Coutu 2002). Because the intrinsic
characteristics of family businesses are quite similar to the features that mark resilient
organizations, we expect family businesses to be more resilient than other organizational
forms, as Table 1 shows. From these interpretations, we derive three hypotheses:
H1: Family businesses resist economic downturns better than non-family businesses.
H2: In economic downturns, family businesses are better able to mobilize their resources
than non-family businesses.
Table 1. Resilient and family business characteristics.
Argument #Resilient organizations’characteristics Family businesses’ characteristics
1 Facing down reality - Long-term orientation(Stein 1988, 1989, Miller 2005)- Familiness (Habbershonand Williams 1999, Chrisman et al. 2003)
2 The search for meaning - Familiness (Habbershonand Williams 1999, Chrisman et al. 2003)- Stewardship theory (Davis et al., 1997,Miller et al. 2006, 2009- Social capital (Arregle et al. 2007)
3 Ritualised ingenuity - Parsimony- Personalism- Particularism (Carney 2005)- Socio-emotional wealth (Gomez-Mejia et al. 2010)
Asia Pacific Business Review 5FA
IR U
SE
ON
LY

H3: In economic downturns, family businesses have stronger financial structures than
non-family businesses.
Resilience and economic downturns
To study the specific impact of an economic downturn on family and non-family
businesses, we split the Asian crisis into three significant periods:
. 1998, the worst year in economic terms. This year provides a basis for investigating
the behaviour of firms in an economic downturn and thereby determining if family
businesses offer a greater resistance to the crisis.
. 2003, the year of confirmed recovery in Japan. With this timing, we study the
behaviour of companies at the end of the economic downturn and thus determine if
family businesses have a greater ability to exit the crisis.
. 2007, or a few years after the confirmation of the recovery. This period enables us to
investigate the behaviour of companies and whether family businesses perform
better, even after an economic downturn.
To test our three hypotheses accurately, we translate them into sub-hypotheses related to
each period, 1998, 2003 and 2007, as follows:
H1: Family businesses resist economic downturns better than non-family businesses.
H1a: During an economic downturn, family businesses enjoy better financial performance
than non-family businesses.
H1b: After an economic downturn, family businesses recover better in terms of financial
performance than non-family businesses.
H1c: After recovery from an economic downturn, family businesses keep their advantages
in term of financial performance over non-family businesses.
H2: In economic downturns, family businesses are better able to mobilize their resources
than non-family businesses.
H2a: During an economic downturn, family businesses better mobilize their resources
than non-family businesses.
H2b: Family businesses mobilize their resources better than non-family businesses at the
end of an economic downturn.
H2c: Family businesses mobilize their resources better than non-family businesses after
the end of an economic downturn.
H3. In economic downturns, family businesses have stronger financial structures than non-
family businesses.
H3a: During an economic downturn, family businesses have stronger financial structures
than non-family businesses.
H3b: Family businesses have stronger financial structures than non-family businesses at
the end of an economic downturn.
H3c: Family businesses have stronger financial structures than non-family businesses
after the end of an economic downturn.
The conceptual model in Figure 1 displays this set of hypotheses.
The 1997 Asian crisis
The Asian currency crisis in 1997 affected not only Asia but the whole world until 1998. It
began in Thailand and other South-East Asian countries (e.g. Indonesia, Malaysia) and
6 B. Amann and J. JaussaudFA
IR U
SE
ON
LY
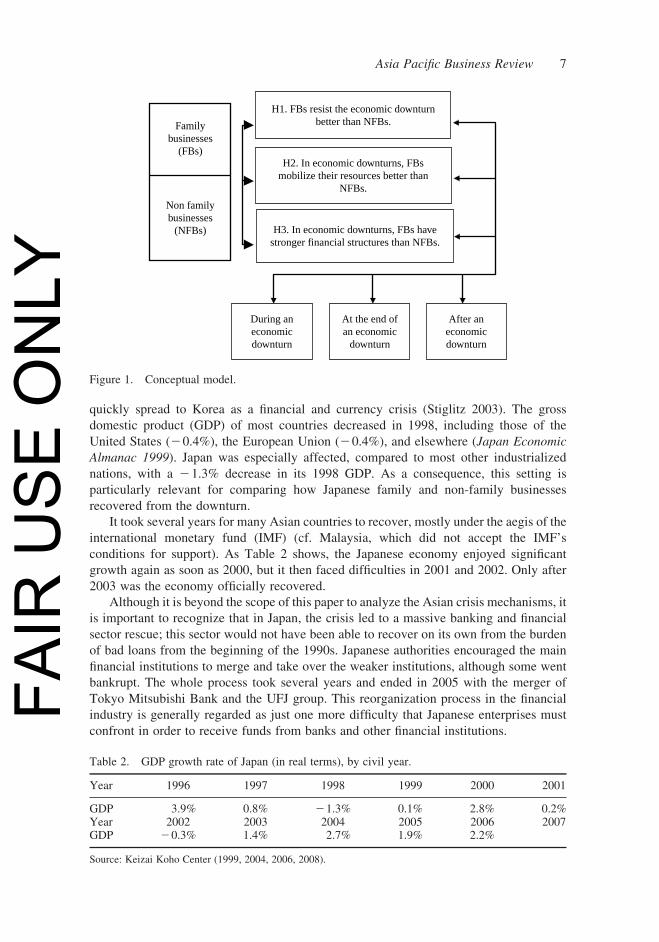
quickly spread to Korea as a financial and currency crisis (Stiglitz 2003). The gross
domestic product (GDP) of most countries decreased in 1998, including those of the
United States (20.4%), the European Union (20.4%), and elsewhere (Japan Economic
Almanac 1999). Japan was especially affected, compared to most other industrialized
nations, with a 21.3% decrease in its 1998 GDP. As a consequence, this setting is
particularly relevant for comparing how Japanese family and non-family businesses
recovered from the downturn.
It took several years for many Asian countries to recover, mostly under the aegis of the
international monetary fund (IMF) (cf. Malaysia, which did not accept the IMF’s
conditions for support). As Table 2 shows, the Japanese economy enjoyed significant
growth again as soon as 2000, but it then faced difficulties in 2001 and 2002. Only after
2003 was the economy officially recovered.
Although it is beyond the scope of this paper to analyze the Asian crisis mechanisms, it
is important to recognize that in Japan, the crisis led to a massive banking and financial
sector rescue; this sector would not have been able to recover on its own from the burden
of bad loans from the beginning of the 1990s. Japanese authorities encouraged the main
financial institutions to merge and take over the weaker institutions, although some went
bankrupt. The whole process took several years and ended in 2005 with the merger of
Tokyo Mitsubishi Bank and the UFJ group. This reorganization process in the financial
industry is generally regarded as just one more difficulty that Japanese enterprises must
confront in order to receive funds from banks and other financial institutions.
H1. FBs resist the economic downturnbetter than NFBs.
H2. In economic downturns, FBsmobilize their resources better than
NFBs.
H3. In economic downturns, FBs havestronger financial structures than NFBs.
Familybusinesses
(FBs)
Non familybusinesses
(NFBs)
During aneconomicdownturn
At the end ofan economic
downturn
After aneconomicdownturn
Figure 1. Conceptual model.
Table 2. GDP growth rate of Japan (in real terms), by civil year.
Year 1996 1997 1998 1999 2000 2001
GDP 3.9% 0.8% 21.3% 0.1% 2.8% 0.2%Year 2002 2003 2004 2005 2006 2007GDP 20.3% 1.4% 2.7% 1.9% 2.2%
Source: Keizai Koho Center (1999, 2004, 2006, 2008).
Asia Pacific Business Review 7FA
IR U
SE
ON
LY
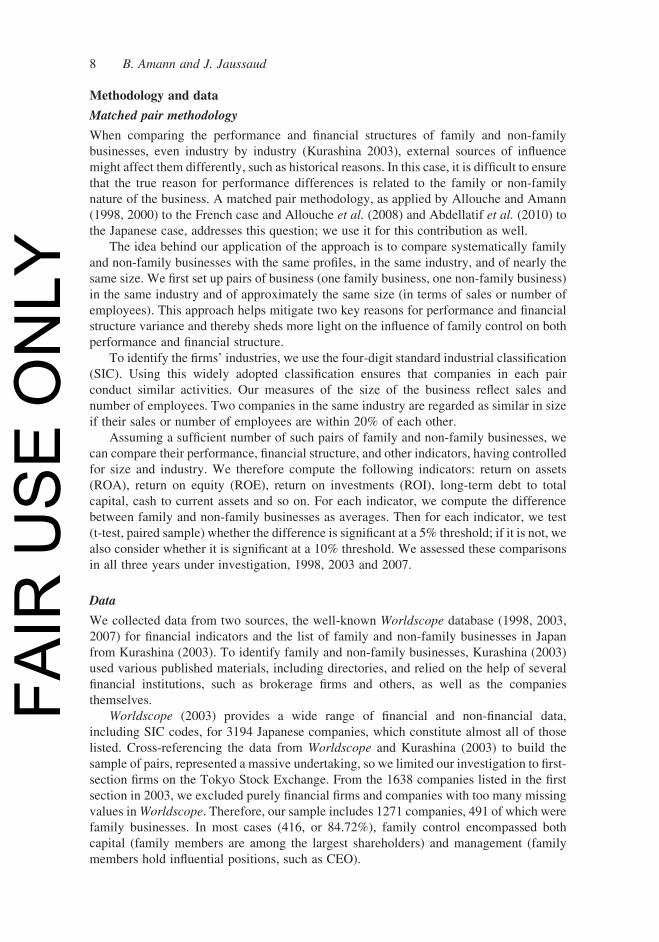
Methodology and data
Matched pair methodology
When comparing the performance and financial structures of family and non-family
businesses, even industry by industry (Kurashina 2003), external sources of influence
might affect them differently, such as historical reasons. In this case, it is difficult to ensure
that the true reason for performance differences is related to the family or non-family
nature of the business. A matched pair methodology, as applied by Allouche and Amann
(1998, 2000) to the French case and Allouche et al. (2008) and Abdellatif et al. (2010) to
the Japanese case, addresses this question; we use it for this contribution as well.
The idea behind our application of the approach is to compare systematically family
and non-family businesses with the same profiles, in the same industry, and of nearly the
same size. We first set up pairs of business (one family business, one non-family business)
in the same industry and of approximately the same size (in terms of sales or number of
employees). This approach helps mitigate two key reasons for performance and financial
structure variance and thereby sheds more light on the influence of family control on both
performance and financial structure.
To identify the firms’ industries, we use the four-digit standard industrial classification
(SIC). Using this widely adopted classification ensures that companies in each pair
conduct similar activities. Our measures of the size of the business reflect sales and
number of employees. Two companies in the same industry are regarded as similar in size
if their sales or number of employees are within 20% of each other.
Assuming a sufficient number of such pairs of family and non-family businesses, we
can compare their performance, financial structure, and other indicators, having controlled
for size and industry. We therefore compute the following indicators: return on assets
(ROA), return on equity (ROE), return on investments (ROI), long-term debt to total
capital, cash to current assets and so on. For each indicator, we compute the difference
between family and non-family businesses as averages. Then for each indicator, we test
(t-test, paired sample) whether the difference is significant at a 5% threshold; if it is not, we
also consider whether it is significant at a 10% threshold. We assessed these comparisons
in all three years under investigation, 1998, 2003 and 2007.
Data
We collected data from two sources, the well-known Worldscope database (1998, 2003,
2007) for financial indicators and the list of family and non-family businesses in Japan
from Kurashina (2003). To identify family and non-family businesses, Kurashina (2003)
used various published materials, including directories, and relied on the help of several
financial institutions, such as brokerage firms and others, as well as the companies
themselves.
Worldscope (2003) provides a wide range of financial and non-financial data,
including SIC codes, for 3194 Japanese companies, which constitute almost all of those
listed. Cross-referencing the data from Worldscope and Kurashina (2003) to build the
sample of pairs, represented a massive undertaking, so we limited our investigation to first-
section firms on the Tokyo Stock Exchange. From the 1638 companies listed in the first
section in 2003, we excluded purely financial firms and companies with too many missing
values in Worldscope. Therefore, our sample includes 1271 companies, 491 of which were
family businesses. In most cases (416, or 84.72%), family control encompassed both
capital (family members are among the largest shareholders) and management (family
members hold influential positions, such as CEO).
8 B. Amann and J. JaussaudFA
IR U
SE
ON
LY
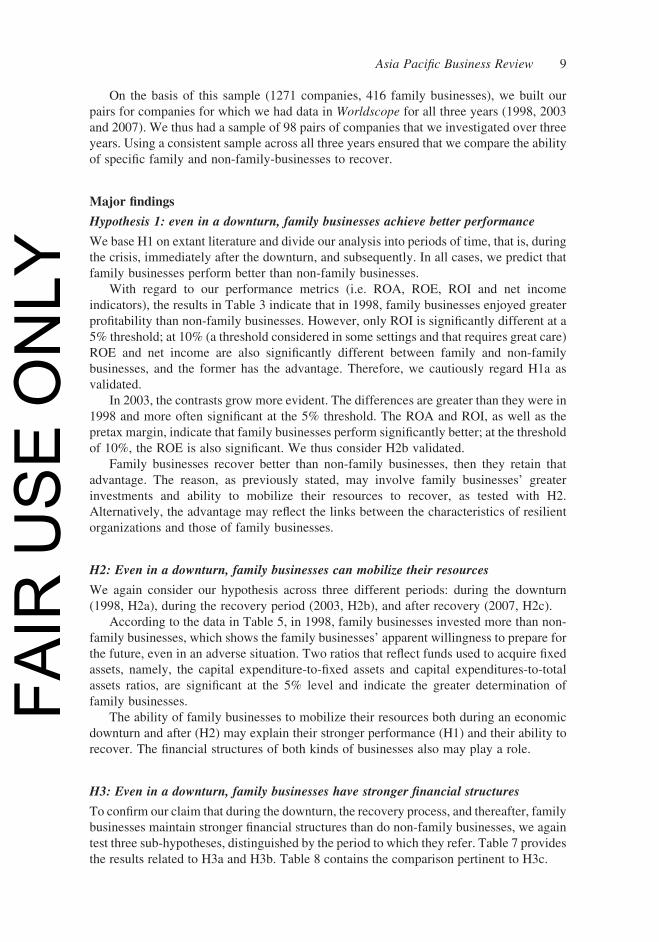
On the basis of this sample (1271 companies, 416 family businesses), we built our
pairs for companies for which we had data in Worldscope for all three years (1998, 2003
and 2007). We thus had a sample of 98 pairs of companies that we investigated over three
years. Using a consistent sample across all three years ensured that we compare the ability
of specific family and non-family-businesses to recover.
Major findings
Hypothesis 1: even in a downturn, family businesses achieve better performance
We base H1 on extant literature and divide our analysis into periods of time, that is, during
the crisis, immediately after the downturn, and subsequently. In all cases, we predict that
family businesses perform better than non-family businesses.
With regard to our performance metrics (i.e. ROA, ROE, ROI and net income
indicators), the results in Table 3 indicate that in 1998, family businesses enjoyed greater
profitability than non-family businesses. However, only ROI is significantly different at a
5% threshold; at 10% (a threshold considered in some settings and that requires great care)
ROE and net income are also significantly different between family and non-family
businesses, and the former has the advantage. Therefore, we cautiously regard H1a as
validated.
In 2003, the contrasts grow more evident. The differences are greater than they were in
1998 and more often significant at the 5% threshold. The ROA and ROI, as well as the
pretax margin, indicate that family businesses perform significantly better; at the threshold
of 10%, the ROE is also significant. We thus consider H2b validated.
Family businesses recover better than non-family businesses, then they retain that
advantage. The reason, as previously stated, may involve family businesses’ greater
investments and ability to mobilize their resources to recover, as tested with H2.
Alternatively, the advantage may reflect the links between the characteristics of resilient
organizations and those of family businesses.
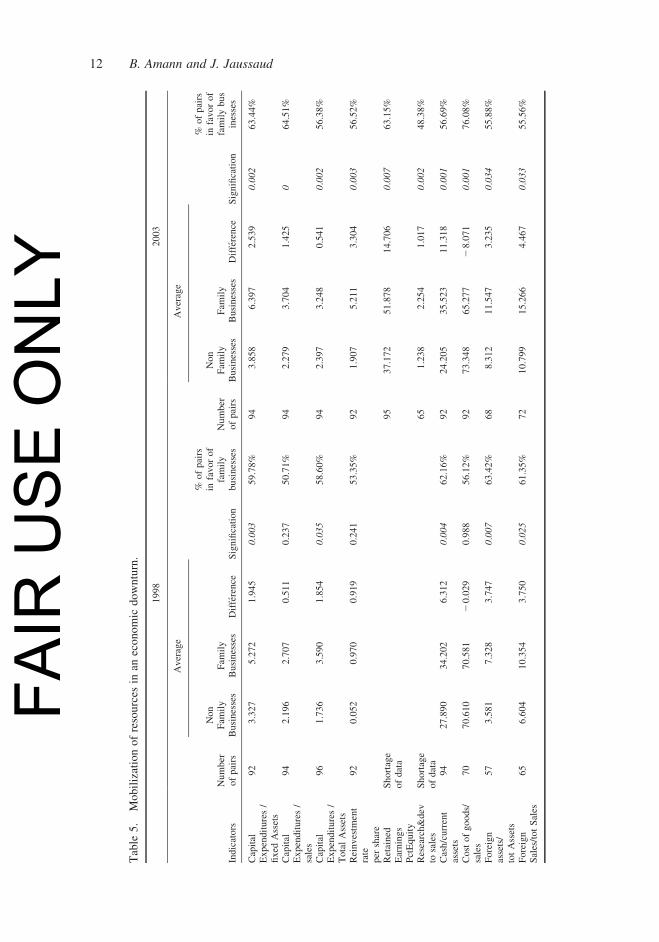
H2: Even in a downturn, family businesses can mobilize their resources
We again consider our hypothesis across three different periods: during the downturn
(1998, H2a), during the recovery period (2003, H2b), and after recovery (2007, H2c).
According to the data in Table 5, in 1998, family businesses invested more than non-
family businesses, which shows the family businesses’ apparent willingness to prepare for
the future, even in an adverse situation. Two ratios that reflect funds used to acquire fixed
assets, namely, the capital expenditure-to-fixed assets and capital expenditures-to-total
assets ratios, are significant at the 5% level and indicate the greater determination of
family businesses.
The ability of family businesses to mobilize their resources both during an economic
downturn and after (H2) may explain their stronger performance (H1) and their ability to
recover. The financial structures of both kinds of businesses also may play a role.
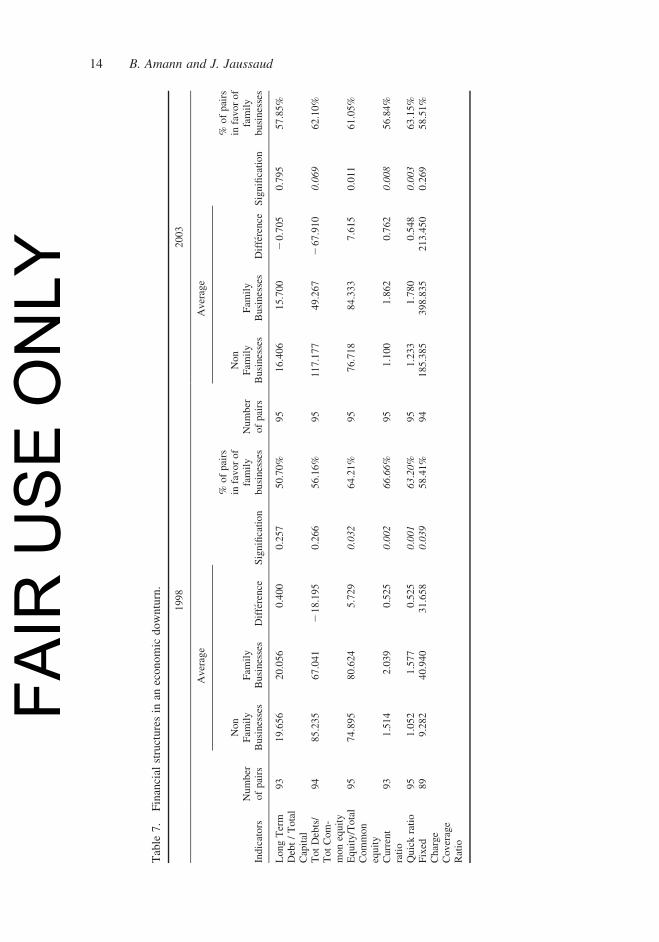
H3: Even in a downturn, family businesses have stronger financial structures
To confirm our claim that during the downturn, the recovery process, and thereafter, family
businesses maintain stronger financial structures than do non-family businesses, we again
test three sub-hypotheses, distinguished by the period to which they refer. Table 7 provides
the results related to H3a and H3b. Table 8 contains the comparison pertinent to H3c.
Asia Pacific Business Review 9FA
IR U
SE
ON
LY

Table
3.
Profitabilityoffamilyandnon-fam
ilybusinessesin
aneconomic
downturn.
1998
2003
Average
Average
Indicators
Number
ofpairs
Non
Fam
ily
Businesses
Fam
ily
Businesses
Difference
Signification
%ofpairs
infavorof
family
businesses
Number
ofpairs
Non
Fam
ily
Businesses
Fam
ily
Businesses
Difference
Signification
%ofpairs
infavorof
family
businesses
Return
on
Assets
91
0.869
1.060
0.191
0.521
56.94%
93
1.878
3.440
1.562
0.0
02
61.29%
Return
on
Equity
94
0.881
3.067
2.185
0.0
73
60.81%
95
3.147
6.642
3.495
0.0
57
47.36%
Return
on
Invested
capital
95
0.906
1.788
0.881
0.0
49
55.40%
95
3.029
5.136
2.107
0.0
02
60.02%
Net
income
95
1844.57
5104.30
3259.73
0.0
60.60
95.00
4389.79
5396.06
1006.27
0.269
46.31%
Pretax
margin
94
2.142
2.262
0.120
0.974
53.33%
94
3.505
6.228
2.723
0.0
07
58.51%
10 B. Amann and J. JaussaudFA
IR U
SE
ON
LY

Table
4.
Profitabilityoffamilyandnon-fam
ilybusinessesaftereconomic
downturn.
2003
2007
Average
Number
of
pairs
Average
Indicators
Number
ofpairs
Non
Fam
ily
Businesses
Fam
ily
Businesses
Difference
Signification
%ofpairsin
favorof
family
businesses
Non
Fam
ily
Businesses
Fam
ily
Businesses
Difference
Signification
%ofpairsin
favorof
family
businesses
Indicators
93
1.878
3.440
1.562
0.0
02
61.29%
89
3.344
4.337
0.994
0.0
59
60.60%
Return
on
Assets
95
3.147
6.642
3.495
0.0
57
47.36
89
5.868
7.728
1.859
0.0
858.81%
Return
on
Equity
95
3.029
5.136
2.107
0.0
02
60.02%
88
4.418
5.716
1.298
0.0
47
67.04%
Net
income
95
4389.79
5396.06
1006.27
0.269
46.31%
87
10557.43
15951.20
5393.77
0.475
48.27%
Pre
tax
margin
94
3.505
6.228
2.723
0.0
07
58.51%
94
4.352
8.295
3.943
0.0
01
63.83%
Asia Pacific Business Review 11FA
IR U
SE
ON
LY
Table
5.
Mobilizationofresources
inan
economic
downturn.
1998
2003
Average
Average
Indicators
Number
ofpairs
Non
Fam
ily
Businesses
Fam
ily
Businesses
Difference
Signification
%ofpairs
infavorof
family
businesses
Number
ofpairs
Non
Fam
ily
Businesses
Fam
ily
Businesses
Difference
Signification
%ofpairs
infavorof
familybus
inesses
Capital
Expenditures/
fixed
Assets
92
3.327
5.272
1.945
0.0
03
59.78%
94
3.858
6.397
2.539
0.0
02
63.44%
Capital
Expenditures/
sales
94
2.196
2.707
0.511
0.237
50.71%
94
2.279
3.704
1.425
064.51%
Capital
Expenditures/
TotalAssets
96
1.736
3.590
1.854
0.0
35
58.60%
94
2.397
3.248
0.541
0.0
02
56.38%
Reinvestm
ent
rate
per
share
92
0.052
0.970
0.919
0.241
53.35%
92
1.907
5.211
3.304
0.0
03
56.52%
Retained
Earnings
PctEquity
Shortage
ofdata
95
37.172
51.878
14.706
0.0
07
63.15%
Research&dev
tosales
Shortage
ofdata
65
1.238
2.254
1.017
0.0
02
48.38%
Cash/current
assets
94
27.890
34.202
6.312
0.0
04
62.16%
92
24.205
35.523
11.318
0.0
01
56.69%
Costofgoods/
sales
70
70.610
70.581
20.029
0.988
56.12%
92
73.348
65.277
28.071
0.0
01
76.08%
Foreign
assets/
totAssets
57
3.581
7.328
3.747
0.0
07
63.42%
68
8.312
11.547
3.235
0.0
34
55.88%
Foreign
Sales/totSales
65
6.604
10.354
3.750
0.0
25
61.35%
72
10.799
15.266
4.467
0.0
33
55.56%
12 B. Amann and J. JaussaudFA
IR U
SE
ON
LY

Table
6.
Mobilizationofresources
afteran
economic
downturn.
2003
2007
Average
Average
Indicators
Number
ofpairs
Non
Fam
ily
Businesses
Fam
ily
Businesses
Difference
Signification
%ofpairs
infavorof
family
businesses
Number
ofpairs
Non
Fam
ily
Businesses
Fam
ily
Businesses
Difference
Signification
%ofpairs
infavorof
family
businesses
Capital
Expenditures/
fixed
Assets
94
3.858
6.397
2.539
0.0
02
63.44%
93
4.848
7.696
2.847
0.0
03
59.13%
Capital
Expenditures/
sales
94
2.279
3.704
1.425
064.51%
93
2.798
4.407
1.609
0.004
55.78%
Captial
Expenditures/
TotalAssets
94
2.397
3.248
0.541
0.0
02
56.38
92
2.977
4.027
1.05
0.0
09
59.97%
Reinvestm
ent
rate
per
share
92
1.907
5.211
3.304
0.0
03
56.52%
84
3.535
5.389
1.854
0.0
57
61.90%
Retained
Earnings
PctEquity
95
37.172
51.878
14.706
0.0
07
63.15%
98
44.029
56.559
12.530
0.0
01
59.60%
Research&dev
tosales
65
1.238
2.254
1.017
0.0
02
48.38%
62
2.039
3.446
1.406
0.0
27
60.29%
Cash/current
assets
92
24.205
35.523
11.318
0.0
01
56.69%
96
23.794
32.025
8.231
0.0
01
70.83%
Costofgoods/
sales
92
73.348
65.277
28.071
0.0
01
76.08%
97
71.633
66.561
25.072
0.0
09
64.94%
Foreignassets/
totAssets
68
8.312
11.547
3.235
0.0
34
55.88%
50
11.097
18.170
7.074
0.0
07
60.00%
Foreign
Sales/totSales
72
10.799
15.266
4.467
0.0
33
55.56%
58
14.318
23.088
8.770
0.0
06
56.89%
Asia Pacific Business Review 13FA
IR U
SE
ON
LY
Table
7.
Financial
structuresin
aneconomic
downturn.
1998
2003
Average
Average
Indicators
Number
ofpairs
Non
Fam
ily
Businesses
Fam
ily
Businesses
Difference
Signification
%ofpairs
infavorof
family
businesses
Number
ofpairs
Non
Fam
ily
Businesses
Fam
ily
Businesses
Difference
Signification
%ofpairs
infavorof
family
businesses
LongTerm
Debt/Total
Capital
93
19.656
20.056
0.400
0.257
50.70%
95
16.406
15.700
20.705
0.795
57.85%
TotDebts/
TotCom-
monequity
94
85.235
67.041
218.195
0.266
56.16%
95
117.177
49.267
267.910
0.0
69
62.10%
Equity/Total
Common
equity
95
74.895
80.624
5.729
0.0
32
64.21%
95
76.718
84.333
7.615
0.011
61.05%
Current
ratio
93
1.514
2.039
0.525
0.0
02
66.6
6%
95
1.100
1.862
0.762
0.0
08
56.84%
Quickratio
95
1.052
1.577
0.525
0.0
01
63.2
0%
95
1.233
1.780
0.548
0.0
03
63.15%
Fixed
Charge
Coverage
Ratio
89
9.282
40.940
31.658
0.0
39
58.41%
94
185.385
398.835
213.450
0.269
58.51%
14 B. Amann and J. JaussaudFA
IR U
SE
ON
LY

Table
8.
Financial
structuresafteran
economic
downturn.
2003
2007
Average
Average
Indicators
Number
ofpairs
Non
Fam
ily
Businesses
Fam
ily
Businesses
Difference
Signification
%ofpairs
infavorof
family
businesses
Number
ofpairs
Non
Fam
ily
Businesses
Fam
ily
Businesses
Difference
Signification
%ofpairs
infavorof
family
businesses
LongTerm
Debt/Total
Capital
95
16.406
15.700
20.705
0.795
57.85%
85
14.633
9.953
24.680
0.0
47
58.82%
TotDebts/
TotCom-
monequity
95
117.177
49.267
267.910
0.0
69
62.10%
85
65.852
36.777
229.075
0.0
567.05%
Equity/Total
capital
95
76.718
84.333
7.615
0.0
11
61.05%
86
82.483
87.884
5.401
0.375
59.30%
Current
ratio
95
1.100
1.862
0.762
0.0
08
56.84%
93
1.772
2.402
0.631
0.0
04
60.4
1%
Quickratio
95
1.233
1.780
0.548
0.0
03
63.15%
91
1.306
1.860
0.554
0.0
04
59.7
8%
Fixed
Charge
Coverage
Ratio
94
185.385
398.835
213.450
0.269
58.51%
74
50.079
215.590
165.511
0.0
27
58.10%
Asia Pacific Business Review 15FA
IR U
SE
ON
LY
In 1998, we found no significant difference between family and non-family businesses
in terms of debts (both long-term and total). However, family businesses enjoyed better
liquidity than non-family businesses, according to the current ratio and quick ratio, which
implies greater flexibility. In addition, the fixed charge coverage ratio is significantly
different at the 5% threshold, in favour of family businesses, which also indicates their
greater flexibility. These results partially validate H3a; however, we find no difference
with regard to long-term or total debt.
In 2003, the picture is almost the same, except the long-term debt-to-total capital ratio
improves for both kinds of businesses, still without significant differences between them.
In addition, the ratio of total debts to total common equity diverges, deteriorating for non-
family businesses and improving for family ones. Therefore, we draw the same conclusion
for H3b, namely, that it is partially validated.
In 2007, family businesses revealed sounder financial structures, in terms of both debts
and liquidity. All the ratios except equity to total capital indicate significant differences in
favour of family businesses at a 5% threshold. Thus, we regard H3c as validated.
Discussion
Family business performance in a downturn (H1)
The wider differences between family and non-family businesses in 2003, at the end of the
downturn, compared with those in 1998 indicate that family businesses recovered better
from the recession than did non-family businesses. Is this recovery success just a matter of
time – such that non-family businesses eventually catch up to family businesses on the
path to recovery? In H1c, we predict instead, that family businesses maintain at least some
of their advantage, and in Table 4, we show that the differences between the types of
business persisted in 2007, still in favour of family businesses. All businesses achieved
better performance than in 2003. However, at the 5% threshold, the ROI and pretax margin
of family businesses were significantly stronger than those of non-family businesses, and
at the 10% threshold, ROA and ROE also significantly supported the benefits of family
businesses. We thus find support for H1c.
The finding supports our hypothesis that family businesses resist economic downturns
better than non-family businesses. In a clear reflection of the ability of family businesses to
face down reality, these firms achieve their success because of both their long-term
orientation (Stein 1988, 1989, Miller 2005) and their so-called ‘familiness’ (Habbershon
and Williams 1999, Chrisman et al. 2003). This fundamental quality – which may appear
in individual people, groups, organizations or systems – to respond to significant change
that disrupts the expected pattern of events without behavioural regressions (Horne and
Orr 1998) strongly suggests the greater organizational resilience of family businesses.
Family business and mobilisation of resources in a downturn (H2)
Family businesses adopt long-term orientations. Even during a crisis, compared with non-
family businesses, family firms ‘invest for the future or undertake initiatives with
significant short-term costs’ (Miller and Le Breton-Miller 2006, p. 78). In addition, the
cash-to-current assets ratio is significant (5%), which indicates greater flexibility among
family businesses. More so than non-family businesses, these companies also are keen to
exploit opportunities abroad. Their ratios of both foreign assets to total assets and foreign
sales to total sales differ significantly at a 5% threshold, in support of H2a.
16 B. Amann and J. JaussaudFA
IR U
SE
ON
LY
Similar findings pertaining to the superiority of family businesses in 2003 indicate that
by this point every ratio in Table 5 significantly favours (5%) family businesses. They
invest more, conduct more research and development, take the lead in overseas markets
and control costs better, all in support of H2b. In addition, our findings show that during
this immediate post-crisis period, investment in innovation (in a broad sense) offers firms
an effective means to resist. The organizational resilience of family businesses emerges in
the form of ‘ritualized ingenuity’.
Because the differences are greater in 2003 than in 1998, as well as more
systematically significant, we can assert that family businesses moving from a crisis into a
recovery phase can better mobilize their resources than can non-family businesses. Even
well after the recovery, family businesses continue to display a better ability to mobilize
their resources; in Table 6 every ratio remains at nearly the same levels, with significant
differences between family and non-family businesses in 2007. Thus we also have support
for H2c.
Family business and stronger financial structures in a downturn (H3)
The interpretation of these results rests on two previously mentioned explanations. First,
academic research notes that family businesses tend to adopt more cautious attitudes
toward debt. Second, some interpretations suggest varied risk preferences for family
versus non-family businesses (Gomez-Mejia et al. 2007). We posit that during an
economic downturn, family businesses renounce their traditional or classical debt-related
behaviour and acknowledge the need to vary their risk preferences. After the crisis, they
re-adopt their traditional behaviours. The results clearly support our first argument, with
regard to facing down reality, and our third claim, pertaining to the translation of ritualized
ingenuity into socio-emotional wealth.
A contingency-based view suggests the possibility of varied risk preferences (Gomez-
Mejia et al. 2007, Abdellatif et al. 2010), such that socio-emotional wealth may be a key
goal for family businesses. Accordingly, firms with these goals are more likely to
perpetuate the owner’s direct control over the firm’s affairs (Gomez-Mejia et al. 2007).
Because owners want to preserve their socio-emotional wealth, which they cannot do
through diversification (e.g. going international), family owners likely avoid that strategic
choice, even if it would confer some risk protection on the company (Gomez-Mejia et al.
2010). However, during a downturn, family businesses are flexible enough to temporarily
accept changes to their traditional goals.
Implications
By addressing three different periods (in the crisis, the end of the crisis and after the crisis),
this contribution makes a threefold contribution to extant literature, particularly with
regard to the organizational resilience of family businesses in a Japanese context:
. First, during the crisis, family businesses, compared with non-family businesses,
achieve better performance (H1), have a greater ability to mobilize their resources
(H2) and are able to alter or adapt their behaviour when it comes to debt (H3).
In short, they resist better.
. Second, at the end of the crisis, these businesses still enjoy better performance than
non-family businesses; the differences between the two groups even increases,
granting greater favour to the family business. On the two other points, the findings
are quite similar. In short, they recover faster.
Asia Pacific Business Review 17FA
IR U
SE
ON
LY

. Third, after the crisis, the differences in the performance of family versus non-
family businesses again increase, in support of the superiority of family businesses.
We find similar results pertaining to their ability to mobilize their resources.
Regarding their recourse to debt, we show that family businesses go back to their
classical behaviours. In short, they still outperform non-family businesses.
This study thus contributes to the broad research stream that addresses questions related to
the performance and financial structure of family businesses; we find consistent results in
contexts of both economic downturn and recovery. In addition, our study takes a step
toward integrating the concept of organizational resilience with family business studies
and understanding (and explaining) the behaviours of various businesses in economic
downturns. These two points represent original contributions. Moreover, by gleaning
lessons from the 1997 Asian financial crisis, this study provides some potentially helpful
insights for dealing with the current global economic crisis. Thus, although it has scarcely
been used to refer to family business settings, the concept of organizational resilience
should be of greater interest in this field.
Several unexplored questions remain however, in relation to the concept of resilience.
Our findings suggest a general debate: Is the resilience displayed by family businesses a
matter of nature (i.e. their innate qualities) or nurture (i.e. experience)? This argument is
quite well documented in entrepreneurship literature (Roderick et al. 2007) but
insufficiently considered in family business literature. Without taking any position in this
debate, we note that the managerial implications of our findings likely support the nurture
position. We have also not addressed the question of how to measure organizational
resilience, a topic that demands greater research attention (see Somers 2009). Both
questions should be at the top of the research agenda for the family business field.
Conclusion
By carefully investigating how Japanese family and non-family businesses weathered the
1997 Asian crisis, we have revealed that family businesses achieved stronger resistance
than non-family businesses, recovered faster, and eventually persisted in enjoying higher
performance and sounder financial structures. In other words, they exhibited greater
organizational resilience than non-family businesses.
However, even as we provide an in-depth analysis, we acknowledge some limitations
to this research. First, we compare large family and non-family businesses, all of which are
listed companies. However, most family firms, including those in Japan, are small and
medium-sized enterprises. It is therefore necessary to keep this limitation in mind when
considering the generalizability of our findings to other family businesses facing an
economic downtown. Second, our research addresses only two of the three characteristics
of resilient organizations (see Table 1; Coutu 2002): facing down reality and ritualized
ingenuity. Data from this research cannot illustrate the implications of the search for
meaning characteristic; a qualitative approach based on interviews of managers of both
types of businesses would provide a means to address this point. Third, our study focuses
solely on Japanese firms. Further studies should confirm if our results apply to other
contexts, within and outside the Asia-Pacific rim, including North America, Europe and
less developed areas.
Comparing the organizational resilience of family and non-family businesses to the
1997 Asian crisis against their resilience in the current economic crisis (once sufficient data
become available) would provide an interesting basis for assessing the strength of our
18 B. Amann and J. JaussaudFA
IR U
SE
ON
LY

results. The two crises indicate similarities, particularly from a Japanese perspective: Both
derive from financial challenges resulting from an excess of debts, both private and public,
and both have caused significant harm to a wide range of industries. In accordance with our
research and findings, it would be helpful to investigate the same hypotheses, using both a
quantitative approach as we have and a qualitative approach that relies on interviews with a
sample of carefully selected managers of both kinds of firms, especially if they have been
able to retain their key positions throughout the crisis and recovery periods.
Acknowledgements
This research has benefitted from funding from the French National Agency for Research (ANR),under the auspices of the MNC Control program (2009–2011).
Note
1. According to Chrisman et al., (2003), ‘the family firm exists because of the reciprocal economicand non-economic value created through the combination of family and business systems. Inother words, the confluence of the two systems leads to hard-to-duplicate capabilities of“familiness” that make family business particularly suited to survive and grow’ p. 444.
Notes on contributors
BrunoAmann is Professor inManagement Sciences at the University Paul Sabatier of Toulouse. He isthe Director of the “Management and Cognition” Research Team of that University. He has publisheda number of contributions in leading academic journals on Family business, Corprorate governance,and on InternationalManagement. Bruno Amann’s most recent publications have been released in theAsia Pacific Business Review (2011), the Journal of Transition Economies (2010), Ebisu (2010), theJournal of Family Business Strategy (2010) and Family Business Review (2008).
Jacques Jaussaud is Professor in Management Sciences at the University of Pau, and is the Directorof the CREG Management Research team of that University. He is currently driving a three yearresearch program with Yokohama National University, financed by the Agency for NationalResearch (ANR, France) and the Japan Society for the Promotion of Science (JSPS, Japan). Thisresearch investigates organisation and control in Japanese and French multinational firms in Asia.Jacques Jaussaud has published in several academic journals, including Asian Business andManagement (2004, 2007), Ebisu (1996, 2003, 2010), Journal of International Management (2006),Asia Pacific Business Review (2011).
References
Abdellatif, M., Amann, B., and Jaussaud, J., 2010. Family versus non-family business: a comparisonof international strategies. Journal of family business strategy, 1 (2), 108–116.
Allouche, J., and Amann, B, 1998. Le retour triomphant du capitalisme familial, Harvardl’expansion.
Allouche, J., Amann, B., Jaussaud, J., and Kurashina, T., 2008. The impact of family control on theperformance and financial characteristics of family versus non-family businesses in Japan:a matched–pair investigation. Family business review, 21 (4), 315–329.
Arregle, J.– .L., Hitt, M.A., Sirmon, D.G., and Very, P., 2007. The development of organizationalsocial capital: attributes of family firms. Journal of management studies, 44, 72–95.
Barclay, M., and Holderness, C., 1989. Private benefits from control of public corporations. Journalof financial economics, 25, 371–396.
Berle, A.A. and Means, G.C., 1932. The modern corporation and private property. New York:Macmillan.
Burkart, M., Panunzi, F., and Shleifer, A., 2003. Family firms. Journal of finance, 18 (5),2167–2201.
Asia Pacific Business Review 19FA
IR U
SE
ON
LY
Carney, M., 2005. Corporate governance and competitive advantage in family–controlled firms.Entrepreneurship theory and practice, 29 (3), 249–266.
Chami, R., 1999. What’s different about family business? Working paper, University of NotreDame.
Charreaux, G., 1991. Structures de propriete, relations d’agence et performances financieres Cahiersdu CREGO, IAE de Dijon.
Chrisman, J.J., Chua, J.H., and Steier, L.P., 2003. An introduction to theories of family business.Journal of business venturing, 18, 441–448.
Chrisman, J.J., Chua, J.H., and Sharma, P., 2005. Trends and directions in the development of astrategic management theory of the family firm. Entrepreneurship theory and practice, 29 (5),555–576.
Coutu, L.D., 2002. How resilience works. Harvard business review, 80 (5), 46–55.Davis, J.H., Schoorman, F.D., and Donaldson, L., 1997. Toward a stewardship theory of
management. Academy of management review, 22 (1), 20–47.Fama, E.F., and Jensen, M.C., 1983. Separation of ownership and control. Journal of law and
economic, 26, 301–326.Fukuyama, F., 1995. Trust, the social virtues and the creation of prosperity. London: Hamish
Hamilton.Galbraith, K., 1967. The new industrial state. Boston Houghton Mifflin College Division.Gallo, M., and Vilaseca, A., 1996. Finance in family business. Family business review, 9 (4),
287–305.Goffee, R., 1996. Understanding family business: issues for further research. International journal of
entrepreneurial behavior and research, 2 (1), 36–48.Gomez–Mejia, L.R., Makri, M.K., and Martin, L., 2010. Diversification decisions in family–
controlled firms. Journal of management studies, 47 (2), 223–252.Gomez–Mejia, L.R., Takacs, K.H., Nunez–Nickel, M., and Jacobson, K.J.L., 2007. Socioemotional
wealth and business risks in family–controlled firms: evidence from Spanish olive oil mills.Administrative science quarterly, 52, 106–137.
Habbershon, T.G., and Williams, M., 1999. A resource–based framework for assessing the strategicadvantage of family firms. Family business review, 12, 1–25.
Habbershon, T., Williams, M., and MacMillan, I.C., 2003. A unified systems perspective of familyfirm performance. Journal of business venturing, 18, 451–466.
Handler, W.C., 1989. Methodological issues and considerations in studying family businesses.Family business review, 2 (3), 257–276.
Harvey, S.J., 1999. Owner as manager, extended horizons and the family firm. International journalof the economics of business, 6 (1), 41–55.
Horne, J.F., III., and Orr, J.E., 1998. Assessing behaviors that create resilient organizations.Employment relations today, 24 (4), 29–39.
Japan Economic Almanac 1999, Tokyo: Nihon Keizai Shimbusha.Keizai Koho Center, 1999, 2004, 2006, 2008. Japan, an International Comparison, Tokyo: Keizai
Koho Center.Kets de Vries, M., 1993. The dynamics of family controlled firms: the good and the bad news.
Organizational dynamics, 21 (3), 59–71.Kurashina, T., 2003. Family Kigyo no Keieigaku, (Management studies on family business), Tokyo:
Toyo Keizai Shimbun Sha.La Porta, R., Lopez–de–Silanes, F., and Shleifer, A., 1999. Corporate ownership around the world.
Journal of finance, 54 (2), 471–519.Lengnick–Hall, C.A., and Beck, T.E., 2009. Resilience capacity and strategic agility: prerequisites
for thriving in a dynamic environment. Working Paper, University of Texas.McConaughy, D.L., Matthews, C.H., and Fialko, A.S., 2001. Founding family controlled firms:
performance, risk and value. Journal of small business management, 39 (1), 31–49.Miller, D. and Le Breton–Miller, I., 2003. Challenge versus advantage in family business. Strategic
organization, 1 (1), 127–134.Miller, D. and Le Breton–Miller, I., 2006. Family governance and firm performance: agency,
stewardship, and capabilities. Family business review, 19 (1), 73–87.Miller, D. and Le Breton–Miller, I., 2009. Agency vs. stewardship in public family firms: a social
embeddedness reconciliation. Entrepreneurship: theory & practice, 33 (6), 1169–1191.
20 B. Amann and J. JaussaudFA
IR U
SE
ON
LY

Miyashita, K., and Russell, D., 1994. Keiretsu: Inside the hidden Japanese conglomerates, NewYork: McGraw-Hill.
Monsen, R.J., 1969. Ownership and management: the effect of separation on performance. Businesshorizons, 12, 46–52.
Monsen, R.J., Chiu, J., and Cooley, D., 1968. The effect of the separation of ownership and controlon the performance of the large firm. Quarterly journal economics, 82 (3), 435–451.
Morck, R., 2003. Corporate governance and family control. Global Corporate Governance Finance,Special issue, Discussion Paper no.1. Available from: http://www.gcgf.org/library/Discussion_Papers_and_Focus%20Notes/Corporate%20Governance%20and%20Family%20Control,%20Morck%20–%20Nov%202003.pdf.
Morck, R., and Nakamura, M., 2007. Business Groups and the Big Push: Meiji Japan’s MassPrivatization and Subsequent Growth. Enterprise & Society, 8 (3), 543–601.
Morck, R. and Yeung, B., 2003. Agency problems in large family business groups. Entrepreneurshiptheory & practice, 27 (4), 367–382.
Morikawa, H., 1996. Toppu Managemento Keizai Shi, Keieisha Kigyo to Kazoku Kigyo (History ofTop Management: Family Businesses versus Non-Family Businesses), Tokyo: Yuhikaku Corp.
Porter, M., 1986. Competition in global industries: a conceptual framework. In: M. Porter, ed.Competition in global industries. Boston, MA: Harvard Business School Press, chapter 1.
Roderick, E.W., Thornhill, S., and Hampson, E., 2007. A biosocial model of entrepreneurship: thecombined effects of nurture and nature. Journal of organizational behavior, 28, 451–466.
Rosenblatt, P.C., de Mik, L., Anderson, R.M., and Johnson, P.A., 1985. The family in business. SanFrancisco, CA: Jossey–Bass.
Saito, T., 2008. Family firms and firm performance: evidence from Japan. Journal of the Japanese &international economies, 22 (4), 620–646.
Schulze, W.S., Lubatkin, M.H., Dino, R.N., and Buchholtz, A., 2001. Agency relationship in family:theory and evidence. Organization science, 12 (2), 99–116.
Schulze, W.S., Lubatkin, M.H., and Dino, R.N., 2003. Exploring the agency consequence ofownership dispersion among the directors of private firms. Academy of management journal, 46(2), 179–194.
Shleifer, A. and Vishny, R.W., 1997. A survey of corporate governance. Journal of finance, 52 (2),737–783.
Somers, S., 2009. Measuring resilience potential: an adaptive strategy for organizational crisisplanning. Journal of contingencies and crisis management, 17 (1), 12–23.
Stein, J.C., 1988. Takeover threats and managerial myopia. Journal of political economy, 96, 61–80.Stein, J.C., 1989. Efficient capital markets, inefficient firms: a model of myopic corporate behavior.
Quarterly journal of economics, (November), 655–669.Stiglitz, J., 2003. Globalization and its discontents. New York and London: Norton & Co.Van den Berghe, L.A.A. and Carchon, S., 2003. Agency relations within the family business
systems: an exploratory approach. Corporate governance: an international review, 11 (3),171–179.
Villalonga, B. and Amit, R., 2004. How do family ownership, control, and management affect firmvalue? EFA 2004 Maastricht Meetings Paper No. 3620. Available from: http://ssrn.com/abstract¼556032.
Asia Pacific Business Review 21FA
IR U
SE
ON
LY