factors influencing lead concentrations in shed deciduous teeth
TRANSCRIPT

The Science of the Total Environment, 74 (1988) 219233 219 Elsevier Science Publishers B.V., Amsterdam - - Printed in The Netherlands
F A C T O R S I N F L U E N C I N G LEAD C O N C E N T R A T I O N S I N S H ED D E C I D U O U S TEETH
LINDSAY J. PATERSON 1 , GILLIAN M. RAAB 2, RUTH HUNTER 2, DUNCAN P.H. LAXEN ~, MARY FULTON 4, GORDON S. FELL 5, DAVID J. HALLS 5 and PHILIP SUTCLIFFE ~
~ Department of Actuarial Mathematics and Statistics, Heriot-Watt University, Edinburgh, EH14 4AS (United Kingdom) 2Medical Statistics Unit, Edinburgh University, Edinburgh, EH8 9A G (United Kingdom) 3London Scientific Services, County Hall, London SE1 7PB (United Kingdom) 4Department of Community Medicine, Edinburgh University, Edinburgh EH8 9AG (United Kingdom) 5Department of Biochemistry, Royal Infirmary, Glasgow G4 OSF (United Kingdom) eDepartment of Preventive Dentistry, Edinburgh University, Edinburgh EH1 1LZ (United Kingdom)
(Received December 8th, 1987; accepted February 22nd, 1988)
ABSTRACT
Data collected for the Edinburgh Lead Study have been used to investigate lead concentrations in children's naturally shed deciduous teeth. A within-child multiple-regression analysis has shown that the upper jaw has a higher concentration of lead than the lower, and that there is a gradient of decreasing concentration from the front to the back of the mouth. Even after the effects of jaw and tooth type have been allowed for, the concentration is still found to be negatively correlated with the weight of the tooth and with the age at which the tooth was shed. No statistically significant effects could be attributed to caries, fillings, or the incomplete resorption of roots. A single-valued index of tooth lead has been derived for each child, taking into account the fact that children gave different types of teeth.
1. INTRODUCTION
T o o t h l ead ha s b e e n used as a m e a s u r e of e x p o s u r e by seve ra l r e c e n t inves- t i g a t i o n s i n t o the effect of l ead on c h i l d r e n ( N e e d l e m a n et al., 1979; S m i t h et al., 1983; W i n n e k e et al., 1983). I t h a s b e e n s u g g e s t e d t h a t the lead c o n c e n t r a t i o n s in d e c i d u o u s t e e th m a y m e a s u r e e x p o s u r e to l ead d u r i n g p r e g n a n c y a n d e a r l y i n f a n c y , w h e n the effect of l ead on n e u r o l o g i c a l d e v e l o p m e n t m a y be g rea tes t .
D i s t o r t i n g the p i c tu r e , howeve r , has b e e n the v a r i a t i o n in t o o t h - l e a d con- c e n t r a t i o n b e t w e e n d i f f e r en t t e e t h f rom the s ame chi ld . T h e r e is e v i d e n c e f rom these a n d o t h e r s t ud i e s (see S e c t i o n 4 be low) of s y s t e m a t i c d i f f e rences in lead c o n c e n t r a t i o n b e t w e e n t o o t h types a n d b e t w e e n q u a d r a n t s of the m o u t h . S m i t h et al. (1983) a c c o r d i n g l y r e s t r i c t e d t h e i r a n a l y s i s to c e r t a i n types , w h i l e N e e d l e m a n et al. (1979) d i s c a r d e d d a t a f rom c h i l d r e n w he r e two t e e t h h a d v e r y d i f f e r en t l ead c o n c e n t r a t i o n s .
S u c h v a r i a t i o n b e t w e e n t o o t h types is con f i rmed in the p r e s e n t paper , by
0048-9697/88/$03.50 ~-) 1988 Elsevier Science Publishers B.V.

220
da ta f rom the Ed inbu rgh Lead Study. This, un l ike Smi th ' s and Need leman ' s , used blood lead as its p r i m a r y m easu re of exposure (Ful ton et al., 1987). But those chi ldren who comple ted the blood-lead s tudy were also asked to dona te dec iduous teeth. We h a v e col lected t ee th of va r ious types, of ten severa l f rom one child. Thus we have a la rge a m o u n t of i n fo rma t ion abou t the way in which tooth- lead c o n c e n t r a t i o n var ies be tween too th types and quadran t s .
We cor rec ted for the d i s to r t ing effects of differences be tween too th types by der iv ing a m eas u re of too th lead t ha t could be used to compare chi ldren direct ly. We descr ibe here the wi thin-chi ld differences in too th- lead concent ra - t ions t ha t we had to t ake into accoun t in ca l cu la t ing the measure . Elsewhere , we will descr ibe the r e l a t ionsh ip be tween too th lead and in te l l ec tua l perfor- mance, and the possible e n v i r o n m e n t a l sources of too th lead.
2. MATERIALS AND METHODS
2.1 Procedures
Before any tee th were collected, the chi ldren had the i r blood lead concen t ra - t ions measured , they comple ted psycholog ica l tests, and one of the i r pa ren t s was in te rv iewed at home. (For deta i ls of those stages, see Fu l ton et al. (1987).) Pos tca rds were left to be sent to the s tudy cen t re when the child had shed a too th (Raab et al., 1985). A nurse then vis i ted the househo ld to col lect the tooth, to check the gap in the chi ld 's mou th f rom which it had been shed, to no te the date a t which it had been shed, and to record its pos i t ion on a s imple mou th cha r t specia l ly des igned for the purpose. The too th type was checked indepen- dent ly by a dent i s t in the D e p a r t m e n t of P reven t ive Den t i s t ry a t Ed inburgh Univers i ty . Any car ies and fillings were removed at this s tage with steel burrs , and incomple te ly resorbed roots were cut off us ing c a r b o r u n d u m discs. Before being analysed , the t ee th were c leaned accord ing to the me thod descr ibed by Delves et al. (1982).
A to ta l of 583 t ee th were received, f rom 267 out of the 501 chi ldren in the study. The chi ldren who gave tee th were aged be tween 6.8 and 9.4 years when they en te red the study. ( T h r o u g h o u t this paper , t ime is expressed as yea rs and decimal f rac t ions of a year . ) Deta i l s of the compar i son of the chi ldren who dona ted t ee th wi th those who did not will be p resen ted elsewhere. The number s of ch i ldren who gave be tween 1 and 8 t ee th are shown in Table 1, and the numbers of different t oo th types which were g iven are shown in Table 2.
The whole c rowns of the t ee th were weighed, d igested in ni t r ic acid, and
TABLE 1
Numbers of t ee th rece ived
Number of teeth: 1 2 3 4 5 6 7 8 Number of chi ldren: 120 66 37 23 7 9 1 4

221
T A B L E 2
Numbers of teeth received, by tooth type a
Right side Left side
M 2 M 1 C LI CI CI L I C M 1 M 2
U p p e r j a w 9 18 21 72 35 37 66 18 26 7
Lower jaw 9 22 57 50 8 5 48 52 17 6
~Tooth types: M 2 - second molar; M 1 - first molar; C canine; LI - lateral incisor; CI -
c e n t r a l incisor.
analysed for lead content by atomic-absorption spectrometry with electrother- mal atomisation (Keating et al., 1987).
2.2 Quality control
Control materials The quality of the chemical analysis of the teeth was controlled by two
materials, H-5 Animal Bone (International Atomic Energy Agency, Vienna) and a solution of digested tooth spiked with lead to give a lead concentration of ~ 60pgl 1. In each batch, two blanks were run through the analytical procedure (Keating et al., 1987). Lead in the blank arose from the acid and because of minor contamination from glassware and the environment. The mean values and within-batch relative standard deviations of these controls and blanks are given in Table 3.
Measurement was made over the range (~100/~g 1 1 . Thus the mean blank value was close to the lower limit of measurement. Most tooth digests were found to have concentrations between 30 and 100pgl - ' (although some required dilution to bring them within this). The mean value for the reference material, H-5 Animal Bone, was close to the certified value, which demon- strates the accuracy of the procedure.
T A B L E 3
Mean lead concentrations and within-batch standard deviations for quality controls (see text for explanation)
Material Number of Mean Relative analyses concentration standard
deviation (%)
Blanks 70 1.5 p g l ~ 21
H-5 Animal Bone" 116 3 . 0 # g g 1 7
S p i k e d tooth digest 72 6 1 . 1 p g 1 1 2.5
" I A E A Certified Reference Material: certified lead content 3 . 1 # g g 1, w i t h a 9 5 % confidence interval of 2 . ~ 3 . 7 # g g ' .

222
Broken teeth Sixty-one teeth accidentally broke into two parts while they were being
prepared, and the parts were analysed separately. (For the results reported later in the paper, we combined the two values for the concentrat ions to give a single measure of lead for each of these teeth.) The average concentrat ion in the split parts was 7.95~g g 1; the standard deviation between the parts was 12.7% of this.
The variat ion seemed to increase with the concentration. We divided the 61 teeth into five groups of 10 and one group (number VI) of 11, the groups being ordered according to the concentrat ion of lead in the whole tooth. Table 4 displays the mean concentrations, and the within-group standard deviations of the differences between the parts. The variability was mostly higher than for the control material, especially for the three groups of teeth at high concentra- tions. This is very likely to have been because the lead in the tooth was unevenly distributed between the split parts.
The results from the parts, however, agreed closely when compared across children; the crude correlat ion between the paired lead concentrat ions was 0.99. This is consistent with the large variance between children in the whole group of tooth-givers: see Section 3.3.
3. R E S U L T S
3.1 Univariate analysis
The minimum lead concentrat ion of the teeth was 0.6ttgg 1, and the maximum was 89.7#gg-1; their arithmetic mean was 9.12~gg 1. Logarithms (to the base e) were used in all calculations, since the crude distribution of the lead concentrat ions was very skew. The crude geometric mean of the con- centrat ions was 6.6ggg 1 (1.89 1Oge (~gg 1)). The means and standard deviations of loge (tooth-lead concentrat ion) are given in Table 5, arranged by tooth type and quadrant of the mouth.
TABLE 4
Broken teeth: m e a n c o n c e n t r a t i o n s (pgg 1), and s t a n d a r d dev ia t ions of the di f ferences in con- c en t r a t i on be tween the par t s (% of mean)
Lead group
I II III IV V VI
M e a n ( p g g 1) 2.27 N u m b e r of b roken 10
tee th Rela t ive s t a n d a r d 3.3
dev ia t ion (%)
3.85 4.82 5.96 8.28 21.2 10 10 10 10 11
8.7 9.5 17.7 22.3 33.7

223
TABLE 5
Tooth-lead concentration, tooth weight, and age of shedding, by type ~ and quadrant; arithmetic means (and standard deviations per tooth)
Right side Left side
M2 M1 C LI CI CI LI C M1 M2
Lead concentration (log~(pg g 1)) Upper jaw 1.6 1.7 1.7 2.1 2.5 2.4 2.0 2.0 1.7 1.5
(1.3) (0.5) (0.6) (0.6) (0.8) (0.7) (0.6) (0.8) (0.9) (0.8) Lower jaw 1.5 1.4 1.7 2.0 2.0 2.8 1.9 1.6 1.3 1.1
(0.6) (0.7) (0.8) (0.8) (0.7) (0.7) (0.8) (0.7) (0.S) (0.8)
Weight (log,,(mg)) Upper jaw 6.2 5.6 5.3 4.7 4.9 4.9 4.7 5.2 5.6 6.1
(0.3) (0.3) (0.3) (0.3) (0.4) (0.3) (0.3) (0.4) (0.3) (0.5) Lower jaw 6.1 5.6 5.2 4.8 4.5 4.5 4.8 5.2 5.5 6.4
(0.3) (0.2) (0.2) (0.2) (0.2) (0.4) (0.2) (0.2) (0.3) (0.1)
Age of shedding (years) Upper jaw 9.3 9.3 9.6 8.2 7.7 7.9 8.2 9.4 9.3 9.9
(0.7) (0.7) (0.9) (0.6) (0.5) (0.5) (0.6) (1.0) (0.8) (0.6) Lower jaw 9.9 9.3 9.0 8.1 7.5 7.6 8.0 9.3 9.6 9.8
(0.9) (0.8) (0.8) (0.6) (0.5) (0.7) (0.6) (0.8) (1.0) (0.6)
See Footnote to Table 2.
T h e w e i g h t s o f t h e t e e t h r a n g e d f rom 33 to 873 mg, w i t h a n a r i t h m e t i c m e a n o f 184 mg. T h e y t o o h a d a s k e w d i s t r i b u t i o n : t h e i r g e o m e t r i c m e a n w a s 161 m g (5.081oge(mg)). See T a b l e 5 for d e t a i l s by t o o t h t ype , a n d for s t a n d a r d d e v i a t i o n s
T h e a g e s a t w h i c h t h e t e e t h w e r e s h e d r a n g e d f rom 6.8 to 11.4 y e a r s ; t h e i r a r i t h m e t i c m e a n w a s 8.6 y e a r s , a n d t h e i r d i s t r i b u t i o n w a s n o t skew. A g a i n see T a b l e 5 for d e t a i l s b y t o o t h t ype , a n d for s t a n d a r d d e v i a t i o n s .
S e v e n t e e n t e e t h h a d c a r i e s , 38 h a d f i l l ings , a n d 13 h a d i n c o m p l e t e l y r e s o r b e d roo t s . T h e c o m p o s i t i o n s o f t h e f i l l i ngs w e r e s u c h t h a t t h e y w e r e u n l i k e l y to h a v e c a u s e d e x t r a l e a d c o n t a m i n a t i o n .
3.2 Regression analysis
A l t h o u g h t h e m e a n s in T a b l e 5 g i v e a c r u d e i n d i c a t i o n o f t h e d i f f e r e n c e s in l e a d c o n c e n t r a t i o n s b e t w e e n d i f f e r e n t t o o t h t y p e s a n d q u a d r a n t s o f t h e m o u t h , t h e r e s u l t s m a y be b i a s e d b e c a u s e d i f f e r e n t s e t s o f c h i l d r e n c o n t r i b u t e d t e e t h o f e a c h t y p e a n d f rom e a c h q u a d r a n t . To o v e r c o m e t h i s p r o b l e m , t h e d a t a w e r e a n a l y s e d b y m u l t i p l e r e g r e s s i o n . T h i s p r o v i d e d a n e s t i m a t e d l e a d c o n c e n t r a - t i o n for e a c h ch i ld , a n d e s t i m a t e s o f t h e d i f f e r e n c e s in l e a d c o n c e n t r a t i o n s b e t w e e n t o o t h t y p e s a n d b e t w e e n q u a d r a n t s . W e i n v e s t i g a t e d a l so t h e i n f l u e n c e on t h e l e a d c o n c e n t r a t i o n s o f t h e w e i g h t o f t h e t o o t h a n d o f t h e a g e a t w h i c h

224
it was shed. Only those chi ldren who dona ted two or more tee th con t r ibu ted to the es t imates of the effects of too th type, m o u t h quadran t , weight , and age of shedding.
The resu l t s for too th type and m o u t h q u a d r a n t are expressed as adjus ted means for a child wi th the ave r age lead c o n c e n t r a t i o n in the s tudy sample. The model which is be ing fitted includes a s t ipu la t ion t ha t the difference be tween too th types and q u a d r a n t s a re cons t an t on a log scale, which cor responds to cons t an t ra t ios of the concen t ra t ions . For example , we es t ima te below (Table 6) t ha t the adjus ted log mean for a cen t ra l inc isor is 2.171Oge(pg g 1), and for a second mo la r is 1.361oge(gg g 1). Thus the log difference is 0.81, correspond- ing to a ra t io of 2.25:1. These are the es t imates for a child wi th the a v e r a g e lead concen t ra t ion . A low-lead child wi th an inc isor c o n c e n t r a t i o n of 1.021oge (#gg 1) would be expec ted to have a c o n c e n t r a t i o n in a second mo la r of 0.21 loge(pg g 1); the co r respond ing raw va lues of 2.77 and 1 .23pgg 1 aga in are in the ra t io 2.25:1.
The regress ion ind ica ted t h a t overa l l there was no evidence of a di f ference in lead c o n c e n t r a t i o n be tween tee th of the same type in s imi lar pos i t ions on different sides of the same jaw. Thus in the resu l t s discussed below, the side of the m o u t h has been ignored.
Similar ly , there was no evidence of any dif ference in lead c o n c e n t r a t i o n a t t r i bu t ab l e to caries, or to fillings, or to roots being incomple te ly resorbed.
Differences in lead concen t r a t i ons were found be tween the two jaws, be tween pos i t ions wi th in the jaw, be tween different weigh ts of t ee th and be tween dif ferent ages of shedding. The resu l t s for j aw and too th type are der ived f rom a model which ignores the inf luence of too th weigh t and age of shedding (see Appendix).
Differences between upper and lower jaws The a v e r a g e lead concen t r a t i ons of t ee th differed be tween the uppe r and
lower jaws. The adjus ted means were 1.821Oge(pgg 1) (upper) and 1.731oge (pgg 1) (lower); (p = 0.026 tha t there is no dif ference be tween the jaws). In o the r words, on the scale gg g 1, an upper too th had on ave rage an 8.7% h igher lead c o n c e n t r a t i o n t h a n a lower too th of the same type.
Differences between tooth types There were di f ferences in lead c o n c e n t r a t i o n f rom f ront to back: see Table
6. The overa l l t r end was h ighly s t a t i s t i ca l ly s ignif icant (p < 0.0001 t h a t all the
TABLE 6
Adjusted mean lead concentrat ions , by tooth type a
Type: CI LI C M1 M2 Adjusted mean 2.17 2.09 1.77 1.49 1.35
(loge(pg g ~)):
a See footnote to Table 2.

225
m e a n s are the same). But ne i ther the dif ference b e t w e e n the lateral and centra l inc isors , nor that b e t w e e n the two types of molar , was s ta t i s t i ca l ly s ignif icant .
These di f ferences can be expressed as percentage reduct ions in lead b e t w e e n too th types on the sca le #g g 1. Thus, as percentages of the average concentra- t ion for centra l inc isors , the average c o n c e n t r a t i o n s were 92% for lateral inc isors , 67% for canines , 51% for first molars , and 44% for s econd molars .
There was ev idence that the di f ference b e t w e e n lead c o n c e n t r a t i o n s in the different too th types was not the same for the upper and lower jaws (p - 0.012 that there is no s tat i s t ica l i n t e r a c t i o n b e t w e e n jaw and too th type): see Fig. 1. The number of donated central inc i sors from the lower jaw was very smal l (Table 2), and so the apparent absence of a trend at the front of that jaw could wel l be due to random error. However , the resul ts do sugges t a s h a l l o w e r fal l ing-off in c o n c e n t r a t i o n to the back o f the m o u t h for the lower jaw than for the upper jaw.
Weight of tooth Most of the effect of t oo th w e i g h t on lead c o n c e n t r a t i o n is inc luded in the
di f ferences b e t w e e n too th types. For example , molars tend to be heav i er than incisors , and also tend to h a v e l ower c o n c e n t r a t i o n s (Table 5). But even after
2.40
2.30'
2.20-
~ 2.10 &.
2.00 d
oz 1.90
1.80
1.70
1.60" '
I . 50 -
1.40:
1.30 :
1 .20
Fig. 1.
iA,
9
\\\
\\\
\
~'- , ~ LO~ER JFIW
~ " E ] UPPER JRW
i I I I I CENTRAL LATERAL CANINE FIRST SECOND INCISOR INCISOR MOLAR MOLAR
Adjusted mean lead concentrations, by tooth type (1Oge(pg g 1)).

226
jaw and too th type have been al lowed for, there remains a res idual effect of weight. Fi t ted af ter jaw and type as a regress ion coefficient of concen t r a t i on on loge(weight in mg), the effect is -0 .31 (p < 0.0001 tha t there is no residual effect of weight). This can be in te rpre ted as the effect of weight on the lead concen t r a t i on for t ee th of different weights but from the same jaw and of the same type. For example, if one too th was 10% heav ie r t han another , but was of the same jaw and type, then it would have a 2.9% lower concen t ra t ion .
Since the morphology of cor responding upper and lower tee th is rough ly the same, the weight var iable is l ikely to have been sufficient to al low for the fact tha t upper tee th tend to be larger t han cor responding lower teeth. If this assumption is not wholly correct , then the effects of different morphology will have been subsumed into the differences between jaws ment ioned above.
Age of shedding Similar comments apply to the age at which the tooth was shed (in years):
tee th shed la te r have lower concen t ra t ions (Table 5). The residual effect af ter al lowing for jaw, too th type, and weight, was - 0.090 (p - 0.02 tha t there is no residual effect of age). Again, this coefficient measures the effect of age on lead concen t r a t i on for tee th of different ages but of the same jaw and type. For example, if one too th was shed 6 months la te r t han another , but was of the same type and jaw, then it would have a 4.5% lower concen t r a t i on of lead.
3.3 Components of variability
Although we have been inves t iga t ing the effects of within-chi ld factors such as jaw and too th type, the va r ia t ion between chi ldren made up by far the largest par t of the overal l va r i a t ion in lead concent ra t ions . The sampling var iance of tooth- lead concen t ra t ions between all 267 chi ldren was 0.39, which represents a s tandard devia t ion of ~ 87% of the mean on the scale #g g 1. By contras t , the residual va r iance wi th in chi ldren was only 0.048 (af ter fi t t ing jaw, type, loge(tooth weight), and age of shedding); this corresponded to a s tandard devia t ion of ~ 25% of the mean on the scale #g g 1.
Thus the va r i ance of lead concen t ra t ions in the popula t ion of chi ldren is about e ight t imes as large as the var iance wi th in a typical child tha t is not accounted for by jaw, type, weight, and age of shedding.
The analysis repor ted in Sect ion 3.2 is wi th in chi ldren, and so is not dis tor ted by the large differences be tween chi ldren.
3.4 Deriving a tooth-index for each child
The resul ts of the regress ion let us es t imate a tooth- lead concen t r a t i on for all 267 chi ldren who gave at least one tooth. This es t imate can be in te rpre ted as an adjusted mean concen t r a t i on of lead in the child 's teeth, a l lowing for va r ia t ion a t t r ibu tab le to jaws, too th types, too th weight, and age of shedding.

227
To ease the i n t e rp re t a t i on , we have re-expressed the es t imated va lues as log- a r i thmic concen t r a t i ons in uppe r l a t e ra l incisors. We chose to s t anda rd i se on this type because it was the c o m m o n e s t we rece ived (Table 2), and because o the r r e sea r che r s had p re fe r red it too (Sect ion 4.2: for example , Delves et al. (1982, page 334).)
A h i s t o g r a m of the e s t ima ted va lues is shown in Fig. 2. The i r m e a n is 2.191oge(pgg 1) (a geomet r i c m e a n of 8.94gg g 1), which was close to the unad jus t ed mean of 2.02 loge(#g g 1) for the 138 uppe r l a te ra l incisors which we ac tua l l y received. For example , one child who was g iven an es t imated va lue of 3.19 loge(pg g 1) did dona te an uppe r l a te ra l incisor, wi th a lead c o n c e n t r a t i o n of 3.011oge(pgg 1).
For a child who dona ted an uppe r l a te ra l incisor, the es t imated va lue was not exac t ly the same as the ac tua l one because it t ook accoun t also of the o the r t ee th g iven by the child, and of how typ ica l were the weigh t and age of shedding of the dona ted uppe r l a te ra l inc isor compared wi th uppe r l a t e ra l incisors f rom o ther chi ldren.
For a child who did not dona te an uppe r l a te ra l incisor, the e s t ima te was ob ta ined by us ing the tee th it a c tua l l y dona ted to predic t w h a t the concen t ra - t ion m a y have been in its upper l a t e ra l incisors.
The h i s t o g r a m in Fig. 2 is not in tended to e s t ima te the shape of the tooth- lead d i s t r ibu t ion in the popu la t ion as a whole. To do tha t , the sampl ing m e c h a n i s m would have to be t a k e n into account . (Raab et al., 1985). F igure 2 should be i n t e rp re t ed as mere ly a s u m m a r y of the too th- lead pa t t e rn in the sample.
48-
42-
36" cz:
30-
24,
~8"
12-
6.
0 ' 0',50' 1.00 1.50 2.00 2.'50 3.00 3.50 4.00 4.50
TOOTH LERO CONCENTRFIT]ON LOG( ~ 9 / 9 ) 5.'00 5.50
Fig. 2. Histogram of estimated lead concentrations (loge~g g t)) in upper lateral incisors.

228
4. DISCUSSION
4.1 Lead concentrations
The crude mean lead concen t r a t i on of our tee th was h igher than tha t found by similar recen t studies in the U.K. For example, Delves et al. (1982) found an a r i thmet ic mean of 4 .8#gg 1, with s t andard e r ro r ~0.16, for 190 la tera l incisors na tu ra l ly shed by chi ldren in London. The a r i thmet ic mean of our 236 la tera l incisors was 7.8 #g g- 1, with approximate s tandard e r ror 0.33. (Our mean and s tandard e r ro r have been weighted to al low for the sampling mechanism: see Appendix.) In the same study, Delves et al. (1982) found an a r i thmet ic mean of 5.3 #g g ~ for 268 cen t ra l incisors, with s tandard e r ror ~ 0.19. Our a r i thmet ic mean for 85 cen t ra l incisors was 11.5 zg g 1 (again weighted); the s tandard e r ror was ~ 0.77.
A useful summary of recen t such findings is by Fergusson and Purchase (1987, especial ly Table 4).
4.2 Choice of tooth type and material
Most o ther studies have used only incisors, usual ly discarding canines and molars (Shapiro et al., 1978; Delves et al., 1982, Ewers et al., 1982; Smith et al., 1983). Some have t aken a simple mean of the tee th obta ined from a child (Needleman et al., 1979; Clegg et al., 1984) and have th rown away ~discordant" t ee th (Needleman et al., 1979).
Incisors have been chosen in these studies main ly because they are the ear l ies t t ee th to form (s tar t ing 0.33 years before bir th) and emerge (0.5-0.75 years af ter birth). Upper t ee th emerge la ter t han lower tee th (Fergusson and Purchase , 1987, Table 1).
Whole crowns are bel ieved to be a be t te r index of lead exposure than dent ine or enamel separa te ly (Delves et al., 1982, page 335; K h a n d e k a r et al., 1986, page 234). But o the r studies have analysed dent ine or enamel separa te ly (Fergusson and Purchase , 1987, pages 18 and 19).
An impor tan t difference between our s tudy and o thers is tha t we did not select the chi ldren according to the type of tooth they donated or the lead concen t r a t i on of the tee th (Raab et al., 1985): compare Smith et al. (1983) or Needleman et al. (1979). The main impl icat ion of this would be for a between- child analysis - - for example, in an inves t iga t ion of the re la t ion between too th lead and env i ronmenta l lead. Regression analysis might then be misleading if the sampling design was not t aken into accoun t (Holt et al., 1980; Raab et al., 1987). A within-chi ld analysis is not biased by such s ta t i s t ica l problems. (But see our Appendix for a discussion of how this affects the es t imate of the between-chi ld component of var iance , and of the means and s tandard errors in Sect ion 4.1.)

229
4.3 Effects of tooth type and quadrant
Our results agree with other studies which have looked at the effects of tooth type and quadrant (Fergusson and Purchase, 1987, Table 3).
The left and right of the mouth were found to have similar concentrations by Grandjean et al. (1984, 1986), and by Smith et al. (1983). The upper jaw was found to have higher concentrations than the lower by Grandjean et al. (1986) and by Smith et al. (1983).
Gradients of decreasing lead concentrations from incisors to molars were found by Khandekav et al. (1986), by Delves et al. (1982), by Fergusson et al. (1980), by Mackie et al. (1977), by Stephens and Waldron (1976), by Lockeretz (1975), and by Oshio (1973).
Our results do not agree with Smith et al. (1983) on the difference between lateral and central incisors when the upper jaw is looked at separately. They found that upper laterals had more lead than upper centrals. Grandjean et al. (1984) agree with Smith et al. (1983) in this respect. But our finding agrees with Grandjean et al. (1986).
4.4 Caries, fillings, and roots
All other studies have discarded carious and filled teeth. Some have reported that carious teeth tend to have higher lead concentrations than non-carious teeth, and that filled teeth have higher concentrations than unfilled teeth. Our results were in the same direction, but did not reach statistical significance.
4.5 Weight and age of shedding
The weight of the tooth has not generally been taken into account in other studies, although any adjustment for tooth type implicitly makes some allowance for it.
Our findings differed from those of Stewart (1974), who found that older extracted deciduous teeth had more lead than younger ones. But Pinchin et al. (1978) found, as we did, a negative relationship, confined though to molars. (They had a mixture of shed deciduous teeth and extracted permanent teeth.) They suggest that a negative slope might be caused by a decreasing deposition rate in teeth with increasing age, or by resorption of the root.
Our approach can be compared to that implied by Moore et al. (1978, p. 82), who suggest adjusting the concentrations to a standard weight of tooth, ignoring tooth type and mouth quadrant. Thus weight would be used to account for all the differences in lead concentrations. By contrast, the estimate in Section 3.2 above is of the residual effect of weight after allowance has been made for type and quadrant. Because our method lets factors other than weight play a role, it can model more accurately than Moore et al.'s proposal the variation in lead concentrations between children. Tooth type and quadrant of
230
the mouth account for 29% of the within-child variat ion in our analysis; weight on its own would account for only 13%.
4.6 Laboratory error
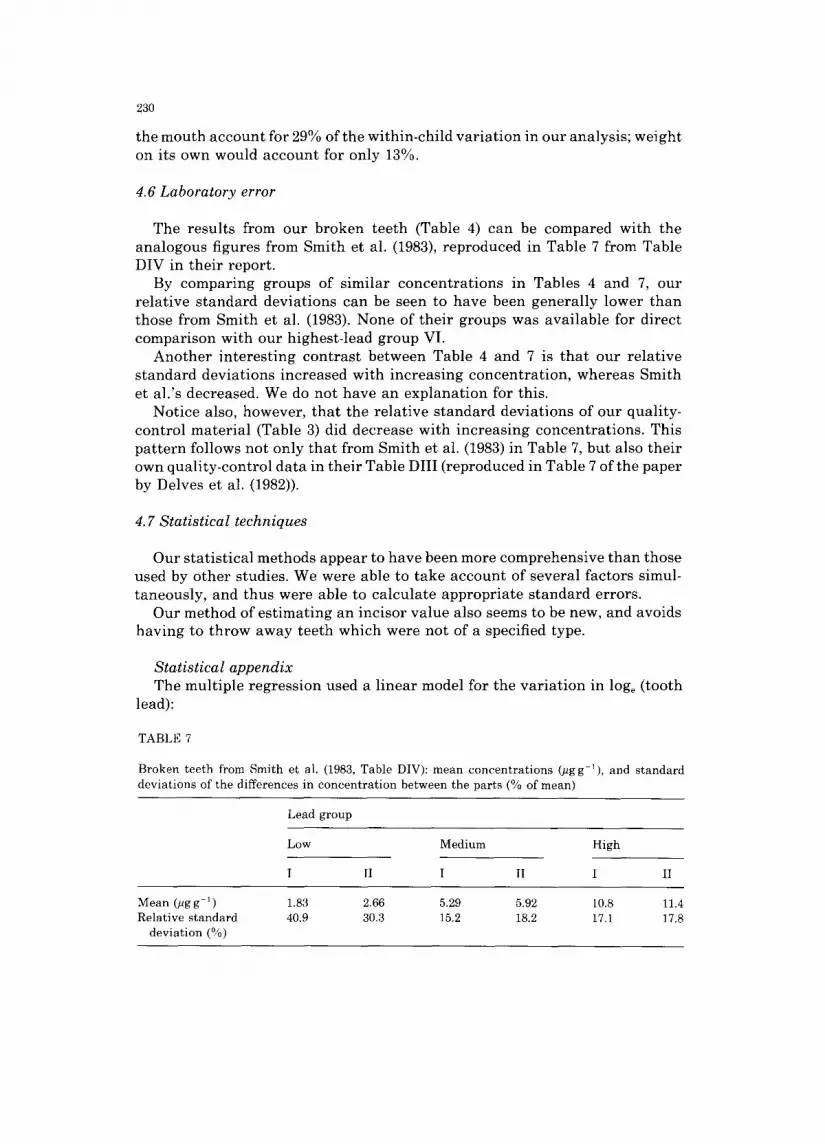
The results from our broken teeth (Table 4) can be compared with the analogous figures from Smith et al. (1983), reproduced in Table 7 from Table DIV in their report.
By comparing groups of similar concentrat ions in Tables 4 and 7, our relative standard deviations can be seen to have been generally lower than those from Smith et al. (1983). None of their groups was available for direct comparison with our highest-lead group VI.
Another interesting contrast between Table 4 and 7 is that our relative standard deviations increased with increasing concentration, whereas Smith et al.'s decreased. We do not have an explanation for this.
Notice also, however, that the relative standard deviations of our quality- control material (Table 3) did decrease with increasing concentrations. This pattern follows not only that from Smith et al. (1983) in Table 7, but also their own quality-control data in their Table DIII (reproduced in Table 7 of the paper by Delves et al. (1982)).
4.7 Statistical techniques
Our statistical methods appear to have been more comprehensive than those used by other studies. We were able to take account of several factors simul- taneously, and thus were able to calculate appropriate standard errors.
Our method of estimating an incisor value also seems to be new, and avoids having to throw away teeth which were not of a specified type.
Statistical appendix The multiple regression used a linear model for the variat ion in loge (tooth
lead):
TABLE 7
Broken teeth from Smith et al. (1983, Table DIV): mean concentrations (#gg 1), and standard deviations of the differences in concentration between the parts (% of mean)
Lead group
Low Medium High
I II I II I II
Mean (tlgg 1) 1.83 Relative standard 40.9
deviation (%)
2.66 5.29 5.92 10.8 11.4 30.3 15.2 18.2 17.1 17.8

231
loge(tooth lead) = o~ I @ ~ p j ~- ( w - l~)72 -- (a (t)5
where ~i = fi t ted va lue for the uppe r l a te ra l inc isor for the I t h child ( I = 1,2...267). flpj - fitted va lue for the difference be tween the lead con- c e n t r a t i o n of the too th type P on the j aw J and the lead c o n c e n t r a t i o n of the upper l a t e ra l incisor. (Thus fieJ for the uppe r l a t e ra l inc isor is jus t 0). w = log o of too th we igh t in mg. 5J = a v e r a g e loge (weight) for all teeth, r - e s t ima te of change in 1Oge (lead concen t r a t i on ) per un i t change in loge ( tooth weight). a = age of shedding for the tooth , in years . ~i - a v e r a g e age of shedding for all teeth. 5 - e s t ima te of change in logo(tooth lead) per yea r difference in age of shedding.
This was the model used to der ive an es t imated lead c o n c e n t r a t i o n for the uppe r l a t e ra l inc isor for each child. O the r fac tors were inc luded as descr ibed in the t ex t (for example , side of the m o u t h and car ious teeth). A model w i thou t the las t two t e rms (r and 3) was fitted in Sec t ion 3 to descr ibe the di f ference in lead c o n c e n t r a t i o n s be tween jaws and too th types.
All the regress ion models were fitted by s t anda rd leas t - squares (see, for example , D r a p e r and Smith, 1981), us ing the compu te r p r o g r a m G E N S T A T (Alvey et ah, 1983). For the assoc ia ted s ignif icance tests to be sure of be ing valid, c e r t a in condi t ions have to be met by the v a r i a t i o n in the data . The unexp la ined v a r i a t i o n s mus t be no rma l ly dis t r ibuted, and the r e l a t ionsh ips mus t be l inear . These condi t ions were checked by examin ing plots of residuals , and by check ing for ind iv idua l inf luent ia l points (Cook and Weisberg, 1982). N o r m a l i t y was plausible , and no s ingle too th had an undue inf luence on the es t imates of the effects of jaw, too th type, too th weight , and age of shedding. Moreover , l eas t - squares me thods are k n o w n to be robus t aga ins t mode ra t e d e p a r t u r e s f rom the va l id i ty condi t ions . The few very la rge es t imated va lues (the e ight g r e a t e r t h a n 3.6 logo (pg g 1), or 36.6 logo (pg g 1)) were all for ch i ldren who had ve ry h igh lead c o n c e n t r a t i o n s in the tee th which they did give. Thus there was no r ea s on to be concerned abou t them as s ta t i s t i ca l outl iers . For example , the h ighes t was 5.201oge(pgg 1) or 181.3/~gg 1. This child gave one tooth , a first mo la r f rom the left side of the upper jaw, which had a lead c o n c e n t r a t i o n 4.50 logo (pg g 1 ) or 90.0 pg g 1. The crude mean of all the 26 tee th of this type which we rece ived was only 1.691oge(pgg 1) or 5 . 4pgg t. Thus, on the ev idence which we had f rom this child, we could say t ha t its lead concen t ra - t ions were far above average , and so an above -ave rage es t ima ted va lue for its uppe r l a t e ra l inc isors was appropr ia te . Observed too th- lead concen t r a t i ons s imi lar to this e s t imated va lue of 5.20 are r epor ted by H a b e r c a m et ah (1974) and by Delves et al. (1982).
The be tween-ch i ld sampl ing v a r i a n c e had to t ake a c c o u n t of the way in which the sample was selected. As exp la ined by Raab et al. (1985), all ch i ldren in the uppe r quar t i l e of the blood-lead d i s t r ibu t ion were inc luded in the even tua l sample , but only a one- in- three sub-sample of the remainder . Therefore , to ob ta in an unb iased es t ima te of the popu la t ion va lue of the be tween-chi ld v a r i a n c e we used a weighted ave rage of the be tween-chi ld
232
v a r i a n c e s in the t o p - q u a r t i l e s t r a t u m (0.321) a n d in the r e m a i n i n g s t r a t u m (0.411):
¼(0.321 + 3×0 .411) = 0.389.
H o l t a n d S m i t h (1979, page 44) e x p l a i n w hy th i s is t he a p p r o p r i a t e form of the w e i g h t e d e s t i m a t o r : i t is t he u s u a l v a r i a n c e of t he m e a n of a s t r a t i f i ed sample , a n d t he r e fo r e is c a l c u l a t e d a b o u t the w e i g h t e d m e a n of the p o p u l a t i o n m e a n s of the s t r a t a .
S i m i l a r w e i g h t i n g gave the a r i t h m e t i c m e a n s a n d s t a n d a r d e r ro r s for c e n t r a l a n d l a t e r a l i n c i s o r s q u o t e d i n S e c t i o n 4.1.
ACKNOWLEDGMENTS
We w o u l d l ike to t h a n k : A. P u g h a n d P. Ross ( the n u r s e s who co l l ec ted the t e e th f rom the ch i ld ren ) ; L. K i r k w o o d a n d J. K e n n e d y (who k e p t t r a c k of the
t e e th f rom c o l l e c t i o n to ana lys i s ) ; M. Brown , B. W o h l g e m u t h a n d J. M i t c h e l l of the D e p a r t m e n t of P r e v e n t i v e D e n t i s t r y a t E d i n b u r g h U n i v e r s i t y (who p r e p a r e d the t e e t h for ana lys i s ) ; A.D. K e a t i n g a n d J.L. K e a t i n g of the D e p a r t m e n t of B i o c h e m i s t r y a t G l a s g o w R o y a l I n f i r m a r y (who a n a l y s e d the tee th) ; L. Boyd of the M e d i c a l S t a t i s t i c s U n i t a t E d i n b u r g h U n i v e r s i t y (who he lped w i t h the s t a t i s t i c a l ana lys i s ) ; a n d the M e d i c a l R e s e a r c h C o u n c i l a n d the S c o t t i s h H o m e a n d H e a l t h D e p a r t m e n t (who f u n d e d the s tudy) .
REFERENCES
Alvey, N.G., C.F. Banfield, et al., 1983. Genstat: A General Statistical Program. Numerical Algorithms Group, Oxford.
Clegg, D.E., I.W. Eddington, et al., 1984. Lead levels in deciduous teeth of Queensland children. Med. J. Aust., 141: 59{~593.
Cook, R.D. and S. Weisberg, 1982. Residuals and Influence in Regression. Chapman and Hall, London.
Delves, H.T., B.E. Clayton et al., 1982. An appraisal of the analytical significance of tooth-lead measurements as possible indices of environmental exposure of children to lead. Ann. Clin. Biochem., 19: 329-337.
Draper, N.R. and H. Smith, 1981. Applied Regression Analysis John Wiley, Chichester, 2nd edn. Ewers, U., A. Brockhaus, 1982. Lead in deciduous teeth of children living in a non-ferrous smelter
area of a rural area of the FRG. Int. Arch. Occup. Env. Health, 50:132 151. Fergusson, J.E. and N.G. Purchase, 1987. The analysis and levels of lead in human teeth: a review.
Environ. Pollut., 46:11 44. Fergusson, J.E., M.L. Jansen et al., 1980. Lead in deciduous teeth in relation to environmental lead.
Environ. Technol. Lett., 1: 376-382. Fulton, M., G. Raab, G. Thomson, D. Laxen, R. Hunter and W. Hepburn,1987. The influence of blood
lead on children's abilities and attainment in Edinburgh. Lancet, 1:1221 1226. Grandjean, P., O.N. Hansen et al., 1984. Analysis of lead in circumpulpal dentine of deciduous
teeth. Ann. Clin. Lab. Sci, 14: 27~275. Grandjean, P., T. Lyngbe et al., 1986. Lead concentrations in deciduous teeth: variation related to
tooth type and analytical technique. J. Toxicol. Environ. Health, 19: 437445. Habercam, J.W., J.E. Keil et al., 1974. Lead content of human blood, hair, and deciduous teeth:
correlation with environmental factors and growth. J. Dent. Res., 53:1160 1163. Holt, D, and T.M.F. Smith, 1979. Post Stratification. J. R. Statist. Soc., A, 142:33 46.

233
Holt, D., T.M.F. Smith and P.D. Winter, 1980. Regression analysis of data from complex surveys. J. R. Statist. Soc., A, 143:474 487.
Keating, A.D., J.L. Keating, D.J. Halls and G.S. Fell, , 1987. Determination of lead in teeth by atomic-absorption spectrometry with electrothermal atomisation. Analyst, 112:1381 1385.
Khandekar, R.N., R. Raghunath and U.C. Mishra, 1986. Lead levels in teeth of an urban Indian population. Sci. Total. Environ. 58:231 236.
Lockeretz, W., 1975. Lead content of deciduous teeth of children in different environments. Arch. Environ. Health, 30:583 587.
Mackie, A.C., R. Stephens et al., 1977. Tooth lead levels in Birmingham children. Arch. Environ. Health, 32:178 185.
Moore, M.R., B.C. Campbell et al., 1978. The association between lead concentrations in teeth and domestic water lead concentrations. Clin. Chim. Acta., 87:77 83.
Needleman, H.L., C. Gunnoe et al. 1979. Deficits in psychologic and classroom performance of children with elevated dentine lead levels. N. Eng. J. Med., 300: 689~695.
Oshio, H., 1973. The cadmium, zinc and lead content of deciduous teeth from two different geo- graphical areas of Japan. J. Dent. Health, Tokyo, 23: 20~222.
Pinchin, M.J., J. Newham and R.P.J. Thompson, 1978. Lead, copper, and cadmium in teeth of normal and mentally retarded children. Clin. Chim. Acta, 85: 89-94.
Raab, G., M. Fulton, D.P.H Laxen and G.O.B. Thompson, 1985. The Edinburgh lead study: aspects of design and progress. Statistician, 34:45 57.
Raab, G., D.P.H. Laxen and M. Fulton, 1987. Lead from dust and water as exposure sources for children. Environ. Geochem. Health, 9:80 85.
Shapiro, I.M., A. Burke et al., 1978. X-ray fluorescence analysis of lead in teeth of urban children in situ: correlation between the tooth lead level and the concentration of blood lead and free erythroporphyrins. Environ. Res., 17: 4~52.
Smith, M., T. Delves et al., 1983. The effects of lead exposure on urban children: the institute of child health/Southampton study. Dev. Med. Neurol., 25, Suppl 47.
Stephens, R. and H.A. Waldron, 1976. Body burdens of lead in Birmingham. R. Soc. Health. J., 96: 17¢~180.
Stewart, D.J., 1974. Teeth as indicators of exposure of children to lead. Arch. Dis. Child., 49: 895 897.
Winneke, G., U. Kramer et al., 1983. Neuropsychological studies in children with elevated tooth- lead concentrations. Int. Arch. Occup. Environ. Health, 51:231 252.