factors affecting soil organic matter conservation in mediterranean hillside winter cereals-legumes...
TRANSCRIPT
[Italian Journal of Agronomy 2012; 7:e38] [page 283]
Factors affecting soil organic matter conservation in Mediterranean hillsidewinter cereals-legumes cropping systemsElisa Marraccini,1,2 Marta Debolini,1 Claudia Di Bene,1 Hélène Rapey,3 Enrico Bonari11Land Lab, Istituto di Scienze della Vita, Scuola Superiore Sant’Anna, Pisa, Italy; 2INRA, UMR 1273 Métafort, Centre Inra de Theix, Saint Genes Champanelle, France; 3IRSTEA, UMR 1273 Métafort, Aubière, France
Abstract
Soil conservation is an important issue for farming and environ-mental protection in Mediterranean areas. Hillside farming systems,based on winter cereals and legumes, are common in these areas andare the target of several environmental policies. Soil organic matter(SOM) is widely used to assess the environmental performance ofthese cropping systems. Nevertheless, few studies have consideredsoil conservation practices in hillside systems in terms of implement-ing more effective agro-environmental policies for these areas. Thispaper compares the SOM conservation of different winter cereal basedcropping systems within Mediterranean hillside crops/livestock farms.Seventeen cropping systems were characterised by on-farm surveys inthe inland hilly area of Grosseto (Tuscany, Italy). For each croppingsystem, we performed a SOM balance, based on Hénin-Dupuis’ equa-tion, using either local environmental databases or data from on-farmsurveys. Differences between cropping systems were analysed by theKruskal-Wallis test. On average, the cropping systems identified didnot guarantee SOM conservation and varied considerably from farm tofarm, however, some practices seemed to have a positive performance,e.g. cropping systems of cattle farms. According to the literature, annu-
al SOM balance differs significantly depending on crop rotation lengthand longer crop rotations performed better than shorter ones.However, we found a local effect indicating that this better perform-ance was influenced by local farmers' cooperatives, which to someextent counteracted the negative effect of crop rotation length. Therewere significant differences in the performance of dairy sheep and cat-tle farms (-1031 kg ha–1 yr–1 vs +103 kg ha–1 yr–1, respectively). Thissuggests that the presence of livestock did not have the same favorableeffect on soil conservation in Mediterranean systems and that this fac-tor should be more investigated. Surprisingly, in our sample, for thesame crop rotation length, livestock density did not affect the annualSOM balance. Due to the high variability in local cropping systems andsoil characteristics, further surveys on a larger farm sample and fieldsoil measurement are needed to confirm these trends and validatedthe regional soil database. However, our results shed light on the soilconservation effects of Mediterranean hillside cropping systems ofwinter cereals and legumes, and could support the local implementa-tion of agro-environmental measures.
Introduction
European landscapes are mainly agricultural. According to Eurostat(2010), agricultural land occupies around 40% of the total area, andthe main agricultural system is based on winter cereals, covering 28%of the land. Over the last few decades, these systems have been great-ly transformed due to: i) the abandonment and marginalisation of agri-cultural land, previously sustained by traditional farming practices(Caraveli, 2000; Dunjó, 2003; Rounsevell et al., 2006); ii) the extensi-fication of land uses in less favourable areas (Bindi and Olesen, 2011;Rounsevell et al., 2006); and iii) the intensification of agriculturalactivities in lowlands and more productive areas (Serra et al., 2008). In most cases these changes simplify agricultural production. In the
case of the hilly Mediterranean areas, these variations have caused atransition from polycultural systems to rotation mainly based on rain-fed autumn-winter cereals (MIPAAF, 2010). These dynamics have hadan important environmental impact in areas that are highly vulnerableto climate change (Bindi and Olesen, 2011), because of steep slopesalong with a generally low content of soil organic matter (SOM). Theseproductive and environmental dynamics can influence soil functions,both in natural and managed ecosystems, which support plant and ani-mal productivity, maintain air and water quality as well as humanhealth and housing (Sombroek and Sims, 1995; Karlen et al., 1997;Pagliai, 2009). The impact of agricultural land transformation on soilfunctions affects: biodiversity, the hydrological cycle balance, runoffand sediment yields, soil properties (Bertora et al., 2009; Schulp andVerburg, 2009; Bindi and Olesen 2011; Di Bene et al., 2011), and par-
Correspondence: Marta Debolini, Land Lab, Istituto di Scienze della Vita,Scuola Superiore Sant'Anna, P.zza Martiri della Libertà 33, 56127 Pisa, Italy.Tel. +39.050.883504 - Fax: +39.050.883526. E-mail: [email protected]
Key words: agro-environmental indicators, cropping systems, on-farm sur-veys, soil conservation, soil organic matter balance.
Contributions: EM and MD contributed equally to this work.
Acknowledgments: EM's and MD's fieldwork was financed by a grant fromthe Scuola Superiore Sant’Anna (Pisa, Italy). The authors would like toacknowledge Mariassunta Galli for useful discussions and CristianoTozzini for help in interpreting the soil map.
Received for publication: 23 March 2012.Accepted for publication: 18 May 2012.
©Copyright E. Marraccini et al., 2012Licensee PAGEPress, ItalyItalian Journal of Agronomy 2012; 7:38doi:10.4081/ija.2012.e38
This article is distributed under the terms of the Creative CommonsAttribution Noncommercial License (by-nc 3.0) which permits any noncom-mercial use, distribution, and reproduction in any medium, provided the orig-inal author(s) and source are credited.
Italian Journal of Agronomy 2012; volume 7:e38
Non-co
mmercial
use o
nly
[page 284] [Italian Journal of Agronomy 2012; 7:e38]
ticularly the soil organic matter (SOM) conservation (Thord Karlssonet al., 2003; Sleutel et al., 2006; Grignani et al., 2007). The SOM bal-ance, under different management strategies, is considered as one ofthe most widely accepted indicators of environmental sustainability ofcropping and farming systems (Bockstaller et al., 1997; Silvestri et al.,2002; Castoldi and Bechini, 2006), since SOM and the carbon cycleinfluence the main properties and functions of soil (Holland, 2004;Pagliai, 2009; Mazzoncini et al., 2010). The issue of SOM conservation is particularly relevant in
Mediterranean areas, where agricultural soils risk progressive degra-dation and desertification, loss of organic matter and an undesirabledecrease in fertility (Kirkby et al., 2003; Di Bene et al., 2011; Farina etal., 2011). This is a consequence of climatic conditions (high evapo-transpiration rates, low/erratic rainfall, and intensive summerdroughts), soil characteristics, and agricultural practices (traditionalplough-based intensive crop production systems) (Mazzoncini et al.,2008; Alvaro-Fuentes and Paustian, 2011). In the 1990s the European Union (EU) developed a series of econom-
ic measures to improve and stimulate best practices to guarantee soilconservation in agriculture. With the adoption of the CommonAgricultural Policy (CAP) reform in 2003 (European Commission, 2003),these measures introduced the cross compliance Standards of GoodAgricultural and Environmental Conditions (GAECs) (Angilieri et al.,2011). The CAP reform has been implemented in the Member Statessince 2005, and in Italy it was put into effect in 2006 (DM 12541/2006),listing the standard GAECs (Bazzoffi and Zaccarini Bonelli, 2011). Oneof the main EU objectives to preserve soil quality is by maintaining ahigh level of SOM. However, only a few studies have analysed and provedthe effectiveness of these measures, especially in hilly and marginalagricultural systems, characterised by poorer crops (Agnoletti et al.,2011; Borrelli et al., 2011). In these areas, the studies available weremainly made in the late 1990s (Bonari et al. 1999; De Falco et al., 2000),while recent ones have focused on more intensive or specialised systems(Farina et al., 2011; Fumagalli et al., 2011). Moreover, most of these stud-ies were made at experimental sites, fields or farms, whereas there hasbeen a lack of research at more wide-ranging levels (e.g. local croppingand farming systems). Our aim was therefore to compare the SOM con-servation of different cropping systems that are representative of themain agricultural systems of Mediterranean winter hillside crops/live-stock farms. We assessed the SOM balance, based on Hénin-Dupuis’equation, of local cropping systems in order to understand factors influ-encing SOM conservation for implementing the post 2013 agro-environ-mental policies at a local level.
Materials and methods
Study areaThe study area was the inland hilly area located in the Grosseto
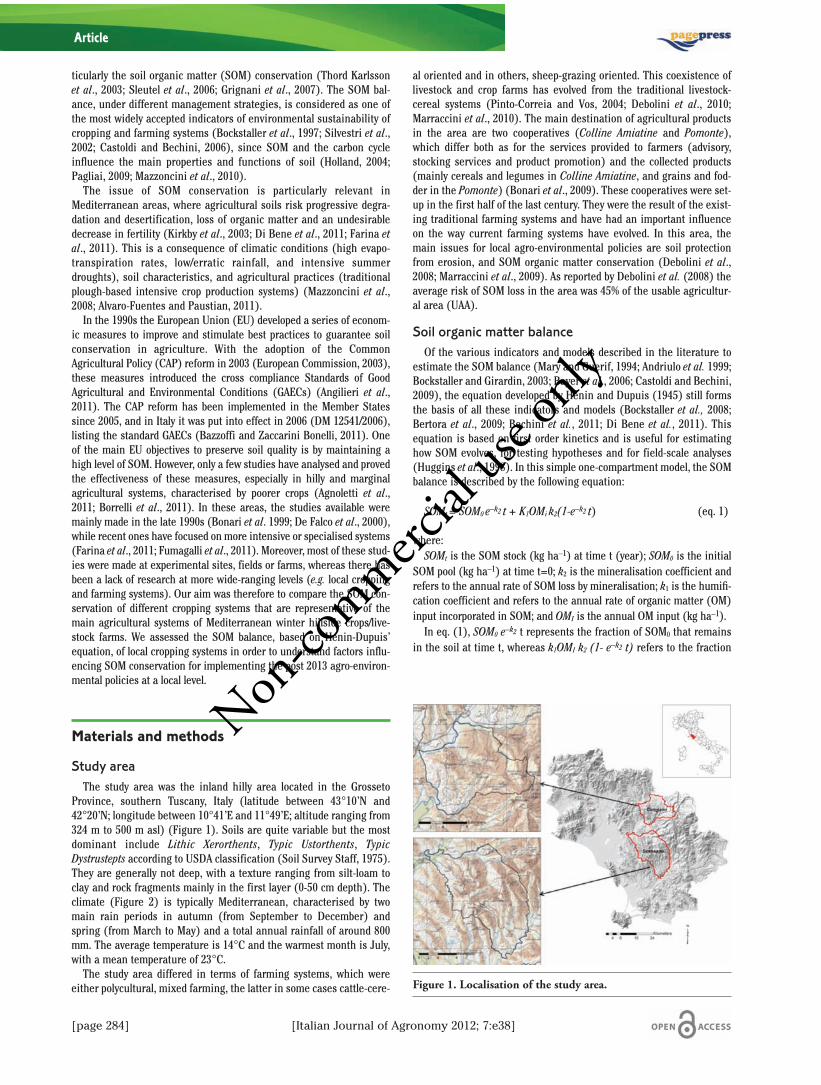
Province, southern Tuscany, Italy (latitude between 43°10’N and42°20’N; longitude between 10°41’E and 11°49’E; altitude ranging from324 m to 500 m asl) (Figure 1). Soils are quite variable but the mostdominant include Lithic Xerorthents, Typic Ustorthents, TypicDystrustepts according to USDA classification (Soil Survey Staff, 1975).They are generally not deep, with a texture ranging from silt-loam toclay and rock fragments mainly in the first layer (0-50 cm depth). Theclimate (Figure 2) is typically Mediterranean, characterised by twomain rain periods in autumn (from September to December) andspring (from March to May) and a total annual rainfall of around 800mm. The average temperature is 14°C and the warmest month is July,with a mean temperature of 23°C.The study area differed in terms of farming systems, which were
either polycultural, mixed farming, the latter in some cases cattle-cere-
al oriented and in others, sheep-grazing oriented. This coexistence oflivestock and crop farms has evolved from the traditional livestock-cereal systems (Pinto-Correia and Vos, 2004; Debolini et al., 2010;Marraccini et al., 2010). The main destination of agricultural productsin the area are two cooperatives (Colline Amiatine and Pomonte),which differ both as for the services provided to farmers (advisory,stocking services and product promotion) and the collected products(mainly cereals and legumes in Colline Amiatine, and grains and fod-der in the Pomonte) (Bonari et al., 2009). These cooperatives were set-up in the first half of the last century. They were the result of the exist-ing traditional farming systems and have had an important influenceon the way current farming systems have evolved. In this area, themain issues for local agro-environmental policies are soil protectionfrom erosion, and SOM organic matter conservation (Debolini et al.,2008; Marraccini et al., 2009). As reported by Debolini et al. (2008) theaverage risk of SOM loss in the area was 45% of the usable agricultur-al area (UAA).
Soil organic matter balanceOf the various indicators and models described in the literature to
estimate the SOM balance (Mary and Guerif, 1994; Andriulo et al. 1999;Bockstaller and Girardin, 2003; Bayer et al., 2006; Castoldi and Bechini,2009), the equation developed by Hénin and Dupuis (1945) still formsthe basis of all these indicators and models (Bockstaller et al., 2008;Bertora et al., 2009; Bechini et al., 2011; Di Bene et al., 2011). Thisequation is based on first order kinetics and is useful for estimatinghow SOM evolves, for testing hypotheses and for field-scale analyses(Huggins et al., 1998). In this simple one-compartment model, the SOMbalance is described by the following equation:
SOMt = SOM0 e–k2 t + K1OMi k2(1-e–k2 t) (eq. 1)
where:SOMt is the SOM stock (kg ha–1) at time t (year); SOM0 is the initial
SOM pool (kg ha–1) at time t=0; k2 is the mineralisation coefficient andrefers to the annual rate of SOM loss by mineralisation; k1 is the humifi-cation coefficient and refers to the annual rate of organic matter (OM)input incorporated in SOM; and OMI is the annual OM input (kg ha–1).In eq. (1), SOM0 e–k2 t represents the fraction of SOM0 that remains
in the soil at time t, whereas k1OMI k2 (1- e–k2 t) refers to the fraction
Article
Figure 1. Localisation of the study area.
Non-co
mmercial
use o
nly
of the SOM stock derived from the humification of organic matter inputwhere t=0. SOM stock was calculated as:
SOMstock = (SOMcDbpA)/100 (eq. 2)
where:SOMc is the soil organic matter concentration (%); Db is the soil bulkdensity (g cm–3) calculated with the equation proposed by Saxton et al.(1986); p is the soil depth (0.40 m), and A is the area being considered(1 ha=10,000 m2).The OM inputs (OMI) were: crop residues, below-ground biomass
and manure or green manure. For each of these inputs, we considereda specific k1 according to Boffin et al. (1986) and Mary and Guerif(1994) (Table 1). The mineralisation coefficient (k2) is affected by climatic conditions
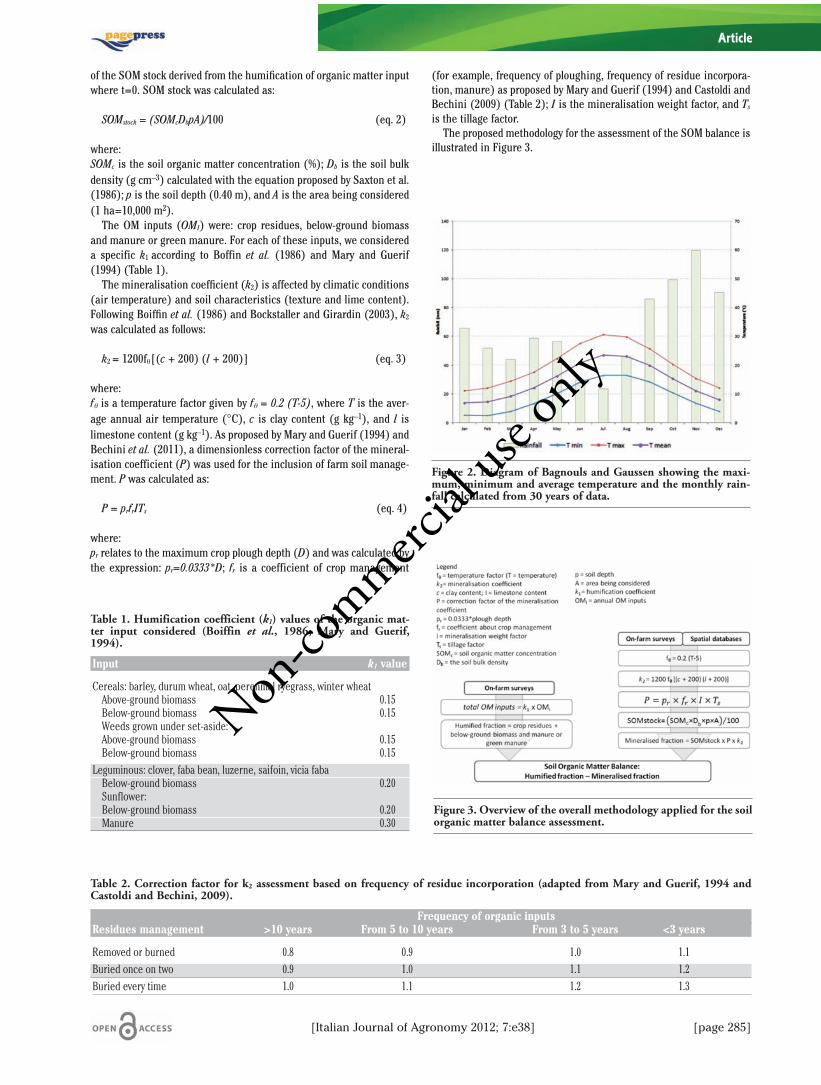
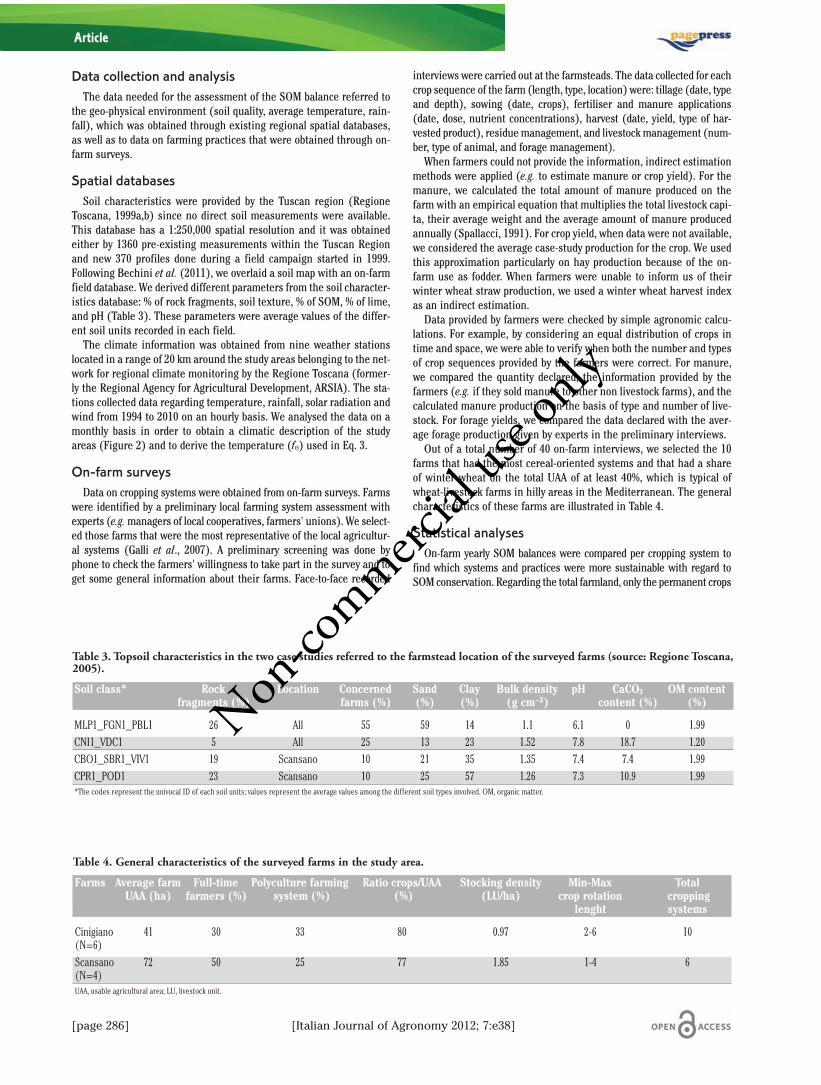
(air temperature) and soil characteristics (texture and lime content).Following Boiffin et al. (1986) and Bockstaller and Girardin (2003), k2was calculated as follows:
k2 = 1200fθ[(c + 200) (l + 200)] (eq. 3)
where:fθ is a temperature factor given by fθ = 0.2 (T-5), where T is the aver-age annual air temperature (°C), c is clay content (g kg–1), and l islimestone content (g kg–1). As proposed by Mary and Guerif (1994) andBechini et al. (2011), a dimensionless correction factor of the mineral-isation coefficient (P) was used for the inclusion of farm soil manage-ment. P was calculated as:
P = prfrITs (eq. 4)
where:pr relates to the maximum crop plough depth (D) and was calculated bythe expression: pr=0.0333*D; fr is a coefficient of crop management
(for example, frequency of ploughing, frequency of residue incorpora-tion, manure) as proposed by Mary and Guerif (1994) and Castoldi andBechini (2009) (Table 2); I is the mineralisation weight factor, and Ts
is the tillage factor.The proposed methodology for the assessment of the SOM balance is
illustrated in Figure 3.
[Italian Journal of Agronomy 2012; 7:e38] [page 285]
Article
Table 2. Correction factor for k2 assessment based on frequency of residue incorporation (adapted from Mary and Guerif, 1994 andCastoldi and Bechini, 2009).
Frequency of organic inputsResidues management >10 years From 5 to 10 years From 3 to 5 years <3 years
Removed or burned 0.8 0.9 1.0 1.1Buried once on two 0.9 1.0 1.1 1.2Buried every time 1.0 1.1 1.2 1.3
Table 1. Humification coefficient (k1) values of the organic mat-ter input considered (Boiffin et al., 1986; Mary and Guerif,1994).
Input k1 value
Cereals: barley, durum wheat, oat, perennial ryegrass, winter wheatAbove-ground biomass 0.15Below-ground biomass 0.15Weeds grown under set-aside:Above-ground biomass 0.15Below-ground biomass 0.15
Leguminous: clover, faba bean, luzerne, saifoin, vicia fabaBelow-ground biomass 0.20Sunflower:Below-ground biomass 0.20Manure 0.30
Figure 2. Diagram of Bagnouls and Gaussen showing the maxi-mum, minimum and average temperature and the monthly rain-fall calculated from 30 years of data.
Figure 3. Overview of the overall methodology applied for the soilorganic matter balance assessment.
Non-co
mmercial
use o
nly
[page 286] [Italian Journal of Agronomy 2012; 7:e38]
Data collection and analysisThe data needed for the assessment of the SOM balance referred to
the geo-physical environment (soil quality, average temperature, rain-fall), which was obtained through existing regional spatial databases,as well as to data on farming practices that were obtained through on-farm surveys.
Spatial databasesSoil characteristics were provided by the Tuscan region (Regione
Toscana, 1999a,b) since no direct soil measurements were available.This database has a 1:250,000 spatial resolution and it was obtainedeither by 1360 pre-existing measurements within the Tuscan Regionand new 370 profiles done during a field campaign started in 1999.Following Bechini et al. (2011), we overlaid a soil map with an on-farmfield database. We derived different parameters from the soil character-istics database: % of rock fragments, soil texture, % of SOM, % of lime,and pH (Table 3). These parameters were average values of the differ-ent soil units recorded in each field. The climate information was obtained from nine weather stations
located in a range of 20 km around the study areas belonging to the net-work for regional climate monitoring by the Regione Toscana (former-ly the Regional Agency for Agricultural Development, ARSIA). The sta-tions collected data regarding temperature, rainfall, solar radiation andwind from 1994 to 2010 on an hourly basis. We analysed the data on amonthly basis in order to obtain a climatic description of the studyareas (Figure 2) and to derive the temperature (fθ) used in Eq. 3.
On-farm surveysData on cropping systems were obtained from on-farm surveys. Farms
were identified by a preliminary local farming system assessment withexperts (e.g.managers of local cooperatives, farmers' unions). We select-ed those farms that were the most representative of the local agricultur-al systems (Galli et al., 2007). A preliminary screening was done byphone to check the farmers' willingness to take part in the survey and toget some general information about their farms. Face-to-face recorded
interviews were carried out at the farmsteads. The data collected for eachcrop sequence of the farm (length, type, location) were: tillage (date, typeand depth), sowing (date, crops), fertiliser and manure applications(date, dose, nutrient concentrations), harvest (date, yield, type of har-vested product), residue management, and livestock management (num-ber, type of animal, and forage management).When farmers could not provide the information, indirect estimation
methods were applied (e.g. to estimate manure or crop yield). For themanure, we calculated the total amount of manure produced on thefarm with an empirical equation that multiplies the total livestock capi-ta, their average weight and the average amount of manure producedannually (Spallacci, 1991). For crop yield, when data were not available,we considered the average case-study production for the crop. We usedthis approximation particularly on hay production because of the on-farm use as fodder. When farmers were unable to inform us of theirwinter wheat straw production, we used a winter wheat harvest indexas an indirect estimation.Data provided by farmers were checked by simple agronomic calcu-
lations. For example, by considering an equal distribution of crops intime and space, we were able to verify when both the number and typesof crop sequences provided by the farmers were correct. For manure,we compared the quantity declared, the information provided by thefarmers (e.g. if they sold manure to other non livestock farms), and thecalculated manure production on the basis of type and number of live-stock. For forage yields, we compared the data declared with the aver-age forage production given by experts in the preliminary interviews. Out of a total number of 40 on-farm interviews, we selected the 10
farms that had the most cereal-oriented systems and that had a shareof winter wheat on the total UAA of at least 40%, which is typical ofwheat-livestock farms in hilly areas in the Mediterranean. The generalcharacteristics of these farms are illustrated in Table 4.
Statistical analysesOn-farm yearly SOM balances were compared per cropping system to
find which systems and practices were more sustainable with regard toSOM conservation. Regarding the total farmland, only the permanent crops
Article
Table 4. General characteristics of the surveyed farms in the study area.
Farms Average farm Full-time Polyculture farming Ratio crops/UAA Stocking density Min-Max TotalUAA (ha) farmers (%) system (%) (%) (LU/ha) crop rotation cropping
lenght systems
Cinigiano 41 30 33 80 0.97 2-6 10(N=6)Scansano 72 50 25 77 1.85 1-4 6(N=4)UAA, usable agricultural area; LU, livestock unit.
Table 3. Topsoil characteristics in the two case studies referred to the farmstead location of the surveyed farms (source: Regione Toscana,2005).
Soil class* Rock Location Concerned Sand Clay Bulk density pH CaCO3 OM content fragments (%) farms (%) (%) (%) (g cm–3) content (%) (%)
MLP1_FGN1_PBL1 26 All 55 59 14 1.1 6.1 0 1.99CNI1_VDC1 5 All 25 13 23 1.52 7.8 18.7 1.20CBO1_SBR1_VIV1 19 Scansano 10 21 35 1.35 7.4 7.4 1.99CPR1_POD1 23 Scansano 10 25 57 1.26 7.3 10.9 1.99*The codes represent the univocal ID of each soil units; values represent the average values among the different soil types involved. OM, organic matter.
Non-co
mmercial
use o
nly
were excluded from the analysis, e.g. vineyards, olive groves and perma-nent grasslands representing on average around 2% of the farmland. SOMbalance results were compared using the Kruskal-Wallis test performedwith R software (R Development Core team, 2011) with different charac-teristics of cropping and farming systems. We used the non-parametricKruskal-Wallis test because the data did not have a normal distribution.The characteristics of these cropping systems were first tested individual-ly, then coupled in order to find hidden effects, for instance if the locationof farmstead had an influence alongside the farming or cropping charac-teristics. We tested farms belonging to different cooperatives (Colline ami-atine and Pomonte), thus the presence/absence of livestock on the farm,livestock density (more intensive/extensive livestock farms), types of live-stock (cattle or sheep farms), ratio of winter wheat in crop rotations, andcrop rotation length. On the basis of on-farms surveys we calculated live-stock density, which varied depending on the presence or absence of graz-ing practices. With non-grazing farms, the livestock density was consid-ered as the ratio between total livestock units and forage crop surfaces.Hence in this case, each on-farm cropping system presented the same live-stock units. With grazing farms on the other hand, livestock density wascalculated on the basis of the grazed surfaces and with reference to therelated livestock units. Hence, in grazing farms, different cropping systemscould have different livestock densities. Due to the agro-environmentalmeasures of local policies, a density of two livestock unit (LU) per hectareis the maximum acceptable for farmers when asking for EU subsidies,thus we distinguished between farms with a livestock density of more orless than two LU ha–1. For the ratio of winter wheat in each crop rotation,we considered cropping systems with less than 50% of winter wheat in theUAA, thus presenting a more diversified crop rotation, and cropping sys-tems with more than 50% in the UAA, which are usually cultivated basedon two years of continuous winter wheat. In addition, we tested differencesbetween cropping systems with a two-year crop rotation and cropping sys-tems with longer crop rotations (≥3), which generally have a higher diver-sity and/or have partly temporary grassland, usually legumes.
Results
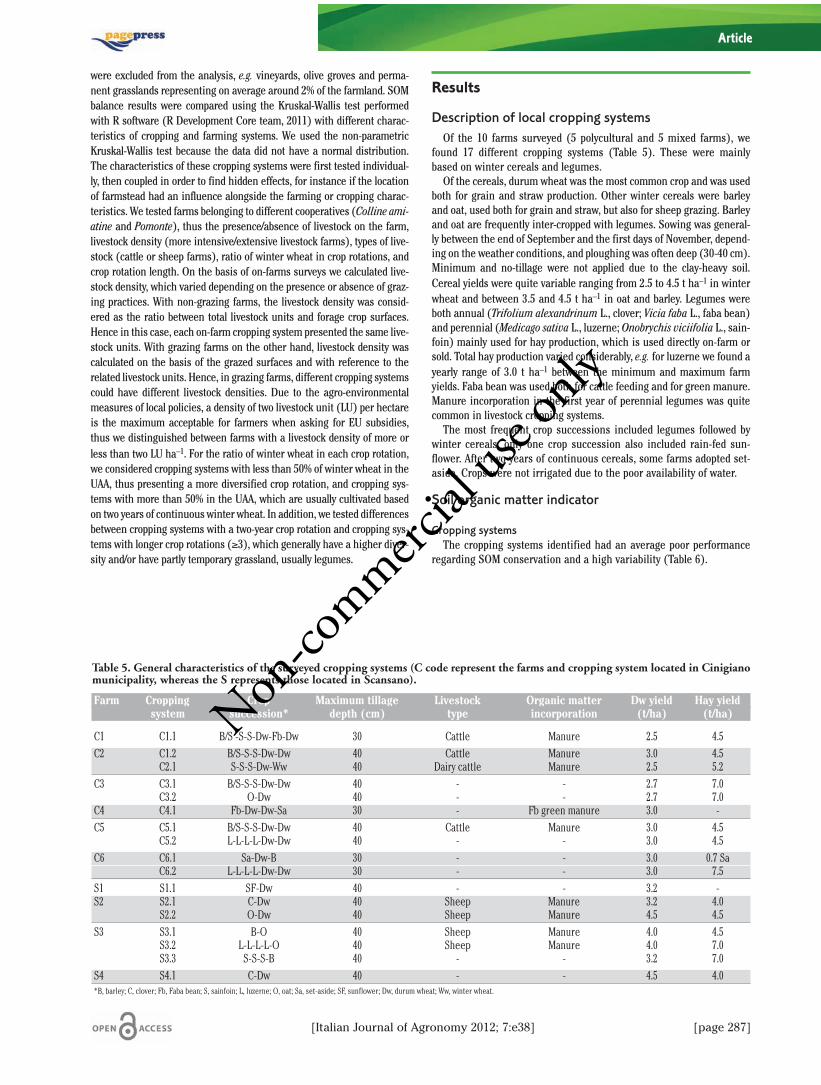
Description of local cropping systems Of the 10 farms surveyed (5 polycultural and 5 mixed farms), we
found 17 different cropping systems (Table 5). These were mainlybased on winter cereals and legumes.Of the cereals, durum wheat was the most common crop and was used
both for grain and straw production. Other winter cereals were barleyand oat, used both for grain and straw, but also for sheep grazing. Barleyand oat are frequently inter-cropped with legumes. Sowing was general-ly between the end of September and the first days of November, depend-ing on the weather conditions, and ploughing was often deep (30-40 cm).Minimum and no-tillage were not applied due to the clay-heavy soil.Cereal yields were quite variable ranging from 2.5 to 4.5 t ha–1 in winterwheat and between 3.5 and 4.5 t ha–1 in oat and barley. Legumes wereboth annual (Trifolium alexandrinum L., clover; Vicia faba L., faba bean)and perennial (Medicago sativa L., luzerne; Onobrychis viciifolia L., sain-foin) mainly used for hay production, which is used directly on-farm orsold. Total hay production varied considerably, e.g. for luzerne we found ayearly range of 3.0 t ha–1 between the minimum and maximum farmyields. Faba bean was used both for cattle feeding and for green manure.Manure incorporation in the first year of perennial legumes was quitecommon in livestock cropping systems. The most frequent crop successions included legumes followed by
winter cereals; only one crop succession also included rain-fed sun-flower. After two years of continuous cereals, some farms adopted set-aside. Crops were not irrigated due to the poor availability of water.
Soil organic matter indicator
Cropping systemsThe cropping systems identified had an average poor performance
regarding SOM conservation and a high variability (Table 6).
[Italian Journal of Agronomy 2012; 7:e38] [page 287]
Article
Table 5. General characteristics of the surveyed cropping systems (C code represent the farms and cropping system located in Cinigianomunicipality, whereas the S represents those located in Scansano).
Farm Cropping Crop Maximum tillage Livestock Organic matter Dw yield Hay yield system succession* depth (cm) type incorporation (t/ha) (t/ha)
C1 C1.1 B/S -S-S-Dw-Fb-Dw 30 Cattle Manure 2.5 4.5C2 C1.2 B/S-S-S-Dw-Dw 40 Cattle Manure 3.0 4.5
C2.1 S-S-S-Dw-Ww 40 Dairy cattle Manure 2.5 5.2C3 C3.1 B/S-S-S-Dw-Dw 40 - - 2.7 7.0
C3.2 O-Dw 40 - - 2.7 7.0C4 C4.1 Fb-Dw-Dw-Sa 30 - Fb green manure 3.0 -C5 C5.1 B/S-S-S-Dw-Dw 40 Cattle Manure 3.0 4.5
C5.2 L-L-L-L-Dw-Dw 40 - - 3.0 4.5C6 C6.1 Sa-Dw-B 30 - - 3.0 0.7 Sa
C6.2 L-L-L-L-Dw-Dw 30 - - 3.0 7.5S1 S1.1 SF-Dw 40 - - 3.2 -S2 S2.1 C-Dw 40 Sheep Manure 3.2 4.0
S2.2 O-Dw 40 Sheep Manure 4.5 4.5S3 S3.1 B-O 40 Sheep Manure 4.0 4.5
S3.2 L-L-L-L-O 40 Sheep Manure 4.0 7.0S3.3 S-S-S-B 40 - - 3.2 7.0
S4 S4.1 C-Dw 40 - - 4.5 4.0*B, barley; C, clover; Fb, Faba bean; S, sainfoin; L, luzerne; O, oat; Sa, set-aside; SF, sunflower; Dw, durum wheat; Ww, winter wheat.
Non-co
mmercial
use o
nly
[page 288] [Italian Journal of Agronomy 2012; 7:e38]
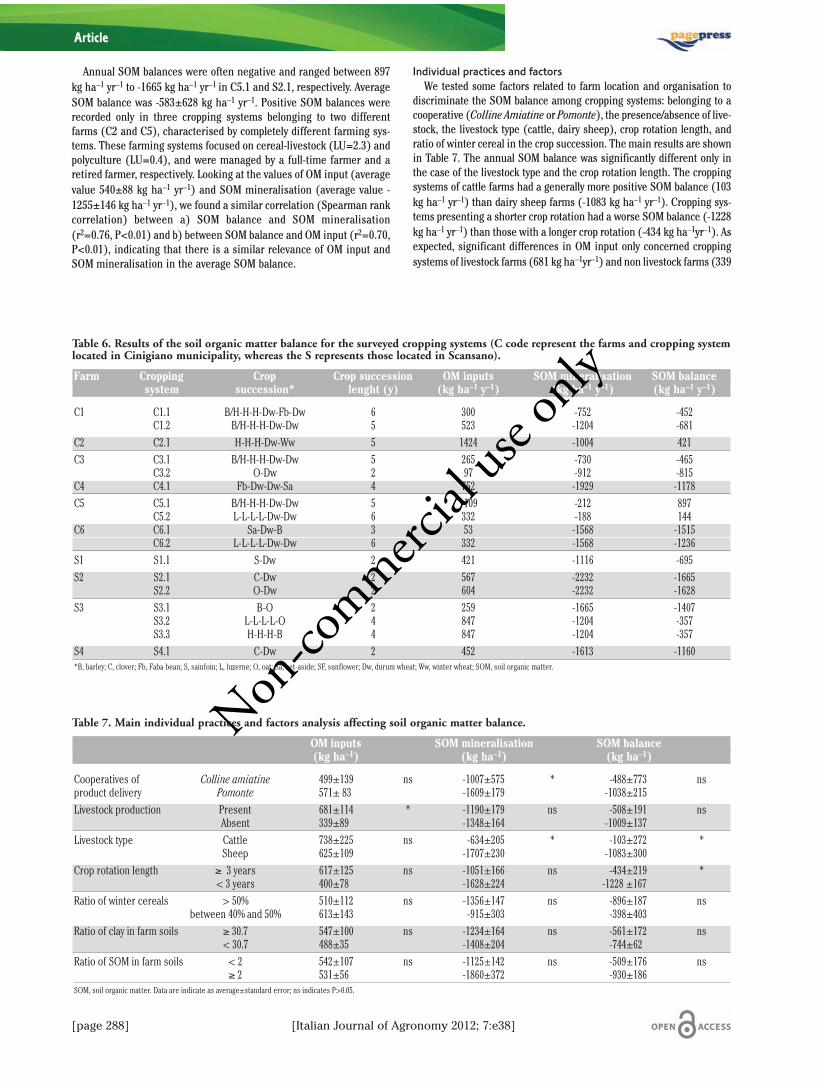
Annual SOM balances were often negative and ranged between 897kg ha–1 yr–1 to -1665 kg ha–1 yr–1 in C5.1 and S2.1, respectively. AverageSOM balance was -583±628 kg ha–1 yr–1. Positive SOM balances wererecorded only in three cropping systems belonging to two differentfarms (C2 and C5), characterised by completely different farming sys-tems. These farming systems focused on cereal-livestock (LU=2.3) andpolyculture (LU=0.4), and were managed by a full-time farmer and aretired farmer, respectively. Looking at the values of OM input (averagevalue 540±88 kg ha–1 yr–1) and SOM mineralisation (average value -1255±146 kg ha–1 yr–1), we found a similar correlation (Spearman rankcorrelation) between a) SOM balance and SOM mineralisation(r2=0.76, P<0.01) and b) between SOM balance and OM input (r2=0.70,P<0.01), indicating that there is a similar relevance of OM input andSOM mineralisation in the average SOM balance.
Individual practices and factorsWe tested some factors related to farm location and organisation to
discriminate the SOM balance among cropping systems: belonging to acooperative (Colline Amiatine or Pomonte), the presence/absence of live-stock, the livestock type (cattle, dairy sheep), crop rotation length, andratio of winter cereal in the crop succession. The main results are shownin Table 7. The annual SOM balance was significantly different only inthe case of the livestock type and the crop rotation length. The croppingsystems of cattle farms had a generally more positive SOM balance (103kg ha–1 yr–1) than dairy sheep farms (-1083 kg ha–1 yr–1). Cropping sys-tems presenting a shorter crop rotation had a worse SOM balance (-1228kg ha–1 yr–1) than those with a longer crop rotation (-434 kg ha–1yr–1). Asexpected, significant differences in OM input only concerned croppingsystems of livestock farms (681 kg ha–1yr–1) and non livestock farms (339
Article
Table 6. Results of the soil organic matter balance for the surveyed cropping systems (C code represent the farms and cropping systemlocated in Cinigiano municipality, whereas the S represents those located in Scansano).
Farm Cropping Crop Crop succession OM inputs SOM mineralisation SOM balance system succession* lenght (y) (kg ha–1 y–1) (kg ha–1 y–1) (kg ha–1 y–1)
C1 C1.1 B/H-H-H-Dw-Fb-Dw 6 300 -752 -452C1.2 B/H-H-H-Dw-Dw 5 523 -1204 -681
C2 C2.1 H-H-H-Dw-Ww 5 1424 -1004 421C3 C3.1 B/H-H-H-Dw-Dw 5 265 -730 -465
C3.2 O-Dw 2 97 -912 -815C4 C4.1 Fb-Dw-Dw-Sa 4 752 -1929 -1178C5 C5.1 B/H-H-H-Dw-Dw 5 1109 -212 897
C5.2 L-L-L-L-Dw-Dw 6 332 -188 144C6 C6.1 Sa-Dw-B 3 53 -1568 -1515
C6.2 L-L-L-L-Dw-Dw 6 332 -1568 -1236S1 S1.1 S-Dw 2 421 -1116 -695S2 S2.1 C-Dw 2 567 -2232 -1665
S2.2 O-Dw 2 604 -2232 -1628S3 S3.1 B-O 2 259 -1665 -1407
S3.2 L-L-L-L-O 4 847 -1204 -357S3.3 H-H-H-B 4 847 -1204 -357
S4 S4.1 C-Dw 2 452 -1613 -1160*B, barley; C, clover; Fb, Faba bean; S, sainfoin; L, luzerne; O, oat; Sa, set-aside; SF, sunflower; Dw, durum wheat; Ww, winter wheat; SOM, soil organic matter.
Table 7. Main individual practices and factors analysis affecting soil organic matter balance.
OM inputs SOM mineralisation SOM balance(kg ha–1) (kg ha–1) (kg ha–1)
Cooperatives of Colline amiatine 499±139 ns -1007±575 * -488±773 nsproduct delivery Pomonte 571± 83 -1609±179 -1038±215Livestock production Present 681±114 * -1190±179 ns -508±191 ns
Absent 339±89 -1348±164 -1009±137Livestock type Cattle 738±225 ns -634±205 * -103±272 *
Sheep 625±109 -1707±230 -1083±300Crop rotation length ≥ 3 years 617±125 ns -1051±166 ns -434±219 *
< 3 years 400±78 -1628±224 -1228 ±167Ratio of winter cereals > 50% 510±112 ns -1356±147 ns -896±187 ns
between 40% and 50% 613±143 -915±303 -398±403Ratio of clay in farm soils ≥ 30.7 547±100 ns -1234±164 ns -561±172 ns
< 30.7 488±35 -1408±204 -744±62Ratio of SOM in farm soils < 2 542±107 ns -1125±142 ns -509±176 ns
≥ 2 531±56 -1860±372 -930±186SOM, soil organic matter. Data are indicate as average±standard error; ns indicates P>0.05.
Non-co
mmercial
use o
nly
kg ha–1y–1) because all livestock farms used manure as a fertiliser,whereas non-livestock farms used poor organic matter (Table 5). SOMmineralisation differed significantly in terms of location. In fact, it washigher in farms belonging to the Pomonte cooperative (-1609±179 kgha–1 yr–1) than the Colline Amiatine cooperative (-1007±182 kg ha–1yr–1)and also in livestock type: it was higher for cattle farms (-714±173 kgha–1yr–1) than for dairy sheep farms (-1707±230 kg ha–1yr–1).
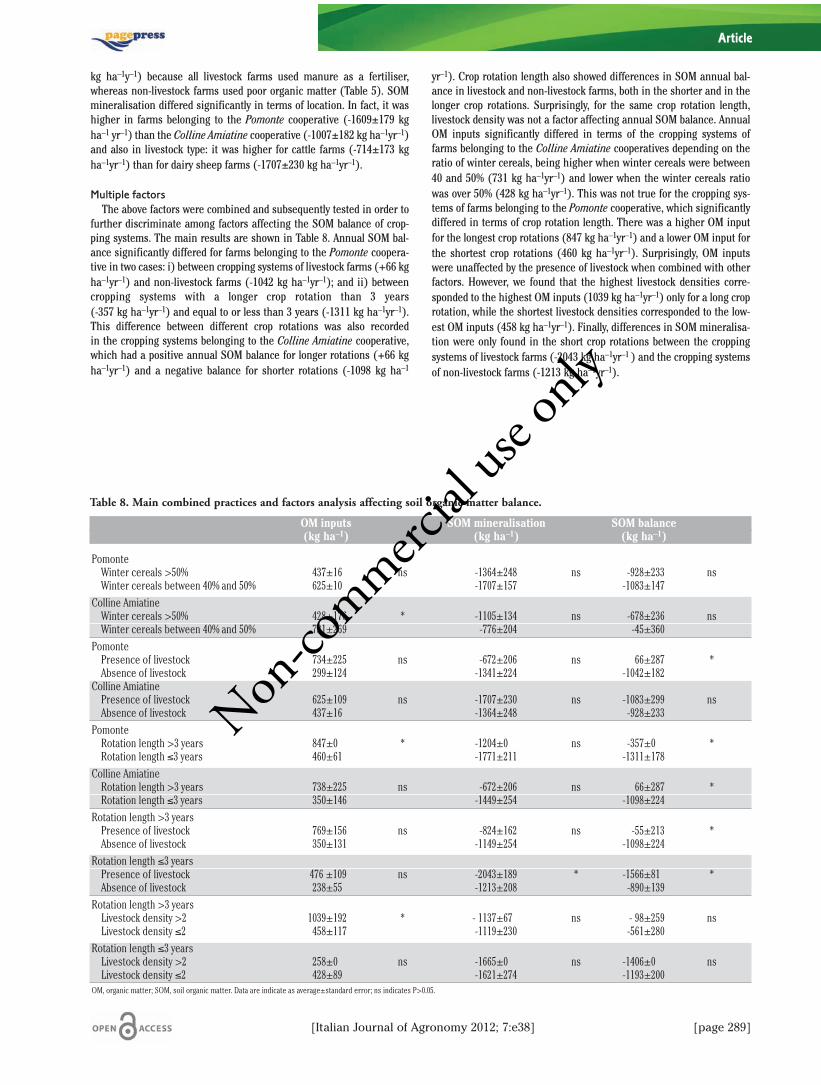
Multiple factorsThe above factors were combined and subsequently tested in order to
further discriminate among factors affecting the SOM balance of crop-ping systems. The main results are shown in Table 8. Annual SOM bal-ance significantly differed for farms belonging to the Pomonte coopera-tive in two cases: i) between cropping systems of livestock farms (+66 kgha–1yr–1) and non-livestock farms (-1042 kg ha–1yr–1); and ii) betweencropping systems with a longer crop rotation than 3 years (-357 kg ha–1yr–1) and equal to or less than 3 years (-1311 kg ha–1yr–1).This difference between different crop rotations was also recorded in the cropping systems belonging to the Colline Amiatine cooperative,which had a positive annual SOM balance for longer rotations (+66 kgha–1yr–1) and a negative balance for shorter rotations (-1098 kg ha–1
yr–1). Crop rotation length also showed differences in SOM annual bal-ance in livestock and non-livestock farms, both in the shorter and in thelonger crop rotations. Surprisingly, for the same crop rotation length,livestock density was not a factor affecting annual SOM balance. AnnualOM inputs significantly differed in terms of the cropping systems offarms belonging to the Colline Amiatine cooperatives depending on theratio of winter cereals, being higher when winter cereals were between40 and 50% (731 kg ha–1yr–1) and lower when the winter cereals ratiowas over 50% (428 kg ha–1yr–1). This was not true for the cropping sys-tems of farms belonging to the Pomonte cooperative, which significantlydiffered in terms of crop rotation length. There was a higher OM inputfor the longest crop rotations (847 kg ha–1yr–1) and a lower OM input forthe shortest crop rotations (460 kg ha–1yr–1). Surprisingly, OM inputswere unaffected by the presence of livestock when combined with otherfactors. However, we found that the highest livestock densities corre-sponded to the highest OM inputs (1039 kg ha–1yr–1) only for a long croprotation, while the shortest livestock densities corresponded to the low-est OM inputs (458 kg ha–1yr–1). Finally, differences in SOM mineralisa-tion were only found in the short crop rotations between the croppingsystems of livestock farms (-2043 kg ha–1yr–1 ) and the cropping systemsof non-livestock farms (-1213 kg ha–1yr–1).
[Italian Journal of Agronomy 2012; 7:e38] [page 289]
Article
Table 8. Main combined practices and factors analysis affecting soil organic matter balance.
OM inputs SOM mineralisation SOM balance(kg ha–1) (kg ha–1) (kg ha–1)
PomonteWinter cereals >50% 437±16 ns -1364±248 ns -928±233 nsWinter cereals between 40% and 50% 625±10 -1707±157 -1083±147
Colline AmiatineWinter cereals >50% 428±176 * -1105±134 ns -678±236 nsWinter cereals between 40% and 50% 731±269 -776±204 -45±360
PomontePresence of livestock 734±225 ns -672±206 ns 66±287 *Absence of livestock 299±124 -1341±224 -1042±182
Colline AmiatinePresence of livestock 625±109 ns -1707±230 ns -1083±299 nsAbsence of livestock 437±16 -1364±248 -928±233
PomonteRotation length >3 years 847±0 * -1204±0 ns -357±0 *Rotation length ≤3 years 460±61 -1771±211 -1311±178
Colline Amiatine Rotation length >3 years 738±225 ns -672±206 ns 66±287 *Rotation length ≤3 years 350±146 -1449±254 -1098±224
Rotation length >3 yearsPresence of livestock 769±156 ns -824±162 ns -55±213 *Absence of livestock 350±131 -1149±254 -1098±224
Rotation length ≤3 yearsPresence of livestock 476 ±109 ns -2043±189 * -1566±81 *Absence of livestock 238±55 -1213±208 -890±139
Rotation length >3 yearsLivestock density >2 1039±192 * - 1137±67 ns - 98±259 nsLivestock density ≤2 458±117 -1119±230 -561±280
Rotation length ≤3 yearsLivestock density >2 258±0 ns -1665±0 ns -1406±0 nsLivestock density ≤2 428±89 -1621±274 -1193±200
OM, organic matter; SOM, soil organic matter. Data are indicate as average±standard error; ns indicates P>0.05.
Non-co
mmercial
use o
nly
[page 290] [Italian Journal of Agronomy 2012; 7:e38]
Discussion
Data analysisThe cropping systems showed a significant difference in terms of the
SOM balance due to the livestock type and crop rotation length. In cat-tle breeding farms, there was an increase in SOM content, whereas insheep farms, the balance was negative. This trend is also observed byBechini et al. (2011) and Morari et al. (2006). This may be due to thedifferent management and agricultural practices of the two farmingsystems. In fact, the differences between the OM inputs were not sig-nificant, whereas the SOM mineralisation was significantly differentand was caused by geo-physical factors and by management practicessuch as tillage and tillage depth. In addition, in our cattle-breedingfarm, rotations were usually longer than in sheep breeding farms,where the main rotation type was based on continuous winter cerealsassociated or not with one-year clover. In line with West and Post(2002) and Nardi et al. (2004), the incorporation of crop residues didnot seem to have a relevant effect on the SOM balance. Here, the onlycase when the OM inputs were significantly different was when wecompared farms with or without livestock. This suggests that the onlyrelevant input of OM was due to the manure incorporation into the soil,which has been widely observed in the literature (e.g. Boiffin et al.,1986; Accademia Nazionale di Agricoltura, 1991; Castoldi and Bechini,2006). When we compared combined factors, with or without livestock,we found significant differences in terms of SOM balance both forshort- and long-rotations. With long-rotations, the presence of livestockpositively influenced the SOM balance, whereas for short-rotationslivestock exerted a negative impact. This unexpected result can beexplained by the fact that short-rotations were characterised by anannual tillage that did not allow for the real beneficial effect of themanure in the soil, and led to a more rapid mineralisation of labile OMfractions. The positive effect of tillage reduction coupled with a long-rotation was observed also by Morari et al. (2006), who found in a long-term experiment comparing different crop rotations and organic fertil-isation, that the SOM balance was positive only in permanent grasslandand complex rotations or with the use of large quantities of livestockmanure. Another unexpected result was that OM input was not affect-ed by the presence of livestock when combined with other factors. Theexplanation may be in the nature of our case study, where also in thelivestock farms, the main agricultural systems were based on rain-fedannual cereal crops. Therefore, the input on OM was also low in thepresence of manure and there was a high level of OM losses due to hightillage levels. These results are in agreement with Zdruli et al. (2004)and Farina et al. (2011). In our study, the only two cases with a positiveSOM balance were in the Pomonte farms with the presence of livestockand in the Colline Amiatine area when the rotation was longer thanthree-years. Because we ruled out any effects due to the different envi-ronmental conditions (e.g. slope, SOM content, clay content), thiswould seem to confirm that the management and the tillage intensitystrongly influenced SOM dynamics. In fact, the most important factorsinfluencing SOM dynamics were soil management and crop rotation, asreported by Farina et al. (2011). West and Post (2002) also found thaton average the conversion from deep tillage to conservation tillage(minimum tillage and no-tillage) implied a carbon sequestration of0.57 t C ha–1 yr–1.
Farm data variabilityWe observed an important on-farm and off-farm data variability,
which was quite surprising given the different cropping systems butsimilar farming systems (polyculture, mixed farming-systems). Thisvariability was influenced by farming practices, e.g. OM inputs werequite different (coefficient of variation equal to 0.67 over the total data,
ranging from 0.59 to 0.67 in polyculture and in mixed farming systems,respectively) and by environmental characteristics (e.g. organic mattercontent, data not shown). However, the variability derived from themeasured data (e.g. OM content in manure, OM% in soil) could also behigher since we worked on declared or estimated data. In the literature we found comparable values of farm data variabili-
ties. For example, Bockstaller et al., (1997) calculated the organic mat-ter indicator on 13 farms (no indication of their type or their locationexcept that they were in France and Germany) obtaining values rang-ing from min 3.5; max 9.5 on an indicator threshold ranging from 0 to10. Fumagalli et al. (2011) also reported that soil organic carbon with-in different clusters ranged between 0.9% and 3.5%, with a maximumstandard deviation for clusters of 3.9%. The average value was 1.7%(1.7 standard deviation). Manure applications ranged between 0 and256 kg N ha–1 depending on the farm monitored. The soil surface nitro-gen indicator between the surveyed farms had an average value of 132kg N ha–1 and a standard deviation of 104, with minimum values incereal and industrial crop oriented farms (27 kg ha–1), and maximumvalues in cereal farms with the use of digested manure (339 kg ha–1).When working in real on-farm conditions it is possible to highlight
the differences both in geographical conditions and farm management,unlike in agronomic trials (Grignani et al., 2007; Bertora et al., 2009)where the plot differences were completely controlled and dependedonly on the variability of environmental conditions if they were locatedin different sites. This variability should be taken into account whenworking in real world conditions and can majorly affect the researchresults. Since it is really difficult to be exhaustive with local farms (e.g.different types of farms and farmer types, lack of data), the choice ofthe sample is of crucial importance. Recommendations based on a fewfarm samples should be avoided. In this case study, the small size of thesample (ten farms, seventeen cropping systems) was compensated forby the similar orientation of the farms and the concentration on twodifferent locations already known to present a similar farming systemand similar environmental conditions (Galli et al., 2007; Bonari et al.,2009). To overcome the small size of the sample, a new calculation willbe performed on an enlarged sample (40 cropping systems), alsoincluding farms with a share of winter cereals lower than 40%.Although we do not expect a significant improvement in terms of on-farm and off-farm variability, it will help to see whether the trendsemerging from our results can be confirmed.
Implications for policy-makingGood Agricultural and Environmental Conditions (GAECs) are the
minimum requirement to access the payment from the EuropeanUnion in the framework of the new Common Agricultural Policy (CAP).At the same time the real effectiveness of the cross compliance meas-ures has not been validated until now and there is a lack of policy eval-uations (Bazzoffi and Zaccarini Bonelli, 2011). In this work we consid-ered the SOM balance at a cropping system level as an indicator of soilmanagement and cropping system sustainability, as a first step to eval-uate the effectiveness of environmental practices applied in a certainarea and the possible improvement for best environmental practices. In this case, we can easily identify the agricultural practices that
guarantee the best environmental performance, and a generalisation ofthis knowledge could be relevant for a local differentiation on GAECs.The main agricultural practices that appear relevant in terms of SOMconservation were the length of rotation and the breeding type. Croprotation is also the only GAEC standard implemented in Italy for SOMconservation, however the real effectiveness of this measure is consid-ered as low (MIPAAF, 2010). At the same time there are no policies thatsimultaneously implement agricultural systems and breeding activitiesin terms of SOM conservation. The agricultural practices that contribute most to soil degradation
Article
Non-co
mmercial
use o
nly
are conventional tillage and the still widespread implementation ofintensive farming systems such as continuous cereals, without thenecessary supply of organic matter. Although these results have alreadybeen highlighted by the scientific community, they are not alwaysimplemented at a policy level and have been demonstrated in this workeffective also in the case of Mediterranean hillside cereal-legumescropping systems.
Conclusions
The aim of this work was to assess the SOM balance of local croppingsystems on typical farms within the hillside of the province of Grosseto(Tuscany, Italy). Our results show that on the basis of the SOM balanceindicator, the environmental sustainability of local cropping systemscan be improved mainly through conservative cultivation techniquesand the lengthening of crop rotations. The simplification of the crop-ping system in the Mediterranean areas, which has taken place overthe last three decades, has affected the hillsides, and also the agricul-tural system that is still characterised by a high level of livestock pro-duction. Our results could help policy makers to provide suggestions fora more effective local implementation of agro-environmental measuresto be considered in the post 2013 CAP. Future policies should try tofacilitate both the maintenance of livestock-oriented farms and thelengthening of crop rotations. These two aspects are generally positive-ly related, and constitute the right management of hillside cereallegume-based crop rotations as a key agro-ecosystem for environmen-tal protection. Our methodology leads to a simplified measurement of the sustain-
ability of cropping systems in terms of SOM conservation. The mainlimitation of the data analysis is due to the high variability of local crop-ping systems and soil characteristics. For these reasons, a larger farmsample and field soil measurements are needed to confirm thesetrends. The used Regional soil database obtained from average valuescould be a source of uncertainty due to the lack of field measures. Awider analysis could be applied by considering the SOM balance notonly in terms of cropping systems, but also for farming and agricultur-al systems, in order to assess the impact of farm management on theoverall landscape.
References
Accademia Nazionale di Agricoltura, 1991. Agricoltura e Ambiente.Edagricole, Bologna, Italy.
Agnoletti M, Cargnello G, Gardin L, Santoro A, Bazzoffi P, Sansone L,Pezza L, Belfiore L. 2011. Traditional landscape and rural develop-ment: comparative study in three terraced areas in northern, cen-tral and southern Italy to evaluate the efficacy of GAEC standard 4.4of cross compliance. Ital. J. Agron. 6(Suppl.1):e16.
Álvaro-Fuentes J, Paustian K, 2011. Potential soil carbon sequestrationin a semiarid Mediterranean agroecosystem under climate change:quantifying management and climate effects. Plant Soil 338:261-272.
Andriulo A, Mary B, Guerif J, 1999. Modelling soil carbon dynamics withvarious cropping sequences on the rolling pampas. Agronomie19:365-377.
Angilieri V, Loudjani P, Serafini F, 2011. GAEC implementation in theEU: situation and perspectives. Ital. J. Agron. 6(Suppl.1):e2.
Bayer C, Lovato T, Dieckow J, Zanatta J, Mielniczuk J, 2006. A methodfor estimating coefficients of soil organic matter dynamics based
on long-term experiments. Soil Till. Res. 91:217-226. Bazzoffi P, Zaccarini Bonelli C, 2011. Cross compliance GAEC standards
implemented in Italy: environmental effectiveness and strategicperspectives. Ital. J. Agron. 6(Suppl.1):e1.
Bechini L, Castoldi N, 2009. On-farm monitoring of economic and envi-ronmental performances of cropping systems: results of a 2-yearstudy at the field scale in northern Italy. Ecol. Indic. 9:1096-1113.
Bechini L, Castoldi N, Stein A, 2011. Sensitivity to information upscal-ing of agro-ecological assessments: application to soil organic car-bon management. Agric. Syst. 104:480-490.
Benini L, Bandini V, Marazza D, Contin A, 2010. Assessment of land usechanges through an indicator-based approach: a case study fromthe Lamone river basin in Northern Italy. Ecol. Indic. 10:4-14.
Bertora C, Zavattaro L, Sacco D, Monaco S, Grignani C, 2009. Soilorganic matter dynamics and losses in manured maize-based for-age systems. Eur. J. Agron. 30:177-186.
Bindi M, Olesen JE, 2011. The responses of agriculture in Europe to cli-mate change. Reg. Environ. Change 11:151-158.
Bockstaller C, Girardin P, 2003. Mode de Calcul des IndicateursAgrienvironmentaux de la Methode INDIGO. Version 1.61 duLogiciel. INRA Internal Technical Report, Colmar, France.
Bockstaller C, Girardin P, van der Werf HMG, 1997. Use of agro-ecolog-ical indicators for the evaluation of farming systems. Eur. J. Agron.7:261-270.
Bockstaller C, Guichard L, Makowski D, Aveline A, Girardin P,Plantureux S, 2008. Agri-environmental indicators to assess crop-ping and farming systems. A review. Agron. Sustain. Dev. 28:139-149.
Boiffin J, Kéli Zagbahi J, Sebillotte M, 1986. Systèmes de culture etstatut organique des sols dans le Noyonnais: application du modèlede Hénin-Dupuis. Agronomie 6:437-447.
Bonari E, Galli M, Balducci E, Debolini M, Marraccini E, 2009. In: E.Bonari (ed.) Competitività rurale: elementi di analisi e sfide pro-gettuali. In: Conoscenza, innovazione e sviluppo. Un futuro possi-bile per il sistema territorio della Provincia di Grosseto. EdizioniISGREC, Grosseto, Italy, pp 89-135.
Bonari E, Silvestri N, Pampana S, Barberi P, 1999. La scelta del sistemacolturale negli ambienti collinari dell’Italia centro-occidentale.Nota II. Aspetti economici, energetici ed ambientali. Riv. Agron.4:220-222.
Borrelli L, Colecchia S, Troccoli A, Caradonna S, Papini R, Ventrella D,Dell’Abate MT, Galeffi C, Tomasoni C, Farina R, 2011. Effectivenessof the GAEC standard of cross compliance Crop rotations in main-taining organic matter levels in soils. Ital. J. Agron. 6(Suppl. 1):e8.
Bronick CJ, Lal R, 2005. Soil structure and management: a review.Geoderma 124:3-22.
Caraveli H, 2000. A comparative analysis on intensification and exten-sification in mediterranean agriculture: dilemmas for LFAs policy.J. Rural Stud. 16:231-242.
Castoldi N, Bechini L, 2006. Agro-ecological indicators of field-farmingsystems sustainability. I. Energy, landscape and soil management.Ital. J. Agrometeorol. 31:19-31.
Cots-Folch R, Martinez-Casasnovas JA, Ramos MC, 2009. Agriculturaltrajectories in a Mediterranean mountain region (Priorat, NESpain) as a consequence of vineyard. Land Degrad. Dev. 20:1-13.
Debolini M, Galli M, Bonari E, 2008. Agro-environmental risk analysisat landscape scale: limits for a sustainable land management. Ital.J. Agron. 3(Suppl.3):321-322.
Debolini M, Galli M, Bonari E, 2010. Assessing cropping systemchanges in Mediterranean environments. A case study in theGrosseto Province (Tuscany, Italy). pp 939-940 in Proc. 11th Congr.Eur. Soc. Agron.m Montpellier, France.
De Falco E, Amato M, Landi G, De Franchi AS, Basso F. 2000.Valutazione di sistemi colturali sostenibili nella collina lucana. Riv.
[Italian Journal of Agronomy 2012; 7:e38] [page 291]
Article
Non-co
mmercial
use o
nly
[page 292] [Italian Journal of Agronomy 2012; 7:e38]
Agron. 34:337-344. Di Bene C, Tavarini S, Mazzoncini M, Angelini LG, 2011. Changes in
soil chemical parameters and organic matter balance after 13 yearsof ramie [Boehmeria nivea (L.) Gaud.] cultivation in theMediterranean region. Eur. J. Agron. 35:154-163.
Dunjó G, 2003. Land use change effects on abandoned terraced soils ina Mediterranean catchment, NE Spain. Catena 52:23-37.
European Union, 2010. Agriculture in the European Union - Statisticaland economic information 2010. Available from: http://ec.europa.eu/agriculture/agrista/2010/table_en/2010enfinal.pdf
Farina R, Seddaiu G, Orsini R, Steglich E, Roggero PP, Francaviglia R,2011. Soil carbon dynamics and crop productivity as influenced byclimate change in a rainfed cereal system under contrasting tillageusing EPIC. Soil Till. Res. 112:36-46.
Fiener P, Auerswald K, Van Oost K, 2011. Spatio-temporal patterns inland use and management affecting surface runoff response ofagricultural catchments-A review. Earth-Sci. Rev. 106:92-104.
Fohrer N, 2001. Hydrologic response to land use changes on the catch-ment scale. Phys. Chem. Earth PT B 26:577-582.
Fumagalli M, Acutis M, Mazzetto F, Vidotto F, Sali G, Bechini L, 2011. Ananalysis of agricultural sustainability of cropping systems in arableand dairy farms in an intensively cultivated plain. Eur. J. Agron.34:71-82.
Galli M, Marraccini E, Bonari E, Debolini M, Rizzo D, 2007. Assettoagro-territoriale e qualificazione dei sistemi agricoli. Il caso dellaprovincia di Grosseto. pp 39-40 in: Atti XXXVII Convegno SocietàItaliana di Agronomia, Catania, Italy.
Grignani C, Zavattaro L, Sacco D, Monaco S, 2007. Production, nitrogenand carbon balance of maize-based forage systems. Eur. J. Agron.26:442-453.
Hénin S, Dupuis M, 1945. Essai de bilan de la matière organique dessols. Ann. Agron. 15:161-172.
Holland JM, 2004. The environmental consequences of adopting con-servation tillage in Europe: reviewing the evidence. Agric. Ecosyst.Environ. 103:1-25.
Huggins DR, Buyanovsky GA, Wagner GH, Brown JR, Darmody RG, PeckRT, Lessoing GW, Vanotti MB, Bundy LG, 1998. Soil organic C in thetallgrass prairie derived region of the corn belt: effects of long-termcrop management. Soil Till. Res. 47:219-234.
Karlen DL, Mausbach MJ, Doran JW, Cline RG, Harris RF, Schuman GE,1997. Soil quality: a concept, definition, and framework for evalua-tion. Soil Sci. Soc. Am. J. 61:4-10.
Kirkby M, Gobin A, Irvine B, 2003. PESERA model strategy, land use andvegetation growth. PESERA EC Contract no. QLK5-CT-1999-01323.
Marraccini E, Galli M, Rapey H, Lardon S, Bonari E, 2009. Multiple agro-environmental functions targeted by decision-makers: a comparedapproach in two European regions. pp 167-172 in Proc. Eur Conf.IALE, Salzburg, Austria.
Marraccini E, Galli M, Rapey H, Lardon S, Bonari E, 2010. Spatial vari-ability of agro-environmental functions fulfilment in aMediterranean agricultural landscape. pp 875-876 in Proc. 11thCongr. Eur. Soc. Agron., Montpellier, France.
Mary B, Guérif J, 1994. Intérets et limites des modèles de prévision del'évolution des matières organiques et de l'azote dans le soil. Cah.Agric. 3:247-257.
Mazzoncini M, Canali S, Giovannetti M, Castagnoli M, Tittarelli F,Antichi D, Nannelli R, Cristani C, Bàrberi P, 2010. Comparison oforganic and conventional stockless arable systems: a multidiscipli-nary approach to soil quality evaluation. Appl. Soil. Ecol. 44:124-132.
Mazzoncini M, Di Bene C, Coli A, Antichi D, Petri M, Bonari E, 2008.Rainfed wheat and soybean productivity in a long-term tillage
experiment in Central Italy. Agron. J. 100:1418-1429.Matson PA, Parton WJ, Power AG, Swift M, 1997. Agricultural intensifi-
cation and ecosystem properties. Science 277:504-509. MIPAAF, Ministero delle Politiche Agricole, Alimentari e Forestali, 2010.
Valutazione ambientale strategica del programma attuativo nazio-nale “Competitività dei sistemi agricoli e rurali”.
Morari F, Lugato E, Berti A, Giardini L, 1996. Long-term effects of rec-ommended management practices on soil carbon changes andsequestration in north-eastern Italy. Soil Use Manage. 22:71-81.
Nardi S, Morari F, Berti A, Tosoni M, Giardini L, 2004. Soil organic mat-ter properties after 40 years of different use of organic and miner-al fertilizers. Eur. J. Agron. 21:257-367.
Pagliai M, 2009. Conoscenza, conservazione e uso sostenibile del suolo:aspetti fisici e morfologici. Ital J Agron 3:151-160.
Pagliai M, Vignozzi N, Pellegrini S, 2004. Soil structure and the effectof management practices. Soil Till Res. 79;131-143.
Pinto-Correia T, Vos W, 2004. Multifunctionality in Mediterranean land-scapes - past and future. In: R. Jongman (ed.) The new dimen-sions of the European landscape, Wageningen EU Frontis Series4:135-164.
R Development Core Team, 2011. The R manual. Available from:http://www.r-project.org/
Rounsevell MD, Reginster I, Araújo MB, Carter TR, Dendoncker N,Ewert F, House JI, Kankaanpää S, Leemans R, Metzger MJ, SchmitC, Smith P, Tuck G, 2006. A coherent set of future land use changescenarios for Europe. Agr. Ecosyst. Env. 114: 57-68.
Saxton KE, Rawls WJ, Romberger JS, Papendick RI, 1986. Estimatinggeneralized soil water characteristics from texture. Soil Sci. Soc.Am. J. 50:1031-1036.
Schulp C, Verburg P, 2009. Effect of land use history and site factors onspatial variation of soil organic carbon across a physiographicregion. Agr. Ecosyst. Env. 133:86-97.
Serra P, Pons X, Saurí D, 2008. Land-cover and land-use change in aMediterranean landscape: a spatial analysis of driving forces inte-grating biophysical and human factors. Appl. Geogr. 28:189-209.
Silvestri N, Bellocchi G, Bonari E, 2002. Possibilità e limiti dell’usodegli indicatori nella valutazione agro-ambientale dei sistemi col-turali. Riv. Agron. 3:232-240.
Sleutel S, De Neve S, Németh T, Tóth T, Hofman G, 2006. Effect ofmanure and fertilizer application on the distribution of organiccarbon in different soil fractions in long-term field experiments.Eur. J. Agron. 25:280-288.
Soil Survey Staff, 1975. Soil taxonomy: a basic system of soil classifica-tion for making and interpreting soil surveys. USDA-SCS Agric.Handbook 436. US Government Print Office, Washington, DC, USA.
Sombroek WG, Sims D, 1995. Land and water bulletin No. 2. FAO Publ.,Roma, Italy.
Spallacci P, 1991. La fertilizzazione con liquami zootecnici: possibilitàagronomiche e compatibilità ambientali. In: Accademia Nazionaledi Agricoltura (ed.) Agricoltura e Ambiente. Edagricole, Bologna,Italy, pp 280-310.
Thord Karlsson L, Andrén O, Kätterer T, Mattsson L, 2003. Managementeffects on topsoil carbon and nitrogen in Swedish long-term fieldexperiments - budget calculations with and without humus pooldynamics. Eur. J. Agron. 20:137-147.
West TO, Post WM, 2002. Soil organic carbon sequestration rates bytillage and crop rotation: a global data analysis. Soil Sci. Soc. Am. J.66:1930-1946.
Zdruli P, Jones RJA, Montanarella L, 2004. Organic matter in the soilsof Southern Europe. European Soil Bureau Technical Report.Office for Official Publications of the European Communities,Luxembourg, pp 1-16.
Article
Non-co
mmercial
use o
nly