explication des rÉsultats d e l ' É t u d e d e s t a u x d
TRANSCRIPT

Société en commandite Gaz Métro
Cause tarifaire 2016, R-3879-2014
Original : 2015.05.29 Gaz Métro – 107, Document 11
Page 1 de 12
E X P L I C A T I O N D E S R É S U L T A T S
D E L ’ É T U D E D E S T A U X D ’ A M O R T I S S E M E N T E T
D E S M O D I F I C A T I O N S L I É E S A U X
I M M O B I L I S A T I O N S

Société en commandite Gaz Métro
Cause tarifaire 2016, R-3879-2014
Original : 2015.05.29 Gaz Métro – 107, Document 11
Page 2 de 12
T A B L E D E S M A T I È R E S
L E X I Q U E . . . . . . . . . . . . . . . . . . . . . . . . . . . . . . . . . . . . . . . . . . . . . . . . . . . . . . . . . . . . . . . . . . . . . . . . . . . . 3
1 I N T R O D U C T I O N . . . . . . . . . . . . . . . . . . . . . . . . . . . . . . . . . . . . . . . . . . . . . . . . . . . . . . . . . . . . . . . 4
2 T R A I T E M E N T A C T U E L . . . . . . . . . . . . . . . . . . . . . . . . . . . . . . . . . . . . . . . . . . . . . . . . . . . . . . . 4
2.1 NORMES CANADIENNES . . . . . . . . . . . . . . . . . . . . . . . . . . . . . . . . . . . . . . . . . . . . . . . . . . . . . . . . . . . . . . . . . . . . 4
2.2 TRAITEMENT RÉGLEMENTA IRE . . . . . . . . . . . . . . . . . . . . . . . . . . . . . . . . . . . . . . . . . . . . . . . . . . . . . . . . . . . 5
3 D É M A R C H E . . . . . . . . . . . . . . . . . . . . . . . . . . . . . . . . . . . . . . . . . . . . . . . . . . . . . . . . . . . . . . . . . . . . . 6
3.1 ANALYSES – IDENTIFICATION DE NOUVELLES CATÉGORIES . . . . . . . . . . . . . . . . . . . . . . 6
3.2 TAUX D ’AMORTISSEMENT DES AC TIFS DE DISTRIBUTION , DE
STOCKAGE ET DE TRANSMISSION . . . . . . . . . . . . . . . . . . . . . . . . . . . . . . . . . . . . . . . . . . . . . . . . . . . . . . . 6
3.2.1 Méthodes de détermination des taux d’amortissement ................................................. 7
3.3 TAUX D ’AMORTISSEMENT DES AC TIFS DES INSTALLATIONS
GÉNÉRALES . . . . . . . . . . . . . . . . . . . . . . . . . . . . . . . . . . . . . . . . . . . . . . . . . . . . . . . . . . . . . . . . . . . . . . . . . . . . . . . . . . . 7
4 R É S U L T A T S . . . . . . . . . . . . . . . . . . . . . . . . . . . . . . . . . . . . . . . . . . . . . . . . . . . . . . . . . . . . . . . . . . . . 8
4.1 MODIFICATION DES TAUX DES ACTIFS DE DISTRIBUTION , DE
STOCKAGE ET DE TRANSMISSION . . . . . . . . . . . . . . . . . . . . . . . . . . . . . . . . . . . . . . . . . . . . . . . . . . . . . . . 9
4.2 PROPOSITION DE GAZ MÉTRO – INSTALLATIONS GÉNÉRALES . . . . . . . . . . . . . . . . 10
5 M O D A L I T É D ’ A P P L I C A T I O N . . . . . . . . . . . . . . . . . . . . . . . . . . . . . . . . . . . . . . . . . . . . . 1 1
6 I M P A C T D E S M O D I F I C A T I O N S D E S I M M O B I L I S A T I O N S C O R P O R E L L E S . . . . . . . . . . . . . . . . . . . . . . . . . . . . . . . . . . . . . . . . . . . . . . . . . . . . . . . . . . . . . . 1 1
7 C O N C L U S I O N . . . . . . . . . . . . . . . . . . . . . . . . . . . . . . . . . . . . . . . . . . . . . . . . . . . . . . . . . . . . . . . . 1 1

Société en commandite Gaz Métro
Cause tarifaire 2016, R-3879-2014
Original : 2015.05.29 Gaz Métro – 107, Document 11
Page 3 de 12
L E X I Q U E
CPA Comptables professionnels agréés
ELG Méthode d’amortissement nommée « Equal Life Group »

Société en commandite Gaz Métro
Cause tarifaire 2016, R-3879-2014
Original : 2015.05.29 Gaz Métro – 107, Document 11
Page 4 de 12
1 I N T R O D U C T I O N
Ce document présente l’étude quinquennale des taux d’amortissement des principales catégories 1
d’immobilisations corporelles de Société en commandite Gaz Métro (« Gaz Métro ») en fonction 2
des soldes aux livres au 30 septembre 2014. L’application des taux de la présente étude sera en 3
vigueur le 1er octobre 2015 et, par conséquent, les taux de cette étude ont été intégrés à la Cause 4
tarifaire 2016. 5
L’étude des taux d’amortissement permet d’assurer une répartition équitable de la dépense 6
d’amortissement entre les générations de clients et favorise la juste récupération des 7
investissements. De plus, cet exercice permet l’ajustement de la dépense d’amortissement de 8
Gaz Métro en fonction de l’évolution de la réalité économique. En effet, la durée de vie résiduelle 9
des actifs et la projection des retraits peuvent évoluer de façon différente de ce qui avait été prévu 10
lors de la dernière étude. 11
Gaz Métro utilise la méthode de l’amortissement linéaire, selon un taux spécifique par catégorie 12
d’actifs. Les taux d’amortissement sont établis en fonction de la durée de vie résiduelle des actifs. 13
Cette méthode prend en considération la valeur historique des investissements, les coûts des 14
retraits passés, la prévision des retraits futurs, les coûts d’abandon associés aux retraits, la valeur 15
de l’amortissement accumulé et la durée de vie résiduelle de l’actif. 16
La nouvelle étude des taux engendre un impact sur la dépense d’amortissement annuelle 17
projetée pour l’année 2016 de 4,6 M$. 18
2 T R A I T E M E N T A C T U E L
2.1 NORMES CANADIENNES
Selon le traitement utilisé actuellement par Gaz Métro, le coût des immobilisations corporelles est 19
ventilé entre les différentes catégories, qui est amorti selon les durées d’utilisation prévues de 20
ces catégories. Ces dernières sont établies selon une étude de taux pour les actifs de distribution, 21
stockage et de transmission. Pour ce qui est des installations générales, les durées 22
d’amortissement sont déterminées à l’interne. Voici les extraits pertinents du chapitre 3061 de la 23
partie V du Manuel de CPA Canada – Comptabilité. 24

Société en commandite Gaz Métro
Cause tarifaire 2016, R-3879-2014
Original : 2015.05.29 Gaz Métro – 107, Document 11
Page 5 de 12
« .29 Les immobilisations corporelles sont acquises afin de générer des produits ou de fournir un 1
service pendant leur durée de vie utile. À l'exception des terrains, dont la durée de vie est 2
habituellement illimitée, les immobilisations corporelles ont une durée de vie limitée. Leur durée de 3
vie utile correspond normalement à la plus courte des durées physique, technologique, 4
commerciale ou juridique. L'amortissement est une charge imputée sur les résultats pour rendre 5
compte du fait que la durée de vie est limitée et pour répartir le coût de l'immobilisation corporelle, 6
après défalcation de sa valeur de récupération ou de sa valeur résiduelle, sur les exercices au 7
cours desquels est consommé son potentiel de service. Dans le cas des ressources, on parle 8
d'épuisement ou de déplétion. 9
.30 Le coût d'une immobilisation corporelle constituée d'importantes composantes distinctes est 10
ventilé entre celles-ci lorsqu'il est raisonnablement possible de le faire et que la durée de vie de 11
chacune des composantes peut faire l'objet d'une estimation. Par exemple, les frais initiaux 12
engagés pour la location peuvent être isolés à titre de composante distincte du coût d'un immeuble 13
destiné à la location, et les moteurs peuvent constituer une composante distincte d'un aéronef. » 14
Les catégories d’immobilisations corporelles sont identifiées en considérant notamment les 15
caractéristiques des actifs, leur nature, leur durée d’utilisation prévue et les activités auxquelles 16
elles se rattachent. Un seul taux d’amortissement est déterminé pour chacune des catégories 17
d’immobilisations corporelles. 18
2.2 TRAITEMENT RÉGLEMENTAIRE
Les ordonnances GC-1 et GC-24 suggèrent une charte de comptes de grand livre, mais ne 19
fournissent pas d’indication quant aux catégories d’actifs à utiliser. 20
La valeur historique, l’amortissement cumulé ainsi que la dépense annuelle d’amortissement 21
(établie à l’aide des taux approuvés par la Régie de l’énergie (la « Régie »)) sont présentés 22
annuellement par catégorie lors de l’élaboration du dossier tarifaire. 23

Société en commandite Gaz Métro
Cause tarifaire 2016, R-3879-2014
Original : 2015.05.29 Gaz Métro – 107, Document 11
Page 6 de 12
3 D É M A R C H E
3.1 ANALYSES – IDENTIFICATION DE NOUVELLES CATÉGORIES
Des ateliers de travail ont été réalisés à l’interne avec les responsables de chaque groupe d’actifs. 1
Ces rencontres avaient pour objectif de revoir les catégories actuelles des immobilisations 2
corporelles et d’établir si des modifications à ces catégories étaient nécessaires. 3
Les responsables se sont interrogés sur les différents éléments contenus dans une catégorie 4
ainsi que sur leur durée d’utilisation prévue afin de voir si ceux-ci ne devraient pas être séparés 5
en nouvelles catégories. 6
3.2 TAUX D ’AMORTISSEMENT DES ACTIFS DE DISTRIBUTION , DE STOCKAGE ET DE
TRANSMISSION
L’exécution de cette analyse statistique et prévisionnelle a été confiée à monsieur Larry Kennedy, 7
consultant spécialisé dans ce domaine, de la firme Gannett Fleming. Son mandat consistait à 8
revoir les taux d’amortissement des catégories d’actifs de distribution, de stockage ainsi que de 9
transmission en tenant compte des informations historiques. 10
Pour chacun des groupes d'actifs, une courbe de mortalité a été établie afin de déterminer une 11
durée de vie moyenne par catégorie d'actifs. Pour ce faire, Gaz Métro a fourni à M. Kennedy les 12
soldes au 30 septembre 2014 de la valeur historique, de l’amortissement accumulé, des 13
additions, des retraits et des coûts d’abandon de toutes les catégories d’actifs ventilées selon 14
l’année de mise en service. À partir de ces informations, la durée de vie1, la durée de vie 15
résiduelle2 ainsi que l’évaluation des coûts de retraits de chaque actif ont été déterminées. 16
Des simulations ont été effectuées pour permettre la sélection de la courbe de mortalité de la 17
catégorie d’actifs qui correspond le mieux aux données réelles de chaque groupe d’actifs étudié. 18
Ces courbes statistiques proviennent de l’Iowa State University. 19
M. Kennedy a discuté avec les ingénieurs responsables de la conception et de la gestion des 20
actifs de distribution, de stockage et de transmission de Gaz Métro. Ces discussions avaient pour 21
1 La durée de vie équivaut à l’espérance de vie d’un groupe d’actifs au moment de son acquisition. 2 La durée de vie résiduelle représente la durée de vie restante de l’ensemble d’un groupe d’actifs. Cette durée tient compte de l’âge moyen du groupe d’actifs par rapport à sa durée de vie établie au départ.

Société en commandite Gaz Métro
Cause tarifaire 2016, R-3879-2014
Original : 2015.05.29 Gaz Métro – 107, Document 11
Page 7 de 12
but de connaître leur opinion sur la durée de vie des actifs du réseau de Gaz Métro. De même, il 1
voulait connaître les projets d’investissement à venir qui pourraient influencer de façon 2
significative l’évaluation du niveau futur de la valeur historique, qui proviendrait d’acquisitions ou 3
de dispositions anticipées d’immobilisations corporelles. 4
3.2.1 Méthodes de détermination des taux d’amortissement
Depuis la dernière étude des taux à partir des données au 30 septembre 2009, Gaz Métro 5
utilise la méthode ELG pour la détermination de ses taux d’amortissement. La méthode ELG 6
prend en compte le fait que dans une catégorie d’actifs, pour une année donnée, certains 7
actifs sont retirés avant l’atteinte de la durée de vie projetée et ce, pour diverses raisons. La 8
durée de vie de la catégorie est donc établie à l’aide de la somme des durées de vie moyennes 9
qui tient compte de l’historique des retraits par année d’acquisition. Il en résulte un niveau 10
plus élevé de dépenses d’amortissement plus tôt dans la vie d’un groupe d’actifs. Cette 11
méthode permet d’établir une charge d’amortissement qui reflète mieux la durée d’utilisation 12
des actifs. 13
3.3 TAUX D ’AMORTISSEMENT DES ACTIFS DES INSTALLATIONS GÉNÉRALES
Pour ce qui est des catégories relatives aux installations générales, les taux d’amortissement ont 14
été analysés à l’interne, tel qu’effectué dans les années précédentes. Compte tenu de la nature 15
des immobilisations incluses dans les catégories des installations générales, l’estimation de la 16
durée de vie de ces actifs est plus facilement déterminable et conséquemment, l’implication d’un 17
expert en étude de taux n’est pas nécessaire. Des ateliers de travail ont été réalisés avec les 18
responsables à l’interne des actifs étudiés. Ces rencontres avaient pour objectif de revoir les 19
catégories, de définir les changements et d’évaluer les taux d’amortissement appropriés. La 20
durée de vie des actifs, la durée d’amortissement et les retraits passés ont aussi été validés au 21
cours de ces rencontres. 22
Outre la révision à la hausse de la durée de vie des fourgonnettes qui est passée de 5 à 7 ans, 23
peu de changements ayant des impacts significatifs ont été effectués sur ces catégories. 24

Société en commandite Gaz Métro
Cause tarifaire 2016, R-3879-2014
Original : 2015.05.29 Gaz Métro – 107, Document 11
Page 8 de 12
4 R É S U L T A T S
Les résultats de l’étude des taux d’amortissement se divisent en deux parties. D’une part, les 1
actifs étudiés par la firme Gannett Fleming sont constitués des actifs de distribution, de stockage 2
et de transmission. Les résultats de l’étude de la firme Gannett Fleming sont présentés à 3
l’annexe A. 4
D’autre part, les résultats de l’étude des installations générales réalisée par Gaz Métro sont 5
intégrés à l’annexe B. 6
Il faut noter que pour certains actifs, il ne fut pas nécessaire de procéder à une étude. C’est le 7
cas, entre autres, des actifs non amortissables tels que les terrains, les droits de mutation et les 8
travaux en cours. Également, certains actifs, tels que les contributions et les subventions, ont les 9
mêmes taux d’amortissement que les actifs auxquels ils sont reliés. Par conséquent, les taux 10
d’amortissement de ces catégories seront ajustés en fonction des nouveaux taux des catégories 11
d’actifs auxquels ils se rapportent. 12
Globalement, la dépense d’amortissement de l’année 2016, toutes catégories d’immobilisations 13
confondues, aurait été de 104,6 M$ selon les anciens taux, comparativement à une prévision de 14
109,1 M$ en fonction des taux de la nouvelle étude des taux réalisée. L’annexe C présente 15
l’analyse détaillée des impacts sur la dépense d’amortissement par catégorie d’immobilisations.16

Société en commandite Gaz Métro
Cause tarifaire 2016, R-3879-2014
Original : 2015.05.29 Gaz Métro – 107, Document 11
Page 9 de 12
4.1 MODIFICATION DES TAUX DES ACTIFS DE DISTRIBUTION , DE STOCKAGE ET DE
TRANSMISSION
Une augmentation importante des taux d’amortissement des branchements d’immeubles en 1
plastique direct est recommandée par le consultant. À la suite de l’analyse basée sur les retraits 2
passés et d’une comparaison avec nos pairs de l’industrie, les coûts d’abandon à provisionner 3
dans l’amortissement cumulé ont augmenté de façon significative pour cette catégorie. Une 4
augmentation des taux d’amortissement des conduites principales en acier est également 5
recommandée en raison d’une diminution de la durée de vie pour ces actifs. Cette augmentation 6
des taux est compensée par une réduction des taux d’amortissement pour : 7
les conduites principales en plastique direct en raison d’une réduction des coûts 8
d’abandon à provisionner; 9
les postes de livraison portion équipement en raison d’une réduction des coûts d’abandon 10
à provisionner et d’une augmentation de la durée de vie; et 11
les compteurs en raison d’une augmentation de la durée de vie résiduelle. 12
Voici un tableau récapitulatif des changements importants. 13
Catégorie Description catégorie Taux
actuel
Estimation durée vie
utile actuelle
Taux proposé
Estimation durée de vie utile
proposée
Impact dépense
amortissement 2016
Z1102 Distribution branchements plastique direct
3,19 % 50 5,15 % 50 14,3 M$
Z1150 Distribution conduites acier 2,82 % 50 3,13 % 45 2,3 M$
Z1151 Distribution conduites plastique direct
1,98 % 60 1,56 % 65 (3,6 M$)
Z1250 Distribution postes de livraison portion équipements
5,97 % 32 2,03 % 37 (3,5 M$)
Z1200 Compteurs 9,16 % 18 7,19 % 18 (3,3 M$)
Autres catégories
Autres catégories divers divers divers divers (0,9 M$)
Total 5,3 M$
L’annexe C présente l’analyse détaillée des impacts sur la dépense d’amortissement des actifs 14
de distribution, de stockage et de transmission par catégorie d’immobilisations. 15

Société en commandite Gaz Métro
Cause tarifaire 2016, R-3879-2014
Original : 2015.05.29 Gaz Métro – 107, Document 11
Page 10 de 12
4.2 PROPOSITION DE GAZ MÉTRO – INSTALLATIONS GÉNÉRALES
Gaz Métro propose des changements pour certains actifs des installations générales, visant ainsi 1
à maintenir une saine gestion de ses immobilisations. Ces changements sont présentés à 2
l’annexe B et les impacts sur la dépense d’amortissement à l’annexe C. 3
Afin de s’ajuster à l’évolution de la technologie, Gaz Métro propose quelques mouvements 4
internes entre les catégories des actifs technologiques. Les investissements en outils de 5
communication Mike et en équipements de télécommunication, qui sont actuellement 6
comptabilisés dans les catégories Pag,cell,caméra - 2 ans (Z2202) et Micro-ord,serveur - 4 ans 7
(Z2203) respectivement, seront transférés à la catégorie imprim.,phot,lib.stock - 5 ans (Z2204). 8
Les systèmes téléphoniques qui sont actuellement comptabilisés dans la catégorie mesurage 9
distance - 10 ans (Z2205) seront désormais comptabilisés dans la catégorie imprim.,phot,lib.stock 10
- 5 ans (Z2204). 11
Gaz Métro propose également un changement de taux pour certaines catégories des installations 12
générales afin de mieux refléter les durées de vie des actifs. Gaz Métro propose également la 13
création de deux nouvelles catégories d’actifs, soit la catégorie de Matériel roulant - Camions 14
lourds – 10 ans (Z2540) et Équipements immeubles - 15 ans (Z2055). L’ajout de la catégorie 15
Matériel roulant - Camions lourds – 10 ans est proposé afin de bien refléter la durée de vie des 16
camions par type de métier. Quant à la catégorie des Équipements des immeubles, actuellement 17
ces équipements sont regroupés dans deux catégories et sont respectivement amortis sur 10 ans 18
et 25 ans. L’ajout de la nouvelle catégorie de 15 ans permettra à Gaz Métro un meilleur 19
appariement entre l’amortissement des actifs et leur utilisation prévue. 20
Les améliorations proposées ci-dessus permettraient une répartition équitable de la dépense 21
d’amortissement entre les générations de clients et favoriseraient la juste récupération des 22
investissements. 23
Globalement, les modifications proposées aux catégories des installations générales ont un 24
impact à la baisse de 0,9 M$ sur la dépense d’amortissement. L’annexe C présente l’analyse 25
détaillée des impacts sur la dépense d’amortissement des installations générales par catégorie 26
d’immobilisations. 27

Société en commandite Gaz Métro
Cause tarifaire 2016, R-3879-2014
Original : 2015.05.29 Gaz Métro – 107, Document 11
Page 11 de 12
5 M O D A L I T É D ’ A P P L I C A T I O N
Pour la cause tarifaire 2016, Gaz Métro demande à la Régie d’autoriser :
a) la création des nouvelles catégories d’immobilisations décrites à l’annexe B,
ainsi que les taux d’amortissement afférents;
b) la modification des taux d’amortissement applicables à certaines catégories
d’actifs tel que plus amplement explicité à l’annexe C.
6 I M P A C T D E S M O D I F I C A T I O N S D E S I M M O B I L I S A T I O N S
C O R P O R E L L E S
L’impact des modifications des taux d’amortissement et des catégories d’immobilisations 1
corporelles est une augmentation sur la dépense d’amortissement de 4,6 M$ pour l’exercice 2
2016. 3
7 C O N C L U S I O N
La mise à jour de la présente étude des taux d’amortissement permettrait de refléter une dépense 4
annuelle d’amortissement conforme à la réalité économique actuelle et à l’application des normes 5
comptables en vigueur. Cette étude des taux d’amortissement de Gaz Métro se traduit par une 6
hausse de la dépense d’amortissement de 4,6 M$, ce qui représente une augmentation de 4,4 % 7
par rapport à la dépense d’amortissement calculée avec les taux actuellement en vigueur. 8
Gaz Métro demande à la Régie de prendre acte de l’étude des taux d’amortissement 9
réalisée par la firme Gannett Fleming pour les actifs de distribution, de stockage et de 10
transmission. 11
Gaz Métro demande à la Régie d’autoriser la modification des taux d’amortissement des 12
actifs de distribution, de stockage et de transmission qui seront en vigueur jusqu’à la 13
prochaine étude des taux. 14

Société en commandite Gaz Métro
Cause tarifaire 2016, R-3879-2014
Original : 2015.05.29 Gaz Métro – 107, Document 11
Page 12 de 12
Gaz Métro demande à la Régie d’autoriser la création de nouvelles catégories d’actifs 1
d’installations générales. 2
Gaz Métro demande à la Régie d’autoriser la modification des taux d’amortissement des 3
actifs d’installations générales qui seront en vigueur jusqu’à la prochaine étude des taux.4

GAZ MÉTRO MONTREAL, QUEBEC
2014 DEPRECIATION STUDY
CALCULATED ANNUAL DEPRECIATION ACCRUALS RELATED TO PLANT IN SERVICE
AS OF SEPTEMBER 30, 2014
Prepared by:
Société en commandite Gaz Métro Cause tarifaire 2015, R-3879-2014
Original : 2015.05.29 Gaz Métro - 107, Document 11 Annexe A (152 pages en liasse)

Gaz Métro 2014 Depreciation Study
GAZ MÉTRO
MONTREAL, QUEBEC
2014 DEPRECIATION STUDY
CALCULATED ANNUAL DEPRECIATION ACCRUALS RELATED TO PLANT IN SERVICE
AS OF SEPTEMBER 30, 2014
GANNETT FLEMING CANADA ULC
Calgary, Alberta

May 12, 2015
Martine Bisaillon, CPA, CMA Chef de service – Immobilisation et contrôle des coûts Société en Commandite Gaz Métro 1717, rue du Havre Montréal QC H2K 2X3 Attention: Mme. Martine Bisaillon Ladies and Gentlemen: Pursuant to your request, we have conducted a depreciation study related to the gas distribution, transmission and stockage plant assets of Gaz Métro as of September 30, 2014. Our report presents a description of the methods used in the estimation of depreciation, the statistical analyses of service life and the summary and detailed tabulations of annual and accrued depreciation. We gratefully acknowledge the assistance of Gaz Métro personnel in the completion of the study.
Respectfully submitted, GANNETT FLEMING CANADA ULC
LARRY E. KENNEDY Vice President LEK/hac Project #059587 Gannett Fleming Canada ULC
Suite 277 • 200 Rivercrest Drive S.E. • Calgary, AB T2C 2X5 • Canada
t: 403.257.5946 • f: 403.257.5947 www.gannettfleming.com www.gfvrd.com

Gaz Métro 2014 Depreciation Study
TABLE OF CONTENTS
Executive Summary ............................................................................................... vi
PART I. INTRODUCTION ...................................................................................... I-1 Scope ...................................................................................................................... I-2 Plan of Report ......................................................................................................... I-2 Basis of the Study ................................................................................................... I-3 Depreciation ................................................................................................ I-3 Service Life and Net Salvage Estimates ....................................................... I-3
PART II. DEVELOPMENT OF DEPRECIATION PARAMETERS ......................... II-1 Depreciation ............................................................................................................ II-2 Estimation of Survivor Curves ................................................................................. II-2
Survivor Curves ............................................................................................ II-2 Service Life and Net Salvage Judgments ..................................................... II-3 PART III. CALCULATION OF ANNUAL AND ACCRUED DEPRECIATION ......... III-1 Group Depreciation Procedures ................................................................... III-2 PART IV. RESULTS OF STUDY ............................................................................ IV-1 Qualification of Results ............................................................................................ IV-2 Description of Detailed Tabulations ......................................................................... IV-2
Table 1 Estimated Survivor Curves, Net Salvage Percents, Original Cost and Annual Accruals Based on Surviving Plant as of September 30, 2014 Combined Life and Net Salvage Analysis ............................................... IV-4 Table 1A Estimated Survivor Curves, Net Salvage Percents, Original Cost and Annual Accruals Based on Surviving Plant as of September 30, 2014 Life Analysis ............................................................................................ IV-5 Table 1B Estimated Survivor Curves, Net Salvage Percents, Original Cost and Annual Accruals Based on Surviving Plant as of September 30, 2014 Net Salvage Analysis .............................................................................. IV-6
PART V. SERVICE LIFE STATISTICS .................................................................. V-1 Service Life Statistics .............................................................................................. V-2
iv

Gaz Métro 2014 Depreciation Study
TABLE OF CONTENTS, Cont’d.
PART VI. DETAILED DEPRECIATION CALCULATIONS .................................... VI-1 Detailed Depreciation Calculations ......................................................................... VI-2 APPENDIX A – ESTIMATION OF SURVIVOR CURVES ....................................... A-1 Survivor Curves ....................................................................................................... A-2 Iowa Type Curves ......................................................................................... A-2 Retirement Rate Method of Analysis ............................................................ A-4 Schedules of Annual Transactions in Plant Records .................................... A-10 Schedule of Plant Exposed to Retirements .................................................. A-14 Original Life Table ........................................................................................ A-15 Smoothing the Original Survivor Curve ........................................................ A-19 APPENDIX B – ESTIMATION OF NET SALVAGE ................................................ B-1 Estimation of Net Salvage ....................................................................................... B-2
v

Gaz Métro 2014 Depreciation Study
GAZ MÉTRO DEPRECIATION STUDY
EXECUTIVE SUMMARY Pursuant to Gaz Métro’s request, Gannett Fleming Canada ULC (“Gannett
Fleming”) conducted a depreciation study related to the surviving balances as of
September 30, 2014. The purpose of this study was to determine the annual
depreciation accrual rates and amounts for financial reporting and ratemaking
objectives.
The depreciation rates are based on the straight line method using the equal life
group (“ELG”) procedure and were applied on a remaining life basis. The calculations
were based on attained ages and estimated average service life, and forecasted net
salvage characteristic for each depreciable group of assets.
Gannett Fleming recommends the calculated annual depreciation accrual rates
set forth herein apply specifically to gas plant in service as of September 30, 2014 as
summarized by Table 1 of the study by account detail. Supporting data and calculations
are provided within the study.
Finally, this study results in an annual depreciation expense accrual of $93.9
million when applied to depreciable plant balances as of September 30, 2014. The
report study results are summarized at an aggregate functional group level as follows:
ORIGINAL COSTPLANT GROUP $'s %'s $'s
(1) (2) (3) (4)
DISTRIBUTION 2,816,537,771 3.26 91,765,804 TRANSMISSION 300,865,052 0.34 1,037,977 GENERAL 40,724,956 2.58 1,051,090
TOTAL PLANT IN SERVICE 3,158,127,779 2.97 93,854,871
SUMMARY OF ORIGINAL COST, ACCRUAL PERCENTAGES AND AMOUNTS
ANNUAL ACCRUAL
vi

Gaz Métro 2014 Depreciation Study
PART I. INTRODUCTION
I-1

Gaz Métro 2014 Depreciation Study
GAZ MÉTRO DEPRECIATION STUDY
PART I. INTRODUCTION SCOPE
This report sets forth the results of the depreciation study for Gaz Métro, to
determine the annual depreciation accrual rates and amounts for book purposes
applicable to the original cost of gas plant at September 30, 2014. The rates and
amounts are based on the straight line remaining life method of depreciation. This
report also describes the concepts, methods and judgments which underlie the
recommended annual depreciation accrual rates related to gas plant in service as of
September 30, 2014.
The service life and net salvage estimates resulting from the study were based
on: informed engineering judgment which incorporated analyses of historical plant
retirement data as recorded through September 30, 2014; a review of Company
practice and outlook as they relate to plant operation and retirement; and consideration
of current practice in the gas industry, including knowledge of service lives and net
salvage estimates used for other gas companies.
PLAN OF REPORT
Part I Introduction, contains statements with respect to the plan of the report, and
the basis of the study. Part II Development of Depreciation Parameters, presents
descriptions of the methods used in the service life and net salvage studies. Part III
Calculation of Annual and Accrued Depreciation presents the methods and procedures
used in the calculation of depreciation. Part IV. Results of Study, presents summaries
by depreciable group of annual and accrued depreciation. Part V presents the results of
the Retirement Rate and Service Life Statistics and Part VI presents Net Salvage
Analysis. Detailed tabulations of annual and accrued depreciation are presented in Part
VII of this report. An overview of Iowa curves and the Retirement Rate Analysis are set
forth in Appendix A of the report. An overview of the net salvage analysis is presented
in Appendix B of this report.
I-2

Gaz Métro 2014 Depreciation Study
BASIS OF THE STUDY Depreciation
For most accounts, the annual and accrued depreciation were calculated by the
straight line method using the equal life group (“ELG”) procedure. For certain General
Plant accounts, the annual depreciation is based on amortization accounting. The
calculations were based on original cost, attained ages, and estimates of service lives
and net salvage.
The straight line method, ELG procedure is a commonly used depreciation
calculation procedure that has been widely accepted in jurisdictions throughout North
America and has been previously approved for use by Gaz Métro.
Service Life and Net Salvage Estimates The service life and salvage estimates used in the depreciation and amortization
calculations were based on informed judgment which incorporated a review of
management’s plans, policies and outlook, a general knowledge of the gas utility
industry, and comparisons of the service life and net salvage estimates from our studies
of other gas utilities. The use of survivor curves to reflect the expected dispersion of
retirement provides a consistent method of estimating depreciation for gas plant. Iowa
type survivor curves were used to depict the estimated survivor curves for the plant
accounts not subject to amortization accounting.
The procedure for estimating service lives consisted of compiling historical data
for the plant accounts or depreciable groups, analyzing this history through the use of
widely accepted techniques, and forecasting the survivor characteristics for each
depreciable group on the basis of interpretations of the historical data analyses and the
probable future. The combination of the historical experience and the estimated future
yielded estimated survivor curves from which the average service lives were derived.
The depreciation rates should be reviewed periodically to reflect the changes that
result from plant and reserve account activity. A depreciation reserve deficiency or
surplus will develop if future capital expenditures vary significantly from those
anticipated in this study.
I-3

Gaz Métro 2014 Depreciation Study
PART II. DEVELOPMENT OF DEPRECIATIONS PARAMETERS
II-1

Gaz Métro 2014 Depreciation Study
PART II. DEVELOPMENT OF DEPRECIATION PARAMETERS DEPRECIATION Depreciation, in public utility regulation, is the loss in service value not restored
by current maintenance, incurred in connection with the consumption or prospective
retirement of utility plant in the course of service from causes which are known to be in
current operation and against which the utility is not protected by insurance. Among
causes to be given consideration are wear and tear, deterioration, action of the
elements, inadequacy, obsolescence, changes in the art, changes in demand, and the
requirements of public authorities.
Depreciation, as used in accounting, is a method of distributing fixed capital
costs, less net salvage, over a period of time by allocating annual amounts to expense.
Each annual amount of such depreciation expense is part of that year's total cost of
providing electric utility service. Normally, the period of time over which the fixed capital
cost is allocated to the cost of service is equal to the period of time over which an item
renders service, that is, the item's service life. The most prevalent method of allocation
is to distribute an equal amount of cost to each year of service life. This method is
known as the straight-line method of depreciation.
The calculation of annual and accrued depreciation based on the straight line
method requires the estimation of survivor curves and is described in the following
sections of this report. The development of the proposed depreciation rates also
requires the selection of group depreciation procedures, as discussed in Part III of this
report.
ESTIMATION OF SURVIVOR CURVES Survivor Curves The use of an average service life for a property group implies that the various
units in the group have different lives. Thus, the average life may be obtained by
determining the separate lives of each of the units, or by constructing a survivor curve
by plotting the number of units which survive at successive ages using the retirement
rate method of analysis.
II-2

Gaz Métro 2014 Depreciation Study
The range of survivor characteristics usually experienced by utility and industrial
properties is encompassed by a system of generalized survivor curves known as the
Iowa type curves. There are four families in the Iowa system, labeled in accordance with
the location of the modes of the retirements in relationship to the average life and
relative height of the modes. The left-moded curves are those in which the greatest
frequency of retirement occurs to the left of, or prior to, average service life. The
symmetrical-moded curves are those in which the greatest frequency of retirement
occurs at average service life. The right-moded curves are those in which the greatest
frequency occurs to the right of, or after, the average service life. The origin-moded
curves are those in which the greatest frequency of retirement occurs at the origin, or
immediately after age 0. The letter designation of each family of curves (L, S, R or O)
represents the mode of the associated frequency curve with respect to the average
service life. The numbers represent the relative heights of the modes of the frequency
curves within each family.
A discussion of the general concept of survivor curves and retirement rate
method is presented in Appendix A of this report. A discussion of the net salvage
estimation process followed by Gannett Fleming in this study is attached as Appendix B.
Survivor Curve and Net Salvage Judgments The survivor curve estimates were based on judgment which considered a
number of factors. The primary factors were the statistical analysis of data; current
policies and outlook as determined during conversations with management personnel
and on the knowledge Gannett Fleming developed through the completion of numerous
gas utility studies.
The estimates of net salvage were based in part on historical data related to
actual retirement activity for the years 2002 through 2014 for most accounts. Gross
salvage and cost of removal as recorded to the depreciation reserve account and
related to experienced retirements were used. Percentages of the cost of plant retired
were calculated for each component of net salvage on annual, three-year rolling band
and the most five-year moving average bases. The net salvage estimates are
expressed as percentages of the cost of plant.
II-3

Gaz Métro 2014 Depreciation Study
The following discussion, dealing with a number of accounts which comprise the
majority of the investment analyzed, presents an overview of the factors considered by
Gannett Fleming in the determination of the average service life and net salvage
estimates. The survivor curve estimates for the remainder of the accounts not discussed
in the following sections were based on similar considerations.
Telephone interviews and discussions were held with key operational and
engineering groups. The interviews and discussions, combined with the information
gained in the interviews and discussions from prior depreciation studies, assisted
Gannett Fleming in the understanding of the historic forces of retirement that have
resulted in the statically developed average service life indications and on the
anticipated future forces of retirement. Based on these discussions, Gannett Fleming
is better able to determine if the results of the retirement rate analysis should be
adjusted to better reflect the future forces of retirement, or changes in technology.
Additionally, operational interviews provide information regarding the reuse practices
and policies and cost of retirement information. Each retirement rate analysis resulted in a life table which, when plotted, formed
an original survivor curve. Each original survivor curve, as plotted from the life table,
represents the average survivor pattern experienced by several vintage groups during
the experience band studied. Inasmuch as this survivor pattern does not necessarily
describe the life characteristics, interpretation of the original survivor curves is required
to use them as valid considerations in service life estimation. Iowa type curves were
used in these interpretations. The survivor curve estimates were based on judgment
which considered a number of factors as discussed above. The primary factors were
the statistical analysis of data, current policies and outlook as determined during
conversations with management and survivor curve estimates from previous studies of
this Company and other gas transmission and distribution companies. The specific
factors for the largest accounts follow.
Account Z11.51 – Distribution - Main Pipe Direct Plastic, is the largest account
studied and represents 26% of Gaz Métro’s depreciable plant. The retirements,
additions and other plant transactions for the period 1957 through 2014 were analyzed
by the retirement rate method. The original and smooth survivor curve is plotted on
II-4

Gaz Métro 2014 Depreciation Study
page V-20. Typical service lives for distribution mains range from 50 to 75 years.
In the previous study Gannett Fleming recommended the Iowa 60-R3. Although
a limited amount of retirement activity has been experienced for this account to date,
the Iowa 65-R3 represents a better fit to the data than the previous recommendation.
The Iowa 65-R3 is within the range typically used within the industry and consistent
with the peer analysis comparison. Discussions with the Gaz Métro’s operations and
engineering staff indicated that the recommended Iowa 65-R3 is a reasonable
expectation for the equipment in this account. With the limited retirement experience,
the Iowa 65-R3 recommended in this study provides recognition to the limited historic
retirement experience, is within the range typically used by industry, and provides for a
reasonable expectation of the future retirement trends. In Gannett Fleming’s
experience, the Iowa 65-R3 is judged to best represent the future expectations of the
equipment in this account.
This account has experienced a significant amount of net salvage (i.e. cost of
removal) activity since 2002, ranging from negative two percent to negative 45 percent
with the more current bands indicating values ranging from negative two percent to
negative five percent. The full depth band (i.e. cumulative from 2002 to 2014) indicates
a value of negative seven percent. A three-year moving average indicates a range from
negative four percent to negative 14 percent with the more current value indicating a
range from negative four percent to negative eight percent. The most recent five-year
average is negative six percent. The discussions held with the company operations and
engineering staff indicated that the historical indications would be indicative for the
future expectations for the equipment in this account. Based upon the historical results
and the comments from the operations and engineering staff, Gannett Fleming
recommends that negative three percent would best represent the future net salvage
expectations for the equipment in this account.
Account Z11.50 – Distribution - Main Pipe Steel, represents approximately 22%
of the depreciable plant studied. The retirements, additions and other plant transactions
for the period 1957 through 2014 were analyzed with the retirement rate method. The
original survivor curve, as plotted on page V-17, indicates low retirement ratios through
age 35 and then significantly increasing ratios of retirement thereafter through to the
II-5

Gaz Métro 2014 Depreciation Study
end of the observation period. This type of a trend in retirement ratios is consistent with
a higher mode R Iowa curve. The previously used Iowa curve estimate for this account
was the Iowa 50-R3. The retirement rate analysis indicated a decrease in average
service life estimate to 45 years and an increase in the mode from an R3 curve to the
R4 curve.
Gannett Fleming interviews of operations and engineering staff indicated that the
historical results for the equipment in this account would be indicative of the future
expectations. Based on the historical results and the confirmation of the operations and
engineering staff, the historical Iowa 45-R4 was judged to best represent the future
expectations of the equipment in this account.
This account has experienced a significant amount of net salvage (i.e. cost of
removal) activity since 2002, ranging from less than negative one percent to negative
100 percent with a full depth band (i.e. cumulative from 2002 to 2014) value of negative
23 percent. A three-year moving average indicates a range from negative two percent
to negative 36 percent with the most recent five-year average being negative 27
percent. The discussions held with the company operations and engineering staff
indicated that the historical indications would be reasonable future expectations for the
equipment in this account. Based upon the historical results and the comments from
the operations and engineering staff, Gannett Fleming recommends that negative 25
percent would best represent the future net salvage expectations for the equipment in
this account. The negative 25 percent net salvage recommendation is within the range
of the peer comparison analysis.
Account Z11.02 – Distribution Branch (Service) – Direct Plastic, represents
approximately 21% of the depreciable distribution plant studied. The retirements,
additions and other plant transactions for the period 1977 through 2014 were analyzed
with the retirement rate method. The original survivor curve, as plotted on page V-8,
indicates consistent retirement ratios through to age 33. The early retirement in this
account occurs at a lesser rate than occurs in the other larger distribution plant
accounts, and is consistent with industry trends for plant of this type. The previously
used Iowa curve selection for this account was the Iowa 50-R2.5. The retirement rate
analysis indicates that the previous selection is still a reasonable estimate for the
II-6

Gaz Métro 2014 Depreciation Study
equipment in this account. Typical average service lives for plastic gas distribution
services range from 33 to 55 years, with most being at least 50 years. Gannett Fleming
interviews of operations and engineering staff related to this account indicated that the
expectations of the company are that plastic distribution services should last at least 50
years on average and would have a maximum life of much more than 50 years. The 50-
R2.5 Iowa curve, provides a good interpretation of the historical data, and is forecast to
be representative of the anticipated future retirement activity.
This account has experienced a significant amount of net salvage (i.e. cost of
removal) activity since 2002, ranging from negative 29 percent to over negative 200
percent with a full depth band (i.e. cumulative from 2002 to 2014) value of negative 85
percent. A three-year moving average indicates a range from negative 38 percent to
negative 144 percent with the most recent five-year average being negative 110
percent. The discussions held with the company operations and engineering staff
indicated that the historical indications would be reasonable future expectations for the
equipment in this account. Based upon the historical results and the comments from
the operations and engineering staff, Gannett Fleming recommends that negative 100
percent would best represent the future net salvage expectations for the equipment in
this account. The negative 100 percent net salvage recommendation is within the range
of the peer comparison analysis.
Account Z31.00 – Transmission - Main Pipe represent approximately nine
percent of the depreciable plant studied. Plant accounting transactions from 1983
through 2014 were analyzed with the retirement rate method. The original survivor
curve, as plotted on page V-51, indicates that very little retirement activity has occurred
over this observation period. The previous Iowa 65-R3 estimate for this account was
based on the professional judgment of Gannett Fleming based on knowledge gained
through the completion of a number of depreciation studies for Canadian natural gas
and crude oil transmission systems. Gannett Fleming interviews of operations and
engineering staff in prior studies related to this account, indicated agreement with the
previous selection. A peer analysis comparison indicates a range from 60-65 years.
Based on the peer experience and confirmed with the Operations and Engineering staff
in prior studies, Gannett Fleming recommends the continued use of the Iowa 65-R3 at
II-7

Gaz Métro 2014 Depreciation Study
this time.
The Iowa 65-R3 recommended in this study provides recognition to the limited
historic retirement experience, is within the range typically used by industry, and
provides for a reasonable expectation of the future retirement trends.
This account has only a few years of net salvage (i.e. cost of removal) activity.
The total cumulative value for the last seven years has been negative 19 percent since
2008, ranging from less than negative five percent to negative 116 percent with a full
depth band (i.e. cumulative from 2008 to 2014) value of negative 19 percent. The most
recent three-year and five-year moving average indicates a value of negative eight
percent for both bands. The discussions held with the company operations and
engineering staff indicated that the historical indications would be reasonable future
expectations for the equipment in this account. Based upon the historical results and
the comments from the operations and engineering staff, Gannett Fleming recommends
that negative 10 percent would best represent the future net salvage expectations for
the equipment in this account. The negative 10 percent net salvage recommendation is
within the range of the peer comparison analysis.
Account Z11.00 - Distribution Branch (Service) - Steel – represents
approximately five percent of the depreciable distribution plant studied. The retirements,
additions and other plant transactions for the period 1957 through 2014 were analyzed
using the retirement rate analysis method. The original survivor curve, as plotted on
page V-2, indicates a trend of significant retirement ratios beginning early in the life of
the account and continuing at a constant rate through the 56-year observation period.
The high frequency of early retirement ratios is typical of distribution plant of this type
and leads to a low mode Iowa curve. The previously used Iowa curve estimate for this
account was the Iowa 45-R1.5. The statistical analysis indicates that the previous
selected R1.5 mode is still appropriate for this account. However, a small decrease
from the previous 45-year average service life to a 43-year average service life is
warranted. The discussions held with the company operations and engineering staff
indicated that the historical indications would be indicative for the future expectations for
the equipment in this account. The Iowa 43-R1.5 provides a good interpretation of the
historical data for the first 30 years of the account’s life and provides a better fit to the
II-8

Gaz Métro 2014 Depreciation Study
historical data from age 30 onward than the previous Iowa 45-R1.5. Based on the
above information, Gannett Fleming recommends the Iowa 43-R1.5 to best represent
the future characteristics of the equipment in this account.
This account has experienced a significant amount of net salvage (i.e. cost of
removal) activity since 2002, ranging from negative three percent to negative 116
percent with a full depth band (i.e. cumulative from 2002 to 2014) value of negative 22
percent. A three-year moving average indicates a range from negative 10 percent to
negative 33 percent with the most recent five-year average being negative 28 percent.
The discussions held with the company operations and engineering staff indicated that
the historical indications would be reasonable future expectations for the equipment in
this account. Based upon the historical results and the comments from the operations
and engineering staff, Gannett Fleming recommends that negative 20 percent would
best represent the future net salvage expectations for the equipment in this account.
The negative 20 percent net salvage recommendation is within the range of the peer
comparison analysis.
Account Z12.00 - Distribution Meter - represent approximately five percent of the
depreciable plant studied. Plant accounting transactions from 1956 through 2014 were
analyzed with the retirement rate method. The original survivor curve, as plotted on
page V-26, indicates a significant amount of retirement activity in this account through
the complete observation period. The retirement rate analysis provided a best fitting
Iowa curve estimate of the Iowa 22-R2.5. The currently approved Iowa curve estimate is
the Iowa 18-R1.5. Gannett Fleming held interviews with the company’s internal experts
in the area of metering. Recent pronouncements made by Measurement Canada lead
the company to believe that the older analog natural gas metering equipment will
undergo a period of significant retirement activity as it will be difficult for the existing
analog meters to pass the new stringent testing requirements. Gannett Fleming has
witnessed a trend in recent depreciation studies of natural gas plant where the
increased use of digital metering equipment has caused the typical average service life
estimates for this equipment to be reduced from the previous 25 to 35-year range to 15
or 20 years. The company’s internal metering experts indicated that some of the casing
material may have a life expectation of approximately 20 years and the internal
II-9

Gaz Métro 2014 Depreciation Study
component parts would have an estimated life of 15 years. They also indicated that the
continued use of the 18-year average service life continues to be appropriate for the
equipment in this account. Gannett Fleming notes that similar experience and
expectation is now common in the natural gas distribution industry. Gannett Fleming
also recommends a change to the R2.5 Iowa curve from the currently used Iowa R1.5
based on the retirement rate analysis. The recommended Iowa R2.5 curve when
combined with the currently used 18-year average service life provides a reasonable
expectation for the equipment in this account.
The survivor curve estimates for the remaining accounts, were based on similar
considerations of historical analyses, management outlook and estimates for the
company and other natural gas distribution utilities.
Following is a brief summary for the accounts not discussed above where a
significant net salvage recommendation is made, outlining the various factors
considered by Gannett Fleming in forming the net salvage recommendation.
Account Z11.03 – Distribution Branch (Service) - Insert Plastic - This account has
experienced net salvage (i.e. cost of removal) activity since 2010. The values have
ranged from negative ten percent to over negative 200 percent with a total cumulative
value for the last five years indicating negative 89 percent. The three-year moving
average has ranged from negative 50 percent to negative 123 percent with the most
recent three-year average being negative 50 percent. The most recent five-year
average is negative 89 percent. The discussions held with the company operations and
engineering staff indicated that the historical indications would be reasonable future
expectations for the equipment in this account. Based upon the historical results and
the comments from the operations and engineering staff, Gannett Fleming recommends
that negative 40 percent would best represent the future net salvage expectations for
the equipment in this account. The negative 40 percent net salvage recommendation is
within the range of the peer comparison analysis.
Account Z13.00 - Distribution Release Station - Equipment – This account has
experienced a significant amount of net salvage (i.e. cost of removal) activity since
2002, ranging from negative one percent to over negative 600 percent with a full depth
band (i.e. cumulative from 2002 to 2014) value of negative 33 percent. A three-year
II-10

Gaz Métro 2014 Depreciation Study
moving average indicates a range from negative 12 percent to negative 75 percent with
the most recent five-year average being negative 31 percent. The discussions held with
the company operations and engineering staff indicated that the historical indications
would be indicative for the future expectations for the equipment in this account. Based
upon the historical results and the comments from the operations and engineering staff,
Gannett Fleming recommends that negative 30 percent would best represent the future
net salvage expectations for the equipment in this account.
The net salvage estimates for the remaining accounts, were based on similar
considerations of historical analyses, management outlook and estimates for the
company and other natural gas transmission and distribution utilities.
II-11

Gaz Métro 2014 Depreciation Study
PART III. CALCULATION OF ANNUAL AND ACCRUED DEPRECIATION
III-1

Gaz Métro 2014 Depreciation Study
PART III. CALCULATION OF ANNUAL AND ACCRUED DEPRECIATION
Group Depreciation Procedures When more than a single item of property is under consideration, a group
procedure for depreciation is appropriate because normally all of the items within a
group do not have identical service lives, but have lives that are dispersed over a range
of time. There are two primary group procedures, namely, Average Service Life (ASL)
and Equal Life Group (ELG).
In the ELG procedure, the property group is subdivided according to service life.
That is, each equal life group includes that portion of the property which experiences the
life of that specific group. The relative size of each equal life group is determined from
the property's life dispersion curve. The calculated depreciation for the property group
is the summation of the calculated depreciation based on the service life of each equal
life group.
The table on the following page presents an illustration of the calculation of equal
life group depreciation in a mass property account using the Iowa 15-R3 survivor curve,
0 percent net salvage and a September 30, 2014 calculation date. In the table, each
equal life group is defined by the age interval shown in columns 1 and 2. These are the
ages at which the first and last retirement of each group occurs, and the group's equal
life, shown in column 3, is the midpoint of the interval. For purposes of the calculation,
each vintage is divided into equal life groups arranged so that the midpoint of each one-
year age interval coincides with the calculation date, e.g., September 30 in this case.
This enables the calculation of annual accruals for a twelve-month period centered on
the date of calculation.
The retirement during the age interval, shown in column 4, is the size of each
equal life group and is derived from the Iowa 15-R3 survivor curve and 0 percent net
salvage. It is the difference between the percents surviving at the beginning and end of
the age interval. Each equal life group's annual accrual, shown in column 5, equals the
group's size (column 4) divided by its life (column 3).
III-2

Gaz Métro 2014 Depreciation Study
Columns 7 through 10 show the derivation of the annual and accrued factors for
each vintage based on the information developed in the first five columns. The year
installed is shown in column 6. For all vintages other than 2010, the summation of
annual accruals for each year installed, shown in column 7, is calculated by adding one-
half of the group annual accrual (column 5) for that vintage's current age interval plus
the group annual accruals for all succeeding age intervals. For example, the figure
7.53413204309 for 2013 equals one-half of 0.14669333333 plus all of the succeeding
figures in column 5. Only one-half of the annual accrual for the vintage's current age
interval group is included in the summation because the equal life group for that interval
has reached the year during which it is expected to be retired. DETAILED COMPUTATION OF ANNUAL AND ACCRUED FACTORS USING THE EQUAL LIFE GROUP PROCEDURE INPUT PARAMETERS: CALCULATION DATE.. 09-31-2014 SURVIVOR CURVE.... 15-R3 RETIREMENTS GROUP SUMMATION AVERAGE AGE INTERVAL DURING ANNUAL YEAR OF ANNUAL PERCENT ANNUAL ACCRUED BEG END LIFE INTERVAL ACCRUAL INST ACCRUALS SURVIVING FACTOR FACTOR (1) (2) (3) (4) (5)=(4)/(3) (6) (7) (8) (9) (10) 0.000 1.000 0.500 0.13204 0.13204000000 2014 7.73951870976 99.939619 0.0774 0.0387 1.000 2.000 1.500 0.22004 0.14669333333 2013 7.53413204309 99.757940 0.0755 0.1133 2.000 3.000 2.500 0.34901 0.13960400000 2012 7.39098337643 99.473416 0.0743 0.1858 3.000 4.000 3.500 0.53168 0.15190857143 2011 7.24522709071 99.033069 0.0732 0.2562 4.000 5.000 4.500 0.77648 0.17255111111 2010 7.08299724944 98.378988 0.0720 0.3240 5.000 6.000 5.500 1.09520 0.19912727273 2009 6.89715805752 97.443149 0.0708 0.3894 6.000 7.000 6.500 1.50085 0.23090000000 2008 6.68214442116 96.145127 0.0695 0.4518 7.000 8.000 7.500 1.99686 0.26624800000 2007 6.43357042116 94.396275 0.0682 0.5115 8.000 9.000 8.500 2.59836 0.30568941176 2006 6.14760171528 92.098663 0.0668 0.5678 9.000 10.000 9.500 3.32846 0.35036421053 2005 5.81957490413 89.135249 0.0653 0.6204 10.000 11.000 10.500 4.20015 0.40001428571 2004 5.44438565601 85.370944 0.0638 0.6699 11.000 12.000 11.500 5.24273 0.45588956522 2003 5.01643373055 80.649505 0.0622 0.7153 12.000 13.000 12.500 6.46397 0.51711760000 2002 4.52993014794 74.796157 0.0606 0.7575 13.000 14.000 13.500 7.78086 0.57636000000 2001 3.98319134794 67.673742 0.0589 0.7952 14.000 15.000 14.500 9.04123 0.62353310345 2000 3.38324479621 59.262695 0.0571 0.8280 15.000 16.000 15.500 9.97724 0.64369290323 1999 2.74963179287 49.753461 0.0553 0.8572 16.000 17.000 16.500 10.26569 0.62216303030 1998 2.11670382611 39.631994 0.0534 0.8811 17.000 18.000 17.500 9.71888 0.55536457143 1997 1.52794002524 29.639708 0.0516 0.9030 18.000 19.000 18.500 8.35418 0.45157729730 1996 1.02446909088 20.603179 0.0497 0.9195 19.000 20.000 19.500 6.50335 0.33350512821 1995 0.63192787812 13.174414 0.0480 0.9360 20.000 21.000 20.500 4.58978 0.22389170732 1994 0.35322946036 7.627850 0.0463 0.9492 21.000 22.000 21.500 2.91547 0.13560325581 1993 0.17348197879 3.875224 0.0448 0.9632 22.000 23.000 22.500 1.61144 0.07161955556 1992 0.06987057311 1.611769 0.0434 0.9765 23.000 24.000 23.500 0.66967 0.02849659574 1991 0.01981249746 0.471215 0.0420 0.9870 24.000 25.000 24.500 0.13425 0.00547959184 1990 0.00282440367 0.069256 0.0408 0.9996 25.000 25.350 25.175 0.00213 0.00008460775 1989 0.00001480636 0.000373 0.0397 1.0000 TOTAL 100.00000
The summation of annual accruals (column 7) for installations during 2014 is
calculated on the basis of an in-service date at the midpoint of the year, i.e., March 31.
III-3

Gaz Métro 2014 Depreciation Study
Inasmuch as the overall calculation is centered on September 30, 2014, the first figure
in column 7, for vintage 2014, equals all of the group annual accrual for the first equal
life group plus the accruals for all of the subsequent equal life groups.
The average percent surviving derived from the Iowa 15-R3 survivor curve and 0
percent net salvage, is shown in column 8 for each age interval. The annual factor,
shown in column 9, is the result of dividing the summation of annual accruals (column 7)
by the average percent surviving (column 8). The accrued factor, shown in column 10,
equals the annual factor multiplied by the age of the group at September 30, 2014.
III-4

Gaz Métro 2014 Depreciation Study
PART IV. RESULTS OF STUDY
IV-1

Gaz Métro 2014 Depreciation Study
PART IV. RESULTS OF STUDY
QUALIFICATION OF RESULTS
The calculated annual and accrued depreciation are the principal results of the
study. Continued surveillance and periodic revisions are normally required to maintain
continued use of appropriate annual depreciation accrual rates. An assumption that
accrual rates can remain unchanged over a long period of time implies a disregard for
the inherent variability in service lives and salvage and for the change of the
composition of property in service. The annual accrual rates and the accrued
depreciation were calculated in accordance with the straight line method, using the
equal life group procedure based on estimates which reflect considerations of current
historical evidence and expected future conditions.
DESCRIPTION OF DETAILED TABULATIONS
The service life estimates were based on judgment that incorporated statistical
analysis of retirement data, discussions with management and consideration of
estimates made for other electric utilities. The results of the statistical analysis of
service life are presented in the section beginning on page V-2 of this report.
For each depreciable group analyzed by the retirement rate method, a chart
depicting the original and estimated survivor curves followed by a tabular presentation
of the original life table(s) plotted on the chart. The survivor curves estimated for the
depreciable groups are shown as dark smooth curves on the charts. Each smooth
survivor curve is denoted by a numeral followed by the curve type designation. The
numeral used is the average life derived from the entire curve from 100 percent to zero
percent surviving. The titles of the chart indicate the group, the symbol used to plot the
points of the original life table, and the experience and placement bands of the life
tables which where plotted. The experience band indicates the range of years for which
retirements were used to develop the stub survivor curve. The placements indicate, for
the related experience band, the range of years of installations which appear in the
experience.
IV-2

Gaz Métro 2014 Depreciation Study
The tables of the calculated annual depreciation applicable to depreciable assets
as of September 30, 2014 are presented in account sequence starting on page VII-2 of
the supporting documents. The tables indicate the estimated average survivor curves
used in the calculations. The tables set forth, for each installation year, the original cost,
calculated accrued depreciation, and the calculated annual accrual.
IV-3

Gaz Métro 2014 Depreciation Study
EST
IMAT
ED
EST
IMAT
ED
EST
IMAT
ED
SU
RVI
VIN
G
BO
OK
ED
CO
MPO
SITE
Y
EAR
OF
FIN
AL
SU
RVI
VOR
N
ET
OR
IGIN
AL C
OST
D
EPR
ECIA
TIO
N
FU
TUR
E R
EMAI
NIN
G
AC
CO
UN
T D
ESC
RIP
TIO
N
RET
IREM
ENT
CU
RVE
S
ALVA
GE
AS
OF
09/3
0/20
14
RES
ERVE
A
CC
RU
ALS
AM
OU
NT
RAT
E L
IFE
(1)
(2)
(3)
(4)
(5)
(6)
(7)
(8)
(9)
(10)
=(9)
/(6)
(11)
=(8)
/(9)
Z10.
50
D
ISTR
IBU
TIO
N S
ER
VIT
UD
E (E
AS
EM
EN
T)
70
-SQ
014
,913
,896
3,48
8,15
911
,425
,737
212,
288
1.42
53.8
Z11.
00
D
ISTR
IBU
TIO
N B
RA
NC
H (S
ER
VIC
E) -
STE
EL
43-R
1.5
(20)
160,
387,
813
99,5
53,9
1192
,911
,465
4,01
7,21
52.
5023
.1Z1
1.01
DIS
TRIB
UTI
ON
BR
AN
CH
(SE
RV
ICE
) - C
OP
PE
R IN
SE
RTS
16-L
1(7
0)1,
079,
344
1,80
9,50
825
,377
8,86
30.
822.
9Z1
1.02
DIS
TRIB
UTI
ON
BR
AN
CH
(SE
RV
ICE
) - D
IRE
CT
PLA
STI
C
50
-R2.
5(1
00)
671,
692,
972
261,
698,
548
1,08
1,68
7,39
734
,647
,287
5.16
31.2
Z11.
03
D
ISTR
IBU
TIO
N B
RA
NC
H (S
ER
VIC
E) -
INS
ER
T P
LAS
TIC
50-R
2.5
(40)
75,6
64,5
5062
,174
,243
43,7
56,1
261,
716,
664
2.27
25.5
Z11.
04
D
ISTR
IBU
TIO
N B
RA
NC
H (S
ER
VIC
E) -
PR
E-R
ELE
AS
E P
LAS
TIC
35-R
4(4
0)1,
819,
359
888,
404
1,65
8,69
810
1,15
15.
5616
.4Z1
1.05
DIS
TRIB
UTI
ON
BR
AN
CH
(SE
RV
ICE
) - P
RE
-RE
LEA
SE
STE
EL
35-R
4(4
0)57
2,32
280
,395
720,
856
41,3
467.
2217
.4Z1
1.50
DIS
TRIB
UTI
ON
- M
AIN
PIP
E S
TEE
L
45
-R4
(25)
694,
097,
590
367,
781,
963
499,
840,
025
21,7
11,9
893.
1323
.0Z1
1.51
DIS
TRIB
UTI
ON
- M
AIN
PIP
E D
IRE
CT
PLA
STI
C
65
-R3
(3)
822,
017,
348
286,
235,
073
560,
442,
796
12,8
20,4
571.
5643
.7Z1
1.52
DIS
TRIB
UTI
ON
- M
AIN
PIP
E P
LAS
TIC
INS
ER
TS
65
-R4
(10)
64,1
09,7
5036
,653
,964
33,8
66,7
6191
9,42
01.
4336
.8Z1
2.00
DIS
TRIB
UTI
ON
ME
TER
18-R
2.5
015
9,05
8,39
662
,122
,116
96,9
36,2
8011
,407
,281
7.17
8.5
Z12.
50
D
ISTR
IBU
TIO
N D
ELI
VE
RY
STA
TIO
N -
EQ
UIP
ME
NT
37-R
3(1
0)83
,528
,413
59,0
30,0
3532
,851
,219
1,69
9,70
62.
0319
.3Z1
2.51
DIS
TRIB
UTI
ON
DE
LIV
ER
Y S
TATI
ON
- C
IVIL
BU
ILD
ING
39-R
4(1
0)13
,085
,002
8,33
3,76
26,
059,
740
322,
520
2.46
18.8
Z13.
00
D
ISTR
IBU
TIO
N R
ELE
AS
E S
TATI
ON
- E
QU
IPM
EN
T
34
-R1.
5(3
0)38
,523
,250
24,6
08,0
3225
,472
,193
1,45
0,56
83.
7717
.6Z1
3.01
DIS
TRIB
UTI
ON
RE
LEA
SE
STA
TIO
N -
CIV
IL B
UIL
DIN
G
35
-R3
(10)
7,73
9,74
54,
033,
220
4,48
0,49
923
6,08
13.
0519
.0Z1
5.01
DIS
TRIB
UTI
ON
BIO
GA
Z - S
ER
VIT
UD
E9/
30/2
031
70-S
Q0
3,41
51,
136
2,27
913
63.
9816
.8Z1
5.50
DIS
TRIB
UTI
ON
BIO
GA
Z - M
AIN
PIP
E -
STE
EL
9/30
/203
165
-R3
(25)
1,97
2,47
573
2,76
61,
732,
828
105,
221
5.33
16.5
Z15.
60
D
ISTR
IBU
TIO
N B
IOG
AZ
- CO
MP
RE
SS
ION
STA
TIO
N -
EQ
UIP
ME
NT
9/30
/203
125
-R2.
5(1
0)4,
046,
626
1,46
0,33
12,
990,
958
233,
102
5.76
12.8
Z15.
61
D
ISTR
IBU
TIO
N B
IOG
AZ
- CO
MP
RE
SS
ION
STA
TIO
N -
BU
ILD
ING
9/30
/203
140
-R2
(10)
1,76
0,47
863
6,93
51,
299,
591
86,5
224.
9115
.0Z1
5.70
DIS
TRIB
UTI
ON
BIO
GA
Z - M
ETE
R S
TATI
ON
- E
QU
IPM
EN
T9/
30/2
031
25-R
2.5
(25)
294,
902
121,
861
246,
766
19,6
786.
6712
.5Z1
5.71
DIS
TRIB
UTI
ON
BIO
GA
Z - M
ETE
R S
TATI
ON
- B
UIL
DIN
G9/
30/2
031
40-R
2(1
0)17
0,12
562
,413
124,
724
8,30
94.
8815
.0Z3
0.50
TR
AN
SM
ISS
ION
- S
ER
VIT
UD
ES
70-S
Q0
12,7
43,8
2812
,400
,331
343,
496
6,93
70.
0549
.5Z3
1.00
TR
AN
SM
ISS
ION
- M
AIN
PIP
E
65
-R3
(10)
288,
121,
224
278,
459,
468
38,4
73,8
781,
031,
040
0.36
37.3
Z40.
51
S
TOC
KIN
G -
AD
MIN
ISTR
ATI
VE
BU
ILD
ING
35-R
30
3,62
7,54
61,
377,
246
2,25
0,30
010
4,19
82.
8721
.6Z4
0.52
STO
CK
ING
- B
UIL
DIN
G IN
FRA
STR
UC
TUR
E
44
-R3
(35)
23,7
52,0
4414
,136
,042
17,9
29,2
1770
3,84
92.
9625
.5Z4
1.01
STO
CK
ING
- M
EC
HA
NIC
AL
EQ
UIP
ME
NT
35-R
30
8,83
6,56
16,
551,
560
2,28
5,00
110
2,62
41.
1622
.3Z4
1.02
STO
CK
ING
- E
LEC
TRO
NIC
EQ
UIP
ME
NT
15-R
30
2,15
6,29
22,
070,
484
85,8
087,
724
0.36
11.1
Z41.
03
S
TOC
KIN
G -
SP
EC
IALI
ZED
EQ
UIP
ME
NT
25-R
40
2,35
2,51
41,
578,
804
773,
711
132,
695
5.64
5.8
TOTA
L PL
ANT
3,15
8,12
7,77
91,
598,
080,
710
2,56
0,67
3,72
693
,854
,871
CAL
CU
LATE
D A
NN
UAL
GAZ
MÉT
RO
TAB
LE 1
. ES
TIM
ATED
SU
RVI
VOR
CU
RVE
S, N
ET S
ALVA
GE
PER
CEN
TS, O
RIG
INAL
CO
ST A
ND
AN
NU
AL A
CC
RU
ALS
BAS
ED O
N S
UR
VIVI
NG
PLA
NT
AS O
F SE
PTEM
BER
30,
201
4"C
OM
BIN
ED L
IFE
AND
NET
SAL
VAG
E AN
ALYS
IS"
IV-4

Gaz Métro 2014 Depreciation Study
EST
IMAT
ED
EST
IMAT
ED
EST
IMAT
ED
SU
RVI
VIN
G
BO
OK
ED
CO
MPO
SITE
Y
EAR
OF
FIN
AL
SU
RVI
VOR
N
ET
OR
IGIN
AL C
OST
D
EPR
ECIA
TIO
N
FU
TUR
E R
EMAI
NIN
G
AC
CO
UN
T D
ESC
RIP
TIO
N
RET
IREM
ENT
CU
RVE
S
ALVA
GE
AS
OF
09/3
0/20
14
RES
ERVE
A
CC
RU
ALS
AM
OU
NT
RAT
E L
IFE
(1)
(2)
(3)
(4)
(5)
(6)
(7)
(8)
(9)
(10)
=(9)
/(6)
(11)
=(8)
/(9)
Z10.
50
D
ISTR
IBU
TIO
N S
ER
VIT
UD
E (E
AS
EM
EN
T)
70
-SQ
014
,913
,896
3,48
8,15
911
,425
,737
212,
288
1.42
53.8
Z11.
00
D
ISTR
IBU
TIO
N B
RA
NC
H (S
ER
VIC
E) -
STE
EL
43-R
1.5
016
0,38
7,81
379
,901
,066
80,4
86,7
473,
513,
427
2.19
22.9
Z11.
01
D
ISTR
IBU
TIO
N B
RA
NC
H (S
ER
VIC
E) -
CO
PP
ER
INS
ER
TS
16
-L1
01,
079,
344
1,18
8,84
9(1
09,5
05)
00.
000.
0Z1
1.02
DIS
TRIB
UTI
ON
BR
AN
CH
(SE
RV
ICE
) - D
IRE
CT
PLA
STI
C
50
-R2.
50
671,
692,
972
208,
260,
195
463,
432,
777
14,3
69,0
332.
1432
.3Z1
1.03
DIS
TRIB
UTI
ON
BR
AN
CH
(SE
RV
ICE
) - IN
SE
RT
PLA
STI
C
50
-R2.
50
75,6
64,5
5044
,971
,230
30,6
93,3
201,
200,
960
1.59
25.6
Z11.
04
D
ISTR
IBU
TIO
N B
RA
NC
H (S
ER
VIC
E) -
PR
E-R
ELE
AS
E P
LAS
TIC
35-R
40
1,81
9,35
990
8,16
091
1,19
951
,686
2.84
17.6
Z11.
05
D
ISTR
IBU
TIO
N B
RA
NC
H (S
ER
VIC
E) -
PR
E-R
ELE
AS
E S
TEE
L
35
-R4
057
2,32
227
2,13
330
0,18
913
,775
2.41
21.8
Z11.
50
D
ISTR
IBU
TIO
N -
MA
IN P
IPE
STE
EL
45-R
40
694,
097,
590
304,
753,
761
389,
343,
829
16,7
30,3
492.
4123
.3Z1
1.51
DIS
TRIB
UTI
ON
- M
AIN
PIP
E D
IRE
CT
PLA
STI
C
65
-R3
082
2,01
7,34
825
9,96
4,88
956
2,05
2,45
912
,929
,630
1.57
43.5
Z11.
52
D
ISTR
IBU
TIO
N -
MA
IN P
IPE
PLA
STI
C IN
SE
RTS
65-R
40
64,1
09,7
5033
,474
,763
30,6
34,9
8783
1,40
21.
3036
.8Z1
2.00
DIS
TRIB
UTI
ON
ME
TER
18-R
2.5
015
9,05
8,39
662
,122
,116
96,9
36,2
8011
,407
,281
7.17
8.5
Z12.
50
D
ISTR
IBU
TIO
N D
ELI
VE
RY
STA
TIO
N -
EQ
UIP
ME
NT
37-R
30
83,5
28,4
1350
,886
,706
32,6
41,7
071,
779,
795
2.13
18.3
Z12.
51
D
ISTR
IBU
TIO
N D
ELI
VE
RY
STA
TIO
N -
CIV
IL B
UIL
DIN
G
39
-R4
013
,085
,002
8,07
1,78
15,
013,
221
252,
368
1.93
19.9
Z13.
00
D
ISTR
IBU
TIO
N R
ELE
AS
E S
TATI
ON
- E
QU
IPM
EN
T
34
-R1.
50
38,5
23,2
5022
,181
,297
16,3
41,9
5386
4,90
62.
2518
.9Z1
3.01
DIS
TRIB
UTI
ON
RE
LEA
SE
STA
TIO
N -
CIV
IL B
UIL
DIN
G
35
-R3
07,
739,
745
4,55
2,59
93,
187,
146
130,
486
1.69
24.4
Z15.
01
D
ISTR
IBU
TIO
N B
IOG
AZ
- SE
RV
ITU
DE
9/30
/203
170
-SQ
03,
415
1,13
62,
279
136
3.98
16.8
Z15.
50
D
ISTR
IBU
TIO
N B
IOG
AZ
- MA
IN P
IPE
- S
TEE
L9/
30/2
031
65-R
30
1,97
2,47
566
3,21
31,
309,
262
79,5
024.
0316
.5Z1
5.60
DIS
TRIB
UTI
ON
BIO
GA
Z - C
OM
PR
ES
SIO
N S
TATI
ON
- E
QU
IPM
EN
T9/
30/2
031
25-R
2.5
04,
046,
626
1,38
5,69
72,
660,
929
207,
351
5.12
12.8
Z15.
61
D
ISTR
IBU
TIO
N B
IOG
AZ
- CO
MP
RE
SS
ION
STA
TIO
N -
BU
ILD
ING
9/30
/203
140
-R2
01,
760,
478
608,
720
1,15
1,75
876
,678
4.36
15.0
Z15.
70
D
ISTR
IBU
TIO
N B
IOG
AZ
- ME
TER
STA
TIO
N -
EQ
UIP
ME
NT
9/30
/203
125
-R2.
50
294,
902
108,
563
186,
339
14,8
595.
0412
.5Z1
5.71
DIS
TRIB
UTI
ON
BIO
GA
Z - M
ETE
R S
TATI
ON
- B
UIL
DIN
G9/
30/2
031
40-R
20
170,
125
59,6
9211
0,43
37,
357
4.32
15.0
Z30.
50
T
RA
NS
MIS
SIO
N -
SE
RV
ITU
DE
S
70
-SQ
012
,743
,828
12,4
00,3
3134
3,49
66,
937
0.05
49.5
Z31.
00
T
RA
NS
MIS
SIO
N -
MA
IN P
IPE
65-R
30
288,
121,
224
276,
232,
421
11,8
88,8
0323
5,87
00.
0850
.4Z4
0.51
STO
CK
ING
- A
DM
INIS
TRA
TIV
E B
UIL
DIN
G
35
-R3
03,
627,
546
1,37
7,24
62,
250,
300
104,
198
2.87
21.6
Z40.
52
S
TOC
KIN
G -
BU
ILD
ING
INFR
AS
TRU
CTU
RE
44-R
30
23,7
52,0
448,
839,
987
14,9
12,0
5762
8,21
22.
6423
.7Z4
1.01
STO
CK
ING
- M
EC
HA
NIC
AL
EQ
UIP
ME
NT
35-R
30
8,83
6,56
16,
551,
560
2,28
5,00
110
2,62
41.
1622
.3Z4
1.02
STO
CK
ING
- E
LEC
TRO
NIC
EQ
UIP
ME
NT
15-R
30
2,15
6,29
22,
070,
484
85,8
087,
724
0.36
11.1
Z41.
03
S
TOC
KIN
G -
SP
EC
IALI
ZED
EQ
UIP
ME
NT
25-R
40
2,35
2,51
41,
578,
804
773,
711
132,
695
5.64
5.8
TOTA
L PL
ANT
3,15
8,12
7,77
91,
396,
875,
558
1,76
1,25
2,22
265
,891
,529
CAL
CU
LATE
D A
NN
UAL
GAZ
MÉT
RO
TAB
LE 1
A. E
STIM
ATED
SU
RVI
VOR
CU
RVE
S, N
ET S
ALVA
GE
PER
CEN
TS, O
RIG
INAL
CO
ST A
ND
AN
NU
AL A
CC
RU
ALS
BAS
ED O
N S
UR
VIVI
NG
PLA
NT
AS O
F SE
PTEM
BER
30,
201
4"L
IFE
ANAL
YSIS
"
IV-5

Gaz Métro 2014 Depreciation Study
EST
IMAT
ED
EST
IMAT
ED
EST
IMAT
ED
SU
RVI
VIN
G
BO
OK
ED
CO
MPO
SITE
Y
EAR
OF
FIN
AL
SU
RVI
VOR
N
ET
OR
IGIN
AL C
OST
D
EPR
ECIA
TIO
N
FU
TUR
E R
EMAI
NIN
G
AC
CO
UN
T D
ESC
RIP
TIO
N
RET
IREM
ENT
CU
RVE
S
ALVA
GE
AS
OF
09/3
0/20
14
RES
ERVE
A
CC
RU
ALS
AM
OU
NT
RAT
E L
IFE
(1)
(2)
(3)
(4)
(5)
(6)
(7)
(8)
(9)
(10)
=(9)
/(6)
(11)
=(8)
/(9)
Z10.
50
D
ISTR
IBU
TIO
N S
ER
VIT
UD
E (E
AS
EM
EN
T)
70
-SQ
014
,913
,896
00
00.
0053
.8Z1
1.00
DIS
TRIB
UTI
ON
BR
AN
CH
(SE
RV
ICE
) - S
TEE
L
43
-R1.
5(2
0)16
0,38
7,81
319
,652
,845
12,4
24,7
1850
3,78
80.
3123
.1Z1
1.01
DIS
TRIB
UTI
ON
BR
AN
CH
(SE
RV
ICE
) - C
OP
PE
R IN
SE
RTS
16-L
1(7
0)1,
079,
344
620,
659
134,
882
8,86
30.
822.
9Z1
1.02
DIS
TRIB
UTI
ON
BR
AN
CH
(SE
RV
ICE
) - D
IRE
CT
PLA
STI
C
50
-R2.
5(1
00)
671,
692,
972
53,4
38,3
5361
8,25
4,62
020
,278
,254
3.02
31.2
Z11.
03
D
ISTR
IBU
TIO
N B
RA
NC
H (S
ER
VIC
E) -
INS
ER
T P
LAS
TIC
50-R
2.5
(40)
75,6
64,5
5017
,203
,013
13,0
62,8
0651
5,70
40.
6825
.5Z1
1.04
DIS
TRIB
UTI
ON
BR
AN
CH
(SE
RV
ICE
) - P
RE
-RE
LEA
SE
PLA
STI
C
35
-R4
(40)
1,81
9,35
9(1
9,75
6)74
7,49
949
,465
2.72
16.4
Z11.
05
D
ISTR
IBU
TIO
N B
RA
NC
H (S
ER
VIC
E) -
PR
E-R
ELE
AS
E S
TEE
L
35
-R4
(40)
572,
322
(191
,738
)42
0,66
727
,571
4.81
17.4
Z11.
50
D
ISTR
IBU
TIO
N -
MA
IN P
IPE
STE
EL
45-R
4(2
5)69
4,09
7,59
063
,028
,202
110,
496,
196
4,98
1,64
00.
7223
.0Z1
1.51
DIS
TRIB
UTI
ON
- M
AIN
PIP
E D
IRE
CT
PLA
STI
C
65
-R3
(3)
822,
017,
348
26,2
70,1
84(1
,609
,663
)(1
09,1
73)
(0.0
1)43
.7Z1
1.52
DIS
TRIB
UTI
ON
- M
AIN
PIP
E P
LAS
TIC
INS
ER
TS
65
-R4
(10)
64,1
09,7
503,
179,
201
3,23
1,77
488
,018
0.13
36.8
Z12.
00
D
ISTR
IBU
TIO
N M
ETE
R
18
-R2.
50
159,
058,
396
00
00.
008.
5Z1
2.50
DIS
TRIB
UTI
ON
DE
LIV
ER
Y S
TATI
ON
- E
QU
IPM
EN
T
37
-R3
(10)
83,5
28,4
138,
143,
329
209,
512
(80,
089)
(0.1
0)19
.3Z1
2.51
DIS
TRIB
UTI
ON
DE
LIV
ER
Y S
TATI
ON
- C
IVIL
BU
ILD
ING
39-R
4(1
0)13
,085
,002
261,
981
1,04
6,51
970
,152
0.53
18.8
Z13.
00
D
ISTR
IBU
TIO
N R
ELE
AS
E S
TATI
ON
- E
QU
IPM
EN
T
34
-R1.
5(3
0)38
,523
,250
2,42
6,73
59,
130,
240
585,
662
1.52
17.6
Z13.
01
D
ISTR
IBU
TIO
N R
ELE
AS
E S
TATI
ON
- C
IVIL
BU
ILD
ING
35-R
3(1
0)7,
739,
745
(519
,379
)1,
293,
353
105,
595
1.36
19.0
Z15.
01
D
ISTR
IBU
TIO
N B
IOG
AZ
- SE
RV
ITU
DE
9/30
/203
170
-SQ
03,
415
00
00.
0016
.8Z1
5.50
DIS
TRIB
UTI
ON
BIO
GA
Z - M
AIN
PIP
E -
STE
EL
9/30
/203
165
-R3
(25)
1,97
2,47
569
,553
423,
566
25,7
191.
3016
.5Z1
5.60
DIS
TRIB
UTI
ON
BIO
GA
Z - C
OM
PR
ES
SIO
N S
TATI
ON
- E
QU
IPM
EN
T9/
30/2
031
25-R
2.5
(10)
4,04
6,62
674
,634
330,
029
25,7
510.
6412
.8Z1
5.61
DIS
TRIB
UTI
ON
BIO
GA
Z - C
OM
PR
ES
SIO
N S
TATI
ON
- B
UIL
DIN
G9/
30/2
031
40-R
2(1
0)1,
760,
478
28,2
1514
7,83
39,
844
0.55
15.0
Z15.
70
D
ISTR
IBU
TIO
N B
IOG
AZ
- ME
TER
STA
TIO
N -
EQ
UIP
ME
NT
9/30
/203
125
-R2.
5(2
5)29
4,90
213
,298
60,4
274,
819
1.63
12.5
Z15.
71
D
ISTR
IBU
TIO
N B
IOG
AZ
- ME
TER
STA
TIO
N -
BU
ILD
ING
9/30
/203
140
-R2
(10)
170,
125
2,72
114
,291
952
0.56
15.0
Z30.
50
T
RA
NS
MIS
SIO
N -
SE
RV
ITU
DE
S
70
-SQ
012
,743
,828
00
00.
0049
.5Z3
1.00
TR
AN
SM
ISS
ION
- M
AIN
PIP
E
65
-R3
(10)
288,
121,
224
2,22
7,04
726
,585
,075
795,
170
0.28
37.3
Z40.
51
S
TOC
KIN
G -
AD
MIN
ISTR
ATI
VE
BU
ILD
ING
35-R
30
3,62
7,54
60
00
0.00
21.6
Z40.
52
S
TOC
KIN
G -
BU
ILD
ING
INFR
AS
TRU
CTU
RE
44-R
3(3
5)23
,752
,044
5,29
6,05
53,
017,
160
75,6
370.
3225
.5Z4
1.01
STO
CK
ING
- M
EC
HA
NIC
AL
EQ
UIP
ME
NT
35-R
30
8,83
6,56
10
00
0.00
22.3
Z41.
02
S
TOC
KIN
G -
ELE
CTR
ON
IC E
QU
IPM
EN
T
15
-R3
02,
156,
292
00
00.
0011
.1Z4
1.03
STO
CK
ING
- S
PE
CIA
LIZE
D E
QU
IPM
EN
T
25
-R4
02,
352,
514
00
00.
005.
8TO
TAL
PLAN
T3,
158,
127,
779
201,
205,
152
799,
421,
504
27,9
63,3
42
CAL
CU
LATE
D A
NN
UAL
GAZ
MÉT
RO
TAB
LE 1
B.
ESTI
MAT
ED S
UR
VIVO
R C
UR
VES,
NET
SAL
VAG
E PE
RC
ENTS
, OR
IGIN
AL C
OST
AN
D A
NN
UAL
AC
CR
UAL
SB
ASED
ON
SU
RVI
VIN
G P
LAN
T AS
OF
SEPT
EMB
ER 3
0, 2
014
"NET
SAL
VAG
E AN
ALYS
IS"
IV-6

Gaz Métro 2014 Depreciation Study
PART V. SERVICE LIFE STATISTICS
V-1

Gaz Métro 2014 Depreciation Study
GAZ MÉTRO
ACCOUNT Z11.00 - DISTRIBUTION BRANCH (SERVICE) - STEEL
ORIGINAL AND SMOOTH SURVIVOR CURVES
V-2

Gaz Métro 2014 Depreciation Study
GAZ MÉTRO
ACCOUNT Z11.00 - DISTRIBUTION BRANCH (SERVICE) - STEEL
ORIGINAL LIFE TABLE
PLACEMENT BAND 1957-2014 EXPERIENCE BAND 1962-2014
AGE AT EXPOSURES AT RETIREMENTS PCT SURV BEGIN OF BEGINNING OF DURING AGE RETMT SURV BEGIN OF INTERVAL AGE INTERVAL INTERVAL RATIO RATIO INTERVAL
0.0 193,849,336 441,025 0.0023 0.9977 100.00 0.5 187,312,440 890,709 0.0048 0.9952 99.77 1.5 181,847,661 1,001,911 0.0055 0.9945 99.30 2.5 175,034,010 916,552 0.0052 0.9948 98.75 3.5 168,389,121 887,687 0.0053 0.9947 98.23 4.5 163,563,490 1,407,349 0.0086 0.9914 97.72 5.5 158,890,172 943,592 0.0059 0.9941 96.88 6.5 155,526,882 988,021 0.0064 0.9936 96.30 7.5 152,783,953 937,978 0.0061 0.9939 95.69 8.5 147,741,148 970,473 0.0066 0.9934 95.10
9.5 144,458,050 1,007,778 0.0070 0.9930 94.48 10.5 139,259,263 1,104,553 0.0079 0.9921 93.82 11.5 131,158,843 1,197,004 0.0091 0.9909 93.07 12.5 125,945,496 1,123,812 0.0089 0.9911 92.22 13.5 123,026,507 1,011,065 0.0082 0.9918 91.40 14.5 119,646,106 901,736 0.0075 0.9925 90.65 15.5 116,590,481 954,298 0.0082 0.9918 89.97 16.5 113,777,537 959,689 0.0084 0.9916 89.23 17.5 109,833,097 930,921 0.0085 0.9915 88.48 18.5 106,292,576 1,185,964 0.0112 0.9888 87.73
19.5 102,931,073 897,614 0.0087 0.9913 86.75 20.5 100,214,097 1,041,700 0.0104 0.9896 85.99 21.5 98,058,306 1,022,165 0.0104 0.9896 85.10 22.5 95,645,729 999,852 0.0105 0.9895 84.21 23.5 92,139,231 754,045 0.0082 0.9918 83.33 24.5 90,108,540 826,480 0.0092 0.9908 82.65 25.5 86,505,449 1,050,129 0.0121 0.9879 81.89 26.5 83,668,560 1,467,341 0.0175 0.9825 80.90 27.5 79,448,348 809,643 0.0102 0.9898 79.48 28.5 77,207,134 785,575 0.0102 0.9898 78.67
29.5 69,043,860 897,743 0.0130 0.9870 77.87 30.5 56,371,523 421,884 0.0075 0.9925 76.85 31.5 47,183,292 832,948 0.0177 0.9823 76.28 32.5 41,727,294 1,411,410 0.0338 0.9662 74.93 33.5 32,350,549 690,499 0.0213 0.9787 72.40 34.5 25,538,321 398,279 0.0156 0.9844 70.85 35.5 1,720,289 144,870 0.0842 0.9158 69.75 36.5 1,575,419 132,826 0.0843 0.9157 63.87 37.5 1,442,592 127,638 0.0885 0.9115 58.49 38.5 1,314,955 125,117 0.0951 0.9049 53.31
V-3

Gaz Métro 2014 Depreciation Study
GAZ MÉTRO
ACCOUNT Z11.00 - DISTRIBUTION BRANCH (SERVICE) - STEEL
ORIGINAL LIFE TABLE, CONT.
PLACEMENT BAND 1957-2014 EXPERIENCE BAND 1962-2014
AGE AT EXPOSURES AT RETIREMENTS PCT SURV BEGIN OF BEGINNING OF DURING AGE RETMT SURV BEGIN OF INTERVAL AGE INTERVAL INTERVAL RATIO RATIO INTERVAL
39.5 1,189,837 122,831 0.1032 0.8968 48.24 40.5 1,067,006 106,706 0.1000 0.9000 43.26 41.5 960,300 87,119 0.0907 0.9093 38.93 42.5 873,182 70,436 0.0807 0.9193 35.40 43.5 802,745 48,227 0.0601 0.9399 32.55 44.5 754,518 44,922 0.0595 0.9405 30.59 45.5 709,596 38,763 0.0546 0.9454 28.77 46.5 670,833 31,049 0.0463 0.9537 27.20 47.5 639,784 28,638 0.0448 0.9552 25.94 48.5 611,146 20,733 0.0339 0.9661 24.78
49.5 590,413 9,444 0.0160 0.9840 23.94 50.5 580,969 6,502 0.0112 0.9888 23.56 51.5 574,467 467 0.0008 0.9992 23.29 52.5 574,000 232,542 0.4051 0.5949 23.27 53.5 341,458 30,891 0.0905 0.9095 13.84 54.5 310,567 0.0000 1.0000 12.59 55.5 310,567 3,400 0.0109 0.9891 12.59 56.5 307,167 0.0000 1.0000 12.45 57.5 12.45
V-4

Gaz Métro 2014 Depreciation Study
GAZ MÉTRO
ACCOUNT Z11.01 - DISTRIBUTION BRANCH (SERVICE) - COPPER INSERTS
ORIGINAL AND SMOOTH SURVIVOR CURVES
V-5

Gaz Métro 2014 Depreciation Study
GAZ MÉTRO
ACCOUNT Z11.01 - DISTRIBUTION BRANCH (SERVICE) - COPPER INSERTS
ORIGINAL LIFE TABLE
PLACEMENT BAND 1957-1989 EXPERIENCE BAND 1959-2014
AGE AT EXPOSURES AT RETIREMENTS PCT SURV BEGIN OF BEGINNING OF DURING AGE RETMT SURV BEGIN OF INTERVAL AGE INTERVAL INTERVAL RATIO RATIO INTERVAL
0.0 10,326,456 79,945 0.0077 0.9923 100.00 0.5 10,262,201 161,226 0.0157 0.9843 99.23 1.5 10,105,946 172,293 0.0170 0.9830 97.67 2.5 9,933,653 200,540 0.0202 0.9798 96.00 3.5 9,733,113 251,707 0.0259 0.9741 94.06 4.5 9,481,406 313,050 0.0330 0.9670 91.63 5.5 9,168,356 317,040 0.0346 0.9654 88.61 6.5 8,851,316 371,467 0.0420 0.9580 85.54 7.5 8,479,848 383,341 0.0452 0.9548 81.95 8.5 8,096,507 429,532 0.0531 0.9469 78.25
9.5 7,666,975 414,216 0.0540 0.9460 74.10 10.5 7,252,759 435,687 0.0601 0.9399 70.09 11.5 6,817,072 491,929 0.0722 0.9278 65.88 12.5 6,325,143 631,998 0.0999 0.9001 61.13 13.5 5,693,145 643,657 0.1131 0.8869 55.02 14.5 5,049,488 572,701 0.1134 0.8866 48.80 15.5 4,476,787 577,651 0.1290 0.8710 43.27 16.5 3,899,136 593,358 0.1522 0.8478 37.68 17.5 3,305,778 510,461 0.1544 0.8456 31.95 18.5 2,795,318 359,034 0.1284 0.8716 27.01
19.5 2,436,284 306,952 0.1260 0.8740 23.54 20.5 2,129,332 236,570 0.1111 0.8889 20.58 21.5 1,892,762 252,523 0.1334 0.8666 18.29 22.5 1,640,240 148,315 0.0904 0.9096 15.85 23.5 1,491,925 71,734 0.0481 0.9519 14.42 24.5 1,420,191 59,962 0.0422 0.9578 13.73 25.5 1,358,775 98,494 0.0725 0.9275 13.15 26.5 1,260,281 92,344 0.0733 0.9267 12.19 27.5 1,167,937 39,359 0.0337 0.9663 11.30 28.5 1,128,578 14,458 0.0128 0.9872 10.92
29.5 1,114,120 12,206 0.0110 0.9890 10.78 30.5 1,101,914 11,712 0.0106 0.9894 10.66 31.5 1,090,202 8,027 0.0074 0.9926 10.55 32.5 1,082,175 1,985 0.0018 0.9982 10.47 33.5 312,483 565 0.0018 0.9982 10.45 34.5 67,357 211 0.0031 0.9969 10.43 35.5 1,526 46 0.0298 0.9702 10.40 36.5 1,480 1,239 0.8373 0.1627 10.09 37.5 241 135 0.5585 0.4415 1.64 38.5 106 58 0.5473 0.4527 0.72
V-6

Gaz Métro 2014 Depreciation Study
GAZ MÉTRO
ACCOUNT Z11.01 - DISTRIBUTION BRANCH (SERVICE) - COPPER INSERTS
ORIGINAL LIFE TABLE, CONT.
PLACEMENT BAND 1957-1989 EXPERIENCE BAND 1959-2014
AGE AT EXPOSURES AT RETIREMENTS PCT SURV BEGIN OF BEGINNING OF DURING AGE RETMT SURV BEGIN OF INTERVAL AGE INTERVAL INTERVAL RATIO RATIO INTERVAL
39.5 48 0.0000 1.0000 0.33 40.5 48 48 1.0000 0.33 41.5
V-7

Gaz Métro 2014 Depreciation Study
GAZ MÉTRO
ACCOUNT Z11.02 - DISTRIBUTION BRANCH (SERVICE) - DIRECT PLASTIC
ORIGINAL AND SMOOTH SURVIVOR CURVES
V-8

Gaz Métro 2014 Depreciation Study
GAZ MÉTRO
ACCOUNT Z11.02 - DISTRIBUTION BRANCH (SERVICE) - DIRECT PLASTIC
ORIGINAL LIFE TABLE
PLACEMENT BAND 1977-2014 EXPERIENCE BAND 1981-2014
AGE AT EXPOSURES AT RETIREMENTS PCT SURV BEGIN OF BEGINNING OF DURING AGE RETMT SURV BEGIN OF INTERVAL AGE INTERVAL INTERVAL RATIO RATIO INTERVAL
0.0 704,519,355 565,394 0.0008 0.9992 100.00 0.5 664,698,734 1,249,047 0.0019 0.9981 99.92 1.5 623,562,540 1,228,228 0.0020 0.9980 99.73 2.5 583,291,551 1,238,652 0.0021 0.9979 99.54 3.5 551,317,767 1,136,762 0.0021 0.9979 99.32 4.5 520,575,657 1,236,536 0.0024 0.9976 99.12 5.5 492,684,711 1,228,036 0.0025 0.9975 98.88 6.5 463,323,800 1,173,251 0.0025 0.9975 98.64 7.5 433,405,215 1,283,301 0.0030 0.9970 98.39 8.5 401,021,628 1,205,252 0.0030 0.9970 98.10
9.5 369,349,918 1,202,503 0.0033 0.9967 97.80 10.5 349,016,612 1,324,596 0.0038 0.9962 97.48 11.5 334,472,417 1,217,933 0.0036 0.9964 97.11 12.5 318,670,797 1,252,830 0.0039 0.9961 96.76 13.5 300,095,846 1,146,895 0.0038 0.9962 96.38 14.5 280,884,881 1,239,367 0.0044 0.9956 96.01 15.5 264,438,111 1,288,482 0.0049 0.9951 95.59 16.5 249,225,704 1,490,013 0.0060 0.9940 95.12 17.5 233,424,497 1,500,557 0.0064 0.9936 94.55 18.5 217,357,868 1,467,888 0.0068 0.9932 93.94
19.5 200,634,459 1,077,321 0.0054 0.9946 93.31 20.5 183,758,779 906,167 0.0049 0.9951 92.81 21.5 169,061,062 787,851 0.0047 0.9953 92.35 22.5 156,635,436 754,075 0.0048 0.9952 91.92 23.5 146,104,238 781,706 0.0054 0.9946 91.48 24.5 136,504,320 714,240 0.0052 0.9948 90.99 25.5 125,802,483 703,040 0.0056 0.9944 90.51 26.5 112,544,761 701,040 0.0062 0.9938 90.01 27.5 97,370,383 587,167 0.0060 0.9940 89.45 28.5 86,027,940 486,686 0.0057 0.9943 88.91
29.5 64,769,093 407,098 0.0063 0.9937 88.40 30.5 34,077,550 124,065 0.0036 0.9964 87.85 31.5 12,849,471 125,575 0.0098 0.9902 87.53 32.5 1,775,615 11,656 0.0066 0.9934 86.67 33.5 86.10
V-9

Gaz Métro 2014 Depreciation Study
GAZ MÉTRO
ACCOUNT Z11.03 - DISTRIBUTION BRANCH (SERVICE) - INSERT PLASTIC
ORIGINAL AND SMOOTH SURVIVOR CURVES
V-10

Gaz Métro 2014 Depreciation Study
GAZ MÉTRO
ACCOUNT Z11.03 - DISTRIBUTION BRANCH (SERVICE) - INSERT PLASTIC
ORIGINAL LIFE TABLE
PLACEMENT BAND 1957-2014 EXPERIENCE BAND 1973-2014
AGE AT EXPOSURES AT RETIREMENTS PCT SURV BEGIN OF BEGINNING OF DURING AGE RETMT SURV BEGIN OF INTERVAL AGE INTERVAL INTERVAL RATIO RATIO INTERVAL
0.0 82,269,482 66,642 0.0008 0.9992 100.00 0.5 81,098,457 141,490 0.0017 0.9983 99.92 1.5 80,038,630 155,625 0.0019 0.9981 99.74 2.5 78,586,285 176,903 0.0023 0.9977 99.55 3.5 77,584,603 193,715 0.0025 0.9975 99.33 4.5 76,786,265 211,807 0.0028 0.9972 99.08 5.5 76,042,684 207,009 0.0027 0.9973 98.81 6.5 75,520,655 220,185 0.0029 0.9971 98.54 7.5 75,028,154 229,187 0.0031 0.9969 98.25 8.5 74,509,576 227,726 0.0031 0.9969 97.95
9.5 74,056,242 220,125 0.0030 0.9970 97.65 10.5 73,858,778 268,550 0.0036 0.9964 97.36 11.5 73,605,743 247,447 0.0034 0.9966 97.01 12.5 73,383,325 251,869 0.0034 0.9966 96.68 13.5 71,945,386 258,522 0.0036 0.9964 96.35 14.5 70,338,871 249,661 0.0035 0.9965 96.00 15.5 68,721,081 245,910 0.0036 0.9964 95.66 16.5 67,388,531 269,227 0.0040 0.9960 95.32 17.5 65,466,512 235,509 0.0036 0.9964 94.94 18.5 63,543,154 272,493 0.0043 0.9957 94.60
19.5 60,897,859 222,404 0.0037 0.9963 94.19 20.5 58,397,080 245,360 0.0042 0.9958 93.85 21.5 55,136,423 215,519 0.0039 0.9961 93.45 22.5 53,011,836 222,468 0.0042 0.9958 93.09 23.5 51,340,964 288,540 0.0056 0.9944 92.70 24.5 50,523,625 327,456 0.0065 0.9935 92.17 25.5 48,415,107 267,436 0.0055 0.9945 91.58 26.5 42,196,205 220,069 0.0052 0.9948 91.07 27.5 36,513,667 226,674 0.0062 0.9938 90.60 28.5 30,981,162 148,854 0.0048 0.9952 90.03
29.5 26,059,775 107,675 0.0041 0.9959 89.60 30.5 20,359,285 101,426 0.0050 0.9950 89.23 31.5 14,794,543 88,927 0.0060 0.9940 88.79 32.5 7,795,290 50,084 0.0064 0.9936 88.25 33.5 5,821,252 40,399 0.0069 0.9931 87.69 34.5 3,929,037 31,331 0.0080 0.9920 87.08 35.5 45,748 6,782 0.1482 0.8518 86.38 36.5 38,967 4,531 0.1163 0.8837 73.58 37.5 34,435 6,551 0.1902 0.8098 65.02 38.5 27,884 4,102 0.1471 0.8529 52.65
V-11

Gaz Métro 2014 Depreciation Study
GAZ MÉTRO
ACCOUNT Z11.03 - DISTRIBUTION BRANCH (SERVICE) - INSERT PLASTIC
ORIGINAL LIFE TABLE, CONT.
PLACEMENT BAND 1957-2014 EXPERIENCE BAND 1973-2014
AGE AT EXPOSURES AT RETIREMENTS PCT SURV BEGIN OF BEGINNING OF DURING AGE RETMT SURV BEGIN OF INTERVAL AGE INTERVAL INTERVAL RATIO RATIO INTERVAL
39.5 23,782 2,883 0.1212 0.8788 44.91 40.5 20,899 3,166 0.1515 0.8485 39.46 41.5 17,733 2,277 0.1284 0.8716 33.48 42.5 15,456 2,691 0.1741 0.8259 29.19 43.5 12,766 5,213 0.4084 0.5916 24.10 44.5 7,553 1,073 0.1421 0.8579 14.26 45.5 6,480 2,973 0.4588 0.5412 12.23 46.5 3,507 613 0.1749 0.8251 6.62 47.5 2,893 449 0.1551 0.8449 5.46 48.5 2,445 530 0.2166 0.7834 4.62
49.5 1,915 490 0.2561 0.7439 3.62 50.5 1,425 1,270 0.8918 0.1082 2.69 51.5 154 154 1.0000 0.29 52.5
V-12

Gaz Métro 2014 Depreciation Study
GAZ MÉTRO
ACCOUNT Z11.04 - DISTRIBUTION BRANCH (SERVICE) - PRE-RELEASE PLASTIC
ORIGINAL AND SMOOTH SURVIVOR CURVES
V-13

Gaz Métro 2014 Depreciation Study
GAZ MÉTRO
ACCOUNT Z11.05 - DISTRIBUTION BRANCH (SERVICE) - PRE-RELEASE STEEL
ORIGINAL AND SMOOTH SURVIVOR CURVES
V-14

Gaz Métro 2014 Depreciation Study
GAZ MÉTRO
ACCOUNT Z11.05 - DISTRIBUTION BRANCH (SERVICE) - PRE-RELEASE STEEL
ORIGINAL LIFE TABLE
PLACEMENT BAND 1989-2012 EXPERIENCE BAND 1999-2014
AGE AT EXPOSURES AT RETIREMENTS PCT SURV BEGIN OF BEGINNING OF DURING AGE RETMT SURV BEGIN OF INTERVAL AGE INTERVAL INTERVAL RATIO RATIO INTERVAL
0.0 336,951 0.0000 1.0000 100.00 0.5 336,951 0.0000 1.0000 100.00 1.5 336,951 0.0000 1.0000 100.00 2.5 334,513 0.0000 1.0000 100.00 3.5 210,490 0.0000 1.0000 100.00 4.5 210,490 0.0000 1.0000 100.00 5.5 213,921 0.0000 1.0000 100.00 6.5 221,748 0.0000 1.0000 100.00 7.5 282,439 0.0000 1.0000 100.00 8.5 371,813 0.0000 1.0000 100.00
9.5 235,371 0.0000 1.0000 100.00 10.5 235,371 0.0000 1.0000 100.00 11.5 235,371 0.0000 1.0000 100.00 12.5 235,371 0.0000 1.0000 100.00 13.5 235,371 0.0000 1.0000 100.00 14.5 235,371 0.0000 1.0000 100.00 15.5 235,371 0.0000 1.0000 100.00 16.5 235,371 0.0000 1.0000 100.00 17.5 235,371 0.0000 1.0000 100.00 18.5 235,371 0.0000 1.0000 100.00
19.5 235,371 0.0000 1.0000 100.00 20.5 235,371 0.0000 1.0000 100.00 21.5 231,939 0.0000 1.0000 100.00 22.5 213,768 0.0000 1.0000 100.00 23.5 142,564 0.0000 1.0000 100.00 24.5 20,389 0.0000 1.0000 100.00 25.5 100.00
V-15

Gaz Métro 2014 Depreciation Study
GAZ MÉTRO
ACCOUNT Z11.50 - DISTRIBUTION - MAIN PIPE STEEL
ORIGINAL AND SMOOTH SURVIVOR CURVES
V-16

Gaz Métro 2014 Depreciation Study
GAZ MÉTRO
ACCOUNT Z11.50 - DISTRIBUTION - MAIN PIPE STEEL
ORIGINAL LIFE TABLE
PLACEMENT BAND 1957-2014 EXPERIENCE BAND 1965-2014
AGE AT EXPOSURES AT RETIREMENTS PCT SURV BEGIN OF BEGINNING OF DURING AGE RETMT SURV BEGIN OF INTERVAL AGE INTERVAL INTERVAL RATIO RATIO INTERVAL
0.0 729,344,932 86,430 0.0001 0.9999 100.00 0.5 695,087,008 176,035 0.0003 0.9997 99.99 1.5 665,863,395 456,003 0.0007 0.9993 99.96 2.5 652,750,204 660,650 0.0010 0.9990 99.89 3.5 640,522,136 786,246 0.0012 0.9988 99.79 4.5 626,749,381 468,912 0.0007 0.9993 99.67 5.5 620,000,457 437,013 0.0007 0.9993 99.60 6.5 615,014,669 502,851 0.0008 0.9992 99.53 7.5 609,934,223 548,515 0.0009 0.9991 99.44 8.5 567,594,864 1,405,897 0.0025 0.9975 99.36
9.5 564,871,869 552,004 0.0010 0.9990 99.11 10.5 562,647,632 775,683 0.0014 0.9986 99.01 11.5 559,325,403 524,030 0.0009 0.9991 98.88 12.5 557,741,651 706,841 0.0013 0.9987 98.78 13.5 538,251,572 704,483 0.0013 0.9987 98.66 14.5 525,848,897 624,479 0.0012 0.9988 98.53 15.5 518,344,107 750,339 0.0014 0.9986 98.41 16.5 507,257,805 2,289,832 0.0045 0.9955 98.27 17.5 495,045,622 1,203,179 0.0024 0.9976 97.83 18.5 447,268,234 769,611 0.0017 0.9983 97.59
19.5 378,222,243 1,275,686 0.0034 0.9966 97.42 20.5 372,562,561 957,540 0.0026 0.9974 97.09 21.5 356,877,642 924,339 0.0026 0.9974 96.84 22.5 348,793,332 1,001,646 0.0029 0.9971 96.59 23.5 327,756,257 1,398,929 0.0043 0.9957 96.31 24.5 318,366,300 700,269 0.0022 0.9978 95.90 25.5 291,944,382 724,011 0.0025 0.9975 95.69 26.5 288,154,463 2,892,944 0.0100 0.9900 95.45 27.5 271,105,185 2,997,490 0.0111 0.9889 94.50 28.5 258,655,463 1,130,677 0.0044 0.9956 93.45
29.5 224,295,302 2,769,945 0.0123 0.9877 93.04 30.5 170,172,472 1,476,376 0.0087 0.9913 91.89 31.5 122,343,331 1,119,739 0.0092 0.9908 91.10 32.5 96,781,146 1,985,900 0.0205 0.9795 90.26 33.5 89,024,818 1,142,769 0.0128 0.9872 88.41 34.5 80,631,834 778,964 0.0097 0.9903 87.28 35.5 3,348,274 274,601 0.0820 0.9180 86.43 36.5 3,073,673 311,502 0.1013 0.8987 79.34 37.5 2,762,172 320,993 0.1162 0.8838 71.30 38.5 2,441,178 242,447 0.0993 0.9007 63.02
V-17

Gaz Métro 2014 Depreciation Study
GAZ MÉTRO
ACCOUNT Z11.50 - DISTRIBUTION - MAIN PIPE STEEL
ORIGINAL LIFE TABLE, CONT.
PLACEMENT BAND 1957-2014 EXPERIENCE BAND 1965-2014
AGE AT EXPOSURES AT RETIREMENTS PCT SURV BEGIN OF BEGINNING OF DURING AGE RETMT SURV BEGIN OF INTERVAL AGE INTERVAL INTERVAL RATIO RATIO INTERVAL
39.5 2,198,731 262,632 0.1194 0.8806 56.76 40.5 1,936,099 292,018 0.1508 0.8492 49.98 41.5 1,644,081 197,101 0.1199 0.8801 42.44 42.5 1,446,980 160,702 0.1111 0.8889 37.35 43.5 1,286,277 201,954 0.1570 0.8430 33.20 44.5 1,084,323 316,095 0.2915 0.7085 27.99 45.5 768,229 250,924 0.3266 0.6734 19.83 46.5 517,304 196,924 0.3807 0.6193 13.35 47.5 320,381 120,934 0.3775 0.6225 8.27 48.5 199,446 97,493 0.4888 0.5112 5.15
49.5 101,954 89,583 0.8787 0.1213 2.63 50.5 12,371 12,371 1.0000 0.32 51.5
V-18

Gaz Métro 2014 Depreciation Study
GAZ MÉTRO
ACCOUNT Z11.51 - DISTRIBUTION - MAIN PIPE DIRECT PLASTIC
ORIGINAL AND SMOOTH SURVIVOR CURVES
V-19

Gaz Métro 2014 Depreciation Study
GAZ MÉTRO
ACCOUNT Z11.51 - DISTRIBUTION - MAIN PIPE DIRECT PLASTIC
ORIGINAL LIFE TABLE
PLACEMENT BAND 1957-2014 EXPERIENCE BAND 1982-2014
AGE AT EXPOSURES AT RETIREMENTS PCT SURV BEGIN OF BEGINNING OF DURING AGE RETMT SURV BEGIN OF INTERVAL AGE INTERVAL INTERVAL RATIO RATIO INTERVAL
0.0 827,981,772 55,899 0.0001 0.9999 100.00 0.5 801,118,877 113,119 0.0001 0.9999 99.99 1.5 764,505,427 274,153 0.0004 0.9996 99.98 2.5 732,399,161 554,878 0.0008 0.9992 99.94 3.5 707,605,348 459,901 0.0006 0.9994 99.87 4.5 689,920,870 235,703 0.0003 0.9997 99.80 5.5 667,658,524 257,311 0.0004 0.9996 99.77 6.5 648,715,009 207,675 0.0003 0.9997 99.73 7.5 630,265,884 192,942 0.0003 0.9997 99.70 8.5 603,691,592 201,771 0.0003 0.9997 99.67
9.5 569,742,923 244,089 0.0004 0.9996 99.63 10.5 538,707,293 200,660 0.0004 0.9996 99.59 11.5 510,565,703 167,096 0.0003 0.9997 99.55 12.5 486,918,028 124,730 0.0003 0.9997 99.52 13.5 457,763,387 217,381 0.0005 0.9995 99.50 14.5 433,468,191 300,729 0.0007 0.9993 99.45 15.5 415,518,537 143,650 0.0003 0.9997 99.38 16.5 401,256,638 174,644 0.0004 0.9996 99.35 17.5 389,832,363 318,532 0.0008 0.9992 99.30 18.5 373,018,573 239,559 0.0006 0.9994 99.22
19.5 346,770,644 288,660 0.0008 0.9992 99.16 20.5 323,245,315 309,312 0.0010 0.9990 99.08 21.5 294,368,488 465,645 0.0016 0.9984 98.98 22.5 278,689,892 342,400 0.0012 0.9988 98.82 23.5 263,508,953 486,709 0.0018 0.9982 98.70 24.5 249,457,576 507,048 0.0020 0.9980 98.52 25.5 238,059,418 302,500 0.0013 0.9987 98.32 26.5 215,877,320 347,336 0.0016 0.9984 98.19 27.5 194,369,124 110,550 0.0006 0.9994 98.04 28.5 175,561,562 50,995 0.0003 0.9997 97.98
29.5 142,332,193 265,210 0.0019 0.9981 97.95 30.5 72,522,451 120,095 0.0017 0.9983 97.77 31.5 33,854,140 23,425 0.0007 0.9993 97.61 32.5 2,242,835 11,194 0.0050 0.9950 97.54 33.5 268,717 27 0.0001 0.9999 97.05 34.5 1,761 0.0000 1.0000 97.04 35.5 1,761 0.0000 1.0000 97.04 36.5 1,761 0.0000 1.0000 97.04 37.5 1,761 0.0000 1.0000 97.04 38.5 1,761 0.0000 1.0000 97.04
V-20

Gaz Métro 2014 Depreciation Study
GAZ MÉTRO
ACCOUNT Z11.51 - DISTRIBUTION - MAIN PIPE DIRECT PLASTIC
ORIGINAL LIFE TABLE, CONT.
PLACEMENT BAND 1957-2014 EXPERIENCE BAND 1982-2014
AGE AT EXPOSURES AT RETIREMENTS PCT SURV BEGIN OF BEGINNING OF DURING AGE RETMT SURV BEGIN OF INTERVAL AGE INTERVAL INTERVAL RATIO RATIO INTERVAL
39.5 1,761 0.0000 1.0000 97.04 40.5 1,761 0.0000 1.0000 97.04 41.5 1,761 0.0000 1.0000 97.04 42.5 1,761 0.0000 1.0000 97.04 43.5 1,761 0.0000 1.0000 97.04 44.5 1,761 0.0000 1.0000 97.04 45.5 1,761 0.0000 1.0000 97.04 46.5 1,761 0.0000 1.0000 97.04 47.5 1,761 0.0000 1.0000 97.04 48.5 1,761 0.0000 1.0000 97.04
49.5 1,761 0.0000 1.0000 97.04 50.5 1,761 0.0000 1.0000 97.04 51.5 1,761 0.0000 1.0000 97.04 52.5 1,761 1,761 1.0000 97.04 53.5
V-21

Gaz Métro 2014 Depreciation Study
GAZ MÉTRO
ACCOUNT Z11.52 - DISTRIBUTION - MAIN PIPE PLASTIC INSERTS
ORIGINAL AND SMOOTH SURVIVOR CURVES
V-22

Gaz Métro 2014 Depreciation Study
GAZ MÉTRO
ACCOUNT Z11.52 - DISTRIBUTION - MAIN PIPE PLASTIC INSERTS
ORIGINAL LIFE TABLE
PLACEMENT BAND 1957-2009 EXPERIENCE BAND 1977-2014
AGE AT EXPOSURES AT RETIREMENTS PCT SURV BEGIN OF BEGINNING OF DURING AGE RETMT SURV BEGIN OF INTERVAL AGE INTERVAL INTERVAL RATIO RATIO INTERVAL
0.0 64,689,661 39,826 0.0006 0.9994 100.00 0.5 64,662,241 27,638 0.0004 0.9996 99.94 1.5 64,646,795 20,038 0.0003 0.9997 99.90 2.5 64,643,809 21,852 0.0003 0.9997 99.86 3.5 64,634,102 17,104 0.0003 0.9997 99.83 4.5 64,619,215 14,596 0.0002 0.9998 99.80 5.5 64,630,344 47,236 0.0007 0.9993 99.78 6.5 64,583,108 14,343 0.0002 0.9998 99.71 7.5 64,568,765 13,529 0.0002 0.9998 99.69 8.5 64,555,237 12,914 0.0002 0.9998 99.67
9.5 64,542,323 10,945 0.0002 0.9998 99.65 10.5 64,531,377 6,489 0.0001 0.9999 99.63 11.5 64,524,889 5,698 0.0001 0.9999 99.62 12.5 64,519,191 5,380 0.0001 0.9999 99.61 13.5 63,755,151 6,936 0.0001 0.9999 99.60 14.5 61,905,090 5,557 0.0001 0.9999 99.59 15.5 60,700,307 6,236 0.0001 0.9999 99.58 16.5 59,073,012 195,576 0.0033 0.9967 99.57 17.5 56,908,713 10,807 0.0002 0.9998 99.24 18.5 54,014,870 5,078 0.0001 0.9999 99.22
19.5 50,279,075 902 0.0000 1.0000 99.21 20.5 47,319,588 1,547 0.0000 1.0000 99.21 21.5 44,930,256 0.0000 1.0000 99.21 22.5 43,091,890 8,004 0.0002 0.9998 99.21 23.5 41,925,662 0.0000 1.0000 99.19 24.5 41,200,628 0.0000 1.0000 99.19 25.5 39,016,215 14,114 0.0004 0.9996 99.19 26.5 33,777,987 51,346 0.0015 0.9985 99.15 27.5 29,237,948 20,280 0.0007 0.9993 99.00 28.5 23,634,499 31,834 0.0013 0.9987 98.94
29.5 19,136,709 23,830 0.0012 0.9988 98.80 30.5 14,262,429 34,402 0.0024 0.9976 98.68 31.5 11,963,807 7,988 0.0007 0.9993 98.44 32.5 7,576,651 23,263 0.0031 0.9969 98.38 33.5 6,263,538 36,918 0.0059 0.9941 98.07 34.5 4,630,681 19,066 0.0041 0.9959 97.50 35.5 100,660 0.0000 1.0000 97.09 36.5 100,660 0.0000 1.0000 97.09 37.5 100,660 0.0000 1.0000 97.09 38.5 100,660 0.0000 1.0000 97.09
V-23

Gaz Métro 2014 Depreciation Study
GAZ MÉTRO
ACCOUNT Z11.52 - DISTRIBUTION - MAIN PIPE PLASTIC INSERTS
ORIGINAL LIFE TABLE, CONT.
PLACEMENT BAND 1957-2009 EXPERIENCE BAND 1977-2014
AGE AT EXPOSURES AT RETIREMENTS PCT SURV BEGIN OF BEGINNING OF DURING AGE RETMT SURV BEGIN OF INTERVAL AGE INTERVAL INTERVAL RATIO RATIO INTERVAL
39.5 100,660 0.0000 1.0000 97.09 40.5 100,660 0.0000 1.0000 97.09 41.5 100,660 0.0000 1.0000 97.09 42.5 100,660 0.0000 1.0000 97.09 43.5 100,660 0.0000 1.0000 97.09 44.5 100,660 0.0000 1.0000 97.09 45.5 100,660 0.0000 1.0000 97.09 46.5 100,660 0.0000 1.0000 97.09 47.5 100,660 0.0000 1.0000 97.09 48.5 100,660 0.0000 1.0000 97.09
49.5 100,660 0.0000 1.0000 97.09 50.5 100,660 0.0000 1.0000 97.09 51.5 100,660 0.0000 1.0000 97.09 52.5 100,660 0.0000 1.0000 97.09 53.5 100,660 1,038 0.0103 0.9897 97.09 54.5 99,622 0.0000 1.0000 96.09 55.5 99,622 0.0000 1.0000 96.09 56.5 99,622 0.0000 1.0000 96.09 57.5 96.09
V-24

Gaz Métro 2014 Depreciation Study
GAZ MÉTRO
ACCOUNT Z12.00 - DISTRIBUTION METER
ORIGINAL AND SMOOTH SURVIVOR CURVES
V-25

Gaz Métro 2014 Depreciation Study
GAZ MÉTRO
ACCOUNT Z12.00 - DISTRIBUTION METER
ORIGINAL LIFE TABLE
PLACEMENT BAND 1956-2014 EXPERIENCE BAND 1957-2014
AGE AT EXPOSURES AT RETIREMENTS PCT SURV BEGIN OF BEGINNING OF DURING AGE RETMT SURV BEGIN OF INTERVAL AGE INTERVAL INTERVAL RATIO RATIO INTERVAL
0.0 241,283,267 335,205 0.0014 0.9986 100.00 0.5 231,874,879 865,711 0.0037 0.9963 99.86 1.5 219,694,990 1,047,079 0.0048 0.9952 99.49 2.5 205,826,937 1,161,213 0.0056 0.9944 99.01 3.5 191,534,248 1,424,661 0.0074 0.9926 98.46 4.5 180,695,406 1,509,660 0.0084 0.9916 97.72 5.5 169,955,405 1,627,774 0.0096 0.9904 96.91 6.5 158,869,353 1,902,876 0.0120 0.9880 95.98 7.5 148,573,344 2,098,010 0.0141 0.9859 94.83 8.5 136,248,081 2,165,659 0.0159 0.9841 93.49
9.5 128,157,637 2,217,247 0.0173 0.9827 92.00 10.5 120,542,503 2,604,811 0.0216 0.9784 90.41 11.5 114,221,149 2,651,160 0.0232 0.9768 88.46 12.5 106,105,745 2,812,626 0.0265 0.9735 86.41 13.5 100,023,319 2,650,074 0.0265 0.9735 84.11 14.5 94,222,242 2,650,230 0.0281 0.9719 81.89 15.5 87,530,471 2,967,180 0.0339 0.9661 79.58 16.5 82,105,583 3,254,045 0.0396 0.9604 76.89 17.5 76,422,583 3,497,281 0.0458 0.9542 73.84 18.5 70,167,823 2,993,168 0.0427 0.9573 70.46
19.5 64,690,032 3,459,186 0.0535 0.9465 67.45 20.5 57,742,335 3,520,505 0.0610 0.9390 63.85 21.5 51,823,145 3,703,128 0.0715 0.9285 59.95 22.5 46,398,811 3,632,649 0.0783 0.9217 55.67 23.5 41,274,867 5,765,513 0.1397 0.8603 51.31 24.5 32,684,882 6,072,398 0.1858 0.8142 44.14 25.5 25,417,015 5,123,138 0.2016 0.7984 35.94 26.5 19,236,672 4,237,501 0.2203 0.7797 28.70 27.5 14,448,541 3,434,728 0.2377 0.7623 22.38 28.5 4,953,956 1,220,408 0.2464 0.7536 17.06
29.5 3,733,547 850,913 0.2279 0.7721 12.85 30.5 2,882,634 708,806 0.2459 0.7541 9.93 31.5 2,173,828 495,276 0.2278 0.7722 7.48 32.5 1,678,552 950,181 0.5661 0.4339 5.78 33.5 728,372 279,043 0.3831 0.6169 2.51 34.5 449,329 124,097 0.2762 0.7238 1.55 35.5 325,231 63,106 0.1940 0.8060 1.12 36.5 262,125 65,006 0.2480 0.7520 0.90 37.5 197,119 85,707 0.4348 0.5652 0.68 38.5 111,412 67,095 0.6022 0.3978 0.38
V-26

Gaz Métro 2014 Depreciation Study
GAZ MÉTRO
ACCOUNT Z12.00 - DISTRIBUTION METER
ORIGINAL LIFE TABLE, CONT.
PLACEMENT BAND 1956-2014 EXPERIENCE BAND 1957-2014
AGE AT EXPOSURES AT RETIREMENTS PCT SURV BEGIN OF BEGINNING OF DURING AGE RETMT SURV BEGIN OF INTERVAL AGE INTERVAL INTERVAL RATIO RATIO INTERVAL
39.5 44,317 21,687 0.4894 0.5106 0.15 40.5 22,630 9,047 0.3998 0.6002 0.08 41.5 13,583 6,536 0.4812 0.5188 0.05 42.5 7,048 5,286 0.7500 0.2500 0.02 43.5 1,762 1,762 1.0000 0.01 44.5
V-27

Gaz Métro 2014 Depreciation Study
GAZ MÉTRO
ACCOUNT Z12.50 - DISTRIBUTION DELIVERY STATION - EQUIPMENT
ORIGINAL AND SMOOTH SURVIVOR CURVES
V-28

Gaz Métro 2014 Depreciation Study
GAZ MÉTRO
ACCOUNT Z12.50 - DISTRIBUTION DELIVERY STATION - EQUIPMENT
ORIGINAL LIFE TABLE
PLACEMENT BAND 1956-2014 EXPERIENCE BAND 1959-2014
AGE AT EXPOSURES AT RETIREMENTS PCT SURV BEGIN OF BEGINNING OF DURING AGE RETMT SURV BEGIN OF INTERVAL AGE INTERVAL INTERVAL RATIO RATIO INTERVAL
0.0 92,355,605 0.0000 1.0000 100.00 0.5 91,417,286 0.0000 1.0000 100.00 1.5 89,956,869 5 0.0000 1.0000 100.00 2.5 88,960,797 68,347 0.0008 0.9992 100.00 3.5 87,538,269 21,471 0.0002 0.9998 99.92 4.5 86,556,566 28,727 0.0003 0.9997 99.90 5.5 85,459,207 78,913 0.0009 0.9991 99.87 6.5 84,540,935 3,976 0.0000 1.0000 99.77 7.5 80,357,260 6,046 0.0001 0.9999 99.77 8.5 75,959,252 28,901 0.0004 0.9996 99.76
9.5 75,683,052 1,534,428 0.0203 0.9797 99.72 10.5 73,338,402 1,192,717 0.0163 0.9837 97.70 11.5 70,367,014 19,177 0.0003 0.9997 96.11 12.5 69,343,952 12,421 0.0002 0.9998 96.09 13.5 69,135,402 66,413 0.0010 0.9990 96.07 14.5 65,811,385 7,162 0.0001 0.9999 95.98 15.5 62,591,590 31,489 0.0005 0.9995 95.97 16.5 60,213,646 197,323 0.0033 0.9967 95.92 17.5 58,298,116 491,988 0.0084 0.9916 95.60 18.5 53,725,058 1,456,633 0.0271 0.9729 94.80
19.5 49,019,393 1,148,264 0.0234 0.9766 92.23 20.5 43,662,391 1,160,242 0.0266 0.9734 90.07 21.5 41,278,409 172,494 0.0042 0.9958 87.67 22.5 39,760,947 72,446 0.0018 0.9982 87.31 23.5 37,432,468 160,700 0.0043 0.9957 87.15 24.5 36,638,152 29,866 0.0008 0.9992 86.77 25.5 35,373,243 139,152 0.0039 0.9961 86.70 26.5 33,808,277 39,731 0.0012 0.9988 86.36 27.5 33,740,771 158,493 0.0047 0.9953 86.26 28.5 33,416,074 88,038 0.0026 0.9974 85.85
29.5 31,302,228 259,872 0.0083 0.9917 85.63 30.5 25,714,383 52,931 0.0021 0.9979 84.92 31.5 13,166,447 32,063 0.0024 0.9976 84.74 32.5 1,832,988 134,711 0.0735 0.9265 84.54 33.5 1,698,277 90,533 0.0533 0.9467 78.32 34.5 1,607,744 50,493 0.0314 0.9686 74.15 35.5 1,557,251 23,442 0.0151 0.9849 71.82 36.5 1,526,082 21,936 0.0144 0.9856 70.74 37.5 1,504,146 23,016 0.0153 0.9847 69.72 38.5 1,481,130 9,954 0.0067 0.9933 68.65
V-29

Gaz Métro 2014 Depreciation Study
GAZ MÉTRO
ACCOUNT Z12.50 - DISTRIBUTION DELIVERY STATION - EQUIPMENT
ORIGINAL LIFE TABLE, CONT.
PLACEMENT BAND 1956-2014 EXPERIENCE BAND 1959-2014
AGE AT EXPOSURES AT RETIREMENTS PCT SURV BEGIN OF BEGINNING OF DURING AGE RETMT SURV BEGIN OF INTERVAL AGE INTERVAL INTERVAL RATIO RATIO INTERVAL
39.5 25,585 9,397 0.3673 0.6327 68.19 40.5 16,188 8,804 0.5438 0.4562 43.15 41.5 7,384 4,211 0.5703 0.4297 19.68 42.5 3,173 2,576 0.8117 0.1883 8.46 43.5 598 598 1.0000 1.59 44.5
V-30

Gaz Métro 2014 Depreciation Study
GAZ MÉTRO
ACCOUNT Z12.51 - DISTRIBUTION DELIVERY STATION - CIVIL BUILDING
ORIGINAL AND SMOOTH SURVIVOR CURVES
V-31

Gaz Métro 2014 Depreciation Study
GAZ MÉTRO
ACCOUNT Z12.51 - DISTRIBUTION DELIVERY STATION - CIVIL BUILDING
ORIGINAL LIFE TABLE
PLACEMENT BAND 1956-2014 EXPERIENCE BAND 1957-2014
AGE AT EXPOSURES AT RETIREMENTS PCT SURV BEGIN OF BEGINNING OF DURING AGE RETMT SURV BEGIN OF INTERVAL AGE INTERVAL INTERVAL RATIO RATIO INTERVAL
0.0 13,990,075 26,654 0.0019 0.9981 100.00 0.5 14,021,251 8,800 0.0006 0.9994 99.81 1.5 13,980,834 6,171 0.0004 0.9996 99.75 2.5 13,952,743 0.0000 1.0000 99.70 3.5 13,783,299 0.0000 1.0000 99.70 4.5 13,422,278 0 0.0000 1.0000 99.70 5.5 13,335,847 46 0.0000 1.0000 99.70 6.5 12,914,303 498 0.0000 1.0000 99.70 7.5 11,868,675 3,664 0.0003 0.9997 99.70 8.5 10,805,153 3,854 0.0004 0.9996 99.67
9.5 10,661,116 3,446 0.0003 0.9997 99.63 10.5 10,169,599 4,906 0.0005 0.9995 99.60 11.5 9,868,211 2,558 0.0003 0.9997 99.55 12.5 9,693,899 3,196 0.0003 0.9997 99.53 13.5 9,690,703 2,090 0.0002 0.9998 99.49 14.5 9,688,256 22,464 0.0023 0.9977 99.47 15.5 9,648,091 50,482 0.0052 0.9948 99.24 16.5 9,584,488 66,290 0.0069 0.9931 98.72 17.5 9,518,198 21,737 0.0023 0.9977 98.04 18.5 9,458,529 23,187 0.0025 0.9975 97.82
19.5 9,318,417 32,429 0.0035 0.9965 97.58 20.5 8,522,245 49,355 0.0058 0.9942 97.24 21.5 8,313,574 37,683 0.0045 0.9955 96.67 22.5 8,108,166 62,461 0.0077 0.9923 96.23 23.5 7,740,086 105,721 0.0137 0.9863 95.49 24.5 7,226,686 120,013 0.0166 0.9834 94.19 25.5 6,777,144 79,135 0.0117 0.9883 92.62 26.5 5,079,197 14,161 0.0028 0.9972 91.54 27.5 5,063,973 3,254 0.0006 0.9994 91.29 28.5 5,013,416 13,494 0.0027 0.9973 91.23
29.5 4,359,021 14,076 0.0032 0.9968 90.98 30.5 2,391,440 24,940 0.0104 0.9896 90.69 31.5 408,476 17,062 0.0418 0.9582 89.74 32.5 235,109 16,743 0.0712 0.9288 86.00 33.5 218,367 17,657 0.0809 0.9191 79.87 34.5 200,710 8,490 0.0423 0.9577 73.41 35.5 192,220 12,549 0.0653 0.9347 70.31 36.5 172,098 10,289 0.0598 0.9402 65.72 37.5 161,809 10,757 0.0665 0.9335 61.79 38.5 151,052 12,441 0.0824 0.9176 57.68
V-32

Gaz Métro 2014 Depreciation Study
GAZ MÉTRO
ACCOUNT Z12.51 - DISTRIBUTION DELIVERY STATION - CIVIL BUILDING
ORIGINAL LIFE TABLE, CONT.
PLACEMENT BAND 1956-2014 EXPERIENCE BAND 1957-2014
AGE AT EXPOSURES AT RETIREMENTS PCT SURV BEGIN OF BEGINNING OF DURING AGE RETMT SURV BEGIN OF INTERVAL AGE INTERVAL INTERVAL RATIO RATIO INTERVAL
39.5 52,812 15,292 0.2895 0.7105 52.93 40.5 37,520 12,263 0.3268 0.6732 37.60 41.5 25,257 11,377 0.4504 0.5496 25.31 42.5 13,880 3,790 0.2731 0.7269 13.91 43.5 10,090 5,678 0.5627 0.4373 10.11 44.5 3,650 1,006 0.2757 0.7243 4.42 45.5 2,644 813 0.3075 0.6925 3.20 46.5 1,831 748 0.4085 0.5915 2.22 47.5 1,083 464 0.4286 0.5714 1.31 48.5 619 512 0.8269 0.1731 0.75
49.5 107 107 1.0000 0.13 50.5
V-33

Gaz Métro 2014 Depreciation Study
GAZ MÉTRO
ACCOUNT Z13.00 - DISTRIBUTION RELEASE STATION - EQUIPMENT
ORIGINAL AND SMOOTH SURVIVOR CURVES
V-34

Gaz Métro 2014 Depreciation Study
GAZ MÉTRO
ACCOUNT Z13.00 - DISTRIBUTION RELEASE STATION - EQUIPMENT
ORIGINAL LIFE TABLE
PLACEMENT BAND 1956-2014 EXPERIENCE BAND 1959-2014
AGE AT EXPOSURES AT RETIREMENTS PCT SURV BEGIN OF BEGINNING OF DURING AGE RETMT SURV BEGIN OF INTERVAL AGE INTERVAL INTERVAL RATIO RATIO INTERVAL
0.0 50,213,969 38,629 0.0008 0.9992 100.00 0.5 49,492,502 93,550 0.0019 0.9981 99.92 1.5 47,253,255 121,520 0.0026 0.9974 99.73 2.5 46,233,116 337,351 0.0073 0.9927 99.48 3.5 43,178,671 255,709 0.0059 0.9941 98.75 4.5 42,344,177 313,823 0.0074 0.9926 98.17 5.5 41,597,696 341,688 0.0082 0.9918 97.44 6.5 40,696,690 294,666 0.0072 0.9928 96.64 7.5 39,714,554 295,443 0.0074 0.9926 95.94 8.5 38,599,353 268,702 0.0070 0.9930 95.23
9.5 37,339,578 286,061 0.0077 0.9923 94.56 10.5 36,175,001 359,806 0.0099 0.9901 93.84 11.5 34,161,085 408,269 0.0120 0.9880 92.90 12.5 31,670,346 463,533 0.0146 0.9854 91.79 13.5 30,880,504 456,918 0.0148 0.9852 90.45 14.5 29,777,707 376,046 0.0126 0.9874 89.11 15.5 28,549,487 449,540 0.0157 0.9843 87.99 16.5 27,476,233 403,371 0.0147 0.9853 86.60 17.5 26,759,867 450,960 0.0169 0.9831 85.33 18.5 25,348,285 358,544 0.0141 0.9859 83.89
19.5 23,924,238 353,129 0.0148 0.9852 82.71 20.5 23,288,323 520,541 0.0224 0.9776 81.49 21.5 21,840,740 532,694 0.0244 0.9756 79.66 22.5 20,518,503 459,909 0.0224 0.9776 77.72 23.5 19,096,098 362,932 0.0190 0.9810 75.98 24.5 17,855,374 779,451 0.0437 0.9563 74.53 25.5 16,648,626 639,400 0.0384 0.9616 71.28 26.5 15,143,161 327,403 0.0216 0.9784 68.54 27.5 14,552,348 235,344 0.0162 0.9838 67.06 28.5 13,837,024 253,194 0.0183 0.9817 65.98
29.5 12,609,375 609,286 0.0483 0.9517 64.77 30.5 8,213,101 267,842 0.0326 0.9674 61.64 31.5 4,606,257 229,505 0.0498 0.9502 59.63 32.5 3,038,820 122,319 0.0403 0.9597 56.66 33.5 2,597,534 291,830 0.1123 0.8877 54.38 34.5 2,097,081 179,950 0.0858 0.9142 48.27 35.5 1,695,129 91,073 0.0537 0.9463 44.13 36.5 1,464,193 45,685 0.0312 0.9688 41.76 37.5 1,308,936 24,584 0.0188 0.9812 40.45 38.5 1,264,524 15,755 0.0125 0.9875 39.69
V-35

Gaz Métro 2014 Depreciation Study
GAZ MÉTRO
ACCOUNT Z13.00 - DISTRIBUTION RELEASE STATION - EQUIPMENT
ORIGINAL LIFE TABLE, CONT.
PLACEMENT BAND 1956-2014 EXPERIENCE BAND 1959-2014
AGE AT EXPOSURES AT RETIREMENTS PCT SURV BEGIN OF BEGINNING OF DURING AGE RETMT SURV BEGIN OF INTERVAL AGE INTERVAL INTERVAL RATIO RATIO INTERVAL
39.5 49,887 15,027 0.3012 0.6988 39.20 40.5 34,860 7,468 0.2142 0.7858 27.39 41.5 27,392 2,797 0.1021 0.8979 21.52 42.5 24,595 317 0.0129 0.9871 19.33 43.5 24,277 0.0000 1.0000 19.08 44.5 24,277 0.0000 1.0000 19.08 45.5 24,277 0.0000 1.0000 19.08 46.5 24,277 0.0000 1.0000 19.08 47.5 24,277 0.0000 1.0000 19.08 48.5 19.08
V-36

Gaz Métro 2014 Depreciation Study
GAZ MÉTRO
ACCOUNT Z13.01 - DISTRIBUTION RELEASE STATION - CIVIL BUILDING
ORIGINAL AND SMOOTH SURVIVOR CURVES
V-37

Gaz Métro 2014 Depreciation Study
GAZ MÉTRO
ACCOUNT Z13.01 - DISTRIBUTION RELEASE STATION - CIVIL BUILDING
ORIGINAL LIFE TABLE
PLACEMENT BAND 1966-2014 EXPERIENCE BAND 2010-2014
AGE AT EXPOSURES AT RETIREMENTS PCT SURV BEGIN OF BEGINNING OF DURING AGE RETMT SURV BEGIN OF INTERVAL AGE INTERVAL INTERVAL RATIO RATIO INTERVAL
0.0 1,721,511 0.0000 1.0000 100.00 0.5 1,566,531 0.0000 1.0000 100.00 1.5 1,119,802 4,401 0.0039 0.9961 100.00 2.5 1,220,171 9,118 0.0075 0.9925 99.61 3.5 1,572,701 477 0.0003 0.9997 98.86 4.5 1,713,983 0.0000 1.0000 98.83 5.5 1,694,744 12,635 0.0075 0.9925 98.83 6.5 1,640,730 0.0000 1.0000 98.10 7.5 1,484,060 0.0000 1.0000 98.10 8.5 1,019,945 120 0.0001 0.9999 98.10
9.5 584,332 0.0000 1.0000 98.08 10.5 537,175 0.0000 1.0000 98.08 11.5 199,828 0.0000 1.0000 98.08 12.5 67,300 0.0000 1.0000 98.08 13.5 155,992 0.0000 1.0000 98.08 14.5 351,743 9,826 0.0279 0.9721 98.08 15.5 354,182 10,917 0.0308 0.9692 95.34 16.5 435,999 7,643 0.0175 0.9825 92.41 17.5 538,163 7,473 0.0139 0.9861 90.79 18.5 608,156 7,176 0.0118 0.9882 89.52
19.5 544,468 471 0.0009 0.9991 88.47 20.5 544,639 486 0.0009 0.9991 88.39 21.5 481,009 856 0.0018 0.9982 88.31 22.5 375,488 0.0000 1.0000 88.16 23.5 279,776 0.0000 1.0000 88.16 24.5 460,489 17,946 0.0390 0.9610 88.16 25.5 1,385,297 48,763 0.0352 0.9648 84.72 26.5 2,269,141 17,805 0.0078 0.9922 81.74 27.5 2,343,796 513 0.0002 0.9998 81.10 28.5 2,268,754 337 0.0001 0.9999 81.08
29.5 2,021,497 258 0.0001 0.9999 81.07 30.5 1,199,124 900 0.0008 0.9992 81.06 31.5 274,188 2,573 0.0094 0.9906 81.00 32.5 183,178 51 0.0003 0.9997 80.24 33.5 169,420 23 0.0001 0.9999 80.21 34.5 350,043 2,999 0.0086 0.9914 80.20 35.5 282,683 1,279 0.0045 0.9955 79.52 36.5 252,347 72 0.0003 0.9997 79.16 37.5 227,725 0.0000 1.0000 79.13 38.5 221,313 152 0.0007 0.9993 79.13
V-38

Gaz Métro 2014 Depreciation Study
GAZ MÉTRO
ACCOUNT Z13.01 - DISTRIBUTION RELEASE STATION - CIVIL BUILDING
ORIGINAL LIFE TABLE, CONT.
PLACEMENT BAND 1966-2014 EXPERIENCE BAND 2010-2014
AGE AT EXPOSURES AT RETIREMENTS PCT SURV BEGIN OF BEGINNING OF DURING AGE RETMT SURV BEGIN OF INTERVAL AGE INTERVAL INTERVAL RATIO RATIO INTERVAL
39.5 79.08 40.5 41.5 42.5 43.5 70,970 0.0000 44.5 70,970 0.0000 45.5 70,970 0.0000 46.5 70,970 0.0000 47.5 70,970 0.0000 48.5
V-39

Gaz Métro 2014 Depreciation Study
GAZ MÉTRO
ACCOUNT Z15.50 - DISTRIBUTION BIOGAZ - MAIN PIPE - STEEL
ORIGINAL AND SMOOTH SURVIVOR CURVES
V-40

Gaz Métro 2014 Depreciation Study
GAZ MÉTRO
ACCOUNT Z15.60 - DISTRIBUTION BIOGAZ- COMPRESSION STATION - EQUIPMENT
ORIGINAL AND SMOOTH SURVIVOR CURVES
V-41

Gaz Métro 2014 Depreciation Study
GAZ MÉTRO
ACCOUNT Z15.61 - DISTRIBUTION BIOGAZ - COMPRESSION STATION - BUILDING
ORIGINAL AND SMOOTH SURVIVOR CURVES
V-42

Gaz Métro 2014 Depreciation Study
GAZ MÉTRO
ACCOUNT Z15.70 - DISTRIBUTION BIOGAZ - METER STATION - EQUIPMENT
ORIGINAL AND SMOOTH SURVIVOR CURVES
V-43

Gaz Métro 2014 Depreciation Study
GAZ MÉTRO
ACCOUNT Z15.71 - DISTRIBUTION BIOGAZ - METER STATION - BUILDING
ORIGINAL AND SMOOTH SURVIVOR CURVES
V-44

Gaz Métro 2014 Depreciation Study
GAZ MÉTRO
ACCOUNT Z31.00 - TRANSMISSION - MAIN PIPE
ORIGINAL AND SMOOTH SURVIVOR CURVES
V-45

Gaz Métro 2014 Depreciation Study
GAZ MÉTRO
ACCOUNT Z31.00 - TRANSMISSION - MAIN PIPE
ORIGINAL LIFE TABLE
PLACEMENT BAND 1983-2014 EXPERIENCE BAND 1994-2014
AGE AT EXPOSURES AT RETIREMENTS PCT SURV BEGIN OF BEGINNING OF DURING AGE RETMT SURV BEGIN OF INTERVAL AGE INTERVAL INTERVAL RATIO RATIO INTERVAL
0.0 14,328,144 11 0.0000 1.0000 100.00 0.5 10,612,412 9 0.0000 1.0000 100.00 1.5 8,516,454 0 0.0000 1.0000 100.00 2.5 8,517,826 0 0.0000 1.0000 100.00 3.5 8,517,826 500 0.0001 0.9999 100.00 4.5 8,762,016 60 0.0000 1.0000 99.99 5.5 8,982,426 450 0.0001 0.9999 99.99 6.5 40,827,174 13,996 0.0003 0.9997 99.99 7.5 35,713,433 153 0.0000 1.0000 99.95 8.5 35,635,095 10 0.0000 1.0000 99.95
9.5 193,579,856 185,214 0.0010 0.9990 99.95 10.5 276,494,069 132,023 0.0005 0.9995 99.86 11.5 276,282,931 0.0000 1.0000 99.81 12.5 275,342,592 17 0.0000 1.0000 99.81 13.5 274,843,760 61 0.0000 1.0000 99.81 14.5 274,820,235 2,539 0.0000 1.0000 99.81 15.5 274,750,576 20 0.0000 1.0000 99.81 16.5 274,750,556 1 0.0000 1.0000 99.81 17.5 274,696,479 18,359 0.0001 0.9999 99.81 18.5 274,678,120 10,975 0.0000 1.0000 99.80
19.5 274,667,145 0.0000 1.0000 99.80 20.5 274,185,066 0.0000 1.0000 99.80 21.5 274,084,948 0.0000 1.0000 99.80 22.5 274,084,948 0.0000 1.0000 99.80 23.5 274,083,576 0.0000 1.0000 99.80 24.5 274,083,576 0.0000 1.0000 99.80 25.5 273,799,962 0.0000 1.0000 99.80 26.5 272,921,775 0.0000 1.0000 99.80 27.5 240,987,093 0.0000 1.0000 99.80 28.5 240,761,298 9,861 0.0000 1.0000 99.80
29.5 240,740,826 381,069 0.0016 0.9984 99.79 30.5 82,956,248 343 0.0000 1.0000 99.64 31.5 99.64
V-46

Gaz Métro 2014 Depreciation Study
GAZ MÉTRO
ACCOUNT Z40.51 - STOCKING - ADMINISTRATIVE BUILDING
ORIGINAL AND SMOOTH SURVIVOR CURVES
V-47

Gaz Métro 2014 Depreciation Study
GAZ MÉTRO
ACCOUNT Z40.52 - STOCKING - BUILDING INFRASTRUCTURE
ORIGINAL AND SMOOTH SURVIVOR CURVES
V-48

Gaz Métro 2014 Depreciation Study
GAZ MÉTRO
ACCOUNT Z40.52 - STOCKING - BUILDING INFRASTRUCTURE
ORIGINAL LIFE TABLE
PLACEMENT BAND 1975-2014 EXPERIENCE BAND 2014-2014
AGE AT EXPOSURES AT RETIREMENTS PCT SURV BEGIN OF BEGINNING OF DURING AGE RETMT SURV BEGIN OF INTERVAL AGE INTERVAL INTERVAL RATIO RATIO INTERVAL
0.0 200,425 0.0000 1.0000 100.00 0.5 3,436,720 0.0000 1.0000 100.00 1.5 195,439 0.0000 1.0000 100.00 2.5 2,488,260 0.0000 1.0000 100.00 3.5 24,530 0.0000 1.0000 100.00 4.5 126,239 0.0000 1.0000 100.00 5.5 63,212 0.0000 1.0000 100.00 6.5 581,962 0.0000 1.0000 100.00 7.5 761,921 0.0000 1.0000 100.00 8.5 361,809 0.0000 1.0000 100.00
9.5 45,021 0.0000 1.0000 100.00 10.5 2,440,006 0.0000 1.0000 100.00 11.5 74,007 0.0000 1.0000 100.00 12.5 5,154 0.0000 1.0000 100.00 13.5 100.00 14.5 22,800 0.0000 15.5 16.5 1,609,170 0.0000 17.5 390,635 0.0000 18.5
19.5 20.5 102 0.0000 21.5 5,510 0.0000 22.5 2,593,948 0.0000 23.5 201,988 0.0000 24.5 25.5 100,700 0.0000 26.5 93,005 0.0000 27.5 28.5 18,320 0.0000
29.5 30.5 31,579 0.0000 31.5 32.5 26,206 0.0000 33.5 34.5 7,566,124 0.0000 35.5 36.5 37.5 38.5 287,253 0.0000
39.5
V-49

Gaz Métro 2014 Depreciation Study
GAZ MÉTRO
ACCOUNT Z41.01 - STOCKING - MECHANICAL EQUIPMENT
ORIGINAL AND SMOOTH SURVIVOR CURVES
V-50

Gaz Métro 2014 Depreciation Study
GAZ MÉTRO
ACCOUNT Z41.01 - STOCKING - MECHANICAL EQUIPMENT
ORIGINAL LIFE TABLE
PLACEMENT BAND 1979-2014 EXPERIENCE BAND 2013-2014
AGE AT EXPOSURES AT RETIREMENTS PCT SURV BEGIN OF BEGINNING OF DURING AGE RETMT SURV BEGIN OF INTERVAL AGE INTERVAL INTERVAL RATIO RATIO INTERVAL
0.0 482,909 0.0000 1.0000 100.00 0.5 403,198 0.0000 1.0000 100.00 1.5 100.00 2.5 126,069 0.0000 3.5 500,854 0.0000 4.5 413,895 0.0000 5.5 179,357 0.0000 6.5 507,957 0.0000 7.5 549,754 0.0000 8.5 355,687 0.0000
9.5 914,997 0.0000 10.5 757,315 0.0000 11.5 347,347 0.0000 12.5 391,001 0.0000 13.5 79,012 0.0000 14.5 173,898 0.0000 15.5 361,194 0.0000 16.5 206,694 0.0000 17.5 18.5 9,059 0.0000
19.5 97,704 0.0000 20.5 212,820 0.0000 21.5 124,176 0.0000 22.5 23.5 24.5 110,454 0.0000 25.5 124,015 0.0000 26.5 163,965 0.0000 27.5 952,180 0.0000 28.5 812,118 0.0000
29.5 95,084 0.0000 30.5 84,742 0.0000 31.5 1,623 0.0000 32.5 1,623 0.0000 33.5 4,143,211 116,856 0.0282 34.5 4,026,355 0.0000 35.5
V-51

Gaz Métro 2014 Depreciation Study
GAZ MÉTRO
ACCOUNT Z41.02 - STOCKING - ELECTRONIC EQUIPMENT
ORIGINAL AND SMOOTH SURVIVOR CURVES
V-52

Gaz Métro 2014 Depreciation Study
GAZ MÉTRO
ACCOUNT Z41.02 - STOCKING - ELECTRONIC EQUIPMENT
ORIGINAL LIFE TABLE
PLACEMENT BAND 1979-2013 EXPERIENCE BAND 2013-2014
AGE AT EXPOSURES AT RETIREMENTS PCT SURV BEGIN OF BEGINNING OF DURING AGE RETMT SURV BEGIN OF INTERVAL AGE INTERVAL INTERVAL RATIO RATIO INTERVAL
0.0 32,266 0.0000 1.0000 100.00 0.5 330,610 0.0000 1.0000 100.00 1.5 298,344 0.0000 1.0000 100.00 2.5 100.00 3.5 4.5 5.5 236,359 0.0000 6.5 504,378 0.0000 7.5 326,757 0.0000 8.5 58,739 0.0000
9.5 105,556 0.0000 10.5 281,977 0.0000 11.5 182,621 0.0000 12.5 6,200 0.0000 13.5 14.5 15.5 7,341 0.0000 16.5 99,562 0.0000 17.5 392,231 0.0000 18.5 300,010 0.0000
19.5 20.5 21.5 22.5 18,255 0.0000 23.5 18,255 0.0000 24.5 25.5 5,453 0.0000 26.5 5,453 0.0000 27.5 28.5
29.5 863 0.0000 30.5 863 0.0000 31.5 32.5 33.5 560,245 10,000 0.0178 34.5 550,245 0.0000 35.5
V-53

Gaz Métro 2014 Depreciation Study
GAZ MÉTRO
ACCOUNT Z41.03 - STOCKING - SPECIALIZED EQUIPMENT
ORIGINAL AND SMOOTH SURVIVOR CURVES
V-54

Gaz Métro 2014 Depreciation Study
PART VI. ESTIMATION OF NET SALVAGE
VI-1

Gaz Métro 2014 Depreciation Study
GAZ MÉTRO
ACCOUNT Z11.00 - DISTRIBUTION BRANCH (SERVICE) - STEEL
SUMMARY OF BOOK SALVAGE
COST OF G R O S S S A L V A G E NET REGULAR REMOVAL REUSE FINAL SALVAGE
YEAR RETIREMENTS AMOUNT PCT AMOUNT PCT AMOUNT PCT AMOUNT PCT
2002 509,680 83,131 16 0 0 83,131 - 16 - 2003 843,820 24,107 3 0 0 24,107 - 3 - 2004 338,058 131,961 39 0 0 131,961 - 39 - 2005 86,731 100,186 116 0 0 100,186 - 116 - 2006 1,111,263 46,494 4 0 0 46,494 - 4 - 2007 1,459,098 106,314 7 0 0 106,314 - 7 - 2008 812,500 177,921 22 0 0 177,921 - 22 - 2009 1,180,994 87,153 7 0 0 87,153 - 7 - 2010 2,049,461 479,074 23 0 0 479,074 - 23 - 2011 1,070,721 811,551 76 0 0 811,551 - 76 - 2012 3,306,945 662,226 20 0 0 662,226 - 20 - 2013 1,658,756 506,419 31 0 0 506,419 - 31 - 2014 1,816,704 334,424 18 0 0 334,424 - 18 -
TOTAL 16,244,731 3,550,962 22 0 0 3,550,962 - 22 -
THREE-YEAR MOVING AVERAGES
02-04 563,853 79,733 14 0 0 79,733 - 14 - 03-05 422,870 85,418 20 0 0 85,418 - 20 - 04-06 512,017 92,880 18 0 0 92,880 - 18 - 05-07 885,697 84,331 10 0 0 84,331 - 10 - 06-08 1,127,620 110,243 10 0 0 110,243 - 10 - 07-09 1,150,864 123,796 11 0 0 123,796 - 11 - 08-10 1,347,652 248,049 18 0 0 248,049 - 18 - 09-11 1,433,725 459,259 32 0 0 459,259 - 32 - 10-12 2,142,376 650,951 30 0 0 650,951 - 30 - 11-13 2,012,141 660,066 33 0 0 660,066 - 33 - 12-14 2,260,802 501,023 22 0 0 501,023 - 22 - FIVE-YEAR AVERAGE
10-14 1,980,517 558,739 28 0 0 558,739 - 28 -
VI-2

Gaz Métro 2014 Depreciation Study
GAZ MÉTRO
ACCOUNT Z11.02 - DISTRIBUTION BRANCH (SERVICE) - DIRECT PLASTIC
SUMMARY OF BOOK SALVAGE
COST OF G R O S S S A L V A G E NET REGULAR REMOVAL REUSE FINAL SALVAGE
YEAR RETIREMENTS AMOUNT PCT AMOUNT PCT AMOUNT PCT AMOUNT PCT
2002 2,248,686 647,476 29 0 0 647,476 - 29 - 2003 1,713,413 735,749 43 0 0 735,749 - 43 - 2004 1,315,043 632,093 48 0 0 632,093 - 48 - 2005 480,611 934,902 195 0 0 934,902 - 195 - 2006 1,134,886 1,222,860 108 0 0 1,222,860 - 108 - 2007 2,024,687 972,614 48 0 0 972,614 - 48 - 2008 1,990,816 1,042,679 52 0 0 1,042,679 - 52 - 2009 635,841 1,494,356 235 0 0 1,494,356 - 235 - 2010 2,680,159 1,331,000 50 0 0 1,331,000 - 50 - 2011 1,036,678 1,147,378 111 0 0 1,147,378 - 111 - 2012 2,215,661 2,201,330 99 0 0 2,201,330 - 99 - 2013 1,187,027 2,198,366 185 0 0 2,198,366 - 185 - 2014 1,182,219 2,220,447 188 0 0 2,220,447 - 188 -
TOTAL 19,845,728 16,781,250 85 0 0 16,781,250 - 85 -
THREE-YEAR MOVING AVERAGES
02-04 1,759,047 671,773 38 0 0 671,773 - 38 - 03-05 1,169,689 767,581 66 0 0 767,581 - 66 - 04-06 976,847 929,952 95 0 0 929,952 - 95 - 05-07 1,213,395 1,043,459 86 0 0 1,043,459 - 86 - 06-08 1,716,796 1,079,384 63 0 0 1,079,384 - 63 - 07-09 1,550,448 1,169,883 75 0 0 1,169,883 - 75 - 08-10 1,768,939 1,289,345 73 0 0 1,289,345 - 73 - 09-11 1,450,893 1,324,245 91 0 0 1,324,245 - 91 - 10-12 1,977,499 1,559,902 79 0 0 1,559,902 - 79 - 11-13 1,479,789 1,849,025 125 0 0 1,849,025 - 125 - 12-14 1,528,303 2,206,714 144 0 0 2,206,714 - 144 - FIVE-YEAR AVERAGE
10-14 1,660,349 1,819,704 110 0 0 1,819,704 - 110 -
VI-3

Gaz Métro 2014 Depreciation Study
GAZ MÉTRO
ACCOUNT Z11.03 - DISTRIBUTION BRANCH (SERVICE) - INSERT PLASTIC
SUMMARY OF BOOK SALVAGE
COST OF G R O S S S A L V A G E NET REGULAR REMOVAL REUSE FINAL SALVAGE
YEAR RETIREMENTS AMOUNT PCT AMOUNT PCT AMOUNT PCT AMOUNT PCT
2010 407,088 387,480 95 0 0 387,480 - 95 - 2011 257,989 575,866 223 0 0 575,866 - 223 - 2012 414,602 370,027 89 0 0 370,027 - 89 - 2013 264,176 69,113 26 0 0 69,113 - 26 - 2014 260,211 27,154 10 0 0 27,154 - 10 -
TOTAL 1,604,066 1,429,640 89 0 0 1,429,640 - 89 -
THREE-YEAR MOVING AVERAGES
10-12 359,893 444,458 123 0 0 444,458 - 123 - 11-13 312,256 338,335 108 0 0 338,335 - 108 - 12-14 312,996 155,431 50 0 0 155,431 - 50 - FIVE-YEAR AVERAGE
10-14 320,813 285,928 89 0 0 285,928 - 89 -
VI-4

Gaz Métro 2014 Depreciation Study
GAZ MÉTRO
ACCOUNT Z11.04 - DISTRIBUTION BRANCH (SERVICE) - PRE-RELEASE PLASTIC
SUMMARY OF BOOK SALVAGE
COST OF G R O S S S A L V A G E NET REGULAR REMOVAL REUSE FINAL SALVAGE
YEAR RETIREMENTS AMOUNT PCT AMOUNT PCT AMOUNT PCT AMOUNT PCT
2003 21,232 21,232 - 2004 1,561 - 1,561 2005 2006 2007 86 86 - 2008 2009 2010 2011 2012 2013 2014
TOTAL 19,757 19,757 -
THREE-YEAR MOVING AVERAGES
03-05 6,557 6,557 - 04-06 520 - 520 05-07 29 29 - 06-08 29 29 - 07-09 29 29 - 08-10 09-11 10-12 11-13 12-14 FIVE-YEAR AVERAGE
10-14
VI-5

Gaz Métro 2014 Depreciation Study
GAZ MÉTRO
ACCOUNT Z11.05 - DISTRIBUTION BRANCH (SERVICE) - PRE-RELEASE STEEL
SUMMARY OF BOOK SALVAGE
COST OF G R O S S S A L V A G E NET REGULAR REMOVAL REUSE FINAL SALVAGE
YEAR RETIREMENTS AMOUNT PCT AMOUNT PCT AMOUNT PCT AMOUNT PCT
2006 45,848 45,848 - 2007 231 231 - 2008 20,491 20,491 - 2009 125,167 125,167 - 2010 2011 2012 2013 2014
TOTAL 191,737 191,737 -
THREE-YEAR MOVING AVERAGES
06-08 22,190 22,190 - 07-09 48,630 48,630 - 08-10 48,553 48,553 - 09-11 41,722 41,722 - 10-12 11-13 12-14 FIVE-YEAR AVERAGE
10-14
VI-6

Gaz Métro 2014 Depreciation Study
GAZ MÉTRO
ACCOUNT Z11.50 - DISTRIBUTION - MAIN PIPE STEEL
SUMMARY OF BOOK SALVAGE
COST OF G R O S S S A L V A G E NET REGULAR REMOVAL REUSE FINAL SALVAGE
YEAR RETIREMENTS AMOUNT PCT AMOUNT PCT AMOUNT PCT AMOUNT PCT
2002 32,107 30,489 95 0 0 30,489 - 95 - 2003 128,798 8,049 6 0 0 8,049 - 6 - 2004 1,357,165 4,411 0 0 0 4,411 - 0 2005 1,813,172 64,661 4 0 0 64,661 - 4 - 2006 3,109,562 282,951 9 0 0 282,951 - 9 - 2007 570,781 570,014 100 0 0 570,014 - 100 - 2008 621,452 305,313 49 0 0 305,313 - 49 - 2009 2,471,338 426,937 17 0 0 426,937 - 17 - 2010 3,237,122 676,156 21 0 0 676,156 - 21 - 2011 4,141,983 999,349 24 0 0 999,349 - 24 - 2012 8,169,113 2,097,350 26 0 0 2,097,350 - 26 - 2013 2,063,598 888,133 43 0 0 888,133 - 43 - 2014 2,891,105 821,866 28 0 0 821,866 - 28 -
TOTAL 30,607,297 7,175,679 23 0 0 7,175,679 - 23 -
THREE-YEAR MOVING AVERAGES
02-04 506,023 14,316 3 0 0 14,316 - 3 - 03-05 1,099,712 25,707 2 0 0 25,707 - 2 - 04-06 2,093,300 117,341 6 0 0 117,341 - 6 - 05-07 1,831,172 305,875 17 0 0 305,875 - 17 - 06-08 1,433,932 386,093 27 0 0 386,093 - 27 - 07-09 1,221,190 434,088 36 0 0 434,088 - 36 - 08-10 2,109,971 469,469 22 0 0 469,469 - 22 - 09-11 3,283,481 700,814 21 0 0 700,814 - 21 - 10-12 5,182,740 1,257,619 24 0 0 1,257,619 - 24 - 11-13 4,791,565 1,328,277 28 0 0 1,328,277 - 28 - 12-14 4,374,605 1,269,116 29 0 0 1,269,116 - 29 - FIVE-YEAR AVERAGE
10-14 4,100,584 1,096,571 27 0 0 1,096,571 - 27 -
VI-7

Gaz Métro 2014 Depreciation Study
GAZ MÉTRO
ACCOUNT Z11.51 - DISTRIBUTION - MAIN PIPE DIRECT PLASTIC
SUMMARY OF BOOK SALVAGE
COST OF G R O S S S A L V A G E NET REGULAR REMOVAL REUSE FINAL SALVAGE
YEAR RETIREMENTS AMOUNT PCT AMOUNT PCT AMOUNT PCT AMOUNT PCT
2002 72,693 32,587 45 0 0 32,587 - 45 - 2003 118,431 7,853 7 0 0 7,853 - 7 - 2004 236,966 20,114 8 0 0 20,114 - 8 - 2005 524,687 28,827 5 0 0 28,827 - 5 - 2006 597,099 28,626 5 0 0 28,626 - 5 - 2007 542,124 58,412 11 0 0 58,412 - 11 - 2008 653,328 35,677 5 0 0 35,677 - 5 - 2009 500,565 72,729 15 0 0 72,729 - 15 - 2010 876,694 140,511 16 0 0 140,511 - 16 - 2011 749,886 15,147 2 0 0 15,147 - 2 - 2012 865,024 47,493 5 0 0 47,493 - 5 - 2013 812,799 36,346 4 0 0 36,346 - 4 - 2014 881,209 23,507 3 0 0 23,507 - 3 -
TOTAL 7,431,506 547,830 7 0 0 547,830 - 7 -
THREE-YEAR MOVING AVERAGES
02-04 142,697 20,185 14 0 0 20,185 - 14 - 03-05 293,361 18,931 6 0 0 18,931 - 6 - 04-06 452,917 25,856 6 0 0 25,856 - 6 - 05-07 554,637 38,622 7 0 0 38,622 - 7 - 06-08 597,517 40,905 7 0 0 40,905 - 7 - 07-09 565,339 55,606 10 0 0 55,606 - 10 - 08-10 676,862 82,972 12 0 0 82,972 - 12 - 09-11 709,049 76,129 11 0 0 76,129 - 11 - 10-12 830,535 67,717 8 0 0 67,717 - 8 - 11-13 809,236 32,995 4 0 0 32,995 - 4 - 12-14 853,011 35,782 4 0 0 35,782 - 4 - FIVE-YEAR AVERAGE
10-14 837,123 52,601 6 0 0 52,601 - 6 -
VI-8

Gaz Métro 2014 Depreciation Study
GAZ MÉTRO
ACCOUNT Z12.50 - DISTRIBUTION DELIVERY STATION - EQUIPMENT
SUMMARY OF BOOK SALVAGE
COST OF G R O S S S A L V A G E NET REGULAR REMOVAL REUSE FINAL SALVAGE
YEAR RETIREMENTS AMOUNT PCT AMOUNT PCT AMOUNT PCT AMOUNT PCT
2010 90,155 10,637 12 0 0 10,637 - 12 - 2011 4,519 60,666 0 0 60,666 - 2012 2,707,379 15,910 1 0 0 15,910 - 1 - 2013 276,256 126,521 46 0 0 126,521 - 46 - 2014 75,138 102,391 136 0 0 102,391 - 136 -
TOTAL 3,153,447 316,124 10 0 0 316,124 - 10 -
THREE-YEAR MOVING AVERAGES
10-12 934,018 29,071 3 0 0 29,071 - 3 - 11-13 996,051 67,699 7 0 0 67,699 - 7 - 12-14 1,019,591 81,607 8 0 0 81,607 - 8 - FIVE-YEAR AVERAGE
10-14 630,689 63,225 10 0 0 63,225 - 10 -
VI-9

Gaz Métro 2014 Depreciation Study
GAZ MÉTRO
ACCOUNT Z13.00 - DISTRIBUTION RELEASE STATION - EQUIPMENT
SUMMARY OF BOOK SALVAGE
COST OF G R O S S S A L V A G E NET REGULAR REMOVAL REUSE FINAL SALVAGE
YEAR RETIREMENTS AMOUNT PCT AMOUNT PCT AMOUNT PCT AMOUNT PCT
2002 268,529 2,013 1 0 0 2,013 - 1 - 2003 232,590 71,290 31 0 0 71,290 - 31 - 2004 42,327 42,327 - 2005 580,908 4,246 1 0 0 4,246 - 1 - 2006 184,318 42,219 23 0 0 42,219 - 23 - 2007 288,558 425,524 147 0 0 425,524 - 147 - 2008 501,240 169,343 34 0 0 169,343 - 34 - 2009 680,688 184,097 27 0 0 184,097 - 27 - 2010 1,074,002 50,189 5 0 0 50,189 - 5 - 2011 701,901 198,697 28 0 0 198,697 - 28 - 2012 48,746 326,128 669 0 0 326,128 - 669 - 2013 526,231 95,972 18 0 0 95,972 - 18 - 2014 133,089 109,956 83 0 0 109,956 - 83 -
TOTAL 5,220,800 1,722,001 33 0 0 1,722,001 - 33 -
THREE-YEAR MOVING AVERAGES
02-04 167,040 38,543 23 0 0 38,543 - 23 - 03-05 271,166 39,288 14 0 0 39,288 - 14 - 04-06 255,075 29,597 12 0 0 29,597 - 12 - 05-07 351,261 157,330 45 0 0 157,330 - 45 - 06-08 324,705 212,362 65 0 0 212,362 - 65 - 07-09 490,162 259,655 53 0 0 259,655 - 53 - 08-10 751,977 134,543 18 0 0 134,543 - 18 - 09-11 818,864 144,328 18 0 0 144,328 - 18 - 10-12 608,216 191,671 32 0 0 191,671 - 32 - 11-13 425,626 206,932 49 0 0 206,932 - 49 - 12-14 236,022 177,352 75 0 0 177,352 - 75 - FIVE-YEAR AVERAGE
10-14 496,794 156,188 31 0 0 156,188 - 31 -
VI-10

Gaz Métro 2014 Depreciation Study
GAZ MÉTRO
ACCOUNT Z31.00 - TRANSMISSION - MAIN PIPE
SUMMARY OF BOOK SALVAGE
COST OF G R O S S S A L V A G E NET REGULAR REMOVAL REUSE FINAL SALVAGE
YEAR RETIREMENTS AMOUNT PCT AMOUNT PCT AMOUNT PCT AMOUNT PCT
2008 45,551 45,551 - 2009 2010 2011 2012 2013 10,041 11,619 116 0 0 11,619 - 116 - 2014 381,912 18,660 5 0 0 18,660 - 5 -
TOTAL 391,953 75,830 19 0 0 75,830 - 19 -
THREE-YEAR MOVING AVERAGES
08-10 15,184 15,184 - 09-11 10-12 11-13 3,347 3,873 116 0 0 3,873 - 116 - 12-14 130,651 10,093 8 0 0 10,093 - 8 - FIVE-YEAR AVERAGE
10-14 78,391 6,056 8 0 0 6,056 - 8 -
VI-11

Gaz Métro 2014 Depreciation Study
PART VII. DETAILED DEPRECIATION CALCULATIONS
VII-1

Gaz Métro 2014 Depreciation Study
GAZ MÉTRO
ACCOUNT Z10.50 - DISTRIBUTION SERVITUDE (EASEMENT)
CALCULATED REMAINING LIFE DEPRECIATION ACCRUAL SURVIVING ORIGINAL COST AS OF SEPTEMBER 31, 2014
ORIGINAL CALCULATED ALLOC. BOOK FUTURE BOOK REM. ANNUAL
YEAR COST ACCRUED RESERVE ACCRUALS LIFE ACCRUAL (1) (2) (3) (4) (5) (6) (7)
SURVIVOR CURVE.. 70-SQUARE NET SALVAGE PERCENT.. 0 1967 4,684.92 3,179 3,209 1,476 22.50 66 1975 1,488,371.20 839,873 847,832 640,539 30.50 21,001 1976 3,829.91 2,106 2,126 1,704 31.50 54 1977 3,102.40 1,662 1,678 1,424 32.50 44 1978 27,026.95 14,093 14,227 12,800 33.50 382 1979 1,901.88 965 974 928 34.50 27 1980 147,744.79 72,817 73,507 74,238 35.50 2,091 1981 46,237.90 22,128 22,338 23,900 36.50 655 1982 201,511.78 93,560 94,447 107,065 37.50 2,855 1983 82,824.18 37,271 37,624 45,200 38.50 1,174 1984 224,077.68 97,633 98,558 125,520 39.50 3,178 1985 303,040.12 127,710 128,920 174,120 40.50 4,299 1986 174,802.34 71,169 71,843 102,959 41.50 2,481 1987 293,946.32 115,480 116,574 177,372 42.50 4,173 1988 297,747.99 112,718 113,786 183,962 43.50 4,229 1989 178,907.95 65,174 65,792 113,116 44.50 2,542 1990 328,057.95 114,820 115,908 212,150 45.50 4,663 1991 236,049.17 79,244 79,995 156,054 46.50 3,356 1992 86,884.24 27,927 28,192 58,692 47.50 1,236 1993 173,708.13 53,353 53,859 119,849 48.50 2,471 1994 49,017.03 14,355 14,491 34,526 49.50 697 1995 423,507.16 117,976 119,094 304,413 50.50 6,028 1996 1,203,645.98 318,112 321,126 882,520 51.50 17,136 1997 144,254.03 36,064 36,406 107,848 52.50 2,054 1998 56,787.76 13,385 13,512 43,276 53.50 809 1999 117,010.12 25,910 26,156 90,854 54.50 1,667 2000 193,290.72 40,038 40,417 152,874 55.50 2,754 2001 1,088,929.10 210,011 212,001 876,928 56.50 15,521 2002 222,328.97 39,701 40,077 182,252 57.50 3,170 2003 754,032.76 123,880 125,054 628,979 58.50 10,752 2004 42,704.08 6,406 6,467 36,237 59.50 609 2005 1,175,823.65 159,571 161,083 1,014,741 60.50 16,773 2006 2,205,195.27 267,777 270,315 1,934,880 61.50 31,461 2007 241,813.81 25,908 26,153 215,661 62.50 3,451 2008 255,187.48 23,697 23,922 231,265 63.50 3,642 2009 212,107.69 16,665 16,823 195,285 64.50 3,028 2010 252,318.35 16,222 16,376 235,942 65.50 3,602 2011 295,578.25 14,779 14,919 280,659 66.50 4,220
VII-2

Gaz Métro 2014 Depreciation Study
GAZ MÉTRO
ACCOUNT Z10.50 - DISTRIBUTION SERVITUDE (EASEMENT)
CALCULATED REMAINING LIFE DEPRECIATION ACCRUAL SURVIVING ORIGINAL COST AS OF SEPTEMBER 31, 2014
ORIGINAL CALCULATED ALLOC. BOOK FUTURE BOOK REM. ANNUAL
YEAR COST ACCRUED RESERVE ACCRUALS LIFE ACCRUAL (1) (2) (3) (4) (5) (6) (7)
SURVIVOR CURVE.. 70-SQUARE NET SALVAGE PERCENT.. 0 2012 398,607.56 14,234 14,369 384,239 67.50 5,692 2013 610,249.03 13,078 13,201 597,048 68.50 8,716 2014 667,049.88 4,763 4,808 662,242 69.50 9,529 14,913,896.48 3,455,414 3,488,159 11,425,737 212,288
COMPOSITE REMAINING LIFE AND ANNUAL ACCRUAL RATE, PERCENT .. 53.8 1.42
VII-3

Gaz Métro 2014 Depreciation Study
GAZ MÉTRO
ACCOUNT Z11.00 - DISTRIBUTION BRANCH (SERVICE) - STEEL
CALCULATED REMAINING LIFE DEPRECIATION ACCRUAL SURVIVING ORIGINAL COST AS OF SEPTEMBER 31, 2014
ORIGINAL CALCULATED ALLOC. BOOK FUTURE BOOK REM. ANNUAL
YEAR COST ACCRUED RESERVE ACCRUALS LIFE ACCRUAL (1) (2) (3) (4) (5) (6) (7)
SURVIVOR CURVE.. IOWA 43-R1.5 NET SALVAGE PERCENT.. -20 1957 307,166.62 324,294 368,600 1979 23,419,753.05 19,554,557 22,511,827 5,591,877 15.52 360,301 1980 6,121,728.70 5,018,103 5,777,000 1,569,074 16.01 98,006 1981 7,965,335.23 6,404,130 7,372,638 2,185,764 16.50 132,471 1982 4,623,049.36 3,642,038 4,192,830 1,354,829 17.00 79,696 1983 8,766,346.67 6,793,568 7,820,971 2,698,645 17.28 156,172 1984 11,774,594.96 8,921,375 10,270,570 3,858,944 17.81 216,673 1985 7,377,698.77 5,458,907 6,284,467 2,568,772 18.34 140,064 1986 1,431,570.74 1,033,136 1,189,379 528,506 18.89 27,978 1987 2,752,871.90 1,944,078 2,238,084 1,065,362 19.23 55,401 1988 1,786,758.77 1,227,289 1,412,894 731,217 19.80 36,930 1989 2,776,611.63 1,860,552 2,141,927 1,190,007 20.16 59,028 1990 1,276,646.35 829,412 954,845 577,131 20.75 27,814 1991 2,506,645.82 1,583,398 1,822,858 1,185,117 21.14 56,060 1992 1,390,412.11 848,429 976,738 691,757 21.75 31,805 1993 1,114,090.72 658,294 757,849 579,060 22.17 26,119 1994 1,819,361.17 1,038,346 1,195,377 987,856 22.60 43,710 1995 2,175,539.33 1,191,238 1,371,391 1,239,256 23.24 53,324 1996 2,609,599.99 1,372,858 1,580,478 1,551,042 23.70 65,445 1997 2,984,750.27 1,504,314 1,731,814 1,849,886 24.17 76,536 1998 1,858,646.17 897,949 1,033,747 1,196,628 24.48 48,882 1999 2,153,889.54 989,411 1,139,041 1,445,626 24.99 57,848 2000 2,369,335.97 1,030,661 1,186,530 1,656,673 25.50 64,968 2001 1,795,176.12 738,679 850,391 1,303,820 25.87 50,399 2002 4,016,343.38 1,554,325 1,789,388 3,030,224 26.26 115,393 2003 6,995,866.47 2,529,425 2,911,955 5,483,085 26.67 205,590 2004 4,191,009.81 1,404,659 1,617,088 3,412,124 27.09 125,955 2005 2,312,625.04 714,324 822,353 1,952,797 27.40 71,270 2006 4,104,827.07 1,155,591 1,330,353 3,595,439 27.73 129,659 2007 1,754,907.10 445,395 512,753 1,593,136 27.96 56,979 2008 2,419,698.84 545,303 627,770 2,275,869 28.10 80,992 2009 3,265,968.94 638,040 734,532 3,184,631 28.28 112,611 2010 4,541,893.70 747,777 860,865 4,589,407 28.29 162,227 2011 6,049,118.26 802,839 924,254 6,334,688 28.15 225,033 2012 6,050,498.37 601,178 692,095 6,568,503 27.71 237,044 2013 4,960,235.21 315,471 363,180 5,589,102 26.83 208,315 2014 6,567,241.01 160,766 185,079 7,695,610 24.01 320,517 160,387,813.16 86,480,109 99,553,911 92,911,465 4,017,215
COMPOSITE REMAINING LIFE AND ANNUAL ACCRUAL RATE, PERCENT .. 23.1 2.50
VII-4

Gaz Métro 2014 Depreciation Study
GAZ MÉTRO
ACCOUNT Z11.01 - DISTRIBUTION BRANCH (SERVICE) - COPPER INSERTS
CALCULATED REMAINING LIFE DEPRECIATION ACCRUAL SURVIVING ORIGINAL COST AS OF SEPTEMBER 31, 2014
ORIGINAL CALCULATED ALLOC. BOOK FUTURE BOOK REM. ANNUAL
YEAR COST ACCRUED RESERVE ACCRUALS LIFE ACCRUAL (1) (2) (3) (4) (5) (6) (7)
SURVIVOR CURVE.. IOWA 16-L1 NET SALVAGE PERCENT.. -70 1979 65,621.03 104,148 111,320 236 2.52 94 1980 244,560.88 384,406 410,879 4,874 2.81 1,735 1981 767,707.54 1,202,261 1,285,058 20,045 2.87 6,984 1989 1,454.69 2,106 2,251 222 4.44 50 1,079,344.14 1,692,921 1,809,508 25,377 8,863
COMPOSITE REMAINING LIFE AND ANNUAL ACCRUAL RATE, PERCENT .. 2.9 0.82
VII-5

Gaz Métro 2014 Depreciation Study
GAZ MÉTRO
ACCOUNT Z11.02 - DISTRIBUTION BRANCH (SERVICE) - DIRECT PLASTIC
CALCULATED REMAINING LIFE DEPRECIATION ACCRUAL SURVIVING ORIGINAL COST AS OF SEPTEMBER 31, 2014
ORIGINAL CALCULATED ALLOC. BOOK FUTURE BOOK REM. ANNUAL
YEAR COST ACCRUED RESERVE ACCRUALS LIFE ACCRUAL (1) (2) (3) (4) (5) (6) (7)
SURVIVOR CURVE.. IOWA 50-R2.5 NET SALVAGE PERCENT.. -100 1981 1,763,958.72 2,245,519 1,548,399 1,979,518 19.13 103,477 1982 10,948,281.15 13,593,386 9,373,330 12,523,232 19.85 630,893 1983 21,104,013.87 25,662,481 17,695,584 24,512,444 20.31 1,206,915 1984 30,284,445.22 35,838,612 24,712,543 35,856,347 21.05 1,703,389 1985 20,772,161.70 24,020,928 16,563,650 24,980,673 21.52 1,160,812 1986 10,755,275.69 12,076,024 8,327,032 13,183,519 22.26 592,252 1987 14,473,337.22 15,839,620 10,922,222 18,024,452 22.75 792,284 1988 12,554,682.83 13,307,964 9,176,517 15,932,849 23.50 677,994 1989 9,987,596.31 10,289,222 7,094,941 12,880,252 24.00 536,677 1990 8,818,211.49 8,772,357 6,048,986 11,587,437 24.76 467,990 1991 9,777,122.95 9,421,236 6,496,421 13,057,825 25.28 516,528 1992 11,637,774.56 10,788,217 7,439,023 15,836,526 26.04 608,162 1993 13,791,550.23 12,335,163 8,505,721 19,077,379 26.58 717,734 1994 15,798,358.45 13,536,034 9,333,783 22,262,934 27.35 814,001 1995 15,255,521.54 12,552,243 8,655,409 21,855,634 27.90 783,356 1996 14,566,071.08 11,425,626 7,878,549 21,253,593 28.67 741,318 1997 14,311,193.35 10,719,084 7,391,353 21,231,034 29.23 726,344 1998 13,923,925.95 9,880,418 6,813,050 21,034,802 30.01 700,926 1999 15,207,402.34 10,231,540 7,055,166 23,359,639 30.58 763,886 2000 18,064,070.78 11,474,298 7,912,111 28,216,031 31.16 905,521 2001 17,322,121.47 10,289,340 7,095,022 27,549,221 31.95 862,260 2002 14,583,686.67 8,093,946 5,581,187 23,586,186 32.55 724,614 2003 13,219,598.39 6,810,737 4,696,349 21,742,848 33.14 656,091 2004 19,130,803.94 9,079,480 6,260,762 32,000,846 33.75 948,173 2005 30,466,458.15 13,137,137 9,058,723 51,874,193 34.56 1,500,989 2006 31,100,285.91 12,104,231 8,346,482 53,854,090 35.17 1,531,251 2007 28,745,333.84 10,003,376 6,897,836 50,592,832 35.60 1,421,147 2008 28,132,875.09 8,558,021 5,901,190 50,364,560 36.24 1,389,751 2009 26,654,409.37 6,919,485 4,771,336 48,537,483 36.87 1,316,449 2010 29,605,347.81 6,371,071 4,393,177 54,817,519 37.34 1,468,064 2011 30,741,855.81 5,226,115 3,603,671 57,880,041 37.65 1,537,318 2012 39,042,760.79 4,825,685 3,327,555 74,757,967 37.98 1,968,351 2013 39,887,870.20 3,039,456 2,095,859 77,679,881 37.87 2,051,225 2014 39,264,609.50 1,052,292 725,609 77,803,610 36.68 2,121,145 671,692,972.37 379,520,344 261,698,548 1,081,687,397 34,647,287
COMPOSITE REMAINING LIFE AND ANNUAL ACCRUAL RATE, PERCENT .. 31.2 5.16
VII-6

Gaz Métro 2014 Depreciation Study
GAZ MÉTRO
ACCOUNT Z11.03 - DISTRIBUTION BRANCH (SERVICE) - INSERT PLASTIC
CALCULATED REMAINING LIFE DEPRECIATION ACCRUAL SURVIVING ORIGINAL COST AS OF SEPTEMBER 31, 2014
ORIGINAL CALCULATED ALLOC. BOOK FUTURE BOOK REM. ANNUAL
YEAR COST ACCRUED RESERVE ACCRUALS LIFE ACCRUAL (1) (2) (3) (4) (5) (6) (7)
SURVIVOR CURVE.. IOWA 50-R2.5 NET SALVAGE PERCENT.. -40 1979 3,851,957.72 3,579,701 4,249,517 1,143,224 17.98 63,583 1980 1,851,815.85 1,681,523 1,996,161 596,381 18.69 31,909 1981 1,923,953.81 1,714,435 2,035,231 658,304 19.13 34,412 1982 6,910,325.07 6,005,902 7,129,696 2,544,759 19.85 128,199 1983 5,463,316.75 4,650,375 5,520,530 2,128,113 20.31 104,782 1984 5,592,814.49 4,632,976 5,499,875 2,330,065 21.05 110,692 1985 4,772,533.42 3,863,270 4,586,146 2,095,401 21.52 97,370 1986 5,305,830.52 4,170,171 4,950,473 2,477,690 22.26 111,307 1987 5,462,468.99 4,184,688 4,967,706 2,679,751 22.75 117,791 1988 5,951,465.60 4,415,987 5,242,284 3,089,768 23.50 131,479 1989 1,781,062.60 1,284,395 1,524,725 968,763 24.00 40,365 1990 528,799.61 368,235 437,137 303,182 24.76 12,245 1991 1,448,403.18 976,977 1,159,784 867,980 25.28 34,335 1992 1,909,068.74 1,238,795 1,470,592 1,202,104 26.04 46,164 1993 3,015,296.88 1,887,817 2,241,056 1,980,360 26.58 74,506 1994 2,278,374.68 1,366,478 1,622,167 1,567,558 27.35 57,315 1995 2,372,801.41 1,366,639 1,622,358 1,699,564 27.90 60,916 1996 1,687,849.36 926,764 1,100,175 1,262,814 28.67 44,047 1997 1,652,791.22 866,558 1,028,704 1,285,204 29.23 43,969 1998 1,086,640.46 539,756 640,752 880,545 30.01 29,342 1999 1,632,625.18 768,901 912,774 1,372,901 30.58 44,895 2000 1,355,038.95 602,505 715,243 1,181,812 31.16 37,927 2001 1,207,732.44 502,175 596,140 1,094,685 31.95 34,262 2005 252,477.71 76,208 90,468 263,001 34.56 7,610 2006 306,196.72 83,420 99,029 329,646 35.17 9,373 2007 285,909.47 69,648 82,680 317,593 35.60 8,921 2008 330,098.50 70,291 83,443 378,695 36.24 10,450 2009 549,497.05 99,855 118,539 650,757 36.87 17,650 2010 614,130.60 92,513 109,824 749,959 37.34 20,085 2011 853,462.99 101,562 120,566 1,074,282 37.65 28,533 2012 1,307,213.33 113,100 134,263 1,695,836 37.98 44,651 2013 948,470.00 50,591 60,057 1,267,801 37.87 33,478 2014 1,174,126.60 22,027 26,148 1,617,629 36.68 44,101 75,664,549.90 52,374,238 62,174,243 43,756,126 1,716,664
COMPOSITE REMAINING LIFE AND ANNUAL ACCRUAL RATE, PERCENT .. 25.5 2.27
VII-7

Gaz Métro 2014 Depreciation Study
GAZ METRO
ACCOUNT Z11.04 - DISTRIBUTION BRANCH (SERVICE) - PRE-RELEASE PLASTIC
CALCULATED REMAINING LIFE DEPRECIATION ACCRUAL SURVIVING ORIGINAL COST AS OF SEPTEMBER 31, 2014
ORIGINAL CALCULATED ALLOC. BOOK FUTURE BOOK REM. ANNUAL
YEAR COST ACCRUED RESERVE ACCRUALS LIFE ACCRUAL (1) (2) (3) (4) (5) (6) (7)
SURVIVOR CURVE.. IOWA 35-R4 NET SALVAGE PERCENT.. -40 1989 8,134.24 8,101 5,769 5,619 10.34 543 1990 283,587.52 273,310 194,650 202,373 11.09 18,248 1991 331,824.76 308,929 220,018 244,537 11.84 20,653 1992 280,570.71 252,766 180,018 212,781 12.47 17,063 1993 175,381.02 152,034 108,278 137,255 13.22 10,382 1994 10,020.68 8,311 5,919 8,110 14.10 575 1996 8,592.27 6,520 4,644 7,385 15.63 472 2005 162,454.85 65,047 46,326 181,111 23.72 7,635 2006 169,883.19 61,053 43,482 194,354 24.61 7,897 2007 208,656.04 66,165 47,122 244,996 25.61 9,566 2008 75,496.11 20,748 14,776 90,919 26.61 3,417 2009 104,757.34 24,434 17,402 129,258 27.50 4,700 1,819,358.73 1,247,418 888,404 1,658,698 101,151
COMPOSITE REMAINING LIFE AND ANNUAL ACCRUAL RATE, PERCENT .. 16.4 5.56
VII-8
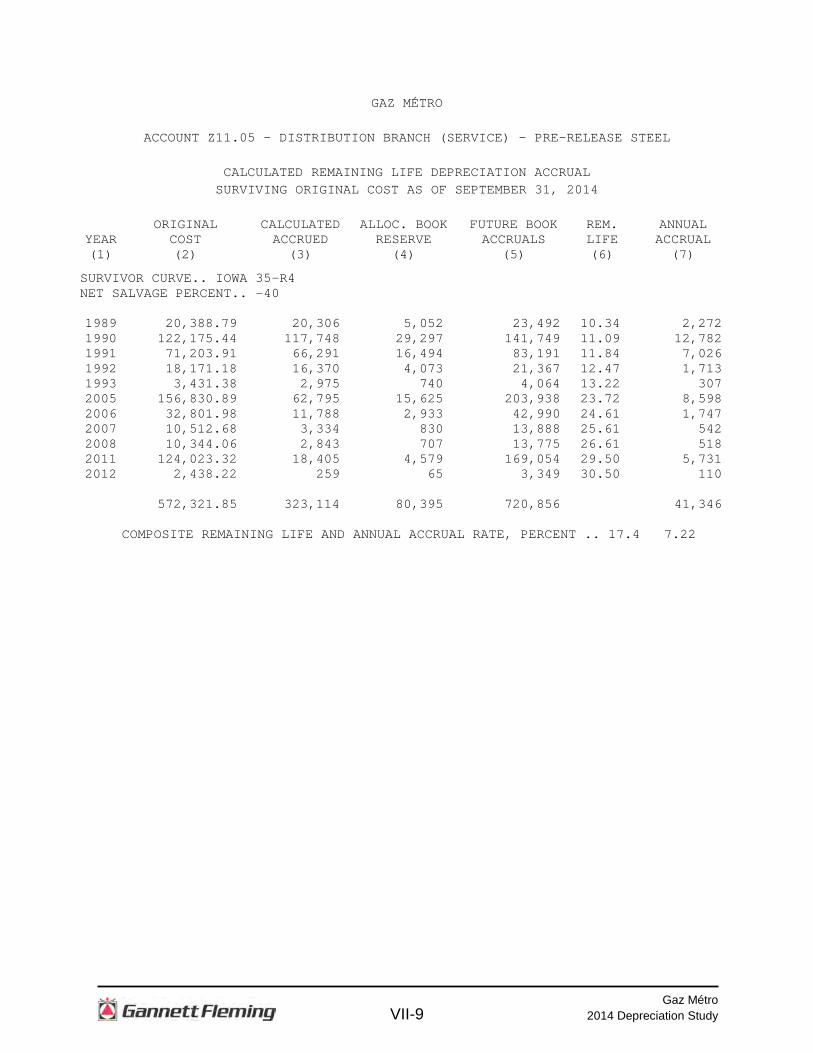
Gaz Métro 2014 Depreciation Study
GAZ MÉTRO
ACCOUNT Z11.05 - DISTRIBUTION BRANCH (SERVICE) - PRE-RELEASE STEEL
CALCULATED REMAINING LIFE DEPRECIATION ACCRUAL SURVIVING ORIGINAL COST AS OF SEPTEMBER 31, 2014
ORIGINAL CALCULATED ALLOC. BOOK FUTURE BOOK REM. ANNUAL
YEAR COST ACCRUED RESERVE ACCRUALS LIFE ACCRUAL (1) (2) (3) (4) (5) (6) (7)
SURVIVOR CURVE.. IOWA 35-R4 NET SALVAGE PERCENT.. -40 1989 20,388.79 20,306 5,052 23,492 10.34 2,272 1990 122,175.44 117,748 29,297 141,749 11.09 12,782 1991 71,203.91 66,291 16,494 83,191 11.84 7,026 1992 18,171.18 16,370 4,073 21,367 12.47 1,713 1993 3,431.38 2,975 740 4,064 13.22 307 2005 156,830.89 62,795 15,625 203,938 23.72 8,598 2006 32,801.98 11,788 2,933 42,990 24.61 1,747 2007 10,512.68 3,334 830 13,888 25.61 542 2008 10,344.06 2,843 707 13,775 26.61 518 2011 124,023.32 18,405 4,579 169,054 29.50 5,731 2012 2,438.22 259 65 3,349 30.50 110 572,321.85 323,114 80,395 720,856 41,346
COMPOSITE REMAINING LIFE AND ANNUAL ACCRUAL RATE, PERCENT .. 17.4 7.22
VII-9

Gaz Métro 2014 Depreciation Study
GAZ MÉTRO
ACCOUNT Z11.50 - DISTRIBUTION - MAIN PIPE STEEL
CALCULATED REMAINING LIFE DEPRECIATION ACCRUAL SURVIVING ORIGINAL COST AS OF SEPTEMBER 31, 2014
ORIGINAL CALCULATED ALLOC. BOOK FUTURE BOOK REM. ANNUAL
YEAR COST ACCRUED RESERVE ACCRUALS LIFE ACCRUAL (1) (2) (3) (4) (5) (6) (7)
SURVIVOR CURVE.. IOWA 45-R4 NET SALVAGE PERCENT.. -25 1979 76,504,596.02 72,315,969 66,311,323 29,319,422 11.45 2,560,648 1980 7,250,214.32 6,691,042 6,135,462 2,927,306 12.23 239,355 1981 5,770,427.93 5,219,352 4,785,971 2,427,064 12.80 189,614 1982 24,442,446.07 21,546,016 19,756,976 10,796,082 13.59 794,414 1983 46,352,764.64 39,967,671 36,649,017 21,291,939 14.16 1,503,668 1984 51,352,884.92 43,072,232 39,495,795 24,695,311 14.95 1,651,860 1985 33,229,483.30 27,082,029 24,833,314 16,703,540 15.75 1,060,542 1986 9,452,232.49 7,509,799 6,886,234 4,929,057 16.34 301,656 1987 14,156,333.99 10,900,377 9,995,281 7,700,136 17.14 449,249 1988 3,065,908.14 2,284,868 2,095,147 1,737,238 17.95 96,782 1989 25,721,647.80 18,529,232 16,990,686 15,161,374 18.75 808,607 1990 7,991,029.10 5,555,763 5,094,449 4,894,337 19.55 250,350 1991 20,035,428.47 13,418,728 12,304,525 12,739,761 20.36 625,725 1992 7,159,971.13 4,611,021 4,228,152 4,721,812 21.17 223,043 1993 14,727,378.34 9,103,361 8,347,477 10,061,746 21.98 457,768 1994 4,383,995.85 2,583,818 2,369,275 3,110,720 22.98 135,366 1995 68,276,380.27 38,439,602 35,247,829 50,097,646 23.79 2,105,828 1996 46,574,208.65 24,987,063 22,912,300 35,305,461 24.60 1,435,181 1997 9,922,351.06 5,035,593 4,617,470 7,785,469 25.60 304,120 1998 10,335,962.19 4,966,430 4,554,050 8,365,903 26.42 316,650 1999 6,880,311.51 3,106,461 2,848,521 5,751,868 27.42 209,769 2000 11,698,192.67 4,961,496 4,549,526 10,073,215 28.24 356,700 2001 18,783,237.99 7,417,031 6,801,169 16,677,878 29.24 570,379 2002 1,059,721.86 387,461 355,289 969,363 30.24 32,056 2003 2,546,546.59 860,096 788,679 2,394,504 31.06 77,093 2004 1,672,232.78 515,884 473,048 1,617,243 32.05 50,460 2005 1,317,098.88 367,471 336,959 1,309,415 33.06 39,607 2006 41,790,843.34 10,437,263 9,570,621 42,667,933 34.05 1,253,096 2007 4,651,328.47 1,024,455 939,391 4,874,770 35.06 139,041 2008 4,784,018.50 917,336 841,166 5,138,857 35.87 143,263 2009 7,871,856.67 1,277,209 1,171,158 8,668,663 36.87 235,114 2010 14,356,621.28 1,905,841 1,747,592 16,198,185 37.87 427,731 2011 12,728,143.98 1,314,181 1,205,060 14,705,120 38.87 378,315 2012 12,965,557.23 956,210 876,813 15,330,134 39.87 384,503 2013 29,454,127.30 1,303,345 1,195,124 35,622,535 40.87 871,606 2014 34,832,106.41 513,774 471,114 43,069,019 41.70 1,032,830 694,097,590.14 401,085,480 367,781,963 499,840,025 21,711,989
COMPOSITE REMAINING LIFE AND ANNUAL ACCRUAL RATE, PERCENT .. 23.0 3.13
VII-10

Gaz Métro 2014 Depreciation Study
GAZ MÉTRO
ACCOUNT Z11.51 - DISTRIBUTION - MAIN PIPE DIRECT PLASTIC
CALCULATED REMAINING LIFE DEPRECIATION ACCRUAL SURVIVING ORIGINAL COST AS OF SEPTEMBER 31, 2014
ORIGINAL CALCULATED ALLOC. BOOK FUTURE BOOK REM. ANNUAL
YEAR COST ACCRUED RESERVE ACCRUALS LIFE ACCRUAL (1) (2) (3) (4) (5) (6) (7)
SURVIVOR CURVE.. IOWA 65-R3 NET SALVAGE PERCENT.. -3 1980 266,929.51 147,971 180,534 94,403 29.60 3,189 1981 1,962,922.95 1,063,472 1,297,503 724,308 30.19 23,992 1982 31,587,880.16 16,599,621 20,252,584 12,282,933 31.20 393,684 1983 38,548,217.18 19,761,011 24,109,679 15,594,985 31.79 490,563 1984 69,544,532.40 34,740,971 42,386,175 29,244,693 32.39 902,893 1985 33,178,373.58 16,027,477 19,554,532 14,619,193 33.40 437,700 1986 18,697,012.59 8,781,613 10,714,122 8,543,801 34.00 251,288 1987 21,160,859.41 9,651,129 11,774,986 10,020,699 34.61 289,532 1988 21,879,597.82 9,674,699 11,803,743 10,732,243 35.23 304,634 1989 10,891,110.46 4,634,091 5,653,883 5,563,961 36.23 153,573 1990 13,566,429.01 5,580,985 6,809,154 7,164,268 36.85 194,417 1991 14,838,539.06 5,890,336 7,186,581 8,097,114 37.48 216,038 1992 15,212,950.72 5,781,986 7,054,387 8,614,952 38.48 223,881 1993 28,567,515.92 10,439,827 12,737,247 16,687,294 39.10 426,785 1994 23,236,668.66 8,094,401 9,875,680 14,058,089 40.11 350,488 1995 26,008,370.58 8,671,477 10,579,749 16,208,873 40.74 397,861 1996 16,495,258.74 5,249,946 6,405,265 10,584,852 41.38 255,796 1997 11,249,630.71 3,385,756 4,130,836 7,456,284 42.38 175,939 1998 14,118,248.32 4,030,986 4,918,057 9,623,739 43.02 223,704 1999 17,648,925.34 4,762,739 5,810,842 12,367,551 43.67 283,205 2000 24,077,815.58 6,076,037 7,413,148 17,387,002 44.67 389,232 2001 29,029,910.52 6,862,235 8,372,359 21,528,449 45.32 475,032 2002 23,480,578.46 5,139,312 6,270,285 17,914,711 46.32 386,760 2003 27,940,929.51 5,657,982 6,903,095 21,876,062 46.98 465,646 2004 30,791,541.35 5,727,781 6,988,254 24,727,034 47.64 519,039 2005 33,756,620.99 5,681,307 6,931,553 27,837,767 48.64 572,323 2006 26,382,741.03 3,994,611 4,873,677 22,300,546 49.31 452,252 2007 18,241,449.41 2,438,772 2,975,455 15,813,238 50.30 314,378 2008 18,686,205.06 2,176,812 2,655,848 16,590,943 50.97 325,504 2009 22,026,642.27 2,182,532 2,662,827 20,024,615 51.65 387,698 2010 17,224,577.33 1,405,112 1,714,325 16,026,990 52.32 306,326 2011 24,239,264.25 1,547,919 1,888,559 23,077,883 52.99 435,514 2012 31,839,840.07 1,459,379 1,780,534 31,014,501 53.68 577,766 2013 36,820,034.51 1,016,380 1,240,048 36,684,588 54.37 674,721 2014 28,819,224.25 270,123 329,567 29,354,234 54.45 539,104 822,017,347.71 234,606,788 286,235,073 560,442,796 12,820,457
COMPOSITE REMAINING LIFE AND ANNUAL ACCRUAL RATE, PERCENT .. 43.7 1.56
VII-11

Gaz Métro 2014 Depreciation Study
GAZ MÉTRO
ACCOUNT Z11.52 - DISTRIBUTION - MAIN PIPE PLASTIC INSERTS
CALCULATED REMAINING LIFE DEPRECIATION ACCRUAL SURVIVING ORIGINAL COST AS OF SEPTEMBER 31, 2014
ORIGINAL CALCULATED ALLOC. BOOK FUTURE BOOK REM. ANNUAL
YEAR COST ACCRUED RESERVE ACCRUALS LIFE ACCRUAL (1) (2) (3) (4) (5) (6) (7)
SURVIVOR CURVE.. IOWA 65-R4 NET SALVAGE PERCENT.. -10 1957 99,621.94 89,475 109,584 1979 4,510,955.57 2,765,847 3,441,032 1,521,019 28.19 53,956 1980 1,595,938.60 956,941 1,190,545 564,987 28.79 19,624 1981 1,289,850.17 750,989 934,317 484,518 29.79 16,264 1982 4,379,167.97 2,473,573 3,077,409 1,739,676 30.79 56,501 1983 2,264,219.66 1,247,313 1,551,801 938,841 31.40 29,899 1984 4,850,450.34 2,587,715 3,219,415 2,116,080 32.39 65,331 1985 4,465,955.21 2,303,986 2,866,424 2,046,127 33.40 61,261 1986 5,583,170.22 2,800,518 3,484,167 2,657,320 34.00 78,156 1987 4,488,692.25 2,172,527 2,702,874 2,234,687 35.00 63,848 1988 5,224,113.95 2,436,527 3,031,320 2,715,205 36.00 75,422 1989 2,184,413.47 986,612 1,227,459 1,175,396 36.61 32,106 1990 725,034.10 314,549 391,335 406,203 37.61 10,800 1991 1,158,223.77 482,099 599,787 674,259 38.61 17,463 1992 1,838,366.23 732,442 911,242 1,110,961 39.61 28,047 1993 2,387,784.95 914,832 1,138,156 1,488,407 40.23 36,997 1994 2,958,584.52 1,080,801 1,344,641 1,909,802 41.23 46,321 1995 3,831,378.03 1,331,366 1,656,372 2,558,144 42.23 60,576 1996 2,883,036.01 950,450 1,182,469 1,988,871 43.23 46,007 1997 1,968,723.24 613,946 763,820 1,401,776 44.23 31,693 1998 1,621,058.76 476,640 592,995 1,190,170 45.23 26,314 1999 1,199,226.36 331,238 412,098 907,051 46.23 19,620 2000 1,843,124.02 479,286 596,287 1,431,149 46.85 30,547 2001 758,660.27 183,596 228,415 606,112 47.85 12,667 64,109,749.61 29,463,268 36,653,964 33,866,761 919,420
COMPOSITE REMAINING LIFE AND ANNUAL ACCRUAL RATE, PERCENT .. 36.8 1.43
VII-12

Gaz Métro 2014 Depreciation Study
GAZ MÉTRO
ACCOUNT Z12.00 - DISTRIBUTION METER
CALCULATED REMAINING LIFE DEPRECIATION ACCRUAL SURVIVING ORIGINAL COST AS OF SEPTEMBER 31, 2014
ORIGINAL CALCULATED ALLOC. BOOK FUTURE BOOK REM. ANNUAL
YEAR COST ACCRUED RESERVE ACCRUALS LIFE ACCRUAL (1) (2) (3) (4) (5) (6) (7)
SURVIVOR CURVE.. IOWA 18-R2.5 NET SALVAGE PERCENT.. 0 1986 6,059,857.44 5,819,887 5,050,637 1,009,220 1.18 855,271 1987 550,629.32 523,924 454,674 95,955 1.40 68,539 1988 1,057,205.03 997,367 865,539 191,666 1.59 120,545 1989 1,195,469.77 1,115,732 968,259 227,211 1.82 124,841 1990 2,824,472.24 2,608,683 2,263,877 560,595 2.03 276,155 1991 1,491,294.81 1,359,763 1,180,035 311,260 2.27 137,119 1992 1,721,206.77 1,549,086 1,344,334 376,873 2.50 150,749 1993 2,398,685.48 2,124,756 1,843,914 554,771 2.77 200,278 1994 3,488,511.02 3,039,191 2,637,482 851,029 3.03 280,868 1995 2,484,623.19 2,117,396 1,837,527 647,096 3.38 191,449 1996 2,757,478.91 2,295,601 1,992,177 765,302 3.72 205,726 1997 2,428,954.02 1,963,809 1,704,240 724,714 4.15 174,630 1998 2,457,708.58 1,926,352 1,671,734 785,975 4.55 172,742 1999 4,041,540.93 3,050,555 2,647,344 1,394,197 5.03 277,176 2000 3,151,003.11 2,280,066 1,978,696 1,172,307 5.54 211,608 2001 3,269,800.09 2,251,257 1,953,695 1,316,105 6.11 215,402 2002 5,464,243.48 3,565,419 3,094,156 2,370,087 6.66 355,869 2003 3,716,543.48 2,282,329 1,980,660 1,735,883 7.23 240,094 2004 5,397,885.89 3,088,670 2,680,421 2,717,465 7.85 346,174 2005 5,924,785.79 3,135,397 2,720,972 3,203,814 8.45 379,150 2006 10,227,253.36 4,937,718 4,285,070 5,942,183 9.11 652,270 2007 8,393,133.49 3,651,013 3,168,436 5,224,697 9.74 536,417 2008 9,458,277.64 3,639,545 3,158,484 6,299,794 10.39 606,332 2009 9,230,340.90 3,066,319 2,661,025 6,569,316 11.06 593,971 2010 9,414,181.09 2,613,377 2,267,951 7,146,230 11.71 610,267 2011 13,131,475.43 2,899,430 2,516,194 10,615,281 12.35 859,537 2012 12,820,973.36 2,074,433 1,800,243 11,020,730 12.96 850,365 2013 11,314,178.97 1,135,944 985,799 10,328,380 13.45 767,909 2014 13,186,682.77 470,765 408,541 12,778,142 13.51 945,828 159,058,396.36 71,583,784 62,122,116 96,936,280 11,407,281
COMPOSITE REMAINING LIFE AND ANNUAL ACCRUAL RATE, PERCENT .. 8.5 7.17
VII-13

Gaz Métro 2014 Depreciation Study
GAZ MÉTRO
ACCOUNT Z12.50 - DISTRIBUTION DELIVERY STATION - EQUIPMENT
CALCULATED REMAINING LIFE DEPRECIATION ACCRUAL SURVIVING ORIGINAL COST AS OF SEPTEMBER 31, 2014
ORIGINAL CALCULATED ALLOC. BOOK FUTURE BOOK REM. ANNUAL
YEAR COST ACCRUED RESERVE ACCRUALS LIFE ACCRUAL (1) (2) (3) (4) (5) (6) (7)
SURVIVOR CURVE.. IOWA 37-R3 NET SALVAGE PERCENT.. -10 1975 1,445,591.07 1,381,841 1,590,150 1978 7,726.87 7,104 8,383 117 7.17 16 1982 11,301,396.14 9,736,379 11,489,930 941,606 9.00 104,623 1983 12,495,005.49 10,564,027 12,466,640 1,277,866 9.48 134,796 1984 5,327,973.59 4,397,336 5,189,309 671,462 10.15 66,154 1985 2,025,807.95 1,636,974 1,931,798 296,591 10.66 27,823 1986 166,203.50 131,304 154,952 27,872 11.18 2,493 1987 27,774.69 21,341 25,185 5,367 11.87 452 1988 1,425,815.22 1,068,078 1,260,442 307,955 12.41 24,815 1989 1,235,042.21 900,716 1,062,938 295,608 12.96 22,809 1990 633,615.88 447,390 527,966 169,011 13.67 12,364 1991 2,256,032.63 1,545,563 1,823,923 657,713 14.23 46,220 1992 1,344,968.38 888,863 1,048,950 430,515 14.95 28,797 1993 1,223,739.68 778,592 918,819 427,295 15.67 27,268 1994 4,208,738.20 2,581,472 3,046,403 1,583,209 16.26 97,368 1995 3,249,032.04 1,909,554 2,253,470 1,320,465 17.00 77,674 1996 4,081,070.11 2,292,174 2,705,001 1,784,176 17.73 100,630 1997 1,718,206.39 922,711 1,088,894 801,133 18.34 43,682 1998 2,346,455.40 1,196,598 1,412,109 1,168,992 19.09 61,236 1999 3,212,632.73 1,549,967 1,829,121 1,704,775 19.84 85,926 2000 3,257,602.88 1,480,646 1,747,315 1,836,048 20.59 89,172 2001 196,128.79 83,578 98,631 117,111 21.34 5,488 2002 1,003,886.02 398,864 470,700 633,575 22.10 28,669 2003 1,778,670.96 654,658 772,564 1,183,974 22.87 51,770 2004 810,221.55 274,147 323,522 567,722 23.63 24,025 2005 247,299.37 76,223 89,951 182,078 24.40 7,462 2006 4,391,961.13 1,219,384 1,438,998 3,392,159 25.17 134,770 2007 4,179,698.23 1,030,797 1,216,446 3,381,222 25.95 130,298 2008 839,359.32 180,597 213,123 710,172 26.72 26,578 2009 1,068,632.91 195,250 230,415 945,081 27.61 34,230 2010 960,232.11 144,496 170,520 885,735 28.39 31,199 2011 1,354,179.94 159,536 188,269 1,301,329 29.18 44,597 2012 1,257,238.30 106,765 125,994 1,256,968 29.86 42,095 2013 1,461,585.90 75,242 88,793 1,518,951 30.55 49,720 2014 988,886.95 17,296 20,411 1,067,364 30.95 34,487 83,528,412.53 50,055,463 59,030,035 32,851,219 1,699,706
COMPOSITE REMAINING LIFE AND ANNUAL ACCRUAL RATE, PERCENT .. 19.3 2.03
VII-14

Gaz Métro 2014 Depreciation Study
GAZ MÉTRO
ACCOUNT Z12.51 - DISTRIBUTION DELIVERY STATION - CIVIL BUILDING
CALCULATED REMAINING LIFE DEPRECIATION ACCRUAL SURVIVING ORIGINAL COST AS OF SEPTEMBER 31, 2014
ORIGINAL CALCULATED ALLOC. BOOK FUTURE BOOK REM. ANNUAL
YEAR COST ACCRUED RESERVE ACCRUALS LIFE ACCRUAL (1) (2) (3) (4) (5) (6) (7)
SURVIVOR CURVE.. IOWA 39-R4 NET SALVAGE PERCENT.. -10 1970 762.30 776 834 5 3.58 1 1975 85,798.94 83,506 89,743 4,636 5.14 902 1978 7,573.47 7,055 7,582 749 6.60 113 1982 156,303.80 135,226 145,326 26,608 8.82 3,017 1983 1,958,025.14 1,655,432 1,779,073 374,755 9.48 39,531 1984 1,953,504.25 1,612,286 1,732,704 416,151 10.15 41,000 1985 640,900.75 515,771 554,293 150,698 10.82 13,928 1986 47,303.28 37,074 39,843 12,191 11.50 1,060 1987 1,063.10 810 870 299 12.18 25 1988 1,618,811.80 1,198,584 1,288,104 492,589 12.87 38,274 1989 329,529.41 235,686 253,289 109,193 13.72 7,959 1990 407,678.57 282,342 303,430 145,016 14.41 10,064 1991 305,619.08 204,600 219,881 116,300 15.11 7,697 1992 167,724.75 107,931 115,992 68,505 15.96 4,292 1993 159,316.11 98,717 106,090 69,158 16.67 4,149 1994 763,743.27 452,991 486,824 353,294 17.52 20,165 1995 116,924.92 66,212 71,157 57,460 18.38 3,126 1996 37,931.36 20,453 21,981 19,743 19.24 1,026 1998 13,121.10 6,359 6,834 7,599 20.95 363 1999 17,701.05 8,088 8,692 10,779 21.81 494 2000 356.59 152 163 229 22.81 10 2002 171,754.47 63,518 68,262 120,668 24.68 4,889 2003 296,481.99 101,263 108,826 217,304 25.54 8,508 2004 488,071.68 152,205 163,573 373,306 26.54 14,066 2005 140,182.25 39,691 42,655 111,545 27.40 4,071 2006 1,059,858.71 268,611 288,673 877,172 28.40 30,886 2007 1,045,129.44 233,607 251,055 898,587 29.40 30,564 2008 421,498.19 81,973 88,095 375,553 30.26 12,411 2009 86,431.14 14,223 15,285 79,789 31.26 2,552 2010 361,020.19 48,608 52,239 344,883 32.26 10,691 2011 169,444.86 17,744 19,069 167,320 33.26 5,031 2012 21,919.60 1,640 1,763 22,349 34.26 652 2013 31,616.80 1,426 1,532 33,246 35.13 946 2014 1,900.00 28 30 2,060 36.13 57 13,085,002.36 7,754,588 8,333,762 6,059,740 322,520
COMPOSITE REMAINING LIFE AND ANNUAL ACCRUAL RATE, PERCENT .. 18.8 2.46
VII-15

Gaz Métro 2014 Depreciation Study
GAZ MÉTRO
ACCOUNT Z13.00 - DISTRIBUTION RELEASE STATION - EQUIPMENT
CALCULATED REMAINING LIFE DEPRECIATION ACCRUAL SURVIVING ORIGINAL COST AS OF SEPTEMBER 31, 2014
ORIGINAL CALCULATED ALLOC. BOOK FUTURE BOOK REM. ANNUAL
YEAR COST ACCRUED RESERVE ACCRUALS LIFE ACCRUAL (1) (2) (3) (4) (5) (6) (7)
SURVIVOR CURVE.. IOWA 34-R1.5 NET SALVAGE PERCENT.. -30 1966 24,277.38 28,471 29,456 2,105 5.26 400 1975 1,198,881.32 1,298,892 1,343,834 214,712 7.90 27,179 1976 19,827.17 21,236 21,971 3,804 8.23 462 1977 109,572.54 115,921 119,932 22,512 8.58 2,624 1978 139,863.34 146,003 151,055 30,767 8.95 3,438 1979 222,001.71 228,458 236,363 52,239 9.35 5,587 1980 208,623.17 212,412 219,761 51,449 9.55 5,387 1981 318,966.46 319,493 330,547 84,109 9.98 8,428 1982 1,337,932.71 1,317,007 1,362,576 376,737 10.42 36,155 1983 3,339,002.40 3,226,879 3,338,529 1,002,174 10.87 92,196 1984 3,786,987.48 3,603,697 3,728,385 1,194,699 11.17 106,956 1985 974,454.72 908,036 939,454 327,337 11.65 28,098 1986 479,980.37 437,469 452,606 171,368 12.15 14,104 1987 263,409.77 235,422 243,568 98,865 12.50 7,909 1988 866,065.03 754,793 780,909 344,976 13.03 26,476 1989 427,297.17 364,066 376,663 178,823 13.41 13,335 1990 877,792.19 726,900 752,051 389,079 13.96 27,871 1991 962,496.24 776,272 803,131 448,114 14.38 31,162 1992 789,542.27 618,922 640,337 386,068 14.81 26,068 1993 927,042.46 702,123 726,416 478,739 15.40 31,087 1994 282,786.09 207,265 214,436 153,186 15.86 9,659 1995 1,065,501.91 753,523 779,595 605,557 16.34 37,060 1996 960,622.92 653,877 676,501 572,309 16.83 34,005 1997 312,994.64 204,342 211,412 195,481 17.34 11,273 1998 623,714.00 390,657 404,174 406,654 17.75 22,910 1999 852,173.22 508,270 525,856 581,969 18.28 31,836 2000 645,879.47 366,420 379,098 460,545 18.72 24,602 2001 326,309.09 175,238 181,301 242,901 19.18 12,664 2002 2,082,470.21 1,052,564 1,088,983 1,618,228 19.65 82,353 2003 1,654,109.71 781,435 808,473 1,341,870 20.15 66,594 2004 878,516.43 386,134 399,494 742,577 20.56 36,118 2005 991,072.83 402,752 416,687 871,708 20.89 41,728 2006 819,757.94 303,507 314,009 751,676 21.35 35,207 2007 687,469.75 229,862 237,815 655,896 21.66 30,281 2008 559,318.02 166,364 172,120 554,993 21.91 25,331 2009 432,657.85 111,704 115,569 446,886 22.20 20,130 2010 578,784.94 126,256 130,625 621,795 22.31 27,871 2011 2,717,093.46 478,263 494,811 3,037,410 22.34 135,963
VII-16

Gaz Métro 2014 Depreciation Study
GAZ MÉTRO
ACCOUNT Z13.00 - DISTRIBUTION RELEASE STATION - EQUIPMENT
CALCULATED REMAINING LIFE DEPRECIATION ACCRUAL SURVIVING ORIGINAL COST AS OF SEPTEMBER 31, 2014
ORIGINAL CALCULATED ALLOC. BOOK FUTURE BOOK REM. ANNUAL
YEAR COST ACCRUED RESERVE ACCRUALS LIFE ACCRUAL (1) (2) (3) (4) (5) (6) (7)
SURVIVOR CURVE.. IOWA 34-R1.5 NET SALVAGE PERCENT.. -30 2012 1,775,713.44 234,305 242,412 2,066,015 22.13 93,358 2013 2,149,622.06 181,923 188,218 2,606,291 21.54 120,998 2014 852,666.37 27,933 28,899 1,079,567 19.38 55,705 38,523,250.25 23,785,066 24,608,032 25,472,193 1,450,568
COMPOSITE REMAINING LIFE AND ANNUAL ACCRUAL RATE, PERCENT .. 17.6 3.77
VII-17

Gaz Métro 2014 Depreciation Study
GAZ MÉTRO
ACCOUNT Z13.01 - DISTRIBUTION RELEASE STATION - CIVIL BUILDING
CALCULATED REMAINING LIFE DEPRECIATION ACCRUAL SURVIVING ORIGINAL COST AS OF SEPTEMBER 31, 2014
ORIGINAL CALCULATED ALLOC. BOOK FUTURE BOOK REM. ANNUAL
YEAR COST ACCRUED RESERVE ACCRUALS LIFE ACCRUAL (1) (2) (3) (4) (5) (6) (7)
SURVIVOR CURVE.. IOWA 35-R3 NET SALVAGE PERCENT.. -10 1966 70,969.78 74,210 75,948 2,119 2.52 841 1975 221,160.65 216,224 221,289 21,988 4.94 4,451 1976 6,412.29 6,218 6,364 690 5.17 133 1977 24,550.18 23,495 24,045 2,960 5.60 529 1978 29,057.06 27,533 28,178 3,785 5.87 645 1979 64,361.24 60,064 61,471 9,326 6.34 1,471 1980 44,396.87 40,774 41,729 7,108 6.82 1,042 1981 20,118.98 18,238 18,665 3,466 7.15 485 1982 112,987.57 100,572 102,928 21,358 7.66 2,788 1983 953,763.82 832,807 852,317 196,823 8.18 24,061 1984 889,049.47 760,653 778,472 199,482 8.71 22,903 1985 292,188.65 245,555 251,308 70,100 9.11 7,695 1986 94,648.47 77,741 79,562 24,551 9.67 2,539 1987 20,785.29 16,663 17,053 5,811 10.23 568 1988 21,630.98 16,899 17,295 6,499 10.81 601 1989 10,040.57 7,604 7,782 3,263 11.54 283 1990 131,835.34 96,989 99,261 45,758 12.13 3,772 1991 191,195.84 136,411 139,607 70,708 12.73 5,554 1992 125,450.65 86,634 88,664 49,332 13.34 3,698 1993 84,774.81 56,539 57,863 35,389 13.96 2,535 1994 9,398.89 6,019 6,160 4,179 14.71 284 1995 188,346.15 115,938 118,654 88,527 15.34 5,771 1996 113,730.44 67,118 68,690 56,413 15.98 3,530 1997 23,663.99 13,302 13,614 12,416 16.75 741 1999 1,554.88 787 805 905 18.17 50 2000 8,697.66 4,148 4,245 5,322 18.94 281 2001 29,689.05 13,315 13,627 19,031 19.61 970 2002 159,886.15 66,832 68,398 107,477 20.39 5,271 2003 337,346.94 130,584 133,643 237,439 21.18 11,211 2004 48,712.02 17,382 17,789 35,794 21.86 1,637 2005 444,190.48 144,335 147,716 340,894 22.66 15,044 2006 493,924.21 144,522 147,908 395,409 23.45 16,862 2007 316,556.59 82,248 84,175 264,037 24.25 10,888 2008 378,725.62 85,819 87,830 328,768 25.05 13,124 2009 67,951.55 13,111 13,418 61,329 25.85 2,372 2010 302,430.68 48,038 49,163 283,511 26.65 10,638 2011 132,276.34 16,442 16,827 128,677 27.46 4,686
VII-18

Gaz Métro 2014 Depreciation Study
GAZ MÉTRO
ACCOUNT Z13.01 - DISTRIBUTION RELEASE STATION - CIVIL BUILDING
CALCULATED REMAINING LIFE DEPRECIATION ACCRUAL SURVIVING ORIGINAL COST AS OF SEPTEMBER 31, 2014
ORIGINAL CALCULATED ALLOC. BOOK FUTURE BOOK REM. ANNUAL
YEAR COST ACCRUED RESERVE ACCRUALS LIFE ACCRUAL (1) (2) (3) (4) (5) (6) (7)
SURVIVOR CURVE.. IOWA 35-R3 NET SALVAGE PERCENT.. -10 2012 224,897.77 20,162 20,634 226,754 28.17 8,049 2013 825,455.55 44,855 45,907 862,094 28.89 29,841 2014 222,931.31 4,120 4,216 241,008 29.26 8,237 7,739,744.78 3,940,900 4,033,220 4,480,499 236,081
COMPOSITE REMAINING LIFE AND ANNUAL ACCRUAL RATE, PERCENT .. 19.0 3.05
VII-19

Gaz Métro 2014 Depreciation Study
GAZ MÉTRO
ACCOUNT Z15.01 - DISTRIBUTION BIOGAZ - SERVITUDE
CALCULATED REMAINING LIFE DEPRECIATION ACCRUAL SURVIVING ORIGINAL COST AS OF SEPTEMBER 31, 2014
ORIGINAL CALCULATED ALLOC. BOOK FUTURE BOOK REM. ANNUAL
YEAR COST ACCRUED RESERVE ACCRUALS LIFE ACCRUAL (1) (2) (3) (4) (5) (6) (7)
INTERIM SURVIVOR CURVE.. SQUARE PROBABLE RETIREMENT YEAR.. 9-2031 NET SALVAGE PERCENT.. 0 2005 3,415.22 1,236 1,136 2,279 16.75 136 3,415.22 1,236 1,136 2,279 136
COMPOSITE REMAINING LIFE AND ANNUAL ACCRUAL RATE, PERCENT .. 16.8 3.98
VII-20

Gaz Métro 2014 Depreciation Study
GAZ MÉTRO
ACCOUNT Z15.50 - DISTRIBUTION BIOGAZ - MAIN PIPE - STEEL
CALCULATED REMAINING LIFE DEPRECIATION ACCRUAL SURVIVING ORIGINAL COST AS OF SEPTEMBER 31, 2014
ORIGINAL CALCULATED ALLOC. BOOK FUTURE BOOK REM. ANNUAL
YEAR COST ACCRUED RESERVE ACCRUALS LIFE ACCRUAL (1) (2) (3) (4) (5) (6) (7)
INTERIM SURVIVOR CURVE.. IOWA 65-R3 PROBABLE RETIREMENT YEAR.. 9-2031 NET SALVAGE PERCENT.. -25 2002 46,541.92 25,162 20,384 37,793 16.40 2,304 2003 2,000.00 1,029 834 1,666 16.43 101 2005 1,895,519.45 866,726 702,128 1,667,271 16.47 101,231 2006 14,847.51 6,325 5,124 13,435 16.44 817 2007 13,566.40 5,304 4,296 12,662 16.48 768 1,972,475.28 904,546 732,766 1,732,828 105,221
COMPOSITE REMAINING LIFE AND ANNUAL ACCRUAL RATE, PERCENT .. 16.5 5.33
VII-21

Gaz Métro 2014 Depreciation Study
GAZ MÉTRO
ACCOUNT Z15.60 - DISTRIBUTION BIOGAZ- COMPRESSION STATION - EQUIPMENT
CALCULATED REMAINING LIFE DEPRECIATION ACCRUAL SURVIVING ORIGINAL COST AS OF SEPTEMBER 31, 2014
ORIGINAL CALCULATED ALLOC. BOOK FUTURE BOOK REM. ANNUAL
YEAR COST ACCRUED RESERVE ACCRUALS LIFE ACCRUAL (1) (2) (3) (4) (5) (6) (7)
INTERIM SURVIVOR CURVE.. IOWA 25-R2.5 PROBABLE RETIREMENT YEAR.. 9-2031 NET SALVAGE PERCENT.. -10 2005 2,488,728.85 1,180,728 974,528 1,763,074 12.53 140,708 2006 456,098.85 199,580 164,726 336,983 12.87 26,184 2007 373,464.15 148,796 122,810 288,001 13.20 21,818 2008 635,502.91 227,192 187,515 511,538 13.50 37,892 2010 34,526.59 9,263 7,646 30,333 13.95 2,174 2013 23,304.48 2,435 2,010 23,625 14.30 1,652 2014 35,000.00 1,328 1,096 37,404 13.99 2,674 4,046,625.83 1,769,322 1,460,331 2,990,958 233,102
COMPOSITE REMAINING LIFE AND ANNUAL ACCRUAL RATE, PERCENT .. 12.8 5.76
VII-22

Gaz Métro 2014 Depreciation Study
GAZ MÉTRO
ACCOUNT Z15.61 - DISTRIBUTION BIOGAZ - COMPRESSION STATION - BUILDING
CALCULATED REMAINING LIFE DEPRECIATION ACCRUAL SURVIVING ORIGINAL COST AS OF SEPTEMBER 31, 2014
ORIGINAL CALCULATED ALLOC. BOOK FUTURE BOOK REM. ANNUAL
YEAR COST ACCRUED RESERVE ACCRUALS LIFE ACCRUAL (1) (2) (3) (4) (5) (6) (7)
INTERIM SURVIVOR CURVE.. IOWA 40-R2 PROBABLE RETIREMENT YEAR.. 9-2031 NET SALVAGE PERCENT.. -10 2005 1,630,813.47 695,314 598,904 1,194,991 15.01 79,613 2006 18,926.46 7,503 6,463 14,356 15.08 952 2007 33,603.07 12,253 10,554 26,409 15.12 1,747 2008 63,484.97 20,971 18,063 51,770 15.15 3,417 2010 13,649.72 3,426 2,951 12,064 15.22 793 1,760,477.69 739,467 636,935 1,299,591 86,522
COMPOSITE REMAINING LIFE AND ANNUAL ACCRUAL RATE, PERCENT .. 15.0 4.91
VII-23

Gaz Métro 2014 Depreciation Study
GAZ MÉTRO
ACCOUNT Z15.70 - DISTRIBUTION BIOGAZ - METER STATION - EQUIPMENT
CALCULATED REMAINING LIFE DEPRECIATION ACCRUAL SURVIVING ORIGINAL COST AS OF SEPTEMBER 31, 2014
ORIGINAL CALCULATED ALLOC. BOOK FUTURE BOOK REM. ANNUAL
YEAR COST ACCRUED RESERVE ACCRUALS LIFE ACCRUAL (1) (2) (3) (4) (5) (6) (7)
INTERIM SURVIVOR CURVE.. IOWA 25-R2.5 PROBABLE RETIREMENT YEAR.. 9-2031 NET SALVAGE PERCENT.. -25 2004 6,726.34 3,893 2,991 5,417 12.18 445 2005 272,681.54 147,009 112,951 227,901 12.53 18,188 2006 15,493.96 7,704 5,919 13,448 12.87 1,045 294,901.84 158,606 121,861 246,766 19,678
COMPOSITE REMAINING LIFE AND ANNUAL ACCRUAL RATE, PERCENT .. 12.5 6.67
VII-24

Gaz Métro 2014 Depreciation Study
GAZ MÉTRO
ACCOUNT Z15.71 - DISTRIBUTION BIOGAZ - METER STATION - BUILDING
CALCULATED REMAINING LIFE DEPRECIATION ACCRUAL SURVIVING ORIGINAL COST AS OF SEPTEMBER 31, 2014
ORIGINAL CALCULATED ALLOC. BOOK FUTURE BOOK REM. ANNUAL
YEAR COST ACCRUED RESERVE ACCRUALS LIFE ACCRUAL (1) (2) (3) (4) (5) (6) (7)
INTERIM SURVIVOR CURVE.. IOWA 40-R2 PROBABLE RETIREMENT YEAR.. 9-2031 NET SALVAGE PERCENT.. -10 2004 2,242.24 1,018 877 1,589 14.95 106 2005 162,717.74 69,376 59,772 119,218 15.01 7,943 2006 5,164.63 2,047 1,764 3,917 15.08 260 170,124.61 72,441 62,413 124,724 8,309
COMPOSITE REMAINING LIFE AND ANNUAL ACCRUAL RATE, PERCENT .. 15.0 4.88
VII-25

Gaz Métro 2014 Depreciation Study
GAZ MÉTRO
ACCOUNT Z30.50 - TRANSMISSION - SERVITUDES
CALCULATED REMAINING LIFE DEPRECIATION ACCRUAL SURVIVING ORIGINAL COST AS OF SEPTEMBER 31, 2014
ORIGINAL CALCULATED ALLOC. BOOK FUTURE BOOK REM. ANNUAL
YEAR COST ACCRUED RESERVE ACCRUALS LIFE ACCRUAL (1) (2) (3) (4) (5) (6) (7)
SURVIVOR CURVE.. 70-SQUARE NET SALVAGE PERCENT.. 0 1983 4,718,624.91 2,123,381 4,718,625 1984 4,111,057.62 1,791,229 4,111,058 1985 89,183.52 37,585 89,184 1986 296,473.96 120,706 291,318 5,156 41.50 124 1987 3,106,086.89 1,220,257 2,945,027 161,060 42.50 3,790 1989 149,026.33 54,289 131,024 18,002 44.50 405 1990 30,256.63 10,590 25,558 4,699 45.50 103 1991 49,679.00 16,678 40,252 9,427 46.50 203 2007 166,176.67 17,804 42,969 123,208 62.50 1,971 2008 23,065.00 2,142 5,169 17,896 63.50 282 2013 2,170.00 47 114 2,056 68.50 30 2014 2,027.31 14 33 1,994 69.50 29 12,743,827.84 5,394,722 12,400,331 343,496 6,937
COMPOSITE REMAINING LIFE AND ANNUAL ACCRUAL RATE, PERCENT .. 49.5 0.05
VII-26

Gaz Métro 2014 Depreciation Study
GAZ MÉTRO
ACCOUNT Z31.00 - TRANSMISSION - MAIN PIPE
CALCULATED REMAINING LIFE DEPRECIATION ACCRUAL SURVIVING ORIGINAL COST AS OF SEPTEMBER 31, 2014
ORIGINAL CALCULATED ALLOC. BOOK FUTURE BOOK REM. ANNUAL
YEAR COST ACCRUED RESERVE ACCRUALS LIFE ACCRUAL (1) (2) (3) (4) (5) (6) (7)
SURVIVOR CURVE.. IOWA 65-R3 NET SALVAGE PERCENT.. -10 1983 82,955,904.70 45,415,869 85,911,770 5,339,725 31.79 167,969 1984 157,403,508.96 83,974,772 158,852,432 14,291,428 32.39 441,230 1985 10,611.62 5,475 10,357 1,316 33.40 39 1986 225,795.02 113,259 214,248 34,127 34.00 1,004 1987 31,934,681.90 15,554,745 29,424,422 5,703,728 34.61 164,800 1988 878,186.50 414,706 784,486 181,519 35.23 5,152 1989 283,614.19 128,877 243,793 68,183 36.23 1,882 1991 1,372.20 582 1,101 408 37.48 11 1993 100,118.33 39,074 73,915 36,215 39.10 926 1994 482,078.62 179,343 339,258 191,028 40.11 4,763 1997 54,076.03 17,381 32,879 26,605 42.38 628 1999 67,119.62 19,344 36,592 37,240 43.67 853 2000 23,464.52 6,324 11,963 13,848 44.67 310 2001 498,814.82 125,926 238,210 310,486 45.32 6,851 2002 940,338.85 219,804 415,796 618,577 46.32 13,354 2003 79,114.83 17,109 32,365 54,661 46.98 1,163 2005 53,060.00 9,537 18,041 40,325 48.64 829 2006 88,806.22 14,360 27,164 70,523 49.31 1,430 2007 5,325,698.86 760,403 1,438,431 4,419,838 50.30 87,870 2008 106,019.63 13,190 24,951 91,671 50.97 1,799 2009 658,047.07 69,635 131,726 592,126 51.65 11,464 2010 39,000.43 3,398 6,428 36,472 52.32 697 2013 2,095,948.94 61,789 116,884 2,188,660 54.37 40,255 2014 3,815,841.84 38,197 72,256 4,125,170 54.45 75,761 288,121,223.70 147,203,099 278,459,468 38,473,878 1,031,040
COMPOSITE REMAINING LIFE AND ANNUAL ACCRUAL RATE, PERCENT .. 37.3 0.36
VII-27

Gaz Métro 2014 Depreciation Study
GAZ MÉTRO
ACCOUNT Z40.51 - STOCKING - ADMINISTRATIVE BUILDING
CALCULATED REMAINING LIFE DEPRECIATION ACCRUAL SURVIVING ORIGINAL COST AS OF SEPTEMBER 31, 2014
ORIGINAL CALCULATED ALLOC. BOOK FUTURE BOOK REM. ANNUAL
YEAR COST ACCRUED RESERVE ACCRUALS LIFE ACCRUAL (1) (2) (3) (4) (5) (6) (7)
SURVIVOR CURVE.. IOWA 35-R3 NET SALVAGE PERCENT.. 0 1979 286,046.15 242,682 256,312 29,734 6.34 4,690 1984 87,389.77 67,972 71,790 15,600 8.71 1,791 1985 16,538.38 12,635 13,345 3,193 9.11 350 1990 6,496.00 4,345 4,589 1,907 12.13 157 1991 6,215.40 4,031 4,257 1,958 12.73 154 1992 58,058.30 36,449 38,496 19,562 13.34 1,466 1993 838.75 509 538 301 13.96 22 1994 298,585.46 173,836 183,600 114,985 14.71 7,817 1995 22,524.89 12,605 13,313 9,212 15.34 601 2001 3,492.30 1,424 1,504 1,988 19.61 101 2002 16,840.00 6,399 6,758 10,082 20.39 494 2003 669,373.63 235,553 248,783 420,591 21.18 19,858 2004 330,308.17 107,152 113,170 217,138 21.86 9,933 2005 570,904.95 168,645 178,117 392,788 22.66 17,334 2006 108,488.43 28,858 30,479 78,009 23.45 3,327 2009 1,145,445.12 200,911 212,195 933,250 25.85 36,103 3,627,545.70 1,304,006 1,377,246 2,250,300 104,198
COMPOSITE REMAINING LIFE AND ANNUAL ACCRUAL RATE, PERCENT .. 21.6 2.87
VII-28

Gaz Métro 2014 Depreciation Study
GAZ MÉTRO
ACCOUNT Z40.52 - STOCKING - BUILDING INFRASTRUCTURE
CALCULATED REMAINING LIFE DEPRECIATION ACCRUAL SURVIVING ORIGINAL COST AS OF SEPTEMBER 31, 2014
ORIGINAL CALCULATED ALLOC. BOOK FUTURE BOOK REM. ANNUAL
YEAR COST ACCRUED RESERVE ACCRUALS LIFE ACCRUAL (1) (2) (3) (4) (5) (6) (7)
SURVIVOR CURVE.. IOWA 44-R3 NET SALVAGE PERCENT.. -35 1975 287,252.79 307,906 326,279 61,512 10.25 6,001 1979 7,566,123.84 7,578,986 8,031,220 2,183,047 12.34 176,908 1981 26,205.99 25,126 26,625 8,753 13.67 640 1983 31,578.51 29,006 30,737 11,894 14.80 804 1985 18,319.84 16,051 17,009 7,723 15.95 484 1987 93,004.63 76,991 81,585 43,971 17.35 2,534 1988 100,699.83 81,050 85,886 50,059 17.95 2,789 1990 201,988.10 152,321 161,410 111,274 19.36 5,748 1991 2,593,948.38 1,892,739 2,005,678 1,496,152 19.98 74,882 1992 5,510.00 3,883 4,115 3,324 20.60 161 1993 101.84 69 73 64 21.42 3 1996 390,635.48 232,196 246,051 281,307 23.52 11,960 1997 1,609,169.90 908,489 962,698 1,209,681 24.34 49,699 1999 22,800.00 11,546 12,235 18,545 25.82 718 2001 5,154.08 2,302 2,439 4,519 27.31 165 2002 74,006.89 30,722 32,555 67,354 28.15 2,393 2003 2,440,006.08 939,451 995,508 2,298,500 28.82 79,754 2004 45,021.35 15,888 16,836 43,943 29.66 1,482 2005 361,808.80 116,005 122,927 365,515 30.50 11,984 2006 761,920.79 220,325 233,472 795,121 31.18 25,501 2007 581,961.88 149,116 158,014 627,635 32.02 19,601 2008 63,211.69 14,089 14,930 70,406 32.87 2,142 2009 126,239.06 23,996 25,428 144,995 33.56 4,320 2010 24,530.00 3,828 4,056 29,060 34.41 845 2011 2,488,259.54 304,339 322,498 3,036,652 35.11 86,490 2012 195,438.72 17,203 18,229 245,613 35.82 6,857 2013 3,436,720.49 182,799 193,707 4,445,866 36.52 121,738 2014 200,425.26 3,626 3,842 266,732 36.81 7,246 23,752,043.76 13,340,048 14,136,042 17,929,217 703,849
COMPOSITE REMAINING LIFE AND ANNUAL ACCRUAL RATE, PERCENT .. 25.5 2.96
VII-29

Gaz Métro 2014 Depreciation Study
GAZ MÉTRO
ACCOUNT Z41.01 - STOCKING - MECHANICAL EQUIPMENT
CALCULATED REMAINING LIFE DEPRECIATION ACCRUAL SURVIVING ORIGINAL COST AS OF SEPTEMBER 31, 2014
ORIGINAL CALCULATED ALLOC. BOOK FUTURE BOOK REM. ANNUAL
YEAR COST ACCRUED RESERVE ACCRUALS LIFE ACCRUAL (1) (2) (3) (4) (5) (6) (7)
SURVIVOR CURVE.. IOWA 35-R3 NET SALVAGE PERCENT.. 0 1979 4,026,355.22 3,415,960 4,026,355 1981 1,622.83 1,337 1,623 1983 84,741.92 67,268 84,742 1984 10,342.51 8,044 10,164 179 8.71 21 1985 801,775.92 612,557 773,986 27,790 9.11 3,050 1986 150,403.94 112,307 141,904 8,500 9.67 879 1987 13,561.14 9,883 12,487 1,074 10.23 105 1988 110,454.10 78,445 99,118 11,336 10.81 1,049 1992 124,175.82 77,958 98,503 25,673 13.34 1,925 1993 88,644.52 53,745 67,909 20,736 13.96 1,485 1994 9,059.00 5,274 6,664 2,395 14.71 163 1997 206,693.72 105,620 133,454 73,240 16.75 4,373 1998 154,500.21 75,211 95,032 59,468 17.40 3,418 1999 19,397.38 8,931 11,285 8,112 18.17 446 2000 59,614.73 25,849 32,661 26,954 18.94 1,423 2001 331,386.15 135,106 170,711 160,675 19.61 8,194 2002 15,961.20 6,065 7,663 8,298 20.39 407 2003 741,353.86 260,882 329,632 411,722 21.18 19,439 2004 173,643.35 56,330 71,175 102,468 21.86 4,687 2005 182,043.57 53,776 67,948 114,096 22.66 5,035 2006 367,710.22 97,811 123,587 244,123 23.45 10,410 2007 140,246.60 33,126 41,856 98,391 24.25 4,057 2008 39,110.00 8,057 10,180 28,930 25.05 1,155 2009 374,784.64 65,737 83,061 291,724 25.85 11,285 2010 126,068.97 18,204 23,001 103,068 26.65 3,867 2013 403,198.26 19,918 25,167 378,031 28.89 13,085 2014 79,711.00 1,339 1,692 78,019 29.26 2,666 8,836,560.78 5,414,740 6,551,560 2,285,001 102,624
COMPOSITE REMAINING LIFE AND ANNUAL ACCRUAL RATE, PERCENT .. 22.3 1.16
VII-30

Gaz Métro 2014 Depreciation Study
GAZ MÉTRO
ACCOUNT Z41.02 - STOCKING - ELECTRONIC EQUIPMENT
CALCULATED REMAINING LIFE DEPRECIATION ACCRUAL SURVIVING ORIGINAL COST AS OF SEPTEMBER 31, 2014
ORIGINAL CALCULATED ALLOC. BOOK FUTURE BOOK REM. ANNUAL
YEAR COST ACCRUED RESERVE ACCRUALS LIFE ACCRUAL (1) (2) (3) (4) (5) (6) (7)
SURVIVOR CURVE.. IOWA 15-R3 NET SALVAGE PERCENT.. 0 1979 550,244.94 550,245 550,245 1983 863.28 863 863 1987 5,452.56 5,453 5,453 1990 18,254.69 18,247 18,255 1995 300,010.32 280,810 300,010 1996 92,221.14 84,788 92,221 1997 7,340.79 6,629 7,341 2001 6,200.00 4,930 6,200 2002 176,420.92 133,639 176,421 2003 105,555.91 75,504 105,556 2005 58,739.00 36,442 58,739 2006 268,018.49 152,181 268,018 2007 236,359.49 120,898 236,359 2012 298,344.20 55,432 229,668 68,676 10.96 6,266 2013 32,265.93 3,653 15,135 17,131 11.75 1,458 2,156,291.66 1,529,714 2,070,484 85,808 7,724
COMPOSITE REMAINING LIFE AND ANNUAL ACCRUAL RATE, PERCENT .. 11.1 0.36
VII-31

Gaz Métro 2014 Depreciation Study
GAZ MÉTRO
ACCOUNT Z41.03 - STOCKING - SPECIALIZED EQUIPMENT
CALCULATED REMAINING LIFE DEPRECIATION ACCRUAL SURVIVING ORIGINAL COST AS OF SEPTEMBER 31, 2014
ORIGINAL CALCULATED ALLOC. BOOK FUTURE BOOK REM. ANNUAL
YEAR COST ACCRUED RESERVE ACCRUALS LIFE ACCRUAL (1) (2) (3) (4) (5) (6) (7)
SURVIVOR CURVE.. IOWA 25-R4 NET SALVAGE PERCENT.. 0 1983 22,225.16 21,283 18,718 3,507 1.39 2,523 1985 3,170.48 2,974 2,616 554 1.95 284 1988 290,000.00 262,044 230,463 59,537 2.83 21,038 1990 5,863.75 5,100 4,485 1,379 3.67 376 1992 3,996.99 3,310 2,911 1,086 4.67 233 1993 558,741.65 448,111 394,106 164,636 5.31 31,005 1994 1,139,478.13 885,375 778,672 360,806 5.88 61,362 1995 164,699.57 123,327 108,464 56,236 6.54 8,599 2003 61,919.26 29,480 25,927 35,992 12.65 2,845 2011 94,145.48 13,971 12,287 81,858 20.08 4,077 2014 8,273.87 176 155 8,119 22.97 353 2,352,514.34 1,795,151 1,578,804 773,711 132,695
COMPOSITE REMAINING LIFE AND ANNUAL ACCRUAL RATE, PERCENT .. 5.8 5.64
VII-32

Gaz Métro 2014 Depreciation Study
APPENDIX A ESTIMATION OF SURIVOR CURVES
A-1

Gaz Métro 2014 Depreciation Study
ESTIMATION OF SURVIVOR CURVES Average Service Life The use of an average service life for a property group implies that the various
units in the group have different lives. Thus, the average life may be obtained by
determining the separate lives of each of the units, or by constructing a survivor curve
by plotting the number of units which survive at successive ages. A discussion of the
general concept of survivor curves is presented. Also, the Iowa type survivor curves are
reviewed.
SURVIVOR CURVES The survivor curve graphically depicts the amount of property existing at each
age throughout the life of an original group. From the survivor curve, the average life of
the group, the remaining life expectancy, the probable life, and the frequency curve can
be calculated. In Figure 1, a typical smooth survivor curve and the derived curves are
illustrated. The average life is obtained by calculating the area under the survivor curve,
from age zero to the maximum age, and dividing this area by the ordinate at age zero.
The remaining life expectancy at any age can be calculated by obtaining the area under
the curve, from the observation age to the maximum age, and dividing this area by the
percent surviving at the observation age. For example, in Figure 1, the remaining life at
age 30 is equal to the crosshatched area under the survivor curve divided by 29.5
percent surviving at age 30. The probable life at any age is developed by adding the
age and remaining life. If the probable life of the property is calculated for each year of
age, the probable life curve shown in the chart can be developed. The frequency curve
presents the number of units retired in each age interval. It is derived by obtaining the
differences between the amount of property surviving at the beginning and at the end of
each interval.
Iowa Type Curves The range of survivor characteristics usually experienced by utility and industrial
properties is encompassed by a system of generalized survivor curves known as the
A-2

Gaz Métro 2014 Depreciation Study
A-3

Gaz Métro 2014 Depreciation Study
Iowa type curves. There are four families in the Iowa system, labeled in accordance
with the location of the modes of the retirements in relationship to the average life and
the relative height of the modes. The left moded curves, presented in Figure 2, are
those in which the greatest frequency of retirement occurs to the left of, or prior to,
average service life. The symmetrical moded curves, presented in Figure 3, are those
in which the greatest frequency of retirement occurs at average service life. The right
moded curves, presented in Figure 4, are those in which the greatest frequency occurs
to the right of, or after, average service life. The origin moded curves, presented in
Figure 5, are those in which the greatest frequency of retirement occurs at the origin, or
immediately after age zero. The letter designation of each family of curves (L, S, R or
O) represents the location of the mode of the associated frequency curve with respect
to the average service life. The numbers represent the relative heights of the modes of
the frequency curves within each family.
The Iowa curves were developed at the Iowa State College Engineering
Experiment Station through an extensive process of observation and classification of
the ages at which industrial property had been retired. A report of the study which
resulted in the classification of property survivor characteristics into 18 type curves,
which constitute three of the four families, was published in 1935 in the form of the
Experiment Station’s Bulletin 125.1 These curve types have also been presented in
subsequent Experiment Station bulletins and in the text, "Engineering Valuation and
Depreciation."2 In 1957, Frank V. B. Couch, Jr., an Iowa State College graduate
student, submitted a thesis3 presenting his development of the fourth family consisting
of the four O type survivor curves.
1 Winfrey, Robley. Statistical Analyses of Industrial Property Retirements. Iowa State College, Engineering Experiment Station, Bulletin 125. 1935.
2Marston, Anson, Robley Winfrey and Jean C. Hempstead. Engineering Valuation and Depreciation, 2nd Edition. New York, McGraw-Hill Book Company. 1953.
3Couch, Frank V. B., Jr. "Classification of Type O Retirement Characteristics of Industrial Property." Unpublished M.S. thesis (Engineering Valuation). Library, Iowa State College, Ames, Iowa. 1957.
A-4

Gaz Métro 2014 Depreciation Study
A-5

Gaz Métro 2014 Depreciation Study
A-6

Gaz Métro 2014 Depreciation Study
A-7

Gaz Métro 2014 Depreciation Study
A-8

Gaz Métro 2014 Depreciation Study
Retirement Rate Method of Analysis The retirement rate method is an actuarial method of deriving survivor curves
using the average rates at which property of each age group is retired. The method
relates to property groups for which aged accounting experience is available and is the
method used to develop the original stub survivor curves in this study. The method
(also known as the annual rate method) is illustrated through the use of an example in
the following text, and is also explained in several publications, including "Statistical
Analyses of Industrial Property Retirements,"4 "Engineering Valuation and
Depreciation,"5 and "Depreciation Systems."6 The average rate of retirement used in the calculation of the percent surviving for
the survivor curve (life table) requires two sets of data: first, the property retired during
a period of observation, identified by the property's age at retirement; and second, the
property exposed to retirement at the beginning of the age intervals during the same
period. The period of observation is referred to as the experience band, and the band
of years which represent the installation dates of the property exposed to retirement
during the experience band is referred to as the placement band. An example of the
calculations used in the development of a life table follows. The example includes
schedules of annual aged property transactions, a schedule of plant exposed to
retirement, a life table and illustrations of smoothing the stub survivor curve.
Schedules of Annual Transactions in Plant Records The property group used to illustrate the retirement rate method is observed for
the experience band 2005-2014 during which there were placements during the years
2000-2014. In order to illustrate the summation of the aged data by age interval, the
data were compiled in the manner presented in Schedules 1 and 2 on the following
pages. In Schedule 1, the year of installation (year placed) and the year of retirement
are shown. The age interval during which a retirement occurred is determined from this
information. In the example which follows, $10,000 of the dollars invested in 2000 were
4Winfrey, Robley, Supra Note 1. 5Marston, Anson, Robley Winfrey, and Jean C. Hempstead, Supra Note 2.
6Wolf, Frank K. and W. Chester Fitch. Depreciation Systems. Iowa State University Press. 1994.
A-9

Gaz Métro 2014 Depreciation Study
Year
Tota
l Dur
ing
Age
Pla
ced
Age
Inte
rval
In
terv
al
2005
2006
2007
2008
2009
2010
2011
2012
2013
2014
(1)
(2)
(3)
(4)
(5)
(6)
(7)
(8)
(9)
(10)
(11)
(12)
(13)
1999
1011
1213
1416
2324
2526
2613
½-1
4½
2000
1112
1315
1618
2021
2219
4412
½-1
3½
2001
1112
1314
1617
1921
2218
6411
½-1
2½
2002
89
1011
1113
1415
1617
8310
½-1
1½
2003
910
1112
1314
1617
1920
939½
-10½
20
044
910
1112
1314
1516
2010
58½
-9½
20
055
1112
1314
1516
1820
113
7½-8
½
2006
612
1315
1617
1919
124
6½-7
½
2007
613
1516
1719
1913
15½
-6½
20
087
1416
1719
2014
34½
-5½
20
09
818
2022
2314
63½
-4½
20
109
2022
2515
02½
-3½
20
1111
2325
151
1½-2
½
2012
1124
153
½-1
½
2013
13
800-
½
Tota
l53
6886
106
128
157
196
231
273
308
1,60
6
Ret
irem
ents
, Tho
usan
ds o
f Dol
lars
D
urin
g Ye
ar
SC
HE
DU
LE 1
. R
ETI
RE
ME
NTS
FO
R E
AC
H Y
EA
R 2
005-
2014
SU
MM
AR
IZE
D B
Y A
GE
INTE
RV
AL
E
xper
ienc
e B
and
2005
-201
4P
lace
men
t Ban
d 20
00-2
014
A-10

Gaz Métro 2014 Depreciation Study
Exp
erie
nce
Ban
d 20
05-2
014
Pla
cem
ent B
and
2000
-201
4
Year
Tota
l Dur
ing
Age
Pla
ced
2005
2006
2007
2008
2009
2010
2011
2012
2013
2014
Age
Inte
rval
Inte
rval
(1
)(2
)(3
)(4
)(5
)(6
)(7
)(8
)(9
)(1
0)(1
1)(1
2)(1
3)
1999
--
--
--
60a
--
--
13½
-14½
2000
--
--
--
--
--
-12
½-1
3½20
01-
--
--
--
--
--
11½
-12½
2002
--
--
--
-(5
)b-
-60
10½
-11½
2003
--
--
--
-6a
--
- 9
½-1
0½20
04-
--
--
--
--
-(5
) 8
½-9
½20
05-
--
--
--
--
-7½
-8½
2006
--
--
--
--
- 6
½-7
½20
07-
--
-(1
2)b
--
- 5
½-6
½20
08-
--
-22
a-
- 4
½-5
½20
09-
-(1
9)b
--
10 3
½-4
½20
10-
--
--
2½
-3½
2011
--
(102
)c(1
21)
1½
-2½
2012
--
- ½
-1½
2013
0-½
Tota
l-
--
--
-60
(30)
22(1
02)
(50)
a T
rans
fer A
ffect
ing
Expo
sure
s at
Beg
inni
ng o
f Yea
r
b Tra
nsfe
r Affe
ctin
g Ex
posu
res
at E
nd o
f Yea
r
c Sal
e w
ith C
ontin
ued
Use
Pa
rent
hese
s D
enot
e C
redi
t Am
ount
.
Acq
uisi
tions
, Tra
nsfe
rs a
nd S
ales
, Tho
usan
ds o
f Dol
lars
Dur
ing
Year
SC
HE
DU
LE 2
. O
THE
R T
RA
NS
AC
TIO
NS
FO
R E
AC
H Y
EA
R 2
005-
2014
SU
MM
AR
IZE
D B
Y A
GE
INTE
RV
AL
A-11

Gaz Métro 2014 Depreciation Study
retired in 2005. The $10,000 retirement occurred during the age interval between 4½
and 5½ years on the basis that approximately one-half of the amount of property was
installed prior to and subsequent to July 1 of each year. That is, on the average,
property installed during a year is placed in service at the midpoint of the year for the
purpose of the analysis. All retirements also are stated as occurring at the midpoint of a
one-year age interval of time, except the first age interval which encompasses only one-
half year.
The total retirements occurring in each age interval in a band are determined by
summing the amounts for each transaction year-installation year combination for that
age interval. For example, the total of $143,000 retired for age interval 4½-5½ is the
sum of the retirements entered on Schedule 1 immediately above the stair step line
drawn on the table beginning with the 2005 retirements of 2000 installations and
ending with the 2014 retirements of the 2009 installations. Thus, the total amount of
143 for age interval 4½-5½ equals the sum of:
10 + 12 + 13 + 11 + 13 + 13 + 15 + 17 + 19 + 20.
In Schedule 2, other transactions which affect the group are recorded in a similar
manner. The entries illustrated include transfers and sales. The entries which are
credits to the plant account are shown in parentheses. The items recorded on this
schedule are not totaled with the retirements, but are used in developing the exposures
at the beginning of each age interval.
Schedule of Plant Exposed to Retirement The development of the amount of plant exposed to retirement at the beginning
of each age interval is illustrated in Schedule 3 on the following page. The surviving
plant at the beginning of each year from 2005 through 2014 is recorded by year in the
portion of the table headed "Annual Survivors at the Beginning of the Year." The last
amount entered in each column is the amount of new plant added to the group during
the year. The amounts entered in Schedule 3 for each successive year following the
beginning balance or addition, are obtained by adding or subtracting the net entries
A-12

Gaz Métro 2014 Depreciation Study
E
xper
ienc
e B
and
2005
-201
4
Pla
cem
ent B
and
2000
-201
4
Tota
l at
Beg
inni
ngYe
arof
Age
Age
Pla
ced
2005
2006
2007
2008
2009
2010
2011
2012
2013
2014
Inte
rval
Inte
rval
(1)
(2)
(3)
(4)
(5)
(6)
(7)
(8)
(9)
(10)
(11)
(12)
(13)
1999
255
245
234
222
209
195
239
216
192
167
167
13½
-14½
2000
279
268
256
243
228
212
194
174
153
131
323
12½
-13½
2001
307
296
284
271
257
241
224
205
184
162
531
11½
-12½
2002
338
330
321
311
300
289
276
262
242
226
823
10½
-11½
2003
376
367
257
346
334
321
307
267
280
261
1,09
7 9
½-1
0½20
04
420
a41
640
739
738
637
436
134
733
231
61,
503
8½
-9½
2005
4
60a
455
444
432
419
405
390
374
356
1,95
27½
-8½
2006
5
10a
504
492
479
464
448
431
412
2,46
3 6
½-7
½20
07
580
a57
456
154
653
050
148
23,
057
5½
-6½
2008
6
60a
653
639
623
628
609
3,78
9 4
½-5
½20
09
750
a74
272
468
566
34,
332
3½
-4½
2010
8
50a
841
821
799
4,95
5 2
½-3
½20
11
960
a94
992
35,
719
1½
-2½
2012
1,0
80a
1,06
96,
579
½-1
½20
13 1
,220
a7,
490
0-½
Tota
l1,
975
2,38
22,
824
3,31
83,
872
4,49
45,
247
6,01
76,
852
7,79
944
,780
a Ad
ditio
ns d
urin
g th
e ye
ar.
Exp
osur
es, T
hous
ands
of D
olla
rsA
nnua
l Sur
vivo
rs a
t the
Beg
inni
ng o
f the
Yea
r
SC
HE
DU
LE 3
. P
LAN
T E
XPO
SE
D T
O R
ETI
RE
ME
NT
JAN
UA
RY
1O
F E
AC
H Y
EA
R 2
005-
2014
SU
MM
AR
IZE
D B
Y A
GE
INTE
RV
AL
A-13

Gaz Métro 2014 Depreciation Study
shown on Schedules 1 and 2. For the purpose of determining the plant exposed to
retirement, transfers-in are considered as being exposed to retirement in this group at
the beginning of the year in which they occurred, and the sales and transfers-out are
considered to be removed from the plant exposed to retirement at the beginning of
the following year. Thus, the amounts of plant shown at the beginning of each year are
the amounts of plant from each placement year considered to be exposed to retirement
at the beginning of each successive transaction year. For example, the exposures for
the installation year 2006 are calculated in the following manner:
Exposures at age 0 = amount of addition = $750,000 Exposures at age ½ = $750,000 - $ 8,000 = $742,000 Exposures at age 1½ = $742,000 - $18,000 = $724,000 Exposures at age 2½ = $724,000 - $20,000 - $19,000 = $685,000 Exposures at age 3½ = $685,000 - $22,000 = $663,000
For the entire experience band 2005-2014, the total exposures at the beginning
of an age interval are obtained by summing diagonally in a manner similar to the
summing of the retirements during an age interval (Schedule 1). For example, the
figure of 3,789, shown as the total exposures at the beginning of age interval 4½-5½, is
obtained by summing: 255 + 268 + 284 + 311 + 334 + 374 + 405 + 448 + 501 + 609.
Original Life Table The original life table, illustrated in Schedule 4 on the following page, is developed from the totals shown on the schedules of retirements and exposures,
Schedules 1 and 3, respectively. The exposures at the beginning of the age interval are
obtained from the corresponding age interval of the exposure schedule, and the
retirements during the age interval are obtained from the corresponding age interval of
the retirement schedule. The retirement ratio is the result of dividing the retirements
during the age interval by the exposures at the beginning of the age interval. The
percent surviving at the beginning of each age interval is derived from survivor ratios,
each of which equals one minus the retirement ratio. The percent surviving is
developed by starting with 100% at age zero and successively multiplying the percent
A-14

Gaz Métro 2014 Depreciation Study
SCHEDULE 4. ORIGINAL LIFE TABLE
CALCULATED BY THE RETIREMENT RATE METHOD
Experience Band 2005-2014 Placement Band 2000-2014
(Exposure and Retirement Amounts are in Thousands of Dollars)
Age at
Beginning of Interval
(1)
Exposures at Beginning of Age Interval
(2)
Retirements During Age
Interval (3)
Retirement Ratio
(4)
Survivor Ratio
(5)
Percent Surviving at Beginning of Age Interval
(6)
0.0 7,490 80 0.0107 0.9893 100.00 0.5 6,579 153 0.0233 0.9767 98.93 1.5 5,719 151 0.0264 0.9736 96.62 2.5 4,955 150 0.0303 0.9697 94.07 3.5 4,332 146 0.0337 0.9663 91.22 4.5 3,789 143 0.0377 0.9623 88.15 5.5 3,057 131 0.0429 0.9571 84.83 6.5 2,463 124 0.0503 0.9497 81.19 7.5 1,952 113 0.0579 0.9421 77.11 8.5 1,503 105 0.0699 0.9301 72.65 9.5 1,097 93 0.0848 0.9152 67.57 10.5 823 83 0.1009 0.8991 61.84 11.5 531 64 0.1205 0.8795 55.60 12.5 323 44 0.1362 0.8638 48.90 13.5 167 26 0.1557 0.8443 42.24
35.66
Total
44,780
1,606
Column 2 from Schedule 3, Column 12, Plant Exposed to Retirement. Column 3 from Schedule 1, Column 12, Retirements for Each Year. Column 4 = Column 3 divided by Column 2. Column 5 = 1.0000 minus Column 4. Column 6 = Column 5 multiplied by Column 6 as of the Preceding Age Interval.
A-15

Gaz Métro 2014 Depreciation Study
surviving at the beginning of each interval by the survivor ratio, i.e., one minus the
retirement ratio for that age interval. The calculations necessary to determine the
percent surviving at age 5½ are as follows:
Percent surviving at age 4½ = 88.15 Exposures at age 4½ = 3,789,000 Retirements from age 4½ to 5½ = 143,000 Retirement Ratio = 143,000 ÷ 3,789,000 = 0.0377 Survivor Ratio = 1.000 - 0.0377 = 0.9623 Percent surviving at age 5½ = (88.15) x (0.9623) = 84.83
The totals of the exposures and retirements (columns 2 and 3) are shown for the
purpose of checking with the respective totals in Schedules 1 and 3. The ratio of the
total retirements to the total exposures, other than for each age interval, is meaningless.
The original survivor curve is plotted from the original life table (column 6, Schedule 4).
When the curve terminates at a percent surviving greater than zero, it is called a stub
survivor curve. Survivor curves developed from retirement rate studies generally are
stub curves.
Smoothing the Original Survivor Curve The smoothing of the original survivor curve eliminates any irregularities and
serves as the basis for the preliminary extrapolation to zero percent surviving of the
original stub curve. Even if the original survivor curve is complete from 100% to zero
percent, it is desirable to eliminate any irregularities, as there is still an extrapolation for
the vintages which have not yet lived to the age at which the curve reaches zero
percent. In this study, the smoothing of the original curve with established type curves
was used to eliminate irregularities in the original curve.
The Iowa type curves are used in this study to smooth those original stub curves
which are expressed as percents surviving at ages in years. Each original survivor
curve was compared to the Iowa curves using visual and mathematical matching in
order to determine the better fitting smooth curves. In Figures 6, 7, and 8, the original
curve developed in Schedule 4 is compared with the L, S, and R Iowa type curves
which most nearly fit the original survivor curve. In Figure 6, the L1 curve with an
A-16

Gaz Métro 2014 Depreciation Study
average life between 12 and 13 years appears to be the best fit. In Figure 7, the S0
type curve with a 12-year average life appears to be the best fit and appears to be
better than the L1 fitting. In Figure 8, the R1 type curve with a 12-year average life
appears to be the best fit and appears to be better than either the L1 or the S0.
In Figure 9, the three fittings, 12-L1, 12-S0 and 12-R1 are drawn for comparison
purposes. It is probable that the 12-R1 Iowa curve would be selected as the most
representative of the plotted survivor characteristics of the group.
A-17

Gaz Métro 2014 Depreciation Study
FIGURE 6. ILLUSTRATION OF THE MATCHING OF AN ORIGINAL SURVIVOR CURVE WITH AN L1 IOWA TYPE CURVE
ORIGINAL AND SMOOTH SURVIVOR CURVES
A-18

Gaz Métro 2014 Depreciation Study
FIGURE 7. ILLUSTRATION OF THE MATCHING OF AN ORIGINAL SURVIVOR CURVE WITH AN S0 IOWA TYPE CURVE
ORIGINAL AND SMOOTH SURVIVOR CURVES
A-19

Gaz Métro 2014 Depreciation Study
FIGURE 8. ILLUSTRATION OF THE MATCHING OF AN ORIGINAL SURVIVOR CURVE WITH AN R1 IOWA TYPE CURVE
ORIGINAL AND SMOOTH SURVIVOR CURVES
A-20

Gaz Métro 2014 Depreciation Study
FIGURE 9. ILLUSTRATION OF THE MATCHING OF AN ORIGINAL SURVIVOR CURVE WITH AN L1, S0 AND R1 IOWA TYPE CURVE
ORIGINAL AND SMOOTH SURVIVOR CURVES
A-21

Gaz Métro 2014 Depreciation Study
APPENDIX B ESTIMATION OF NET SALVAGE
B-1

Gaz Métro 2014 Depreciation Study
ESTIMATION OF NET SALVAGE
The estimates of net salvage were based primarily on the professional judgment
of Gannett Fleming, in part on historical data, and in part through a comparison to peer
companies. Gross salvage and cost of removal as recorded to the depreciation reserve
account and related to experienced retirements are used. Percentages of the cost of
plant retired are calculated for each component of net salvage on both annual and
three-year moving average bases.
The net salvage percentages estimated is usually determined using the
“Traditional Approach” for net salvage estimation. When a utility retires plant, the plant
may be: (1) sold to a third party; (2) reused by the utility for additional service; (3)
abandoned in place; or (4) physically removed. In the circumstances where the plant is
sold or re-used, a salvage proceed (or positive salvage amount) is normally recognized.
In circumstances where the plant is abandoned in place or physically removed, a cost of
removal expenditure (or negative salvage) is incurred. The net of these estimated
gross salvage proceeds and the estimated costs of removal are expressed as a
percentage of the account’s original cost to determine a net salvage percentage. In the
circumstances where the salvage proceeds exceed the costs of retirement, a net
positive salvage percentage exists. In the circumstances where the costs of removal
exceed the salvage proceeds, a net negative salvage percentage results.
The estimation of the net salvage percentages developed using the traditional
approach, includes the following steps:
1. The annual retirement, gross salvage and cost of removal transactions for the period of analysis are extracted from the plant accounting systems.
2. A net salvage amount (gross salvage proceeds less cost of retirement) is
calculated for each historic year. Additionally, a net salvage amount is also calculated for each historic three-year rolling band and the most recent five-year rolling band.
3. The net salvage amount determined above is compared to the original
booked costs retired for each period in the manner described, which results in a net salvage percentage of original costs retired for each year, in addition to three-year rolling bands and the most recent five-year rolling band.
B-2

Gaz Métro 2014 Depreciation Study
4. The annual, the three-year rolling average, and the most recent five-year rolling average net salvage percentages are analyzed to determine a reasonable estimated net salvage percentage. At this point the net salvage percentage is based purely upon statistical analysis.
5. Each account is then compared to the net salvage percentage currently
approved, compared to peer companies, and discussed with company engineering staff. Based on the statistical analysis, the review of current and peer company net salvage percentages, and with the professional judgment of Gannett Fleming, a net salvage percentage is determined for each account.
6. The net salvage percentage is then used in the depreciation rate
calculations in the technical update.
B-3

Gannett Fleming Canada ULC
Suite 277 • 200 Rivercrest Drive S.E. • Calgary, AB T2C 2X5 • Canada t: 403.257.5946 • f: 403.257.5947
www.gannettfleming.com www.gfvrd.com

Société en commandite Gaz Métro
Cause tarifaire 2016, R-3879-2014
Original : 2015.05.29 Gaz Métro – 107, Document 11
Annexe B - Page 1 de 1
A N N E X E B
Taux d’amortissement proposés pour les catégories d’installations générales
Catégories actuelles
Taux
actuels
Nouvelles catégories proposées
Taux proposés pour les
catégories
Matériel roulant - Fourgonnettes (Z2400)
20 %
(5 ans)
14,29 %
(7 ans)
Véhicules tout terrain (Z2560) 10 %
(10 ans)
33.33 %
(3 ans)
Machinerie lourde (Z2600)
12,5 %
(8 ans)
Équipements flotte (Z2600)
Les investissements de la catégorie actuelle Z2550 – Accessoires et équip. camions lourds seront désormais comptabilisés dans cette catégorie.
10 %
(10 ans)
Remorques (Z2650) 12,5 %
(8 ans)
10 %
(10 ans)
Matériel roulant - Camions lourds – 10 ans (Z2540)
10 %
(10 ans)
Équipements immeubles - 15 ans (Z2055) :
Équipement majeur ventilation, chauffage & climatisation
Toiture
Tour d’eau
Équipement sanitaire (toilette, lavabo)
Porte
Vérin & pont roulant
Actuellement dans la catégorie Z2052 – 4 % (25 ans)
Actuellement dans la catégorie Z2053 – 10 % (10 ans)
6,67 %
(15 ans)


Société en commandite Gaz Métro
Cause tarifaire 2016, R-3879-2014
Original : 2015.05.29 Gaz Métro – 107, Document 11
Annexe C - Page 1 de 2
A N N E X E C
Impacts de l’étude des taux sur la dépense d’amortissement de la Cause tarifaire 2016
Note : Les impacts à la hausse sur la dépense d’amortissement sont présentés en négatif tandis que les impacts à la baisse sont
présentés en positif.
Taux Amortissement Taux Amortissement
Amort. prévu Amort. prévu
proposé CT 2016 actuel CT 2016
Catégories Description 000 $ 000 $ 000 $
ACTIFS INTANGIBLES
Z1400 Distribution - mutation 2,50% (51) 2,50% (51) -
Z2700 Installation - mutation 2,50% (3) 2,50% (3) -
Z3150 Transmission - mutation 2,50% (9) 2,50% (9) -
Z4150 Stockage - mutation 2,50% (1) 2,50% (1) -
Total (64) (64) -
ENTREPOSAGE
Z4051 Bâtiment administratifs-usine de liquéfaction 2,87% (123) 2,87% (123) -
Z4052 Bâtiment infrastructures-usine de liquéfaction 2,96% (723) 3,48% (850) 127
Z4101 Équipement mécaniques-usine de liquéfaction 1,16% (106) 1,75% (160) 54
Z4102 Équipements électroniques-usine de liquéfaction 0,36% (1) 38,71% (22) 21
Z4103 Équipements spécialisés-usine de liquéfaction 5,63% (162) 5,85% (168) 6
Z4200 Gaz coussin - - - - -
Total (1 115) (1 323) 208
TRANSMISSION
Z3050 Servitudes 0,05% (2) 0,17% (7) 5
Z3100 Conduites principales-acier 0,36% (178) 0,46% (228) 50
Total (180) (235) 55
DISTRIBUTION
Z1050 Servitudes 1,42% (219) 1,55% (240) 21
Z1251 Postes livraison - civile 2,46% (324) 4,17% (549) 225
Z1301 Postes détente - civile 3,05% (250) 6,82% (559) 309
Z1101 Branchements d'immeubles-cuivre 0,82% (9) 0,00% - (9)
Z1100 Branchements d'immeubles-acier 2,50% (4 177) 2,66% (4 446) 269
Z1102 Branchements d'immeubles-plast.direct 5,15% (37 557) 3,19% (23 272) (14 285)
Z1351 Distribution - CASEP 2,10% 64 3,19% 97 (33)
Z1352 Revenus contributions clients raccordements 2,10% 235 3,19% 357 (122)
Z1353 Revenus conditions de raccordementss 2,10% 12 3,19% 19 (7)
Z1354 Revenus contributions rentabilités investissements 1,99% 271 3,19% 434 (163)
Z1355 Revenus pénalités ententes promoteurs 2,10% 5 3,19% 7 (2)
Z1103 Branchements d'immeubles-plast.inséré 2,27% (1 748) 2,45% (1 887) 139
Z1104 Branchements pré-détente-plast.direct 5,56% (102) 3,02% (55) (47)
Z1105 Branchements pré-détente acier 7,23% (42) 5,43% (31) (11)
Z1150 Conduites principales-acier 3,13% (23 447) 2,82% (21 130) (2 317)
Z1151 Conduites principales-plast.direct 1,56% (13 446) 1,98% (17 063) 3 617
Z1152 Conduites principales-plast.inséré 1,43% (914) 1,65% (1 055) 141
Z1250 Postes de livraison - équipement 2,03% (1 803) 5,97% (5 302) 3 499
Z1300 Postes détente - équipement 3,77% (1 524) 5,58% (2 254) 730
Z1200 Compteurs 7,19% (12 006) 9,16% (15 306) 3 300
Z1501 Biogaz - servitudes 3,97% - 3,95% - -
Z1550 Biogaz - conduites acier 5,33% (105) 5,19% (102) (3)
Z1560 Biogaz - poste de compression - équipement 5,77% (233) 6,03% (244) 11
Z1561 Biogaz - poste de compression - partie civile 4,92% (87) 5,15% (91) 4
Z1570 Biogaz - poste de mesurage - équipement 6,67% (20) 6,67% (20) -
Z1571 Biogaz - poste de mesurage - partie civile 4,88% (8) 5,11% (9) 1
Z1350 Contributions construction 2,10% 265 3,19% 403 (138)
Total (97 169) (92 298) (4 871)
Nouvelle étude des taux Ancienne étude des taux
Écart
amortissement
prévu CT 2016

Société en commandite Gaz Métro
Cause tarifaire 2016, R-3879-2014
Original : 2015.05.29 Gaz Métro – 107, Document 11
Annexe C - Page 2 de 2
Note : Les impacts à la hausse sur la dépense d’amortissement sont présentés en négatif tandis que les impacts à la baisse sont
présentés en positif.
Taux Amortissement Taux Amortissement
Amort. prévu Amort. prévu
proposé CT 2016 actuel CT 2016
Catégories Description 000 $ 000 $ 000 $
INSTALLATIONS GÉNÉRALES
Z2050 Structures et améliorations 3,51% (2 293) 3,51% (2 293) -
Z2051 Infrastructures 2,25% (261) 2,25% (261) -
Z2052 Équip base immeubles 4,00% (712) 4,00% (729) 17
Z2053 Équip fct immeubles 10,00% (788) 10,00% (799) 11
Z2054 Équip tech immeubles 20,00% (26) 20,00% (20) (6)
Z2055 Équip immeubles - 15 ans 6,67% (28) 0,00% - (28)
Z2100 Améliorations locatives Durée (135) Durée (135) -
Z2150 Équipements de bureau 10,00% (1 133) 10,00% (1 133) -
Z2150_ Équipements de bureau - usine LSR 10,00% (35) 10,00% (35) -
Z2201 Équipement ordinateur central Durée (44) Durée (44) -
Z2202 Pag,cell,caméra - 2 ans 50,00% (396) 50,00% (468) 72
Z2203 Micro-ord,serveur - 4 ans 25,00% (2 655) 25,00% (2 703) 48
Z2203_ Micro-ord,serveur - 4 ans - usine LSR 25,00% (26) 25,00% (24) (2)
Z2204 Imprim.,phot,lib.stock - 5 ans 20,00% (363) 20,00% (332) (31)
Z2205 Mesurage distance - 10 ans 10,00% (187) 10,00% (187) -
Z2400 Matériel roulant-fourgonnettes 14,29% (1 988) 20,00% (2 786) 798
Z2400_ Matériel roulant-fourgonnettes - usine LSR 14,29% (9) 20,00% (11) 2
Z2450 Matériel roulant-voitures et camionnettes 20,00% (577) 20,00% (564) (13)
Z2500 Matériel roulant-camions lourds - 8 ans 12,50% (1 016) 12,50% (1 027) 11
Z2540 Matériel roulant- camions lourds - 10 ans 10,00% (9) 0,00% - (9)
Z2560 Véhicules tout terrain 33,33% (60) 10,00% (18) (42)
Z2650 Remorques 10,00% (79) 12,50% (98) 19
Z2550 Accessoires et équip camions lourds 12,50% (57) 12,50% (57) -
Z2600 Équipement flotte 10,00% (296) 12,50% (369) 73
Z2301 Équipement et outillage 4,00% (106) 4,00% (106) -
Z2301_ Équipement et outillage - usine LSR 4,00% (6) 4,00% (6) -
Z2302 Outils spéc, électro 20,00% (682) 20,00% (682) -
Z2303 Inst équip et outillage - 12 ans 8,33% (91) 8,33% (91) -
Z2300 Machinerie et outillage 12,50% (824) 12,50% (824) -
Z2250 Matériel de communications 8,33% (134) 8,33% (134) -
Z2250_ Matériel de communications - usine LSR 8,33% - 8,33% - -
Total (15 016) (15 936) 920
Total avant travaux en cours et contributions (113 544) (109 856) (3 688)
CONTRIBUTIONS
Z5001 Contributions infrastructures 1,93% 783 2,33% 943 (160)
Z5002 Subv. Gouv. - distr. projets majeurs (CP acier) 2,41% 942 2,82% 1 104 (162)
Z5050 Contributions transmission 0,08% - 0,46% 1 (1)
Z5000 Contributions - P.E.R.D. 1,93% 1 551 2,33% 1 871 (320)
Z5003 Subv. Gouv. - distr. Projets majeurs (CP plast.) 1,57% 223 1,98% 281 (58)
Z5200 Subv. - Inst générales 14,29% 24 20,00% 33 (9)
Sous-total contributions 3 523 4 233 (710)
Total avant travaux en cours (110 021) (105 623) (4 398)
Z9000 à Z9355 Travaux en cours - - - - -
Sous-total TEC - - - - -
Total (110 021) (105 623) (4 398)
Amortissement imputé à d'autres comptes:
Matériel Roulant (20%) 818 986 (168)
Droits de mutation 64 64 -
Total dépense amortissement (109 139) (104 572) (4 567)
Écart
amortissement
prévu CT 2016
Nouvelle étude des taux Ancienne étude des taux