experimental study of mixed mode crack parameters in high performance concrete
TRANSCRIPT

IJRET: International Journal of Research in Engineering and Technology eISSN: 2319-1163 | pISSN: 2321-7308
_______________________________________________________________________________________
Volume: 04 Special Issue: 01 | NCRTCE-2014 | Feb-2015, Available @ http://www.ijret.org 167
EXPERIMENTAL STUDY OF MIXED MODE CRACK PARAMETERS
IN HIGH PERFORMANCE CONCRETE
T. Santhi Sagar M1, Y.Murali Krishna M
2, Ch.N.Satish Kumar
3
1Assistant Professor, Department of Civil Engineering, Bapatla Engineering College, Bapatla-522101, India
2Assistant Professor, Department of Civil Engineering, Bapatla Engineering College, Bapatla-522101, India
3professor, Department of Civil Engineering, Bapatla Engineering College, Bapatla-522101, India
Abstract In this paper an experimental investigation was carried out to study the fracture behavior of plain high performance
concrete beams subjected to three point bending. In this investigation to study the effect of stress intensity factor and Fracture energy of concrete beams of various sizes with constant position of notch from center of beam and notch depth ratios. It was
found that the stress intensity factor and fracture energy increases with the increasing of beam sizes and decreasing the failure
stresses with increasing the beam sizes.
Keywords: Stress Intensity Factor, Fracture Energy, Three Point Bending
--------------------------------------------------------------------***------------------------------------------------------------------
1. INTRODUCTION
Concrete is often considered a heterogeneous material in
engineering design and construction, yet is in reality a composite consisting of mortar matrix and aggregate
inclusion phases. Upon closer inspection, voids are
apparent, as the cement paste is actually a mixture of
different types of crystalline structures at various degrees of
hydration with trapped and entrained air voids. Most
researchers simplify concrete as a two-phase composite
consisting of mortar and aggregate; to complete the model,
defects known as ‘microcracks’ are introduced in the
system. The failure process is initiated when minute bond
cracks format mortar-aggregate interfaces, while small
cracks may also occur in the mortar and aggregate phases separately. Fracture of these microcracks gives concrete the
semblance of ductility; it is the brittle propagation of many
microcracks that form a semi-ductile propagation of a
microcrack and ultimately lead to material failure. In
fracture mechanics terminology there are three different
cracking modes defined: (i) mode I- opening mode, (ii)
mode II – shearing mode and (iii) mode III- tearing mode.
At the macro scale level they describe three independent
kinematic movements of the upper and lower crack surface
with respect to each other and are sufficient to define all
possible modes of crack propagation in an elastic material.
Of course, at the micro scale the stress distribution is much more complex and at such a level modes of fracture have no
sense. As far as concrete is concerned, mode I is a relatively
clear type of crack propagation. On the contrary, mode II
and III are complex failure modes, which can hardly be
realized in an experiment. In these modes the stress normal
to the crack surface need to be approximately zero and only
in-plane shear stress should exist. Even when these
conditions can be realized, due to the complexity of the
concrete structure, over a concrete crack surface a
combination of different stresses exist (shear, tension,
compression and bending). Although the resulting stress
may be in-plane stress (shear), complex stress-strain conditions on a crack surface make the identification of
mode II and III fracture parameters extremely difficult.
Moreover, the question arises whether in a sense of linear
elastic fracture mechanics these two failure modes even
exist. The similar complex combination of stresses exists for
mode I fracture type as well, however, the stress and strain
perpendicular to the crack surface dominate at this fracture
type. large number of experimental results of crack initiation
and propagation in mixed mode on notched beams are based
on the Iosipescu geometry (Iosipescu, 1967; Arrea and
Ingraffea, 1982; Bažant and Pfeiffer, 1986; Biolzi, 1990;
Bocca et al., 1991; Schlangen, 1993a, b; Swartz and Taha, 1990) and the results developed in the RILEM 89-FMT
Committee (Ballatore et al., 1990; Bocca et al., 1990),
among others. Other sets of experimental results are based
on the three point bend of notched beams with eccentric
notch: (Guo et al., 1994a,b; Jenq and Shah, 1988; Swartz et
al. 1988a), among others. Moreover, there are experimental
results developed on notched cylinders (Barr et al., 1989)
and double notched prismatic specimens (Bažant and
Pfeiffer, 1986; Schlangen, 1993a; Barr and Deradj, 1990;
Davies, 1989). The advance has been important, but some
aspects need to be studied in depth [1, 2].
In the present paper, our main attention is to study the
influence of eccentrically placed notch of high strength
concrete beams of various sizes and high performance
concrete with constant notch depth ratio with constant mix
proportions on mixed mode stress intensity factor, fracture
energy and failure stresses
2. EXPERIMENTAL PROGRAM
The experimental program was designed to study the stress
intensity factor and fracture energy of plain-high strength
concrete beams of size 75mm x 75mm x 350mm (Span is
300mm), 75mm x 150mm x 650mm (Span is 600mm) and
IJRET: International Journal of Research in Engineering and Technology eISSN: 2319-1163 | pISSN: 2321-7308
_______________________________________________________________________________________
Volume: 04 Special Issue: 01 | NCRTCE-2014 | Feb-2015, Available @ http://www.ijret.org 168
75mm x 300mm x 1250mm (Span is 1200mm) with
eccentrically placed notch at (L/4) from mid span of the
beam under a three point bending test i.e., with a central
point load. The influence of eccentrically placed notch of
specimens on stress intensity and fracture energy was
studied on beams of varying size effects with constant mix proportions (M30).
This experimental program consists of three series of beams
for each grade, namely small, medium, and large and having
equal notch depth ratio (0.2) from a distance X. In this series
‘0.2’ represents the notch depth ratios and ‘X’ represents
the position of notch from the center of the beam (L/4). Fig
shows the schematic arrangement of the beam specimen
subjected to three point bending.
Loading configuration for mixed mode test
3. MATERIAL DETAILS:
Ordinary Portland cement (OPC) of 53 grade conforming to
IS 8112:1989 with specific gravity of 3.15 was used in
Concrete mix [6]. Fine aggregate conforming to Zone II of
IS 383:1970 was used[7].Crushed coarse aggregate passing
through 20mm sieve and retained on 10mm sieve(100%)
with specific gravity 2.7 was used. Robo Sand or crusher
dust obtained from local granite crushers was used in concrete and also GGBS is used in concrete.
Table: 4 details of materials for 1 cubic meter of concrete
Grade
of
concre
te
Mix
Proportion
Water
wt.
(kg)
Ceme
nt
wt.(k
g)
Weig
ht of
FA
(kg)
Weig
ht of
CA
(kg)
M30 0.46:1:1.26:
3.12 191.6 416.5 525.7
1300.
3
Table 5: Mechanical properties of concrete
Grad
e of
concr
ete
%
Robosand&%
GGBS
Mix
Proportion
fck
(N/m
m2)
ft
(N/m
m2)
M30
R-0%-G-0%
0.46:1:1.26:
3.12
37.1 3.2
R-25%-G-25% 40.12 3.6
R-30%-G-50% 48.89 4
R-50%-G-50% 46.79 4.1
4. CASTING
Cubes of 150mm size were used to determine the compressive strength of concrete. Cylinders with 150 mm diameter and 300 mm length were used to determine the
splitting tensile strength of concrete. Specially made
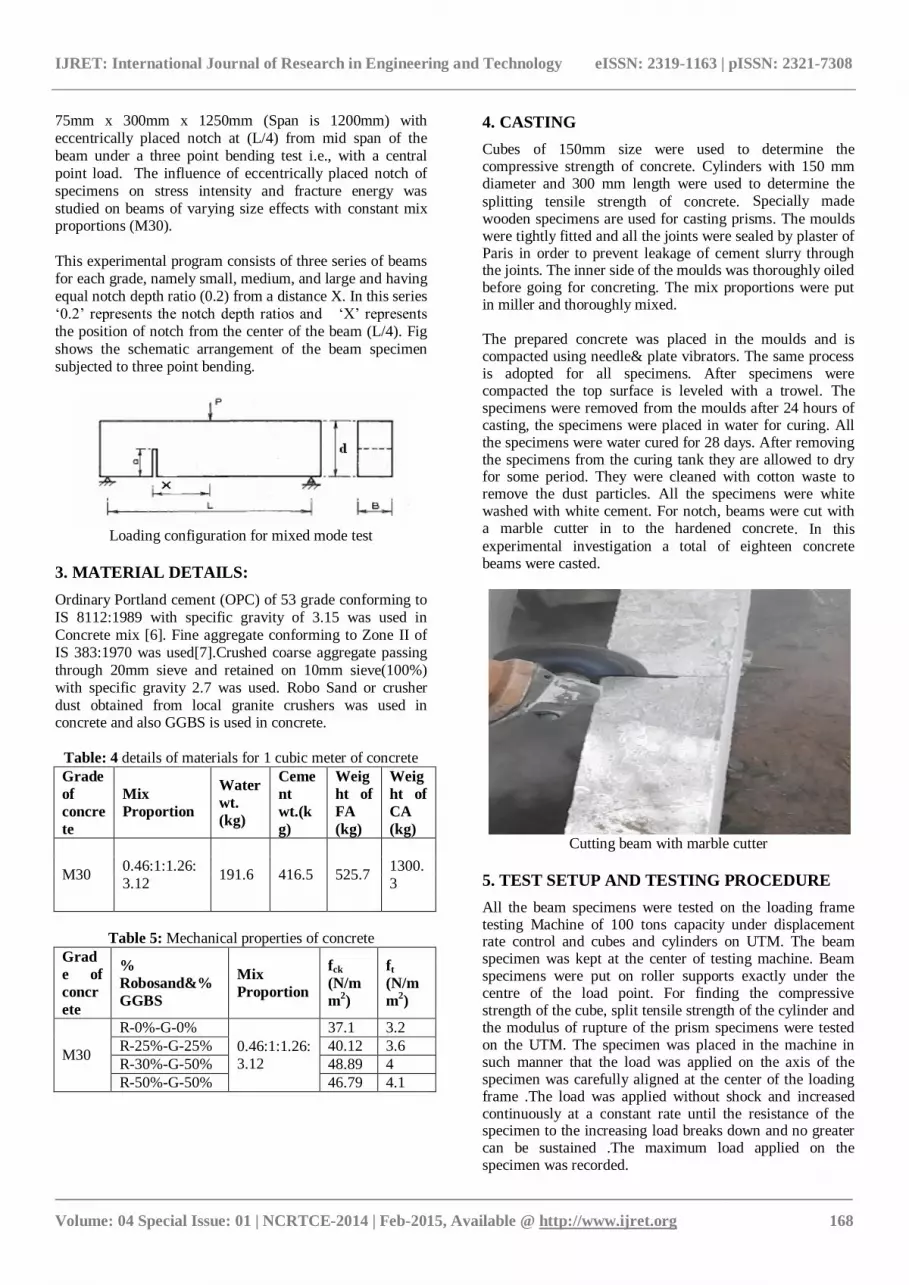
wooden specimens are used for casting prisms. The moulds were tightly fitted and all the joints were sealed by plaster of Paris in order to prevent leakage of cement slurry through the joints. The inner side of the moulds was thoroughly oiled before going for concreting. The mix proportions were put in miller and thoroughly mixed. The prepared concrete was placed in the moulds and is compacted using needle& plate vibrators. The same process is adopted for all specimens. After specimens were compacted the top surface is leveled with a trowel. The specimens were removed from the moulds after 24 hours of casting, the specimens were placed in water for curing. All the specimens were water cured for 28 days. After removing the specimens from the curing tank they are allowed to dry for some period. They were cleaned with cotton waste to remove the dust particles. All the specimens were white washed with white cement. For notch, beams were cut with a marble cutter in to the hardened concrete. In this experimental investigation a total of eighteen concrete beams were casted.
Cutting beam with marble cutter
5. TEST SETUP AND TESTING PROCEDURE
All the beam specimens were tested on the loading frame testing Machine of 100 tons capacity under displacement rate control and cubes and cylinders on UTM. The beam specimen was kept at the center of testing machine. Beam specimens were put on roller supports exactly under the centre of the load point. For finding the compressive strength of the cube, split tensile strength of the cylinder and the modulus of rupture of the prism specimens were tested on the UTM. The specimen was placed in the machine in such manner that the load was applied on the axis of the specimen was carefully aligned at the center of the loading frame .The load was applied without shock and increased continuously at a constant rate until the resistance of the specimen to the increasing load breaks down and no greater can be sustained .The maximum load applied on the specimen was recorded.

IJRET: International Journal of Research in Engineering and Technology eISSN: 2319-1163 | pISSN: 2321-7308
_______________________________________________________________________________________
Volume: 04 Special Issue: 01 | NCRTCE-2014 | Feb-2015, Available @ http://www.ijret.org 169
Test setup
Dimensions of beam specimens in Size Effect Method
Grade
of
concrete
Specimen
Aggregate
Size
(mm)
Length,L,
(mm)
width,b,
(mm)
Depth,d,
(mm)
Span,S,
(mm)
Notch
Depth
(a0)
a0/d S/d
M30
Small 20 350 75 75 300 11.25 0.15 4
Medium 20 650 75 150 600 22.5 0.15 4
Large 20 1250 75 300 1200 45 0.15 4
Quantities of Materials
S.NO
% Of Robosand
and GGBS
Agg.
Size
mm
Specimen size
(mm)
Wt. of
water
(Kg)
Wt. of
cement
(Kg)
Wt. of
FA
(Kg)
Wt. of
CA
(Kg)
Wt. of
Robo
sand
(Kg)
Wt. of
GGBS
(Kg)
1. R-0%-G-0% 20 75×75×350 0.527 1.147 1.147 3.582 0 0
R-0%-G-0% 20 75×150×650 1.95 4.259 4.259 13.29 0 0
R-0%-G-0% 20 75×300×1250 7.54 16.39 16.39 51.15 0 0
2. R-25%-G-25% 20 75×75×350 0.527 0.860 1.860 3.582 0.286 0.362
R-25%-G-25% 20 75×150×650 1.95 3.194 4.027 13.29 1.064 1.342
R-25%-G-25% 20 75×300×1250 7.54 12.29 15.51 51.15 4.097 5.17
3. R-30%-G-50% 20 75×75×350 0.527 0.573 1.013 3.582 0.573 0.4344
R-30%-G-50% 20 75×150×650 1.95 2.129 3.759 13.29 2.129 1.611
R-30%-G-50% 20 75×300×1250 7.54 8.195 14.47 51.15 8.195 6.204
4. R-50%-G-50% 20 75×75×350 0.527 0.573 0.724 3.582 0.573 0.724
R-50%-G-50% 20 75×150×650 1.95 2.129 2.685 13.29 2.129 2.685
R-50%-G-50% 20 75×300×1250 7.54 8.195 10.34 51.15 8.195 10.34
The beam specimens were tested on the Loading Frame
Machine under displacement rate control. All the beam
specimens were tested under the three point bending test
with the displacement rate control. A photograph of the test
setup is shown in Fig 4.1. To understand the fracture
behavior of plain concrete beams and High Performance
Concrete beamsTthe following graphs were drawn i) Load
Vs deflection. The stress intensity factor and the fracture
energy and normal stresses of the beams subjected to three
point bending with eccentrically placed notch at a distance
(L/4) from mid span of the beam, is calculated by using the
suitable equations which are mentioned below. From the
graphs and Tables it was observed the Mixed Mode failure
of concrete,

IJRET: International Journal of Research in Engineering and Technology eISSN: 2319-1163 | pISSN: 2321-7308
_______________________________________________________________________________________
Volume: 04 Special Issue: 01 | NCRTCE-2014 | Feb-2015, Available @ http://www.ijret.org 170
6. RESULTS AND DISCUSSIONS:
Based on the tests on Concrete beams it can be observed
that, in the case of eccentrically placed notch at a distance
(L/4) from mid span of the beam, in plain concrete beams
and High Performance Concrete, the first crack appeared at
notch tip. The deflections were measured only up to the
ultimate load and failed suddenly into two pieces.
For calculation of the stress intensity factor the following
formulas are used
= Notch depth
CN = Arbitrary constant = 1.5(L/D)
For beams having
geometry of L/D = 4
α = Notch/Depth ratio = 0.15
Pu = failure load
b = thickness of the beam
d = depth of the beam
After finding the value of stress intensity factor K1 value
then the value of the fracture energy is obtained in non
linear fracture approach by the formula
E = young’s modulus of concrete = 5700fck
A = constant obtained from regression plot
After obtaining the value of fracture energy Gf the brittleness number is obtained by formula
d = depth of beam, d0 = C/A taken from regression plot The formula for cohesive fracture zone length is
g’(α) = derivative of g(α) with respect to α
Failure Loads, Nominal Stresses, Stress Intensity Factors
S.NO.
% Of Robosand
and GGBS
Agg.
Size
mm
Specimen size
(mm)
Grade Of
Concrete
Peak
Load
P(max)
KN
Failure
stress
N/mm2
Stress intensity
factor
(N/mm2)mm
KI
1.
R-0%-G-0%
20
75×75×350
30
5 5.358
31.439
R-0%-G-0%
20
75×150×650
30
9 4.846
40.215
R-0%-G-0%
20
75×300×1250
30
15 4.09
47.993
2.
R-25%-G-25%
20
75×75×350
30
6 6.425
37.697
R-25%-G-25%
20
75×150×650
30
11 5.913
49.066
R-25%-G-25%
20
75×300×1250
30
18 4.89
57.380
3.
R-30%-G-50%
20
75×75×350
30
7 7.491 43.955
R-30%-G-50%
20
75×150×650
30
13 6.980 57.91

IJRET: International Journal of Research in Engineering and Technology eISSN: 2319-1163 | pISSN: 2321-7308
_______________________________________________________________________________________
Volume: 04 Special Issue: 01 | NCRTCE-2014 | Feb-2015, Available @ http://www.ijret.org 171
R-30%-G-50%
20
75×300×1250
30
21 5.69 66.768
4.
R-50%-G-50%
20
75×75×350
30
8 8.558 50.214
R-50%-G-50%
20
75×150×650
30
15 8.046 66.767
R-50%-G-50%
20
75×300×1250
30
24 6.49 76.155
Fracture Energy, Cohesive Fracture Zone length
% Of Robosand and
GGBS
Specimen
Specimen Size
(mm)
Gf
j/m2
Cf
(mm)
R-0%-G-0%
Small
75×75×350
134.4052 26.90961
R-0%-G-0%
Medium
75×150×650
134.4052 26.90961
R-0%-G-0%
Large
75×300×1250
134.4052 26.90961
R-25%-G-25%
Small
75×75×350
204.4738 28.57709
R-25%-G-25%
Medium
75×150×650
204.4738 28.57709
R-25%-G-25%
Large
75×300×1250
204.4738 28.57709
R-30%-G-50%
Small
75×75×350
228.6773 25.32838
R-30%-G-50%
Medium
75×150×650
228.6773 25.32838
R-30%-G-50%
Large
75×300×1250
228.6773 25.32838
R-50%-G-50%
Small
75×75×350
327.4485 26.67962
R-50%-G-50%
Medium
75×150×650
327.4485 26.67962
R-50%-G-50%
Large
75×300×1250
327.4485 26.67962

IJRET: International Journal of Research in Engineering and Technology eISSN: 2319-1163 | pISSN: 2321-7308
_______________________________________________________________________________________
Volume: 04 Special Issue: 01 | NCRTCE-2014 | Feb-2015, Available @ http://www.ijret.org 172
Regression graphs
Stress Intensity Factor curves for Depth of beams
y = 0.0005x + 0.1170 R² = 0.9993
y = 0.0004x + 0.0994 R² = 0.9915
y = 0.0004x + 0.0881 R² = 0.9816
y = 0.0003x + 0.0696 R² = 0.9726
0
0.05
0.1
0.15
0.2
0.25
0.3
0 100 200 300 400
R-0%-G-0%
R-25%-G-25%
R-30%-G-50%
R-50%-G-50%
Linear (R-0%-G-0%)
Linear (R-25%-G-25%)
Linear (R-30%-G-50%)
Linear (R-50%-G-50%)
DEPTH
Y
REGRESSION GRAPH
0
10
20
30
40
50
60
70
80
0 100 200 300 400
R-0%-G-0%
R-25%-G-25%
R-30%-G-50%
R-50%-G-50%
DEPTH

IJRET: International Journal of Research in Engineering and Technology eISSN: 2319-1163 | pISSN: 2321-7308
_______________________________________________________________________________________
Volume: 04 Special Issue: 01 | NCRTCE-2014 | Feb-2015, Available @ http://www.ijret.org 173
Nominal Stresses Vs Load graph
Load Vs Displacement graph for Small beams
0
1
2
3
4
5
6
7
8
9
0 100 200 300 400
R-0%-G-0%
R-25%-G-25%
R-30%-G-50%
R-50%-G-50%
DEPTH
0
1
2
3
4
5
6
7
8
9
0 1 2 3
S-R-0%-G-0%
S-R-25%-G-25%
S-R-30%-G-50%
S-R-50%-G-50%
L
o
a
d
Deflection

IJRET: International Journal of Research in Engineering and Technology eISSN: 2319-1163 | pISSN: 2321-7308
_______________________________________________________________________________________
Volume: 04 Special Issue: 01 | NCRTCE-2014 | Feb-2015, Available @ http://www.ijret.org 174
Load Vs Displacement graph for medium beams
Load Vs Displacement graph for large beams
0
2
4
6
8
10
12
14
16
0 1 2 3 4 5
M-R-0%-G-0%
M-R-25%-G-25%
M-R-30%-G-50%
M-R-50%-G-50%
L
o
ad
Deflection
0
5
10
15
20
25
30
0 2 4 6 8
L-R-0%-G-0%
L-R-25%-G-25%
L-R-30%-G-50%
L-R-50%-G-50%
Deflection
L
o
a
d

IJRET: International Journal of Research in Engineering and Technology eISSN: 2319-1163 | pISSN: 2321-7308
_______________________________________________________________________________________
Volume: 04 Special Issue: 01 | NCRTCE-2014 | Feb-2015, Available @ http://www.ijret.org 175
Load Vs CMOD graph for small beams
Load Vs CMOD graph for MEDIUM beams
-1
0
1
2
3
4
5
6
7
8
9
-1 0 1 2 3
S-R-0%-G-0%
S-R-25%-G-25%
S-R-30%-G-50%
S-R-50%-G-50%
-2
0
2
4
6
8
10
12
14
16
-0.5 0 0.5 1 1.5 2 2.5 3
M-R-0%-G-0%
M-R-25%-G-25%
M-R-30%-G-50%
M-R-50%-G-50%

IJRET: International Journal of Research in Engineering and Technology eISSN: 2319-1163 | pISSN: 2321-7308
_______________________________________________________________________________________
Volume: 04 Special Issue: 01 | NCRTCE-2014 | Feb-2015, Available @ http://www.ijret.org 176
Load Vs cmod graph for large beams
BEFORE TESTING AFTER TESTING
-5
0
5
10
15
20
25
30
-0.5 0 0.5 1 1.5 2 2.5 3
L-R-0%-G-0%
L-R-25%-G-25%
L-R-30%-G-50%
L-R-50%-G-50%

IJRET: International Journal of Research in Engineering and Technology eISSN: 2319-1163 | pISSN: 2321-7308
_______________________________________________________________________________________
Volume: 04 Special Issue: 01 | NCRTCE-2014 | Feb-2015, Available @ http://www.ijret.org 177
CONCLUSIONS
Based on the tests on eighteen notched concrete beam
specimens, the following conclusions have been drawn:
1. It is observed that, failure stresses (nominal stresses)
decreases with increasing of beam sizes.
2. It is also observed that, stress intensity factor
increases with increase in beam sizes f 3. It is also observed that, stress intensity factor
increases with increase in compressive strength of
beams.
4. It is also observed that, Fracture energy decreases
with increase in compressive strength of concrete.
5. It is observed that,the stress intensity factor is
increases when the beam proportions of GGBS and
Robosand are increases.
6. The compressive strength of normal concrete is less
than high performance concrete.
7. It is observed that,the Fracture energy is increases when the beam proportions of GGBS and Robosand
are increases.
REFERENCES
[1] In 2008 Dr.T.D.Gunneswararao, Dr.Ch.N.Satish
Kumar, Dr.J.girish has done their investigation on
“Mixed mode crack propagation through plain
concrete”.
[2] In 2008 T.D.Gunneswararao, Ch.N.Satish Kumar,
Y. Murali Krishna has done their investigation on
“Mixed mode crack Fracture energy through Fibre
reinforced concrete”.
[3] In 2007 Jacinto R. Carmona, Gonzalo Ruiz *, Javier R. del Viso has done their investigation on
“Mixed-mode crack propagation through reinforced
concrete”.
[4] In 2009 M.T. Kazemi* and I. Zakeri has done their
investigation on " Mixed-mode crack propagation
through reinforced concrete with low volume fraction
of ateel fibers.”
[5] Bazant, Z.P., “Concrete Fracture Models: Testing and
Practice”, Eng. Fracture Mech., Vol. 69, (2002),
165-205..
[6] 6.Elices, M., Guinea, G. V. and Planas, J.,
“Measurement of the Fracture Energy Using Three-
Point Bend Tests: Part 3-Influence of Cutting the P-δ
Tail”, Mat. Struct.,Vol. 25, (1992), 327-334.
[7] Bazant ZP, Planas J. Fracture size effect in concrete
and other quasibrittle materials. Boca Raton: CRC
Press; 1998. [8] J.Ozbolt and H.W. Reinhardt (2000) “Numerical
study of mixed mode fracture in concrete
structures” Numerical study of mixed mode fracture
in concrete structures, Vol.11.
[9] J.C.Galvez, D.A.Cendon and J.Planas (2002)“
Influence of shear parameters on mixed mode
fracture of concrete” International journal of
Fracture 118: 163-189.
[10] J.C.Galvez, M.Elices, G.V.Guinea and J.Planas
(1998)“Mixed mode fracture of concrete under
proportional and non proportional loading”
International journal of Fracture 94: 267-284.
[11] Parviz Soroushian, Hafez Elyamany, Atef Tlili
and Ken Ostowari (1998) “ Mixed mode Fracture
properties of Concrete Reinforced with low volume
fractions of steel and Polypropylene Fibers”
Cement and Concrete Composites 20, 67-78.
[12] Swartz, S.E.,Lu,L.W. and Tang L.D(1998) “
Mixed mode fracture toughness testing of
concrete beams in three point bending” Mater.
Struct., 21, 33-40.
[13] Indian standard for high strength ordinary
Portland cement, IS 8112-1989, Bureau of Indian standards, New Delhi.
[14] Indian Standards for coarse and fine aggregate from
natural sources for concrete, IS383:1970, second
revision, Bureau of Indian standards, New Delhi.
[15] In 2010, P. N. RAO has done his investigation on
High Performance Concrete. The cubes and cylinders
are tested for both compressive and tensile strengths.
[16] In 2013, Sumit Kumar has investigate his work of
using crushed stone dust as fine aggregate partially or
fully with different grades of concrete composites