experience moderates overlap between object and face recognition, suggesting a common ability
TRANSCRIPT
Experience moderates overlap between object and facerecognition, suggesting a common ability
Isabel Gauthier # $Department of Psychology, Vanderbilt University,
Nashville, TN, USA
Rankin W. McGugin # $Department of Psychology, Vanderbilt University,
Nashville, TN, USA
Jennifer J. Richler # $Department of Psychology, Vanderbilt University,
Nashville, TN, USA
Grit Herzmann # $Department of Psychology and Neuroscience, University
of Colorado Boulder, Boulder, CO, USA
Magen Speegle # $Department of Psychology, Vanderbilt University,
Nashville, TN, USA
Ana E. Van Gulick # $Department of Psychology, Vanderbilt University,
Nashville, TN, USA
Some research finds that face recognition is largelyindependent from the recognition of other objects; aspecialized and innate ability to recognize faces couldtherefore have little or nothing to do with our ability torecognize objects. We propose a new framework inwhich recognition performance for any category is theproduct of domain-general ability and category-specificexperience. In Experiment 1, we show that the overlapbetween face and object recognition depends onexperience with objects. In 256 subjects we measuredface recognition, object recognition for eight categories,and self-reported experience with these categories.Experience predicted neither face recognition nor objectrecognition but moderated their relationship: Facerecognition performance is increasingly similar to objectrecognition performance with increasing objectexperience. If a subject has a lot of experience withobjects and is found to perform poorly, they also proveto have a low ability with faces. In a follow-up survey, weexplored the dimensions of experience with objects thatmay have contributed to self-reported experience inExperiment 1. Different dimensions of experience appearto be more salient for different categories, with generalself-reports of expertise reflecting judgments of verbalknowledge about a category more than judgments ofvisual performance. The complexity of experience and
current limitations in its measurement support theimportance of aggregating across multiple categories.Our findings imply that both face and object recognitionare supported by a common, domain-general abilityexpressed through experience with a category and bestmeasured when accounting for experience.
Introduction
It is widely believed that face recognition constitutesa special ability that is relatively independent fromdomain-general factors such as general cognitiveability, motivation, or attention (Wilhelm et al., 2010;Wilmer et al., 2010; Zhu et al., 2010). Additionally, facerecognition ability does not tend to correlate verystrongly with the recognition of nonface objects(Dennett, McKone, Edwards, & Susilo, 2012; Wilhelmet al., 2010). Here, we present evidence challenging thisdistinction. Our results imply that face and objectrecognition share much more variance than originallythought and reflect an underlying ability that generallysupports the acquisition of skills in discriminatingvisually similar objects. Evidence for such a domain-
Citation: Gauthier, I., McGugin, R. W., Richler, J. J., Herzmann, G., Speegle, M., & Van Gulick, A. E. (2014). Experience moderatesoverlap between object and face recognition, suggesting a common ability. Journal of Vision, 14(8):7, 1–12, http://www.journalofvision.org/content/14/8/7, doi:10.1167/14.8.7.
Journal of Vision (2014) 14(8):7, 1–12 1http://www.journalofvision.org/content/14/8/7
doi: 10 .1167 /14 .8 .7 ISSN 1534-7362 � 2014 ARVOReceived February 12, 2014; published July 3, 2014
general ability would have broad-ranging implications.Beyond influencing aptitude in social interactions, thisability could constrain performance in domains such aslearning to play chess, identifying tumors in X-rays ormagnetic resonance imaging pictures, identifying fin-gerprints, or reading airport security displays. Expertisein some of these domains is associated with processingstrategies and neural responses similar to those foundfor faces (Gauthier et al., 2000, 2002; Harley et al.,2009; McGugin, Gatenby, Gore, & Gauthier, 2012;McGugin, Van Gulick, Tamber-Rosenau, Ross, &Gauthier, in press), but such results are not sufficient totest hypotheses regarding the correlation between faceand object recognition abilities across subjects. Becausemany domains of human activity surely benefit fromskilled perception, measuring individual differencesthat may explain variability in high-level visualcognition (beyond what can be accounted for bygeneral cognitive ability) could greatly increase pre-dictions about performance.
Although many agree that face recognition consti-tutes an important skill, the study of individualdifferences in face recognition in the normal adultpopulation with consideration to the psychometricproperties of the measures is surprisingly recent. Thisgrowing literature has established the Cambridge FaceMemory Test (CFMT) as a measure of face recognitionability (Duchaine & Nakayama, 2006). The CFMTsuccessfully discriminates individuals over a wide rangeof performance (Bowles et al., 2009; Germine, Duch-aine, & Nakayama, 2011; Russell, Duchaine, &Nakayama, 2009). Consistent with other measures offace recognition (Wilhelm et al., 2010), CFMT scoresare generally independent from (or at least not linearlycorrelated with) verbal memory (Bowles et al., 2009;Wilmer et al., 2010) and intelligence quotient (Davis etal., 2011).
In a study that found face recognition to be a highlyheritable ability, Wilmer et al. (2010) also assessed theindependence of face recognition from object recogni-tion. In a very large sample (n¼ 3,004), the comparisonof the CFMT with a similar test of recognition forabstract art yielded a low correlation (r3002 ¼ 0.26),accounting for less than 7% (R2¼ 0.07) of the variancein the CFMT. Likewise, Dennett et al. (2011) designedthe Cambridge Car Memory Test, which accounted foronly 13.6% of the variance in the CFMT (n¼142). As aresult, the authors concluded that face and objectprocessing are largely independent. Others have com-pared performance for faces and a single category ofnonface objects with similar results (Dennett et al.,2012; Wilhelm et al., 2010).
Before accepting the independence of face and objectrecognition abilities based on limited shared variancebetween performance for faces and objects in a singlenonface domain, however, an alternative has to be
considered. Face and object recognition may beexpressions of a single domain-general ability that allowspeople to discriminate visually similar objects, and thisdomain-general ability is best expressed for individualsin domains with which they have sufficient experience.Such a domain-general ability is not inconsistent withthe above-mentioned results. First, shared variancearound 14% reflects correlations in the 0.3 to 0.4 range,which is comparable with the magnitude of correlationsobtained between individual tasks that are not consid-ered to reflect independent abilities. For instance,different tasks measuring working memory or short-term memory skills can show correlations of thismagnitude, even though each of the task’s loading onlatent factors that represent these constructs can bemuch higher (;0.6–0.8; Engle, Tuholski, Laughlin, &Conway, 1999). Second, even if there is a domain-general ability, performance with faces and nonfaceobjects may not be strongly correlated since there ismore variability in experience with objects relative tofaces. On the one hand, in a domain such as facerecognition, where most people are highly motivated toexcel and have extensive opportunity to practice,performance likely expresses this ability in full. Indomains such as cars or abstract art, on the other hand,motivation and experience vary greatly, so performancewill not reflect innate ability alone but rather the productof category-specific experience and domain-generalability. In fact, it is plausible that people vary more intheir experience with objects than they do in theirgeneral visual ability, in which case performance withobjects would mostly reflect experience.
Here, we reassess the shared variance between faceand object recognition and provide the first demon-stration that expressing this ability depends onexperience. Experts with extensive real-world experi-ence individuating objects in nonface categories (e.g.,birds, cars) also demonstrate a variety of behavioral(Curby, Glazek, & Gauthier, 2009; McGugin,McKeeff, Tong, & Gauthier, 2010) and neural(Gauthier, Curran, Curby, & Collins, 2003; Harley etal., 2009; Xu, 2005) markers of face perception in theirdomain of expertise. We hypothesize that subjects withmore individuating experience will show more similarperformance for faces and nonface objects than thosewith less individuating experience. Using many objectcategories is important in this framework because weassume that performance with a category with which asubject has modest experience provides very littleinformation about their ability. To the extent thatexperience between different categories is moderatelycorrelated (e.g., this correlation across all subjects is r¼0.38 in our Experiment 1), using several categories hasat least two advantages: 1) the standard benefits ofaggregating to reduce noise (Rushton, Brainerd, &Pressley, 1983), and 2) any subject is more likely to
Journal of Vision (2014) 14(8):7, 1–12 Gauthier et al. 2
have experience with at least some of these categories,providing us with more information about their ability.
Virtually no work has been done in the measurementof experience with objects (see Stanovich & Cunning-ham, 1992, for research on measuring exposure to printas a contributor to verbal skills). Since the self-ratingsused in Experiment 1 proved to be a significantmoderator of object performance, Part 2 offers ananalysis of a survey designed to explore what dimen-sions subjects may have emphasized when answeringthese self-rating questions.
Experiment 1
Methods
Subjects
A total of 256 individuals (130 males, mean age¼23.7 years, SD ¼ 4.34; 126 females, mean age ¼ 22.6years, SD¼ 4.03) participated for a small honorariumor course credit. Subjects were recruited as part of otherexperiments (samples from McGugin, Gatenby et al.,2012; McGugin, Richler, Herzmann, Speegle, &Gauthier, 2012; Van Gulick, McGugin, & Gauthier,2012), none of which included the analyses reportedhere.1 All subjects had normal or corrected-to-normalvisual acuity and provided written informed consent.The experiment was approved by the InstitutionalReview Board at Vanderbilt University.
Cambridge Face Memory Test
In the CFMT (Duchaine & Nakayama, 2006),subjects studied six target faces and completed an 18-trial introductory learning phase, after which they werepresented with 30 forced-choice test displays. Subjectshad to select the target among two distractors on eachtrial. The matching faces varied from their originalpresentation in terms of lighting condition, pose, orboth. Next, subjects were again presented with the sixtarget faces to study, followed by 24 trials presented inGaussian noise.
Vanderbilt Expertise Test
The Vanderbilt Expertise Test (VET; McGugin,Richler et al., 2012) is similar to the CFMT in formatand in psychometric properties. It includes 48 items foreach of eight categories of objects (butterflies, cars,leaves, motorcycles, mushrooms, owls, planes, wadingbirds; see Supplementary Material and SupplementaryTable S1).
Before the start of a category-specific block, subjectsviewed a study screen with one exemplar from each of
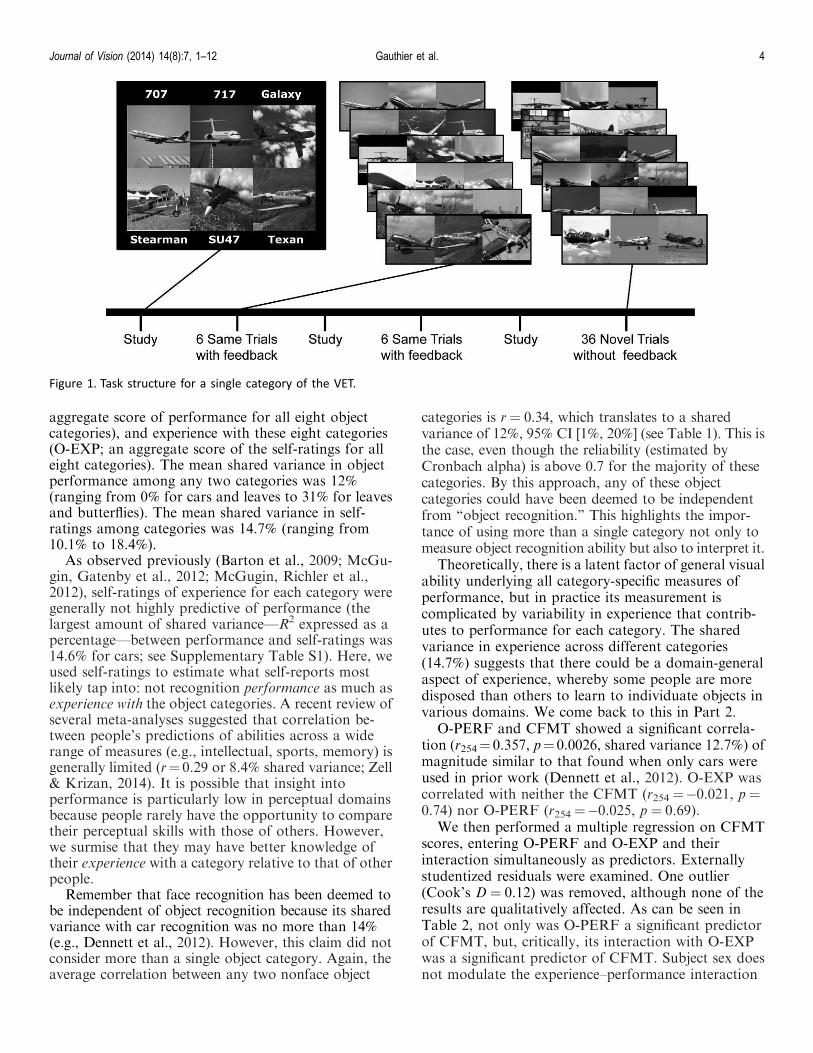
six species or models. For the first twelve trials, one ofthe studied exemplars was presented with two dis-tractors from another species or model in a forced-choice paradigm with feedback (Figure 1). Then,subjects reviewed the study screen and were warnedthat in the subsequent 36 trials there would be nofeedback and that target images would be differentexemplars of the studied species or models, requiringgeneralization across viewpoint, size, and backgrounds.Subjects viewed image triplets and indicated whichexemplar corresponded to one of the target species ormodels studied. For a complete description of the VET,see McGugin, Richler et al. (2012).
Self-rating of experience
Subjects rated themselves on their expertise witheach of the eight VET categories and with faces on a 9-point scale, considering ‘‘interest in, years of exposureto, knowledge of, and familiarity with each category.’’To be clear, here and in past work, even though thequestion is phrased in terms of ‘‘expertise,’’ it shouldnot be assumed that these ratings correspond toperceptual skills, especially because such ratings tendnot to be strongly related to perceptual performance(Barton, Hanif, & Ashraf, 2009; McGugin, Richler etal., 2012). For clarity, we therefore refer to this measureas one of ‘‘experience’’ (a conjecture supported by Part2). We were able to retest a small number of subjects(n ¼ 39) an average of 719 days (SD ¼ 203) after theoriginal test. Test–reretest reliability (Pearson r) foreach category was as follows: faces, 0.20, 95% CI[�0.12, 0.48]; butterflies, 0.56, 95% CI [0.30, 0.74]; cars,0.59, 95% CI [0.34, 0.76]; leaves, 0.66, 95% CI [0.44,0.81]; motorcycles, 0.63, 95% CI [0.39, 0.79]; mush-rooms, 0.63, 95% CI [0.39, 0.79]; owls, 0.54, 95% CI[0.27, 0.73]; planes, 0.63, 95% CI [0.39, 0.79]; andwading birds, 0.39, 95% CI [0.09, 0.63]. The test–retestreliability of the ratings across nonface categories was0.69, 95% CI [0.48, 0.83], and with faces included it was0.80, 95% CI [0.65, 0.89], because even though thereliability of the face ratings is low, the ratings areconsistently higher than ratings for the other categories.While the test–retest reliability of these self-reports waslow for several of these categories, it reached 0.60, 95%CI [0.35, 0.77] for the measure we use in our mainanalyses, O-EXP (the summed ratings for all nonfacecategories). As a comparison, one large sample studyreports a test–retest reliability for the CFMT of 0.70(Wilmer et al., 2010).
Results and discussion
Our analyses consider the relationship between facerecognition (CFMT), object recognition (O-PERF; an
Journal of Vision (2014) 14(8):7, 1–12 Gauthier et al. 3
aggregate score of performance for all eight objectcategories), and experience with these eight categories(O-EXP; an aggregate score of the self-ratings for alleight categories). The mean shared variance in objectperformance among any two categories was 12%(ranging from 0% for cars and leaves to 31% for leavesand butterflies). The mean shared variance in self-ratings among categories was 14.7% (ranging from10.1% to 18.4%).
As observed previously (Barton et al., 2009; McGu-gin, Gatenby et al., 2012; McGugin, Richler et al.,2012), self-ratings of experience for each category weregenerally not highly predictive of performance (thelargest amount of shared variance—R2 expressed as apercentage—between performance and self-ratings was14.6% for cars; see Supplementary Table S1). Here, weused self-ratings to estimate what self-reports mostlikely tap into: not recognition performance as much asexperience with the object categories. A recent review ofseveral meta-analyses suggested that correlation be-tween people’s predictions of abilities across a widerange of measures (e.g., intellectual, sports, memory) isgenerally limited (r¼ 0.29 or 8.4% shared variance; Zell& Krizan, 2014). It is possible that insight intoperformance is particularly low in perceptual domainsbecause people rarely have the opportunity to comparetheir perceptual skills with those of others. However,we surmise that they may have better knowledge oftheir experience with a category relative to that of otherpeople.
Remember that face recognition has been deemed tobe independent of object recognition because its sharedvariance with car recognition was no more than 14%(e.g., Dennett et al., 2012). However, this claim did notconsider more than a single object category. Again, theaverage correlation between any two nonface object
categories is r¼ 0.34, which translates to a sharedvariance of 12%, 95% CI [1%, 20%] (see Table 1). This isthe case, even though the reliability (estimated byCronbach alpha) is above 0.7 for the majority of thesecategories. By this approach, any of these objectcategories could have been deemed to be independentfrom ‘‘object recognition.’’ This highlights the impor-tance of using more than a single category not only tomeasure object recognition ability but also to interpret it.
Theoretically, there is a latent factor of general visualability underlying all category-specific measures ofperformance, but in practice its measurement iscomplicated by variability in experience that contrib-utes to performance for each category. The sharedvariance in experience across different categories(14.7%) suggests that there could be a domain-generalaspect of experience, whereby some people are moredisposed than others to learn to individuate objects invarious domains. We come back to this in Part 2.
O-PERF and CFMT showed a significant correla-tion (r254¼ 0.357, p¼ 0.0026, shared variance 12.7%) ofmagnitude similar to that found when only cars wereused in prior work (Dennett et al., 2012). O-EXP wascorrelated with neither the CFMT (r254 ¼�0.021, p ¼0.74) nor O-PERF (r254¼�0.025, p ¼ 0.69).
We then performed a multiple regression on CFMTscores, entering O-PERF and O-EXP and theirinteraction simultaneously as predictors. Externallystudentized residuals were examined. One outlier(Cook’s D ¼ 0.12) was removed, although none of theresults are qualitatively affected. As can be seen inTable 2, not only was O-PERF a significant predictorof CFMT, but, critically, its interaction with O-EXPwas a significant predictor of CFMT. Subject sex doesnot modulate the experience–performance interaction
Figure 1. Task structure for a single category of the VET.
Journal of Vision (2014) 14(8):7, 1–12 Gauthier et al. 4
when accounting for variability in the CFMT (p¼0.16;see Supplementary Table S2).
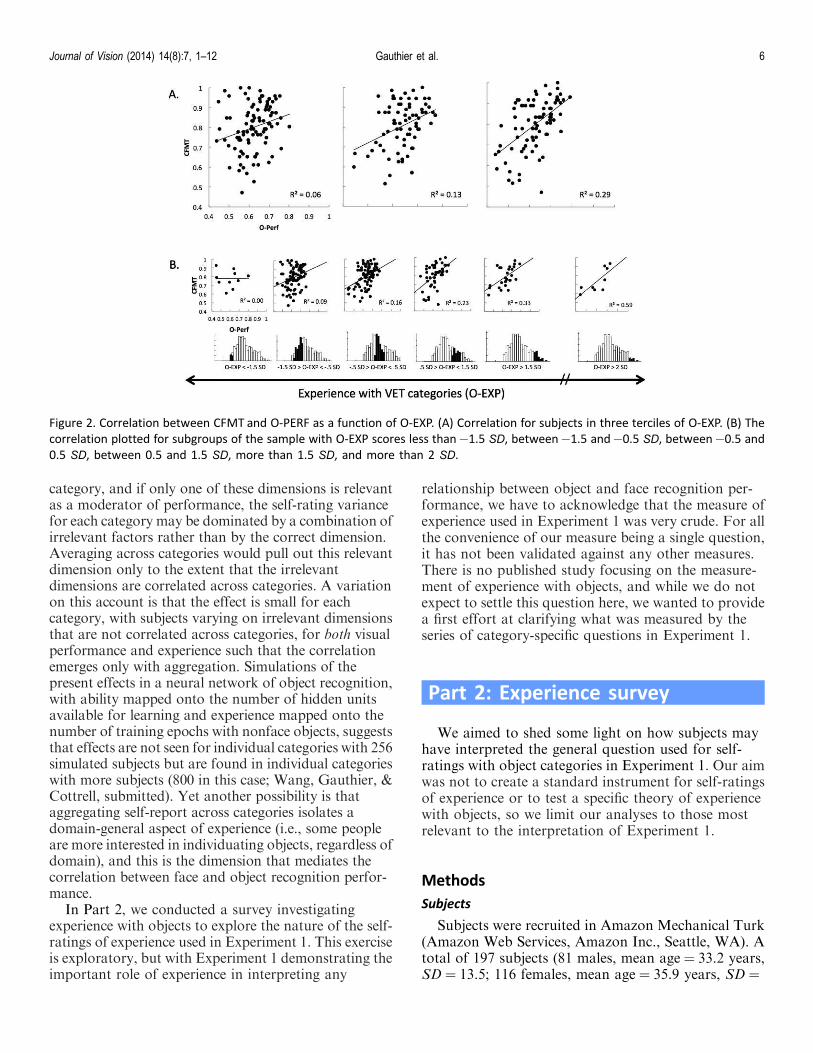
To unpack this interaction, Figure 2A displays thecorrelation between CFMT and O-PERF separatelyfor subjects in three terciles of O-EXP. Shared varianceis near zero in subjects with very little experience withour object categories, whereas a robust correlation isobtained in subjects with more experience. Figure 2Bshows the same effect for the entire sample, in smallerbins of O-EXP, to illustrate how the effect growsmonotonically with experience. Because the first sample(O-EXP ��1.5 SD) has only 10 subjects, we include asample of a similar size (n¼ 9) at the other extreme ofO-EXP (.2 SD), illustrating a very dramatic differenceeven with such small samples. For subjects with O-EXPmore than 2 SD above the mean (seven men, twowomen), the shared variance between CFMT and O-PERF is 59% (p ¼ 0.01), with a value corrected forreliability (correction for attenuation; Spearman, 1904)based on our Cronbach alpha for CFMT and VET of73%, 95% CI [49.5, 100]. Even though this small sampleestimate has a large confidence interval, it illustrateshow with increasing experience the results are lessconsistent with the suggestion that face recognition isindependent from object recognition. According to ourfindings, experience with objects appears to be neces-sary for performance with objects to reflect the sameability measured by the CFMT. If a subject has a lot ofexperience with objects and is found to perform poorly,then we can expect that they have a low ability(including with faces). But if they perform poorly andhave little experience, the performance score is not agood measure of ability and may reflect other sources
of variance supporting strategies that subjects may usewhen they have little knowledge of a category’sdiagnostic dimensions.
Interestingly, Cho et al. (submitted) recently providedthe first test of the assumption that CFMT measures asingle source of variance (unidimensionality assump-tion) in a large sample (n¼2,497). While there was someevidence for multidimensionality, 71% of the varianceexplained by CFMT scores was due to a single factoronto which all trials loaded and the rest was dividedamong three roughly equal factors that appeared torelate to different CFMT target faces. In other words,there was little evidence for any variance that was notrelated to face recognition, and certainly not ofsufficient magnitude to explain the present relationshipswith object performance at high levels of experience.
Dennett et al. (2012) performed an analysis similar toours, although with a single object category and using ameasure of knowledge with cars instead of a self-reportof experience. They found no interaction with carrecognition when predicting the CFMT. This result is notinconsistent with ours: We also do not find a significantexperience–performance interaction when predicting theCFMT with the VET for most individual categories, theexception being motorcycles (Supplementary Table S2).Thus, our findings may depend on the well-known valueof aggregation (Rushton et al., 1983), especially for theexperience measure. There are several possibilities thatcould explain why we observe an interaction betweenexperience and performance in predicting CFMT scoreswhen we use eight categories but not each individualcategory. There may be several distinct dimensions thatinfluence a subject’s self-ratings of experience on a given
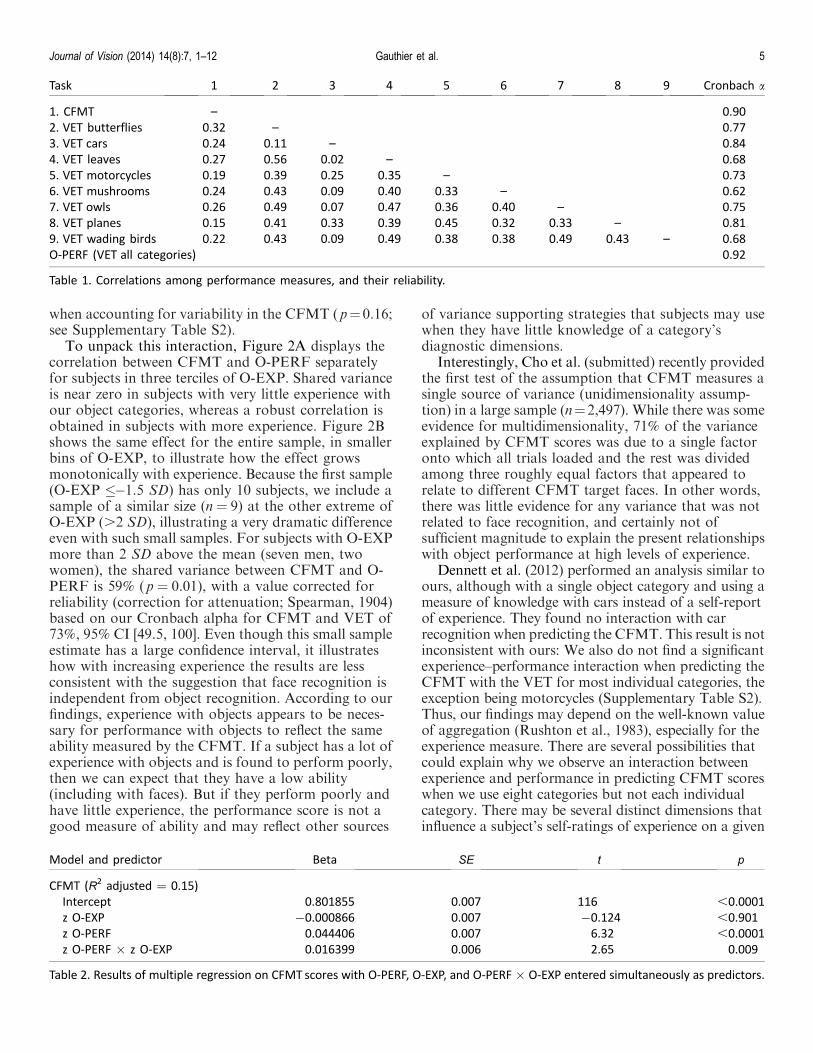
Task 1 2 3 4 5 6 7 8 9 Cronbach a
1. CFMT – 0.90
2. VET butterflies 0.32 – 0.77
3. VET cars 0.24 0.11 – 0.84
4. VET leaves 0.27 0.56 0.02 – 0.68
5. VET motorcycles 0.19 0.39 0.25 0.35 – 0.73
6. VET mushrooms 0.24 0.43 0.09 0.40 0.33 – 0.62
7. VET owls 0.26 0.49 0.07 0.47 0.36 0.40 – 0.75
8. VET planes 0.15 0.41 0.33 0.39 0.45 0.32 0.33 – 0.81
9. VET wading birds 0.22 0.43 0.09 0.49 0.38 0.38 0.49 0.43 – 0.68
O-PERF (VET all categories) 0.92
Table 1. Correlations among performance measures, and their reliability.
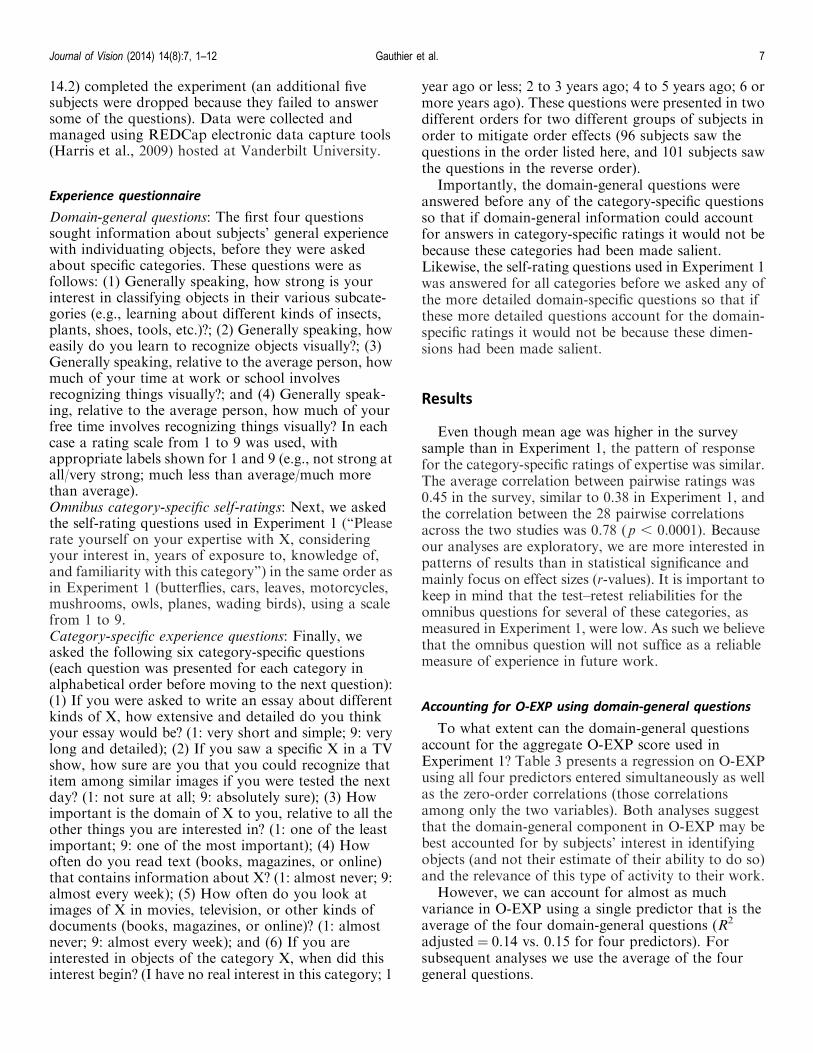
Model and predictor Beta SE t p
CFMT (R2 adjusted ¼ 0.15)
Intercept 0.801855 0.007 116 ,0.0001
z O-EXP �0.000866 0.007 �0.124 ,0.901
z O-PERF 0.044406 0.007 6.32 ,0.0001
z O-PERF · z O-EXP 0.016399 0.006 2.65 0.009
Table 2. Results of multiple regression on CFMT scores with O-PERF, O-EXP, and O-PERF · O-EXP entered simultaneously as predictors.
Journal of Vision (2014) 14(8):7, 1–12 Gauthier et al. 5
category, and if only one of these dimensions is relevantas a moderator of performance, the self-rating variancefor each category may be dominated by a combination ofirrelevant factors rather than by the correct dimension.Averaging across categories would pull out this relevantdimension only to the extent that the irrelevantdimensions are correlated across categories. A variationon this account is that the effect is small for eachcategory, with subjects varying on irrelevant dimensionsthat are not correlated across categories, for both visualperformance and experience such that the correlationemerges only with aggregation. Simulations of thepresent effects in a neural network of object recognition,with ability mapped onto the number of hidden unitsavailable for learning and experience mapped onto thenumber of training epochs with nonface objects, suggeststhat effects are not seen for individual categories with 256simulated subjects but are found in individual categorieswith more subjects (800 in this case; Wang, Gauthier, &Cottrell, submitted). Yet another possibility is thataggregating self-report across categories isolates adomain-general aspect of experience (i.e., some peopleare more interested in individuating objects, regardless ofdomain), and this is the dimension that mediates thecorrelation between face and object recognition perfor-mance.
In Part 2, we conducted a survey investigatingexperience with objects to explore the nature of the self-ratings of experience used in Experiment 1. This exerciseis exploratory, but with Experiment 1 demonstrating theimportant role of experience in interpreting any
relationship between object and face recognition per-formance, we have to acknowledge that the measure ofexperience used in Experiment 1 was very crude. For allthe convenience of our measure being a single question,it has not been validated against any other measures.There is no published study focusing on the measure-ment of experience with objects, and while we do notexpect to settle this question here, we wanted to providea first effort at clarifying what was measured by theseries of category-specific questions in Experiment 1.
Part 2: Experience survey
We aimed to shed some light on how subjects mayhave interpreted the general question used for self-ratings with object categories in Experiment 1. Our aimwas not to create a standard instrument for self-ratingsof experience or to test a specific theory of experiencewith objects, so we limit our analyses to those mostrelevant to the interpretation of Experiment 1.
Methods
Subjects
Subjects were recruited in Amazon Mechanical Turk(Amazon Web Services, Amazon Inc., Seattle, WA). Atotal of 197 subjects (81 males, mean age¼ 33.2 years,SD¼ 13.5; 116 females, mean age¼ 35.9 years, SD¼
Figure 2. Correlation between CFMT and O-PERF as a function of O-EXP. (A) Correlation for subjects in three terciles of O-EXP. (B) The
correlation plotted for subgroups of the sample with O-EXP scores less than�1.5 SD, between�1.5 and�0.5 SD, between�0.5 and
0.5 SD, between 0.5 and 1.5 SD, more than 1.5 SD, and more than 2 SD.
Journal of Vision (2014) 14(8):7, 1–12 Gauthier et al. 6
14.2) completed the experiment (an additional fivesubjects were dropped because they failed to answersome of the questions). Data were collected andmanaged using REDCap electronic data capture tools(Harris et al., 2009) hosted at Vanderbilt University.
Experience questionnaire
Domain-general questions: The first four questionssought information about subjects’ general experiencewith individuating objects, before they were askedabout specific categories. These questions were asfollows: (1) Generally speaking, how strong is yourinterest in classifying objects in their various subcate-gories (e.g., learning about different kinds of insects,plants, shoes, tools, etc.)?; (2) Generally speaking, howeasily do you learn to recognize objects visually?; (3)Generally speaking, relative to the average person, howmuch of your time at work or school involvesrecognizing things visually?; and (4) Generally speak-ing, relative to the average person, how much of yourfree time involves recognizing things visually? In eachcase a rating scale from 1 to 9 was used, withappropriate labels shown for 1 and 9 (e.g., not strong atall/very strong; much less than average/much morethan average).Omnibus category-specific self-ratings: Next, we askedthe self-rating questions used in Experiment 1 (‘‘Pleaserate yourself on your expertise with X, consideringyour interest in, years of exposure to, knowledge of,and familiarity with this category’’) in the same order asin Experiment 1 (butterflies, cars, leaves, motorcycles,mushrooms, owls, planes, wading birds), using a scalefrom 1 to 9.Category-specific experience questions: Finally, weasked the following six category-specific questions(each question was presented for each category inalphabetical order before moving to the next question):(1) If you were asked to write an essay about differentkinds of X, how extensive and detailed do you thinkyour essay would be? (1: very short and simple; 9: verylong and detailed); (2) If you saw a specific X in a TVshow, how sure are you that you could recognize thatitem among similar images if you were tested the nextday? (1: not sure at all; 9: absolutely sure); (3) Howimportant is the domain of X to you, relative to all theother things you are interested in? (1: one of the leastimportant; 9: one of the most important); (4) Howoften do you read text (books, magazines, or online)that contains information about X? (1: almost never; 9:almost every week); (5) How often do you look atimages of X in movies, television, or other kinds ofdocuments (books, magazines, or online)? (1: almostnever; 9: almost every week); and (6) If you areinterested in objects of the category X, when did thisinterest begin? (I have no real interest in this category; 1
year ago or less; 2 to 3 years ago; 4 to 5 years ago; 6 ormore years ago). These questions were presented in twodifferent orders for two different groups of subjects inorder to mitigate order effects (96 subjects saw thequestions in the order listed here, and 101 subjects sawthe questions in the reverse order).
Importantly, the domain-general questions wereanswered before any of the category-specific questionsso that if domain-general information could accountfor answers in category-specific ratings it would not bebecause these categories had been made salient.Likewise, the self-rating questions used in Experiment 1was answered for all categories before we asked any ofthe more detailed domain-specific questions so that ifthese more detailed questions account for the domain-specific ratings it would not be because these dimen-sions had been made salient.
Results
Even though mean age was higher in the surveysample than in Experiment 1, the pattern of responsefor the category-specific ratings of expertise was similar.The average correlation between pairwise ratings was0.45 in the survey, similar to 0.38 in Experiment 1, andthe correlation between the 28 pairwise correlationsacross the two studies was 0.78 (p , 0.0001). Becauseour analyses are exploratory, we are more interested inpatterns of results than in statistical significance andmainly focus on effect sizes (r-values). It is important tokeep in mind that the test–retest reliabilities for theomnibus questions for several of these categories, asmeasured in Experiment 1, were low. As such we believethat the omnibus question will not suffice as a reliablemeasure of experience in future work.
Accounting for O-EXP using domain-general questions
To what extent can the domain-general questionsaccount for the aggregate O-EXP score used inExperiment 1? Table 3 presents a regression on O-EXPusing all four predictors entered simultaneously as wellas the zero-order correlations (those correlationsamong only the two variables). Both analyses suggestthat the domain-general component in O-EXP may bebest accounted for by subjects’ interest in identifyingobjects (and not their estimate of their ability to do so)and the relevance of this type of activity to their work.
However, we can account for almost as muchvariance in O-EXP using a single predictor that is theaverage of the four domain-general questions (R2
adjusted ¼ 0.14 vs. 0.15 for four predictors). Forsubsequent analyses we use the average of the fourgeneral questions.
Journal of Vision (2014) 14(8):7, 1–12 Gauthier et al. 7
Accounting for O-EXP using category-specific questions
To what extent do the category-specific questionsaccount for the aggregate O-EXP score used inExperiment 1? When we ask specific questions aboutexperience rather than one omnibus question, theanswers are moderately correlated across categories(between 0.2 and 0.5; Table 4). Moreover, the averagefor each of these questions across categories correlatesmoderately with O-EXP (between 0.4 and 0.7), which isnumerically higher in all cases than the correlation withthe average of the domain-general questions (between0.1 and 0.3; see Table 4).
A multiple regression on O-EXP using six simulta-neously entered predictors (the average across catego-ries for each question) accounted for 55% of thevariance, with all the predictors significant except forvisual memory. A stepwise regression adding theaverage of the domain-general questions to this modelaccounted for only an additional 4% of the variance(although it was significant).
Thus, to the extent that O-EXP can be explained bydomain-general factors, those factors may be betterexpressed by an aggregate of different dimensions ofexperience for the categories we happened to use thanby domain-general ratings. Caveats include the factthat we may have better sampled dimensions ofexperience with our six domain-specific questionsrelative to our four domain-general questions and thateach index of a dimension of experience acrosscategories already benefits from aggregating over eightdifferent measurements.
Accounting for category-specific self-ratings ofexperience
To what extent do the six specific dimensions and theaverage of the four domain-general questions accountfor variance in the category-specific rating questionsused in Experiment 1 for each category?
The zero-order correlations for the questions arepresented in Table 5 (in descending order of theiraverage correlation) and suggest that each of thesefactors shares nonnegligible variance with the self-rating questions used in Experiment 1, including theaverage of the domain-general ratings, although itproduced the lowest correlations. These results providevalidity to the omnibus self-rating questions: They doappear to tap into a number of dimensions ofexperience with objects.
Table 6 shows the results of multiple regressions (onefor each category, with questions shown in descendingorder of their average correlations) in which allcategory-specific predictors and the general averagewere entered simultaneously to predict each of thecategory-specific self-ratings.
Interestingly, some of the predictors provide limitedunique variance accounting for the self-ratings. Inparticular, the question about visual memory was not asignificant predictor for any of the categories, consis-tent with self-ratings in Experiment 1 not being strongpredictors of VET performance. In contrast, self-reports of verbal knowledge accounted for uniquevariance for most categories (seven out of eight) and isa candidate for the dimension that was expressed byaggregation in Experiment 1. It would be interesting tomeasure verbal knowledge in specific domains, ratherthan self-report, to estimate experience. Also interest-ing is the finding that the average of the domain-generalquestions produced a significant partial correlation forfive of the categories. Domain-general information isanother candidate for a common factor that isexpressed by aggregation.
The results suggest that even though the omnibusself-rating question in Experiment 1 was phrased thesame way for all categories, people may attend todifferent aspects of their experience depending on thecategory. For instance, frequency of looking at images(question five) provided the most unique variance for
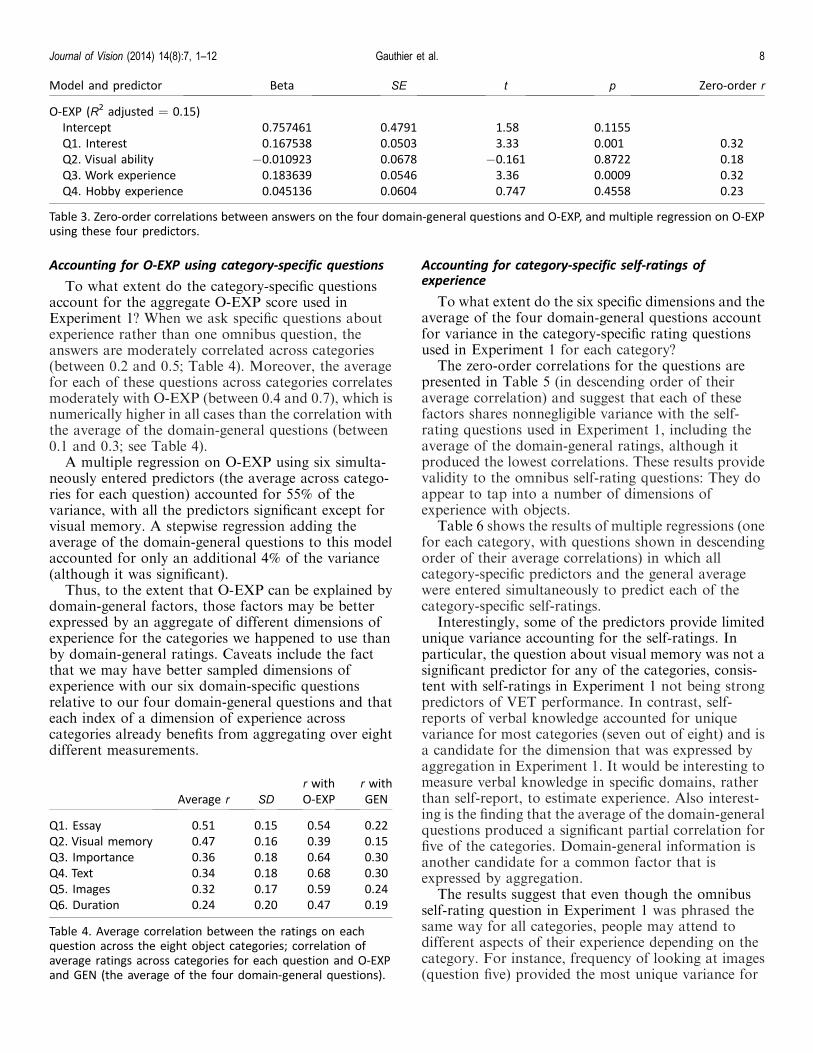
Model and predictor Beta SE t p Zero-order r
O-EXP (R2 adjusted ¼ 0.15)
Intercept 0.757461 0.4791 1.58 0.1155
Q1. Interest 0.167538 0.0503 3.33 0.001 0.32
Q2. Visual ability �0.010923 0.0678 �0.161 0.8722 0.18
Q3. Work experience 0.183639 0.0546 3.36 0.0009 0.32
Q4. Hobby experience 0.045136 0.0604 0.747 0.4558 0.23
Table 3. Zero-order correlations between answers on the four domain-general questions and O-EXP, and multiple regression on O-EXPusing these four predictors.
Average r SD
r with
O-EXP
r with
GEN
Q1. Essay 0.51 0.15 0.54 0.22
Q2. Visual memory 0.47 0.16 0.39 0.15
Q3. Importance 0.36 0.18 0.64 0.30
Q4. Text 0.34 0.18 0.68 0.30
Q5. Images 0.32 0.17 0.59 0.24
Q6. Duration 0.24 0.20 0.47 0.19
Table 4. Average correlation between the ratings on eachquestion across the eight object categories; correlation ofaverage ratings across categories for each question and O-EXPand GEN (the average of the four domain-general questions).
Journal of Vision (2014) 14(8):7, 1–12 Gauthier et al. 8
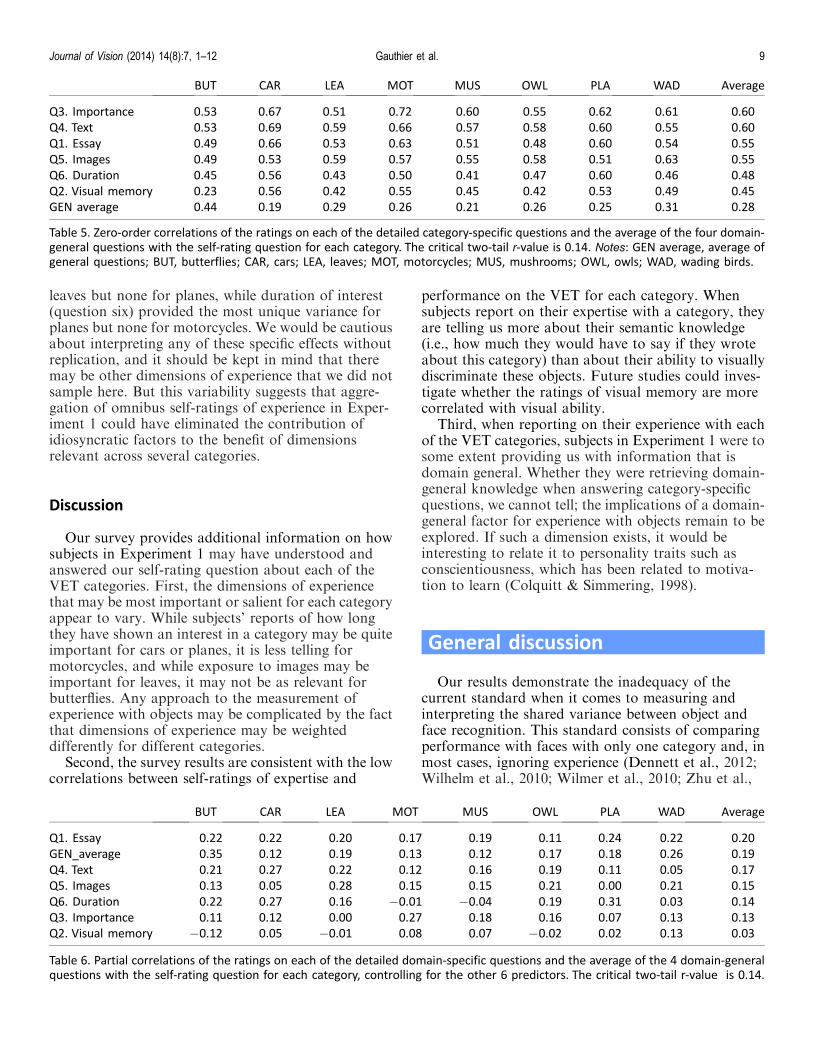
leaves but none for planes, while duration of interest(question six) provided the most unique variance forplanes but none for motorcycles. We would be cautiousabout interpreting any of these specific effects withoutreplication, and it should be kept in mind that theremay be other dimensions of experience that we did notsample here. But this variability suggests that aggre-gation of omnibus self-ratings of experience in Exper-iment 1 could have eliminated the contribution ofidiosyncratic factors to the benefit of dimensionsrelevant across several categories.
Discussion
Our survey provides additional information on howsubjects in Experiment 1 may have understood andanswered our self-rating question about each of theVET categories. First, the dimensions of experiencethat may be most important or salient for each categoryappear to vary. While subjects’ reports of how longthey have shown an interest in a category may be quiteimportant for cars or planes, it is less telling formotorcycles, and while exposure to images may beimportant for leaves, it may not be as relevant forbutterflies. Any approach to the measurement ofexperience with objects may be complicated by the factthat dimensions of experience may be weighteddifferently for different categories.
Second, the survey results are consistent with the lowcorrelations between self-ratings of expertise and
performance on the VET for each category. Whensubjects report on their expertise with a category, theyare telling us more about their semantic knowledge(i.e., how much they would have to say if they wroteabout this category) than about their ability to visuallydiscriminate these objects. Future studies could inves-tigate whether the ratings of visual memory are morecorrelated with visual ability.
Third, when reporting on their experience with eachof the VET categories, subjects in Experiment 1 were tosome extent providing us with information that isdomain general. Whether they were retrieving domain-general knowledge when answering category-specificquestions, we cannot tell; the implications of a domain-general factor for experience with objects remain to beexplored. If such a dimension exists, it would beinteresting to relate it to personality traits such asconscientiousness, which has been related to motiva-tion to learn (Colquitt & Simmering, 1998).
General discussion
Our results demonstrate the inadequacy of thecurrent standard when it comes to measuring andinterpreting the shared variance between object andface recognition. This standard consists of comparingperformance with faces with only one category and, inmost cases, ignoring experience (Dennett et al., 2012;Wilhelm et al., 2010; Wilmer et al., 2010; Zhu et al.,
BUT CAR LEA MOT MUS OWL PLA WAD Average
Q3. Importance 0.53 0.67 0.51 0.72 0.60 0.55 0.62 0.61 0.60
Q4. Text 0.53 0.69 0.59 0.66 0.57 0.58 0.60 0.55 0.60
Q1. Essay 0.49 0.66 0.53 0.63 0.51 0.48 0.60 0.54 0.55
Q5. Images 0.49 0.53 0.59 0.57 0.55 0.58 0.51 0.63 0.55
Q6. Duration 0.45 0.56 0.43 0.50 0.41 0.47 0.60 0.46 0.48
Q2. Visual memory 0.23 0.56 0.42 0.55 0.45 0.42 0.53 0.49 0.45
GEN average 0.44 0.19 0.29 0.26 0.21 0.26 0.25 0.31 0.28
Table 5. Zero-order correlations of the ratings on each of the detailed category-specific questions and the average of the four domain-general questions with the self-rating question for each category. The critical two-tail r-value is 0.14. Notes: GEN average, average ofgeneral questions; BUT, butterflies; CAR, cars; LEA, leaves; MOT, motorcycles; MUS, mushrooms; OWL, owls; WAD, wading birds.
BUT CAR LEA MOT MUS OWL PLA WAD Average
Q1. Essay 0.22 0.22 0.20 0.17 0.19 0.11 0.24 0.22 0.20
GEN_average 0.35 0.12 0.19 0.13 0.12 0.17 0.18 0.26 0.19
Q4. Text 0.21 0.27 0.22 0.12 0.16 0.19 0.11 0.05 0.17
Q5. Images 0.13 0.05 0.28 0.15 0.15 0.21 0.00 0.21 0.15
Q6. Duration 0.22 0.27 0.16 �0.01 �0.04 0.19 0.31 0.03 0.14
Q3. Importance 0.11 0.12 0.00 0.27 0.18 0.16 0.07 0.13 0.13
Q2. Visual memory �0.12 0.05 �0.01 0.08 0.07 �0.02 0.02 0.13 0.03
Table 6. Partial correlations of the ratings on each of the detailed domain-specific questions and the average of the 4 domain-generalquestions with the self-rating question for each category, controlling for the other 6 predictors. The critical two-tail r-value is 0.14.
Journal of Vision (2014) 14(8):7, 1–12 Gauthier et al. 9
2010). Using more than a single object category iscritical for putting the magnitude of the relationshipbetween face and object measures in perspective;indeed, we find that performance for different objectcategories also shares limited variance. Such moderatecorrelations (;0.3–0.4 between any two categories)seem to simply reflect variance associated with specificcategories.
It would seem misguided to try to provide a singlenumber for the shared variance between face andnonface object recognition if this value depends onexperience. Over what range of experience should it beestimated? We found that experience with objectspredicted neither face nor object recognition butmoderated their relationship: Performance in objectrecognition was increasingly more similar to facerecognition with increasing experience. Here, this effectdepended on aggregation over several object categories.Future work should explore if the effect can beobtained with single categories given (1) direct mea-sures of domain-general experience, (2) better measuresof specific dimensions of category-specific experiencesuch as that which could be estimated using verbalknowledge, or (3) a much larger sample size (Wang etal., submitted).
Our results do not definitively point to a singleability underlying object and face recognition. Therecould be two distinct abilities that contribute to bothCFMT and VET measures, but this appears unlikelybecause CFMT scores organize around a large primarysource of variance (Cho et al., submitted). The morecautious interpretation at this time is that there is nomore evidence for a face-specific ability than there is fora butterfly-specific or plane-specific ability. But if theability to individuate faces and objects reflects acommon ability that underlies the acquisition ofperceptual knowledge for any visual category, it may beexpected to have a common neural substrate. Ourresults are consistent with high-resolution fMRI resultsrevealing overlap of object and face representations incar and plane experts (McGugin, Gatenby et al., 2012).When expertise is ignored, the face-selective fusiformface area (FFA; Kanwisher, McDermott, & Chun,1997) shows reliable activity only to faces. But whenperformance for cars or planes is considered, thelocation of the expertise effect for cars and planes in thefusiform gyrus cannot be spatially distinguished fromface selectivity, even at high resolution.
However, expertise effects in fMRI studies (Bilalic,Langner, Ulrich, & Grodd, 2011; Gauthier et al., 2000;Harley et al., 2009; McGugin, Gatenby et al., 2012; Xu,2005) rely on performance with a category, withoutconsideration for the interaction between experienceand ability in accounting for such performance. A meta-analysis of the relationship between car expertise andthe selective response to cars in the FFA across all
published studies (Gauthier et al., 2000; Gauthier &Curby, 2005; Gauthier, Curby, Skudlarski, & Epstein,2005; Harel, Gilaie-Dotan, Malach, & Bentin, 2010;McGugin, Gatenby et al., 2012; McGugin, Richler etal., 2012; Van Gulick et al., 2012; Xu, 2005) shows therelationship to be r¼ 0.54, 95% CI [0.40, 0.65],suggesting that only about 25% of the variance isaccounted for. Measuring experience independently ofperformance may help account for more of theindividual differences in brain activity. In addition,experience likely has a larger range than observed here.In many domains that include a perceptual component,experts refine their skills over many years (Ericsson &Lehmann, 1996) up to levels of performance higher thanwe were able to capture in the current sample. Efforts insampling a greater range of experience should improvethe measurement of object recognition abilities.
Our results may have implications for the interpre-tation of the high heritability measured for facerecognition ability. In Wilmer et al. (2010), the strongcorrelation for performance on the CFMT in mono-zygotic twin pairs (r162¼0.70) was more than twice thatfor dizygotic twin pairs (r123¼ 0.29) (see also Zhu et al.,2010), with at least 68% of variability in facerecognition explained by genetic factors. Such resultshave spurred the beginnings of a search for genes thatdetermine the response of the FFA (Brown et al., 2012).The definition and measurement of this behavioralphenotype should be refined to account for thecommon variance between face and object recognitionas a function of experience. Our results also dramat-ically expand the areas of human activity for which thisheritable ability is relevant.
Coda
Ever since we started working with real-worldexpertise, we have asked people to rate their experiencein a domain, only to conclude that such self-ratingshave little use since people seem to be unable to predicttheir performance (McGugin, Gatenby et al., 2012;McGugin, Richler et al., 2012). It turns out we shouldhave listened better, as they were providing us with veryuseful information about their experience, and experi-ence is what allows a domain-general ability to becomeexpressed in category-specific performance.
Keywords: individual differences, experience, visualperception
Acknowledgments
We thank Brad Duchaine for sharing the CFMT,Lisa Weinberg for assistance with data collection, and
Journal of Vision (2014) 14(8):7, 1–12 Gauthier et al. 10
Randolph Blake and Tim Curran for comments. Thiswork was supported by the NSF (Grant SBE-0542013),VVRC (Grant P30-EY008126), and NEI (Grant R01EY013441-06A2). Data are available from the firstauthor upon request.
Commercial relationships: none.Corresponding author: Isabel Gauthier.Email: [email protected]: Department of Psychology, Vanderbilt Uni-versity, Nashville, TN, USA.
Footnote
1While the data were not collected to test themediating role of experience, the analyses wereperformed to test this hypothesis, using the largestavailable data set at the time.
References
Barton, J. J. S., Hanif, H., & Ashraf, S. (2009).Relating visual to verbal semantic knowledge: Theevaluation of object recognition in prosopagnosia.Brain, 132(12), 3456–3466, doi:10.1093/brain/awp252.
Bilalic, M., Langner, R., Ulrich, R., & Grodd, W.(2011). Many faces of expertise: Fusiform face areain chess experts and novices. Journal of Neurosci-ence, 31(28), 10206–10214, doi:10.1523/JNEUROSCI.5727-10.2011.
Bowles, D. C., McKone, E., Dawel, A., Duchaine, B.,Palermo, R., Schmalzl, L., et al. (2009). Diagnosingprosopagnosia: Effects of ageing, sex, and subject-stimulus ethnic match on the Cambridge FaceMemory Test and Cambridge Face PerceptionTest. Cognitive Neuropsychology, 26(5), 423–455,doi:10.1080/02643290903343149.
Brown, A. A., Jensen, J., Nikolova, Y. S., Djurovic, S.,Agartz, I., Server, A., et al. (2012). Genetic variantsaffecting the neural processing of human facialexpressions: Evidence using a genome-wide func-tional imaging approach. Translational Psychiatry,2(7), e143, doi:10.1038/tp.2012.67.
Cho, S. J., Wilmer, J., Herzmann, G., McGugin, R. N.,Fiset, D., Van Gulick, A. E., & Ryan, K.(submitted). Item response theory analyses of theCambridge Face Memory Test (CFMT).
Colquitt, J. A., & Simmering, M. J. (1998). Conscien-tiousness, goal orientation, and motivation to learnduring the learning process: A longitudinal study.Journal of Applied Psychology, 83(4), 654–665.
Curby, K. M., Glazek, K., & Gauthier, I. (2009). Avisual short-term memory advantage for objects ofexpertise. Journal of Experimental Psychology:Human Perception and Performance, 35(1), 94–107,doi:10.1037/0096-1523.35.1.94.
Davis, J. M., McKone, E., Dennett, H., O’Connor, K.B., O’Kearney, R., & Palermo, R. (2011). Individ-ual differences in the ability to recognise facialidentity are associated with social anxiety. PLoSONE, 6(12), e28800, doi:10.1371/journal.pone.0028800.
Dennett, H. W., McKone, E., Edwards, M., & Susilo,T. (2012). Face aftereffects predict individualdifferences in face recognition ability. PsychologicalScience, 23(11), 1279–1287, doi:10.1177/0956797612446350.
Dennett, H. W., McKone, E., Tavashmi, R., Hall, A.,Pidcock, M., Edwards, M., et al. (2011). TheCambridge Car Memory Test: A task matched informat to the Cambridge Face Memory Test, withnorms, reliability, sex differences, dissociationsfrom face memory, and expertise effects. BehaviorResearch Methods, 44(2), 587–605, doi:10.3758/s13428-011-0160-2.
Duchaine, B., & Nakayama, K. (2006). The CambridgeFace Memory Test: Results for neurologicallyintact individuals and an investigation of its validityusing inverted face stimuli and prosopagnosicsubjects. Neuropsychologia, 44(4), 576–585, doi:10.1016/j.neuropsychologia.2005.07.001.
Engle, R. W., Tuholski, S. W., Laughlin, J. E., &Conway, A. R. (1999). Working memory, short-term memory, and general fluid intelligence: Alatent-variable approach. Journal of ExperimentalPsychology: General, 128(3), 309–331.
Ericsson, K. A., & Lehmann, A. C. (1996). Expert andexceptional performance: Evidence of maximaladaptation to task constraints. Annual Review ofPsychology, 47, 273–305.
Gauthier, I., & Curby, K. M. (2005). A perceptualtraffic-jam on Highway N170: Interference betweenface and car expertise. Current Directions inPsychological Science, 14(1), 30–33.
Gauthier, I., Curby, K. M., Skudlarski, P., & Epstein,R. (2005). Individual differences in FFA activitysuggest independent processing at different spatialscales. Cognitive, Affective, and Behavioral Neuro-science, 5(2), 222–234.
Gauthier, I., Curran, T., Curby, K. M., & Collins, D.(2003). Perceptual interference supports a non-modular account of face processing. Nature Neu-roscience, 6(4), 428–432, doi:10.1038/nn1029.
Gauthier, I., Skudlarski, P., Gore, J. C., & Anderson,A. W. (2000). Expertise for cars and birds recruits
Journal of Vision (2014) 14(8):7, 1–12 Gauthier et al. 11
brain areas involved in face recognition. NatureNeuroscience, 3(2), 191–197, doi:10.1038/72140.
Gauthier, I., & Tarr, M. J. (2002). Unravelingmechanisms for expert object recognition: Bridgingbrain activity and behavior. Journal of Experimen-tal Psychology: Human Perception and Perfor-mance, 28(2), 431–446.
Germine, L. T., Duchaine, B., & Nakayama, K. (2011).Where cognitive development and aging meet: Facelearning ability peaks after age 30. Cognition,118(2), 201–210, doi:10.1016/j.cognition.2010.11.002.
Harel, A., Gilaie-Dotan, S., Malach, R., & Bentin, S.(2010). Top-down engagement modulates the neu-ral expressions of visual expertise. Cerebral Cortex,20(10), 2304–2318, doi:10.1093/cercor/bhp316.
Harley, E. M., Pope, W. B., Villablanca, J. P.,Mumford, J., Suh, R., Mazziotta, J. C., et al.(2009). Engagement of fusiform cortex and disen-gagement of lateral occipital cortex in the acquisi-tion of radiological expertise. Cerebral Cortex,19(11), 2746–2754, doi:10.1093/cercor/bhp051.
Harris, P. A., Taylor, R., Thielke, R., Payne, J.,Gonzalez, N., & Conde, J. G. (2009). Researchelectronic data capture (REDCap)—A metadata-driven methodology and workflow process forproviding translational research information sup-port. Journal of Biomedical Informatics, 42(2), 377–381.
Kanwisher, N., McDermott, J., & Chun, M. M. (1997).The fusiform face area: A module in humanextrastriate cortex specialized for face perception.Journal of Neuroscience, 17(11), 4302–4311.
McGugin, R. W., Gatenby, C., Gore, J., & Gauthier, I.(2012). High-resolution imaging of expertise revealsreliable object selectivity in the FFA related toperceptual performance. Proceedings of the Na-tional Academy of Sciences, USA, 109(42), 17063–17068.
McGugin, R. W., McKeeff, T. J., Tong, F., &Gauthier, I. (2010). Irrelevant objects of expertisecompete with faces during visual search. Attention,Perception, and Psychophysics, 73(2), 309–317, doi:10.3758/s13414-010-0006-5.
McGugin, R. W., Richler, J. J., Herzmann, G., Speegle,M., & Gauthier, I. (2012). The Vanderbilt ExpertiseTest reveals domain-general and domain-specificsex effects in object recognition. Vision Research,69, 10–22, doi:10.1016/j.visres.2012.07.014.
McGugin, R. W., Van Gulick, A. E., Tamber-Rosenau,B. J., Ross, D. A., & Gauthier, I. (in press).Expertise effects in face-selective areas are robust to
clutter and diverted attention, but not to competi-tion. Cerebral Cortex.
Rushton, J. P., Brainerd, C. J., & Pressley, M. (1983).Behavioral development and construct validity:The principle of aggregation. Psychological Bulle-tin, 94(1), 18–38, doi:10.1037/0033-2909.94.1.18.
Russell, R., Duchaine, B., & Nakayama, K. (2009).Super-recognizers: People with extraordinary facerecognition ability. Psychonomic Bulletin and Re-view, 16(2), 252–257, doi:10.3758/PBR.16.2.252.
Spearman, C. (1904). The proof and measurement ofassociation between two things. The AmericanJournal of Psychology, 15(1), 72–101.
Stanovich, K. E., & Cunningham, A. E. (1992).Studying the consequences of literacy within aliterate society: The cognitive correlates of printexposure. Memory and Cognition, 20(1), 51–68.
Van Gulick, A. E., McGugin, R.W., & Gauthier, I.(2012). Expertise effects for non-face objects inFFA are robust to inattention but not competition.Presented at the 2012 Meeting of the Society forNeuroscience, New Orleans, LA.
Wang, P., & Gauthier, I., & Cottrell, G. W. (2014).Experience matters: Modeling the relationshipbetween face and object recognition. In Proceedingsof the 36th Annual Conference of the CognitiveScience Society. Austin, TX: Cognitive ScienceSociety.
Wilhelm, O., Herzmann, G., Kunina, O., Danthiir, V.,Schacht, A., & Sommer, W. (2010). Individualdifferences in perceiving and recognizing faces—One element of social cognition. Journal ofPersonality and Social Psychology, 99(3), 530–548,doi:10.1037/a0019972.
Wilmer, J. B., Germine, L., Chabris, C. F., Chatterjee,G., Williams, M., Loken, E., et al. (2010). Humanface recognition ability is specific and highlyheritable. Proceedings of the National Academy ofSciences, USA, 107(11), 5238–5241.
Xu, Y. (2005). Revisiting the role of the fusiform facearea in visual expertise. Cerebral Cortex, 15(8),1234–1242, doi:10.1093/cercor/bhi006.
Zell, E., & Krizan, Z. (2014). Do people have insightinto their abilities? A metasynthesis. Perspectives onPsychological Science, 9(2), 111–125, doi:10.1177/1745691613518075.
Zhu, Q., Song, Y., Hu, S., Li, X., Tian, M., Zhen, Z., etal. (2010). Heritability of the specific cognitiveability of face perception. Current Biology, 20(2),137–142, doi:10.1016/j.cub.2009.11.067.
Journal of Vision (2014) 14(8):7, 1–12 Gauthier et al. 12