excited state proton transfer and photochromism of an aromatic schiff base. pico- and femtosecond...
TRANSCRIPT
Excited state proton transfer and photochromism of anaromatic Schiff base. Pico- and femtosecond kinetics of the
N,N 0-bis(salicylidene)-p-phenylenediamine (BSP)
Marcin Zi�oołek a, Jacek Kubicki a,*, Andrzej Maciejewski b,c,Ryszard Naskre�cki a, Anna Grabowska d,1
a Quantum Electronics Laboratory, Faculty of Physics, Adam Mickiewicz University, Umultowska 85, 61-614 Poznan, Polandb Photochemistry Laboratory, Faculty of Chemistry, Adam Mickiewicz University,Grunwaldzka 6, 60-780 Poznan, Poland
c Center for Ultrafast Laser Spectroscopy, Adam Mickiewicz University, Umultowska 85, 61-614 Poznan, Polandd Institute of Physical Chemistry, Polish Academy of Sciences, Kasprzaka 44, 01-224 Warsaw, Poland
Received 22 October 2002
Abstract
The results of time-resolved pico- and femtosecond absorption and emission study performed for the title photo-
chromic Schiff base, (BSP) are presented. Transient absorption spectra of intermediates, appearing in the excited state
intramolecular proton transfer (ESIPT) were identified. A full scheme of deactivation of the excited BSP molecule,
including the enol-, keto- and photochromic tautomers, was proposed. In particular, the characteristic time of the
ESIPT process was determined as <50 fs, and the time of the back proton transfer, as 0.5–1.5 ps. The photochromic
transient in its ground state is created from the S1 excited keto-tautomer with the rate constant kK�PC ¼ 2:8� 1010 s�1.
� 2003 Elsevier Science B.V. All rights reserved.
1. Introduction
Modern techniques, like the time-resolved laserspectroscopy, are excellent tools for the study of
fast chemical reactions occurring in nature.
The excited state intramolecular proton transfer
(ESIPT) processes belong to this category [1]. In
most cases, such a reaction follows the cycle:
absorption–proton transfer–emission–back proton
transfer. The last step closes up the cycle, restoring
the initial species, stable in the ground state. Fromamong many examples of molecular systems un-
dergoing the ESIPT reactions [2,3], some aromatic
Schiff bases are particularly interesting. The phe-
nomena of photochromism originating from dif-
ferent reactions have been observed in various
molecular systems. These phenomena attract
nowadays much interest, also from the point of
view of such applications as molecular memoriesand switches [4]. The photophysics and ESIPT re-
action of the Schiff bases involve formation of a
Chemical Physics Letters 369 (2003) 80–89
www.elsevier.com/locate/cplett
* Corresponding author.
E-mail addresses: [email protected] (J. Kubicki), agrab@
ichf.edu.pl (A. Grabowska).1 Also corresponding author.
0009-2614/03/$ - see front matter � 2003 Elsevier Science B.V. All rights reserved.
doi:10.1016/S0009-2614(02)01985-1
metastable �photochromic� version of the primary
structure, absorbing in the visible part of the
spectrum. The phenomena of thermo- and photo-
chromism of aromatic Schiff bases were discovered
already in the beginning of the 20th century and for
many decades attracted much interest [5].The best known photochromic Schiff base is
salicylideneaniline (SA) [6–10]. In the crystal state
the thermochromic properties of SA were reported
[6], while in solution, or theoretically in the isolated
system, its photochromism was widely studied [7–
10]. The molecular mechanisms of the thermo- and
photochromism of SA are essentially the same,
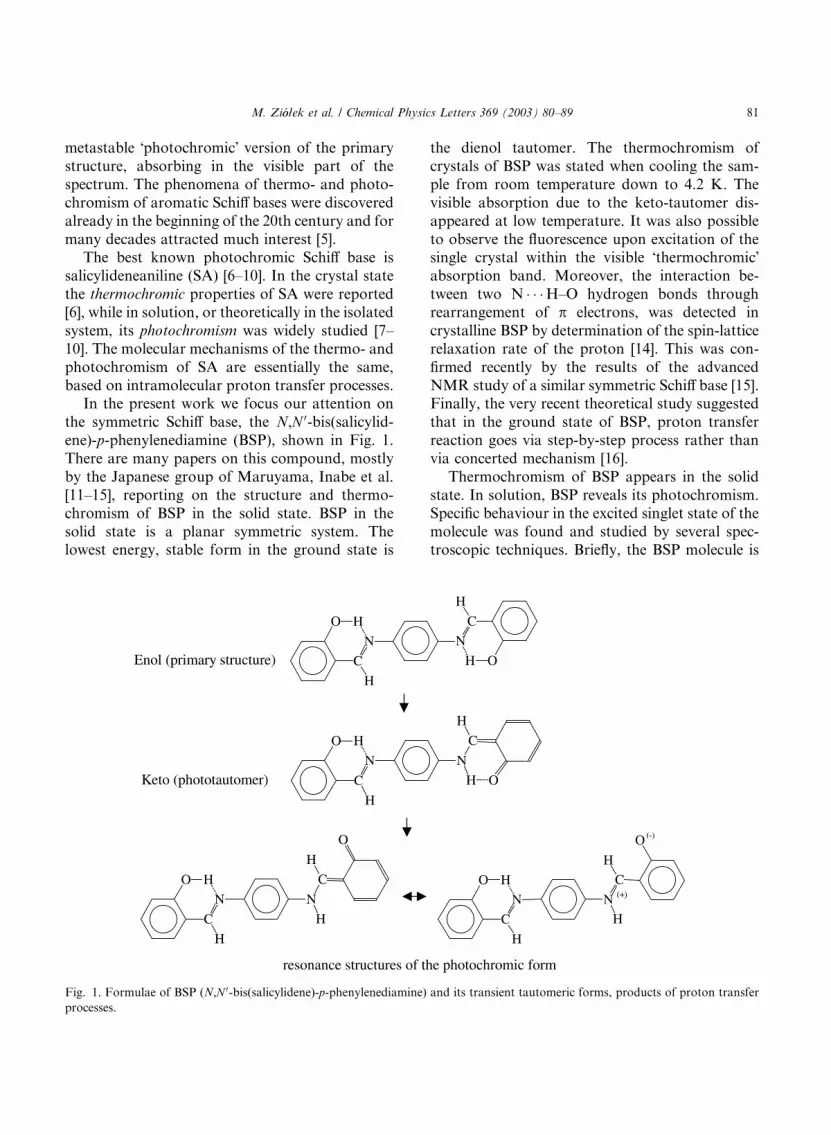
based on intramolecular proton transfer processes.In the present work we focus our attention on
the symmetric Schiff base, the N,N 0-bis(salicylid-
ene)-p-phenylenediamine (BSP), shown in Fig. 1.
There are many papers on this compound, mostly
by the Japanese group of Maruyama, Inabe et al.
[11–15], reporting on the structure and thermo-
chromism of BSP in the solid state. BSP in the
solid state is a planar symmetric system. Thelowest energy, stable form in the ground state is
the dienol tautomer. The thermochromism of
crystals of BSP was stated when cooling the sam-
ple from room temperature down to 4.2 K. The
visible absorption due to the keto-tautomer dis-
appeared at low temperature. It was also possible
to observe the fluorescence upon excitation of thesingle crystal within the visible �thermochromic�absorption band. Moreover, the interaction be-
tween two N � � �H–O hydrogen bonds through
rearrangement of p electrons, was detected in
crystalline BSP by determination of the spin-lattice
relaxation rate of the proton [14]. This was con-
firmed recently by the results of the advanced
NMR study of a similar symmetric Schiff base [15].Finally, the very recent theoretical study suggested
that in the ground state of BSP, proton transfer
reaction goes via step-by-step process rather than
via concerted mechanism [16].
Thermochromism of BSP appears in the solid
state. In solution, BSP reveals its photochromism.
Specific behaviour in the excited singlet state of the
molecule was found and studied by several spec-troscopic techniques. Briefly, the BSP molecule is
Fig. 1. Formulae of BSP (N,N 0-bis(salicylidene)-p-phenylenediamine) and its transient tautomeric forms, products of proton transfer
processes.
M. Zi�oołek et al. / Chemical Physics Letters 369 (2003) 80–89 81
no more planar in solution and its dipole moment
is l ¼ 2:8 D [17]. The two halves of the molecule
are much less coupled than in the solid state due to
the free rotation around the single bonds. BSP was
studied together with a large group of closely
structurally related systems, all of them revealingthe phenomenon of photochromism [17–19] ob-
served as a new absorption band peaking around
20 000 cm�1. In a two-step laser excitation exper-
iment it was possible to detect and separate two
fluorescence bands, one arising from the primary
product of proton transfer (keto-tautomer) in the
excited state, and the other one, from a photo-
chromic transient in the ground state [19]. More-over, several papers [17–20] brought some general
information on the whole family of molecules
closely related to BSP: the ground state absorption
spectra are sensitive to the structure of the ab-
sorbing species (size, more or less extended aro-
matic system, etc.), while the excited state �forgets�its ground state nature. All �spectral responses�,namely the visible absorption bands and bothfluorescences, exhibit the surprisingly constant
spectral positions.
The most general conclusion of the above-quo-
ted papers is that the excitation of all molecules
belonging to the �SA family� is localised on one
salicylidene subunit and consequently, it is the site
of the proton transfer reactivity. Thus, the sym-
metric system such as BSP, upon excitation un-dergoes the single proton transfer, leading to the
excited monoketo-tautomer. This one is eventually
transformed to the photochromic transient (Fig. 1).
The main aim of the present study is to find out
the detailed mechanism and the dynamic infor-
mation about the primary proton transfer
reaction. It means, to test the occurrence of the
father-son relationship between the two tautomerson the level of excited singlet state, and to deter-
mine the rate at which the excited dienol tautomer
is converted to the keto-form. We also wish to
establish the deactivation pathways of the S1-keto
tautomer, and in particular the mechanism and the
yield of formation of the S0-photochromic form of
the molecule. Moreover, we wish to find out which
information can be deduced from the repopulationkinetics of the ground state, concerning in partic-
ular the S0-keto! S0-enol back proton transfer.
2. Experimental and data correction
BSP was given to us by Prof. Y. Maruyama and
Dr. T. Inabe from the Institute for Molecular
Science, Okazaki, Japan. The sample was addi-tionally recrystallized from CHCl3. The concen-
tration of BSP in acetonitrile (ACN) (for
fluorescence, Merck) was 1� 10�4 M.
The stationary UV/VIS absorption spectra were
taken with UV–VIS-550 (Jasco) spectrophotome-
ter. The steady-state fluorescence emission spectra
were recorded with the spectrofluorimeter with
Ti:sapphire laser as an excitation source, whichensured high intensity and sufficiently monochro-
macity of the excitation beam and low level of
scattered light. The fluorescence excitation spectra
were recorded with a modified MPF-3 (Perkin–El-
mer) spectrofluorimeter. The introduced modifica-
tions enabled the single-photon counting detection
and data processing using a dual-photon counting
set (Light-Scan). The spectrofluorimeter wasequipped with a reference quantum counter.
The apparatus (actually the same as in the
steady state emission measurement) used for time-
resolved emission measurements (time correlated
single-photon counting, TCSPC) is already de-
scribed [21,22].
The set-up used for the transient absorption
measurements has been also described in detailearlier [23]. The output of the laser system (fem-
tosecond titanium–sapphire) was set at 1 kHz
repetition rate providing pulses between 80 and 120
fs duration, with the energy up to 1 mJ. The probe
beam passed through an optical delay line con-
sisting of a retroreflector mounted on a computer-
controlled motorised translation stage and then
converted to white light continuum which diameterwas 2–5 times smaller than that of the pump. A
grating polichromator was used in conjunction
with thermoelectrically cooled CCD camera to re-
cord the spectra.
To improve the signal-to-noise ratio the tran-
sient absorption measurements were performed in
two-beam geometry (probe and reference) with two
synchronized choppers in the pump and probepaths, respectively, which allowed substantial
elimination of the influence of the laser beam fluc-
tuations and, consequently, measurements of much
82 M. Zi�oołek et al. / Chemical Physics Letters 369 (2003) 80–89
lower values of the small optical density changes.
With this experimental set-up, the optical density
changes (DOD) can be measured to with an accu-
racy of �0.0005 in the 300–700 nm spectral range.
The thickness of the flowing sample was 2 mm
and the wavelength of the pump beam was 400nm, with the pulse energy of 30 lJ. The measure-
ments were performed at the magic angle of 54.7�between the polarization of the pump and probe
beam. The transient absorption spectra measured
at two BSP concentrations, 1:0� 10�4 and
1:6� 10�4 M, were compared.
All the spectra analysed were corrected for group
velocity dispersion effect (GVD) according to thestandard numerical scheme [24]. The chirp of white
light continuum was obtained by measuring two-
photon absorption (TPA) in a very thin (150 lm)
BK7 glass plate. An additional contribution of
dispersion, due to the front window of the sample
cell, was calculated from the Sellmeier equation. All
fits of the kinetic curves involved the temporal in-
strumental function modified to take into regard thecell thickness and hence the dispersion of the delay
between the pump and the probe (group delay dif-
ference, GDD). The GVD unaffected pump–probe
cross-correlation function was determined based on
the two-photon absorption in BK7; its FWHM is
150 fs. The real instrumental function used for the
convolution with the kinetic exponential functions
was determined separately for each wavelength,according to the theory [25]. In the time range of the
pump–probe overlap, some signals appear assigned
to non-linear interaction between the pure solvent
and the pump pulse [26]. For certain wavelengths
these signals are comparable with the measured BSP
signal. In order to obtain true undisturbed signals
coming only from the compound studied, we also
measured in the same experimental conditions, thesignal from the pure solvent, which was then sub-
tracted from the data collected, as proposed [26].
3. Results
3.1. Stationary absorption and fluorescence
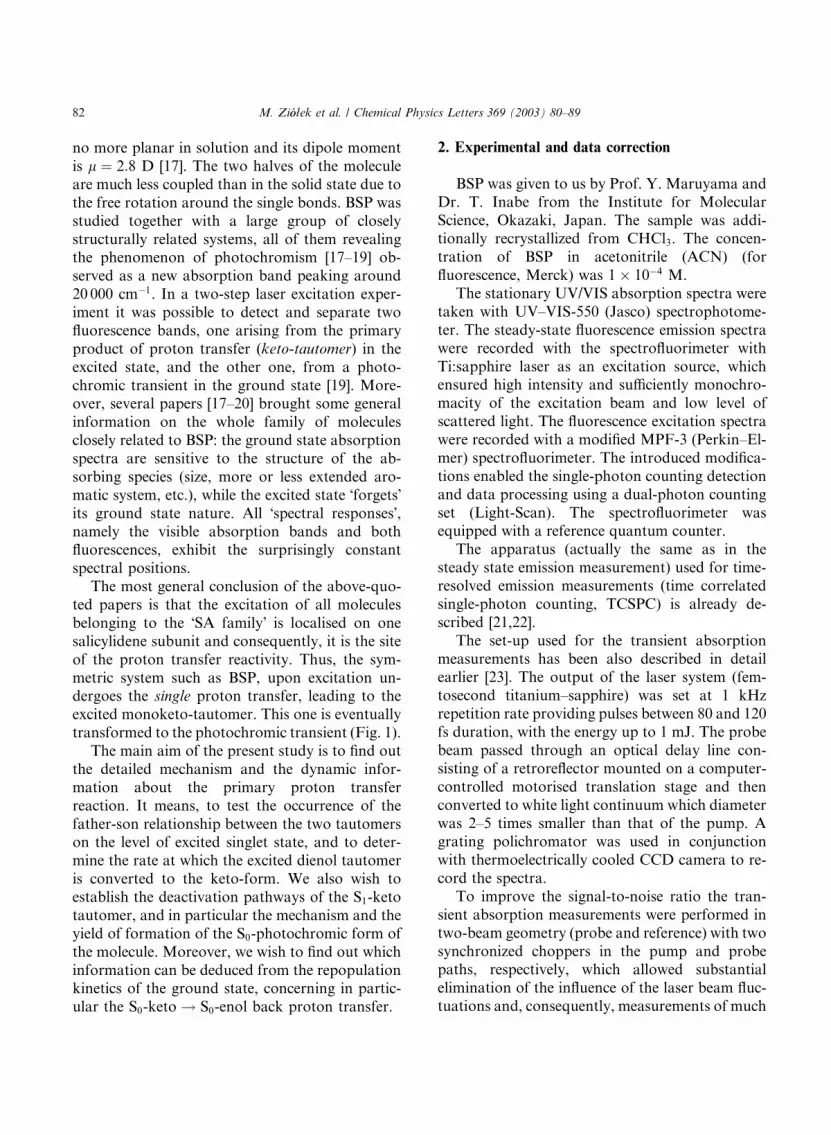
The stationary absorption spectrum of BSP in
ACN is shown in Figs. 2a and b. High sensitivity
of the stationary absorption measurements per-
mitted the observation of a weak long-wavelength
absorption tail with a maximum at �22900 cm�1,
and the extinction coefficient of �300 M�1cm�1
(Fig. 2a). The band should be assigned to the
S1 S0(n, p) absorption of the enol tautomer.The absorption band with a maximum at 27000
cm�1 and the extinction coefficient of 35000M�1
cm�1 should be assigned to the transition S2 S0(p; p). Therefore, in our experiments molecules
are excited to the latter state (kexc ¼ 400 nm).
Fig. 2b presents the emission spectrum cor-
rected for the sensitivity of the detection system.
The dominant signal is the emission from the ketotautomer with a characteristic large Stokes� shift,
(a)
(b)
Fig. 2. (a) Stationary absorption spectrum of BSP in ACN
(c ¼ 10�4 M) with magnified absorption spectrum (in the inset)
allowing a detection of the S1ðn; pÞ state in the long-wave-
length range. (b) BSP in ACN: the absorption, fluorescence,
and its excitation spectra.
M. Zi�oołek et al. / Chemical Physics Letters 369 (2003) 80–89 83
but the short-wavelength emission is also well vis-
ible in the range 20 000–24 000 cm�1. The possi-
bility that the short-wavelength emission might
originate from the solvent or solvent impurities has
been excluded. The total quantum yield of emis-
sion was 1:0� 10�3, while the contribution of theshort-wavelength emission (in the range up to 490
nm) was 2:5� 10�5. Fig. 2b also presents the flu-
orescence excitation spectrum for kem ¼ 570 nm,
which is in very good agreement with the absorp-
tion spectrum. Unfortunately, a too weak signal
made it impossible to measure the emission exci-
tation spectrum in the short-wavelength range, so
that we could not unambiguously identify thisemission. However, using the relation /F ¼ kF � sF
with the value of radiative rate constant
kF ¼ 2:8� 108 s�1 as determined from the Stric-
kler–Berg relation [27] and the lifetime of the ex-
cited state of enol tautomer sF < 50 fs (see below),
the quantum yield of the enol tautomer fluores-
cence was estimated as /F < 1:4� 10�5. Therefore,
it is highly probable that the short-wavelengthemission comes from the excited enol species.
In order to confirm this supposition, dynamic
measurements were performed for a number of kem
in the whole spectral range of emission, using the
TCSPC method. Because of the presence of Ra-
man lines, the measurements were performed for
kem ¼ 434 nm, and then for kem > 465 nm. In the
short-wavelength range of emission, the fluores-cence decay was much shorter than in the long-
wavelength range. The kinetics of the decay for
kem ¼ 434 nm was almost identical to that of the
decay measured for the scattered signal, and the
time of this decay was beyond the temporal reso-
lution of the spectrofluorimeter used (<1 ps). For
the emission wavelengths of 465, 480 and 490 nm,
the FWHM of the measured fluorescence decaygradually increased. The emissions were best fitted
with the two-exponential decay model of the life-
times one below 1 ps and the other 9� 3 ps. With
increasing emission wavelength, the fraction cor-
responding to the short time decreased, so that for
the emission at 500 nm only the mono-exponential
decay with the lifetime of �11� 3 ps was ob-
served. These observations confirm that the short-wavelength emission can be accounted for by
the excited state of the enol species S2ðp; pÞ,
although it cannot be excluded that it can also
originate from the upper vibrational levels of the
excited state S1ðp; pÞ of the keto form.
3.2. Transient absorption
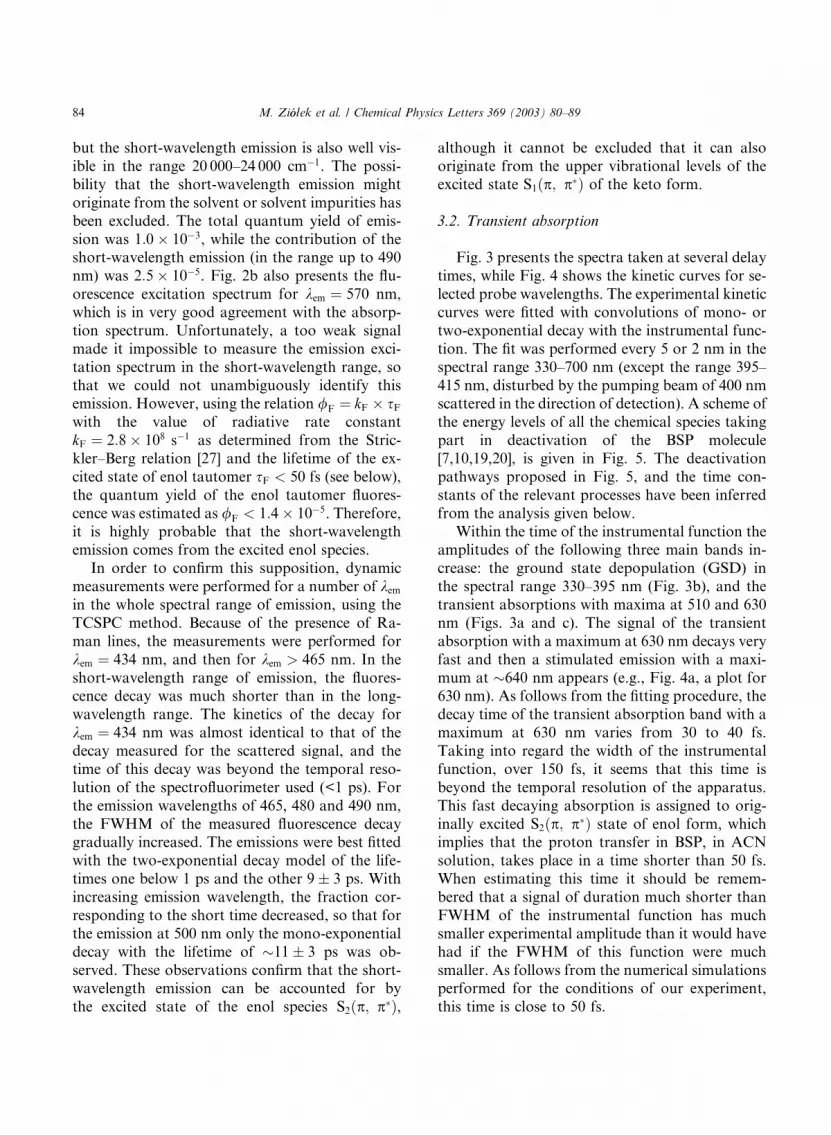
Fig. 3 presents the spectra taken at several delay
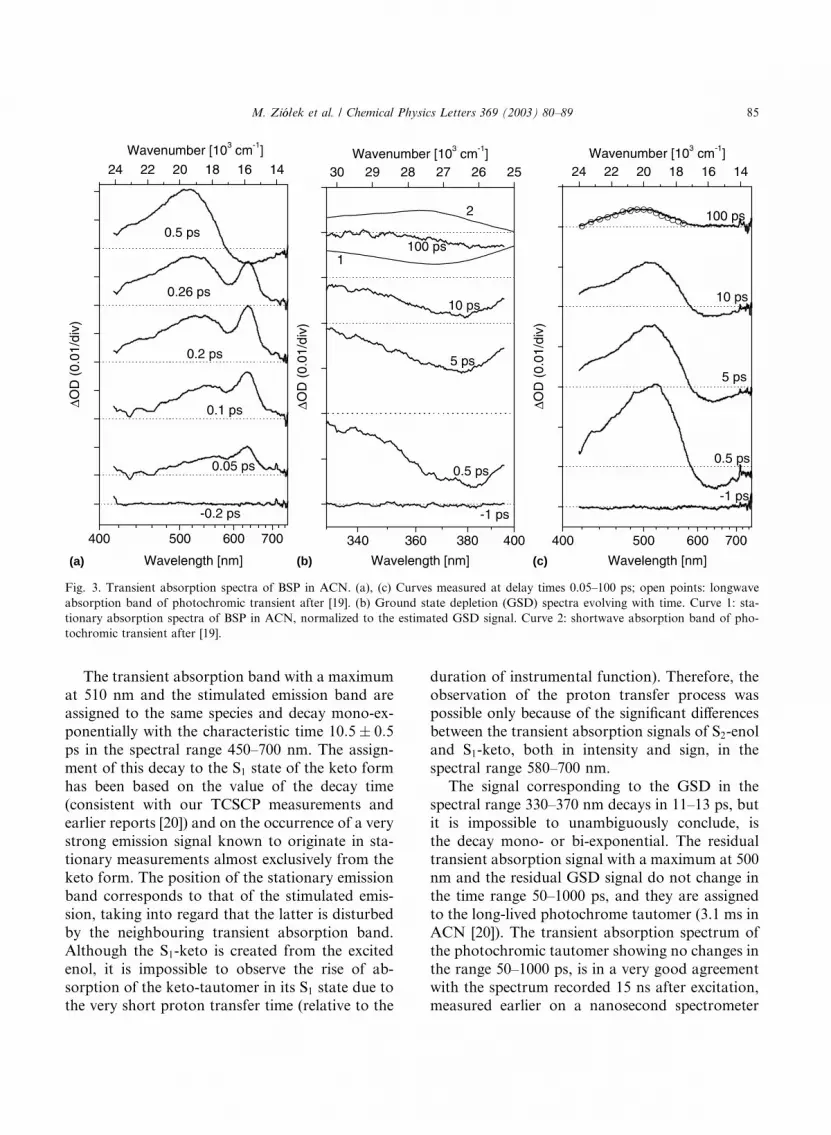
times, while Fig. 4 shows the kinetic curves for se-
lected probe wavelengths. The experimental kinetic
curves were fitted with convolutions of mono- or
two-exponential decay with the instrumental func-
tion. The fit was performed every 5 or 2 nm in the
spectral range 330–700 nm (except the range 395–
415 nm, disturbed by the pumping beam of 400 nmscattered in the direction of detection). A scheme of
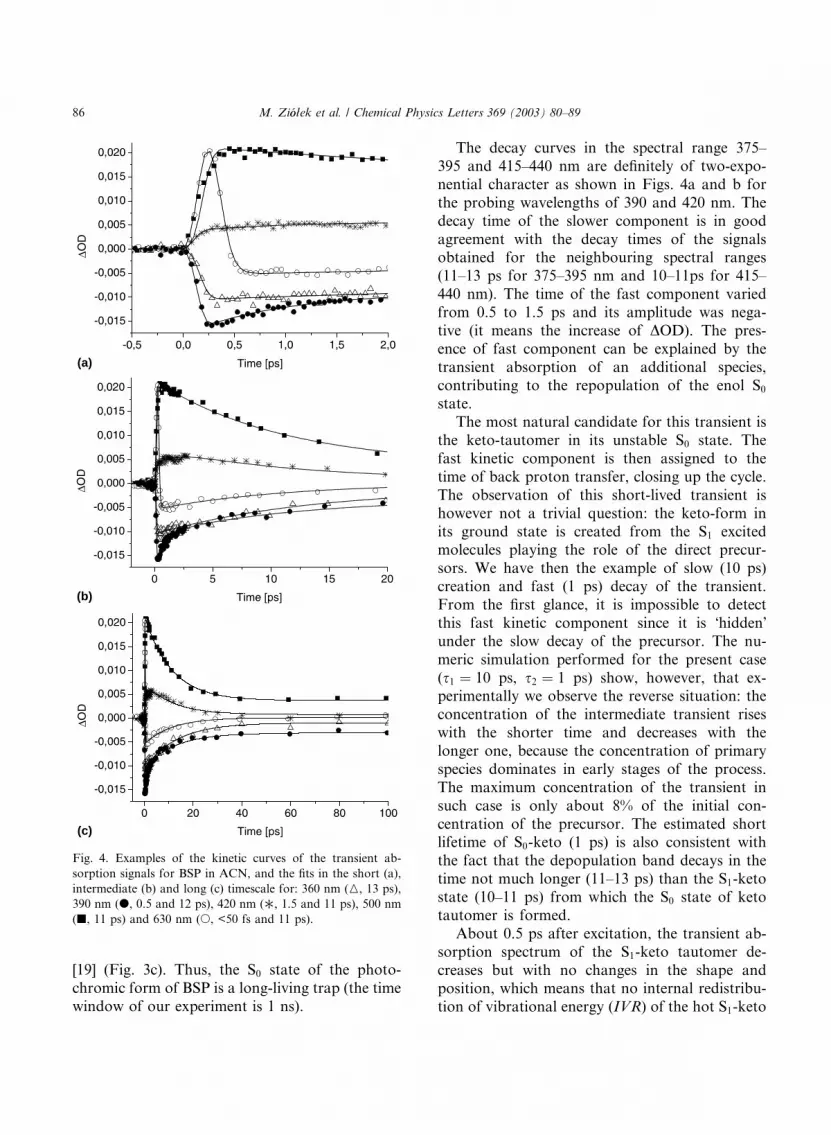
the energy levels of all the chemical species taking
part in deactivation of the BSP molecule
[7,10,19,20], is given in Fig. 5. The deactivation
pathways proposed in Fig. 5, and the time con-
stants of the relevant processes have been inferred
from the analysis given below.
Within the time of the instrumental function theamplitudes of the following three main bands in-
crease: the ground state depopulation (GSD) in
the spectral range 330–395 nm (Fig. 3b), and the
transient absorptions with maxima at 510 and 630
nm (Figs. 3a and c). The signal of the transient
absorption with a maximum at 630 nm decays very
fast and then a stimulated emission with a maxi-
mum at �640 nm appears (e.g., Fig. 4a, a plot for630 nm). As follows from the fitting procedure, the
decay time of the transient absorption band with a
maximum at 630 nm varies from 30 to 40 fs.
Taking into regard the width of the instrumental
function, over 150 fs, it seems that this time is
beyond the temporal resolution of the apparatus.
This fast decaying absorption is assigned to orig-
inally excited S2ðp; pÞ state of enol form, whichimplies that the proton transfer in BSP, in ACN
solution, takes place in a time shorter than 50 fs.
When estimating this time it should be remem-
bered that a signal of duration much shorter than
FWHM of the instrumental function has much
smaller experimental amplitude than it would have
had if the FWHM of this function were much
smaller. As follows from the numerical simulationsperformed for the conditions of our experiment,
this time is close to 50 fs.
84 M. Zi�oołek et al. / Chemical Physics Letters 369 (2003) 80–89
The transient absorption band with a maximum
at 510 nm and the stimulated emission band areassigned to the same species and decay mono-ex-
ponentially with the characteristic time 10:5� 0:5ps in the spectral range 450–700 nm. The assign-
ment of this decay to the S1 state of the keto form
has been based on the value of the decay time
(consistent with our TCSCP measurements and
earlier reports [20]) and on the occurrence of a very
strong emission signal known to originate in sta-tionary measurements almost exclusively from the
keto form. The position of the stationary emission
band corresponds to that of the stimulated emis-
sion, taking into regard that the latter is disturbed
by the neighbouring transient absorption band.
Although the S1-keto is created from the excited
enol, it is impossible to observe the rise of ab-
sorption of the keto-tautomer in its S1 state due tothe very short proton transfer time (relative to the
duration of instrumental function). Therefore, the
observation of the proton transfer process waspossible only because of the significant differences
between the transient absorption signals of S2-enol
and S1-keto, both in intensity and sign, in the
spectral range 580–700 nm.
The signal corresponding to the GSD in the
spectral range 330–370 nm decays in 11–13 ps, but
it is impossible to unambiguously conclude, is
the decay mono- or bi-exponential. The residualtransient absorption signal with a maximum at 500
nm and the residual GSD signal do not change in
the time range 50–1000 ps, and they are assigned
to the long-lived photochrome tautomer (3.1 ms in
ACN [20]). The transient absorption spectrum of
the photochromic tautomer showing no changes in
the range 50–1000 ps, is in a very good agreement
with the spectrum recorded 15 ns after excitation,measured earlier on a nanosecond spectrometer
(a) (b) (c)
Fig. 3. Transient absorption spectra of BSP in ACN. (a), (c) Curves measured at delay times 0.05–100 ps; open points: longwave
absorption band of photochromic transient after [19]. (b) Ground state depletion (GSD) spectra evolving with time. Curve 1: sta-
tionary absorption spectra of BSP in ACN, normalized to the estimated GSD signal. Curve 2: shortwave absorption band of pho-
tochromic transient after [19].
M. Zi�oołek et al. / Chemical Physics Letters 369 (2003) 80–89 85
[19] (Fig. 3c). Thus, the S0 state of the photo-
chromic form of BSP is a long-living trap (the time
window of our experiment is 1 ns).
The decay curves in the spectral range 375–
395 and 415–440 nm are definitely of two-expo-
nential character as shown in Figs. 4a and b for
the probing wavelengths of 390 and 420 nm. The
decay time of the slower component is in good
agreement with the decay times of the signalsobtained for the neighbouring spectral ranges
(11–13 ps for 375–395 nm and 10–11ps for 415–
440 nm). The time of the fast component varied
from 0.5 to 1.5 ps and its amplitude was nega-
tive (it means the increase of DOD). The pres-
ence of fast component can be explained by the
transient absorption of an additional species,
contributing to the repopulation of the enol S0
state.
The most natural candidate for this transient is
the keto-tautomer in its unstable S0 state. The
fast kinetic component is then assigned to the
time of back proton transfer, closing up the cycle.
The observation of this short-lived transient is
however not a trivial question: the keto-form in
its ground state is created from the S1 excitedmolecules playing the role of the direct precur-
sors. We have then the example of slow (10 ps)
creation and fast (1 ps) decay of the transient.
From the first glance, it is impossible to detect
this fast kinetic component since it is �hidden�under the slow decay of the precursor. The nu-
meric simulation performed for the present case
(s1 ¼ 10 ps, s2 ¼ 1 ps) show, however, that ex-perimentally we observe the reverse situation: the
concentration of the intermediate transient rises
with the shorter time and decreases with the
longer one, because the concentration of primary
species dominates in early stages of the process.
The maximum concentration of the transient in
such case is only about 8% of the initial con-
centration of the precursor. The estimated shortlifetime of S0-keto (1 ps) is also consistent with
the fact that the depopulation band decays in the
time not much longer (11–13 ps) than the S1-keto
state (10–11 ps) from which the S0 state of keto
tautomer is formed.
About 0.5 ps after excitation, the transient ab-
sorption spectrum of the S1-keto tautomer de-
creases but with no changes in the shape andposition, which means that no internal redistribu-
tion of vibrational energy (IVR) of the hot S1-keto
(a)
(b)
(c)
Fig. 4. Examples of the kinetic curves of the transient ab-
sorption signals for BSP in ACN, and the fits in the short (a),
intermediate (b) and long (c) timescale for: 360 nm (M, 13 ps),
390 nm (d, 0.5 and 12 ps), 420 nm (, 1.5 and 11 ps), 500 nm
(j, 11 ps) and 630 nm (s, <50 fs and 11 ps).
86 M. Zi�oołek et al. / Chemical Physics Letters 369 (2003) 80–89
form is detected. Manifestations of such changescould appear in shorter times.
To be able to resolve the mechanism studied, it
is important to determine the efficiency of the
process: S1-keto! S0-photochrome. Judging from
the transient absorption, at t ¼ 0:5 ps only S1-
keto, whereas at 100 ps only S0-photochrome is
present. Comparison of the spectra of the GSD at
these times (Fig. 3b) with the stationary absorp-tion spectrum shows that the depopulation spectra
are considerably disturbed by directly not ob-
served transient absorption band at �360 nm,
present in the spectra of both, S1-keto transient
and S0-photochrome. The latter observation is
consistent with the earlier one [19], see Fig. 3b.
From the interpolation of the GSD spectrum to
400 nm (where it is least disturbed) we estimatethat the ratio of the depopulation band intensity at
Dt ¼ 100 ps and at Dt ¼ 0:5 ps is 0.3. This result
leads to the conclusion: about 30% of excited BSP
molecules undergo the transformation from S1
keto-tautomer to photochrome, while the rest,
about 70%, returns directly to the initial form.
Moreover, from the stationary absorption data
and the amplitude ratio of transient absorptionand GSD bands we can estimate the extinction
coefficients of S1 keto-tautomer (at 510 nm) and
S0-photochrome (at 500 nm), which are about
36 000 and 25000 M�1 cm�1, respectively.
4. Discussion
Barbara et al. [7], and after them Mitra and
Tamai [28] stated that photochromic tautomer in
the S0 state of the model molecule, SA (salicy-
lideneaniline) is formed from highly vibrationally
excited S1-keto state. We were not able to verify
this hypothesis for the case of BSP relaxation,because the transient absorption spectra of S0-
photochrome and S1-keto tautomer are very sim-
ilar. In contrast, it seems more probable that the
photochrome of BSP is populated mostly from the
relaxed S1-keto state.
Very fast ESIPT is in agreement with recent
literature reports for similar systems [1,28–35]. The
times of 60 fs and shorter were observed forMS (methyl salicylate) (60 fs) [29], HBT (2-
(20-hydroxyphenyl)-benzothiazole) (60 fs) [31],
HBO (2-(20-hydroxyphenyl)-benzoxazole) (60� 30
fs) [34] and the TIN (2-(20-hydroxy-50-methylphe-
nyl)-benzotriazole) derivative, (TINSi) (50� 20 fs)
[35]. Slightly longer times were observed for 2,5-
bis(20-benzoxazolyl)-hydroquinone (BBHQ, 110
fs) [30], TIN (100 fs) [32], 3-hydroxyflavone (240fs) [33] and SA (210 and 380 fs, depending on the
solvent) [28]. In all these systems but MS the pro-
ton is transferred from the oxygen atom to the
nitrogen atom, two heavy atoms engaged in the
intramolecular hydrogen bond.
Fig. 5. A proposed scheme of deactivation of the BSP molecule in ACN. The indices at the rate constants (k) denote the species
involved in a given transition (E – enol, K – keto, PC – photochrome).
M. Zi�oołek et al. / Chemical Physics Letters 369 (2003) 80–89 87
There is no general mechanism of ESIPT
process in polyatomic molecules. Each particular
system has its own specific structural limitations.
By intuition, the simplest mechanism would be
the O–H stretching vibration, which provides a
pure displacement of the proton towards the ac-ceptor group [1]. The frequency of this vibration
(3500 cm�1) implies that the proton transfer time
should be about 10 fs, what is much shorter than
the results of experimental observations reported
so far.
It is nowadays generally accepted (e.g., [28–35])
that the ESIPT reaction needs the contribution of
high and low frequency vibrations operating viathe strong anharmonic coupling; the reaction co-
ordinates involve the high frequency stretch, OH
vibration, and the slow skeletal motion of much
lower frequency. The spectacular example is pro-
vided by the recent paper [30] on BBHQ: the in-
tramolecular proton transfer reaction occurs with
a characteristic time of 110 fs which corresponds
to the half-cycle of the in plane chelate skeletonbending vibration of 118 cm�1.
Taking into regard the long lifetime of the
photochrome transient (3.1 ms) the repopulation
of the enol ground state (observed in the GSD
band) can occur from the S0-keto and/or S1(n, p)enol state. A significant contribution of the latter
should be rejected for a few reasons. First of all, if
the S2 � enol! S1-enol transition occurred with asignificant yield, this process would have to com-
pete with this of proton transfer. Thus, its rate
constant would have to be higher than 1013 s�1,
what seems to be rather improbable. Secondly, the
S1-keto state would then be formed with a yield
much lower than 1. However, in view of the fact
that the observed S1-keto absorption band is rel-
atively strong, it would imply that its molar ab-sorption coefficient was exceptionally high, which
also seems very unlikely.
Most probably, the bi-exponential kinetic
curves observed in the spectral ranges 375–395 nm
and 415–440 nm can be treated as a manifestation
of the presence of keto-tautomeric molecules in
their S0 (unstable) states.
To the best of our knowledge there are noliterature data on the S0-keto state of BSP, and
other aromatic Schiff bases. For other molecules
of similar structure, the lifetimes of the S0-keto
forms are close to the value reported in this work
(600 fs for TIN [32] and 500 fs for TINSi [35]).
However, for these systems the observation of
this state was easier because of a much higher
concentration of the S0-keto related to an ex-ceptionally short lifetime of the S1-keto (less than
200 fs).
In our work we report on the example of ESIPT
reaction belonging to the fastest processes of this
category and exhibiting complex and rich reactiv-
ity. Besides the simple proton transfer cycle, in
BSP and other photochromic Schiff bases, the new
channel is open: creation of photochromic longliving transient.
Having considered all species and transients
possibly appearing upon excitation of the BSP-
enol to its S2 state, it seems that the pathways of
deactivation of this molecule proposed in Fig. 5
are correct.
5. Conclusions
A full scheme of deactivation of the BSP
molecule in ACN as a model was determined
based on the time-resolved transient absorption
and emission measurements on the pico- and
femtosecond timescale in the visible and in the
near UV range. The excitation to the S2(p; p)enol state (the transient absorption maximum at
630 nm) is followed by a very fast (<50 fs) proton
transfer leading to formation of the S1 state of
keto-tautomer with a lifetime of 10.5 ps. It is
characterised by the stimulated emission and by
the absorption band with maximum at 510 nm.
Then about 30% of the molecules undergo a
transition to the long-lived (ms) ground state ofthe photochrome (whose absorption spectrum is
very similar to that of the S1-keto state) formed
as a result of cis–trans tautomerization of the
transient keto species. The majority of the mole-
cules deactivate to the initial enol ground state
via the S0-keto state. The short-lived transient
(0.5–1.5 ps) contributing to repopulation of the
primary enol tautomer is also detected andassigned to the (unstable) ground state of the
keto-tautomer.
88 M. Zi�oołek et al. / Chemical Physics Letters 369 (2003) 80–89
Acknowledgements
This work was done under financial support of
the KBN (State Committee for Scientific Re-
search) project 2 P03B 040 22 and 4 T09A 166 24.Dynamics studies were performed at the Centre
for Ultrafast Laser Spectroscopy at the University
of A. Mickiewicz in Poznan. M. Ziolek is a holder
of a grant from the Foundation for Polish Sci-
ence(FNP) in the year 2002.
References
[1] T. Elsaesser, in: J. Manz, L. W€ooste (Eds.), Femtosecond
Chemistry, VCH, Weinheim, 1995, p. 563.
[2] A. Weller, Z. Elektrochem. 60 (1956) 1144.
[3] C.A. Taylor, M.A. El-Bayoumi, M. Kasha, Proc. Natl.
Acad. Sci. 63 (1969) 253.
[4] Chem. Reviews 100 (2000) #5; special issue on �Photo-
chromism: Memories and Switches�.[5] E. Hadjoudis, in: H. D€uurr, H. Bouas-Laurent (Eds.),
Photochromism: Molecules and Systems, Elsevier, Amster-
dam, 1990, p. 685.
[6] M.D. Cohen, G.M. Schmidt, S.J. Flavian, J. Chem. Soc.
(1964) 2041.
[7] P.F. Barbara, P.M. Rentzepis, L.E. Brus, J. Am. Chem.
Soc. 102 (1980) 2786.
[8] D. Higelin, H. Sixl, Chem. Phys. 77 (1983) 391.
[9] W. Turbeville, P.K. Dutta, J. Phys. Chem. 94 (1990) 4060.
[10] M.Z. Zgierski, A. Grabowska, J. Chem. Phys. 112 (2000)
6329, and the references therein.
[11] N. Hoshino, T. Inabe, T. Mitani, Y. Maruyama, Bull. Soc.
Chem. Jpn. 61 (1988) 4207.
[12] T. Inabe, N. Hoshino, T. Mitani, Y. Maruyama, Bull. Soc.
Chem. Jpn. 62 (1989) 2245.
[13] T. Inabe, New J. Chem. 15 (1991) 129.
[14] S. Takeda, H. Chihara, T. Inabe, T. Mitani, Y. Maruyama,
Chem. Phys. Lett. 189 (1992) 13.
[15] S. Takeda, T. Inabe, C. Benedict, U. Langer, H.H.
Limbach, Ber. Bunsenges. Phys. Chem. 102 (1998) 1358.
[16] V. Enchev, A. Ugrinov, G.P. Neykov, J. Mol. Struct.
(Theochem.) 530 (2000) 223.
[17] K. Kownacki, Ł. Kaczmarek, A. Grabowska, Chem. Phys.
Lett. 210 (1993) 373.
[18] A. Grabowska, K. Kownacki, Ł. Kaczmarek, J. Lumin.
60–61 (1994) 886.
[19] K. Kownacki, A. Mordzi�nnski, R. Wilbrandt, A. Grab-
owska, Chem. Phys. Lett. 277 (1994) 270.
[20] K. Kownacki, Ph.D. Thesis, Inst. of Phys. Chem. Pol.
Acad. Sci., Warsaw, 1994.
[21] J. Karolczak, D. Komar, J. Kubicki, M. Szymanski, T.
Wrozowa, A. Maciejewski, Bull. Pol. Acad. Sci.: Chem. 47
(1999) 361.
[22] J. Karolczak, J. Kubicki, D. Komar, T. Wrozowa, K.
Dobek, B. Ciesielska, A. Maciejewski, Chem. Phys. Lett.
344 (2001) 154.
[23] A. Maciejewski, R. Naskrecki, M. Lorenc, M. Ziolek, J.
Karolczak, J. Kubicki, M. Matysiak, M. Szymanski,
J. Mol. Struct. 555 (2000) 1.
[24] T. Nakayama, Y. Amijima, K. Ibuki, K. Hamanoue, Rev.
Sci. Instrum. 68 (1997) 436.
[25] M. Ziolek, M. Lorenc, R. Naskrecki, Appl. Phys. B 72
(2001) 843.
[26] M. Lorenc, M. Ziolek, R. Naskrezcki, J. Karolczak,
J. Kubicki, A. Maciejewski, Appl. Phys. B 74 (2002)
19.
[27] S.J. Strickler, A. Berg, J. Chem. Phys. 37 (1962) 814.
[28] S. Mitra, N. Tamai, Chem. Phys. Lett. 282 (1998) 391.
[29] J.L. Herek, S. Pedersen, L. Banares, A.H. Zewail, J. Chem.
Phys. 97 (1992) 9046.
[30] N.P. Ernsting, S.A. Kovalenko, T. Senyushkina, J. Saam,
V. Farztdinov, J. Phys. Chem. A 105 (2001) 3443.
[31] S. Lochbrunner, A.J. Wurzer, E. Riedle, J. Chem. Phys.
112 (2000) 10699.
[32] C. Chudoba, S.E. Riedle, M. Pfeiffer, T. Elsaesser, Chem.
Phys. Lett. 263 (1996) 622.
[33] B.J. Schwartz, L.A. Peteanu, C.B. Harris, J. Phys. Chem.
96 (1992) 3591.
[34] T. Arthen-Engeland, T. Bultmann, N.P. Ernsting,
M.A. Rodriguez, W. Thiel, Chem. Phys. 163 (1992)
43.
[35] S. Pommeret, J.C. Mialocq, A. Deflandre, in: F.C. De
Schryver, S. De Feyter, G. Schweitzer (Eds.), Femtochem-
istry, Wiley-VCH, Weinheim, 2001, p. 323.
M. Zi�oołek et al. / Chemical Physics Letters 369 (2003) 80–89 89