evolution and conservation of sinai's primrose (primula boveana): an endangered pre-glacial...
TRANSCRIPT

BBiioo--GGeenneettiiccss JJoouurrnnaall Vol. 4, No. 1 (2016): 56-72 Research Article Open Access
ISSN: 2347-7407
Evolution and conservation of Sinai's primrose (Primula boveana): an endangered pre-glacial relict species growing on Sinai Mountain, Egypt
M. S. Zaghloul1, A. A. Moustafa1*, R. Mauricio2 and H. M. H. Mansour1
1 Botany Department, Faculty of Science, Suez Canal University, Ismailia, Egypt. 2 Department of Genetics, University of Georgia, Athens, GA, USA. * Corresponding author: A. A. Moustafa; e-mail: [email protected]
ABSTRACT Sinai Primrose (Primula boveana) is an endangered paleo-endemic to South Sinai, Egypt, where it is restricted to high-elevation year-round springs in red granitic rocks. It is subjected to a number of threats causing the populations to decline in number and size. We measured genetic diversity and structure of its populations using allozymes and examined the mating system using progeny arrays. We examined the sequence-level variation in PbSLL1 and PbSLL2 and compared it with P. vulgaris. Results showed that P. boveana maintains a low to moderate level of genetic diversity with most of genetic diversity (62%) were found within the populations. Appreciable genetic differentiation among populations was revealed which strengthens the hypothesis of historic isolation. A remarkable matching was detected between genetic and spatial distances. The results of mating system analysis indicated that P. boveana is largely outcrossing with single locus outcrossing rates higher than 0.83. The level of biparental inbreeding indicated that there is a very weak selfing occurring. Crosses showed that selfing does produce fertile offspring but at a high fitness cost compared to outcrossing. The sequencing of S-locus detected a single variable site in sequenced intron 1 of PbSLL2 for pin and thrum plants in the sequenced regions of 2kb of PbSLL2 and 212bp of PbSLL1. However, there was no association of this SNP to the flower polymorphism. A high divergence has been detected between P. vulgaris and P. boveana which confirmed the evolutionary variation between the two species. The conservational implications of the results have been discussed.
Keywords: Genetic diversity, mating system, outcrossing, S-locus, polymorphism.
1. INTRODUCTION The Mediterranean Basin has been recognized as one of the biodiversity "hot spots" in the world ] as it is characterized by high levels of plant diversity and endemism. Primula boveana Decne, ex Duby is an endangered paleo-endemic [2,3] which represents the remaining evidence from the Tertiary paleo-flora [4]. Degradation of its natural habitats is the major threatening factor affecting distribution of P. boveana in the area. It is endangered by human impact through severe over-grazing by goats and sheep. The effect of grazing is aggravated by the prevailing aridity in the area, where annual rainfall averages has been recorded to be less than 50 mm/year [5, 6].
Declining genetic variation is a major threat for endangered plants with small population sizes or narrow geographic ranges. Low genetic diversity may contribute to low fitness of individuals [7, 8], reduces the viability or adaptability of populations in changing environments [9], and in extreme cases causes the extinction of species. For these reasons, evaluation and monitoring genetic diversity is often required for the development of effective conservation programs for threatened plants [10, 11]. Mating system is an important determinant of how genetic diversity is distributed among individuals and
Received: 04 November 2015 Accepted: 30 December 2015 Online: 24 February 2016
http://biogenetics.aizeonpublishers.net/content/2015/1/biogen56-72.pdf 56

57 http://biogenetics.aizeonpublishers.net/content/2016/1/biogen56-72.pdf
M. S. Zaghloul et al. / Bio-Genetics J. 2016, 4(1): 56-72
populations within a species. Outcrossing species are expected to have higher genetic diversity within populations and lower genetic structure among populations compared to selfing species [12]. Preserving genetic diversity of outcrossing species requires maintaining populations of large size, while inbreeding species require the protection of many different populations. In addition, biparental inbreeding, mating of relatives, can contribute to inbreeding depression [13]. Finally, the number of pollen donors contributing to each family can also limit genetic diversity. Different individuals within populations and populations within the species may show variability in their mating systems, so measuring the rate of inbreeding for each population is critical for developing and designing conservation strategies. Plants have evolved a remarkable diversity of mating systems in order to promote outcrossing [14, 15]. A number of species, including those of Primula, demonstrate distyly with two different flower morphs among individuals in a population [14; 16; 15; 17]. The two floral morphs have their anthers and stigma at reciprocal heights (reciprocal herkogamy; [18]). Pin flowers have a long style and their anthers are attached to the petals by short filaments, while thrum flowers have long stamens and short stigmas. This structural mechanism allows pollinators to transfer pollen between the morphs, reducing pollen wastage and thus increasing male fitness and promoting outcrossing. Most distylic species within Primula also have a diallelic genetic incompatibility system that makes intermorph crosses more successful than intramorph crosses [19, 20] which protects against self-fertilization and inbreeding depression, and thus increase female fitness [21]. Despite of the evolutionary value of the P. boveana’s mating system [22]; nothing is known about the basis of heteromorphic flower development, the nature of genes responsible, their organization within the S-locus or the mechanism that maintains the integrity of this co-adapted linkage group. The objectives of our study were: (1) to measure genetic variation and structure of P. boveana populations using allozymes, (2) to assess the variability of floral phenotypic characters for each morph in studied populations, (3) to quantify the variation of mating system between and within morphs in order to determine the heteromorphic pattern of P. boveana, (4) to figure out the effect of decreasing population size on the pin-thrum ratio as well as to test the hypothesis that the reproductive output of small populations with a biased morph frequency will be particularly sensitive, (5) to understand the evolution of the mating system of P. boveana through comparison with P. vulgaris sequences variation in S- Locus linked genes, and (6) to determine the implications of our results for conservation plans of P. boveana in fragmented habitats in Saint Katherine Protectorate.
2. MATERIALS AND METHODS 2.1 Study Species The six species of Primula section Sphondylia are endemic to areas of the Middle East and thought to be all derived from a single ancestral species that was extensively distributed in Asia and Africa during a cool wet period about 6 million years ago [2]. As the climate became drier, water-loving Primula populations were isolated on cooler, high mountains, eventually forming several endemic species in Yemen, Saudi Arabia, Turkey, Iran and Ethiopia. One of these species is Sinai's primrose (Primula boveana), Egypt's only species in this genus and also Egypt's rarest plant. Primula boveana Decne, ex Duby is an extremely endangered paleo-endemic perennial herb restricted to the St. Catherine Mountain area (1880-2120 m a.s.l.), Sinai, Egypt, where the type was collected by N. Bové in June 1832 [2, 3]. It grows in north-facing rock crevices and cracks of granite near springs supplied with water almost all the year in narrow steep-sided wadis [23, 6]. These habitats are characterized by high soil moisture content, organic matter, carbonate, and electric conductivity [5]. P. boveana normally grows in its own assemblage co-dominated by biological crust and Hypericum sinaicum and associated with Adiantum capillus-veneris [5]. The Sinai's primrose starts flower budding in March, while sheds seeds in July and August. Vegetative growth activity in P. boveana continues all over the four seasons with its minimum in July and maximum in September. It produces dust seeds with average weight of 0.0031gm [5]. These seeds have strong innate dormancy that they germinate only in presence of light and the germination ratio is enhanced by increasing chilling. This strong innate dormancy explains the large accumulated persistent seed bank that buried seed are prevented from germination until it passes a chilling period (winter) and being on the top of soil not buried in it [3]. Up to our knowledge, there is no published research on the diversity and abundance of insects that pollinate P. boveana. Nevertheless, Jiménez [24] reported very few visits to P. boveana by the solitary bee Anthophora pauperata in its range. 2.2 Population sampling and seed collection All known populations (four) of P. boveana were sampled: Kahf El-Ghoula (KaGhs) in W. El-Arbaie'en, W. Garagnia (Garag), W. Shaq Mousa (ShaMo), and Ain Shennarah (Ainsh) (Fig 1). Seeds were collected from any available individual. The number of sampled families was limited by the availability of seeds. Geographic distances between populations were measured by tracing the wadi’s drainage lines. These distances ranged from ≈ 300m between ShaMo and Ainsh, which are in the same wadi, to ≈ 4057m between KaGhs and Garag. 2.3 Seed Germination Seeds from open pollinated plants (separated families) were planted in Fafard mix no. 3B. potting soil (a mix for bedding plants, seed germination, and growing

58 http://biogenetics.aizeonpublishers.net/content/2016/1/biogen56-72.pdf
M. S. Zaghloul et al. / Bio-Genetics J. 2016, 4(1): 56-72
composed of Canadian Sphagnum Peat (45%), Vermiculite, Perlite, and Processed Pine Bark) mixed with lime and germinated in growth chamber for 25-30 days under 15oC/5oC day and night temperature, light 12h/12h, and 70% humidity environmental regime.
The seedlings were transplanted into 10 cm diameter (650 cm3) pots filled with peat compost and placed in a cold greenhouse (15 - 20o C) where they were left to grow up to 30 days before transferring to the regular greenhouse.
Figure 1. Location of sampled Primula boveana populations.

59 http://biogenetics.aizeonpublishers.net/content/2016/1/biogen56-72.pdf
M. S. Zaghloul et al. / Bio-Genetics J. 2016, 4(1): 56-72
A
B
Figure 2. (a) L.S. in whole pin and thrum flowers of P. boveana and (b) sketch drawing of anther and stigma positions.
2.4 Morphometric variation Phenotypic traits were measured for three flowers per each of 123 individuals representing the studied populations (Table 1). In most cases, the three flowers were randomly chosen from the first week flowering. The measured traits included the corolla tube diameter (at the upper and the middle part) and length, anther and stigma heights, and stigma-anther separation. Corolla was slit longitudinally from the base of the superior ovary to the mouth, and the base of the ovary was used as the baseline for the measurements using a digital Varnier caliper (Fig 2). Individual ANOVAs were performed on all continuous response variables. Each univariate ANOVA tested the fixes effects of flower morph (Pin and thrum) and populations. Multiple comparisons of significance level when determining pairwise differences between pin and thrum morphs and populations were performed by Tukey’s HSD test. Meantime, the effect of mating type and the source of crosses were tested. Floral
phenotypic characters association were assessed by population Pearson Correlation Coefficient which is the function of the degree of correlation between any two variables, e.g. the parameter ρjk = σjk / σjσk where σjk is the parametric covariance of variables Yj and Yk, and σj and σk are the standard deviations of variables Yj and Yk [25]. All statistical analyses were performed using JMP 6.0 [26]. 2.5 Starch Gel Electrophoresis Whole P. boveana seedling tissues were ground manually with sea sand using a small pre-cooled mortar and pestle. Preliminary trials determined that the extraction buffer of produced superior resolution. After homogenization, crude extracts were absorbed onto 4x6 mm sample wicks made from No. 3 Whatman filter paper. Wicks were stored in 96-well microtest plates at -70° C until needed for electrophoresis. Twenty five allozymes were tested in a preliminary survey to identify potentially readable loci. Adequate

60 http://biogenetics.aizeonpublishers.net/content/2016/1/biogen56-72.pdf
M. S. Zaghloul et al. / Bio-Genetics J. 2016, 4(1): 56-72
resolution was obtained for 7 enzyme systems: isocitrate dehydrogenase (IDH), shikimic dehydrogenase (SKDH), menadione reductase (MNR), aspartate aminotransferase (AAT), glutamate dehydrogenase (GDH), phosphoglucose isomerase
(PGI), and phosphoglucomutase (PGM). Four gel and electrode buffer systems were used to resolve these enzymes: system 4 of [27], IDH and SkDH; 7, MNR and AAT; 8- (a modification of system 8 of [27], GDH; 11 of [27], PGM and PGI.
Table 1. Variation in phenotypic characters among studied populations. Pair-wise comparisons (Tukey’s HSD test) results are shown as superscripts. Within each character, values with same superscripts are not significantly different.
Pop. Flower
morph
Num
ber
Character mean ± SE
Tube
diameter 1
(mm)
Tube
diameter 2
(mm)
Tube length
(mm)
Anther height
(mm)
Stigma height
(mm)
Stigma-anther
separation
Relative
anther
position
Relative
stigma
position
Ainsh Thrum 39 10.59 ± 0.22 ab 2.07 ± 0.04 ab 21.40 ± 0.52 a 18.40 ± 0.43a 14.57 ± 0.44 bc 3.83 ± 0.35 a 0.85 ± 0.01a 0.67 ± 0.02 b
Pin 6 10.08 ± 0.56 ab 1.80 ± 0.11 b 19.51 ±1.32 ab 15.25 ±1.09 ab 17.42 ±1.13 ab -2.17 ± 0.90 b 0.79 ± 0.03a 0.90 ± 0.04a
KaGhs Thrum 17 10.92 ± 0.33 a 2.09 ± 0.06 ab 18.20 ± 0.79 b 15.40 ± 0.65 b 12.25 ± 0.67 c 3.16 ± 0.53 a 0.85 ± 0.02 a 0.67 ± 0.02b
Pin 3 9.75 ± 0.80 a 1.91 ± 0.15 ab 18.08 ±1.86 ab 15.28 ± 1.54ab 16.45 ±1.59 abc -1.18 ± 1.27 b 0.84 ± 0.04 a 0.91 ± 0.06a
Garag Thrum 21 11.42 ± 0.30 a 2.09 ± 0.06 ab 21.15 ±0.70 ab 18.59 ± 0.58 a 13.77 ± 0.60 bc 4.83 ± 0.48 a 0.88 ± 0.02 a 0.65 ± 0.02 b
Pin 6 12.19 ± 0.56 a 2.34 ± 0.11 a 20.61 ± 1.32 ab 16.92 ±1.09 ab 18.41 ± 1.13 a -1.50 ± 0.90 b 0.82 ± 0.03 a 0.89 ± 0.04a
ShaMo Thrum 22 11.32 ± 0.29a 2.02 ± 0.06 ab 20.62 ± 0.69ab 17.38 ± 0.57 ab 13.04 ± 0.59 c 4.34 ± 0.47 a 0.84 ± 0.02a 0.63 ± 0.02b
Pin 9 9.03 ± 0.46 b 1.99 ± 0.09 ab 19.89 ± 1.07ab 16.61 ± 0.89 ab 18.17 ± 0.92 a -1.56 ± 0.73b 0.84 ± 0.03 a 0.92 ± 0.03 a
Figure 3. Dendrogram of the P. boveana populations using unbiased Nei’s genetic distance.
2.6 Genetic diversity and structure Genetic diversity within P. boveana populations was assessed in GenAlEx 6.1 [28] by estimating the proportion of polymorphic loci (P), number of alleles per polymorphic locus (AP), the effective number of alleles per locus (Ae), observed heterozygosity (Ho), and expected heterozygosity (He). Wright’s F- statistics were calculated and used to determine deviations from Hardy-Weinberg expectations [291]. AMOVA was used to assess population genetic structure of P. boveana populations in Arlequin [30, 31]. Pairwise FST values (from 9999 random permutations) for each population were also calculated in Arlequin to give insight into the degree of genetic differentiation between populations. [32] measure of genetic distance (D) was estimated between populations using POPGENE version 1.31 [33]. The UPGMA dendrogram was constructed using [34] unbiased genetic distances to alleviate any bias by small sample sizes (Fig 3).
2.7 Mating system analysis Multilocus (tm) and single-locus (ts) outcrossing rates and the correlation of outcrossed paternity (rp) of P. boveana were estimated using the maximum likelihood methods developed by [35, 36]. We estimated biparental inbreeding as the difference between the multilocus and single locus outcrossing rates. All analyses were performed using the multilocus mating system program MLTR version 3.2 for Windows [36]. All polymorphic allozyme loci obtained using gel electrophoresis were used in this mating system analysis. 2.8 Crosses (controlled mating) Crosses were performed in an insect-free greenhouse on plants grown from seeds collected from wild populations in St. Catherine area. Population size was determined as the number of flowering individuals and ranged from 31 to 277 flowering individuals. In some plants, pin and thrum flowers had been detected within
61 http://biogenetics.aizeonpublishers.net/content/2016/1/biogen56-72.pdf
M. S. Zaghloul et al. / Bio-Genetics J. 2016, 4(1): 56-72
the same individual on different branches. These plants were described as dimorphic plants. The other individuals that have either pin or thrum flowers were described as monomorphic plants. The number of
dimorphic and monomrophic individuals was counted for all populations, in addition to the average number of thrum and pin flowers grown in each population.
Table 2. Effects of source of crossing between and within different morphs/populations in addition to effect of morphs on the
parameters of reproductive output and seed viability. Pair-wise comparisons of the different studied factors were performed by Tukey’s HSD test. Within columns, values with same superscripts were not significantly different.
Source Mating type
Cross Successfulness Seed Character
Attempted crosses #
Successful crosses #
Success rate
Sample size
Mean no. seed / fruit
Mean seed proportion / fruit
Mean seed viability
Pin*Thrum Outcrossing 34 24 0.71 24 408.6a 69.72a 55.55a Selfing 16 6 0.38 6 106.8c 28.00b 43.66b
Thrum*Thrum Outcrossing 92 41 0.45 41 275.0b 71.3a 42.03b Selfing 86 23 0.27 23 149.08c 47.77b 15.57c
Pin*Pin Outcrossing 32 11 0.34 11 100.6c 29.98b 15.38c Selfing 10 0.00 0.00 0.00 0.00 0.00 0.00
Total 270 105 0.39 Different populations outcrossing 35 300.4a 65.02a 44.60a
Within populations outcrossing 41 284.7a 66.1a 37.07a selfing 29 140.3b 43.14b 19.40b
All possible reciprocal crosses between pin and thrum individuals were performed (including selfing), as well as crosses within-type (pin and pin, thrum and thrum) and all the crosses were performed within and across the studied populations, depended on the availability of flower as well as the frequency of two different morphs. The numbers for the attempted crosses and successful crosses for each cross type are shown in Table 2. Success rate have been calculated as the number of successful crosses divided by the number of attempted crosses. Fruits from crosses were allowed to mature. Capsules were harvested when ripe (turning brown) but before dehiscence (5-12 week after crosses) and the number of seeds per fruit were estimated inferred by 100 seeds weight/capsule and the mean proportion of seed produced per cross per plant (the mean number of seeds produced by each plant for each cross divided by the mean number of ovules produced by the plant). The mean number of ovules per plant was assessed examining three flowers per plant using dissecting microscope. Individual ANOVA was performed on all continuous response variables. Each univariate ANOVA tested the fixes effects of flower morph (Pin and thrum) and populations. Multiple comparisons of significance level when determining pairwise differences between pin and thrum morphs and populations were performed by Tukey’s HSD test. In the meantime, the effect of mating type and the source of crosses were tested. All statistical analyses were performed using JMP 6.0 [26]. 2.9 DNA extraction We analyzed both monomorphic (with only thrum flowers) and polymorphic (with both pin and thrum flowers) plants in each population (Table 3), which were distinguished by their differences in stigma position. A fresh leaf near the apical bud was collected from each plant for DNA extraction and stored at -80°C. Genomic DNA was extracted using the DNEasy Plant
mini kit (Qiagen, Valencia, CA, USA). The concentrations of the DNA extracts were measured with a Nanodrop-1000 spectrophotometer and diluted to 5ng/µL. 2.10 PCR amplification and sequencing DNA was amplified using the polymerase chain reaction (PCR) using S-locus linked gene specific primers. Primers were designed from P. boveana sequences to amplify 5 overlapping parts of PbSLL1 and 10 overlapping parts of PbSLL2 using PRIMER3, version 0.4.0. Table 4 shows the sequences of the forward and reverse primers that have been used in each amplification. PbSLL2 included partial sequences of 3 of the 4 exons and one of the introns. Genomic DNA was amplified in 25 µl PCRs reactions containing 1 µl DNA, 10X PCR buffer, a marker-specific concentration of MgCl2, 10 mM dNTP, 10 mM of each primer, and 5 unit/ul of Taq DNA polymerase (New England Biolabs). Amplifications were performed on a MJ Research thermocycler using a touchdown procedure: an initial denaturing at 95° for 2 min, 11 cycles of 94° for 10 sec, a primer-specific annealing temperature which was decreased for 0.7°C per cycle, and 72° for 1 min, followed by 26 cycles of a denaturing step at 94° for 10 sec, an annealing step at Tm-7° for 40 sec, 1 min at 72°, with a final 5 minutes at 72C. Diploid PCR products were directly sequenced using the same primers. Sequencing reactions were carried out using ABI BigDye® v 3.1 terminators, 5X sequencing buffer and 10 mM of each primer. Reactions were performed on a MJ thermocycler using the following steps: 96 C for 10 seconds, 26 cycles of 50 C for 5 seconds, and 60 C for 4 minutes. Resulting products were sequenced on an ABI 310 automated sequencer (Applied Biosystems, Foster City, CA). Sequences were edited and aligned using SEQUENCHER ver. 4.2 (Gene Codes Inc., Ann Arbor, MI).

62 http://biogenetics.aizeonpublishers.net/content/2016/1/biogen56-72.pdf
M. S. Zaghloul et al. / Bio-Genetics J. 2016, 4(1): 56-72
Table 3. Total numbers of individuals were sampled for DNA genotyping.
Population No. of individuals monomorphic morphs polymorphic morphs
Ainsh 17 11 6 ShaMo 10 7 3 KaGhs 7 5 2 Garag 5 3 2
Table 4. Primer sequences pairs for each sequenced region.
Region Primer Sequence Tm (°C)
(MgCl2 ) mM
Sequence length
(bp) SLL1 Exon 2 101 (F) 5’-CAACCAAACGAGGCCTAAAA-3’ 53° 1.5 241 101 (R) 5’-GGCACTCATCCTCTTTGCTC-3’ 103 (F) 5’-CTCCTGGTTTCCCTCACAAG-3’ 53° 1.5, 2 720 103 (R) 5’-CCGAAGCAGTTTTCTTTTGC-3’ 106 (F) 5’-GGAGCAAAGAGGATGAGTGC-3’ 55° 1.5, 2 109 106 (R) 5’-CGAGGGACATTGTCAGCTTC-3’ 104 (F) 5’-ATGCAACAGGAGCAAAGAGG-3’ 53° 1.5, 2 185 104 (R) 5’-CCCGAAGCAGTTTTCTTTTG-3’ 105 (F) 5’-CAGGAGCAAAGAGGATGAGTG-3’ 52° 1.5 190 105 (R) 5’-CCCGAAGCAGTTTTCTTTTG-3’ SLL2 Exon 1 21 (F) 5’-GACCGAAATGTCCACTCAGC-3’ 53° 1.5, 2 447 21 (R) 5’-CTTTCCTTGGCCTTCCAAAC-3’ 23 (F) 5’-TTGGTTGGGTCATAACTGCTC-3’ 53° 1.5, 2 316 21 (R) 5’-CTTTCCTTGGCCTTCCAAAC-3’ Intron 1 17 (F) 5’-AGGCGGTCAATTGTTATTCG-3’ 51° 1.5 1138 18 (R) 5’-TCATCGTTCTCGCAGATGTC-3’ 19 (F) 5’-TATTCGGGATGTCCTTCGTC-3’ 53° 1.5, 2 1109 17 (R) 5’-ATGTCAGGTGCCTTTGTTCC-3’ 17 (F) 5’-AGGCGGTCAATTGTTATTCG-3’ 53° 1.5 1259 20 (R) 5’-CATGCTCCCGATTCCATTAG-3’ 17 (F) 5’-AGGCGGTCAATTGTTATTCG-3’ 51° 1.5 1123 17 (R) 5’-ATGTCAGGTGCCTTTGTTCC-3’ Exon 2 24 (F) 5’-CTCGTCCTGACATGACTTGC-3’ 51°,
52° 1.5, 2 488
25 (R) 5’-TCAAATGGTTGATCGTGGTC-3’ 26 (F) 5’-GACTCCGATGAAGCAATCAAG-3’ 51° 1.5, 2 252 24 (R) 5’-GCATCAAATGGTTGATCGTG-3’ Exon 3 202 (F) 5’-CTGGTCAACAAAGAAACACAGC-3’ 50° 2.5 213 202 (R) 5’-TTGAAGGGAACGAACATGG-3’ 203 (F) 5’-AGAAACACAGCTCCACCCACTTGCAGC-3’ 60° 3 171 203 (R) 5’-AGGCGGCTCTCCCATTCCAATCTCGTG-3’
2.11 Divergence of P. boveana from P. vulgaris Intron/exon boundaries were assigned by comparison to P. vulgaris sequences variation in S- Locus linked genes according to [37]. Single nucleotide polymorphisms (SNPs) were identified as synonymous and nonsynonymous substitutions. DnaSP version 5.10.00 was used to calculate the number of nucleotide substitutions between P. vulagaris and P. boveana. Amino acid sequences were inferred from the DNA sequences and aligned using CLUSTALW2 [38].
3. RESULTS AND DISCUSSION 3.1 Morphometric variation Morphometric measurements and L.S. in whole pin and thrum flowers of P. boveana showed the development of pin and thrum style positions, but only one anther position (Fig 2). Determining the variability of floral phenotypic characters for each morphs (pin and thrum) among the studied populations, ANOVA results revealed that variation was significant for corolla tube diameter at the upper part, corolla tube diameter at the
middle part, corolla tube length, anther and stigma heights, stigma-anther separation, relative stigma position, and ovule number (Table 1). No significant variation was found for pollen viability percent. The mean diameter for corolla tube at the upper part in the pin flowers of ShaMo population (9.03 mm) was the lowest among the other populations, while the mean for the pin flowers of Grag population (12.19 mm) was the highest. The mean for corolla tube length ranged from 18.08 mm in the pin flowers of KaGhs population to 21.40 mm in the thrum flowers of AinSh population. The mean of the anther height ranged from 15.25 mm (pin flowers of Ainsh population) to 18.59 mm (thrum flowers of Garag population). The mean of stigma height measurements has high variations among the studied populations with the lowest value of 12.25 mm in the thrum flowers of KaGhs populations and the highest value of 18.41 mm in the pin flower of Garag population.

63 http://biogenetics.aizeonpublishers.net/content/2016/1/biogen56-72.pdf
M. S. Zaghloul et al. / Bio-Genetics J. 2016, 4(1): 56-72
The stigma-anther separation distance showed significant variation among the studied populations. In pin flowers, it ranged from -1.18 mm (KaGhs) to -2.17 mm (AinSh) while in thrum flowers; it ranged from 3.16 mm (KaGhs) to 4.83 mm (Garag). In contrary to the relative anther position, the relative stigma position measures have significant variation among the sampled flowers. It ranged from 0.63 in thrum flowers at ShaMo population to 0.92 in pin flowers at the same population (Table 1). Pearson's Correlation results showed that the relative positions of anthers and stigma within the corolla were not correlated in both pin and thrum flowers (ρ = 0.003, P = 0.234). Meanwhile, the anther height was highly positively correlated with tube diameter (ρ = 0.177, P = 0.0001) and corolla tube length (ρ = 0.707, P = 0.0001). Also, the stigma height was highly positively correlated with corolla tube length (ρ = 0.320, P = 0.0001). 3.2 Loci and Alleles scored Enzyme electrophoresis resulted in clear staining for seven enzymes encoded by thirteen putative loci: Idh-1,
Idh-2, Idh-3, Skdh-1, Skdh-2, Mnr-1, Mnr-2, Aat-1, Aat-3, Idh-1, Pgi-2, Pgm-1, Pgm-2. All enzymes migrated anodally. The Idh-2, Idh-3, Mnr-1, Aat-1, and Pgm-2 were monomorphic, in all individuals from all populations of P. boveana. All other eight loci were polymorphic in at least one population. Idh-1, Skdh-2, Aat-3, Pgm-1 and Pgi-2 had two alleles; Skdh-1, Mnr-2 and Gdh-1 had three alleles. A locus was considered polymorphic if two or more alleles were detected, regardless of their frequencies. A total of 24 alleles were observed for the species (A = 1.85). At only two loci, Idh-1 and Skdh-2, the frequency of the common allele was either more than 90% or fixed in any of the studied populations. At Idh-1 the common allele was fixed (monomorphic) at all populations but one population (Ainsh) where its frequency was 0.99. At each locus, the common allele was the same in every population for 5 polymorphic loci (Idh-1, Skdh-1, Skdh-2, Gdh-1, and Pgi-2). Two rare alleles Idh-1(1) and Skdh-2(3) were represented only in one population.
Table 5. Genetic diversity statistics in the 4 populations of P. boveana. N = the number of seedlings assayed, P = % polymorphic loci, Ap = mean number of alleles per polymorphic locus, A = mean number of alleles per locus, Ae = effective number of alleles
per locus, Ho = observed heterozygosity, and He = unbiased heterozygosity expected under Hardy-Weinberg assumptions.
Pop. N No. Alleles P Ap A Ae Ho (SD) He (SD)
Ainsh 202 22 53.85 2.29 1.77 1.168 0.101 (0.042) 0.112 (0.044)
ShaMo 83 19 38.46 2.20 1.46 1.123 0.079 (0.047) 0.078 (0.041)
Garag 58 22 53.85 2.29 1.77 1.264 0.156 (0.060) 0.157 (0.055)
KaGhs 33 20 53.85 2.00 1.54 1.174 0.113 (0.049) 0.119 (0.043)
Mean (SD) / Total
24 50 (3.85) 2.195 (0.28) 1.60 (0.09) 1.183 (0.04) 0.112 (0.024) 0.117 (0.023)
3.3 Genetic diversity within populations Genetic diversity in P. boveana species was quantified using standard measures of genetic diversity (Table 5). The total number of alleles in each population for the 13 loci ranged from 19 to 22 with a mean of 20.75. The polymorphism (P) ranged from 38.46% to 53.85% (mean = 50.0%). The mean number of alleles per polymorphic locus (AP) ranged from 2.00 to 2.29 with a
mean of 2.195. The mean effective number of alleles per locus within each population ranged from 1.23 to 1.264 with a mean of 1.6. The observed heterozygosity (Ho) ranged from 0.101 to 0.156 (mean = 0.112). The expected heterozygosity (He) ranged from 0.112 to 0.157 (mean = 0.117). In all studied populations, observed heterozygosity (Ho) was very close to Hardy-Weinberg expectations.
Table 6. Summary ANOVA table.
Source df SS MS Est. Var. %
Among Pops 3 232.444 77.481 0.960 38%
Within Pops 372 575.016 1.546 1.546 62%
Total 375 807.460 2.506 100%
Table 7. Estimates of FST, genetic distances (lower triangle), and spatial distances (m) for tracing Wadi's drainage lines (upper triangle) for all pairwise comparisons between the studied P. boveana populations.
Ainsh ShaMo Garag KaGhs
FST GD FST GD FST GD FST GD
Ainsh 0.000 0.000 306.93 2409.62 3419.46
ShaMo 0.129 0.0174 0.000 0.000 2102.69 3112.53

64 http://biogenetics.aizeonpublishers.net/content/2016/1/biogen56-72.pdf
M. S. Zaghloul et al. / Bio-Genetics J. 2016, 4(1): 56-72
Garag 0.144 0.0208 0.180 0.0298 0.000 0.000 4057.13
KaGhs 0.432 0.1052 0.583 0.1663 0.264 0.673 0.000 0.000
3.4 Genetic structure among populations Wright’s F- statistics showed that the mean FIT over all loci for the studied populations is 0.187 (SD = 0.094) indicating very little non-equilibrium conditions and mean FST is 0.171 (SD = 0.06) suggesting appreciable genetic differentiation among populations. The AMOVA analysis showed that 62% of the total genetic variation recorded in P. boveana is maintained within populations while 38% of the diversity is found among populations (Table 6). Pair-wise FST between populations was smallest (0.129) between Ainsh and ShaMo which are also the closest geographically and
within the same valley (Table 7). The most geographically distant populations, KaGhs and ShaMo, had the highest pairwise FST (0.583). Genetic distances between P. boveana populations based on differences in allele frequencies over all loci [32] ranged from 0.017 between Ainsh and ShaMo to 0.166 between ShaMo and KaGhs (Table 7). The UPGMA dendrogram (Fig 3) showed that the most geographically proximate populations are also the most genetically similar.
Table 8. Population mating system parameters including, N = the number of seedlings assayed, inbreeding coefficient of maternal individuals (parental F), multilocus outcrossing rate (tm), single locus outcrossing rate (ts), biparental inbreeding tm –
ts, and correlation of outcrossed paternity (rp). Standard deviation from 100 bootstraps replicates is in parentheses.
Population No. Families No. Progeny tm (SD) ts (SD) tm – ts (SD) rp (SD)
Ainsh 18 202 0.967 (0.078) 0.883 (0.101) 0.083 (0.075) 0.355 (0.141)
ShaMo 3 83 0.913 (0.174) 0.866 (0.185) 0.047 (0.025) -0.012 (0.033)
Garag 2 58 1.027 (0.096) 1.024 (0.085) 0.002 (0.019) 0.028 (0.055)
KaGhs 2 33 1.200 (0.002) 1.080 (0.048) 0.120 (0.048) 0.011 (0.083)
3.5 Population mating-system parameters Multilocus outcrossing rate (tm) estimates in studied P. boveana populations were significantly higher than 57% and not significantly different than 100% (Table 8). ShaMo had the lowest while KaGhs had the highest outcrossing rate. Population single locus outcrossing rates (ts) ranged from 0.833 (Ainsh) to 1.080 (KaGhs). Biparental inbreeding (tm – ts) was significantly higher than zero in KaGhs population only, while it was not significantly different than zero in all other populations. This suggests that the P. boveana populations mainly experience outcrossing with very low selfing rate. Estimates of the correlation of outcrossed paternity (rp) ranged from 0.012 in ShaMo to 0.355 in Ainsh (Table 8). This suggests high multiple paternity reaching at least 2.8. 3.6 Crosses (controlled matings) 3.6.1 Within and among morphs The legitimate crosses (outcrosses between pin and thrum flowers) showed the highest success rate (0.71) and seed production (mean = 408.6) (Table 2). While the lowest success rate resulted from illegitimate within-thrum crosses (0.27), it was within-pin crosses which resulted in the lowest seed production (mean = 100.6). Selfing within-pin morphs did not result in successful crosses (0.00) and hence did not develop seeds at all (Table 2). Generally, significant differences were noted between legitimate and illegitimate outcrosses. Number of seeds produced from the outcrossing between pin and thrum flowers was significantly different than that produced from either
outcrossing within-thrum or within-pin flowers. The legitimate outcrosses between pin and thrum flowers resulted in the highest mean proportion of seed produced per cross (69.7%) while selfing resulted in the lowest mean (28.0%). A significant variation exists between means of seed proportion/fruit resulted from the outcrossing between pin-thrum and within-thrum and the outcrossing between within-pin flowers. The seed viability data revealed the highest mean (55.6%) in seeds resulted from outcrosses between pin and thrum flowers, and the lowest mean (15.4%) in seeds resulted from outcrosses within-pin flowers. Significant variation was found between means of viable seeds that resulted from legitimate pin-thrum outcrosses and illegitimate outcrosses either within-thrum or within-pin flower morphs (Table 2). 3.6.2 Within and among populations A significant variation was detected between the number of seeds per fruit that were produced from outcrosses between plants grown from either different populations (300.4) or within populations (284.7) and those produced from self-crosses within populations (140.3). On the other hand, no significant variation was detected between the number of seeds and seed proportion per fruit that were produced from outcrossing within and among populations (Table 2). Viability of seeds that were produced from outcrosses between plants grown from either different or within populations differed significantly than viability of seeds that were produced from selfing within populations (Table 2).
65 http://biogenetics.aizeonpublishers.net/content/2016/1/biogen56-72.pdf
M. S. Zaghloul et al. / Bio-Genetics J. 2016, 4(1): 56-72
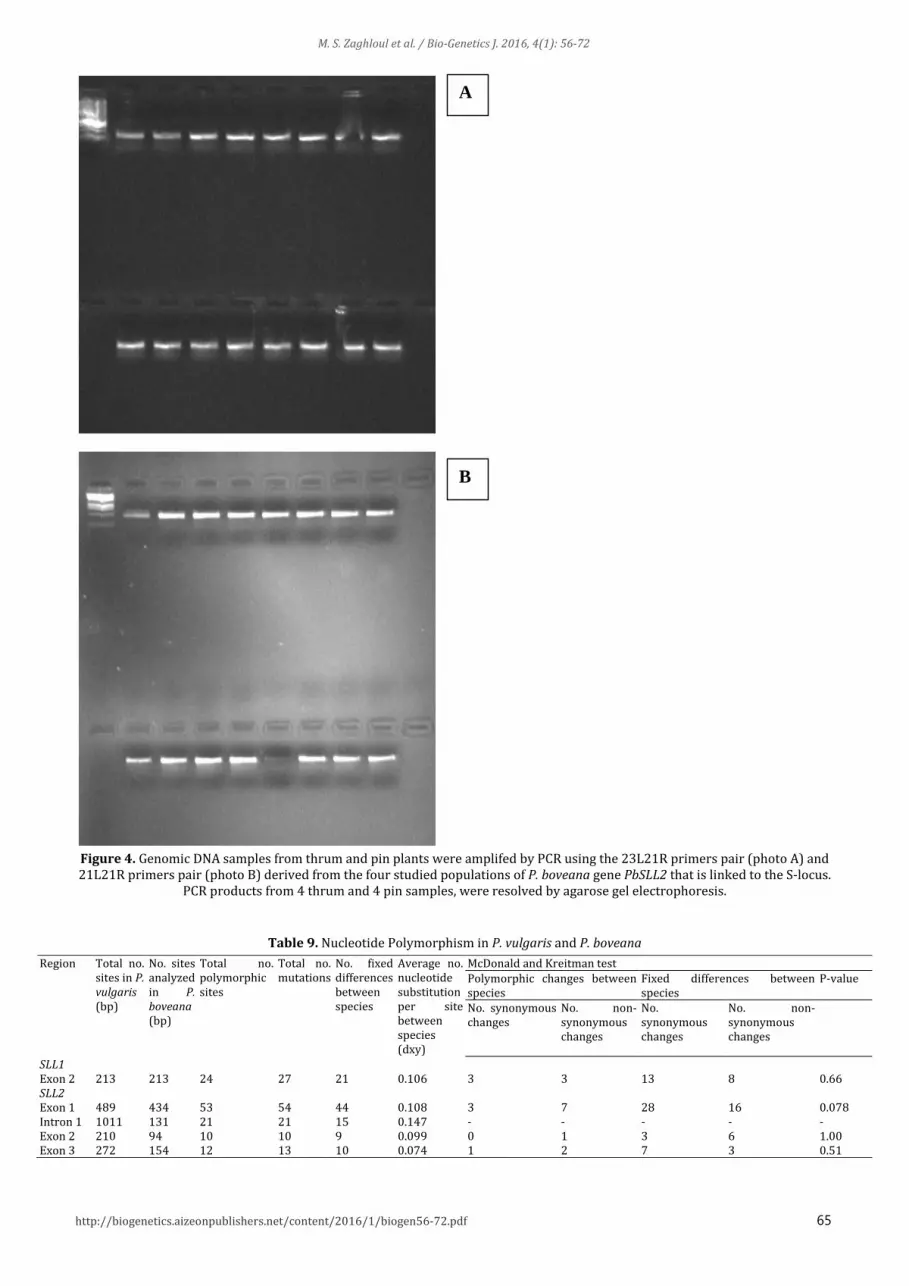
Figure 4. Genomic DNA samples from thrum and pin plants were amplifed by PCR using the 23L21R primers pair (photo A) and 21L21R primers pair (photo B) derived from the four studied populations of P. boveana gene PbSLL2 that is linked to the S-locus.
PCR products from 4 thrum and 4 pin samples, were resolved by agarose gel electrophoresis.
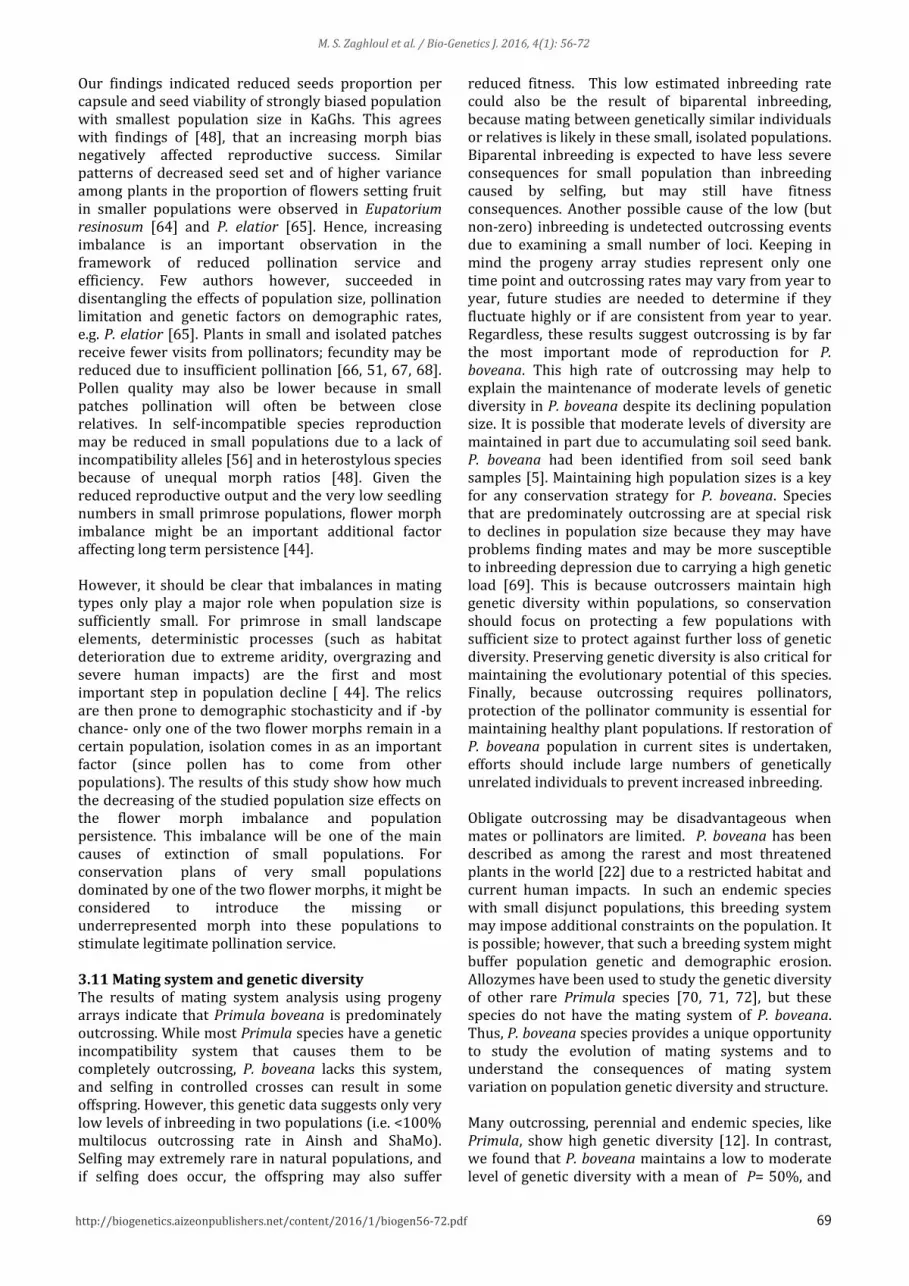
Table 9. Nucleotide Polymorphism in P. vulgaris and P. boveana
Region Total no. sites in P. vulgaris (bp)
No. sites analyzed in P. boveana (bp)
Total no. polymorphic sites
Total no. mutations
No. fixed differences between species
Average no. nucleotide substitution per site between species (dxy)
McDonald and Kreitman test Polymorphic changes between species
Fixed differences between species
P-value
No. synonymous changes
No. non- synonymous changes
No. synonymous changes
No. non- synonymous changes
SLL1 Exon 2
213
213
24
27
21
0.106
3
3
13
8
0.66
SLL2 Exon 1
489
434
53
54
44
0.108
3
7
28
16
0.078
Intron 1 1011 131 21 21 15 0.147 - - - - - Exon 2 210 94 10 10 9 0.099 0 1 3 6 1.00 Exon 3 272 154 12 13 10 0.074 1 2 7 3 0.51
B
A

66 http://biogenetics.aizeonpublishers.net/content/2016/1/biogen56-72.pdf
M. S. Zaghloul et al. / Bio-Genetics J. 2016, 4(1): 56-72
Table 10. Number of different genotypes (CC and CT) at SNP (Monomorphic plants have only pin flowers and dimorphic have both of pin and thrum flowers).
Pop. Plant type CC CT Ainsh Monomorphic 2 - Dimorphic 12 - ShaMo Monomorphic 3 - Dimorphic 10 - KaGhs Monomorphic - 2 Dimorphic 2 5 Garag Monomorphic 2 - Dimorphic 2 2
3.7 The sequence variation in S-Locus linked genes among populations More than 2kb of PbSLL2 and 212bp of PbSLL1 locus were sequenced in monomorphic and dimorphic plants of P. boveana from four populations (Fig 4). The sequenced region included parts of Exon 1, Intron 1, Exon 2 and Exon 3 for PbSLL2, and Exon 2 of PbSLL1 (Table 9). No stop codons were inferred, suggesting that genes at studied loci are functional. We detected a single variable site within P. boveana in intron 1 of
PbSLL2 (Fig 4). However, there was no association of this SNP to flower morph: both alleles were found with similar frequency in monomorphic and polymorphic plants (Table 9). There were geographic differences in allele frequency of this SNP in the four studied populations. The “T” allele was found only in KaGhs and Garag, while it was absent in Ainsh and ShaMo (Table 10). Because no sequence variation was found for PbSLL1, we were unable to test for an association of flower morph at this locus.
Exon 1
(64 bp)Exon 2
(213 bp)
Intron 1
(1464 bp )
P. vulgaris
Exon 2
(213 bp)
P. boveana
Figure 5. Predicted gene structure of the Exon 2 of PbSLL1 in alignment with PvSLL1.
3.8 Divergence of P. boveana from P. vulgaris The amino acids sequences from P. vulgaris for the coding regions aligned unambiguously with those from P. boveana. While we sequenced the entire intron for PbSLL2, only 131 sites of this region could be aligned with P. vulgaris due to the presence of extensive indels. The levels of sequence divergence between P. vulgaris and P. boveana were highest in Intron 1 and lowest in Exon3 of PbSLL2 (Table 9). The highest average number of nucleotide substitution per site between species was in the Intron 1 of PbSLL2 (0.147) and the lowest was in the Exon 3 of PvSLL2 (0.074). The highest fixed differences were 44 and existed in the Exon1 of SLL2, these differences were synonymous at 28 sites and non synonymous at 16 sites, while the lowest fixed differences were 9 and detected in Exon 2 of SLL2, there were 3 sites of synonymous and 6 sites of non synonymous changes. The maximum number of polymorphic sites (53 sites) was detected in Exon 1 of
SLL2, while the minimum number polymorphic sites (10 sites) in Exon 2 of SLL2. The polymorphic changes in Exon 1 at sites 365, 377 and 392 were synonymous while there were 7 non synonymous polymorphic sites in the same region. The results from the McDonald Kreitman test were not significant in any gene region. Primula has long been a model for evolutionary geneticists and botanists interested in the evolution of mating systems [16; 15; 17; 14]. The evolution of distyly in Primula section Sphondylia is thought to have evolved in response to historic isolation as populations have become isolated over the last millions of years before the mating system had arose [39]. The species in this section are nowadays isolated and scattered in the mountains of western and central Asia, presumably relict from cooler and wetter eras when their ancestors were more widespread in the intervening desert.

67 http://biogenetics.aizeonpublishers.net/content/2016/1/biogen56-72.pdf
M. S. Zaghloul et al. / Bio-Genetics J. 2016, 4(1): 56-72
Figure 6. Predicted gene structure of the Exon 1, Intron 2, Exon 2 and Exon 3 of PbSLL2 in alignment with PvSLL2.
3.9 Morphometric and sequence variations While most species within Primula are characterized by a typical mating system syndrome that includes both distyly and the diallelic incompatibility system, P. boveana has several key differences in its mating system from most of its congeners that makes it a compelling study species [22]. P. boveana lacks the diallelic genetic incompatibility system [39]. The present study showed that thrum-thrum crosses may produce fertile offspring, though at a high fitness cost. Unlike other Sphondylia, P. boveana develops pin and thrum style positions, but only one anther position (Fig 2). Also, while most Primula species have only monomorphic plants (i.e. plants with only pin or thrum flowers), P. boveana plants may be polymorphic (with both pin and thrum flowers on the same plant). Except the study that was conducted by [39] to follow the evolutionary development of distyly in eight species in Primula subgenus Sphondylia including P. boveana grown in only one site at St. Catherine Mountain, there is no information about reproductive success and heteromorphic pattern of P. boveana within and among its different populations in South Sinai. The most common conditions in heteromorphy are morphs with long styles, short stamens, small pollen and long stigmatic papillae (pin) and those with short styles, long stamens, large pollen and short stigmatic papillae (thrum). However, according to [15] about 16 characters can vary between heteromorphs, of which between two and seven can vary within a species [22]. Thus, there is a basic pattern of characters varying between morphs which is common to most genera (and furthermore which shows common relationships to the breeding system), yet there are many additional modifications within and between genera. Our data from the studied four P. boveana populations proved that corolla tube were significantly longer in short-styled (thrum morph) than in long-styled (pin morph),
which is the most common pattern in distylous species with anthers fixed directly onto the corolla tube (e.g.[ 40, 41]) According to the theory of reciprocity, stigma height must follow anther height as corolla length varies. Moreover, the distance between stigma and anther must be constant value irrespective of corolla length [40]. Our results supported the relationship between corolla tube and sex-organ heights, since slopes of all linear relationships differed significantly from zero, but considerable deviation from strict reciprocity was found in both morphs in the four populations. The considerable proportion of the variation in stigma and anther heights originates from the differences between the two floral morphs in the four populations of P. boveana. Long-style (LS) and short-style (SS) morphs can be distinguished almost unambiguously on the basis of stigma heights, whereas relative-anther heights are not as useful in distinction because of the extensive overlap between the two floral morphs (no significant variation was detected between pin and thrum morphs throughout the studied four populations). These findings agree with [39]. Even the anther height distribution was fairly overlapping among the P. boveana populations, the separation of the stigma and anthers within the flowers unambiguously supported the distylous structure. Previous studies proved that most species did not conform to the hypothetical expectation of constant value between stigma and anthers within the flowers and dependence on flower size could not be ignored (e.g.[42]). Stigmas and anthers were more much closer together in LS than in SS morph in some species, while herkogamy was more pronounced in LS than in SS morph in others (e.g. [42], [40]). In P. boveana, high significant variation of stigma-anther separation between thrum and pin flowers was detected. Stigmas and anthers were much closer in thrum SS than pin LS. The interpretation of the
Exon 1
(580 bp )
Exon 2
(86 bp )
Intron 1
(1592 bp )
P. boveane
Exon 3
(166 bp )
Exon 1
(489 bp )
Exon 2
(210 bp )
Intron 1
(1016 bp )
P. vulgaris
Exon 3
(272 bp )
Intron 2
(1539 bp )
(870
bp)
SNP

68 http://biogenetics.aizeonpublishers.net/content/2016/1/biogen56-72.pdf
M. S. Zaghloul et al. / Bio-Genetics J. 2016, 4(1): 56-72
functional significance of stigma-anther separation in hermaphrodite animal-pollinated plants is still under debate. It was proposed that separation of the sex-organs within the flowers did not serve solely to avoid selfing and inbreeding depression, but also to reduce the interference between pollen removal and deposition [21, 43]. Despite the association of the S-locus gene (PvSLL2) with flower morphs of Primula vulgaris, we did not find an association of the floral morphs in P. boveana. Because we did not sequence the entire locus for the genes, we cannot entirely rule out functionally important variation in these other gene regions. However, since the S-locus is a tightly linked region, we would have expected to see strong differences in allele frequencies between floral morphs if this gene or a closely linked gene was involved. Because we saw no association, it raises the possibly that a different genetic mechanism is involved. Distyly is thought to be controlled by a major diallelic locus, but this has not been tested in this species. A series of test crosses between monomorphic and polymorphic plant types in P. boveana could be used to explore the genetic basis of this trait. The observed SNP in intron 1 of PbSLL2 did show geographic differences among the four studied populations. The low level of sequence variation in P. boveana compared to P. vulgaris may be a result of many reasons including the declining in the population size [11, 44]. 3.10 Mating types and reproductive response Depending on their specificities, morph types can be expected to differently respond to habitat fragmentation. For instance, morph-specific differences in self- and intra- morph compatibility can confer a reproductive advantage under poor pollination service for the partially self-fertile morph because of increased seed output through intra-morph assortative mating [45]. However it can also lead to higher inbreeding levels [46] and inbreeding depression [47]. Only a few studies investigated reproductive response to habitat fragmentation at the morph level [47, 48, 49]. Little is still known whether morph specificities can contribute to reduce or increase reproductive success in small populations from fragmented habitats. Seed production is thought to be more sensitive to habitat fragmentation and isolation in heterostylous and dioecious plants than in plants with other breeding systems because the potential mating partners are more limited [50, 51]. Imbalances in pin-thrum ratios and relationships with pollination or reproductive output have been investigated in several studies e.g. [52, 53, 54. 47, 55]. Moreover, biased morph frequencies may interact with the limited pollinator attraction observed in small populations to further decrease seed set [56]. Viable seed is only set when pollination occurs between the pin and the thrum, or the thrum and the pin. Such crosses are termed ‘legitimate’. Nevertheless, in many species illegitimate pollinations (self, or crosses between plants of the same
morph) will result in some seeds-set, although fertility is never as great as for legitimate crosses [57]. When pins can be selfed, only pin seedlings result. However, when thrums are selfed, about two thrum seedlings are found for every pin seedling. True breeding thrums have rarely been reported although [58] reported the occurrence of rather unviable true-breeding SS thrums in P. sinensis. Thus, one can be sure that the thrum is usually a heterozygote Ss with the thrum features S dominant, while the pin is a homozygote ss. It follows that the offspring of a legitimate cross Ss X ss should be half thrum Ss and half pin ss and this does usually seem to be the case. Another consequence is that pin and thrum individuals should occur in the wild at roughly equal frequency, and this is also usually found. Excesses of pins or thrum would indicate that significant proportions of illegitimate fertilizations were occurring. Intuitively, it seems likely that the reciprocal positioning of the sites of pollen issue and pollen receipt in pins or thrums would increase the efficiency of legitimate pollen flow between the two mating types in insect pollinated flowers. They should also decrease illegitimate pollination and selfing [22]. A relatively strong within-morph incompatibility reaction is demonstrated in the populations of P. baveana under study. This is apparently in pin flowers, but in thrum flower good proportion of seeds was observed in illegitimately pollinated outcrossed flowers. The high proportion of seeds produced by the illegitimate outcrossing among the thrum flowers is more suggestive of a physiological breaking of incompatibility than experimental error. It can be attributed to the low frequency of pin flowers to the thrum flowers, which have been detected in all of the studied populations. [59] has shown that in P. obconica, the area of style conducting tissue in thrum is over twice that in the pin, and that the small area in the pin style may inhibit the growth of enough pollen tubes for all ovules to be fertilized. A comparable difference can be observed in P. veris [60]. It is also worth nothing that the thrum has a much shorter style, which may also facilitate access to the ovary by legitimate pollen tubes. In the legitimate cross, the mean of seeds proportion and seed viability are significantly higher than seeds proportion produced by the illegitimate outcrossing among thrum flower which confirm the experimental studies demonstrate that heterostyly functions to promote more effective pollinator-mediated pollen dispersal between plants than would occur in populations uniform in style length [61, 15, 62, 20, 63]. Due to reciprocal herkogamy, intermorph cross pollinations are favored over intramorph transfers because of segregated pollen deposition on different pollinator parts [19, 20]. In species with diallelic incompatibility, effective intermorph cross-pollination reduces pollen losses on incompatible stigmas resulting in more efficient male function. Heterostyly is therefore best interpreted as a floral design that increases male mating proficiency.
69 http://biogenetics.aizeonpublishers.net/content/2016/1/biogen56-72.pdf
M. S. Zaghloul et al. / Bio-Genetics J. 2016, 4(1): 56-72
Our findings indicated reduced seeds proportion per capsule and seed viability of strongly biased population with smallest population size in KaGhs. This agrees with findings of [48], that an increasing morph bias negatively affected reproductive success. Similar patterns of decreased seed set and of higher variance among plants in the proportion of flowers setting fruit in smaller populations were observed in Eupatorium resinosum [64] and P. elatior [65]. Hence, increasing imbalance is an important observation in the framework of reduced pollination service and efficiency. Few authors however, succeeded in disentangling the effects of population size, pollination limitation and genetic factors on demographic rates, e.g. P. elatior [65]. Plants in small and isolated patches receive fewer visits from pollinators; fecundity may be reduced due to insufficient pollination [66, 51, 67, 68]. Pollen quality may also be lower because in small patches pollination will often be between close relatives. In self-incompatible species reproduction may be reduced in small populations due to a lack of incompatibility alleles [56] and in heterostylous species because of unequal morph ratios [48]. Given the reduced reproductive output and the very low seedling numbers in small primrose populations, flower morph imbalance might be an important additional factor affecting long term persistence [44]. However, it should be clear that imbalances in mating types only play a major role when population size is sufficiently small. For primrose in small landscape elements, deterministic processes (such as habitat deterioration due to extreme aridity, overgrazing and severe human impacts) are the first and most important step in population decline [ 44]. The relics are then prone to demographic stochasticity and if -by chance- only one of the two flower morphs remain in a certain population, isolation comes in as an important factor (since pollen has to come from other populations). The results of this study show how much the decreasing of the studied population size effects on the flower morph imbalance and population persistence. This imbalance will be one of the main causes of extinction of small populations. For conservation plans of very small populations dominated by one of the two flower morphs, it might be considered to introduce the missing or underrepresented morph into these populations to stimulate legitimate pollination service. 3.11 Mating system and genetic diversity The results of mating system analysis using progeny arrays indicate that Primula boveana is predominately outcrossing. While most Primula species have a genetic incompatibility system that causes them to be completely outcrossing, P. boveana lacks this system, and selfing in controlled crosses can result in some offspring. However, this genetic data suggests only very low levels of inbreeding in two populations (i.e. <100% multilocus outcrossing rate in Ainsh and ShaMo). Selfing may extremely rare in natural populations, and if selfing does occur, the offspring may also suffer
reduced fitness. This low estimated inbreeding rate could also be the result of biparental inbreeding, because mating between genetically similar individuals or relatives is likely in these small, isolated populations. Biparental inbreeding is expected to have less severe consequences for small population than inbreeding caused by selfing, but may still have fitness consequences. Another possible cause of the low (but non-zero) inbreeding is undetected outcrossing events due to examining a small number of loci. Keeping in mind the progeny array studies represent only one time point and outcrossing rates may vary from year to year, future studies are needed to determine if they fluctuate highly or if are consistent from year to year. Regardless, these results suggest outcrossing is by far the most important mode of reproduction for P. boveana. This high rate of outcrossing may help to explain the maintenance of moderate levels of genetic diversity in P. boveana despite its declining population size. It is possible that moderate levels of diversity are maintained in part due to accumulating soil seed bank. P. boveana had been identified from soil seed bank samples [5]. Maintaining high population sizes is a key for any conservation strategy for P. boveana. Species that are predominately outcrossing are at special risk to declines in population size because they may have problems finding mates and may be more susceptible to inbreeding depression due to carrying a high genetic load [69]. This is because outcrossers maintain high genetic diversity within populations, so conservation should focus on protecting a few populations with sufficient size to protect against further loss of genetic diversity. Preserving genetic diversity is also critical for maintaining the evolutionary potential of this species. Finally, because outcrossing requires pollinators, protection of the pollinator community is essential for maintaining healthy plant populations. If restoration of P. boveana population in current sites is undertaken, efforts should include large numbers of genetically unrelated individuals to prevent increased inbreeding. Obligate outcrossing may be disadvantageous when mates or pollinators are limited. P. boveana has been described as among the rarest and most threatened plants in the world [22] due to a restricted habitat and current human impacts. In such an endemic species with small disjunct populations, this breeding system may impose additional constraints on the population. It is possible; however, that such a breeding system might buffer population genetic and demographic erosion. Allozymes have been used to study the genetic diversity of other rare Primula species [70, 71, 72], but these species do not have the mating system of P. boveana. Thus, P. boveana species provides a unique opportunity to study the evolution of mating systems and to understand the consequences of mating system variation on population genetic diversity and structure. Many outcrossing, perennial and endemic species, like Primula, show high genetic diversity [12]. In contrast, we found that P. boveana maintains a low to moderate level of genetic diversity with a mean of P= 50%, and

70 http://biogenetics.aizeonpublishers.net/content/2016/1/biogen56-72.pdf
M. S. Zaghloul et al. / Bio-Genetics J. 2016, 4(1): 56-72
this level falls lower than the range of those reported by [12] with a mean of P=54.4% for outcrossing, regionally distributed species. Our results are in agreement with those from other rare Primula species including P. vulgaris [73], P. veris [71], and P. eliater [72] and other long-lived perennial plant species [74]. This suggests that small population size of P. boveana has impacted its genetic diversity despite high rates of outcrossing in this species. The four populations of P. boveana showed relatively high genetic differentiation among populations even though they are geographic proximate (i.e. <4 km between the most distant sites). FST values suggested moderate differentiation among populations, and the AMOVA showed a high percent (38%) the total genetic variation found among populations. This genetic differentiation among populations may reflect a combination of historic isolation and recent reductions in population size and number. P. boveana has suffered a rapid decline in population size due to climate change and human impact. This species is restricted to habitat with persistent springs on high mountains, which now occur only in isolated relics. Its wild populations have been reduced from a few dozen populations to approximately four populations in South Sinai in only 20 years. Although Jime´nez [24] provided higher expected heterozygosity and differentiation levels using seven microsatellite markers, it still agree with our findings. Direct comparisons between the different methods when applied to the same plant material indicate lower similarity with the STMS-based data presumably due to insufficient number of analyzed microsatellite DNA loci [75]. The results showed also that the most geographically isolated site, Kahf El-Ghoula (KaGhs), was the most genetically distinct of the populations. The two populations in the same drainage that were also the most geographically close, Shaq Mousa (ShaMo) and Ain Shennarah (Ainsh), were also the most genetically similar. This suggests isolation by distance pattern where patterns of gene flow are related to geographic proximity along valley drainages. 3.12 Conservation implications All the above-mentioned circumstances show deep impact on the persistence of P. boveana populations in South Sinai. [76] stated that the Sinai Primrose has far been found on Gebel Catherine, Gebel Mousa, Gebel Safsafa, Gebel Serbal, and Gebel Umm Shaumer. It is now restricted only to five sites, mainly on north facing cliffs of Gebel Catherine. Given the current pressure on all the populations of this threatened species in Saint Katharine protectorate, for their preservation there is a need of measures improving the genetic composition of the populations as a complement to restoration measures intending to increase population sizes through higher recruitment. Restoring gene flow among small populations can contribute to ‘‘genetic rescue’’ [77, 78]. As seed dispersal is restricted in P. elatior, pollen-mediated gene flow appears to be the major component to restore. Primula boveana is insect-pollinated, and so pollinator movements and behaviour are determinant factors of pollen dispersal [79, 17, 80].
Within its isolated habitats, these factors will be influenced by the distance between populations, by the existing barriers for pollinators between populations and by the attractiveness of the populations (related to plant density and plant size) for pollinators e.g. [80, 81, 82]. When the fragment itself divided into patches, gene flow may be restored by increasing landscape connectivity through wooded biological corridors between its populations that facilitate pollinator dispersal [72, 78, 83]. Introduction strategies might also be considered to reinforce the genetic composition of small, highly isolated populations, but at the condition that it does not lead to the disruption of local adaptation (outbreeding depression) [84]. This effort will involve protecting P. boveana from being overgrazed, and teaching them the seed collection and cultivation practices to overcome the declining in its population composition. Balancing selection may slow the loss of genetic diversity, it would be recommended to work more on increasing populations size of the studied populations by introducing seeds produced from the common garden experiment through intermoph crosses which show high viability.
4. Acknowledgments The authors wish to thank Prof. Jim Hamrick for facilitating and helping in isozyme analysis, Dr. Shu-mei chang for helping in Crosses, and Cecile Deen for technical assistance. This research was supported by a grant from the Emission Department, Higher Education Ministry, Egypt, to Hassan Mansour through a Ph.D. Joint supervision system scholarship.
5. REFERENCES 1. Myers N, RA Mittermeier, CG Mittermeier, et al., 2000
Biodiversity hotspots for conservation priorities. Nature 403: 853-858.
2. Wendelbo P 1961 Studies in Primulaceae. II. An account of Primula subgenus Sphenodylia with review of the sections of the genus. Aarbok Universitet Bergen, Matematisk- Natur videnskapelig 11: 1-49.
3. Moustafa AA, AA Ramadan, MS Zaghloul et al. 2001a Characteristics of two endemic and endangered species (Primula boveana and Kickxia macilenta) growing in South Sinai. Egyptian Journal of Botany 41: 17-39.
4. Thompson JD 2005 Plant evolution in the Mediterranean. Oxford University Press, New York, New York, USA.
5. Zaghloul MS 1997 Ecological studies on some endemic plant species in South Sinai, Dissertation, Suez Canal University.
6. Moustafa AA, MS Zaghloul, RH Abdel-Wahab et al. 2001b Evaluation of plant diversity and endemism in Saint Catherine Protectorate, South Sinai, Egypt. Egyptian Journal of Botany 41: 123-141.
7. Frankham R 2005 Genetics and extinction. Biological Conservation 126: 131-140.
8. Jump AS, R Marchant, J Penuelas 2009 Environmental change and the option value of genetic diversity. Trends in plant science 14: 51-58
9. Young A, Boyle T, Brown A (1996) The Population genetic consequences of habitat fragmentation for plants. Trends in Ecology and Evolution 11: 413-419.
10. Schemske DW, BC Husband, MH Rukelshaus et al. 1994 Evaluating approaches to the conservation of rare and endangered plants. Ecology 75: 584-606.
11. Frankham R, JD Ballou, DA Briscoe 2002 Introduction to conservation genetics. Smithsonian institution, Cambridge University Press, UK.

71 http://biogenetics.aizeonpublishers.net/content/2016/1/biogen56-72.pdf
M. S. Zaghloul et al. / Bio-Genetics J. 2016, 4(1): 56-72
12. Hamrick JL, MJW Godt 1996 Effects of life history traits on genetic diversity in plant species. Phil. Trans. R. Soc. Lond. B. 351: 1291-1298.
13. Nason JD, NC Ellstrand 1995 Lifetime estimates of biparental inbreeding depression in the self-incompatible annual plant Raphanus sativus. Evolution 49: 307- 316.
14. Barrett SCH, LK Jesson, AM Baker 2000 The evolution and function of stylar polymorphisms in flowering plants. Annual review of Botany 85: 253-265.
15. Ganders FR 1979 The biology of heterostyly. NZ. Journal of Botany 17: 607-35.
16. Darwin C 1862 On the two forms or dimorphic conditions in the species of Primula and on their remarkable sexual relations. J. Proc. Linn. Soc. Bot. 6: 77-96.
17. Richards AJ 1997 Plant Breeding Systems. 2nd edn. London: Chapman and Hall, Cambridge.
18. Webb CJ, DG Lloyd 1986 The avoidance of interference between presentation of pollen and stigmas in angiosperms II. Herkogamy. NewZealand Journal of Botany 24: 163-178.
19. Wolfe LM, SCH Barrett 1989 Patterns of pollen removal and deposition in tristylous Pontederia cordata L. (Pontederiaceae). Biological Journal of the Linnean Society 36: 317-329.
20. Lloyd DG, CJ Webb 1992 The selection of heterostyly. In: Barrett SCH (ed.) Evolution and function of heterostyly. Berlin: Springer Verlag, pp 179-208.
21. Barrett SCH 2002 The evolution of plant sexual diversity. Nature Reviews Genetics
22. Richards AJ 1993 Primula. London: Batsford 274-284 23. Moustafa AA; AA Ramadan; MS Zaghloul et al. 1999
Environmental factors affecting endemic species, species richness and diversity in Saint Catherine Protectorate, South Sinai, Egypt. Journal of Arab Union of Biologists 9(B): 419-446
24. Jiménez A, H Mansour, B Keller et al. 2014 Low genetic diversity and high levels of inbreeding in the Sinai primrose (Primula boveana), a species on the brink of extinction. Plant Systematics and Evolution 300: 1199-1208.
25. Sokal R, FJ Rohlf 1981 Biometry. WH Freeman and Company, San Francisco.
26. SAS Institute 2005 JMP version 6.0. 27. Soltis DE, CH Haufler, DC Darrow et al. 1983 Starch-gel
electrophoresis of ferns: a compilation of grinding buffers, gel and electrode buffers, and staining schedules. American Fern Journal 73: 9-27
28. Peakall R, PE Smouse 2006 GENALEX 6: genetic analysis in Excel. Population genetic software for teaching and research. Molecular Ecology Notes 6:288-295.
29. Wright S 1965 The interpretation of population structure by F-statistics with special regard to systems of mating. Evolution 19: 395-420
30. Excoffier L, PE Smouse, JM Quattro 1992 Analysis of molecular variance inferred from metric distances among DNA haplotypes: application to human mitochondrial DNA restriction data. Genetics 131: 479-491.
31. Michalakis Y, L Excoffier 1996 A generic estimation of population subdivision using distances between alleles with special reference for microsatellite loci. Genetics 142: 1061-1064.
32. Nei M 1972 Genetic distance between populations. American Naturalist 106: 283-292.
33. Yeh FC, R Yang, T Boyle 1999 POPGENE version 1.31: Microsoft Windows-based Freeware for Population Genetic Analysis
34. Nei M 1978 Estimation of average heterozygosity and genetic distance from a small number of individuals. Genetics 89: 583-590.
35. Ritland, K. & Jain, S. 1981 A model for the estimation of outcrossing rate and gene frequencies using n independent loci. Heredity, 47, 35-52.
36. Ritland, K. (2002) Extensions of models for the estimation of mating systems using n independent loci. Heredity, 88, 221-228.
37. Li J, Webster MA, Furuya M, Gilmartin PM. 2007. Identification and characterization of pin and thrum alleles of two genes that co-segregate with the Primula S locus. Plant Journal 51: 18–31.
38. Larkin MA, G Blackshields, NP Brown et al. 2007 Clustal W and Clustal X version 2.0. Bioinformatics 23: 2947-2948.
39. Al Wadi H, AJ Richards 1993 Primary homostyly in Primula L. subgenus Sphondylia (Duby) Rupr. and the evolution of distyly in Primula. New Phytol 124: 329-338.
40. Faivre AE, LA McDade 2001 Population-level variation in the expression of heterostyly in three species of Rubiaceae: Does reciprocal placement of anthers and stigmas characterize heterostyly? American Journal of Botany 88: 841-853.
41. Kalman K, A Medvegy, E Mihalik 2004 Pattern of the floral variation in hybrid zone of two distylous Primula species. Flora 199: 218-227.
42. Pailler T, L Humeau, JD Thompson 1998 Distyly and heteromorphic incompatibility in oceanic island species of Erythroxylum (Erythroxylaceae). Plant Systematic and Evolution 213: 187-198
43. Parra-Tabla V, SH Bullock 2005 Ecological and selective effects of stigma-anther seperation in the self-incompatible tropical tree Ipomoea wolcottiana (Convolvulaceae). Plant Systematic and Evolution 252: 85-95.
44. Endels P, H Jacquemyn, R Brys, et al. 2002 Temporal changes (1986–1999) in populations of primrose (Primula vulgaris Huds.) in an agricultural landscape and implications for conservation. Biological Conservation 105: 11-25.
45. Matsumura C, I Washitani 2000 Effect of population size and pollination limitation on seed-set of Primula sieboldii populations in a fragmented landscape. Ecological Research 15: 307-322.
46. Eckert CG, Barrett SCH 1994 Inbreeding depression in partially self-fertilizing Decodon verticillatus (Lythraceae): population-genetic and experimental analyses. Evolution 48: 952-964.
47. Mateu-Andrés I, JG Segarra-Moragues 2004 Reproductive system in the Iberian endangered endemic Antirrhinum valentinum F.Q. (Antirrhineae, Scrophulariaceae): consequences for species conservation. International Journal Plant Science 165: 773-778.
48. Kéry M, D Matthies, B Schmid 2003 Demographic stochasticity in population fragments of the declining distylous perennial Primula veris (Primulaceae). Basic and Applied Ecology 4: 197-206.
49. Waites AR, J Agren 2004 Pollinator visitation, stigmatic pollen loads and among population variation in seed set in Lythrum salicaria. Journal of Ecology 92: 512-526
50. Demauro MM 1993 Relationship of breeding system to rarity in the lakeside of daisy (Hymenoxys acaulis var. glabra). Conservation Biology 7: 542-550.
51. Agern J 1996 Population size, pollinator limitation, and seed set in the self-incompatible herb Lythrum salicaria. Ecology 77: 1779-1790.
52. Woodel SRJ 1960 What pollinates Primulas ? The New Scientist 8: 568-571
53. Lees DR 1971 Frequency of pin and thrum plants in a wild population of the Cowslip, Primula veris L. Watsonia 8: 289-291.
54. Piper JG, B Charlesworth, D Charlesworth 1984 A high rate of self-fertilization and increased seed fertility of homostyle Primroses. Nature 310: 50-51.
55. Jacquemyn H, K Vandepitte, I Roldan-Ruiz, et al. 2009 Rapid loss of genetic variation in a founding population of Primula elatior (Primulaceae) after colonization. Annals of Botany 103: 777-783.
56. Byers DL 1995 Pollen quantity and quality as explanation for low seed set in small populations exemplified by Eupatorium (Asteraceae). American Journal of Botany 82: 1000-1006.
57. Wedderburn FM, AJ Richards 1990 Variation in within-morph incompatibility inhibition sites in heteromorphic Primula L. New Phytol 116: 149-162.
58. Mather K, D De Winton 1941 Adaptation and counter adaptation of the breeding system in Primula. Annals Botany II 5: 297-311.
59. Dowrick VPJ 1956 Heterostyly and homostyly in Primula obconica. Heredity 10: 219-236.
60. Ibrahim H 1979 Population studies in Primula veris L. and Primula vulgaris Huds. Dissertation, University of Newcastle upon Tyne, England.
61. Darwin C 1877 The different forms of flowers on plants of the same species. John Murray, London.

72 http://biogenetics.aizeonpublishers.net/content/2016/1/biogen56-72.pdf
M. S. Zaghloul et al. / Bio-Genetics J. 2016, 4(1): 56-72
62. Kohn JR, SCH Barrett 1992 Experimental studies on the functional significance of heterostyly. Evolution 46: 43-55.
63. Stone JL, JD Thompson 1994 The evolution of distyly: Pollen transfer in artificial flowers. Evolutionl 48: 1595-1606.
64. Byers DL, TR Meagher 1992 Mate availability in small populations of plant species with homomorphic sporophitic self-incompatibility. Heredity 68: 353-359.
65. Jacquemyn H, R Brys, M Hremy 2002 Patch occupancy, population size and reproductive success of a forest herb (Primula elatior) in a fragmented landscape. Oecologia 130: 617-625.
66. Lamont BB, PGL Klinkhamer, ETF Witkowski 1993 Population fragmentation may reduce fertility to zero in Banksia goodii - a demonstration of the Allee effect. Oecologia 94: 446-450.
67. Groom MJ 1998 Allee effects limit population viability of an annual plant. American Naturalist 151: 487-496.
68. Steffan-Dewenter I, T Tscharntke 1999 Effects of habitat isolation on pollinator communities and seed set. Oecologia 121: 432-440.
69. Charlesworth D, B Charlesworth 1987 Inbreeding depression and its evolutionary consequences. Annual Review in Ecology and Systematic 18: 237-268
70. Glover BJ, RJ Abbott 1995 Low genetic diversity in the Scottish endemic Primula scotica Hook. New Phytol 129: 147-153.
71. Van Rossum F, L Triest 2006 Fine-scale genetic structure of the common Primula elatior (Primulaceae) at an early stage of population fragmentation. American Journal of Botany 93:1281-1288.
72. Van Rossum F 2008 Conservation of long-lived perennial forest herbs in an urban context: Primula elatior as study case. Conservation Genetics 9: 119-128.
73. Van Rossum F, S Campos De Sousa, L Triest 2004 Genetic consequences of habitat fragmentation in an agricultural landscape on the common Primula veris, and comparison with its rare congener, P. vulgaris. Conservation Genetics 5: 231-245.
74. Young A, AHD Brown, FA Zich 1999 Genetic structure of fragmented populations of the endangered daisy Rutidosis leptorrhynchoides. Conservation Biology 13: 256-265.
75. Nybom H 2004 Comparison of different nuclear DNA markers for estimating intraspecific genetic diversity in plants. Molecular Ecology 13: 1142-1155.
76. Danin A 1983 Desert vegetation of Israel and Sinai. Cana Publishing House, Jerusalem.
77. Newman D, DA Tallmon 2001 Experimental evidence for beneficial fitness effects of gene flow in recently isolated populations. Conservation Biology 15:1054–1063
78. Volis S, G Bohrer, JGB Oostermeijer et al. 2005 Regional consequences of local population demography and genetics in relation to habitat management in Gentiana pneumonanthe. Conservation Biology 19: 357-367.
79. Inouye DW, DE Gill, MR Dudash et al. 1994 A model and lexicon for pollen fate. American Journal of Botany 81:1517-1530
80. Kwak MM, O Velterop, J van Andel 1998 Pollen and gene flow in fragmented habitats. Applied Vegetation Science 1: 37-54.
81. Ghazoul J 2005 Pollen and seed dispersal among dispersed plants. Biological Review 80:413-443.
82. Kunin WE 1997 Population size and density effects in pollination: pollinator foraging and plant reproductive success in experimental arrays of Brassica kaber. Journal of Ecology 85: 225-234.
83. Pirnat J 2000 Conservation and management of forest patches and corridors in suburban landscapes. Landscape Urban Plan 52: 135-143.
84. Vergeer P, E Sonderen, NJ Ouborg 2004 Introduction strategies put to the test: local adaptation versus heterosis. Conservation Biology 18: 812-821
*****
© 2016; AIZEON Publishers; All Rights Reserved
This is an Open Access article distributed under the terms of the Creative Commons Attribution License which permits unrestricted use, distribution, and reproduction in any medium, provided the original work is properly cited.