evidence that pairing with genetically similar mates is maladaptive in a monogamous bird
TRANSCRIPT

BioMed CentralBMC Evolutionary Biology
ss
Open AcceResearch articleEvidence that pairing with genetically similar mates is maladaptive in a monogamous birdHervé Mulard*1,2,3,6, Etienne Danchin1,3, Sandra L Talbot4, Andrew M Ramey4, Scott A Hatch4, Joël F White1,2,3, Fabrice Helfenstein5 and Richard H Wagner2Address: 1Laboratoire Fonctionnement et Évolution des Système Écologiques, CNRS-UMR 7103, Ecology Institute, Université Pierre et Marie Curie-Paris 6, 7 Quai St Bernard, 75005 Paris, France, 2Konrad Lorenz Institute for Ethology, Austrian Academy of Sciences, Savoyenstrasse 1a, A-1160 Vienna, Austria, 3Laboratoire Évolution et Diversité Biologique, UMR 5174, Université Paul Sabatier, 118 Route de Narbonne, 31962 Toulouse Cedex 9, France, 4U.S. Geological Survey, Alaska Science Center, 4210 University Drive, Anchorage, Alaska, 99508, USA, 5Evolutionary Ecology Group, Institute of Ecology and Evolution, University of Bern, Baltzerstrasse 6, 3012 Bern, Switzerland and 6Laboratoire d'Écologie et de Neuro-Éthologie Sensorielles, Université Jean Monnet, 23 Rue Paul Michelon, 42023 Saint-Étienne Cedex 03, France
Email: Hervé Mulard* - [email protected]; Etienne Danchin - [email protected]; Sandra L Talbot - [email protected]; Andrew M Ramey - [email protected]; Scott A Hatch - [email protected]; Joël F White - [email protected]; Fabrice Helfenstein - [email protected]; Richard H Wagner - [email protected]
* Corresponding author
AbstractBackground: Evidence of multiple genetic criteria of mate choice is accumulating in numeroustaxa. In many species, females have been shown to pair with genetically dissimilar mates or withextra-pair partners that are more genetically compatible than their social mates, thereby increasingtheir offsprings' heterozygosity which often correlates with offspring fitness. While most studieshave focused on genetically promiscuous species, few studies have addressed geneticallymonogamous species, in which mate choice tends to be mutual.
Results: Here, we used microsatellite markers to assess individual global heterozygosity andgenetic similarity of pairs in a socially and genetically monogamous seabird, the black-leggedkittiwake Rissa tridactyla. We found that pairs were more genetically dissimilar than expected bychance. We also identified fitness costs of breeding with genetically similar partners: (i) geneticsimilarity of pairs was negatively correlated with the number of chicks hatched, and (ii) offspringheterozygosity was positively correlated with growth rate and survival.
Conclusion: These findings provide evidence that breeders in a genetically monogamous speciesmay avoid the fitness costs of reproducing with a genetically similar mate. In such species that lackthe opportunity to obtain extra-pair fertilizations, mate choice may therefore be under highselective pressure.
BackgroundNumerous traits influence mate choice that may producenon-random mating patterns in many species. Althoughmost studies have focused on morphological and behav-
ioral traits [1-4]), there is rapidly growing evidence ofmultiple genetic criteria of mate choice (reviewed in[5,6]). For example, females might choose the most heter-ozygous males [7], which may increase the resistance of
Published: 30 June 2009
BMC Evolutionary Biology 2009, 9:147 doi:10.1186/1471-2148-9-147
Received: 15 January 2009Accepted: 30 June 2009
This article is available from: http://www.biomedcentral.com/1471-2148/9/147
© 2009 Mulard et al; licensee BioMed Central Ltd. This is an Open Access article distributed under the terms of the Creative Commons Attribution License (http://creativecommons.org/licenses/by/2.0), which permits unrestricted use, distribution, and reproduction in any medium, provided the original work is properly cited.
Page 1 of 12(page number not for citation purposes)

BMC Evolutionary Biology 2009, 9:147 http://www.biomedcentral.com/1471-2148/9/147
offspring to parasites [8,9]. Alternatively, females mightchoose males carrying alleles that are compatible withtheir own genotypes. The main driving forces of matechoice would then be to maintain equilibrium betweenco-adapted genes [10] or alternatively, to enhance thegenetic variability of offspring [11-16].
In species with biparental care, both sexes should bechoosy in selecting a mate [17,18]. Blomqvist et al. [14]reported that in socially monogamous shorebirds, bothsexes obtained extra-pair fertilizations when mates weregenetically similar. In blue tits (Parus caeruleus), femalesacquired extra-pair fertilizations that enhanced the heter-ozygosity and fitness of their offspring [19]. In superbstarlings (Lamprotornis superbus), the benefits of extra-pairfertilizations may differ according to the genetic similarityof the extra-pair partner [20]. However, few studies havefocused on the mating patterns in genetically monoga-mous species which lack extra-pair fertilizations to dimin-ish the costs of pairing with a suboptimal mate.
The black-legged kittiwake (Rissa tridactyla) is a long-lived,monogamous seabird with no extra-pair fertilizations[21] and high between-year repairing rates [22-25]. In thisspecies, mate choice may thus profoundly affect reproduc-tive success throughout an individual's lifetime. To exam-ine whether mating patterns in kittiwakes are influencedby genetic criteria, we assessed individual heterozygosityand genetic similarity of mates with microsatellite mark-ers.
Our first aim was to examine three hypotheses of matingpatterns driven by individual genotypes. Breeders may bepaired with: (1) heterozygous mates ("preference of heter-ozygous mates" hypothesis; [15]), (2) genetically dissimi-lar mates, in order to increase the genetic variability ofoffspring ("genetic similarity avoidance" hypothesis;[14,26,27]), or (3) genetically similar mates, in order topreserve the link between locally co-adapted genes("genetic similarity preference" hypothesis; [10,28]).According to Hypothesis 1, the most heterozygous matesare of better quality because they may provide direct ben-efits (e.g., better parental care) and/or indirect benefits interm of more heterozygous offspring. The hypothesis pre-dicts that paired individuals are more heterozygous thanunpaired ones, and that there a positive correlationbetween male and female heterozygosity [7]. Hypothesis2 predicts that the observed mean genetic similaritybetween pair members is lower than expected throughrandom matings. Hypothesis 3 is the reverse of Hypothe-sis 2 and predicts that mates share more alleles thanexpected by chance, meaning that the observed meangenetic similarity between pair members will be higherthan expected through random matings.
Our second aim was to examine the fitness consequencesof breeding with genetically similar or dissimilar individ-uals. We searched for possible relationships betweengenetic characteristics of pairs and fitness componentssuch as clutch size and hatching success [29,30]. Becausegenetically similar pairs are more likely to producehomozygous offspring than dissimilar pairs, we alsoexamined predicted relationships between offspring het-erozygosity and their growth and survival.
Microsatellites are generally assumed to be neutral geneticmarkers and have been widely used to estimate related-ness, individual heterozygosity and population level ofinbreeding [31-34]. If heterozygosity at certain selectedloci enhances fitness [8,15], heterozygosity at microsatel-lite loci may be a good surrogate of the overall geneticquality of an individual, especially in wild species wherelittle is known about genes under selection. However,Lieutenant-Gosselin & Bernatchez [35] and Tiira et al. [36]have shown that global heterozygosity might be highlyinfluenced by heterozygosity at certain specific loci. Suchloci may be physically linked to fitness loci, and oneshould therefore distinguish effects of global heterozygos-ity from effects of heterozygosity at each microsatellitemarker. Thus we performed our analyses both with theglobal heterozygosity and with the heterozygosity at eachlocus in order to distinguish the effects of global heterozy-gosity from that of specific loci that might be physicallylinked to fitness loci.
ResultsWe monitored 348 genotyped adults in 2003 and 2004:241 were seen alive in 2003 and 289 in 2004. Adultsformed 74 pairs in 2003 and 72 in 2004; the remainingadults for each year corresponded to unpaired adults oradults paired with non-genotyped mates. All these adultswere included in the bootstrap analyses because they werealive in the considered year and thus potentially availablefor pairing.
For chicks with genotyped parents, we found that Phmxy ofthe parents was closely related to all indices of offspringheterozygosity (82 chicks, p < 0.007), confirming thatPhmxy might be a reliable estimate of the probability of agiven pair of producing homozygous offspring. Further-more, Phmxy of pairs used in our study exhibited a wide,six-fold range of variation (from 0.06 to 0.39, mean: 0.18+/- 0.06).
Mating pattern and geneticsTo correct for linkages between loci, OHW loci and K31were excluded from calculations of H, SH and IR, butresults did not differ with all loci. The "preference of het-erozygous mates" hypothesis (hypothesis 1) predicted
Page 2 of 12(page number not for citation purposes)

BMC Evolutionary Biology 2009, 9:147 http://www.biomedcentral.com/1471-2148/9/147
assortative mating by heterozygosity. However, male andfemale H were not correlated for any year (r ranging from0.021 to 0.10, p ranging from 0.38 to 0.86). Results werethe same for SH (0.02 ≤ r ≤ 0.13, 0.26 ≤ p ≤ 0.87) and IR(0.05 ≤ r ≤ 0.10, 0.38 ≤ p ≤ 0.67). Heterozygosity of pairedand unpaired individuals did not differ (for all indices: in2003, t2,241 < 1.93, p > 0.06; in 2004, t2,241 < 1.25, p >0.21).
The "genetic similarity avoidance" hypothesis (hypothesis2) predicted that observed pairs comprise less geneticallysimilar individuals than expected by chance. To test this,for each year we ran 10,000 bootstraps using the observedindividuals. For each run, we used either a calculationacross all loci, or excluding OHW loci (Table 1). We founda significant difference in terms of genetic similaritybetween observed and simulated pairs in 2003 and 2004(Figure 1), indicating that pairs were formed of moregenetically dissimilar individuals than expected bychance.
When pooling pairs seen in 2003 and 2004 (one observa-tion for each pair, column "all pairs" in Table 1), we stillfound a significant difference in genetic dissimilaritybetween observed and simulated pairs. Results were simi-lar when taking only pairs of kittiwakes breeding togetherboth years (considered as "stable pairs", Table 1). Becauseof a low divorce rate, we lacked a sufficient sample tocompare the genetic similarity of divorced versus reunitedpairs.
The "genetic similarity preference" hypothesis (hypothe-sis 3) predicts that mates share more alleles than expectedby chance. This means that observed pairs should com-
prise more genetically similar individuals than expectedby chance. We would then expect to have a p-value forPhmxy higher than 0.95, which we did not find (Table 1).
Reproductive success and genetic similarityWe used only 2003 data to determine the number of eggslaid and the number and proportion of eggs hatched,because the reproductive success of some of the pairs in2004 and subsequent years may have been affected byother experiments after pair formation. Genetic similarityindices were computed without OHW loci and K31. Thenumber of eggs laid was not correlated with pair geneticsimilarity (χ2
72 = 0.01, p = 0.91, n = 74). However, forpairs that laid eggs, the number of hatched chicks was cor-related with Phmxy (χ2
69 = 4.0, p = 0.045, n = 71), with themean number of chicks hatched being lower in moregenetically similar pairs (Figure 2). Similarly, hatchingrate was also negatively correlated with Phmxy (χ2
69 = 4.0,p = 0.045, n = 71).
Offspring growth and survival in relation to offspring heterozygosityChicks were not genotyped for K67 (because of low varia-bility). In 2005, we assessed the survival and growth inbody weight, tarsus and wing length of 82 chicks until age25 days. These life history parameters were highly corre-lated to hatching rank (χ2 > 12, p < 0.001 in all analyses).The hatching rank*chick heterozygosity interactions werenon-significant for all heterozygosity indices (p > 0.6) andwere thus discarded from the models. Chick survival waspositively correlated with chick heterozygosity for all indi-ces (H: χ2 = 5.2, p = 0.022, see Figure 3; SH: χ2 = 4.7, p <0.03; IR: χ2 = 4.5, p = 0.03), but became non-significantwhen removing OHW loci and K31 from the computationof chick heterozygosity (H: χ2 = 3.6, p = 0.06; SH: χ2 = 2.5,p = 0.11; IR: χ2 = 3.3, p = 0.07).
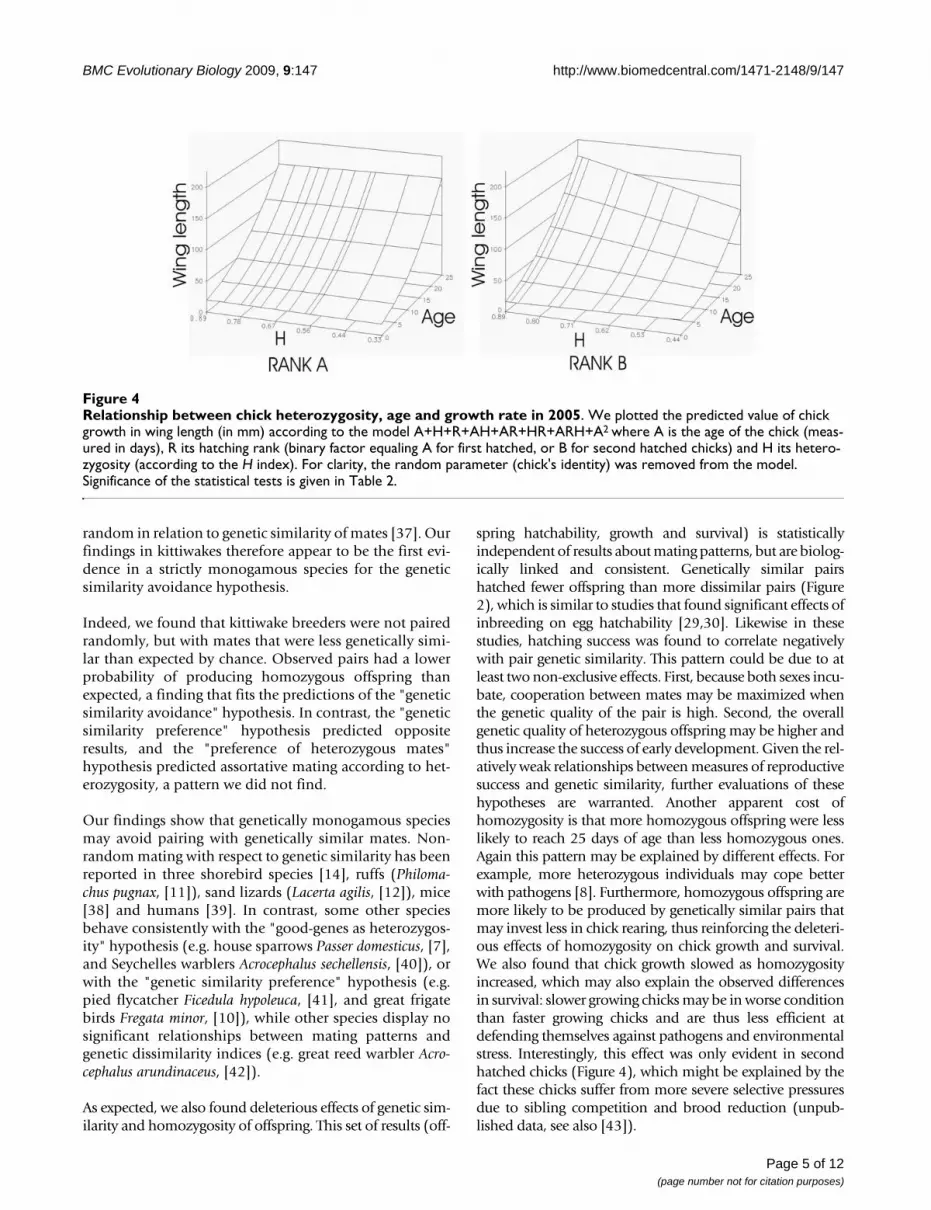
When analyzing chick growth in body weight, wing andtarsus length, we found a significant interaction ofAge*Chick heterozygosity*Hatching rank (p < 0.017,when chick heterozygosity was calculated over all loci, p <0.089 when chick heterozygosity was calculated withoutOHW loci and K31; Table 2 and Additional file 1). Thiseffect of chick heterozygosity on chick growth was how-ever only evident for B-chicks (Table 2, see Figure 4 for arepresentation of this effect on chick growth in winglength).
Local effects and global effects of microsatellite lociFor mating patterns in 2003, we found that pairs wereformed of genetically dissimilar individuals according tothree of the 10 loci (Phm index for K32, K6 and K71).Hatching success was negatively correlated to genetic sim-ilarity of pairs in 2003 for two loci (Phm index for K32 andRBG20). Chick heterozygosity and survival until 25 days(in 2005) were positively correlated only for RBG29 (H
Distribution of genetic similarity (calculated with the Phm index) in pairs observed in 2003 and/or 2004Figure 1Distribution of genetic similarity (calculated with the Phm index) in pairs observed in 2003 and/or 2004. Black bars represent the percentage of observed pairs (n = 92) and white bars represent a random distribution of the Phm of pairs obtained by simulating 10,000 pairings. Phm was calculated with all ten loci. Kittiwake pairs were less geneti-cally similar than expected by chance (p = 0.016).
0
0.05
0.1
0.15
0.2
0.25
0.3
0.35
0.05 0.
1
0.15 0.
2
0.25 0.
3
0.35 0.
4
0.45 0.
5
0.55 0.
6
>=0.
6
Phm
Pro
po
rtio
n o
f p
airs
Page 3 of 12(page number not for citation purposes)

BMC Evolutionary Biology 2009, 9:147 http://www.biomedcentral.com/1471-2148/9/147
index, p = 0.027; p > 0.1 for all other loci). For chickgrowth, we found that the parameters associated with theinteractions Age*Heterozygosity and Age*Heterozygos-ity*Rank were significant in explaining chick growth inbody weight and wing length when chick heterozygositywas estimated through three of the nine loci (H index forK16, K31, K32). Similarly, the parameters associated withthe interactions Age*Heterozygosity and Age*Heterozy-gosity*Rank were significant in explaining chick growthin tarsus length when chick heterozygosity was calculatedwith two loci (H index for K31 and K32).
DiscussionOur main objective was to examine predicted relation-ships between genetic variables and mating patterns in agenetically monogamous species. Selective pressures onmate choice may be stronger in such species, which do notmitigate the costs of homozygous offspring with extra-pair fertilizations. To our knowledge, there is only oneother study of this kind of genetically monogamous spe-cies, the New Zealand robin (Petroica australis) and saddle-backs (Philesturnus carunculatus), in which pairings were
Table 1: Differences between observed and simulated means of genetic similarity of mates
Phm (prob. of producing a homozygous offspring)
All pairs in both years Stable pairs in both years 2003 2004
Pairs (P) 92 58 74 72
Adults (N) 348 348 241 289
All loci 0.184 0.182 0.181 0.1840.199 0.199 0.196 0.2010.016 0.029 0.021 0.018
Without OHW loci 0.172 0.171 0.162 0.1740.189 0.189 0.184 0.1910.026 0.048 0.005 0.043
Distributions of Phm estimated by performing 10,000 random repairings of P pairs among the N possible adults and calculating the simulated mean genetic similarity between mates. For each estimate, the first provides the observed mean genetic similarity between mates for the population and the second line reports the simulated mean, the last line is the p-value calculated as the proportion of bootstraps having a mean genetic similarity between mates lower than the observed mean. Significant p-values are in bold. The first column contains the results for both years combined (each pair counted only once), the second contains the results for all years combined using only pairs breeding together in both years (with again each pair counted only once).
Relationship between number of hatched chicks and Phm in 2003Figure 2Relationship between number of hatched chicks and Phm in 2003. Here, the probability of producing a homozygous offspring (Phm) was calculated excluding out of Hardy-Weinberg (OHW) loci, but results were similarly sig-nificant with all ten loci. The number of hatched chicks decreased significantly with genetic similarity of pairs (see the text for statistical tests).
Relationship between heterozygosity and chick survival in 2005Figure 3Relationship between heterozygosity and chick sur-vival in 2005. We show the correlation between chick sur-vival up to 25 days of age and chick heterozygosity estimated by the H index calculated over all loci. Chicks that survived 25 days were significantly more heterozygous than chicks that died (see the text for statistical tests).
0.5
0.55
0.6
0.65
0.7
0.75
0.8
0.85
0.9
Rank A Rank B
Chick's hatching rank
Het
ero
zyg
osi
ty
Did not survive 25 days
Survived 25 days
1621
8
37
Page 4 of 12(page number not for citation purposes)
BMC Evolutionary Biology 2009, 9:147 http://www.biomedcentral.com/1471-2148/9/147
random in relation to genetic similarity of mates [37]. Ourfindings in kittiwakes therefore appear to be the first evi-dence in a strictly monogamous species for the geneticsimilarity avoidance hypothesis.
Indeed, we found that kittiwake breeders were not pairedrandomly, but with mates that were less genetically simi-lar than expected by chance. Observed pairs had a lowerprobability of producing homozygous offspring thanexpected, a finding that fits the predictions of the "geneticsimilarity avoidance" hypothesis. In contrast, the "geneticsimilarity preference" hypothesis predicted oppositeresults, and the "preference of heterozygous mates"hypothesis predicted assortative mating according to het-erozygosity, a pattern we did not find.
Our findings show that genetically monogamous speciesmay avoid pairing with genetically similar mates. Non-random mating with respect to genetic similarity has beenreported in three shorebird species [14], ruffs (Philoma-chus pugnax, [11]), sand lizards (Lacerta agilis, [12]), mice[38] and humans [39]. In contrast, some other speciesbehave consistently with the "good-genes as heterozygos-ity" hypothesis (e.g. house sparrows Passer domesticus, [7],and Seychelles warblers Acrocephalus sechellensis, [40]), orwith the "genetic similarity preference" hypothesis (e.g.pied flycatcher Ficedula hypoleuca, [41], and great frigatebirds Fregata minor, [10]), while other species display nosignificant relationships between mating patterns andgenetic dissimilarity indices (e.g. great reed warbler Acro-cephalus arundinaceus, [42]).
As expected, we also found deleterious effects of genetic sim-ilarity and homozygosity of offspring. This set of results (off-
spring hatchability, growth and survival) is statisticallyindependent of results about mating patterns, but are biolog-ically linked and consistent. Genetically similar pairshatched fewer offspring than more dissimilar pairs (Figure2), which is similar to studies that found significant effects ofinbreeding on egg hatchability [29,30]. Likewise in thesestudies, hatching success was found to correlate negativelywith pair genetic similarity. This pattern could be due to atleast two non-exclusive effects. First, because both sexes incu-bate, cooperation between mates may be maximized whenthe genetic quality of the pair is high. Second, the overallgenetic quality of heterozygous offspring may be higher andthus increase the success of early development. Given the rel-atively weak relationships between measures of reproductivesuccess and genetic similarity, further evaluations of thesehypotheses are warranted. Another apparent cost ofhomozygosity is that more homozygous offspring were lesslikely to reach 25 days of age than less homozygous ones.Again this pattern may be explained by different effects. Forexample, more heterozygous individuals may cope betterwith pathogens [8]. Furthermore, homozygous offspring aremore likely to be produced by genetically similar pairs thatmay invest less in chick rearing, thus reinforcing the deleteri-ous effects of homozygosity on chick growth and survival.We also found that chick growth slowed as homozygosityincreased, which may also explain the observed differencesin survival: slower growing chicks may be in worse conditionthan faster growing chicks and are thus less efficient atdefending themselves against pathogens and environmentalstress. Interestingly, this effect was only evident in secondhatched chicks (Figure 4), which might be explained by thefact these chicks suffer from more severe selective pressuresdue to sibling competition and brood reduction (unpub-lished data, see also [43]).
Relationship between chick heterozygosity, age and growth rate in 2005Figure 4Relationship between chick heterozygosity, age and growth rate in 2005. We plotted the predicted value of chick growth in wing length (in mm) according to the model A+H+R+AH+AR+HR+ARH+A2 where A is the age of the chick (meas-ured in days), R its hatching rank (binary factor equaling A for first hatched, or B for second hatched chicks) and H its hetero-zygosity (according to the H index). For clarity, the random parameter (chick's identity) was removed from the model. Significance of the statistical tests is given in Table 2.
Page 5 of 12(page number not for citation purposes)

BMC Evolutionary Biology 2009, 9:147 http://www.biomedcentral.com/1471-2148/9/147
The use of multi-locus estimates of heterozygosity andgenetic similarity has been criticized by authors arguingthat global heterozygosity-fitness correlations may bedriven by certain loci that are physically linked to fitness-affecting loci [35,36,44]. However, such local effects areexpected to be weak in this population, since we found nolocus that correlated with all components of fitness. Weare also aware that the number of microsatellites we used(7–10) is low given that the number of loci needed toachieve an accurate estimation of individual global heter-ozygosity may be much higher [45]. However, a smallnumber of microsatellite loci should diminish our capac-
ity to detect any relationship between heterozygosity andfitness components, making our analyses conservative.The fact that we found negative effects of genetic similarityand homozygosity on different components of fitness(mate choice, hatching success, offspring growth and sur-vival) despite our relatively small number of loci suggeststhat genetic similarity is costly, and therefore selectedagainst, in this population.
Little is known about mate choice in kittiwakes, and thepattern we describe here may result from different mech-anisms. It could be due to a passive process with, for
Table 2: Relationships between chick age, hatching rank, heterozygosity and growth in body weight, wing and tarsus length
Explained variable Hz index used A*H*R AIC A*H in A-chicks A*H in B-chicks
Body weight H <0.0001 3267.5 0.68 <0.0001
SH <0.0001 3271.7 0.44 <0.0001
IR <0.0001 3273.3 0.86 <0.0001
H' 0.020 3284.8 0.12 0.0020
SH' 0.046 3285.9 0.094 0.0038
IR' 0.064 3289.2 0.12 0.0055
Wing length H <0.0001 2612.3 0.58 <0.0001
SH 0.0001 2615.0 0.91 <0.0001
IR <0.0001 2615.4 0.39 <0.0001
H' 0.013 2621.7 0.31 0.0007
SH' 0.037 2621.6 0.15 0.0013
IR' 0.038 2626.8 0.41 0.0033
Tarsus length H 0.0017 2758.8 0.71 0.0025
IR 0.0013 2760.4 0.95 0.011
SH 0.012 2762.2 0.28 0.0045
H' 0.027 2765.2 0.75 0.04
IR' 0.014 2767.2 0.20 0.054
SH' 0.089 2766.3 0.97 0.089
We used AIC for model selection. Parameters: A (Age), H (Heterozygosity, estimated by the index in the column "Hz index used") and R (hatching Rank, a binary effect). For heterozygosity indices: H, SH and IR are calculated over all loci, while H', SH' and IR' are calculated without OHW loci and K31. With either heterozygosity index, the structure of the selected model was: A+H+R+AH+HR+AHR+A2 plus the random effect of chick identity. Since the interaction A*H*R was significant, we also tested the significance of the A*H effect in each rank (A or B-chicks). P-values below 0.05 are in bold. (Note: a more complete version, with the mean effect size for heterozygosity for each analysis, is given as additional file 1).
Page 6 of 12(page number not for citation purposes)

BMC Evolutionary Biology 2009, 9:147 http://www.biomedcentral.com/1471-2148/9/147
example, genetically similar pairs being more likely to failin their breeding attempt, which in turn would makethem more prone to divorcing than successful pairs. Inour population, this seems unlikely since divorce afterreproductive failure is not systematic [25]. Furthermore,the correlation between genetic similarity of mates andreproductive success may not be strong enough to makedivorces significantly correlated to genetic similarity.Alternatively, kittiwakes may choose to pair with individ-uals from different areas within a structured population,but we think this is unlikely. Genetic structuring is low atthe scale of the whole North Atlantic kittiwake population[46,47]). At a local scale, movements due to re-nesting ofpreviously failed breeders into new areas are likely todiminish preexisting genetic structuring in this popula-tion. A third mechanism could be that prospective breed-ers may actively search for genetically dissimilar mates.The evolution of this strategy could be driven by the fit-ness costs of genetic similarity. Active mate choice wouldallow individuals to encounter a more adaptive matefaster than a passive process. However, experiments areneeded to demonstrate that active mate choice has pro-duced the observed pattern. Long-term monitoring andgenotyping may also allow us to compare pairs thatdivorced with pairs that stayed together in relation to thegenetic similarity of the first and second mate.
Active choice of genetically dissimilar mates has beendemonstrated in mammals (e.g., humans, [48], mice [49]or fur seals, [50]) where genetic similarity is detecTable
2ecause of correlations between MHC alleles and bodyodors (humans, [51]; lemurs, [52]; mice [53]). Althoughthe use of smell remains poorly known in birds, Antarcticprions (Pachiptila desolata) have been shown to recognizetheir mates through odors [54]. Genetically driven odorshave not yet been shown in birds, but various aspects ofsocial interactions in kittiwakes may allow them to recog-nize and choose their mates according to odor. Experi-ments are needed to determine the potential mechanismsfor birds to estimate their relatedness to potential mates.
ConclusionBlack-legged kittiwakes pair with individuals that aregenetically more dissimilar than expected by chance, apattern that is consistent with our observation of the exist-ence of potential costs of producing homozygous prog-eny, such as decreases in hatching success and survival. Insuch genetically monogamous species, mate choice there-fore seems to be under selection. Thus, the genetic criteriaof mate and extra-pair mate choice in various geneticallypolygamous species may also be a general feature ingenetically monogamous species. Indeed, breeders ofstrictly monogamous species may experience the highestselective pressure to choose genetically dissimilar mates.
MethodsStudy species and populationWe conducted our study on Middleton Island (Gulf ofAlaska, 58°25' N, 146°19' W, May-July 2003–2006). Thisisland supports a large declining population of black-leg-
Table 3: Summary of the ten microsatellite loci.
Locus Repeated motif Allele Sizes No. of alleles No. of ind. Hexp Hobs p-value Genebank Accession No.
K6 (AC)4T(TA)12 111–139 15 593 0.86 0.82 N.S. AY083596
K16 (TG)4(TA)8(GA)10 151–187 13 591 0.86 0.72 < 0.0001 AY083597
K31 (TG)13 176–225 26 580 0.88 0.87 N.S. AY083598
K32 (GA)2(GT)12 116–188 35 596 0.90 0.90 N.S. AY083599
K67 (CA)2(TA)9 135–147 7 463 0.48 0.43 N.S. AY083601
K71 (AC)11 143–159 7 593 0.65 0.69 N.S. AY083602
RBG20 (GT)13 186–199 10 572 0.68 0.67 N.S. AY091849
RBG27 (GT)12 207–223 9 593 0.73 0.71 N.S. AY091851
RBG29 (GT)13 151–169 9 584 0.65 0.63 0.005 AY091853
RBG39 (AC)11 180–190 6 597 0.55 0.50 N.S. AY091852
K6, K16, K31, K32, K67 and K71 were first described in the black-legged kittiwake [59]), whereas RBG20, RBG27, RBG29 and RBG39 were sequenced from the red-billed gull, Larus novaehollandiae scopulinus [60]). Hexp and Hobs are the expected and observed heterozygosities computed by GENEPOP, and we give also the p-value the Hardy-Weinberg equilibrium test (after Bonferroni correction for multiple tests).
Page 7 of 12(page number not for citation purposes)

BMC Evolutionary Biology 2009, 9:147 http://www.biomedcentral.com/1471-2148/9/147
ged kittiwakes (from 166,000 birds in 1981 to fewer than25,000 in 1999; [55]). We studied kittiwakes nesting onthe ledges of an abandoned U.S. Air Force radar tower thathas been modified to enable close observations and easycapture. The study plot is characterized by vertical wallsand uniform nest spacing, with breeders nesting onwooden ledges built specifically for cliff-nesting seabirds[55].
Nest sites were observed twice daily from mid-May to late-August to assess individual attendance and reproductivesuccess. We arrived at the field site too late to assess thearrival dates of adults. During each visit, we recorded thecolor-band combination of attending adults, the stage ofnest building, the presence of eggs and chicks and thebehavior of adults in the form of incubation, nest build-ing and copulation, variables that we used to confirm pairidentity. Each chick was marked at hatching and bandedat 25 days old. Adults received five bands (one coded U.S.metal and four color-bands). We could thus preciselydetermine laying and hatching dates of focal pairs, as wellas the hatching rank of chicks (recorded as A for firsthatched and B for second hatched; brood size rarelyexceeds two chicks). Copulation behavior was also moni-tored in order to determine the sex of every paired adult;for unpaired adults, the sex was identified by morpholog-ical values such as bill length, tarsus length, bill width andhead+bill length [56]. We sampled blood from breedingand non-breeding individuals in 2003–2004 in order toanalyze mating patterns. Results for mating patterns in2005 were not analyzed because of other experiments per-formed in 2004 that affected mating patterns and divorcerates in subsequent years. Therefore, in 2005, we used ourdataset to analyze the fitness costs of homozygosity inchicks hatched from pairs that were not manipulated in2004 or 2005. In order to analyze the fitness costs ofhomozygosity, chicks of such pairs were blood-sampled athatching and were weighed and measured (for wing andtarsus length) every 5 days from hatching to 25 days old.We did not remain at the field station long enough torecord fledging success, which occurs between 35 and 40days old. However, mortality is very low between 25 daysold and fledging in this species, and thus survival at 25days old is a reliable estimation of survival at fledging(unpublished data). Blood was kept in a preservationbuffer solution (Longmire buffer, [57]) that allows thestorage of samples without refrigeration.
Genetic analysisDNA extractionWhole genomic DNA was extracted from each blood sam-ple using a "salting out" protocol described in [58]), mod-ified by substituting Pronase E for Protease K andincubating at 37°C in the lysis phase, and substituting 0.7volumes of 2-propanol in place of 2 volumes of ETOH inthe DNA precipitation phase. Genomic DNA extractions
were quantified using fluorometry and diluted to 50 ng/μL working solutions.
PCR and electrophoresisSamples were genotyped at 10 microsatellite loci. Loci K6,K16, K31, K32, K67 and K71 were first described in theblack-legged kittiwake [59], see Table 3); RBG20, RBG27,RBG29 and RBG39 were developed from the red-billedgull, Larus novaehollandiae scopulinus [60], see Table 3).Three additional loci (K56, [59], RBG18 and RBG13,[60]) were also tested but not used because the first twowere found to be unreliable (see the quality controlsbelow), and the third was monomorphic in our popula-tion.
The forward primer in each primer pair was synthesizedwith a modified 19- to 20-bp universal tail (M13F, M13Ror SP6) added to the 5' end of the oligonucleotide [61].We used a complementary fluorescently labeled (IRD700or IRD800) primer, identical to the specific tail used tomodify the forward primer, to detect alleles at each loci.We carried out amplifications in a final volume of 10 μLthat contained 50 ng DNA extract, 0.2 mM dNTPs, 0.1 mgBSA, 1× PCR buffer (Perkin Elmer Cetus I; PE Biosystems,Forest City, California), 10.0 pmoles forward and reverseunlabeled primers, 1.0 pmole fluorescently labeledprimer, and 0.2 units of Taq polymerase. PCR reactionsbegan at 94°C for 90 seconds, and continued with 40cycles each of 94 C for 15 s, 50°C for 15 s and 74°C for30 s.
Amplification products were separated on a 48-well 25-cm 6% polyacrylamide gel on a LI-COR 4200 LR auto-mated sequencer, using Base ImagIR™ (LI-COR, Inc., Lin-coln, Nebraska). Allele sizes for specific samples at eachlocus were determined relative to the M13 phage singlenucleotide ladder. These samples were later used as inter-nal size standards to score new genotypes, using GeneImagIR™ 4.05 software (Scanalytics, Inc., Fairfax, Vir-ginia). For quality control purposes, we reprocessed aminimum of 10% of the samples for all markers, and onlykept markers giving reliable scores. Two markers (K56,[59], and RBG18 [60]) that gave inconsistent scores ateach PCR were thus discarded.
Genetic Diversity and Tests of EquilibriumMean number of alleles (A) and observed and expectedheterozygosities (HO and HE) were calculated in GENE-POP Version 3.1 [62]. We also used this program to testlinkage disequilibria and deviation from Hardy-Weinbergequilibrium (Markov chain parameters: 10,000 dememo-rization steps, 100 batches, and 5,000 iterations perbatch). These different tests guided final marker selection.
A total of 645 adults were genotyped in the Middletonpopulation from 2003 to 2006. The number of alleles per
Page 8 of 12(page number not for citation purposes)

BMC Evolutionary Biology 2009, 9:147 http://www.biomedcentral.com/1471-2148/9/147
locus varied from 6 to 35. After correcting for multipletests, two loci appeared to be out of Hardy-Weinberg equi-librium: K16 (p < 0.0001) and RBG29 (p = 0.005).Because of its lower heterozygosity, K67 was not geno-typed in all samples. Thus, for each analysis, we presentthe results obtained using all loci, or excluding K16, K67and RBG29, which are designated as the "OHW" loci, for"out of Hardy-Weinberg" equilibrium. Only K31 and K32were genetically linked (p < 0.05 after correcting for mul-tiple tests). Since our genetic similarity analyses are basedon bootstrapping on the multi-locus genotypes (such thatlinkages between alleles are conserved for every boot-strap) and not on alleles, both loci were kept. We also con-ducted every allelic-based analysis with all ten loci andwithout "OHW" loci and K31 (7 remaining loci).
Genetic similarity indicesThe genetic similarity between two given pair members (xand y) was estimated by the probability for this pair ofproducing homozygous offspring (Phm). For each locus(l), this probability is equal to:
following Lynch & Ritland's [63]) notation, where sij is aBoolean factor equal to 1 if alleles i and j are similar (i andj standing for any other letter), and 0 otherwise. An indexbased on such probabilities was first proposed by Mathieuet al. [64], but has seldom been used. Belkhir et al. [65]showed that when the number of alleles per loci is low,such indices have a low variance in their estimations ofrelatedness, a property relevant to our study in whichsome loci were not highly variable (see Table 3).
To obtain a value for Phm across all loci, a weighted aver-age of the Phmxy(l) is calculated using the formula pro-posed by Mathieu et al. [64]:
where pl is the probability of an individual beinghomozygous by chance at locus l. Therefore Phmxy will beclose to 1 if the pair has a high probability of producing ahomozygous offspring (pair members are closely geneti-cally similar), and close to 0 otherwise.
Individual heterozygosityWe used three different indices to estimate individual glo-bal heterozygosity: the direct heterozygosity H (propor-tion of heterozygous loci in a given individual), thestandardized heterozygosity SH and the internal related-
ness IR, all described in [66]). All these indices were calcu-lated using the same program computed in Delphi(Borland Delphi 5.0, ©1983, 1989 Inprise Corporation;Additional file 2 and 3).
Monte-Carlo analysesGenetic indices were performed using a program com-puted (Additional file 2 and 3) in Delphi (Borland Delphi5.0, ©1983, 1989 Inprise Corporation) that was previouslytested for no significant differences with Queller & Good-night estimations obtained from the IDENTIX software[65]. This program allowed us to calculate Phmxy and,given the configuration of our datasets, it makes ourMonte-Carlo analyses much easier than previously pub-lished programs.
For each given sample of individuals, we re-mated adultsrandomly according to their sex 10,000 times (i.e. 10,000bootstraps). These bootstraps gave a set of values that weused as the distribution under the assumption of randommating (in further analyses, we only give the mean of thegenetic indices of all these bootstraps). The observed val-ues of the genetic indices were then tested for significantdeparture from the expected distribution obtained by thebootstraps. When bootstrapping, we used only adultsseen in the considered year, and in each bootstrap we ran-domly made the same number of pairs that had been gen-otyped in the population using all live adults, as they wereall considered as potentially available for pairing. Allelicfrequencies were calculated for this sub-sample of individ-uals. For Hypothesis 2, that mates are genetically less sim-ilar than expected by chance, statistical significance wasassessed by the proportion of the bootstraps having amean genetic index lower than the observed mean. Westatistically tested Hypothesis 3 that mates share morealleles than expected by chance, by assessing the propor-tion of the bootstrap values with a mean genetic similarityindex higher than the observed mean (i.e. 1 minus the p-value calculated under Hypothesis 2). By bootstrappingon observed individuals and not on randomly createdindividuals generated via allelic frequencies, we mightalso expect to correct for biases due to linkage disequi-libria or genotyping errors. Individuals with incompletegenotypes had thus the same probability of beingincluded in observed pairs as in bootstrapped pairs. Thus,biases will be similar for observed and bootstrapped pairs.
General statisticsGeneral statistical analyses were made using SAS® package(©SAS Institute Inc.1999, Cary, NC, USA). Correlationsbetween the two indices of genetic similarity, or betweenmale and female heterozygosity, were analyzed throughstandard linear models. To analyze the links between repro-ductive success (number of eggs laid and the number andproportion of eggs hatched) and genetic variables, we used
Phm lsac sad sbc sbd
xy( )( )= + + +
4
Phmpl
Phmxy ll
pll
xy =å
å
1
1
( )
Page 9 of 12(page number not for citation purposes)

BMC Evolutionary Biology 2009, 9:147 http://www.biomedcentral.com/1471-2148/9/147
a generalized linear model (allowing fitting standard linearmodels to discrete variables) since the dependent variablesnever showed more than three levels. For each of thesethree levels, the genetic variables and the residuals from themodel were normally distributed. Similarly, we analyzedthe correlations between chick survival and heterozygosityusing generalized linear models, since both chick survival(alive or dead) and hatching rank (A or B) are binary effects.For each rank and each survival value, the residuals fromthe model procedure were normally distributed.
For the analyses of growth variables (body weight, tarsus orwing length), we have repeated measures of individuals,having measured each chick every 5 days. We therefore con-ducted mixed linear models with chick identity as a ran-dom parameter in order to account for non-independence.We made mixed linear models with tarsus length, winglength or body weight as dependent variables, chick iden-tity as a random parameter, and chick age (A), age*age(A2), heterozygosity (H) and hatching rank (R) as explain-ing variables. We added A2 because growth of morphologi-cal traits is non-linear. For each variable and eachheterozygosity index, we ran several models and kept onlythe one with the lowest AIC value. Given that the threegrowth variables are correlated, and given that the differentindices of heterozygosity are also correlated, the structure ofthe model with the lowest AIC was always the same, in theform of Growth variable = A + H + R + A*H + A*R + H*R +A*H*R + A2 + Chick identity as a random parameter. Wewill only give the results obtained with the latter model,since the difference in AIC between this model and othermodels was always higher than 2. The significance of theinteraction A*H was then tested in each rank separately.
Authors' contributionsHM carried out the genetic analyses, monitored the birdson Middleton Island and drafted the manuscript withRHW. ED and RHW conceived the study and participatedin its design and coordination. JFW and FH helped inmonitoring the birds and in the conception of the studyin the field. SLT and AMR participated in the microsatel-lite genotyping and scoring. SAH is responsible of thelong-term monitoring on Middleton Island and gaveaccess to the study area. All authors read and approved thefinal manuscript.
Additional material
AcknowledgementsWe thank Kevin Sage and Judy Gust for their help in the lab, as well as sev-eral assistants for their help in the field. Karen McCoy, Donald Blomqvist and Bart Kempenaers gave valuable comments on earlier drafts. Experi-ments were carried out in accordance with American regulations and under permits from the U.S. Fish and Wildlife Service (MB789758-2) and the U.S. Department of Agriculture (43860). This study was financed by a four year grant from the French Polar Institute Paul-Emile Victor ("Programme Arc-tique 429" 2004–2007), a France-Austria PICS (Programme International de Coopération Scientifique), and by the U.S. Geological Survey, Alaska Sci-ence Center. This project was part of the French GDR2155 "Écologie com-portementale".
References1. Burley NT, Foster V: Variation in female choice of mates: con-
dition influences selectivity. Anim Behav 2006, 72:713-719.2. Johnsen A, Delhey K, Schlicht E, Peters A, Kempenaers B: Male sex-
ual attractiveness and parental effort in Blue tits: a test ofthe differential allocation hypothesis. Anim Behav 2005,70:877-888.
3. Poesel A, Kunc HP, Foerster K, Johnsen A, Kempenaers B: Earlybirds are sexy: male age, dawn song and extrapair paternityin Blue tits, Cyanistes (formerly Parus) caeruleus. Anim Behav2006, 72:531-538.
4. Rantala MJ, Eriksson CJP, Vainikka A, Kortet R: Male steroid hor-mones and female preference for male body odor. Evolutionand Human Behavior 2006, 27:259-269.
5. Neff BD, Pitcher TE: Genetic quality and sexual selection: anintegrated framework for good genes and compatible genes.Molec Ecol 2005, 14:19-38.
6. Mays HL, Hill GE: Choosing mates: good genes versus genesthat are a good fit. TREE 2004, 19:554-559.
7. Bonneaud C, Chastel O, Federici P, Westerdahl H, Sorci G: Com-plex MHC-based mate choice in a wild passerine. Proc R Soc B2006, 273:1111-1116.
8. Penn DJ, Damjanovich K, Potts WK: MHC heterozygosity confersa selective advantage against multiple-strain infections. PNAS2002, 99:11260-11264.
9. Westerdahl H, Waldenström J, Hansson B, Hasselquist D, VonSchantz T, Bensch S: Associations between malaria and MHCgenes in a migratory songbird. Proc R Soc B 2005,272:1511-1518.
10. Cohen LB, Dearborn DC: Great frigatebirds, Fregata minor,choose mates that are genetically similar. Anim Behav 2004,68:1229-1236.
11. Thuman KA, Griffith SC: Genetic similarity and the nonrandomdistribution of paternity in a genetically highly polyandrousshorebird. Anim Behav 2005, 69:765-770.
Additional file 1Table 2with effect size of heterozygosity. Extended version of the Table 2, including mean effect size of heterozygosity for all analyses.Click here for file[http://www.biomedcentral.com/content/supplementary/1471-2148-9-147-S1.doc]
Additional file 2Code of the program Nausicaa. This file contains the complete code of the program used for calculation of genetic indices and Monte-Carlo anal-yses.Click here for file[http://www.biomedcentral.com/content/supplementary/1471-2148-9-147-S2.txt]
Additional file 3GNU-GPL Licence. GNU-GPL Licence for the program Nausicaa con-tained in additional file 2.Click here for file[http://www.biomedcentral.com/content/supplementary/1471-2148-9-147-S3.txt]
Page 10 of 12(page number not for citation purposes)
BMC Evolutionary Biology 2009, 9:147 http://www.biomedcentral.com/1471-2148/9/147
12. Olsson M, Madsen T, Nordby J, Wapstra E, Ujvari B, Wittsell H:Major histocompatibility complex and mate choice in sandlizards. Proc R Soc B 2003:S1-S3.
13. Freeman-Gallant CR, Meguerdichian M, Wheelwright NT, SollecitoSV: Social pairing and female mating fidelity predicted byrestriction fragment length polymorphism similarity at themajor histocompatibility complex in a songbird. Molec Ecol2003, 12:3077-3083.
14. Blomqvist D, Andersson M, Küpper C, Cuthill IC, Kis J, Lanctot RB,Sandercock BK, Székely T, Wallander J, Kempenaers B: Geneticsimimarity between mates and extra-pair parentage in threespecies of shorebirds. Nature 2002, 419:613-615.
15. Landry C, Garant D, Duchesne P, Bernatchez L: 'Good genes asheterozygosity': the major histocompatibility complex andmate choice in Atlantic salmon (Salmo salar). Proc R Soc B2001, 268:1279-1285.
16. Tregenza T, Wedell N: Genetic compatibility, mate choice andpatterns of parentage: Invited review. Molec Ecol 2000,9:1013-1027.
17. Trivers RL: Parental investment and sexual selection. In Sexualselection and the descent of man, 1871–1971 Edited by: Campbell B.Chicago, IL: Aldine Publishing Company; 1972:136-179.
18. Jones IL, Hunter FM: Mutual sexual selection in a monogamousseabird. Nature 1993, 362:238-239.
19. Foerster K, Delhey K, Johnsen A, Lifjeld JT, Kempenaers B: Femalesincrease offspring heterozygosity and fitness through extra-pair matings. Nature 2003, 425:714-717.
20. Rubenstein DR: Female extrapair mate choice in a coopera-tive breeder: trading sex for help and increasing offspringheterozygosity. Proc R Soc B 2007, 274:1895-1903.
21. Helfenstein F, Tirard C, Danchin E, Wagner RH: Low frequency ofextra-pair paternity and high frequency of adoption in Black-legged kittiwakes. Condor 2004, 106:149-155.
22. Coulson JC, Thomas CS: Mate choice in the kittiwake gull. InMate choice Edited by: Bateson P. Cambridge: Cambridge UniversityPress; 1983:361-376.
23. Fairweather JA, Coulson JC: Mate retention in the kittiwake,Rissa tridactyla, and the significance of nest site tenacity. AnimBehav 1995, 50:455-464.
24. Hatch SA, Roberts BD, Fadely BS: Adult survival of Black-leggedkittiwakes Rissa tridactyla in a Pacific colony. Ibis 1993,135:247-254.
25. Naves LC, Monnat J-Y, Cam E: Breeding performance, matefidelity, and nest site fidelity in a long-lived seabird: behavingagainst the current? OIKOS 2006, 115:263-276.
26. Bensch S, Hasselquist D, Von Schantz T: Genetic similaritybetween parents predicts hatching failure nonincestuousinbreeding in the Great reed warbler? Evolution 1994,48:317-326.
27. Brown JL: A theory of mate choice based on heterozygosity.Behav Ecol 1996, 8:60-65.
28. Kokko H, Ots I: When not to avoid inbreeding. Evolution 2006,60:467-475.
29. Kempenaers B, Adriaensen F, Van Noordwijk AJ, Dhondt AA:Genetic similarity, inbreeding and hatching failure in bluetits: are unhatched eggs infertile? Proc R Soc B 1996,263:179-185.
30. Casteele T Van de, Galbusera P, Schenck T, Matthysen E: Seasonaland lifetime reproductive consequences of inbreeding in thegreat tit Parus major . Behav Ecol 2003, 14:165-174.
31. Coulson TN, Albon SD, Slate J, Pemberton JM: Microsatellite locireveal sex-dependent responses to inbreeding and outbreed-ing in red deer calves. Evolution 1999, 53:1951-1960.
32. Coltman DW, Slate J: Microsatellite measures of inbreeding: ameta-analysis. Evolution 2003, 57:971-983.
33. Hansson B: Marker-based relatedness predicts egg-hatchingfailure in great reed warblers. Conserv Gen 2004, 5:339-348.
34. Höglund J, Piertney SB, Alatalo RV, Lindell J, Lundberg A, RintamäkiPT: Inbreeding depression and male fitness in black grouse.Proc R Soc B 2002, 269:711-715.
35. Lieutenant-Gosselin M, Bernatchez L: Local heterozygosity-fit-ness correlations with global positive effects of fitness inthreespine stickleback. Evolution 2006, 60:1658-1668.
36. Tiira K, Laurila A, Enberg K, Piironen J, Aikio S, Ranta E, Primmer CR:Do dominants have higher heterozygosity? Social status and
genetic variation in brown trout, Salmo trutta. Behav EcolSociobiol 2005, 59:657-665.
37. Jamieson IG, Taylor SS, Tracy LN, Kokko H, Armstrong DP: Whysome species of birds do not avoid inbreeding: insights fromNew Zealand robins and saddlebacks. Behav Ecol 2009,20:575-584.
38. Roberts SC, Gosling LM: Genetic similarity and quality interactin mate choice decisions by female mice. Nat Gen 2003,35:103-106.
39. Milinski M, Wedekind C: Evidence for MHC-correlated perfumepreferences in humans. Behav Ecol 2001, 12:140-149.
40. Richardson DS, Komdeur J, Burke T, Von Schantz T: MHC-basedpatterns of social and extra-pair mate choice in the Sey-chelles warbler. Proc R Soc B 2005, 272:759-767.
41. Rätti O, Hovi M, Lundberg A, Tegelström H, Alatalo RV: Extra-pairpaternity and male characteristics in the pied flycatcher.Behav Ecol Sociobiol 1995, 37:419-425.
42. Westerdahl H: No evidence of an MHC-based female matingpreference in great reed warblers. Molec Ecol 2004,13:2465-2470.
43. Braun BM, Hunt GLJ: Brood reduction in black-legged kitti-wakes. Auk 1983, 100:469-476.
44. Hansson B, Westerberg L: On the correlation between hetero-zygosity and fitness in natural populations. Molec Ecol 2002,11:2467-2474.
45. Cooper G, Amos W, Bellamy R, Ruby Siddiqui M, Frodsham A, HillAVS, Rubinsztein DC: An empirical exploration of the ( )2
genetic distance for 213 human microsatellite markers. AmJ Hum Genet 1999, 65:1125-1133.
46. McCoy KD, Boulinier T, Tirard C: Comparative host-parasitepopulation structures: disentangling prospecting and disper-sal in the Black-legged kittiwake Rissa tridactyla . Molec Ecol2005, 14:2825-2838.
47. Friesen VL, Burg TM, McCoy KD: Mechanisms of population dif-ferenciation in seabirds. Molec Ecol 2007, 16:1765-1785.
48. Wedekind C, Seebeck T, Bettens F, Paepke AJ: MHC-dependentmate preferences in humans. Proc R Soc B 1995, 260:245-249.
49. Penn DJ, Potts WK: Untrained mice discriminate MHC-deter-mined odors. Physiol & Behav 1998, 63:235-243.
50. Hoffman JI, Fordaca J, Trathan PN, Amos W: Female fur sealsshow active choice for males that are heterozygous andunrelated. Nature 2007, 445:912-914.
51. McClintock M, Schumm P, Jacob S, Zelano B, Ober C: (in reply of)The MHC and body odors: arbitrary effects caused by shiftsof mean pleasantness. Nature 2002, 31:237-238.
52. Knapp LA, Robson J, Waterhouse JS: Olfactory signals and theMHC: a review and a case study in Lemur catta . American Jour-nal of Primatology 2006, 68:568-584.
53. Yamazaki K, Beauchamp GK, Imai Y, Bard J, Phelan SP, Thomas L,Boyse EA: Odortypes determined by the major histocompat-ibility complex in germfree mice. PNAS 1990, 87:8413-8416.
54. Bonadonna F, Nevitt GA: Partner-specific odor recognition inan Antarctic seabird. Science 2004, 306:835.
55. Gill VA, Hatch SA: Components of productivity in black-leggedkittiwakes Rissa tridactyla : response to supplemental feed-ing. J Av Biol 2002, 33:113-126.
56. Jodice PGR, Lanctot RB, Gill VA, Roby DD, Hatch S: Sexing adultblack-legged kittiwakes by DNA, behavior, and morphology.Waterbirds 2000, 23:405-415.
57. Longmire JL, Lewis AK, Brown NC, Buckingham JM, Clark LM, JonesMD, Meincke LJ, Meyne J, Ratliff RL, Ray FA, et al.: Isolation andmolecular characterization of a highly polymorphic centro-meric tandem repeat in the family Falconidae. Genomics 1988,2:14-24.
58. Medrano JF, Aasen E, Sharrow L: DNA extraction from nucle-ated red blood cells. Biotechniques 1990, 8:43.
59. Tirard C, Helfenstein F, Danchin E: Polymorphic microsatellitesin the Black-legged kittiwake Rissa tridactyla . Molec Ecol Notes2002, 2:431-433.
60. Given AD, Mills A, Baker J: Isolation of polymorphic microsatel-lite loci from the red-billed gull (Larus novaehollandiae scop-ulinus) and amplification in related species. Molec Ecol Notes2002, 2:416-418.
61. Oetting WS, Lee HK, Flanders DJ, Wiesner GL, Sellers TA, King RA:Linkage analysis with multiplexed short tandem repeat pol-
Page 11 of 12(page number not for citation purposes)

BMC Evolutionary Biology 2009, 9:147 http://www.biomedcentral.com/1471-2148/9/147
Publish with BioMed Central and every scientist can read your work free of charge
"BioMed Central will be the most significant development for disseminating the results of biomedical research in our lifetime."
Sir Paul Nurse, Cancer Research UK
Your research papers will be:
available free of charge to the entire biomedical community
peer reviewed and published immediately upon acceptance
cited in PubMed and archived on PubMed Central
yours — you keep the copyright
Submit your manuscript here:http://www.biomedcentral.com/info/publishing_adv.asp
BioMedcentral
ymorphisms using infrared fluorescence and M13 taied prim-ers. Genomics 1995, 30:450-458.
62. Raymond M, Rousset F: GENEPOP (ver. 1.2): a populationgenetics software for exact test and ecumenicism. Heredity1995, 86:248-249.
63. Lynch M, Ritland K: Estimation of pairwise relatedness withmolecular markers. Genetics 1999, 152:1753-1766.
64. Mathieu E, Autem M, Roux M, Bonhomme F: Epreuves de valida-tion dans l'analyse de structures génétiques multivariées:comment tester l'équilibre panmictique? Revue de StatistiqueAppliquée 1990, 38:47-66.
65. Belkhir K, Castric V, Bonhomme F: IDENTIX, a software to testfor relatedness in a population using permutation methods.Molec Ecol Notes 2002, 2:611-614.
66. Amos W, Worthington Wilmer J, Fullard K, Burg TM, Croxall JP,Bloch D, Coulson T: The influence of parental relatedness onreproductive success. Proc R Soc B 2001, 268:2021-2027.
Page 12 of 12(page number not for citation purposes)