evaluation of natural wax for green packaging applications
TRANSCRIPT
Evaluation of natural wax for green
packaging applications
Mariona Ribas Garriga
Materials Engineering, master's level
2019
Luleå University of Technology
Department of Engineering Sciences and Mathematics
Acknowledgments
First of all, I would like to thank Prof. Roberts Joffe who gave me the opportunity to develop this project at
Luleå University of Technology and also for his supervision, kind assistance and support during my research.
I would like to express my gratitude towards Zainab Al-Maqdasi for the help given during the project, the
patient guidance and the encouragement to overcome difficulties.
Furthermore, special thanks also to Johnny Grahn, Lars Firsk and the other members of the Laboratory in the
Material Science Division for sharing their abilities as well as giving me so much attention and time. I am very
grateful for all their support.
Also, it has been a pleasure to take part in the “WAX Interreg Project”, a joint multidisciplinary project funded
by Interreg Nord and partnered with University of Oulu (Centre of Microscopy and Nanotechnology),
Norwegian Institute of Bioeconomy Research (NIBIO) and Oulu University of Applied Science. In special, I would
like to thank Petri Sundqvist for his kind support.
I wish to extend my gratitude to the AMASE coordinators for giving me the opportunity to take part in this
program during two years.
At last but not least, I would also like to express my love and thankfulness to my family and friends for their
understanding and support during my studies and especially during this thesis, despite the distance.
Luleå, May 2019
Abstract
Society has become more aware of the negative environmental impact of the petroleum-based packaging
materials (e.g. plastics) used in the food industry. Therefore, cleaner and more sustainable packaging with
ecological zero-impact is in demand. One of the solutions for this problem could be the use of natural wax-
impregnated paper.
It has been recently demonstrated that wax obtained from arctic berries may be a good candidate for this
application. This project is intended to define the properties of this wax which are essential for the food-
packaging application and evaluate if berry wax can fulfil those requirements.
For this reason, physical characterization of different natural waxes has been conducted and compared. On
the one hand, it has been concluded that pure arctic berry wax presents similar thermal parameters to
commercially available natural waxes. In addition, mechanical testing and barrier properties of paper
substrates coated with beeswax and lingonberry have been successfully carried out. During the testing, wax-
coated samples showed interesting results in terms of good barrier properties, which is the key factor to be
a promising alternative for food packaging applications.
Nevertheless, further research should be conducted in order to study other barrier properties and
mechanical performance of these natural wax-impregnated papers. In addition, it would be of great interest
to investigate more precise coating procedures in order to obtain the optimum way for coating paper
substrates with natural waxes.
Table of Contents
1. Introduction ...................................................................................................................... 1
1.1 Packaging ............................................................................................................................ 2 1.1.1 Historical background ............................................................................................................................... 2
1.2 Food packaging .................................................................................................................... 3 1.2.1 Introduction .............................................................................................................................................. 3 1.2.2 Food packaging definitions ....................................................................................................................... 4 1.2.3 Food packaging requirements .................................................................................................................. 4 1.2.4 Replacing conventional food packaging materials with green materials ................................................. 5
1.3 Green food materials ........................................................................................................... 6 1.3.1 Description of green polymers directly extracted from biomass ............................................................. 7 1.3.2 Manufacturing of green food packaging .................................................................................................. 9
1.4 Properties of green packaging materials ............................................................................. 11 1.4.1 Introduction ............................................................................................................................................ 11 1.4.2 Barrier properties ................................................................................................................................... 11 1.4.3 Mechanical properties ............................................................................................................................ 14 1.4.4 Thermal properties ................................................................................................................................. 15 1.4.5 Summary of barrier properties ............................................................................................................... 15
1.5 Natural waxes .................................................................................................................... 16 1.5.1 Types of waxes ........................................................................................................................................ 16 1.5.2 Natural waxes ......................................................................................................................................... 17 1.5.3 Plant-based waxes .................................................................................................................................. 19 1.5.4 Insect-based waxes ................................................................................................................................. 26
2. Project objectives ............................................................................................................ 29
2.1 Interreg Nord Project ......................................................................................................... 29
2.2 Master thesis objectives ..................................................................................................... 30
3. Experimental procedure .................................................................................................. 31
3.1 Materials ........................................................................................................................... 31 3.1.1 Paper substrate ....................................................................................................................................... 31 3.1.2 Wax coating ............................................................................................................................................ 31
3.2 Characterization of the waxes ............................................................................................ 32 3.2.1 Thermal characterization ........................................................................................................................ 32
3.3 Characterization of the wax coated-paper .......................................................................... 34 3.3.1 Conditioning of the paper samples ......................................................................................................... 34 3.3.2 Coating procedure .................................................................................................................................. 34 3.3.3 Description of the coated-paper samples............................................................................................... 35 3.3.4 Coating weight and thickness measurements ........................................................................................ 35 3.3.5 Scanning electron microscopy and profile observation ......................................................................... 35
3.4 Barrier properties testing ................................................................................................... 36 3.4.1 Moisture uptake ..................................................................................................................................... 36 3.4.2 Water vapor transmission rate ............................................................................................................... 36 3.4.3 Grease resistance .................................................................................................................................... 37
3.5 Mechanical testing ............................................................................................................. 37 3.5.1 Tensile testing ......................................................................................................................................... 37
3.6 Contact angle measurements ............................................................................................. 38
4. Results and discussion ..................................................................................................... 39
4.1 Characterization of the waxes ............................................................................................ 39 4.1.1 Thermal properties ................................................................................................................................. 39
4.2 Characterization of the wax coated-paper .......................................................................... 45 4.2.1 Coating procedure .................................................................................................................................. 45 4.2.2 Coating weight and thickness measurements ........................................................................................ 48 4.2.3 Scanning electron microscopy and profile observation ......................................................................... 48
4.3 Barrier properties testing ................................................................................................... 50 4.3.1 Moisture uptake ..................................................................................................................................... 50 4.3.2 Water vapor permeability ...................................................................................................................... 52 4.3.3 Grease resistance .................................................................................................................................... 53
4.4 Mechanical properties........................................................................................................ 55 4.4.1 Tensile testing ......................................................................................................................................... 55
4.5 Contact angle measurements ............................................................................................. 58 4.5.1 Beeswax-coated samples ........................................................................................................................ 58 4.5.2 Lingon W-coated samples ....................................................................................................................... 58
5. Conclusions and further research .................................................................................... 60
References ............................................................................................................................. 63
Appendix ................................................................................................................................ 68
A. Barrier properties from other materials .................................................................................. 68
B. Characterization of waxes – Thermal analysis ......................................................................... 70
C. Barrier properties testing ....................................................................................................... 74 C.1 Moisture uptake .............................................................................................................................................. 74 C.2 Water vapor transmission rate ....................................................................................................................... 75 C.3 Grease resistance tests ................................................................................................................................... 75
D. Coating weight and thickness measurements .......................................................................... 82
E. Tensile testing ........................................................................................................................ 84
F. Sample book for coated samples ............................................................................................ 86
G. Time planning ........................................................................................................................ 88
List of figures
Figure 1 Schematic representation of the main green polymers used in food packaging applications [2], [7]. ......................................................................................................................................................................... 6 Figure 2 Comparison of oxygen permeabilities of green materials compared to conventional petroleum-based materials [2]. ....................................................................................................................................... 12 Figure 3 Water vapor transmittance of green materials compared to conventional packaging materials based on mineral oil [2]. ................................................................................................................................ 13 Figure 4 Comparison of the thermal properties of green polymers with conventional polymers [2]. ........... 15 Figure 5 Diagram of types of waxes [19]. ....................................................................................................... 17 Figure 6 DSC patterns of rice bran wax (RBX), carnauba wax (CRX) and candelilla wax (CLX). Cooling process, dotted line; heating process, solid line. Extracted from [29]. ........................................................................ 21 Figure 7 Candelilla wax DSC curve extracted from [26]. ................................................................................ 21 Figure 8 Carnauba wax DSC curve extracted from [34]. ................................................................................ 22 Figure 9 DSC curve of carnauba wax extracted from [35]. ............................................................................. 22 Figure 10 Cross-section of Arctic bilberry in the left and cross-section of a cultivated blueberry in the right [53]. ................................................................................................................................................................ 26 Figure 11 Beeswax DSC curve extracted from [35]. ....................................................................................... 28 Figure 12 Beeswax DSC curve extracted from [44]. ....................................................................................... 28 Figure 13 Beeswax (Apis species) DSC curve extracted from [42]. ................................................................ 28 Figure 14 Beeswax DSC curve extracted from [30]. ....................................................................................... 29 Figure 15 TGA curves of lingonberry samples ................................................................................................ 39 Figure 16 TGA curves of natural waxes .......................................................................................................... 40 Figure 17 TGA curve of Lingon W (thin red line); DTGA curve of Lingon W (thick red line) ........................... 41 Figure 18 Thermal method of DSC tests ........................................................................................................ 41 Figure 19 DSC curves of beeswax from untreated and thermally treated samples ....................................... 43 Figure 20 DSC results of Lingon W from untreated and thermally treated samples ...................................... 44 Figure 21 Comparison of DSC curves of beeswax and Lingon W at 0h (untreated) and after 24h of thermal treatment ....................................................................................................................................................... 44 Figure 22 Applying vacuum infusion to coat with Lingon 1002 ..................................................................... 46 Figure 23 Lingon 1002-coated sample after vacuum infusion ....................................................................... 46 Figure 24 Lingon 1002 dissolved with ethanol. Marked: white particles (wax). ............................................ 46 Figure 25 Beeswax-coated sample ................................................................................................................. 46 Figure 26 Lingon W-coated sample ............................................................................................................... 46 Figure 27 Beeswax-coated paper A (surface)................................................................................................. 48 Figure 28 Uncoated paper A (surface) ........................................................................................................... 48 Figure 29 Beeswax-coated paper A (profile) .................................................................................................. 48 Figure 30 Uncoated paper A (profile) ............................................................................................................ 48 Figure 31 Beeswax-coated paper B (surface) ................................................................................................. 49 Figure 32 Uncoated paper B (surface) ........................................................................................................... 49 Figure 33 Beeswax-coated paper B (profile) .................................................................................................. 49 Figure 34 Uncoated paper B (profile) ............................................................................................................ 49 Figure 35 Lingon W-coated paper B (surface) ................................................................................................ 50 Figure 36 Moisture uptake beeswax-coated paper A samples and reference ............................................... 50 Figure 37 Moisture uptake beeswax-coated paper B samples and reference ............................................... 51 Figure 38 Moisture uptake Lingon W-coated paper B samples and reference .............................................. 51 Figure 39 WVTR test of beeswax-coated paper A sample and reference ...................................................... 52 Figure 40 WVTR test of beeswax-coated paper B sample and reference ...................................................... 52 Figure 41 Uncoated crisp bag (on the left); Beeswax-coated crisp bag (on the right) at 0h, 4h and 2 weeks 53 Figure 42 Uncoated crisp bag (on the left); Lingon W-coated crisp bag (on the right) at 0h, 4h and 1 week 54
Figure 43 Grease resistance test beeswax-coated samples at room temperature ........................................ 54 Figure 44 Grease resistance test beeswax-coated samples at 50 ºC ............................................................. 54 Figure 45 Representative stress-strain curve from each set of tensile tested samples ................................. 57 Figure 46 Summary of ultimate strength values ............................................................................................ 57 Figure 47 Summary of elongation at US values ............................................................................................. 57 Figure 48 Summary of Young modulus values ............................................................................................... 57 Figure 49 Summary of yield strength values .................................................................................................. 57 Figure 50 CA measurements for beeswax-coated paper A samples .............................................................. 58 Figure 51 CA measurements for beeswax-coated paper B samples .............................................................. 58 Figure 52 CA measurements for Lingon W-coated paper B samples ............................................................. 58 Figure 53 Assembly for CA tests ..................................................................................................................... 58
List of tables
Table 1 Functions and issues of the food packaging depending on the temporal period [4]. ......................... 3 Table 2 Specific requirements depending on the area within a food package production [2]. ....................... 4 Table 3 The major processing routes to potential green materials [2]. ........................................................... 9 Table 4 General properties of different types of waxes ................................................................................. 18 Table 5 Most common applications of natural waxes. ................................................................................... 19 Table 6 Chemical composition of candelilla wax based on references. ......................................................... 20 Table 7 Thermal properties of rice bran wax, candelilla wax and carnauba wax [29]. ................................... 21 Table 8 Chemical composition of carnauba wax based on references. ......................................................... 23 Table 9 Information table about wild berry features [39]. ............................................................................. 26 Table 10 Chemical composition of beeswax based on references ................................................................. 27 Table 11 Characteristics of natural waxes ...................................................................................................... 31 Table 12 Characteristics of lingonberry samples ........................................................................................... 32 Table 13 Parameters used in the tensile tests ............................................................................................... 38 Table 14 TGA results from all the samples studied ........................................................................................ 40 Table 15 Thermal method of DSC tests .......................................................................................................... 41 Table 16 DSC results from untreated samples of all the samples studied. .................................................... 42 Table 17 DSC results of beeswax from untreated and thermally treated samples ........................................ 42 Table 18 DSC results of Lingon W from untreated and thermally treated samples ....................................... 43 Table 19 Parameters of coated samples ........................................................................................................ 47 Table 20 Tensile test results from beeswax-coated paper A samples and uncoated paper A samples ......... 55 Table 21 Tensile test results from beeswax-coated paper B samples and uncoated paper B samples ......... 56 Table 22 Tensile test results from Lingon W-coated paper B samples and uncoated paper B samples ........ 56
1
1. Introduction
Nowadays our society is facing prominent challenges considering the fast-growing population and the
climate crisis that is causing a significant impact worldwide. It is for this reason that we have the
responsibility to act accordingly in order to find the most proficient solutions so as to ensure sustainable
progress. In addition, since we are the most self-conscious generation and seem to start being aware of
these problems, it is down to us to initiate this transition.
As a consequence, Europe has started a transformation from a linear trend towards a circular with the
aim of achieving the efficient use of resources, especially, in the plastic industry. Plastic materials help
us avoid food waste, save energy and decrease CO2 emissions. On the other hand, due to their massive
production, they can easily end up in landfills after their service life causing an extremely negative
impact on our planet [1].
It is for this reason that new paths have to be implemented not only to place back this plastic waste in
the life cycle of plastic, by what is known as circular economy, but also to develop innovative alternatives
from our natural resources with an ecological zero-impact in order to reduce the large amount of plastic
production.
It is a well-known fact that one of the sectors that use more plastic products is the packaging sector
with special focus on packaging for food items. Taking this into account, paper and paperboard, which
come from cellulose, could be a suitable alternative to plastic products. This raw material, a
polysaccharide-based polymer that is considered to be the most abundant natural polymer on earth, is
cheap and biodegradable but it also presents drawbacks that need to be addressed. The mechanical
properties are suitable for this purpose, but its hydrophilic nature, insolubility and crystalline structure
hinder the competitiveness of this green material as a green alternative towards plastic [2].
This thesis puts forward a solution: to make use of natural wax-impregnated paper so as to achieve
competitive food packaging materials both sustainable and biodegradable. This proposal is explained
on the grounds that lipid-based polymers, such as natural waxes, present high moisture resistance as
well as a hydrophilic nature that can overcome the gas permeability limitations in paper-based
substrates.
It has been recently determined that wax obtained from wild arctic berries could be a good candidate
for food packaging applications. Therefore, this project intends to define relevant properties of this
natural wax that are essential for this application and to evaluate if this natural berry wax can fulfil those
requirements. Properties such as thermal stability, moisture resistance, water vapor transmission,
grease resistance, stiffness and mechanical strength among others will be analyzed and discussed in the
following sections.
2
1.1 Packaging
Packaging materials can be used in a wide variety of products. They can be considered for food including
fast-food packages, frozen food, pet food, cereals, fresh fruits and vegetables, instant food or other
forms or for non-food products such as cosmetics, creams, electronics, sports equipment, boxes,
envelopes, toys among others. As it can be clearly noticed, due to this large classification, it is very
important to decide which packaging material is more appropriate for its end use properties taking into
account the advantages and disadvantages of this choice [3].
1.1.1 Historical background
Starting from leaves, skins and earthenware vessels as containers, the packaging evolved to more
complex containers to meet specific needs such as supplying overseas trades. In fact, the ancient Greek
and Roman Empires were the pioneers in settling a package shape by following the same reasoning as
those found nowadays. After that, glass-making was started and industrialized in Egypt in 1500 B.C. It
was in the same location where the oldest form of what is understood as “flexible packaging” was
invented: paper. Parallelly, China also made some progress in this field by treating mulberry bark [3].
The use of paper spread to Europe and subsequently refined. Paperboard appeared in the early 1800s
[4]. On the other hand, metal containers also progressed. From ancient silver and gold boxes to cheaper
metal such as cans, which meant a big breakthrough in that time considering the ability to seal and
retrieve the content [3].
Finally, plastic was invented in the 19th century for military purposes although some forms including
cellulose nitrate, styrene and vinyl chloride were invented previously [4]. From that moment, a
revolutionary area started and a wide variety of plastics were studied and refined becoming very
popular for the food industry. Manufacturing processes such as molding, casting, forming and extrusion
became widely well-known. One of the most commonly used petroleum-based plastic, polyethylene
terephthalate (PET), was launched into the market in 1977 [3].
This massive plastic production period started causing significant concerns regarding the negative
impact on the environment and the plastic waste disposal problem. In the early 2000s, the packaging
market started to pay attention to green plastic, such as polylactic acid (PLA) [3]. On the other hand, in
2016, 39.9% of the plastic demand in Europe came from the packaging segment [1]. In this segment,
polymers such as low-density polyethylene (LDPE), linear low-density polyethylene (LLDPE), high-
density polyethylene (HDPE), polyethylene terephthalate (PET) and polypropylene (PP) were the most
commonly used [1].
3
Therefore, in order to find environmentally-friendly options, several ongoing investigations about
sustainable alternatives that come from natural resources are being carried out. This tendency seems
to be the engine for a global change of perspective that will gain projection in the near future. Being
able to reduce several thousands of tons of plastic packages that are landfilled continuously will have a
positive impact regarding global warming and the plastic waste disposal problem.
Green packaging materials seem to be promising alternatives to synthetic polymers. The nature of these
renewable materials presents clear environmental advantages, although sometimes it is difficult to be
able to reach the same result as with those petroleum-based polymers currently used in the food
packaging industry [5].
1.2 Food packaging
1.2.1 Introduction
Food packaging materials pursue mainly the following objectives: to preserve, protect, merchandise,
market and distribute foods. Rigid packaging including metal, wood, glass or plastic combinations are
adequate options to inhibit the activation of microorganisms [3]. Also, controlled atmosphere, vacuum,
intelligent packaging (IP), modified atmosphere packaging (MAP), active packaging (AP) and edible
packaging are other alternatives that can fulfil the food packaging requirements [3]. Apart from these
types of packaging, biodegradable packaging (BDP) has raised interest due to the concerns regarding
the lack of recyclability of synthetic multilayer packaging systems. Moreover, incineration of any plastic
leaves carbon footprints in the atmosphere. Consequently, recyclability and biodegradability are highly
important functional requirements for our environment [4].
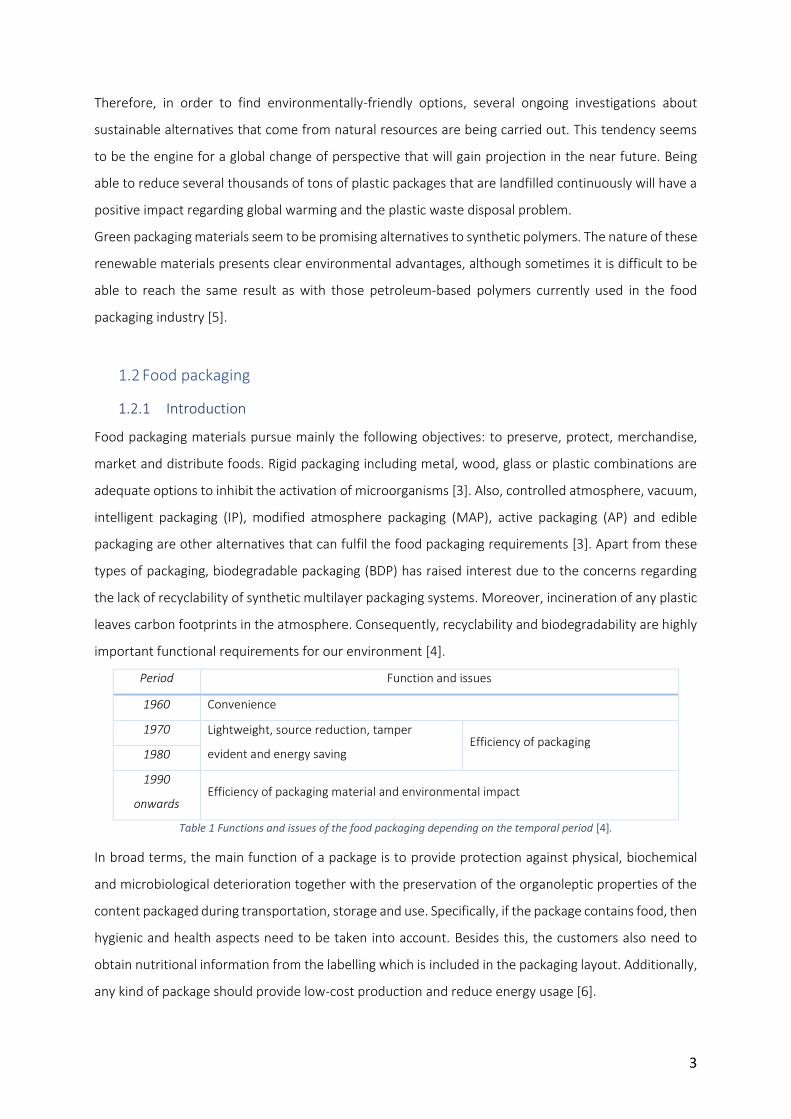
Period Function and issues
1960 Convenience
1970 Lightweight, source reduction, tamper
evident and energy saving Efficiency of packaging
1980
1990
onwards Efficiency of packaging material and environmental impact
Table 1 Functions and issues of the food packaging depending on the temporal period [4].
In broad terms, the main function of a package is to provide protection against physical, biochemical
and microbiological deterioration together with the preservation of the organoleptic properties of the
content packaged during transportation, storage and use. Specifically, if the package contains food, then
hygienic and health aspects need to be taken into account. Besides this, the customers also need to
obtain nutritional information from the labelling which is included in the packaging layout. Additionally,
any kind of package should provide low-cost production and reduce energy usage [6].
4
1.2.2 Food packaging definitions
There are three main categories regarding the most commonly used packages for foodstuff. Mainly,
they are divided into primary, secondary and tertiary packaging [2].
1) Primary packaging materials are those in direct contact with food but separated from each
other, therefore, edible films do not belong to this category. The main functions are to contain,
protect and storage food.
2) Secondary packaging confers physical protection of the product. An example could be a box
containing a food package in a flexible plastic bag. The main functions are to ease handling
during storage and distribution, to protect the primary package from mechanical damage and
provide information on characteristics regarding the content of the package.
3) Tertiary packaging has the function of collecting the secondary packaging in final transportation
systems. Examples of this category of packaging can be boxes, pallets and stretch foils.
Other categories such as edible coatings and films can also be taken into account as a different type of
packaging. This last category differs from the others because edible coatings are applied directly to the
food. In this category, some of the procedures to fulfil the packaging purpose are to spread the coating
as a liquid film-forming solution or a molten compound [2].
1.2.3 Food packaging requirements
There are some requirements that have to be taken into consideration when the packaging used is in
direct contact with food so as to prevent migration of molecular species and ions [6] because foods are
dynamic systems with very specific packaging needs [2]. The following table depicts the most important
requirements concerning food packaging.
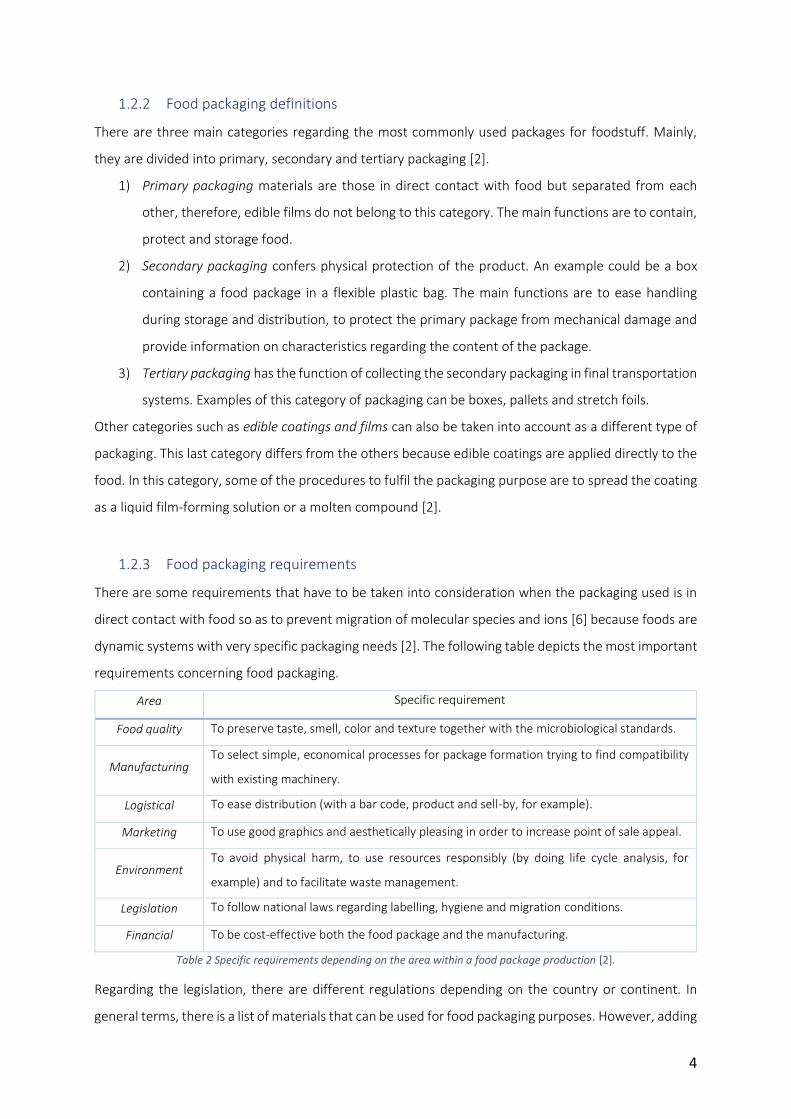
Area Specific requirement
Food quality To preserve taste, smell, color and texture together with the microbiological standards.
Manufacturing To select simple, economical processes for package formation trying to find compatibility
with existing machinery.
Logistical To ease distribution (with a bar code, product and sell-by, for example).
Marketing To use good graphics and aesthetically pleasing in order to increase point of sale appeal.
Environment To avoid physical harm, to use resources responsibly (by doing life cycle analysis, for
example) and to facilitate waste management.
Legislation To follow national laws regarding labelling, hygiene and migration conditions.
Financial To be cost-effective both the food package and the manufacturing.
Table 2 Specific requirements depending on the area within a food package production [2].
Regarding the legislation, there are different regulations depending on the country or continent. In
general terms, there is a list of materials that can be used for food packaging purposes. However, adding
5
a new material generally-recognized-as-safe (GRAS) in the list is costly and takes a long time, being this
one of the reasons why new green materials that are potential options to be used are not always
successfully approved [6].
1.2.4 Replacing conventional food packaging materials with green materials
As it has already been pointed out in the previous sections, packaging which is not efficiently recycled
or biodegradable is causing a very negative impact on our planet. It is for this reason that finding
alternative solutions is becoming a priority. Green materials have to meet the needs that are in demand
for food packaging applications. These materials must remain without variations in their mechanical and
barrier properties along with their functionality and proper storage during their use. In addition, they
have to provide enough durability of the packaging within the product shelf-life [2]. Considering all of
these aspects, it goes without saying that this is a challenging situation. Therefore, finding suitable
biodegradable alternatives in the near future is a priority.
The most commonly used material for packaging applications is paper due to the fact that it presents
suitable mechanical strength and flexibility. However, paper exhibits poor barrier properties being this
the reason why a surface treatment becomes essential for broadening its applications [6]. Paper is a
biodegradable material made up of microfibrils from a porous cellulose structure. It presents long-chain
cellulose molecules in a crystalline state with amorphous regions regularly distributed. Despite its
biodegradable nature, it presents an important disadvantage: the paper has a hydrophilic behavior that
limits its barrier properties. In addition, it can also absorb water easily from the environment on account
of its fiber network porosity. Therefore, mechanical and physical characteristics may be affected,
changed or even lost. It is for this reason that paper is often combined with plastic or aluminum so as
to achieve improved barrier properties by combining the stiffness of the paper with advantageous
properties from the other materials added to this substrate [5].
Nowadays, ethylene vinyl alcohol (EVOH) is a commonly used polymer that exhibits high oxygen barrier
properties. Nevertheless, its polar groups create a hydrophilic characteristic at high relative humidity
which is why an extra polyolefin layer has to be regularly used. This configuration is commonly known
as a multilayer system which lacks biodegradability and recyclability [5]. Apart from EVOH, PE and PET
are plastics commonly used in multilayer systems in order to produce combined packaging systems for
food storage. Likewise, synthetic polymer dispersions are being considered for coating board or similar
substrates [6]. Paper is usually coated with a thin layer of PE that can be removed before the repulping
process of the paper due to the hydrophobic nature of this plastic [2]. Nevertheless, these plastic
6
options used for packaging applications are difficult to recycle and consequently, they negatively
contribute to the carbon footprint in the atmosphere.
Some countries are taking action by increasing oil prices, changing the legislation on the treatment of
packaging waste, reducing the amount of material used and forcing retailers and producers to face
responsibilities [6]. Taking these measures into account and promoting new green alternatives are
potential solutions to fight against the plastic waste disposal problem. However, as discussed before, it
is crucial to keep in mind that these green materials need to be competitive with the existing plastics,
both economically and in the functional properties. In addition, aspects such as processability, recycling
and compostability need to be taken into consideration.
1.3 Green food materials
Green food packaging materials are derived from renewable sources. There are three main categories
based on their origin and production [2]:
1) Polymers directly extracted from biomass. This category includes polysaccharides, proteins
(both hydrocolloids) and lipids. This case of study is focused on paper, a polysaccharide
consisting mainly of cellulose combined with waxes, a lipid-based biopolymer.
2) Polymers produced by classical chemical synthesis using renewable green monomers. Polylactic
acid is a good example.
3) Polymers produced by microorganisms or genetically modified bacteria. This group consists
mainly of polyhydroxyalkonoates.
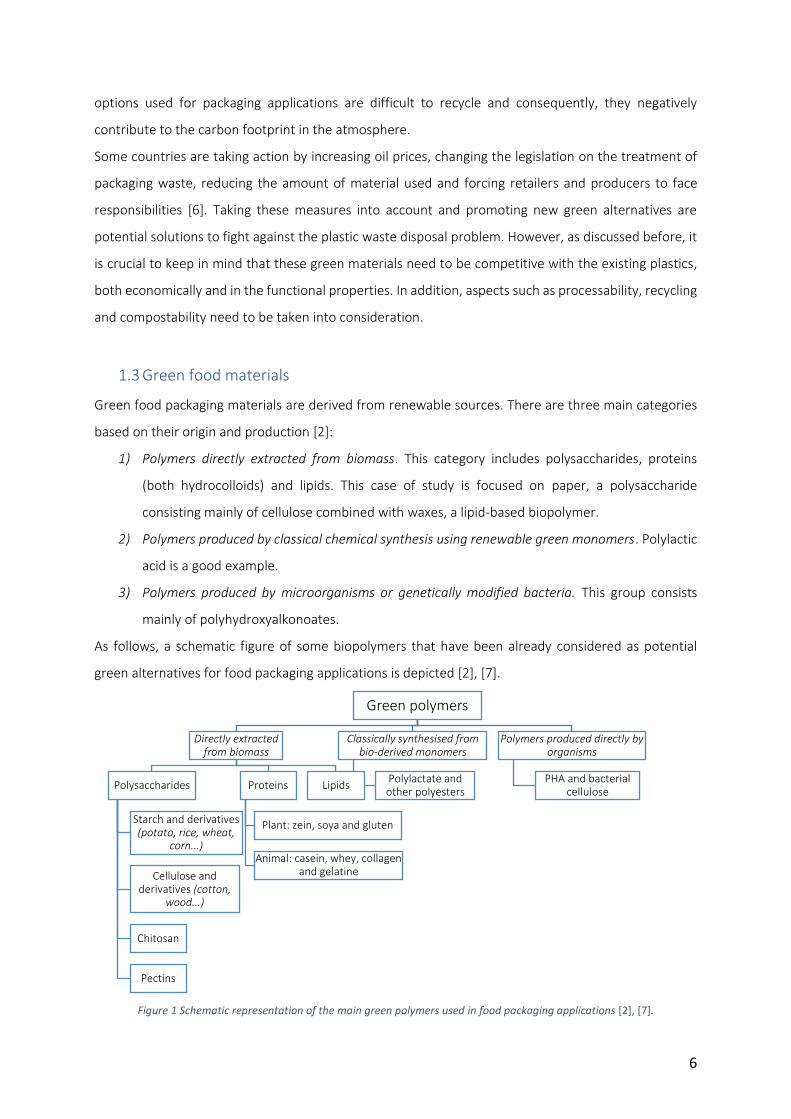
As follows, a schematic figure of some biopolymers that have been already considered as potential
green alternatives for food packaging applications is depicted [2], [7].
Figure 1 Schematic representation of the main green polymers used in food packaging applications [2], [7].
Green polymers
Directly extracted from biomass
Polysaccharides
Starch and derivatives (potato, rice, wheat,
corn...)
Cellulose and derivatives (cotton,
wood...)
Chitosan
Pectins
Proteins
Plant: zein, soya and gluten
Animal: casein, whey, collagen and gelatine
Lipids
Classically synthesised from bio-derived monomers
Polylactate and other polyesters
Polymers produced directly by organisms
PHA and bacterial cellulose
7
In this case of study, the attention is focused on green polymers directly extracted from biomass. In the
following section, the main characteristics of polysaccharides, proteins and lipids are displayed together
with some relevant examples that can be of great interest in this study.
Regarding the biodegradability aspect, biodegradable polymers are those which can experience
perceptible changes in their chemical structure under specific environmental conditions. These changes
can be understood as both physical and mechanical damage when the materials are tested using
standard methods [7].
1.3.1 Description of green polymers directly extracted from biomass
As mentioned previously, green polymers used for the food packaging industry can be divided into
proteins, polysaccharides and lipids [5]. They are extracted from marine or agricultural animals and
plants [2]. Frequently, a coating or an edible film is created from a combination of them [5]. For instance,
lipid-based films can be combined with polysaccharides to provide mechanical strength by creating
composite films. These combinations pursue the aim of enhancing permeability as well as mechanical
properties because the lipid component confers barrier to water vapor while the hydrocolloid
components, such as proteins or polysaccharides, provide mechanical strength [8].
Bearing in mind the aim pursued in this research, the following description is mainly focused on coatings
for paper substrates. Therefore, this leaves aside these same materials used in the form of films which
can confer an equivalent purpose (for example, edible films in direct contact with food items).
Polysaccharide-based coatings
This category of biopolymer-based coatings includes polymers such as cellulose, starch, alginates,
carrageenan and chitosan. All of them are green materials that exhibit excellent gas, aroma and lipid
barriers. Moreover, they present high mechanical properties but their hydrophilic nature results in poor
water vapor barrier properties [5].
The first polysaccharide that has to be pointed out is cellulose and its derivatives. This polymer is the
most abundant natural polymer on earth. It exhibits a regular structure with strong hydrogen bonded
crystalline microfibrils and fibers. In the packaging field, cellulose is often presented in the form of paper
or cardboard [2]. Although it is mainly used for secondary food packaging application, it can be coated
with wax or polyethylene and therefore, it can be used for primary packaging. Among its derivatives,
cellulose acetate (CA) is commonly used in food packaging and it presents low gas and moisture barrier
properties but it has to be plasticized for film production [2].
Chitosan is the second most abundant biopolymer after cellulose and it is a semi-crystalline
polysaccharide that has good film-forming properties and therefore, can be used both for edible films
8
or coatings [5]. Chitosan comes from chitin, a load-bearing component present in the shells of
shellfishes which can be extracted from by-products of the seafood industry [6]. In addition, chitosan
can also present bioactive properties and excellent oxygen barrier properties due to its high crystallinity
and the hydrogen bonds between its molecular chains. It has been reported that chitosan films can
exhibit mechanical properties comparable to commercial polymers from the same strength scale [5].
Moreover, this material has also a high grease resistance on the grounds that the positive charges on
its amino groups constrain fats and lipids because they are negatively charged [5]. On the other hand,
some properties can be affected by moist conditions [2].
To finish with this category, another well-known example of polysaccharide-based materials is starch
which improves its poor barrier properties by being combined with cellulose derivatives and proteins
[5]. This polysaccharide can be found in cereals, legumes and tubers and due to the fact that it does not
form films with suitable mechanical properties, it is first treated by plasticization, blending or modified
either genetically or chemically [2]. On the other hand, if starch is used as a coating, an acetylation
reaction is often used to decrease its hygroscopicity by creating a derivative material known as starch
acetate. It has been reported that water vapor permeability and absorptivity can be notably reduced by
using this derivative material at low relative humidity. An explanation of this phenomenon is that starch
acetate can fill the internal pores of the substrate, such as paper or paperboard [5].
Protein-based coatings
This category of biopolymer-based coatings includes milk proteins, wheat gluten, gelatin, corn zein and
soy protein isolate (SPI) and can be used as edible coatings for fruits, vegetables, meats, eggs, nuts or
directly for coating paper [5].
In general, this type of biopolymers presents outstanding oxygen barrier properties at low to
intermediate relative humidity and good mechanical properties [5]. However, mechanical and barrier
properties can be affected by the relative humidity taking into account the hydrophilic nature of these
protein-based materials. A solution to overcome this drawback is to blend or laminate protein-based
coatings with other compounds that present lower sensitivity towards humidity [2].
Lipid-based coatings
This category of biopolymer-based coatings includes waxes or long-chain fatty acids and they are the
most efficient compounds to reduce moisture permeability due to their high hydrophobicity. This
characteristic is justified by their high content in esters of long-chain fatty alcohols and acids along with
long-chain alkanes [5]. During a wax treatment, this lipid-based material is impregnated on a paper
substrate and it penetrates into the fiber structure. Consequently, a glossy surface with hydrophobic
9
characteristics can be achieved, therefore improving the water resistance performance of the substrate
[6]. On the other hand, this category presents weak points such as brittleness, heterogeneity and
pinholes or cracks in the surface of the coating [5].
Biopolymer composite coatings
As it can be easily noticed, it is difficult that a single green material exhibits good properties in all the
aspects required. This is the reason why composites or multilayer coatings gain importance in this field
seeing that it can be very advantageous to combine structural properties and gas barrier properties
from hydrocolloids (proteins and polysaccharides) with moisture barrier properties from lipids [5], [8].
1.3.2 Manufacturing of green food packaging
Green packaging materials must meet the same requirements as the conventional packaging materials
used for food packaging applications. In the following table, the most commonly used processing routes
are displayed. As already pointed out, it is a key factor to be able to process green materials with the
same extrusion techniques as the existing ones for synthetic polymers. The processing of green
materials has to be cost-efficient to be a competitive candidate [7].
Processing route Product examples
Co-Extruded film Packaging film
Cast film Packaging film
Thermoformed sheets Trays, cups
Blown films Packaging film
Injection blow-
molding Salad pots, cutlery, drinking beakers, cups, plates, drink bottles
Fibers and non-woven Agricultural products, diapers, feminine hygiene products, medical plastics and
clothing
Extrusion coating Laminated paper or films
Table 3 The major processing routes to potential green materials [2].
Coating technique
There are several coating techniques that can be considered in order to coat paper or paperboard with
green polymers. Among them, solution coating, compression molding, surface sizing or curtain coating
are the most common ones.
The technique selected in each particular case is highly dependent on the coating used, the available
amount of coating and the desired final function of the packaging product [5].
10
Taking all of this into account, in [9] different coating procedures and oxygen barrier properties of paper
coated with chitosan, whey protein isolate (WPI), whey protein coating (WPC) and wheat gluten (WG)
were examined by means of solution-coating using hand applicator, compression-molding and curtain
coating procedures. They determined that the applicator resulted in too thin and discontinuous sheets,
whereas in the compression-molding process applied by using WG, the sheets were thick and
continuous, with a low oxygen permeability result. Finally, chitosan-curtain-coated paperboard
exhibited the greatest oxygen barrier permeability. In addition, the chitosan coating also showed
remarkably suitable mechanical properties. Therefore, it was concluded that each technique offered
different results in the final performance of the coatings on the paper substrate.
In addition, when a specific coating technique is selected it is also necessary to take into consideration
the coating viscosity as well as the colloidal stability. For instance, too low viscosity may result in an
excess penetration into the paper due to its highly porous structure [6]. Consequently, the coating
technique can directly influence the final performance of the coating. Techniques such as curtain
coating or spray coating follow the irregularities of the substrates resulting in a thicker coating layer
while blade coating normally achieves a smooth surface with a major variation in thickness in the coating
layer. On the other hand, bar coaters confer a middle result between the previous techniques cited. In
addition, depending on the coating technique selected, different coating weight ranges can be achieved
[6]. In fact, several studies analyzed the influence of the coating weight by varying parameters during
the coating procedure.
Conditioning of the paper
When testing paper and paper products, made from cellulosic materials, there is a practice that needs
to be carried out. Before applying the coating, it is very important to precondition and condition the
paper samples that will be coated and subsequently tested. The importance of this conditioning
procedure is due to the fact that the physical properties of cellulosic materials are highly affected by
both temperature and relative humidity [10], [11]. Therefore, standard procedures or justified
modifications of these standards have to be performed. These standards describe practices in which
the samples are placed and kept in a specified atmosphere for a length of time in order to be able to do
reproducible measurements of their physical properties.
11
1.4 Properties of green packaging materials
1.4.1 Introduction
Designing and manufacturing a new package is a multi-step process which involves taking into account
all the required properties for its specific end use. These properties include gas and water vapor
permeability, mechanical properties, sealing capability, thermoforming properties, resistance (towards
water, grease, acid, UV light…), machinability on the packaging line, transparency, anti-fogging capacity,
printability, availability and costs. Also, the process of disposal of the package at the end of its use has
to be considered [2]. Factors such as time, temperature, moisture, light, gases and pressure can
indirectly affect the quality of foods packaged whereas mechanical damage during transportation or
attack of microorganisms can irreversibly damage the edible content of the package [6].
On the other hand, achieving a precise barrier properties comparison among different green packaging
materials becomes very complex on the grounds that different types of equipment and dissimilar
conditions during testing are likely to happen [2].
1.4.2 Barrier properties
As already mentioned, when working with food packaging materials, it has to be taken into account that
water vapor and oxygen molecules can penetrate and cause permanent changes in the food quality,
react with it or even degrade it. For this reason, studying barrier properties becomes an essential key
point considering the final application of these materials. As follows, some barrier properties are
discussed along with interesting examples from ongoing investigations.
Oxygen permeability
Exposing food to oxygen can cause oxidation and irreversible changes in food contained in a package.
Consequently, the oxygen permeability of materials used for food packaging applications has to be
examined. As a matter of fact, most of the hygroscopic materials lose oxygen barrier at high relative
humidity (RH) because they absorb water and consequently, the polymeric substrate swells creating a
more porous structure. Therefore, the oxygen permeability of green polymers with a hydrophilic
tendency increases exponentially with an increment of RH [6].
For instance, in [12] greaseproof paper coated with chitosan was analyzed in order to test the barrier
properties of oxygen, nitrogen and carbon dioxide. It was concluded that the oxygen permeability was
on the same scale as PET when the coating weight was superior to 5 g/m2. Moreover, grease barrier
properties were tested and it was concluded that with a coating weight ranging between 2.4 to 5.2
g/m2, the paper could exhibit outstanding results.
12
Another interesting example, in [13] a combination of carnauba wax, mica, glycerol and NaCAS (sodium
caseinate) solution was studied by varying the concentrations of each component in order to obtain
different coating solutions for the paper. Afterwards, the oxygen barrier properties were analyzed and
compared. It was concluded that the oxygen permeability decreased from 13 to 90 times in the coated-
samples compared to the uncoated paper.
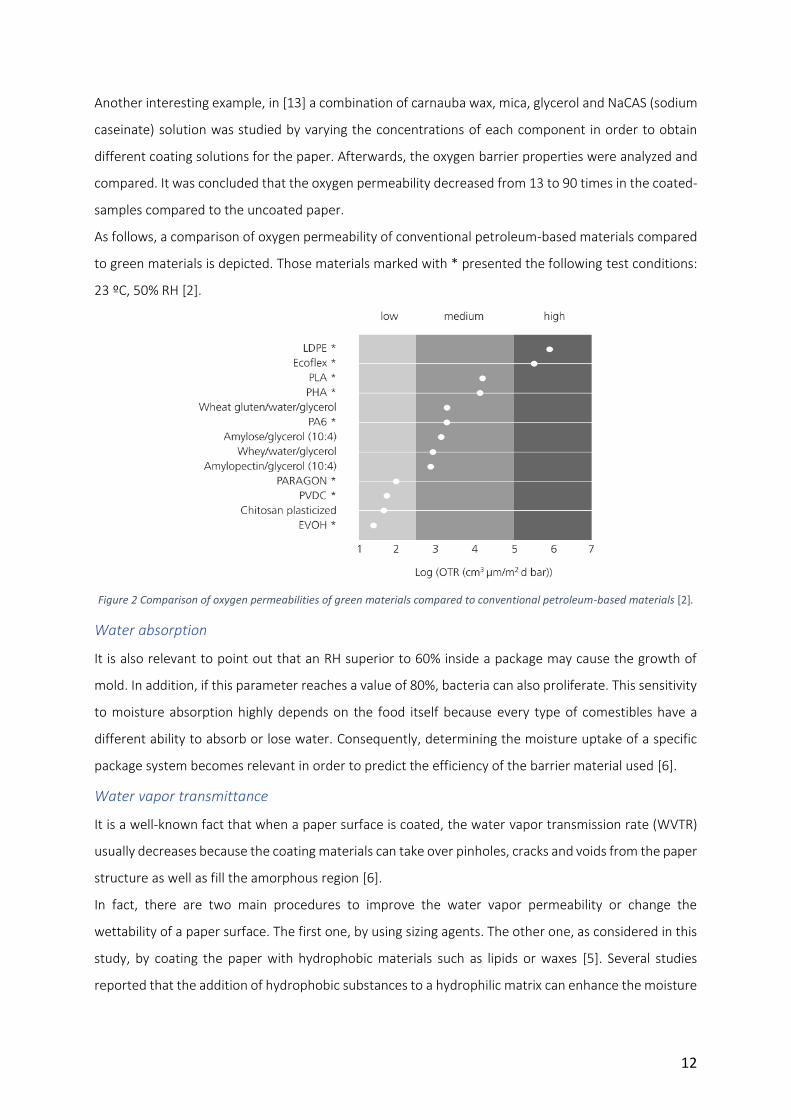
As follows, a comparison of oxygen permeability of conventional petroleum-based materials compared
to green materials is depicted. Those materials marked with * presented the following test conditions:
23 ºC, 50% RH [2].
Figure 2 Comparison of oxygen permeabilities of green materials compared to conventional petroleum-based materials [2].
Water absorption
It is also relevant to point out that an RH superior to 60% inside a package may cause the growth of
mold. In addition, if this parameter reaches a value of 80%, bacteria can also proliferate. This sensitivity
to moisture absorption highly depends on the food itself because every type of comestibles have a
different ability to absorb or lose water. Consequently, determining the moisture uptake of a specific
package system becomes relevant in order to predict the efficiency of the barrier material used [6].
Water vapor transmittance
It is a well-known fact that when a paper surface is coated, the water vapor transmission rate (WVTR)
usually decreases because the coating materials can take over pinholes, cracks and voids from the paper
structure as well as fill the amorphous region [6].
In fact, there are two main procedures to improve the water vapor permeability or change the
wettability of a paper surface. The first one, by using sizing agents. The other one, as considered in this
study, by coating the paper with hydrophobic materials such as lipids or waxes [5]. Several studies
reported that the addition of hydrophobic substances to a hydrophilic matrix can enhance the moisture
13
barrier properties. Moreover, they also detected that this parameter depends highly on the amount of
wax comprised in the coating [5].
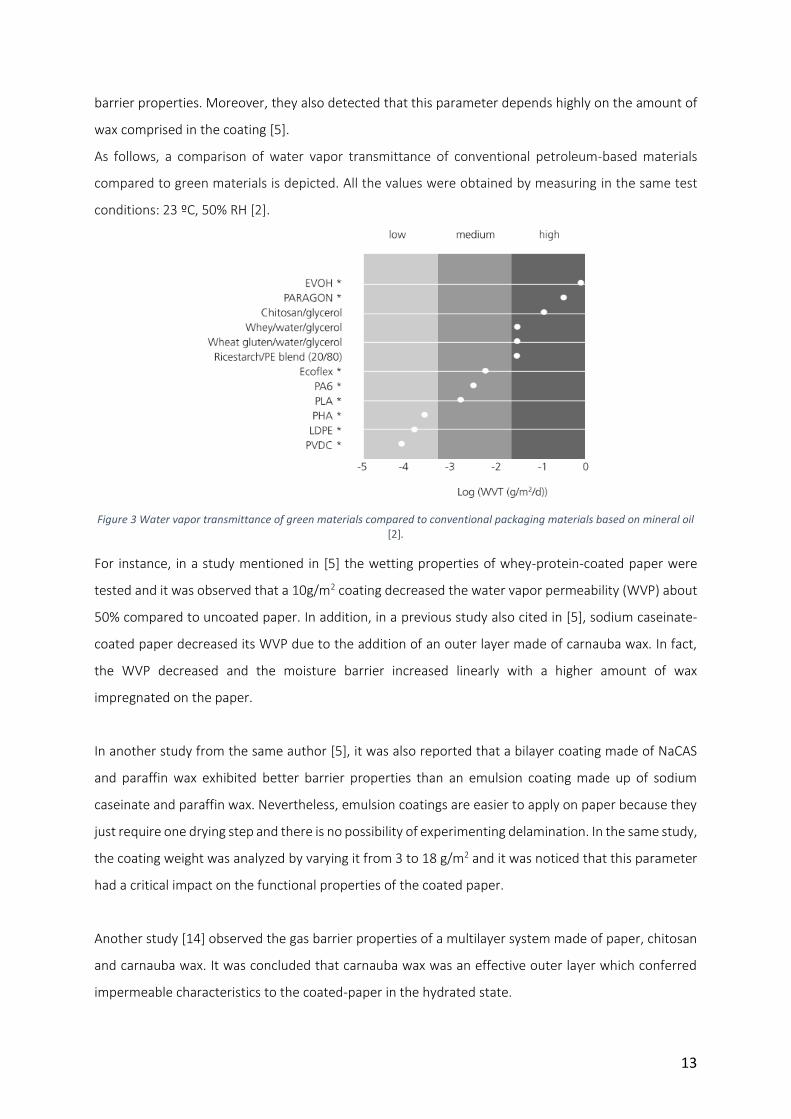
As follows, a comparison of water vapor transmittance of conventional petroleum-based materials
compared to green materials is depicted. All the values were obtained by measuring in the same test
conditions: 23 ºC, 50% RH [2].
Figure 3 Water vapor transmittance of green materials compared to conventional packaging materials based on mineral oil [2].
For instance, in a study mentioned in [5] the wetting properties of whey-protein-coated paper were
tested and it was observed that a 10g/m2 coating decreased the water vapor permeability (WVP) about
50% compared to uncoated paper. In addition, in a previous study also cited in [5], sodium caseinate-
coated paper decreased its WVP due to the addition of an outer layer made of carnauba wax. In fact,
the WVP decreased and the moisture barrier increased linearly with a higher amount of wax
impregnated on the paper.
In another study from the same author [5], it was also reported that a bilayer coating made of NaCAS
and paraffin wax exhibited better barrier properties than an emulsion coating made up of sodium
caseinate and paraffin wax. Nevertheless, emulsion coatings are easier to apply on paper because they
just require one drying step and there is no possibility of experimenting delamination. In the same study,
the coating weight was analyzed by varying it from 3 to 18 g/m2 and it was noticed that this parameter
had a critical impact on the functional properties of the coated paper.
Another study [14] observed the gas barrier properties of a multilayer system made of paper, chitosan
and carnauba wax. It was concluded that carnauba wax was an effective outer layer which conferred
impermeable characteristics to the coated-paper in the hydrated state.
14
Grease resistance
Another barrier property that is interesting to be determined for food packaging applications is the
grease resistance. There are several methods to establish the grease resistance of packaging that is in
direct contact with oil, fat and grease. In most of them, this property is analyzed by visual observation
of the external state of the substrate tested [6]. Accordingly, this property becomes important when
the packaging considered has to be in direct contact with food that contains fats or oils [5]. In a study
cited in [15], it was observed that by using a zein coating on paper, a grease barrier comparable to
polyethylene sandwich packaging already being used in some fast-food companies was achievable. Also,
a study referred to in [5] considered carrageenan-coated papers and they resulted in a grease resistance
comparable to polyethylene-laminated papers.
Also, in [5] another study was cited. They examined WPI-coated paperboard and they found that a good
grease barrier was achieved. However, glycerol, used as a plasticizer, could migrate during storage.
Plasticizers, short-chain and low-molecular-weight polymers or oligomers, are added in order to
increase the flexibility, workability and dispensability of a coating solution [4]. It is very important to
study the behavior of these substances in order to prevent the migration of chemicals that may cause
quality changes in the food, resulting in health risks. The most commonly used plasticizer for starch and
proteins is glycerol due to its small size and the ability to be inserted between the polymer chains [4].
Furthermore, plasticizers decrease the water activity and consequently, they can effectively limit
microbial growth [2].
1.4.3 Mechanical properties
To meet the demands of food packaging products, good mechanical properties are required. It has to
be taken into account that during the preparation of paper-based food packaging materials, creasing or
die cutting in order to achieve the final shape of the package implicates complex tensile, compression
and shear forces acting on a very small area. Therefore, cracks in the coating or delamination can take
place during manufacturing [6]. It is for this reason that properties such as tensile strength (TS),
elongation (E), Young modulus (E) and tearing resistance (TR) are the main ones considered for
characterizing paper. By examining these properties, the ductility of the coating layer placed on the
paper substrate can be defined [5]. These properties are directly influenced by the substrate, the paper
in this case. However, the coating material used may cause an influential change in these properties
which is why studying the mechanical properties of paper-coated configurations becomes relevant.
Studies such as one cited in [5] demonstrated that the use of different coating weights from a NaCAS-
paraffin wax emulsion coating (from 3 to 18 g/m2) did not affect directly the TS of the resulting coated-
papers. In fact, it was concluded that TS depended mainly on the paper whereas E was increased by
15
incrementing the coating weight. Nevertheless, the TR was changed by both coating weight and paraffin
wax concentration. On the other hand, in [13] it was experienced an increase in TS and ductility when a
NaCAS, mica, carnauba wax and glycerol coating solution was used to coat paper. Conversely, in [15]
was observed that whey protein (WPI) coating decreased the TS of the paper used. They explained that
the reason why the mechanical properties decreased could be due to some fiber-to-fiber interference
between the cellulose fiber structure of the paper and the WPI coating. This interference could be
causing a reduction in the interaction force among fibers resulting in a decrease in the TS values.
1.4.4 Thermal properties
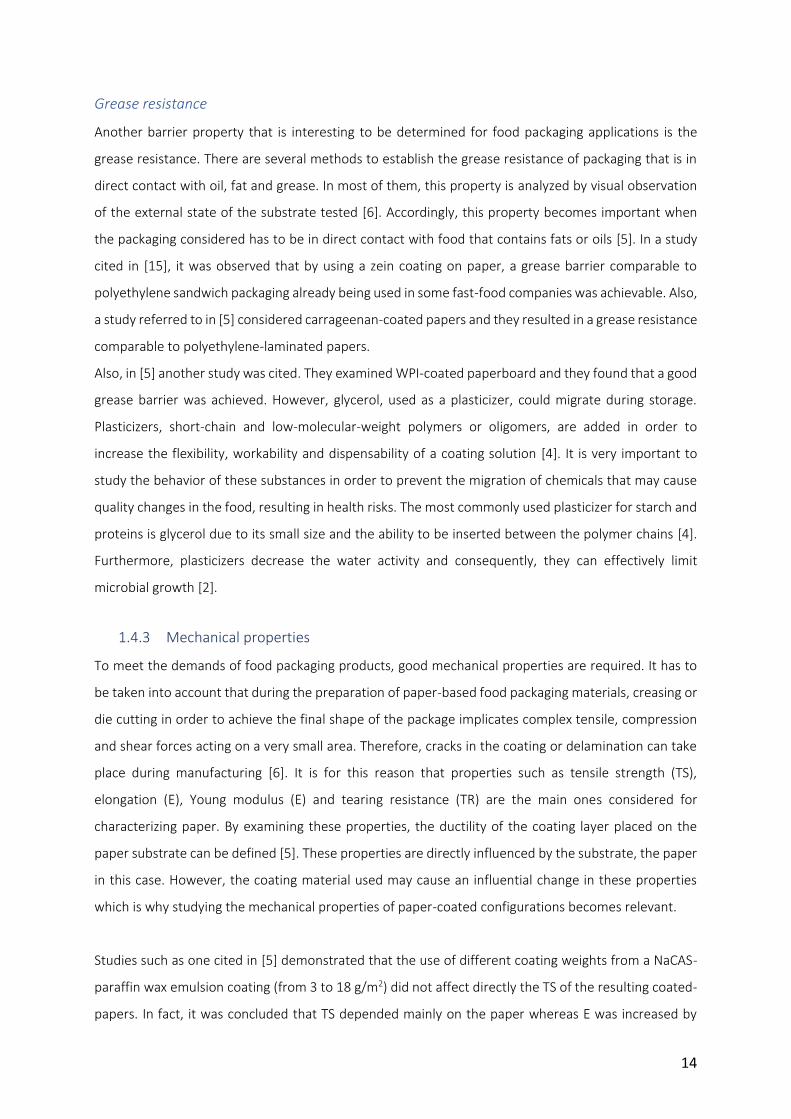
Lastly, thermal properties also play an important role when packaging materials are used. Defining the
thermal transition temperatures is important not only for the end use of the packaging item but also to
adjust the processing parameters properly. As follows, a comparison of the melting temperature of
conventional petroleum-based materials compared to green materials is depicted [2]. From this image,
it can be clearly observed that usually green materials present a narrower as well as lower range of
melting temperature.
Figure 4 Comparison of the thermal properties of green polymers with conventional polymers [2].
1.4.5 Summary of barrier properties
Several studies have been reviewed during this work regarding the characterization of green coatings
and their barrier, mechanical and thermal properties. As cited previously, being able to compare results
in this field is difficult due to the fact that green polymers are usually found to be more heterogeneous
than the synthetic ones. Additionally, the testing conditions have a determining effect on the
performance of the tested coatings as well as their respective substrates, adding complexity when it
comes to comparing among different studies. The coating weight, the monolayer or multilayer system
selected or the coating technique used, among other factors can result in divergent conclusions.
Nevertheless, in Appendix A of this document a table with permeability values from different barrier
16
coated substrates can be found. This collected data is intended to give a general idea of the common
values expected for the barrier properties of these food packaging materials.
1.5 Natural waxes
1.5.1 Types of waxes
Waxes are a class of substance extensively used in formulations of cosmetic products [16]. In addition,
waxes are commonly used as food additives and coatings providing protection to fresh products, for
molding preparation, for polymer and composites modification, in the medical field, for dental care
products as well as for the food packaging industry. As a consequence of this wide variety of
applications, synthetic and natural waxes are significantly important as raw materials in many industry
branches [16]. Nevertheless, in this case of study, the interest is focused on innovative food packaging
applications.
As already mentioned before, waxes belong to the lipid category. They are non-polar and soluble in
organic solvents. Moreover, they self-assemble rapidly at room temperature and have the ability to
form crystalline materials. Their crystallinity depends on the molecular rearrangements when the
materials crystallize and these rearrangements affect directly their material properties. In addition,
waxes have a complex chemical composition because they are made up of a wide variety of distinct
molecular entities and their molecular composition and interactions during crystallization affect their
physical properties. The crystal network formation along with the lipid crystal structure (size and shape
of the lipid crystals) set their physical properties. The lipid crystal structure depends on the type of lipid,
fatty acid distribution and the crystallization conditions such as temperature, cooling rate, shear and
presence of a solvent [17].
In general terms, waxes are divided into natural or synthetic materials. Within the natural waxes, there
are four different types of waxes: plant, animal, mineral and petrochemical waxes. The composition of
waxes is complex and sometimes being able to achieve a detailed analysis is not easy [18].
A general definition for waxes according to [19] is a mixture of more or less hydrophobic substances of
medium chain length with the following properties: low melt viscosity, occasionally buffable, strong
temperature dependence of solubility and consistency, re-solidifying unchanged after melting and
melting points from 40 to 140ºC approx. At 20ºC, waxes exhibit a plastic and brittle behavior but they
melt higher than 40ºC achieving a soft and tacky form.
17
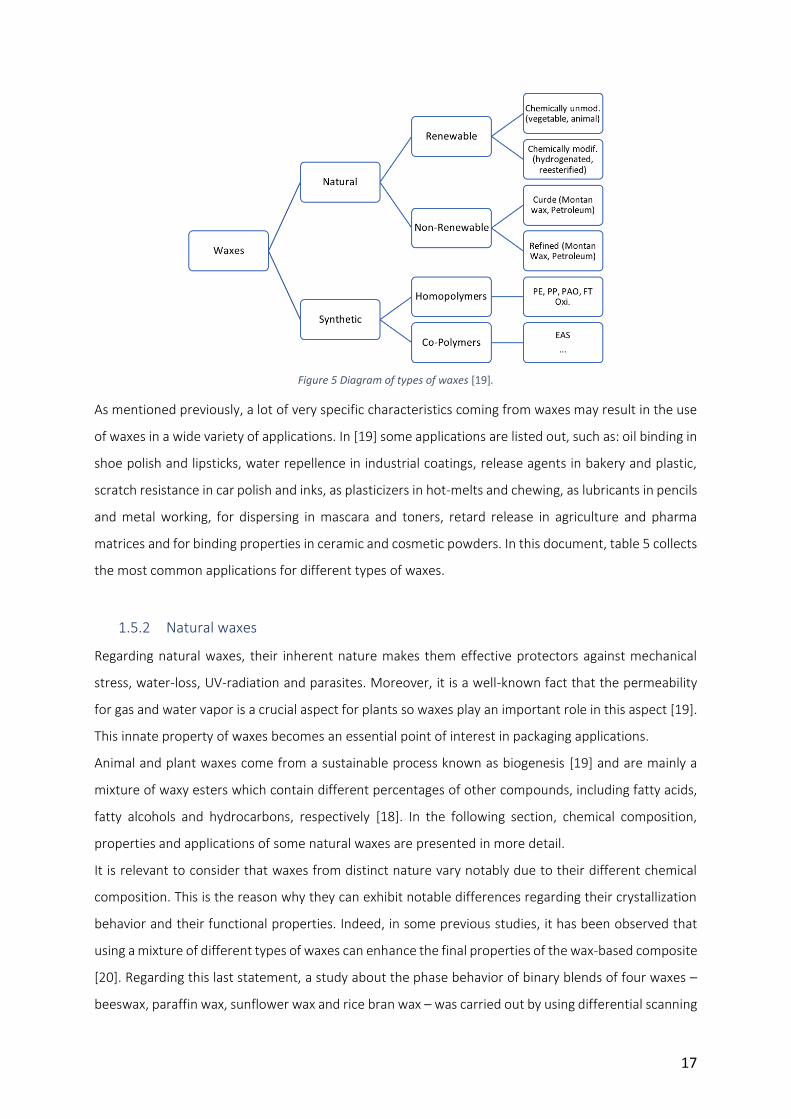
Figure 5 Diagram of types of waxes [19].
As mentioned previously, a lot of very specific characteristics coming from waxes may result in the use
of waxes in a wide variety of applications. In [19] some applications are listed out, such as: oil binding in
shoe polish and lipsticks, water repellence in industrial coatings, release agents in bakery and plastic,
scratch resistance in car polish and inks, as plasticizers in hot-melts and chewing, as lubricants in pencils
and metal working, for dispersing in mascara and toners, retard release in agriculture and pharma
matrices and for binding properties in ceramic and cosmetic powders. In this document, table 5 collects
the most common applications for different types of waxes.
1.5.2 Natural waxes
Regarding natural waxes, their inherent nature makes them effective protectors against mechanical
stress, water-loss, UV-radiation and parasites. Moreover, it is a well-known fact that the permeability
for gas and water vapor is a crucial aspect for plants so waxes play an important role in this aspect [19].
This innate property of waxes becomes an essential point of interest in packaging applications.
Animal and plant waxes come from a sustainable process known as biogenesis [19] and are mainly a
mixture of waxy esters which contain different percentages of other compounds, including fatty acids,
fatty alcohols and hydrocarbons, respectively [18]. In the following section, chemical composition,
properties and applications of some natural waxes are presented in more detail.
It is relevant to consider that waxes from distinct nature vary notably due to their different chemical
composition. This is the reason why they can exhibit notable differences regarding their crystallization
behavior and their functional properties. Indeed, in some previous studies, it has been observed that
using a mixture of different types of waxes can enhance the final properties of the wax-based composite
[20]. Regarding this last statement, a study about the phase behavior of binary blends of four waxes –
beeswax, paraffin wax, sunflower wax and rice bran wax – was carried out by using differential scanning
18
calorimetry (DSC). It was concluded that natural waxes consist of molecular entities which have a direct
effect on the crystallization behavior and the morphology of the crystal formation. By analyzing the
behavior of wax blends, it was confirmed that an addition of 20% of one component over the other
varied significantly the phase behavior. In consequence, the functional and physical properties of the
entire system were altered [20].
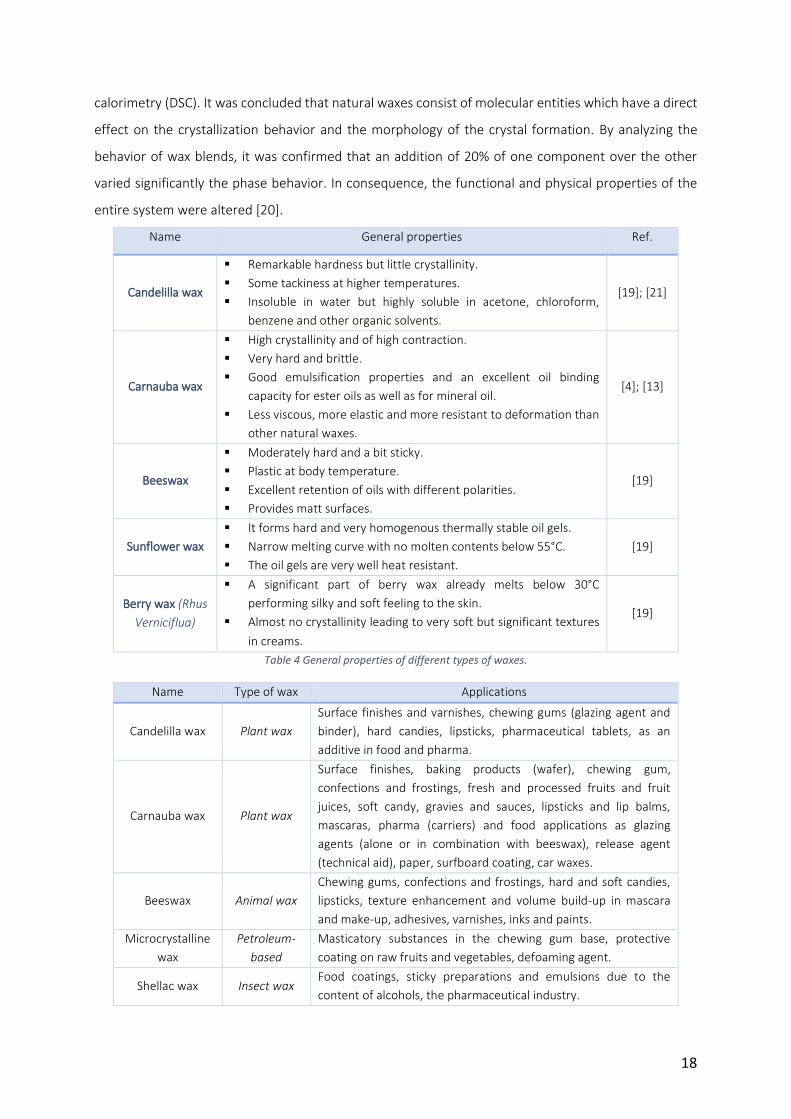
Name General properties Ref.
Candelilla wax
Remarkable hardness but little crystallinity.
Some tackiness at higher temperatures.
Insoluble in water but highly soluble in acetone, chloroform,
benzene and other organic solvents.
[19]; [21]
Carnauba wax
High crystallinity and of high contraction.
Very hard and brittle.
Good emulsification properties and an excellent oil binding
capacity for ester oils as well as for mineral oil.
Less viscous, more elastic and more resistant to deformation than
other natural waxes.
[4]; [13]
Beeswax
Moderately hard and a bit sticky.
Plastic at body temperature.
Excellent retention of oils with different polarities.
Provides matt surfaces.
[19]
Sunflower wax
It forms hard and very homogenous thermally stable oil gels.
Narrow melting curve with no molten contents below 55°C.
The oil gels are very well heat resistant.
[19]
Berry wax (Rhus
Verniciflua)
A significant part of berry wax already melts below 30°C
performing silky and soft feeling to the skin.
Almost no crystallinity leading to very soft but significant textures
in creams.
[19]
Table 4 General properties of different types of waxes.
Name Type of wax Applications
Candelilla wax Plant wax
Surface finishes and varnishes, chewing gums (glazing agent and
binder), hard candies, lipsticks, pharmaceutical tablets, as an
additive in food and pharma.
Carnauba wax Plant wax
Surface finishes, baking products (wafer), chewing gum,
confections and frostings, fresh and processed fruits and fruit
juices, soft candy, gravies and sauces, lipsticks and lip balms,
mascaras, pharma (carriers) and food applications as glazing
agents (alone or in combination with beeswax), release agent
(technical aid), paper, surfboard coating, car waxes.
Beeswax Animal wax
Chewing gums, confections and frostings, hard and soft candies,
lipsticks, texture enhancement and volume build-up in mascara
and make-up, adhesives, varnishes, inks and paints.
Microcrystalline
wax
Petroleum-
based
Masticatory substances in the chewing gum base, protective
coating on raw fruits and vegetables, defoaming agent.
Shellac wax Insect wax Food coatings, sticky preparations and emulsions due to the
content of alcohols, the pharmaceutical industry.
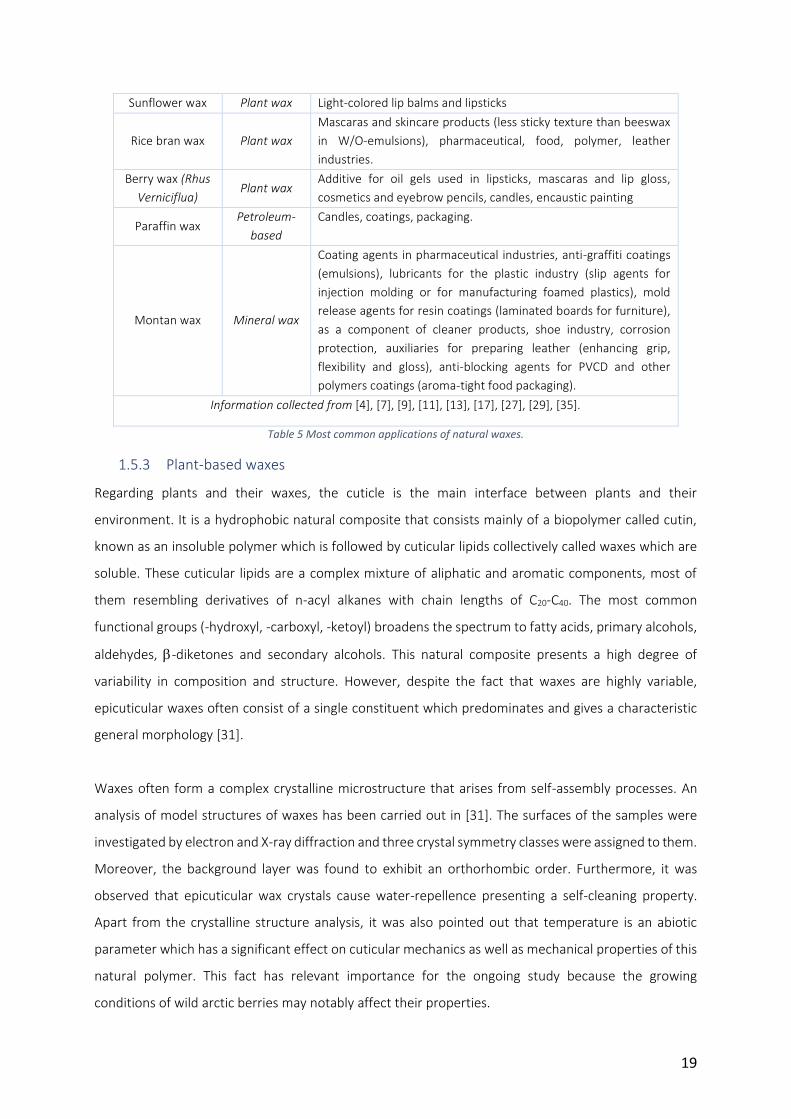
19
Sunflower wax Plant wax Light-colored lip balms and lipsticks
Rice bran wax Plant wax
Mascaras and skincare products (less sticky texture than beeswax
in W/O-emulsions), pharmaceutical, food, polymer, leather
industries.
Berry wax (Rhus
Verniciflua) Plant wax
Additive for oil gels used in lipsticks, mascaras and lip gloss,
cosmetics and eyebrow pencils, candles, encaustic painting
Paraffin wax Petroleum-
based
Candles, coatings, packaging.
Montan wax Mineral wax
Coating agents in pharmaceutical industries, anti-graffiti coatings
(emulsions), lubricants for the plastic industry (slip agents for
injection molding or for manufacturing foamed plastics), mold
release agents for resin coatings (laminated boards for furniture),
as a component of cleaner products, shoe industry, corrosion
protection, auxiliaries for preparing leather (enhancing grip,
flexibility and gloss), anti-blocking agents for PVCD and other
polymers coatings (aroma-tight food packaging).
Information collected from [4], [7], [9], [11], [13], [17], [27], [29], [35].
Table 5 Most common applications of natural waxes.
1.5.3 Plant-based waxes
Regarding plants and their waxes, the cuticle is the main interface between plants and their
environment. It is a hydrophobic natural composite that consists mainly of a biopolymer called cutin,
known as an insoluble polymer which is followed by cuticular lipids collectively called waxes which are
soluble. These cuticular lipids are a complex mixture of aliphatic and aromatic components, most of
them resembling derivatives of n-acyl alkanes with chain lengths of C20-C40. The most common
functional groups (-hydroxyl, -carboxyl, -ketoyl) broadens the spectrum to fatty acids, primary alcohols,
aldehydes, -diketones and secondary alcohols. This natural composite presents a high degree of
variability in composition and structure. However, despite the fact that waxes are highly variable,
epicuticular waxes often consist of a single constituent which predominates and gives a characteristic
general morphology [31].
Waxes often form a complex crystalline microstructure that arises from self-assembly processes. An
analysis of model structures of waxes has been carried out in [31]. The surfaces of the samples were
investigated by electron and X-ray diffraction and three crystal symmetry classes were assigned to them.
Moreover, the background layer was found to exhibit an orthorhombic order. Furthermore, it was
observed that epicuticular wax crystals cause water-repellence presenting a self-cleaning property.
Apart from the crystalline structure analysis, it was also pointed out that temperature is an abiotic
parameter which has a significant effect on cuticular mechanics as well as mechanical properties of this
natural polymer. This fact has relevant importance for the ongoing study because the growing
conditions of wild arctic berries may notably affect their properties.
20
In this section, three different plant-based waxes (candelilla wax, carnauba wax and blueberry wax) are
presented and their main characteristics and properties are cited in detail. There are other types of
waxes that belong to this category (soy wax, rice bran wax, Japan wax among others) that are not
discussed in this report.
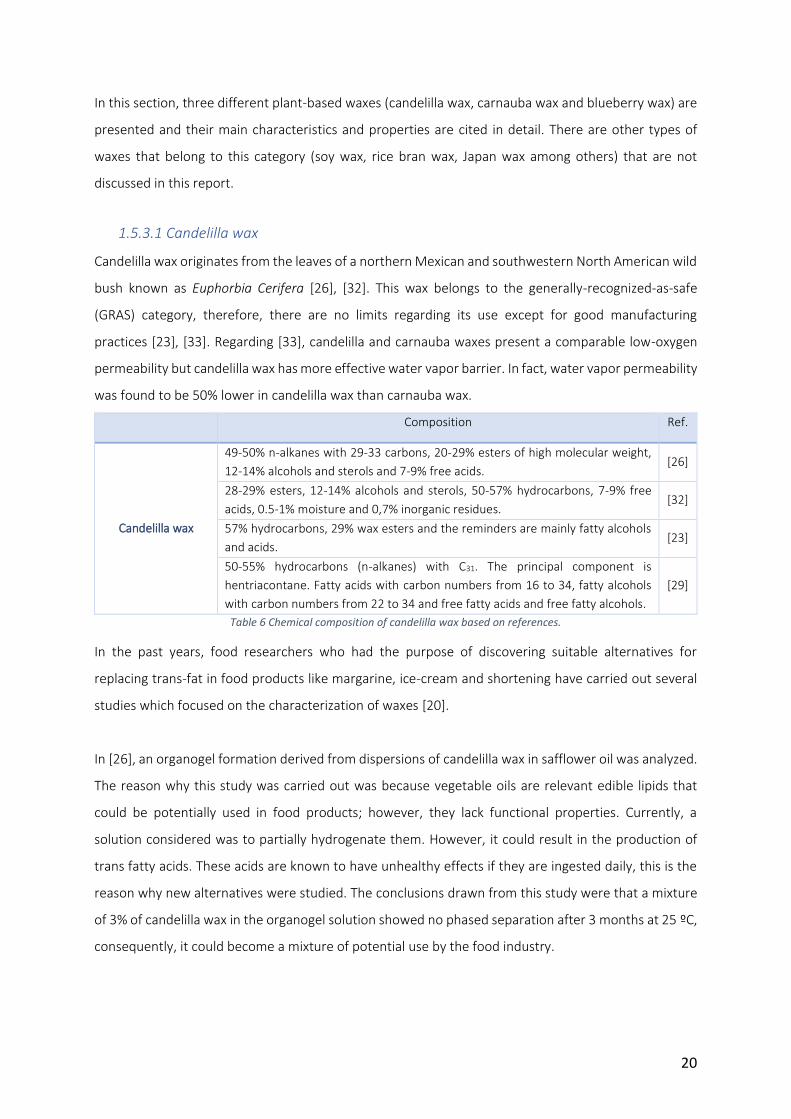
1.5.3.1 Candelilla wax
Candelilla wax originates from the leaves of a northern Mexican and southwestern North American wild
bush known as Euphorbia Cerifera [26], [32]. This wax belongs to the generally-recognized-as-safe
(GRAS) category, therefore, there are no limits regarding its use except for good manufacturing
practices [23], [33]. Regarding [33], candelilla and carnauba waxes present a comparable low-oxygen
permeability but candelilla wax has more effective water vapor barrier. In fact, water vapor permeability
was found to be 50% lower in candelilla wax than carnauba wax.
Composition Ref.
Candelilla wax
49-50% n-alkanes with 29-33 carbons, 20-29% esters of high molecular weight,
12-14% alcohols and sterols and 7-9% free acids. [26]
28-29% esters, 12-14% alcohols and sterols, 50-57% hydrocarbons, 7-9% free
acids, 0.5-1% moisture and 0,7% inorganic residues. [32]
57% hydrocarbons, 29% wax esters and the reminders are mainly fatty alcohols
and acids. [23]
50-55% hydrocarbons (n-alkanes) with C31. The principal component is
hentriacontane. Fatty acids with carbon numbers from 16 to 34, fatty alcohols
with carbon numbers from 22 to 34 and free fatty acids and free fatty alcohols.
[29]
Table 6 Chemical composition of candelilla wax based on references.
In the past years, food researchers who had the purpose of discovering suitable alternatives for
replacing trans-fat in food products like margarine, ice-cream and shortening have carried out several
studies which focused on the characterization of waxes [20].
In [26], an organogel formation derived from dispersions of candelilla wax in safflower oil was analyzed.
The reason why this study was carried out was because vegetable oils are relevant edible lipids that
could be potentially used in food products; however, they lack functional properties. Currently, a
solution considered was to partially hydrogenate them. However, it could result in the production of
trans fatty acids. These acids are known to have unhealthy effects if they are ingested daily, this is the
reason why new alternatives were studied. The conclusions drawn from this study were that a mixture
of 3% of candelilla wax in the organogel solution showed no phased separation after 3 months at 25 ºC,
consequently, it could become a mixture of potential use by the food industry.
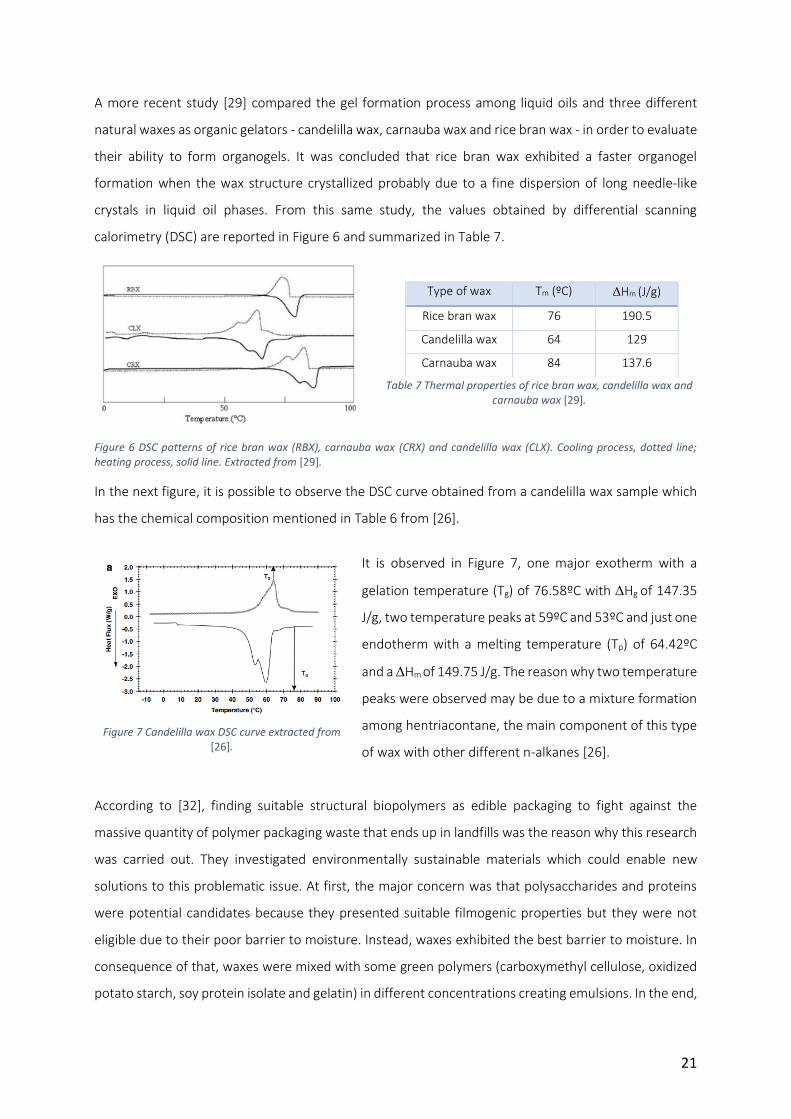
21
A more recent study [29] compared the gel formation process among liquid oils and three different
natural waxes as organic gelators - candelilla wax, carnauba wax and rice bran wax - in order to evaluate
their ability to form organogels. It was concluded that rice bran wax exhibited a faster organogel
formation when the wax structure crystallized probably due to a fine dispersion of long needle-like
crystals in liquid oil phases. From this same study, the values obtained by differential scanning
calorimetry (DSC) are reported in Figure 6 and summarized in Table 7.
Table 7 Thermal properties of rice bran wax, candelilla wax and carnauba wax [29].
Figure 6 DSC patterns of rice bran wax (RBX), carnauba wax (CRX) and candelilla wax (CLX). Cooling process, dotted line; heating process, solid line. Extracted from [29].
In the next figure, it is possible to observe the DSC curve obtained from a candelilla wax sample which
has the chemical composition mentioned in Table 6 from [26].
It is observed in Figure 7, one major exotherm with a
gelation temperature (Tg) of 76.58ºC with Hg of 147.35
J/g, two temperature peaks at 59ºC and 53ºC and just one
endotherm with a melting temperature (Tp) of 64.42ºC
and a Hm of 149.75 J/g. The reason why two temperature
peaks were observed may be due to a mixture formation
among hentriacontane, the main component of this type
of wax with other different n-alkanes [26].
According to [32], finding suitable structural biopolymers as edible packaging to fight against the
massive quantity of polymer packaging waste that ends up in landfills was the reason why this research
was carried out. They investigated environmentally sustainable materials which could enable new
solutions to this problematic issue. At first, the major concern was that polysaccharides and proteins
were potential candidates because they presented suitable filmogenic properties but they were not
eligible due to their poor barrier to moisture. Instead, waxes exhibited the best barrier to moisture. In
consequence of that, waxes were mixed with some green polymers (carboxymethyl cellulose, oxidized
potato starch, soy protein isolate and gelatin) in different concentrations creating emulsions. In the end,
Type of wax Tm (ºC) Hm (J/g)
Rice bran wax 76 190.5
Candelilla wax 64 129
Carnauba wax 84 137.6
Figure 7 Candelilla wax DSC curve extracted from [26].
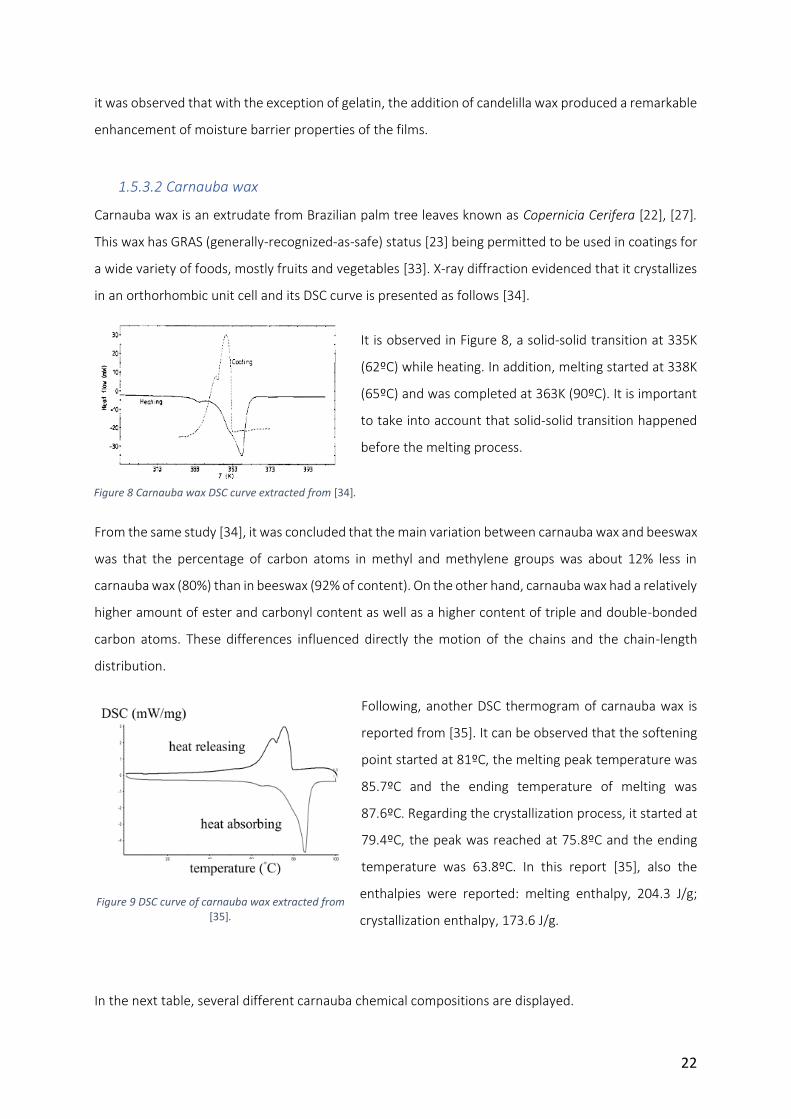
22
it was observed that with the exception of gelatin, the addition of candelilla wax produced a remarkable
enhancement of moisture barrier properties of the films.
1.5.3.2 Carnauba wax
Carnauba wax is an extrudate from Brazilian palm tree leaves known as Copernicia Cerifera [22], [27].
This wax has GRAS (generally-recognized-as-safe) status [23] being permitted to be used in coatings for
a wide variety of foods, mostly fruits and vegetables [33]. X-ray diffraction evidenced that it crystallizes
in an orthorhombic unit cell and its DSC curve is presented as follows [34].
It is observed in Figure 8, a solid-solid transition at 335K
(62ºC) while heating. In addition, melting started at 338K
(65ºC) and was completed at 363K (90ºC). It is important
to take into account that solid-solid transition happened
before the melting process.
From the same study [34], it was concluded that the main variation between carnauba wax and beeswax
was that the percentage of carbon atoms in methyl and methylene groups was about 12% less in
carnauba wax (80%) than in beeswax (92% of content). On the other hand, carnauba wax had a relatively
higher amount of ester and carbonyl content as well as a higher content of triple and double-bonded
carbon atoms. These differences influenced directly the motion of the chains and the chain-length
distribution.
Following, another DSC thermogram of carnauba wax is
reported from [35]. It can be observed that the softening
point started at 81ºC, the melting peak temperature was
85.7ºC and the ending temperature of melting was
87.6ºC. Regarding the crystallization process, it started at
79.4ºC, the peak was reached at 75.8ºC and the ending
temperature was 63.8ºC. In this report [35], also the
enthalpies were reported: melting enthalpy, 204.3 J/g;
crystallization enthalpy, 173.6 J/g.
In the next table, several different carnauba chemical compositions are displayed.
Figure 8 Carnauba wax DSC curve extracted from [34].
Figure 9 DSC curve of carnauba wax extracted from [35].
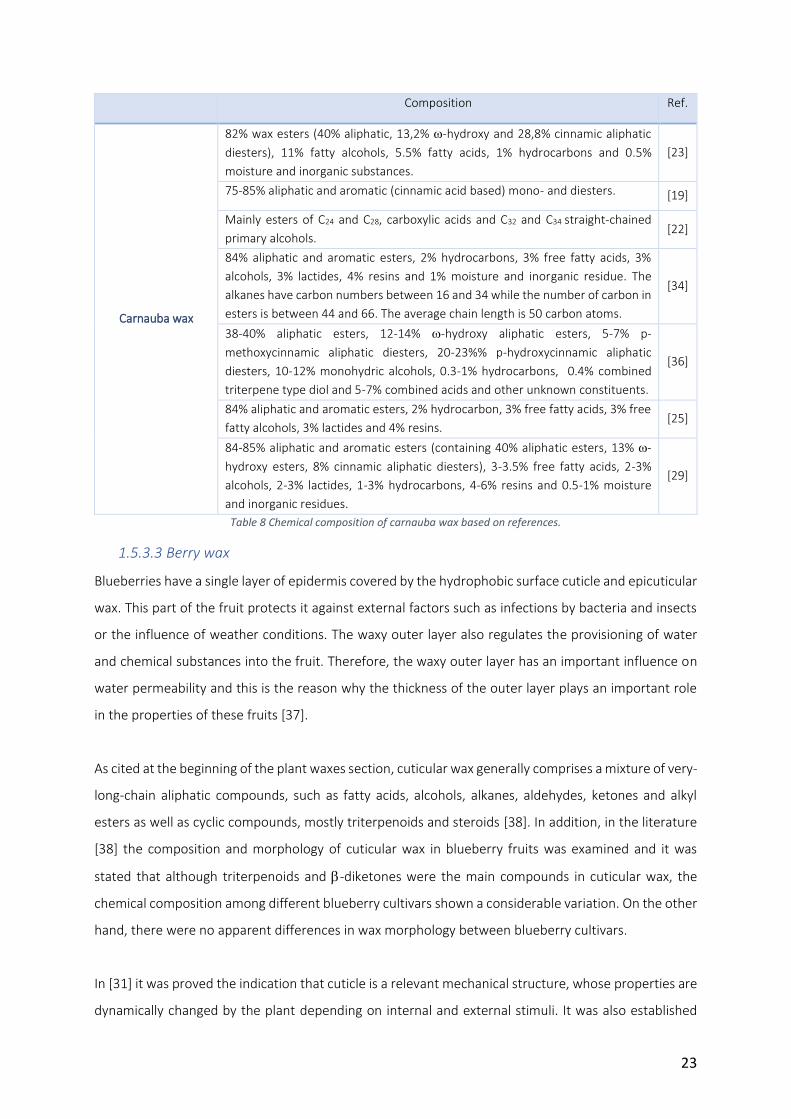
23
Composition Ref.
Carnauba wax
82% wax esters (40% aliphatic, 13,2% -hydroxy and 28,8% cinnamic aliphatic
diesters), 11% fatty alcohols, 5.5% fatty acids, 1% hydrocarbons and 0.5%
moisture and inorganic substances.
[23]
75-85% aliphatic and aromatic (cinnamic acid based) mono- and diesters. [19]
Mainly esters of C24 and C28, carboxylic acids and C32 and C34 straight-chained
primary alcohols. [22]
84% aliphatic and aromatic esters, 2% hydrocarbons, 3% free fatty acids, 3%
alcohols, 3% lactides, 4% resins and 1% moisture and inorganic residue. The
alkanes have carbon numbers between 16 and 34 while the number of carbon in
esters is between 44 and 66. The average chain length is 50 carbon atoms.
[34]
38-40% aliphatic esters, 12-14% -hydroxy aliphatic esters, 5-7% p-
methoxycinnamic aliphatic diesters, 20-23%% p-hydroxycinnamic aliphatic
diesters, 10-12% monohydric alcohols, 0.3-1% hydrocarbons, 0.4% combined
triterpene type diol and 5-7% combined acids and other unknown constituents.
[36]
84% aliphatic and aromatic esters, 2% hydrocarbon, 3% free fatty acids, 3% free
fatty alcohols, 3% lactides and 4% resins. [25]
84-85% aliphatic and aromatic esters (containing 40% aliphatic esters, 13% -
hydroxy esters, 8% cinnamic aliphatic diesters), 3-3.5% free fatty acids, 2-3%
alcohols, 2-3% lactides, 1-3% hydrocarbons, 4-6% resins and 0.5-1% moisture
and inorganic residues.
[29]
Table 8 Chemical composition of carnauba wax based on references.
1.5.3.3 Berry wax
Blueberries have a single layer of epidermis covered by the hydrophobic surface cuticle and epicuticular
wax. This part of the fruit protects it against external factors such as infections by bacteria and insects
or the influence of weather conditions. The waxy outer layer also regulates the provisioning of water
and chemical substances into the fruit. Therefore, the waxy outer layer has an important influence on
water permeability and this is the reason why the thickness of the outer layer plays an important role
in the properties of these fruits [37].
As cited at the beginning of the plant waxes section, cuticular wax generally comprises a mixture of very-
long-chain aliphatic compounds, such as fatty acids, alcohols, alkanes, aldehydes, ketones and alkyl
esters as well as cyclic compounds, mostly triterpenoids and steroids [38]. In addition, in the literature
[38] the composition and morphology of cuticular wax in blueberry fruits was examined and it was
stated that although triterpenoids and -diketones were the main compounds in cuticular wax, the
chemical composition among different blueberry cultivars shown a considerable variation. On the other
hand, there were no apparent differences in wax morphology between blueberry cultivars.
In [31] it was proved the indication that cuticle is a relevant mechanical structure, whose properties are
dynamically changed by the plant depending on internal and external stimuli. It was also established
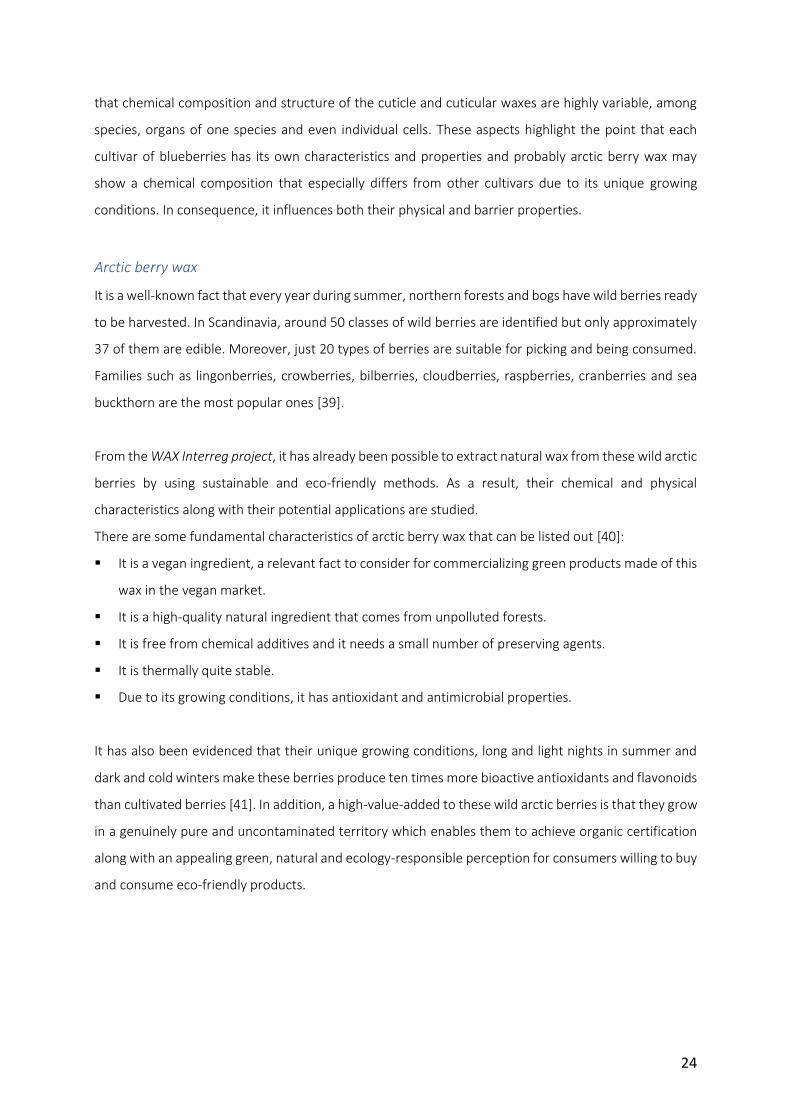
24
that chemical composition and structure of the cuticle and cuticular waxes are highly variable, among
species, organs of one species and even individual cells. These aspects highlight the point that each
cultivar of blueberries has its own characteristics and properties and probably arctic berry wax may
show a chemical composition that especially differs from other cultivars due to its unique growing
conditions. In consequence, it influences both their physical and barrier properties.
Arctic berry wax
It is a well-known fact that every year during summer, northern forests and bogs have wild berries ready
to be harvested. In Scandinavia, around 50 classes of wild berries are identified but only approximately
37 of them are edible. Moreover, just 20 types of berries are suitable for picking and being consumed.
Families such as lingonberries, crowberries, bilberries, cloudberries, raspberries, cranberries and sea
buckthorn are the most popular ones [39].
From the WAX Interreg project, it has already been possible to extract natural wax from these wild arctic
berries by using sustainable and eco-friendly methods. As a result, their chemical and physical
characteristics along with their potential applications are studied.
There are some fundamental characteristics of arctic berry wax that can be listed out [40]:
It is a vegan ingredient, a relevant fact to consider for commercializing green products made of this
wax in the vegan market.
It is a high-quality natural ingredient that comes from unpolluted forests.
It is free from chemical additives and it needs a small number of preserving agents.
It is thermally quite stable.
Due to its growing conditions, it has antioxidant and antimicrobial properties.
It has also been evidenced that their unique growing conditions, long and light nights in summer and
dark and cold winters make these berries produce ten times more bioactive antioxidants and flavonoids
than cultivated berries [41]. In addition, a high-value-added to these wild arctic berries is that they grow
in a genuinely pure and uncontaminated territory which enables them to achieve organic certification
along with an appealing green, natural and ecology-responsible perception for consumers willing to buy
and consume eco-friendly products.
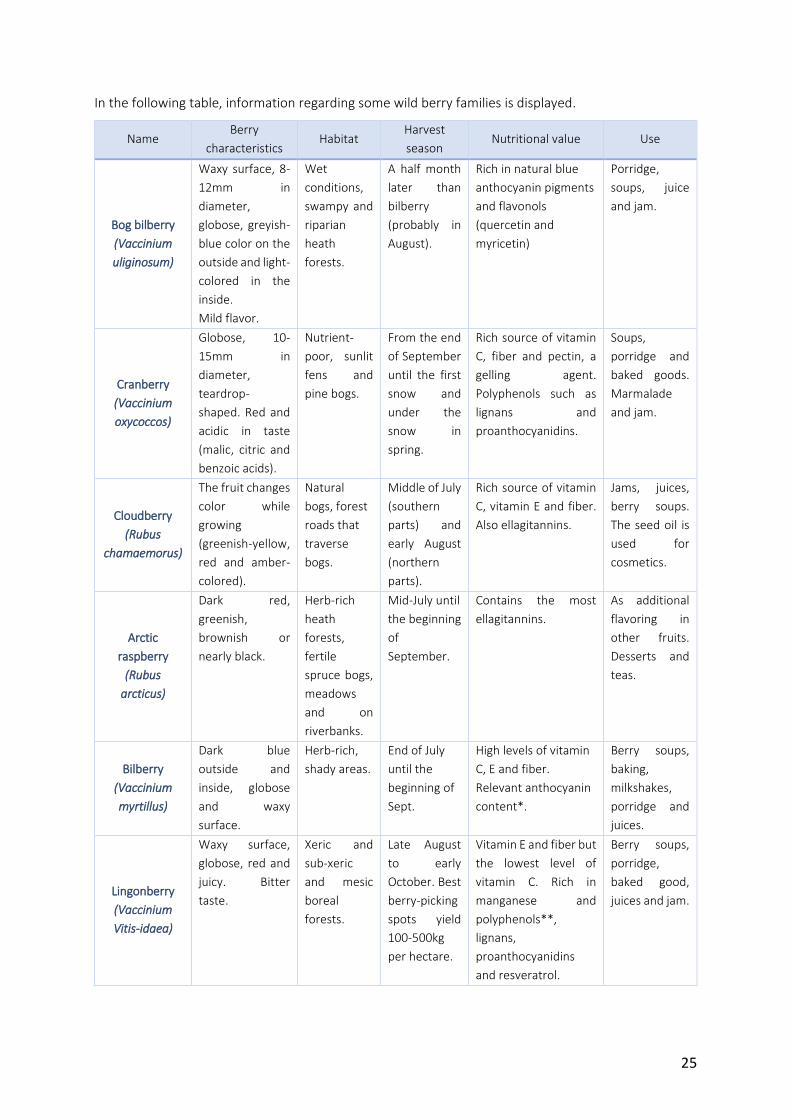
25
In the following table, information regarding some wild berry families is displayed.
Name Berry
characteristics Habitat
Harvest
season Nutritional value Use
Bog bilberry
(Vaccinium
uliginosum)
Waxy surface, 8-
12mm in
diameter,
globose, greyish-
blue color on the
outside and light-
colored in the
inside.
Mild flavor.
Wet
conditions,
swampy and
riparian
heath
forests.
A half month
later than
bilberry
(probably in
August).
Rich in natural blue
anthocyanin pigments
and flavonols
(quercetin and
myricetin)
Porridge,
soups, juice
and jam.
Cranberry
(Vaccinium
oxycoccos)
Globose, 10-
15mm in
diameter,
teardrop-
shaped. Red and
acidic in taste
(malic, citric and
benzoic acids).
Nutrient-
poor, sunlit
fens and
pine bogs.
From the end
of September
until the first
snow and
under the
snow in
spring.
Rich source of vitamin
C, fiber and pectin, a
gelling agent.
Polyphenols such as
lignans and
proanthocyanidins.
Soups,
porridge and
baked goods.
Marmalade
and jam.
Cloudberry
(Rubus
chamaemorus)
The fruit changes
color while
growing
(greenish-yellow,
red and amber-
colored).
Natural
bogs, forest
roads that
traverse
bogs.
Middle of July
(southern
parts) and
early August
(northern
parts).
Rich source of vitamin
C, vitamin E and fiber.
Also ellagitannins.
Jams, juices,
berry soups.
The seed oil is
used for
cosmetics.
Arctic
raspberry
(Rubus
arcticus)
Dark red,
greenish,
brownish or
nearly black.
Herb-rich
heath
forests,
fertile
spruce bogs,
meadows
and on
riverbanks.
Mid-July until
the beginning
of
September.
Contains the most
ellagitannins.
As additional
flavoring in
other fruits.
Desserts and
teas.
Bilberry
(Vaccinium
myrtillus)
Dark blue
outside and
inside, globose
and waxy
surface.
Herb-rich,
shady areas.
End of July
until the
beginning of
Sept.
High levels of vitamin
C, E and fiber.
Relevant anthocyanin
content*.
Berry soups,
baking,
milkshakes,
porridge and
juices.
Lingonberry
(Vaccinium
Vitis-idaea)
Waxy surface,
globose, red and
juicy. Bitter
taste.
Xeric and
sub-xeric
and mesic
boreal
forests.
Late August
to early
October. Best
berry-picking
spots yield
100-500kg
per hectare.
Vitamin E and fiber but
the lowest level of
vitamin C. Rich in
manganese and
polyphenols**,
lignans,
proanthocyanidins
and resveratrol.
Berry soups,
porridge,
baked good,
juices and jam.
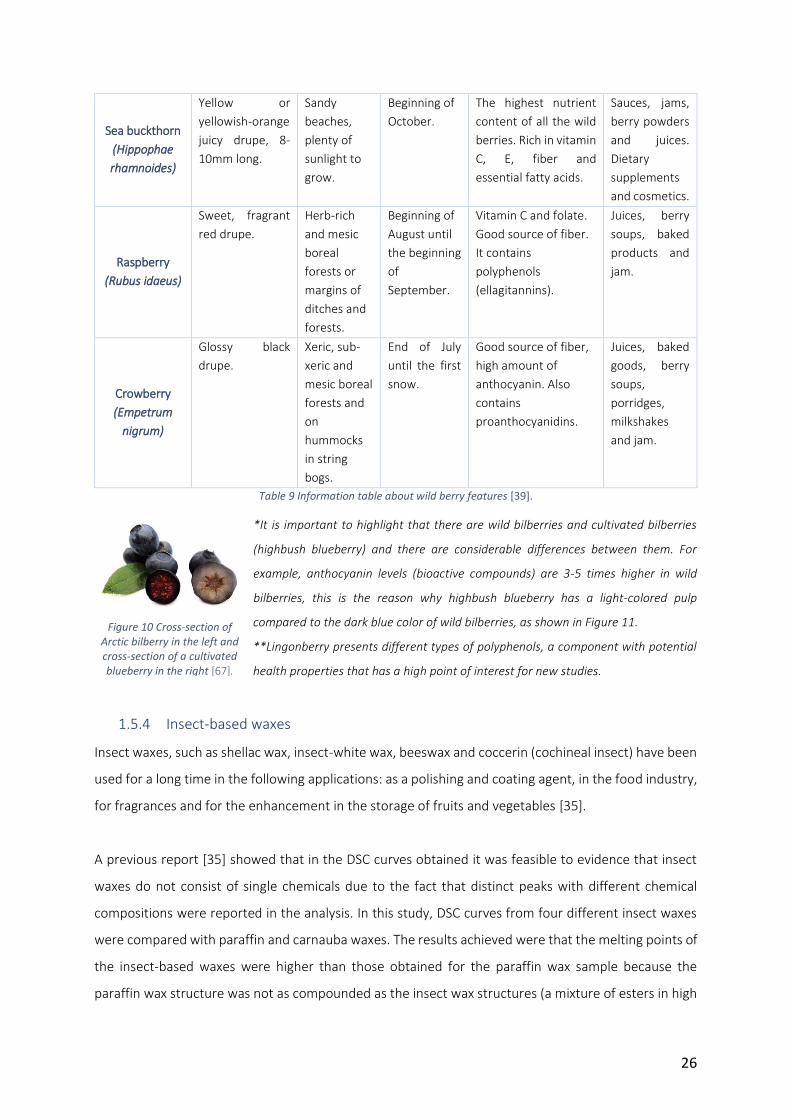
26
Sea buckthorn
(Hippophae
rhamnoides)
Yellow or
yellowish-orange
juicy drupe, 8-
10mm long.
Sandy
beaches,
plenty of
sunlight to
grow.
Beginning of
October.
The highest nutrient
content of all the wild
berries. Rich in vitamin
C, E, fiber and
essential fatty acids.
Sauces, jams,
berry powders
and juices.
Dietary
supplements
and cosmetics.
Raspberry
(Rubus idaeus)
Sweet, fragrant
red drupe.
Herb-rich
and mesic
boreal
forests or
margins of
ditches and
forests.
Beginning of
August until
the beginning
of
September.
Vitamin C and folate.
Good source of fiber.
It contains
polyphenols
(ellagitannins).
Juices, berry
soups, baked
products and
jam.
Crowberry
(Empetrum
nigrum)
Glossy black
drupe.
Xeric, sub-
xeric and
mesic boreal
forests and
on
hummocks
in string
bogs.
End of July
until the first
snow.
Good source of fiber,
high amount of
anthocyanin. Also
contains
proanthocyanidins.
Juices, baked
goods, berry
soups,
porridges,
milkshakes
and jam.
Table 9 Information table about wild berry features [39].
*It is important to highlight that there are wild bilberries and cultivated bilberries
(highbush blueberry) and there are considerable differences between them. For
example, anthocyanin levels (bioactive compounds) are 3-5 times higher in wild
bilberries, this is the reason why highbush blueberry has a light-colored pulp
compared to the dark blue color of wild bilberries, as shown in Figure 11.
**Lingonberry presents different types of polyphenols, a component with potential
health properties that has a high point of interest for new studies.
1.5.4 Insect-based waxes
Insect waxes, such as shellac wax, insect-white wax, beeswax and coccerin (cochineal insect) have been
used for a long time in the following applications: as a polishing and coating agent, in the food industry,
for fragrances and for the enhancement in the storage of fruits and vegetables [35].
A previous report [35] showed that in the DSC curves obtained it was feasible to evidence that insect
waxes do not consist of single chemicals due to the fact that distinct peaks with different chemical
compositions were reported in the analysis. In this study, DSC curves from four different insect waxes
were compared with paraffin and carnauba waxes. The results achieved were that the melting points of
the insect-based waxes were higher than those obtained for the paraffin wax sample because the
paraffin wax structure was not as compounded as the insect wax structures (a mixture of esters in high
Figure 10 Cross-section of Arctic bilberry in the left and cross-section of a cultivated blueberry in the right [67].
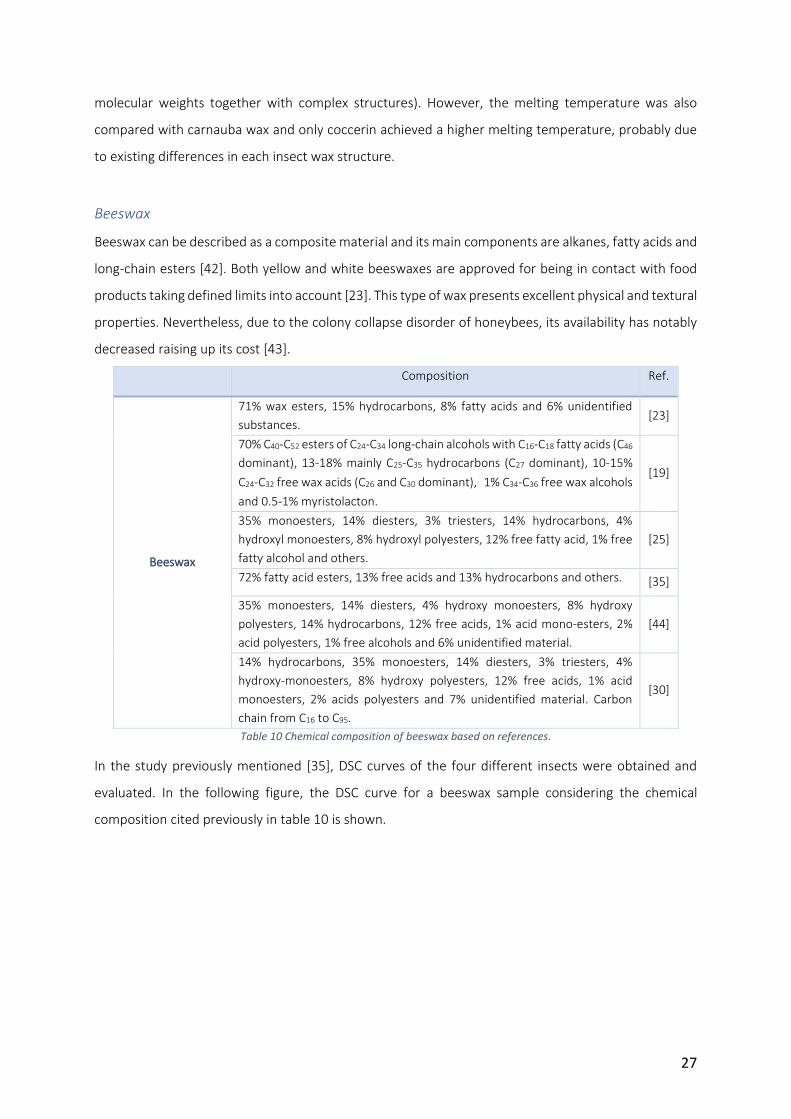
27
molecular weights together with complex structures). However, the melting temperature was also
compared with carnauba wax and only coccerin achieved a higher melting temperature, probably due
to existing differences in each insect wax structure.
Beeswax
Beeswax can be described as a composite material and its main components are alkanes, fatty acids and
long-chain esters [42]. Both yellow and white beeswaxes are approved for being in contact with food
products taking defined limits into account [23]. This type of wax presents excellent physical and textural
properties. Nevertheless, due to the colony collapse disorder of honeybees, its availability has notably
decreased raising up its cost [43].
Composition Ref.
Beeswax
71% wax esters, 15% hydrocarbons, 8% fatty acids and 6% unidentified
substances. [23]
70% C40-C52 esters of C24-C34 long-chain alcohols with C16-C18 fatty acids (C46
dominant), 13-18% mainly C25-C35 hydrocarbons (C27 dominant), 10-15%
C24-C32 free wax acids (C26 and C30 dominant),1% C34-C36 free wax alcohols
and 0.5-1% myristolacton.
[19]
35% monoesters, 14% diesters, 3% triesters, 14% hydrocarbons, 4%
hydroxyl monoesters, 8% hydroxyl polyesters, 12% free fatty acid, 1% free
fatty alcohol and others.
[25]
72% fatty acid esters, 13% free acids and 13% hydrocarbons and others. [35]
35% monoesters, 14% diesters, 4% hydroxy monoesters, 8% hydroxy
polyesters, 14% hydrocarbons, 12% free acids, 1% acid mono-esters, 2%
acid polyesters, 1% free alcohols and 6% unidentified material.
[44]
14% hydrocarbons, 35% monoesters, 14% diesters, 3% triesters, 4%
hydroxy-monoesters, 8% hydroxy polyesters, 12% free acids, 1% acid
monoesters, 2% acids polyesters and 7% unidentified material. Carbon
chain from C16 to C95.
[30]
Table 10 Chemical composition of beeswax based on references.
In the study previously mentioned [35], DSC curves of the four different insects were obtained and
evaluated. In the following figure, the DSC curve for a beeswax sample considering the chemical
composition cited previously in table 10 is shown.
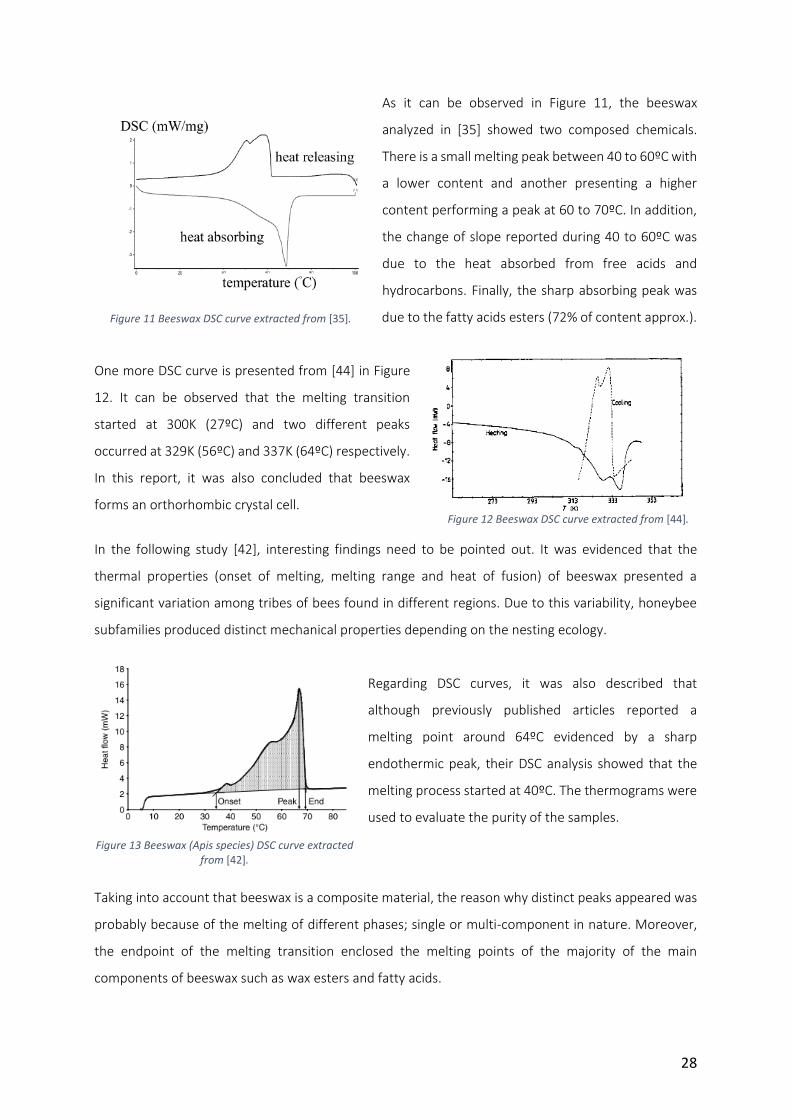
28
As it can be observed in Figure 11, the beeswax
analyzed in [35] showed two composed chemicals.
There is a small melting peak between 40 to 60ºC with
a lower content and another presenting a higher
content performing a peak at 60 to 70ºC. In addition,
the change of slope reported during 40 to 60ºC was
due to the heat absorbed from free acids and
hydrocarbons. Finally, the sharp absorbing peak was
due to the fatty acids esters (72% of content approx.).
One more DSC curve is presented from [44] in Figure
12. It can be observed that the melting transition
started at 300K (27ºC) and two different peaks
occurred at 329K (56ºC) and 337K (64ºC) respectively.
In this report, it was also concluded that beeswax
forms an orthorhombic crystal cell.
In the following study [42], interesting findings need to be pointed out. It was evidenced that the
thermal properties (onset of melting, melting range and heat of fusion) of beeswax presented a
significant variation among tribes of bees found in different regions. Due to this variability, honeybee
subfamilies produced distinct mechanical properties depending on the nesting ecology.
Regarding DSC curves, it was also described that
although previously published articles reported a
melting point around 64ºC evidenced by a sharp
endothermic peak, their DSC analysis showed that the
melting process started at 40ºC. The thermograms were
used to evaluate the purity of the samples.
Taking into account that beeswax is a composite material, the reason why distinct peaks appeared was
probably because of the melting of different phases; single or multi-component in nature. Moreover,
the endpoint of the melting transition enclosed the melting points of the majority of the main
components of beeswax such as wax esters and fatty acids.
Figure 12 Beeswax DSC curve extracted from [44].
Figure 13 Beeswax (Apis species) DSC curve extracted from [42].
Figure 11 Beeswax DSC curve extracted from [35].
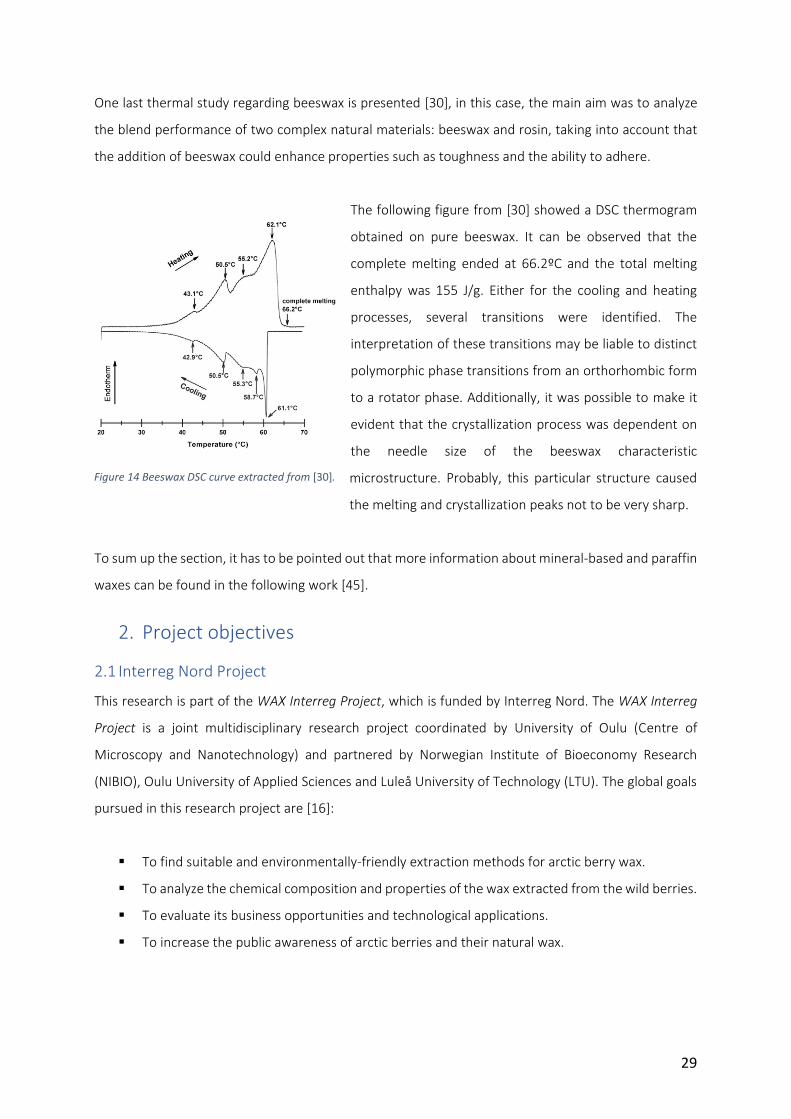
29
One last thermal study regarding beeswax is presented [30], in this case, the main aim was to analyze
the blend performance of two complex natural materials: beeswax and rosin, taking into account that
the addition of beeswax could enhance properties such as toughness and the ability to adhere.
The following figure from [30] showed a DSC thermogram
obtained on pure beeswax. It can be observed that the
complete melting ended at 66.2ºC and the total melting
enthalpy was 155 J/g. Either for the cooling and heating
processes, several transitions were identified. The
interpretation of these transitions may be liable to distinct
polymorphic phase transitions from an orthorhombic form
to a rotator phase. Additionally, it was possible to make it
evident that the crystallization process was dependent on
the needle size of the beeswax characteristic
microstructure. Probably, this particular structure caused
the melting and crystallization peaks not to be very sharp.
To sum up the section, it has to be pointed out that more information about mineral-based and paraffin
waxes can be found in the following work [45].
2. Project objectives
2.1 Interreg Nord Project
This research is part of the WAX Interreg Project, which is funded by Interreg Nord. The WAX Interreg
Project is a joint multidisciplinary research project coordinated by University of Oulu (Centre of
Microscopy and Nanotechnology) and partnered by Norwegian Institute of Bioeconomy Research
(NIBIO), Oulu University of Applied Sciences and Luleå University of Technology (LTU). The global goals
pursued in this research project are [16]:
To find suitable and environmentally-friendly extraction methods for arctic berry wax.
To analyze the chemical composition and properties of the wax extracted from the wild berries.
To evaluate its business opportunities and technological applications.
To increase the public awareness of arctic berries and their natural wax.
Figure 14 Beeswax DSC curve extracted from [30].
30
As a brief abstract of the overall project, approximately 90-95 % of the whole wild berry growth in the
northern forests of Europe is left unpicked every year. Wild berries are a natural resource with unique
growing conditions that have not been yet exploited on a competent level. This issue raises interest in
contributing to solving this challenging problem by a relevant number of companies, universities and
non-profit organizations [46]. Wild berries which grow in northern Europe are well-known for their
bioactive properties. The average berry yield in the Nordic countries is approximately 500 million kg per
year, although, as said before, only around 5% is picked [47]. Arctic berry wax is not yet available in the
market [16] but its potential applications request an exhaustive research to find out the possibilities of
its utilization in the near future.
The main goals of Luleå University of Technology (LTU) in this project are to perform a physical
characterization of arctic berry wax and to investigate the main properties along with its potential
applications comparing this wax with currently available natural waxes.
2.2 Master thesis objectives
In the current project, the aim was to produce wax-coated paper samples in order to analyze the viability
of using berry wax as a coating for paper substrates used in the food packaging field. Both natural wax
and paper are based on natural resources. Therefore, this composite could be a promising green
material for food packaging applications.
On one hand, berry wax along with other natural waxes were thermally characterized. On the other
hand, beeswax and berry wax were impregnated on paper and the structure was characterized by
means of scanning electron microscopy, tensile testing and contact angle measurements. In addition,
the barrier properties were tested taking into consideration the final application of the specimens.
Methods such as moisture uptake, WVTR (water vapor transmission rate), grease resistance tests or
crisp bag tests were carried out. The results from these tests helped to determine the barrier
performance of the wax-coated samples. Moreover, it was possible to compare the coating behavior of
berry wax with commercially available natural waxes that are already been used as a coating for food
packaging items.
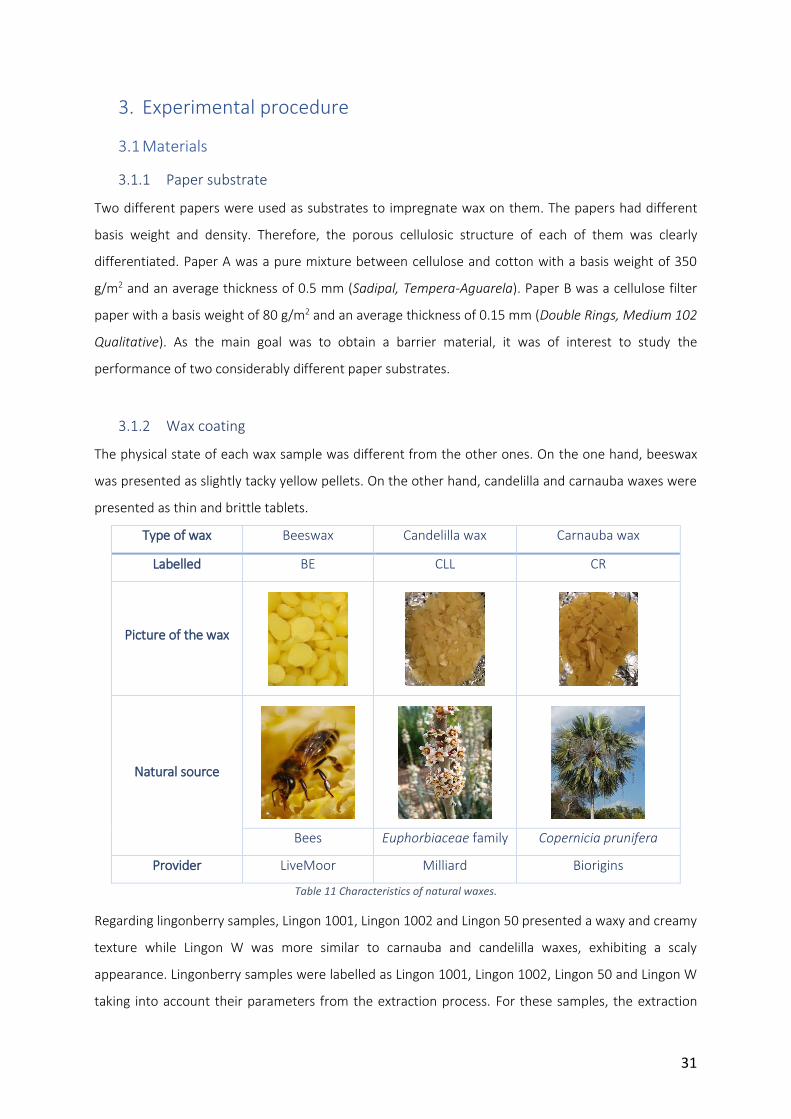
31
3. Experimental procedure
3.1 Materials
3.1.1 Paper substrate
Two different papers were used as substrates to impregnate wax on them. The papers had different
basis weight and density. Therefore, the porous cellulosic structure of each of them was clearly
differentiated. Paper A was a pure mixture between cellulose and cotton with a basis weight of 350
g/m2 and an average thickness of 0.5 mm (Sadipal, Tempera-Aguarela). Paper B was a cellulose filter
paper with a basis weight of 80 g/m2 and an average thickness of 0.15 mm (Double Rings, Medium 102
Qualitative). As the main goal was to obtain a barrier material, it was of interest to study the
performance of two considerably different paper substrates.
3.1.2 Wax coating
The physical state of each wax sample was different from the other ones. On the one hand, beeswax
was presented as slightly tacky yellow pellets. On the other hand, candelilla and carnauba waxes were
presented as thin and brittle tablets.
Type of wax Beeswax Candelilla wax Carnauba wax
Labelled BE CLL CR
Picture of the wax
Natural source
Bees Euphorbiaceae family Copernicia prunifera
Provider LiveMoor Milliard Biorigins
Table 11 Characteristics of natural waxes.
Regarding lingonberry samples, Lingon 1001, Lingon 1002 and Lingon 50 presented a waxy and creamy
texture while Lingon W was more similar to carnauba and candelilla waxes, exhibiting a scaly
appearance. Lingonberry samples were labelled as Lingon 1001, Lingon 1002, Lingon 50 and Lingon W
taking into account their parameters from the extraction process. For these samples, the extraction
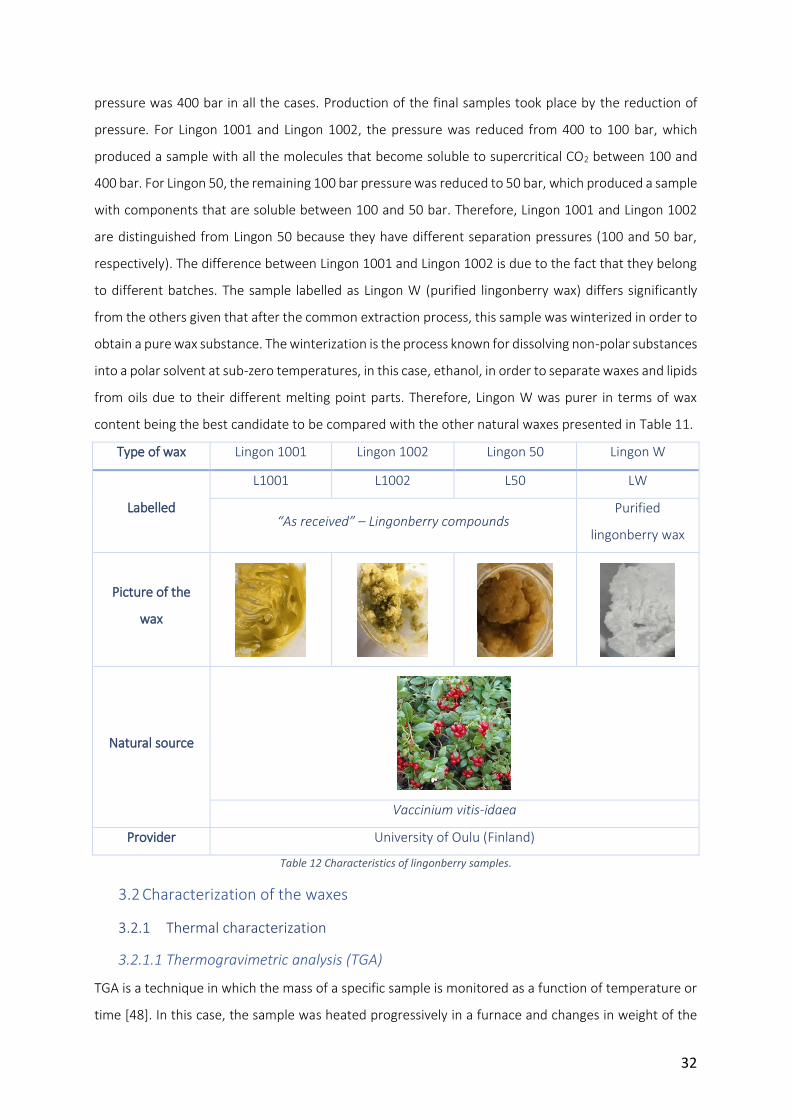
32
pressure was 400 bar in all the cases. Production of the final samples took place by the reduction of
pressure. For Lingon 1001 and Lingon 1002, the pressure was reduced from 400 to 100 bar, which
produced a sample with all the molecules that become soluble to supercritical CO2 between 100 and
400 bar. For Lingon 50, the remaining 100 bar pressure was reduced to 50 bar, which produced a sample
with components that are soluble between 100 and 50 bar. Therefore, Lingon 1001 and Lingon 1002
are distinguished from Lingon 50 because they have different separation pressures (100 and 50 bar,
respectively). The difference between Lingon 1001 and Lingon 1002 is due to the fact that they belong
to different batches. The sample labelled as Lingon W (purified lingonberry wax) differs significantly
from the others given that after the common extraction process, this sample was winterized in order to
obtain a pure wax substance. The winterization is the process known for dissolving non-polar substances
into a polar solvent at sub-zero temperatures, in this case, ethanol, in order to separate waxes and lipids
from oils due to their different melting point parts. Therefore, Lingon W was purer in terms of wax
content being the best candidate to be compared with the other natural waxes presented in Table 11.
Type of wax Lingon 1001 Lingon 1002 Lingon 50 Lingon W
Labelled
L1001 L1002 L50 LW
“As received” – Lingonberry compounds Purified
lingonberry wax
Picture of the
wax
Natural source
Vaccinium vitis-idaea
Provider University of Oulu (Finland)
Table 12 Characteristics of lingonberry samples.
3.2 Characterization of the waxes
3.2.1 Thermal characterization
3.2.1.1 Thermogravimetric analysis (TGA)
TGA is a technique in which the mass of a specific sample is monitored as a function of temperature or
time [48]. In this case, the sample was heated progressively in a furnace and changes in weight of the
33
pan sample were recorded and depicted in function of temperature. The increase in temperature during
the experiment was regulated and the sample environment was also controlled by nitrogen atmosphere
with a purge rate of 20 ml/minute. The amount of sample placed in the pan varied among samples,
between 20 and 40 mg. The temperature range began at about 25 ºC and ended in between 450 and
600 ºC depending on the sample tested. The temperature scanning rate was either 20 or 25 ºC/min. By
using this technique, the thermal degradation of the waxes was quantified. Consequently, their behavior
when they were exposed to high temperatures was evaluated. On the other hand, performing TGA tests
(Pyris 1 TGA, PerkinElmer) provided more accuracy when the thermal parameters for the Differential
Scanning Calorimetry tests were defined.
3.2.1.2 Differential Scanning Calorimetry (DSC)
DSC is a thermo-analytical technique that yields a quantitative characterization of phase transitions. The
principle of DSC analysis is based on determining heat flow through a sample by simultaneous
measurements through the sample pan and an empty reference pan [17]. During the thermal test, the
temperature in the sample holder is programmed to increase or decreased linearly as a function of time
[49]. Thermal events like melting, crystallization, glass transitions and thermal decomposition can be
determined by using DSC and it has been proved that heating properties of wax-based products can be
measured accurately by using this method [35]. In this case of study, this characterization helped to gain
a better understanding of the thermal properties of waxes and consequently, to find suitable processing
conditions. Moreover, this technique permitted achieving the onset, major peak and endset of the
melting and crystallization transitions together with the corresponding enthalpies. Endothermic and
exothermic peaks were obtained in function of the absorption or release of energy by the sample, taking
into account that more or less heat is needed to flow into the sample pan in comparison to the reference
pan [49]–[51].
On the other hand, an understanding of the degree of crystallinity was relevant due to the fact that
crystallinity has a significant impact on the physical properties of materials. By using DSC, the crystallinity
was determined through the heat of fusion of the material (∆𝐻𝑓; J/g). In addition, it was expressed as
% crystallinity or degree of crystallinity by normalizing the heat of fusion obtained to that of a 100 %
crystalline sample (∆𝐻𝑓º; J/g) from the same material.
% 𝑐𝑟𝑦𝑠𝑡𝑎𝑙𝑙𝑖𝑛𝑖𝑡𝑦 = ∆𝐻𝑓
∆𝐻𝑓º
· 100 𝐸𝑞. (1)
Due to the fact that the aim of characterizing different natural waxes was to make a comparison among
them and taking into account that the ideal enthalpies of natural waxes are difficult to find in literature,
it was decided to define a constant value as the ideal enthalpy of fusion for all the natural waxes studied.
34
The ideal enthalpy of fusion (∆𝐻𝑓º) was set at 200 J/g. By doing this, the degree of crystallinity was
obtained for each sample thermally analyzed.
Regarding the sample preparation, aluminum pans were filled with approximately 10 mg of wax by using
an analytical balance (AG245, Mettler Toledo) and then sealed with an aluminum lid (Mettler Toledo).
After that, the sample pan was placed into the DSC machine (DSC821e, Mettler Toledo) and the
corresponding thermal method was carried out. STARe software (Version 13.00) was used to process
and analyze the thermal curves obtained from the DSC tests. In addition to untreated samples (“as
received”), thermal degradation tests were carried out in order to analyze the alteration of the samples
after being exposed to high temperatures for a prolonged time. For these tests, the samples were placed
in an oven and exposed to 150 ºC during different time intervals. After the thermal treatment, the
samples were tested in the DSC by using the same thermal method as the untreated samples.
3.3 Characterization of the wax coated-paper
3.3.1 Conditioning of the paper samples
Before coating the paper samples, a conditioning procedure was carried out. The procedure was a
modification from ASTM D4332 – 14 (Standard Practice for Conditioning Containers, Packages or
Packaging Components for Testing) and ASTM D685 – 17 (Standard Practice for Conditioning Paper and
Paper Product for Testing). In this case, the paper samples were cut using a guillotine and weighed
initially. Subsequently, they were placed in an oven at 50 ºC for 48 hours. Afterwards, the samples were
weighed. After the conditioning, the paper thickness was measured at 6 different points and the paper
samples were preserved individually in a sealed plastic bag until they were coated or tested. It is
important to point out that the time elapsed between the conditioning and the testing should be the
minimum possible. Paper, being made of organic fibers is hygroscopic by nature and therefore, it
absorbs moisture easily. This behavior could affect the conditioning of the paper samples.
3.3.2 Coating procedure
From the packaging point of view, using natural wax as a coating on paper was an interesting field to be
studied. The set of materials used were paper A, paper B and different waxes as coatings. Different
coating procedures such as dipping the paper samples into melted wax, spraying a wax solution
previously diluted with ethanol as solvent, to homogeneously spread melted wax by using a hot press
or using a vacuum infusion technique were options considered so as to impregnate natural waxes on
paper substrates. The impregnation obtained by each different procedure resulted in different
outcomes as it is reported in the next section of this document. In addition, the different nature of each
wax had a distinct influence on the coating achievements.
35
At this point, it has to be pointed out that the study focused on coating the substrates by using beeswax
and Lingon W, from all the other possible options. In the next section, this choice is explained in detail.
3.3.3 Description of the coated-paper samples
In this report, the samples are labelled depending on the type of wax used to coat the paper, BE for
beeswax and LW for Lingon W, being these the only two types of waxes used as coatings. Apart from
the type of wax, they are also labelled with A or B depending on the substrate (A for paper A and B for
paper B). The uncoated samples used as reference are labelled with the paper type along with the term
Ref. Moreover, the specific dimensions of the samples varied depending on the test performed and they
are detailed in each testing section. Nevertheless, the conditioning and the coating procedure used was
the same for the entire set of samples tested in this study.
3.3.4 Coating weight and thickness measurements
Coating weights were determined by subtracting the weight of the initially uncoated paper sample from
the weight of a coated paper sample and divided it by the total area (in m2). Thereby, it was possible to
determine the amount of wax deposited on the paper effectively. The coating weight (CW) expressed
in g/m2 was calculated as follows:
𝐶𝑊 =(𝑊𝑐𝑜𝑎𝑡𝑒𝑑 − 𝑊𝑢𝑛𝑐𝑜𝑎𝑡𝑒𝑑)
𝐴𝑟𝑒𝑎 𝐸𝑞. (2)
In addition, the matrix and fiber fractions were also calculated for each specimen, taking into account
the composite nature obtained after the coating procedure. It has to be pointed out that the fiber
fraction referred to the fraction of paper whereas the matrix fraction to the fraction of wax.
𝑊𝑓𝑖𝑏𝑒𝑟 =𝑊𝑢𝑛𝑐𝑜𝑎𝑡𝑒𝑑
𝑊𝑐𝑜𝑎𝑡𝑒𝑑 ; 𝑊𝑚𝑎𝑡𝑟𝑖𝑥 = 1 − 𝑊𝑓𝑖𝑏𝑒𝑟 𝐸𝑞. (3)
The thickness of both uncoated (reference samples) and coated paper samples were measured by using
an electronic digital micrometer (measuring range: 0-25mm; resolution 0,001mm). It was measured at
6 different points along the length of the specimen. The values reported in this document are the
average thickness together with their standard deviation.
3.3.5 Scanning electron microscopy and profile observation
The morphology of the coating was studied by using JEOL JCM-6000 Plus (Scanning Electron
Microscopy). The paper samples were painted by an agar silver paint in order to glue the sample into
the holder. Then, the samples were dried below a lamp for 10 minutes. Subsequently, they were placed
into Leica EM ACE200 in order to produce a platinum coating so as to make them conductive.
Afterwards, the sputtered samples were viewed by the equipment.
36
Regarding the profile observation, coated and uncoated paper samples were dipped into liquid nitrogen
for 2 minutes. Afterwards, the samples were fractured towards a middle point of the specimen by using
a pair of tweezers. Then, the profile was observed by SEM in order to analyze coating impregnation and
penetration on the paper substrate.
3.4 Barrier properties testing
3.4.1 Moisture uptake
The moisture uptake (MU) test was run on the coated paper samples together with the corresponding
reference samples. At first, the samples were cut in a rectangular shape (70 mm long x 25 mm wide).
After conditioning and coating them, the samples were weighed and the thickness was measured. In
order to evaluate the moisture uptake, the samples were placed in a desiccator with a controlled
humidity of about 100 %RH and room temperature (See Appendix Fig 7 in Appendix C).
After the initial weight measurement (M0), the samples were weighed (Mt) every hour during the first
12 hours, every 4 hours subsequently, every 12 hours and then in more spaced intervals up to 7 weeks
for beeswax and 4 weeks for Lingon W. The weight of water in the sample was calculated by the
difference between the initial and final sample weights as follows:
𝑀𝑈 =(𝑀𝑡 − 𝑀0)
𝑀0· 100 𝐸𝑞. (4)
3.4.2 Water vapor transmission rate
The water vapor transmission rate (WVTR) is the amount of water vapor transferred through a unit area
in a unit time under specified conditions of temperature and humidity. Regarding the packaging
industry, these test conditions are fixed at 23 ºC and 85 %RH considering that these values are realistic
for packaging environments [6]. The procedure was a modification from ASTM E96 (Standard Test
Methods for Water Vapor Transmission of Materials).
In this case, the samples were glued with hot silicon onto the top of a 45mm-diameter glass cup filled
with 20 mL of distilled water (See Appendix Fig 10 in Appendix C). The entire assembly was initially
weighed and placed in a desiccator at an average temperature and humidity of 20 ºC and 65-70 %RH
respectively. The assembly was weighed at regular intervals for 7 weeks for beeswax samples. Thereby,
the water vapor transmission rate (WVTR) of the coatings was determined as follows:
𝑊𝑉𝑇𝑅 =(∆𝑚/∆𝑡)
𝐴 𝐸𝑞. (5)
Where m is the mass variation (in grams), t is the time variation (in hours) and A is the exposed area
of the sample (in m2).
37
3.4.3 Grease resistance
3.4.3.1 Crisp bag test
Crisp bag test is a technique to analyze the coating performance of packaging items for greasy food
products [52]. This test was only carried out with paper B due to the complexity to manipulate paper A
in terms of obtaining the bag shape desired. Therefore, uncoated and coated paper samples were folded
in the form of bags (see Appendix Fig 11 and 12 in Appendix C). Then, the bags were filled with about
5-2 g of crisps while the top was left unsealed and they were placed on a polycarbonate plate. This test
ran for 2 weeks for beeswax samples and for 1 week for Lingon W. The status of each crisp bag was
noted down and compared to a reference sample by observing the external appearance. Additionally,
images were taken at defined time intervals by a scanning machine so as to observe the progression of
the test. The test conditions were 21 ºC and 30 %RH.
3.4.3.2 Grease permeability test
A grease resistance test was carried out according to ASTM F119 – 82 (Standard Test Method for Rate
of Grease Penetration of Flexible Barrier Materials) with some modifications. Both paper A and B were
considered for this test. At first, they were cut in squared dimensions (50 mm long x 50 mm wide),
conditioned and coated. The thickness of each specimen was measured in six equally spaced positions.
The conditioned coatings were then folded following the standard procedure. Thereafter, the
specimens were placed on a polycarbonate plate and one layer of a small cotton pad (20 mm in
diameter) and a 50-g weight were placed above each paper sample. Then, half of them were kept at
room temperature whereas the other half was placed in an oven at 50ºC. After 30 minutes, the 50-g
weights were removed and six drops of quenching oil (brown color) were added. Subsequently, the 50-
g weights were replaced and the test started (see Appendix Fig 13 in Appendix C). Then, the samples
were observed at regular time intervals increasingly spaced during 2 weeks. In addition, images were
taken in each defined interval by a scanning machine so as to observe the progression of the test. The
test conditions were 21 ºC and 30 %RH.
3.5 Mechanical testing
3.5.1 Tensile testing
Tensile tests consist of testing uniform cross-section specimens loaded in tension by a mechanical
testing machine. Tensile tests were in agreement with the ASTM D828 – 16 (Standard Test Method for
Tensile Properties of Paper and Paperboard Using Constant-Rate-of-Elongation Apparatus) with some
modifications.
Tensile tests were performed by using Instron 4411 and the results were processed with Bluehill 2
(Version 2.6). At first, the samples were cut using a guillotine in a rectangular shape (70 mm long x 25
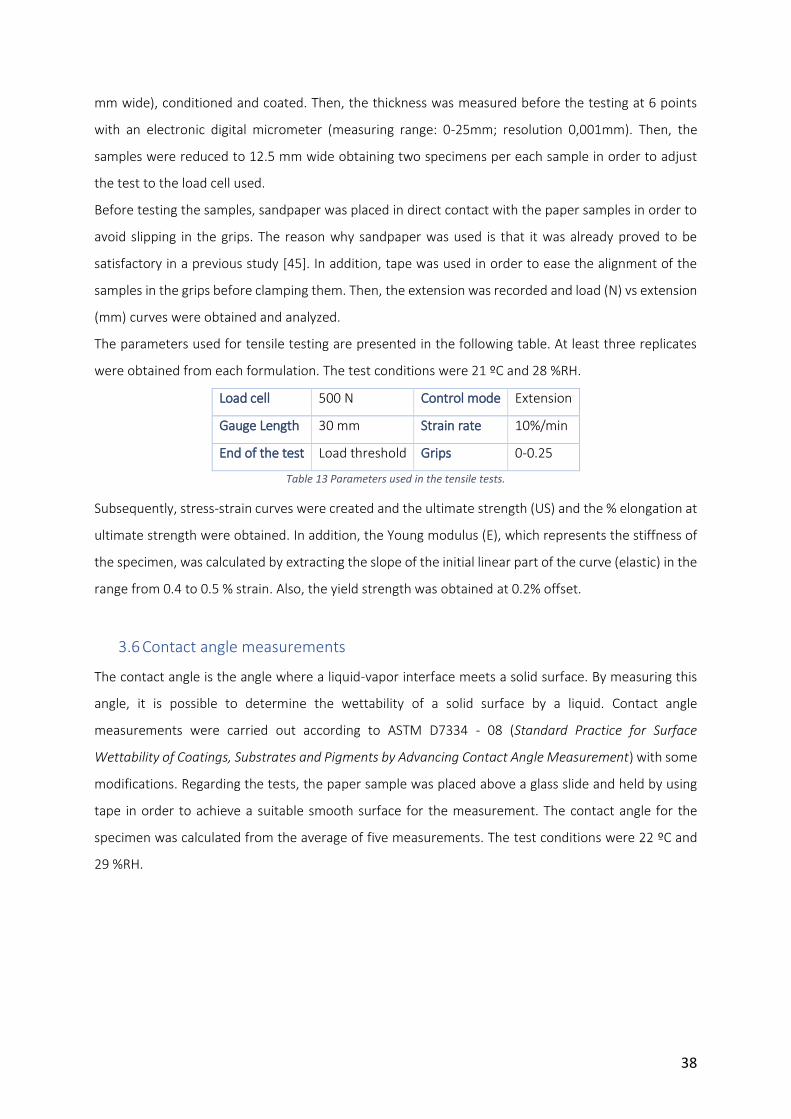
38
mm wide), conditioned and coated. Then, the thickness was measured before the testing at 6 points
with an electronic digital micrometer (measuring range: 0-25mm; resolution 0,001mm). Then, the
samples were reduced to 12.5 mm wide obtaining two specimens per each sample in order to adjust
the test to the load cell used.
Before testing the samples, sandpaper was placed in direct contact with the paper samples in order to
avoid slipping in the grips. The reason why sandpaper was used is that it was already proved to be
satisfactory in a previous study [45]. In addition, tape was used in order to ease the alignment of the
samples in the grips before clamping them. Then, the extension was recorded and load (N) vs extension
(mm) curves were obtained and analyzed.
The parameters used for tensile testing are presented in the following table. At least three replicates
were obtained from each formulation. The test conditions were 21 ºC and 28 %RH.
Load cell 500 N Control mode Extension
Gauge Length 30 mm Strain rate 10%/min
End of the test Load threshold Grips 0-0.25
Table 13 Parameters used in the tensile tests.
Subsequently, stress-strain curves were created and the ultimate strength (US) and the % elongation at
ultimate strength were obtained. In addition, the Young modulus (E), which represents the stiffness of
the specimen, was calculated by extracting the slope of the initial linear part of the curve (elastic) in the
range from 0.4 to 0.5 % strain. Also, the yield strength was obtained at 0.2% offset.
3.6 Contact angle measurements
The contact angle is the angle where a liquid-vapor interface meets a solid surface. By measuring this
angle, it is possible to determine the wettability of a solid surface by a liquid. Contact angle
measurements were carried out according to ASTM D7334 - 08 (Standard Practice for Surface
Wettability of Coatings, Substrates and Pigments by Advancing Contact Angle Measurement) with some
modifications. Regarding the tests, the paper sample was placed above a glass slide and held by using
tape in order to achieve a suitable smooth surface for the measurement. The contact angle for the
specimen was calculated from the average of five measurements. The test conditions were 22 ºC and
29 %RH.
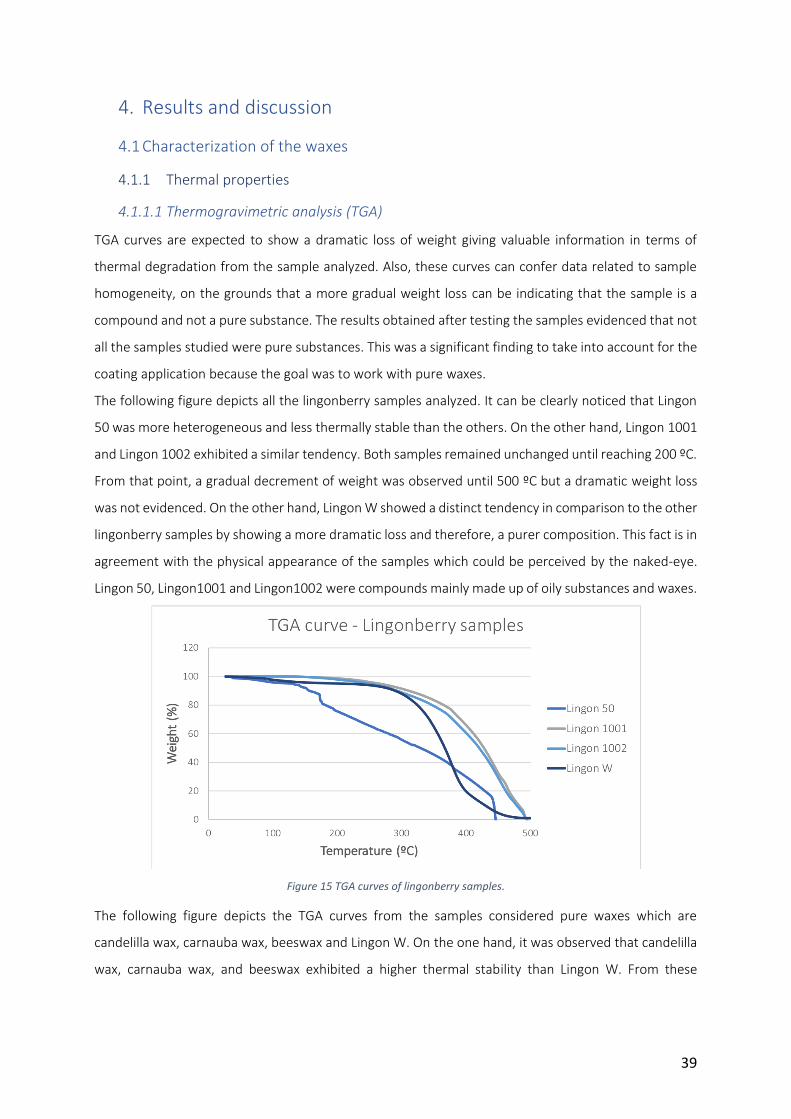
39
4. Results and discussion
4.1 Characterization of the waxes
4.1.1 Thermal properties
4.1.1.1 Thermogravimetric analysis (TGA)
TGA curves are expected to show a dramatic loss of weight giving valuable information in terms of
thermal degradation from the sample analyzed. Also, these curves can confer data related to sample
homogeneity, on the grounds that a more gradual weight loss can be indicating that the sample is a
compound and not a pure substance. The results obtained after testing the samples evidenced that not
all the samples studied were pure substances. This was a significant finding to take into account for the
coating application because the goal was to work with pure waxes.
The following figure depicts all the lingonberry samples analyzed. It can be clearly noticed that Lingon
50 was more heterogeneous and less thermally stable than the others. On the other hand, Lingon 1001
and Lingon 1002 exhibited a similar tendency. Both samples remained unchanged until reaching 200 ºC.
From that point, a gradual decrement of weight was observed until 500 ºC but a dramatic weight loss
was not evidenced. On the other hand, Lingon W showed a distinct tendency in comparison to the other
lingonberry samples by showing a more dramatic loss and therefore, a purer composition. This fact is in
agreement with the physical appearance of the samples which could be perceived by the naked-eye.
Lingon 50, Lingon1001 and Lingon1002 were compounds mainly made up of oily substances and waxes.
Figure 15 TGA curves of lingonberry samples.
The following figure depicts the TGA curves from the samples considered pure waxes which are
candelilla wax, carnauba wax, beeswax and Lingon W. On the one hand, it was observed that candelilla
wax, carnauba wax, and beeswax exhibited a higher thermal stability than Lingon W. From these
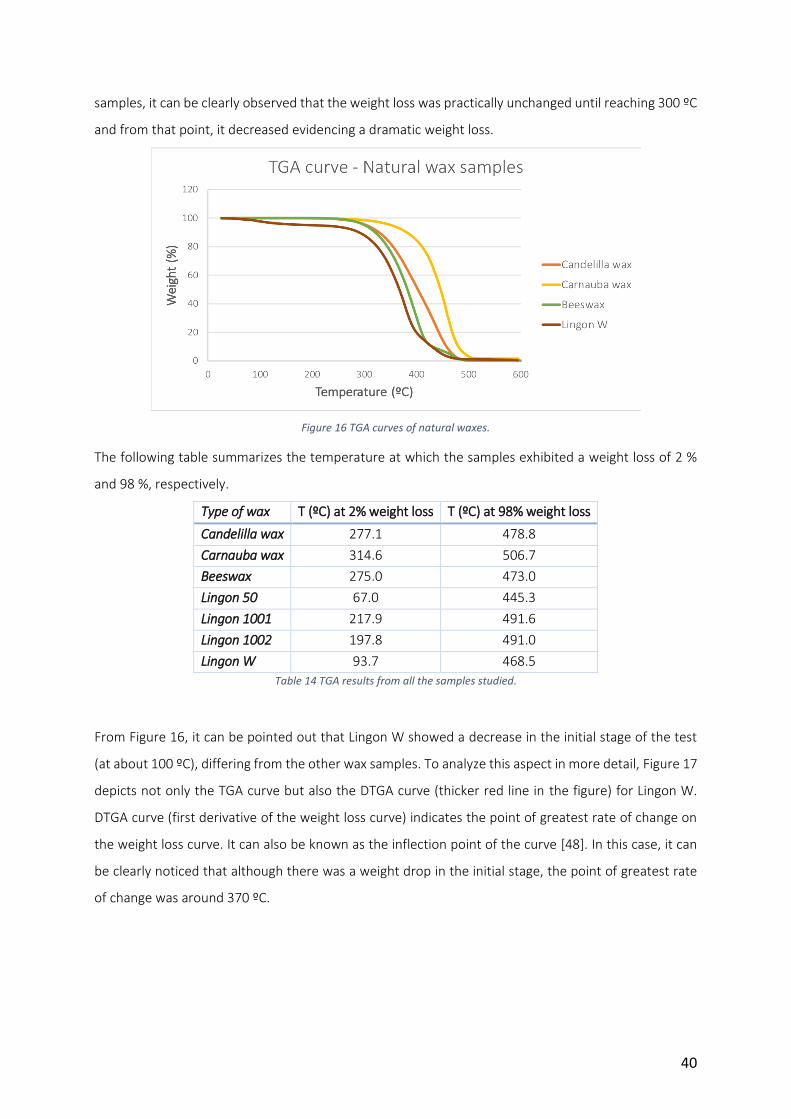
40
samples, it can be clearly observed that the weight loss was practically unchanged until reaching 300 ºC
and from that point, it decreased evidencing a dramatic weight loss.
Figure 16 TGA curves of natural waxes.
The following table summarizes the temperature at which the samples exhibited a weight loss of 2 %
and 98 %, respectively.
Type of wax T (ºC) at 2% weight loss T (ºC) at 98% weight loss
Candelilla wax 277.1 478.8
Carnauba wax 314.6 506.7
Beeswax 275.0 473.0
Lingon 50 67.0 445.3
Lingon 1001 217.9 491.6
Lingon 1002 197.8 491.0
Lingon W 93.7 468.5
Table 14 TGA results from all the samples studied.
From Figure 16, it can be pointed out that Lingon W showed a decrease in the initial stage of the test
(at about 100 ºC), differing from the other wax samples. To analyze this aspect in more detail, Figure 17
depicts not only the TGA curve but also the DTGA curve (thicker red line in the figure) for Lingon W.
DTGA curve (first derivative of the weight loss curve) indicates the point of greatest rate of change on
the weight loss curve. It can also be known as the inflection point of the curve [48]. In this case, it can
be clearly noticed that although there was a weight drop in the initial stage, the point of greatest rate
of change was around 370 ºC.
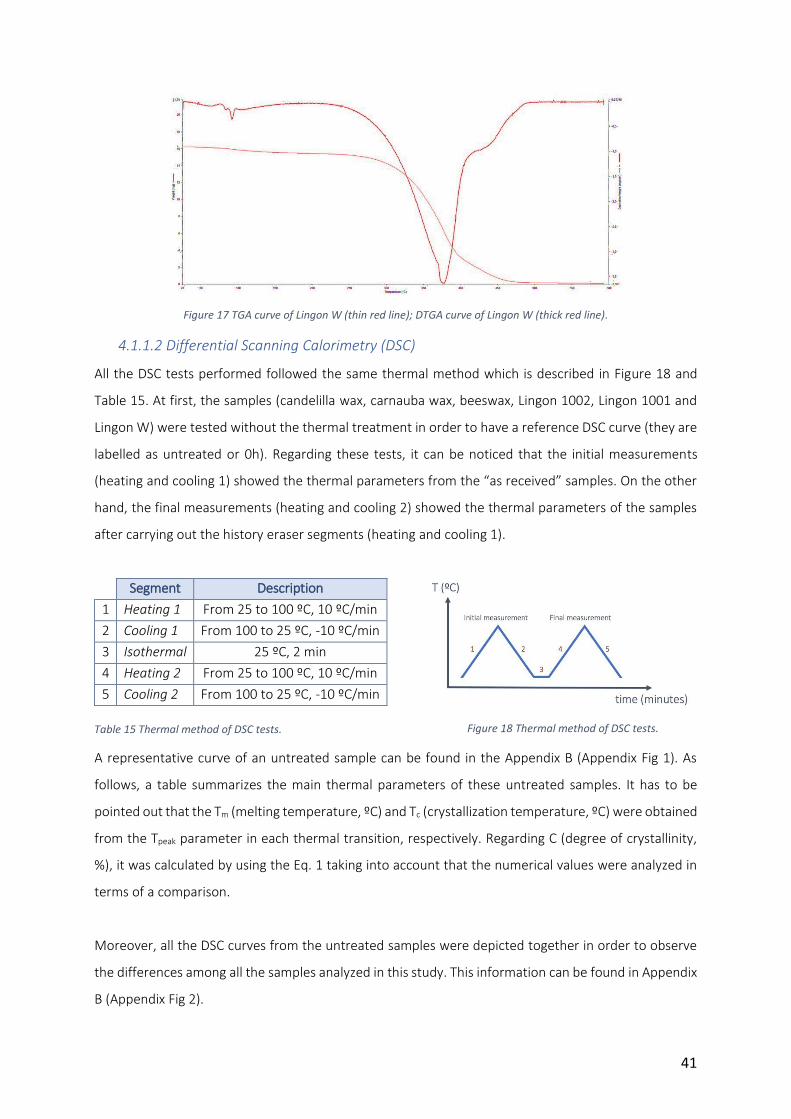
41
Figure 17 TGA curve of Lingon W (thin red line); DTGA curve of Lingon W (thick red line).
4.1.1.2 Differential Scanning Calorimetry (DSC)
All the DSC tests performed followed the same thermal method which is described in Figure 18 and
Table 15. At first, the samples (candelilla wax, carnauba wax, beeswax, Lingon 1002, Lingon 1001 and
Lingon W) were tested without the thermal treatment in order to have a reference DSC curve (they are
labelled as untreated or 0h). Regarding these tests, it can be noticed that the initial measurements
(heating and cooling 1) showed the thermal parameters from the “as received” samples. On the other
hand, the final measurements (heating and cooling 2) showed the thermal parameters of the samples
after carrying out the history eraser segments (heating and cooling 1).
Figure 18 Thermal method of DSC tests.
A representative curve of an untreated sample can be found in the Appendix B (Appendix Fig 1). As
follows, a table summarizes the main thermal parameters of these untreated samples. It has to be
pointed out that the Tm (melting temperature, ºC) and Tc (crystallization temperature, ºC) were obtained
from the Tpeak parameter in each thermal transition, respectively. Regarding C (degree of crystallinity,
%), it was calculated by using the Eq. 1 taking into account that the numerical values were analyzed in
terms of a comparison.
Moreover, all the DSC curves from the untreated samples were depicted together in order to observe
the differences among all the samples analyzed in this study. This information can be found in Appendix
B (Appendix Fig 2).
Segment Description
1 Heating 1 From 25 to 100 ºC, 10 ºC/min
2 Cooling 1 From 100 to 25 ºC, -10 ºC/min
3 Isothermal 25 ºC, 2 min
4 Heating 2 From 25 to 100 ºC, 10 ºC/min
5 Cooling 2 From 100 to 25 ºC, -10 ºC/min
Table 15 Thermal method of DSC tests.
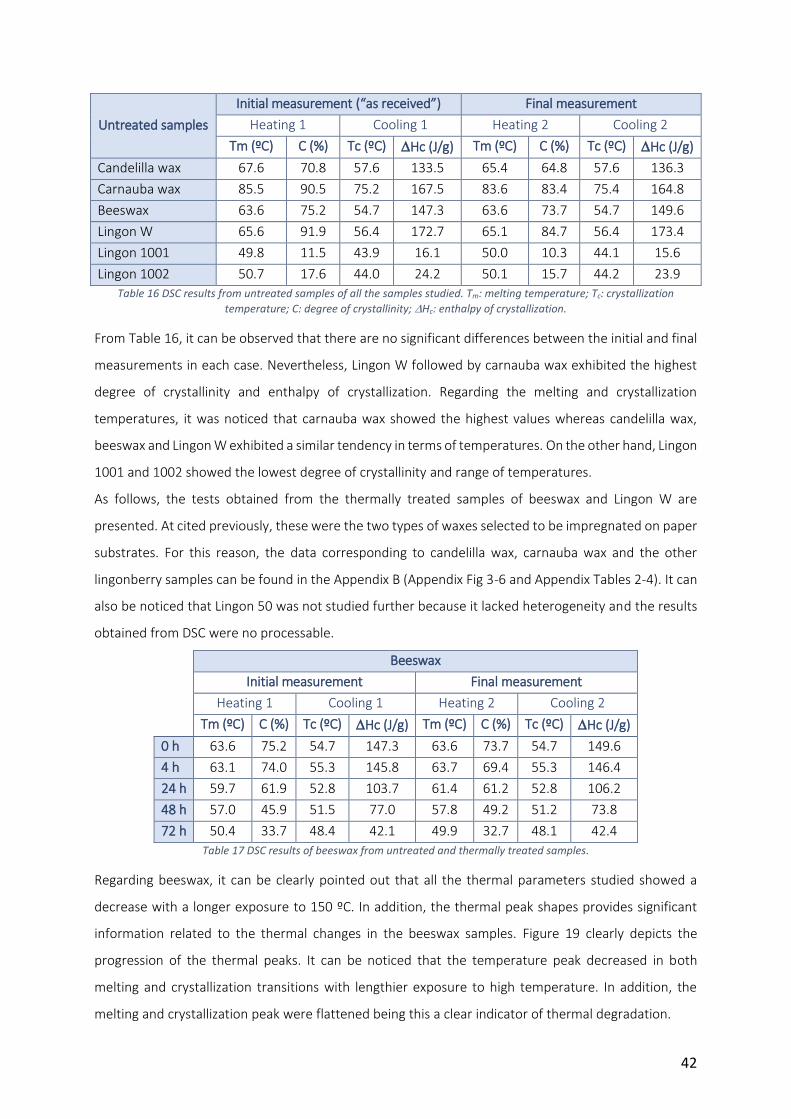
42
Untreated samples
Initial measurement (“as received”) Final measurement
Heating 1 Cooling 1 Heating 2 Cooling 2
Tm (ºC) C (%) Tc (ºC) Hc (J/g) Tm (ºC) C (%) Tc (ºC) Hc (J/g)
Candelilla wax 67.6 70.8 57.6 133.5 65.4 64.8 57.6 136.3
Carnauba wax 85.5 90.5 75.2 167.5 83.6 83.4 75.4 164.8
Beeswax 63.6 75.2 54.7 147.3 63.6 73.7 54.7 149.6
Lingon W 65.6 91.9 56.4 172.7 65.1 84.7 56.4 173.4
Lingon 1001 49.8 11.5 43.9 16.1 50.0 10.3 44.1 15.6
Lingon 1002 50.7 17.6 44.0 24.2 50.1 15.7 44.2 23.9
Table 16 DSC results from untreated samples of all the samples studied. Tm: melting temperature; Tc: crystallization
temperature; C: degree of crystallinity; Hc: enthalpy of crystallization.
From Table 16, it can be observed that there are no significant differences between the initial and final
measurements in each case. Nevertheless, Lingon W followed by carnauba wax exhibited the highest
degree of crystallinity and enthalpy of crystallization. Regarding the melting and crystallization
temperatures, it was noticed that carnauba wax showed the highest values whereas candelilla wax,
beeswax and Lingon W exhibited a similar tendency in terms of temperatures. On the other hand, Lingon
1001 and 1002 showed the lowest degree of crystallinity and range of temperatures.
As follows, the tests obtained from the thermally treated samples of beeswax and Lingon W are
presented. At cited previously, these were the two types of waxes selected to be impregnated on paper
substrates. For this reason, the data corresponding to candelilla wax, carnauba wax and the other
lingonberry samples can be found in the Appendix B (Appendix Fig 3-6 and Appendix Tables 2-4). It can
also be noticed that Lingon 50 was not studied further because it lacked heterogeneity and the results
obtained from DSC were no processable.
Beeswax
Initial measurement Final measurement
Heating 1 Cooling 1 Heating 2 Cooling 2
Tm (ºC) C (%) Tc (ºC) Hc (J/g) Tm (ºC) C (%) Tc (ºC) Hc (J/g)
0 h 63.6 75.2 54.7 147.3 63.6 73.7 54.7 149.6
4 h 63.1 74.0 55.3 145.8 63.7 69.4 55.3 146.4
24 h 59.7 61.9 52.8 103.7 61.4 61.2 52.8 106.2
48 h 57.0 45.9 51.5 77.0 57.8 49.2 51.2 73.8
72 h 50.4 33.7 48.4 42.1 49.9 32.7 48.1 42.4
Table 17 DSC results of beeswax from untreated and thermally treated samples.
Regarding beeswax, it can be clearly pointed out that all the thermal parameters studied showed a
decrease with a longer exposure to 150 ºC. In addition, the thermal peak shapes provides significant
information related to the thermal changes in the beeswax samples. Figure 19 clearly depicts the
progression of the thermal peaks. It can be noticed that the temperature peak decreased in both
melting and crystallization transitions with lengthier exposure to high temperature. In addition, the
melting and crystallization peak were flattened being this a clear indicator of thermal degradation.
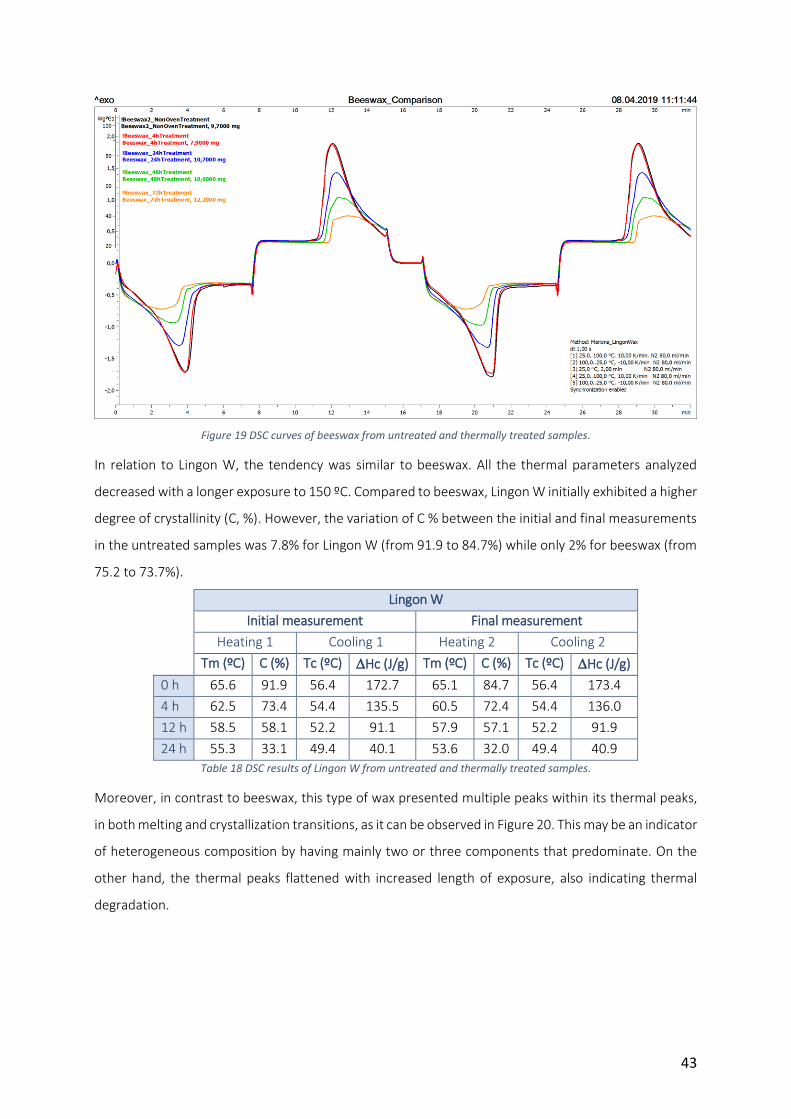
43
Figure 19 DSC curves of beeswax from untreated and thermally treated samples.
In relation to Lingon W, the tendency was similar to beeswax. All the thermal parameters analyzed
decreased with a longer exposure to 150 ºC. Compared to beeswax, Lingon W initially exhibited a higher
degree of crystallinity (C, %). However, the variation of C % between the initial and final measurements
in the untreated samples was 7.8% for Lingon W (from 91.9 to 84.7%) while only 2% for beeswax (from
75.2 to 73.7%).
Lingon W
Initial measurement Final measurement
Heating 1 Cooling 1 Heating 2 Cooling 2
Tm (ºC) C (%) Tc (ºC) Hc (J/g) Tm (ºC) C (%) Tc (ºC) Hc (J/g)
0 h 65.6 91.9 56.4 172.7 65.1 84.7 56.4 173.4
4 h 62.5 73.4 54.4 135.5 60.5 72.4 54.4 136.0
12 h 58.5 58.1 52.2 91.1 57.9 57.1 52.2 91.9
24 h 55.3 33.1 49.4 40.1 53.6 32.0 49.4 40.9
Table 18 DSC results of Lingon W from untreated and thermally treated samples.
Moreover, in contrast to beeswax, this type of wax presented multiple peaks within its thermal peaks,
in both melting and crystallization transitions, as it can be observed in Figure 20. This may be an indicator
of heterogeneous composition by having mainly two or three components that predominate. On the
other hand, the thermal peaks flattened with increased length of exposure, also indicating thermal
degradation.
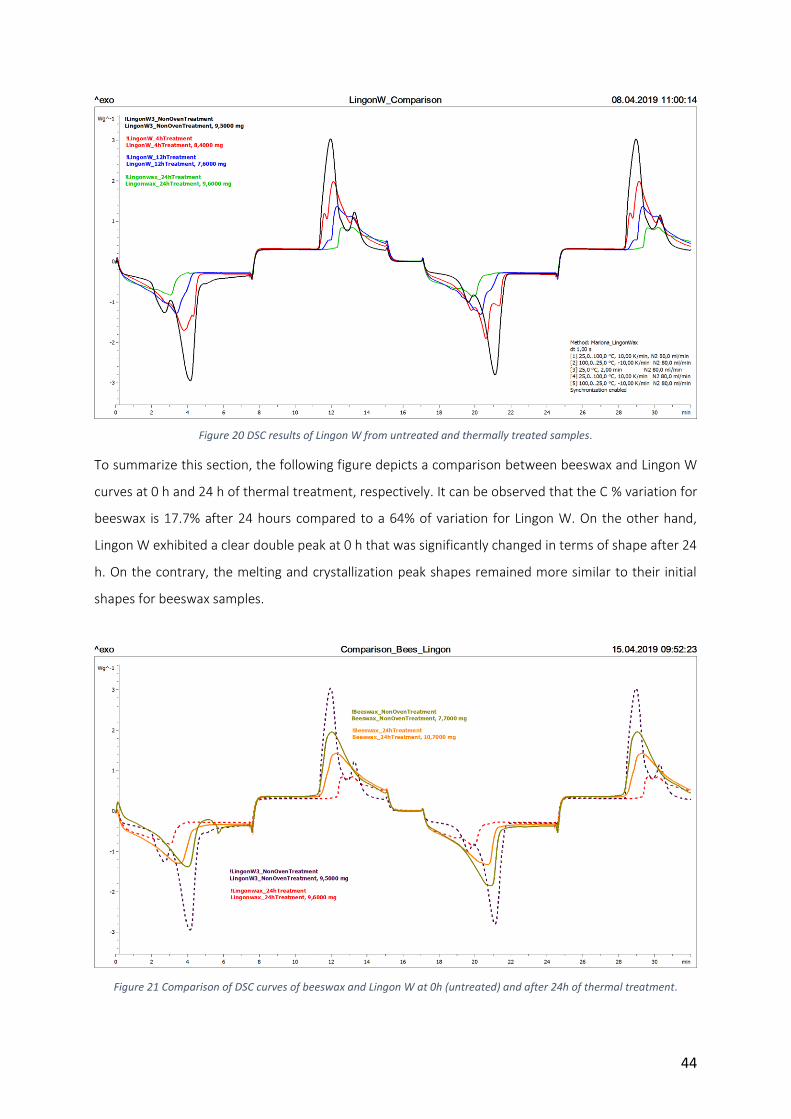
44
Figure 20 DSC results of Lingon W from untreated and thermally treated samples.
To summarize this section, the following figure depicts a comparison between beeswax and Lingon W
curves at 0 h and 24 h of thermal treatment, respectively. It can be observed that the C % variation for
beeswax is 17.7% after 24 hours compared to a 64% of variation for Lingon W. On the other hand,
Lingon W exhibited a clear double peak at 0 h that was significantly changed in terms of shape after 24
h. On the contrary, the melting and crystallization peak shapes remained more similar to their initial
shapes for beeswax samples.
Figure 21 Comparison of DSC curves of beeswax and Lingon W at 0h (untreated) and after 24h of thermal treatment.
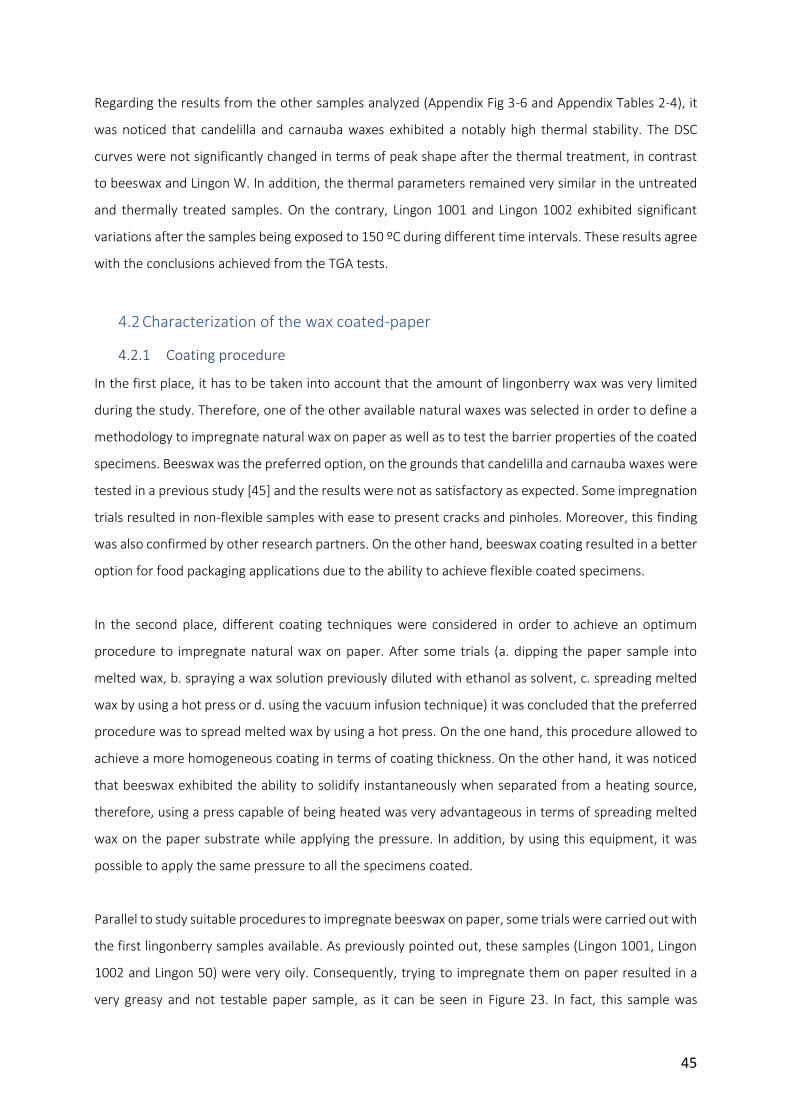
45
Regarding the results from the other samples analyzed (Appendix Fig 3-6 and Appendix Tables 2-4), it
was noticed that candelilla and carnauba waxes exhibited a notably high thermal stability. The DSC
curves were not significantly changed in terms of peak shape after the thermal treatment, in contrast
to beeswax and Lingon W. In addition, the thermal parameters remained very similar in the untreated
and thermally treated samples. On the contrary, Lingon 1001 and Lingon 1002 exhibited significant
variations after the samples being exposed to 150 ºC during different time intervals. These results agree
with the conclusions achieved from the TGA tests.
4.2 Characterization of the wax coated-paper
4.2.1 Coating procedure
In the first place, it has to be taken into account that the amount of lingonberry wax was very limited
during the study. Therefore, one of the other available natural waxes was selected in order to define a
methodology to impregnate natural wax on paper as well as to test the barrier properties of the coated
specimens. Beeswax was the preferred option, on the grounds that candelilla and carnauba waxes were
tested in a previous study [45] and the results were not as satisfactory as expected. Some impregnation
trials resulted in non-flexible samples with ease to present cracks and pinholes. Moreover, this finding
was also confirmed by other research partners. On the other hand, beeswax coating resulted in a better
option for food packaging applications due to the ability to achieve flexible coated specimens.
In the second place, different coating techniques were considered in order to achieve an optimum
procedure to impregnate natural wax on paper. After some trials (a. dipping the paper sample into
melted wax, b. spraying a wax solution previously diluted with ethanol as solvent, c. spreading melted
wax by using a hot press or d. using the vacuum infusion technique) it was concluded that the preferred
procedure was to spread melted wax by using a hot press. On the one hand, this procedure allowed to
achieve a more homogeneous coating in terms of coating thickness. On the other hand, it was noticed
that beeswax exhibited the ability to solidify instantaneously when separated from a heating source,
therefore, using a press capable of being heated was very advantageous in terms of spreading melted
wax on the paper substrate while applying the pressure. In addition, by using this equipment, it was
possible to apply the same pressure to all the specimens coated.
Parallel to study suitable procedures to impregnate beeswax on paper, some trials were carried out with
the first lingonberry samples available. As previously pointed out, these samples (Lingon 1001, Lingon
1002 and Lingon 50) were very oily. Consequently, trying to impregnate them on paper resulted in a
very greasy and not testable paper sample, as it can be seen in Figure 23. In fact, this sample was
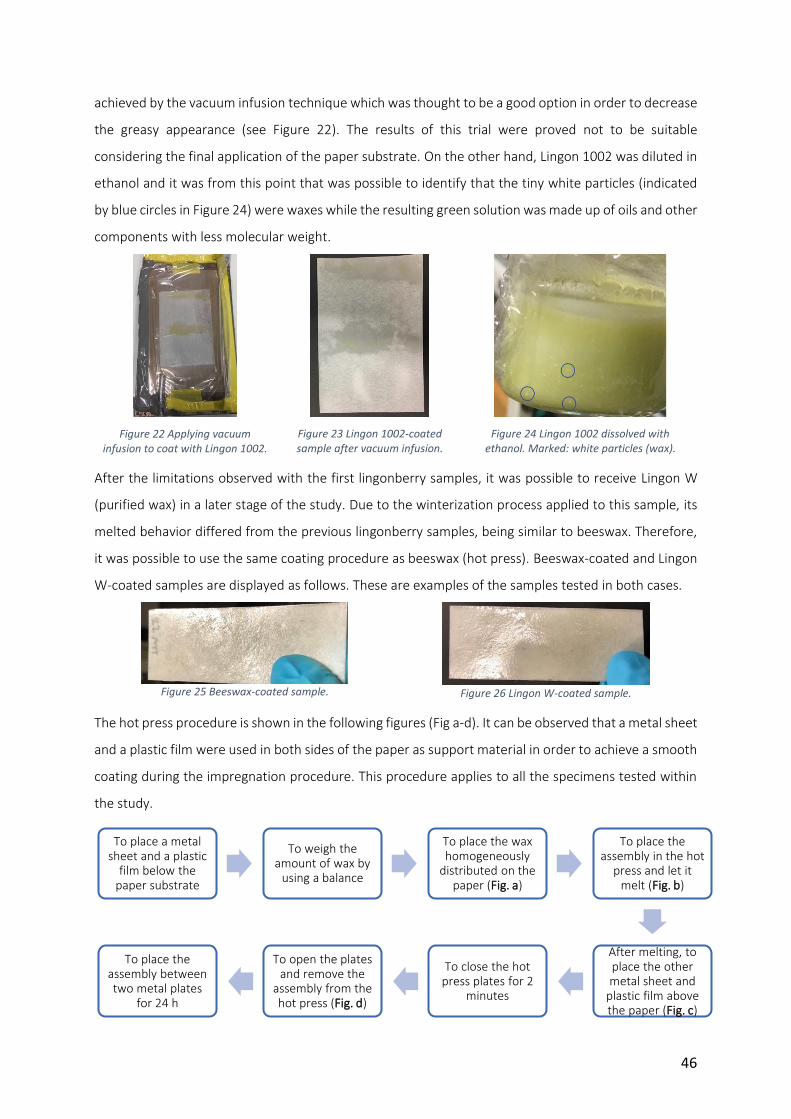
46
achieved by the vacuum infusion technique which was thought to be a good option in order to decrease
the greasy appearance (see Figure 22). The results of this trial were proved not to be suitable
considering the final application of the paper substrate. On the other hand, Lingon 1002 was diluted in
ethanol and it was from this point that was possible to identify that the tiny white particles (indicated
by blue circles in Figure 24) were waxes while the resulting green solution was made up of oils and other
components with less molecular weight.
Figure 22 Applying vacuum infusion to coat with Lingon 1002.
Figure 23 Lingon 1002-coated sample after vacuum infusion.
Figure 24 Lingon 1002 dissolved with ethanol. Marked: white particles (wax).
After the limitations observed with the first lingonberry samples, it was possible to receive Lingon W
(purified wax) in a later stage of the study. Due to the winterization process applied to this sample, its
melted behavior differed from the previous lingonberry samples, being similar to beeswax. Therefore,
it was possible to use the same coating procedure as beeswax (hot press). Beeswax-coated and Lingon
W-coated samples are displayed as follows. These are examples of the samples tested in both cases.
Figure 25 Beeswax-coated sample.
Figure 26 Lingon W-coated sample.
The hot press procedure is shown in the following figures (Fig a-d). It can be observed that a metal sheet
and a plastic film were used in both sides of the paper as support material in order to achieve a smooth
coating during the impregnation procedure. This procedure applies to all the specimens tested within
the study.
To place a metal sheet and a plastic
film below the paper substrate
To weigh the amount of wax by
using a balance
To place the wax homogeneously
distributed on the paper (Fig. a)
To place the assembly in the hot
press and let it melt (Fig. b)
After melting, to place the other metal sheet and
plastic film above the paper (Fig. c)
To close the hot press plates for 2
minutes
To open the plates and remove the
assembly from the hot press (Fig. d)
To place the assembly between two metal plates
for 24 h
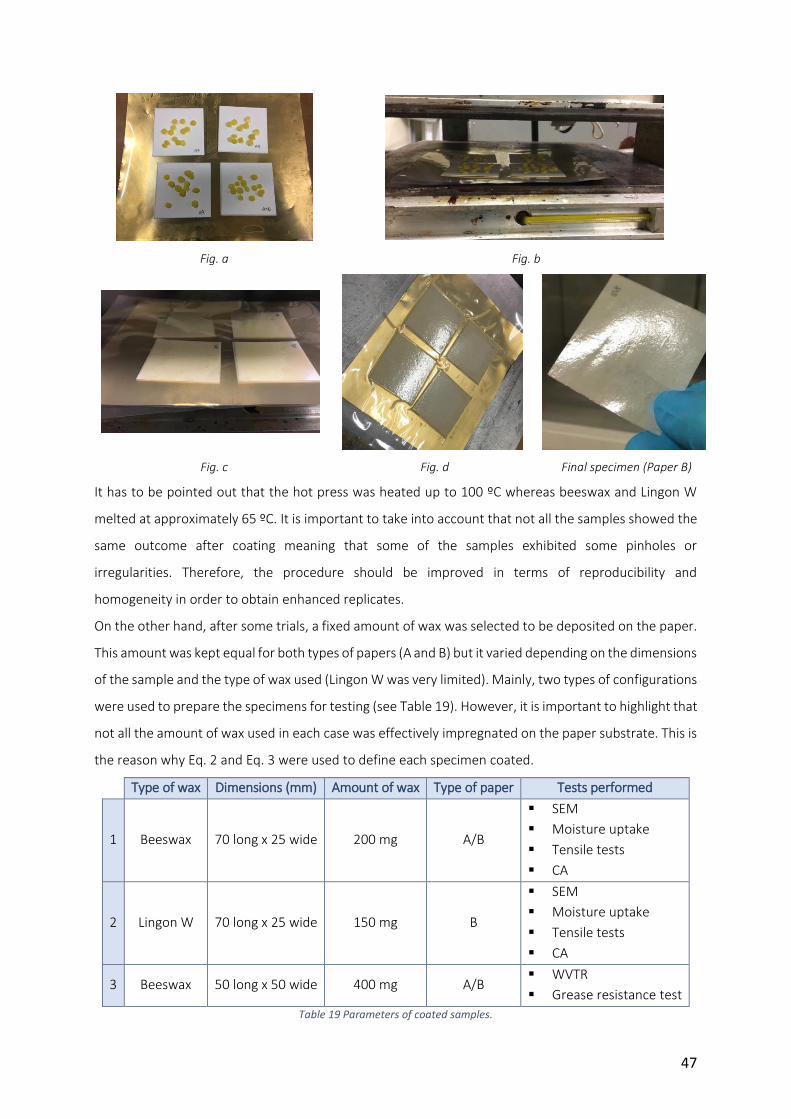
47
Fig. a Fig. b
Fig. c Fig. d Final specimen (Paper B)
It has to be pointed out that the hot press was heated up to 100 ºC whereas beeswax and Lingon W
melted at approximately 65 ºC. It is important to take into account that not all the samples showed the
same outcome after coating meaning that some of the samples exhibited some pinholes or
irregularities. Therefore, the procedure should be improved in terms of reproducibility and
homogeneity in order to obtain enhanced replicates.
On the other hand, after some trials, a fixed amount of wax was selected to be deposited on the paper.
This amount was kept equal for both types of papers (A and B) but it varied depending on the dimensions
of the sample and the type of wax used (Lingon W was very limited). Mainly, two types of configurations
were used to prepare the specimens for testing (see Table 19). However, it is important to highlight that
not all the amount of wax used in each case was effectively impregnated on the paper substrate. This is
the reason why Eq. 2 and Eq. 3 were used to define each specimen coated.
Type of wax Dimensions (mm) Amount of wax Type of paper Tests performed
1 Beeswax 70 long x 25 wide 200 mg A/B
SEM
Moisture uptake
Tensile tests
CA
2 Lingon W 70 long x 25 wide 150 mg B
SEM
Moisture uptake
Tensile tests
CA
3 Beeswax 50 long x 50 wide 400 mg A/B WVTR
Grease resistance test
Table 19 Parameters of coated samples.
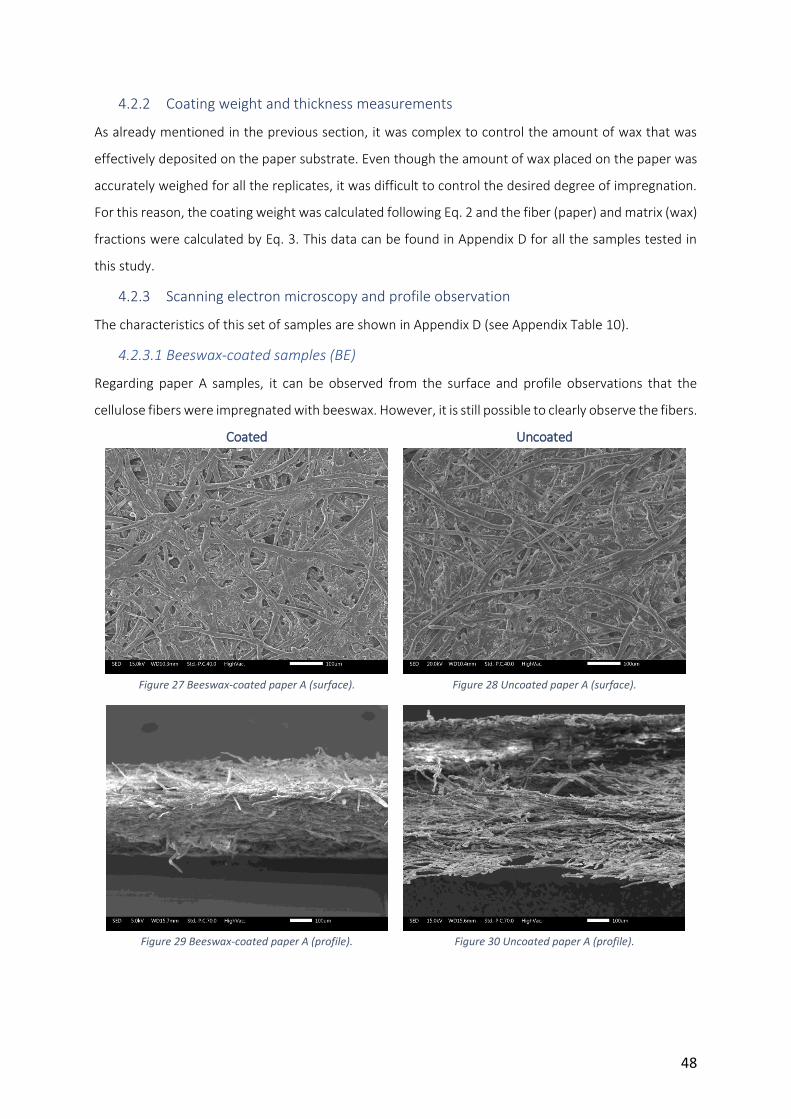
48
4.2.2 Coating weight and thickness measurements
As already mentioned in the previous section, it was complex to control the amount of wax that was
effectively deposited on the paper substrate. Even though the amount of wax placed on the paper was
accurately weighed for all the replicates, it was difficult to control the desired degree of impregnation.
For this reason, the coating weight was calculated following Eq. 2 and the fiber (paper) and matrix (wax)
fractions were calculated by Eq. 3. This data can be found in Appendix D for all the samples tested in
this study.
4.2.3 Scanning electron microscopy and profile observation
The characteristics of this set of samples are shown in Appendix D (see Appendix Table 10).
4.2.3.1 Beeswax-coated samples (BE)
Regarding paper A samples, it can be observed from the surface and profile observations that the
cellulose fibers were impregnated with beeswax. However, it is still possible to clearly observe the fibers.
Coated Uncoated
Figure 27 Beeswax-coated paper A (surface).
Figure 28 Uncoated paper A (surface).
Figure 29 Beeswax-coated paper A (profile).
Figure 30 Uncoated paper A (profile).
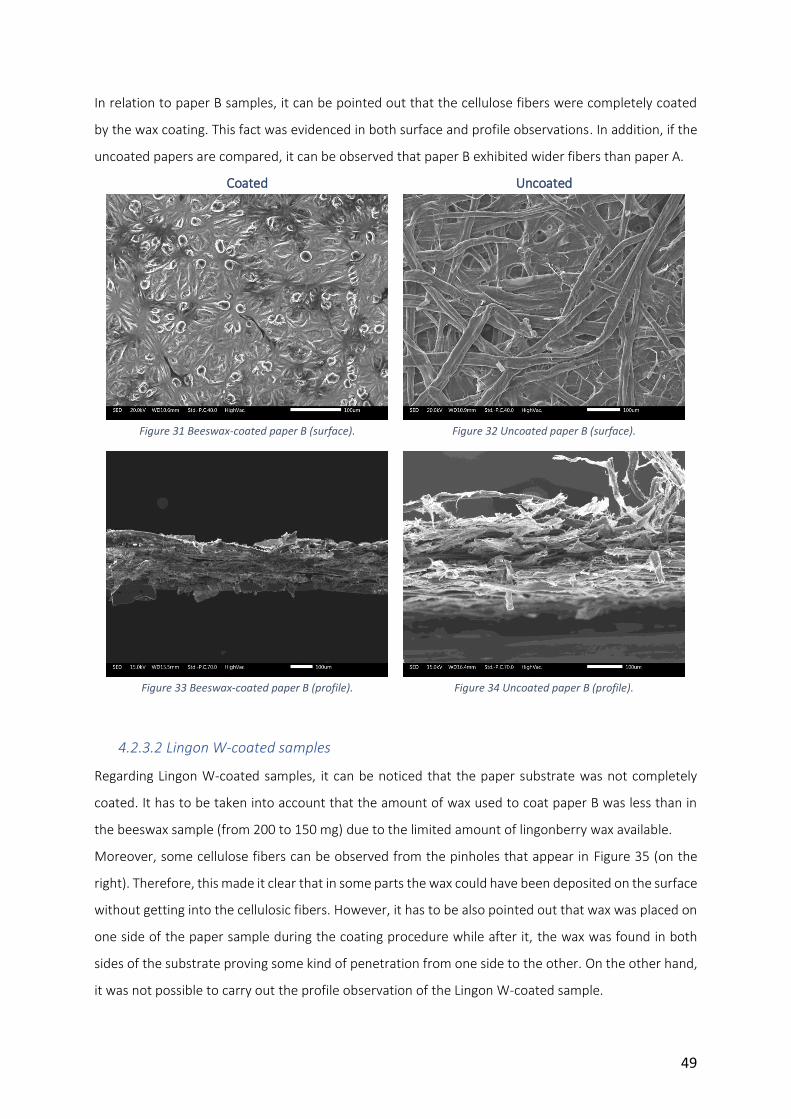
49
In relation to paper B samples, it can be pointed out that the cellulose fibers were completely coated
by the wax coating. This fact was evidenced in both surface and profile observations. In addition, if the
uncoated papers are compared, it can be observed that paper B exhibited wider fibers than paper A.
Coated Uncoated
Figure 31 Beeswax-coated paper B (surface).
Figure 32 Uncoated paper B (surface).
Figure 33 Beeswax-coated paper B (profile).
Figure 34 Uncoated paper B (profile).
4.2.3.2 Lingon W-coated samples
Regarding Lingon W-coated samples, it can be noticed that the paper substrate was not completely
coated. It has to be taken into account that the amount of wax used to coat paper B was less than in
the beeswax sample (from 200 to 150 mg) due to the limited amount of lingonberry wax available.
Moreover, some cellulose fibers can be observed from the pinholes that appear in Figure 35 (on the
right). Therefore, this made it clear that in some parts the wax could have been deposited on the surface
without getting into the cellulosic fibers. However, it has to be also pointed out that wax was placed on
one side of the paper sample during the coating procedure while after it, the wax was found in both
sides of the substrate proving some kind of penetration from one side to the other. On the other hand,
it was not possible to carry out the profile observation of the Lingon W-coated sample.
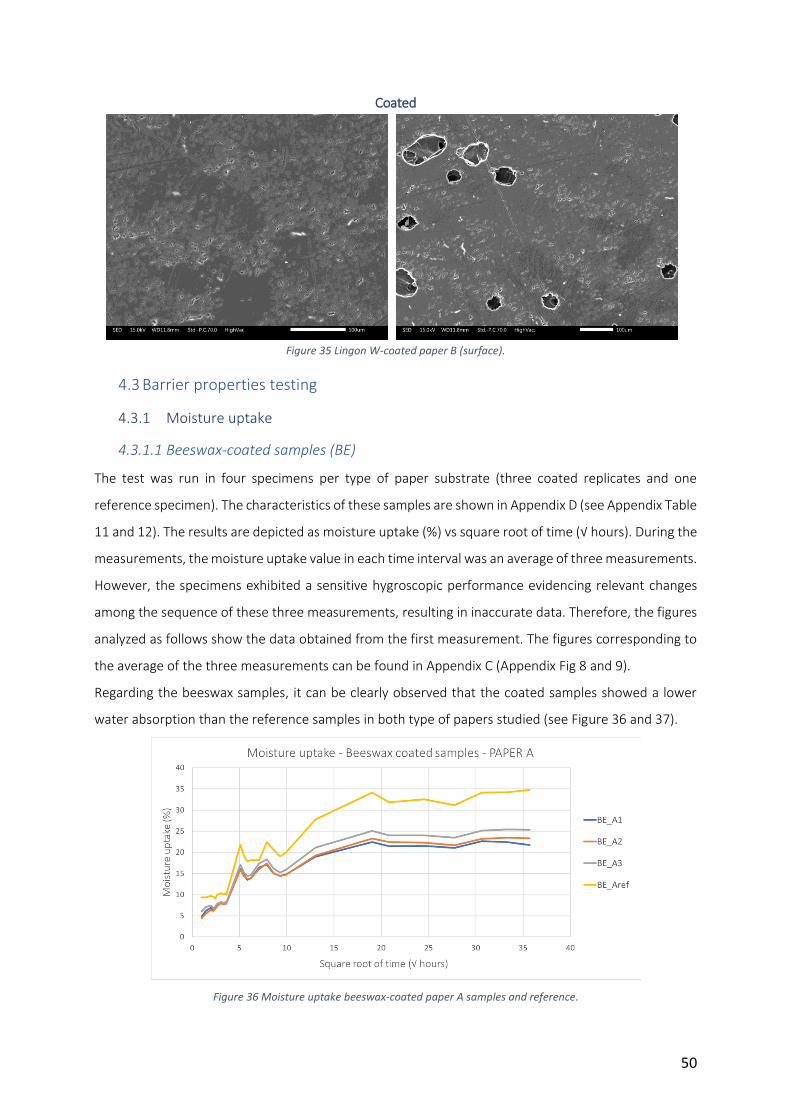
50
Coated
Figure 35 Lingon W-coated paper B (surface).
4.3 Barrier properties testing
4.3.1 Moisture uptake
4.3.1.1 Beeswax-coated samples (BE)
The test was run in four specimens per type of paper substrate (three coated replicates and one
reference specimen). The characteristics of these samples are shown in Appendix D (see Appendix Table
11 and 12). The results are depicted as moisture uptake (%) vs square root of time (√ hours). During the
measurements, the moisture uptake value in each time interval was an average of three measurements.
However, the specimens exhibited a sensitive hygroscopic performance evidencing relevant changes
among the sequence of these three measurements, resulting in inaccurate data. Therefore, the figures
analyzed as follows show the data obtained from the first measurement. The figures corresponding to
the average of the three measurements can be found in Appendix C (Appendix Fig 8 and 9).
Regarding the beeswax samples, it can be clearly observed that the coated samples showed a lower
water absorption than the reference samples in both type of papers studied (see Figure 36 and 37).
Figure 36 Moisture uptake beeswax-coated paper A samples and reference.

51
Regarding paper A samples (Figure 36), it can be noticed that the CW showed a slightly variation among
the three coated specimens considered. In addition, sample BE_A3, which exhibited the lowest CW
(89.4 g/m2), resulted in the highest moisture uptake tendency. Consequently, it can be concluded that
CW may influence the water absorption response of beeswax-coated samples.
Figure 37 Moisture uptake beeswax-coated paper B samples and reference.
In reference to paper B samples (Figure 37), the coated samples displayed similar CW values being this
in accordance with the results obtained in the water absorption behavior of these set of samples. The
trend is very similar for all the coated samples analyzed, being significantly lower than the reference
sample.
4.3.1.2 Lingon W-coated samples (LW)
The test was run in three specimens (two coated and one reference specimen). In this case, the moisture
uptake testing was carried out only with paper B samples due to the limited amount of Lingon W
available. From the figure below, it can be noticed that the trend is very similar to beeswax samples.
Lingon W-coated samples exhibited a notably lower water absorption compared to the uncoated
sample. The characteristics of these samples are shown in Appendix D (see Appendix Table 13).
Figure 38 Moisture uptake Lingon W-coated paper B samples and reference.
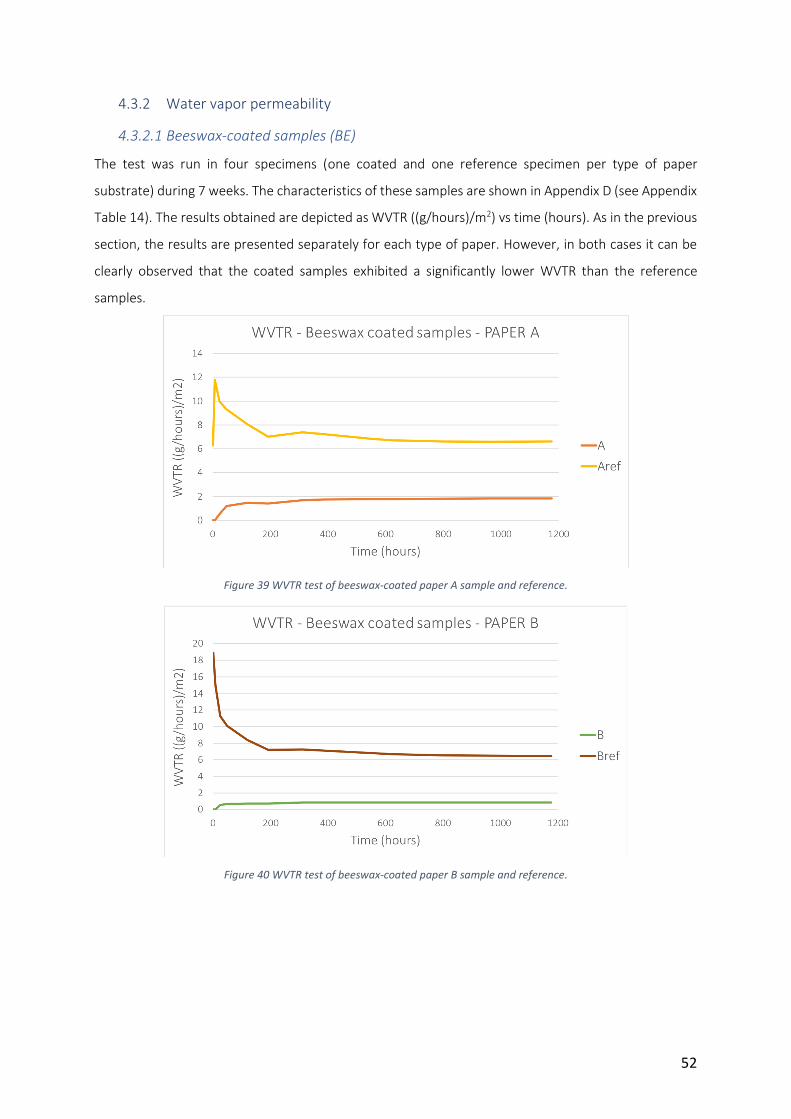
52
4.3.2 Water vapor permeability
4.3.2.1 Beeswax-coated samples (BE)
The test was run in four specimens (one coated and one reference specimen per type of paper
substrate) during 7 weeks. The characteristics of these samples are shown in Appendix D (see Appendix
Table 14). The results obtained are depicted as WVTR ((g/hours)/m2) vs time (hours). As in the previous
section, the results are presented separately for each type of paper. However, in both cases it can be
clearly observed that the coated samples exhibited a significantly lower WVTR than the reference
samples.
Figure 39 WVTR test of beeswax-coated paper A sample and reference.
Figure 40 WVTR test of beeswax-coated paper B sample and reference.
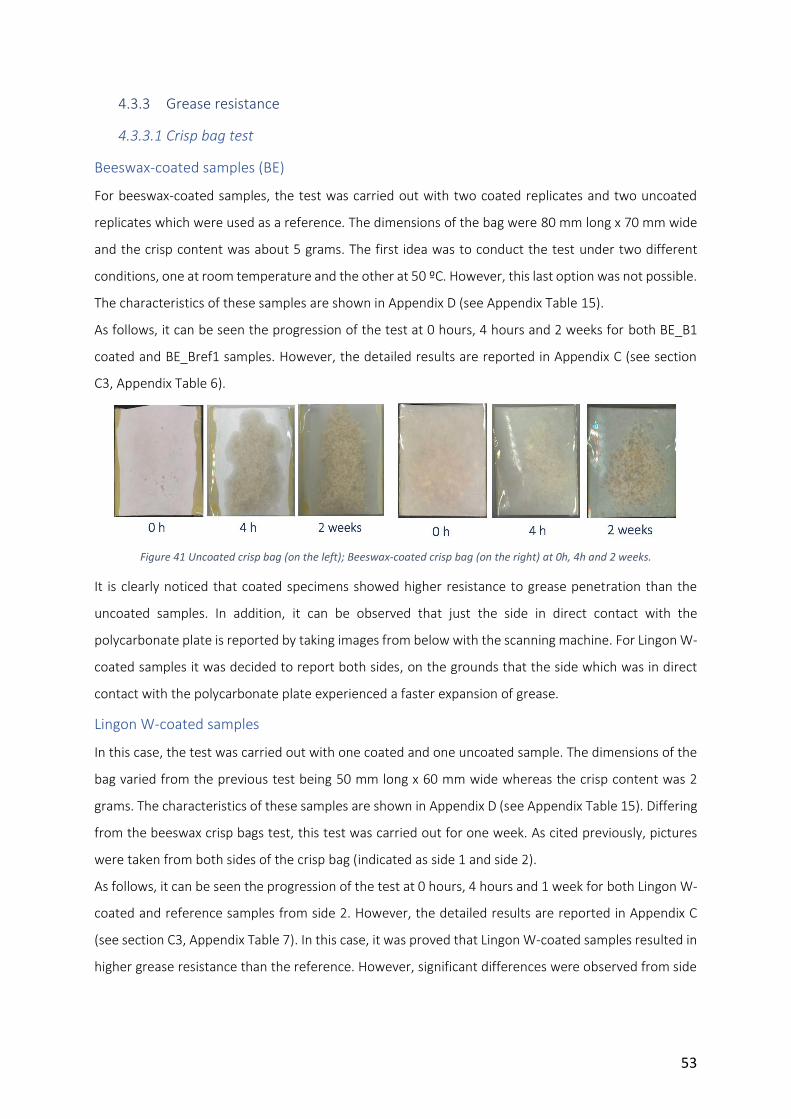
53
4.3.3 Grease resistance
4.3.3.1 Crisp bag test
Beeswax-coated samples (BE)
For beeswax-coated samples, the test was carried out with two coated replicates and two uncoated
replicates which were used as a reference. The dimensions of the bag were 80 mm long x 70 mm wide
and the crisp content was about 5 grams. The first idea was to conduct the test under two different
conditions, one at room temperature and the other at 50 ºC. However, this last option was not possible.
The characteristics of these samples are shown in Appendix D (see Appendix Table 15).
As follows, it can be seen the progression of the test at 0 hours, 4 hours and 2 weeks for both BE_B1
coated and BE_Bref1 samples. However, the detailed results are reported in Appendix C (see section
C3, Appendix Table 6).
Figure 41 Uncoated crisp bag (on the left); Beeswax-coated crisp bag (on the right) at 0h, 4h and 2 weeks.
It is clearly noticed that coated specimens showed higher resistance to grease penetration than the
uncoated samples. In addition, it can be observed that just the side in direct contact with the
polycarbonate plate is reported by taking images from below with the scanning machine. For Lingon W-
coated samples it was decided to report both sides, on the grounds that the side which was in direct
contact with the polycarbonate plate experienced a faster expansion of grease.
Lingon W-coated samples
In this case, the test was carried out with one coated and one uncoated sample. The dimensions of the
bag varied from the previous test being 50 mm long x 60 mm wide whereas the crisp content was 2
grams. The characteristics of these samples are shown in Appendix D (see Appendix Table 15). Differing
from the beeswax crisp bags test, this test was carried out for one week. As cited previously, pictures
were taken from both sides of the crisp bag (indicated as side 1 and side 2).
As follows, it can be seen the progression of the test at 0 hours, 4 hours and 1 week for both Lingon W-
coated and reference samples from side 2. However, the detailed results are reported in Appendix C
(see section C3, Appendix Table 7). In this case, it was proved that Lingon W-coated samples resulted in
higher grease resistance than the reference. However, significant differences were observed from side
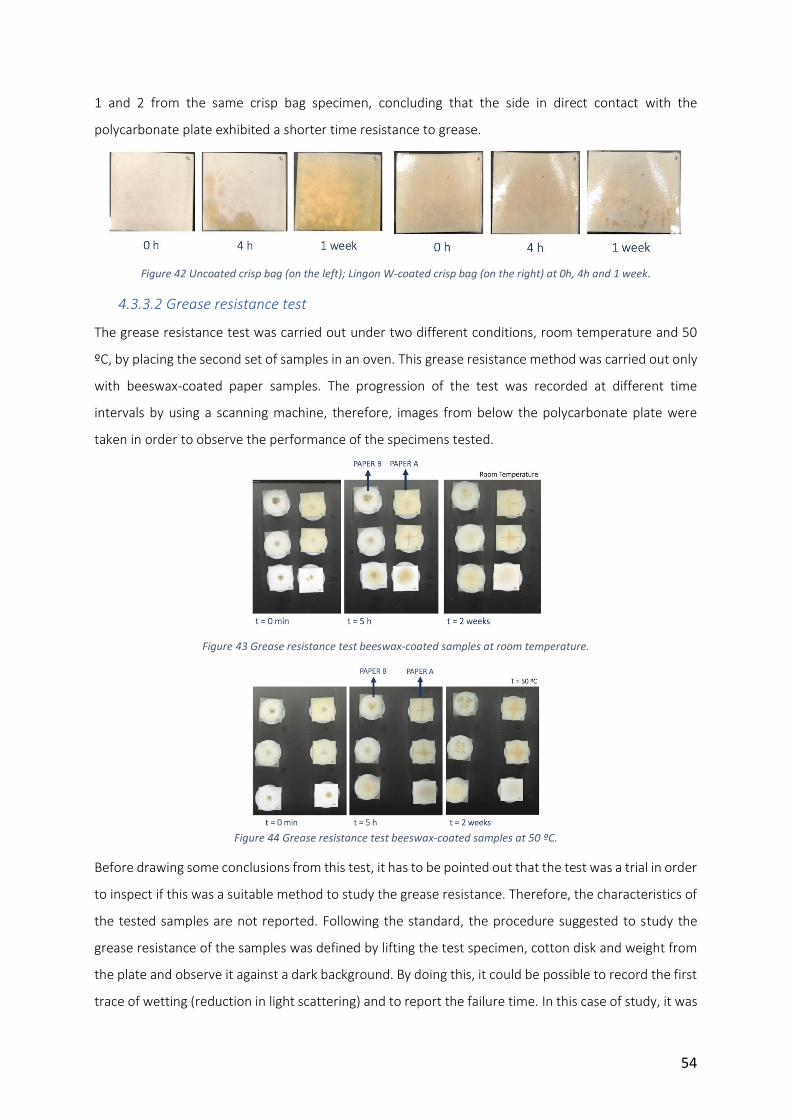
54
1 and 2 from the same crisp bag specimen, concluding that the side in direct contact with the
polycarbonate plate exhibited a shorter time resistance to grease.
Figure 42 Uncoated crisp bag (on the left); Lingon W-coated crisp bag (on the right) at 0h, 4h and 1 week.
4.3.3.2 Grease resistance test
The grease resistance test was carried out under two different conditions, room temperature and 50
ºC, by placing the second set of samples in an oven. This grease resistance method was carried out only
with beeswax-coated paper samples. The progression of the test was recorded at different time
intervals by using a scanning machine, therefore, images from below the polycarbonate plate were
taken in order to observe the performance of the specimens tested.
Figure 43 Grease resistance test beeswax-coated samples at room temperature.
Figure 44 Grease resistance test beeswax-coated samples at 50 ºC.
Before drawing some conclusions from this test, it has to be pointed out that the test was a trial in order
to inspect if this was a suitable method to study the grease resistance. Therefore, the characteristics of
the tested samples are not reported. Following the standard, the procedure suggested to study the
grease resistance of the samples was defined by lifting the test specimen, cotton disk and weight from
the plate and observe it against a dark background. By doing this, it could be possible to record the first
trace of wetting (reduction in light scattering) and to report the failure time. In this case of study, it was
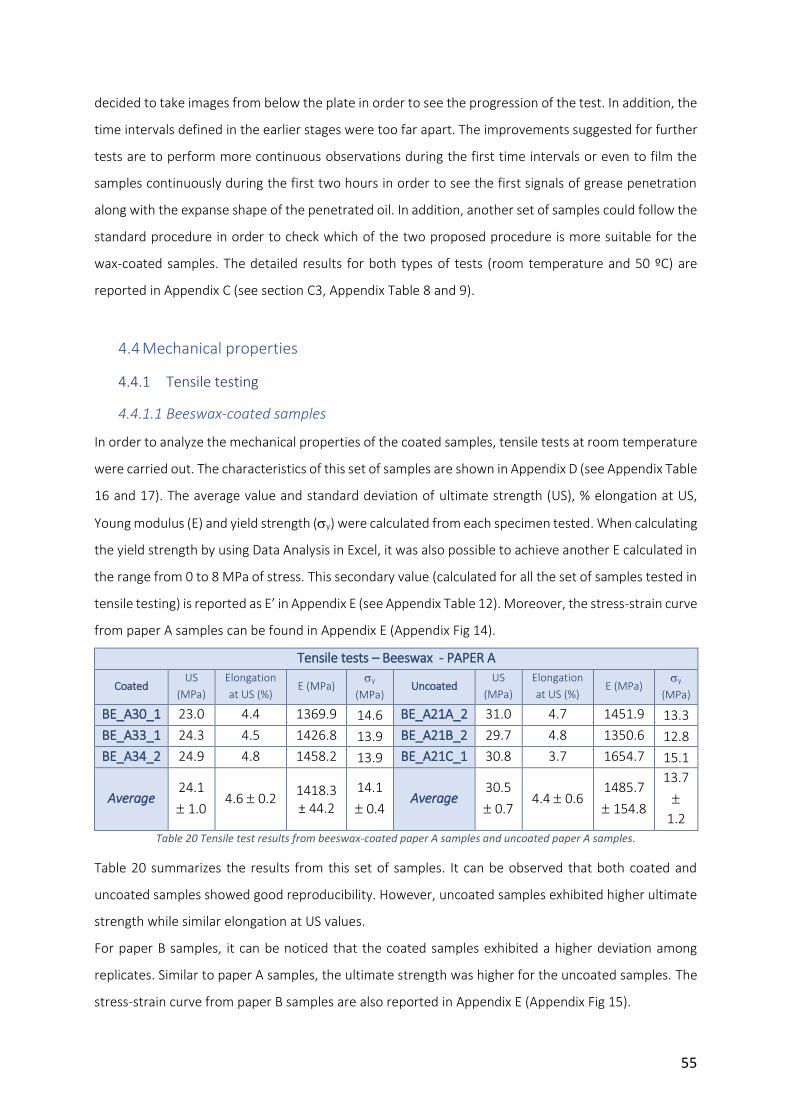
55
decided to take images from below the plate in order to see the progression of the test. In addition, the
time intervals defined in the earlier stages were too far apart. The improvements suggested for further
tests are to perform more continuous observations during the first time intervals or even to film the
samples continuously during the first two hours in order to see the first signals of grease penetration
along with the expanse shape of the penetrated oil. In addition, another set of samples could follow the
standard procedure in order to check which of the two proposed procedure is more suitable for the
wax-coated samples. The detailed results for both types of tests (room temperature and 50 ºC) are
reported in Appendix C (see section C3, Appendix Table 8 and 9).
4.4 Mechanical properties
4.4.1 Tensile testing
4.4.1.1 Beeswax-coated samples
In order to analyze the mechanical properties of the coated samples, tensile tests at room temperature
were carried out. The characteristics of this set of samples are shown in Appendix D (see Appendix Table
16 and 17). The average value and standard deviation of ultimate strength (US), % elongation at US,
Young modulus (E) and yield strength (y) were calculated from each specimen tested. When calculating
the yield strength by using Data Analysis in Excel, it was also possible to achieve another E calculated in
the range from 0 to 8 MPa of stress. This secondary value (calculated for all the set of samples tested in
tensile testing) is reported as E’ in Appendix E (see Appendix Table 12). Moreover, the stress-strain curve
from paper A samples can be found in Appendix E (Appendix Fig 14).
Tensile tests – Beeswax - PAPER A
Coated US
(MPa)
Elongation
at US (%) E (MPa)
y
(MPa) Uncoated
US
(MPa)
Elongation
at US (%) E (MPa)
y
(MPa)
BE_A30_1 23.0 4.4 1369.9 14.6 BE_A21A_2 31.0 4.7 1451.9 13.3
BE_A33_1 24.3 4.5 1426.8 13.9 BE_A21B_2 29.7 4.8 1350.6 12.8
BE_A34_2 24.9 4.8 1458.2 13.9 BE_A21C_1 30.8 3.7 1654.7 15.1
Average 24.1
1.0 4.6 0.2
1418.3 ± 44.2
14.1
0.4 Average
30.5
0.7 4.4 0.6
1485.7
154.8
13.7
1.2
Table 20 Tensile test results from beeswax-coated paper A samples and uncoated paper A samples.
Table 20 summarizes the results from this set of samples. It can be observed that both coated and
uncoated samples showed good reproducibility. However, uncoated samples exhibited higher ultimate
strength while similar elongation at US values.
For paper B samples, it can be noticed that the coated samples exhibited a higher deviation among
replicates. Similar to paper A samples, the ultimate strength was higher for the uncoated samples. The
stress-strain curve from paper B samples are also reported in Appendix E (Appendix Fig 15).
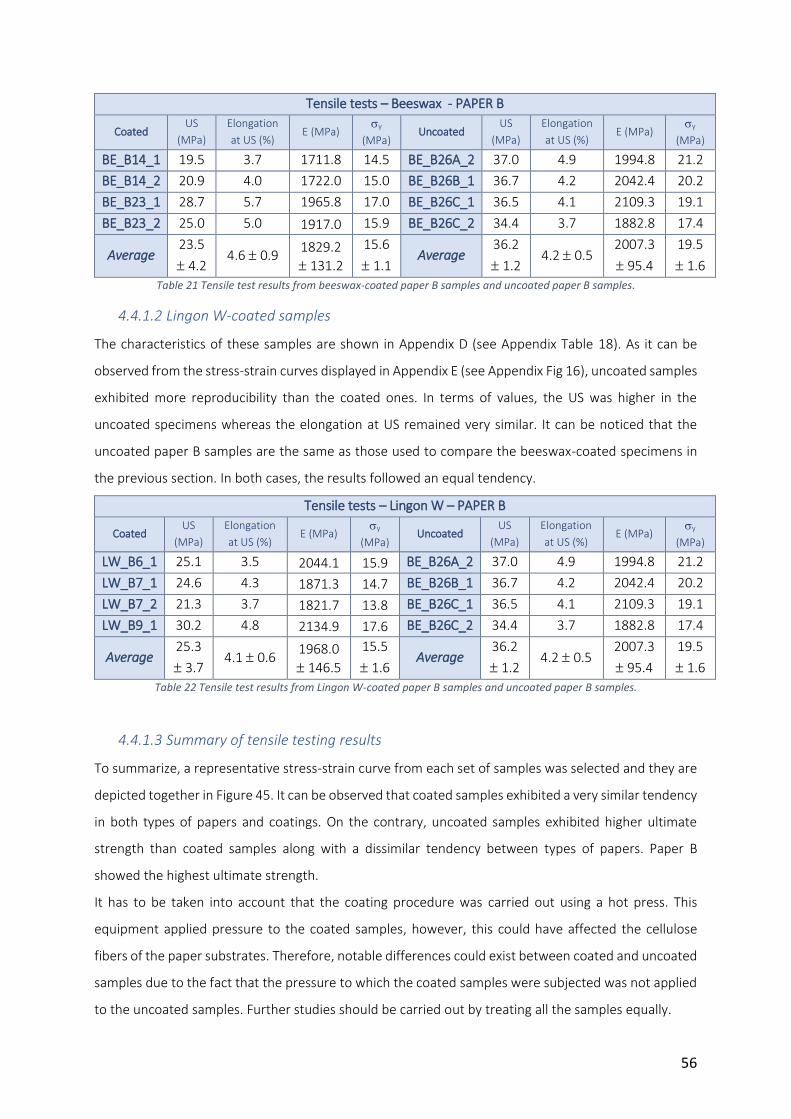
56
Tensile tests – Beeswax - PAPER B
Coated US
(MPa)
Elongation
at US (%) E (MPa)
y
(MPa) Uncoated
US
(MPa)
Elongation
at US (%) E (MPa)
y
(MPa)
BE_B14_1 19.5 3.7 1711.8 14.5 BE_B26A_2 37.0 4.9 1994.8 21.2
BE_B14_2 20.9 4.0 1722.0 15.0 BE_B26B_1 36.7 4.2 2042.4 20.2
BE_B23_1 28.7 5.7 1965.8 17.0 BE_B26C_1 36.5 4.1 2109.3 19.1
BE_B23_2 25.0 5.0 1917.0 15.9 BE_B26C_2 34.4 3.7 1882.8 17.4
Average 23.5
4.2 4.6 0.9
1829.2
131.2
15.6
1.1 Average
36.2
1.2 4.2 0.5
2007.3
95.4
19.5
1.6
Table 21 Tensile test results from beeswax-coated paper B samples and uncoated paper B samples.
4.4.1.2 Lingon W-coated samples
The characteristics of these samples are shown in Appendix D (see Appendix Table 18). As it can be
observed from the stress-strain curves displayed in Appendix E (see Appendix Fig 16), uncoated samples
exhibited more reproducibility than the coated ones. In terms of values, the US was higher in the
uncoated specimens whereas the elongation at US remained very similar. It can be noticed that the
uncoated paper B samples are the same as those used to compare the beeswax-coated specimens in
the previous section. In both cases, the results followed an equal tendency.
Tensile tests – Lingon W – PAPER B
Coated US
(MPa)
Elongation
at US (%) E (MPa)
y
(MPa) Uncoated
US
(MPa)
Elongation
at US (%) E (MPa)
y
(MPa)
LW_B6_1 25.1 3.5 2044.1 15.9 BE_B26A_2 37.0 4.9 1994.8 21.2
LW_B7_1 24.6 4.3 1871.3 14.7 BE_B26B_1 36.7 4.2 2042.4 20.2
LW_B7_2 21.3 3.7 1821.7 13.8 BE_B26C_1 36.5 4.1 2109.3 19.1
LW_B9_1 30.2 4.8 2134.9 17.6 BE_B26C_2 34.4 3.7 1882.8 17.4
Average 25.3
3.7 4.1 0.6
1968.0
146.5
15.5
1.6 Average
36.2
1.2 4.2 0.5
2007.3
95.4
19.5
1.6
Table 22 Tensile test results from Lingon W-coated paper B samples and uncoated paper B samples.
4.4.1.3 Summary of tensile testing results
To summarize, a representative stress-strain curve from each set of samples was selected and they are
depicted together in Figure 45. It can be observed that coated samples exhibited a very similar tendency
in both types of papers and coatings. On the contrary, uncoated samples exhibited higher ultimate
strength than coated samples along with a dissimilar tendency between types of papers. Paper B
showed the highest ultimate strength.
It has to be taken into account that the coating procedure was carried out using a hot press. This
equipment applied pressure to the coated samples, however, this could have affected the cellulose
fibers of the paper substrates. Therefore, notable differences could exist between coated and uncoated
samples due to the fact that the pressure to which the coated samples were subjected was not applied
to the uncoated samples. Further studies should be carried out by treating all the samples equally.
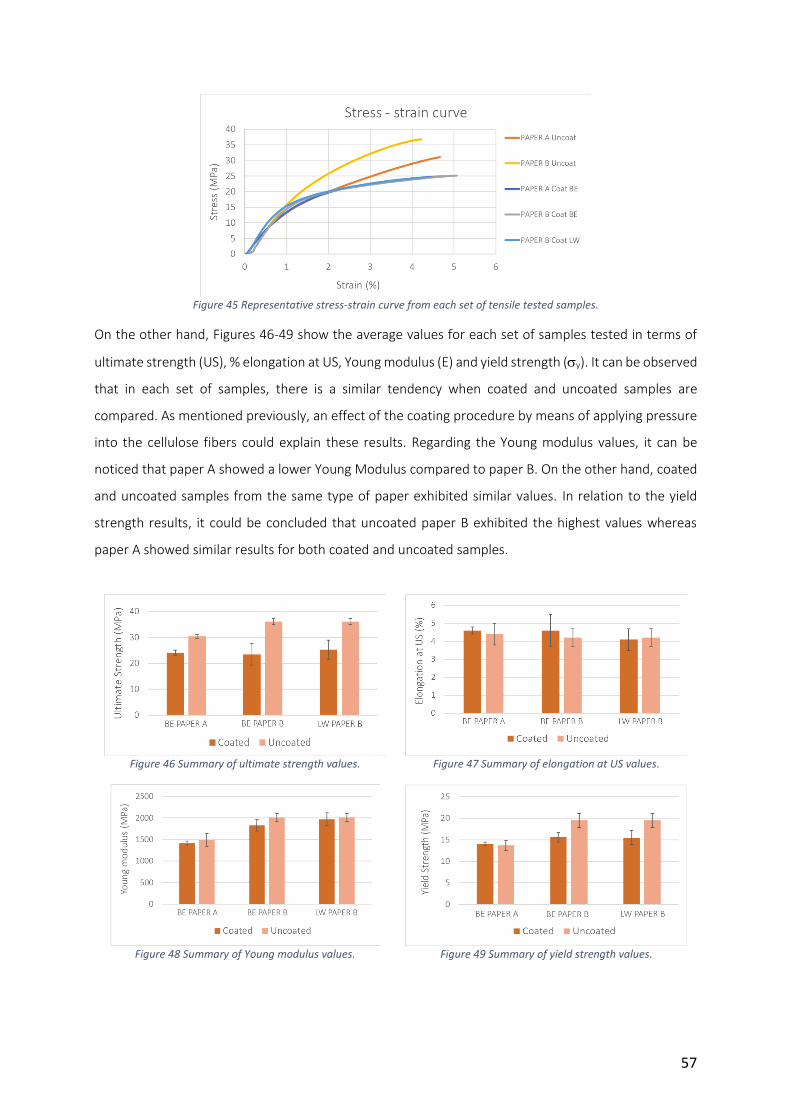
57
Figure 45 Representative stress-strain curve from each set of tensile tested samples.
On the other hand, Figures 46-49 show the average values for each set of samples tested in terms of
ultimate strength (US), % elongation at US, Young modulus (E) and yield strength (y). It can be observed
that in each set of samples, there is a similar tendency when coated and uncoated samples are
compared. As mentioned previously, an effect of the coating procedure by means of applying pressure
into the cellulose fibers could explain these results. Regarding the Young modulus values, it can be
noticed that paper A showed a lower Young Modulus compared to paper B. On the other hand, coated
and uncoated samples from the same type of paper exhibited similar values. In relation to the yield
strength results, it could be concluded that uncoated paper B exhibited the highest values whereas
paper A showed similar results for both coated and uncoated samples.
Figure 46 Summary of ultimate strength values.
Figure 47 Summary of elongation at US values.
Figure 48 Summary of Young modulus values.
Figure 49 Summary of yield strength values.
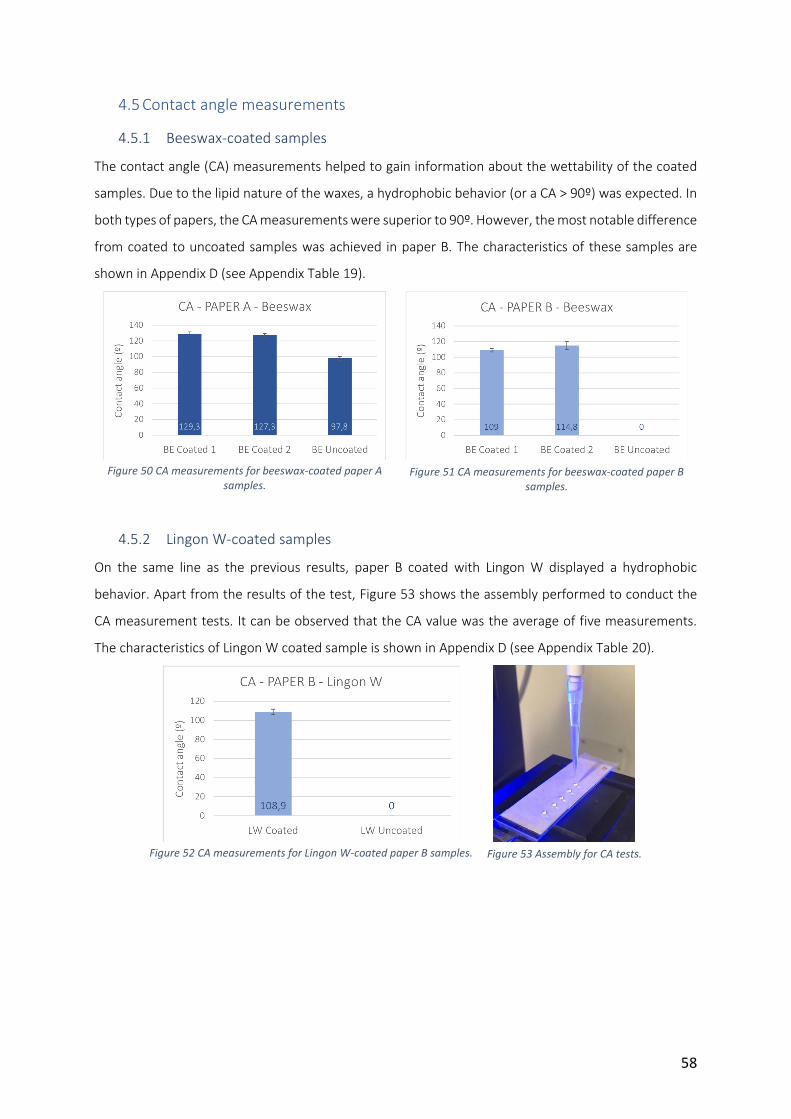
58
4.5 Contact angle measurements
4.5.1 Beeswax-coated samples
The contact angle (CA) measurements helped to gain information about the wettability of the coated
samples. Due to the lipid nature of the waxes, a hydrophobic behavior (or a CA > 90º) was expected. In
both types of papers, the CA measurements were superior to 90º. However, the most notable difference
from coated to uncoated samples was achieved in paper B. The characteristics of these samples are
shown in Appendix D (see Appendix Table 19).
Figure 50 CA measurements for beeswax-coated paper A
samples.
Figure 51 CA measurements for beeswax-coated paper B
samples.
4.5.2 Lingon W-coated samples
On the same line as the previous results, paper B coated with Lingon W displayed a hydrophobic
behavior. Apart from the results of the test, Figure 53 shows the assembly performed to conduct the
CA measurement tests. It can be observed that the CA value was the average of five measurements.
The characteristics of Lingon W coated sample is shown in Appendix D (see Appendix Table 20).
Figure 52 CA measurements for Lingon W-coated paper B samples.
Figure 53 Assembly for CA tests.

59
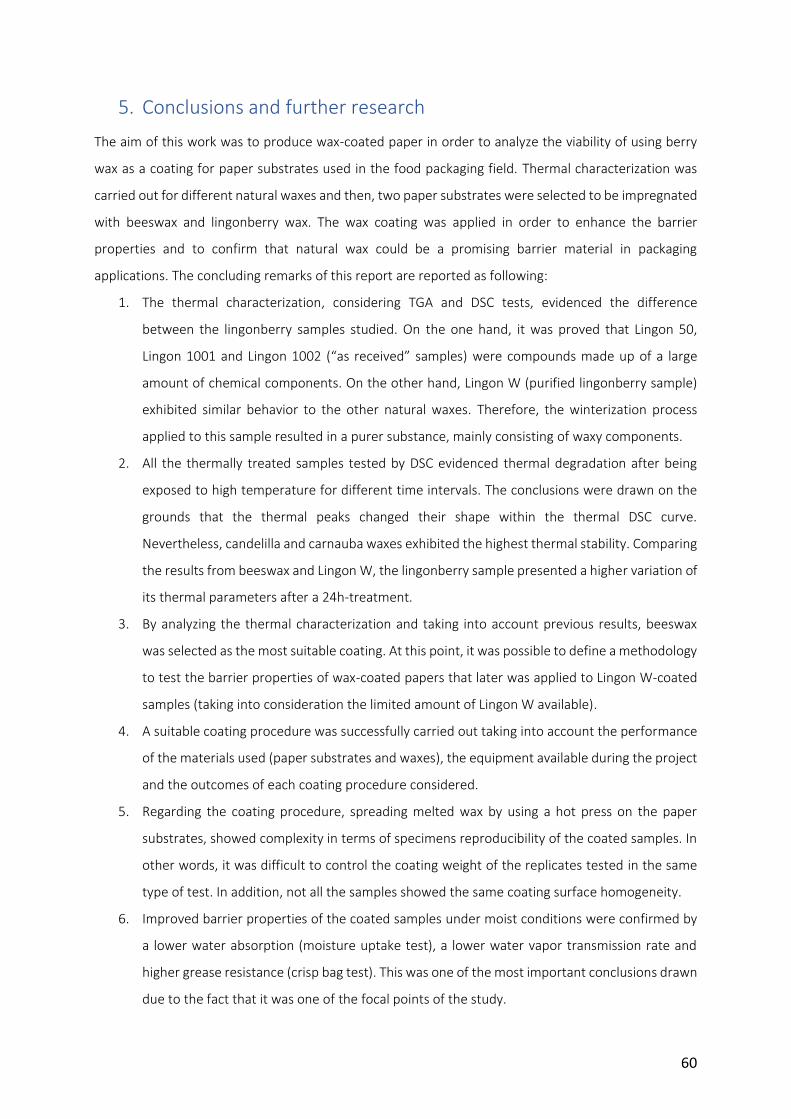
60
5. Conclusions and further research
The aim of this work was to produce wax-coated paper in order to analyze the viability of using berry
wax as a coating for paper substrates used in the food packaging field. Thermal characterization was
carried out for different natural waxes and then, two paper substrates were selected to be impregnated
with beeswax and lingonberry wax. The wax coating was applied in order to enhance the barrier
properties and to confirm that natural wax could be a promising barrier material in packaging
applications. The concluding remarks of this report are reported as following:
1. The thermal characterization, considering TGA and DSC tests, evidenced the difference
between the lingonberry samples studied. On the one hand, it was proved that Lingon 50,
Lingon 1001 and Lingon 1002 (“as received” samples) were compounds made up of a large
amount of chemical components. On the other hand, Lingon W (purified lingonberry sample)
exhibited similar behavior to the other natural waxes. Therefore, the winterization process
applied to this sample resulted in a purer substance, mainly consisting of waxy components.
2. All the thermally treated samples tested by DSC evidenced thermal degradation after being
exposed to high temperature for different time intervals. The conclusions were drawn on the
grounds that the thermal peaks changed their shape within the thermal DSC curve.
Nevertheless, candelilla and carnauba waxes exhibited the highest thermal stability. Comparing
the results from beeswax and Lingon W, the lingonberry sample presented a higher variation of
its thermal parameters after a 24h-treatment.
3. By analyzing the thermal characterization and taking into account previous results, beeswax
was selected as the most suitable coating. At this point, it was possible to define a methodology
to test the barrier properties of wax-coated papers that later was applied to Lingon W-coated
samples (taking into consideration the limited amount of Lingon W available).
4. A suitable coating procedure was successfully carried out taking into account the performance
of the materials used (paper substrates and waxes), the equipment available during the project
and the outcomes of each coating procedure considered.
5. Regarding the coating procedure, spreading melted wax by using a hot press on the paper
substrates, showed complexity in terms of specimens reproducibility of the coated samples. In
other words, it was difficult to control the coating weight of the replicates tested in the same
type of test. In addition, not all the samples showed the same coating surface homogeneity.
6. Improved barrier properties of the coated samples under moist conditions were confirmed by
a lower water absorption (moisture uptake test), a lower water vapor transmission rate and
higher grease resistance (crisp bag test). This was one of the most important conclusions drawn
due to the fact that it was one of the focal points of the study.
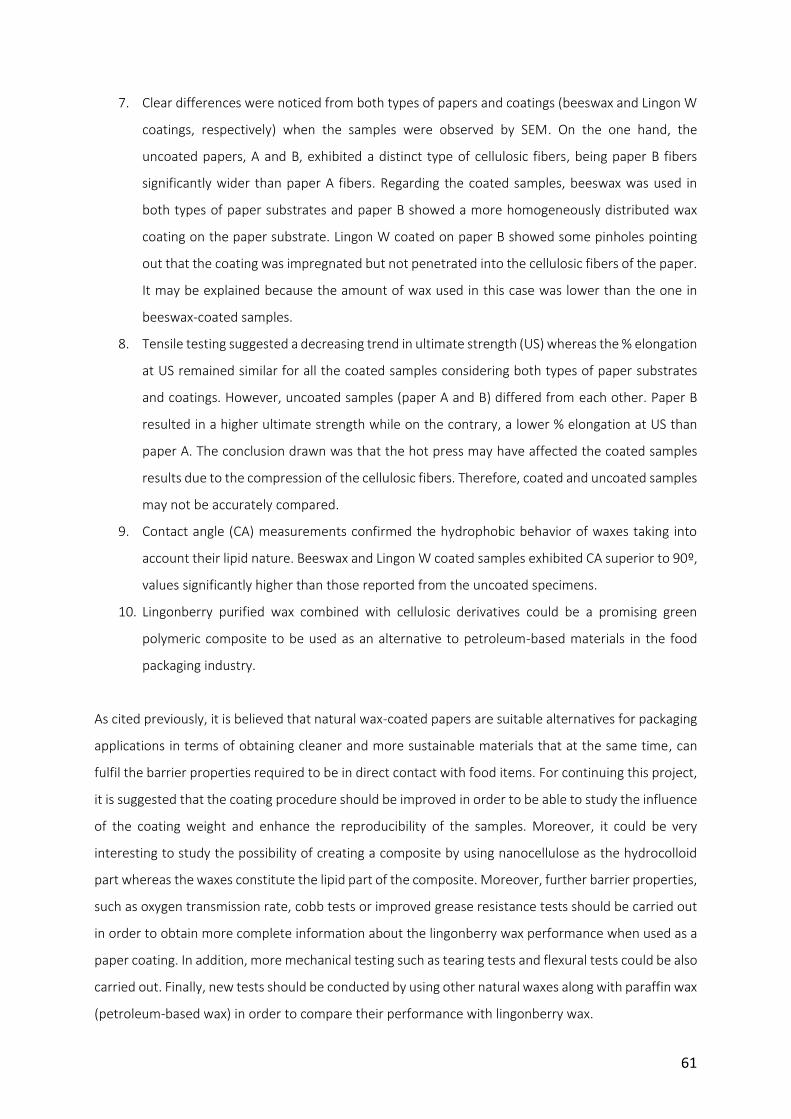
61
7. Clear differences were noticed from both types of papers and coatings (beeswax and Lingon W
coatings, respectively) when the samples were observed by SEM. On the one hand, the
uncoated papers, A and B, exhibited a distinct type of cellulosic fibers, being paper B fibers
significantly wider than paper A fibers. Regarding the coated samples, beeswax was used in
both types of paper substrates and paper B showed a more homogeneously distributed wax
coating on the paper substrate. Lingon W coated on paper B showed some pinholes pointing
out that the coating was impregnated but not penetrated into the cellulosic fibers of the paper.
It may be explained because the amount of wax used in this case was lower than the one in
beeswax-coated samples.
8. Tensile testing suggested a decreasing trend in ultimate strength (US) whereas the % elongation
at US remained similar for all the coated samples considering both types of paper substrates
and coatings. However, uncoated samples (paper A and B) differed from each other. Paper B
resulted in a higher ultimate strength while on the contrary, a lower % elongation at US than
paper A. The conclusion drawn was that the hot press may have affected the coated samples
results due to the compression of the cellulosic fibers. Therefore, coated and uncoated samples
may not be accurately compared.
9. Contact angle (CA) measurements confirmed the hydrophobic behavior of waxes taking into
account their lipid nature. Beeswax and Lingon W coated samples exhibited CA superior to 90º,
values significantly higher than those reported from the uncoated specimens.
10. Lingonberry purified wax combined with cellulosic derivatives could be a promising green
polymeric composite to be used as an alternative to petroleum-based materials in the food
packaging industry.
As cited previously, it is believed that natural wax-coated papers are suitable alternatives for packaging
applications in terms of obtaining cleaner and more sustainable materials that at the same time, can
fulfil the barrier properties required to be in direct contact with food items. For continuing this project,
it is suggested that the coating procedure should be improved in order to be able to study the influence
of the coating weight and enhance the reproducibility of the samples. Moreover, it could be very
interesting to study the possibility of creating a composite by using nanocellulose as the hydrocolloid
part whereas the waxes constitute the lipid part of the composite. Moreover, further barrier properties,
such as oxygen transmission rate, cobb tests or improved grease resistance tests should be carried out
in order to obtain more complete information about the lingonberry wax performance when used as a
paper coating. In addition, more mechanical testing such as tearing tests and flexural tests could be also
carried out. Finally, new tests should be conducted by using other natural waxes along with paraffin wax
(petroleum-based wax) in order to compare their performance with lingonberry wax.

62
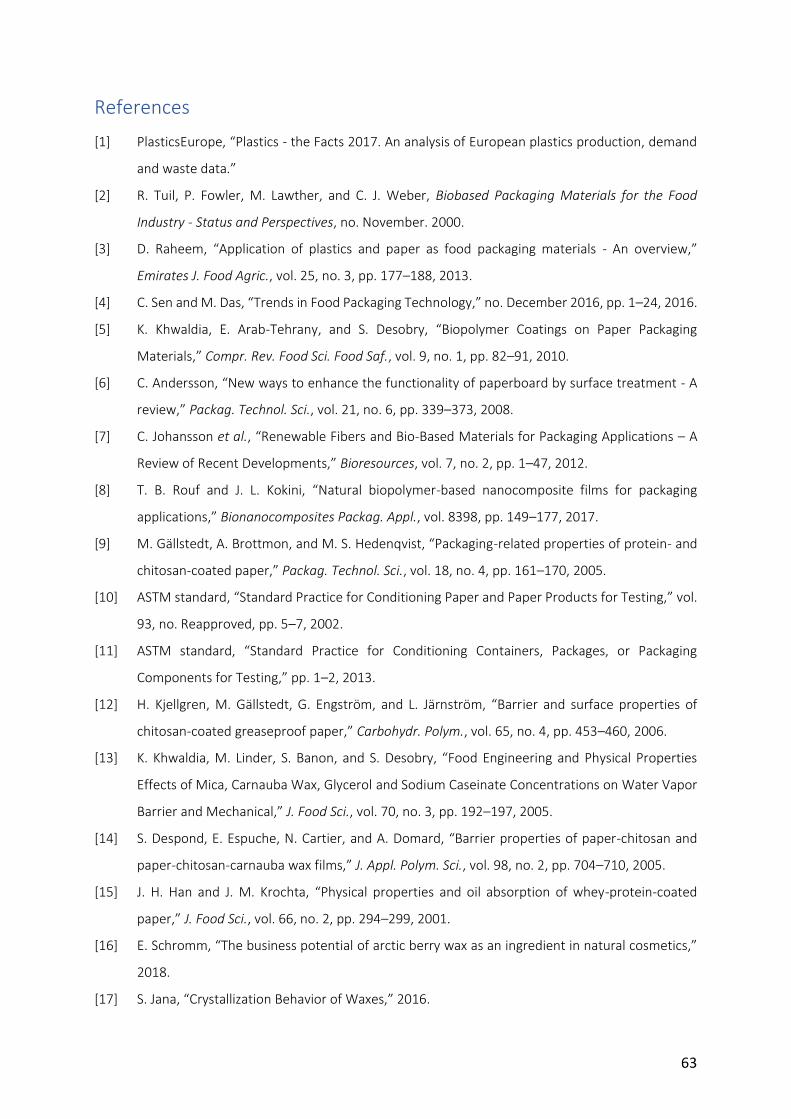
63
References
[1] PlasticsEurope, “Plastics - the Facts 2017. An analysis of European plastics production, demand
and waste data.”
[2] R. Tuil, P. Fowler, M. Lawther, and C. J. Weber, Biobased Packaging Materials for the Food
Industry - Status and Perspectives, no. November. 2000.
[3] D. Raheem, “Application of plastics and paper as food packaging materials - An overview,”
Emirates J. Food Agric., vol. 25, no. 3, pp. 177–188, 2013.
[4] C. Sen and M. Das, “Trends in Food Packaging Technology,” no. December 2016, pp. 1–24, 2016.
[5] K. Khwaldia, E. Arab-Tehrany, and S. Desobry, “Biopolymer Coatings on Paper Packaging
Materials,” Compr. Rev. Food Sci. Food Saf., vol. 9, no. 1, pp. 82–91, 2010.
[6] C. Andersson, “New ways to enhance the functionality of paperboard by surface treatment - A
review,” Packag. Technol. Sci., vol. 21, no. 6, pp. 339–373, 2008.
[7] C. Johansson et al., “Renewable Fibers and Bio-Based Materials for Packaging Applications – A
Review of Recent Developments,” Bioresources, vol. 7, no. 2, pp. 1–47, 2012.
[8] T. B. Rouf and J. L. Kokini, “Natural biopolymer-based nanocomposite films for packaging
applications,” Bionanocomposites Packag. Appl., vol. 8398, pp. 149–177, 2017.
[9] M. Gällstedt, A. Brottmon, and M. S. Hedenqvist, “Packaging-related properties of protein- and
chitosan-coated paper,” Packag. Technol. Sci., vol. 18, no. 4, pp. 161–170, 2005.
[10] ASTM standard, “Standard Practice for Conditioning Paper and Paper Products for Testing,” vol.
93, no. Reapproved, pp. 5–7, 2002.
[11] ASTM standard, “Standard Practice for Conditioning Containers, Packages, or Packaging
Components for Testing,” pp. 1–2, 2013.
[12] H. Kjellgren, M. Gällstedt, G. Engström, and L. Järnström, “Barrier and surface properties of
chitosan-coated greaseproof paper,” Carbohydr. Polym., vol. 65, no. 4, pp. 453–460, 2006.
[13] K. Khwaldia, M. Linder, S. Banon, and S. Desobry, “Food Engineering and Physical Properties
Effects of Mica, Carnauba Wax, Glycerol and Sodium Caseinate Concentrations on Water Vapor
Barrier and Mechanical,” J. Food Sci., vol. 70, no. 3, pp. 192–197, 2005.
[14] S. Despond, E. Espuche, N. Cartier, and A. Domard, “Barrier properties of paper-chitosan and
paper-chitosan-carnauba wax films,” J. Appl. Polym. Sci., vol. 98, no. 2, pp. 704–710, 2005.
[15] J. H. Han and J. M. Krochta, “Physical properties and oil absorption of whey-protein-coated
paper,” J. Food Sci., vol. 66, no. 2, pp. 294–299, 2001.
[16] E. Schromm, “The business potential of arctic berry wax as an ingredient in natural cosmetics,”
2018.
[17] S. Jana, “Crystallization Behavior of Waxes,” 2016.
64
[18] A. Asperger, W. Engewald, and G. Fabian, “Analytical characterization of natural waxes
employing pyrolysis-gas chromatography-mass spectrometry,” vol. 50, pp. 103–115, 1999.
[19] K. Peleikis and E. Endlein, “Natural Waxes - Properties , Compositions and Applications,” Int. J.
Appl. Sci., vol. 4, pp. 1–8, 2011.
[20] S. Jana and S. Martini, “Phase Behavior of Binary Blends of Four Different Waxes,” J. Am. Oil
Chem. Soc., vol. 93, no. 4, pp. 543–554, 2016.
[21] S. Saucedo-Pompa et al., “Edible film based on candelilla wax to improve the shelf life and quality
of avocado,” Food Res. Int., vol. 42, no. 4, pp. 511–515, 2009.
[22] J. Milanovic, V. Manojlovic, S. Levic, N. Rajic, V. Nedovic, and B. Bugarski, “Microencapsulation
of flavors in carnauba wax,” Sensors, vol. 10, no. 1, pp. 901–912, 2010.
[23] I. Donhowe and O. Fennema, “Water vapour and oxygen permeability of wax films,” J. Am. Oil
Chem. Soc., vol. 70, no. 9, pp. 867–873, 1993.
[24] B. Ritter, J. Schulte, E. Schulte, and H. P. Thier, “Detection of coating waxes on apples by
differential scanning calorimetry,” Eur. Food Res. Technol., vol. 212, no. 5, pp. 603–607, 2001.
[25] T. Fei and T. Wang, “A review of recent development of sustainable waxes derived from
vegetable oils,” Curr. Opin. Food Sci., vol. 16, pp. 7–14, 2017.
[26] J. F. Toro-Vazquez, J. A. Morales-Rueda, E. Dibildox-Alvarado, M. Charó-Alonso, M. Alonzo-
Macias, and M. M. González-Chávez, “Thermal and textural properties of organogels developed
by candelilla wax in safflower oil,” JAOCS, J. Am. Oil Chem. Soc., vol. 84, no. 11, pp. 989–1000,
2007.
[27] T. Bourtoom, “Review Article Edible films and coatings : characteristics and properties,” Int. Food
Res. J., vol. 15, no. 3, pp. 237–248, 2008.
[28] L. Matthies, “Natural montan wax and its raffinates,” Eur. J. Lipid Sci. Technol., vol. 103, no. 4,
pp. 239–248, 2001.
[29] L. S. K. Dassanayake, D. R. Kodali, S. Ueno, and K. Sato, “Physical properties of rice bran wax in
bulk and organogels,” JAOCS, J. Am. Oil Chem. Soc., vol. 86, no. 12, pp. 1163–1173, 2009.
[30] Y. Gaillard, A. Mija, A. Burr, E. Darque-Ceretti, E. Felder, and N. Sbirrazzuoli, “Green material
composites from renewable resources: Polymorphic transitions and phase diagram of
beeswax/rosin resin,” Thermochim. Acta, vol. 521, no. 1–2, pp. 90–97, 2011.
[31] C. Bargel, H., Koch, K., Cerman, Z., Neinhuis, “Structure-function relationships of the plant cuticle
and cuticular waxes - a smart material?,” Plant Biol., vol. 33, no. 3, p. 893–910., 2006.
[32] D. Kowalczyk and B. Baraniak, “Effect of candelilla wax on functional properties of biopolymer
emulsion films - A comparative study,” Food Hydrocoll., vol. 41, pp. 195–209, 2014.
[33] V. Alleyne and R. D. Hagenmaier, “Candelilla-shellac: An alternative formulation for coating
apples,” HortScience, vol. 35, no. 4, pp. 691–693, 2000.
65
[34] I. Basson and E. C. Reynhardt, “An Investigation of the Structures and Molecular-Dynamics of
Natural Waxes .2. Carnauba Wax,” J. Phys. D-Applied Phys., vol. 21, no. 9, pp. 1429–1433, 1988.
[35] H. Zheng, R. Zhang, H. Zhang, Y. Feng, K. Li, and W. Zhang, “Thermal analysis of four insect waxes
based on differential scanning calorimetry (DSC),” Procedia Eng., vol. 18, pp. 101–106, 2011.
[36] L. E. Vandenburg and E. A. Wilder, “The structural constituents of carnauba wax,” J. Am. Oil
Chem. Soc., vol. 47, no. 12, pp. 514–518, 1970.
[37] A. Michalska and G. Łysiak, “Bioactive compounds of blueberries: Post-harvest factors
influencing the nutritional value of products,” Int. J. Mol. Sci., vol. 16, no. 8, pp. 18642–18663,
2015.
[38] W. Chu, H. Gao, S. Cao, X. Fang, H. Chen, and S. Xiao, “Composition and morphology of cuticular
wax in blueberry (Vaccinium spp.) fruits,” Food Chem., vol. 253, p. 322, 2018.
[39] “Arktiset Aromit.” [Online]. Available: https://www.arktisetaromit.fi/en/berries/. [Accessed: 26-
Sep-2018].
[40] “Marketing Potential of a New Ingredient – Arctic Berry Wax – for Natural and Organic Cosmetics
Industry – Oamkin blogi.” [Online]. Available: https://blogi.oamk.fi/2018/09/21/marketing-
potential-of-a-new-ingredient-arctic-berry-wax-for-natural-and-organic-cosmetics-industry/.
[Accessed: 26-Sep-2018].
[41] P. Cao, “Business potential of arctic berry wax for cosmetics in the United Kingdom,” 2018.
[42] R. Buchwald, M. D. Breed, and A. R. Greenberg, “The thermal properties of beeswaxes:
unexpected findings,” J. Exp. Biol., vol. 211, no. 1, pp. 121–127, 2008.
[43] L. Yao, J. Lio, T. Wang, and D. H. Jarboe, “Synthesis and characterization of acetylated and
stearylyzed soy wax,” JAOCS, J. Am. Oil Chem. Soc., vol. 90, no. 7, pp. 1063–1071, 2013.
[44] I. Basson and E. C. Reynhardt, “An investigation of the structures and molecular dynamics of
natural waxes. I. Beeswax,” J. Phys. D. Appl. Phys., vol. 21, no. 9, pp. 1421–1428, 1988.
[45] M. Ribas, “Characterisation of natural berry wax for use in technical applications,” no. December,
2018.
[46] M. Paassilta, S. Moisio, L. Jaakola, H. Häggman, and Oulu University press, “Voice of the Nordic
wild berry industry. A survey among the companies,” p. 84, 2009.
[47] L. Jaakola, I. Martinussen, and U. Oskarsson, “Nordic Bilberry Project,” no. January, 2009.
[48] P. Inc, “Thermogravimetric Analysis (TGA).”
[49] K. KV, A. SR, Y. PR, P. RY, and B. VU, “Differential Scanning Calorimetry: A Review.,” Res. Rev. J.
Pharm. Anal., vol. 3, no. 3, pp. 11–22, 2014.
[50] ASTM-D3418, “Standard Test Method for Transition Temperatures and Enthalpies of Fusion and
Crystallization of Polymers by Differential Scanning Calorimetry,” ASTM Int., pp. 1–7, 2012.
[51] ASTM, “Standard Test Method for Measurement of Transition Temperatures of Petroleum
66
Waxes by Differential Scanning Calorimetry ( DSC ),” Astm, vol. 08, no. Reapproved, pp. 1–4,
2015.
[52] N. Doroudgarian, “Nanocomposite Films of Hemicellulose and Nanocelluloses with Improved
Barrier Properties for Packaging Applications.”
[53] C. Aulin, M. Gällstedt, and T. Lindström, “Oxygen and oil barrier properties of microfibrillated
cellulose films and coatings,” Cellulose, vol. 17, no. 3, pp. 559–574, 2010.
[54] C. D. Division et al., “Water resistance and mechanical properties of biopolymer (alginate and
soy protein) coated paperboards,” Carbohydr. Polym., vol. 63, no. 3, pp. 575–586, 2003.
[55] W. Zhang, H. Xiao, and L. Qian, “Beeswax-chitosan emulsion coated paper with enhanced water
vapor barrier efficiency,” Appl. Surf. Sci., vol. 300, pp. 80–85, 2014.
[56] C. Tambe, D. Graiver, and R. Narayan, “Moisture resistance coating of packaging paper from
biobased silylated soybean oil,” Prog. Org. Coatings, vol. 101, pp. 270–278, 2016.
[57] J. W. Rhim, J. H. Lee, and S. I. Hong, “Increase in water resistance of paperboard by coating with
poly(lactide),” Packag. Technol. Sci., vol. 20, no. 6, pp. 393–402, 2007.
[58] K. Khwaldia, “Water Vapor Barrier And Mechanical Properties Of Paper-Sodium Caseinate And
Paper-Sodium Caseinate-Paraffin Wax Films,” J. Food Biochem., vol. 34, no. 5, pp. 998–1013,
2010.
[59] E. Bugnicourt et al., “Processing and validation of whey-protein-coated films and laminates at
semi-industrial scale as novel recyclable food packaging materials with excellent barrier
properties,” Adv. Mater. Sci. Eng., vol. 2013, 2013.
[60] A. B. Reis, C. M. P. Yoshida, A. P. C. Reis, and T. T. Franco, “Application of chitosan emulsion as a
coating on Kraft paper,” Polym. Int., vol. 60, no. 6, pp. 963–969, 2011.
[61] S. Y. Lin and J. M. Krochta, “Plasticizer effect on grease barrier and color properties of whey-
protein coatings on paperboard,” J. Food Sci., vol. 68, no. 1, pp. 229–233, 2003.
[62] J. P. Reddy and J. W. Rhim, “Characterization of bionanocomposite films prepared with agar and
paper-mulberry pulp nanocellulose,” Carbohydr. Polym., vol. 110, pp. 480–488, 2014.
[63] F. D. S. Larotonda, K. S. Matsui, S. S. Paes, and J. B. Laurindo, “Impregnation of Kraft paper with
cassava-starch acetate - Analysis of the tensile strength, water absorption and water vapor
permeability,” Starch/Staerke, vol. 55, no. 11, pp. 504–510, 2003.
[64] E. L. Hult, M. Iotti, and M. Lenes, “Efficient approach to high barrier packaging using microfibrillar
cellulose and shellac,” Cellulose, vol. 17, no. 3, pp. 575–586, 2010.
[65] K. Khwaldia, A. H. Basta, H. Aloui, and H. El-Saied, “Chitosan-caseinate bilayer coatings for paper
packaging materials,” Carbohydr. Polym., vol. 99, no. 2014, pp. 508–516, 2014.
[66] N. Bordenave, S. Grelier, F. Pichavant, and V. Coma, “Water and moisture susceptibility of
chitosan and paper-based materials: Structure-property relationships,” J. Agric. Food Chem., vol.
67
55, no. 23, pp. 9479–9488, 2007.
[67] “Wild bilberries and cultivated blueberries | Arctic Bilberry.” [Online]. Available:
https://www.arcticbilberry.fi/en/. [Accessed: 26-Sep-2018].
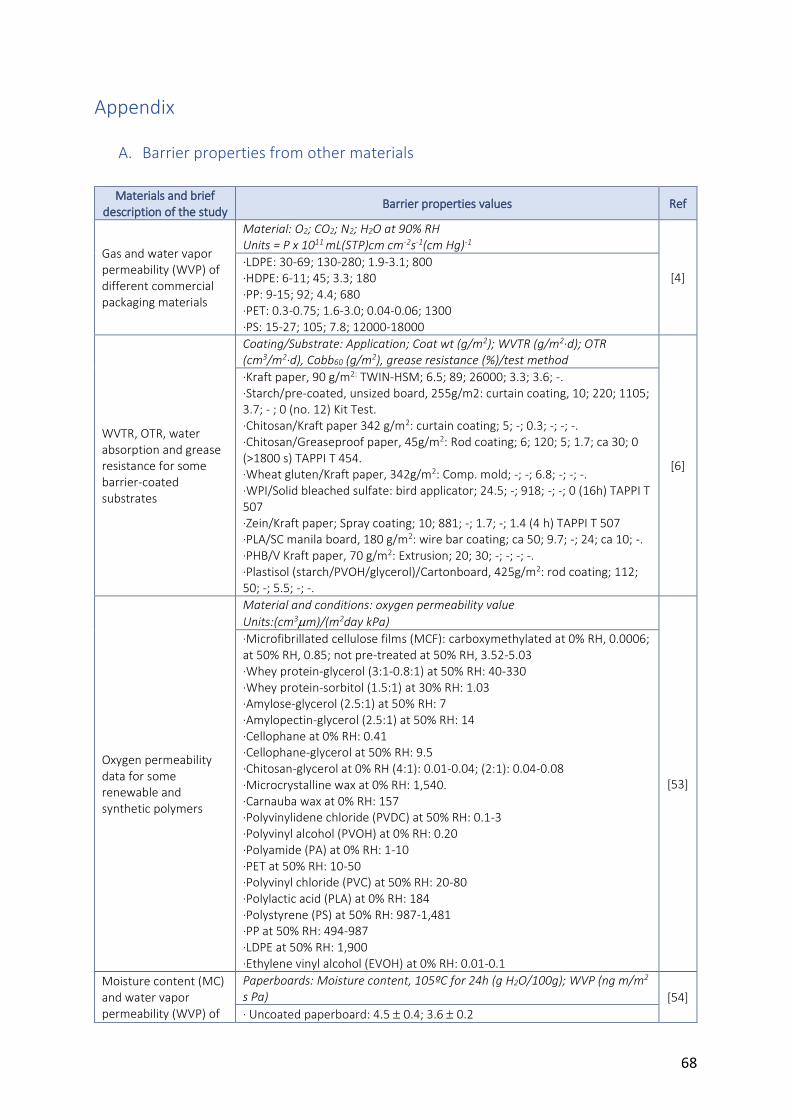
68
Appendix
A. Barrier properties from other materials
Materials and brief
description of the study Barrier properties values Ref
Gas and water vapor permeability (WVP) of different commercial packaging materials
Material: O2; CO2; N2; H2O at 90% RH Units = P x 1011 mL(STP)cm cm-2s-1(cm Hg)-1
[4] ·LDPE: 30-69; 130-280; 1.9-3.1; 800 ·HDPE: 6-11; 45; 3.3; 180 ·PP: 9-15; 92; 4.4; 680 ·PET: 0.3-0.75; 1.6-3.0; 0.04-0.06; 1300 ·PS: 15-27; 105; 7.8; 12000-18000
WVTR, OTR, water absorption and grease resistance for some barrier-coated substrates
Coating/Substrate: Application; Coat wt (g/m2); WVTR (g/m2·d); OTR (cm3/m2·d), Cobb60 (g/m2), grease resistance (%)/test method
[6]
·Kraft paper, 90 g/m2: TWIN-HSM; 6.5; 89; 26000; 3.3; 3.6; -. ·Starch/pre-coated, unsized board, 255g/m2: curtain coating, 10; 220; 1105; 3.7; - ; 0 (no. 12) Kit Test. ·Chitosan/Kraft paper 342 g/m2: curtain coating; 5; -; 0.3; -; -; -. ·Chitosan/Greaseproof paper, 45g/m2: Rod coating; 6; 120; 5; 1.7; ca 30; 0 (>1800 s) TAPPI T 454. ·Wheat gluten/Kraft paper, 342g/m2: Comp. mold; -; -; 6.8; -; -; -. ·WPI/Solid bleached sulfate: bird applicator; 24.5; -; 918; -; -; 0 (16h) TAPPI T 507 ·Zein/Kraft paper; Spray coating; 10; 881; -; 1.7; -; 1.4 (4 h) TAPPI T 507 ·PLA/SC manila board, 180 g/m2: wire bar coating; ca 50; 9.7; -; 24; ca 10; -. ·PHB/V Kraft paper, 70 g/m2: Extrusion; 20; 30; -; -; -; -. ·Plastisol (starch/PVOH/glycerol)/Cartonboard, 425g/m2: rod coating; 112; 50; -; 5.5; -; -.
Oxygen permeability data for some renewable and synthetic polymers
Material and conditions: oxygen permeability value
Units:(cm3m)/(m2day kPa)
[53]
·Microfibrillated cellulose films (MCF): carboxymethylated at 0% RH, 0.0006; at 50% RH, 0.85; not pre-treated at 50% RH, 3.52-5.03 ·Whey protein-glycerol (3:1-0.8:1) at 50% RH: 40-330 ·Whey protein-sorbitol (1.5:1) at 30% RH: 1.03 ·Amylose-glycerol (2.5:1) at 50% RH: 7 ·Amylopectin-glycerol (2.5:1) at 50% RH: 14 ·Cellophane at 0% RH: 0.41 ·Cellophane-glycerol at 50% RH: 9.5 ·Chitosan-glycerol at 0% RH (4:1): 0.01-0.04; (2:1): 0.04-0.08 ·Microcrystalline wax at 0% RH: 1,540. ·Carnauba wax at 0% RH: 157 ·Polyvinylidene chloride (PVDC) at 50% RH: 0.1-3 ·Polyvinyl alcohol (PVOH) at 0% RH: 0.20 ·Polyamide (PA) at 0% RH: 1-10 ·PET at 50% RH: 10-50 ·Polyvinyl chloride (PVC) at 50% RH: 20-80 ·Polylactic acid (PLA) at 0% RH: 184 ·Polystyrene (PS) at 50% RH: 987-1,481 ·PP at 50% RH: 494-987 ·LDPE at 50% RH: 1,900 ·Ethylene vinyl alcohol (EVOH) at 0% RH: 0.01-0.1
Moisture content (MC) and water vapor permeability (WVP) of
Paperboards: Moisture content, 105ºC for 24h (g H2O/100g); WVP (ng m/m2
s Pa) [54]
· Uncoated paperboard: 4.5 0.4; 3.6 0.2
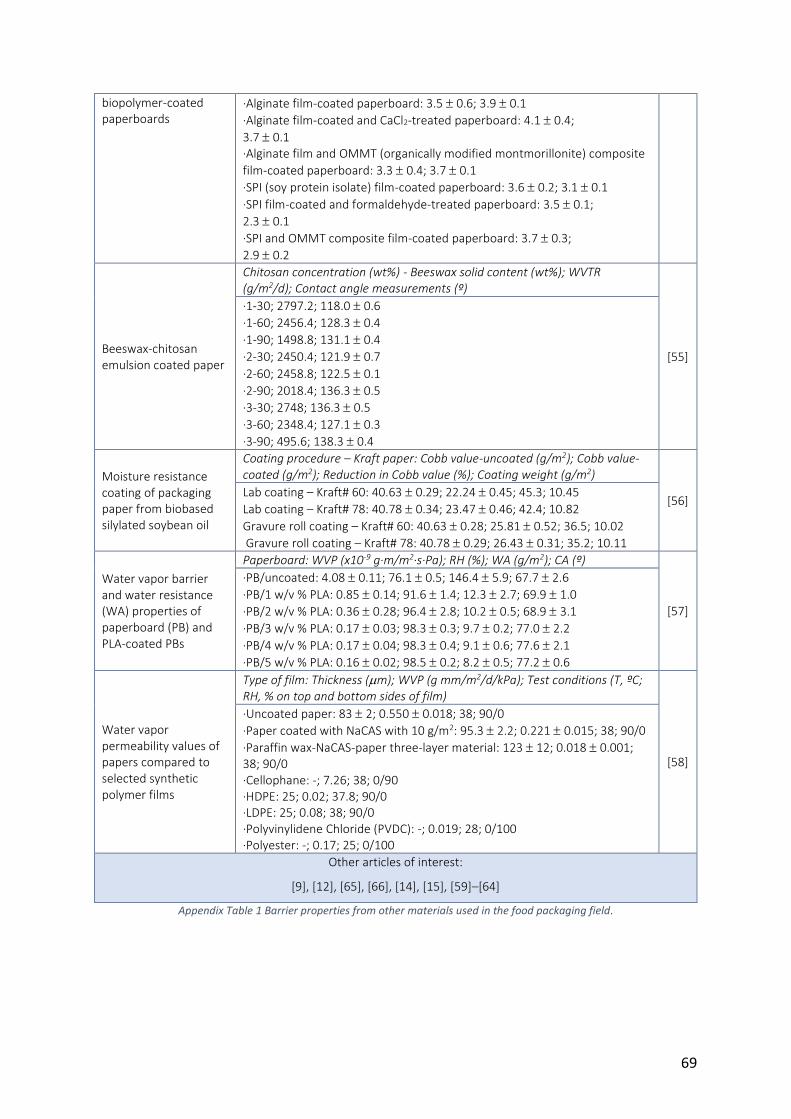
69
biopolymer-coated paperboards
·Alginate film-coated paperboard: 3.5 0.6; 3.9 0.1
·Alginate film-coated and CaCl2-treated paperboard: 4.1 0.4;
3.7 0.1 ·Alginate film and OMMT (organically modified montmorillonite) composite
film-coated paperboard: 3.3 0.4; 3.7 0.1
·SPI (soy protein isolate) film-coated paperboard: 3.6 0.2; 3.1 0.1
·SPI film-coated and formaldehyde-treated paperboard: 3.5 0.1;
2.3 0.1
·SPI and OMMT composite film-coated paperboard: 3.7 0.3;
2.9 0.2
Beeswax-chitosan emulsion coated paper
Chitosan concentration (wt%) - Beeswax solid content (wt%); WVTR (g/m2/d); Contact angle measurements (º)
[55]
·1-30; 2797.2; 118.0 0.6
·1-60; 2456.4; 128.3 0.4
·1-90; 1498.8; 131.1 0.4
·2-30; 2450.4; 121.9 0.7
·2-60; 2458.8; 122.5 0.1
·2-90; 2018.4; 136.3 0.5
·3-30; 2748; 136.3 0.5
·3-60; 2348.4; 127.1 0.3
·3-90; 495.6; 138.3 0.4
Moisture resistance coating of packaging paper from biobased silylated soybean oil
Coating procedure – Kraft paper: Cobb value-uncoated (g/m2); Cobb value-coated (g/m2); Reduction in Cobb value (%); Coating weight (g/m2)
[56] Lab coating – Kraft# 60: 40.63 0.29; 22.24 0.45; 45.3; 10.45
Lab coating – Kraft# 78: 40.78 0.34; 23.47 0.46; 42.4; 10.82
Gravure roll coating – Kraft# 60: 40.63 0.28; 25.81 0.52; 36.5; 10.02
Gravure roll coating – Kraft# 78: 40.78 0.29; 26.43 0.31; 35.2; 10.11
Water vapor barrier and water resistance (WA) properties of paperboard (PB) and PLA-coated PBs
Paperboard: WVP (x10-9 g·m/m2·s·Pa); RH (%); WA (g/m2); CA (º)
[57]
·PB/uncoated: 4.08 0.11; 76.1 0.5; 146.4 5.9; 67.7 2.6
·PB/1 w/v % PLA: 0.85 0.14; 91.6 1.4; 12.3 2.7; 69.9 1.0
·PB/2 w/v % PLA: 0.36 0.28; 96.4 2.8; 10.2 0.5; 68.9 3.1
·PB/3 w/v % PLA: 0.17 0.03; 98.3 0.3; 9.7 0.2; 77.0 2.2
·PB/4 w/v % PLA: 0.17 0.04; 98.3 0.4; 9.1 0.6; 77.6 2.1
·PB/5 w/v % PLA: 0.16 0.02; 98.5 0.2; 8.2 0.5; 77.2 0.6
Water vapor permeability values of papers compared to selected synthetic polymer films
Type of film: Thickness (m); WVP (g mm/m2/d/kPa); Test conditions (T, ºC; RH, % on top and bottom sides of film)
[58]
·Uncoated paper: 83 2; 0.550 0.018; 38; 90/0
·Paper coated with NaCAS with 10 g/m2: 95.3 2.2; 0.221 0.015; 38; 90/0
·Paraffin wax-NaCAS-paper three-layer material: 123 12; 0.018 0.001; 38; 90/0 ·Cellophane: -; 7.26; 38; 0/90 ·HDPE: 25; 0.02; 37.8; 90/0 ·LDPE: 25; 0.08; 38; 90/0 ·Polyvinylidene Chloride (PVDC): -; 0.019; 28; 0/100 ·Polyester: -; 0.17; 25; 0/100
Other articles of interest:
[9], [12], [65], [66], [14], [15], [59]–[64]
Appendix Table 1 Barrier properties from other materials used in the food packaging field.
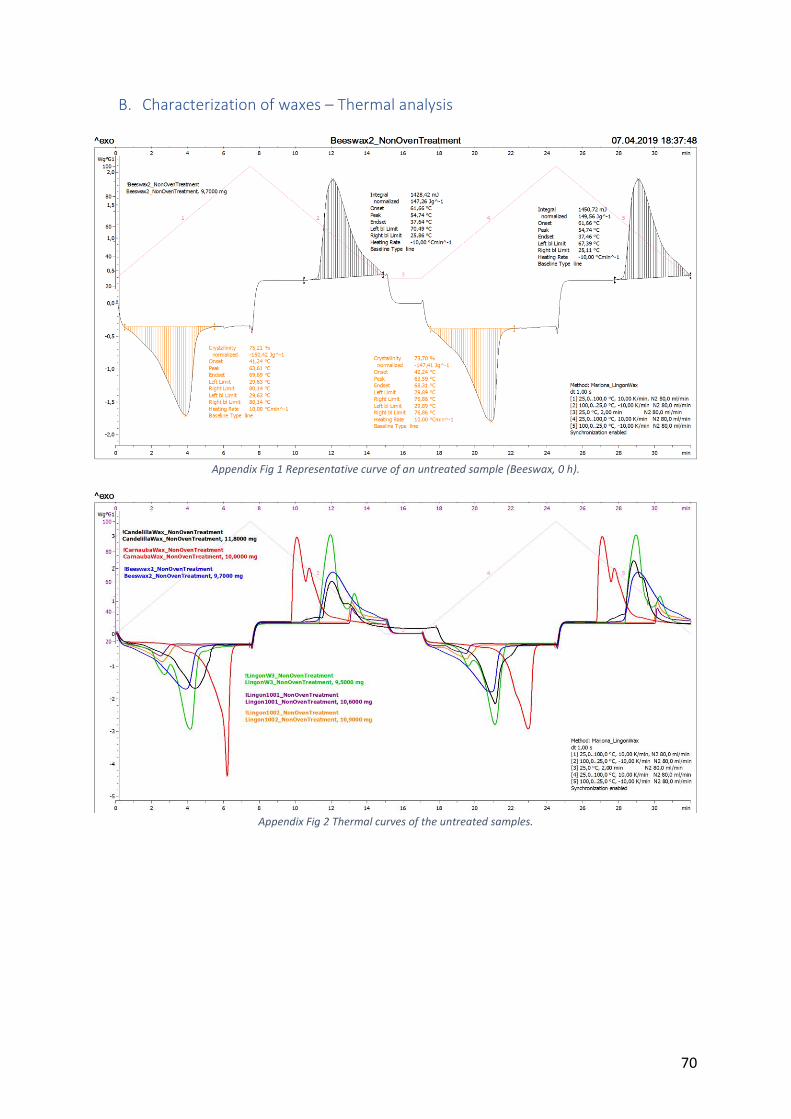
70
B. Characterization of waxes – Thermal analysis
Appendix Fig 1 Representative curve of an untreated sample (Beeswax, 0 h).
Appendix Fig 2 Thermal curves of the untreated samples.
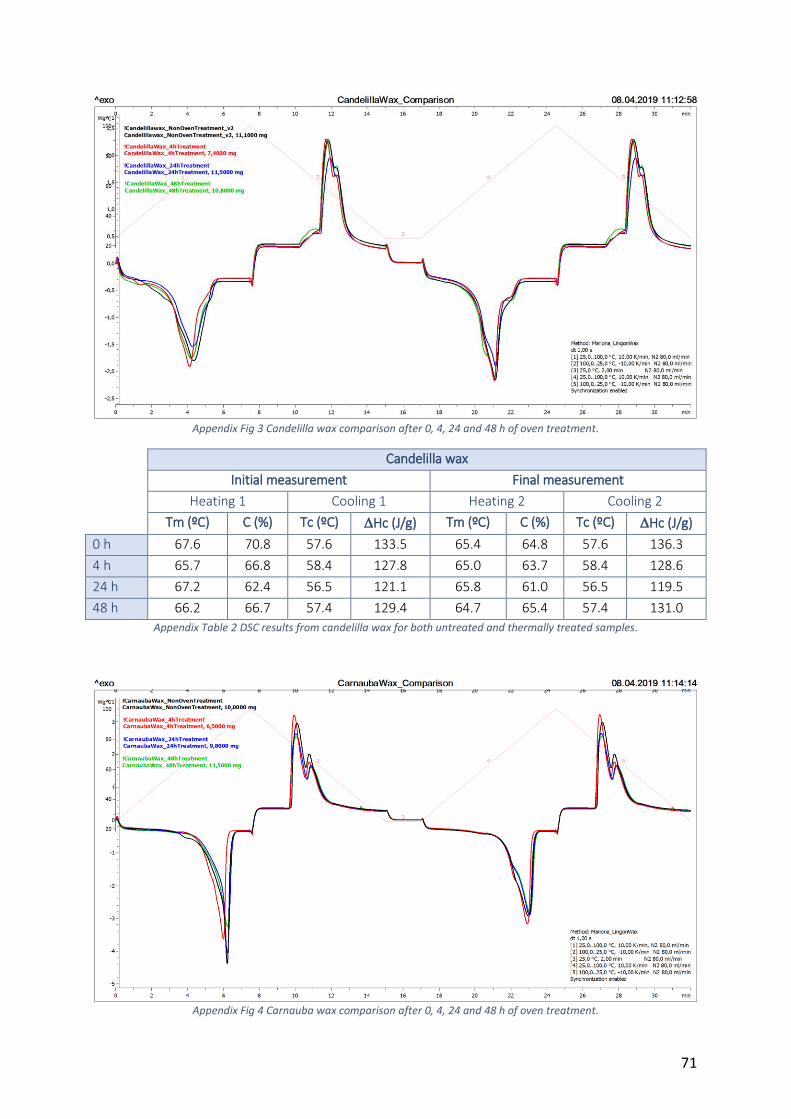
71
Appendix Fig 3 Candelilla wax comparison after 0, 4, 24 and 48 h of oven treatment.
Candelilla wax
Initial measurement Final measurement
Heating 1 Cooling 1 Heating 2 Cooling 2
Tm (ºC) C (%) Tc (ºC) Hc (J/g) Tm (ºC) C (%) Tc (ºC) Hc (J/g)
0 h 67.6 70.8 57.6 133.5 65.4 64.8 57.6 136.3
4 h 65.7 66.8 58.4 127.8 65.0 63.7 58.4 128.6
24 h 67.2 62.4 56.5 121.1 65.8 61.0 56.5 119.5
48 h 66.2 66.7 57.4 129.4 64.7 65.4 57.4 131.0
Appendix Table 2 DSC results from candelilla wax for both untreated and thermally treated samples.
Appendix Fig 4 Carnauba wax comparison after 0, 4, 24 and 48 h of oven treatment.
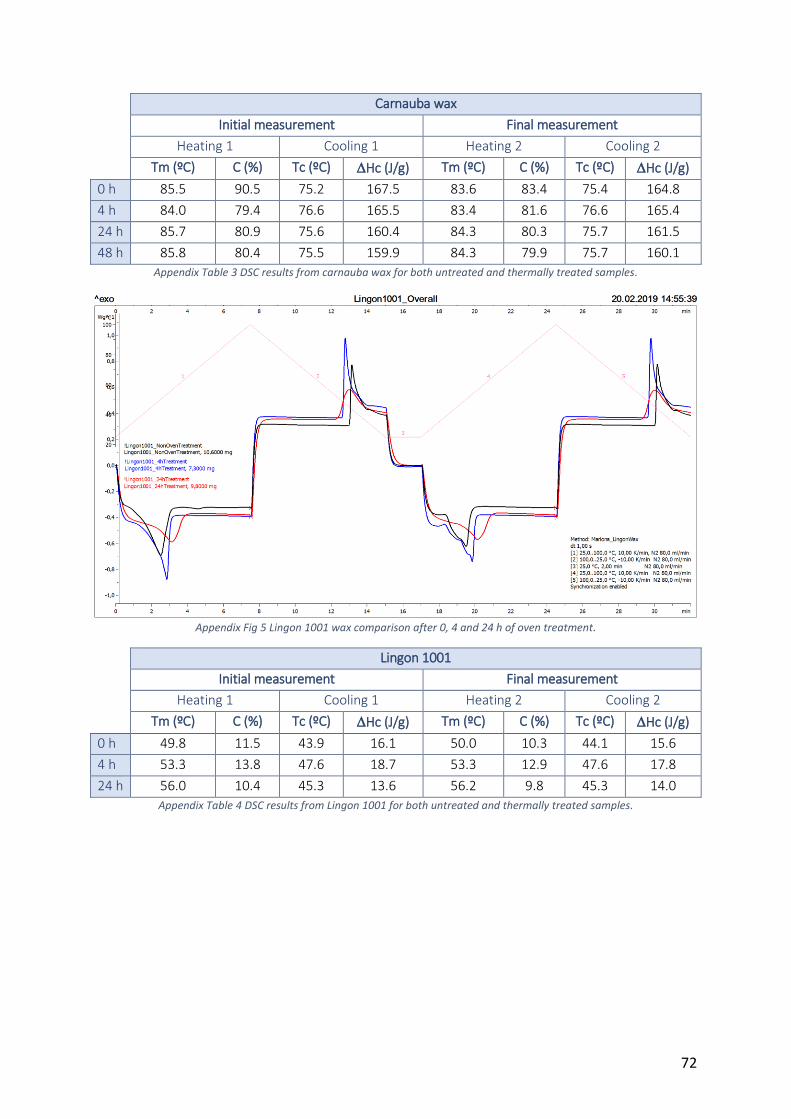
72
Carnauba wax
Initial measurement Final measurement
Heating 1 Cooling 1 Heating 2 Cooling 2
Tm (ºC) C (%) Tc (ºC) Hc (J/g) Tm (ºC) C (%) Tc (ºC) Hc (J/g)
0 h 85.5 90.5 75.2 167.5 83.6 83.4 75.4 164.8
4 h 84.0 79.4 76.6 165.5 83.4 81.6 76.6 165.4
24 h 85.7 80.9 75.6 160.4 84.3 80.3 75.7 161.5
48 h 85.8 80.4 75.5 159.9 84.3 79.9 75.7 160.1
Appendix Table 3 DSC results from carnauba wax for both untreated and thermally treated samples.
Appendix Fig 5 Lingon 1001 wax comparison after 0, 4 and 24 h of oven treatment.
Lingon 1001
Initial measurement Final measurement
Heating 1 Cooling 1 Heating 2 Cooling 2
Tm (ºC) C (%) Tc (ºC) Hc (J/g) Tm (ºC) C (%) Tc (ºC) Hc (J/g)
0 h 49.8 11.5 43.9 16.1 50.0 10.3 44.1 15.6
4 h 53.3 13.8 47.6 18.7 53.3 12.9 47.6 17.8
24 h 56.0 10.4 45.3 13.6 56.2 9.8 45.3 14.0
Appendix Table 4 DSC results from Lingon 1001 for both untreated and thermally treated samples.
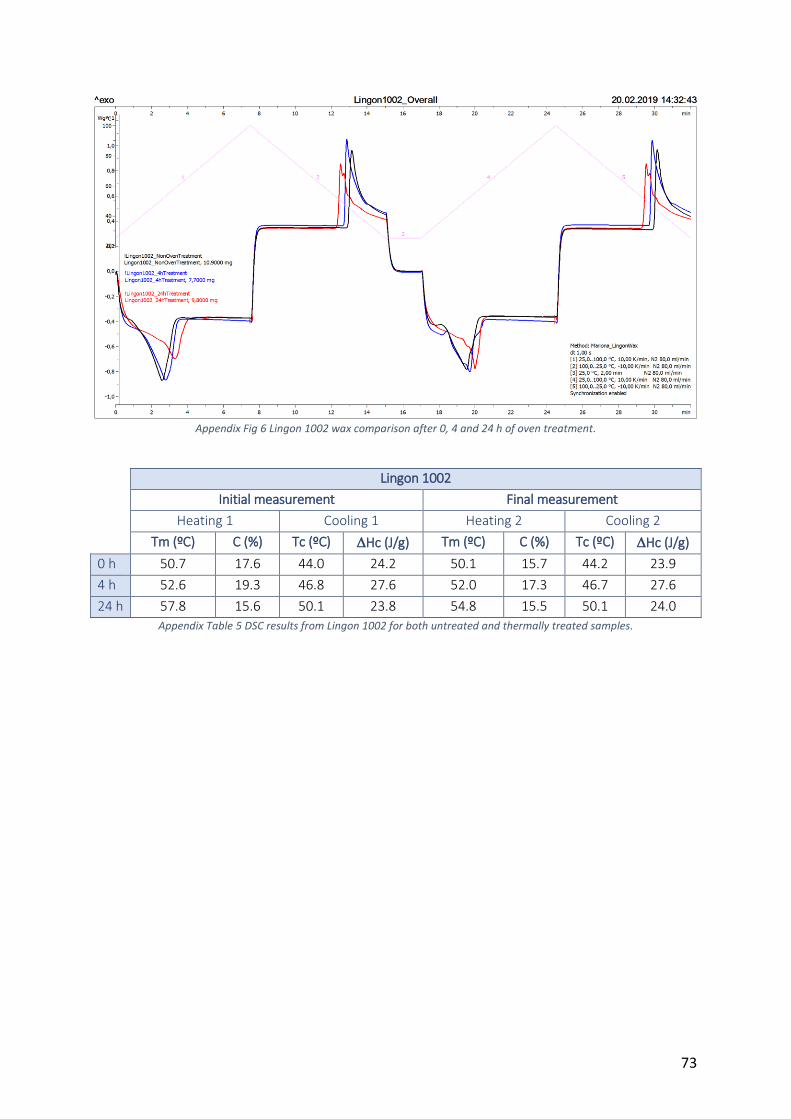
73
Appendix Fig 6 Lingon 1002 wax comparison after 0, 4 and 24 h of oven treatment.
Lingon 1002
Initial measurement Final measurement
Heating 1 Cooling 1 Heating 2 Cooling 2
Tm (ºC) C (%) Tc (ºC) Hc (J/g) Tm (ºC) C (%) Tc (ºC) Hc (J/g)
0 h 50.7 17.6 44.0 24.2 50.1 15.7 44.2 23.9
4 h 52.6 19.3 46.8 27.6 52.0 17.3 46.7 27.6
24 h 57.8 15.6 50.1 23.8 54.8 15.5 50.1 24.0
Appendix Table 5 DSC results from Lingon 1002 for both untreated and thermally treated samples.
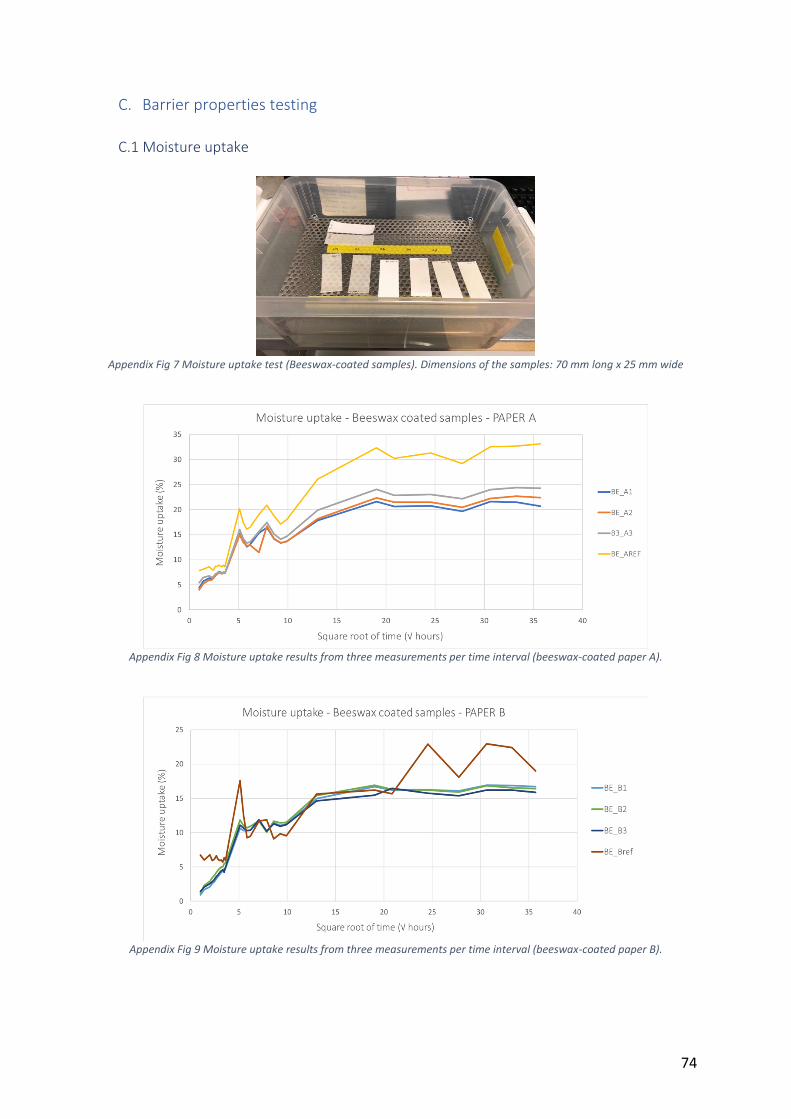
74
C. Barrier properties testing
C.1 Moisture uptake
Appendix Fig 7 Moisture uptake test (Beeswax-coated samples). Dimensions of the samples: 70 mm long x 25 mm wide
Appendix Fig 8 Moisture uptake results from three measurements per time interval (beeswax-coated paper A).
Appendix Fig 9 Moisture uptake results from three measurements per time interval (beeswax-coated paper B).
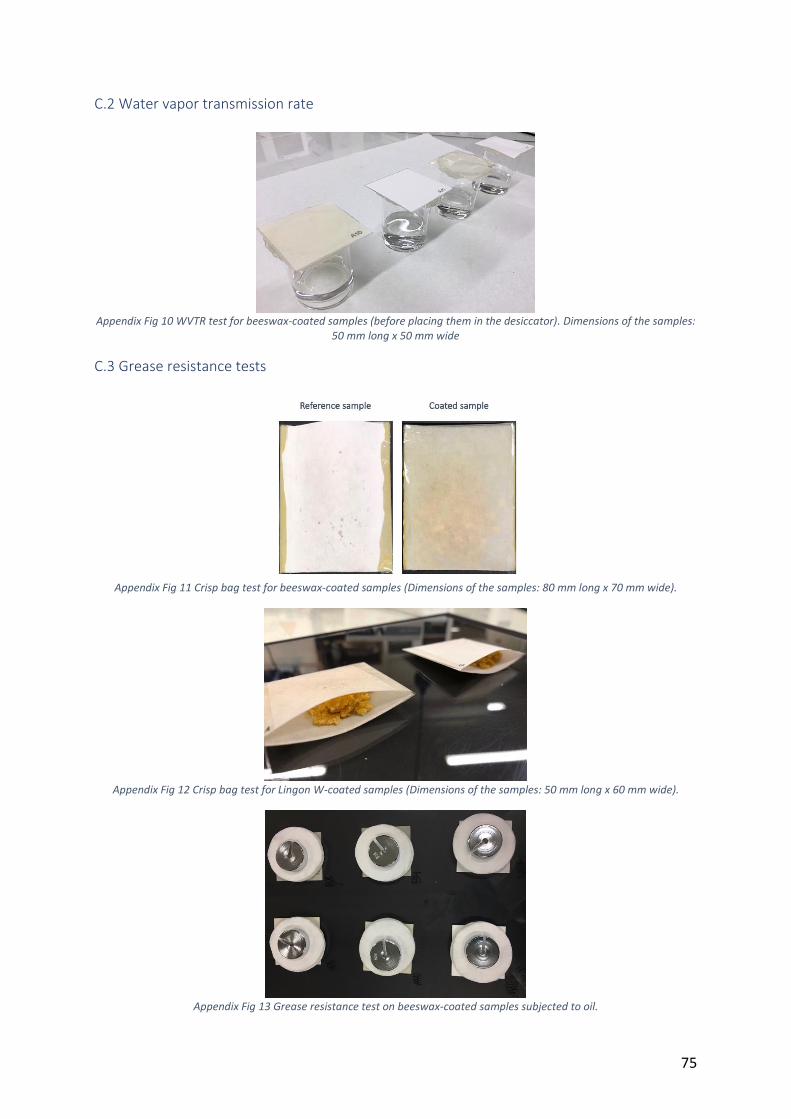
75
C.2 Water vapor transmission rate
Appendix Fig 10 WVTR test for beeswax-coated samples (before placing them in the desiccator). Dimensions of the samples:
50 mm long x 50 mm wide
C.3 Grease resistance tests
Appendix Fig 11 Crisp bag test for beeswax-coated samples (Dimensions of the samples: 80 mm long x 70 mm wide).
Appendix Fig 12 Crisp bag test for Lingon W-coated samples (Dimensions of the samples: 50 mm long x 60 mm wide).
Appendix Fig 13 Grease resistance test on beeswax-coated samples subjected to oil.
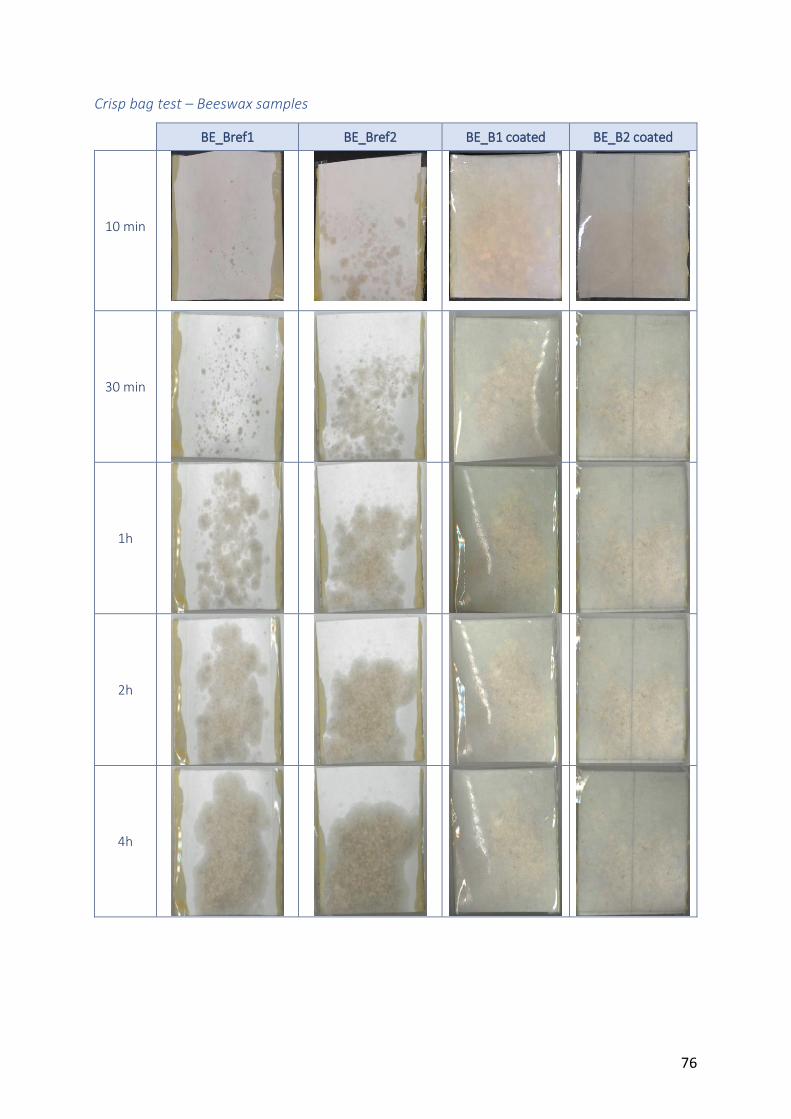
76
Crisp bag test – Beeswax samples
BE_Bref1 BE_Bref2 BE_B1 coated BE_B2 coated
10 min
30 min
1h
2h
4h
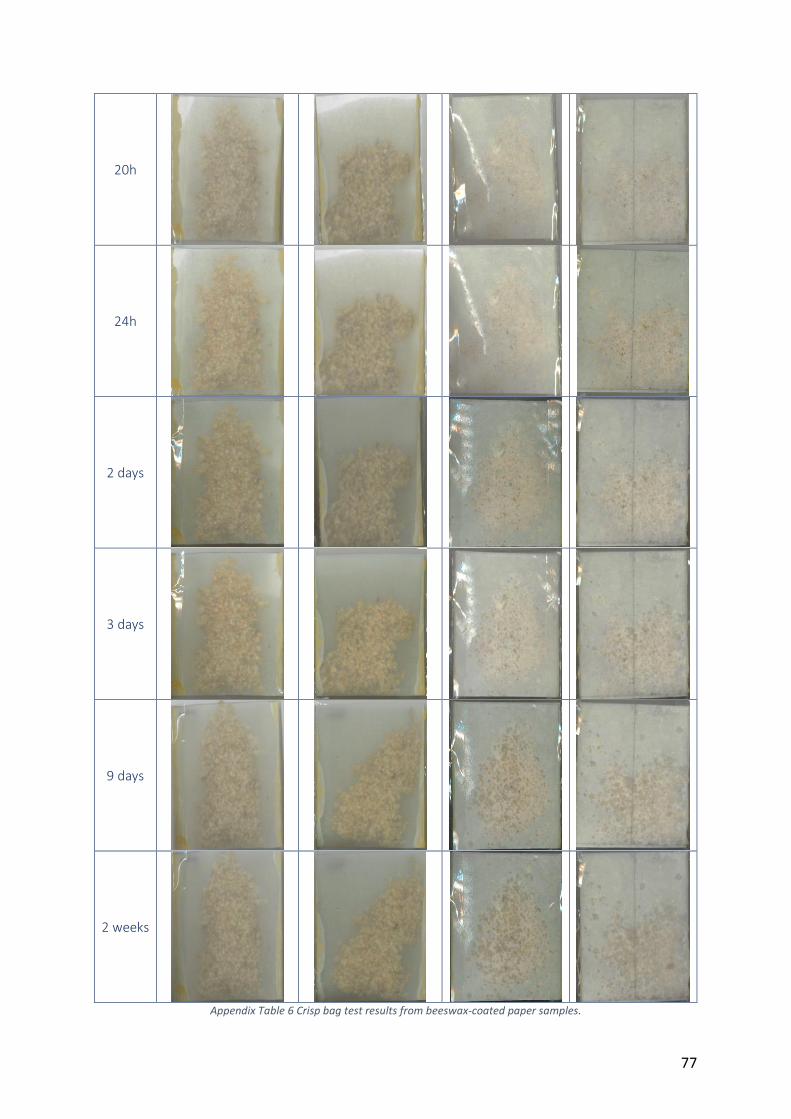
77
20h
24h
2 days
3 days
9 days
2 weeks
Appendix Table 6 Crisp bag test results from beeswax-coated paper samples.
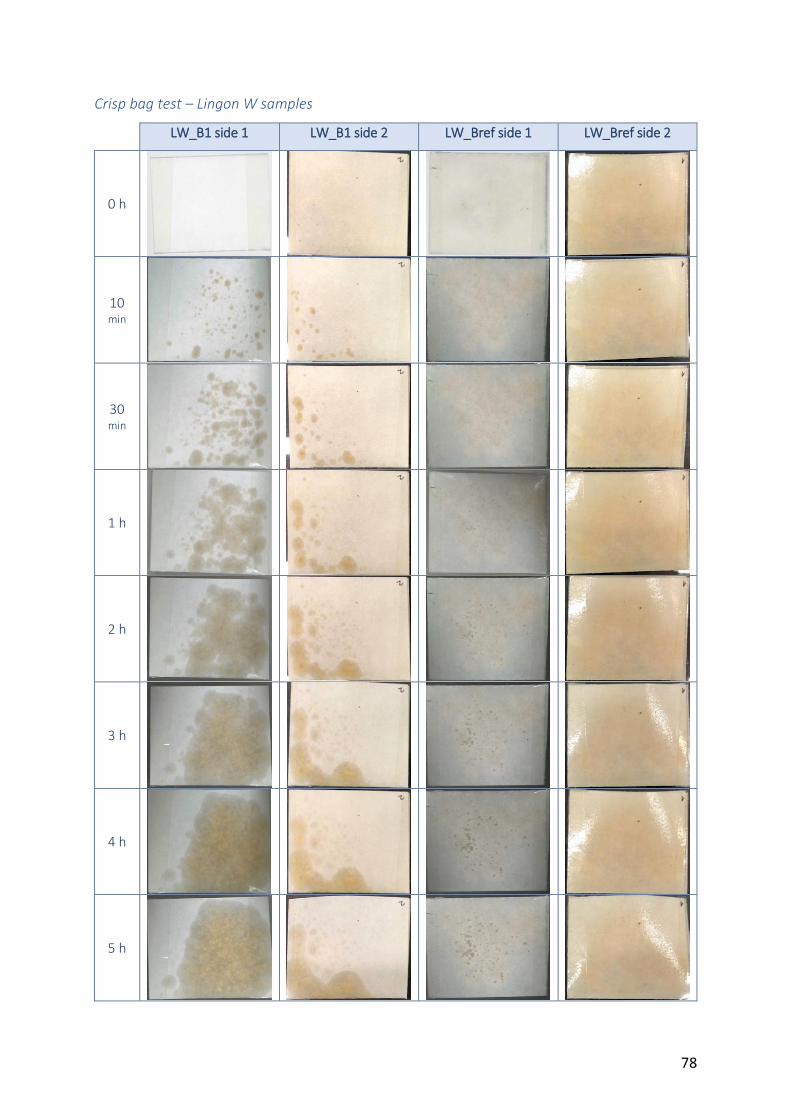
78
Crisp bag test – Lingon W samples
LW_B1 side 1 LW_B1 side 2 LW_Bref side 1 LW_Bref side 2
0 h
10 min
30 min
1 h
2 h
3 h
4 h
5 h
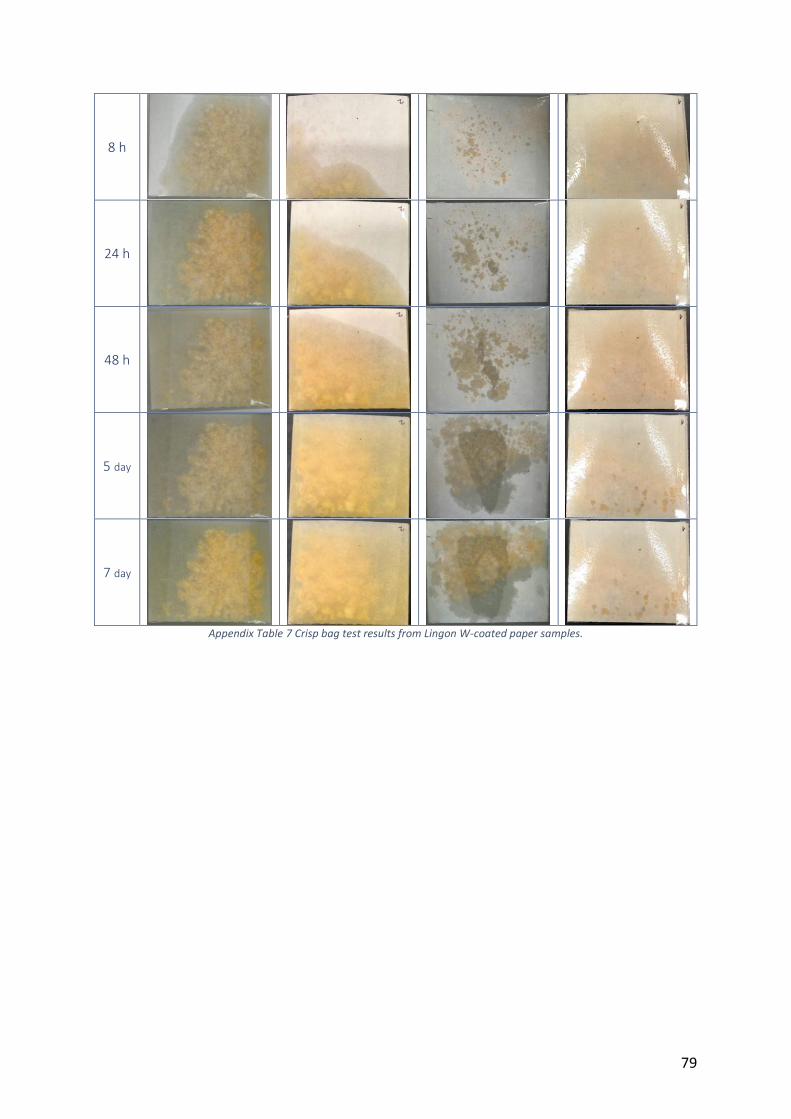
79
8 h
24 h
48 h
5 day
7 day
Appendix Table 7 Crisp bag test results from Lingon W-coated paper samples.
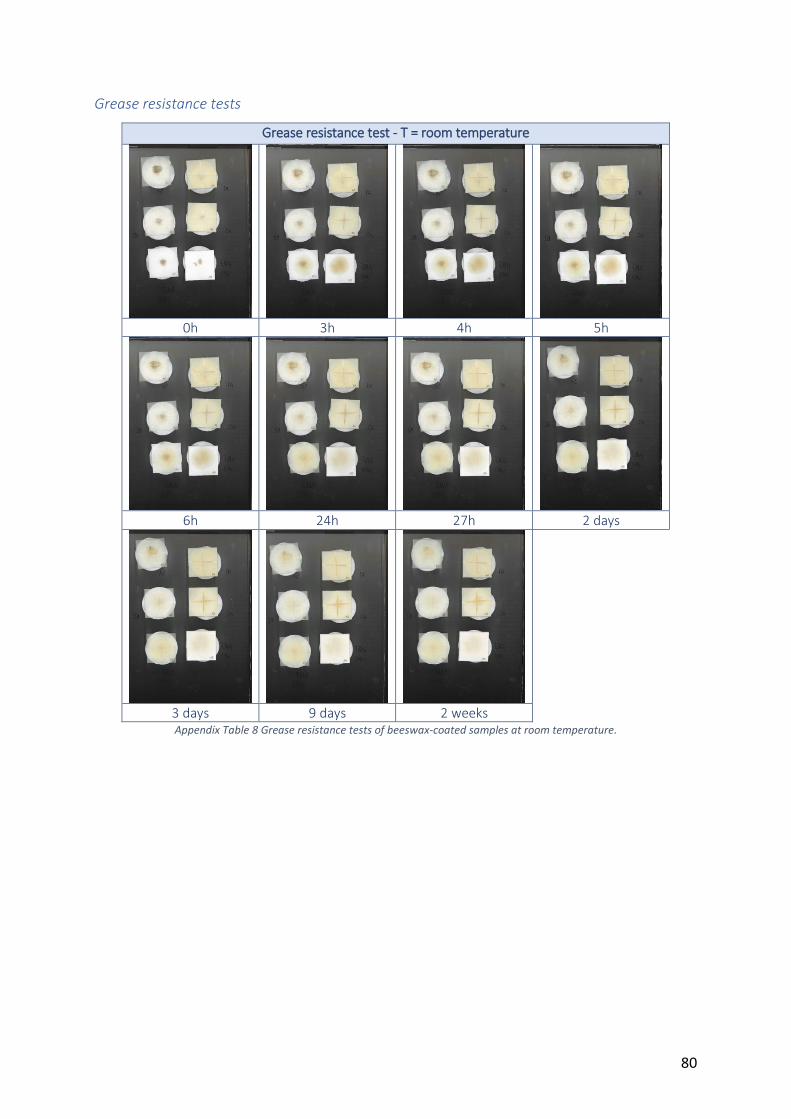
80
Grease resistance tests
Grease resistance test - T = room temperature
0h 3h 4h 5h
6h 24h 27h 2 days
3 days 9 days 2 weeks Appendix Table 8 Grease resistance tests of beeswax-coated samples at room temperature.
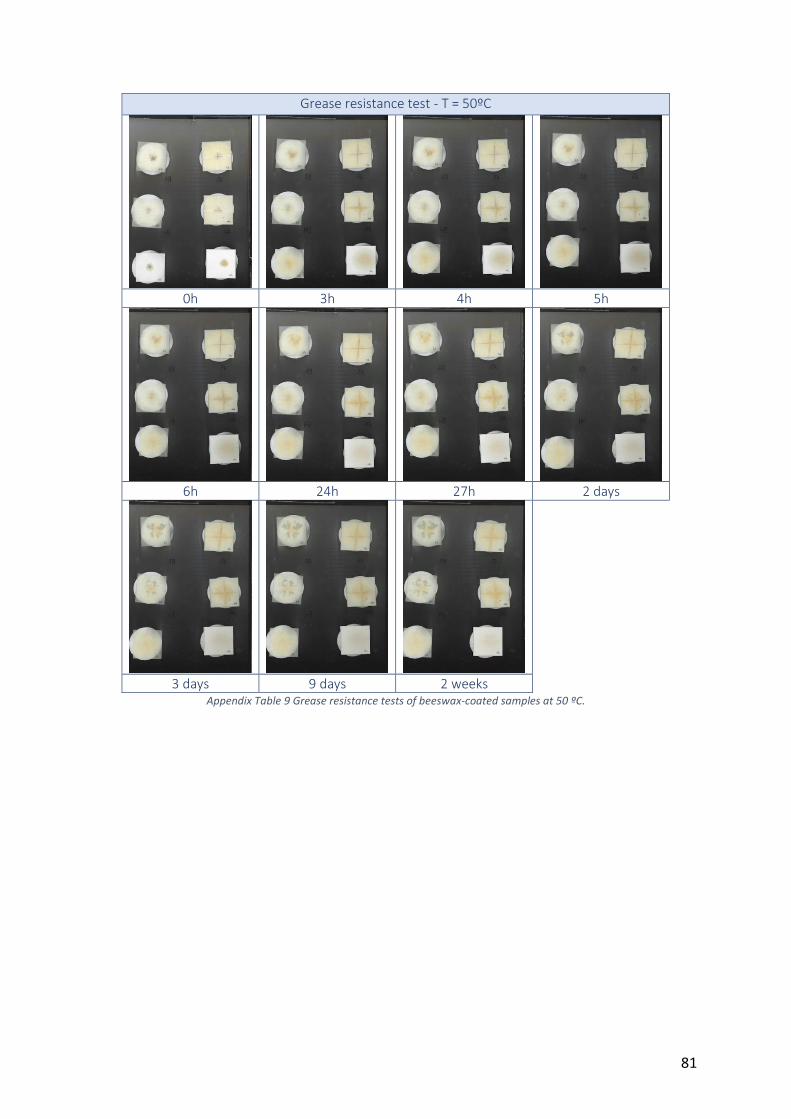
81
Grease resistance test - T = 50ºC
0h 3h 4h 5h
6h 24h 27h 2 days
3 days 9 days 2 weeks Appendix Table 9 Grease resistance tests of beeswax-coated samples at 50 ºC.
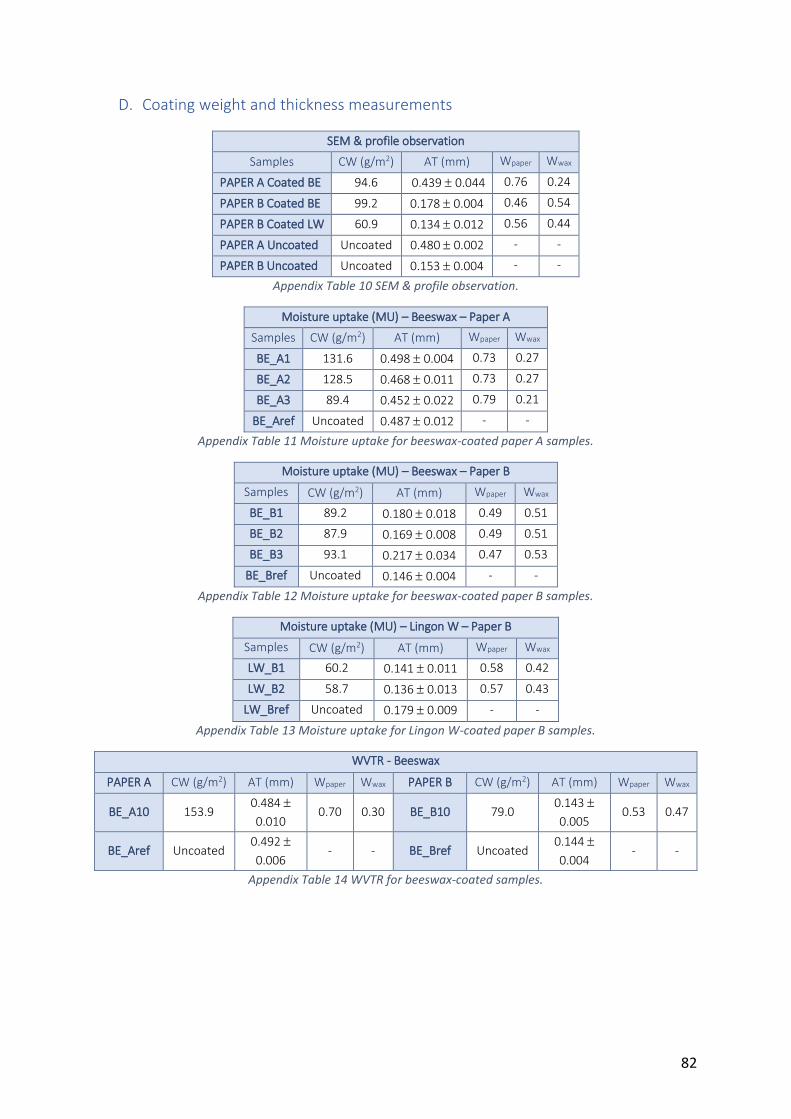
82
D. Coating weight and thickness measurements
SEM & profile observation
Samples CW (g/m2) AT (mm) Wpaper Wwax
PAPER A Coated BE 94.6 0.439 0.044 0.76 0.24
PAPER B Coated BE 99.2 0.178 0.004 0.46 0.54
PAPER B Coated LW 60.9 0.134 0.012 0.56 0.44
PAPER A Uncoated Uncoated 0.480 0.002 - -
PAPER B Uncoated Uncoated 0.153 0.004 - -
Appendix Table 10 SEM & profile observation.
Moisture uptake (MU) – Beeswax – Paper A
Samples CW (g/m2) AT (mm) Wpaper Wwax
BE_A1 131.6 0.498 0.004 0.73 0.27
BE_A2 128.5 0.468 0.011 0.73 0.27
BE_A3 89.4 0.452 0.022 0.79 0.21
BE_Aref Uncoated 0.487 0.012 - -
Appendix Table 11 Moisture uptake for beeswax-coated paper A samples.
Moisture uptake (MU) – Beeswax – Paper B
Samples CW (g/m2) AT (mm) Wpaper Wwax
BE_B1 89.2 0.180 0.018 0.49 0.51
BE_B2 87.9 0.169 0.008 0.49 0.51
BE_B3 93.1 0.217 0.034 0.47 0.53
BE_Bref Uncoated 0.146 0.004 - -
Appendix Table 12 Moisture uptake for beeswax-coated paper B samples.
Moisture uptake (MU) – Lingon W – Paper B
Samples CW (g/m2) AT (mm) Wpaper Wwax
LW_B1 60.2 0.141 0.011 0.58 0.42
LW_B2 58.7 0.136 0.013 0.57 0.43
LW_Bref Uncoated 0.179 0.009 - -
Appendix Table 13 Moisture uptake for Lingon W-coated paper B samples.
WVTR - Beeswax
PAPER A CW (g/m2) AT (mm) Wpaper Wwax PAPER B CW (g/m2) AT (mm) Wpaper Wwax
BE_A10 153.9 0.484
0.010 0.70 0.30 BE_B10 79.0
0.143
0.005 0.53 0.47
BE_Aref Uncoated 0.492
0.006 - - BE_Bref Uncoated
0.144
0.004 - -
Appendix Table 14 WVTR for beeswax-coated samples.
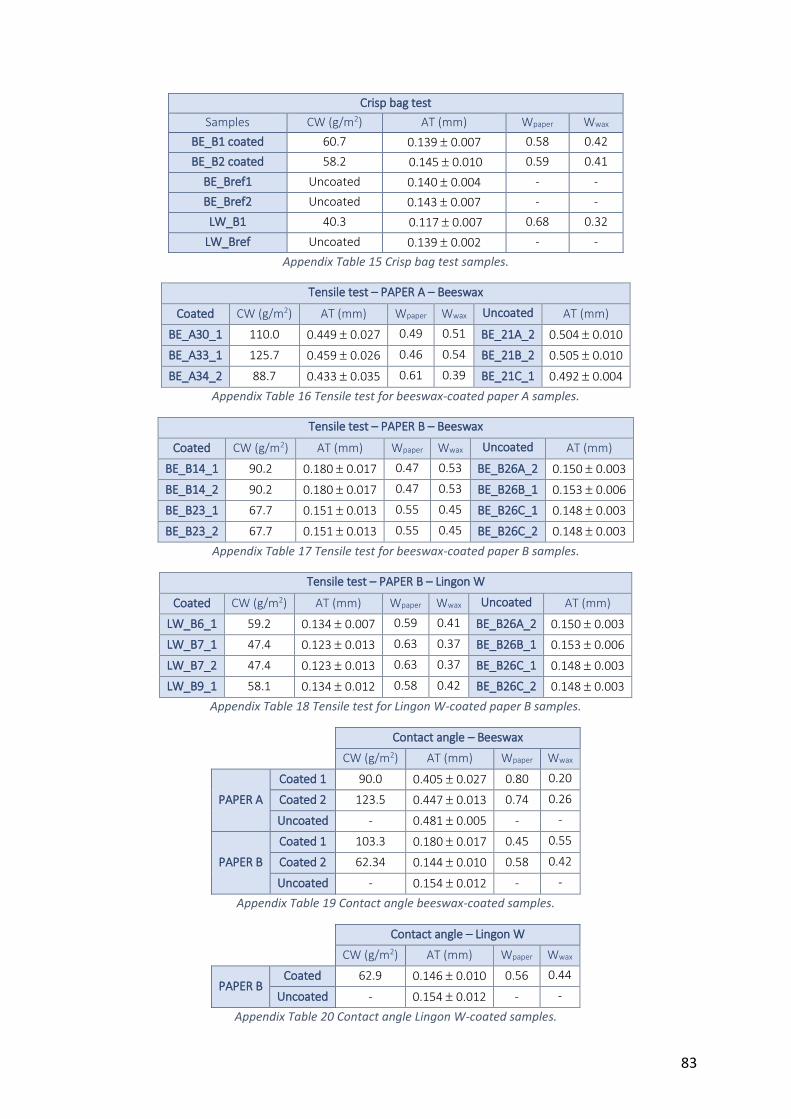
83
Crisp bag test
Samples CW (g/m2) AT (mm) Wpaper Wwax
BE_B1 coated 60.7 0.139 0.007 0.58 0.42
BE_B2 coated 58.2 0.145 0.010 0.59 0.41
BE_Bref1 Uncoated 0.140 0.004 - -
BE_Bref2 Uncoated 0.143 0.007 - -
LW_B1 40.3 0.117 0.007 0.68 0.32
LW_Bref Uncoated 0.139 0.002 - -
Appendix Table 15 Crisp bag test samples.
Tensile test – PAPER A – Beeswax
Coated CW (g/m2) AT (mm) Wpaper Wwax Uncoated AT (mm)
BE_A30_1 110.0 0.449 0.027 0.49 0.51 BE_21A_2 0.504 0.010
BE_A33_1 125.7 0.459 0.026 0.46 0.54 BE_21B_2 0.505 0.010
BE_A34_2 88.7 0.433 0.035 0.61 0.39 BE_21C_1 0.492 0.004
Appendix Table 16 Tensile test for beeswax-coated paper A samples.
Tensile test – PAPER B – Beeswax
Coated CW (g/m2) AT (mm) Wpaper Wwax Uncoated AT (mm)
BE_B14_1 90.2 0.180 0.017 0.47 0.53 BE_B26A_2 0.150 0.003
BE_B14_2 90.2 0.180 0.017 0.47 0.53 BE_B26B_1 0.153 0.006
BE_B23_1 67.7 0.151 0.013 0.55 0.45 BE_B26C_1 0.148 0.003
BE_B23_2 67.7 0.151 0.013 0.55 0.45 BE_B26C_2 0.148 0.003
Appendix Table 17 Tensile test for beeswax-coated paper B samples.
Tensile test – PAPER B – Lingon W
Coated CW (g/m2) AT (mm) Wpaper Wwax Uncoated AT (mm)
LW_B6_1 59.2 0.134 0.007 0.59 0.41 BE_B26A_2 0.150 0.003
LW_B7_1 47.4 0.123 0.013 0.63 0.37 BE_B26B_1 0.153 0.006
LW_B7_2 47.4 0.123 0.013 0.63 0.37 BE_B26C_1 0.148 0.003
LW_B9_1 58.1 0.134 0.012 0.58 0.42 BE_B26C_2 0.148 0.003
Appendix Table 18 Tensile test for Lingon W-coated paper B samples.
Contact angle – Beeswax
CW (g/m2) AT (mm) Wpaper Wwax
PAPER A
Coated 1 90.0 0.405 0.027 0.80 0.20
Coated 2 123.5 0.447 0.013 0.74 0.26
Uncoated - 0.481 0.005 - -
PAPER B
Coated 1 103.3 0.180 0.017 0.45 0.55
Coated 2 62.34 0.144 0.010 0.58 0.42
Uncoated - 0.154 0.012 - -
Appendix Table 19 Contact angle beeswax-coated samples.
Contact angle – Lingon W
CW (g/m2) AT (mm) Wpaper Wwax
PAPER B Coated 62.9 0.146 0.010 0.56 0.44
Uncoated - 0.154 0.012 - -
Appendix Table 20 Contact angle Lingon W-coated samples.
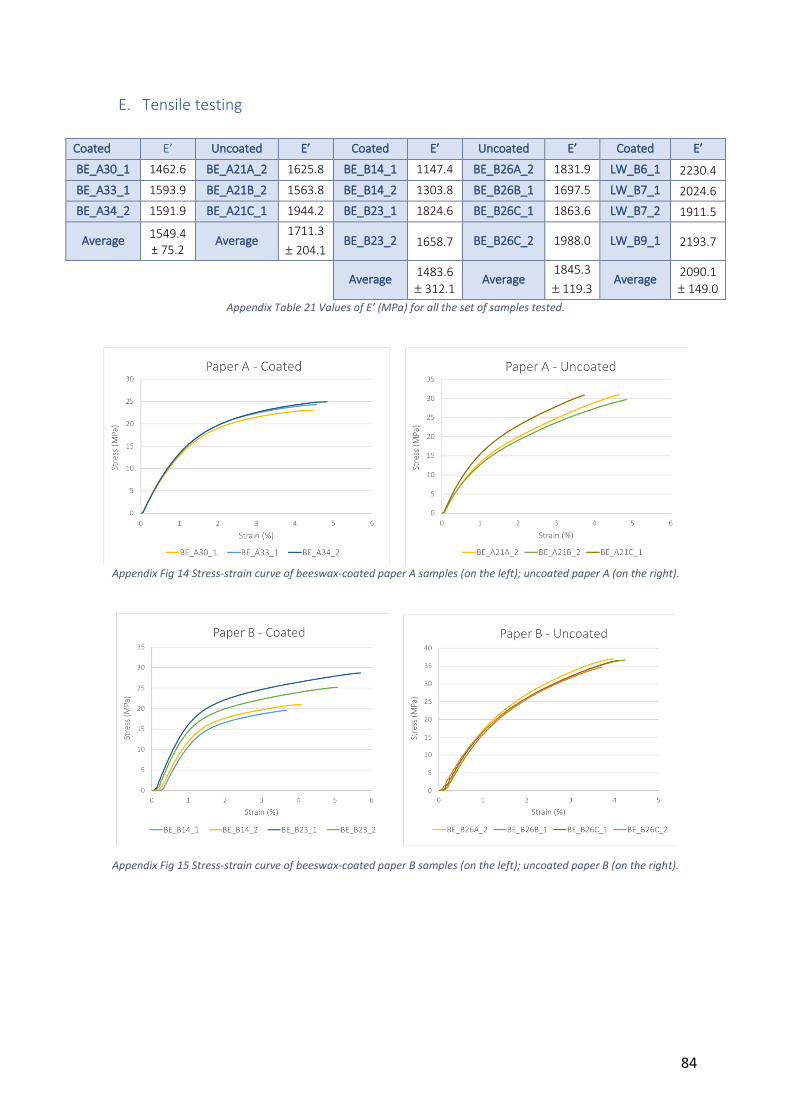
84
E. Tensile testing
Coated E’ Uncoated E’ Coated E’ Uncoated E’ Coated E’
BE_A30_1 1462.6 BE_A21A_2 1625.8 BE_B14_1 1147.4 BE_B26A_2 1831.9 LW_B6_1 2230.4
BE_A33_1 1593.9 BE_A21B_2 1563.8 BE_B14_2 1303.8 BE_B26B_1 1697.5 LW_B7_1 2024.6
BE_A34_2 1591.9 BE_A21C_1 1944.2 BE_B23_1 1824.6 BE_B26C_1 1863.6 LW_B7_2 1911.5
Average 1549.4 ± 75.2
Average 1711.3
204.1 BE_B23_2 1658.7 BE_B26C_2 1988.0 LW_B9_1 2193.7
Average 1483.6
312.1 Average
1845.3
119.3 Average
2090.1
149.0
Appendix Table 21 Values of E’ (MPa) for all the set of samples tested.
Appendix Fig 14 Stress-strain curve of beeswax-coated paper A samples (on the left); uncoated paper A (on the right).
Appendix Fig 15 Stress-strain curve of beeswax-coated paper B samples (on the left); uncoated paper B (on the right).
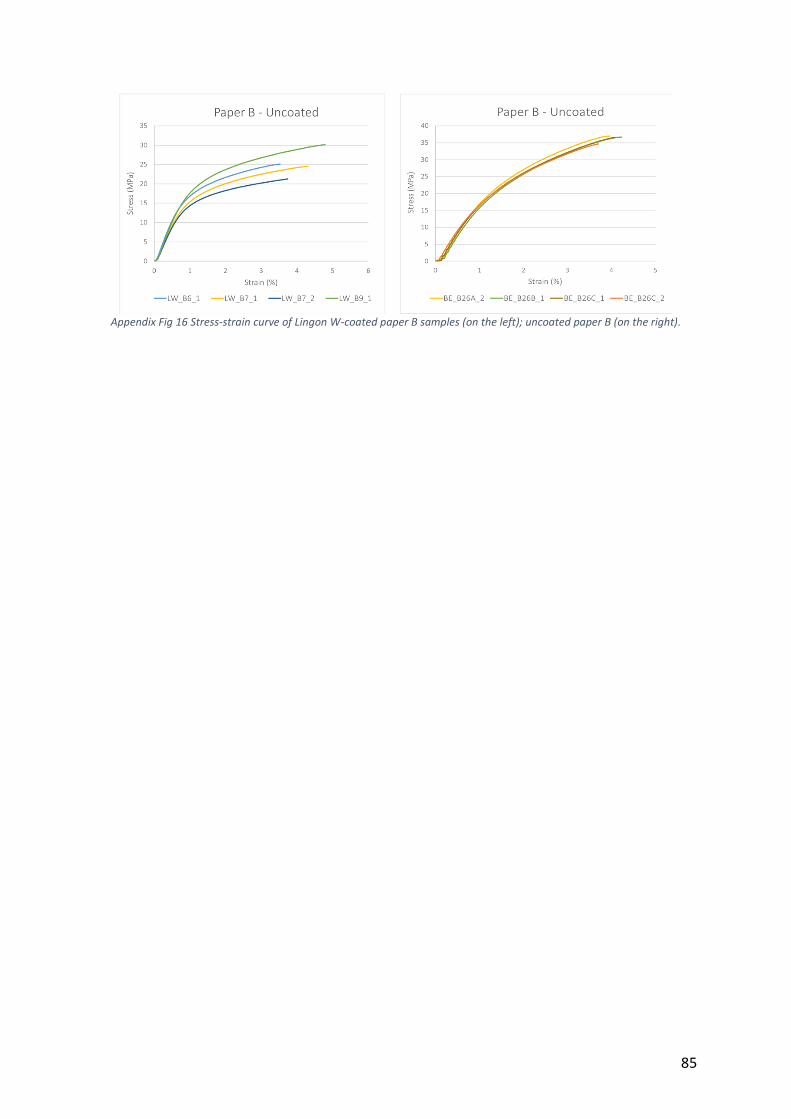
85
Appendix Fig 16 Stress-strain curve of Lingon W-coated paper B samples (on the left); uncoated paper B (on the right).
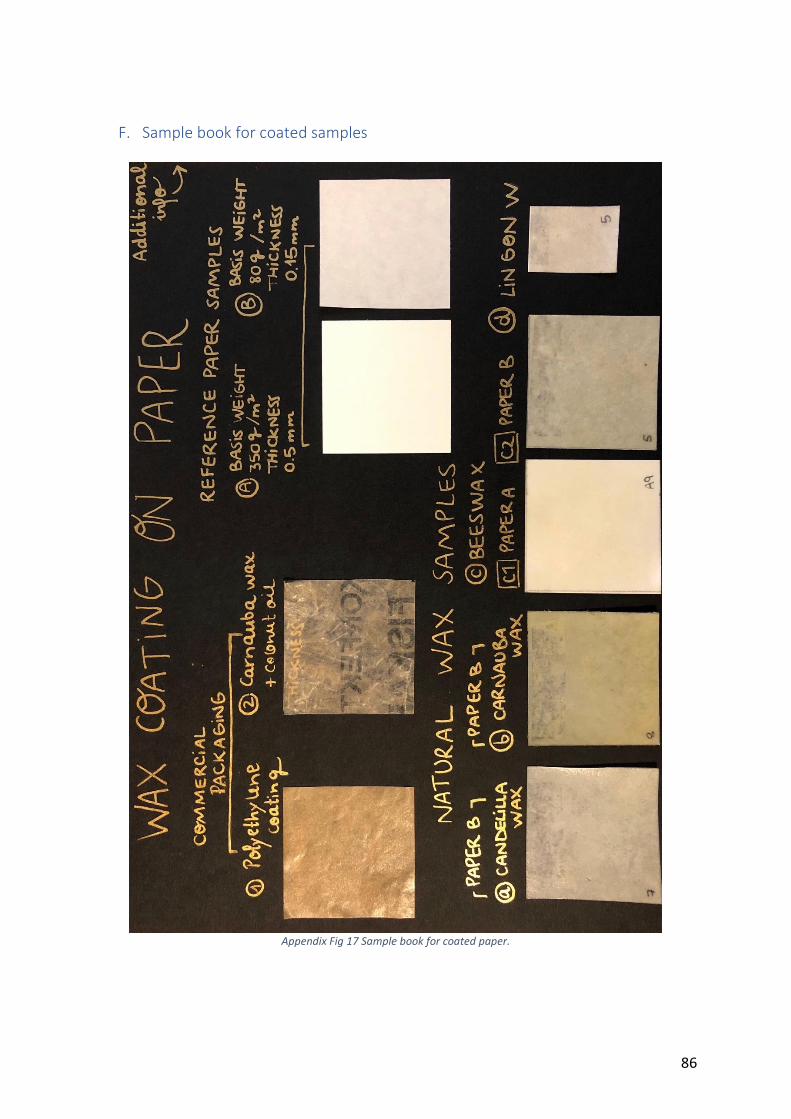
86
F. Sample book for coated samples
Appendix Fig 17 Sample book for coated paper.
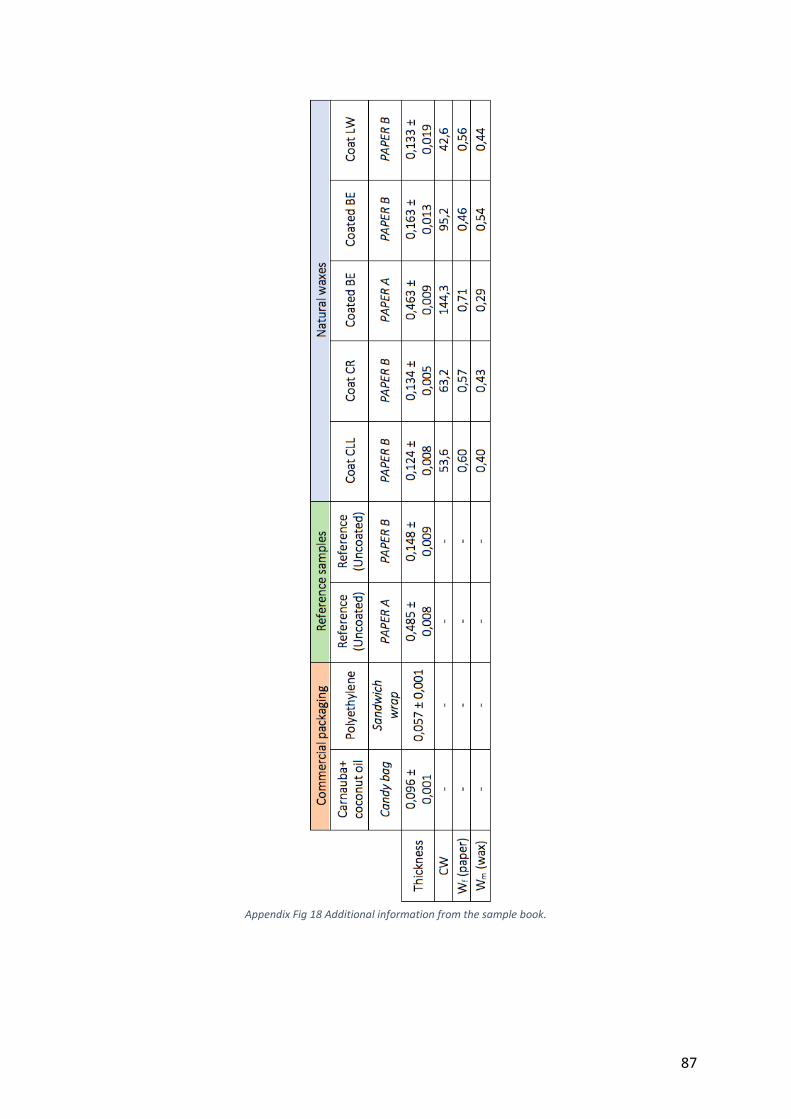
87
Appendix Fig 18 Additional information from the sample book.
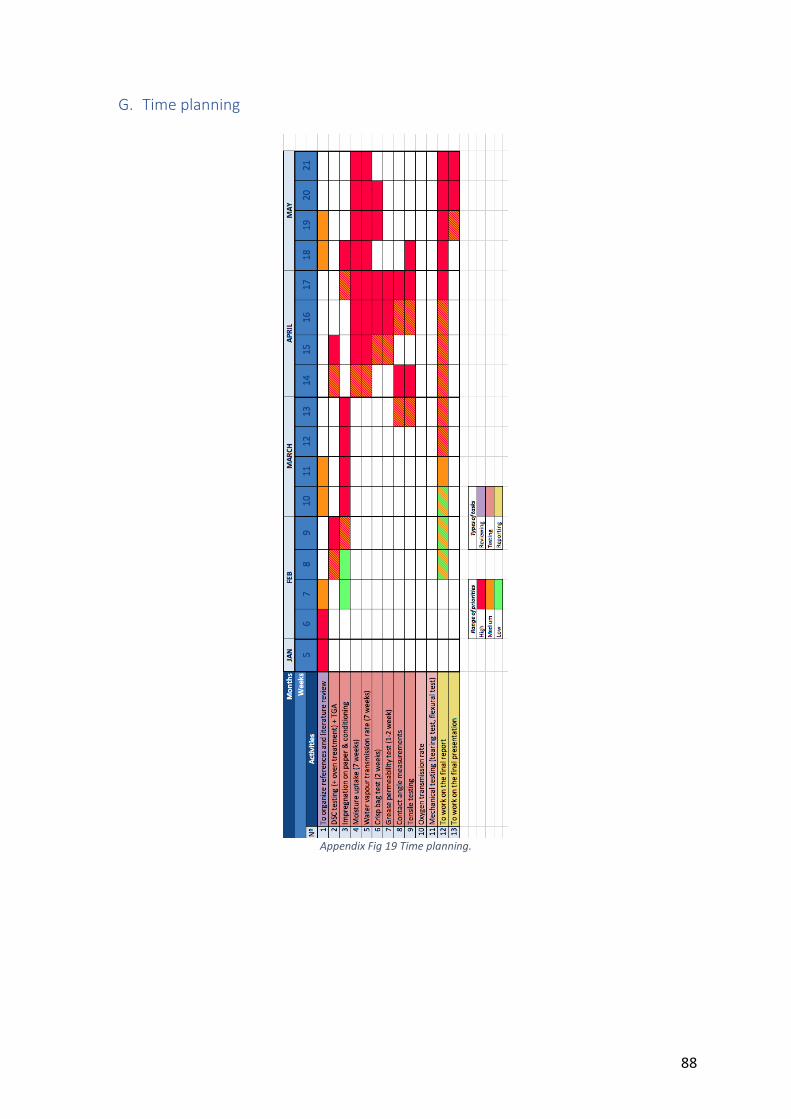
88
G. Time planning
Appendix Fig 19 Time planning.