evaluation of laboratory procedures for compacting asphalt
TRANSCRIPT

SHRP-A/UWP-91-523
Evaluation of LaboratoryProcedures for Compacting
Asphalt-Aggregate Mixtures
Prepared byJ.B. Sous_ J. Harvey, L. Painter, J.A. Deacon, and C.L. Monismith
Institute of Transportation StudiesUniversity of California
Berkeley, C_llfornia
Strategic Highway Research ProgramNational Research Council
Washington, D.C. 1991

SHRP-A/UWP-91-523Contract A-003AProgram Manager:.Edward T. HarriganProject Man:_ger:Rita B. LeahyProgram Secretary:Juliet Nar_:h
September 1991
key words:air voidsasphalt mixturesbeam fatiguecompressive creep modulusdiametral fatiguedynamic modulusfield compactiongyratorykneadinglaboratory compactionmix designrolling wheelshear creep modulus
Strategic Highway Research Program2101 Constitution Avenue, N.W.Washington, D.C. 20418
(202) 334-3774
This report represents the views of the authors only, and is not necessarily reflective of the views of theNational Research Council, the views of SHRP, or SHRP's sponsor. The results reported here arc notnecessarily in agreement with the results of other SHRP research activities. They are reported to stimulatereview and discussion with in the research commnnity.

ABSTRACT
The scope of Strategic Highway Research Program (SHRP) Project A-003A,
"PerformanceRelated Testing and Measuringof Asphalt-AggregateInteractions and Mixtures,"
includes a comprehensive examination of laboratorytests for asphalt-aggregatemixtures. For
test results to be meaningful, however, specimens prepared in the laboratory must resemble as
closely as possible in-service mixtures, those producedby mixing, placement, and compaction
in the field and subsequently "conditioned-."by traffic loads and "aged" by environmental
influences. Considerable attentionis thus being given both to methods of laboratorycompaction
and to methods of conditioning by acceleratedexposureto water, air, elevated temperatures, etc.
This report documents results of the laboratory compaction phase of the SHRP study.
The compaction investigation focused on the extent to which method of laboratory
compaction (Texas gyratory, kneading, and rollingwheel) affects fundamentalmixtureproperties
of importance to pavement performance in service. Permanent deformation and fatigue were
selected as the performance features of greatest concern, and laboratory creep and fatigue tests
were among those used to measure mixtureproperties that were likely to correlate well with
these performance features. A total of 16 asphalt-aggregatemixtures--varyingwidely in asphalt
source, aggregate type, asphalt content, and air-void content--were tested.
Compaction method was found to significantly affect properties of the dense-graded
mixtures evaluated herein, both in the statistical sense and in terms of practical engineering
consequence. The likelihood is reasonably high that differentkinds of mixtures might evolve
from a comprehensive mixture analysis and design system depending on method of compaction.
Among the three compaction methods examined, kneading specimens are generally most
sensitive to aggregate characteristics and least sensitive to asphalt characteristics. Gyratory
specimens are least sensitive to aggregate characteristics and only slightly more sensitive than
i

rolling-wheel specimens to asphalt characteristics. In general, kneading compaction produced
specimens having greatest resistance to permanent deformation while gyratory compaction
produced those having greatest resistance to fatigue cracking under controlled-stress loading.
For both permanent-deformation and fatigue resistances, roning-wheel specimens were ranked
between gyratory and kneading specimens.
Unlike static and impact compactors, the three compaction methods investigated herein
subject the densifying mixture to shearing motions similar to those induced during field
compaction. During compaction, the three compactors likely differ most in the "effective"
stressI applied to the aggregate particles and in the magnitude and randomness of interparticle
displacements. A greater effective stress promotes more interparticlecontact, and larger and
more random displacements promote a more tightly interlocked aggregate structure. Under
gyratory compaction, the effective stress can be relatively low due to pore pressures building
up in the fluid (asphalt and air voids) phase, and the interparticle shearing motion is relatively
small and uniform: the net result is a relatively "weak" aggregate structure. Kneading
compaction probablydevelops the strongestaggregatestructure. Differences amongcompaction
methods are greatest for mixtures with low air voids, presumably because pore pressures are
larger when there are fewer air voids in the mixture. Notwithstanding these generalities, it also
appears that, depending on their design and operation, compactors within a given genre may
produce specimens having quite differentengineeringproperties.
As a result of this study, the rolling-wheel compactor has been selected for use in
subsequentphases of SHRP ProjectA-003A. It is intuitively appealing for its apparent similarity
to field compaction, and it generally produces specimens whose properties lie within or near the
IDuring compaction, the compaction pressure is resisted by the pore pressure in the fluid(asphalt and air) phase and the effective stress transmitted through the aggregate particles.
ii

range of those produced by gyratory and kneadingcompaction. Rolling-wheel compaction is a
comparatively easy procedure and enables rapidfabricationof the large numberof specimens
required in subsequent A-003A testing. Because specimens produced by rolling-wheel
compaction are cored or .sawed from a larger mass, all surfaces are cut. Cut surfaces are
desirable because test results are likely to be less variable, air voids can be more accurately
measured, comparisonswith specimens extractedfrom in-service pavementsare morevalid, and
specimens are more homogenous.
The measurement of air voids is also a critical element of laboratory testing of
asphalt-aggregate mixtures. After considerableexperimentation, air-void estimates were most
uniform and consistent when measurementswere made with dry specimens encased in parafilm
(an impervious, stretchable fdm) for immersed weighing. Specimens exposed to water as a
result of coring and/or sawing can be sufficiently dried by blowing compressed air over their
surfaces. Air-void measurements in subsequent phases of the study will be based on this
technique.
.o.
111

ACKNOWLEDGEMENTS
The work reported herein has been conducted as a part of Project A-003A of the Strategic
Highway Research Program (SHRP). SHRP is a unit of the National Research Council that was
authorized by Section 128 of the Surface Transportation and Uniform Relocation Assistance Act
of 1987. This project is entitled, "Performance Related Testing and Measuring of Asphalt-
Aggregate Interactions and Mixtures," and is being conducted by the Institute of Transportation
Studies, University of California, Berkeley, with Carl L. Monismith as principal investigator.
The support and encouragement of Dr. Ian Jamieson, SHRP Contract Manager, is gratefully
acknowledged.
The draft of this report was reviewed by an Expert Task Group (ETG) who provided
many valuable comments and will continue to provide guidance throughout the contract. The
members are:
]_'aest G. ]Lgstian Michael L. Fiin_
Federal Highway Administration. ELF Asphalt
Campbell Crawford Charles S. HughesNational Asphalt Paving Association Virginia Highway and Transportation Research
Council
WilliamDearasaugh D*nK N. LittleTransportationResearchBoard TexasA&MUniversity
FrancisFee KevinStuart1_L1_Asphalt FederalESgbwsyAdministration
Douglas L Hanson Roger L. YarbroughNew Mexico State Highway Department University Asphalt Company
Eric E. HarmIllinois Department of Transportation
The contributions of Dr. Akhtar Tayebali, Elie Abi-Jaoude, Kashyapa Yapa, Thomas
Mills, Matthew McCune, Alexandro Tanco, and Sirous Alavi, who assisted in various phases
of the work, are also gratefully acknowledged.
iv

DXSCLA_
The contents of this report reflect the views of the authors, who are solely responsible
for the facts and accuracy of the datapresented. The contents do not necessarily reflect the
official view or policies of the Strategic Highway Research Program (SHR.P) or SHRP's
sponsors. The results reportedhere are not necessarily in agreementwith the results of other
SHRP research activities. They are reported to stimulate review and discussion within the
research community, This reportdoes not constitute a standard,specification, or regulation.
V

TABLE OF CONTENTS
ABSTRACT ......................................... i
ACKNOWLEDGEMENTS ............................... iv
DISCLAIMER ........................................ v
TABLE OF CONTENTS ................................ vi
LIST OF FIGURES ................................... viii
LIST OF TABLES .................................... xiv
1.0 INTRODUCTION .................................... l
2.0 SIGNIFICANT _TEMENTS IN MAIN EXPERIMENT ............. 4
2.1 Mixture and Test Variables ........................... 42.2 Specimen Fabrication .............................. 92.3 Test Methods ................................... l02.4 Mixture Properties ................................ 13
3.0 DESIGN OF MAIN EXPERIMENT ......................... 20
3.! Experiment Designs . .............................. 203.2 Analysis Techniques ............................... 25
4.0 ANALYSIS AND FINDINGS ............................. 28
4.1 Main Experiment ................................. 284.2 ExtendedPermanent-DeformationStudy ................... 974.3 ComplexModulusStudy ............................ 1124.4 Comparisonswith OtherCompactionMethods ............... 1274.5 Comparisonswith Field Cores ......................... 1314.6 Comparisonswith OtherInvestigations.................... 139
5.0 AIR-VOID MEAS_ AND CUT-SURFACE EFFECTS ........ 145
5.1 Air-Void Measurement.............................. 1475.2 Effectof Cut Surfaces.............................. 1585 3 Summary 165
6.0 SUMMARY AND RECOMMENDATIONS ..................... 169
6.1 Findings ...................................... 1696.2 Recommendations ................................. 173
vi

7.0 REFERENCES ...................................... 176
APPENDICES
A Specimen Preparation .............................. A. 1B Diametral Fatigue Test Procedure ....................... B. 1C Statistical Analysis Techniques for Main Experiment ........... C. 1D Proposed Method for Measurement of Air Voids in Test
Specimens of BituminousMixtures ...................... D. 1E Proposed Method for Preparationof Test Specimens of
Bituminous Mixtures by Means of Rolling-Wheel Compaction ...... E. 1
vii

LIST OF.FIGURES
2.1 Typical Creep Curves ................................. 15
2.2 Constancy of Collapse Strainfor a Number of Randomly Selected TestsUnder Compressive Creep .............................. 17
2.3 Constancy of Collapse Strain for a Number of Randomly Selected TestsUnder Shear Creep ................................... 18
4.1 Effect of Compaction on Compressive Creep Modulus ............. 40
4.2 Effect of Compaction on Shear Creep Modulus .................. 41
4.3 Combined Effects of Compaction and Asphalt Type on Compressive CreepModulus, AAK-1 [B] and AAG-1 IV] ....................... 43
4.4 Combined Effects of Compactionand Asphalt Type on Shear CreepModulus, AAK-1 []3] and AAG-1 IV] ....................... 44
4.5 CombinedEffectsofCompactionandAsphaltContenton CompressiveCreepModulus,OptimumAsphalt[0]andHighAsphalt[I].......... 46
4.6 CombinedEffectsofCompactionandAsphaltContentonShearCreepModulus,OptimumAsphalt[0]andHighAsphalt[l].............. 47
4.7 CombinedEffectsofCompactionandAggregateTypeonCompressiveCreepModulus,RL Chert[T]andRB Granite[W] ............... 48
4.8 CombinedEffectsofCompactionandAggregateTypeonShearCreepModulus,RL ChertIT]andRB Granite[W'J.......... ......... 50
4.9 CombinedEffectsofCompactionandAir-VoidContentonCompressiveCreepModulus,Low Voids[0]andHighVoids[I]............... 51
4.I0 CombinedEffectsofCompactionandAir-VoidContentonShearCreepModulus,Low Voids[0]andHighVoids[I]................... 52
4.11 Combined Effects of Compaction and Temperatureon Compressive CreepModulus, 104°F (40°C) [0] and 140°F (60°C) [I] ................ 53
4.12 Combined Effects of Compaction and Temperature on Shear CreepModulus, 104°F (40°C) [0] and 140°F (60°C) [1] ................ 54
4.13 Combined Effects of Compaction and Stress Level on Compressive CreepModulus, 14.5 psi [0] and 29.0 psi [1] ....................... 55
°°°
VIII

4.14 Combined Effects of Compaction and Stress Level on Shear CreepModulus, 2.4 psi [0] and 4.8 psi [1] ........................ 56
4.15 Combined Effects of Compaction and Mixture Stiffness on FlexuralFatigue at Low Stress, 100 psi ............................ 60
4.16 Combined Effects of Compaction and Mixture Stiffness on FlexuralFatigue at High Stress, 175 psi ............................ 61
4.17 Combined Effects of Compaction and MixtureStiffness on DiametralFatigue at Low Stress ................................. 64
4.18 Combined Effects of Compaction and Mixture Stiffness on DiametralFatigue at High Stress ................................. 65
4.19 Effect of Heating and Mixing on Hardeningof AAK-1 Asphalt ........ 76
4.20 Effect of Heating and Mixing on Hardening of AAG-1 Asphalt ........ 77
4.21 Effect of Compaction Method on Permeability .................. 81
4.22 Compressive Creep Curves for Specimens with Varying Air Voids,Gyratory Compaction ................................. 98
4.23 Compressive Creep Curves for Specimens with Varying Air Voids,Kneading Compaction ................................. 99
4.24 Shear Creep Curves for Specimens with Varying Air Voids,Gyratory Compaction ................................. 100
4.25 Shear Creep Curves for Specimens with Varying Air Voids,Kneading Compaction ................................. 101
4.26 Effect of Air Voids on Compressive Creep Modulus,Gyratory Compaction ................................. 103
4.27 Effect of Air Voids on Compressive Creep Modulus,Kneading Compaction ................................. 104
4.28 Combined Effects of Air Voids and Loading Time on Compressive CreepModulus, Kneading Compaction ........................... 105
4.29 Effect of Compaction Method on Compressive Creep Modulus of LowAir-Void Mixtures, Average of Four Specimens for Each Line ........ 106
4.30 Effect of Compaction Method on ShearCreep Modulus of LowAir-Void Mixtures, Average of Four Specimens for Each Line ........ 107
ix

4.31 Effect of Compaction Method on Compressive Creep Modulus ofHigh Air-Void Mixtures, Average of Five Specimens for Each Line ..... 108
4.32 Effect of Compaction Method on ShearCreep Modulus of HighAir-Void Mixtures, Average of Five Specimens for Each Line ........ 109
4.33 Effect of Compaction Method on Strain Ratio in Shear Creep,Average of Four Specimens for Each Line .................... 110
4.34 Effect of Compaction Method on Specimen Dilation in Shear Creep,Average of Four Specimens for Each Line .................... 111
4.35 Effect of Compaction Method on PermanentStrain in Cyclic Shear ..... 113
4.36 EffectofCompactionMethodonSpecimen"DilationinCyclicShear,Average of Two Specimens for Each Line ..................... ! 14
4.37 Effect of Compaction Method on Permanent Deformation Modulusin Cyclic Shear ........... .......................... 115
4.38 Effect of Compaction Method on Permanent Deformation Modulusin Cyclic Compression ................................. 116
4.39 Effect of Compaction Method on Dynamic Modulus at 68°F (20°C),Average of Seven Specimens for Each Line .................... 118
4.40 EffectofCompactionMethodonDynamicModulusat104°F (40°C),AverageofSixSpecimensforGyratoryandSevenSpecimensforKneading................................ 119
4.41 Effect of Compaction Method on Loss Tangent at 68°F (20°C),Average of Seven Specimens for Each Line .................... 121
4.42 Effect of Compaction Method on Loss Tangent at 104°F (40"C),Average of Six Specimens for Gyratory and Seven Specimens forKneading ......................................... 122
4.43 Combined Effects of Air-Void Contentand Compaction Method onDynamic Modulus at 104°F (40°C), Average of Three Specimens forEach Line ........................................ 123
4.44 Combined Effects of Air-Void Content and Compaction Method onDynamic Modulus at 680F (20°C), Average of Three Specimens forEach Line ........................................ 124
4.45 Combined Effects of Air-Void Content and Compaction Method onLoss Tangent at 1040F (400C), Average of Three Specimens forEach Line ........................................ 125
X

4.46 Combined Effects of Air-Void Contentand Compaction Method onLoss Tangent at 68°F (20°C), Average of Three Specimens forEach Line ........................................ 126
4.47 Comparative Response of Corpsof Engineers' Gyratory Specimensto Shear Creep Loading, Average of Two Specimens for Each Line ..... 129
4.48 ComparativeResponse of Exxon Rolling-Wheel Specimens to ShearCreep Loading, Average of Two Specimens for Each Line .......... 130
4.49 ComparativeResponse of I 80 Field Cores to Shear Creep Loading,Average of Five Specimens for Each Line ..................... 132
4.50 ComparativeDilational Responseof I 80 Field Cores to ShearCreep Loading, Average of Five Specimens for Each Line. .......... 134
4.51 Viscosities of Asphalts ExtractedFrom I 80 Field Cores andLaboratorySpecimens, 140°F (60°C) ....................... 135
4.52 Viscosities of Asphalts ExtractedFrom I 80 Field Cores andLaboratory Specimens, 275°F (135°C) ....................... 136
4.53 Comparative Response of US 101 Field Cores to Shear Creep Loading,Average of Four Specimens for Each Line .................... 137
4.54 Comparative Dilational Response of US 101 Field Cores to ShearCreep Loading ...... . ............................... 138
4.55 Comparison Between Laboratory Specimensand Field Cores forMixtures with Carbon Black (After Monismith and Tayebali, 1988) ..... 140
4.56 Comparison Between Laboratory Specimens and Field Cores forControl Mixtures (After Monismith and Tayebali, 1988) ............ 141
4.57 Comparison of Slope of Creep Curves for Gyratory (MT/GS) andKneading (CK/CC) Specimens (March28, 1989 Letter to J. Moulthropfrom H. Von Quintus) ................................. 143
5.1 Effect of ParaTdmon Surface-Dry Measurementsof Air Voids,All Specimens ...................................... 150
5.2 Combined Effect of Parafilm and Wetting on Air-Void Measurements .... 151
5.3 Effect of Wetting on No-ParafilmMeasurements of Air Voids ........ 152
5.4 Comparison of DNP, WNP, and WWP Measurementsof Air Voids,Regression Lines .................................... 153
xi

5.5 Combined Effect of Cut Surfaces and Parafilmon Air-VoidMeasurements, Regression Lines .......................... 154
5.6 Combined Effect of Wetting and AggregateType on Air-VoidMeasurements, Regression Lines .......................... 156
5.7 Combined Effect of ParaYxlmand Aggregate Type on Air-VoidMeasurements, Regression Lines .......................... 157
5.8 Effect of Cut Surfaces on Wet-With-Paraf'dmMeasurements ofAir Voids in Large Beams, KneadingCompaction ................ 162
5.9 Effect of Cut Surfaces on Wet-No-ParafilmMeasurements of Air Voidsin Large Beams, Kneading Compaction ...................... 163
5.10 Effect of Cut Surfaces on No-ParafilmMeasurements of Air Voidsin Large Cylinders, Gyratory Compaction ..................... 164
5.11 Illustration of BoundaryEffects of Cut Specimen Surfaces in Shearand DiametraJTesting ................................. 166
5.12 Effect of Cut Surfaces on Shear Creep Modulus, GyratorySpecimens .... 167
A.1 Form No. 1 ....................................... A.11
A.2 Form No. 2 ....................................... A.12
A.3 Form No. 3 ....................................... A. 13
A.4 BTDC Showing Mixing TemperatureSelection .................. A. 19
A.5 Form No. 4 ....................................... A.24
A.6 Example Calculation for Compaction Using Large Texas GyratoryCompactor ........................................ A.29
A.7 Mold Dimensions for Rolling Wheel Compaction ................ A.35
B. 1 Loading of Cylindrical Specimen in the Diametral Fatigue Test ........ B.3
B.2 Stress Distributions Within Diametrally Loaded Specimens(After Hadley, Hudson, and Kennedy, 1970) ................... B.5
B.3 Test Specimen with Diametral Yoke and Loading Ram(After Vinson, 1989) .................................. B.8
E. 1 Example Calculation for Mass of Mixture to Be Compacted .......... E.3
xii

E.2 Rolling-Wheel Compaction Apparatus ....................... E.5
E.3 University of CaliforniaOne-LiftRolling-Wheel Compaction Mold ..... E.7
OoO
XUl

LIST OF TABLES
1.1 Compaction Experiments ............................... 3
2.1 Significant Mixture and Test Variables for Main Experiment ......... 6
2.2 Aggregate Gradationfor Compaction Study .................... 7
2.3 Mixture Designs .................................... 8
3.1 Experiment Design for Diametr_ Fatigue Tests, Main Experiment ...... 21
3.2 Experiment Design for Flexural Fatigue Tests, Main Experiment ....... 23
3.3 Experiment Design for Shearand Compressive-Creep-Tests; MainExperiment ........................................ 24
3.4 Sample Size Required for Main Experiment .................... 26
4.1 Summary Results of Unconfined Axial Compressive Creep Tests ....... 32
4.2 Summary Results of Unconfined Shear Creep Tests ............... 33
4.3 Effect of Compaction Method on Resistance to PermanentDeformation... 34
4.4 Effect of Compaction Method on Sensitivity ofPermanent-Deformation Response to MixtureVariables ............. 37
4.5 EffectofMixtureandTestVariablesonResistancetoPermanentDeformation....................................... 38
4.6 Summary ResultsofFlexuralFatigueTests... ................. 58
4.7 Summary ResultsofDiametralFatigueTests................... 62
4.8 Effect of Compaction Method on Resistance to Fatigue ............. 66
4.9 Effect of Compaction Method on Sensitivity of Fatigue Responseto Mixture Variables .................................. 68
4.10 Effect of Mixture and Test Variableson Resistance to Fatigue ........ 69
4.11 Effect of Compaction Method on Stiffness ..................... 71
4.12 Effect of Compaction Method on Sensitivity of Stiffness Responseto Mixture Variables .................................. 72
xiv

4.13 Effect of Mixture and Test Variables on Stiffness Modulus .......... 73
4.14 Effect of Compaction Method on Hardeningof Asphalts ............ 75
4.15 Experimental Validation of Hypotheses Regarding CompactionMethodologies ...................................... 79
4.16 Statistically Significant Effects in Compressive Creep Testing ......... 85
4.17 Summary Statistics for Main Experiment ...................... 86
4.18 Statistically Significant Effects in Shear Creep Testing ............. 88
4.19 Statistically Significant Effects in Flexural Fatigue Testing ........... 91
4.20 Statistically Significant Effects in Diametral Fatigue Testing .......... 94
5.1 Sample Size for Study of Air-Void Measurement................. 146
A. 1 Medium Gradation No. 1 ............................... A.6
A.2 Medium GradationNo. 2 ............................... A.7
A.3 Coarse Gradation .................................... A.8
A.4 Minimum Masses Required for Analysis Specimens(from ASTM C 117-80) . ............................... A.10
A.5 Sieving Regimes for Chert (R.L)Aggregate .................... A.16
A.6 Mixing Temperatures ................................. A.21
A.7 Percentages of Asphalt To Be Used in Mixing .................. A.23
A.8 Ratio of Blows on Lift to be Compactedto Blows on Lift JustCompacted ........................................ A.33
XV

1.0 INTRODUCTION
DThe scope of Strategic Highway Research Program (SHRP) Project A-003A,
"PerformanceRelatedTesting andMeasuringof Asphalt-AggregateInteractionsand Mixtures,"
includes a comprehensive examination of laboratory tests for asphalt-aggregate mixtures, tests
which measure fundamentalmixturepropertiesthat reflect significant influences of asphalts and
asphalt-aggregate interactions on pavement performance. For test results to be meaningful,
specimens preparedin the laboratory must resemble as closely as possible in-service mixtures,
those produced by mixing, placement, and compaction in the field and subsequently
"conditioned" by traffic loads and "aged" by environmentalinfluences. Considerable attention
is thus being given both to methodsof laboratory compaction and to methods of conditioning by
accelerated exposure to water, air, elevated temperatures, etc. It is the purpose of this report
to document results of the laboratorycompaction phase of the overall study.
A recent National Cooperative Highway Research Project study (Von Quintus et al.,
1988) has identified promising laboratory compaction techniques. Named after the asphalt-
aggregate mixtureanalysis system it is developing, the AAMAS study has effectively eliminated
from contention both impact compaction and the Arizona vibratory/kneading compactor. It has
successfully narrowed the search to three leading contenders; gyratory, kneading, and
rolling-wheel compaction. These three methods form the focus of the current investigation.
The main experiment was designed primarily to ascertain the extent to which method of
compaction (Texas gyratory,kneading,androlling wheel) affects fundamentalmixtureproperties
of importance to pavement performance in service. Permanent deformation and fatigue were
selected as the performance parametersto be considered, and laboratory creep and fatigue tests
were used to measure mixture properties that were likely to correlate well with field
performance. The main experiment was structuredto accomplish the following:
I

1. To identify any effects of_compaction method on permanent-deformationand
fatigue properties and on the sensitivities of these properties to mixture
composition and
2. If effects are observed, to determine their statistical significance.
Auxiliary experiments (1) extended the rutting investigation to include measures of
permanent deformation underrepetitive loading and to examine more broadly the interaction of
airvoids and compaction method, (2) addeddynamic modulus and phase angle (loss tangent) as
mixture properties of_possibly significant relationship to pavement performance, (3) included
limited comparisons with other laboratory compaction methods, and (4) included limited
comparisons between laboratory and field compaction. The extent of the experimentalprogram
is indicated by Table 1.1.
Although the primary purpose of the compaction study was to identify a compaction
procedure(s) most appropriate for laboratory use, the study also provided opportunityto identify
minor improvements to the preferred compactionmethod(s) and to reevaluate the range of testing
and mixture properties to be evaluated in subsequentlaboratory studies.
2

Table I.I Compaction Experiments
l:xperiment Laboratory Tests Compaction Methods Mixture Types No. ofTestsi | eH
Flexure/Fatigue Gyratory 2 Asphalts
Main Experiment Diametral Fatigue Kneading 2 Asphalt Contents 480Compressive Creep Rolling Wheel 2 Air VoidsShear Creep 2 Aggregates
|
Compressive Creep Gyratory I Asphalt
Extended Permanent Shear Creep Kneading 1 Asphalt Content 50Deformation Study Compressive Cyclic Multiple Air Voids
Shear Cyclic 1 Aggregate
Dynamic Axial Gyratory 1 Asphalt
Complex Modulus Compression Kneading 1 AsphaltContent 376Study Multiple Air Voids
1 Aggregate
Shear Creep GypJtory (rexas) 1 Asphalt
Other Compaction Oyratory (Corps) I Asphalt Content 12Comparisons Kneading 1 Aggregate
Rolling Wheel ('Exxon)e
Shear Creep Gyratory 1 Field Mixture1 80 Kneading 15Field
Core Field
Tests Shear Creep Gyratory I Field MixtureUS 101 Kneading 12
Field

2.0 SIGNIFICANT ELEMENTS IN MAIN EXPERIMENT
The objective of the main experiment was to determine the effect of compaction
methodology on fundamental engineering properties of asphalt-aggregate mixtures. The
candidatecompaction methods includedTexas gyratorycompaction (adapted from.TexasMethod
Tex-206-F and ASTM D 4013), kneading compaction (ASTM D 1561), and rolling-wheel
compaction (a procedure not yet standardized). Because the compaction study preceded other
elements of the overzU SHRP A-003A investigation, final choices had yet to be made regarding
the most critical mixture properties influencingpavement performance. Resistances to cracking
and to permanent deformation under repetitive loading were considered to be the critical
pavement performance parameters, however, and state-of-the-art surveys confirmed that tests
commonly used at the University of California would adequately measure related mixture
properties (Sousa, Claus, and Monismith, 1990 and Tangella et al., 1990). These surveys also
helped to highlight the mixturevariables most likely to affect the resistanceof asphalt-aggregate
mixtures to cracking and to permanent deformation and to identify test conditions sufficiently
representative of a range in field conditions to produce reliable results. The purpose of this
section is to identify and describe these significantelements of the maincompaction experiment.
2.1 Mixture and Test Variables
In order to limit the experiment to manageable size, only those mixture variables
expected to significantly affect the primary response measures (resistance to permanent
deformation and fatigue) were selected for investigation. These included asphalt type, asphalt
content, aggregate type, and air-voidcontent. Significant test variablesincluded both stress level
and temperature. A factorial design was used for the main experiment, and a two-level
4

representationwas used for each of these six primaryvariables (or factors). Specific mixture
and test variables, summarized in the matrixof Table 2.1, are more fully described as follows:
1. Aggggg_. The two aggregatesselected for evaluationincludedgranite (R.B)and
chert (RL). The granite (RB), a non-stripper, is an angular aggregate with a
rough surface texture. The chert (P.L), considered to be a stripl_r, is a gravel
with more rounded particles and smoother surface texture. One gradation was
selected, typical of dense graded aggregates having a 3/4-inch (19.0 ram)
maximum size (Table 2.2).
2. A_P.]!_. An AC-30 asphalt (AAK-1) and an AR-4000 asphalt (AAG-I) were
selected for investigation because of their vastly different compositional and
temperature-susceptibility characteristics. Additionally, two levels of asphalt
content were selected. For each asphalt-aggregate mixture, the lower asphalt
content was determinedusing a modificationof standardHveem (ASTM D 1560)
procedures (Table 2.3). _The upper asphalt content was set at a 0.5- or 0.7-
percent higher level (by weight of mixture), only slightly exceeding the optimum
asphalt content determinedby the U.S. Army Corps of Engineers (Marshall)
75-blow procedure (ASTM D 1559) for the granite (RB) and somewhat less for
the chert (RL) (Table 2.3).
3. Air Voids. Each of the three methods of compaction, kneading, gyratory, and
rolling wheel, were evaluatedat two levels of compactiveeffort. The upperlevel
of compaction was thatnecessary to produce an air-voidcontent initially targeted
at approximately 4 percent. The lower level was that necessary to produce a
targeted air-void content of approximately 8 percent. As the compaction study
progressed, however, it becameapparentthat air-void measurementswere being
5

Table 2.1 Significant Mixture and Test Variables for Main Experiment
Variable Level of Treatment NumberI of Levels
1 I 2 3
Aggregate
• StrippingPotential Low High (2)
• Gradation Medium (1)
Asphalt
• Temperature Susceptibility Low High (2)
• Grade Medium (1)
• Content " Optimum High (2)
Compaction
• Method Gyratory Kneading Rolling (3)V,qleel
• Air Voids 4.5+% 11.5+__% (2)
Test Conditions
• Temperature
- Fatigue 32/39.2°F 68°F (2)........ (0/4.o.C), (20°C)
- Rutting 104°F 140°F (2)(400C) (60°C)
• Stress Level
- Fatigue Low High (2)
- Rutting Low High (2)
Conditioning
• Aging None (1)
• Moisture None (1)
26.31
6

Table 2.2 Aggregate Gradation for Compaction Study
Sieve Size Percent Passing by Mass
1 in lO0
3/4 in 95
112 in 80
318in 68
No. 4 48
No. 8 35
No. 16 25
No. 30 17i
No. 50 12
No. 100 8
No. 200 4
Pan
Note: Iin- 25.4mm
7

Table 2.3 Mixture Designs
Percent Asphalt by Weight of Mixture
U.S. Army Compaction StudyAggregate Asphalt State of Corps of
California Engineers
Method (Marshall) Low Level High LevelMethOdb
AAK-I 4.9a 5.3 4.9 5.4Granite0_)
AAG-1 4.7 a 5.1 4.7 5.2
AAK-I 4.1 © $.2+ d 4.1 4.8Chert (P_)
AAG-I 3.9 c 5.2+ d 3.9 4.6
aBased on stabilometer "S" value of 35.
b75-blow compaction.
CBa_ on stabilometer "S" value of about 25 and air voids of about 4 percent.
dBased on Asphalt Institute criteria for compaction with 75-blow procedure.

affected by surface condition(eitheras moldedor as cut by coring or sawing) and
by prior exposure to water. To reduce measurement variability, a modified
procedure, described in Section 5.0 as "wet-with-parafilm," was ultimately
adopted. Using this technique, the low and high air-void-content specimens
averaged approximately4.5- and 11.5-percentair voids, respectively. Thisrange
in air voids is generally compatiblewith the range measured by Von Quintuset
al. (1988) in field cores from newly constructedprojects in five states.
4. Test Conditions. The two temperatures selected for each test procedure are
considered representative of the range of critical in-service conditions. For the
fatigue tests, they included 32° or 39.2°F (0° or 4°C) and 680F (20°C) and for
the rutting tests, 1040F and 140°F (4OoCand60°C). Two levels of loading (low
and high) were used for each test method. Selection of load levels was based
both on the time requiredto complete laboratorytestingand on the levels of load-
induced stressesanticipated in pavement structures.
5. .C.,.¢.ggIi._7.I3L_.Although one of the main objectives of SHRP Project A-003A is
to develop appropriateprocedures for conditioning laboratory specimens, this
aspect of the project was not sufficiently advanced in time to affect the
compaction study. Accordingly, only unconditioned specimens were tested.
2.2 Specimen Fabrication
Immediately prior to mixing, both asphalt and aggregate were heated to a mixing
temperature of 275 + 5°F (135 + 2.8°C). They were mixed as quickly as possible to obtain
uniformity, and the mixture was placed in a 14OOF(60°C) oven for 15 hours to cure. Before
compaction, the mixture was placed in a 240°F (1160C) oven for 1.5 hours. Compaction
9

procedures are described-along with other specimen preparation procedures as they evolved
from the compaction study--in Appendix A.
2.3
Two repetitive-loading tests were chosen for measuring response of asphalt-aggregate
mixtures to fatigue cracking, flexural loading and diametral loading. Flexural loading was
selected because of the considerable experience accumulatedover many years by the University
of California using such loading to measure fatigue response of beam specimens. Flexurai
testing yields a mixture property, applications to failure; that has been successfully correlated
with pavement performance (Monismith et al., 1971). Unfortunately, gyratory compaction does
not produce specimens of a size suitable for use with available flexural fatigue equipment.
Because fatigue tests can be conducted on gyratory specimens in the diametral mode and because
of current interest in diametral fatigue testing, diametraltesting was selected to provide a second
measure of fatigue response.• . .,. , , . ...., ......... . .. .., - . . ..
Resistance to permanent deformation was measured by the application of static creep
loads to cylindrical specimens. Although alternative methods hold considerable promise, their
use in the compaction study was considered to be premature. Moreover, the fact that mixture
response to creep loads in axial compression has been correlated with pavement rutting lends
creditability to the use of compressive creep in this comparison of compaction methods (Hills,
Brien, and van de Loo, 1974). On the premise that pavement rutting results principally from
shearing stresses, shear creep was also used to evaluate the resistance of test mixtures to
permanent deformation.
2.3.1 tF..g!ig_. All fatigue tests were conducted at two temperatures, representative of the
range within which pavement cracking under traffic loading is most likely. Originally, both
10

flexural and diametral tests were planned for 32°F (0°C) and 68°F (20°C). Because of
equipmentlimitations in conducting the diametralfatigue tests at 32OF(0°C), however, the low-
temperaturediametraltests were conducted at 39.2°F (4oc). The following briefly describes
the fatigue test procedures:
1. Flexural Fatigue. Because the gyratory compactor does not produce beam
specimens of the necessary size, specimens for flexural fatigue testing were
prepared using only kneading (ASTM D 3202) and rolling-wheel compaction
(Appendix A). After compaction, they were sawed to the required size of 1.5 x
1.5 x 15 inches 08.1 x 38.1 x 381 mm), and specific gravities and air voids were
measured. Beams were testedusing one-third point, pulse loading, at a frequency
of 1.67 Hz and a duration of 0.1 second. Bending stresses, selected to yield
fatigue lives of approximately 10,000 and 100,000 applications to failure, were
set at 115 and 225 psi (792 and 1,550 kPa) for the low-temperature testing and
80 and 130 psi (551 and 896 k1'a)for the high-temperature testing. Controned-
stress loading was used.
2. Diametral Fatigue. Specimens were prepared using aU three methods, gyratory,
kneading, and roUing-wheel compaction. Testing procedures are described in
Appendix B. Load frequency was 1 I-Iz and load duration as well as mode of
loading were similar to those employed in the flexural testing. Unlike flexural
testing, however, permanent deformation is allowed to accumulate in the
diametral specimens, and stress reversal is not provided. Stress levels were
individually chosen (for each mixture, compaction type, and temperature level)
to produce failure in the ranges of 1,000 to 5,000 applications (high stress level)
and 70,000 to 100,000 applications 0ow stress level).
11

2.3.2 Permanent-Deformation Tests .... For.the permanent-deformation tests, two test
temperatures, 104°F and 140°F (40"C and 60°C), were used. In addition, two compressive
stress levels (without confinement) were employed for the compressive creep testing and two
shear stress levels, for the shearcreep testing. Briefly, the test procedures are describedbelow:
1. Compressive Creep. Specimens 4 inches (101.6 mm) in diameter and 8 inches
(203.2 mm) in height were fabricatedusing gyratory, kneading, and rolling-wheel
methods. Kneading specimens were molded to the required dimensions.
Gyratory and'rotling-wbeel specimens were cored from larger compactedmasses:
ends were sawed as necessary to produce the required height. For both
temperatures, tests were performed at two identical levels of compressive stress,
targeted at 15 and 30 psi (103.4 and 206.7 kPa) but actually averaging 14.5 and
29.0 psi (99.9 and 199.8 kPa), respectively. Loading in these creep tests was
static: it was maintaineduntilthe specimen collapsed or until a maximumof one
hour had elapsed.......................................
2. Shear Creep. The shear creep test was conducted on specimens 4 inches (101.6
mm) in diameter and approximately 2.5 inches (63.5 mm) high. It consists of
applying a step load in a directionparallel to the two plane faces of the specimen.
The relative displacement of the two faces is recorded and a shearcreep modulus
is obtained by dividing the stress applied to the specimen (ratio of shear load to
cross sectional area) by the measured shear strain (ratio of relative displacement
of the faces to the height of the specimen). Shear is applied in the test rig
through loading plates bonded with hydrostone to the parallel faces of the
specimen. When failure is induced, the failure plane is typically inclined at an
angle of about 45". Two identical shear stress levels were applied at both
12

temperatures, averaging 2.4 and 4.8 psi (16.5 and 33.1 kPa) for the low and high
stress levels, respectively. A normal(axial) stress of 2.5 psi (17.2 Ha) was also
applied during the sheartesting. Gyratory and kneading specimens were molded
to the required dimensions. Coring and sawing were used in fabricating the
rolling-wheel specimens. Loading in these creep tests was static: it was
maintained until the specimen collapsed or until a maximum of one hour had
elapsed.
2.4 Mh'ture Pro_eriies
Among the measures that havebeen used as quantitativeexpressionsof mixtureproperties
in controlled-stress fatigue testing are fatigue life (the number of load applications sustained to
"failure")at some fixed stress level; the stress necessary to cause failure at some fixed number
of applications; and the parameters,K1 and K2, of one of the more common fatigue models1.
Each of these measures was considered for use in interpretingresults of the compaction study.
Fatigue life, the clear favorite because of the ease with which it is understood, proved to be a
logically consistent measureof response to fatigue cracking and was selected for use herein. A
wide range in fatigue lives were measured,and logarithmic transformationswere made for most
of the analyses.
According to the original experimental plan for the fatigue testing (Hicks et al., 1990),
the same two levels of stress were to be applied at each of two temperature levels, 32°F and
68°F (0°C and 20°C). Finding stress levels appropriateto the range in test mixtures proved to
IThebasic relationshipbetween fatigue life, N, and applied flexural stress, ¢, is commonlyexpressed as follows:
N = K1 (o)K2
in which K1 and K2 are experimentally determined fatigue parameters.
13

be a very difficult experimental task: large stresses caused early failure, small stresses resulted
in tests that were too time consuming, and stresses that seemed proper for one temperature were
inappropriate for the other. As a consequence, multiple stress levels were used in the fatigue
testing. For the flexural tests, bending stresses of 115 and 225 psi (792 and 1,550 kPa) were
used at 32°F (0°C) and 80 and 130 psi (551 and 896 kPa), at 68°F (20°C). For the diametral
tests, stresses were selected for each mixture, compaction, and temperature combination to
produce fatigue lives in the ranges of 70,000 to 100,000 applications for the low stress level and
1,000 to 5,000 applications for the higl_ level: For purposes of statistical analysis, stress was
actually considered to be a continuous variable. Following calibration of general regression
models, failure lives were computed for two common stress levels, 100 and 175 psi (689 and
1,206 kPa) for the flexural tests. For the diametral tests, finding two stress levels suitable for
temperature levels of 39.2 and 68°F (4 and 20°C) proved impossible. Stresses suitable for one
temperature were well outside the range of stresses used in the testing program at the other
temperature. Accordingly,-different.low--and high. stress levels were used for the two
temperatures in the diametrai testing. For testing at 39.2°F (4°C), the stress levels were 100
and 150 psi (689 and 1,034 kPa) and at 68°F (20°C), 10 and 40 psi (69 and 276 kPa).
Although creep data can be graphically presented in several ways, the creep curve used
in most of the illustrations herein is a double-logarithmic plot of creep modulus versus time
(Figure 2.1). Such a curve suggests several reasonable possibilities for characterizing resistance
to permanent deformation from creep tests, including its slope, the creep modulus (or permanent
strain) corresponding to a f'LXedtime of loading, or the time to reach a critical strain level. The
hypothesis on which such measures are based is that more resistant mixtures have moduli that
are larger and that decrease less rapidly with increasing time. These mixtures also retain their
14

100000
AXIALCREEP ""-
MODULUS(PSI)lOOO0 ..
\
i '
i ! , i1000 _ _ J
0.01 0.1 1 10 100 1000 10000
Time (see)
I- EARLYCOI.IAPSE -- SURVIVEDI-HOURTESTI
Figure 2.1 Typical Creep Curves (1 psi - 6.89 kPa)
15

integrity longer before they eventually collapse under the constant pressure. More complex
measuresbased on postulated mechanicalbehavior seemed unnecessaryfor this evaluation.
The slope of the creep curve, both at its midpointand from end to end, was investigated
rather thoroughly. The midpoint slope, conceptuallypreferable to the end-to-end slope, proved
to be relatively insensitive to mixture and test variablesand failed on occasion to rankmixtures
and test conditions as expected. Further,becausemanyspecimenscollapsed beforereaching the
one-hour test limit and-some" collapsedmuch-sooner, no measure, taken at a fixed time of
loading, seemed to be suitable for use.
Francken (1977) had reported that there is a threshold state of stress beyond which
specimens fail rapidly. However, unpublishedresearchat the University of California, Berkeley
hasfoundthatsuchathresholdseemstobemorecloselyassociatedwithstrainthanwithstress.
Thisresearchhasalsoshownthatthethresholdlevelofstrainisnotaconstantbutisinfluenced
by bothmixturecompositionand stateof stress.However,fortheconditionsinvestigated
herein,reasonableconsistencywas foundinthestrainlevelatwhicha varietyofmixtures
collapsedundercreeploading:thosemore resistanttopermanentdeformationreachedthe
criticalstrainlevelmuch laterthanlessresistantmixtures.Critical(terminal)strainlevelsin
thecurrenttestingprogramwerefoundtobeapproximately0.008in/in(0.008mm/mm) for
compressivecreepand0.02in/in(0.02mm/mm) forshear2. Figures2.2and2.3demonstrate,
foravarietyofrandomlyselectedmixturesandtestconditions,theconstancyatwhichrapid
deteriorationoccursatornearthesecriticallevels.Thetime(seconds)toreachterminalstrain
provedtobea consistentlyreliablemeasureofresistanceofasphalt-aggregatemixturesto
_Theterminalswainlevelsof0.008in/in(0.008mm/mm) and0.02in/in(0.02mm/mm) forcompressiveandshearcreep,respectively,wereselectedsomewhatarbitrarily.Nevertheless,thereisnoreasontosuspectthatselectionofotherreasonablelevelswouldmateriallyaffectthefindingsorthereliabilityofthisinvestigation.
16

O.l
0.0] _ ......iO.OOB
AXIALSTRAIN(in/in)
0.001
O.O00l
O.l 1 10 lO0 1000 10000
TIME(sec)
Figure 2.2 Constancy of Collapse Strain for a Number of RandomlySelected Tests Under Compressive Creep (1 in/in - 1 ram/ram)
17

0.02
0.01
SHEARSTRAIN
(in/in)
0.001
i ii
0.0001 I i I
0.1 1 10 100 1000 10000
TIME(sec)
Figure 2.3 Constancy of Collapse Strain for a Number OfRandomlySelected Tests Under Shear Creep (1 in/in - 1 ram/ram) "
18

permanent deformation and was adopted for use in the compaction investigation. It is not
expected, however, that time to terminal strain will continue to be used as a primarymeasure
of the resistance to permanent deformation in subsequent phases of SHRP Project A-003A.
Other more fundamentalmeasures will be investigated later.
Because stiffness of the asphalt layers materially affects the response of;pavements to
traffic loads, stiffness is a fundamentalmixturepropertyof considerablesignificanceto pavement
performance. Although the compaction study concentratedon permanent deformation and
fatigue cracking, each of the four tests employed in the main experiment also provided an
estimate of mixture stiffness, and stiffness was added to the set of mixtureproperties evaluated
herein. The flexural and diametralfatigue tests provide estimates of resilientbendingand tensile
moduli, respectively, resulting from a short load pulse of 0.1-second duration. Measurements
were recorded after conditioning by 200 load applications for the flexural tests and 50, for the
diametral. Under creep loading, the modulus, either compressive or shear depending on test
configuration, was also determined at 0.1-second loading. Total, not elastic or recoverable,
strains were used in computing the creep moduli.
19

3.0 DESIGN OF MAIN EXPERIMENT
The primary purpose of the compaction study was to evaluate the effect of method of
compaction (Texas gyratory, kneading, and rolling wheel) on the permanent-deformationand
fatigue behavior of asphalt-aggregatemixtures. The main experiment, utilizing four different
test procedures and 16 different mixtures, was designed to accomplish the following:
1. To identify any effects of compaction method on permanent-deformation and
fatigue properties and on the sensitivities of these properties to mixture
composition and
2. If effects are observed, to determine their statistical significance.
Described herein are the experiment designs and analysis techniques employed in the main
experiment.
3.1 Experimept Desifns
The main experiment was,comprised-of a _eries of fractional factorial experiments with
replicationas needed. Mixtureand test variables,discussedpreviously, aresummarizedin Table
2.1. The four series of tests that were performed included diametral and flexural fatigue and
compressive and shear creep. Experiment designs for the testing are shown in Tables 3.1
through 3.3. An important feature of these designs is that they are all based on a common set
of eight asphalt-aggregate mixes (two asphalts, two aggregates, and two asphaltcontents), each
prepared at two levels of compactive effort (as defined by air-void content). Thus, there are
only 16 different asphalt-aggregatemixtures to be preparedfor each series of tests.
Table 3.1 shows the experiment designfor the diametralfatiguetests for each of the three
compaction methods. As gyratory compaction cannotproduce the beams needed for flexural
2O

Table 3.1 Experiment Design for Diametral Fatigue Tests, Main Experiment
Asphalt Asphalt Aggregate Air Temper- Stress Number ofType Content Type Voids amre Repeats
0 0 O 0 O O,l 2
1 0 0 0 1 0,1 1
0 1 0 0 I 0,I I
I 1 0 0 0 0,I 2
0 0 I 0 1 0,1 I
1 0 I 0 0 0,I 2
0 I I 0 0 0,1 2
1 1 1 0 I 0,1 I
0 0 0 1 I 0,I 1
1 0 0 I 0 0,I 2
0 1 0 I 0 0,I 2
1 I 0 I I 0,1 I
0 0 I I 0 0,I 2
I 0 I 1 1 0,I 1
0 I I 1 1 0,1 1
1 1 1 I 0 0,i 2
NOTE: A 25"1 • 2 fractional factorial in 48 runs (25"I * 2 + 32 repeated tests) for each of thethree compaction methods for a total of 144 tests.
The O's and l's indicate low and high levels of the factors, with the following definitions for the"type" factors:
0 1Asphalt Type: AAK-1 AAG-1Aggregate Type: RL RB
21

fatigue testing, a slight modification of the design is required for flexural testing (Table 3.2).
This is a standard 26"1 fractional factorial run at two stress levels.
As one of the principal measures from fatigue testing is the response of fatigue life (N) to
stress level (Gr),it was decided to construct a fractional factorial design on all factors except
stress, running the resultant design at both levels of stress. For the diametral testing, a full
factorial experiment can thus be written as a [31 • 25] * 2. The only fraction of the 3 * 2s part
that permits estimation of most two-factor interactions is a half replicate of the 25 repeated for
each level of the three-level factor, compaction method. Actually, this design provides estimates
of all two-factor interactions. The resulting 3 * 25"1• 2 design for diametral specimens is as
shown in Table 3.1 for each of the three compaction types.
For the flexural fatigue tests, where only the kneading and rolling-wheel compaction methods
are applicable, the full design is a [26] * 2 factorial. The only fraction of a 26 factorial that
permits estimation of two-factor interactions is a half fraction (26"1), which leads to the design
shown in Table 3.2. This design is similar to that in Table 3.1 for each of the three compaction
methods. The difference is that, for the second compaction type, the temperature levels are
reversed for each of the specimens. Thus, Table 3.2 includes a column for compaction type.
Table 3.3 shows the design for permanent deformation using the shear and compressive creep
tests. Structurally, it is the same design as that shown in Table 3.1 for diametral fatigue tests
for each of the three compaction methods. The only difference is that the "repeats" pattern has
been modified. Eight instead of 16 of the 32 different test conditions are repeated for each
compaction method in order to provide an estimate of test precision independent of any
assumptions about which higher order interactions exist. The runs to be repeated are noted with
an asterisk in the last column of Table 3.3.
22

Table 3.2 Experiment Design for FIexural Fatigue Tests,Main Experiment
Asphalt Asphalt Aggre- Air Compac- Temper- No. offion StressType Content gate Voids Type ature Repeats
0 0 0 0 0 0 0,I 21 0 0 0 0 I 0,I I0 1 0 0 0 1 0,I 11 1 0 0 0 0 0,1 20 0 1 0 0 1 0,1 1l 0 1 0 0 0 0,1 20 1 1 0 0 0 O,l 2I I I 0 0 I 0,I I0 0 0 I 0 1 0,I 1I 0 0 I 0 0 0,I 20 I 0 1 0 0 0,I 2I I 0 I 0 I 0,I I0 0 1 I 0 0 0,I 21 0 1 1 0 1 0,1 10 1 1 1 0 1 0,1 11 1 1 1 0 0 0,1 20 0 0 0 1 1 0,1 11 0 0 0 1 0 0,1 20 I 0 0 I 0 0,1 21 1 0 0 1 I 0,1 10 0 1 0 I 0 0,1 21 0 1 0 1 1 0,1 I0 1 1 0 1 1 0,1 II I 1 0 1 0 0,1 20 0 0 I 1 0 0,1 21 0 0 1 1 1 0,I 10 1 0 1 1 1 0,I 11 1 0 1 1 0 0,I 20 0 1 1 1 I 0,1 11 0 1 1 1 0 0,1 20 I 1 I 1 0 0,I 2
I I I I I 0,1 I
NOTE: A 2e'1* 2 fractionalfactorialin96runs(26"I• 2 + 32repeatedtests)includingtwocompaction methods. The O's and l's indicate low and high levels of the factors, with thefollowing definitions for the "type"factors:
0 IAsphalt Type: AAK-I AAG-IAggregate Type: RL RBCompaction Type: Kneading Rolling Wheel
--.
23

Table 3.3 Experiment Design for Shear and Compressive Creep Tests,Main Experiment
Asphalt Asphalt Aggregate Air Temperature StressType Content Type Voids
0 0 0 0 0 0,I=
1 0 0 0 1 0,10 1 0 0 1 0,11 I 0 0 0 0", 1
0 0 1 0 1 0,1*1 0 1 0 0 0,10 1 1 0 0 0,11 ' 1 1 0 1 0", 1
0 0 0 1 1 0,1"1 0 0 1 0 0,10 1 0 1 0 0,1
1 1 0 1 1 0", 1
0 0 1 1 0 0,1"1 0 1 1 1 0,1
0 1 1 1 1 0,11 1 1 1 0 0", 1
NOTE: A 2s'l * 2 fractional factorial in 40 runs (2s'1 * 2 + 8 repeated tests) for each of threecompaction methods for a total of 120 tests.
Runs to be repeated are indicated by an asterisk, *, on the stress condition.
The O'sand l's indicate low and high levels of the factors, with the following definitions for the"type"factors:
0 1Asphalt Type: AAK-1 AAG-IAggregam Type: RL RB
24

In order to keep the mixtureand test conditions for the permanent-deformationtests similar
to those for the fatigue tests, it was decided to use the same fractional factorial design on the
five factors, excluding stress, running the resultant design at both levels of stress. The full
factorial experiment can thus again be writtenas a [31 • 25] * 2.
Table 3.4 summarizes the number of specimens for each testing method in the main
compaction study. As indicated, a total of 480 specimens were tested.
3.2 Analysis Technioues
Designs selected for the compaction study permit the estimation of main effects of the
experimental factors (variables) and all two-factor interactions. A two-factor interaction, for
example, between asphalt type and temperature, simply measures the extent to which the effect
of temperature on properties of AAK-1 mixturesis different from the effect of temperatureon
similar properties of AAG-1 mixtures.
Because of the lack of complete replication,the designs are unbalanced, and it is not possible
to analyze the data as a simple orthogonalarrayusing, for example, Yates' algorithm. Instead,
a more complex General Linear Model (GLM) procedure must be used. This permits the
imbalance caused by incomplete replicationto be handledwhile still using the same mathematical
model and providing the same statistical tests on the various effect estimates.
In the fatigue tests, the response (dependent)variableis the numberof load cycles to failure.
Creep tests, on the other hand, yield a continuousrecord of deformation (strain)as a function
of time. To facilitate the statistical analysis, the time to reach a critical or terminal level of
strainwas selected as the response variableof interest. A modulus was available from each of
the tests to represent mixture stiffness. All statistical modeling and analysis-was based on
logarithmic transformations of the responsevariables.
25

Table 3.4 Sample Size Required for Main Experiment
Complete Factorial 26 • 31 = 192 cells1/2 Fractional 96 cellsTotal Number of Specimens 480
Number of SpecimensTest I
1/2 Fractional I Replicates Total
Fatigue
• Flexural* 64 32 96
• DL_anetral 96.... 48 144
PermanentDeformation
• Shear Creep 96 24 120
• Compressive Creep 96 24 120
GrandTotal I
m
480
_}nly two compaction methods.
26

The analysis of each type of measurement (response) provides an estimate of each effect
(maineffects and two-factor interactions) togetherwith the sum of squaresfor each effect. This
permitsan analysis of variance and an assessment of statistical significance for eacheffect. The
magnitudesof the effects are used to evaluate the significant relationships and to comparethe
three compaction methods.
The precision of these test designs is such that comparisons between compaction methods
will have a reasonably good chance of detecting differences of about 0.3 standarddeviations.
Within a compaction method, differences of about 0.5 standard deviations can be readily
detectable. For some typical coefficients of variations, representative of those reported in the
technical literature and considered by the authors to be reasonable, these come to:
Typical Values Between WithinCompaction Compaction
Methods Methods
Fatigue life 60 percent 18 percent 30 percent
Permanentdeformation 10 percent 3 percent 5 percent
27

4.0 ANALYSIS AND FINDINGS
The purpose of this section is to present the laboratorydatacollected in the compaction
study-including the main experiment as well as auxiliary studies--and to document its analysis
and important findings resulting therefrom. The main experiment was designed to allow
evaluation of the statistical significance of the principal findings of the study. Auxiliary
experiments, performed to complement the main experiment, included the following:
• t-_xtendedPermanent-DeformationStudy - Furtherexploration of the interaction of air
voids and compaction method together with investigations of both repetitive loading and
the application of a larger axial compressive stress during shear creep testing;
• Complex Modulus Study - Investigation of compaction effects on dynamic modulus and
phase angle Ooss tangent), propertiespossibly significant to pavementperformance and
potentially useful for examining dissipated-energy concepts;
• Comparisons with Other Comoaction Methods- Limited comparisons with specimens
produced by the U.S. Corps of Engineersgyratory testing machine (ASTM D 3387) and
by Exxon's rolling-wheel compactor; and
• Comoarisons with Field Cores- Limited comparisons with field cores taken from
pavements on two California highways, US 101 and I 80.
These auxiliary studies were generally limited to a single asphalt-aggregatemixture, and the
focus was principally on gyratory and kneading compaction. They were not designed as
statistical experiments, and the possible statistical significance of their findings was not assessed.
4.! ]Vl[_inF_,xveriment_.
As detailed earlier, the main experiment was designed as series of unequallyreplicated,
fractional factorials. The factor or variable of primary interest was, of course, compaction
28

method. Sixteen asphalt-aggregate mixtures were investigated: each was tested at two
temperature levels and two stress levels. Mixture properties or response measures, which were
of three types, included the following:
• Resistance to permanent deformation
- Time under unconfined compressive or shear creep to reach a limiting strainlevel, 0.008 in/in (0.008 mm/mm) for compressive creep and 0.02 in/in (0.02mm/mm) for shear creep
• Resistance to fatigue cracking
- Number of load applications to failure
• Stiffness modulus
- Compressive creep modulus at O.l-second load duration (compressive creep)- Shear creep modulus at 0. l-second load duration (shear creep)- Flexural stiffness at 200 load applications of 0.1-second load pulse (flexural
fatigue)- Tensile stiffness at 50 load applications of 0. l-second load pulse (diametral
fatigue)
From the very beginning of the laboratory work, compacting specimens of widely varying
composition to targeted air-void contents proved to be an especially difficult task, regardless of
compaction method. Despite the considerable attention that was directed to this matter, it proved
impossible to prepare a set of specimens without variability in air voids and whose average
air-void content matched the targeted level. These difficulties were exacerbated by the extreme
sensitivity of the response measures (identified above) to air-void content. To reduce the effects
of off-target air voids, the statistical modeling and analysis treated air-void content as a
continuous rather than discrete variable, utilizing a general regression approach. A similar
approach, previously explained, was used to treat stress level. The calibrated regression models
were used to provide estimates of the response measures corresponding to _arget air-void
contents of 4.5 percent (low level) and 11.5 percent (high level) as well as the target stress
levels. Statistical testing of the main compaction experiment is detailed in Section 4.1.6.
29

4.1.1 Comvaction Processes. Compaction equipment included two Texas gyratory shear
devices, one for fabricating 6 x 8-inch (152.4 x 203.2 ram) cylinders and the second for
fabricating 2.5 x 4-inch (63.5 x 101.6 mm) briquets;a Triaxial Institutekneadingcompactor for
fabricating 3.5 x 3.5 x 15-inch (88.9 x 88.9 x 381 ram)beams, 4 x 8-inch (101.6 x 203.2 mm)
cylinders, and 2.5 x 4-inch (63.5 x 101.6 ram) briquets; and a "homemade" rolling-wheel
compactor which fabricated 16 x 16 x 9-inch (406.4 x 406.4 x 228.6 mm) slabs from which
specimens of the required dimensions were cored and/or sawed. Details regarding the
compaction processes are presented in Appendix A. ....
In general, the performance of each compactor was quite satisfactory. The gyratory
compactors excelled in the speed with which compaction was achieved. By comparison,
kneading compaction, particularly to low void levels, was much more time consuming. At the
same time, the kneading compactor proved moreversatile, especially in its ability to form large
beam specimens. Rolling-wheel compactionis distinguished by the larger quantitiesof materials
required for compaction. This reduced the totaJtime required for mixing and compaction and
was well suited for producing the large numberof specimens required in the compaction study.
From each rolling-wheel slab, 16 specimens could be fabricated, four each for compressive
creep, shear creep, flexural fatigue, and diametral fatigue testing.
With each compaction method, careful attentionwas given to following procedures that
resulted in uniform, homogeneous specimens. In general, this effort was successful, and the
various compaction methods could not be distinguished in their abilities to consistently produce
specimens that were internally uniform. At the same time, the surfaces of all molded specimens
were distinctly different from their interiors. In particular, flushing of the asphaltwas common
on the surfaces of high-asphalt-content specimens prepared by both gyratory and kneading
compaction.
3O

4.1.2 Resistance to Permanent Deformation. Althoughearly work had conclusively shown
thatcompaction methodcan have a distincteffect on engineering properties of asphalt-aggregate
mixtures (for example, Vallerga, 1951), the initial expectation when this study began was that
gyratory, kneading, and rolling-wheel compactorswere sufficiently similar that anydifferences
in mixture properties would likely be small and, in terms of pavement performance,
insignificant. That expectation was quickly dispelled when testing began: when subjected to
either compressive or shear creep, early collapse was much more prevalent in gyratory
specimens than in kneading or rolling-wheel specimens. It remained, of course, to establish the
extent to which thispatternpersisted for a range of mixturesand test conditions, to quantifythe
differences, and to ascertain their statistical and practical significance.
Average (geometric)resistancetopermanentdeformation-expressed as the time(seconds)
to reacha critical level of strainunder creeploading-is summarizedfor a range of mixtureand
test conditions in the right-mostcolumns of Tables4.1 and 4.2. For both compressiveand shear
loading, kneading specimens are generally most resistant to permanent deformation, followed
in orderby rolling-wheel and gyratory specimens. However, at the high air-void content (11.5
percent) and for the chert (IU..) aggregate, the effect of compaction method on permanent-
deformation resistance is greatly diminished. Table 4.3 provides an overall summary, ranking
the threecompaction methods not only on the basis of overall performance but also in terms of
the 12 individual mixture and test conditions of Tables 4.1 and 4.2 and confirming the general
effect, noted above, of compaction methodon resistance to permanent deformation.
One of the difficulties in using time to terminal strain as a response variable is that it
must be estimated for specimens which survive the one-hour test limit. Linear extrapolations--
of the logarithmic transformations, as used herein, overestimate the true response because they
ignore the downward turnin the creep curve which heraldsthe beginning of collapse. The real
31

Table 4.1 Summary Results of UnconJ'med Axial Compressive Creep Tests
Average Creep Modulus at 0. I Seconds, Average Time to Terminal Axial Strainpsi of 0.008 in/in (0.008 ram/ram),
oecoods
Gyrator,/ Kneading Rolling Gyratory Kneading RollingWheel Wheel
All Tests 19,500 22,400 20,900 28.4 249.1 43.8
AsphaltType
• AAK-I 22,700 24,300 23,900 63.6 388.8 79.2
• AAG-I 16,700 20,800 18,300 12.7 159.5 24.2
• Percent Difference 30.4 15.5 26.5 133.4 83.6 106.4
Asphalt Content
• Optimum 21,900 2.5,900 23,800 64.7 1,037.7 66.2
• High 17,300 19,400 18,400 12.5 59.8 28.9
• Percent Difference 23.5 28.7 25.6 135.2 178.2 78.4
Aggregate Type
• Chert (RL) 16,500 16,600 17,100 9.8 9.6 10.6
• Granite (RB) 22,900 30,400 25,600 82.3 6,455.2 181.3
• Percent Difference 32.5 58.7 39.8 157.4 199.4 177.9
Air Void Content
• 4.5+_ 32,200 39,300 32,800 622.1 18,427.7 357.1
• 11.5+% 11,800 12,800 13,300 1.3 3.4 5.4
• Percent Difference 92.7 101.7 84.6 199.2 199.9 194.0
Test Temperature
• 104"F (40"C) 37,400 43,000 40,100 94.2 1,433.0 276.6
• 140"F (60"C) 10,100 11,700 10,900 8.6 43.3 6.9
• Percent Difference 114.9 92.5 114.5 166.5 188.3 190.3
Vertical Stress
• 14.5 psi 19,500 22,200 20,400 127.7 673.7 113.7
• 29.0 psi 19,500 22,700 21,400 6.3 92.1 16.8
• Percent Difference 0.0 2.2 4.8 181.2 151.9 148.5
Note: Percent difference is the difference expressed as a percentage of the average; 1 psi --6.89 kPa.
32

Table 4.2 Summary Results of Unconl'med Shear Creep Tests
,u
Average Creep Modulus at 0. l Seconds, Average Time w Termina] Shear Strainpsi of 0.02 in/in (0.02 ram/ram), seconds
Gyramry Kneading Rolling Gyratory Kneading RollingWheel Wheelir
All Tests 2,570 2,670 2,820 21.9 59.8 42.1
Asphalt Type
• AAK-1 2,980 2,980 3,480 33.8 S5.4 100.1
• AAG-1 2,230 2,400 2,280 14.2 41.9 17.7
• Percent Difference 28.8 21.6 41.7 81.7 68.3 139.9
Asphalt Content
• Optimum 2,760 3,020 3,510 26.6 83.7 80.5
• High 2,400 2,370 2,260 18.0 42.7 22.0
• Percent Difference 14.0 24.1 43.3 38.6 64.9 114.1
Aggregate Type
• Chert (RL) 2,460 2,350 2,550 11.8 21.3 15.0
• Granite (P,B) 2,690 3,040 3,110 40.7 168.2 117.8
• Percent Difference 8.9 25.6 19.8 110.1 155.0 154.8
Air Void Content
• 4.5+% 3,500 4,110 4,380 50.5 450.9 235.2
• 11.5_.+_ 1,900 1,740 1,810 9.5 7.9 7.5
• Percent Difference 59.2 81.0 83.0 136.7 193.1 187.6
Test Temperature
• 104"F (40"C) 6,760 6,700 7,080 120.3 334.2 250.6
• 140"F (60"C) 980 1,060 1,120 4.0 10.7 7.1
• Percent Difference 149.4 145.4 145.4 187.1 187.6 189.0
Shear Stress
• 2.4 psi 3,020 2,990 3,330 98.9 389.9 195.8
• 4.8 psi 2,190 2,390 2,380 4.8 9.2 9.0
• Percent Difference 31.9 22.3 33.3 181.$ 190.8 182.4
Note: Percent difference is the difference expressed as a percentage of the average; 1 psi --6.89 kPa.
33

Table 4.3 Effect of Compaction Method on Resistance to Perm*nent Deformation
]Rm_g in the Twelve Mixture mKITest VariableCompaction Overall Comparisonsof Tables 4. i and 4.2
Method Test Resistance I
Strongest Intermediate I Weakest
Compressive Weakest None 4 Times 8 Times
Gyratory Creep
Shear Creep We._est 1 Time None 11 Times
Compressive Strongest 10 Times 1 Time 1 Time
K_._lmg Creep
Shear Creep Strongest 10 Times 2 Times None
Compressive Intermediate 2 Times 7 Times 3 TimesRolling ..... CropWheel
Shear Creep Intermediate 1 Time 10 Times 1 Time
34

concern is whether the overestimates are so large that, when grouped with other observations,
the averages are meaningless. Rankingtechniquesoffer an alternative that avoids the possible
bias of inflated averages.
It was possible to use ranking techniquesin interpretingboth compressive and shear test
results because direct comparisons among the three compaction methods were possible for 32
unique combinations of mixtures, temperatures, and stress levels. For each of these
combinations, the three compaction methods were ranked according to the resistance of the
specimens to permanent deformation. Again, time to terminal strain was considered an
appropriateindicator of deformation resistance. Eachcompaction method was assigned a rating
of 1, 2, or 3, depending on its ranking: a rating of 1 signified the greatest resistance to
permanent deformation. Results are summarizedas follows:
Compaction Number of #1 Rankings Average Rating
Method Compression Shear Compression Shear
Kneading 16 13 1.63 1.78
Rolling Wheel 9 13 2.06 1.88
Gyratory 7 6 2.31 2.34
This analysis thus confirms that kneadingspecimens are mostresistantto permanentdeformation
and that gyratory specimens are least resistant.
Another objective of the main compaction experiment was to determine whether
compaction methods might differ in terms of the sensitivity of engineering properties of the
specimens they produce to mixture composition. Insofar as insignificant effects are not
artificially exaggerated, sensitivity is considered to be a desirable attribute: certainly, a
compaction procedure that effectively masks important compositional effects would be
unattractive. Mixture variables in the main experiment included asphalt type, asphaltcontent,
aggregate type, and air-void content. With two levels of each, a total of 16 different mixtures
35

were included. Because of the fractionalnatureof the experiment, however, only eight mixtures
were evaluated at each combinationof temperature and stress level. The coefficient of variation
of the time to terminal st.r_nfor these eight mixtures(for each combination of temperature
stress level) was selected as a measure of the sensitivity to mixture composition3. A small
coefficient suggests that the resistancesof the eight differentmixtures to permanentdeformation
are much the same, that is, the resistances are insensitive to the rather large compositional
differences among the eight mixtures. A large coefficient, on the other hand, reflects a greater
sensitivity to mixture composition. Results-of--the. computations-summarized in Table
4.4-indicate that the permanent-deformation response of kneading specimens is generally more
sensitive to mixture composition than thatof specimens compacted by other techniques. The
evidence is compelling because, with exception of the high-temperature shear testing, kneading
specimens consistently rankednear or at the top across the range of stresses, temperatures, and
test methods.
An additional matterof interest is the effect of mixtureand test variables on resi.,
of the mixtures to permanentdeformation. The orderof the effects is generally known, a priori,
and comparisons can not only verify this a priori order and confh'm thattime to terminal strain
is a consistent measure of resistance to permanent deformation but, more importantly, can
identify compaction "abnormalities." Results of these comparisons, summarizedin Table 4.5,
are quite consistent and confu'ma priori expectations. Nothing unusual is foundwith any of the
compaction methods or with the chosen response measure, time to terminal strain.
While time to terminal strain is a useful quantification of permanent-deformation
response, it does not capture the full extent of informationcollected in creep testing. Additional
3The coefficient of variation is a useful, although imperfect, measure of sensitivity tomixturevariables. Its imperfections arise because it includes not only mixture effects butQrsources of variability as well (including random and testing errors).
36

Table 4.4 Effect of Compaction Method on Sensitivity ofPermanent-Deformation Response to Mixture Variables
Test Ceefficient of Variation of Seconds to Termini/Strain (Percent)Stress Temperature Method I
Gyratory Kneading _ Rolling Wheel
Axial 224.11 215.0 166.4Law
Shear 108.0 236.5 147.7Low
Axial 264.6 264.5 217.8High
Shear 177.7 213.6 263.6
Axial 163.6 264.6 153.6Low
Shear 84.3 !43.3 118.4_th
Axial 125.8 264.5 182.6l-Iigh
Shear 100.7 111.3 208.4
m
37

Table 4.5 Effect of Mixture and Test Variables on Resistanceto Permanent Deformation
Compaction MethodVariable Test
Gyratory I Kneading I Rolling Wheel
Compressive AAK-I > AAG-I AAK-I > AAG-I AAK-I > AAG-I
Asphalt Type creep
Shear creep AAK-I • AAG-I AAK-I • AAG-I A_-I • AAG-I
Compressive Optimum • High Optimum • High Optimum • High
Asphalt Content creep
Shear creep Optimum • High Optimum • High Optimum • High
Compressive Granite (RB) • Granite (RB) • Granite (R.B) •creep " Chert (RL)..... Chert (RL) Chert (RL)
Aggregate TypeShear creep Granite (P,B) • Granite (P,B) • Granite 0_B) •
Chert (ILL) Chert (RL) Chert (P.L)
Compressive Low • High Low • High Low • High
Air Void Content creep
Shear creep Low • High Low • High Low • High
Compressive Low • High Low • High Low • High
Temperature creep
Shear creep Low • High Low • High Low • High
Compressive Low • High Low • High Low • High
Stress creep
Shear creep Low • High Low • High Low • High
b-
38

information is available from graphic portrayals, usually double logarithmic plots of creep
modulus or creep compliance as a function of time. Figure 4. I, showing the collective results
of the compressive creep testing, exemplifies the creep curve and provides visual confirmation
of the superiority of specimens prepared by kneading compaction 4. Each of the lines on Figure
4.1 represents a total of 40 specimens: the sum of the creep moduli of the 40 specimens is
shown as the ordinate.
Unfortunately, composite curves such as these are not faithful representations of typical
creep response and may give a distorted image of collective response: When specimens collapse
before reaching the one-hour test limit, their moduli are thereafter considered to be zero. Thus,
each curve represents fewer and more resistant specimens as the loading time increases. As a
consequence, the collective curve is less steeply sloped than the average of its individual
components. At one hour, the curve is quite sensitive to the number of surviving specimens,
perhaps more so than their individual moduli. In Figure 4. I, the number of specimens surviving
the one-hour test included eight kneading specimens, six rolling-wheel specimens, and six
gyratory specimens. Again focusing on Figure 4.1, gyratory specimens appear superior to
rolling-wheel specimens at short as well as long loading times, a finding that appears
contradictory both to laboratory experiences in handling and testing these specimens and to the
numerical comparisons summarized above. This apparent contradiction can be partly explained
by differences in the average air-void contents. The voids in the rolling-wheel specimens
averaged 7.3 percent, 0.7 percent more than the gyratory average of 6.6 percent. All other
factors being equal, mixtures with larger air-void contents are less resistant to permanent
deformation than those with smaller void contents. Figure 4.2 illustrates the effect of
4The symbols G, K, and R represent gyratory, kneading, and rolling-wheel compaction,respectively. Corresponding average air-void contents are shown in parentheses.
39

A A
m oi
F'_,ure 4.1 Effect of Compaction on Compressive Creep Modulus (1 psi = 6.89 k.Pa)
40

V V V
mm 0 +
Figure 4.2 Effect of Compaction on Shear Creep Modulus (1 psi = 6.89 kPa)
41

compaction methodon shearcreep responseand confirms thatkneadingspecimens aregenerally
more resistant to permanentdeformationthangyratory specimens.
The interactive effects of compactionmethod and the various mixtureand test variables
are illustratedby the composite response curves of Figures 4.3 through 4.14. These figures are
paired such that the f'trstof each pair representsresponse to compressive loads and the second,
to shear loads. The legend of each figure includes information about the average air voids for
each particular set of conditions.
The experimentdesign was arrangedso that two-way interactions could be investigated.
This means that one could compare, for instance, the sum of creep moduli of all granite (P.B)
kneading specimens with the sum of creep moduli of all chert (RL) kneading specimens. These
sums can then be furthercompared with the corresponding specimens preparedby gyratory or
rolling-wheel compaction.
Figure 4.3 indicates that the compressivecreep modulus is sensitive to the relative effect
of asphalt type. The higher viscosity_of AAK_-Iasphaltat temperaturesof 104 and 140°F (40
and 60°C) causes its mixtures to exhibit better resistance to permanent deformation.
Furthermore kneading specimens exhibit a consistently higher modulus than those preparedby
gyratory or rolling-wheel compaction. It is also interesting to note, that, regardless of asphalt
type, B (AAK-1) or V (AAG-1), kneading specimens seem to approach the same behavior at
long times of loading. The biggest differences between kneading and the other compaction
methods are encountered for the specimens fabricated with the AAG-1 asphalt. Gyratory
sp_mens behave similarly to roUing-wheelspecimens: the slight differences between them can
be explained by differences in the average void ratios. Figure 4.4 indicates that the shearcreep
modulus is also sensitive to asphalt type but at long times of loading the compaction method
seems to have a predominanteffect with kneading specimens being slightly more resistant.
42

A A _ A A
i I I I i I
Figure 4.3 Combined Effects of Compaction and Asphalt Type on CompressiveCreep Modulus, AAK-1 [B] and AAG-1 IV] (1 psi = 6.89 k]Pa)
43

I I I I I I
mm 0 + <> HI
V
Figure 4.4 Combined Effects of Compaction and Asphalt Type on ShearCreep Modulus, AAK-1 [B] and AAG-I m (I psi = 6.89 kPa)
44

Figure 4.5 indicates that the compressive creep modulus is also somewhat sensitive to
asphalt content. Specimens prepared with optimum 0ow) asphalt contents perform slightly
better. The data also indicates that kneading specimens exhibit creep moduli consistently larger
than rolling-wheel or gyratory specimens. This difference is especially noticeable with optimum
asphalt contents. The combined effects of compaction method and asphalt content on shear creep
modulus are illustrated by Figure 4.6.
While the optimum asphalt content (0) was chosen to be representative of a Hvecm
mixture design, the high asphalt content was selected to be somewhat indicative of the Marshall
(75-blow) mixture design. It is generally accepted that Hveem designs are more resistant to
permanent deformation than Marshall designs. Some have also argued that mixtures designed
by the Marshall method have not always performed well, especially in hotter climates.
Figure 4.7 shows that the compressive creep modulus is sensitive to aggregate type.
Mixtures prepared with granite (RB) perform consistently better than those prepared with chert
(P.L). It is also apparent that the granite (R.B) kneading specimens perform significantly better
than those prepared by either the gyratory or rolling-wheel method. The difference is magnified
if one realizes that the average void ratio for the kneading specimens is 7.7 percent and that the
average for the roUing-wheel and gyratory specimens is about 6.5 percent. With such a large
difference in average air-void content, it would be expected that the specimens prepared by
kneading compaction might exhibit slightly lower creep moduli. It is interesting to note that the
behavior of the granite (RB) gyratory specimens is very similar to the granite ('P,B)rolling-wheel
specimens. Mixtures prepared with the chert (RL) have a behavior more comparable within all
compaction methods. The significantly lower values of the chert (RL) rolling-wheel specimens
can be explained by the significantly higher void content (8.2 percent versus 6.7 percent for
gyratory or 7.5 percent for kneading specimens). The shear creep response is also quite
45

A A A A _ A
I I I I I I
• • _mmq-
Figure ,1.5 Combined Effects of Compaction and Asphalt Content on CompressiveCreep Modulus, Optimum Asphalt [0] and High Asphalt [I] (I psi = 6.89 kPa)
46

A _ A _ _ A
I I I ) I I
mm D + <_ HI
Figure 4.6 Combined Effects of Compaction and Asphalt Content on Shear CreepModulus, Optimnm Asphalt [0] and High Asphalt [1] (1 psi -- 6.89 kPa)
47

A A A _ A
V _ V
I I I I I I
Figure 4.7 Combined EfTects of Compaction and Aggregate Type on CompressiveCreep Modulus, ILL Chert [1] and RB Granite [W] (1 psi = 6.89 kPa)Fig 4.5
48

sensitive to aggregate type (Figure 4.8). Again, granite ('P,.B)specimens perform much better
than chert (P,.L)specimens. The differences between gyratory and kneading specimens are more
noticeable in granite (R.B) specimens.
Figure 4.9 shows the large sensitivity of the compressive creep moduli to void content.
The low void data indicate that kneading specimens exhibit higher resistanceto permanent
deformation even though the average void content (4.2 percent) is higher than that of gyratory
specimens (3. I percent). The void content also affects the shear creep response of the mixtures
(Figure 4. I0). The differences between gyratory and kneading-specimens are more noticeable
at low void contents.
Figure 4.11 indicates that one of the most sensitive factors influencing the permanent-
deformation characteristics of asphalt mixtures is temperature. Also noticeable is the
significantly different behavior of kneading specimens from that of specimens compacted with
the other devices. The differences increase with temperature. Figure 4.12 confirms that
permanent-deformation behavior in shear is also particularly sensitive to temperature.
Differences between gyratory and kneading specimens appear to be larger at high temperatures.
Figure 4.13 indicates that, regardless of stress level, kneading specimens consistently
perform better than specimens produced by either of the other methods. Figure 4.14 indicates
that the shear creep response is more sensitive to stress level than the compressive creep
response. In both cases, however, kneading specimens perform better than gyratory specimens.
The above data indicates that the largest difference in the compressive creep response is
between kneading and gyratory specimens and that rolling-wheel specimens generally have an
intermediate response. The differences are particularly noticeable for mixtures fabricated with
AR..4000 asphalt (AAG-I), with optimum (low) asphalt content, and granite (P.B) aggregate.
They are exacerbated when air voids are low and when testing is performed at high temperatures
49

A A A
I I I I I I
i
F'_ure 4.8 Combined Effects of Compaction and Aggregate Type on ShearCreep Modulus, RL Chert [T] and RB Granite [W] (I psi --- 6.89 kPa)
5O

/_gure 4.9 Combined Effects of Compaction and Air-Void Content on CompressiveCreep Modulus, Low Voids [0] and High Voids [I] (l psi -- 6.B9 kPa)
51

I I I I I I
Figure 4.10 Combined Effects of Compaction and Air-Void Content on ShearCreep Modulus, Low Voids [0] and High Voids [1] (1 psi = 6.89 kPa)
52

A A _ A _ A
I I I I I I
?
F'_re 4.U Combined Effects of Compaction and Temperature on CompressiveCreep Modulus, 104°F (40°C) [0] and 140°F (60°C) [1] (1 psi - 6.89 kPa)
53

I I I I I I
............T-_
Figure 4.12 Combined Effects of Compaction and Temperature on Shear CreepModulus, 104°¥ (40°C) [0] and 140°F (60°C) [1] (1 psi = 6.89 IcPa)
54

I I I I I I
Figure 4.13 Combined Effects of Compaction and Stress Level on CompressiveCreep Modulus, 14.5 psi [0] and 29.0 psi [1] (1 psi = 6.89 kPa)
55

A _ _ A A
c_ _ cc_ c5 r-. r-:
I I I I I I
! ,.. ..
i
Figure 4.14 Combined Effects of Compaction and Stress Level on ShearCreep Modulus, 2.4 psi [0] and 4.8 psi [1] (1 psi - 6.89 kPa)
56

and high stress levels. At high temperaturesthe AAG-1 asphalt is less viscous than the AAK-1
asphalt. This makes the resistance to permanentdeformation moredependenton the contribution
of the aggregate in the mixture. The extended permanent-deformation study investigates
specifically the differences in performance between gyratoryand kneading specimens for these
particularconditions.
4.1.3 Resistance to Fatigue Crackine. In additionto permanent deformation, possible effects
of compaction method., on.. resistance, to. fatigue, cracking were also of great interest.
Con_olled-stress testing in both flexural and diametral modes was conducted to evaluate these
effects. The responseparameterwas the numberof load applicationsto failure. In the flexural
tests, failure occurred catastrophically when cracking propagatedcompletely through the beam
specimen. In the diametral tests, failure was defined as the number of load applications
producing either collapse or permanent deformationin the direction of load application of 0.20
inch (5.1 ram) at 39.2°F (4°C) or 0.50 inch (12.7 ram) at 68°F (20°C), whichever occurred
firsts . This measure was chosen not only for its convenience but also because otheralternatives
seemed no better suited for isolating effects of fatigue cracking from other mechanisms which
produce permanent distortion and cracking undercyclic diametralloads.
Results of the flexural-fatigue testing are summarized in Table 4.6. Gyratory
compaction was excluded from the flexural testingprogrambecause beams of the requiredsize
could notbe fabricated. Rolling-wheel specimens were generally superiorthroughout the range
of comparisons. The average rolling-wheel specimen failed after 30,000 applications compared
to 22,800 for the avexage kneading specimen, a difference of approximately 27 percent.
5Except for weak specimens at 68°F (20°C), failure was typically by cracking and not bycrushing or other modes. Once a crack formed, it propagated rapidly: under thesecircumstances the deformation limits were simply a convenient method for shutting down theequipment.
57

Table 4.6 Summary Results of FIexural Fatigue Tests
AverageInitialFlexuralStiffness,psi AverageNumber ofLoad Applicationsto Failure
Gyratory Kneading Rolling RollingWheel Gyratory Kneading Wheel
All Tests 529,000 573,000 22,800 30,000
AJph_tType
• AAX-1 582,000 590,000 26,300 36,200
• A.AG-1 480,000 $57,000 19,800 24,800
• Percent Difference 19.2 5.8 28.2 37.4
Asphalt Content
• Optimum 559,000 627,000 25,000 43,400
• High 500,000 524,000 20,800 20,700
• Percent Difference 11.1 17.9 18.3 70.8
Aggregate Type
• Chert (ILL) 469,000 535,000 17,000 31,100
• Granite (RB) Beams can $96,000 615,000 Beams can 30,700 28,900
• Percent Difference not be 23.8 13.9 not be 57.4 7.3compacted ,;umpacted
Air Void Content
• 4.5+% 715,000 797,000 57,600 76,200
• 11.5+% 391,000 412,000 9,050 I 1,800
• Percent Difference 58.6 63.7 145.7 146.4
Test Temperature
• 32"F (0"C) 985,000 1,095,000 81,600 73,200
• 68"F (20"C) 284,000 300,000 6,390 12,300
• Percent Difference 110.5 114.0 171.0 142.4
Flexura/Stress
• I00 psi 571,000 613,000 $1,800 93,200
• 175 p'; 490,000 $36,000 6,380 9,640
• Percent Difference 15.3 13.4 171.0 162.5
Note: Percent difference is the difference expressed as a percentage of the average; 1 psi -6.89 kPa.
58

In controned-stress testing, the stiffest mixtures are usually the best performers. Table
4.6 seems to confirm this notion: based on average (geometric) performance, rolling-wheel
specimens were consistently stiffer than their kneading counterparts. Combined effects of
mixture stiffness and compaction method on flexure] fatigue life are illustratedin Figures 4.15
and 4.16. Each point on these figures representsan individual test (or an average in the case
of replicates): in all, the entire set of mixturevariables and test temperatures is represented.
The lines were fit by normal least squarestechniques. Correlationsbetween In fatigue life and
In stiffness were reasonably good: coefficients of determinationwere 0.69 (rolling wheel) and
0.94 (kneading) for the low-stress testing and 0.83 (rolling wheel) and 0.93 (kneading) for the
high-stress testing.
This analysis provides furthercont'h-mationthat stiffer mixtures do perform better in
controlled-stress fatigue tests. More importantly,the nearness of the best-fit lines for kneading
and rolling-wheel compaction suggests that at least some of the difference between compaction
methods can be attributedto mixture stiffness.
Results of the diametral-fatiguetesting are summarizedin Table 4.7. This analysis is
particularly important because gyratory specimens were included in the diametral testing
program. The diametral tests confirm that rolling-wheel specimensresist fatiguecracking better
than kneading specimens. Gyratory specimens, which could not be tested in fiexural fatigue,
proved superior to both kneading and rolling-wheel specimens when tested in the diametral
configuration.
A pn771ing feature of the diametral data, as reported in Table 4.7, is that kneading
specimens (although failing sooner than rolling-wheel specimens) are somewhat stiffer than
roUing-wheelspecimens. Nevertheless, collective examinationof individualtestsconfirmed that
stiffer specimens provide better resistanceto cyclic diametralloading for each of the three
59

........................................ o,° ° °,- O-o° ° .: --: .............. .; ........• * , * * °• , * ° ,• t * * * !t * * i i• * ° , *
1000000 .............................................................. o, i ° , , , ' * ' '
........ ...;°.. &.., ......° * i ° * i ° "
: ................... ".**'°..',_.._.'.i * ° * *, * ° , ° ,
"_ 100000 ' ............... ::,o ..... L.. ,.......................J, J • °°*
::::::::::::::::::::::::::::::::::, , --'---:---:--'-.:-&............ -.........
, , . , ,. *°.. ..... ,
, °
1 1 '" | 1 ; ..... *
_ i i * * i
, la J : t , * i * * i
_ ', ......I0000 ..................................
.°_ .... ° ...... ..°.°.°°°.°°li
.-'T...... ,= '...... F**- °;--* -¢---:- -*'.-- _.--_.............. -i........ ,
..$...: ........ j,,: ........4-_::-'_ ...... _........ :...... _..-+-.4--_,_._t,w-K_ect_O ....... :
o, | , , , , | , , , • _v *
4- ��$#œ��_,........ :...... ,_----',---<--,_-_.._.._-RaZtt_-'=,........ :I , , i , * * * | * *
A .I .L i.J,...°° ...... ......................'.--'---'--' .......... °.. ...... ..°°..
s , , , t D * , *! ! t . I , , o *
', : ', *, ,, ,, ,, ,,I000 1 i i i i i i I _ i
I00000 1000000 •
Flexural Stiffness (psi)
Figure 4.15 Combined Effects of Compaction and Mixture Stiffnesson Flexural Fatigue at Low Stress, 100 psi (1 psi - 6.89 kPa)
60

, , , ,
Figure 4.16 Combined Effects of Compaction and Mixture Stiffn_on FIexural Fatigue at High Stress, 175 psi (I psi -" 6.89 kPa)
61

Table 4.7 Summary Results of Diametral Fatigue Tests
i
Average Initial Tensile Stiffness, psi Average Number of Load Applicationsto Failure
Oyratory Kneading Rolling Gyrawry Kneading RollingWheel Wheel
All Tests 663,000 660,000 627,000 11,100 9,150 10,600
Asphalt Type
• AAK-1 436,000 437,000 486,000 5,170 4,060 6,250
• AAG-1 1,010,000 997,000 809,000 23,800 20,600 17,900
• Percent Difference 79.5 78.2 49.9 128.6 134.2 96.5
Asphalt Content
• Optimum 760,000 759,000 692,000 12,200 9,140 7,870
• High 579,000 573,000 569,000 10,100 9,160 14,200
• Percent Difference 27.1 28.0 19.6 18.5 0.0 57.6
Aggregate Type
• Chert (RL) 670,000 662,000 570,000 9,760 6,580 4,860
• Granite (P,B) 657,000 658,000 690,000 12,600 12,700 23,100
• Percent Difference 2.I 0.6 19.0 25.6 63.7 130.4
Air Void Content
• 4.5+% 903,000 966,000 863,000 43,600 39,000 45,100
• 11.5+% 488,000 451,000 456,000 2,820 2,140 2,480
• Percent Difference 59.7 72.8 61.8 175.7 179.2 179.1
Test Temperature
• 39.2"F (4"C) 886,000 953,000 992,000 15,500 10,700 7,740
• 68"F (20"C) 497,000 456,000 397,000 7,450 7,820 14,500
• Percent Difference 56.3 70.5 85.7 64.4 31.1 60.6
Tensile Stress
• Low 695,000 684,000 663,000 30,600 33,200 64,900
• High 634,000 636,000 594,000 4,020 2,520 1,730
• Percent Difference 9.2 7.3 11.1 153.5 171.8 189.6
Note: Percent difference is the difference expressed as a percentageof the average; 1 psi =6.89 kPa; low stress is 100 psi at 39.2°F (4°C) and 10 psi at 68°F (20°C); high stressis 150 psi at 39.2°F (4°C) and 40 psi at 68°F (20°C).
62

compaction methods (Figures 4.17 and 4.18). As evidenced by coefficients of determination in
the range of 0.49 to 0.78 (tabulated below), the fit between In fatigue life and In stiffness is
weaker for diametral testing than for flexural testing.
Coefficient of Determination
Stress Temperature (p-value)
Gyratory Kneading Rolling Wheel
0.587 0.778 0.540Low(0.0267) (0.0037) (0.0379)
Low
High 0.649 0.615 0.688(0.0157) (0.0212) (0.0109)
0.508 0.780 0.564Low(0.0471) (0.0037) (0.0317)
High0.494 0.702 0.642
High (0.0517) (0.0094) (0.0169)
The apparent contradiction in Table 4.7 between compaction's collective stiffness effects
and its fatigue effects remains unexplained. It may be due to the relative inaccuracy of stiffness
measurements in diametral testing or may be a harmless artifact of the averaging process which,
with small sample sizes and data extremes, may have produced misleading results. At the same
time, possible confounding effects of surface condition (as-molded or cut) should not go unnoted.
Gyratory and kneading specimens were tested as molded while rolling-wheel specimens, on the
other hand, were cored from compacted slabs and sawed to the proper heights. The possible
effect of surface condition is further addressed in Section 5.0.
Table 4.8 summarizes the comparative effect of compaction method on fatigue resistance.
On the basis of the diametral-fatigue testing, gyratory specimens were found to be the most
resistant. Both flexural and diametral testing confirmed that rolling-wheel specimens were
superior to kneading specimens in terms of fatigue resistance. The fatigue response of rolling-
63

a. Low Temperature, 39.2°F (4°C)
10000000 ..............................................................................................................................................................
41.
I000000 ............
° _ i • Gyratory
_ ....""i 0 Kneading
--_ 0
r._ ...........................................................................,......>__S._,:................................. • )_oLti,__,,t= I00000 ....................................................................• 0 ...I i.ll ............Gyrltory
............. _neoding
10000 ..............................:_.':.................................................................................................................................................$'" • •**°n
!iii
I000 I
100 1000 10000
_Ns]_ s_ss (lO0OPSDb. High Temperature, 680F (20°C)
Figure 4.17 Combined Ellect_ of Compaction and Mixture Stillnesson Diametral Fatigue at Low Stress (1 psi = 6.89 kPa)
64

! _/' ....!!--l 00000 ..................................................... l ...... _ ...................... £ ' ............................
• Gyrmtory
i T"/_ .+ ii ."" 0 Kneadi_l 0 ! "_ i
r.,. I0000 _o .-'l. i • ,o,t,,_;meet
l " " m 11 '
_ __ I I l i ..... __ ...... _ - ....... Gyrmtory
" -- ............... ICnemdir_
..•....................................:.........-"_=..........................I'_........"T--
1000 "i_ -,ort,,,,_.t,..,*
0@
l0 -------
100 1000 10000
TENSILESTIFFNESS(1000 PSi)
a. Low Temperature, 39.2°F 14°C)
tooooo.....................................................................................................................................................................................................i,,
• ........_:L.....................................................................I O O O 0 ................... ........ 0 • ......................... _" ;,."""'•:
O
• Gyratory
• . -'.'-; " ie ' " " '" l l" " " _ _ Kneading
• Rot lir_ WheeL.-'" ...."'+ t
............ • ................... ; " ..-_I
• 0 ol
< //...-.+. of.x.. ! _ Rotting Wheet
...'"
100 ........................................................................................................................................................................................................:t
° i
100 1000 10000
TENSILESTIFFNESS(1000 PSI)
b. High Temperature, 68°F 120°C)
Figure 4.18 Combined Effects of Compaction and Mixture StUTnesson Diametral Fatigue at High Stress 11 psi = 6.89 kPa)
65

Table ,I.8 Effect of Compaction Method on Resistance to Fatigue
RankingintheTwelveMixtureandTestVariable
Compaction Overall Comparisons of Tables 4.6 and 4.7Method Test Resistance
Strongest Intermediate Weakest
FlexuralFatigue N/A N/A N/A N/AGyratory
Diametral Fatigue Strongest 6 Times 3.5 Times 2.5 Times
FlexuralFatigue Intermediate 3 Times 9 Times N/AKneading
DiametralFatigue Weakest None 7.5Times 4.5Times
Rolling FlexuralFatigue Strongest 9 Times 3 Times N/AWheel
Diametral Fatigue Intermediate 6 Times 1 Time 5 Times
66

wheel specimens is most sensitive to mixture composition and differences between gyratory and
kneading specimens are small (Table 4.9).
Comparison of the effects of mixture and test variables on resistance to fatigue (Table
4.10) reveals several inconsistences. Flexural testing evaluates the effects of asphalt type and
asphalt content differently than diametral testing. Because AAG-1 mixtures are stiffer than
AAK-1 mixtures at temperatures used in the fatigue testing, the diametral testing seems to
provide the most reliable indication of asphalt effects_ Based on similar reasoning, the flexural
testing seems to provide the most reliable indication of asphalt-content effects. The indicated
superiority of chert, rolling-wheel specimens under flexural fatigue is obviously a spurious test
fnding. Additionally, the apparently inaccurate temperature effect in the diametral testing of
rolling-wheel specimens is a consequence of the coupling of stresses and temperatures for this
analysis. That fatigue resistance appeared superior at the high temperature merely reflects the
use of much lower stresses than at the low temperature level.
4.1.4 Stiffness Modulus. Although stress, loading, and temperature conditions are quite
different, each of the four test procedures provides a measure of mixture stiffness. At short
loading times, such a measure approximates mixture response to transient traffic loading in situ
and becomes an important variable in the pavement performance equation. For thick pavements
characteristic of heavy-duty highways, stiff mixtures are thought to be essential for acceptable
performance. Consideration of stiffness effects is, thus, an essential component of the evaluation
of laboratory compaction procedures.
The main experiment produced four different stiffness measures corresponding to 0. l-
second loading, namely, a compressive modulus (compressive creep), a shear modulus (shear
creep), a flexural modulus (flexural fatigue), and an indirect tensile modulus (diametral fatigue).
Average (geometric) values of these moduli have been summarized in Tables 4.1, 4.2, 4.6, and
67

Table 4.9 Effect of Compaction Method on Sensitivity of FatigueResponse to Mixture Variables
Coefficient of Variation of Number of Application. to FailureTest (PercenO
Stress Temperature Method
Gyratory [ Kneading, Rolling Wheel
Flexurai N/A 82.2 95.2Low
Diametrid 146.6 138.3 172.1Low
Flex-arid N/A 120.3 123.7_gh
Diametral 85.8 120.5 156.9
Flexurid N/A 95.0 99.1Low
Diametrid 154.9 151.9 165.0I_gh
Flexurid N/A _.4 83.7_gh
Diametral 84.1 89.9 135.1
68

Table 4.10 Effect of Mixture and Test Variables on Resistance to Fatigue
Compaction MethodVariable Test I
Gyratory I Kneading Rolling Wheel
Flexural fatigue N/A AAK-I • AAG-I AAK-1 • AAG-IAsphalt Type
Diametral fatigue AAG-I • AAK-1 AAG-1 • AAK-1 AAG-I • AAK-1
Asphalt Flexural fatigue N/A Optimum • High Optimum • HighContent
Diametral fatigue Optimum • High No Difference High • Optimum
Flexural fatigue N/A Granite (RB) • Chert (P..L) •Aggregate Chert (RL) Granite (RB)
Type Diametral fatigue Granite (RB) • Granite (RB) • Granite (RB) •Chert (RL) Chert (RL) Chert (RL)
Air Voids Flexural fatigue N/A Low • High Low • HighContent
Diametral fatigue Low • High Low • High Low • High
Flexural fatigue N/A Low • High Low • HighTemperature
Diametral fatigue Low • High Low • High High • Low
Fiexural fatigue N/A LOw • High Low • HighStress
Diametral Low • High Low • High Low • High
69

4.7, respectively. Although the moduli differ markedlyin magnitude--areflection primarilyof
differencesin test temperatureand in the type and level of stress-and are, therefore, notdirectly
comparable, they do permit similarcomparativeevaluationsof compactionand other significant
variables.
The effect of compaction method on mixturestiffness is summarized in Table 4.11, and
Table 4.12 compares compaction methods based on sensitivity of stiffness response to mixture
composition. In part because stiffness was notparticularlysensitive to compaction method-at
least not when compared to the sensitivity of either permanent-deformation or fatigue
measures-evidence is mixed about which, if any, compaction method produces the stiffest
mixes. Informed judgment seems to first requirean appraisalof the reliability of the different
moduli, a task aided by Table 4.13. As summarizedin Table 4.13, flexural moduli violate a
priori notions about the effects of asphalt types and indirect tensile moduli from diametral
fatigue tests violate a priori notions about the effects of aggregate type (gyratoryand kneading).
Compressive moduli from creep tests violate a priori notions about the effects of stress level.
Shear creep dataare corroborative throughout. On the basis of such reasoning, the conclusion
from the shear testing is that the stiffest mixtures are produced by rolling-wheel compaction,
followed in order by kneading and gyratory compaction. The stiffness of rolling-wheel
specimens reflects more sensitivity to mixture composition than either gyratory or kneading
specimens but kneading specimens are a close second.
t'The effect of asphalt type on mixture stiffness is temperature dependent. At highertemperatures in the range of 104 to 140°F (40 to 60°C), the AAK-1 asphalt is more viscous thanthe AAG-1 asphalt, and mixtures containing AAK-1 are stiffer. The reverse is true at lowertemperatures in the range of 32 to 68°F (0 to 20°C). This temperature-dependent stiffness effectof these two asphalts has been confirmed in later phases of the SHRP A-003A testing program.
70

Table 4.11 Effect of Compaction Method on Stiffness
| ,
Ranking in the Twelve Mixture and Test VariableCompaction Overall Comparisons of Tables 4.1, 4.2, 4.6, and 4.7Method Test Stiffness
Stiffest Intermediate Weakest
Compressive Creep Weakest None None 12 Times
ShearCreep Weakest 2Times 3.5Times 6.5TimesGyratory
Flexure NIA NIA NIA NIA
Indirect Tension Stiffest 5.3 Times 4.3 Times 2.3 Times
Compressive Creep Stiffest 10 Times 2Times None
Shear Creep .. Intermediate 2 Times 5.5 Times 4.5 TimesKneading
Flexure Intermediate None 12 Times N/A
Indirect Tension Intermediate 3.3 Times 6.8 Times 1.8 Times
Compressive Creep Intermediate 2 Times 10 Times None
Rolling Shear Creep Stiffest 8 Times 3 Times 1 TimeWheel
Flexure Stiffest 12 Times None N/A
Indirect Tension Weakest 3.3 Times 0.8 Times 7.8 Times
D
71

Table 4.12 Effect of Compaction Method on Sensitivity of StiffnessResponse to Mixture Variables
i n
Coefficient of Vsur_ien of Stiffness Modulus (Percent)Stress Temper- Test Method
ature GyrIJLory Kneading Roiling Wheel
Compression 4,1.8 42.5 40.3
Shear 27.8 33.5 63.6Low
Flexure N/A _4.a.]7 32.8
Indirect Tension $7.5 44.8 44.7Low
Compression 56.0 $9.2 50.2
Shear 53.6 49.9 81.4High-
Flexure N/A 50.2 F7.2
Indirect Tension 53.1 49.8 $3.5
Compression 37.5 38.2 37.4
Shear 38.5 48.3 $0.9LOw
Flexure N/A 42.2 42.2
Indirect Tension 66.3 54.2 49.8High ,
Compression 64.3 64.4 51.8
Shear 43.6 _;1.1 50.2High
Flexure N/A 36.2 35.2
Indirect Tension 60.7 77.7 55.5
72

Table 4.13 Effect of Mixture and Test Variables onStiffness Modulus
D Compaction MethodVariable Test
Gyrator/ [ Kneading Roiling Wheel
Compressive creep AAK-1 > AAG-1 AAK-! > AAG-1 AAK-I • AAG-I
Shear creep AAK-1 • AAG-I AAK-I > AAG-I AAK-1 • AAG-IAsphalt Type
Flexural fatigue N/A AAK-I • AAG-I AAK-1 • AAG-1
Diametral fatigue AAG-I • AAK-1 AAG-1 • AAK-1 AAG-1 • AAK-I
Compressive creep Optimum • High Optimum • High Optimum • High
Asphalt Shear creep Optimum • High Optimum • High Optimum • HighContent
Flexural fatigue N/A Optimum • High Optimum • High
Diametral fatigue Optimum • High Optimum • High Optimum • High
Compressive creep Granite (RB) • Granite (]_B) • Granite (RB) •Chert ('RL) Chert (RL) Chert (R.L)
Shear creep Granite (P,.B)• Granite (RB) • Granite (RB) •
Aggregate Chert (R.L) Chert 0_,L) Chert (RJ..)
Type Flexural fatigue N/A Granite (RB) • Granite (RB) •Chert (R.U) Chert (]U.)
Diametral fatigue Chert (RL) • No effect Granite (P..8) •Granite (RB) Chert (RL)
Compressive creep Low • High Low • High Low • High
Air Void Shear creep Low • High Low • High Low • HighContent
Flexural fatigue N/A Low • High Low • High
Diametral fatigue Low > High Low • High Low • High
Compressive creep LOw • High LOw • High LOw • High
Shear creep Low • High Low • High LOw • HighTemperature
Flexural fatigue N/A Low • High LOw • High
Diametral fatigue LOw • High Low • High Low • High
Compressive creep No effect High • LOw High > Low
Shear creep Low • High Low • High Low • HighStress
Flexural fatigue N/A Low • High LOw • High
Diametral fatigue LOw • High Low • High LOw >. High
73

4.1.5 D_ussion. As noted earlier, the effects of compaction method on mixture properties
were larger than had been expected initially. Differences between gyratory and kneadin
specimens were most pronounced and of greatest initial interest. Because compaction was
completed much quicker in the gyratorycompactor than in the kneadingcompactor, particularly
for the low air-void mixturesincorporatinggranite(RB), there was concern that the asphalt may
have hardened more in kneading specimens than in gyratory specimens. To investigate this
possibility, viscosities were measuredfor asphalts extracted from specimens preparedby each
method. For neither asphalt was viscosity'greater for kneading than for gyratory compaction
Gable 4.14). Figures 4.19 and 4.20 comparethe recovered asphalt propertieswith those of neat
asphalts, determined in accord with procedures for asphalt heating and transfer to small
containersand supplied by the A-001 contractor. It will be noted that the hardening occurring
in the mixing and compaction processes results in an approximately one-grade increase in
viscosity. Also it will be noted that the degree of hardening of the asphalts is approximatelythe
same for both methods of compaction even though the kneading specimens requireda longer
time period to compact. Thus, the effects of compaction method on mixture properties cannot
be attributedto differential hardeningof the asphalt binders.
Although both gyrator3,andkneadingcompactorsinduce "shearing"displacementsduring
compaction, they appear to differ fundamentallyin two important ways. First, the gyratory
compactor subjects the confined mixtureto a significant "hydrostatic"pressure. Following the
soil mechanicsanalogy, this pressurehas two components,pore pressurewithin the fluid (asphalt
and air voids) phase and effective pressure within the granularphase. Large pore pressures,
•" expected with mixtures having a large percentage of their mineral voids filled with asphalt,
reduce the effective pressuresand, hence, the extent to which aggregateparticles are forcedinto
intimate contact. In kneading compaction, pore pressuresare more readily dissipated because
74

Table 4.14 Effect of Compaction Method on Hardening of Asphalts
Average Viscosity of Recovered Asphalt, Poises
Asphalt Type 140"F (60"C) 2750F (135"C)
Gyratory Kneading Gyratory Kneading
AAK-1 9,130 8,300 9.84 9.38
AAG-1 3,740 3,480 3.32 3.20
Note: Asphalts were exwacted from mixturescontaininggranite (RB) and compactedat optimalasphalt content to low air voids;-1 poise = 0.1 Pa*s.
75

VISCOSITY vs HEATING STAGE - AC30
10000
lOOOVZSC0S
I • _0 _ iT
100y []275 F
I
pO
is
e
s10
Ist 2nd Heating Recovered - Recovered -
Heating Kn Gy
Figure 4.19 Effect of Heating and Mixing on Hardeningof AAK-1 Asphalt (1 poise = 0.1 Pa.s)
76

VISCOSITY vs HEATING STAGE - AR4000
lOOOVISC0
D °7T • 1_o F
100 ----y i _275 F
Ip Io fi ise
slo
i
I
ti j j
ist Heating 2nd Heating Recovered - Recovered -
Kn Gy
Figure 4.20 Effect of Heating and Mixing on Hardeningof AAG-I Asphalt (l poise = 0.1 Pa.s)

the mixture is unconfined during compaction. Because of the pore-pressure effect, more
interparticle contact is expected in kneading specimens, especially when more of the voids
in the mineral aggregate are filled with asphalt.
The second major difference between gyratory and kneading compactors is in the
nature of the interparticle movement during compaction. The back-and-forth movement
of the gyratory compactor aligns the larger particles but does little to promote an
interlocking, edge-to-face structure. Kneading compaction, on the other hand, induces
larger, more random shearing displacements. The result is likely to be a more tightly
interlocked and stable aggregate structure in kneading specimens.
In terms of the main compaction experiment, these differences are expected to have
the following manifestations:
• Differences between the physical properties of gyratory and kneading
specimens are expected to be greater when more of the aggregate voids are
filled with asphalt, that is, with larger asphalt contents and smaller air-void
contents;
• Kneading specimens are expected to be more sensitive than gyratory
specimens to aggregate properties, that is, aggregate type; and
• Gyratory specimens are expected to be more sensitive than kneading
specimens to asphalt type.
Using data developed by the main compaction experiment, an evaluation of the above
"hypotheses" is summarized in Table 4.15. The results support all but one of these
hypotheses and strengthen the notion that the primary differences between gyratory and
kneading compaction derive from differences in aggregate structure and interparticle
contact.
Another possible difference between compaction methods is in the configuration or
pattern of internal air voids. Most of the air entrapped in the loose mixture is expelled
78

Table 4.15 Experimental Validation of Hypotheses RegardingCompaction Methodologies
Permanent Deformation Stiffness Modulus
Hypothesis DiametralCompression Shear Fatigue Compressive Shear Indirect
Creep Creep Tension
The difference between
gyrato_ and kneading No No No No No Yescompaction is greater at higherasphalt contents.
The difference between
gyratory and kneading Yes Yes No Yes Yes Yescompaction is greater at lowerair voids.
Kneading specimens are moresensitive to aggregate type than Yes Yes Yes Yes Yes Yesare gyrator), specimens.
Gyratory specimens are moresensitive to asphalt type than Yes Yes No Yes Yes Yesare kneading specimens.
D
79

during the compaction process. Under the compaction pressure, individual pockets of air
migrate to a nearby free surface. The channels thus formed axe altered by subsequent
compaction: most doubtlessly become closed entrapping small pockets of air within the
mixture. Of interest to the current study is whether compaction :method influences the
configuration of internal air voids that remain and, ff so, whether the air-void pattern is
likely to affect mixture properties of interest. It does seem likely that kneading compaction
would more thoroughly disrupt internal air channels than would gyratory compaction or,
stated alternatively, that internal air capillaries would be longer az_dmore continuous in
gyratory specimens.
To test this hypothesis, water permeability measurements were made on eleven,
2.5 x 4-inch (63.5 x 101.6 turn) briquets, six prepared by gyratory compaction and five by
kneading compaction. Although not conclusive, results of this testing suggest that gyratory
specimens may be slightly more permeable than kneading specimens (Figure 4.21). Such
a finding is consistent with the hypothesis of greater interconnectivity of the internal air
capillaries within gyratoryspecimens. Differences in the internal-air-void pattern could have
obvious impact on mixture aging and perhaps on other mixture properties as well.
Finally, the condition of the specimen surface (either as-molded or cut) is a
confounding variable of unknown significance. The main compaction experiment was based
on the assumption that surface condition does not affect fundamental measurements.
Accordingly, as shown in the table below, isolating effects of compaction method from
possible confounding effects of surface condition is impossible.
8O

Z C_ Z
>" Z >--
I• o I
ii
C,O
m
(o_s/_o6-_ot)alm_v_d
Figure 4.21 Effect of Compaction Method on Permeability
81

Surface Condition as Function of Compaction Method and Test Type
I
Test Type Compaction MethodGyratory Kneading Rolling Wheel
Compressive Creep Cored As-Molded Cored
Shear Creep As-Molded As-Molded Cored
Flexural Fatigue N/A Sawed Sawed
Diametral Fatigue As-Molded As-Molded Cored
Further discussion of the possible effects of cut surfaces is included in Section 5.0.
4.1.6 Statistical Si2nific,ane¢.
The primary purpose of the main compaction experiment was to determine if the method
of specimen compaction has any effect on fundamental properties of asphalt-aggregate mixtures
considered important to pavement performance. The three compaction methods examined in the
main experiment were gyratory, kneading, and rolling wheel. The several test procedures
included compressive creep, shear creep, flexural fatigue, and diametral fatigue. Both creep
studies were performed under steady load conditions (as opposed to repeated load applications).
The other factors included in the main compaction experiment were asphalt type, asphalt
content, aggregate type, air-void content, test temperature, and stress level. By looking at such
a large number of factors, the hypothesis of "no compaction method effect" is tested more
broadly, thus giving greater credibility to any finding of a compaction-method effect or a
no-compaction-method effect.
Ex_eriment Design for Main Ex_riment
The experiment design for the compressive and shear creep tests was a one-half fraction
of a 2-level factorial design in the first five variables listed above (a 25"1 design), repeated at
each of two stress levels, with all this run on specimens prepared by each of the three
82

compaction methods. Thus, the data for each of the creep tests come from a 2s'l • 2 • 3
experiment.
For the flexural fatigue tests, only two compaction methods could be studied, as the
gyratoryequipment could not preparespecimens of the necessary size. Here the design was a
one-half fractionof a 26 factorial (includingthe two compaction methods) run at each of two
stress levels, for a 26"1• 2 experiment. A similar designwas used for the diametralfatigue tests
but all three compaction methods were investigated.
In both creep and fatigue tests, a number of replicates were run to provide greater
precision in the test results and also to provide an independentestimate of the test error. All
four sets of tests incorporate a basic matrix of 16 mixtures, representing all 16 different
combinations of the two levels of each of the mixturefactors; asphalt type, asphalt content,
aggregate type, and air voids. These designs are described in greater detail in Section 3.0.
StatisticalAnalysis
The statistical calculations were carried out using the SAS (R) system, Version 6.04 for
PCs. The main procedure was the General Linear Model (GLM), a least-squares program which
permits variables of both a CLASS nature (for example, asphalt type of AAK-1 or AAG-1) as
well as numerically valued variables (for example, air voids of 4.5 percent, 11.5 percent.... _.
The analysis technique is described more completely in Appendix C. The analysis of the
correlations between the compaction methods was done with the SAS procedure CORR.
Analysis of Creep T¢_tData
In the compressive and shear creep tests, two responses were studied, both derived from
the basic measurements of specimen modulus as a function of test time:
I. Initial creep modulus (i.e., at 0.1 sec) and
83

2. Time (seconds) to reacha criticallevel of strain, 0.008 in/in (0.008 mm/mm) for
compressive creep and 0.02 in/in (0.02 mm/mm) for shear creep.
The logarithms of these two responses were analyzed using the generalized linear model
formulation.
Table 4.16 identifies those effects found to be statistically significant at the 95-percent
probability level in the compressive-creep testing. In this table, a "Yes" indicates that the effect
was found to be significant at a 95-percent or greater probability level. That is, there is a 5-
percent or smaller chance that the observed effect could have come from a situation in which
there is really no effect. For each response (for example, time to terminal strain), there are two
columns. The first, labeled "Significant Effect," denotes whether the listed effect is significant
when averaged over the several compaction methods: the second, labeled "Significant
Compaction Interaction," indicates whether the effect of one or moreof the compaction methods
is significantly different from the average.
From Table 4.17, the summary statistics for the compressive creep testing are:
Response
Statistic Time to Terminal Strain . Initial Creep Modulus(In sec) On psi)
R2 0.951 0.972
RMSE 1.577 0.213
CV, % 332.0 21.6,
Note: R 2 --- Coefficient of determination; RMSE = Root mean squared error; CV =Coefficient of variation; 1 psi = 6.89 kPa.
The compressive creep responses for the three compaction methods were also compared
by correlating each response from each compaction method against its counterpart on the other
compaction methods. This was done using the ordinary Pearson linear correlation (on
logarithms of time or modulus) and also using the rank correlation method of Spearman. In all
84

Table 4.16 Statistically Significant Effects in Compressive Creep Testing
Time to TerminalStrain Creep Modulus at O.I Sec
Effect Significant Significant Significant SignificantEffect Compaction Effect Compaction
Interaction Interaction
Intercept Yes Yes Yes Yes
Asphalt Type (Asph) Yes Yes
Aggregate Type (Aggr) Yes Yes Yes
Asphalt Content (% Asph)- " Yes Yes Yes
Air Voids (% Voids) Yes Yes Yes
Temperature(Temp) Yes Yes
Stress Yes
Asph x Aggr Yes
Asph x % Asph Yes
Asph x % Voids Yes
Asph x Temp Yes
Asph x Stress Yes
Aggr x % Asph Yes Yes
Aggr x % Voids Yes Yes Yes
Aggr x Temp Yes
Aggr x Stress
% Asph x % Voids Yes
% Asph x Temp Yes
% Asph x Stress
% Voids x Temp Yes Yes
% Voids x Stress
Temp x Stress
85

Table 4.17 Snmmary Statistics for Main Experiment
Compressive Creep Shear Creep Flexural Fatigue Diametral FatigueSta-tistic Terminal Initial Terminal Initial Fatigue Initial Fatigue Initial
Time Modulus Time Modulus Life Modulus Life Modulus
(In sec) On psi) Onsee) (In psi) On) Onpsi) On) Onpsi)
R2 0.951 0.972 0.944 0.983 0.961 0.970 0.85 ! 0.753
RMSE 1.577 0.213 1.141 0.221 0.469 0.166 1.025 0.354
CV, % 332.0 21.6 164.0 22.4 49.6 16.7 136.0 36.6
Note: R2 = Coefficient of determination;RMSE - Root mean squarederror = VMSE; CV- Coefficient of variation _ 100V(eMSE-I);1 psi - 6.89 kPa.
86

cases, the correlations were significant at the 99.99-percent level or higher. The correlation
D coefficients were found to be as follows:i i ,, i, ,i
Response Compaction Methods Ordinary RankPearson Spearman
Gyratory/Kneading 0.846 0.910Time to
Terminal Strain Gyratory/RoUing Wheel 0.840 0.896On _c)
Kneading/Rolling Wheel 0.849 0.938i
Initial Gyratory/Kneading 0.937 0.915
Creep Modulus Gyratory/Rollin.g Wheel 0.952 0.924(In psi)
Kneading/Rolling Wheel 0.958 0.943
This analysis suggests that, although the responses of specimens prepared by different
compaction methods may be considerably different, the effect of compaction method on the
ranking of different mixture (and testing) conditions is much smaller.
As with the compressive creep tests, the shear creep data were obtained in the form of
creep modulus vs. time, and the analysis was done in terms of the logarithm of the initial
modulus (at 0.1 sec) and the logarithm of the time at which the strain reached a terminal value.
Table 4.18 identifies those effects found to be significant at the 95-percent level,
including the interactions of compaction method with other effects. For both compressive creep
(Table 4.16) and shear creep (Table 4.18), the effect of compaction method on permanent-
deformation resistance was statistically significant. A few of the interactions of compaction
method with other factors were also statistically significant. Of particular importance are the
significant interactions of (1) compaction method and air voids and (2) compaction method,
aggregate type, and air voids. These interactions give credence to the notion that compaction
effects become more pronounced at low air-void contents and are largely due to compaction's
effects on aggregate structure and interparticle contact. Tables 4.16 and 4.1_ also show that
87

Table 4.18 Statistically Significant Effects in Shear Creep Testing
Time to Terminal Strain Creep Modulus at 0.1
Effect Significant Significant SignificantEffect Compaction SignificantEffect Compaction
Interaction Interaction
Intercept Yes Yes Yes
Asphalt Type (Asph) Yes Yes
Aggregate Type (Aggr) Yes Yes
Asphalt Content (% Asph) Yes Yes Yes
Air Voids (% Voids) Yes .... Yes Yes Yes
Temperature (Temp) Yes Yes
Stress Yes Yes
Asph x Aggr Yes
Asph x % Asph
Asph x % Voids
Asph x Temp Yes
Asph x Stress
Aggr x % Asph
Aggr x % Voids Yes Yes
Aggr x Temp
Aggr x Stress
% Asph x % Voids Yes
% Asph x Temp
% Asph x Stress
% Voids x Temp Yes
% Voids x Stress Yes Yes
Temp x Stress
88

effects of all other main factorswere, with minor exception, statistically significantin terms of
both permanent-deformationresistanceand stiffness.
The summary statistics from Table 4.17 for shear creep are as follows:
i1
Response
Statistic Time to TerminalStrain Initial Creep ModulusOn sec) On psi)
i
R2 0.944 0.983
RMSE 1.141 0.221
CV, % 164.0 22.4
Note: 1 psi = 6.89 kPa
These are quite in line with the compressive creep results, and again indicate that the specimens
responded to the experimental factors and that the results are reasonably precise. As indicated
D by the coefficient of variation, there was less residual error in the shear creep testing than in thecompressive creep testing.
The shear creep responses for the three compaction methods were also compared by
correlating each response from each compaction method against its counterpart on the other
compaction methods. This was done using the ordinary Pearson linear correlation (on
logarithms of time or modulus) and also using the rank correlation method of Spearman. In all
eases, the correlations were significant at the 99.99-percent level or higher. The correlation
coefficients were found to be as follows:
89

Ordinary RankResponse CompactionMethods Pearson Spearman
Gyratory/Kneading 0.831 0.871Timeto
Terminal Strain Gyratory/RollingWheel 0.896 0.932sec)
Kneading/Rolling Wheel 0.900 0.912
Initial Oyratory/Kneading 0.960 0.949CreepModulus GyratorylRollingWheel 0.949 0.961
(Inpsi) "Kneading/RollingWheel 0.960 0.963
Analysis of Fatigue Test Data
In the fatigue tests, two responses were studied:
1. Initial specimen stiffness and
2. Fatigue life (cycles to failure).
The logarithms of these two responses were analyzed using effectively the same models as were
used to analyze the compressive and shear creep data.
For flexural testing, data were obtained only for kneading and rolling-wheel compaction,
as the gyrator), compactor could not make specimens of the size required by the flexural fatigue
apparatus. Effects, including the interactions of compaction method with other effects, found
to be significant at the 95-percent level are noted in Table 4.19.
The summary statistics for the flcxural fatigue data, excerpted from Table 4.17, show
high correlations for both stiffness and fatigue life. Even the 50-percent (coefficient of
variation) precision for fatigue life is very good. As mentioned elsewhere, data previously
reported in the literature have shown coefficients of variation of approximately 60 percent.
9O

Table 4.19 Statistically Significant Effects in Fiexeral Fatigue Testing
Fatigue Life Flexural Stiffness at 0.1 Sec
SignificantEffect Significant Significant Significant CompactionEffect Compaction Effect
Interaction Interaction
Intercept Yes Yes Yes
Asphalt Type (Asph) Yes Yes
Aggregate Type (Aggr) Yes Yes Yes
Asphalt Content (% Asph) .... Yes Yes Yes
Air Voids (% Voids) Yes Yes
Temperature O'emp) Yes Yes Yes
Stress Yes Yes
Asph x Aggr Yes Yes
Asph x % Asph Yes Yes
Asph x % Voids
D Asph x TempAsph x Stress
Aggr x % Asph Yes Yes
Aggr x % Voids Yes Yes
Aggr x Temp
Aggr x Stress Yes
% Asph x % Voids
% Asph x Temp Yes Yes
% Asph x Stress
% Voids x Temp
% Voids x Stress
Temp x Stress Yes
P
91

Response
Statistic Fatigue Life Initial Flexural ModulusOn applications to failure) (In psi)
R2 0.961 0.970
RMSE 0.469 0.166
CV, % 49.6 16.7
Note: 1 psi - 6.89 kPa
The flexural-fatigue responses for the two compaction .methods were also. comparedby
correlating each response from each compaction method against its counterpart on the other
compaction method. This was cloneusing the ordinaryPearson linear correlation (on logarithms
of life or modulus) and also using the rank correlation method of Spearman. In all cases the
correlations were significant at the 99.99-percent level or higher. The correlation coefficients
were found to be as follows:
Ordinary RankResponse Compaction Methods Pearson Spearman
Gyratory/Kneading Not applicable Not applicableFatigue Life
(In) Gyratory/Rolling Wheel Not applicable Not applicableKneading/Rolling Wheel 0.888 0.843
Initial Gyratory/Kneading Not applicable Not applicable
Flexural Gyratory/Rolling Wheel Not applicable Not applicableModulusfin psi) Kneading/Rolling Wheel 0.973 0.960
92

The diametral-fatigue testing included specimens prepared using all three of the
compaction methods. Table 4.20 identifies those effects found to be statistically significant at
the 95-percent probabilitylevel in the diametral fatigue testing. The primarycompaction effects
on both fatigue resistance and stiffness, identified above, were generally not found to be
statistically significant either in fiexural (Table 4.19) or diametral (Table 4.20) testing. Effects
of all other primaryfactorswere found to be statistically significant in flexural fatigue, and most
were significant in diametral fatigue as well. Compaction method did have a few statistically
significant interactions with other factors, primarilyaggregate type and temperature.
The summary statistics from Table 4.17 for diametral fatigue are as follows:
Response
Statistic Fatigue Life Initial Tensile ModulusOnapplications to failure) On psi)
R2 0.851 0.753
RMSE 1.025 0.354
CV, % 136.0 36.6
Note: 1 psi - 6.89 kPa
Comparing these summary statistics with those from the flexural-fatigue experiments reveals a
better fit of the regression model to the flexural-fatigue data as well as significantly less
variability of the flexural-fatigue testing both for fatigue life and for stiffness.
The diametral-fatigue responses for the three compaction methods were also compared
by correlating each response from each compaction method against its counterpart on the other
compaction methods. This was done using the ordinary Pearson linear correlation (on
logarithms of fatigue life or modulus) and also using the rank correlation method of Spearman.
In all cases, the correlations were significant at the 99.99-percent level or higher. The
correlation coefficients were found to be as follows:
93

Table 4.20 Statistically Significant Effectsin Diametral Fatigue Testing
i
Fatigue Life Tensile Stiffness at 0.1 Sec
Factor Compaction CompactionEffect EffectInteraction Interaction
Intercept Yes Yes
Asphalt Type (Asph) Yes Yes
Aggregate Type (Aggr) Yes Yes
Asphalt Content (% Asph) Yes
Air Voids (% Voids) Yes Yes.
Temperature (Temp) Yes Yes
Stress Yes Yes
Asph x Aggr Yes
Asph x % Asph Yes
Asph x % Voids
Asph x Temp Yes
Asph x Stress
Aggr x % Asph
Aggr x % Voids Yes
Aggr x Temp Yes
Aggr x Stress
% Asph x % Voids
% Asph x Temp
% Asph x Stress
% Voids x Temp Yes Yes
% Voids x Stress
Temp x Stress Yes
94

i
Response Compaction Methods Ordinary RankPearson Spearman
Gyratory/Kneading 0.949 0.923Fatigue Life
On) Gyratory/RoUing Wheel 0.824 0.807Kneading/Rolling Wheel 0.868 0.852
Initial Gyratory/Kneading 0.913 0.877Tensile
Modulus Gyratory/Rolling Wheel 0.842 0.736
(ln psi) Kneading/Rolling Wheel 0.831 0.740
As with the other response measures evaluated herein, the relatively large magnitude of these
correlation coefficients means that, overall, the rankings of test conditions and mixtures are not
greatly affected by compaction method.
Fatigue Life - Stiffness Relationship
In the course of examining the fatigue data, double-logarithmic plots (Figures 4.15-4.18)
of fatigue life vs. stiffness showed interesting patterns in the data. To investigate the possibility
of developing a prediction relationship for fatigue life based primarily on the initial observed
stiffness, regression analysis of fatigue life (logarithm) against stiffness (logarithm) for the
flexural tests showed that virtually all the other variables were still required in order to obtain
a residual error as small as when stiffness was not included as a regressor variable. Although
stiffness seemed to group the data into several distinct lines, the scatter about those lines was
still large compared to the ultimate residual error when fatigue life is correlated against the
experimental factors (root mean squared error of 0.47 for flexural fatigue). Thus, a simple
correlation of life against stiffness and just a few other effects does not do justice to the data.
95

Summary_of Findings
The statistical analyses described herein found several statistically significant differences
among the three compaction methods, both as regards the average values of the response
variables and the effects of some of the other factors (interactions of these other factors with
compaction method). Tables 4.16, 4.18, 4.19, and 4.20 identify the significant effects for the
compressive creep, shearcreep, flexural-fatigue,and diametral-fatigueexperiments, respectively,
and Table 4.17 lists the summary statistics for each of the analyses.
Overall, the experimental factors accounted for most of the information (variability) in
the clam. This is reflected in large coefficients of determination, ranging from a low of 0.75 to
a high of 0.98. This means that from 75 to 98 percent of the variation in the raw data is
"explained" by the experimental factors (asphalt type, aggregate type, etc.). Excluding the
diametral testing, the smallest coefficient of determination was a very respectful 0.94.
In addition, the residual (unexplained) variation in the modulus (stiffness) responses
reasonably low on an absolute basis, ranging from 1"/-percentcoefficient of variation on
stiffness to 37-percent on tensile modulus in indirect tension. The flexural-fatigue life residual
error, again expressed as the coefficient of variation, was 50 percent, a quite good (low) level
for fatigue testing7. For diametral fatigue, the residual error, 136 percent, was considerably
greater. The residual errors in the compressive and shear creep "times to terminal strain," while
appearing to be inordinately large, are inflated by the fact that a few specimens failed very early
and so were arbitrarily assigned a time to terminal strain of 0.1 second. On the other hand, a
fair number of specimens were so strong that they had not reached the terminal strain at the end
of testing (3,600 seconds). Times to terminal strain for these specimens were extrapolated,
7The fatigue experiment was designed and sized based upon a coefficient of variationpercent as estimated from fatigue data previously reported in the literature.
96

using a double logarithmic relation between strain and time. The residual error was considerably
less for shear creep tests than for compression creep tests.
Despite the fact that compaction method was generally found to influence mixture
properties, mixtures (and test conditions) were ranked in much the same way irrespective of
method of compaction for all the test responses evaluated herein.
4.2 F.,xtended Permanent-Deformation Study
Objectives of the extended permanent-deformation study included further exploration and
documentation of the interactive effects of air voids and compaction method on specimen
response to creep loading, evaluation of the effects of cyclic loading on the accumulation of
permanent deformation, and evaluation of the effects of increasing the constant axial load on
specimens being tested in shear. Both gyratory and kneading compaction were investigated.
The testing program, utilizing a single mixture and a single temperature, is described as follows:
Number of Tests Air-VoidTest Stress Content
Gyratory Kneading
Compressive Creep 10 I0 30 psi (206.7 kPa), axial, static Variable (3-9%)
Shear Creep 10 10 3.3 psi (22.7 kPa), shear, static Variable (3-9_)5.0 psi (34.4 kPa), axial, static
Compressive 3 3 30 psi (206.7 kPa), axial, cyclic LowCyclic (I Hz, 0.l-sec load pulse)
Shear Cyclic 3.3 psi (22.7 kPa), shear, cyclic2 2 (1 Hz, 0.1-sec load pulse) Low
5.0 psi (34.4 kPa), axial, static
Common Elements AAG-1 asphalt at optimum asphalt content with granite (RB). All testing performed at140*F (60°C).
Compressive creep curves for individual specimens of varying air-void content are
depicted in Figures 4.22 and 4.23 for gyratory and kneading compaction, respectively. Similar
curves for shear creep are shown in Figures 4.24 and 4.25. The effect of air-void content on
the resistance of these mixtures to creep loads is clearly evident: more air voids translate to
97

Cr_ _'3 r'-- _ _ _ _ O'_ CAD Cr_
Figure 4.22 Compressive Creep Curves for Specimens with Varying Air Voids,Gyratory Compaction (1 psi = 6.89 kPa)
98

Figure 4.23 Compressive Creep Curves for Specimens with Varying Air Voids,Kneading Compaction (1 psi = 6.89 kPa)
99

Figure 4.24 Shear Creep Curves for Specimens with Varying Air Voids,Gyratory Compaction (1 psi = 6.89 kPa)
100

q,==_
E---
Figure 4.25 Shear Creep Curves for Specimens with Varying Air Voids,Kneading Compaction (1 psi = 6.89 kPa)
101

weaker mixtures. The effect of air voids under compressive loading is indicated more directly
in Figures 4.26 and 4.27. At a given time of loading, the compressive creep modulus decreases
with increasing air voids: the relationship between In modulus and air-void content seems to be
approximately linear except within the region where collapse is imminent. Figure 4.28
illustrates the combined effects of air voids and loading time for kneading specimens and shows
that air-void effects on compressive creep modulus are not much smaller in magnitude than
time-of-loading effects. The extended permanent-deformation study also validated the superior
resistance of kneading specimens to permanent deformation both for specimens with low air
voids (Figures 4.29 and 4.30) and for those with higher air voids (Figures 4.31 and 4.32).
In the main compaction experiment, specimens being tested in shear were subjected to
a normal (axial) pressure of 2.5 psi (17.2 kPa). To examine whether the compaction effect in
shear creep might be significantly altered by larger pressures, all shear testing in the extended
permanent-deformation study incorporated a static axial pressure of 5 psi (34.4 kPa).
summarized in Figures 4.30 and 4.32, indicate that, in shear creep, kneading specimens remain
more resistant to permanent deformation than gyratory specimens after the imposition of an
added normal stress increment.
Under shear creep loading, asphalt-aggregate mixtures expand or dilate axially. To test
whether the dilational behavior might be sensitive to compaction method, instrumentation for
recording axial as well as shear strains was added to a few of the shear creep tests. Figure 4.33,
tracing the ratio of shear to axial strain as a function of time, demonstrates definite differences
•-_ between compaction methods. For a given level of shear strain, kneading specimens dilatedtx
more than gyratory specimens (Figure 4.34). This is the kind of behavior expected of mixtures
having a tightly interlocked aggregate structure where shear strains force the angular particles
to rotate. That kneading specimens dilate more than gyratory specimens under shear loadir
102

................................................................i -T
i
/
i ///
m ...........................
Figure 4.26 Effect of Air Voids on Compressive Creep Modulus,Gyratory Compaction (1 psi = 6.89 kPa)
103

i.... Z'-
Z"..-
r_
/Ii ,.,._JJi
HIh
............. I
_'_ r.f_
r,,,..,
Figure 4.27 Effect of Air Voids on Compressive Creep Modulus,Kneading Compaction (I psi = 6.89 kPa)
I04

Figure 4.28 Combined Effects of Air Voids and Loading Time on CompressiveCreep Modulus, Kneading Compaction (1 psi = 6.89 kPa)
105

IV
i ¢
..... _-"T '_'" _ " ": .......................................... r"_-o'"_""r-"-'r ............. t ............................ i
i........4-.-!-....i.......!.........-. _: ! _---:..--_.---i.........-................: . : :
i : i " " ' :
-_-!::"ii: ......._..........q ..............._......................: _ : .................+--.i.._,,.,-_......_::. ! : ... . :
..............._.............. ............i _;::_ ;:;::::_::;:;; .................. _........
:::::::::::::::::::::::::::::::::::'_:::-T"'-"'""""."'"_"""+" :.::::: ' ===========================:: "";; "'_-" " _
_..--.,---i-._...........,.......-.... ..........i!!!!!!):i:!!!:.:!!!!!!!!!!!!! : ; :• .:,... _
::::::::::::::::::::::.....i.........- !?i.!:!sF!;!!:!!:!!.
Figure 4.30 Effect of Compaction Method on Shear Creep Modulus of Low Air-VoidMixtures, Average of Four Specimens for Each Line (1 psi = 6.89 kPa)
107

t
r.d
........................................................................•i .i i̧ . - .
ii_i : i i i _ i:iii i
• . ! '
--:--_-+---,_---_ i _ ii i " ' !
. - - _ :
......... L_-............... _.. L..L.."............... _....
• , .... ! ! ._.._.........
................ ' "i::::i.':L':['! :i!:: : :D.':..IZ : "': : :13: I
' !.
; ................:.:_.!: ........:r...............
._._._..&..i.-i---._, _ i ,_,.. _..........i..:........ _ : :• _ =. i :
Figure 4.31 Effect of Compaction Method on Compressive Creep Modulus of HiAir-Void Mixtures, Average of Five Specimens for Each Line (1 psi - 6.89 kPa)
108

_d r.dv
, 0
-":..................... :": "-":';'r:.:Z-Z:.;];z:"_:Z:/Z::::;:_:-:_::_;_.;:I::::.:.....:--'-" r"': "]"-'-_..........':TT:"VTW'"'["i !i [. . . t "?
-+-'i : } ........... _........_ ......!'!'_'"'7"'""i"": "' _': ' : _ i. : iii'.il i " " :: " !
"'_"t"" _ '':'''_ ......... - • :
:: ; i::,_!,, i ; _.... :,z ' : ., ; : : ......... ".: " "
:--'i_!!!!:::!!!!!]!!:!!':!:: : ::=;:;:::i!:"i: ............t._ @� �l�°�::::::::::::::!2:7.=;:::L:::::_::::::..::','-'• .;....._........ ..:: " : " " " " ; ; . .i
. _,. ! : '.i _,]_'_!i _ " i i
•-:2:-:_:" :;:::::::::::• ::::..t..t J: +_." " " " _z":::".:":::::..*::::::...: .:"":':: ..... _ .__,_._.i. ;......z ............. •"" " i- ._-----_....... " " -,_
":-: .......................:......?.... _ _i...........i!:',:i!::!:::i:::!::::i......... r.,a.....:.............................. " " :.... ................:.-..:..i....................
_i_!:'!i:: i!i!!!;_!-!-::':!! !!!:_ ! : ::::;::::::::..: "'--
-:_ ...................... . _ • . ,...; ........ ;.;.g.,..;..: ........ . ...: ...............
..... : ..................... :......... : ....................... ,Li ...............
........................... -...........;.;.........;...................:.:.;....
i,,! i!!!!!'i
Figure 4.32 Effect of Compaction Method on Shear Creep Modulus of High Air-VoidMixtures, Average of Five Specimens for Each Line (1 psi = 6.89 kPa)
109

>-" Z
II
................................................................................. 7 .........................................................
f i i ii i
........................ : i ir! i
i -
I I I I I i I
Figure 4.33 Effect of Compaction Method on Strain Ratio in Shear Creep,Average of Four Specimens for Each Line
110

ZE-, r-_
-_
>-" Z
' I1
m
\\
i \
\ !
i \\ °J--,i
._",,. \ " _o z
• ! ",• \ _ . ,,%--,-..................................................; ....................._'__......................................................
: : ,.. . _ "_
• ' i '.. ::: • • i ",, r.2D
I I I I I
.J
Z__.=,-,,.....,_..[--, .....,.r./D Z
[_.,
Figure 4.34 Effect of Compaction Method on Specimen Dilation in Shear Creep,Average of Four Specimens for Each Line (I in/in = I ram/ram)
111

thusadds to the evidence that kneadingcompactionproducesa more stable aggregate structure,
at least in dense asphalt-aggregatemixtures.
A few cyclic-load tests, both in compressionand in shear, were conductedto corroborate
findings from the more extensive creep test program. The cyclic loading was characterizedby
a square loadpulse of 0.1 seconds followed by a rest period of 0.9 seconds. Strainsaccumulate
under cyclic loading, muchas they do undercreep loading.
Figure 4.35 illustrates the typical accumulationof "permanent" strains in cyclic shear
tests. At a given numberof load repetitions, kneadingspecimens accumulatedlesser amounts
of both dilational (axial) and shearswainsthan did gyratoryspecimens. With respect to dilation,
the effects of compaction method were similarto those observed undercreep conditions (Figure
4.36). Kneading specimens also had greater permanent deformation moduli than gyratory
specimens, both in shear (Figure 4.37) and in compression (Figure 4.38), indicating a greater
resistance to permanent deformation under cyclic loading. These findings, though based on
limited testing, are in full accord with those of the more extensive creep testing.
4.3 Complex Modulu_ Study
The complex modulus studyextended the domain of the properties of interest to include
dynamic modulusand phase angle, properties used to characterize the load response of linear
viscoelastic materials. Measured under sinusoidal loads, the dynamic modulus is simply the
ratio of peak stress to peak strain. The phase angle, a measure of damping, represents the
amount by which strain response lags the applied stress. Damping is also characterized by the
loss tangent, the tangent of the phase angle. In addition to examining two more engineering
properties of potential significance to pavement performance, the complex modulus study
provided further opportunity to examine the interactive effect of air voids and compaction
method. The study is detailed as follows:
112

•° ) D°).m °m
Figure 4.35 Effect of Compaction Method on Permanent Strain in Cycfic Shear(1 in/in - 1 mm/mm)
113

Z.-- 0
Z >"C_D
W
Figure 4.36 Effect of Compaction Method on Specimen Dilation in Cyclic Shear,Average of Two Specimens for Each Line (1 in/in - 1 mm/mm)
114

• []
...................................I ...........................II ........................................._ o
/ =
' B// o
t_
,..o _
E_oID.
Figure 4.37 Effect of Compaction Method on Permanent Deformation Modulusin Cycfic Shear (1 psi = 6.89 kPa)
115

Z =::
Z >--
, 0
i i i _. : : : ; _ : _'_'+!"i"+::., , I_:!: ! : !
"-'"........:"_.......... : = = _ _ ?"?'"'Pi ......': : : : : i i!':
:;;:_-::::: : :::::::.i:.":_ : : :. :::::::::::::::_:::............' ............._ !....: i : ..! ,.._........... ......
,, ,, : ":,: : , P
:::':-:::: i:::::i::: : ;-_::::::::::-:_:-:..... _ ; :::::':::::i::::::::::::::."_.,...... :;:::':_,:::...:.:.. :. ..............._....................../ _ .,,..:"_ .............._...... :i • • i :
...................................:,::: _ .....
_.:.........._.........:.............._ ........:.._ I i I
=E:: !i:! : ! !
I:_.::':": ::::::2:: "'. ".. , i ..................... "
....:!:2::::: :::::::::::::i:::::::::::..................... :,...,- ............
,,:.,,...; .........
! ::" ,'i: " . :
J i I -
Z _
Figure 4.38 Effect of Compaction Method on Permanent Deformation Modulusin Cyclic Compression (1 psi -- 6.89 kPa)
116

Number of Tests
(Specimens) Air-VoidTemperature .... Stress Frequency Content
Gyratory Kneading(Cored) (As Molded)
Sinnsoidal, Variable
68"F (20"C) 98 (7) 98 (7) 2 to 32 psi (0.01 to 16 Hz) Variable(13.8 to 220.5 kPa)
Sinusoidal, Variable
104°F (40"C) 84 (6) 98 (7) 2 to 12 psi (0.01 to 16 I-Iz) Variable(13.8 to 82.7 kPa)
I I I
Common AAG-1 asphalt at optimum asphalt content with granite (RB). Unconfined compressiveElements load applied axially to 4 x 8-inch (101.6 x 203.2 ram) specimens.
Because the loading is considered to be nondestructive, each specimen was tested over
the entire frequency spectrum and at each of the two test temperatures. To minimize potential
specimen damage, however, tests were conducted first at the low temperature and the 16-Hz
frequency. Subsequent testing progressively swept the frequency range toward its lowest point,
0.01 Hz. The temperature was then increased and, when it stabilized, the frequency sweep was
repeated. To minimize testing error, computations at the higher frequencies were based on
average specimen response during the 91st through 100th load cycles after discarding the high
and low extremes in this 10-cycle range. For frequencies of 0.8 Hz and less, averages, after
again discarding the high and low extremes, were based on measurements made during the first
seven load cycles.
The effect of compaction method on dynamic modulus was an expected one: kneading
specimens were stiffer (as indicated by larger dynamic moduli) than gyratory specimens even
though on average their air-void content was 0.6 percent larger (Figures 4.39 and 4.40).
Differences attributable to compaction procedure are greatest at the higher temperature and
lowest frequencies where larger strains accentuate the contribution of the aggregate structure.
At the lower temperature and highest frequencies, the asphalt binder exerts much greater
117

t.
qg
D
................................C .............................: ............... it,.
Figure 4.39 Effect of Compaction Method on Dynamic Modulus at 68°F (20°C),Average of Seven Specimens for Each Line (1 psi = 6.89 kPa)
118

m
Figure 4.40 Effect of Compaction Method on D3m_mic Modulus at 104°F (40°C),Average of Six Specimens for Gyratory and Seven Specimens for Kneading
(1 psi - 6.89 kPa)
119

influence on the dynamic modulus, and the measurable differences between compaction methods
seem to vanish.
In addition to its effect on dynamic modulus, compaction method has a definitive
effect--also diminishing at the lower temperature and highest frequencies-on loss tangent
(Figures 4.41 and 4.42). Where compressive strains are large (high temperature and low
frequencies), kneading specimens exhibit greater damping as evidenced by larger loss tangents.
At intermediate strains, there is a reversal in order and gyratory specimens exhibit greater
damping. Where compressive strains are small (low temperature and high frequencies), the
compaction effect on loss tangent seems to diminish.
Figures 4.43 and 4.44 illustrate the effect of air-void content on dynamic modulus. For
the two test temperatures and throughout the frequency range, mixtures with higher air voids
were less stiff than those with lower air voids. The effect of air voids is less pronounced--but
still readily distinguishable--at the lower temperature and highest frequencies, generally the low
strain region. Results at the opposite extreme of the temperature and frequency spectra are less
reliable, possibly because of nonlinear response to the applied loads. Most importantly, the
difference between compaction methods is more pronounced for low-void specimens than for
high-void specimens, a finding in agreement with the hypothesis that differences between
gyratory and kneading compaction become more pronounced when more of the mineral voids
are filled with asphalt.
There is more measurement error in the loss tangent data, and the effects of air-void
content appear more complex (Figures 4.45 and 4.46). Focusing for the moment on the
kneading specimens, the loss tangent of specimens with fewer air voids is larger at the high test
temperature (Figure 4.45) but smaller at the high-frequency end of the low temperature testing
(Figure 4.46). The air-void effect diminishes in magnitude at low strain levels, that is, low
120

• []
Figure 4.41 Effect of Compaction Method on Loss Tangent at 68°F (20°C),Average of Seven Specimens for Each Line
121

• rq
Ii
Figure 4.42 Effect of Compaction Method on Loss Tangent at 104°F (40°C),Average of Six Specimens for Gyratory and Seven Specimens for Kneading
122

Qt4
i
O
i ! .O
l ° °8 °Ogp-
P
rjq.4 .._
_gh
It00_:D
Figure 4.43 Combined Effects of Air-Void Content and Compaction Method onDyn_c Modulus at 104°F (40°C), Average of Three Specimens for Each Line
(1 psi = 6.89 kPa)
123

> " ,d _ "
........................................ Op
Figure 4.44 Combined Effects of Air-Void Content and Compaction Method onDynamic Modulus at 68"F (20"C), Average of Three Specimens for Each Line
(1 psi = 6.89 kPa)
124

Nv
0 • • •
.............. Q
e--
... .. ,... . .................. , ........................ _....................... _,. [
,-. ......_ ....... ] _0
i -
Figure 4.45 Combined Effects of Air-Void Content and Compaction Method on LossTangent at 104°F (40°C), Average of Three Specimens for Each Line
(1 psi = 6.89 kPa)
125

.............................. O: Q-
Figure 4.46 Combined Effects of Air-Void Content and Compaction Method on LossTangent at 68°F (20°C), Average of Three Specimens for Each Line
126

temperatures and high frequencies. The pattern for gyratory specimens is similar to that of
kneading specimens for the low-temperature tests (Figure 4.46). At the high temperature, data
for the gyratory specimens appear to be less reliable, possibly because of nonlinearities, and no
clear pattern in the air-void effect is apparent (Figure 4.45). Interactive effects between
compaction method and air-void content are not apparent from the graphical presentations of
Figures 4.45 and 4.46.
In summary, kneading specimens have larger dynamic moduli than gyratory specimens,
an effect that is more pronounced at higher strains (high temperature and low frequency) than
at lower strains (low temperature and high frequency). As expected, the effect of compaction
method is magnified for specimens with lower air voids. Compaction method and air-void
content also affect loss tangent, though in more complex ways. It appears that stiffer mixtures,
whether a result of kneading compaction or a result of lower air voids, have greater loss tangents
at higher strains (high temperature and low frequency) and smaller loss tangents at lower strains
(low temperature and high frequency). Available data don't permit an accurate assessment of
the combined effects of compaction method and air-void content on loss tangent.
4.4 Comparisons with Other Compaction Methods
During the course of the compaction study, opportunities became available to test a
limited number of specimens compacted with the Corps of Engineers' gyratory testing machine
and Exxon's rolling-wheel compactor s. The following summarizes the testing program for
comparing these specimens with others compacted by the Texas gyratory compactor and the
Triaxial Institute kneading compactor:
8The Corps of Engineers' gyratory specimens were prepared by North Carolina StateUniversity, a subcontractor on SHRP Project A-003A. The rolling-wheel specimens wereprepared by Exxon Research and Engineering Company of Linden, New Jersey.
127

Compaction Method Number of Tests Surface Condition
Gyratory (Texas) 2 As Molded
Gyratory (Corps) 2 As Molded
Kneading 2 As Molded
Gyratory (Texas) 2 AS Molded
Kneading 2 AS Molded
Exxon Rolling Wheel 2 Cored
AAG-1 asphalt at optimum asphalt content with granite (RB). All testingCommon Elements performed at 140"F (60"C) in shear creep at 3.3 psi (22.7 kPa) static
shear and 5 psi (34.4 k.Pa) staticaxial.
Shear creep curves for the Corps of Engineers gyratory specimens and those to which
they were compared are presented in Figure 4.47. The Corps specimens, identified as
"GNCSU" on the figure, exhibited a distinctly different response to shear creep than did the
Texas gyratory specimens, identified simply as "G". Although the cause of this difference could
not be ascertained, it may be related to the use of different angles of gyration. The Corps
gyratory testing machine was operated at an angle of one degree, and the Texas gyratory
compactor, at an angle of six degrees. Regardless of the cause of the difference, however, the
important point in the context of the current study is that different compactors (or different
compaction procedures) of the same class or genre may produce distinctly different kinds of
specimens.
Shear creep curves for the Exxon rolling-wheel specimens and those to which they were
compared are presented in Figure 4.48. The rolling-wheel specimens are identified by the letter
"X" in the legend. At the longer loading times, those of greatest practical significance to
pavement performance, the response of the rolling-wheel specimens appears to match that of
kneading specimens more closely than that of gyratory specimens. The general ranking in terms
of resistance to permanent deformation, kneading followed by rolling-wheel followed by
gyratory, corroborates findings from the main compaction experiment.
128
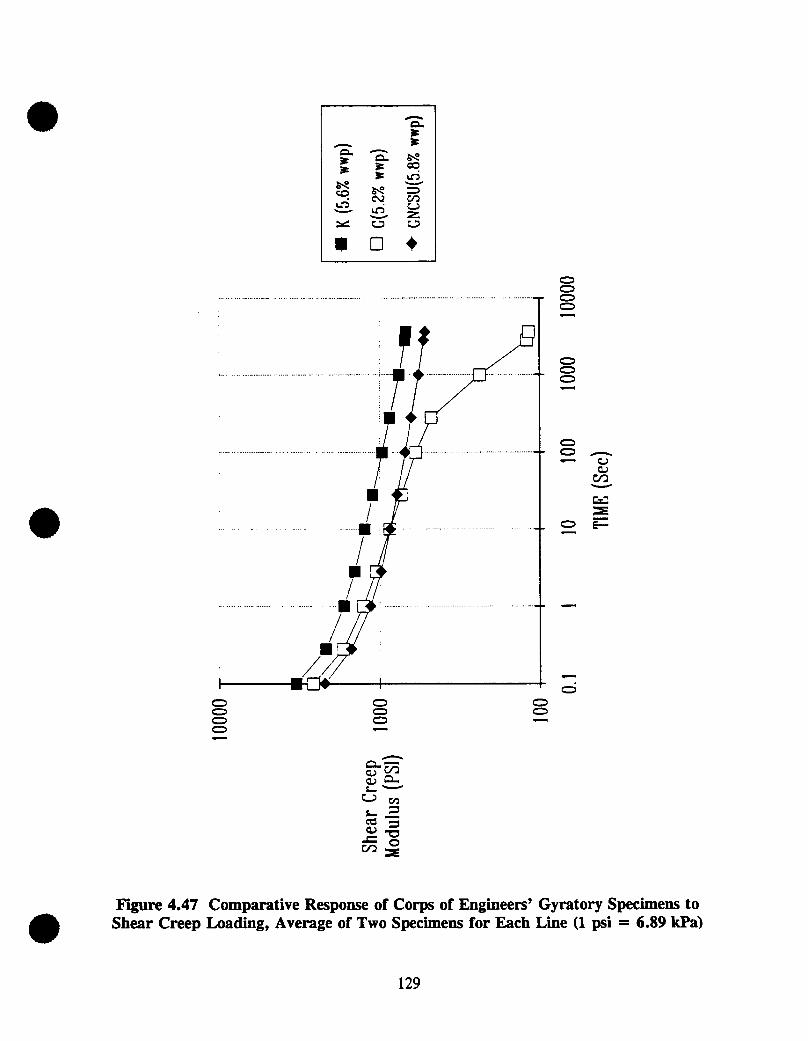
e'_
an _ #
• " " __
/ _
//
.......................................... m . ........................................................ _
/
_ m
_ 0m_
Figure 4.47 Comparative Response of Corps of Engineers' Gyratory Specimens toShear Creep Loading, Average of Two Specimens for Each Line (1 psi = 6.89 kPa)
129

v v _v_ X
/ E
/ -
/ ,f
II• i
i i --.
LV
o
Figure 4.48 Comparative Response of Exxon Rolling-Wheel Specimens to ShearCreep Loading, Average of Two Specimens for Each Line (1 psi - 6.89 kPa)
130

Although this investigation was too limited to be of much significance, it does support
the notion that compactors of the same generic class but of different detail may produce
specimens that respond rather differently to imposedloads. Tests on the rolling-wheel specimens
prepared by Exxon yielded no surprises: results were in general accord with those developed
in other phases of the study.
4.5 Comparisons with Field Cores
Field cores, extracted-from.the wheel paths of two California highways, provided the
opportunity for a limited comparison of field and laboratory compaction. The testing program
is summarized as follows:
Highway Compaction Method Number of Laboratory SurfaceTests Fabrication Condition
Gyratory 5 Laboratory specimens As Moldedprepared from loose
I 80 Kneading 5 mixture stored in sacks As Molded
since pavementField 5 construction. Cored
Gyratory 4 Laboratoryspecimens As Moldedremoldedfromloose
US 101 Kneading 4 materials recovered As Molded
Field 4 from heating cores. Cored
Common Elements Field mixes (US 101 with granite, RB). All testing performed at 140°F (60°C) inshear creep at 3.3 psi (22.7 kPa) static shear and 5 psi (34.4 kPa) static axial.
The I 80 pavement had been undertraffic for approximatelythreeyears priorto coring.
At the time of construction, loose samplesof the asphalt-aggregatemixturehadbeen sacked for
later testing and evaluation. Laboratory specimens were prepared from these loose samples.
The mixture was composed of a high quality, crushed aggregate and the equivalent of an
AR-4000 asphalt.
Results of the shear creep testing, summarized in Figure 4.49, suggest that response of
the field cores lies between that of gyratory specimens and that of kneading specimens. At the
131

r,.-
c,- >-
r-_ [....
z _ >-.
m <_
!. oi
v
Figure 4.49 Comparative Response of 1 80 Field Cores to Shear Creep Loading,Average of Five Specimens for Each Line (1 psi = 6.89 kPa)
132

same time, the dilational response of field cores matched much more closely that of kneading
specimens, possibly indicating similar aggregate structure between field cores and kneading
specimens (Figure 4.50).
Confounding aspects of this comparison of field and laboratory compaction included (1)
possible differences between as-molded and cored surfaces, (2) traffic conditioning of the field
cores, and (3) differential aging. To examine the latter aspect, viscosities were measured on
extracted asphalts. Although these measurements indicate more aging in the field cores than in
the laboratory specimens (Figures 4.51 and 4.52), they provide no further explanation of the
effects observed in the creep testing.
Field cores were also available from a section of US 101 in California that had been in
service for many years. Laboratory specimens were prepared from field cores which, after
heating, were mechanically crumbled in preparation for recompaction. Results of the shear
creep testing are summarized in Figure 4.53. In this case, the field cores proved more resistant
to permanent deformation than either type of laboratory specimen. Interestingly, despite low
average air voids, gyratory specimens appear to be more resistant than kneading specimens
although, at the end of the one-hour test, they seem to have been more rapidly approaching
collapse. These results are not easily explained.
The dilational response of these specimens in shear creep is of even greater curiosity.
As expected because of their high resistance to shear, the field cores dilated more than the
laboratory specimens (Figure 4.54). For some inexplicable reason, the kneading specimens
reached a plateau at intermediate shear strains: little additional dilation occurred even though
the shear strains eventually approached the collapse level of 0.02 in/in (0.02 mm/mm). Such
behavior had not been observed in other shear testing and was unexpected.
133

>- _._Zm
r_ >_ zm
<_ _ m
c",.)
c_5 z
E.-.--
........................"mm_--_io°
e-°_
Z__.__
Figure 4.50 Comparative Dilational Response of 1 80 Field Cores to Shear CreepLoading, Average of Five Specimens for Each Line (1 in/in -- 1 ram/ram)
134

180- Viscosityat 140 F
16000-
14000 - '
12000
10000 ,
Viscosity 8000(Poises)
i
6000 ,
I
4000 rI
2000
0 I
FIELD GYRATORY KNEADING
Figure 4.51 Viscosities of Asphalts Extracted From I 80 Field Coresand Laboratory Specimens, 140°F (60°C) (1 poise = 0.1 Paos)
135

180- Viscosityat 275 _
5 l
m
Viscosity 3(Poises)
l
2
0
FIELD GYRATORY KNEADING
Figure 4.52 Viscosities of Asphalts Extracted From I 80 Field Coresand Laboratory Specimens, 275°F (135°C) (1 poise = 0.1 Paos)

A _ A
I I I
i
0.................................................. 0
0
/ -j" i ....................................
i _ i --
_g
Figure 4.53 Comparative Response of US 101 Field Cores to Shear CreepLoading, Average of Four Specimens for Each Line (1 psi = 6.89 kPa)
137

................... 7 .......
Figure 4.54 Comparative Dilational Response of US 101 Field Coresto Shear Creep Loading (1 in/in -- 1 mm/mm)
138

In summary, the testing of field cores failed to produce definitive results. The I 80 tests
are more easily understood than the US 101 tests, but neither set of tests adds substantially to
a better understanding of the compaction process. The US I01 tests raise interesting, but
unanswered, questions.
4.6 (_Qmoarisons with Other Investi2ations
Monismith and Tayebali (1988) compared the shear creep response of laboratory
compacted asphalt concrete mixtures (with and without carbon black modifier) with the response
of I 80 (Sierra Nevada) field cores. The laboratory compactor used in their study was the same
kneading compactor used in the SHRP A-003A study. Figures 4.55 and 4.56 indicate that, in
both cases (with and without modifier), the kneading specimens exhibited a better resistance to
permanent deformation than the field cores.
The most recent comprehensive investigation of laboratory compaction procedures was
conducted as a part of the National Cooperative Highway Research Program (NCHRP)
Asphalt-Aggregate Mixture Analysis System (AAMAS) study (Von Quintus et al., 1988). Its
primary objective was to determine which of five laboratory compaction methods produced
specimens most nearly duplicating field cores. The five compaction methods included not only
the Texas gyratory compactor and the kneading compactor but also the Marshall compactor, the
Arizona vibratory/kneading compactor, and a mobile steel wheel simulator.
Although particle orientation and the distribution of air voids were among the factors
considered in the analysis, the NCHRP comparisons were driven primarily by the notion that
the best laboratory procedure is that which produces specimens having engineering properties
most like field cores. Critical engineering properties, all measured by diametral loading of
briquet specimens, were considered to be tensile strength, tensile strain at failure, resilient
139

_9
(FIELD MIX, I.AJ_COMPACTION)
_ (FIELD CO,_ES)
OCSCBll I:ICSCBI2 "FIELD CORES)A CSCBL f 0 CSCBL2 (FIELD MIX. LAB COMPACTION)
10 -I I 10 10 z 10 s 10 "TIME (sec)
Figure 4.55 Comparison Between Laboratory Specimens and Field Cores for Mixtureswith Carbon Black (1 psi = 6.89 kPa) (After Monismith and Tayebali, 1988)
140

I I F0 O
_ ^7 <> r_
2! °£.7. _ _"
°-.-
y -T
• Ol , Ol , Ol _'0l _ Ol Ol '_
Figure 4.56 Comparison Between Laboratory Specimens and Field Cores for ControlMixtures (1 psi = 6.89 kPa) (After Monismith and Tayebali, 1988)
141

modulus--each measured at temperatures of 41, 77, and 104*F (5, 25, and 40°C)--and various
indices from creep testing at 77 and 104*F (25 and 40"C).
Based primarily on the analysis of three of five paving projects, located in as many states
and each unconditioned by traffic loading, the NCHRP investigators concluded that specimens
produced by gyratory compaction had engineering properties more similar to field cores than
those produced by the other compaction procedures. The kneading compactor and the steel
wheel simulator were ranked as second-best choices. Although the differences among these
three compaction methods were judged to be statistically significant; they were relatively small
in magnitude and of no apparent practical significance--considering the inaccuracies of the
models that were employed to predict performance effects.
Using the slope of the creep curve as a measure of resistance to permanent deformation,
the NCHRP investigators found that kneading specimens (CK/CC) had flatter slopes than
gyratory specimens (MT/GS) and were, therefore, more resistant to permanent deformation
(Figure 4.57). The NCHRP Studythus corroborates one of the principal findings of the current
study.
However, two caveats regarding the NCHRP study are in order. First, it seems likely
that compaction effects observed in the current study are significantly greater than those
observed in the NCHRP study. Whether such differences can be attributed to different test
procedures, to different mixture composition and/or air-void contents, or to other factors is
unknown. In any case, the NCHRP study may understate the effects of compaction method on
important mixture properties. Second, most of the NCHRP field projects exhibited rather high
air voids. Results reported herein indicate that differences among compaction methods are likely
to be smaller for mixtures with high air voids. Results of the NCHRP study might have been
142

0.7
O-35
0.3 I ( I I
0.3 0.4. 0,5 0.6 0.7
Dope of CreepCurve,CK/CC
Figure 4.57 Comparison of Slope of Creep Curves for Gyratory (MT/GS) andKneading (CK/CC) Specimens (March 28, 1989 Letter to J. Moulthrop
from H. Von Quintus)
143

different if field compaction had resulted in lower initial air voids or if the field mixtures had
been further compacted by traffic before they were tested.
144

5.0 AIR-VOID MEASUREMENT AND CUT-SURFACE EFFECTS
The laboratory work for this study revealed that standard methods of air-void
measurement were not reliable for comparisons among specimens that had been prepared by the
different compaction procedures. Furthermore, significant differences in both measured air-void
contents as well as mechanical behavior were observed between uncut specimens (those tested
as compacted in the mold) and cut specimens (those sawed and/or cored from a larger compacted
mass). Primarily because of the critically important impact of air-void content on the
mechanical behavior of asphalt-aggregate mixtures, a special investigation of the effects of air-
void measurement and cut-surface effects was undertaken.
This section presents data that provide insight into these problems and includes
recommendations for resolving them. Useful evidence was collected regarding (1) relationships
between measured air voids and specimen preparation method and (2) the effects of cut surfaces
on measured air voids and test results. Shear creep tests were performed to examine the effects
of cut surfaces on specimen performance under loading.
The extent of data used to examine the issue of air-void measurement is summarized in
Table 5.1. Surface condition of the several types of specimens is summarized as follows:
• Briquets, 4 x 2.5 inches (101.6 x 63.5 mm), prepared by gyratory or kneading
compaction had "compacted" or "as-molded" surfaces that were not cut by coring
or sawing.
• Cylinders, 4 x 8 inches (101.6 x 203.2 mm), prepared by kneading compaction
had uncut surfaces at the sides and cut surfaces at the ends.
• Fatigue beams, 3.5 x 3.5 x 15 inches (88.9 x 88.9 x 381 mm), prepared by
kneading compaction, cylinders prepared by gyratory compaction, and all
145

Table 5.1 Sample Size for Study of Air-Void Measurement
Compaction Specimen Size and Chert (RL) Granite (RB) OtherShape AAG-1 AAK-1 AAG-1 AAK-1
4x2.5 in(101.6 x 63.5 mm) 29
BriquetGTrator7
4x8in(101.6 x 203.2 ram) 12
Cylinder
4 x2.5 in(101.6x63.5mm) 12 6 38 15 8
Briquet
4xSin
(101.6x 203.2mm) 2 9 15 5Cylinder
3.5x 3.5x 15in(88.9x 88.9x 381 27 7 20 17
Kneading mm)UncutBeam
3x3xl5in
(76.2x 76.2x 381 12 I 30 71mm)
Cut Beam
1.5 x 1.5 x 15 in(38.1 x 38.1 x 381 105 34 165 143
ram)Beam
4x 2.5 in(101.6 x 63.5 ram) 11
Rolling Briquet
Wheel 4 x 8 in(101.6 x 203.2 ram) 18
Cylinder
Total Number of Specimens 805
146

specimens prepared by rolling-wheel compaction were cut or cored from larger
compacted masses.
5.1 Air-Void Measurement
5.1.1 Objectives of Air-Void Measurement. The objectives of air-void-measurement
procedures can be summarized as follows:
1. To measure the degree of mixture compaction resulting from the application of
mechanical energy to the mixture in order to expel air and/or reorient the
aggregate into a denser, more stable arrangement;
2. To measure the voids in the aggregate matrix which are not filled with asphalt;
3. To be fast and simple and to provide repeatable results and maintain the original
specimen shape so that it can be used for testing; and
4. To allow meaningful comparisons among a variety of specimens with different
degrees of compaction, different asphalt contents, and/or different fabrication
techniques including specimens obtained by field coring.
5.1.2 Methods of Air-Void Measurement. Bulk specific gravities for air-void measurement
of specimens prepared early in the compaction study, 4 x 2.5-inch (101.6 x 63.5 ram) briquets
using kneading and gyratory compaction, were calculated by weighing them in air and in water,
without the use of paraffin wax or other surface coating. The air-void content was calculated
using the following equation:
AV = (I- ob_,) x 100 (1)Gmm
where AV is the air-void content in percent, Gb is the bulk specific gravity, and Gmm is the
maximum specific gravity determined by the "Rice method" (ASTM D 2041). The standard
147

method for sealing specimens using paraffin wax (ASTM D 1188) was not used, since testing
after air-void measurement requires removal of the paraffin wax, a difficult and time
process. These specimens were neither cut nor cored and therefore contained no entrapped
water. This procedure is referred to as dry-no-parafilm (drip).
Rolling-wheel specimens and 4 x 8-inch (101.6 x 203.2 mm) gyratory cylindrical
specimens were cored and/or cut from larger compacted masses, using water cooling to prevent
aging of the asphalt and damage to the specimens due to frictional heat. Thisprocess leaves
water in the specimen--in varying amounts depending in part-on the internal air voids--which
may require several days to remove by drainage and evaporation. Because entrapped water may
be included in the weight-in-air measurement used to calculate Gb in Equation l, comparison
between air-void contents for these cut/cored specimens and those measured using the
dry-no-parafilm method was questioned. The standard procedure for removal of water (ASTM
D 2726) requires heating at 230°F (ll0OC), a potentially destructive process likely to
some specimens unsuitable for use.
To surmount this difficulty, a method was developed to permit direct comparisons
between the air voids of cut and uncut specimens. It was assumed that, once a specimen had
been wetted, a considerable waiting period might be required to allow it to dry under ambient
conditions. To circumvent such delays, the adopted method required all specimens (cut and
uncut) to be first wetted by immersion in a water bath and then dried with a compressed air
nozzle until a "surface dry" condition was achieved. This method is referred to as wet-no-
parafilm (wnp).
At the same time, it was found that permitting water to enter the specimen during
submersed weighing resulted in underestimation of air voids, particularly for specimens with
higher air-void contents. At high air-void contents, above approximately 8.5 percent by
148

dry-no-parafilm method, it was found that air-void content as measuredby the dry-no-parafilm
or wet-no-parafdmmethods was extremely insensitiveto compactive effort, andvisually obvious
differences in void content were undetectedby the air-void measurements. Experimentationwas
then carriedout using an elastic wax paper, parafilm, as a substitute for paraffinwax (Del VaUe,
1985). Measurementsof air voids, using the "surfacedry"condition and parafilm,were found
to be sensitive to air-void content, applicable to all types of compaction and specimen
preparation methods, and convenient for later testing of the specimen. This procedure is
referred to as wet-with-parafilm (wwp). The equation used to calculate bulk specific gravity
using this method is the same as in the standardparaffin-wax procedure (ASTM D 1188).
5.1.30uantitative Differences Between Methods. Wet-with-parafilm (wwp) measurements
are compared to wet-no-parafilm (wnp) measurements in Figure 5.1 and to dry-no-parafilm (dnp)
measurements in Figure 5.2. These results show the significant difference resulting from the
use of parafilm. Interestingly, however, the dry measurements (dnp) are not significantly
different from the surface-dry measurements (wnp) as illustrated in Figure 5.3. This indicates
that the blown-air-drying procedure was quite efficient and that initial concerns about completely
drying the specimens in a relatively short time were unwarranted. This finding permits direct
comparisons of measured air voids for as-molded specimens with those for previously wetted
specimens that have been surface dried with compressed air. The combined results of Figures
5.1 through 5.3 are summarized in Figure 5.4 which shows the least squares regression line for
each of the above three relationships.
The effects of parafilm on cut and uncut specimens are similar though not identical, as
demonstrated by regression lines for the with (wwp) and without (wnp) parafilm methods (both
methods used on specimens in both the cut and uncut condition) shown in Figure 5.5. There
149

AIRVOID5WWP 8
0
O 2 4 6 O 10 12
All?VOIDSWNP
Figure 5.1 Effect of Paraf'dm on Surface-Dry Measurements of Air Voids,All Specimens
150

16
14
12
10 ••_ 4#
_IRvoidswwPo •° Y_,*:_-o°
4 _i 1_]_6_-_./._
0
0 2 4 6 8 10 12
AIRVOIDSDNP
Figure 5.2 Combined Effect of ParafUm and Wetting on Air-Void Measurements
151

16
14
12
10
AIRVOIDSWNP 8
6
4
, I
o i :0 P. 4 6 8 I0 !_
AIRVOIDSDNP
Figure 5.3 Effect of Wetting on No-Parafilm Measurements of Air Voids
152

16
1, /12 // xvsY10 x-_ ALL,WNPvs WWP
ALL.DNPvs _PY - AIRVOIDS(Z) 8 ., [
I _ ALL,DNPvs WNP
6 -- Line of Equality
4
2
0
0 2 4 6 a _0 _2 14 _8X- AIRVOIDS(%)
Figure 5.4 Comparison of DNP, WNP, and WWP Measurements of Air Voids,Regression Lines
153

16s
//1, J/;_ /12
t[ _///_//// _" CUT,WNPvs WWP
10
AIRVOIDSWWP g I ,J/ "<>UNCUT,WNPvsI
° //4
0
0 2 4 6 8 10 12 14 16
AIRVOIDSWNP
Figure 5.5 Combined Effect of Cut Surfaces and Parafilm on Air-VoidMeasurements, Regression Lines
154

is generally less difference between airvoids measuredwith the two methods for specimens with
cut surfaces than with uncut surfaces due to the smoother exteriors of the cut specimens.
Specimens prepared using granite (RB)andchert (RL) both show littledifference between
the dry (dnp) and wet (wnp) conditions, as can be seen in Figure 5.6. However, the chert (P,.L)
specimens with higher air-void contents are more sensitive to the use of parafilm than are the
granite (RB) specimens, as shown in Figure 5.7. This is probably the result of the parafilm
trapping air because of the more irregular, chipped surfaces of the chert (RL) specimens.
5.1.4 Critiaue of Wet-With-Parafilm Procedure. Although the wet-with-parafilmprocedure
is better than other alternatives, two concerns remain. The primary concern is arching of the
parafilm over surface irregularitiescausedby chipping of the aggregates during cuttingand/or
coring, with the result that air trappedunderthe parafilm is improperly considered as internal
air voids. This problemoccurs most frequentlywith specimens having thin cross-sections, broad
flat uncut surfaces, and/or aggregates that chip easily. A similar problem occurs even with
smooth specimens if careful attentionis not given to the removal of air entrappedbeneath the
parafilm.
The other potentialconcern with the wet-with-parafilmtechnique is the repeatabilitywith
which the "surface dry" condition is reached, although a limited comparison with tests from
another laboratory showed little problem. While the general technique used in this study has
proven to be suitable, moreattention must be given to standardizationof the drying equipment
and procedures.
155

16
12 ' /
I0_ TEXCHERT.DNPvsWNP
AIRVOIDSWNP 8 1 /j// <>-WATGRANITE.DNPvs
!/4
2 k
/ ,o , i ,I0 2 4 6 8 10 12 14 16
AIRVOIDSDNP
Figure 5.6 Combined Effect of Wetting and Aggregate Type on Air-VoidMeasurements, Regression Lines
156

16
::i10 I / _ TEXCHERT.DNPvs WNP
AIRVOIDSWWP 8 ¢- _ATGRANITE,DNPvs_,'NP
/ _8 k4
0
0 2 4. 6 8 10 12 14 16
A]RVOIDSWNP
Figure 5.7 Combined Effect of Parafilm and Aggregate Type on Air-VoidMeasurements, Regression Lines
157

5.2 Effect of Cut Surfaces
5.2.10biectives of Laboratory Svecimen Compaction. The objectives of laboratory
specimen fabrication are briefly summariz___as follows:
1. To fabricate specimens that as closely as possible resemble in-service mixtures,
that is, those produced by mixing, placement, and compaction in the field;
2. To fabricate specimens that, under laboratory testing, exhibit the same behavior
as in-situ mixtures under similar states of stress; and
3. To be as efficient as possible in the use of labor, time, equipment, and material.
5.2.2 Effects of Compaction Method. Slight differences were visually observed between the
top and bottom surfaces of all laboratory-prepared specimens. For gyratory specimens, the
lower surface was usually rougher, that is, both the aggregate particles and the surface voids
were larger in size. The top of the specimen, which had been in contact with the compacting
surface, usually had a smoother surface with finer particles. For kneading specimens, the
reverse was true although the difference between the top and bottom surfaces was much less than
that of gyratory specimens. The lateral surfaces of most molded specimens were a smooth
matrix of asphalt and the finer fractions of aggregate: there was little honeycombing and larger
particles had migrated inward. Lateral surfaces of specimens with high asphalt contents often
contained excess asphalt, especially when compacted to low air-void contents.
During compaction, the mold walls constrain the reorientation of surface particles.
However, in the interior, the sheafing action of the compactor reorients the larger particles,
producing a "structure" that significantly affects engineering properties of the compacted
mixture. If quantifies of the asphalt and fine particles are limited or the compaction effort is
modest, gaps separating the larger particles at the surface remain unfilled. In any case, the
158

likely result is that the aggregate structure at the surface of the specimen is different from that
in its interior.
Some segregation of larger from finer panicles occurs when pouring and compacting hot
mixtures. Segregation becomes more pronounced as the size of the compacted specimen and/or
the compactive effort decreases, since the size of the larger aggregates relative to the mold
dimensions, and/or the lack of shearing energy, do not permit easy movement of fines to the
interstices between the larger aggregates.
Gyratory specimens are subjected to a torsional shear force on their lateral surfaces due
to rotation of the compaction apparatus base plate, while the compaction ram resists rotation at
the top surface. As a residual result of these surface forces, large aggregate particles often
separate from the surface when the specimen is extruded from the compaction mold. When the
large particles are rounded, thin layers of finer material between the large particles and the
specimen surface also frequently separate from the specimen after extrusion. The effects of the
torsional surface forces in gyratory compaction are recognized in the procedure for the Texas
gyratory compactor (Texas Method Tex-206-F and ASTM D 4013) which stipulates that large
aggregate particles should be pulled away from the mold wall with a spoon before beginning
compaction. The mold will rotate if the torsional shear force exceeds the friction between the
mixture and the mold wall, smearing excess asphalt and fine material across the lateral surface
of the specimen.
Cutting or coring the specimen from a larger compacted mass removes those portions of
the specimen that have been subjected to the forces and effects described above. The specimen
with cut surfaces has a more homogenous aggregate and air-void structure, and its surface is not
smeared with asphalt.
159

The major drawbacks of cut specimens include (1) the need for care during sawing and
coring to obtain the required geometric shapes, free of ripples or other surface imperfections,
and (2) possible problems with the exposure of mixtures to water during the sawing/coring
process. Problems with water-sensitive mixturesare encounteredin air-void measurementsthat
involve wetting the specimen, however, and they can usually be solved by careful drying and
timely testing.
5.2.3 Effects on Air-Void Determinstien. The effects of surface condition (cut or uncut) on
air-void measurements depend on the properties of the mixture (including, for example, asphalt
content and aggregate angularity) and the compaction method (gyratory, kneading, or rolling
wheel).
1. The difference between air voids measured with cut surfaces and those measured
with uncut surfaces depends on the degree of nonuniformity in the air voids and
aggregate structure between the surface and the interior of the specimen: this is
a function of compaction method, compaction effort, aggregate angularity, and
asphalt content.
2. If the specimen has a large surface area in relation to its volume, the difference
between the measured air voids with cut versus uncut surfaces is greater. Thus,
large specimens such as 3.5 x 3.5 x 15-inch (88.9 x 88.9 x 381 mm) beams and
4 x 8-inch (101.6 x 203.2 mm) cylinders will have less difference in the
measured air voids than 2.5 x 4-inch (63.5 x 101.6 mm) briquets.
3. If the asphalt content and/or the compaction effort is high, asphait at the surface
of the uncut specimen may forma coating, which prohibits the entry of water into
the specimen and may affect air-void measurements.
160

4. For high asphalt contents and/or large compaction efforts, the sealing action at
the surface of the uncut specimen is greater for gyratory specimens due to
smearing caused by the torsional shear forces on the lateral surfaces.
An example of the difference between the measured air voids for specimens as compacted
and after cutting is shown in Figure 5.8. In this case 3.5 x 3.5 x 15-inch (88.9 x 88.9 x 381
ram) beams of all mixture types, prepared by kneading compaction, were tested using the
wet-with-parafdm (wwp) procedure both after compaction and after trimming of the outer 3/16
inch (4.8 ram) of the surface. The data indicates that the as-compacted specimen has
approximately 1 to 2 percent more air voids than the same specimen after cutting. This pattern
is confirmed by testing the same specimens using the wet-no-parafilm (wnp) method as
illustrated in Figure 5.9.
Further evidence of differences between interior and exterior air-void contents is shown
in Figure 5.10, for 4 x 8-inch (101.6 x 203.2 ram) gyratory specimens. In this case specimens
were compacted as 6 x 9.5-inch (152.4 x 241.3 ram) cylinders, then cored and cut to their final
dimensions. Comparison of air-void measurements using the dry-no-parafilm method for the
uncut specimens and the wet-no-parafilm method for the cut specimens--these two methods have
previously been shown to produce similar results-indicates that at lower compaction efforts
(higher air-void contents) the outer portion of the specimen is more densely compacted than the
inner portion, while at higher compactive efforts 0ower air-void contents) the reverse is true.
At high compactive efforts (low air voids), differences in air voids of up to three percent (wwp)
have been found between the center third (higher air voids) and top and bottom thirds (lower air
voids) of 4 x 8-inch (101.6 x 203.2 mm) gyratory specimens. This indicates specimen non-
uniformity along the vertical axis, occurring despite the fact that the specimens were compacted
in one lift.
161

16 "!
14
12
AIRVOIDSWWP- ACUT 8
i A _ *-)--%-*_)4
2 ,,
! !O 2 4 6 8 10 i2
AIRVOIDSWWP - UNCUT
Figure 5.8 Effect of Cut Surfaces on Wet-With-Parafilm Measurements ofAir Voids in Large Beams, Kneading Compaction
162

16
14
12
R VOIDSWNP - 8
CUT _ E
4
O "__ _""
0 2 4 6 8 10 12
AIRVOIDSWNP- UNCUT
Figure 5.9 Effect of Cut Surfaces on Wet-No-Parafilm Measurements ofAir Voids in Large Beams, Kneading Compaction
163

16
14
12
I0
AIRVOIDSWNP- 8 I
CUT ,!_ __6 ii
4
2 e
o I0 2 4 6 8 10 12
AIRVOIDSDNP- UNCUT
Figure 5.10 Effect of Cut Surfaces on No-Parardm Measurements ofAir Voids in Large Cylinders, Gyratory Compaction
164

5.2.4 Effects on En2ineerin2 Prom_rties. In some types of tests, cut surfaces may have a
significant effect on the measured response of the mixture. In tests which impose large shear
stresses, the measurementswill tend to be larger for specimens whose surfaces have been cut.
The cut surfaces of the aggregates rest against the end plates, effectively resisting rotationof the
large aggregate particles. Figure 5.11 shows two examples, shearand diametral loading, where
this mechanism is likely to produce an effective increase of stiffness modulus, resistance to
permanentdeformation, and fatigue life.
Direct evidence is provided by comparison of simple shear test results for uncut, 4 x
2.5-inch (101.6 x 63.5 mm) gyratory specimens with those for specimens cored and cut from
6 x 9.5-inch (152.4 x 241.3 mm) cylinders. In Figure 5.12, the difference between the
performance of the two types of specimens is illustrated. The uncut specimens have a larger
proportion of aggregates able to move under stress, leading to rapid failure once aggregate
interlock has been overcome by the shea_ng force.
5.3 Summa_
Based on the stated objectives of specimenpreparationand air-void measurementand on
the dataand observationspresented herein, the following conclusions can be drawn:
1. Whether a specimen is uncut (as-molded) or cut (sawed or cored from a larger
compactedmass) may have significanteffects both on its mechanical behaviorand
on its measured air-void content.
2. In comparison to cut specimens, specimens with uncut surfaces axe less
homogeneous in their distributionof air voids and exhibit more segregation of
aggregate and greater migration of fines and asphalt to their surfaces.
3. Cutting the surfacesof laboratoryspecimensallows more accurate comparisonof
their properties with those of field cores.
165

SHEAR
CUT i; _ AS MOLDED
SURFACES (NO CUT SURFACES)
[i
DIAMETRA_
Figure 5.11 Illustration of Boundary Effects of Cut Specimen Surfaces inShear and Diametral Testing
166

10000
]ooo- B_-'_-'<'_-. ¢- G-UNCUT-(a.SZwwp)SHEARCREEP - =-n-_u__
MODULUS(PSl) _l-mlt -= G-CUT-(3.T%wwp)I00
I0
0.1 1 I0 IO0 1000 10000
TIME(SEC)
Figure 5.12 Effect of Cut Surfaces on Shear Creep Modulus,Gyratory Specimens (1 psi = 6.89 kPa)
167

4. Measurement of air-void content is critical to understanding specimen
performance in testing. The use of parafilm for immersed weighing produces
consistently sensitive and reproduciblemeasurements and easily allows further
testing of the specimen after air-voiddetermination.
Based on these conclusions it is recommendedthat laboratory specimens be preparedby
coring and/or cutting from a larger compacted mass and that cut specimens be allowed to dry
naturally, or surface dried with compressedair, prior to in-air weighing. All specimens should
be encased in parafflm for immersed weighing.
168

6.0 SUMMARY AND RECOMMENDATIONS
The primary purpose of this study was to determine the extent to which method of
laboratory compaction (Texas gyratory, kneading, and rolling wheel) affects fundamental mixture
properties of importance to pavement performance in service. Permanent deformation and
fatigue were selected as the performance parameters of greatest concern, and laboratory creep
and fatigue tests were used to measure mixture properties that were likely to correlate well with
field performance.-A total of i6 asphalt-aggregate mixtures--varying widely in asphalt source,
aggregate type, asphalt content, and air-void content--were tested. All aggregates were densely
graded with a 3/4-inch (19.0 ram) maximum size. Principal findings and recommendations of
the investigation follow.
6.1
1. The method of compacting asphalt-aggregate mixtures affects the way test specimens
respond to laboratory loading. Fundamental engineering properties with expected links
to pavement performance are significantly affected, both statistically and in terms of
practical engineering consequence.
2. Regarding resistance to permanent deformation, kneading compaction produces the most
resistant specimens, followed in order by rolling-wheel and gyratory compaction. In
genera/, kneading compaction also produces specimens that are most sensitive to mixture
composition. Specifically, the properties of kneading specimens are more sensitive to
aggregate type while those of gyrator), and rolling-wheel specimens have greater
sensitivity to asphalt type.
3. Regarding resistance to fatigue--under controlled-stress conditions--gyratory compaction
produces the most resistant specimens followed in order by rolling-wheel and kneading
169

compaction. Sensitivity to mixture composition favors rolling-wheel specimens,
however, and any differences in sensitivity between gyratory and kneading specimens are
small.
4. Regarding mixture stiffness, the various test methods do not produce uniform results.
The shear creep tests seem to be most reliable, however, and, on this basis, the stiffest
mixtures are those produced by rolling-wheel compaction, followed in order by kneading
and gyratory compaction. Complex modulus testing confirmed the finding that kneading
specimens are stiffer than gyratory specimens. The stiffness of rolling-wheel specimens
reflects slightly more sensitivity to mixture composition than either gyratory or kneading
specimens.
5. These effects can at least partially be explained in terms of differences in the interparticle
contact and aggregate "structure" likely to be developed by the different compactors. At
least for dense-graded mixtures, the effect of compaction method is intensified at low
levels of air voids and presumably at high levels of asphalt content, conditions
representative of a larger percentage of voids in the mineral aggregate that are filled with
asphalt.
The kneading compactor imparts a large, localized shearing force and permits
considerable movement within the loose but densifying mixture: it is very effective in
producing specimens with maximum interparticle contact and a tight, interlocking
aggregate structure. As a result, mixtures prepared under kneading compaction are most
sensitive to aggregate angularity and surface texture. The asphalt serves to assure that
the integrity of the interparticle contact and aggregate structure is maintained.
Although it does serve to reorient the larger aggregate particles, the shearing
motion of the Texas gyratory compactor is much less severe than that of the kneading
170

compactor, is applied fewer times, and is much less effective in inducing structure within
the aggregate particles. Also, during compaction the loose mixture is under considerable
"hydrostatic _ pressure from the compressive compaction loading. Under such pressure,
the gyratory action very effectively densifies the mixture by expelling air but is less
successful in forcing intimate interparticle contact. Because the asphalt tends to separate
the aggregate particles, the properties of mixtures prepared by gyratory compaction are
more sensitive to the properties of the asphalt binder.
A steel-wheel roller, with a vibratory capability that was needed only
occasionally, was used to represent rolling-wheel compaction techniques in this study.
Although flow of the loose mixture during compaction was restrained to some extent by
lateral confinement, the movement was apparently sufficient to induce considerable
interparticle contact. Rolling-wheel specimens were ranked between kneading and
gyratory specimens in their resistances to permanent deformation and to fatigue.
However, they were stiffer under transient loading than either gyratory or kneading
specimens.
6. With minor exception, the general influence of mixture and test variables on fundamental
mixture properties was unaffected by compaction method. Effects of mixture and test
variables are summarized as follows:
Resistance to Permanent Deformation
Asphalt Type: AAK-1 superior to AAG-1Asphalt Content: _Optimum _ superior to _high _Aggregate Type: Granite (RB) superior to chert (RL)Air-Void Content: Low voids superior to high voidsTemperature: More resistant at low temperatureStress Level: More resistant at low stress
171

Resistance to Fatieue
Asphalt Type: AAG-1 superior to AAK-1Asphalt Content: "Optimum" superior to "high"Aggregate Type: Granite (RB) superior to chert (RL)Air-Void Content: Low voids superior to high voidsTemperature: More resistant at low temperatureStress Level: More resistant at low stress
Stiffness Modulus
Asphalt Type: AAK-1 stiffer than AAG-1, 104-140°F (40-600C)AAG-1 stiffer than AAK-1, 32-68°F (0-32°C)
Asphalt Content: "Optimum" stiffer than "high"Aggregate Type: Granite (RB) stiffer-than chert (RL)-..Air-Void Content: Low voids stiffer than high voidsTemperature: Stiffer at low temperatureStress Level: Stiffer at low stress
7. Compactors within a given genre may produce specimens having quite different
engineering properties. Taking kneading compaction as an example, a variety of
multistage compaction strategies can be employed and critical parameters--the size of the
tamping foot, the size of the specimen, the number of layers, the number of tamps on
each layer, and tamping pressure--can be varied over rather wide ranges. Such variations
almost certainly affect the aggregate structure and, in turn, are expected to affect many
mixture l.roperties linked to pavement performance. The limited comparisons reported
herein between the Texas and Corps of Engineers gyratory compactors provide tentative
verification of possibly significant differences among compactors of the same general
type,
8. Measurements of permanent deformation accumulated under repetitive loading, although
limited in extent, generally corroborated results of the creep tests.
172

6.2 Recommendations
1. Because one of the most critical mixture characteristics is air-void content, it must be
measured as accurately and as with as much reliability as feasible if test results are to be
meaningful. Experimentation with several different methods for measuring air voids
yielded widely divergent estimates, especially for mixtures having high voids and uncut
surfaces. The use of parafilm for immersed weighing is clearly advantageous both for
its accuracy and its reliability. It will be used in test systems evaluation where its use
would not negate or confound work already completed or currently underway. In
addition, it will be used to measure air voids in both the cooperative test program and
the expanded test program. If its use continues to be successful throughout these
extensive test efforts, parafilm will be recommended, thereafter, for adoption in relevant
standards and specifications.
Specimens that have been exposed to water as a result of coring and/or sawing
must be dried before measurements of in-air weight are taken. Surface drying with
compressed air is an acceptable substitute for natural drying by drainage and evaporation.
2. Specimens with cut surfaces, either sawed or cored, are preferred to those with as-
molded surfaces: test results are expected to be more precise as a result of the greater
homogeneity, air voids can be more accurately measured, and comparisons with
specimens extracted from in-service pavements are potentially more valid. Specimens
for use in the test-systems-evaluation phase of the study will have cut surfaces, providing
available equipment permits and providing the practice does not negate or confound work
already completed or currently underway. In the cooperative test program and the
expanded test program, which follow test-systems evaluation, all specimens will be cut
from larger compacted masses. If this effort proves successful, sawing and/or coring
173

will be recommended, thereafter, in the preparation of all laboratory specimens.
Compaction procedures that are recommended for future use and for adoption in relevant
standaxds and specifications must then be able to accommodate masses from which
specimens of the necessary size and shape can be extracted by sawing and/or coring.
3. Because compaction method can have such a profound impact on fundamental mixture
properties, consistent testing demands use of a single compaction procedure. The
gyratory compactor places excessive emphasis on the asphalt binder and does not
accurately portray the role of asphalt-aggregate interaction in the performance of properly
constructed pavements. Furthermore, the shapes and dimensions of specimens produced
by gyratory compactors are limited. Although the kneading compactor is more adaptable
for producing a variety of sizes and shapes, it may create a more stable aggregate
structure than is commonly developed by conventional construction practice, thereby
failing to capture the role of the asphalt binder in properly performing pavements.
Rolling-wheel compaction seems to be the preferred procedure for laboratory
compaction. Among the methods investigated, it appears to best duplicate field-
compacted mixtures. It can be used to produce specimens of the necessary sizes and
shapes and can accommodate aggregates of all reasonable sizes. Rolling-wheel
compaction is a comparatively easy procedure and is fully compatible with the
requirement for cut specimen surfaces and for the rapid fabrication of a large number of
specimens as is likely to be required for AAMAS-based designs and investigations.
Because of the advanced stage of the test-systems-evaluation phase of the SHRP
A-003A project, it is not feasible to require that all specimens be prepared by rolling-
wheel compaction. When specimens have been prepared by other procedures during this
phase, very careful assessment may be required to discriminate between the effect of
174

7.0 REFERENCES
Del Valle, H. (1985), "Procedure - Bulk Specific Gravity of Compacted Bituminous MixturesUsing Parafilm-Coated Specimens, =Chevron Research Company, Richmond, California.
Francken, L. (1977), "Permanent Deformation Law of Bituminous Road Mixes in RepeatedTfiaxial Compression," ]_I._AlJ/)_, Fourth International Conference on StructuralDesign of Asphalt Pavements, University of Michigan, Ann Arbor, pp. 483-496.
Hicks, R. G., J. A. Deacon, L. Painter, and C. L. Monismith (1990), "Laboratory Study Planfor SHRP Project A-003A," T_chnical Memorandum 89-8, Institute of TransportationStudies, University of California, Berkeley.
Hills, L E., D. Brien, and P. J. van de Loo (1974), "The Correlation of Rutting and CreepTests in Asphalt Mixes," Paver 1P-74-001, Institute of Petroleum, London.
Monismith, C. L., J. A. Epps, D. A. Kasianchuk, and D. B. McLean (1971), "Asphalt MixtureBehavior in Repeated Flexure," Report No. TE 70-5, University of California, Berkeley.
Monismith, C. L. and A. A. Tayebali (1988), "Permanent Deformation (Rutting) Considerationsin Asphalt Concrete Pavement Sections," _A_[L_, The Association of Asphalt PavingTechnologists, Volume 57, pp. 414-463.
Sousa, J. B., J. Craus, and C. L. Monismith (1990), "State of the Art on Rutting in AsphaltConcrete," TM-UCB-A-0Q_A-89-4, Institute of Transportation Studies, University ofCalifornia, Berkeley.
Tangella, S. C. S. Rao, J. Craus, J. A. Deacon, and C. L. Monismith (1990), "SummaryReport on Fatigue Response of Asphalt Mixtures," TM-UCB-A-003A-89-3, Institute ofTransportation Studies, University of California, Berkeley.
Vallerga, B.A. (1951), "Recent Laboratory Compaction Studies of Bituminous PavingMixtures," _, The Association of Asphalt Paving Technologists, Volume 20,pp. 117-153.
Von Quintus, H. L., J. A. Scherocman, C. S. Hughes, and T. W. Kennedy (1988),"Development of Asphalt-Aggregate Mixture Analysis System: AAMAS, Phase II -Volume I, Preliminary Draft Final Report," Brent Rauhut Engineering Inc., Austin,Texas 1988.
176

compaction method and the effect of each test system underevaluation. Exclusive use
of rolling-wheel compactionwill be mandatoryin both the cooperative test programand
the expanded test program. If this effort proves successful, rolling-wheel compaction
will likely be recommended for adoption in relevant standards and specifications.
Recommending an alternate to rolling-wheelcompaction for routine mix designs may be
an eventual consideration.
175

1.0 INTRODUCTION
Documentation of the methods used to prepare asphalt-aggregate specimens for SHRP
Project A-003A is necessary for several reasons. First, it is required for later evaluation of the
effects of specimen preparation on test results. Second, a common procedure for specimen
preparation is necessary to provide uniformity of specimens in order to avoid confounding the
experiment. Third, the procedure can be used as a framework to include any specimen
preparation variables that are to be introduced into the experiment.
1.1 Effective Date
The first version of this document (Version 1.0 dated August 29, 1989) described
procedures in effect at the University of California at Berkeley (UCB) laboratory during the
mixture design and compaction study phases of this project. This revised version (Version 2.0),
while continuing to describe procedures in effect during the compaction study, also addresses
the preparation of specimens for all other testing at UCB as well as at other laboratories
participating in SHRP Project A-003A. Version 2.0, with effective date of May 8, 1990,
remains in effect until superseded by an updated version.
1.2 Scooe
Described herein are the following procedures:
1. Aggregate batching and handling procedures;
2. Asphalt-aggregate mixing and curing of mixtures;
3. Asphalt-aggregate compaction, currently including the following methods;
a. Texas gyratory compaction of 2.5 x 4.0-inch (63.5 x 10!.6 ram) briquets,
b. Texas gyratory compaction of 6.0 x 8.0-inch (152.4 x 203.2 ram)
cylinders cut to make 4-inch (101.6 ram) diameter cylinders,
A.2

APPENDIX A
SPECIMF_N PREPARATION

c. Kneadingcompactionof 2.5 x 4.0-inch (63.5 x 101.6 ram)briquets,
d. Kneading compaction of 4.0 x 8.0-inch (101.6 x 203.2 mm) cylinders,
e. Kneading compaction of 3.5 x 3.5 x 15-inch (88.9 x 88.9 x 381 ram)
beams cut to makespecimens of different sizes,
f. Rolling-wheel compactionof 16.0 x 16.0 x 9-inch slabs (406.4 x 406.4 x
228.6 ram)cut to make specimensof different sizes; and
4. Procedures for determining specimen air-void content.
A.3

2.0 AGGREGATE BATCHING
2.1 D ryin2 and Sievin_
Aggregate to be used for specimen preparation must first be dried and sieved according
to the following procedure, taken from "Materials Handling Protocol" (Hicks, 1989).
1. All aggregate should be checked to be sure that it contains no refuse material,
such as sticks, asphalt, bits of concrete, other types of aggregate, or any other
material that will affect the performance of the asphalt-aggregate specimens to be
made.
2. Spread the aggregate on sheets or trays and dry in a forced air oven overnight
(about 20 hours) at about 300°F (149°C) so that it arrives at a constant mass.
If sheets are not available and the material is dried in barrels or similar
containers, more time may be needed to completely dry the aggregate.
3. After removing the material from the oven, allow it to cool, and then place it in
a storage container for sieving. The storage container should be of a type that
allows complete sealing from the outside air (and rain, if outdoors!).
4. Material should he sieved in a Gilson type machine. The sieving time used at
UCB is 5 minutes. Any convenient sieving time between about 4 and 30 minutes
can be used, provided that appropriate batching and gradation analysis
procedures, described herein, are followed.
The screens should be cleaned regularly, and checked to be sure that they are neither
clogging with fine material nor allowing coarse material to pass. Each time material is taken
off the screens, it should be placed in an intermediate container, such as a 5-gallon (0.0189 m3)
bucket, before emptying into the final sieved aggregate storage container, typically a 55-gallon
(0.208 m3) barrel. This will help prevent accidently emptying a sieve full of the wrong size
A.4

material into a large container, and also allow checking of the sieved material for leaking or
overloaded sieves.
2.2 Calculation of Batching Weights
If the specimens are prepared using the sieved materials in exactly the same percentages
as required by the mixture-design gradation, the actual specimen gradation will probably be
somewhat different. The difference is due to incomplete sieving of the material--whatever the
sieving time-and dust which adheres to the surface of the larger size aggregates during sieving.
Also, due to difficulties in sieving large quantities of material into different sizes below the No.
100 sieve, a minus 100 (- 100) material is sometimes being used at UCB for granite (RB).
However, for granite (P.B) as well as chert (ELL the actual amounts of materials passing the No.
100 and No. 200 sieve must still be determined. To account for these problems the following
procedures should be followed.
1. The following gradations have been or are being used for this project:
a. Medium Gradation No. 1. This gradation, shown in Table A. 1, was used
during the mixture design and compaction studies.
b. New Medium Gradation No. 2. This gradation, shown in Table A.2, is
being used for all specimens of medium gradation made for tests after the
compaction study. The asphalt contents from the mixture design were
checked with this gradation and found to be acceptable. However, it
should be remembered that the No. 1 and No. 2 medium gradations are
not interchangeable.
c. Coarse Gradation. This gradation is shown in Table A.3. It was not used
during the compaction study.
A.5

Table A.1 Medium Gradation No. 1
Sieve Size Percent Passing by Mass Percent Retained by Mass
1 in 100 0
3/4 in 95 5
1/2 in 80 15
3/8 in 68 12
No. 4 48 20
No. 8 35 13
No. 16 25 10
No. 30 17 8
No. 50 12 5
No. 100 8 4
No. 200 4 4
Pan 4
Note: lin =25.4mm
A.6

Table A.2 Medium Gradation No. 2
Sieve Size Percent Passing by Mass Percent Retained by Mass
1 in I00 0
3/4 in 95 5
1/2 in 80 15
3/8 in 68 12
No. 4 48 20
No. 8 35 13
No. 16 25 l0
No. 30 17 8
No. 50 12 5
No. I00 8 4
No. 200 5.5 2.5
Pan 5.5
Note: lin-25.4mm
D
A.7

Table A.3 Coarse Gradation
I
Sieve Size Percent Passing by Mass Percent Retained by Mass
I in I00 0
3/4 in 90 I0
1/2in 72.5 17.5
318 in 60 12.5
No. 4 40 20
No. 8 27 13
No. 16 18 9
No. 30 10 8
No. 50 8 2
No. I00 5.5 2.5
No. 200 3 2.5
Pan 3
Note: lin =25.4mm
A.8

2. Using the top size of the gradationand the informationin Table A.4, determine
the minimumrequired mass of aggregate.
3. Using the appropriate mixture-design gradation (Tables A.1, A.2, or A.3),
calculate the percentby weight passingeach individual sieve, and the percent by
weight retained on each individual sieve. Form 1 (Figure A. l) can be used for
this calculation.
4. With the total aggregate weight and the percentretainedon each sieve, calculate
the weight of each size to be included in the specimen, using Form 1 (Figure
A. 1). Then batch the specimen.
5. Wash the hatchedspecimen through a No. 200 sieve, following the procedure in
ASTM C 117-80. Calculate the weight of material washingthroughthe No. 200
sieve by drying the retainedmaterialto constant weight, weighing it, and finding
the difference from the original weight. Form 2 (Figure A.2) can be used for this
calculation.
6. Dry sieve the material retainedon the No. 200 sieve for 30 minutes, recording
the results on Form 3 (Figure A.3). Add the weight of material passing the No.
200 sieve from the wet-sieve analysis to the like materialfrom the dry sieving.
7. Calculate the cumulativepercent weightpassing each sieve and the percent weight
retained on each sieve on Form 3 (Figure A.3).
8. Compare the results of the analysis and make any appropriate changes in the
batchingoperation. For sieve sizes No. 50 and smaller, the gradation should be
within 4- 0.5 percent of the percent mass retainedon that sieve size in the
required gradation. For sieve sizes No. 30 and larger _+1.0 percent is allowed.
A.9

Table A.4 Minimum Masses Required for Analysis Specimens(from ASTM C 117-80)
Nominal Maximum Size of Panicles Minimum Specimen Mass (g)
2.36 mm (No.g) 100
4.75 mm (No. 4) 500
9.50 mm (3/8 in) 1000
19.00 mm (3/4 in) 2500
37.50 mm (1.5 in or larger) 5000
A. IO

UNIVERSITY OF CALIFORNIA - BERKELEYRICHMOND FIELD STATION
BITUMINOUS MATERIALS LABORATORYSHRP PROJECT
WEIGHTS OF MATERIALS TO ASSEMBLE SPECIMENS
Calculated by Checked by
Test Specimen Date
Aggregate Gradation
Test Specimen Codes
(A) Total Wt. of Specimen
Percent Passing Percent Retained Wt. per SpecimenSieve Size Cumulative on One Size of One Size
03) (Bi - Bi+l) (Bi - Bi+I)*A
2"
1"
3/4"
1/2"
318"
#4
#8
#16
#30
#50
#100
#200
Passing #200
TOTAL
Figure A.1 Form No. 1
A.11

UNIVERSITY OF CALIFORNIA - BERKELEYRICHMOND FIELD STATION
BITUMINOUS MATERIALS LABORATORYSHRP PRO/ECT
WET SIEVE ANALYSISASTM C ll7
Calculated by Checked by
Test Specimen Date
Aggregate Gradation
Test Specimen Codes
Nominal Total Wt. of Specimen
(A) Tare Wt. of Container
(B) Wt. of Container and Dry Specimen
(C) Wt. of Container and Dry SpecimenAfter Washing Through #200 Sieve (R200)
(D) Wt. of Original Material (B) - (A)
(E) Wt. of R200 Material AfterWashing (C) - (A)
(F) Percent Passing #200 Sieve [(D) - (E)]/(D)
Figure A.2 Form No. 2
A.12

UNIVERSITY OF CALIFORNIA - BERKELEYRICHMOND FIELD STATION
BITUMINOUS MATERIALS LABORATORYSHRP PROJECT
DRY SIEVE ANALYSISASTM C 136
Calculated by Checked by
Test Specimen Date
Aggregate Gradation
Test Specimen Codes
Nominal Wt. of Specimen
Weight Retained Percent Retained " l_ercent PassingSieve Size on One Size Cumulative Cumulative
(A) (C)=(Sum of Ai)/(B) (1 - Ci)*1002"
1"
3/4"
1/2"
318"
#4
#8
#16
#30i
#50
#100
#200t
Pan
(From Form 2)
(13)TOTAL WT
D Figure A.3 Form No. 3
A.13

9. Repeat Steps 3 through7 until the specimen gradationmeets the requirementsof
the mixturedesign. File the resultsof all analyses and hatchingregimes.
10. Periodically perform the above analysis on random specimens taken out of the
specimen production line. If you are making specimens smaller than the
minimum mass, combine several specimens.
2.3 Res'_lts to Date of Batchine Analyses
The results of wet sieving, and the batching regimes currently being used at UCB, are
available by telephone (415/231-9560, 415/231-9513, or 415/231-9588). The batching regime
to be used with sieved material sent to subcontractorswill be sent with each shipment. The
procedure, described in Section 2.2, should be carried out by subcontractorswhen receiving
unsieved material.
2.4 Receivine and Processine Unsieved Material or Mal[erialFrom Sources Other ThanUCB
2.4.1 Receiving. Whenever any materialarrives unsieved, or from sources other than UCB,
it should be checked to be sure thatit has the same characteristicsas any previous material that
may have been used. Specifically, new material should be checked for the following
characteristics.
1. Visual appearance. The material should be visually examined to assure that it
appearsthe same as previous materials of the same size. Indicationsare color,
specific gravity, microtexture,and gradation.
2. Angularity. The new materialshould have the same percentage of crushed faces
as previous material of the same size.
A.14

3. Dustiness. The material should be unwashed or washed, the same as previous
materialused of the same size.
4. Gradation. If different sizes of the material have different characteristics, the
gradations of the materialsreceived should be compared with previous materials
to be sure that the characteristics of the different sizes occur in the same
proportionsas for previous specimens.
2.4.2 _. In some cases the material retainedon a given sieve size originates from
two differentaggregatesources. For example, with chert (RL), the material retainedon the No.
4 and No. 8 sieves comes from two types of material, one completely crushed (called #6 by the
quarry)and the other completely uncrushedand smooth (called #8-200). Aggregates fromthese
two types must continuouslybe sieved and batehed in the same proportions (and be well mixed
together) to insure uniformpropertiesof the asphalt-aggregatespecimens. The ratios for sieving
this aggregate used at UCB are shown in Table A.5.
The terms RR Ballast, #2, #4, #6, 8-200 and -200 are the names used by the quarry for the
different types of material and are only the nominal sizes of the material. The term "grindings"
refers to chert (RL) material that was retained on the No. 100 sieve, and then ground between
rotating plates to make finer material.
If there are any questions regarding the uniformity of materials received from UCB, or
other sources, do not hesitate to call UCB.
2.5 Storage of Batched Agere_,ates
After batching a set of specimen aggregates, each specimen should be weighed to check
for mistakes. The aggregates should be stored at room temperature in covered containersuntil
placed in the oven in preparationfor mixing. Each container should have an identificationtag
A.15

Table A.5 Sieving Regimes for Chert (1_) Aggregate
I
Components Regime
0.5 partsRR Ballast:Coarse 2.0 parts #2;
2.0 parts #4
1.0 parts #6;Medium 2.0 parts #8-200
Fine Grindings, -200any proportion
I
A.16

inside, with a code for the aggregate type and gradation. Metal dog tags have been found to
work well. ,
A.17

3.0 MIXING AND CURING OF ASPHALT-AGGREGATE SPECIMENS
3.1 Heating of Materials for Mixing
Mixing Temperature 1. The optimum mixing temperature is selected from a Bitumen
Test Data Chart (BTDC). The temperature should correspond to a viscosity of 170 _+ 20
centistokes (0.000170 + 0.000020 m2/s), based on the original asphalt properties. Figure A.4
shows a BTDC with plots of the original consistency data for the two asphalts used in the initial
A-003A laboratory studies. The optimum mixing temperatures are as follows:
AAG-I: 2880F (142"C)
AAK-I: 3200F (160"C)
Use of the optimum mixing temperature ensures that each asphalt will have a similar consistency
when mixed, which, in turn, ensures that similar film thicknesses will result. The ranges of
mixing temperature given below should be regarded as "broad band" guidelines, and the
approach outlined above should be used to determine mixing temperature for a specific asphalt.
Broad Guidelines for Mixing Temperatures
Temperature RangeGrade
Minimum Maximum
AC-2.5, AR-1000, or 200-300 Pen. 210°F (99°C) 250°F (121°C)
AC-5, AR-2000, or 120-150 Pen. 230°F (110°C) 275°F (135°C)
AC-10, AR-4000, or 85-100 Pen. 250"F (121"C) 300*F (149"C)
AC-20, AR-8000, or 60-70 Pen. 270°F (132"C) 325°F (163°C)
AC-40, AR-16000, or 40-50 Pen. 270"F (132"C) 325"F (163"C)
1The section on mixing temperatures was prepared by C. A. Bell of Oregon StateUniversity. References include the following: AASHTO T 246-82 (1986), AASHTO T 247-80(1986), ASTM D 1560-81a, ASTM D 1561-81a, TAI MS-2 (1984), and California Test 304(1978).
A.18

J. Mixing Temperature
A.AGe AR 4000: 142°C (288"I=)
AAKo AC 30: 160"C (320"F)
ZolI--4t---
CompactionTemp = 110°C (230°I=)CK 6
2 tOLu_o"7 5LU 10n
10 1
if?
1 moe--t
0
2_.0>-
if t f _ _ I i
i "[ I I i C3I ! , I
' I i i , co>.; I i 01
I I I' I I
0tO
-40 0 25 60 135 _.60
TENPERATURE (C)
Figure A.4 BTDC Showing Mixing Temperature Selection (1 poise = 0.1 Pa*s)
A.19

The optimum mixing temperatures were determined using the Bitumen Test Data Chart as shown
in Figure A.4. The temperature for mixing with asphalt AAK-1 was lowered due to smoking
to 300°F (149°C).
Aggregate. The aggregate should be heated at the mixing temperature, which depends
on the type of asphalt being used in the mixture. Temperatures used for the AAG- 1 and AAK- 1
asphalts are summarized in Table A.6. The aggregate containers should be kept covered during
heating to ensure that fines are not lost due to blowing air in the oven. If the specimen
containers do not allow covers, shake the container until the fine materials segregate to the
bottom of the container, leaving a layer of coarser materials on top that will not blow away.
It usually best to heat the aggregates overnight in the oven in preparation for mixing the
following day.
Asphalt. The asphalt should be heated at 275°F (135°C) for distribution to small cans,
following the procedures in the Materials Protocol (Hicks, 1989) (this is called the first heating).
In preparation for mixing, the asphalt in the small cans is heated (second heating) at the
appropriate temperature, with periodic stirring to ensure uniform heating. The lid should be
kept on the asphalt during heating.
A one liter (1 kg) specimen in a tin can should be heated for a minimum of about 90
minutes to reach uniform temperature throughout. If the specimen is not used within 3 to 3.5
hours from the start of heating it should be discarded. These heating times have been used at
UCB, and it is suggested that they be followed strictly to provide for uniformity of asphalt aging
in the specimens. The heating of the asphalt must only be done once and must be continuous.
Asphalt cannot be heated, cooled, and then reheated. The temperature of the oven and asphalt
should be carefully monitored. The asphalt should also be discarded if it burns due to
A.20

Table A.6 Mixing Temperatures
Asphalt Type Mixing Temperatures
AAG-I (V) Medium Gradation No. 1 275°F (135°C)
AAK-I 03) Medium Gradation No. 1 275°F (135°C)
AAG-1 (V) Medium Gradation No. 2 284°F (140°C)
AAK-1 (B) Medium Gradation No. 2 300°F (149°C)
A.21

overheating. The AAK-I mixing temperature for Gradation No. 2 is not at the optimum for
mixing viscosity due to extreme smoking for temperatures over 300°F (149°C).
Equipment. The mixing bowl and stirring device should be preheated to the mixing
temperature.
3.2
Mixing Equipment. Any mixing equipment can be used that meets the following
requirements:
1. It can be heated to approximately the asphalt mixing temperature, and that
temperature can be maintained during mixing.
2. The equipment causes the aggregate to be uniformly and completely coated with
asphalt in the mixing time period used (assuming that the percent asphalt being
used allows complete coating).
Mixing Time. Using the granite (RB) and chert (RL) aggregates; the AC-30 (AAK-1)
and AR-4000 (AAG-1) asphalts; and the percentages of asphalts (from the mixture designs
carried out at UCB) shown in Table A.7, it has been found that four minutes of mixing meets
the above requirements.
The equipment used at UCB consists of a revolving blade inside a steel bowl, or a
revolving bowl and a fixed steel blade. At the midpoint of the four-minute mixing period, the
revolutions are stopped, and accumulated fines and asphalt are scraped off the blade and the edge
of the bowl and spaded into the mixture. Form No. 4 (Figure A.5) can be used for mixture
calculations.
A.22

Table A.7 Percentages of Asphalt To Be Used in Mixing
Percent Percent
Asphalt Asphalt by Asphalt UCBAsphalt Aggregate Content Weight of by Code
Aggregate Weight ofMixture
AAG-1 Chert (RL) Low 4.1 3.9 V0T(Mix Design)
AAG-1 Chert (R.L) High 4.8 4.6 VIT
AAK-I Chert (RL) Low 4.3 4.1 B0T(Mix Design)
AAK-1 Chert (RL) High 5.0 4.8 B1T
AAG-1 Granite (R.B) Low 4.9 4.7 VOW(Mix Design)
AAG-1 Granite (P.B) High 5.5 5.2 V1W
AAK-1 Granite (P.B) Low 5.1 4.9 BOW(Mix Design)
AAK-1 Granite (R.B) High 5.7 5.4 B1W
A.23

UNIVERSITY OF CALIFORNIA - BERKELEYRICHMOND FIELD STATION
BITUMINOUS MATERIALS LABORATORYSHRP PROJECT
SPECIMEN PREPARATION RECORD
Date
Calculated by Checked by
Test Specimen Date/Time of Mixing
Aggregate Gradation
AC Heating Time/Temp Aggregate Heating Time/Temp
Aggregate % Asphalt by Weight of AC CompactionSpecimen Specimen Code Weight Weight of (A) x (13) Date and Hour
(A) Aggregate (B)
1.
2.
3.
4.
5.
6.
7.
8.
9.
10.
11.
12.
13.
14.
Figure A.5 Form No. 4
A.24

3.3
After mixing, the asphalt-aggregate mixture should be placed in containers and
maintained in a 140°F (60°C) oven for 15 hours. This operation, called curing, allows any
asphalt absorption by the aggregate to take place before compaction or other use of the mixture.
The mixture need not be cured directly after mixing, but should be done within several days of
mixing. A convenient procedure is to place the mixture in the oven at 5 p.m., and remove it
at 8 a.m. the next morning.
3.4 Storage of Cured Mixtures
Cured mixtures can be stored in closed containers at room temperature or a little cooler.
If a mixture is not used within approximately 90 days, it should be discarded. Little or no
difference in specimen strength has been found among specimens made with mixtures used
within this time frame.
P
A.25

4.0 COMPACTION
4.1 Heatin2 the Mixture for Compaction
The mixture should be placed in a 240°F (116°C) forced air oven until it reaches a
uniform temperature throughout. For 1,200 g to 7,000 g specimens, this has required a
minimum heating time of 1.5 hours at UCB. The oven temperature may require adjustment to
result in this mixture temperature, especially if the oven doors are being continuously opened
and closed to move specimens and equipment. The mixture should be discarded if it is not used
within 3 to 3.5 hours after it is placed in the oven, or if it bums. The heating of the mixture
must be continuous and must only be done once.
Whenever possible, all molds and tools that contact the mixture during compaction should
be maintained at the compaction temperature.
4.2 Compaction Procedur¢$
Compaction procedures depend on the type of device used for compaction, the air-void
content, and other required specimen properties. The results of specimen preparation to date
at UCB are described in the following sections. This information will be updated as required
in future versions of this document. As mentioned earlier, the materials used at UCB to date
are granite (P,B) and chert (RL) aggregates, and AC-30 (AAK-1) and AR-4000 (AAG-I)
asphalts.
4.2.1 Texas Gyratorv Compaction. 2.5 x 4-Inch (63.5 x 101,6 nun) Briquets. Two
variations of the same method are used for compacting these specimens, depending on the
mixture and the air-void content to be achieved. The methods are adapted from Texas Method
Tex-206-F and ASTM D 4013-81 and require the use of the small Texas gyratory compaction
machine.
A.26

First, approximatelyhalf of the specimen is put in the mold and pusheddown with the
bent spoon tool to level it. The second half of the specimen is then put in the mold, and
likewise pushed into the mold.
Method A. The levels of compactionstressarevarieddependingon the desired air-void
content. However, the ratios between the different stresses (pregyration, end point, and
consolidation)are keptthe same. The specimengenerally contains 1,200 g of material.
After the pressure is brought to the prescribed pregyrafion level, the hydraulic load
handleshould then be placed in its uppermostposition. The specimen is then put in its inclined
position (six degrees from horizontal) and gyrated one gyration set (three revolutions per
gyration set). As soon as the gyration set has been completed, the specimen is returnedto the
horizontalposition, and the load handle is pushed through one downward stroke which should
take place in one second. If the pressureon the specimen does not reach the end point stress
with this one stroke, the specimen is again broughtto the pregyrationstress (even if the one
stroke put the pressure above the pregyrationstress, in which case the stress is lowered to the
pregyration stress), and the process is repeated. If the one stroke reaches the end point stress,
then the specimen is loaded to the consolidationstress, at a rate of one full stroke of the load
handleper second. The specimen is then immediately unloadedand left to cool.
Method B. If the desired air-void content(usuallya very high or very low one) cannot
be obtained using Method A, the following procedureis used. First the specimen is brought to
a pregyration pressure of 50 psi (344 kPa) gauge. Then a certain numberof gyration sets is
carriedout, each time loading the specimento thepregyration stress in the horizontal position.
When the gyration sets have been completed, the specimenis loaded to the consolidation stress
of 1,000 psi (6,890 kPa) gauge using the same procedureas in Method A.
A.27

4.2.2 Texas Gvrato_ Comt_action.4 x 8-Inch (101.6 x 203.2 mm) Cylinders. This method
is adapted from Texas Method Tex-126-E and requires the use of the large Texas gyratory
compaction machine.
The first step for compaction is to measurethe thickness of the base plate, two tin spacer
plates, and the compressor ram head from its bottomup to where it has a horizontal plane. The
total combined thickness for these parts is about 2.21 inches (56 mm) on the machine loaned to
UCB by the Texas State Highway Department. Next, the diameter of the molds to be used
should be checked. They should be 6 inches (152.4 mm) in diameter. With these dimensions
the volume of the specimen can be determined and can be measured during compaction using
the measuring device provided with the compaction machine (a small arm that sits on the ram
head when measuring the height of the specimen).
Next, using the desired height of the specimen (here about 2.032 din), the required
air-void content, and the maximum specific gravity of the mixture (by the Rice method), the
required weight of material is calculated. An example calculation is shown in Figure A.6. For
an 8-inch (203.2 mm) final height, approximately9,000 to 10,500 g of material are needed.
The mixture is placed in the mold in three equal lifts. First a tin plate is placed on the
gyrator), mold bottom plate. Then the first lift is placed in the mold. This lift is rodded 15 to
20 times around the wall and then 15 to 20 times in the center. The second and third lifts are
then placed, each with the same rodding. The top tin cover is then placed on the material, and
the mold is slid under the compactorram. The ram head is broughtdown against the material,
so that it is inside the top of the mold. The mold is then inclined to 6 degrees.
For higher air-void specimens (more than about 6-percent air voids) the specimen is
subjected to a gauge pressure of 69 psi (475 kPa), while for low air-void specimens 0ess than
about 6 percent) the specimen is subjectedto 104 psi (716 kPa). The specimen is then gyrated,
A.28

Specimen Height = 9 in. = 2.29 dm
Specimen Size Ram Thickness = 0.56 dm
Measured Height = 2.29 + 0.56 = 2.85 dm
Specimen Diameter = 6 in. = 1.52 dmVolume
Specimen Volume = I"(1.52/2) 2 x 2.29 = 4.16 dm 3
Mixture = VOT
Rice Maximum Density = 2.435Specific Gravity
Desired Air Voids = 5 %
Density Required = (1 - 0.05) 2.435 = 2.313 kg/dm 3
Mass of Material Mass Required - Volume x Density= 4.16 dm3 x 2.313 kg/dm 3 = 9.622 kg
Figure A.6 Example Calculation for Compaction UsingLarge Texas Gyratory Compactor
A.29

while maintaining this compaction pressure. As the specimen densities the ram head must be
lowered using the hand pump to maintain the compaction pressure. When the ram head has
reached approximately the correct height, the gyration is stopped, the specimen is brought to
horizontal, the measuring device is placed on the ram head, and the height of the specimen is
measured using a ruler. If the height is not within two to four millimeters of the correct height,
the specimen is inclined again, and gyrated until within that height. If the specimen height is
within two to four millimeters of the correct height, it is subjected to static pressure at the rate
of one stroke of the pump handle per second until it reaches the correct height. This static
pressure is a leveling off load, since the specimen will have a domed top and bottom, with the
dome height approximately two to four millimeters, if not subjected to this load. The static
pressure is immediately released and the ram head raised once the correct height is reached.
The specimen is then left to cool.
After extrusion, specimens are cored to a diameter of 4 inches (101.6 mm), and then cut
to a height of 8 inches (203.2 mm). Coring also produces a 6-inch (152.4 mm) diameter hollow
cylinder specimen which is used for other testing.
4.2.3 Kneadiw, Compaction, 2,5 x 4-1nch ¢63.5 x 101.6 mm) Briquets. For low air-void
specimens, the mold is first elevated on small metal plates. For all specimens, approximately
half of the specimen material is placed in the mold and rodded 20 times around the perimeter
of the mold and 20 times on the inside. Then the second half of the specimen is placed in the
mold and rodded the same number of times. Specimens usually contain 1,200 g of material.
For low air-void specimens, a setting compaction of 20 blows at a nominal gauge
pressure is applied. The small plates are then removed from under the mold, allowing it to slip
down the specimen (about four millimeters).
A.30

The specimen is then subjected to the number of blows at some pressure (both pressure
and numberof blows can be varied) necessaryto achieve the requiredair-voidpercentage. After
the blows are complete, one of several methods of static compaction is applied, as follows:
1. No static load.
2. The specimen is immediately subjected to a true load of up to 12,560 pounds
(5,697 kg). The load is applied by compacting the specimen at a rate of 0.25
inches (6.4 mm) per minutewith a hydraulic press until the load is achieved, and
then immediately unloading the specimen.
3. The specimen is heated for 1.5 hours at 140°F (60°C), and then subjected to a
true load of up to 12,560 pounds (5,697 kg). The load is applied as in Method
2, above.
4.2.4 Kneading Comoaetion, 4 x _-lneh (101.6 x 203.2 mm) Cylinders. Cylindrical
kneading compaction specimens generally contain 4,000 to 4,300 g of material. For high
air-void specimens, the specimen is compacted in three lifts, while low air-void specimens are
compacted in five lifts.
For high air-void specimens, half of the material for the first of the three lifts is placed
in the mold and rodded 20 times around the outside of the specimen and 20 times on the inside.
The second half of the lift is then placed and likewise rodded. The lift is then subjected to the
numberof blows and foot pressure required to obtain the desired air-void content. The same
process is then repeatedfor the remainingtwo lifts.
For low air-void specimens, the first lift is placed in the mold and rodded 20 times
around the outsideand 20 times on the inside of the specimen. The lift is then compacted using
the numberof blows and foot pressure necessary to obtain the desired air-void content. The
same procedure is then followed for the remaining four lifts.
A.31

The ratio of blows for the succeeding lifts must be proportioned, since the already
compactedlifts continue to be compacted by the blows on the lifts above. The ratios shown in
Table A.8 are used for the number of blows on the lift to be compacted and on the lift just
compacted.
After the specimen has been compacted, it is sometimes subjected to a load on the
hydraulic press, the same as for 2.5 x 4-inch (63.5 x 101.6 mm) specimens. This load is usually
10,000 pounds (4,536 kg) or less (true load). After cooling and extrusion from the mold, the
ends of the specimens are usually cut so that they are 8 inches (203.2 mm) tall.
4.2.5 Kneading Compaction. 3.5 x 3,5 x 15-1nch (88.9 x 88.9 x 381 mm) Beam_, Beam
specimens, usually containing 7,000 grams of material, are always compacted in three lifts.
The first lift is placed in the mold and rodded about 30 times around the perimeter of the
mold and 20 times on the inside portion. The lift is then compacted in three stages. Each
succeeding stage consists of more blows at higher pressures. Most of the compaction occurs
during the third stage. When the compaction of the first stage is completed, the second and third
stages are compacted in the same manner.
For the same reasons as for the 4 x 8-inch (101.6 x 203.2 ram) kneading cylinders, or
any specimen compacted in lifts, the ratios between the number of blows on each layer must be
adjusted so the void ratio is consistent throughout the specimen.
After the specimen has been compacted it is subjected to one of the following two
methods of static load.
1. The specimen is placed in an oven at 240°F (116°C) for 30 minutes and then
subjected to a true static load of 18,500 to 40,000 pounds (8,392 to 18,144 kg)
for one minute. This method was only used a few times at UCB.
A.32

Table A.8 Ratio of Blows on Lift to be Compacted to Blows on Lift JustCompacted
Lift: 1 2 3 4 5i
Ratio: - 1.25 1.20 1.167 1.143
Example A 40 blows 50 blows 60 blows 70 blows 80 blows
Example B 100 blows 125 blows 150 blows
A.33

2. The specimen is immediately subjected to a true static load of 18,500 to 40,000
pounds (8,392 to 18,144 kg) for one minute.
After the specimen has cooled and the mold has been removed, it is cut to the dimensions
required for testing.
4.2.6 Rollim,-Wheel Compaction of Laree Slabs. The rolling-wheel method of compaction
for large slabs used at UCB follows principles similar to those used for compacting 4 x 8-inch
(101.6 x 203.2 mm) Texas gyratory specimens. For both methods, the amount of material
required to fill the volume of the mold is calculated using the maximum specific gravity found
using the Rice method and the desired air-void content.
The theoretical desired air-void contents for the three succeeding layers placed in UCB
slabs decreased with each lift. In general, material for 0.5 to I percent less air voids was placed
in each succeeding layer. For example, to produce a slab with a uniform (top to bottom) air-
void content of 6 percent, material quantities for the first, second, and third lifts might be
computed on the basis of 6.5 percent voids, 6.0 percent voids, and 5.5 percent voids,
respectively.
The dimensions of the mold used at UCB are shown in Figure A.7. The mold was built
so that the frame for each lift was detachable. This was required since the roller was too large
to fit inside the mold. The required amount of mixture ranged between I00 and 117 kg.
The first level of the mold was attached to the base plate, and filled with the required
material. As the material was placed in the mold, it was rodded using a hoe. The rodding took
place until the material was distributed into the comers of the mold, and a small hump of
material was present in the center. The roller was then rolled back and forth over the material
until it was level with the top of the mold.
A.34

All dimensions in inches F u_._11.50
,4,_",._ 3.00_p" ce_ 3 "_,,_
Sp_ce_- 2 3.00
Sp=cer I 3.00
Figure A.7 Mold Dimensions for Rolling Wheel Compaction (1 in - 25.4 mm)
A.35

The next level of the mold was then bolted to the first layer, and the same compaction
process was carriedout. The third lift was compactedin the same manner. Whencompaction
was complete, a sheet of plywood was placed over the mold and slab, and a two-ton block of
concrete was placed on the plywood untilthe next day.
After the slabhad cooled atleast 24 hours, the mold was removed, and the specimenwas
placed in a constanttemperatureroom at 68°F (20°C) for several moredays. If possible, the
specimen was allowed to cool several days beforeremoving the mold, since some slabs were still
warm even 24 hours after compaction. After three or four days of cooling, the slab was cored
vertically, and after removal of the cores, the cored half was then cut off. The remaininghalf
of the slab was cut for beam specimens.
A.36

5.0 AIR-VOID DETERMINATION
At the beginning of this project, laboratory measurement of air voids was not considered
to be a major difficulty. Experience has since taught that air-void determination is one of the
most important aspects of fabricating good specimens with consistent engineering properties.
This is true for two reasons. First, the calculated percent air voids depends greatly on the
method used and on the type of specimen being tested (as will be seen below). Second, testing
has shown that air-void content is one of the most important parameters affecting the engineering
properties of the specimen.
5.1 Tvves of Svecimens
The preparation of the specimen determines its air-void content. This includes not only
the number of blows or gyrations and compaction pressures, but also the compaction
temperature, the porosity of the surface of the specimen (determined by compaction type and
effort, and cutting and/or coring), and whether it has previously been wetted. For these reasons,
several methods of air-void determination have been simultaneously used on most specimens at
the UCB laboratory. Even still, determining whether two specimens prepared using different
methods have the same air voids is sometimes only approximate. A better understanding of this
problem will be found from the following descriptions of the methods used for each specimen
type.
5.1.1 As-Molded Surface vs. Cut Surface Soecimens. Specimens with asphalt surfaces are
those which have not been cut or cored. Specimens with cut surfaces are those that have been
cored and/or cut to arrive at their final dimensions. This preparation leaves the specimens with
a surface that is generally smooth, and with exposed cut aggregate. Examples of these
A.37

specimens are kneading fatiguebeams, 4 x 8-inch (101.6 x 203.2 ram) gyratory specimens, and
all specimens extracted from the rolling-wheel slabs.
5.1.2 Wet vs. Dry Sm,cimens. Many specimens that arewetted, whetherduringair-void tests,
or duringcutting or coring, retainsome of the water for extended periods of time. The result
is that specimens that have been cored, or cut with a wet saw, or tested for air voids without a
waterproofcoating, can not be compared directly with those that have neverbeen wet. For this
reason a procedurewas developed that allows calculationof several air-void estimators,with the
goal of allowing comparison with at least one estimator, of specimensprepared using different
methods.
5.2 Air-Void Test Metho_
In order to have the most data for determining whether specimens from different
compaction methods have the same air-void contents, the following three air-void estimators
have been used for each specimen whenever possible at UCB:
1. Air voids, dry (never been exposed to water) withoutparafilm,
2. Air voids, wetted (surface air blown dry) with parafilm, and
3. Air voids, wetted (surface air blown dry) without parafilm.
Parafilm, manufactured by the American Can Company, is a stretchablewax paper which
is used in place of paraffin wax. The use of parafilm, described herein, is adapted from
procedures developed at Chevron Research Company (Del Valle, 1985). The dipping of the
specimen in paraffin as per ASTIVlD 1188 does not allow easy testing of the specimen after
air-void determination due to the difficulty of removing the paraffin from the specimen
(American Society for Testing and Materials, 1988).
Data for the three methods is collected in one process as follows:
A.38

I. If the specimen has been cored or cut, or otherwise been wetted at some time,
submerge it in water until no more air is seen to escape and then go to step 3.
Otherwise, weigh the specimen in air (this is recorded as dry weight in air, A).
2. Weigh the specimen suspendedin water, taking the readingas soon as the balance
stabilizes (normally 1-2 seconds). (This is recorded as dry weight in water, B.)
3. The specimen should now be dripping wet and soaked through. It should
immediately be air dried using a small blower valve connected to the house air
supply, about 110 psi (758 kPa) at UCB. Dry the surfaceof the specimen until
no waterescapes from the surfacedirectlybeneath the air stream, with the blower
held about an inch (25 ram) from the surface. When this condition is reached,
immediately weigh the specimen in air (recorded as wet weight in air, C). This
represents the weight of the specimen with some water trapped inside the
permeablepores. ASTM method D 2726-68 (AmericanSociety for Testing and
Materials, 1988) requires heating of the specimen at 230°F (110°C): experience
gained to date shows this often results in its disintegration.
4. Wrap the specimen in parafilm, so that it is completely watertight,but using the
minimumamountof parafilm necessary. Be sure that no air bubbles are trapped
under the surface. Weigh the specimen in air (this is recorded as wet weight in
air with parafilm, D).
5. Weigh the specimen suspended in water with the parafilm, taking the reading as
soon as the balance stabilizesafter the specimenis placed in the water (normally
1 to 2 seconds). (This is recordedas wet weight in water with parafilm, E.)
6. Remove the parafilm, and repeat step 2 (this is recorded as the wet weight in
water, F).
A.39

The three specific gravities are then calculated as follows:
7. Specific gravity, dry, no parafilm (Gdnp)
8. Specific gravity, wet, with parafilm (Gwwp)
C
G... = C-D + D-E0.9
9. Specific gravity, wet, no parafilm (Gwap)
C
G.,,_ = C-F
10. After determination of the maximum specific gravity of the mixture using the
Rice Method (ASTM D 2041), each of the specific gravities can then be used to
calculate the corresponding air-void percentages using the following formula:
GAir Voids (%) = 100 [1 - "-2]
K
where G is the measured specific gravity (dnp, wwp or wnp) and R is the Rice
maximum specific gravity.
A.40

6.0 R__CF__
American Society for Testing and Materials (1988), "1988 Annual Book of ASTM Standards,Section 4, Construction," Vol. 04.03, Philadelphia.
Del Valle, H. (1985), "Procedure - Bulk Specific Gravity of Compacted Bituminous MixturesUsing Pamfilm-Coated Specimens," ChevronResearch Company, Richmond, California.
Hicks, R.G. (1989), "Technical Memo OSU-89-1, Materials Protocol: SHRP A-003A," 2riddraft.
D
A.41

APPENDIX B
DIAMETRAL FATIGUE TEST PROCEDURE

1.0 INTRODUCTION
1.1 Scope
This appendix describes the diametral (indirect-tensile) test for determining the stiffness
and fatigue life of either laboratory-fabricated or field-recovered asphalt-aggregate mixtures.
The described procedure is essentially an extension of the Standard Method of Indirect Tension
Test for Resilient Modulus of Bituminous Mixtures 2 (ASTM D 4123-82). Other applicable
documentsincludethefollowingASTM standards:
D 1559 - TestMethod forResistancetoPlasticFlow of BituminousMixtureUsingMarshallApparatus,
D 1561- Method ofPreparationofBituminousMixtureTestSpecimensby Means ofCaliforniaKneadingCompactor,
D 3387 -TestforCompactionand ShearPropertiesof BituminousMixturesby MeansoftheU.S.CorpsofEngineersGyrator),TestingMachine(GTM),
D 3496 - Method forPreparationof BituminousMixtureSpecimensforDynamicModulusTesting,
D 3515- SpecificationsforHot-Mixed,Hot-LaidBituminousPavingMixtures,and
D 4013 -StandardPracticeforPreparationofTestSpecimensofBituminousMixturesby Means ofGyratoryShearCompactor.
1.2 _;pmmary 9f Pr0cedere
The repeated-load diametral test for determining the resilient modulus and fatigue life of
asphalt-aggregate mixtures is conducted by the application of compressive load pulses having
square waveforms. The load is applied in the vertical diametral plane of a cylindrical specimen
as shown in Figure B. 1. Repetitive applications cause permanent deformation of the specimen
2Annual Book of ASTM Standards, Vol. 04.03
B.2

Pi Loading
Specimen Strip
D
P
Figure B.I Loading of Cylindrical Specimen in the Diametral Fatigue Test
B.3

and also induce tensile stresses (a0y of Figure B.2) thatusually are sufficient to eventually split
the specimen into two pieces.
The fatigue life of the specimen is defined as the number of load applications resulting
in either disintegration or a specified permanent vertical deformation whichever occurs first.
Criteria of 0.20 and 0.50 inch (5.1 and 12.7 mm) for testing at 39.2°F and 68°F (4°C and
20°C), respectively, have been found to be appropriate for recording the drop of the upper
loading platen from the splitting caused by repeated tensile stresses and for stopping the test if
the specimen undergoes significant compressive deformation under the repeated load. Vertical
deformation is usually the combined result of both plastic deformation and vertical splitting.
1.3 Significance and Use
Fatigue life, as measured by diametral loading, has been used to evaluate the relative
performance of asphalt-aggregate mixtures as well as for input to pavement thickness design or
pavement evaluation and analysis. It has also been used to study the effects of temperature,
repeated-load magnitude, loading frequency and duration, etc. However, since the test is
destructive, tests cannot be repeated on the same specimen as can be done for resilient-modulus
testing.
B.4

- 1.0 --
O'oy
6 -
.8 --
I I I I I I I I I I I
1.0 .8 .6 ,4 .2 0 -.2 -.4 -.6 -.8 - 1.0
Tension _ Compression
Sign Convention :
+ Denotes tensile effects
Denotes compression effects
Figure B.2 Stress Distributions Within DiametraUy Loaded Specimens(After Hadley, Hudson, and Kennedy, 1970)
B.5

2.0 TEST PROCEDURE
2.1 Test Apparatus
The apparatus to perform the diametral fatigue test should conform to that specified in
ASTM D 4123 with the added ability to count and record the number of load applications. In
addition, the apparatus should have the ability to automatically discontinue load applications
when the specified amount of permanent deformation has occurred.
2.2 SI_'cimen Preparation
2.2.1 Laboratory-Fabricated S_¢imfn_. Laboratory specimens should be prepared in
accordance with the procedures described in Appendix A.
2.2.1 Core Sl_ecimens. Specimens cored from in-situ pavements or other large masses should
have relatively smooth and parallel surfaces. Height and diameter requirements specified for
laboratory-fabricated specimens are also applicable to core specimens, nominally 2.5 x 4 inches
(63.5 x 101.6 mm).
2.3 Failure Criteria
As previously mentioned, the fatigue life is the number of load applications required to
induce a specified amount of permanent vertical deformation. Experience has shown that, even
before the vertical deformation has reached limits of 0.20 or 0.50 inch (5.1 or 12.7 mm) for test
temperatures of 39.2°F and 68°F (4°C and 20°C), respectively, the test specimen often fails
dramatically ('explodes'), that is, it disintegrates before permanent deformation has reached a
critical level. Fatigue life in this case is simply the number of load applications that had been
sustained prior to specimen disintegration. Experience has also shown that specimens with low
B.6

resistance to permanent deformation at temperatures of 68°F (20°C) and above may experience
significant permanent deformation before substantial tensile cracking is observed.
The vertical deformation is measured during testing with a linear variable displacement
transducer (LVDT) which measures the vertical displacement of the upper loading platen. The
amount of permanent vertical deformation, as measured by the LVDT, that occurs before a
failure condition is reached can be recorded using either a computer data acquisition system or
a strip chart recorder.
2.4
The diametral fatigue test is conducted as follows:
I. Determine the test temperature and loading conditions (that is, load frequency and
duration). For the compaction study, test temperatures were 39.2°F and 68°F (4°C and 20°C).
At both 39.2°F and 68°F (4°C and 20°C), the load frequency was 1 Hz, with a 0.1-second
loading followed by 0.9-second relaxation period.
2. Determine the desired stresses or estimate the tensile strains that will result in failure
between 1,000 and 5,000 load repetitions (high stress level), or 70,000 and 100,000 load
repetitions (low stress level), based on experience and established fatigue equations.
3. Measure the specimen for both height and diameter, and record the measurements for
later calculations of stress, strain, and modulus of elasticity.
4. Center the specimen in the horizontal displacement measurement apparatus (Figure
B.3) and adjust the position of the horizontal LVDTs so that they are in the correct voltage
range. Place the specimen with the horizontal LVDTs into the loading frame and adjust the
position of the vertical LVDT so that it, too, is in the correct voltage range.
5. Determine the load magnitude required to induce the desired tensile strain by loading
the specimen five times and calculating the average tensile strain. The tensile strain is calculated
B.7

LOOdmq Rom
)1 AIIochmenl
,Top Loodm 9 Strip
LVOT
Gouge Heod To Sir;l:) Chor!
RecorderLVOTAdjuStment
Knob A$ohollCo_crele
Oiometrol SpecimenYoke
Bottom LOoding Slf,p Cell
Proven (Rqtsl_ OnLOOO Frome 8o_ePlole)
Figure B.3 Test Specimen with Diametrai Yoke and Loading Ram(After Vinson, 1989)
B.8

from the horizontal displacement measurements, assuming a Poisson's ratio of 0.35 (Kennedy,
1977). For a 4-inch (101.6 ram) diameter specimen, the tensile strain is as follows:
err = 0.520 HRT 03.1)
where eRTis the resilient tensile strain and HRT is the total resilient horizontal deformation in
inches. Repeat this step, adjusting the load until the desired tensile strain is achieved. Normally
no more than two repetitions are necessary.
6. Load the specimen 50 times, collecting data on the last 10 repetitions. The tensile
strain is calculated by Equation B. 1. The modulus of elasticity and tensile stress are also
calculated after Kennedy (1977) using an assumed Poisson's ratio of 0.35. For a 4-inch (101.6
ram) diameter specimen:
ERr : 0.618 (H--_) 03.2)
and
: 0.156 (h) 03.3)IIT
where ERT is the total resilient modulus of elasticity in psi, P is the repeated load in pounds, h
is the height of the specimen in inches, and lIt is the tensile stress in psi. The average values
for the ten repetitions are taken as the test values.
7. Mark the load platen positions on the specimen, and then remove the horizontal
LVDTs. Replace the specimen in the loading frame with the loading platens in the same
positions, and readjust the position of the vertical LVDT so that it is in the correct voltage
range.
8. Load the specimen to failure, recording the number of load repetitions and the vertical
deformation. The test should automatically stop when the vertical LVDT measures a
B.9

displacement greater than the failure criterion, whether it is caused by vertical plastic
deformation, disintegration of the specimen due to tensile stresses, or a combination of the two.
B.IO

3.0 REFERENCES
Hadley, William O., W. Ronald Hudson, and Thomas W. Kennedy (1970), "A Method ofEstimating Tensile Properties of Materials Tested in Indirect Tension," ]_esearch Report98-7, Center for Highway Research, The University of Texas at Austin.
Kennedy, Thomas W. (1977), "Characterization of Asphalt Pavement Materials Using theIndirect Tensile Test," ]_l_,_di13_, Association of Asphalt Paving Technologists,Volume 46, pp. 132-150.
Vinson, T. (1989), "Fundamentals of Resilient Modulus Testing," Presented at the Workshopon ResilienrModulus Testing, Oregon State University, Corvallis, March 1989.
B. 11

APPENDIX C
STATISTICAL ANALYSIS TECHNIQUES FOR MAIN EXPERIMENT

Unequally replicated, fractional factorial experiments--such as those used in the main
experiment-can be analyzed using any good regressionor General Linear Model (GLM) program,
as are available from the SAS Institute. It is important,though, that therebe no totally missing treatment
combination, as the efficiency of the experimentaldesign greatly suffers.
Regardless of the particular algorithm used, the model used to analyze any full or fractional factorial
is the same. With suitable numerical coding of the factor levels, a model of the form
Yi --- ao + ax Xix+ a2 Xi2 + --. + an Xin
+ a12 Xil Xi2 -6 a13 Xit Xi3 + ...
+ a23 X_2X_ + ...
will analyze the data properly. In this expression, Yiis the observed measure of the dependent variable
during the ith trial, Xij is the value for the jth factorduring the ith trial, and the a's are coefficients to be
estimated by the regression.
For each two-level factor, the numerical variableX is defined to have the value -1 for its low
and + 1 for its high level. When the number of levels of a factor is three or more, the same kind of model
can be used, but with different X values. For example, a three-level factor uses two X variables to describe
it, with each X taking on one of three values, as follows:
Level i XL xiQ0 -1 11 0 -22 1 1
The superscripts L and Q denote the linear and quadratic components of a three-level factor. A four-level
factor requires three variables (linear, quadratic, and cubic), thus:
C.2

Leveli XL xiQ X_t
0 -3 1 -11 -1 -1 32 1 -1 -33 3 1 1
The values for each component are chosen so as to be linear, quadratic, cubic, etc. functions of the
level i such thatthe cross product sum of any two components (e.g., E XL * XQ) is zero:
XL*X_, ffi(-3xl)+(-Ix-1)+(1x-1)+(3xl)i
--3+ 1-1+3--0
In addition, the values are scaled so as to be simple, small integers. These sets of values for factorsat 2,
3, 4, etc. levels are called simply "orthogonalpolynomials."
Using this polynomial model for a simple 22 factorialexperimentpermits us to see how the concept
of "hiddenreplication" works. Our model for a 22 factorial is
Yi - °to + ai Xil + °t2 Xi2 + ¢x12 Xil2 + ei
where the a's are unknown true effects to be estimated, ei is the error in the observation Yi,and Xil 2 is the
factor representing interaction effects. The X's would be defined as follows:
i Xil Xi2 Xil 2 - Xil x Xi2
"I -1 -1 I2 1 -1 -13 -1 1 -14 1 1 1
Assuming an experiment without replication, four equations relate the observations, Yi, to the true effects,
a, as follows:
C.3

Yl -- ao " al " ¢x2 + a12 + el
Y2 ----aO + al - a2 - a12 + e2
Y3 -- ao'al + a2-a12 + e3
Y4 -- ao 4- a I + a 2 + a12 + e4
Summing the four observations gives
Yl + Y2 + Y3 + Y4 = 4ao + el + e.2 + e3 + e4,
and dividing by 4 gives the mean value of y
_ Eeiy -a o + ---,
4
which has error variance of _/4.
Best estimates of the effects, _j, and their variances, _(&), are as follows:
_Yi _ O_eao ffi --- -- y with _(_o) ffi "-
4 4
Y2 + Y4 " Yl " Y3 _'e&l = ................. with CXl) - --
4 4
Y3 + Y4-YI'Y2a 2 = ................. with _(_2) = --
4 4
Yl - Y2 - Y3 + Y4 ¢r_e= ................. with (a12) = --
4 4
Each effect estimate, _j, has the same variance as that of the mean of the four observations. For a
23 design, each of the eight effects (%, at, or2, oc3,a12, cq3, a23, a123) would have variance, _/8, the
variance of a mean of eight points. This shows that regardless of whether we simply run repeats or include
other factors in our experiment, the error variance in our estimates always decreases by 1/N.
C.4

APPENDIX D
PROPOSED METHOD FOR MEASUREMENT OF AIR VOIDS INTEST SPECIMENS OF BITUMINOUS MIXTURES

1.1 Definition of Terms
Specimens with asphalt surfaces are those which have not been cut or cored. Specimens
with cut surfaces are those that have been cored and/or cut to arrive at their final dimensions.
Wet specimens are those that have been exposed to water during coring, cutting, or previous air
voids tests.
1.2 Air-Voids Measuremenla
In order to have the most data for determining whether specimens from different
compaction methods have the same air-void contents, the following three estimators are used for
each specimen whenever possible at the University of California - Berkeley COCB):
1. Air voids, dry (never been exposed to water) without parafilm,
2. Air voids, wetted (surface air blown dry) with parafilm, and
3. Air voids, wetted (surface air blown dry) without parafilm.
Parafilm is a stretchable wax paper which is used in place of paraffin wax and is
manufactured by the American Can Company.
Data for the three methods is collected in one process as follows.
1.2.1 Measurement of SDechncn Weights.
1. If the specimen has been cored or cut, or otherwise been wetted, place it in water
until no more air bubbles are seen to rise to the surface, and then go to step 3.
Otherwise, weigh the specimen in air and record the weight as the dry weight in
air, A.
2. Weigh the specimen suspended in water, taking the reading as soon as the balance
stabilizes (normally 1-2 seconds). Record the weight as the dry weight in water,
B.
D.2

3. The specimen should now be dripping wet and soaked through. It should
immediately be air dried using a small blower valve connected to the house air
supply (about 105 psi at UCB). Dry the surface of the specimen until no water
escapes from the specimen surface directly beneath the air stream, with the
blower held about an inch from the surface. When this condition is reached,
immediately weigh the specimen in air, recording the weight as the wet weight
in air, C. This represents the weight of the specimen with some water trapped
inside the permeable pores.
4. Wrap the specimen in parafilm, so that it is completely watertight, but using the
minimum amount of parafilm necessary. Weigh the specimen in air and record
the weight as the wet weight in air with parafilm, D.
5. Weigh the specimen suspended in water with the parafilm, taking the reading as
soon as the balance stabilizes after the specimen is placed in the water (normally
1 to 2 seconds). Record the weight as the wet weight in water with parafilm, E.
6. Remove the parafilm and repeat step 2. Record this weight as the wet weight in
water, F.
1.2.2 Calculation of S_eific Graviti_. The three specific gravities axe then calculated as
follows:
1. Specific gravity, dry, no parafilm (Gdnp)
A
Gd'v' = A-B
D.3

2. Specific gravity, wet, with parafilm (G,_q_)
C
G._ = C-D+ D-E
0.9
3. Specific gravity, wet, no parafilm (Gwap)
C
G._, = C-F
4. After determination of the maximum specific gravity of the mixture using the
Rice Method (ASTM D 2041), each of the specific gravities can then be used to
calculate the corresponding air-void percentages using the following formula:
GAir Voids (%) ffi 100 [1 - -__]
R
where G is the measured specific gravity (dnp, wwp or wnp) and R is the Rice
maximum specific gravity.
D.4

APPENDIX E
PROPOSED METHOD FOR PREPARATION OF TEST SPECIMENSOF BITUMINOUS MIXTURES BY MEANS OF ROLLING-WHEEL COMPACTION

1.1 LIB_lg[gglJ_
This is a summary of the rolling-wheel compaction procedure for preparing asphalt
concrete specimens at the University of California - Berkeley (UCB) using a one-lift mold (3
inches high). Except as noted, the method for the three-lift mold (9 inches high) is the same.
1.2 Mixture Preparatiop
Asphalt concrete mixtures should be prepared following procedures documented in
Protocol Version 2.0 or any subsequent version.
1.3 Calculation of Slab Air-Void Contents
The first step for compaction is to measure, to the highest precision possible, the
dimensions of the compaction mold that will containthe compacted specimen. The dimensions
are used to calculate the volume of the compacted specimen.
Next, the requiredweight of materialto be compacted is calculatedusing the volume of
the compacted specimen, the requiredair-voidcontent,and the maximumspecific gravityof the
mixture(by the Rice Method, ASTM D 2041). An example calculationis shown in Figure E. 1.
For the UCB one-lift mold, approximately65 to 80 kg of material are needed to achieve air
voids between 3 and 10 percent (wet-with-parafilmair-void method).
1.4 Compaction Procedure
1.4.1 Compaction Temperature. The mix is heated to about 240°F (116°C) in a forced air
oven for at least 90 minutes prior to compaction. The mix should be discardedif it remains in
the oven for more than about 3.5 hours, due to excessive aging of the asphalt. Care should be
taken that the mix does not cool significantly during weighing and placement in the mold. If
E.2

Average Height 3 in = 7.62 cm
Specimen Size Average Width 24.75 in = 62.87 cm
Average Length 24.75 in = 62.87 cm
7.62 x 62.87 x 62.87 -Volume Volume 30,119 cm3 - 30.119 dm3
Rice Maximum Specific 2.486 (ratio of density ofGravity mix to density of water)
Rice Maximum Density 2.486 kg/dm 3Specific Gravity
Desired Air Voids 8.0%
Density - Rice Maximum 2.486 x (1 - .08) --Density x (1- Air Voids) 2.287 kg/dm3
30.119 dm3 x 2.287
Mass of Material Volume x Density kg/dm 3 - 68.886 kg
Figure E.1 Example Calculation for Mass of Mixture to be Compacted
E.3

the mix cools significantly, it will be difficultor impossible to compact to the desired air-void
content.
1.4.2 ]_|Rcementand Rolling. Material to be compactedis weighed just prior to placement
in the mold. At UCB the materialis mixedand heatedin 7 kg batches, using roasting or baking
pans (steel turkeyroastingpans are ideal). Each pan of material is weighed to the nearestgram
using a precision balance before placing in the mold. After the material is in the mold it is
rodded using a hoe like instrument. The roddingdistributesthe material into the corners of the
mold. As the final batches are placed in the mold, a small hump is formed in the center of the
mold.
The roller used at UCB is designed for compaction of sidewalks and other small areas.
It is self propelled with a forward/reverse control, weighs approximately400 kg, and has one
rolling wheel, as shown in Figure E.2. A secondroller weighing approximately600 kg, but of
otherwise similar design, will be used in the future. The rolling wheel is heated for at least
three hours prior to compaction using electrical heating tapes. This is to help prevent the mix
from sticking to the wheel during compaction. Oil, or other chemical bond breakers are not
used on the wheel or in the mold, to prevent possible contamination of the mixture. Bond
breakers can be used, in extreme moderation, if the specimens taken from the slab are to have
cut surfaces, thus removing any effected asphaltfrom the specimen.
The roller is then rolled backand forthover the materialuntil it is level with the top of
the mold. Rolling should only takeplace in one direction, to simulate the unidirectionalrolling
of field compaction. The roller can be used on one half of the slab, and then the other, thus
simulating the effects at the edge of the rolling wheel during field compaction.
When compaction is complete (the top of the specimen is level with the top of the mold),
a sheet of plywood is placed over the mold and slab to prevent disturbanceduring cooling.
E.4

Figure E.2 Rolllng-Wheel Compaction Apparatus
E.5

Underno circumstancesshould a weight be placed on the specimen if it has not been completely
compacted, since the weight will cause static compactionof the slab.
1.5 Slab Removal and Preoaration of S_ecimens
After the slab has cooled at least overnight, it can be removed from the mold. The slab
should not be removed from the mold if it is still warm. The slab should be cored and/or cut
as soon as possible, or else stored in a constant temperatureroom at about 68°F (20°C) until
cut, to prevent cracking or plastic deformation.
The dimensions of the mold used at UCB are shown in Figure E.3. Also shown on
Figure E.3 is one of several differentpatternsthat can be used for specimen extraction.
After specimens are extracted from the slab and cut to final dimensions, the air-void
contents are determined following the proceduresdocumented in Protocol Version 2.0. The
calculationsfor the next slab of the same mixturetype can be adjustedusing the measured air
voids.
E.6

r
0 0
0 0 0
° °0 0 04.coo© 6ooooo
0 024.000
0 0 0
0 0
60.000
1 0.75001/4 in thich
I IL4_IO__ PL', -;_-;, L4A_
Figure E.3 University of California One-Lift Rolllng-Wheel Compaction Mold
E.7