evaluation of directive 1994/63/ec on voc emissions from
TRANSCRIPT
Evaluation of Directive 1994/63/EC and Directive 2009/126/EC
Final interim: July 2015 1
Evaluation of Directive
1994/63/EC on VOC emissions from petrol storage &
distribution and Directive 2009/126/EC on petrol vapour
recovery
Interim Evaluation Report
Evaluation of Directive 1994/63/EC and Directive 2009/126/EC
Final interim: July 2015 2
Legal Notices:
The information and views set out in this report are those of the author(s) and do not necessarily reflect the official opinion of the Commission. The Commission does not guarantee the accuracy of the data included in this study. Neither the Commission nor any person acting on the Commission’s behalf may be held responsible for the use which may be made of the information contained therein.
Prepared by AMEC Environment & Infrastructure UK Ltd, BIO by Deloitte (‘BIO’) and the Regional Environmental Centre for Central and Eastern Europe (‘REC’)
h:\projects\36342 ppaq evaluation of pvr directives\c client\reports\final interim\to issue\36342 final interim evaluation report_20150720_finalv1.docx
Prepared by AMEC Environment & Infrastructure UK Ltd Add date here
Evaluation of Directive 1994/63/EC and Directive 2009/126/EC
Final interim: July 2015 3
Executive summary
Aims of the study and methodology
This report presents the (interim) findings of an evaluation study contracted by the European Commission on the Directives on Petrol Vapour Recovery (PVR). These are Directive 1994/63/EC on the control of volatile organic compound (VOC) emissions resulting from the storage of petrol and its distribution from terminals to service stations (aka VOC-I Directive) and Directive 2009/126/EC on Stage II petrol vapour recovery during refuelling of motor vehicles at service stations (aka VOC-II Directive).
The aim of the study was to carry out an evaluation of the two Directives to assess their effectiveness, efficiency, coherence, relevance and EU added value. The study is intended to support the Commission in collecting and assessing evidence to assess the actual performance of the two Directives compared with initial expectations. In addition, the study includes an assessment of the implementation of the two Directives. This assessment also includes the evaluation required under Article 7 of Directive 2009/126/EC.
In order to carry out the evaluation, an intervention logic and an analytical framework were developed, including a set of specific evaluation questions. A combination of research methods and analytical tools has been used, including literature review and consultation via a dedicated survey informing both the implementation assessment and the evaluation. This is an interim report on the work, and there are a number of areas that might be investigated further following its discussion at a stakeholder workshop.
Findings and conclusions of the study
Directive 1994/93/EC
Status of implementation
� Despite some data gaps, the vast majority of work to implement the VOC-I Directive has already been done and, with a few seemingly minor exceptions (based on available data), the provisions seem to have been fully implemented.
� No significant problems with implementation have been highlighted.
Effectiveness
� The VOC-I Directive has led to changes that have contributed to its objectives:
o Current annual emissions from the activities covered by the Directive have been estimated to be around 259 kt less than the annual emission levels in 1995 (399kt). Around 59% of the reduction can be attributed to the Directive (153kt), around 39% to a decrease in petrol consumption and around 2% to national legislation pre-dating the Directive. Future reductions in the sector until 2020 have been estimated to be 10kt, though it is expected that the vast majority of these reductions will occur due to a decrease in petrol consumption (actual implementation of Stage I controls is largely complete). These estimations are subject to uncertainty associated with the use of a number of assumptions.
o By comparison, the total reductions that may be attributed to the Directive (153 kt) since 1995 correspond to 2% of the total reductions of VOC emissions from 1995 to 2012 according to the EEA (6,361 kt). Collectively, the current emissions of the activities controlled by the VOC-I Directive represent around 0.1% of the total man-made VOC emissions in the EU-28.
Evaluation of Directive 1994/63/EC and Directive 2009/126/EC
Final interim: July 2015 4
o Reductions in VOC emissions achieved by the Directive help the Member States and the EU to meet their international obligations. They contribute to lower ozone concentrations and reduced exposure to harmful VOC (e.g. benzene), although it has not been possible to quantify these effects. Nonetheless, analysis of the photochemical ozone creation potential (POCP) of the sector provides an indication that it was appropriate to target emissions through the Directive, as the POCP of VOC in petrol is higher than some other major sources of VOC.
o The Directive has helped to create a level playing field and common approach in the EU, enabling cross-border trade of petrol and equipment.
� It has led to some unintended positive changes (e.g. innovation and workers’ awareness).
� The approach chosen with the Directive involving the establishment of emission limits and detailed technical provisions thus appears to have been effective in achieving its expected results.
Efficiency
� There is limited quantified evidence (either ex-ante or ex-post) on the costs and benefits of implementing Stage I controls, mainly due to its implementation a long time ago. This has precluded any form of robust cost-benefit analysis.
� The annualised benefits for the EU28 resulting from the Directive have been estimated as follows, although they are subject to uncertainty:
o Between €162m-€479m from the reduction of the harmful effects on health and the environment associated with estimated VOC emissions reductions since 1995
o €136m of financial benefits from sales of recovered petrol
o There other non-monetised benefits associated with the safeguarding of employment in this sector and with having harmonised technical provisions.
� Small throughput sites, especially those operated by SME, are likely to have faced relatively higher compliance costs due to economies of scale and relative lack of sufficient resources (i.e. higher cost of controls per litre of petrol sold).
� There is scope to simplify the Directive through its amendment or the removal of certain technical requirements, though issuing supporting guidance could also serve the same purpose at less cost and lower regulatory burden.
� Initial findings suggest that there are no provisions that hinder cost-effectiveness. Good practices regarding cost-effectiveness at national level have been identified.
Coherence
� Overall, the Directive’s objectives are coherent with other EU and international legislation on air quality.
� The most relevant finding is the difference with the Gothenburg Protocol regarding the VOC emission limit for vapour recovery units (35 g/m³ in the Directive versus 10 g/m³ under the Protocol). However, this difference does not cause any practical problems. Member State performance on VOC emission rates indicate that they are reaching VOC emission rates much lower than what is stipulated by the VOC-I Directive and the Gothenburg Protocol. Therefore, it does not appear that the Directive in its current form is preventing Member States from fulfilling the international obligations.
Relevance
� The Directive remains relevant because it responds to the environmental and health objectives of the EU (i.e. reaffirmed need for tighter national ceilings for VOC emissions in 2020 and 2030).
� 75% of consultees have a positive to very positive view of the VOC I Directive.
Evaluation of Directive 1994/63/EC and Directive 2009/126/EC
Final interim: July 2015 5
� There is potential for the Directive to better respond to today’s needs by better reflecting the current state of the art. However, although its annexes have never been updated (though it includes a mechanism for doing so), this has not prevented Member States from setting stricter emission limits in their national legislation and reaching performance levels beyond those in the Directive.
EU-added value
� The consultation acknowledged the benefits of this field being regulated at EU level
� It has been important in establishing an EU-wide common approach, in ensuring cross-border trade of petrol and equipment and in providing a “safety net” of environmental protection.
� In its absence (or in case it is repealed) it is likely that individual national action would have led to divergent regulatory systems. Notwithstanding this, the Gothenburg Protocol is also relevant in driving action, though it is noted that its development is closely linked with the Directive.
Directive 2009/126/EC
Status of implementation
� All Member States have transposed the Directive, though some (particularly those with pre-existing legislation) have gone beyond its requirements.
� Estimates indicate that here are around 115,000 service stations in the EU-28, of which around 82,500 (72%) are fitted with Stage II systems. This estimation involves a degree of uncertainty, as it is based on a number of assumptions. Further introduction of these controls will take place over the coming years, as the implementation deadline is approached, and as service stations are refurbished.
� Most Member States seemed to have experienced few, if any, technical problems in implementing the Directive.
Review of the elements required under Article 7
� Based on the consultation responses, the 100 m3/year threshold is generally accepted as being appropriate. Lowering the threshold is unlikely to have significant impact in terms of environmental benefit compared to the costs.
� The monitoring regime established by the Directive is essential to the correct functioning of Stage II vapour recovery, to monitor the correct functioning of the equipment and hence the desired emission reductions. Some Member States also require testing of vapour tightness, which is not currently covered by the Directive.
� With regard to automatic monitoring systems, the current voluntary approach implemented through the Directive seems to be appropriate in terms of cost-effectiveness, considering that overall emission savings from making these mandatory are likely to be small compared to a situation where Stage II systems are properly maintained. This approach enables regulatory authorities and service stations themselves to decide on an individual basis whether the costs outweigh the benefits.
Effectiveness
� Though implementation its ongoing, the VOC-II Directive has led to changes that have contributed to its objectives:
o Current annual emissions from the activities covered by the Directive have been estimated to be 159 kt less than the annual emission levels in 1995 (201kt). Around 54% of the reduction can be attributed to the uptake of Stage II controls (153kt), around 43% to a decrease in petrol consumption and around 3% to national legislation pre-dating 1995. Several other Member States had Stage II controls prior to the Directive itself (in 2009), but it has not been possible to quantify the specific effect of post-1995 legislation in the results. Future
Evaluation of Directive 1994/63/EC and Directive 2009/126/EC
Final interim: July 2015 6
reductions in the sector until 2020 have been estimated to be 17.1 kt, of which 59% is estimated to be caused by a decrease in petrol consumption. These estimations are subject to uncertainty associated with the use of a number of assumptions.
o By comparison, total reductions that may be attributed to the uptake of Stage II systems since 1995 (86 kt) corresponds to 1% of the total reductions of anthropogenic VOC emissions that occurred from 1995 to 2012 according to the EEA (6,361 kt). Estimated current emissions collectively represent around 0.6% of the total man-made VOC emissions in the EU-28.
o Reductions in VOC emissions achieved by the Directive help the Member States and the EU to meet their international obligations. They contribute to lower ozone concentrations and reduced exposure to harmful VOC (e.g. benzene), although it has not been possible to quantify these effects.
o It has helped driving standardisation and achieving consistency across the EU.
� It has led to some unintended positive changes (e.g. innovation and workers’ awareness).
� The approach chosen with the Directive requiring the same types of abatement techniques to be applied across the EU and the use of European standards thus appears to have been effective in achieving its expected results.
Efficiency
� Limited quantified ex-post evidence on the costs and benefits of implementing Stage II controls for operators and authorities has been identified. However, available ex-ante data from the impact assessments developed on the Directive by the Commission and some Member States have been used to estimate the annual costs of implementing Stage II systems (i.e. not discounting the costs incurred prior to adoption of the Directive). These estimates are still applicable, as they were based on actual implementation costs for Member States that were already introducing Stage II controls when the Directive was introduced.
� It has been estimated that the investment made by Member States from 1995 corresponds to total annualised costs of €212m at EU level (€199m if the administrative and compliance costs are excluded). As a result of this, costs would fall within the range of the quantified annualised benefits estimated from health and crop damage avoided and benefits resulting from the petrol recovered (between €169m and €347m).
� Considering the additional costs and benefits of the uptake increase from the current level to 2020 calculated above, the costs would fall between the range of benefits estimated for that period (costs of €20m or €19m if the administrative and compliance costs are excluded, compared to benefits between €8m and €23m). Furthermore there are other non-monetised benefits relating to employment or financial benefits from harmonisation.
� It appears that small throughput sites, especially those operated by SME, face relatively higher compliance costs due to economies of scale and relative lack of resources.
� There is limited scope for simplification and any simplification appears to be better achieved with the issuance of guidance rather than with an amendment to the Directive.
� Initial findings suggest that there are no provisions that hinder cost-effectiveness. Good practices regarding cost-effectiveness at national level have been identified.
Evaluation of Directive 1994/63/EC and Directive 2009/126/EC
Final interim: July 2015 7
Coherence
� Overall, the Directive’s objectives are coherent with other EU and international legislation on air quality.
� The most relevant linkage is with the Fuel Quality Directive (FQD), which establishes derogations to allow bioethanol and low temperature waivers, which may hamper the overall effectiveness of Stage II controls. In practice, these instruments are considered coherent, as the process for allowing higher volatility petrol under the FQD takes into account the application of Stage II controls, and includes provisions for ensuring that VOC emission increases do not detract from meeting national and international emissions and air quality obligations.
Relevance
� The Directive remains relevant because it responds to the environmental and health objectives of the EU (i.e. reaffirmed need for tighter national ceilings for VOC emissions in 2020 and 2030).
� 65% of consultees have a positive to very positive view of the VOC I Directive.
� It appears that the Directive has kept up with technological progress as seen through its recent amendment which makes reference to CEN standards.
� Based on consultation, Article 5(3) of Directive may be obsolete (or at least ineffectual) in terms of its usefulness in informing consumers of the existence of Stage II controls.
EU-added value
� The consultation acknowledged the benefits of this field being regulated at EU level.
� Considering that 16 Member States had already started to adopt national legislation to regulate the use of Stage II controls in advance of the Directive (to some extent influenced by the VOC-I Directive and anticipated EU action on Stage II controls), it has been important in establishing an EU-wide common approach, harmonising approaches and providing a “safety net” of environmental protection.
� In the Directive’s absence, it appears that individual national action would have led to divergent regulatory systems. Repealing it now would probably most affect those Member States that are still in the implementation process. Notwithstanding this, the Gothenburg Protocol is also relevant in driving action, though it is noted that its development is closely linked with the VOC-I and VOC-II Directives.
Initial recommendations at interim report stage
VOC-I Directive
Several aspects of the Directive were highlighted that deserve further investigation:
� A potential decision to harmonise the VOC emission limit for VRUs established in the VOC-I Directive (35 g/m³) with that established in the Gothenburg Protocol (10 g/m³) would require further analysis to determine whether the benefits would outweigh the costs and potential administrative burdens of a revision. This analysis would need to take into consideration the following: 1) The Directive as it stands is not a barrier for Member States to apply more stringent requirements or extend the scope of application through national legislation. 2) Lowering the current ELV for VRUs at terminals could result in net benefits for the EU in terms of emission reductions, though these reductions are estimated to be relatively small.
� The potential benefits of including control/capture of tank breathing emissions under the Directive and the introduction of other technical improvements (e.g. to storage tanks at terminals) compared to the costs and administrative burden of
Evaluation of Directive 1994/63/EC and Directive 2009/126/EC
Final interim: July 2015 8
integrating these into the Directive appears to be limited. However, these could be encouraged through other instruments (e.g. guidance, innovation support).
� Areas that could be further investigated so that the different air quality and emissions legislation along with the VOC-I Directive work better work together include the promotion of greater international cooperation in this field and of initiatives that encourage technological innovation.
� There is scope to simplify the Directive through its amendment and the removal of certain technical requirements, which could be replaced with references to external documents such as CEN Standards. Alternatively guidance or a Commission Opinion could be provided to address the issues identified, which would be less burdensome to implement than an amendment of Directive.
VOC-II Directive
Several aspects of the Directive were highlighted that deserve further investigation:
� The interaction between the VOC-II Directive and the FQD. A synergy that could be explored relates to the fact that the FQD directly affects the composition of petrol vapour. As such the possibility to impose additional limits to harmful VOC that are petrol components could be explored.
� There is limited scope for simplification compared to the VOC-I Directive, and any such simplification appears to be better achieved with the issuance of guidance rather than with an amendment to the directive. In particular, the following issues may warrant further attention:
o Assess ways to improve the effectiveness of Article 5.3 on consumer information, which as noted by several stakeholders is believed to have little impact on consumer awareness.
o Clarifying how to determine the actual throughput and what constitutes “major refurbishment”.
o The interactions between Stage I and Stage II systems, which may lead to excessive pressure in the underground storage tank.
Evaluation of Directive 1994/63/EC and Directive 2009/126/EC
Final interim: July 2015 9
Table of contents
Executive summary ........................................................................................... 3 Aims of the study and methodology ..................................................................... 3 Findings and conclusions of the study .................................................................. 3 Initial recommendations at interim report stage .................................................... 7
Table of contents ............................................................................................... 9
1. Introduction ...........................................................................................14 1.1 Purpose and structure of this report ..........................................................14 1.2 Objectives and scope of the study ............................................................14 1.3 Description of the Directives ....................................................................15
2. The policy context in which the Directives operate ......................................21 2.1 Wider policy context on air quality and VOC emissions ................................21 2.2 Analysis of total amount and general trends of VOC emissions across different
sectors ..................................................................................................27 2.3 Photochemical ozone creation potential (POCP) and toxicity of VOC emitted per
sector ...................................................................................................46 2.4 International policy context .....................................................................57
3. Methodology ..........................................................................................60 3.1 Overview ...............................................................................................60 3.2 Screening phase .....................................................................................60 3.3 Interim phase ........................................................................................65
4. Results and analysis – Implementation of Directive 1994/63/EC (VOC-I) .......71 4.1 Overview ...............................................................................................71 4.2 Horizontal Status of implementation (EU wide) ...........................................71 4.3 Specific implementation issues .................................................................74
5. Results and analysis – Evaluation of Directive 1994/63/EC (VOC-I) ...............79 5.1 Summary of evaluation results .................................................................79 5.2 Effectiveness ..........................................................................................82 5.3 Efficiency ...............................................................................................99 5.4 Coherence ........................................................................................... 115 5.5 Relevance ............................................................................................ 126 5.6 EU added-value .................................................................................... 133
6. Results and analysis – Implementation of Directive 2009/126/EC (VOC-II) .. 135 6.1 Overview ............................................................................................. 135 6.2 Horizontal Status of implementation (EU wide) ......................................... 135 6.3 Implementation and review of the elements of Article 7 ............................ 143 6.4 Key issues with implementation .............................................................. 152
7. Results and analysis–Evaluation of Directive 2009/126/EC (VOC-II) ............ 154 7.1 Summary of evaluation results ............................................................... 154 7.2 Effectiveness ........................................................................................ 157 7.3 Efficiency ............................................................................................. 168 7.4 Coherence ........................................................................................... 187 7.5 Relevance ............................................................................................ 190 7.6 EU added-value .................................................................................... 199
Evaluation of Directive 1994/63/EC and Directive 2009/126/EC
Final interim: July 2015 10
8. Conclusions and recommendations ......................................................... 202 8.1 Overview ............................................................................................. 202 8.2 Overall conclusions and recommendations for VOC-I Directive ................... 202 8.3 Overall conclusions and recommendations for VOC-II Directive .................. 205
Appendix A References ............................................................................... 209
Appendix B Glossary of terms ...................................................................... 214
Appendix C Analytical framework ................................................................. 218
Appendix D Member States summaries on implementation .............................. 219
Appendix E List of Member State guidance .................................................... 220
Appendix F List of stakeholders contacted ..................................................... 221
Appendix G Workshop ................................................................................. 222
Appendix H Additional background information .............................................. 223 Table 2.1 Key European directives and international conventions regulating VOC
emissions (either directly or indirectly) .............................................23 Table 2.2 Sector share of volatile organic compounds emissions in the EEA-32
(2011) ..........................................................................................29 Table 2.3 Sector share of non-methane volatile organic compounds emissions in
the EEU 28. EEA data vs. GAINS (2010) ............................................31 Table 2.4 VOC emissions reductions (2005-2030) by category ...............................36 Table 2.5 Summary of the VOC emissions reductions in the petrol distribution and
storage sector over the studied period (Unabated scenario-current level of uptake-2020) .............................................................................44
Table 2.6 Speciation, Photochemical Ozone Creation Potential (POCP) and toxicity according to CLP criteria of the VOC with a proportion higher than 1% (by weight) in the evaporative emissions arising from petrol storage and distribution. ...................................................................................47
Table 2.7 Speciation, Photochemical Ozone Creation Potential (POCP) and toxicity according to CLP criteria of the 10 VOC with the highest proportion (by weight) in emissions derived from the use of solvents (SNAP 6 activities) ....................................................................................................49
Table 2.8 Speciation, Photochemical Ozone Creation Potential (POCP) and toxicity according to CLP criteria of the 10 VOC with the highest proportion (by weight) in emissions derived from road transport (SNAP 7 activities) ....50
Table 2.9 Speciation, Photochemical Ozone Creation Potential (POCP) and toxicity according to CLP criteria of the 10 VOC with the highest proportion (by weight) in the evaporative emissions arising from residential combustion (SNAP 2 activities) .........................................................................51
Table 2.10 Proportion of VOC in each of the ozone creation classes (as classified in Annex IV of the 1991 Geneva Protocol) for each of the sectors ............54
Table 2.11 CMR substances within the 10 VOC with the highest proportion for each of the sectors ................................................................................56
Table 3.1 Evaluation questions .......................................................................61 Table 4.1 Concentration limits for VOC emissions at vapour recovery units ..........76
Evaluation of Directive 1994/63/EC and Directive 2009/126/EC
Final interim: July 2015 11
Table 5.1 Estimated historical (1995), current and future (2020) VOC emissions in the activities controlled by the VOC-II Directive. Emissions reductions and effect of the Directive ...............................................................79
Table 5.2 Emission factor reduction at loading facilities and service stations (Filling tanks only) ....................................................................................84
Table 5.3 Emission values for vapour recovery plants during the loading of motor gasolines (source: BREF for the Refining of Mineral Oil and Gas, 2015) .96
Table 5.4 Categories of costs for competent authorities -VOC-I Directive........... 100 Table 5.5 Categories of costs for industry operators -VOC-I Directive ............... 101 Table 5.6 Findings from consultation on perceived benefits -VOC-I Directive ...... 104 Table 5.7 Annual benefits resulting from the damage costs avoided due to the VOC
emissions reductions attributed to the VOC-I Directive (1995-current implementation) .......................................................................... 105
Table 5.8 Annual benefits resulting from petrol savings (petrol recovered) in the activities controlled by the VOC-I Directive (1995-current implementation) .......................................................................... 107
Table 5.9 Cost assessment of Stage –I in the petrol station sector (DEFRA, 2004) 109 Table 5.10 Reference to relevant CEN standards in the VOC-I Directive .............. 123 Table 6.1 Colour key to assess how the VOC-II Directive has been introduced in
national regulations ...................................................................... 136 Table 6.2 Overview on how the VOC-II Directive has been introduced in national
regulations .................................................................................. 137 Table 6.3 Applicable deadlines to install a PVR stage II system in service stations
under the VOC-II Directive (Article 3) ............................................. 141 Table 7.1 Estimated historical (1995), current and future (2020) VOC emissions in
the activities controlled by the VOC-II Directive. Emissions reductions and effect of the Directive on them ................................................. 155
Table 7.2 Estimated annual cost and benefits of the VOC-II Directive for the periods 1995-current level of uptake and from current levels until 2020 in the EU-28 ......................................................................................... 156
Table 7.3 Emission factor reduction at service stations (refuelling only) ............ 160 Table 7.4 Categories of costs for competent authorities -VOC-II Directive ......... 169 Table 7.5 Categories of costs for industry operators -VOC-II Directive .............. 171 Table 7.6 Costs (in €) identified with scheduled and unscheduled installation of
Stage II PVR in Impact Assessment ................................................ 173 Table 7.7 Recurring costs (in €) identified in Impact Assessment ...................... 173 Table 7.8 Stage II controls investment, administrative and compliance costs (€m)
in the EU-28 (1995-current uptake) ................................................ 174 Table 7.9 Findings from consultation on perceived benefits -VOC-II Directive .... 176 Table 7.10 Benefits resulting from the damage costs avoided due to the VOC
emissions reductions attributed to the VOC-II Directive (1995-current implementation) .......................................................................... 178
Table 7.11 Benefits resulting from petrol savings (petrol recovered) in the activities controlled by the VOC-II Directive (1995-current implementation) ..... 179
Table 7.12 Comparison of the Commission’s Impact Assessment (2008) with the results of this study ...................................................................... 182
Figure 1 Stages for vapour emission controls (after Institute of Petroleum, 2000) ..16 Figure 2 Share of the VOC emissions in the EEA-32: Further look at the energy and
distribution sector .............................................................................30 Figure 3 Historical petrol consumption and number of petrol and diesel passenger
vehicles in the EU fleet (1990-2012) ....................................................32 Figure 4 Historical VOC emissions 1990-2012 (By EEA Aggregation sector) ...........33
Evaluation of Directive 1994/63/EC and Directive 2009/126/EC
Final interim: July 2015 12
Figure 5 Historical VOC emissions reductions from 1990 to 2012 (%) (By EEA Aggregation sector) ........................................................................34
Figure 6 Historical and future (projected) VOC emissions 2000-2030 (GAINS) ....35 Figure 7 Historical (1990-2012) and projected (2013-2030) VOC emission factor
expressed as tonnes of emissions per million of litres sold (petrol) .......37 Figure 8 VOC emissions from service stations and loading facilities (a) without any
control in place (Scenario 1a); and (b) with current implementation of Stage I and Stage II controls (Scenario 2) .........................................40
Figure 9 VOC emissions from service stations and loading facilities (a) with projected implementation of Stage I and Stage II controls in (a) 2015 (Scenario 3) and (b) 2020 (Scenario 4) .............................................42
Figure 10 VOC emissions reductions (from scenario 1a to scenario 4. Effects of previous national legislation calculated using scenario 5a, 5b and 5c): at service stations, loading facilities, and storage at refineries .................43
Figure 11 VOC emissions reductions (1995-scenario 2) at service stations, loading facilities, and storage at refineries ....................................................46
Figure 12 Ozone concentrations reported in the EU-27 (2012). Exceedances of EU target value. ..................................................................................53
Figure 13 Benzene concentrations reported in the EU-27 (2012). Exceedances of EU limit value. ....................................................................................55
Figure 14 Project workflow ............................................................................60 Figure 15 Intervention logic ...........................................................................63 Figure 16 Number of consultation respondents by Member State ........................67 Figure 17 Overview of the status of implementation of the VOC-I Directive (% of
member states) .............................................................................74 Figure 18 Use of orifice vent device (OVD) in Stage I controls (DECCW NSW,
2009b) .........................................................................................77 Figure 19 Expected results of the VOC-I Directive – extract from the intervention
logic .............................................................................................82 Figure 20 VOC emissions reductions (1995-current uptake) at service stations
(filling tanks), and loading facilities in the EU-28 ................................84 Figure 21 Stakeholder responses: What unexpected/unintended positive or
negative changes have you identified as a result of the implementation of the Directives (or national legislation that transposes the Directives)? ..93
Figure 22 Stakeholder responses: How suitable is the VOC I Directive in meeting national and local air quality limits for VOC emissions and for ozone and benzene concentrations? (Total responses: 48) ................................ 127
Figure 23 Stakeholder responses: How suitable is the VOC I Directive in terms of protecting workers’ health and well-being? (Total responses: 50) ....... 127
Figure 24 Stakeholder responses: How suitable is the VOC I Directive in terms raising awareness of the environmental and health concerns related to VOC emissions? (Total responses: 50) ............................................ 128
Figure 25 Stakeholder responses: What is your organisation’s overall view of the VOC-I Directive? Total responses: 56) ............................................ 131
Figure 26 Stakeholder responses: Indicate whether control of VOC emissions from petrol should be a higher or lower priority now relative to when the Directives were introduced, and why? (Total responses: 49) .............. 132
Figure 27 Level of uptake of Stage II systems across the EU-28 (estimated)...... 142 Figure 28 Level of uptake of Stage II systems per annual throughput band ( estimated) .................................................................................. 143 Figure 29 Stakeholder responses: Do you think the 100 m3 throughput threshold
for service stations referred to in Article 3(1)(b) and (2)(b) of the VOC-II Directive and Article 6(3) of VOC-I Directive is appropriate? .............. 145
Evaluation of Directive 1994/63/EC and Directive 2009/126/EC
Final interim: July 2015 13
Figure 30 Proportion of total currentemisisons (controlled), number of service stations and service stations with Stage II controls per annual throughput band ........................................................................................... 147
Figure 31 VOC emissions reductions (1995-current uptake) at service stations (refuelling) in the EU-28 ............................................................... 159
Evaluation of Directive 1994/63/EC and Directive 2009/126/EC
Final interim: July 2015 14
1. Introduction
1.1 Purpose and structure of this report
This report concerns a contract (070201/2014/692091/ENV.C3) between the European Commission and Amec Foster Wheeler Environment and Infrastructure UK Limited (‘Amec Foster Wheeler’), which relates to “supporting the evaluation of Directive 1994/63/EC on VOC emissions from petrol storage & distribution and Directive 2009/126/EC on petrol vapour recovery”. The work on this contract is being undertaken in association with BIO by Deloitte (‘BIO’) and the Regional Environmental Centre for Central and Eastern Europe (‘REC’).
This is the Interim Report for this study and summarises the information gathered and analysed up to 20 of July 2015, as well as preliminary analysis and results, including the identification of gaps and inconsistencies. The findings of report will be discussed at a stakeholder workshop. It is noted that this report represents a snapshot of progress made to date with the study. There are a number of key areas that might be investigated further following its submission and discussion at the stakeholder workshop.
The report is structured as follows:
� Section 1 introduces the study’s objectives and scope and describes the two Directives under evaluation;
� Section 2 describes the broader policy context in which the Directives operate;
� Section 3 presents the methodology and tools applied to undertake the study;
� Sections 4 and 6 present the results and analysis on the status of implementation of the VOC-I Directive and VOC-II Directive respectively;
� Sections 5 and 7 present the evaluation results and analysis of the VOC-I Directive and VOC-II Directive respectively based on criteria of effectiveness, efficiency, coherence, relevance and EU added value; and
� Section 8 includes conclusions and policy recommendations.
1.2 Objectives and scope of the study
This report presents the (interim) findings of the evaluation study commissioned by the European Commission on the following Directives on Petrol Vapour Recovery (PVR):
� Directive 1994/63/EC on the control of volatile organic compound (VOC) emissions resulting from the storage of petrol and its distribution from terminals to service stations (aka VOC-I or Stage I Petrol Vapour Recovery)1
.
� Directive 2009/126/EC on Stage II petrol vapour recovery during refuelling of motor vehicles at service stations (aka VOC-II or Stage II Petrol Vapour Recovery)2
.
1 European Parliament and Council Directive 94/63/EC of 20 December 1994 on the control of volatile organic compound (VOC) emissions resulting from the storage of petrol and its distribution from terminals to service stations (OJ L 365, 31/12/1994, p. 24-33) 2 Directive 2009/126/EC of the European Parliament and of the Council of 21 October 2009 on Stage II petrol vapour recovery during refuelling of motor vehicles at service stations (OJ L 285, 31/10/2009, p. 36-39)
Evaluation of Directive 1994/63/EC and Directive 2009/126/EC
Final interim: July 2015 15
The evaluation of the PVR Directives (hereafter referred to as the VOC-I Directive and the VOC-II Directive) is included in the Commission’s Regulatory Fitness and Performance Programme (REFIT)3 which aims at reviewing the entire stock of EU legislation to make EU law lighter, simpler and less costly. The evaluation was published in the REFIT Scoreboard4 published in June 2014 and is due to conclude in 2016, in accordance with the Commission's Work Programme for 20155.
The overall aim of this evaluation study is to present key findings and conclusions and to serve as evidence to the European Commission on the process of implementation of the Directives and for further planning. The outputs will be used by the Commission in their evaluation report to the European Parliament and the Council, due in 2016. This will be provided alongside the report on the status of implementation as required under Article 7 of the VOC-II Directive.
As outlined in the terms of reference, the study has the following specific objectives6:
� An evaluation of the performance of two Directives compared to initial expectations. The study pays particular attention to a) detecting and assessing regulatory burden and identifying opportunities for simplification; b) assessing the following evaluation criteria:
o Effectiveness: To what extent did the Directives cause the observed changes/effects? To what extent can these changes/effects be credited to the Directives? To what extent do the observed effects correspond to the objectives?
o Efficiency: Were the costs involved justified, given the changes/effects which have been achieved? What factors influenced the achievements observed?
o Coherence: To what extent are the Directives coherent with other interventions which have similar objectives? To what extent are the Directives coherent internally?
o Relevance: To what extent do the (original) objectives (still) correspond to the needs within the EU?
o EU added value: What is the additional value resulting from the Directives, compared to what could be achieved by Member States at national and/or regional levels?
� An assessment of the implementation status of the two Directives across the 28 EU Member States, focusing on the key provisions and requirements of the legislation and, in particular, the issues listed in Article 7 of the VOC-II Directive.
1.3 Description of the Directives
1.3.1 Overview
Petrol is a complex mixture of volatile organic compounds (VOC)7 which readily evaporate in storage tanks. Unless controlled, the petrol vapour containing VOC will
3http://ec.europa.eu/smart-regulation/refit/index_en.htm 4http://ec.europa.eu/smart-regulation/docs/scoreboard_en.pdf 5http://ec.europa.eu/atwork/pdf/cwp_2015_refit_actions_en.pdf 6Details of the evaluation process, its timetable and related documents are available through the following website: http://ec.europa.eu/environment/air/transport/petrol.htm 7 VOC in general are organic chemicals that are determined by having a high vapour pressure at ambient temperatures resulting in a relatively low boiling point. Methane is also a VOC but is often singled out because of its different origin (natural gas distribution networks, coal mining
Evaluation of Directive 1994/63/EC and Directive 2009/126/EC
Final interim: July 2015 16
dissipate into the atmosphere from storage tanks, during loading/ unloading operations or when vehicles are being filled at service stations, as the incoming petrol displaces the petrol vapour in the tank.
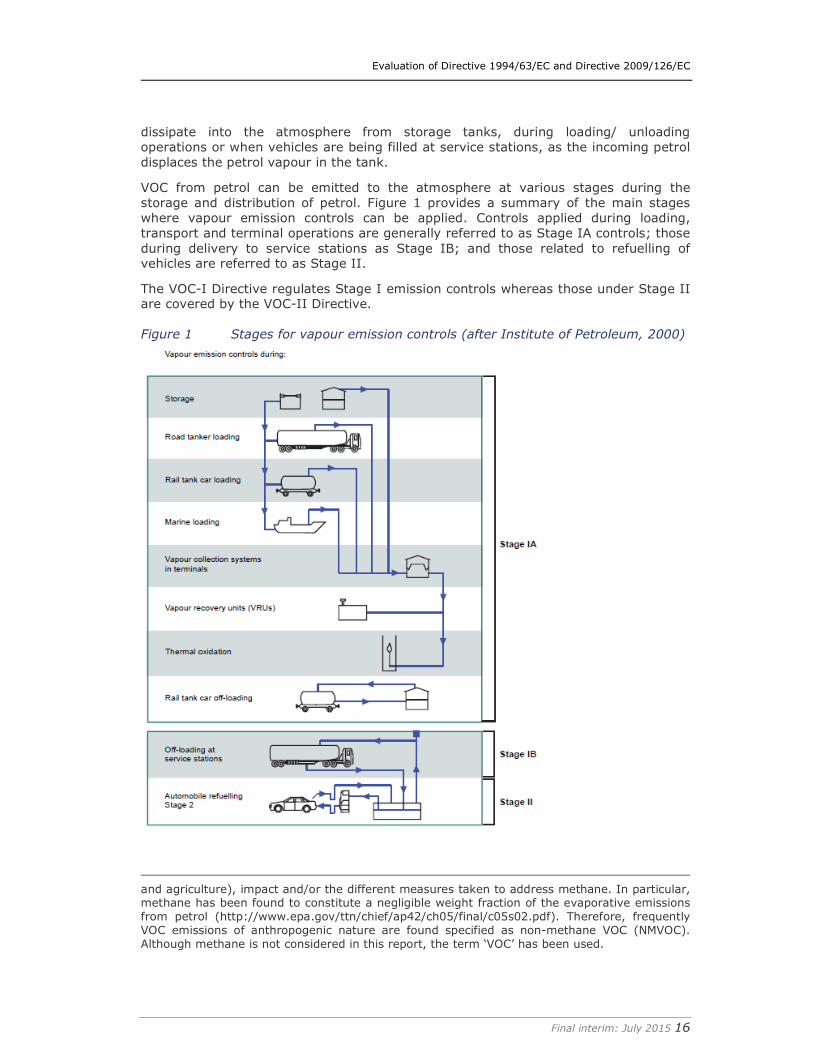
VOC from petrol can be emitted to the atmosphere at various stages during the storage and distribution of petrol. Figure 1 provides a summary of the main stages where vapour emission controls can be applied. Controls applied during loading, transport and terminal operations are generally referred to as Stage IA controls; those during delivery to service stations as Stage IB; and those related to refuelling of vehicles are referred to as Stage II.
The VOC-I Directive regulates Stage I emission controls whereas those under Stage II are covered by the VOC-II Directive.
Figure 1 Stages for vapour emission controls (after Institute of Petroleum, 2000)
and agriculture), impact and/or the different measures taken to address methane. In particular, methane has been found to constitute a negligible weight fraction of the evaporative emissions from petrol (http://www.epa.gov/ttn/chief/ap42/ch05/final/c05s02.pdf). Therefore, frequently VOC emissions of anthropogenic nature are found specified as non-methane VOC (NMVOC). Although methane is not considered in this report, the term ‘VOC’ has been used.
Evaluation of Directive 1994/63/EC and Directive 2009/126/EC
Final interim: July 2015 17
The reductions of VOC emissions achieved by the Directives are intended to address number of environmental and health problems:
� They reduce the formation of photochemical oxidants, particularly ground-level ozone (O3), for which the VOC from petrol play a role as a precursor of pollution. Ground-level ozone is a secondary pollutant formed by photochemical reaction between VOC and nitrogen oxides (NOx) in sunlight. Ozone pollution can cause and aggravate cardiopulmonary problems (e.g. asthma), damage agricultural crops and vegetation by reducing their growth rates, and can contribute to climate change.
� Reduce exposure to VOC substances that are carcinogenic, mutagenic and/or toxic for reproduction, such as benzene, toluene or hexane. In particular, benzene is a known human carcinogen and can cause damages to genetic structures in cells in humans. There is no accepted safe level of exposure to benzene. Benzene occurs naturally in crude oil and hence can be released during delivery and storage of petrol.
� Contribute to reducing odour nuisance to people in the vicinity of service stations.
1.3.2 Directive 1994/63/EC (VOC-I)
Key provisions
The VOC-I Directive is intended to reduce VOC emissions to atmosphere from the operations, installations, vehicles and vessels used for storage, loading and transport of petrol from one terminal to another, or from a terminal to a service station. At the time that the Directive was introduced, emissions of VOC from storage and distribution of petrol were estimated to represent around 500,000 tonnes per year (5% of total anthropogenic VOC emissions in the European Community).
The ‘Stage I’ control measures established in the VOC-I Directive set out actions to ‘close’ the system for storage and distribution of petrol by reducing breathing losses from storage tanks at terminals and by ensuring that the petrol vapours displaced during transport and loading operations from terminals to the service station are captured, contained and transported back ‘upstream’ to terminals, where the vapours can be regenerated into petrol. The Directive’s main requirements are summarised below.
Box 1 Requirements of the VOC-I Directive
The requirements of the VOC-I Directive were required to be implemented over the period 1996-2004 (Note 1)and are briefly summarised below:
� For storage at terminals:
o Above ground tanks must be painted with high heat-reflectance paint (with derogations for the protection of special landscape areas designated by national authorities and exemptions where tanks are connected to a vapour recovery unit).
o Tanks with external floating roofs must have primary and secondary seals between the tank wall and the floating roof.
o Fixed roof tanks must either be connected to a vapour recovery unit or be fitted with an internal floating roof.
o Vapour containment efficiencies are specified for the above sealing systems (compared with a fixed roof tank with pressure/vacuum relief valve).
� When loading and unloading at terminals:
o Displaced vapours must be returned through a vapour-tight connection line to a vapour recovery unit for regeneration at the terminal (this does not apply to top-loading tankers; all road tankers had to be bottom-loaded by the end of 2004) or intermediate storage.
o Vapours may be incinerated when loading onto vessels where vapour recovery is unsafe or
Evaluation of Directive 1994/63/EC and Directive 2009/126/EC
Final interim: July 2015 18
technically impossible because of the volume of return vapour.
� Mobile containers need to be designed and operated so as to retain vapours returned from storage installations.
� Where intermediate storage of vapours is carried out at terminals and during unloading of petrol at service stations and terminals, displaced vapours must be returned through a vapour-tight connection line to the mobile container delivering the petrol.
There are a number of time-limited derogations set out in the Directive related to specific Member States as well as derogations for smaller terminals and service stations. There also exists the possibility for Member States to grant a derogation from the requirements for petrol stations where emissions are unlikely to contribute significantly to environmental or health problems and where throughput is below a certain threshold (Note 2).
Note 1: With certain derogations granted for some Member States, including older Member States (as set out in the Directive) and transition periods for some newer Member States (as agreed in the accession process). It is noted that of these transition periods have now passed and the Directive should be fully implemented in all Member States.
Note 2: For example, such a derogation has been implemented by the United Kingdom for existing petrol stations with a throughput less than 500m3/year (since these are not expected to contribute significantly to environmental or health problems).
Implementation and review of the Directive
Under Article 9 of the Directive, the Commission is expected to report on implementation of the Directive, including, where appropriate, proposals for the amendment of the Directive8. An extensive review of the status of implementation was undertaken in 2009 (Entec and REC, 2009)9. The study concluded that, in general, the majority of Member States had implemented and applied the Directive’s requirements correctly within the agreed timescales. However there were some instances where there appeared to have been some delays and/or issues with implementation.
The 2009 study identified a number of areas where possible changes to the regime under VOC-I could be considered, in order to improve the effectiveness of the directive (driving further emission reductions), but also for simplification (e.g. through referring to relevant CEN standards instead of the detailed provisions of the directive), and for its improved coherence with other EU and international legislation. The present study builds on and enriches the findings of the previous assessment.
1.3.3 Directive 2009/126/EC (VOC-II)
Stage II petrol vapour recovery involves recovering the petrol vapour displaced from the fuel tank of a vehicle during refuelling at a service station and transferring that petrol vapour to an underground storage tank at the service station or back to the petrol dispenser for resale.
The VOC-II Directive lays down measures to reduce the amount of petrol vapour emitted to the atmosphere during refuelling at service stations.
8 Including, in particular, the extension of the scope to include vapour control and recovery systems for loading installations and ships (as indicated in the preamble to the Directive, the preference was for standards to be drawn up at the International Maritime Organisation level). The Preamble also refers to further action being needed to reduce vapour emissions during refuelling at service stations which was achieved through the VOC-II Directive. 9 Entec UK limited & REC (2009), Assessment of the implementation of the VOC Stage I Directive (1994/63/EC).
Evaluation of Directive 1994/63/EC and Directive 2009/126/EC
Final interim: July 2015 19
Its main requirements are summarised below.
Box 2 Requirements of the VOC-II Directive
� A requirement to apply Stage II petrol vapour recovery to:
o All new service stations (from 1 January 2012) and existing service stations undergoing a major refurbishment (at the time of refurbishment) if actual or intended throughput:
o is greater than 500m3 per annum or;
o is greater than 100m3 per annum if situated under permanent living quarters or working areas.
o Existing service stations with a throughput in excess of 3,000m3 (by 31 December 2018).
� A requirement to ensure a petrol vapour capture efficiency (Note 1) of at least 85% and, where the recovered petrol vapour is transferred to an underground storage tank at the service station, a vapour/petrol ratio (Note 2) of 0.95 to 1.05.
� Testing of petrol vapour capture efficiency at least once per year, unless an automatic monitoring system is installed (in which case, testing must be done at least every three years and the system is required to indicate faults to the operator and automatically stop the flow of petrol within seven days if the fault is not rectified).
� A requirement to ensure that service stations displays a sign, sticker or other notification on, or in the vicinity of, the petrol dispenser, informing consumers on the installation of a Stage II petrol vapour recovery system.
� A requirement to lay down effective, proportionate and dissuasive penalties applicable to infringements (and to notify the provisions for these penalties and the main provisions of national law to the European Commission by 1 January 2012).
� Legislation had to be transposed by 1 January 2012.
Note 1: This relates to the amount of petrol vapour captured by the Stage II petrol vapour recovery system compared to the amount of petrol vapour that would otherwise be emitted to the atmosphere in the absence of such a system.
Note 2: The ratio between the volume of petrol vapour passing through the Stage II petrol vapour recovery system and the volume of petrol dispensed.
Article 8 of the VOC-II Directive provides for the adaptation of Articles 4 and 5 to technical progress where necessary. Accordingly, these Articles have been recently amended by Commission Directive 2014/99/EU of 21 October 201410. The amendments ensure that the Directive is consistent with the recently adopted CEN standards EN 16321-1:201311 and EN 16321-2:201312, which were made available on 25 September 2013. The deadline for transposition to Member States is 12 May 2016 at the latest.
Implementation of the Directive
The status of implementation of the VOC-II Directive has not been assessed thus far. Article 7 required the Commission to review, by 31 December 2014, the status of implementation of the Directive and to inform the European Parliament and the Council on the results, with particular attention to the following elements:
� The 100 m3/year threshold referred to in Article 3(1)(b) and (2)(b) of the Directive and Article 6(3) of Directive 94/63/EC;
10 Commission Directive 2014/99/EU of 21 October 2014 amending, for the purposes of its adaptation to technical progress, Directive 2009/126/EC on Stage II petrol vapour recovery during refuelling of motor vehicles at service stations. OJ L 304, 23.10.2014, p. 89–90. 11Standard EN 16321-1:2013 specifies the test methods for the type approval of petrol vapour recovery systems for use in service stations. 12Standard EN 16321 2:2013 specifies the test methods to be used at service stations to verify the operation of such vapour recovery systems
Evaluation of Directive 1994/63/EC and Directive 2009/126/EC
Final interim: July 2015 20
� The in-service compliance record of Stage II petrol vapour recovery systems (Article 5); and
� The need for automatic monitoring equipment (Article 5).
In addition to assessing the items listed in Article 7, it is also within the remit of the current study to assess the extent to which Member States have met the timescales envisaged in the Directive and are progressing with its implementation.
Evaluation of Directive 1994/63/EC and Directive 2009/126/EC
Final interim: July 2015 21
2. The policy context in which the Directives operate
2.1 Wider policy context on air quality and VOC emissions
The improvement of air quality has been one of Europe’s main political concerns since the late 1970s.Air quality is determined by the presence in the atmosphere of polluting substances involving different impacts upon welfare, health or the environment. The subject is complex considering the different types of substances emitted and emission sources (natural and man-made), the chemical reactions that can occur in the atmosphere and the transboundary nature of air pollution.
Among the different types of air pollutants, VOC include a variety of chemicals that can be associated with a number of environmental and health problems. As noted above in section 1.3.1, one main concern is their contribution to the formation of ground-level ozone (O3) which is one of the major constituents of photochemical smog. In Europe ozone is currently one of the air pollutants of most concern due to the significant effect that excessive concentrations can have on human health and the environment. In addition some VOC such as benzene are carcinogenic, mutagenic and/ or toxic for reproduction. Further detail on the effects of VOC as precursors of ground-level ozone and their environmental and health concerns is provided in section 2.2.
VOC are either man-made (transport, industry) or can have a biogenic/natural origin (trees and plants). Man-made sources include the use of solvents in products and industry, road vehicles, household heating and power generation.
These man-made sources of VOC are characterised by their diversity and, in many cases, their complexity, thus requiring an integrated regulatory framework to control VOC emissions and their detrimental impacts. Moreover, since VOC (and ground level-ozone) are transboundary pollutants which can be transported long distances across national boundaries, measures to reduce emissions would only be effective if they are coordinated internationally.
Recognising this international dimension, the European Union signed the 1991 Geneva Protocol to the 1979 Convention on Long-Range Transboundary Air Pollution (LRTAP Convention) concerning the Control of Emissions of Volatile Organic Compounds or their Transboundary Fluxes13 establishing target reductions of the annual emissions of man-made VOC by 1999. Efforts to reduce VOC emissions were reinforced with the signature in 2003 of the1999 Gothenburg Protocol (recently revised in 2012)14 to abate acidification, eutrophication and ground-level ozone. The Protocol sets an emission ceiling for VOC (among other pollutants) as well as national emission reduction commitments and the requirement to apply best available techniques (BAT).
International commitments have been key in driving and shaping air quality policy in the European Union. The overarching policy instruments on air pollution within the EU include Directive 2001/81/EC on National Emission Ceilings (NECD)15 and Directive 2008/50/EC on ambient air quality (AQD)16. These are complemented by specific legislation regulating the different sources of air pollution, including the Directives on petrol storage and distribution among others. Indirectly, other regulatory instruments promoting good environmental practices and behaviour also contribute to enhanced air quality.
13http://www.unece.org/ab/env/lrtap/vola_h1.html 14http://www.unece.org/ab/env/lrtap/multi_h1.html 15http://ec.europa.eu/environment/air/pollutants/ceilings.htm
16http://eur-lex.europa.eu/legal-content/EN/TXT/?uri=celex:32008L0050
Evaluation of Directive 1994/63/EC and Directive 2009/126/EC
Final interim: July 2015 22
At EU level, in December 2013 the Commission completed a comprehensive review of EU air quality policy, building on the 2005 Thematic Strategy on Air Pollution17, which resulted in the publication of the Clean Air Policy Package18. The review concluded that, although the existing policy framework enabled a significant reduction in air pollution, important challenges remained to be tackled, including ground level ozone pollution, to which VOC contribute. It was noted in this review that meeting the air quality targets set out in the legislation and achieving further reductions of VOC relies on the full implementation of the existing legislation. The review also suggests that Member States may have to take additional measures.
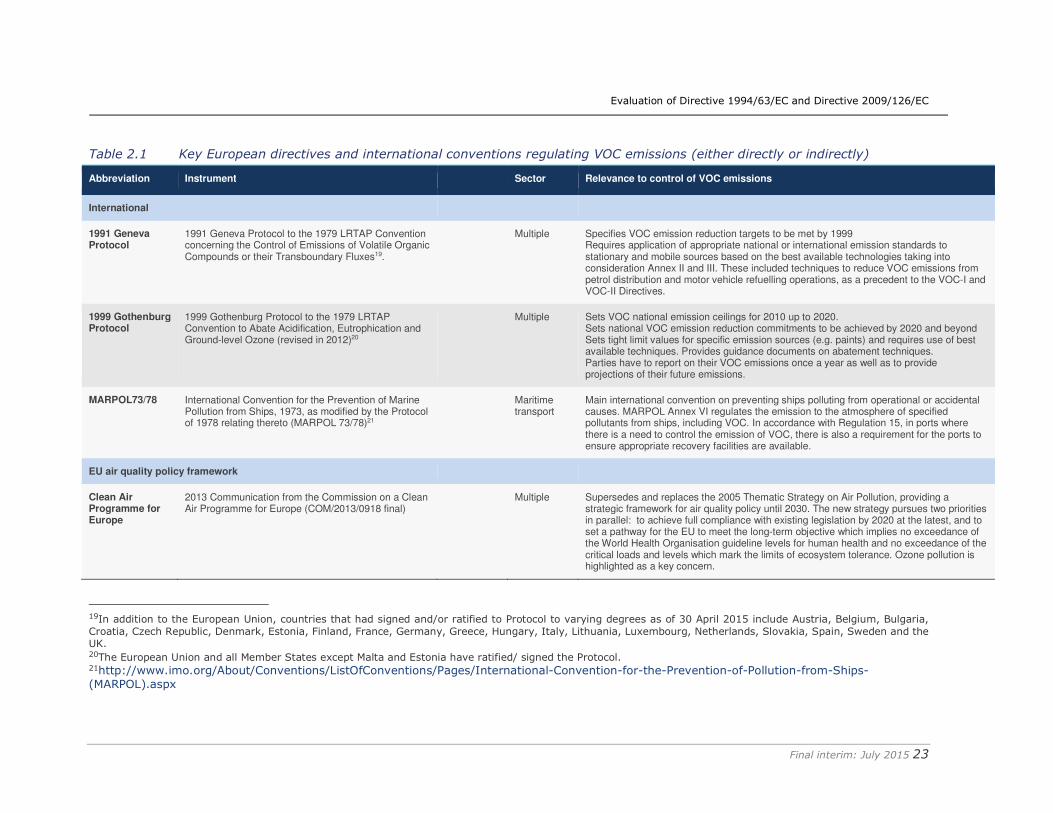
Hence, it is important to have a good understanding of the main components of the EU air quality policy framework addressing VOC emissions. These are summarised in Table 2.1 below:
17http://eur-lex.europa.eu/legal-content/EN/ALL/?uri=CELEX:52005DC0446 18http://ec.europa.eu/environment/air/clean_air_policy.htm
Evaluation of Directive 1994/63/EC and Directive 2009/126/EC
Final interim: July 2015 23
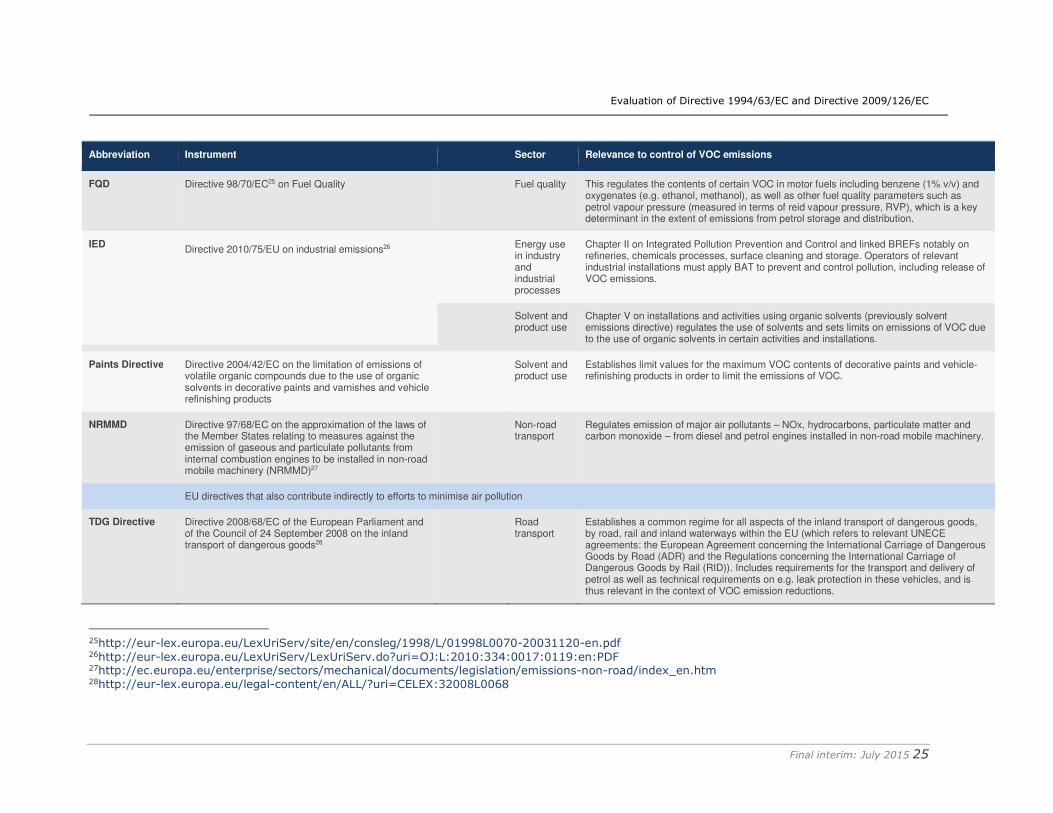
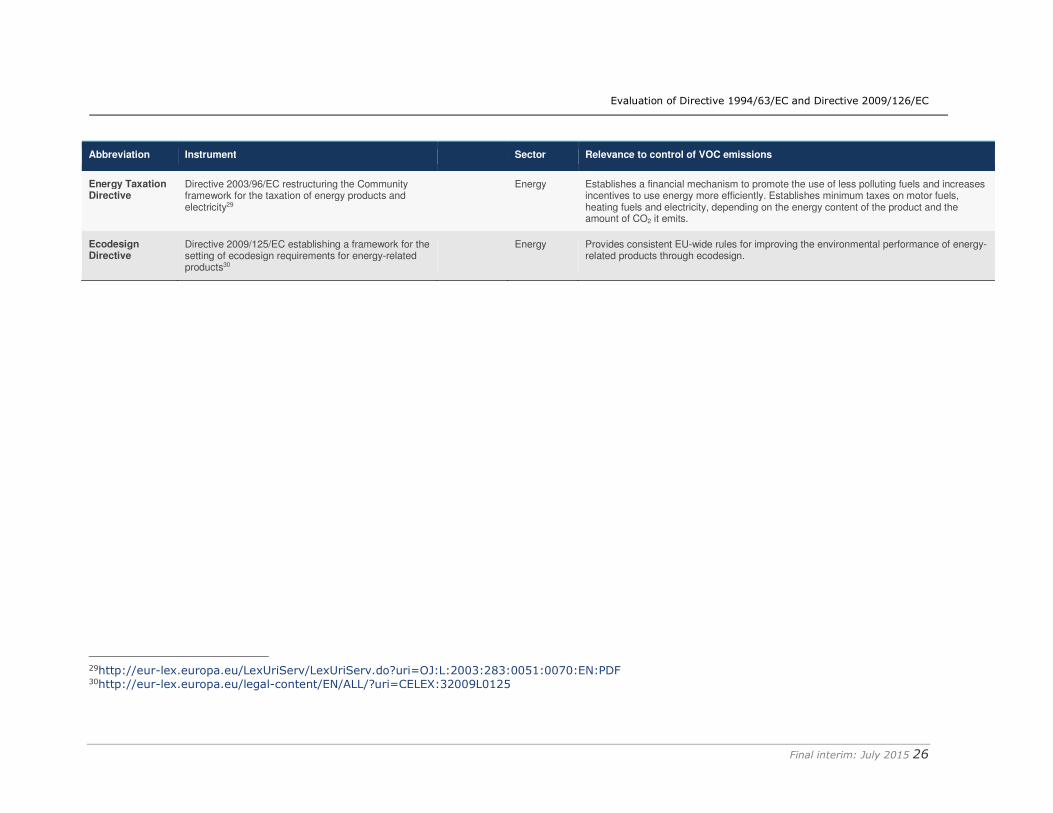
Table 2.1 Key European directives and international conventions regulating VOC emissions (either directly or indirectly)
Abbreviation Instrument Sector Relevance to control of VOC emissions
International
1991 Geneva Protocol
1991 Geneva Protocol to the 1979 LRTAP Convention concerning the Control of Emissions of Volatile Organic Compounds or their Transboundary Fluxes19.
Multiple
Specifies VOC emission reduction targets to be met by 1999 Requires application of appropriate national or international emission standards to stationary and mobile sources based on the best available technologies taking into consideration Annex II and III. These included techniques to reduce VOC emissions from petrol distribution and motor vehicle refuelling operations, as a precedent to the VOC-I and VOC-II Directives.
1999 Gothenburg Protocol
1999 Gothenburg Protocol to the 1979 LRTAP Convention to Abate Acidification, Eutrophication and Ground-level Ozone (revised in 2012)20
Multiple
Sets VOC national emission ceilings for 2010 up to 2020. Sets national VOC emission reduction commitments to be achieved by 2020 and beyond Sets tight limit values for specific emission sources (e.g. paints) and requires use of best available techniques. Provides guidance documents on abatement techniques. Parties have to report on their VOC emissions once a year as well as to provide projections of their future emissions.
MARPOL73/78 International Convention for the Prevention of Marine Pollution from Ships, 1973, as modified by the Protocol of 1978 relating thereto (MARPOL 73/78)21
Maritime transport
Main international convention on preventing ships polluting from operational or accidental causes. MARPOL Annex VI regulates the emission to the atmosphere of specified pollutants from ships, including VOC. In accordance with Regulation 15, in ports where there is a need to control the emission of VOC, there is also a requirement for the ports to ensure appropriate recovery facilities are available.
EU air quality policy framework
Clean Air Programme for Europe
2013 Communication from the Commission on a Clean Air Programme for Europe (COM/2013/0918 final)
Multiple Supersedes and replaces the 2005 Thematic Strategy on Air Pollution, providing a strategic framework for air quality policy until 2030. The new strategy pursues two priorities in parallel: to achieve full compliance with existing legislation by 2020 at the latest, and to set a pathway for the EU to meet the long-term objective which implies no exceedance of the World Health Organisation guideline levels for human health and no exceedance of the critical loads and levels which mark the limits of ecosystem tolerance. Ozone pollution is highlighted as a key concern.
19In addition to the European Union, countries that had signed and/or ratified to Protocol to varying degrees as of 30 April 2015 include Austria, Belgium, Bulgaria, Croatia, Czech Republic, Denmark, Estonia, Finland, France, Germany, Greece, Hungary, Italy, Lithuania, Luxembourg, Netherlands, Slovakia, Spain, Sweden and the UK. 20The European Union and all Member States except Malta and Estonia have ratified/ signed the Protocol. 21http://www.imo.org/About/Conventions/ListOfConventions/Pages/International-Convention-for-the-Prevention-of-Pollution-from-Ships-(MARPOL).aspx
Evaluation of Directive 1994/63/EC and Directive 2009/126/EC
Final interim: July 2015 24
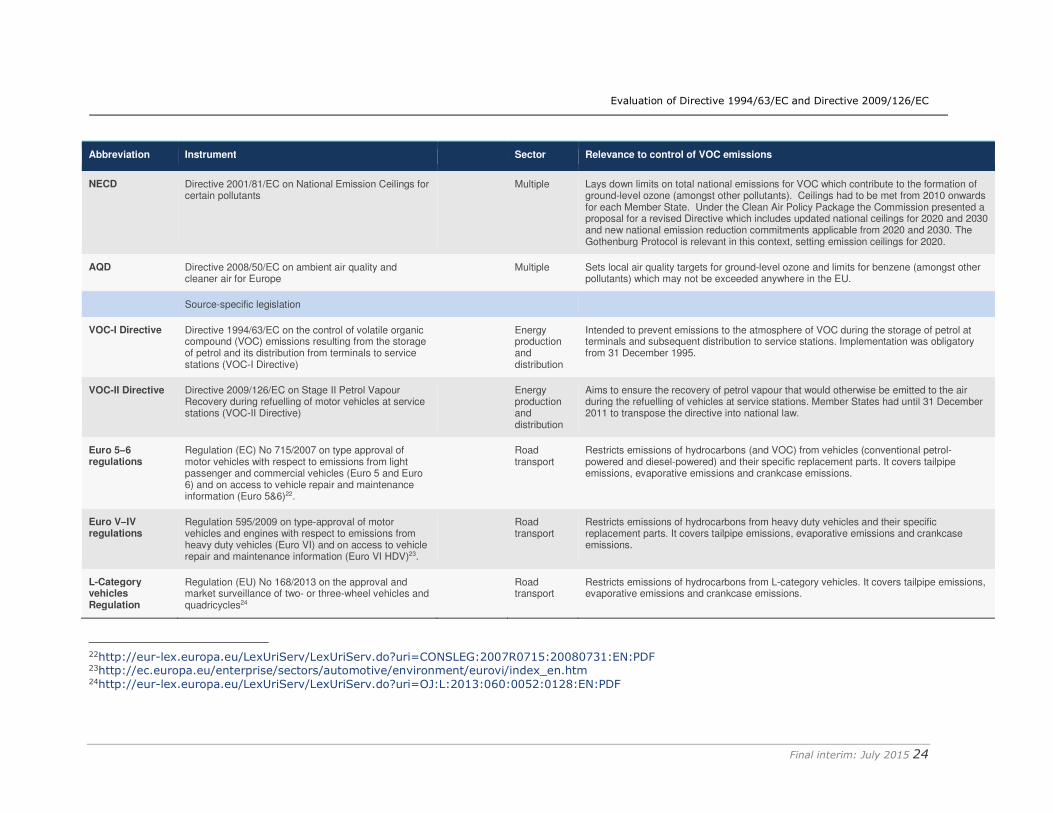
Abbreviation Instrument Sector Relevance to control of VOC emissions
NECD Directive 2001/81/EC on National Emission Ceilings for certain pollutants
Multiple Lays down limits on total national emissions for VOC which contribute to the formation of ground-level ozone (amongst other pollutants). Ceilings had to be met from 2010 onwards for each Member State. Under the Clean Air Policy Package the Commission presented a proposal for a revised Directive which includes updated national ceilings for 2020 and 2030 and new national emission reduction commitments applicable from 2020 and 2030. The Gothenburg Protocol is relevant in this context, setting emission ceilings for 2020.
AQD Directive 2008/50/EC on ambient air quality and cleaner air for Europe
Multiple Sets local air quality targets for ground-level ozone and limits for benzene (amongst other pollutants) which may not be exceeded anywhere in the EU.
Source-specific legislation
VOC-I Directive Directive 1994/63/EC on the control of volatile organic compound (VOC) emissions resulting from the storage of petrol and its distribution from terminals to service stations (VOC-I Directive)
Energy production and distribution
Intended to prevent emissions to the atmosphere of VOC during the storage of petrol at terminals and subsequent distribution to service stations. Implementation was obligatory from 31 December 1995.
VOC-II Directive Directive 2009/126/EC on Stage II Petrol Vapour Recovery during refuelling of motor vehicles at service stations (VOC-II Directive)
Energy production and distribution
Aims to ensure the recovery of petrol vapour that would otherwise be emitted to the air during the refuelling of vehicles at service stations. Member States had until 31 December 2011 to transpose the directive into national law.
Euro 5–6 regulations
Regulation (EC) No 715/2007 on type approval of motor vehicles with respect to emissions from light passenger and commercial vehicles (Euro 5 and Euro 6) and on access to vehicle repair and maintenance information (Euro 5&6)22.
Road transport
Restricts emissions of hydrocarbons (and VOC) from vehicles (conventional petrol-powered and diesel-powered) and their specific replacement parts. It covers tailpipe emissions, evaporative emissions and crankcase emissions.
Euro V–IV regulations
Regulation 595/2009 on type-approval of motor vehicles and engines with respect to emissions from heavy duty vehicles (Euro VI) and on access to vehicle repair and maintenance information (Euro VI HDV)23.
Road transport
Restricts emissions of hydrocarbons from heavy duty vehicles and their specific replacement parts. It covers tailpipe emissions, evaporative emissions and crankcase emissions.
L-Category vehicles Regulation
Regulation (EU) No 168/2013 on the approval and market surveillance of two- or three-wheel vehicles and quadricycles24
Road transport
Restricts emissions of hydrocarbons from L-category vehicles. It covers tailpipe emissions, evaporative emissions and crankcase emissions.
22http://eur-lex.europa.eu/LexUriServ/LexUriServ.do?uri=CONSLEG:2007R0715:20080731:EN:PDF 23http://ec.europa.eu/enterprise/sectors/automotive/environment/eurovi/index_en.htm 24http://eur-lex.europa.eu/LexUriServ/LexUriServ.do?uri=OJ:L:2013:060:0052:0128:EN:PDF
Evaluation of Directive 1994/63/EC and Directive 2009/126/EC
Final interim: July 2015 25
Abbreviation Instrument Sector Relevance to control of VOC emissions
FQD Directive 98/70/EC25 on Fuel Quality
Fuel quality This regulates the contents of certain VOC in motor fuels including benzene (1% v/v) and oxygenates (e.g. ethanol, methanol), as well as other fuel quality parameters such as petrol vapour pressure (measured in terms of reid vapour pressure, RVP), which is a key determinant in the extent of emissions from petrol storage and distribution.
IED Directive 2010/75/EU on industrial emissions26
Energy use in industry and industrial processes
Chapter II on Integrated Pollution Prevention and Control and linked BREFs notably on refineries, chemicals processes, surface cleaning and storage. Operators of relevant industrial installations must apply BAT to prevent and control pollution, including release of VOC emissions.
Solvent and product use
Chapter V on installations and activities using organic solvents (previously solvent emissions directive) regulates the use of solvents and sets limits on emissions of VOC due to the use of organic solvents in certain activities and installations.
Paints Directive Directive 2004/42/EC on the limitation of emissions of volatile organic compounds due to the use of organic solvents in decorative paints and varnishes and vehicle refinishing products
Solvent and product use
Establishes limit values for the maximum VOC contents of decorative paints and vehicle-refinishing products in order to limit the emissions of VOC.
NRMMD Directive 97/68/EC on the approximation of the laws of the Member States relating to measures against the emission of gaseous and particulate pollutants from internal combustion engines to be installed in non-road mobile machinery (NRMMD)27
Non-road transport
Regulates emission of major air pollutants – NOx, hydrocarbons, particulate matter and carbon monoxide – from diesel and petrol engines installed in non-road mobile machinery.
EU directives that also contribute indirectly to efforts to minimise air pollution
TDG Directive Directive 2008/68/EC of the European Parliament and of the Council of 24 September 2008 on the inland transport of dangerous goods28
Road transport
Establishes a common regime for all aspects of the inland transport of dangerous goods, by road, rail and inland waterways within the EU (which refers to relevant UNECE agreements: the European Agreement concerning the International Carriage of Dangerous Goods by Road (ADR) and the Regulations concerning the International Carriage of Dangerous Goods by Rail (RID)). Includes requirements for the transport and delivery of petrol as well as technical requirements on e.g. leak protection in these vehicles, and is thus relevant in the context of VOC emission reductions.
25http://eur-lex.europa.eu/LexUriServ/site/en/consleg/1998/L/01998L0070-20031120-en.pdf 26http://eur-lex.europa.eu/LexUriServ/LexUriServ.do?uri=OJ:L:2010:334:0017:0119:en:PDF 27http://ec.europa.eu/enterprise/sectors/mechanical/documents/legislation/emissions-non-road/index_en.htm 28http://eur-lex.europa.eu/legal-content/en/ALL/?uri=CELEX:32008L0068
Evaluation of Directive 1994/63/EC and Directive 2009/126/EC
Final interim: July 2015 26
Abbreviation Instrument Sector Relevance to control of VOC emissions
Energy Taxation Directive
Directive 2003/96/EC restructuring the Community framework for the taxation of energy products and electricity29
Energy Establishes a financial mechanism to promote the use of less polluting fuels and increases incentives to use energy more efficiently. Establishes minimum taxes on motor fuels, heating fuels and electricity, depending on the energy content of the product and the amount of CO2 it emits.
Ecodesign Directive
Directive 2009/125/EC establishing a framework for the setting of ecodesign requirements for energy-related products30
Energy Provides consistent EU-wide rules for improving the environmental performance of energy-related products through ecodesign.
29http://eur-lex.europa.eu/LexUriServ/LexUriServ.do?uri=OJ:L:2003:283:0051:0070:EN:PDF 30http://eur-lex.europa.eu/legal-content/EN/ALL/?uri=CELEX:32009L0125
Evaluation of Directive 1994/63/EC and Directive 2009/126/EC
Final interim: July 2015 27
Table 2.1 shows that there is an extensive set of EU legislation in place to address VOC emissions originating from different sources, all of which will influence, to varying degrees, VOC emission trends across the EU. The individual and combined effect of the above instruments on the evolution of VOC emissions is assessed in the following section. In particular, it is relevant to understand the share of total VOC emissions that the PVR Directives cover compared to emissions covered by other regulatory instruments. In doing this analysis it is key to identify those instruments with direct linkages to the petrol storage and distribution sector, and therefore with high influence on the evolution of its emissions.
In the context of the VOC-I and VOC-II directives, the key instruments with direct linkages include:
� The NECD (and proposed revision), since reduced VOC emissions from petrol storage and distribution contribute to meeting these targets. The Gothenburg Protocol, which was recently amended in 2012, is also relevant in this context.
� The AQD, which is of particular relevance in terms of the targets for benzene and ground-level ozone, both of which are affected by emissions from petrol.
� The FQD, as this includes requirements on VOC content (e.g. benzene) and petrol vapour pressure (RVP), which is a key determinant in the extent of emissions from petrol storage and distribution. The possibility to grant derogations to allow higher vapour pressure fuel (in member states with low ambient temperature and where bioethanol is used) also affects the degree of VOC emissions from petrol.
� The IED is relevant in the context of application of BAT to the petrol sector through the relevant BREF documents, notably on refineries and storage.
� The TDG Directive concerning the inland transport of dangerous goods is also relevant. This includes requirements on the delivery of petrol and technical requirements (e.g. leak protection in vehicles), and is thus relevant in the context of VOC-I.
2.2 Analysis of total amount and general trends of VOC emissions across different sectors
2.2.1 Data sources on VOC emissions
The main data source used to present information on VOC emissions has been the official inventories produced by Member States and submitted to the EEA in the context of the LRTAP convention. These are reported according to the Nomenclature For Reporting (NFR) 09 format31. This format classifies and splits VOC emissions into more than 120 different activities.
Within this breakdown, the sector “Distribution of oil products” corresponds to the closest match to emissions from petrol storage and distribution. Given that this is the closest approach to an official estimation of the VOC emissions that are relevant for the VOC-I and II Directives, it has been taken as the primary literature source for the current study (to complement the specific modelling undertaken in Section 2.2.4). However, it has limitations in that different methodologies can be applied by Member States to estimate these emissions, and it is also thought that there are differences amongst Member States in the allocation of emissions to different categories used in each national inventory. Emissions from “Storage and handling of petroleum products 31 EEA (2014) National emissions to LRTAP Convention - NFR09 sector classification. Available on: http://www.eea.europa.eu/data-and-maps/data/national-emissions-reported-to-the-convention-on-long-range-transboundary-air-pollution-lrtap-convention-8[Accessed 12/01/2015]
Evaluation of Directive 1994/63/EC and Directive 2009/126/EC
Final interim: July 2015 28
in refineries” are part of the “Refining/storage” sector according to the EMEP/EEA air pollutant emission inventory guidebook and are not part of the “Distribution of oil products” sector, which may lead to an underestimation of the emissions of this sector.
In order to obtain a more accurate estimation of the emissions from the sources controlled by the VOC-I and VOC-II Directives, a model developed by Amec Foster Wheeler (then Entec) was used32. The main inputs to this model are:
� Petrol sales in the EU Member States (see Appendix H).
� Averaged national temperatures (summer and winter) as these influence VOC emissions.
� Vapour pressure of petrol sold (at different times of year).
� Service station numbers in different throughput bands in each Member State.
� Data obtained in the consultation conducted during this study (as described in the methodology (Section 3).
� Various other data, mainly in the public domain.
Emissions are calculated using the approaches set out in the EMEP/EEA emission inventory guidebook33, tier 2 methods. The model takes into account the waivers set out in Directive 98/70/EC34on Fuel Quality with regard to the use of petrol blended with bioethanol and with regard to low ambient temperature. The use of this model aims to provide a more consistent and comparable estimation of emissions arising from the distribution and storage of petrol.
Finally, data from the Greenhouse Gas - Air Pollution Interactions and Synergies (GAINS) model (IIASA) was used for comparison purposes35. The GAINS model is an assessment model that integrates abatement costs, air pollution control, greenhouse gases (GHG) mitigation and policy interaction. The model was developed from RAINS, also developed by IIASA. GAINS includes several scenarios with different inputs and assumptions which can be used to obtain historical data and future emissions/cost projections. The data related to VOC emissions and technologies is based on data from the industry as well as on the methodology explained in their interim report “Estimating Costs for Controlling Emissions of Volatile Organic Compounds (VOC) from Stationary Sources in Europe” (Klimont et al., 2000). The scenario used to obtain comparable data is the PRIMES 2013 REF-CLE scenario. This is the 'Current legislation' reference Scenario described in the TSAP Report No. 11 prepared by IIASA (2014). It is based on the PRIMES 2013 Reference Scenario and assumes full and timely implementation of current legislation (for 2025 and 2030 with the most cost-effective abatement techniques of those currently available). It should be noted that GAINS historical data on emissions, abatement costs, abatement efficiency and activity data36 are only available from 2000 onwards (except data on petrol consumption, which is available from 1990).
32 Evaluations of Member State requests for exemptions from the vapour pressure requirements for petrol pursuant to Article 3(4) and 3(5) of Directive 98/70/EC relating to the quality of petrol and diesel fuels. 33http://www.eea.europa.eu/publications/emep-eea-guidebook-2013 34http://eur-lex.europa.eu/LexUriServ/site/en/consleg/1998/L/01998L0070-20031120-en.pdf 35 GAINS may only be used for comparison purposes and not as the main source of any modelling according to IIASA’s terms of use. 36 The term activity data refers to the magnitude of human activities that result in emissions. It is measured in terms of fuel consumed by the activity in question or in terms of output (e.g. products manufactured).
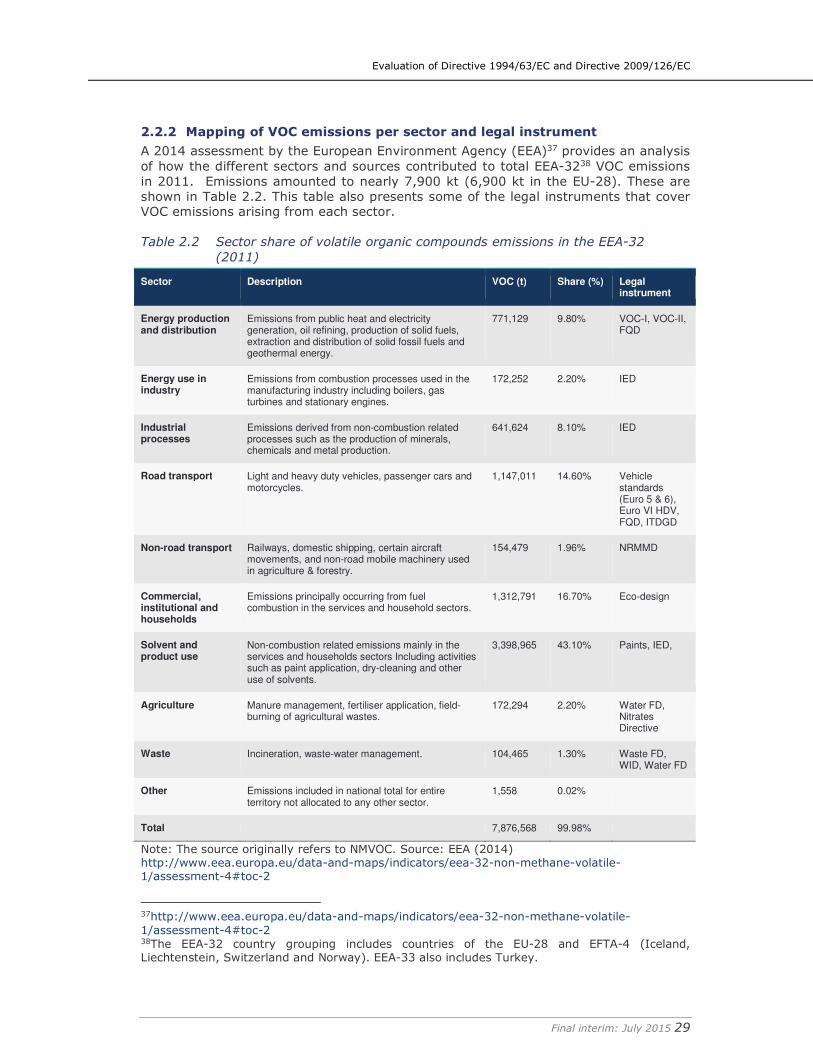
Evaluation of Directive 1994/63/EC and Directive 2009/126/EC
Final interim: July 2015 29
2.2.2 Mapping of VOC emissions per sector and legal instrument
A 2014 assessment by the European Environment Agency (EEA)37 provides an analysis of how the different sectors and sources contributed to total EEA-3238 VOC emissions in 2011. Emissions amounted to nearly 7,900 kt (6,900 kt in the EU-28). These are shown in Table 2.2. This table also presents some of the legal instruments that cover VOC emissions arising from each sector.
Table 2.2 Sector share of volatile organic compounds emissions in the EEA-32
(2011)
Sector Description VOC (t) Share (%) Legal instrument
Energy production and distribution
Emissions from public heat and electricity generation, oil refining, production of solid fuels, extraction and distribution of solid fossil fuels and geothermal energy.
771,129 9.80% VOC-I, VOC-II, FQD
Energy use in industry
Emissions from combustion processes used in the manufacturing industry including boilers, gas turbines and stationary engines.
172,252 2.20% IED
Industrial processes
Emissions derived from non-combustion related processes such as the production of minerals, chemicals and metal production.
641,624 8.10% IED
Road transport Light and heavy duty vehicles, passenger cars and motorcycles.
1,147,011 14.60% Vehicle standards (Euro 5 & 6), Euro VI HDV, FQD, ITDGD
Non-road transport Railways, domestic shipping, certain aircraft movements, and non-road mobile machinery used in agriculture & forestry.
154,479 1.96% NRMMD
Commercial, institutional and households
Emissions principally occurring from fuel combustion in the services and household sectors.
1,312,791 16.70% Eco-design
Solvent and product use
Non-combustion related emissions mainly in the services and households sectors Including activities such as paint application, dry-cleaning and other use of solvents.
3,398,965 43.10% Paints, IED,
Agriculture Manure management, fertiliser application, field-burning of agricultural wastes.
172,294 2.20% Water FD, Nitrates Directive
Waste Incineration, waste-water management. 104,465 1.30% Waste FD, WID, Water FD
Other Emissions included in national total for entire territory not allocated to any other sector.
1,558 0.02%
Total 7,876,568 99.98%
Note: The source originally refers to NMVOC. Source: EEA (2014) http://www.eea.europa.eu/data-and-maps/indicators/eea-32-non-methane-volatile-1/assessment-4#toc-2
37http://www.eea.europa.eu/data-and-maps/indicators/eea-32-non-methane-volatile-1/assessment-4#toc-2
38The EEA-32 country grouping includes countries of the EU-28 and EFTA-4 (Iceland, Liechtenstein, Switzerland and Norway). EEA-33 also includes Turkey.
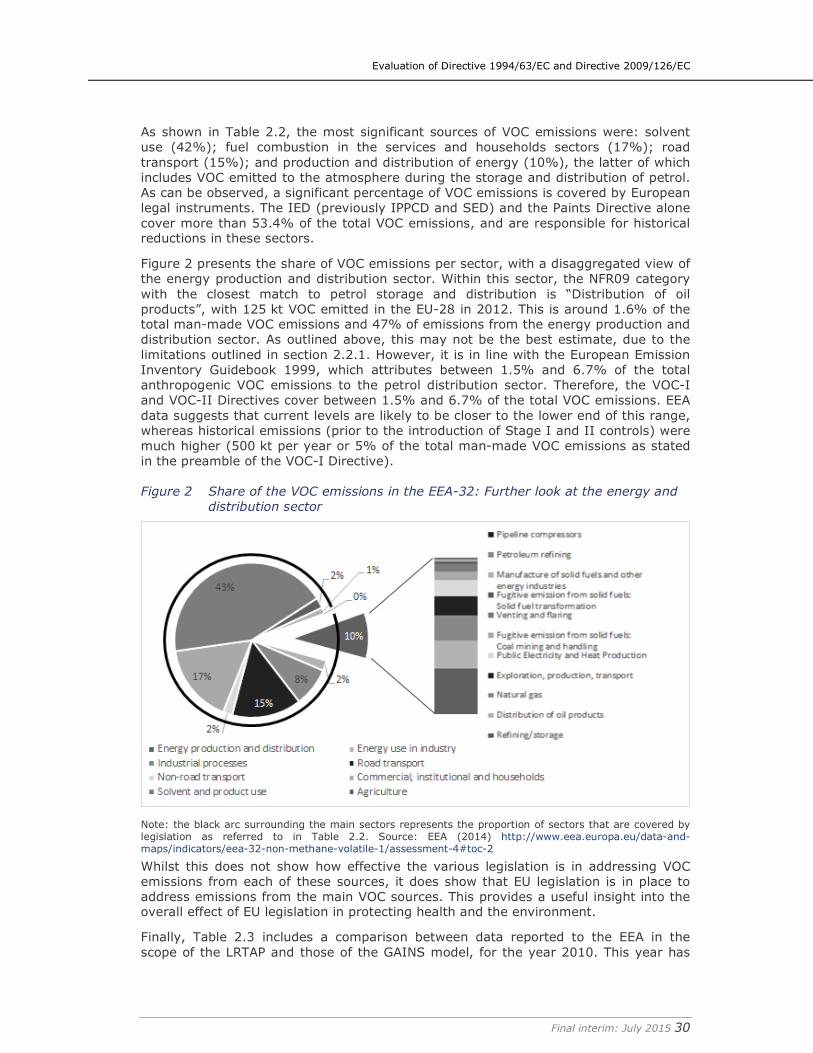
Evaluation of Directive 1994/63/EC and Directive 2009/126/EC
Final interim: July 2015 30
As shown in Table 2.2, the most significant sources of VOC emissions were: solvent use (42%); fuel combustion in the services and households sectors (17%); road transport (15%); and production and distribution of energy (10%), the latter of which includes VOC emitted to the atmosphere during the storage and distribution of petrol. As can be observed, a significant percentage of VOC emissions is covered by European legal instruments. The IED (previously IPPCD and SED) and the Paints Directive alone cover more than 53.4% of the total VOC emissions, and are responsible for historical reductions in these sectors.
Figure 2 presents the share of VOC emissions per sector, with a disaggregated view of the energy production and distribution sector. Within this sector, the NFR09 category with the closest match to petrol storage and distribution is “Distribution of oil products”, with 125 kt VOC emitted in the EU-28 in 2012. This is around 1.6% of the total man-made VOC emissions and 47% of emissions from the energy production and distribution sector. As outlined above, this may not be the best estimate, due to the limitations outlined in section 2.2.1. However, it is in line with the European Emission Inventory Guidebook 1999, which attributes between 1.5% and 6.7% of the total anthropogenic VOC emissions to the petrol distribution sector. Therefore, the VOC-I and VOC-II Directives cover between 1.5% and 6.7% of the total VOC emissions. EEA data suggests that current levels are likely to be closer to the lower end of this range, whereas historical emissions (prior to the introduction of Stage I and II controls) were much higher (500 kt per year or 5% of the total man-made VOC emissions as stated in the preamble of the VOC-I Directive).
Figure 2 Share of the VOC emissions in the EEA-32: Further look at the energy and
distribution sector
Note: the black arc surrounding the main sectors represents the proportion of sectors that are covered by legislation as referred to in Table 2.2. Source: EEA (2014) http://www.eea.europa.eu/data-and-maps/indicators/eea-32-non-methane-volatile-1/assessment-4#toc-2
Whilst this does not show how effective the various legislation is in addressing VOC emissions from each of these sources, it does show that EU legislation is in place to address emissions from the main VOC sources. This provides a useful insight into the overall effect of EU legislation in protecting health and the environment.
Finally, Table 2.3 includes a comparison between data reported to the EEA in the scope of the LRTAP and those of the GAINS model, for the year 2010. This year has
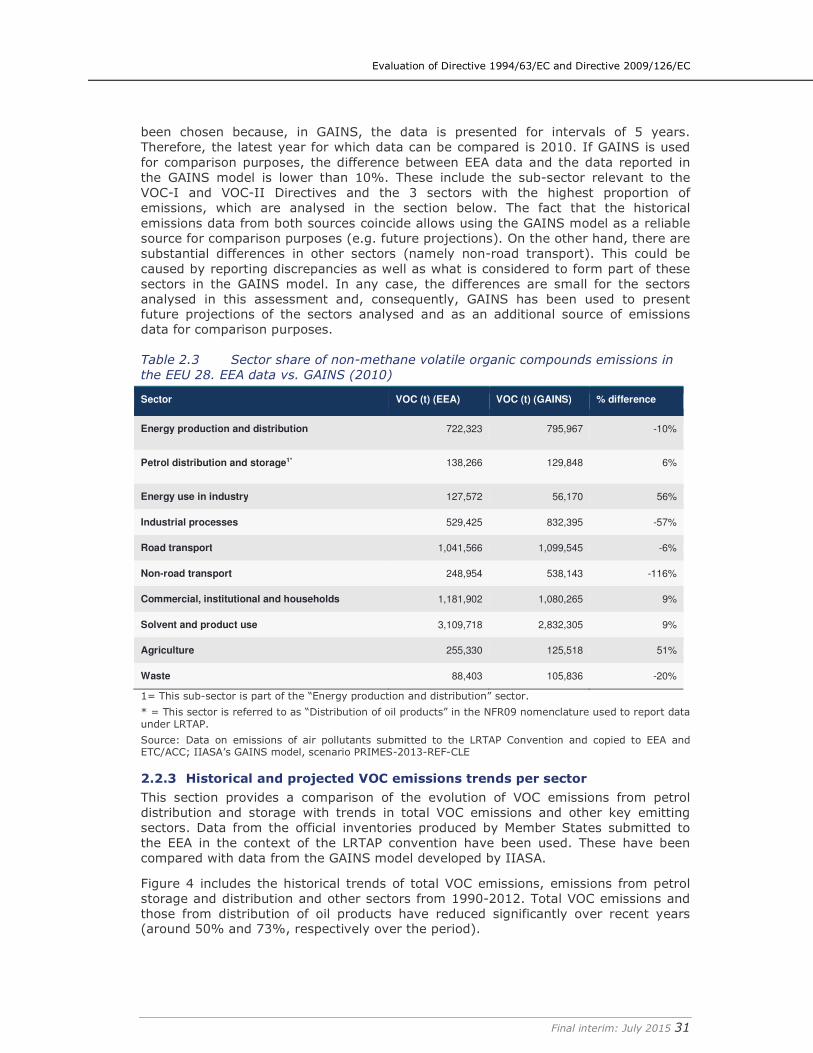
Evaluation of Directive 1994/63/EC and Directive 2009/126/EC
Final interim: July 2015 31
been chosen because, in GAINS, the data is presented for intervals of 5 years. Therefore, the latest year for which data can be compared is 2010. If GAINS is used for comparison purposes, the difference between EEA data and the data reported in the GAINS model is lower than 10%. These include the sub-sector relevant to the VOC-I and VOC-II Directives and the 3 sectors with the highest proportion of emissions, which are analysed in the section below. The fact that the historical emissions data from both sources coincide allows using the GAINS model as a reliable source for comparison purposes (e.g. future projections). On the other hand, there are substantial differences in other sectors (namely non-road transport). This could be caused by reporting discrepancies as well as what is considered to form part of these sectors in the GAINS model. In any case, the differences are small for the sectors analysed in this assessment and, consequently, GAINS has been used to present future projections of the sectors analysed and as an additional source of emissions data for comparison purposes.
Table 2.3 Sector share of non-methane volatile organic compounds emissions in
the EEU 28. EEA data vs. GAINS (2010)
Sector VOC (t) (EEA) VOC (t) (GAINS) % difference
Energy production and distribution 722,323 795,967 -10%
Petrol distribution and storage1* 138,266 129,848 6%
Energy use in industry 127,572 56,170 56%
Industrial processes 529,425 832,395 -57%
Road transport 1,041,566 1,099,545 -6%
Non-road transport 248,954 538,143 -116%
Commercial, institutional and households 1,181,902 1,080,265 9%
Solvent and product use 3,109,718 2,832,305 9%
Agriculture 255,330 125,518 51%
Waste 88,403 105,836 -20%
1= This sub-sector is part of the “Energy production and distribution” sector.
* = This sector is referred to as “Distribution of oil products” in the NFR09 nomenclature used to report data under LRTAP.
Source: Data on emissions of air pollutants submitted to the LRTAP Convention and copied to EEA and ETC/ACC; IIASA’s GAINS model, scenario PRIMES-2013-REF-CLE
2.2.3 Historical and projected VOC emissions trends per sector
This section provides a comparison of the evolution of VOC emissions from petrol distribution and storage with trends in total VOC emissions and other key emitting sectors. Data from the official inventories produced by Member States submitted to the EEA in the context of the LRTAP convention have been used. These have been compared with data from the GAINS model developed by IIASA.
Figure 4 includes the historical trends of total VOC emissions, emissions from petrol storage and distribution and other sectors from 1990-2012. Total VOC emissions and those from distribution of oil products have reduced significantly over recent years (around 50% and 73%, respectively over the period).
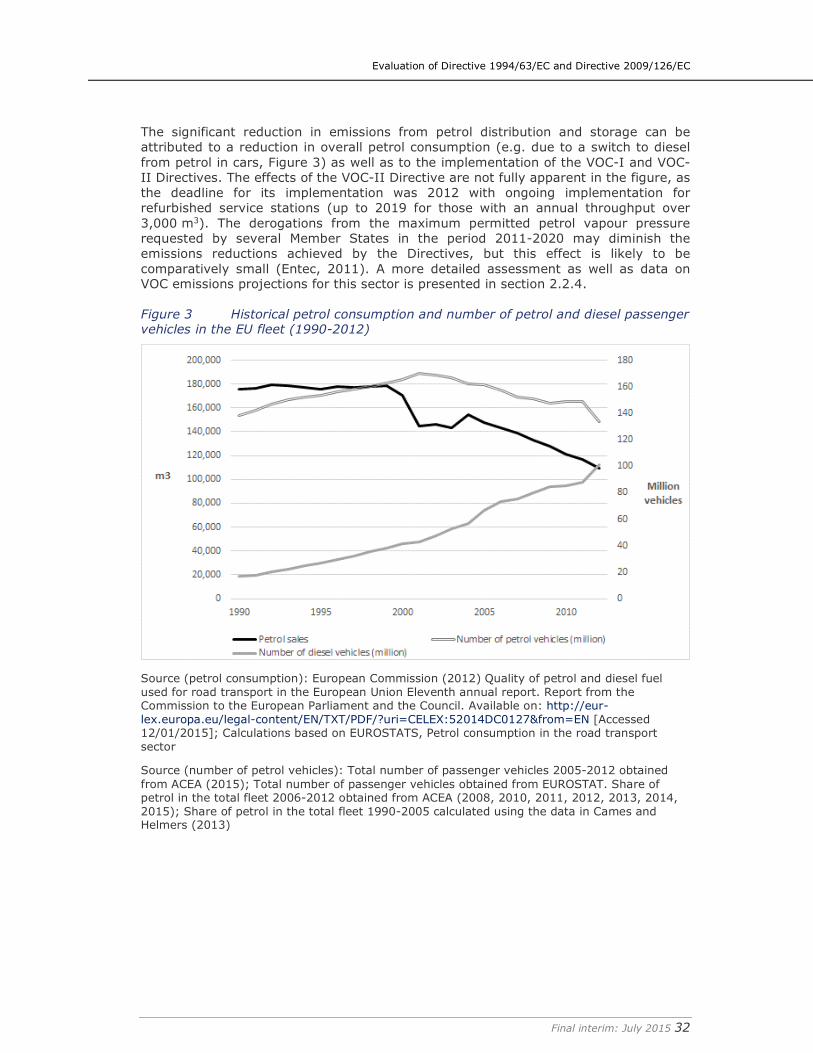
Evaluation of Directive 1994/63/EC and Directive 2009/126/EC
Final interim: July 2015 32
The significant reduction in emissions from petrol distribution and storage can be attributed to a reduction in overall petrol consumption (e.g. due to a switch to diesel from petrol in cars, Figure 3) as well as to the implementation of the VOC-I and VOC-II Directives. The effects of the VOC-II Directive are not fully apparent in the figure, as the deadline for its implementation was 2012 with ongoing implementation for refurbished service stations (up to 2019 for those with an annual throughput over 3,000 m3). The derogations from the maximum permitted petrol vapour pressure requested by several Member States in the period 2011-2020 may diminish the emissions reductions achieved by the Directives, but this effect is likely to be comparatively small (Entec, 2011). A more detailed assessment as well as data on VOC emissions projections for this sector is presented in section 2.2.4.
Figure 3 Historical petrol consumption and number of petrol and diesel passenger vehicles in the EU fleet (1990-2012)
Source (petrol consumption): European Commission (2012) Quality of petrol and diesel fuel used for road transport in the European Union Eleventh annual report. Report from the Commission to the European Parliament and the Council. Available on: http://eur-lex.europa.eu/legal-content/EN/TXT/PDF/?uri=CELEX:52014DC0127&from=EN [Accessed 12/01/2015]; Calculations based on EUROSTATS, Petrol consumption in the road transport sector
Source (number of petrol vehicles): Total number of passenger vehicles 2005-2012 obtained from ACEA (2015); Total number of passenger vehicles obtained from EUROSTAT. Share of petrol in the total fleet 2006-2012 obtained from ACEA (2008, 2010, 2011, 2012, 2013, 2014, 2015); Share of petrol in the total fleet 1990-2005 calculated using the data in Cames and Helmers (2013)
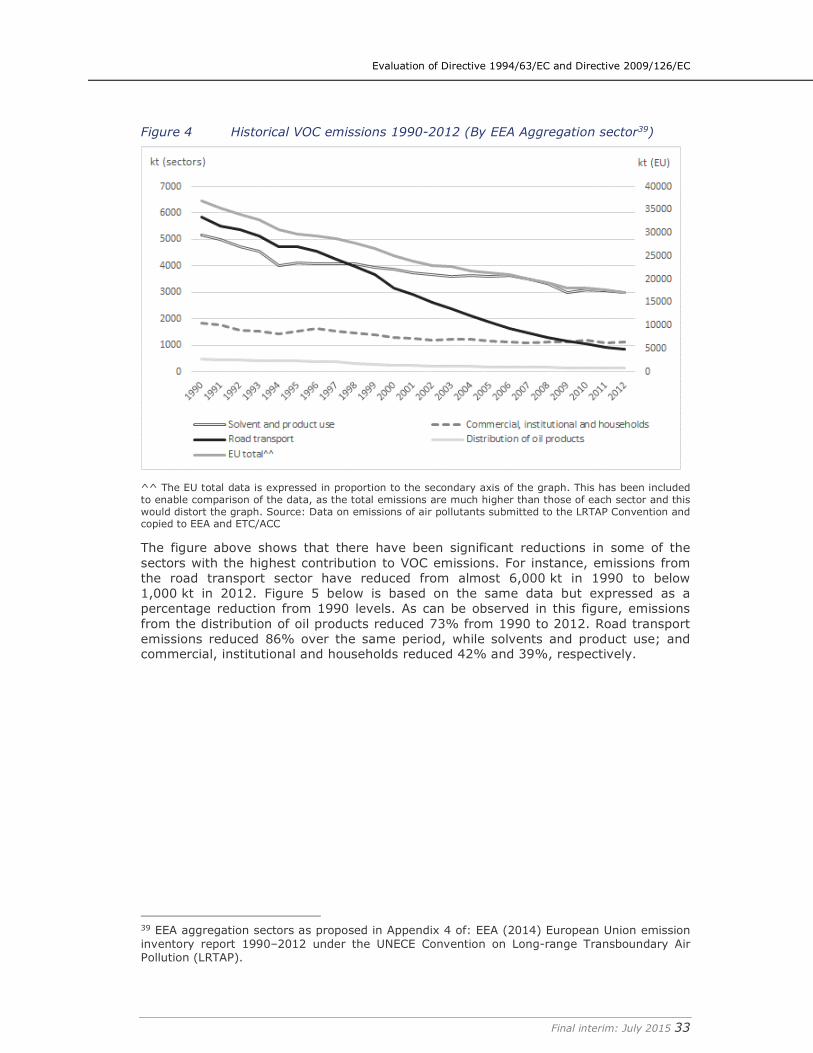
Evaluation of Directive 1994/63/EC and Directive 2009/126/EC
Final interim: July 2015 33
Figure 4 Historical VOC emissions 1990-2012 (By EEA Aggregation sector39)
^^ The EU total data is expressed in proportion to the secondary axis of the graph. This has been included to enable comparison of the data, as the total emissions are much higher than those of each sector and this would distort the graph. Source: Data on emissions of air pollutants submitted to the LRTAP Convention and copied to EEA and ETC/ACC
The figure above shows that there have been significant reductions in some of the sectors with the highest contribution to VOC emissions. For instance, emissions from the road transport sector have reduced from almost 6,000 kt in 1990 to below 1,000 kt in 2012. Figure 5 below is based on the same data but expressed as a percentage reduction from 1990 levels. As can be observed in this figure, emissions from the distribution of oil products reduced 73% from 1990 to 2012. Road transport emissions reduced 86% over the same period, while solvents and product use; and commercial, institutional and households reduced 42% and 39%, respectively.
39 EEA aggregation sectors as proposed in Appendix 4 of: EEA (2014) European Union emission inventory report 1990–2012 under the UNECE Convention on Long-range Transboundary Air Pollution (LRTAP).
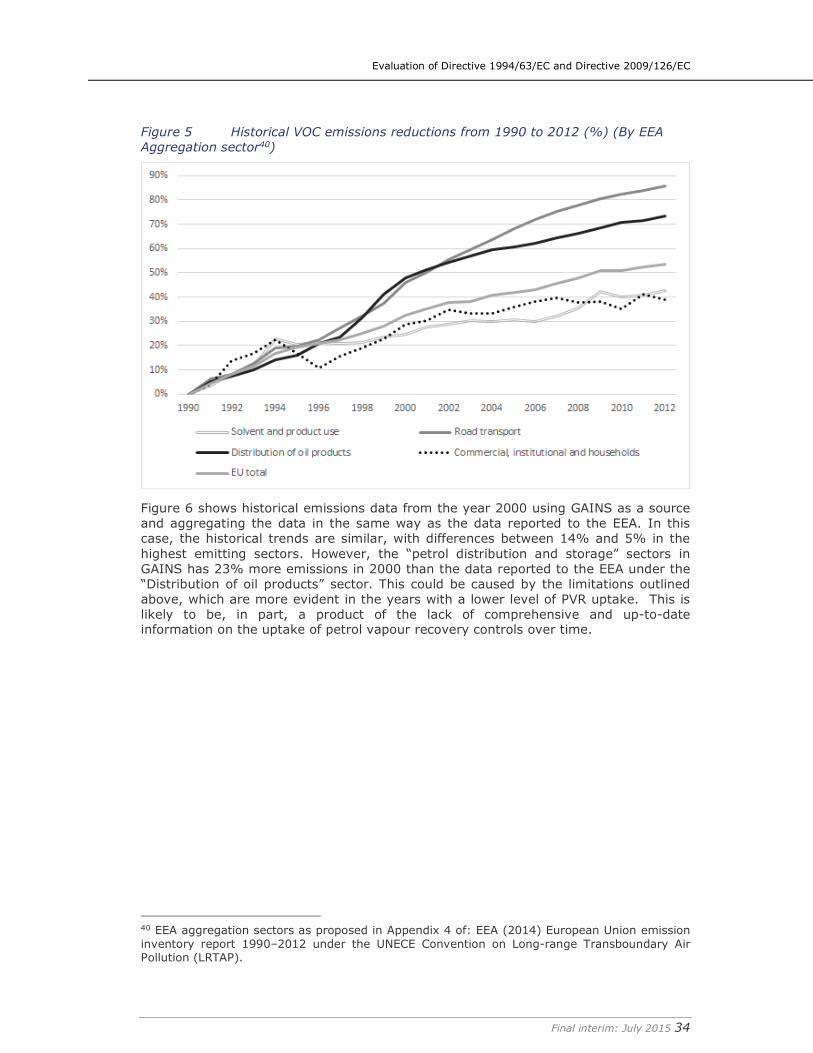
Evaluation of Directive 1994/63/EC and Directive 2009/126/EC
Final interim: July 2015 34
Figure 5 Historical VOC emissions reductions from 1990 to 2012 (%) (By EEA
Aggregation sector40)
Figure 6 shows historical emissions data from the year 2000 using GAINS as a source and aggregating the data in the same way as the data reported to the EEA. In this case, the historical trends are similar, with differences between 14% and 5% in the highest emitting sectors. However, the “petrol distribution and storage” sectors in GAINS has 23% more emissions in 2000 than the data reported to the EEA under the “Distribution of oil products” sector. This could be caused by the limitations outlined above, which are more evident in the years with a lower level of PVR uptake. This is likely to be, in part, a product of the lack of comprehensive and up-to-date information on the uptake of petrol vapour recovery controls over time.
40 EEA aggregation sectors as proposed in Appendix 4 of: EEA (2014) European Union emission inventory report 1990–2012 under the UNECE Convention on Long-range Transboundary Air Pollution (LRTAP).
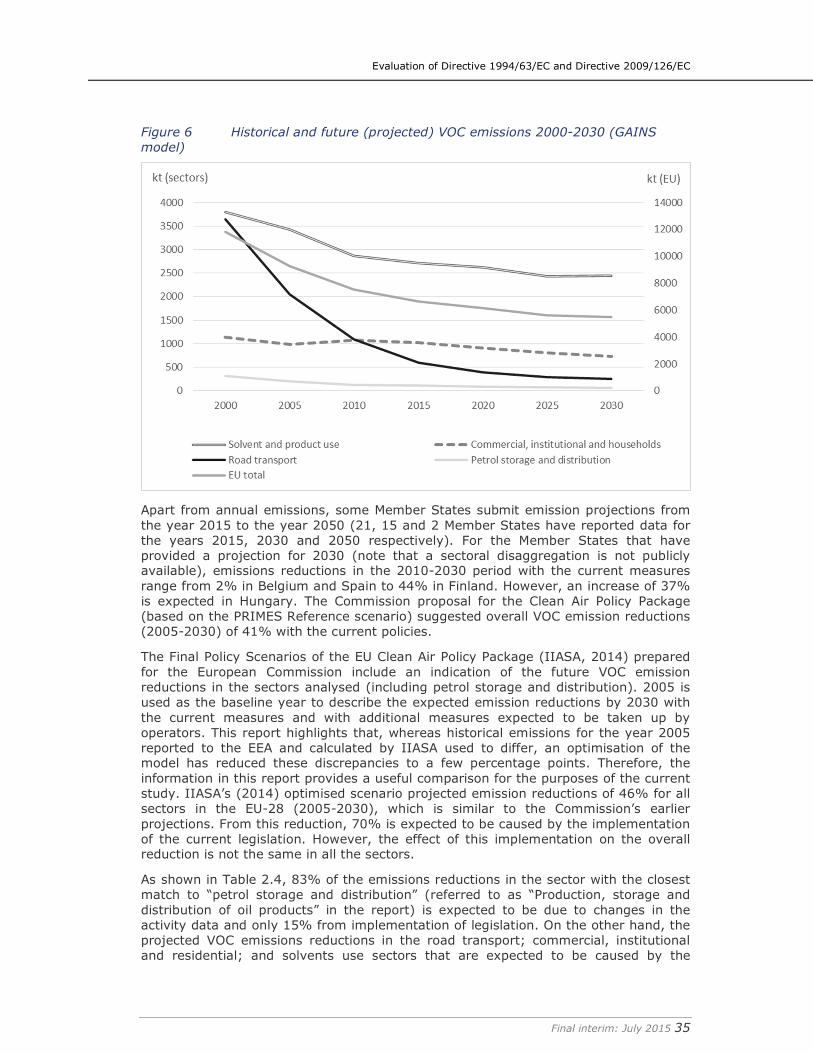
Evaluation of Directive 1994/63/EC and Directive 2009/126/EC
Final interim: July 2015 35
Figure 6 Historical and future (projected) VOC emissions 2000-2030 (GAINS
model)
Apart from annual emissions, some Member States submit emission projections from the year 2015 to the year 2050 (21, 15 and 2 Member States have reported data for the years 2015, 2030 and 2050 respectively). For the Member States that have provided a projection for 2030 (note that a sectoral disaggregation is not publicly available), emissions reductions in the 2010-2030 period with the current measures range from 2% in Belgium and Spain to 44% in Finland. However, an increase of 37% is expected in Hungary. The Commission proposal for the Clean Air Policy Package (based on the PRIMES Reference scenario) suggested overall VOC emission reductions (2005-2030) of 41% with the current policies.
The Final Policy Scenarios of the EU Clean Air Policy Package (IIASA, 2014) prepared for the European Commission include an indication of the future VOC emission reductions in the sectors analysed (including petrol storage and distribution). 2005 is used as the baseline year to describe the expected emission reductions by 2030 with the current measures and with additional measures expected to be taken up by operators. This report highlights that, whereas historical emissions for the year 2005 reported to the EEA and calculated by IIASA used to differ, an optimisation of the model has reduced these discrepancies to a few percentage points. Therefore, the information in this report provides a useful comparison for the purposes of the current study. IIASA’s (2014) optimised scenario projected emission reductions of 46% for all sectors in the EU-28 (2005-2030), which is similar to the Commission’s earlier projections. From this reduction, 70% is expected to be caused by the implementation of the current legislation. However, the effect of this implementation on the overall reduction is not the same in all the sectors.
As shown in Table 2.4, 83% of the emissions reductions in the sector with the closest match to “petrol storage and distribution” (referred to as “Production, storage and distribution of oil products” in the report) is expected to be due to changes in the activity data and only 15% from implementation of legislation. On the other hand, the projected VOC emissions reductions in the road transport; commercial, institutional and residential; and solvents use sectors that are expected to be caused by the
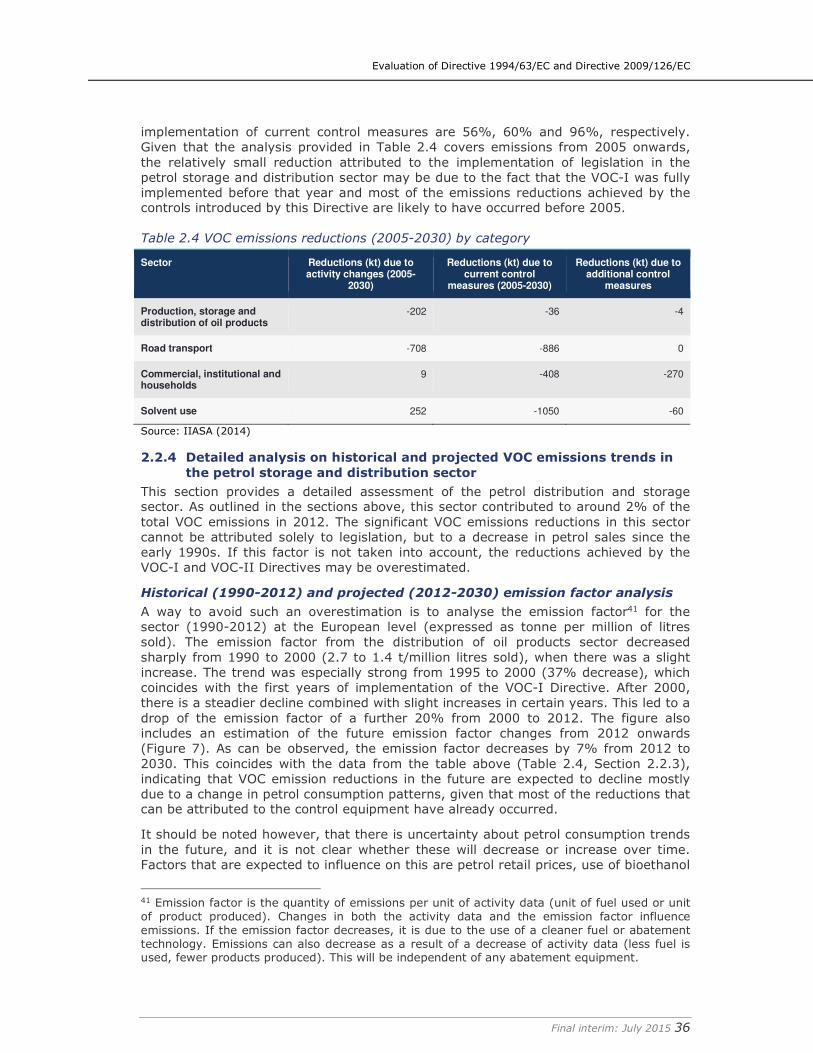
Evaluation of Directive 1994/63/EC and Directive 2009/126/EC
Final interim: July 2015 36
implementation of current control measures are 56%, 60% and 96%, respectively. Given that the analysis provided in Table 2.4 covers emissions from 2005 onwards, the relatively small reduction attributed to the implementation of legislation in the petrol storage and distribution sector may be due to the fact that the VOC-I was fully implemented before that year and most of the emissions reductions achieved by the controls introduced by this Directive are likely to have occurred before 2005.
Table 2.4 VOC emissions reductions (2005-2030) by category
Sector Reductions (kt) due to activity changes (2005-
2030)
Reductions (kt) due to current control
measures (2005-2030)
Reductions (kt) due to additional control
measures
Production, storage and distribution of oil products
-202 -36 -4
Road transport -708 -886 0
Commercial, institutional and households
9 -408 -270
Solvent use 252 -1050 -60
Source: IIASA (2014)
2.2.4 Detailed analysis on historical and projected VOC emissions trends in
the petrol storage and distribution sector
This section provides a detailed assessment of the petrol distribution and storage sector. As outlined in the sections above, this sector contributed to around 2% of the total VOC emissions in 2012. The significant VOC emissions reductions in this sector cannot be attributed solely to legislation, but to a decrease in petrol sales since the early 1990s. If this factor is not taken into account, the reductions achieved by the VOC-I and VOC-II Directives may be overestimated.
Historical (1990-2012) and projected (2012-2030) emission factor analysis
A way to avoid such an overestimation is to analyse the emission factor41 for the sector (1990-2012) at the European level (expressed as tonne per million of litres sold). The emission factor from the distribution of oil products sector decreased sharply from 1990 to 2000 (2.7 to 1.4 t/million litres sold), when there was a slight increase. The trend was especially strong from 1995 to 2000 (37% decrease), which coincides with the first years of implementation of the VOC-I Directive. After 2000, there is a steadier decline combined with slight increases in certain years. This led to a drop of the emission factor of a further 20% from 2000 to 2012. The figure also includes an estimation of the future emission factor changes from 2012 onwards (Figure 7). As can be observed, the emission factor decreases by 7% from 2012 to 2030. This coincides with the data from the table above (Table 2.4, Section 2.2.3), indicating that VOC emission reductions in the future are expected to decline mostly due to a change in petrol consumption patterns, given that most of the reductions that can be attributed to the control equipment have already occurred.
It should be noted however, that there is uncertainty about petrol consumption trends in the future, and it is not clear whether these will decrease or increase over time. Factors that are expected to influence on this are petrol retail prices, use of bioethanol
41 Emission factor is the quantity of emissions per unit of activity data (unit of fuel used or unit of product produced). Changes in both the activity data and the emission factor influence emissions. If the emission factor decreases, it is due to the use of a cleaner fuel or abatement technology. Emissions can also decrease as a result of a decrease of activity data (less fuel is used, fewer products produced). This will be independent of any abatement equipment.
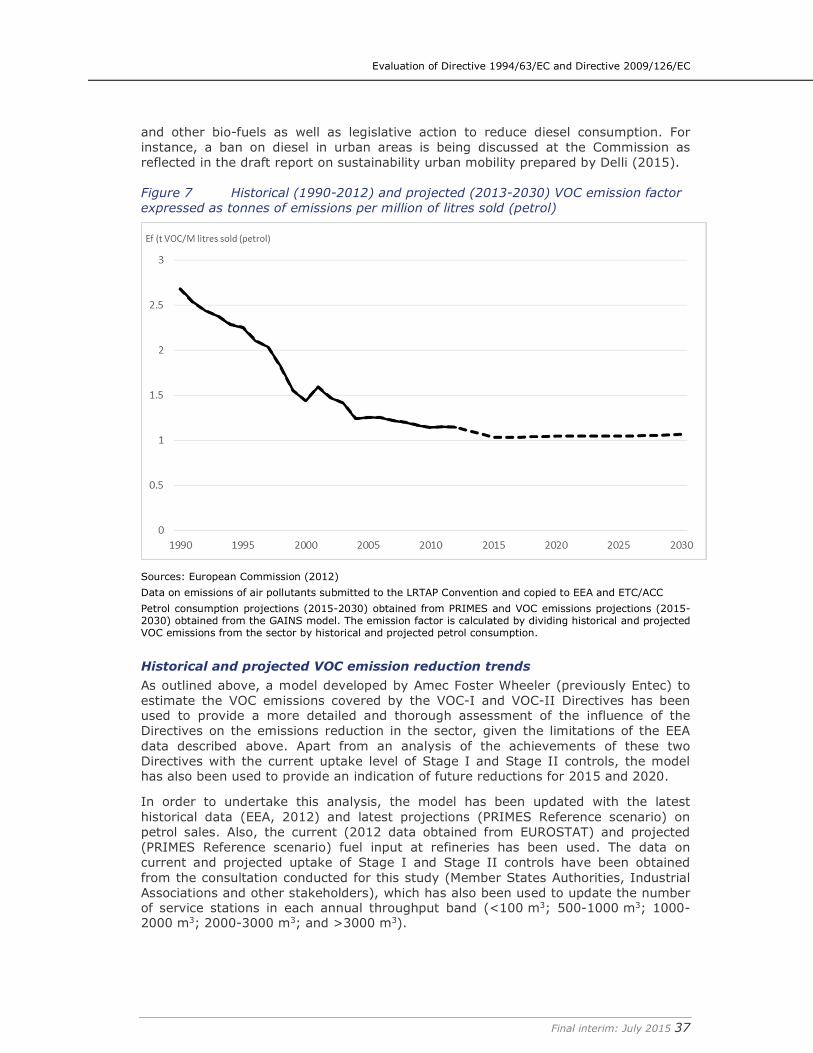
Evaluation of Directive 1994/63/EC and Directive 2009/126/EC
Final interim: July 2015 37
and other bio-fuels as well as legislative action to reduce diesel consumption. For instance, a ban on diesel in urban areas is being discussed at the Commission as reflected in the draft report on sustainability urban mobility prepared by Delli (2015).
Figure 7 Historical (1990-2012) and projected (2013-2030) VOC emission factor
expressed as tonnes of emissions per million of litres sold (petrol)
Sources: European Commission (2012)
Data on emissions of air pollutants submitted to the LRTAP Convention and copied to EEA and ETC/ACC Petrol consumption projections (2015-2030) obtained from PRIMES and VOC emissions projections (2015-2030) obtained from the GAINS model. The emission factor is calculated by dividing historical and projected VOC emissions from the sector by historical and projected petrol consumption.
Historical and projected VOC emission reduction trends
As outlined above, a model developed by Amec Foster Wheeler (previously Entec) to estimate the VOC emissions covered by the VOC-I and VOC-II Directives has been used to provide a more detailed and thorough assessment of the influence of the Directives on the emissions reduction in the sector, given the limitations of the EEA data described above. Apart from an analysis of the achievements of these two Directives with the current uptake level of Stage I and Stage II controls, the model has also been used to provide an indication of future reductions for 2015 and 2020.
In order to undertake this analysis, the model has been updated with the latest historical data (EEA, 2012) and latest projections (PRIMES Reference scenario) on petrol sales. Also, the current (2012 data obtained from EUROSTAT) and projected (PRIMES Reference scenario) fuel input at refineries has been used. The data on current and projected uptake of Stage I and Stage II controls have been obtained from the consultation conducted for this study (Member States Authorities, Industrial Associations and other stakeholders), which has also been used to update the number of service stations in each annual throughput band (<100 m3; 500-1000 m3; 1000-2000 m3; 2000-3000 m3; and >3000 m3).
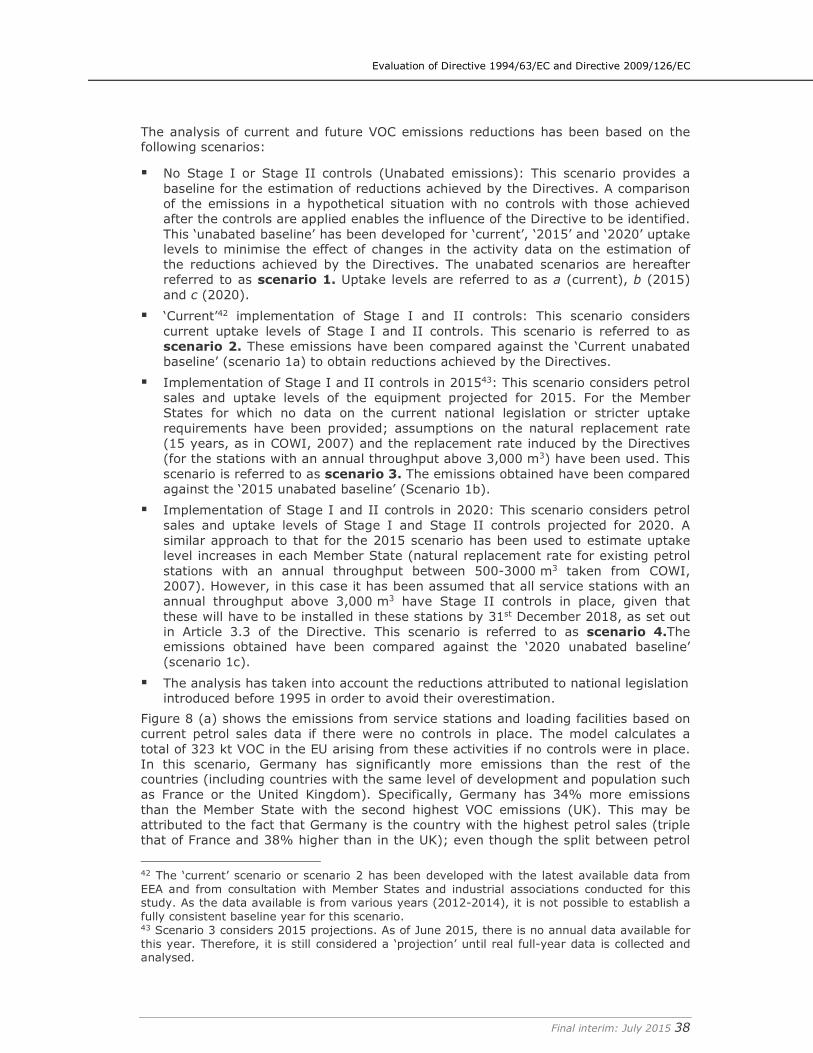
Evaluation of Directive 1994/63/EC and Directive 2009/126/EC
Final interim: July 2015 38
The analysis of current and future VOC emissions reductions has been based on the following scenarios:
� No Stage I or Stage II controls (Unabated emissions): This scenario provides a baseline for the estimation of reductions achieved by the Directives. A comparison of the emissions in a hypothetical situation with no controls with those achieved after the controls are applied enables the influence of the Directive to be identified. This ‘unabated baseline’ has been developed for ‘current’, ‘2015’ and ‘2020’ uptake levels to minimise the effect of changes in the activity data on the estimation of the reductions achieved by the Directives. The unabated scenarios are hereafter referred to as scenario 1. Uptake levels are referred to as a (current), b (2015) and c (2020).
� ‘Current’42 implementation of Stage I and II controls: This scenario considers current uptake levels of Stage I and II controls. This scenario is referred to as scenario 2. These emissions have been compared against the ‘Current unabated baseline’ (scenario 1a) to obtain reductions achieved by the Directives.
� Implementation of Stage I and II controls in 201543: This scenario considers petrol sales and uptake levels of the equipment projected for 2015. For the Member States for which no data on the current national legislation or stricter uptake requirements have been provided; assumptions on the natural replacement rate (15 years, as in COWI, 2007) and the replacement rate induced by the Directives (for the stations with an annual throughput above 3,000 m3) have been used. This scenario is referred to as scenario 3. The emissions obtained have been compared against the ‘2015 unabated baseline’ (Scenario 1b).
� Implementation of Stage I and II controls in 2020: This scenario considers petrol sales and uptake levels of Stage I and Stage II controls projected for 2020. A similar approach to that for the 2015 scenario has been used to estimate uptake level increases in each Member State (natural replacement rate for existing petrol stations with an annual throughput between 500-3000 m3 taken from COWI, 2007). However, in this case it has been assumed that all service stations with an annual throughput above 3,000 m3 have Stage II controls in place, given that these will have to be installed in these stations by 31st December 2018, as set out in Article 3.3 of the Directive. This scenario is referred to as scenario 4.The emissions obtained have been compared against the ‘2020 unabated baseline’ (scenario 1c).
� The analysis has taken into account the reductions attributed to national legislation introduced before 1995 in order to avoid their overestimation.
Figure 8 (a) shows the emissions from service stations and loading facilities based on current petrol sales data if there were no controls in place. The model calculates a total of 323 kt VOC in the EU arising from these activities if no controls were in place. In this scenario, Germany has significantly more emissions than the rest of the countries (including countries with the same level of development and population such as France or the United Kingdom). Specifically, Germany has 34% more emissions than the Member State with the second highest VOC emissions (UK). This may be attributed to the fact that Germany is the country with the highest petrol sales (triple that of France and 38% higher than in the UK); even though the split between petrol
42 The ‘current’ scenario or scenario 2 has been developed with the latest available data from EEA and from consultation with Member States and industrial associations conducted for this study. As the data available is from various years (2012-2014), it is not possible to establish a fully consistent baseline year for this scenario. 43 Scenario 3 considers 2015 projections. As of June 2015, there is no annual data available for this year. Therefore, it is still considered a ‘projection’ until real full-year data is collected and analysed.
Evaluation of Directive 1994/63/EC and Directive 2009/126/EC
Final interim: July 2015 39
and diesel sales is fairly similar to other Member States such as the UK, Finland or Sweden. Germany is also the most populated country in the EU, with 80.5 million people (France has 65.5 million); and the one with the highest number of vehicles.
Current controls (Figure 8 (b)) are estimated to provide a substantial reduction of emissions (approximately 77%, from 323 kt to 73 kt).
Emissions from storage at refineries is 129 kt VOC, making a total of 202 kt VOC attributed to petrol distribution and storage according to the results obtained in the model.
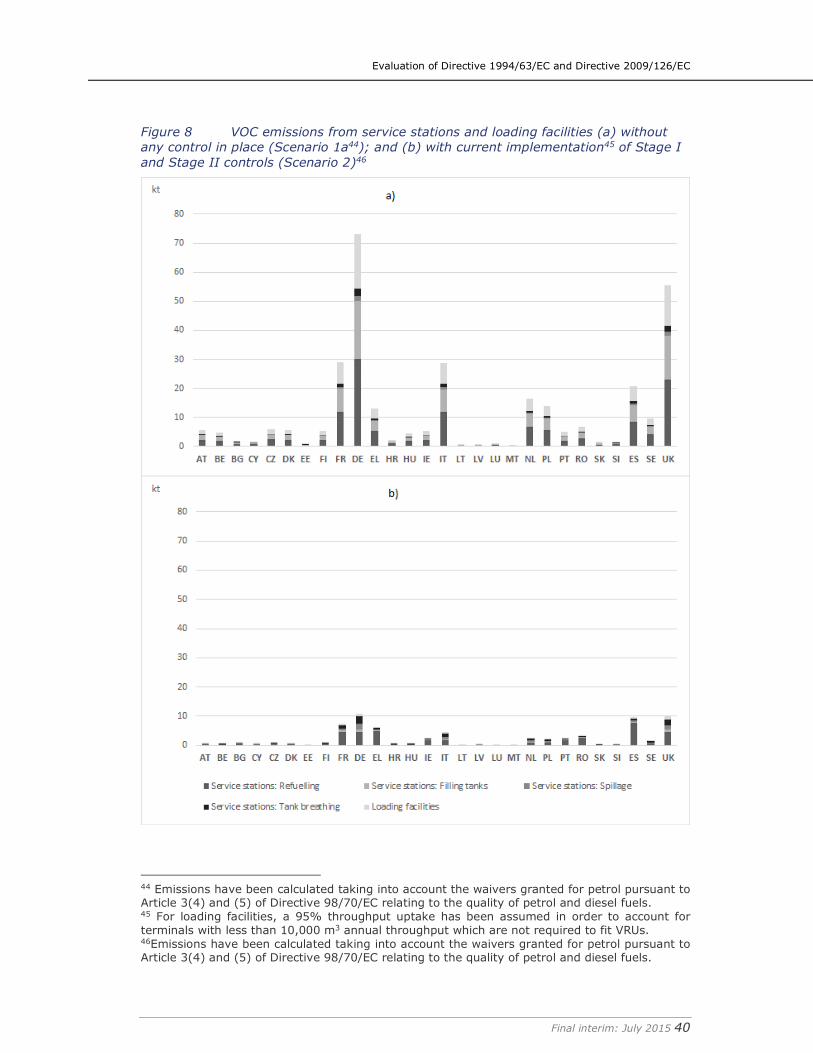
Evaluation of Directive 1994/63/EC and Directive 2009/126/EC
Final interim: July 2015 40
Figure 8 VOC emissions from service stations and loading facilities (a) without
any control in place (Scenario 1a44); and (b) with current implementation45 of Stage I
and Stage II controls (Scenario 2)46
44 Emissions have been calculated taking into account the waivers granted for petrol pursuant to Article 3(4) and (5) of Directive 98/70/EC relating to the quality of petrol and diesel fuels. 45 For loading facilities, a 95% throughput uptake has been assumed in order to account for terminals with less than 10,000 m3 annual throughput which are not required to fit VRUs. 46Emissions have been calculated taking into account the waivers granted for petrol pursuant to Article 3(4) and (5) of Directive 98/70/EC relating to the quality of petrol and diesel fuels.
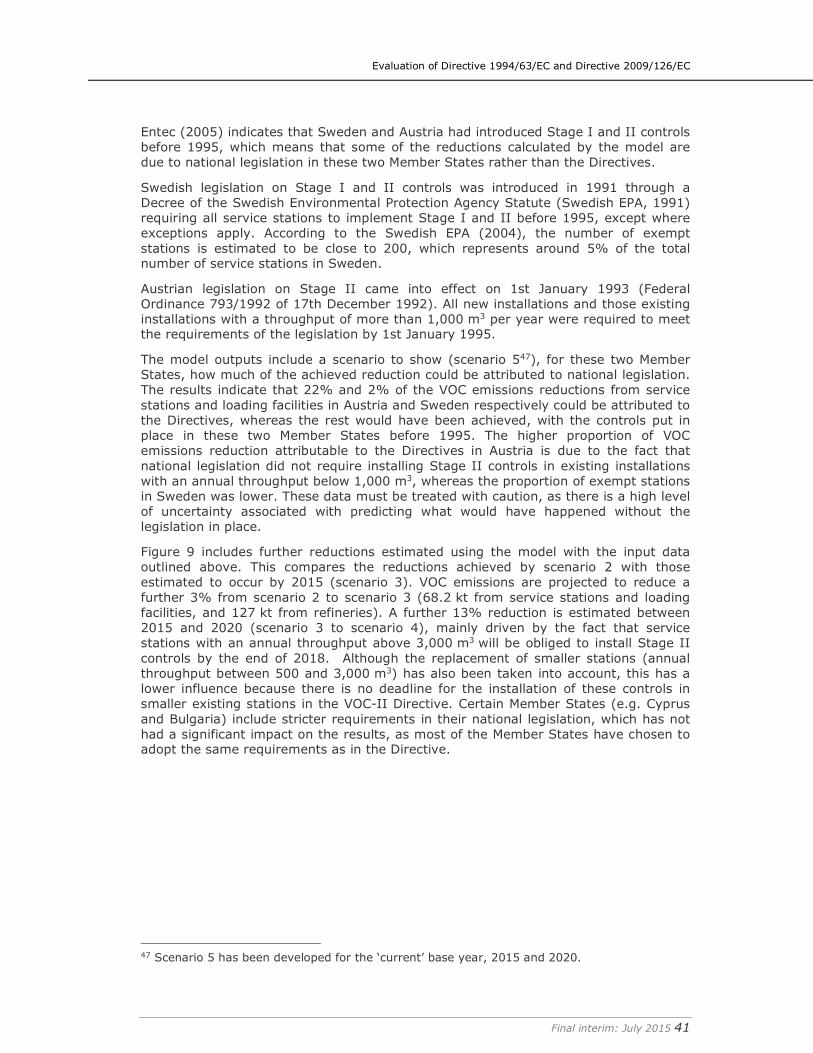
Evaluation of Directive 1994/63/EC and Directive 2009/126/EC
Final interim: July 2015 41
Entec (2005) indicates that Sweden and Austria had introduced Stage I and II controls before 1995, which means that some of the reductions calculated by the model are due to national legislation in these two Member States rather than the Directives.
Swedish legislation on Stage I and II controls was introduced in 1991 through a Decree of the Swedish Environmental Protection Agency Statute (Swedish EPA, 1991) requiring all service stations to implement Stage I and II before 1995, except where exceptions apply. According to the Swedish EPA (2004), the number of exempt stations is estimated to be close to 200, which represents around 5% of the total number of service stations in Sweden.
Austrian legislation on Stage II came into effect on 1st January 1993 (Federal Ordinance 793/1992 of 17th December 1992). All new installations and those existing installations with a throughput of more than 1,000 m3 per year were required to meet the requirements of the legislation by 1st January 1995.
The model outputs include a scenario to show (scenario 547), for these two Member States, how much of the achieved reduction could be attributed to national legislation. The results indicate that 22% and 2% of the VOC emissions reductions from service stations and loading facilities in Austria and Sweden respectively could be attributed to the Directives, whereas the rest would have been achieved, with the controls put in place in these two Member States before 1995. The higher proportion of VOC emissions reduction attributable to the Directives in Austria is due to the fact that national legislation did not require installing Stage II controls in existing installations with an annual throughput below 1,000 m3, whereas the proportion of exempt stations in Sweden was lower. These data must be treated with caution, as there is a high level of uncertainty associated with predicting what would have happened without the legislation in place.
Figure 9 includes further reductions estimated using the model with the input data outlined above. This compares the reductions achieved by scenario 2 with those estimated to occur by 2015 (scenario 3). VOC emissions are projected to reduce a further 3% from scenario 2 to scenario 3 (68.2 kt from service stations and loading facilities, and 127 kt from refineries). A further 13% reduction is estimated between 2015 and 2020 (scenario 3 to scenario 4), mainly driven by the fact that service stations with an annual throughput above 3,000 m3 will be obliged to install Stage II controls by the end of 2018. Although the replacement of smaller stations (annual throughput between 500 and 3,000 m3) has also been taken into account, this has a lower influence because there is no deadline for the installation of these controls in smaller existing stations in the VOC-II Directive. Certain Member States (e.g. Cyprus and Bulgaria) include stricter requirements in their national legislation, which has not had a significant impact on the results, as most of the Member States have chosen to adopt the same requirements as in the Directive.
47 Scenario 5 has been developed for the ‘current’ base year, 2015 and 2020.
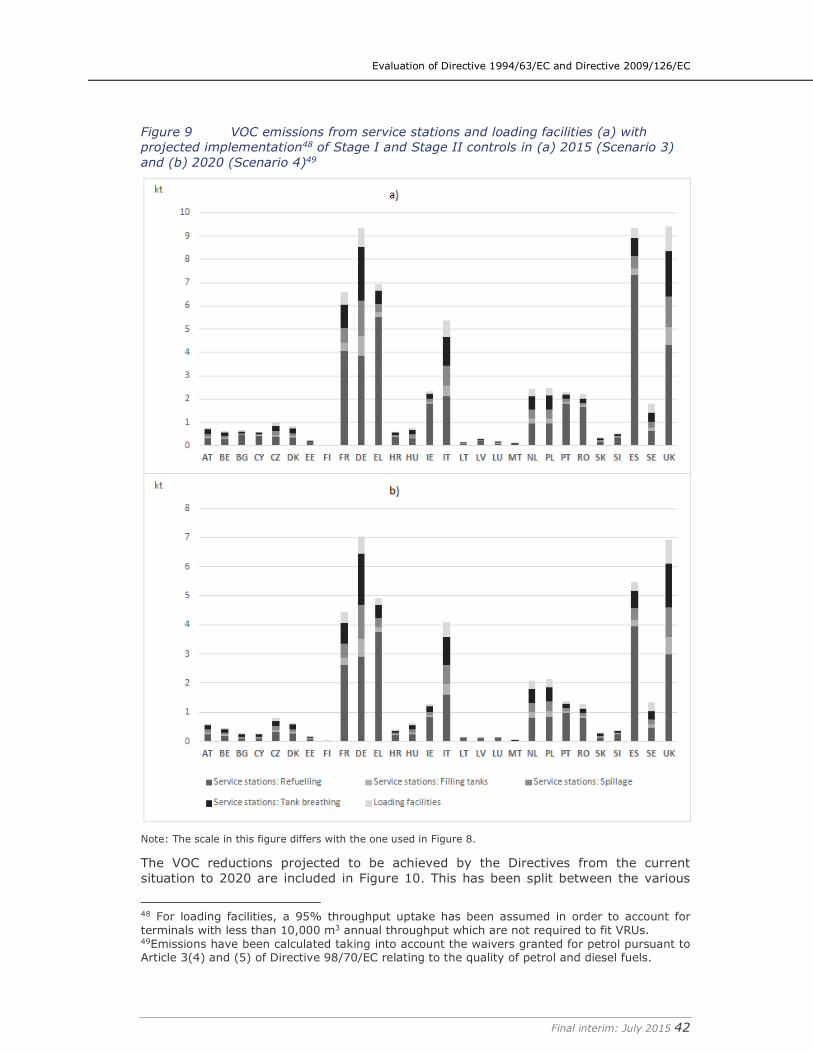
Evaluation of Directive 1994/63/EC and Directive 2009/126/EC
Final interim: July 2015 42
Figure 9 VOC emissions from service stations and loading facilities (a) with
projected implementation48 of Stage I and Stage II controls in (a) 2015 (Scenario 3)
and (b) 2020 (Scenario 4)49
Note: The scale in this figure differs with the one used in Figure 8.
The VOC reductions projected to be achieved by the Directives from the current situation to 2020 are included in Figure 10. This has been split between the various
48 For loading facilities, a 95% throughput uptake has been assumed in order to account for terminals with less than 10,000 m3 annual throughput which are not required to fit VRUs. 49Emissions have been calculated taking into account the waivers granted for petrol pursuant to Article 3(4) and (5) of Directive 98/70/EC relating to the quality of petrol and diesel fuels.
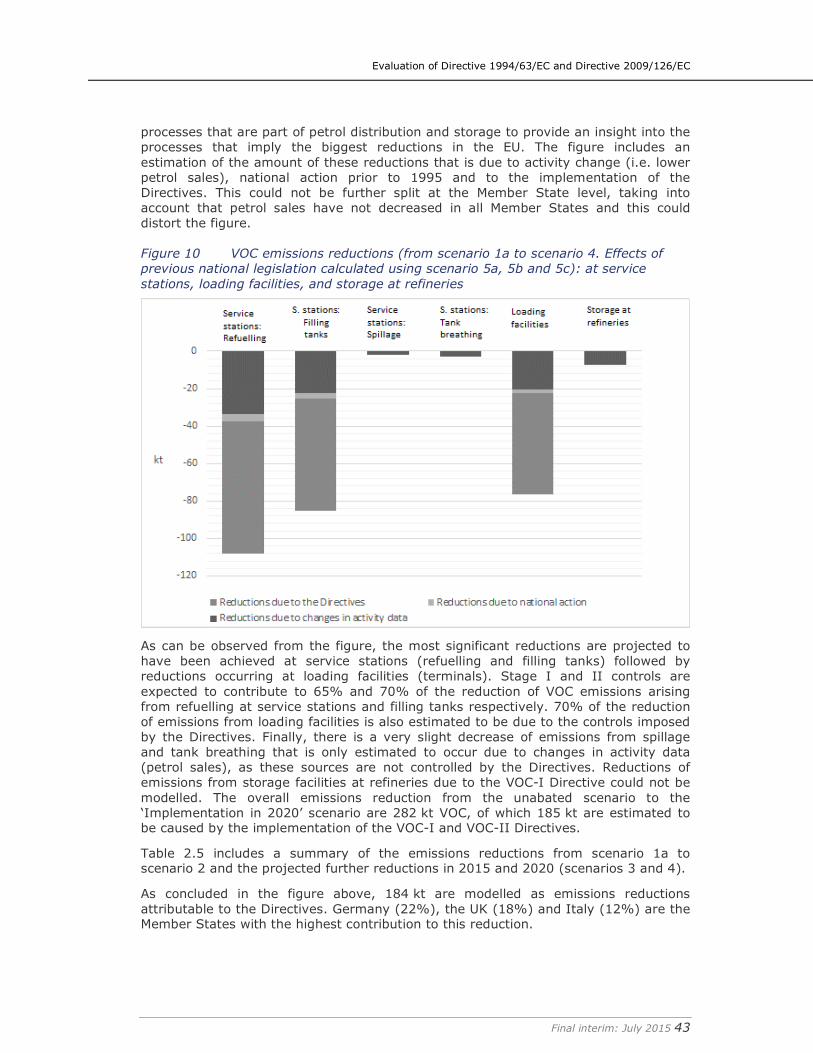
Evaluation of Directive 1994/63/EC and Directive 2009/126/EC
Final interim: July 2015 43
processes that are part of petrol distribution and storage to provide an insight into the processes that imply the biggest reductions in the EU. The figure includes an estimation of the amount of these reductions that is due to activity change (i.e. lower petrol sales), national action prior to 1995 and to the implementation of the Directives. This could not be further split at the Member State level, taking into account that petrol sales have not decreased in all Member States and this could distort the figure.
Figure 10 VOC emissions reductions (from scenario 1a to scenario 4. Effects of
previous national legislation calculated using scenario 5a, 5b and 5c): at service
stations, loading facilities, and storage at refineries
As can be observed from the figure, the most significant reductions are projected to have been achieved at service stations (refuelling and filling tanks) followed by reductions occurring at loading facilities (terminals). Stage I and II controls are expected to contribute to 65% and 70% of the reduction of VOC emissions arising from refuelling at service stations and filling tanks respectively. 70% of the reduction of emissions from loading facilities is also estimated to be due to the controls imposed by the Directives. Finally, there is a very slight decrease of emissions from spillage and tank breathing that is only estimated to occur due to changes in activity data (petrol sales), as these sources are not controlled by the Directives. Reductions of emissions from storage facilities at refineries due to the VOC-I Directive could not be modelled. The overall emissions reduction from the unabated scenario to the ‘Implementation in 2020’ scenario are 282 kt VOC, of which 185 kt are estimated to be caused by the implementation of the VOC-I and VOC-II Directives.
Table 2.5 includes a summary of the emissions reductions from scenario 1a to scenario 2 and the projected further reductions in 2015 and 2020 (scenarios 3 and 4).
As concluded in the figure above, 184 kt are modelled as emissions reductions attributable to the Directives. Germany (22%), the UK (18%) and Italy (12%) are the Member States with the highest contribution to this reduction.
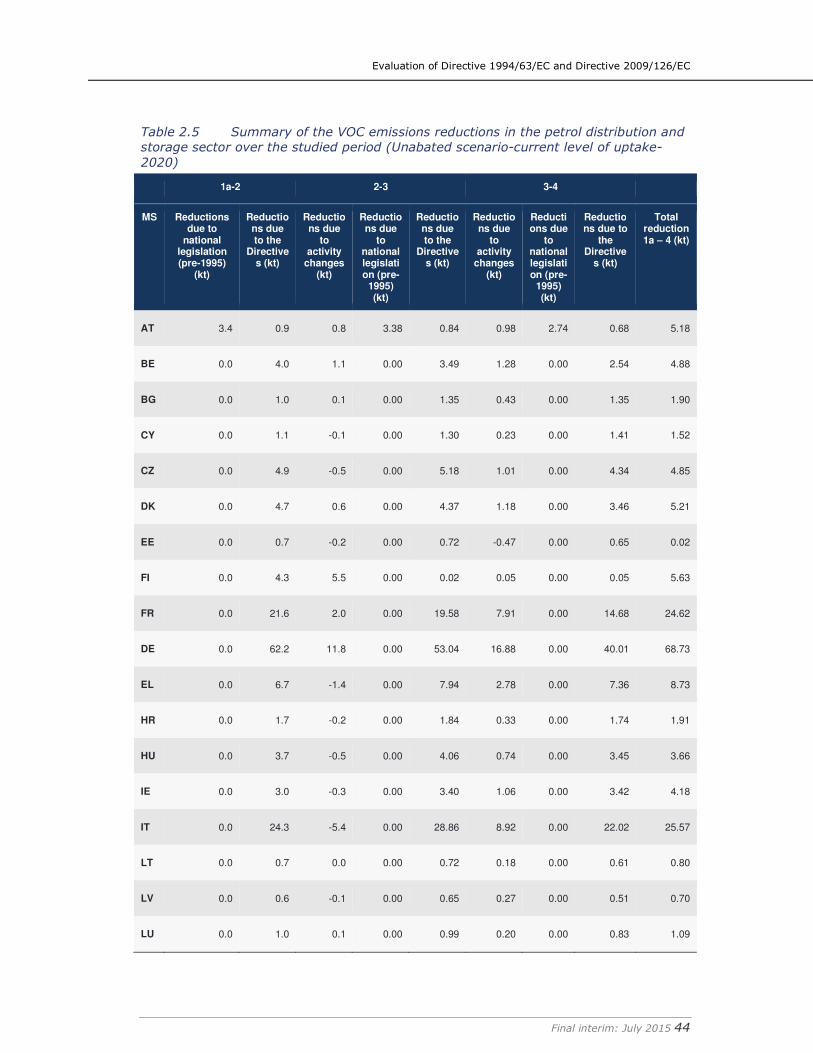
Evaluation of Directive 1994/63/EC and Directive 2009/126/EC
Final interim: July 2015 44
Table 2.5 Summary of the VOC emissions reductions in the petrol distribution and
storage sector over the studied period (Unabated scenario-current level of uptake-
2020)
1a-2 2-3 3-4
MS Reductions due to
national legislation (pre-1995)
(kt)
Reductions due to the
Directives (kt)
Reductions due
to activity
changes (kt)
Reductions due
to national legislation (pre-
1995) (kt)
Reductions due to the
Directives (kt)
Reductions due
to activity
changes (kt)
Reductions due
to national legislation (pre-
1995) (kt)
Reductions due to
the Directive
s (kt)
Total reduction 1a – 4 (kt)
AT 3.4 0.9 0.8 3.38 0.84 0.98 2.74 0.68 5.18
BE 0.0 4.0 1.1 0.00 3.49 1.28 0.00 2.54 4.88
BG 0.0 1.0 0.1 0.00 1.35 0.43 0.00 1.35 1.90
CY 0.0 1.1 -0.1 0.00 1.30 0.23 0.00 1.41 1.52
CZ 0.0 4.9 -0.5 0.00 5.18 1.01 0.00 4.34 4.85
DK 0.0 4.7 0.6 0.00 4.37 1.18 0.00 3.46 5.21
EE 0.0 0.7 -0.2 0.00 0.72 -0.47 0.00 0.65 0.02
FI 0.0 4.3 5.5 0.00 0.02 0.05 0.00 0.05 5.63
FR 0.0 21.6 2.0 0.00 19.58 7.91 0.00 14.68 24.62
DE 0.0 62.2 11.8 0.00 53.04 16.88 0.00 40.01 68.73
EL 0.0 6.7 -1.4 0.00 7.94 2.78 0.00 7.36 8.73
HR 0.0 1.7 -0.2 0.00 1.84 0.33 0.00 1.74 1.91
HU 0.0 3.7 -0.5 0.00 4.06 0.74 0.00 3.45 3.66
IE 0.0 3.0 -0.3 0.00 3.40 1.06 0.00 3.42 4.18
IT 0.0 24.3 -5.4 0.00 28.86 8.92 0.00 22.02 25.57
LT 0.0 0.7 0.0 0.00 0.72 0.18 0.00 0.61 0.80
LV 0.0 0.6 -0.1 0.00 0.65 0.27 0.00 0.51 0.70
LU 0.0 1.0 0.1 0.00 0.99 0.20 0.00 0.83 1.09
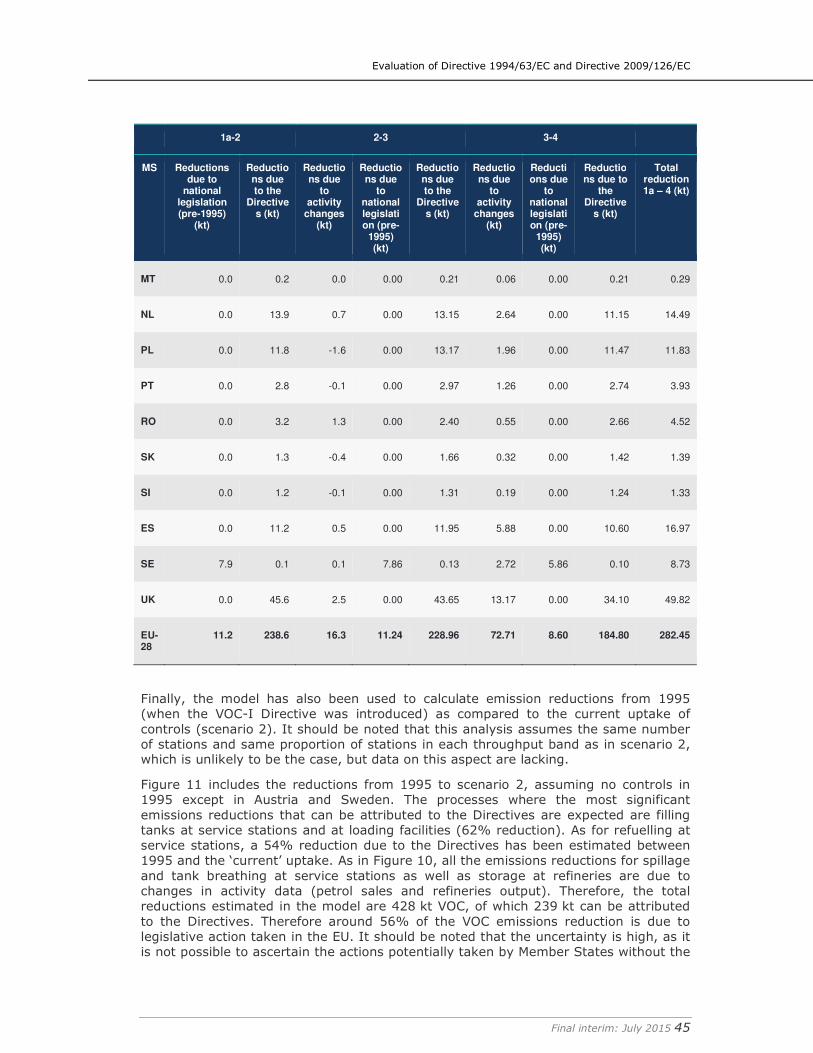
Evaluation of Directive 1994/63/EC and Directive 2009/126/EC
Final interim: July 2015 45
1a-2 2-3 3-4
MS Reductions due to
national legislation (pre-1995)
(kt)
Reductions due to the
Directives (kt)
Reductions due
to activity
changes (kt)
Reductions due
to national legislation (pre-
1995) (kt)
Reductions due to the
Directives (kt)
Reductions due
to activity
changes (kt)
Reductions due
to national legislation (pre-
1995) (kt)
Reductions due to
the Directive
s (kt)
Total reduction 1a – 4 (kt)
MT 0.0 0.2 0.0 0.00 0.21 0.06 0.00 0.21 0.29
NL 0.0 13.9 0.7 0.00 13.15 2.64 0.00 11.15 14.49
PL 0.0 11.8 -1.6 0.00 13.17 1.96 0.00 11.47 11.83
PT 0.0 2.8 -0.1 0.00 2.97 1.26 0.00 2.74 3.93
RO 0.0 3.2 1.3 0.00 2.40 0.55 0.00 2.66 4.52
SK 0.0 1.3 -0.4 0.00 1.66 0.32 0.00 1.42 1.39
SI 0.0 1.2 -0.1 0.00 1.31 0.19 0.00 1.24 1.33
ES 0.0 11.2 0.5 0.00 11.95 5.88 0.00 10.60 16.97
SE 7.9 0.1 0.1 7.86 0.13 2.72 5.86 0.10 8.73
UK 0.0 45.6 2.5 0.00 43.65 13.17 0.00 34.10 49.82
EU-28
11.2 238.6 16.3 11.24 228.96 72.71 8.60 184.80 282.45
Finally, the model has also been used to calculate emission reductions from 1995 (when the VOC-I Directive was introduced) as compared to the current uptake of controls (scenario 2). It should be noted that this analysis assumes the same number of stations and same proportion of stations in each throughput band as in scenario 2, which is unlikely to be the case, but data on this aspect are lacking.
Figure 11 includes the reductions from 1995 to scenario 2, assuming no controls in 1995 except in Austria and Sweden. The processes where the most significant emissions reductions that can be attributed to the Directives are expected are filling tanks at service stations and at loading facilities (62% reduction). As for refuelling at service stations, a 54% reduction due to the Directives has been estimated between 1995 and the ‘current’ uptake. As in Figure 10, all the emissions reductions for spillage and tank breathing at service stations as well as storage at refineries are due to changes in activity data (petrol sales and refineries output). Therefore, the total reductions estimated in the model are 428 kt VOC, of which 239 kt can be attributed to the Directives. Therefore around 56% of the VOC emissions reduction is due to legislative action taken in the EU. It should be noted that the uncertainty is high, as it is not possible to ascertain the actions potentially taken by Member States without the
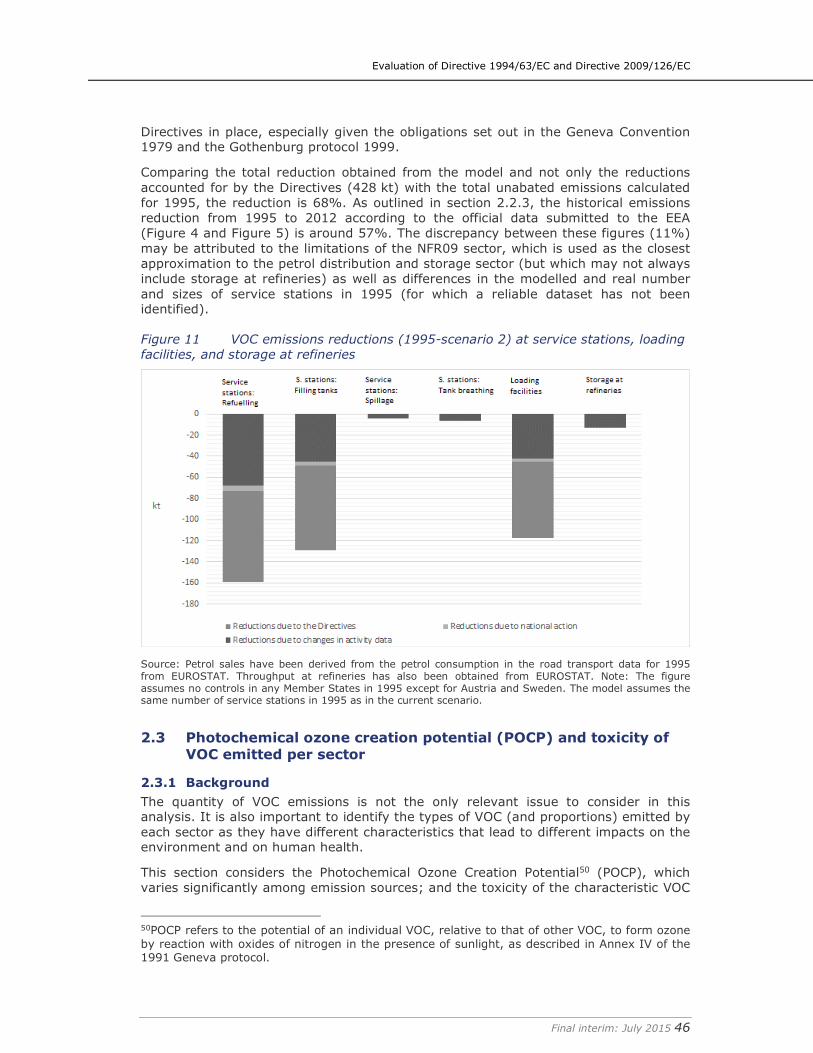
Evaluation of Directive 1994/63/EC and Directive 2009/126/EC
Final interim: July 2015 46
Directives in place, especially given the obligations set out in the Geneva Convention 1979 and the Gothenburg protocol 1999.
Comparing the total reduction obtained from the model and not only the reductions accounted for by the Directives (428 kt) with the total unabated emissions calculated for 1995, the reduction is 68%. As outlined in section 2.2.3, the historical emissions reduction from 1995 to 2012 according to the official data submitted to the EEA (Figure 4 and Figure 5) is around 57%. The discrepancy between these figures (11%) may be attributed to the limitations of the NFR09 sector, which is used as the closest approximation to the petrol distribution and storage sector (but which may not always include storage at refineries) as well as differences in the modelled and real number and sizes of service stations in 1995 (for which a reliable dataset has not been identified).
Figure 11 VOC emissions reductions (1995-scenario 2) at service stations, loading
facilities, and storage at refineries
Source: Petrol sales have been derived from the petrol consumption in the road transport data for 1995 from EUROSTAT. Throughput at refineries has also been obtained from EUROSTAT. Note: The figure assumes no controls in any Member States in 1995 except for Austria and Sweden. The model assumes the same number of service stations in 1995 as in the current scenario.
2.3 Photochemical ozone creation potential (POCP) and toxicity of
VOC emitted per sector
2.3.1 Background
The quantity of VOC emissions is not the only relevant issue to consider in this analysis. It is also important to identify the types of VOC (and proportions) emitted by each sector as they have different characteristics that lead to different impacts on the environment and on human health.
This section considers the Photochemical Ozone Creation Potential50 (POCP), which varies significantly among emission sources; and the toxicity of the characteristic VOC
50POCP refers to the potential of an individual VOC, relative to that of other VOC, to form ozone by reaction with oxides of nitrogen in the presence of sunlight, as described in Annex IV of the 1991 Geneva protocol.
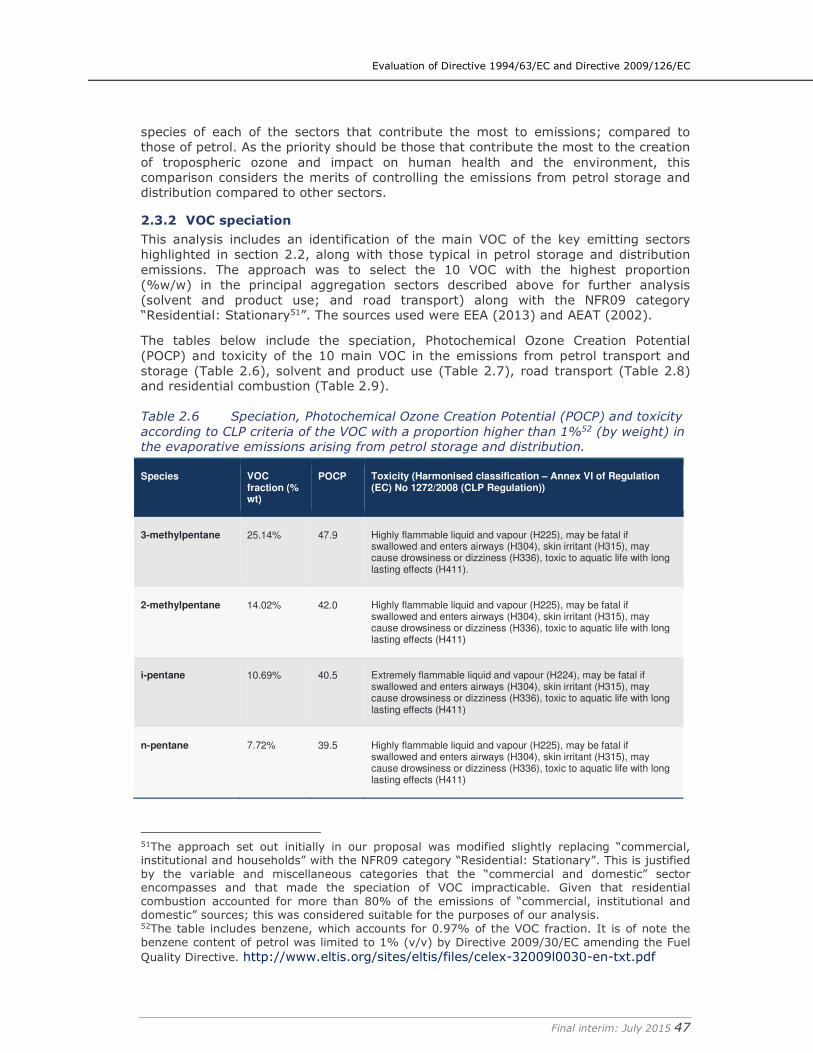
Evaluation of Directive 1994/63/EC and Directive 2009/126/EC
Final interim: July 2015 47
species of each of the sectors that contribute the most to emissions; compared to those of petrol. As the priority should be those that contribute the most to the creation of tropospheric ozone and impact on human health and the environment, this comparison considers the merits of controlling the emissions from petrol storage and distribution compared to other sectors.
2.3.2 VOC speciation
This analysis includes an identification of the main VOC of the key emitting sectors highlighted in section 2.2, along with those typical in petrol storage and distribution emissions. The approach was to select the 10 VOC with the highest proportion (%w/w) in the principal aggregation sectors described above for further analysis (solvent and product use; and road transport) along with the NFR09 category “Residential: Stationary51”. The sources used were EEA (2013) and AEAT (2002).
The tables below include the speciation, Photochemical Ozone Creation Potential (POCP) and toxicity of the 10 main VOC in the emissions from petrol transport and storage (Table 2.6), solvent and product use (Table 2.7), road transport (Table 2.8) and residential combustion (Table 2.9).
Table 2.6 Speciation, Photochemical Ozone Creation Potential (POCP) and toxicity
according to CLP criteria of the VOC with a proportion higher than 1%52 (by weight) in the evaporative emissions arising from petrol storage and distribution.
Species VOC fraction (% wt)
POCP Toxicity (Harmonised classification – Annex VI of Regulation (EC) No 1272/2008 (CLP Regulation))
3-methylpentane 25.14% 47.9 Highly flammable liquid and vapour (H225), may be fatal if swallowed and enters airways (H304), skin irritant (H315), may cause drowsiness or dizziness (H336), toxic to aquatic life with long lasting effects (H411).
2-methylpentane 14.02% 42.0 Highly flammable liquid and vapour (H225), may be fatal if swallowed and enters airways (H304), skin irritant (H315), may cause drowsiness or dizziness (H336), toxic to aquatic life with long lasting effects (H411)
i-pentane 10.69% 40.5 Extremely flammable liquid and vapour (H224), may be fatal if swallowed and enters airways (H304), skin irritant (H315), may cause drowsiness or dizziness (H336), toxic to aquatic life with long lasting effects (H411)
n-pentane 7.72% 39.5 Highly flammable liquid and vapour (H225), may be fatal if swallowed and enters airways (H304), skin irritant (H315), may cause drowsiness or dizziness (H336), toxic to aquatic life with long lasting effects (H411)
51The approach set out initially in our proposal was modified slightly replacing “commercial, institutional and households” with the NFR09 category “Residential: Stationary”. This is justified by the variable and miscellaneous categories that the “commercial and domestic” sector encompasses and that made the speciation of VOC impracticable. Given that residential combustion accounted for more than 80% of the emissions of “commercial, institutional and domestic” sources; this was considered suitable for the purposes of our analysis. 52The table includes benzene, which accounts for 0.97% of the VOC fraction. It is of note the benzene content of petrol was limited to 1% (v/v) by Directive 2009/30/EC amending the Fuel Quality Directive. http://www.eltis.org/sites/eltis/files/celex-32009l0030-en-txt.pdf
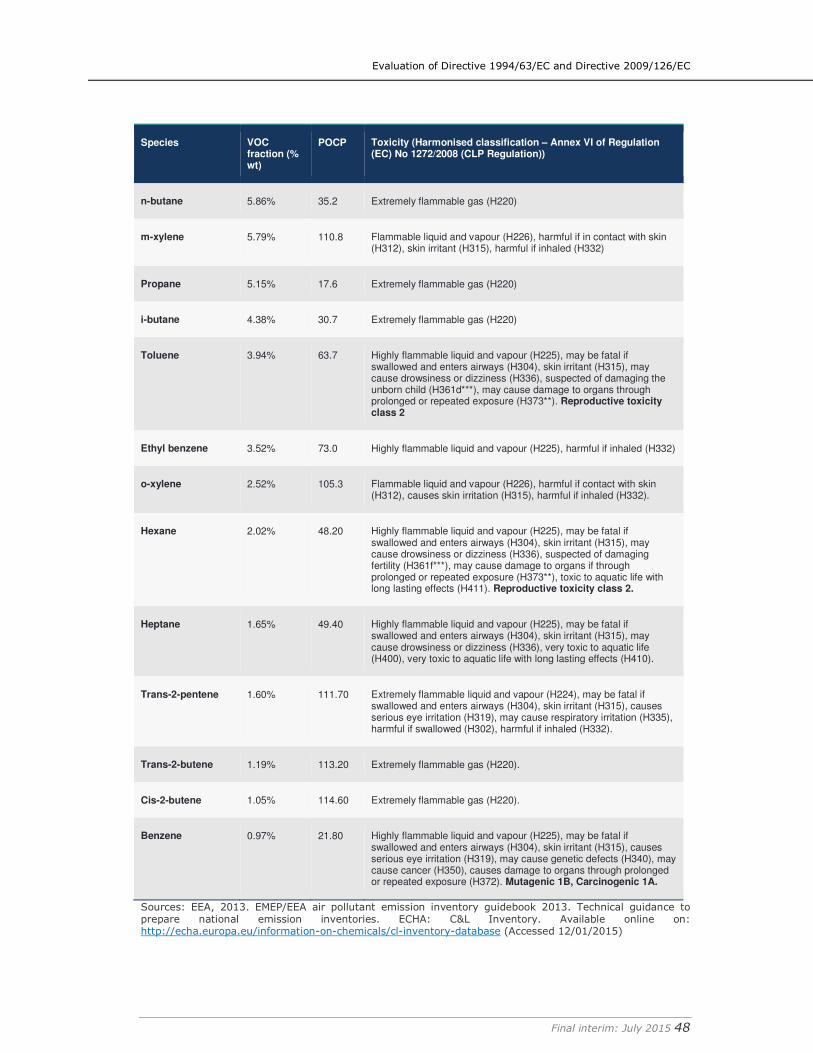
Evaluation of Directive 1994/63/EC and Directive 2009/126/EC
Final interim: July 2015 48
Species VOC fraction (% wt)
POCP Toxicity (Harmonised classification – Annex VI of Regulation (EC) No 1272/2008 (CLP Regulation))
n-butane 5.86% 35.2 Extremely flammable gas (H220)
m-xylene 5.79% 110.8 Flammable liquid and vapour (H226), harmful if in contact with skin (H312), skin irritant (H315), harmful if inhaled (H332)
Propane 5.15% 17.6 Extremely flammable gas (H220)
i-butane 4.38% 30.7 Extremely flammable gas (H220)
Toluene 3.94% 63.7 Highly flammable liquid and vapour (H225), may be fatal if swallowed and enters airways (H304), skin irritant (H315), may cause drowsiness or dizziness (H336), suspected of damaging the unborn child (H361d***), may cause damage to organs through prolonged or repeated exposure (H373**). Reproductive toxicity class 2
Ethyl benzene 3.52% 73.0 Highly flammable liquid and vapour (H225), harmful if inhaled (H332)
o-xylene 2.52% 105.3 Flammable liquid and vapour (H226), harmful if contact with skin (H312), causes skin irritation (H315), harmful if inhaled (H332).
Hexane 2.02% 48.20 Highly flammable liquid and vapour (H225), may be fatal if swallowed and enters airways (H304), skin irritant (H315), may cause drowsiness or dizziness (H336), suspected of damaging fertility (H361f***), may cause damage to organs if through prolonged or repeated exposure (H373**), toxic to aquatic life with long lasting effects (H411). Reproductive toxicity class 2.
Heptane 1.65% 49.40 Highly flammable liquid and vapour (H225), may be fatal if swallowed and enters airways (H304), skin irritant (H315), may cause drowsiness or dizziness (H336), very toxic to aquatic life (H400), very toxic to aquatic life with long lasting effects (H410).
Trans-2-pentene 1.60% 111.70 Extremely flammable liquid and vapour (H224), may be fatal if swallowed and enters airways (H304), skin irritant (H315), causes serious eye irritation (H319), may cause respiratory irritation (H335), harmful if swallowed (H302), harmful if inhaled (H332).
Trans-2-butene 1.19% 113.20 Extremely flammable gas (H220).
Cis-2-butene 1.05% 114.60 Extremely flammable gas (H220).
Benzene 0.97% 21.80 Highly flammable liquid and vapour (H225), may be fatal if swallowed and enters airways (H304), skin irritant (H315), causes serious eye irritation (H319), may cause genetic defects (H340), may cause cancer (H350), causes damage to organs through prolonged or repeated exposure (H372). Mutagenic 1B, Carcinogenic 1A.
Sources: EEA, 2013. EMEP/EEA air pollutant emission inventory guidebook 2013. Technical guidance to prepare national emission inventories. ECHA: C&L Inventory. Available online on: http://echa.europa.eu/information-on-chemicals/cl-inventory-database (Accessed 12/01/2015)
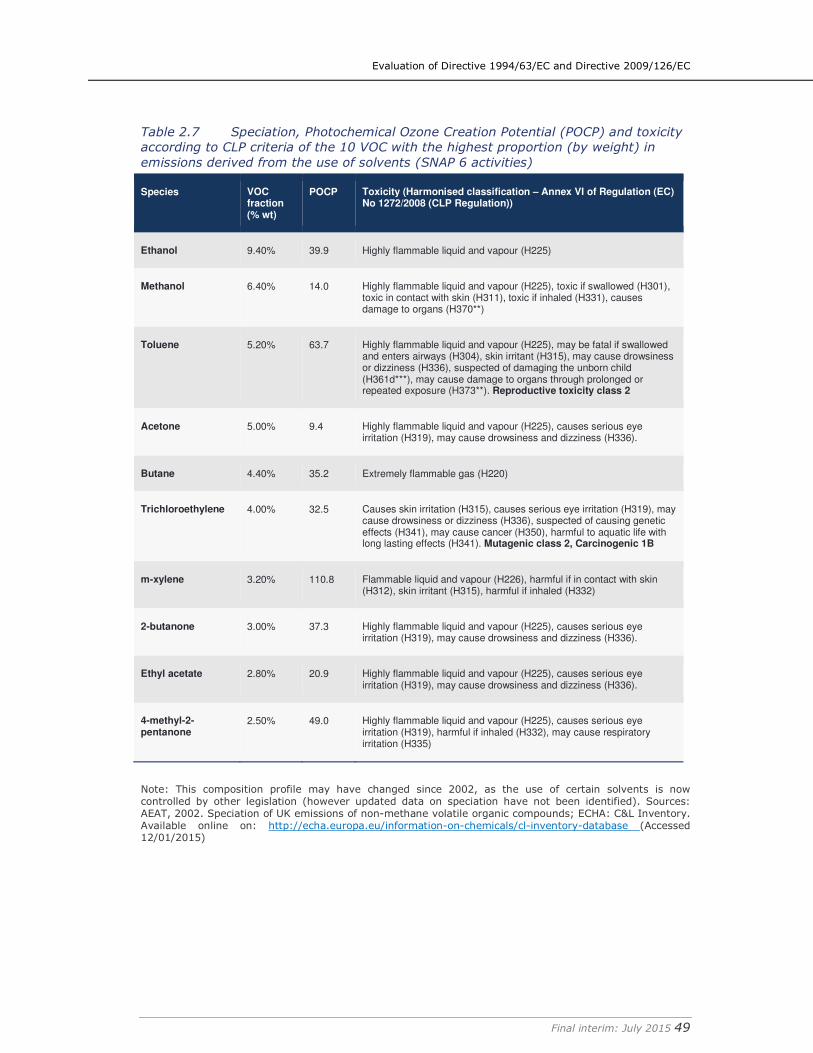
Evaluation of Directive 1994/63/EC and Directive 2009/126/EC
Final interim: July 2015 49
Table 2.7 Speciation, Photochemical Ozone Creation Potential (POCP) and toxicity
according to CLP criteria of the 10 VOC with the highest proportion (by weight) in
emissions derived from the use of solvents (SNAP 6 activities)
Species VOC fraction (% wt)
POCP Toxicity (Harmonised classification – Annex VI of Regulation (EC) No 1272/2008 (CLP Regulation))
Ethanol 9.40% 39.9 Highly flammable liquid and vapour (H225)
Methanol 6.40% 14.0 Highly flammable liquid and vapour (H225), toxic if swallowed (H301), toxic in contact with skin (H311), toxic if inhaled (H331), causes damage to organs (H370**)
Toluene 5.20% 63.7 Highly flammable liquid and vapour (H225), may be fatal if swallowed and enters airways (H304), skin irritant (H315), may cause drowsiness or dizziness (H336), suspected of damaging the unborn child (H361d***), may cause damage to organs through prolonged or repeated exposure (H373**). Reproductive toxicity class 2
Acetone 5.00% 9.4 Highly flammable liquid and vapour (H225), causes serious eye irritation (H319), may cause drowsiness and dizziness (H336).
Butane 4.40% 35.2 Extremely flammable gas (H220)
Trichloroethylene 4.00% 32.5 Causes skin irritation (H315), causes serious eye irritation (H319), may cause drowsiness or dizziness (H336), suspected of causing genetic effects (H341), may cause cancer (H350), harmful to aquatic life with long lasting effects (H341). Mutagenic class 2, Carcinogenic 1B
m-xylene 3.20% 110.8 Flammable liquid and vapour (H226), harmful if in contact with skin (H312), skin irritant (H315), harmful if inhaled (H332)
2-butanone 3.00% 37.3 Highly flammable liquid and vapour (H225), causes serious eye irritation (H319), may cause drowsiness and dizziness (H336).
Ethyl acetate 2.80% 20.9 Highly flammable liquid and vapour (H225), causes serious eye irritation (H319), may cause drowsiness and dizziness (H336).
4-methyl-2-pentanone
2.50% 49.0 Highly flammable liquid and vapour (H225), causes serious eye irritation (H319), harmful if inhaled (H332), may cause respiratory irritation (H335)
Note: This composition profile may have changed since 2002, as the use of certain solvents is now controlled by other legislation (however updated data on speciation have not been identified). Sources: AEAT, 2002. Speciation of UK emissions of non-methane volatile organic compounds; ECHA: C&L Inventory. Available online on: http://echa.europa.eu/information-on-chemicals/cl-inventory-database (Accessed 12/01/2015)
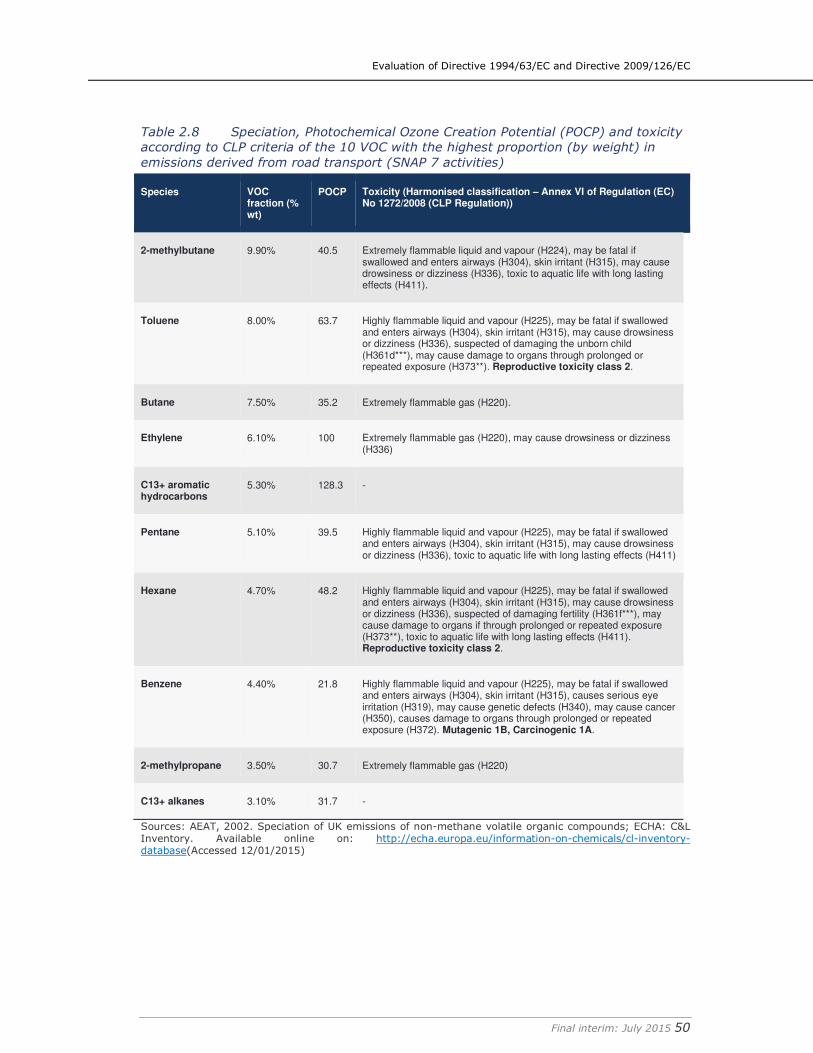
Evaluation of Directive 1994/63/EC and Directive 2009/126/EC
Final interim: July 2015 50
Table 2.8 Speciation, Photochemical Ozone Creation Potential (POCP) and toxicity
according to CLP criteria of the 10 VOC with the highest proportion (by weight) in
emissions derived from road transport (SNAP 7 activities)
Species VOC fraction (% wt)
POCP Toxicity (Harmonised classification – Annex VI of Regulation (EC) No 1272/2008 (CLP Regulation))
2-methylbutane 9.90% 40.5 Extremely flammable liquid and vapour (H224), may be fatal if swallowed and enters airways (H304), skin irritant (H315), may cause drowsiness or dizziness (H336), toxic to aquatic life with long lasting effects (H411).
Toluene 8.00% 63.7 Highly flammable liquid and vapour (H225), may be fatal if swallowed and enters airways (H304), skin irritant (H315), may cause drowsiness or dizziness (H336), suspected of damaging the unborn child (H361d***), may cause damage to organs through prolonged or repeated exposure (H373**). Reproductive toxicity class 2.
Butane 7.50% 35.2 Extremely flammable gas (H220).
Ethylene 6.10% 100 Extremely flammable gas (H220), may cause drowsiness or dizziness (H336)
C13+ aromatic hydrocarbons
5.30% 128.3 -
Pentane 5.10% 39.5 Highly flammable liquid and vapour (H225), may be fatal if swallowed and enters airways (H304), skin irritant (H315), may cause drowsiness or dizziness (H336), toxic to aquatic life with long lasting effects (H411)
Hexane 4.70% 48.2 Highly flammable liquid and vapour (H225), may be fatal if swallowed and enters airways (H304), skin irritant (H315), may cause drowsiness or dizziness (H336), suspected of damaging fertility (H361f***), may cause damage to organs if through prolonged or repeated exposure (H373**), toxic to aquatic life with long lasting effects (H411). Reproductive toxicity class 2.
Benzene 4.40% 21.8 Highly flammable liquid and vapour (H225), may be fatal if swallowed and enters airways (H304), skin irritant (H315), causes serious eye irritation (H319), may cause genetic defects (H340), may cause cancer (H350), causes damage to organs through prolonged or repeated exposure (H372). Mutagenic 1B, Carcinogenic 1A.
2-methylpropane 3.50% 30.7 Extremely flammable gas (H220)
C13+ alkanes 3.10% 31.7 -
Sources: AEAT, 2002. Speciation of UK emissions of non-methane volatile organic compounds; ECHA: C&L Inventory. Available online on: http://echa.europa.eu/information-on-chemicals/cl-inventory-database(Accessed 12/01/2015)
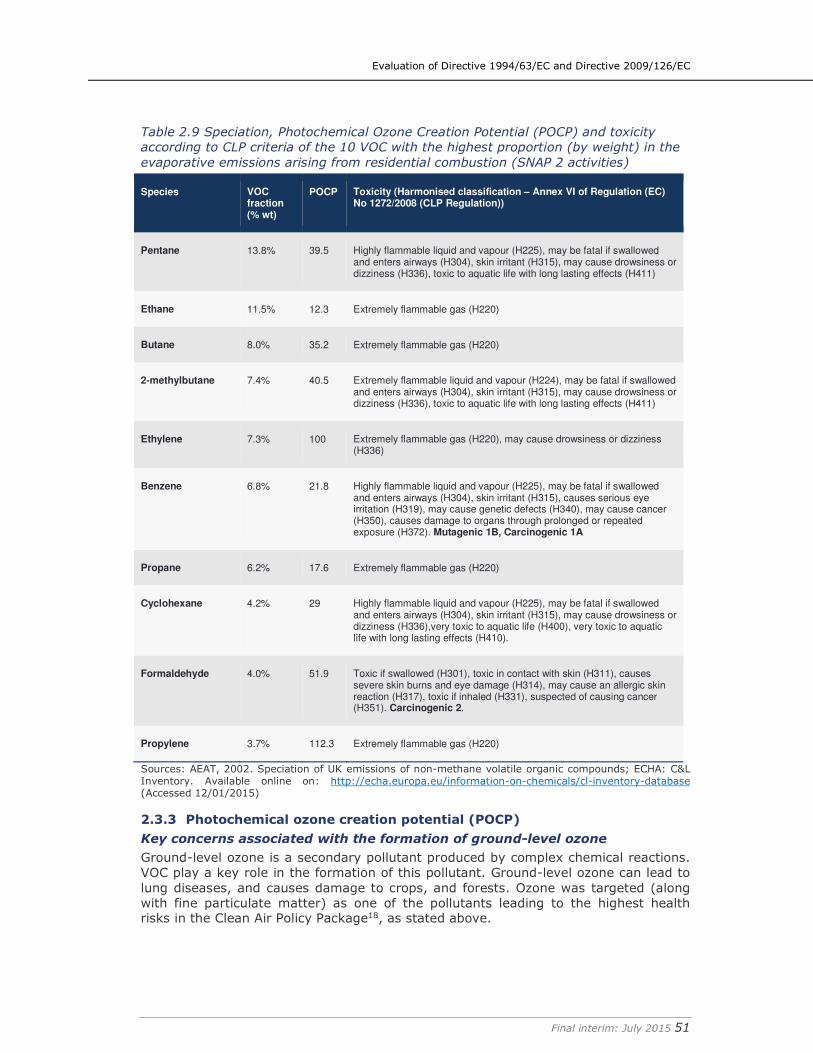
Evaluation of Directive 1994/63/EC and Directive 2009/126/EC
Final interim: July 2015 51
Table 2.9 Speciation, Photochemical Ozone Creation Potential (POCP) and toxicity
according to CLP criteria of the 10 VOC with the highest proportion (by weight) in the
evaporative emissions arising from residential combustion (SNAP 2 activities)
Species VOC fraction (% wt)
POCP Toxicity (Harmonised classification – Annex VI of Regulation (EC) No 1272/2008 (CLP Regulation))
Pentane 13.8% 39.5 Highly flammable liquid and vapour (H225), may be fatal if swallowed and enters airways (H304), skin irritant (H315), may cause drowsiness or dizziness (H336), toxic to aquatic life with long lasting effects (H411)
Ethane 11.5% 12.3 Extremely flammable gas (H220)
Butane 8.0% 35.2 Extremely flammable gas (H220)
2-methylbutane 7.4% 40.5 Extremely flammable liquid and vapour (H224), may be fatal if swallowed and enters airways (H304), skin irritant (H315), may cause drowsiness or dizziness (H336), toxic to aquatic life with long lasting effects (H411)
Ethylene 7.3% 100 Extremely flammable gas (H220), may cause drowsiness or dizziness (H336)
Benzene 6.8% 21.8 Highly flammable liquid and vapour (H225), may be fatal if swallowed and enters airways (H304), skin irritant (H315), causes serious eye irritation (H319), may cause genetic defects (H340), may cause cancer (H350), causes damage to organs through prolonged or repeated exposure (H372). Mutagenic 1B, Carcinogenic 1A
Propane 6.2% 17.6 Extremely flammable gas (H220)
Cyclohexane 4.2% 29 Highly flammable liquid and vapour (H225), may be fatal if swallowed and enters airways (H304), skin irritant (H315), may cause drowsiness or dizziness (H336),very toxic to aquatic life (H400), very toxic to aquatic life with long lasting effects (H410).
Formaldehyde 4.0% 51.9 Toxic if swallowed (H301), toxic in contact with skin (H311), causes severe skin burns and eye damage (H314), may cause an allergic skin reaction (H317), toxic if inhaled (H331), suspected of causing cancer (H351). Carcinogenic 2.
Propylene 3.7% 112.3 Extremely flammable gas (H220)
Sources: AEAT, 2002. Speciation of UK emissions of non-methane volatile organic compounds; ECHA: C&L Inventory. Available online on: http://echa.europa.eu/information-on-chemicals/cl-inventory-database (Accessed 12/01/2015)
2.3.3 Photochemical ozone creation potential (POCP)
Key concerns associated with the formation of ground-level ozone
Ground-level ozone is a secondary pollutant produced by complex chemical reactions. VOC play a key role in the formation of this pollutant. Ground-level ozone can lead to lung diseases, and causes damage to crops, and forests. Ozone was targeted (along with fine particulate matter) as one of the pollutants leading to the highest health risks in the Clean Air Policy Package18, as stated above.
Evaluation of Directive 1994/63/EC and Directive 2009/126/EC
Final interim: July 2015 52
Excessive ozone in the air can have a significant effect on human health. At European level, the AQD establishes a target value for the protection of human health of 120 µg/m3. This value is not to be exceeded on more than 25 days per calendar year averaged over three years.
According to the EEA (2014a), this value is regularly exceeded in various regions across the EU (Figure 12). The proportion of the European urban population that is exposed to ambient ozone concentrations above the target value set by the EU was reduced from 65% (2003) to 14% (2012)53.However, these exceedances are still an issue and are thought to have a cost to society of €20 billion to €60 billion per year (external costs of the health impacts) (European Commission, 2013a). 340,000 premature deaths are still expected by 2020 due to PM2.5 and ground-level ozone (European Commission, 2013a).
Moreover it is noted that the European value is lower than that established by the 2005 Air Quality Guidelines of the World Health Organisation (WHO) which recommend 100 µg/m3 as a daily maximum 8-hour mean concentration. The 'Air quality in Europe – 2014' report prepared by the EEA shows that, between 2010 and 2012, up to 98% of city dwellers were exposed to ozone levels above the WHO guidelines. This report estimates that ozone concentrations in 2011 were responsible for about 16,160 premature deaths per year in the Member States, originating from short-term exposure (EEA, 2014b).
In addition to its significant health impacts, ground-level ozone is considered to be the most damaging air pollutant to vegetation, hampering the growth of trees as well as food crops (EEA, 2014b). In 2011, the target value set for protection of vegetation in the AQD (AOT40 18000 µg/m3-h averaged over 5 years) was exceeded in about 18% of the agricultural area in the EEA area. The resulting crop productivity loss in the EU is valued at €3 billion per year (European Commission, 2013b). In addition, the UNECE critical level (10,000 µg/m3-h)54 set for the protection of forests was exceeded at 85% of the rural stations in 2012 (EEA, 2014b).
Ozone is also relevant for its contribution to climate change. However, it is noted that among the different ozone precursors, VOC emissions have the lowest climate effect (EEA, 2014b).
53http://www.eea.europa.eu/data-and-maps/indicators/exceedance-of-air-quality-limit-3/assessment 54The UNECE LRTAP Convention (UNECE, 1979) defines a 'critical' level for the protection of forests. This critical level is a function of the accumulated exposure over threshold AOT40 during the period April September and is set to 10 000 (µg/m3).h.
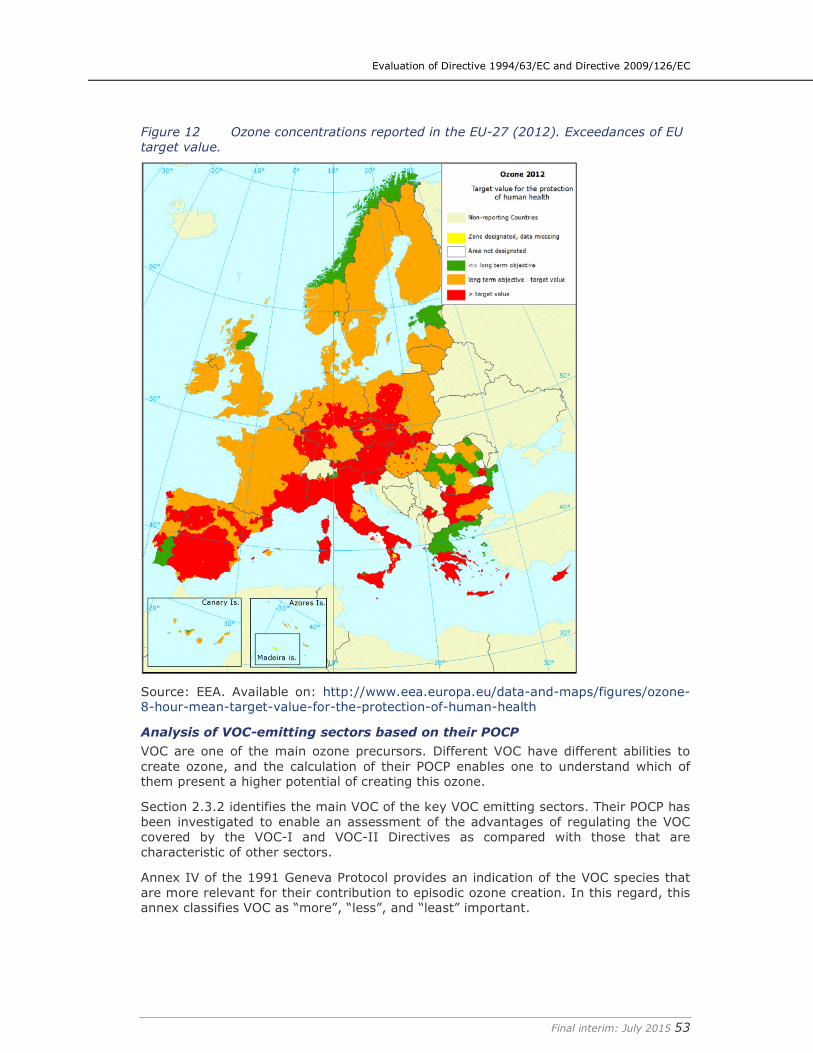
Evaluation of Directive 1994/63/EC and Directive 2009/126/EC
Final interim: July 2015 53
Figure 12 Ozone concentrations reported in the EU-27 (2012). Exceedances of EU
target value.
Source: EEA. Available on: http://www.eea.europa.eu/data-and-maps/figures/ozone-8-hour-mean-target-value-for-the-protection-of-human-health
Analysis of VOC-emitting sectors based on their POCP
VOC are one of the main ozone precursors. Different VOC have different abilities to create ozone, and the calculation of their POCP enables one to understand which of them present a higher potential of creating this ozone.
Section 2.3.2 identifies the main VOC of the key VOC emitting sectors. Their POCP has been investigated to enable an assessment of the advantages of regulating the VOC covered by the VOC-I and VOC-II Directives as compared with those that are characteristic of other sectors.
Annex IV of the 1991 Geneva Protocol provides an indication of the VOC species that are more relevant for their contribution to episodic ozone creation. In this regard, this annex classifies VOC as “more”, “less”, and “least” important.
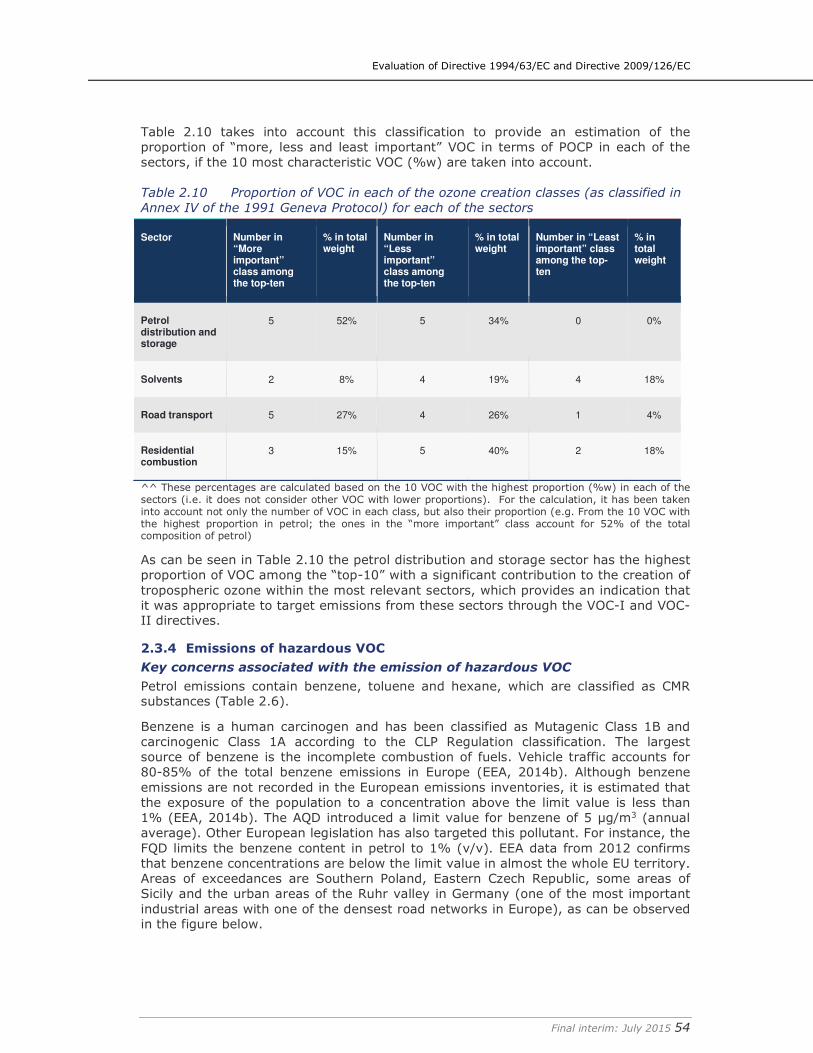
Evaluation of Directive 1994/63/EC and Directive 2009/126/EC
Final interim: July 2015 54
Table 2.10 takes into account this classification to provide an estimation of the proportion of “more, less and least important” VOC in terms of POCP in each of the sectors, if the 10 most characteristic VOC (%w) are taken into account.
Table 2.10 Proportion of VOC in each of the ozone creation classes (as classified in
Annex IV of the 1991 Geneva Protocol) for each of the sectors
Sector Number in “More important” class among the top-ten
% in total weight
Number in “Less important” class among the top-ten
% in total weight
Number in “Least important” class among the top-ten
% in total weight
Petrol distribution and storage
5 52% 5 34% 0 0%
Solvents 2 8% 4 19% 4 18%
Road transport 5 27% 4 26% 1 4%
Residential combustion
3 15% 5 40% 2 18%
^^ These percentages are calculated based on the 10 VOC with the highest proportion (%w) in each of the sectors (i.e. it does not consider other VOC with lower proportions). For the calculation, it has been taken into account not only the number of VOC in each class, but also their proportion (e.g. From the 10 VOC with the highest proportion in petrol; the ones in the “more important” class account for 52% of the total composition of petrol)
As can be seen in Table 2.10 the petrol distribution and storage sector has the highest proportion of VOC among the “top-10” with a significant contribution to the creation of tropospheric ozone within the most relevant sectors, which provides an indication that it was appropriate to target emissions from these sectors through the VOC-I and VOC-II directives.
2.3.4 Emissions of hazardous VOC
Key concerns associated with the emission of hazardous VOC
Petrol emissions contain benzene, toluene and hexane, which are classified as CMR substances (Table 2.6).
Benzene is a human carcinogen and has been classified as Mutagenic Class 1B and carcinogenic Class 1A according to the CLP Regulation classification. The largest source of benzene is the incomplete combustion of fuels. Vehicle traffic accounts for 80-85% of the total benzene emissions in Europe (EEA, 2014b). Although benzene emissions are not recorded in the European emissions inventories, it is estimated that the exposure of the population to a concentration above the limit value is less than 1% (EEA, 2014b). The AQD introduced a limit value for benzene of 5 µg/m3 (annual average). Other European legislation has also targeted this pollutant. For instance, the FQD limits the benzene content in petrol to 1% (v/v). EEA data from 2012 confirms that benzene concentrations are below the limit value in almost the whole EU territory. Areas of exceedances are Southern Poland, Eastern Czech Republic, some areas of Sicily and the urban areas of the Ruhr valley in Germany (one of the most important industrial areas with one of the densest road networks in Europe), as can be observed in the figure below.
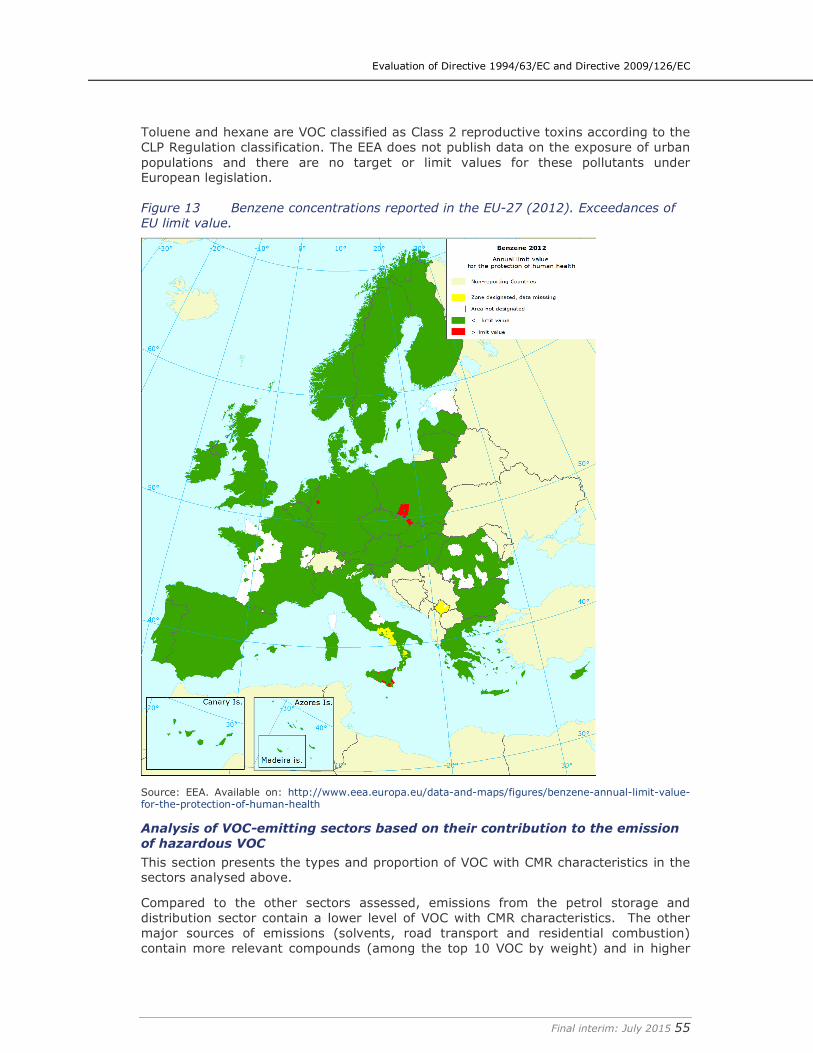
Evaluation of Directive 1994/63/EC and Directive 2009/126/EC
Final interim: July 2015 55
Toluene and hexane are VOC classified as Class 2 reproductive toxins according to the CLP Regulation classification. The EEA does not publish data on the exposure of urban populations and there are no target or limit values for these pollutants under European legislation.
Figure 13 Benzene concentrations reported in the EU-27 (2012). Exceedances of
EU limit value.
Source: EEA. Available on: http://www.eea.europa.eu/data-and-maps/figures/benzene-annual-limit-value-for-the-protection-of-human-health
Analysis of VOC-emitting sectors based on their contribution to the emission
of hazardous VOC
This section presents the types and proportion of VOC with CMR characteristics in the sectors analysed above.
Compared to the other sectors assessed, emissions from the petrol storage and distribution sector contain a lower level of VOC with CMR characteristics. The other major sources of emissions (solvents, road transport and residential combustion) contain more relevant compounds (among the top 10 VOC by weight) and in higher
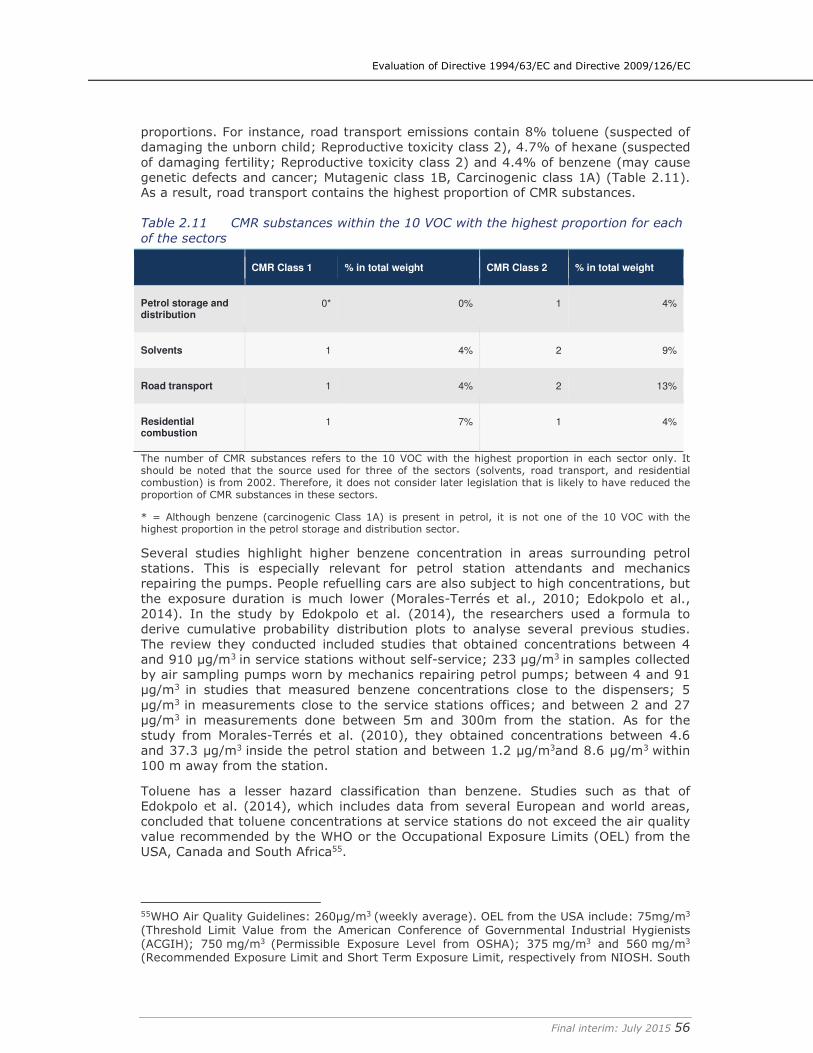
Evaluation of Directive 1994/63/EC and Directive 2009/126/EC
Final interim: July 2015 56
proportions. For instance, road transport emissions contain 8% toluene (suspected of damaging the unborn child; Reproductive toxicity class 2), 4.7% of hexane (suspected of damaging fertility; Reproductive toxicity class 2) and 4.4% of benzene (may cause genetic defects and cancer; Mutagenic class 1B, Carcinogenic class 1A) (Table 2.11). As a result, road transport contains the highest proportion of CMR substances.
Table 2.11 CMR substances within the 10 VOC with the highest proportion for each
of the sectors
CMR Class 1 % in total weight CMR Class 2 % in total weight
Petrol storage and distribution
0* 0% 1 4%
Solvents 1 4% 2 9%
Road transport 1 4% 2 13%
Residential combustion
1 7% 1 4%
The number of CMR substances refers to the 10 VOC with the highest proportion in each sector only. It should be noted that the source used for three of the sectors (solvents, road transport, and residential combustion) is from 2002. Therefore, it does not consider later legislation that is likely to have reduced the proportion of CMR substances in these sectors.
* = Although benzene (carcinogenic Class 1A) is present in petrol, it is not one of the 10 VOC with the highest proportion in the petrol storage and distribution sector.
Several studies highlight higher benzene concentration in areas surrounding petrol stations. This is especially relevant for petrol station attendants and mechanics repairing the pumps. People refuelling cars are also subject to high concentrations, but the exposure duration is much lower (Morales-Terrés et al., 2010; Edokpolo et al., 2014). In the study by Edokpolo et al. (2014), the researchers used a formula to derive cumulative probability distribution plots to analyse several previous studies. The review they conducted included studies that obtained concentrations between 4 and 910 µg/m3 in service stations without self-service; 233 µg/m3 in samples collected by air sampling pumps worn by mechanics repairing petrol pumps; between 4 and 91 µg/m3 in studies that measured benzene concentrations close to the dispensers; 5 µg/m3 in measurements close to the service stations offices; and between 2 and 27 µg/m3 in measurements done between 5m and 300m from the station. As for the study from Morales-Terrés et al. (2010), they obtained concentrations between 4.6 and 37.3 µg/m3 inside the petrol station and between 1.2 µg/m3and 8.6 µg/m3 within 100 m away from the station.
Toluene has a lesser hazard classification than benzene. Studies such as that of Edokpolo et al. (2014), which includes data from several European and world areas, concluded that toluene concentrations at service stations do not exceed the air quality value recommended by the WHO or the Occupational Exposure Limits (OEL) from the USA, Canada and South Africa55.
55WHO Air Quality Guidelines: 260µg/m3 (weekly average). OEL from the USA include: 75mg/m3
(Threshold Limit Value from the American Conference of Governmental Industrial Hygienists (ACGIH); 750 mg/m3 (Permissible Exposure Level from OSHA); 375 mg/m3 and 560 mg/m3 (Recommended Exposure Limit and Short Term Exposure Limit, respectively from NIOSH. South
Evaluation of Directive 1994/63/EC and Directive 2009/126/EC
Final interim: July 2015 57
As for hexane, data from CONCAWE published in a study by Kountouriotis et al. (2014) gives an indication of measured peak concentration levels at service stations. It should be highlighted that many Member States did not have Stage II controls when the data was recorded (1999/200056). Peak hexane exposure concentrations ranged between 0.8 mg/m3 and 3.9 mg/m3 for drum fillers (34 minutes of exposure time); 0.4 mg/m3and 0.9 mg/m3 for service station attendants (no PVR equipment in any of the trials and between 320 and 457 minutes of exposure time); and 0.2 mg/m3and 0.3 mg/m3 for attendants/cashiers (no PVR equipment and exposure times between 457 and 465 minutes). If hexane exposure concentrations are within these levels, the occupational Health limits set out by the US National Institute for Occupational Safety and Health (NIOSH57), US Occupational Safety and Health Organisation (OSHA58) and the American Conference of Governmental Industrial Hygienists (ACGIH58) would not be exceeded (180 mg/m3, 1,800 mg/m3 and 176 mg/m3 are the limits set out by NIOSH, OSHA and ACGIH, respectively).
2.4 International policy context
Internationally, petrol vapour recovery has been on the policy agenda in many countries since the 1980s, and even earlier in the case of the USA where vapour recovery controls were first regulated in state law in 1974 in California. Of the countries examined in this review – the USA, Canada and Australia - Stage I controls mirror those adopted in the EU. However, different approaches to Stage II vapour recovery have emerged in national policies In countries still developing policies for petrol vapour recovery, the relative benefits and disadvantages of the different approaches are still being discussed (for example in China – see MECA, 2014).
2.4.1 United States
Mandatory Stage II controls were first introduced in the USA in 1972 and 1973 in California – in San Diego County followed by Orange and Bay Area Counties. The standards were formalised in 1974 under the California Health and Safety Code (41954), which regulated performance and set certification standards for vapour recovery systems (Castronovo, 2000). At a national level, provisions for Stage I and Stage II controls were incorporated in the 1990 amendments to the US Clean Air Act. The Act established a mandate for Stage I controls to be introduced across all states, and for service stations and other dispensing stations to install Stage II vapour recovery equipment on site where operating in areas designated as “Serious, Severe, and Extreme ozone nonattainment areas” as well as setting requirements for new vehicles to have Onboard Refuelling Vapour Recovery (ORVR) devices fitted (ICCT, 2011). National regulation was adopted in 1994 stipulating that ORVR systems should be fitted to new vehicles in three phases – from 1998 for light duty vehicles (LDVs), 2001 for light-duty trucks (LDTs), and 2004 for heavier LDTs (USA EPA, 1994). By 2006, all new motorway vehicles were required to fit ORVR devices (USA EPA, 2012).
This policy approach was intended to support a dual approach to Stage II vapour recovery, whereby Stage II equipment could be installed relatively quickly and target areas with high levels of ozone while allowing ORVR devices to be fitted to new vehicles over time. Research showed that the cost of implementing Stage II vapour recovery equipment at service stations required larger capital investments and
Africa: 175 mg/m3 (OEL from South African Occupational Health and Safety). Canada: 400µg/m3 (daily average, Alberta Ambient Air Quality Objective). 56 The data from CONCAWE referred to in the study by Kountouriotis et al. (2014) was collected in 1999 and 2000 and does not specify specific Member States. It is classified into stations from Central Europe, Southern Europe, Northern Europe and Western Europe. 57http://www.cdc.gov/niosh/npg/npgd0322.html 58https://www.osha.gov/dts/chemicalsampling/data/CH_245400.html
Evaluation of Directive 1994/63/EC and Directive 2009/126/EC
Final interim: July 2015 58
operational costs due to ongoing monitoring needs compared to the costs of retrofitting ORVR devices.
ORVR devices were also found to operate more efficiently (with an average 98% efficiency) while the efficiency of vapour recovery in Stage II service station equipment was found to rely on regular maintenance. Thus, although it could potentially operate at 95% efficiency, the working average was estimated to be 70% (with potential for greater efficiency where inspection and follow-up enforcement are imposed). It was also noted that the potential impact of installing Stage II equipment at service stations is weakened significantly where service stations with a smaller throughput are exempt (ICCT, 2011). Although the research found that ORVR systems are highly efficient, require little maintenance, and are inexpensive on a per vehicle basis, they cannot be retrofitted (due to cost and product design). Therefore, it would require a fleet overhaul to implement as an effective control mechanism (ICCT, 2011).
Since taking a dual approach it has become apparent that there is a compatibility issue between Stage II service station equipment and ORVR devices. It was found that, where vehicles fitted with ORVR devices use vapour recovery equipment at service stations, fresh air was being drawn down into the storage tank forming additional vapour and increasing the pressure in the tanker. Although technology has been developed to overcome this issue, it is expensive to fit and has not been commonly applied in the USA. Therefore, where vehicles fitted with ORVR devices use vapour recovery equipment at service stations the efficiency of vapour recovery fell by between 1 and 10% (ICCT, 2011). Subsequently, in 2012, the mandate for Stage II at service stations operating in designated areas was rescinded and only ORVR devices are regulated as a measure to control Stage II vapour recovery in the USA (USA EPA, 2012).
2.4.2 Canada
In Canada, a management plan for NOx and VOC was approved in 1990 which included the first provisions for vapour recovery controls to be installed at terminals and service stations (National Task Force on Vapour Recovery in Gasoline Distribution Networks, 1991). The management plan identified priority regions with high ozone levels as areas requiring “full implementation“ of vapour recovery controls (namely Lower Fraser Valley and the Windsor-Quebec City Corridor), whereas only Stage I controls were recommended for other parts of the country. Initially, it was decided that all service stations in the priority regions should be equipped with Stage II vapour recovery controls by 1995, on the understanding that the policy would be reviewed every 5 years (National Task Force on Stage II Vapour Recovery, 1995). Ultimately it was decided to follow the USA's approach, favouring the installation of ORVR devices over Stage II service station equipment, particularly as so many vehicles from the USA refuel at service stations in Canada (Canadian Statutory Authority, 1999; Consolidated Amendments (SOR/200-43), 2015).
2.4.3 Australia
Contrary to the approach taken in the USA and Canada, policy provisions in Australia require that service stations are equipped with Stage II vapour recovery controls. Stage I vapour recovery controls were established in 1986 in Australia (in Sydney). As with the USA, the Australian approach targets areas with poor air quality. Additional provisions for Stage I controls were introduced under the Protection of the Environment Operations (Clean Air) Amendment (Vapour Recovery) Regulation 2009. The amendments extended Stage I controls to Central Coast, Illawarra and Lower Hunter regions so that since 2014 service stations that dispense more than 500m3 per annum are required to apply Stage I certified control equipment. The amendments also included provisions for Stage II equipment to be installed progressively from 2010

Evaluation of Directive 1994/63/EC and Directive 2009/126/EC
Final interim: July 2015 59
until 2017 for service stations in the Sydney, Newcastle, Wollongong and Central Coast metropolitan areas (EPA – Australia, 2012).
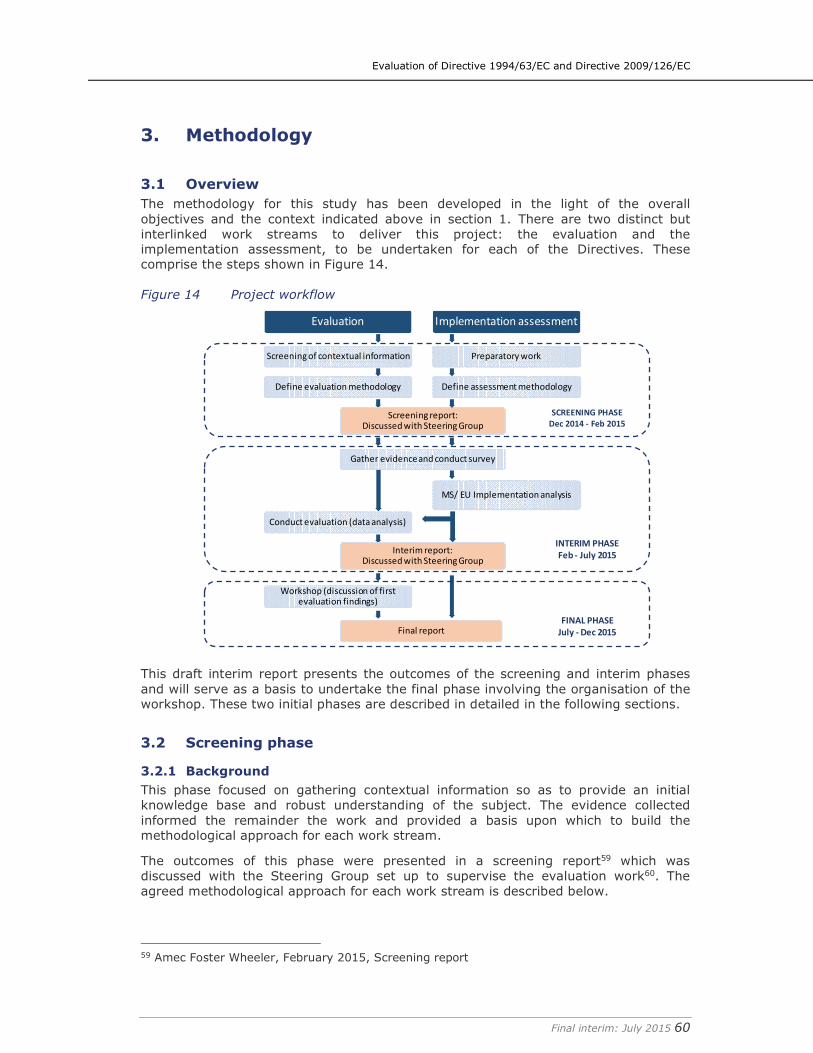
Evaluation of Directive 1994/63/EC and Directive 2009/126/EC
Final interim: July 2015 60
3. Methodology
3.1 Overview
The methodology for this study has been developed in the light of the overall objectives and the context indicated above in section 1. There are two distinct but interlinked work streams to deliver this project: the evaluation and the implementation assessment, to be undertaken for each of the Directives. These comprise the steps shown in Figure 14.
Figure 14 Project workflow
This draft interim report presents the outcomes of the screening and interim phases and will serve as a basis to undertake the final phase involving the organisation of the workshop. These two initial phases are described in detailed in the following sections.
3.2 Screening phase
3.2.1 Background
This phase focused on gathering contextual information so as to provide an initial knowledge base and robust understanding of the subject. The evidence collected informed the remainder the work and provided a basis upon which to build the methodological approach for each work stream.
The outcomes of this phase were presented in a screening report59 which was discussed with the Steering Group set up to supervise the evaluation work60. The agreed methodological approach for each work stream is described below.
59 Amec Foster Wheeler, February 2015, Screening report
Evaluation
Screening of contextual information
Define evaluation methodology
Implementation assessment
Preparatory work
Define assessment methodology
Gather evidence and conduct survey
Conduct evaluation (data analysis)
Workshop (discussion of first evaluation findings)
MS/ EU Implementation analysis
Final report
Screening report:Discussed with Steering Group
Interim report:Discussed with Steering Group
SCREENING PHASE
Dec 2014 - Feb 2015
INTERIM PHASE
Feb - July 2015
FINAL PHASE
July - Dec 2015
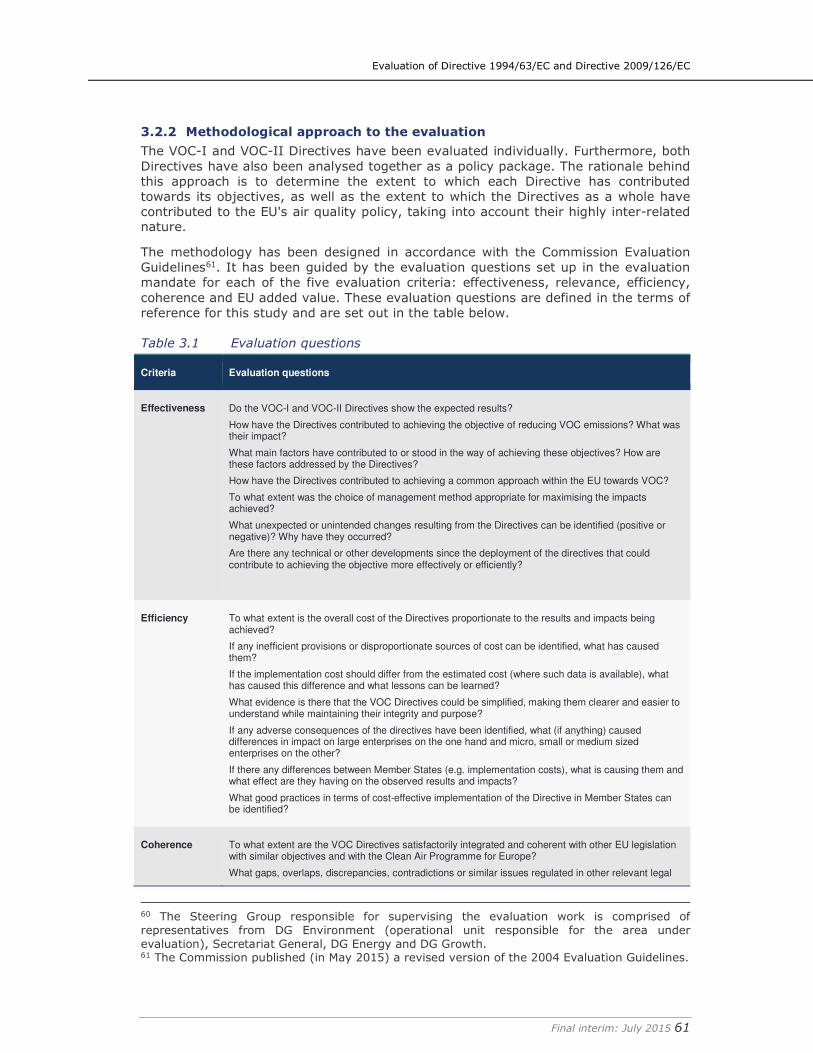
Evaluation of Directive 1994/63/EC and Directive 2009/126/EC
Final interim: July 2015 61
3.2.2 Methodological approach to the evaluation
The VOC-I and VOC-II Directives have been evaluated individually. Furthermore, both Directives have also been analysed together as a policy package. The rationale behind this approach is to determine the extent to which each Directive has contributed towards its objectives, as well as the extent to which the Directives as a whole have contributed to the EU's air quality policy, taking into account their highly inter-related nature.
The methodology has been designed in accordance with the Commission Evaluation Guidelines61. It has been guided by the evaluation questions set up in the evaluation mandate for each of the five evaluation criteria: effectiveness, relevance, efficiency, coherence and EU added value. These evaluation questions are defined in the terms of reference for this study and are set out in the table below.
Table 3.1 Evaluation questions
Criteria Evaluation questions
Effectiveness Do the VOC-I and VOC-II Directives show the expected results?
How have the Directives contributed to achieving the objective of reducing VOC emissions? What was their impact?
What main factors have contributed to or stood in the way of achieving these objectives? How are these factors addressed by the Directives?
How have the Directives contributed to achieving a common approach within the EU towards VOC?
To what extent was the choice of management method appropriate for maximising the impacts achieved?
What unexpected or unintended changes resulting from the Directives can be identified (positive or negative)? Why have they occurred?
Are there any technical or other developments since the deployment of the directives that could contribute to achieving the objective more effectively or efficiently?
Efficiency To what extent is the overall cost of the Directives proportionate to the results and impacts being achieved?
If any inefficient provisions or disproportionate sources of cost can be identified, what has caused them?
If the implementation cost should differ from the estimated cost (where such data is available), what has caused this difference and what lessons can be learned?
What evidence is there that the VOC Directives could be simplified, making them clearer and easier to understand while maintaining their integrity and purpose?
If any adverse consequences of the directives have been identified, what (if anything) caused differences in impact on large enterprises on the one hand and micro, small or medium sized enterprises on the other?
If there any differences between Member States (e.g. implementation costs), what is causing them and what effect are they having on the observed results and impacts?
What good practices in terms of cost-effective implementation of the Directive in Member States can be identified?
Coherence To what extent are the VOC Directives satisfactorily integrated and coherent with other EU legislation with similar objectives and with the Clean Air Programme for Europe?
What gaps, overlaps, discrepancies, contradictions or similar issues regulated in other relevant legal
60 The Steering Group responsible for supervising the evaluation work is comprised of representatives from DG Environment (operational unit responsible for the area under evaluation), Secretariat General, DG Energy and DG Growth. 61 The Commission published (in May 2015) a revised version of the 2004 Evaluation Guidelines.
Evaluation of Directive 1994/63/EC and Directive 2009/126/EC
Final interim: July 2015 62
Criteria Evaluation questions
acts, standards or activities can be identified which hampered or improved achievement of the objectives in the VOC Directives?
Relevance Are the key needs, problems and concerns related to VOC emissions from petrol addressed by the current Directives? (i.e. to what extent are the objectives still relevant to meet current needs)?
How do the Directives facilitate achieving the international obligations of the EU?
What (if any) obsolete provisions in the Directives can be identified and why are such provisions obsolete?
How have the Directives adapted to any technical or other developments since their adoption?
What is the overall perception of EU petrol vapour recovery legislation and policy among stakeholders and citizens?
EU Added Value
What has been the EU added value of the VOC-I and VOC-II Directives?
To what extent do the issues addressed by the Directives continue to require action at EU level?
What would be the most likely impacts of repealing the Directives?
How did VOC-II provide added value to those Member States in which similar measures were already in place and how did those Member States profit from implementing VOC-II in Member States where such measures were not in place?
How do the Directives contribute to improving air quality and health in the Union?
The following sections describe the key elements that have been used to structure the evaluation work: the intervention logic and the analytical framework. Intervention logic
The intervention logic is set out in Figure 15 and illustrates how the different components to be assessed are linked together i.e. specifying the various dimensions of the study, and the links between them. The diagram below sets out the general and specific objectives of the Directives which reflect the needs that they address, the means to realise these objectives, the expected outputs, and the specific and broader effects of the Directives. The diagram also includes other relevant legislation with linkages to the objectives of the VOC-I and VOC-II Directives.
The intervention logic serves as the basis for the analytical framework by providing an overview of the key areas, objectives, actions, expected outputs and impacts of the Directives that need to be considered during the evaluation.
The aim of the evaluation is to judge whether the Directives have met, through their specific objectives and the actions performed by the parties involved, the general objectives/ needs they were intended to address and whether they have actually achieved the expected effects (i.e. consequences/ results/ impacts). It involves assessing the extent to which the Directives have led to changes (including those that were unintended or unexpected), as well as measuring the level of influence that other external factors might have had on these changes.
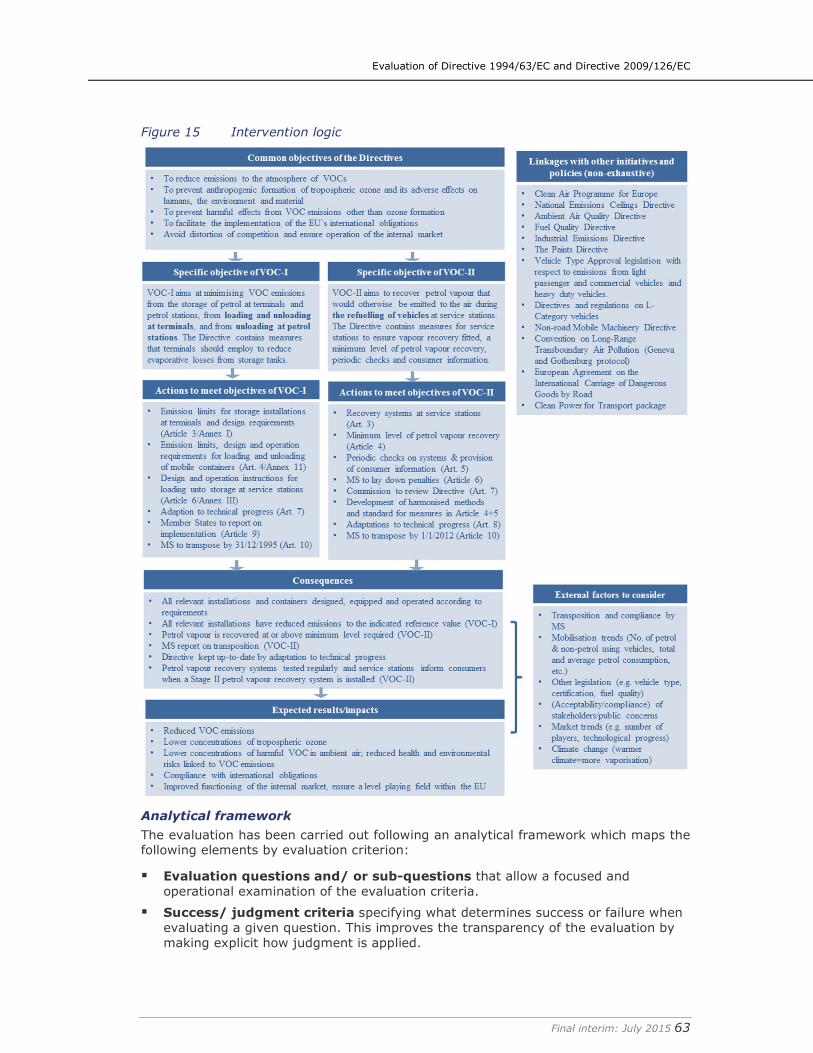
Evaluation of Directive 1994/63/EC and Directive 2009/126/EC
Final interim: July 2015 63
Figure 15 Intervention logic
Analytical framework
The evaluation has been carried out following an analytical framework which maps the following elements by evaluation criterion:
� Evaluation questions and/ or sub-questions that allow a focused and operational examination of the evaluation criteria.
� Success/ judgment criteria specifying what determines success or failure when evaluating a given question. This improves the transparency of the evaluation by making explicit how judgment is applied.
Evaluation of Directive 1994/63/EC and Directive 2009/126/EC
Final interim: July 2015 64
� Qualitative and quantitative indicators used to inform judgment on the questions and issues and assess success according to the judgement criterion chosen. Some indicators might be used to answer several evaluation questions. They determine the type of information to be collected and potential data sources.
� Methods and tools to be used to gather and assess the necessary evidence to respond to the evaluation questions, on the basis of the indicators identified. Where practicable, the analysis is based on several perspectives and data sources (“triangulation”) to avoid a one-sided approach and biased results. The input data for the indicators and criteria has been based on evidence collected via desk-based study and consultation interviews/data submissions involving a range of organisations and individuals with experience of the directives. Furthermore, the outcomes of the assessment of implementation and of the workshop also provide a key input into the evaluation framework.
The consolidated analytical table mapping each of the above elements per evaluation question is presented in Appendix C.
3.2.3 Methodological approach to assess the implementation status
The implementation of the Directives was assessed in two stages:
1. Analysis at Member State level: For each country a "Member State summary" has been developed which captures the status of implementation under each Directive, highlighting key issues. These are provided in Appendix D.
2. Analysis at EU level: On the basis of the analysis undertaken for each of the Member States, conclusions are drawn on the status of implementation at the EU-28 level. The horizontal analysis has involved analysing and presenting the key information from the individual summaries. It has enabled the identification of key difficulties and potential cases of non-compliance but also of positive aspects brought by the implementation of the Directives.
Due to the fact that there has been no formal reporting by Member States to the Commission on the status of implementation, evidence for the analysis originated from two sources: desk-based review of published documents (and legislation) and from extensive consultation with competent authorities and other relevant stakeholders (e.g. industry).
The approach to gather this information and the focus of analysis differed for the two Directives:
� For the VOC-I Directive the work has built on the findings of a previous assessment on implementation (Entec and REC, 2009). As part of this study a consultation was undertaken with the Member States in order to develop a country-specific summary on the implementation status of the VOC-I Directive. Building on these, the present study has assessed the key changes that have occurred since the last review and where available has incorporated additional information that was not previously considered.
� In the case of the VOC-II Directive, this is the first assessment of implementation, and therefore the focus was on assessing the extent to which Member States have met the timescales envisaged in the Directive (some of which have not yet elapsed) and are progressing with its implementation, and on assessing the items listed in Article 762. The outputs of the assessment will be used
62 These are: the 100 m3/year threshold referred to in Article 3(1)(b) and (2)(b) of the Directive and Article 6(3) of Directive 94/63/EC; the in-service compliance record of Stage II petrol vapour recovery systems; and the need for automatic monitoring equipment
Evaluation of Directive 1994/63/EC and Directive 2009/126/EC
Final interim: July 2015 65
by the Commission in their report to the European Parliament and the Council in accordance with Article 7.
While some information has been identified via a review of literature, the principal source of data has been consultation with interested stakeholders. In this sense, it is noted that conformity-checking studies have not been carried out for the VOC-II Directive and that Member States have not communicated information to the Commission on the transposition and implementation of Article 6 on penalties.
3.3 Interim phase
3.3.1 Background
The interim phase of the study was dedicated to the collection and analysis of data to inform both the evaluation and implementation assessment. This phase used a combination of research and analytical tools, including literature review and consultation via a dedicated survey informing both work streams.
3.3.2 Literature review
An ongoing desk-based review was used to collect information on existing developments and practices in the area of petrol vapour recovery as well as on the context in which the Directives operate (e.g. policy developments, emission trends). This involved reviewing a wide range of documents, a bibliography of which is provided in 8.1. The documentation reviewed includes:
� EU legislation and reports on policy implementation and evaluation in the context of the PVR Directives63. In particular the Impact Assessment (2008) accompanying the adoption of the VOC-II Directive has been particularly relevant. An equivalent impact assessment was not available for the VOC-I Directive so the potential for "ex post" comparison is more limited.
� Relevant studies from the Commission and other institutions (e.g. EEA, UNECE, and IIASA), emission inventories and ongoing initiatives in the wider context of air quality and linked legislation.
� Published statistics (e.g. Eurostat).
� Member States’ legislation transposing the Directives as well as national reports, ex-ante impact assessments and guidance documents on the Directives.
� Information provided by Member States to the Commission as part of reporting flows under other EU legal instruments (e.g. the FQD).
� Relevant standards or type approval certificates in this field (e.g. CEN EN 16321).
� Relevant legislation and technical developments in other countries or regions (e.g. Canada, USA).
While the above sources of information have provided relevant inputs to the evaluation and the implementation assessment, in general most of the literature focuses more on describing the background and applicable requirements in the field of PVR rather than on discussing quantitatively their benefits and costs or the level of uptake of PVR controls. Moreover, in the case of the VOC-II Directive, available literature and data often predates the adoption of the Directive, thereby hindering a comprehensive assessment of its results. Regarding the VOC-I directive, it is noted that available literature is quite dated due to the fact that it was implemented a long time ago.
63These reports are accessible here: http://ec.europa.eu/environment/air/transport/petrol.htm
Evaluation of Directive 1994/63/EC and Directive 2009/126/EC
Final interim: July 2015 66
3.3.3 Stakeholder Consultation
Approach
A consultation exercise has been undertaken to gather information and views from a wide range of stakeholders in order to build a robust evidence base to evaluate the performance of the Directives and assess their status of implementation. The outcomes of the consultation have largely informed and supported most of the findings and conclusions developed and drawn on both work streams.
The list of stakeholders that have participated in this study is divided into four main categories as follows:
� Member States’ competent authorities involved in the implementation of the Directives.
� Industry actors involved in the various activities of petrol storage and distribution covered by the Directive, including manufacture and distribution of equipment to control VOC emissions.
� Stakeholders who hold relevant expertise or knowledge on the topic or with known interest in the policy, including non-governmental organisations (NGOs) / associations who represent or speak on behalf of wider environmental and social interests, non-EU authorities or relevant stakeholders from countries with relevant legislation and/or technical developments in the field of PVR.
� EU officials with relevant expertise of working with policies with linkages to the Directives.
Stakeholders were invited to respond to a standard questionnaire structured around the evaluation criteria and the key topics to assess the status of implementation. Targeted phone interviews have been undertaken with representatives that either provided particularly interesting or relevant information in the questionnaire, preferred to be interviewed by phone or failed to respond in writing.
This approach has allowed focused/specific input to be collected from targeted respondents through direct interaction. The steering group for the project decided that a formal public consultation was not necessary (for the purposes of this specific contract) on the basis that the directives are primarily aimed at industry and that NGOs convey the interest of the general public.
Two dedicated questionnaires were designed: the first questionnaire was designed specifically to target Member States authorities with the aim of collating detailed evidence on the implementation and performance of the Directives in their territories. The second questionnaire targeted the other categories of stakeholders (i.e. industry and other interested or expert stakeholders) and mainly aimed at gathering their views on the performance of the Directives. To reach a suitable number of these stakeholders, a top down approach to distribution of the surveys was adopted, contacting first representatives from EU or supra-national organisations, through which platforms/associations at the national level were eventually contacted.
Before the questionnaires were released they were tested by a small group of users, including two competent authorities and two industry stakeholders. Both questionnaires can be found in the dedicated website maintained by DG ENV on the Directives64, through access to the public CIRCABC interest group.
Outcomes
The consultation was announced in February 2015 and conducted between March and May 2015. The majority of responses were submitted electronically and follow up 64http://ec.europa.eu/environment/air/transport/petrol.htm
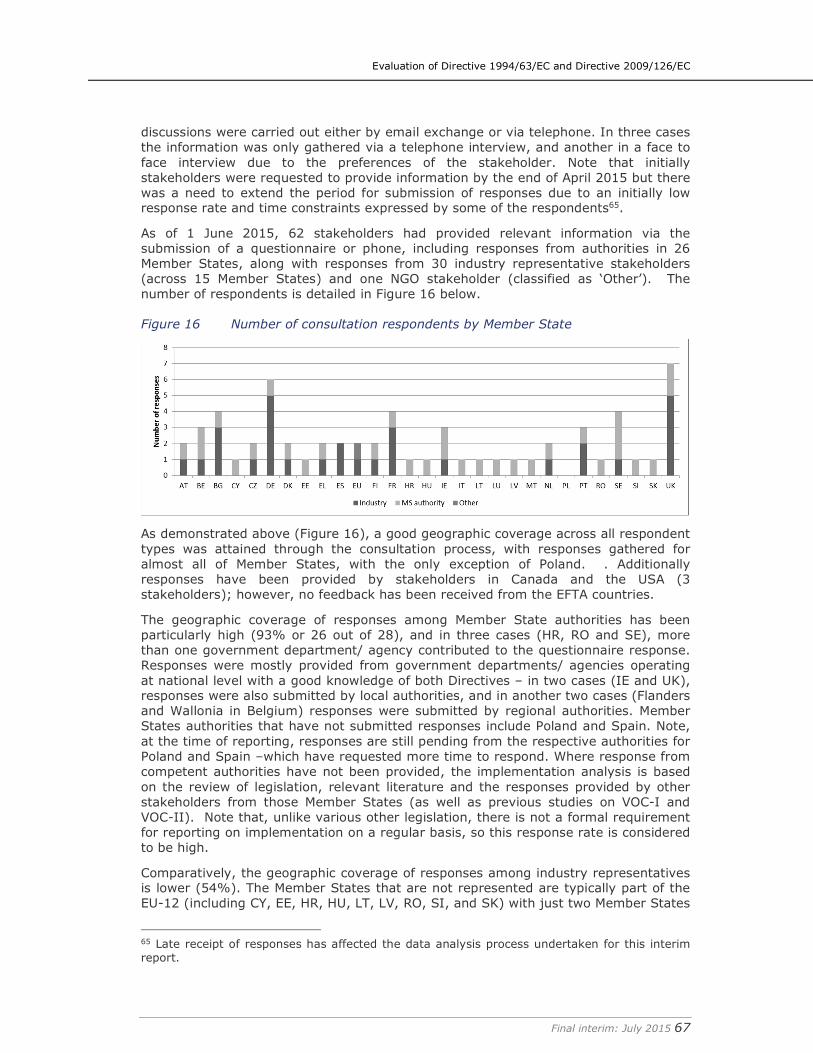
Evaluation of Directive 1994/63/EC and Directive 2009/126/EC
Final interim: July 2015 67
discussions were carried out either by email exchange or via telephone. In three cases the information was only gathered via a telephone interview, and another in a face to face interview due to the preferences of the stakeholder. Note that initially stakeholders were requested to provide information by the end of April 2015 but there was a need to extend the period for submission of responses due to an initially low response rate and time constraints expressed by some of the respondents65.
As of 1 June 2015, 62 stakeholders had provided relevant information via the submission of a questionnaire or phone, including responses from authorities in 26 Member States, along with responses from 30 industry representative stakeholders (across 15 Member States) and one NGO stakeholder (classified as ‘Other’). The number of respondents is detailed in Figure 16 below.
Figure 16 Number of consultation respondents by Member State
As demonstrated above (Figure 16), a good geographic coverage across all respondent types was attained through the consultation process, with responses gathered for almost all of Member States, with the only exception of Poland. . Additionally responses have been provided by stakeholders in Canada and the USA (3 stakeholders); however, no feedback has been received from the EFTA countries.
The geographic coverage of responses among Member State authorities has been particularly high (93% or 26 out of 28), and in three cases (HR, RO and SE), more than one government department/ agency contributed to the questionnaire response. Responses were mostly provided from government departments/ agencies operating at national level with a good knowledge of both Directives – in two cases (IE and UK), responses were also submitted by local authorities, and in another two cases (Flanders and Wallonia in Belgium) responses were submitted by regional authorities. Member States authorities that have not submitted responses include Poland and Spain. Note, at the time of reporting, responses are still pending from the respective authorities for Poland and Spain –which have requested more time to respond. Where response from competent authorities have not been provided, the implementation analysis is based on the review of legislation, relevant literature and the responses provided by other stakeholders from those Member States (as well as previous studies on VOC-I and VOC-II). Note that, unlike various other legislation, there is not a formal requirement for reporting on implementation on a regular basis, so this response rate is considered to be high.
Comparatively, the geographic coverage of responses among industry representatives is lower (54%). The Member States that are not represented are typically part of the EU-12 (including CY, EE, HR, HU, LT, LV, RO, SI, and SK) with just two Member States
65 Late receipt of responses has affected the data analysis process undertaken for this interim report.
Evaluation of Directive 1994/63/EC and Directive 2009/126/EC
Final interim: July 2015 68
being part of the EU-15 (IT and LU). This comparatively low geographic coverage among industry respondents in the EU-12 can in part be explained by the fact that the Directives were implemented at a later stage, and that the technologies are more developed elsewhere in Europe. Industry respondents consist of oil companies, storage terminals, service station operators and equipment suppliers and assessors, along with representatives of trade associations operating across the EU and in a handful of Member States (including AT, BG, DE, DK, FI, FR, PT and UK). Questionnaires have been received from parties representing both large companies and SME/independents. Of the industry respondents, 18 report that they have a good knowledge of both Directives, with just four having a better knowledge of VOC I (DE, ES, FR and UK), and three of VOC II (operating in DE)66.
The questionnaire from an environmental NGO is from an EU wide organisation with knowledge of the Directives. It is relevant to note that 11 European NGOs (some which are platforms integrating number of national NGOs) with experience in the environmental and transport fields have been approached. However, most of them have declined to participate due to their lack of knowledge on the Directives. For instance, the EU NGO Transport & Environment (T&E) noted that they were not aware of any NGOs working in this field.
As a whole, the information collated provides a good overview on how the Directives are being implemented in the EU Member States and gathers relevant views on their performance.
With regard to the level of completion of the questionnaires, 47 respondents have answered to a high to a moderate standard and have provided relevant information – particularly with regards to implementation of the Directives. However there are also questionnaires that show a low level of completion with subjective responses (9). It has also been observed that a few questions (e.g. on costs) might not provide the expected results (i.e. low answer rate or great disparity in the responses which may question their validity). A careful analysis of the robustness and the validity of the responses obtained to those questions based on available literature and expert judgement has been undertaken prior to their utilisation in the study.
More information about the participating stakeholders can be found in Appendix F.
3.3.4 Constraints and data limitations
In undertaking the evaluation and implementation assessment, there have been a number of challenges that the research team had to overcome and that have resulted in certain limitations of this study. The most important challenges have been:
� Timeframe: The VOC-II Directive entered into force in 2012. Considering that the latest data from several key datasets is from 2014 or earlier, it is not feasible to estimate the full benefit of the Directive. In particular there is a key deadline in 2019 for the VOC-II Directive and many service stations are not yet required to comply with the Directive.
� Difficulty in establishing the link between the Directives and VOC emissions: VOC emissions arising from the sector have decreased substantially since 1990. There are various reasons for this including a decrease in petrol sales over the years, which has been decoupled from the quantification of the emissions reduction achieved by the Directives. However, there is uncertainty associated with the proportion of the remaining VOC emissions reduction that can be attributed to the Directives. It is not feasible to determine accurately what would have happened in
66 Note that the remaining four responses had low response rates in relation to both Directives.
Evaluation of Directive 1994/63/EC and Directive 2009/126/EC
Final interim: July 2015 69
each Member State if the Directives were not in place, especially given the introduction of the Gothenburg protocol at the wider international level.
� Data constraints:
o The data on total emissions reported to the EEA has several limitations, including different approaches of Member State authorities when reporting the data in one sector or another. This hinders the use of these data for the estimation of emission reductions that can be attributed to the Directives.
o There have been difficulties in obtaining the data from the GAINS model thus far. The data presented in the report thus far are provided for comparison purposes only, in compliance with IIASA’s terms of use.
o Actual data on control costs is limited and not readily available in public literature. GAINS was explored to provide an insight into the costs incurred by Member States but it only provides annualised costs, and these are not believed to have been updated with retrospective estimates of actual costs incurred. In addition, it was not possible to determine the model’s assumptions with regard to total costs, technology lifespan and the first year when it was introduced in each Member State, from the data provided. Also, the costs are usually aggregated per GAINS sector (e.g. Stage IB and II at service stations are often aggregated), which does not allow an individual quantification of Stage I and II controls. Moreover, GAINS historical data is only available from the year 2000 onwards. Finally, GAINS could not be used to calculate a cost per tonne of VOC abated due to the discrepancies between GAINS and data used the more up-to-date information from the consultation for this project, with respect to the uptake levels of Stage I and II controls
o Consistency of datasets: various data provided in the consultation and in public literature (petrol sales data, number of stations, emissions reported to the EEA) are from different years, thus making it difficult to establish a reference year for the analysis of current levels of emissions reduction/ uptake. In addition to this, the data provided by the stakeholders consulted was voluntary, which has influenced in the level of detail provided for each Member State.
� Absence of provisions facilitating data collection (e.g. lack of figures on uptake of controls, number of service stations in each throughput band): Assumptions on uptake levels have relied heavily on data from the consultation. However, it is clear that, in many Member States, data that would facilitate a detailed assessment of implementation and evaluation are not routinely collected (e.g. on PVR control systems in place and number of service stations in each throughput band).
� Uncertainty in the emission reduction figures, as well as on the costs and benefits estimated in the model developed by Amec Foster Wheeler: Given the constraints with the data outlined above, there is uncertainty with the emission reductions and costs estimated in the model related to a number of assumptions including the assumed level of uptake, the assumed efficiency and cost of the equipment or possible interactions between stage I and II equipment that have not been taken into account.
� Constraints in the consultation: There has been a varied response rate to the survey undertaken for the study. This has hindered the aggregation of the answers to several questions. Also, some stakeholders based their answers on their subjective opinion without providing further explanations or data to support

Evaluation of Directive 1994/63/EC and Directive 2009/126/EC
Final interim: July 2015 70
their statements, which increases the uncertainty and the risk of misleading/biased answers.
� Triangulation was not possible for all questions. In some cases, information had to rely to a large extent on consultation responses rather than on available literature.
Evaluation of Directive 1994/63/EC and Directive 2009/126/EC
Final interim: July 2015 71
4. Results and analysis – Implementation of Directive
1994/63/EC (VOC-I)
4.1 Overview
This section provides an overview of the current status of implementation of the Directive across the EU-28. The overview is based on the Member State specific analyses (presented in Appendix D).
An extensive review of the status of implementation of the VOC-I across the EU-27 was undertaken in 2009 (Entec and REC, 2009), which was after the implementation deadline for the majority of Member States. The work under this study has built on the findings of the previous 2009 review and has assessed key changes that have occurred since that time and where available has incorporated additional information that was not previously considered, including an assessment of the status of implementation in Croatia which was not covered in the previous review.
The Directive does not establish a systematic reporting framework requiring Member States to report to the Commission on their status of implementation. Therefore, the majority of the information required for the 2009 review was derived from extensive (and voluntary) consultation with relevant organisations responsible for implementing the Directive as well as from a review of relevant literature. This included the review of work by an Environmental Fuels Expert Group (EFEG) in the 1990s which involved reviewing the technical provisions of the Directive and which led to a number of recommendations regarding possible changes to the Annexes to the Directive.
The 2009 review resulted in the development of country-specific summaries on the implementation status of the VOC-I Directive. In order to avoid duplication of efforts, the 2009 summaries have been submitted to competent authorities to allow them to comment on whether these need updating and/or provide new information.
4.2 Horizontal Status of implementation (EU wide)
Overall, the previous 2009 review concluded that, despite some data gaps, the vast majority of implementation work had already been done and, with a few seemingly minor exceptions (based on the data available), the provisions seemed to have been implemented. In addition, the majority of Member States did not seem to have introduced additional derogations or time limits to those established in the Directive or Accession Treaties for compliance with the Directive.
At the time of the present implementation assessment, all transition periods have now expired and the Directive’s requirements are fully applicable in all Member States. This includes Croatia, which was granted (in the Accession Treaty of 200167) a transition period until 31 December 2012 to comply with the Directive.
Based on the information gathered as part of this study, the following can be concluded on the status of implementation, in comparison with the 2009 review:
� In 13 Member States (Austria, Cyprus, Czech Republic, Estonia, Germany, Hungary, Italy, Latvia, Netherlands, Poland, Slovakia, Slovenia and UK) the Directive’s requirements appeared to have been implemented and applied correctly at the time of the 2009 study. For these countries there is no information to suggest that this has changed. In general, authorities consulted have indicated that the 2009 review reflects the current status of implementation in their
67http://www.mvep.hr/custompages/static/hrv/files/pregovori/ZSEUEN/27.pdf
Evaluation of Directive 1994/63/EC and Directive 2009/126/EC
Final interim: July 2015 72
countries. Only Poland has not provided a response to the survey (thus far) but it is likely that the Directive continues to be applied correctly as it has been implemented in full since 2007.
� For a few Member States there appeared to have been certain delays and/or issues with implementation:
o For Lithuania, the 2009 review indicated that there were a few service stations (35 out of 530) that did not comply with the national legislation transposing the Directive. As part of this consultation, the Lithuanian Ministry of Environment notes that they cannot provide updated information on the status of service stations. However, in the near future the Ministry intends to initiate a study aimed to assess the compliance of terminals and petrol service stations with the requirements of VOC-I and VOC-II Directives.
o For France the 2009 review noted that it was rare for mobile tankers of less than 7.5t to be fitted with vapour recovery equipment (all the rest had it). It is unclear whether this continues to be the case (clarification is pending from the Member State).
o In Ireland, some small terminals located inland were not yet subject to permitting and authorities were hoping for these terminals to be in compliance with the Directive by 2010. Consultation with the Environmental Protection Agency has confirmed that, since 2008, the permitting of pre-existing smaller inland terminals has been completed.
o For Finland and Sweden, the 2009 review confirmed that the Directive had been implemented completely, except for Annex IV (Specifications for road tankers) due to local issues specific to these countries, where they followed the recommendations raised at the ‘Environmental Fuels Expert Group’ in 1997. Information provided as part of this study suggests that this continues to be the case. The differences in implementation for these Member States are not expected to have significant implications for the level of environmental protection achieved or for intra-EU trade. This is described in greater detail in Section 4.3 of this report.
o For the Walloon region of Belgium, consultation suggested that national legislation allowed a transitional period up to 1 January 2010 for stations with storage tanks that were less than 20 years old in 2001. It was anticipated that all terminals and service stations in Wallonia would comply with the requirements of the Directive no later than 1st January 2010 and information provided as part of the consultation does not suggest that the derogation has been renewed.
o The 2009 review identified that in Greece a small number of road tankers did not comply with the requirements of the Directive (although steps were being taken to rectify this). In addition, whilst all service stations had Stage I controls fitted, in some cases they were reportedly not being used and/or operated correctly. The competent authority consulted was unclear on whether any update was required to the 2009 report. Therefore it has not been possible to conclude on whether these issues have been rectified. Clarification has been requested from other competent authorities but no information has been received.
� For Bulgaria and Romania there were various transition periods (until 31 December 2009) for compliance with the requirements of the Directive that had not passed at the time of the 2009 study. As such, it was noted that not all of the requirements had been implemented at that stage in those two countries. These derogations have now ended and the Directives' requirements appear to be fully in force.
Evaluation of Directive 1994/63/EC and Directive 2009/126/EC
Final interim: July 2015 73
� For five Member States (Luxembourg, Denmark, Malta, Portugal and Spain) the previous report included insufficient information to fully comment on the status of implementation:
o Luxembourg has provided information to update the summary. They note that the Directive was fully implemented and applied in the late 1990s.
o Malta provided relevant information to reflect the current status of implementation. Malta notes that due to the local market situations (i.e. lack of local equipment suppliers), the VOC-I Directive has not yet been fully implemented in the regulated activities (terminals mobile tankers and service stations). In particular, all road tankers but one still need to be retrofitted to comply with the VOC-I directive. However it is noted that steps are being taken to rectify this and that the service stations have obtained all relevant permits to upgrade to the Directive’s requirements by 2018.
o Denmark’s response to the survey indicated there is no need to update the 2009 report. Their response at that time indicated that they could not obtain data from the municipalities, which are responsible for the permitting and inspection activities; though they surmised that the Directive was working satisfactorily.
o Portugal has provided information to update the summary with regard to a description of competent authorities and designated inspection bodies. However, there is still insufficient information to comment on the status of implementation. Further information will be included for the revised report if available.
o For Spain no response has been received to the survey on this issue and there is insufficient information to comment on the status of implementation.
� Croatia was not covered in the 2009 review. Information gathered as part of this study shows that Croatia has fully transposed and applied the Directive’s requirements. However, it appears that by the end of 2014 Stage I controls have not been fitted in all terminals (5 out of 14) and service stations (approximately 710 out of 721)68. Given that the transition period established in the Accession Treaty for Croatia expired in December 2012 there appear to have been some delays in implementation.
Based on the above, it can be concluded that most Member States (for which information was available) appear to have fully implemented and applied the requirements of the Directive. For some Member States the implementation issues identified in the 2009 review have now been solved (Ireland, Romania, Bulgaria, Luxembourg). For others due to insufficient information it has not been possible to comment on the status of implementation (Denmark, Portugal and Spain) or on whether delays and/or issues with implementation identified in the previous review have been rectified (France, Greece). In the case of Croatia, information gathered suggests that there has been a delay in the implementation of the Directive in some terminals and service stations. Delays in implementation have been also identified for Malta, particularly regarding the retrofitting of mobile road tankers. This is summarised in the chart below.
68 Croatia has collected data for 721 petrol stations. There is still lack of data for approximately 100 petrol station due to the fact that the owners did not deliver the data.
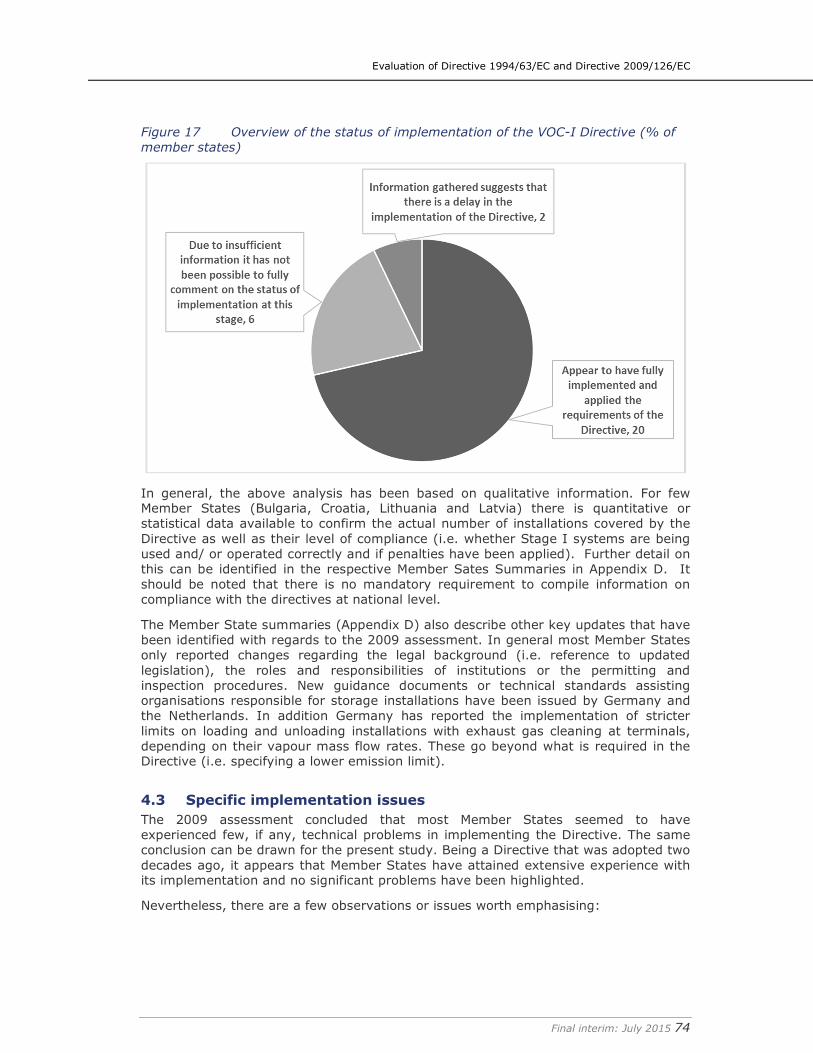
Evaluation of Directive 1994/63/EC and Directive 2009/126/EC
Final interim: July 2015 74
Figure 17 Overview of the status of implementation of the VOC-I Directive (% of
member states)
In general, the above analysis has been based on qualitative information. For few Member States (Bulgaria, Croatia, Lithuania and Latvia) there is quantitative or statistical data available to confirm the actual number of installations covered by the Directive as well as their level of compliance (i.e. whether Stage I systems are being used and/ or operated correctly and if penalties have been applied). Further detail on this can be identified in the respective Member Sates Summaries in Appendix D. It should be noted that there is no mandatory requirement to compile information on compliance with the directives at national level.
The Member State summaries (Appendix D) also describe other key updates that have been identified with regards to the 2009 assessment. In general most Member States only reported changes regarding the legal background (i.e. reference to updated legislation), the roles and responsibilities of institutions or the permitting and inspection procedures. New guidance documents or technical standards assisting organisations responsible for storage installations have been issued by Germany and the Netherlands. In addition Germany has reported the implementation of stricter limits on loading and unloading installations with exhaust gas cleaning at terminals, depending on their vapour mass flow rates. These go beyond what is required in the Directive (i.e. specifying a lower emission limit).
4.3 Specific implementation issues
The 2009 assessment concluded that most Member States seemed to have experienced few, if any, technical problems in implementing the Directive. The same conclusion can be drawn for the present study. Being a Directive that was adopted two decades ago, it appears that Member States have attained extensive experience with its implementation and no significant problems have been highlighted.
Nevertheless, there are a few observations or issues worth emphasising:
Evaluation of Directive 1994/63/EC and Directive 2009/126/EC
Final interim: July 2015 75
4.3.1 Local conditions of certain Member States (Sweden and Finland)
As noted in the 2009 assessment, there are specific issues for Sweden and Finland in that they do not fully comply with the requirements in Annex IV due to the nature of the pre-existing Stage I controls in place in these Member States and their specific climatic circumstances. Because of the colder temperatures, different types of equipment are required e.g. temperature coefficient of thermistors, which are not specified in the Directive. Moreover, the road tankers used in these Member States are different from those used in other Member States. They have different sized fuel and vapour return lines and often have trailers in addition to the main tanker. In particular, it is noted that 3 inch vapour recovery couplings for bottom loading instead of the 4 inch couplings required by the Directive are used. According to the feedback received from the Member State authority in Sweden, some parts of the Directive are difficult to apply in countries with severe winter conditions.
Work by the Environmental Fuels Expert Group (EFEG) led to a number of recommendations to encompass these States (and information available for this study suggests that the Directive has been implemented in line with the EFEG recommendations in these Member States). The 2009 review concluded that these provisions do not appear likely to compromise the overall aims of the VOC-I Directive in terms of control of VOC emissions. In addition, given the relative geographic isolation of these Member States, the conclusions of the EFEG technical sub-group suggested that the provisions as recommended would be sufficient to avoid adverse effects upon cross-border trade.
In this regard, measures have been taken to avoid adverse effects upon intra-EU trade. In particular adapters for 4 inch couplings were reported to be available on one gantry at each Swedish terminal (Entec and REC, 2009). It is understood that these have very rarely been used given that these Member States are relatively isolated geographically as compared to other Member States (it has been suggested that some use may have occurred in southern Sweden where road tankers from other Member States, with 4 inch couplings, may visit). Therefore, the impact on intra-EU trade is considered to be minimal.
4.3.2 Derogations
Few Member States appear to have introduced the derogations established in the Directive for smaller terminals and service stations. The 2009 review indicated that Italy, France and Ireland had permitted the application of the derogation as set out in Article 4 (4) of the Directive which allows some terminals with throughput below 10,000 tonnes/year to retain the use of top-loading equipment. No information has been identified on whether these derogations have been renewed or have expired and are no longer available. For instance the derogation was due to end in 2010 for Italy. Nonetheless, the continuation of these derogations is compliant with the VOC-I Directive.
Additionally, the derogation set out in Article 6 (4) has been implemented by the UK for existing petrol stations with a throughput less than 500m3/year (since these are not expected to contribute significantly to environmental or health problems). As these apply to small sites, whose number has been declining over the past years, the overall effect in terms of VOC emissions was expected to be relatively small.
4.3.3 Stringent concentration limits at vapour recovery units (VRUs)
Some Member States have introduced more stringent concentration limits for VOC emissions at vapour recovery units (VRUs) at terminals than that established in Annex II of the Directive (35 g/Nm3). Based on information gathered as part of this consultation, Table 4.1 presents the Member States, for which information is available, that have gone beyond the requirements of the Directive.
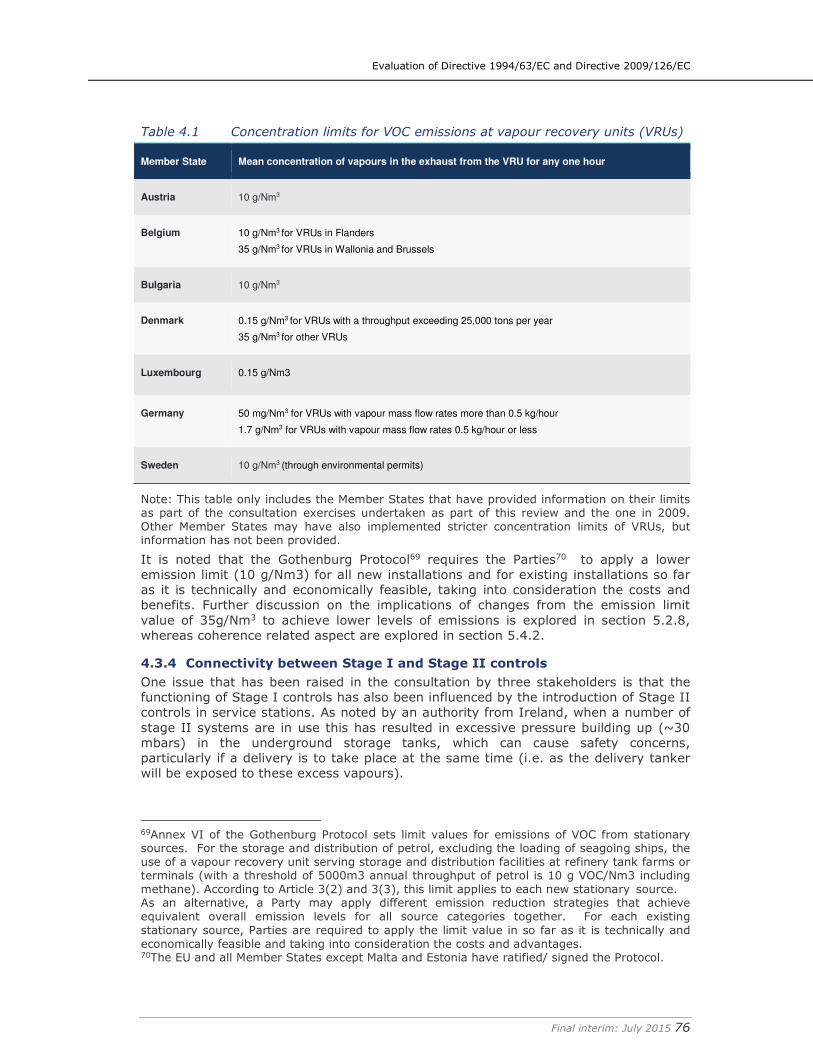
Evaluation of Directive 1994/63/EC and Directive 2009/126/EC
Final interim: July 2015 76
Table 4.1 Concentration limits for VOC emissions at vapour recovery units (VRUs)
Member State Mean concentration of vapours in the exhaust from the VRU for any one hour
Austria 10 g/Nm3
Belgium 10 g/Nm3 for VRUs in Flanders
35 g/Nm3 for VRUs in Wallonia and Brussels
Bulgaria 10 g/Nm3
Denmark 0.15 g/Nm3 for VRUs with a throughput exceeding 25,000 tons per year
35 g/Nm3 for other VRUs
Luxembourg 0.15 g/Nm3
Germany 50 mg/Nm3 for VRUs with vapour mass flow rates more than 0.5 kg/hour
1.7 g/Nm3 for VRUs with vapour mass flow rates 0.5 kg/hour or less
Sweden 10 g/Nm3 (through environmental permits)
Note: This table only includes the Member States that have provided information on their limits as part of the consultation exercises undertaken as part of this review and the one in 2009. Other Member States may have also implemented stricter concentration limits of VRUs, but information has not been provided.
It is noted that the Gothenburg Protocol69 requires the Parties70 to apply a lower emission limit (10 g/Nm3) for all new installations and for existing installations so far as it is technically and economically feasible, taking into consideration the costs and benefits. Further discussion on the implications of changes from the emission limit value of 35g/Nm3 to achieve lower levels of emissions is explored in section 5.2.8, whereas coherence related aspect are explored in section 5.4.2.
4.3.4 Connectivity between Stage I and Stage II controls
One issue that has been raised in the consultation by three stakeholders is that the functioning of Stage I controls has also been influenced by the introduction of Stage II controls in service stations. As noted by an authority from Ireland, when a number of stage II systems are in use this has resulted in excessive pressure building up (~30 mbars) in the underground storage tanks, which can cause safety concerns, particularly if a delivery is to take place at the same time (i.e. as the delivery tanker will be exposed to these excess vapours).
69Annex VI of the Gothenburg Protocol sets limit values for emissions of VOC from stationary sources. For the storage and distribution of petrol, excluding the loading of seagoing ships, the use of a vapour recovery unit serving storage and distribution facilities at refinery tank farms or terminals (with a threshold of 5000m3 annual throughput of petrol is 10 g VOC/Nm3 including methane). According to Article 3(2) and 3(3), this limit applies to each new stationary source. As an alternative, a Party may apply different emission reduction strategies that achieve equivalent overall emission levels for all source categories together. For each existing stationary source, Parties are required to apply the limit value in so far as it is technically and economically feasible and taking into consideration the costs and advantages. 70The EU and all Member States except Malta and Estonia have ratified/ signed the Protocol.
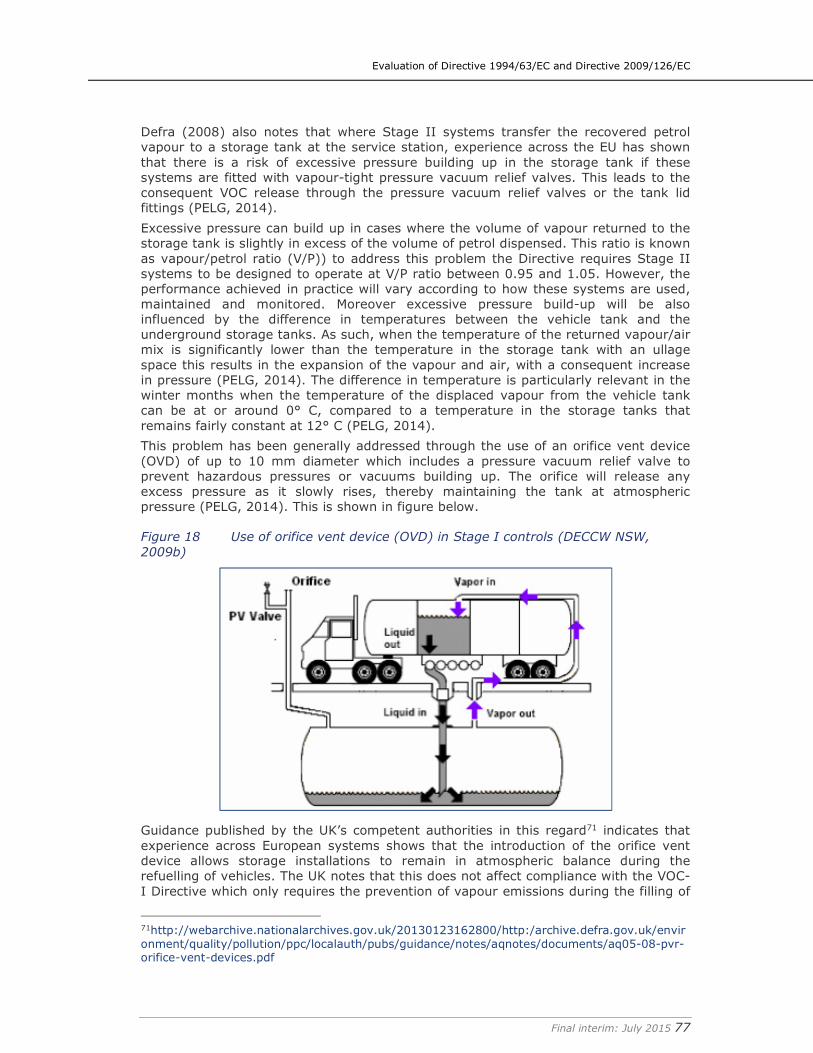
Evaluation of Directive 1994/63/EC and Directive 2009/126/EC
Final interim: July 2015 77
Defra (2008) also notes that where Stage II systems transfer the recovered petrol vapour to a storage tank at the service station, experience across the EU has shown that there is a risk of excessive pressure building up in the storage tank if these systems are fitted with vapour-tight pressure vacuum relief valves. This leads to the consequent VOC release through the pressure vacuum relief valves or the tank lid fittings (PELG, 2014).
Excessive pressure can build up in cases where the volume of vapour returned to the storage tank is slightly in excess of the volume of petrol dispensed. This ratio is known as vapour/petrol ratio (V/P)) to address this problem the Directive requires Stage II systems to be designed to operate at V/P ratio between 0.95 and 1.05. However, the performance achieved in practice will vary according to how these systems are used, maintained and monitored. Moreover excessive pressure build-up will be also influenced by the difference in temperatures between the vehicle tank and the underground storage tanks. As such, when the temperature of the returned vapour/air mix is significantly lower than the temperature in the storage tank with an ullage space this results in the expansion of the vapour and air, with a consequent increase in pressure (PELG, 2014). The difference in temperature is particularly relevant in the winter months when the temperature of the displaced vapour from the vehicle tank can be at or around 0° C, compared to a temperature in the storage tanks that remains fairly constant at 12° C (PELG, 2014).
This problem has been generally addressed through the use of an orifice vent device (OVD) of up to 10 mm diameter which includes a pressure vacuum relief valve to prevent hazardous pressures or vacuums building up. The orifice will release any excess pressure as it slowly rises, thereby maintaining the tank at atmospheric pressure (PELG, 2014). This is shown in figure below.
Figure 18 Use of orifice vent device (OVD) in Stage I controls (DECCW NSW,
2009b)
Guidance published by the UK’s competent authorities in this regard71 indicates that experience across European systems shows that the introduction of the orifice vent device allows storage installations to remain in atmospheric balance during the refuelling of vehicles. The UK notes that this does not affect compliance with the VOC-I Directive which only requires the prevention of vapour emissions during the filling of
71http://webarchive.nationalarchives.gov.uk/20130123162800/http:/archive.defra.gov.uk/environment/quality/pollution/ppc/localauth/pubs/guidance/notes/aqnotes/documents/aq05-08-pvr-orifice-vent-devices.pdf
Evaluation of Directive 1994/63/EC and Directive 2009/126/EC
Final interim: July 2015 78
storage tanks. In this sense, it has been calculated that the vacuum generated by the delivery tanker within the storage tank during filling should prevent emissions from the 10-millimetre orifice.
Nevertheless, in addition to pressure relief systems there are other techniques/practices that could be implemented to address over pressurisation in a proactive way. Further discussion on the use of these techniques is discussed in section 5.2.8.
It is noted that this issue was already acknowledged during the adoption process of the VOC-II Directive as well as during the approval of CEN Standard EN 16321:201372. However, the final decision was to not regulate this aspect in the Directive on the grounds that it would be difficult for manufacturers of Stage II systems to meet the 85% recovery criterion if this included additional emissions from the vent pipe which might not be related to the functioning of the Stage II equipment. Similarly during negotiation of the CEN Standard EN 16321:2013, it was decided to postpone the issue, though it could ultimately form an additional or complementary part to the CEN standard. Alternatively it could constitute a subject to be covered by EU Guidance.
72 Commission letter of May 2010 [from Environment Directorate C – Industry] to CEN TC 393 [ref. ENV C.3/DJ/pb ARES(2010) 274854]
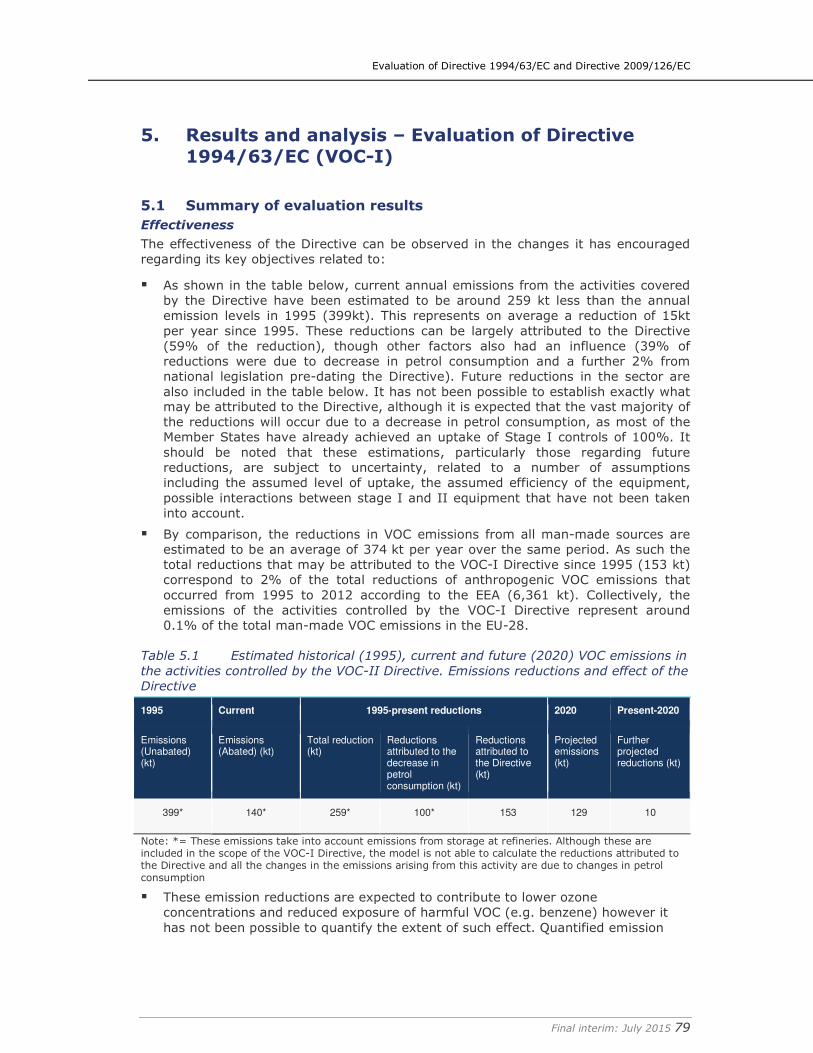
Evaluation of Directive 1994/63/EC and Directive 2009/126/EC
Final interim: July 2015 79
5. Results and analysis – Evaluation of Directive
1994/63/EC (VOC-I)
5.1 Summary of evaluation results
Effectiveness
The effectiveness of the Directive can be observed in the changes it has encouraged regarding its key objectives related to:
� As shown in the table below, current annual emissions from the activities covered by the Directive have been estimated to be around 259 kt less than the annual emission levels in 1995 (399kt). This represents on average a reduction of 15kt per year since 1995. These reductions can be largely attributed to the Directive (59% of the reduction), though other factors also had an influence (39% of reductions were due to decrease in petrol consumption and a further 2% from national legislation pre-dating the Directive). Future reductions in the sector are also included in the table below. It has not been possible to establish exactly what may be attributed to the Directive, although it is expected that the vast majority of the reductions will occur due to a decrease in petrol consumption, as most of the Member States have already achieved an uptake of Stage I controls of 100%. It should be noted that these estimations, particularly those regarding future reductions, are subject to uncertainty, related to a number of assumptions including the assumed level of uptake, the assumed efficiency of the equipment, possible interactions between stage I and II equipment that have not been taken into account.
� By comparison, the reductions in VOC emissions from all man-made sources are estimated to be an average of 374 kt per year over the same period. As such the total reductions that may be attributed to the VOC-I Directive since 1995 (153 kt) correspond to 2% of the total reductions of anthropogenic VOC emissions that occurred from 1995 to 2012 according to the EEA (6,361 kt). Collectively, the emissions of the activities controlled by the VOC-I Directive represent around 0.1% of the total man-made VOC emissions in the EU-28.
Table 5.1 Estimated historical (1995), current and future (2020) VOC emissions in
the activities controlled by the VOC-II Directive. Emissions reductions and effect of the
Directive
1995 Current 1995-present reductions 2020 Present-2020
Emissions (Unabated) (kt)
Emissions (Abated) (kt)
Total reduction (kt)
Reductions attributed to the decrease in petrol consumption (kt)
Reductions attributed to the Directive (kt)
Projected emissions (kt)
Further projected reductions (kt)
399* 140* 259* 100* 153 129 10
Note: *= These emissions take into account emissions from storage at refineries. Although these are included in the scope of the VOC-I Directive, the model is not able to calculate the reductions attributed to the Directive and all the changes in the emissions arising from this activity are due to changes in petrol consumption
� These emission reductions are expected to contribute to lower ozone concentrations and reduced exposure of harmful VOC (e.g. benzene) however it has not been possible to quantify the extent of such effect. Quantified emission
Evaluation of Directive 1994/63/EC and Directive 2009/126/EC
Final interim: July 2015 80
reductions are also relevant to achieve the national ceilings and emission reduction targets set at an international level.
� The VOC-I Directive has also triggered a level playing field by laying down minimum and harmonised requirements to control VOC emissions from Stage I operations which have been fundamental in safeguarding the cross-border trade of petrol and equipment. Overall, a common approach across the EU has been achieved; national regulations are generally aligned, with only some exceptions (e.g. some Member States in the Arctic region), which are expected to have a limited impact on the correct functioning of the internal market.
Additionally, the Directive appears to have contributed to technological innovation (including the development of technical standards) and the increased awareness of workers (i.e. risk management), with no strong evidence being identified for any significant unexpected/unintended negative impacts.
The approach chosen with the Directive involving the establishment of emission limits and detailed technical provisions thus appears to have been effective in achieving its expected results. Some stakeholder consulted for the study have suggested that a more flexible approach that enables the Directive to be adapted to technical progress and innovation could have led to further reductions in emissions. In particular, that there is potential to increase the efficiency of petrol vapour recovery based on current state of the art, notably through reducing the emission limit values specified for vapour recovery units (VRUs) at terminals.
Efficiency
On efficiency, the fact that the Directive has been in place for a long time has meant that limited quantified evidence (both ex-ante and ex-post) on the costs and benefits of implementing Stage I controls for operators and authorities has been identified. This has precluded any form of robust cost-benefit analysis at this stage. The installation of the Stage I equipment at terminals (particularly VRUs) has been reported as the most significant cost, while the installation of controls at service stations appears to be much simpler and less costly (although this will depend on the size of the service station). As such, small throughput sites, especially those operated by SME, are likely to have faced higher compliance costs due to economies of scale and relative lack of sufficient resources to meet the requirements of the Directive (i.e. they will face a higher cost per litre of petrol sold).
Concerning benefits, in general terms, the reduction of the harmful effects on health and the environment associated with VOC emissions reductions can be considered the main benefit of the application of Stage I controls. These have been estimated to be between €162m and €479m annually, comparing annual emissions in the ‘current’ year compared to those in 1995, see section 5.3.2). There are also financial benefits to the industry from sales of petrol recovered using the vapour recovery equipment (estimated to be around €136m excluding tax and duties (annualised)), as well as financial benefits through having harmonised technical provisions amongst and within member states, including the facilitation of cross-border trade in petrol. Finally, the Directive contributes to employment levels in this sector, including those involved in its manufacture and maintenance/ testing.
An analysis of the simplification potential of the Directive has identified a few approaches that could be applied to make the Directive simpler while maintaining its integrity and purpose. These include issuing guidance on certain issues or even the possibility of removing certain technical requirements from the Annexes and replacing these with references to external documents such as CEN standards. Initial findings from the evaluation suggest that there are no apparent provisions that hinder cost-
Evaluation of Directive 1994/63/EC and Directive 2009/126/EC
Final interim: July 2015 81
effectiveness and good practices in this regard at national level have been identified in section 5.3.8.
Coherence
Overall, no major incoherencies were identified between the objectives of the VOC-I Directive and other EU and international legislation on air quality. The main difference relates to the scope of the legislation and some of the technical requirements and provisions, where some potential overlaps and inconsistencies were identified, however none were significant enough to merit strong argument for the revision or amendment of the Directive. For example, several stakeholders from Member State authorities brought up the fact that the VOC-I Directive includes a 35 g/m³ VOC emission limit for vapour recovery units, which is considerably higher than the 10 g/m³ limit under the Gothenburg Protocol. Comments from stakeholders suggested that this could hamper achievement of international obligations. However, Member State performance on VOC emission rates indicate that they are reaching VOC emission rates much lower than what is stipulated by the VOC-I Directive and the Gothenburg Protocol. Therefore, it does not appear that the Directive in its current form is preventing Member States from fulfilling the international obligations.
In addition, several areas were identified where the different air quality and emissions legislation along with the VOC-I Directive could work better work together. These include the promotion of greater international cooperation in this field and the promotion of initiatives that encourage technological innovation.
Relevance
Despite the fact that the VOC-I Directive has been established for several years in the EU, it remains relevant because it responds to the environmental and health objectives of the EU by contributing to the reduction of harmful VOC emissions into the atmosphere from petrol storage and distribution. This is also highlighted by the recently reaffirmed need for tighter national ceilings for VOC emissions in 2020 and 2030. As such it is noted that the majority of stakeholders have a positive to very positive view of the VOC I Directive (75% of total respondents).
Concerning the existence of obsolete provisions, apart from those related to past deadlines and timescales, it was identified through literature review and stakeholder consultation that further investigation was needed to determine whether some the technical requirements need to be updated or maintained in the Annexes of the Directive.
The Directive has not been adapted to technological progress and developments, though it includes a mechanism for doing so in principle. Since the adoption of the Directive, several new technologies have been developed that have the potential to increase the efficiency of petrol vapour recovery, though it has been estimated that these would only achieve relatively minor VOC reductions compared with the current situation. Such technologies are not necessarily covered by the Directive, therefore there is potential for the Directive to better respond to today’s needs by better addressing these developments. However, it is noted that although the Directive’s Annexes have not been updated since its adoption, this has not prevented Member States from setting stricter emission limits in their national legislation and reaching performance levels beyond those stipulated by the Directive.
EU-added value
The VOC-I Directive has been instrumental in establishing an EU-wide common approach to addressing emissions from petrol storage and distribution operations. In its absence it is likely that individual national action would have led to the development of divergent regulatory systems that could affect the correct functioning
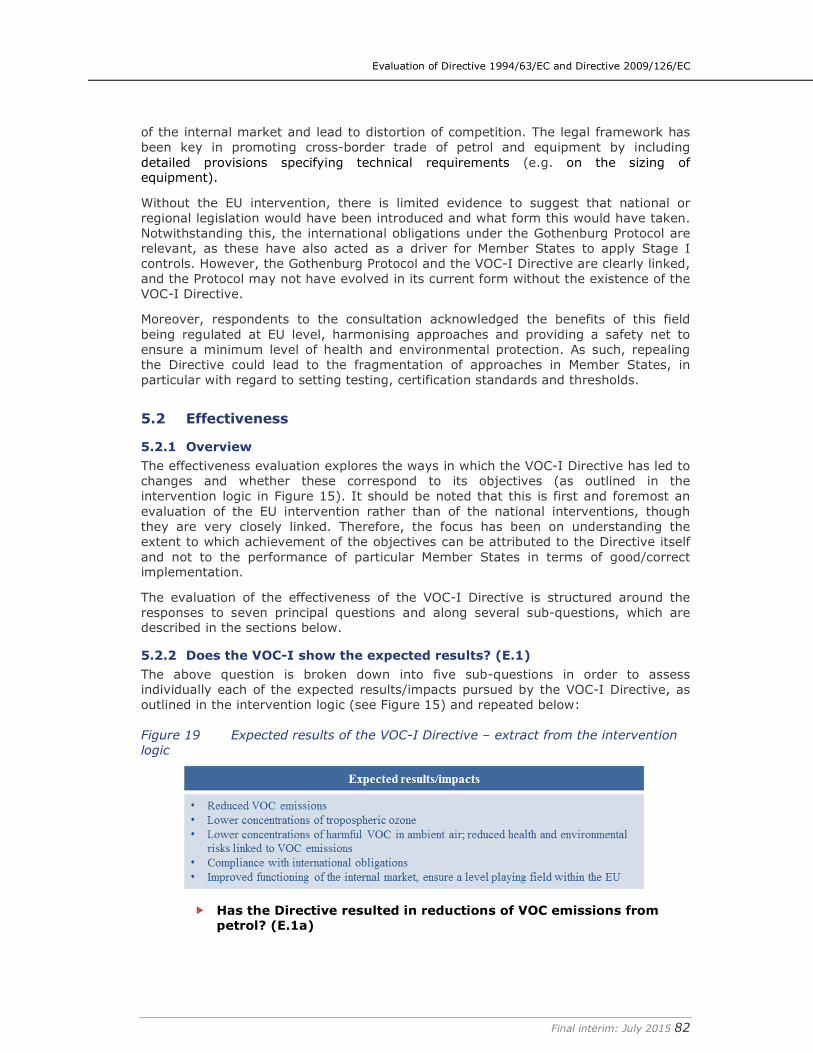
Evaluation of Directive 1994/63/EC and Directive 2009/126/EC
Final interim: July 2015 82
of the internal market and lead to distortion of competition. The legal framework has been key in promoting cross-border trade of petrol and equipment by including detailed provisions specifying technical requirements (e.g. on the sizing of equipment).
Without the EU intervention, there is limited evidence to suggest that national or regional legislation would have been introduced and what form this would have taken. Notwithstanding this, the international obligations under the Gothenburg Protocol are relevant, as these have also acted as a driver for Member States to apply Stage I controls. However, the Gothenburg Protocol and the VOC-I Directive are clearly linked, and the Protocol may not have evolved in its current form without the existence of the VOC-I Directive.
Moreover, respondents to the consultation acknowledged the benefits of this field being regulated at EU level, harmonising approaches and providing a safety net to ensure a minimum level of health and environmental protection. As such, repealing the Directive could lead to the fragmentation of approaches in Member States, in particular with regard to setting testing, certification standards and thresholds.
5.2 Effectiveness
5.2.1 Overview
The effectiveness evaluation explores the ways in which the VOC-I Directive has led to changes and whether these correspond to its objectives (as outlined in the intervention logic in Figure 15). It should be noted that this is first and foremost an evaluation of the EU intervention rather than of the national interventions, though they are very closely linked. Therefore, the focus has been on understanding the extent to which achievement of the objectives can be attributed to the Directive itself and not to the performance of particular Member States in terms of good/correct implementation.
The evaluation of the effectiveness of the VOC-I Directive is structured around the responses to seven principal questions and along several sub-questions, which are described in the sections below.
5.2.2 Does the VOC-I show the expected results? (E.1)
The above question is broken down into five sub-questions in order to assess individually each of the expected results/impacts pursued by the VOC-I Directive, as outlined in the intervention logic (see Figure 15) and repeated below:
Figure 19 Expected results of the VOC-I Directive – extract from the intervention
logic
� Has the Directive resulted in reductions of VOC emissions from petrol? (E.1a)
Evaluation of Directive 1994/63/EC and Directive 2009/126/EC
Final interim: July 2015 83
A detailed analysis of historical and projected VOC emissions trends in the petrol storage and distribution sector has been conducted in section 2.2.4. As can be observed in Figure 11, the total VOC emissions from the petrol distribution and storage sector have decreased from 1995 to the current uptake level of the VOC-I and VOC-II Directives based on the results of the model developed by Amec Foster Wheeler (a total decrease of 428 kt). This figure includes the overall reduction that can be attributed to both Directives (239 kt). Section 2.2.4 compares this reduction with the official data that has been reported to the EEA over the years, confirming that emissions from the sector have had a declining trend. The analysis of the official data includes a comparison of the evolution of historical VOC emissions from the sector and the historical petrol sales (emission factor). This comparison shows that, although both petrol sales and the Directives have influenced the emissions reduction, the Directives have had a more significant impact.
Focusing on the VOC-I Directive, the analysis can be tailored to assess the reductions occurring when filling tanks at service stations as well as in loading facilities.
The model developed by Amec Foster Wheeler estimates 134 kt and 123 kt VOC emitted from filling tanks and loading facilities respectively for 1995, assuming no VOC-I controls at all (baseline emissions, noting the uncertainties and qualifications in Section 2).
Based on data on current petrol sales and uptake of Stage I controls, the model estimates 4 kt and 6 kt VOC emitted from filling tanks and loading facilities, respectively, which collectively represent around 0.1% of the total man-made VOC emissions in the EU-28 (Figure 20). This equates to emissions reductions of 97% (129 kt) and 95% (117 kt) respectively. As outlined in section 2.2.4, part of this reduction is due to a decrease in petrol sales as well as to national action taken by some Member States (Sweden and Austria) before the Directive came into force. It is estimated that 35% (45 kt VOC) of the reductions in the tank filling process have been caused by a decrease of petrol sales, whereas 58% may be attributed to the Directive and the rest (7%) is estimated to be due to pre-existing national legislation. The total reductions that may be attributed to the VOC-I Directive since 1995 (153 kt) correspond to 2% of the total reductions of anthropogenic VOC emissions that occurred from 1995 to 2012 according to the EEA (6,361 kt). It should be noted that there is a high level of uncertainty with these results as it is not possible to ascertain what would have happened in other Member States if the Directive had never been introduced. Also, there are several uncertainties related to the assumed uptake levels, efficiency of the equipment, interactions with Stage II equipment and emissions from storage facilities at refineries.
The emissions from the processes controlled by the VOC-I Directive in 1995 and petrol sales in 1995 can be compared to the emissions of the same processes with the current uptake and the latest petrol sales data (2012). This is known as the Emission Factor (EF) and provides an indication of the emission intensity of a given activity. As it provides the quantity of emissions per unit of fuel sold, it will not be influenced by lower or higher petrol sales over the period of interest. The EFs (Table 5.2) decrease very significantly, thus showing that the VOC-I Directive has influenced in the VOC emissions reductions in the filling of tanks and at loading facilities, given that the amount of VOC emissions per unit of fuel sold has decreased.
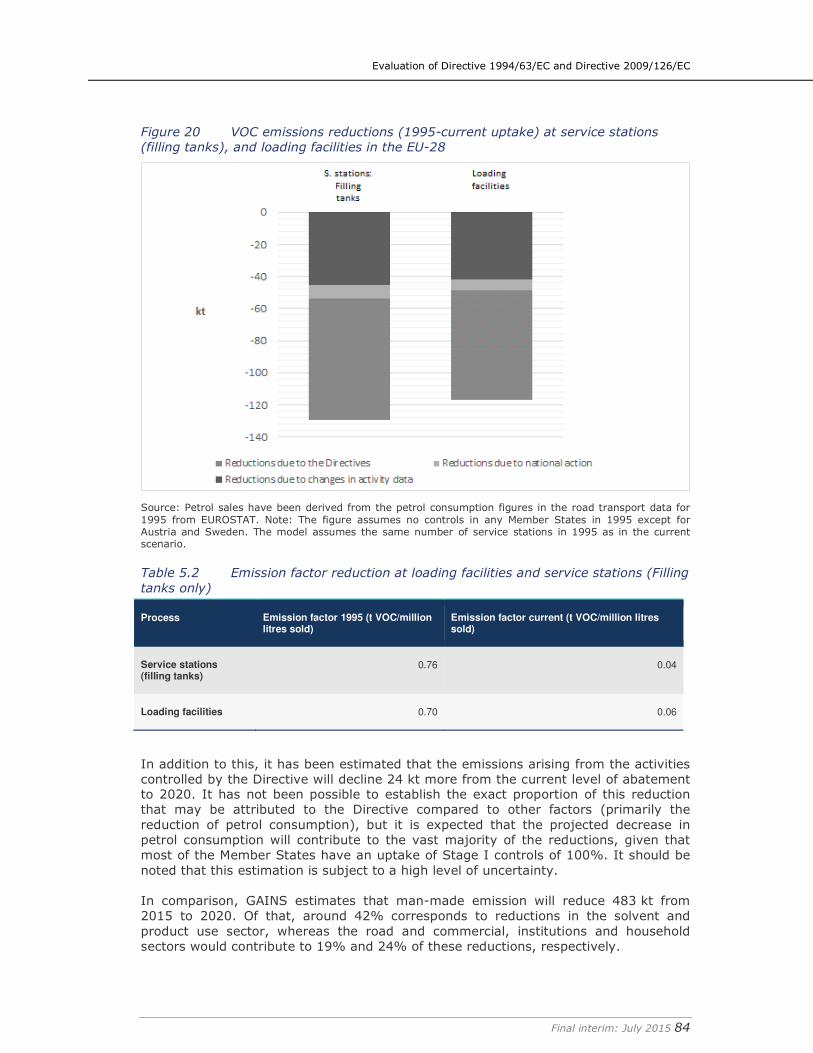
Evaluation of Directive 1994/63/EC and Directive 2009/126/EC
Final interim: July 2015 84
Figure 20 VOC emissions reductions (1995-current uptake) at service stations
(filling tanks), and loading facilities in the EU-28
Source: Petrol sales have been derived from the petrol consumption figures in the road transport data for 1995 from EUROSTAT. Note: The figure assumes no controls in any Member States in 1995 except for Austria and Sweden. The model assumes the same number of service stations in 1995 as in the current scenario.
Table 5.2 Emission factor reduction at loading facilities and service stations (Filling
tanks only)
Process Emission factor 1995 (t VOC/million litres sold)
Emission factor current (t VOC/million litres sold)
Service stations (filling tanks)
0.76 0.04
Loading facilities 0.70 0.06
In addition to this, it has been estimated that the emissions arising from the activities controlled by the Directive will decline 24 kt more from the current level of abatement to 2020. It has not been possible to establish the exact proportion of this reduction that may be attributed to the Directive compared to other factors (primarily the reduction of petrol consumption), but it is expected that the projected decrease in petrol consumption will contribute to the vast majority of the reductions, given that most of the Member States have an uptake of Stage I controls of 100%. It should be noted that this estimation is subject to a high level of uncertainty. In comparison, GAINS estimates that man-made emission will reduce 483 kt from 2015 to 2020. Of that, around 42% corresponds to reductions in the solvent and product use sector, whereas the road and commercial, institutions and household sectors would contribute to 19% and 24% of these reductions, respectively.
Evaluation of Directive 1994/63/EC and Directive 2009/126/EC
Final interim: July 2015 85
� Has the Directive contributed to lower concentrations of tropospheric ozone? (E.1b)
VOC emissions are a key precursor of tropospheric ozone, so their reductions are usually regarded as leading to reductions of this secondary pollutant (Entec 2002). This implies that the emissions reductions achieved through implementation of the VOC-I Directive (as quantified above) have contributed to the Directive’s objective to reducing ozone concentrations.
However, the atmospheric processes which form ozone are characterised by their complexity, relying not only on the presence of VOC but also on sunlight and other precursors including CO, NOx, SO2 and NH3 (for example, reductions of NOx emissions in certain areas may not lead to a decrease in ozone concentrations, for instance in highly urbanised areas of central and western Europe). The relationship of ozone concentration to the emitted precursors is not linear and it is influenced by a number of factors including meteorological conditions. Moreover, reactions leading to the formation of ozone in the presence of sunlight take place relatively slowly and hence elevated ozone concentrations can be found hundreds or even thousands of kilometres away from a given source of VOC emissions such as a petrol station. As such, emissions reductions achieved in one country or region might be insignificant compared to the contribution from trans-boundary ozone pollution.
In this regard, Entec (2011) modelled ozone concentration increases due to changes in VOC emissions in relation to the (then) potential waivers granted in the scope of the FQD and concluded that some Member States with lower VOC emissions increases would experience higher ozone concentration exceedances than others with higher increases as a result of transboundary ozone from neighbour Member States. However, it was noted that the increase in numbers of days when the ozone target value is exceeded was likely to be small in relation to increases in emissions resulting from changed vapour pressure of petrol potentially allowed under waivers to the FQD.
Additionally, as noted earlier in section 2.3, different VOC have different abilities to create ozone, which is measured by the calculation of their Photochemical Ozone Creation Potential (POCP). As can be seen in Table 2.10 the petrol storage and distribution sector has a high proportion of VOC with a significant contribution to the creation of tropospheric ozone (i.e. with high POCP values) and therefore VOC emission reductions in this sector are relevant to reductions in low-level ozone concentrations.
Data from the EEA (2014b, 2014c) indicates that tropospheric ozone concentrations have decreased since 2003 and that episodic peak concentrations are less common now than they were in 2003. However, the trend is not always clear and EEA (2014b) indicates that the number of exceedances over the information threshold (180 µg/m3 in a one-hour average) was higher in 2012 than in 2011.
All these considerations make it difficult and complex to perform a quantitative assessment on the extent to which the Directives are having an effect on ozone concentrations.
� Has the Directive resulted in lower concentrations of harmful VOC
in ambient air (e.g. benzene)? (E.1c)
As described in section 2.3, petrol emissions contain harmful substances including benzene, toluene and hexane. Of these, benzene is of most concern, being classified as a human genotoxic carcinogen for which there is no known safe level of exposure.
Therefore reductions of petrol vapour emissions from activities covered by the VOC-I Directive also reduce the concentration of benzene and other harmful VOC in and
Evaluation of Directive 1994/63/EC and Directive 2009/126/EC
Final interim: July 2015 86
around terminals and petrol station forecourts. However, it is difficult to determine the effect of the Directives on benzene concentrations. This is mainly due to the following reasons:
� Benzene emissions are not included as an individual pollutant in European emissions inventories covering VOC. This means that benzene emissions are not recorded. Moreover, benzene concentrations in ambient air are measured at a relatively small number of stations (512 in 2012) across the EU (EEA, 2014b).
� It is important to consider that there are other policies regulating exposure to benzene from petrol. The FQD limits the benzene content of petrol (1% v/v) since the year 2000, whereas Regulation (EC) N° 715/2007 on the type approval of motor vehicles restricts the emissions of hydrocarbons from road vehicles (including VOC emissions although benzene is not targeted specifically). Therefore, it is difficult to allocate the extent to which the VOC-I Directive has contributed to reductions of VOC in comparison to other regulatory instruments.
Nevertheless, several studies show that Stage I as well as Stage II systems have been effective in reducing exposure to benzene and other hazardous substances. In a study by Edokpolo et al. (2014) it was concluded that health risk identified due to benzene exposure for service station attendants and mechanics repairing petrol dispensing pumps was minimised for service stations using vapour recovery systems. These reduced the level of exposure to benzene to levels of minimal concern. Similarly, a programme of measurements of the benzene concentrations in air in the vicinity of petrol stations conducted on behalf of Defra (2000) showed how the fitting Stage I controls significantly reduced the measured benzene concentrations.
� Has the Directive contributed to compliance with international obligations? (E.1d)
As described in section 2.1 (see Table 2.1), the key international obligations in the field of VOC emissions are the 1979 Geneva Protocol and the 1999 Gothenburg Protocol (recently revised in 2012) which have been ratified/signed by the European Union and most Member States. Under these protocols specific VOC emission reduction targets and national emission ceilings for VOC have been established.
Analysis under question E.1a, has shown that the VOC-I Directive has resulted in reductions of VOC emissions to the atmosphere, thus contributing to progress made in achieving the emission targets set at an international level.
However, as noted in section 2.2, it is difficult to isolate and determine the specific contribution of the VOC-I Directive to achieving these targets, mainly because VOC emissions result from a number of sources and are influenced by a wide range of causes (e.g. petrol consumption trends). In this sense, analysis under section 2.2 reveals that petrol storage and distribution have contributed to reductions of around 202 kt VOC since 1995, of which 153 kt (64%) corresponds to reductions in the activities controlled by the VOC-I Directive. On the other hand, emissions data reported to the EEA by Member States demonstrates that reductions in the road transport, solvents and commercial and institution combustion sectors have been much more significant in the same period of time (3,865 kt, 1,131 and 408 kt, respectively). These three sectors account for 43% of the total reductions achieved in the EU. Therefore, the regulation of other sources seems to have played a larger role in contributing to compliance with international targets.
In line with this, 24 responses to the consultation from both industry stakeholders and Member State authorities have expressed that the VOC-I Directive has only contributed “to some extent” to compliance with international obligations, with fewer
Evaluation of Directive 1994/63/EC and Directive 2009/126/EC
Final interim: July 2015 87
(15) considering that the contribution has been large. This seems to reflect the relatively low weight of this sector compared to other sources of VOC emissions.
Moreover, these protocols also require use of best available techniques, including particular reference to Stage I controls. However, as noted in section 4.3.3 and indicated by several stakeholders, the technical requirements of the Directive might not be sufficiently integrated and coherent with the Gothenburg Protocol. Further analysis on coherence-related aspects of international obligations is described in section 5.4 (see questions C.1 and C.2).
� Has the Directive improved the functioning of the internal market? (E.1e)
Prior to the adoption of the VOC-I Directive in 1994, Stage I controls had been already introduced by national legislation in Sweden (since 1991) and Austria (since 1993) and other Member States were considering their introduction. In this sense the 1991 Geneva Protocol already required of its Parties the application of techniques to reduce VOC emissions through Stage I controls (in line with Annexes II and III to the Protocol). Moreover, some industry stakeholders had already started to implement these systems at their sites (e.g. in Finland). Therefore, there was a risk that development of different regulatory systems across the Member States could affect the correct functioning of the internal market and lead to distortion of competition. In particular, as noted in the Directive, harmonised techniques regarding the equipment for loading of mobile tankers were needed to ensure the possibility of cross-border trade of petrol and equipment (i.e. movement of mobile tankers across the EU).
In this context, the adoption of the VOC-I Directive contributed to establishing a level playing field by laying down minimum and harmonised requirements that Member States should impose regarding the control of VOC emissions from Stage I operations. In this sense, 28 responses to the consultation agreed to the fact that the VOC-I Directive has contributed (at least to some extent) to the internal market objective.
In particular, the Directive imposes requirements on the sizing of equipment (for instance Annex IV defines the size of couplings) which facilitates this cross-border trade. Without this, equipment would be physically incompatible.
Overall, the Member States national regulations are generally aligned with the requirements of the Directive and only some have gone beyond or deviated from regards to specific aspects. As indicated in section 4.3 these include the introduction of stricter concentration limits in VRUs in some Member States (see section 4.3.3) and the specific case of Sweden and Finland, which do not fully comply with the specifications for road tankers, though this is expected to have minimal impact on intra-EU trade (see section 4.3.1)
5.2.3 How has the Directive contributed to achieving the objective of
reducing VOC emissions? What was its impact? (E.2)
The VOC-I Directive prescribes emission limits that need to be achieved by the various regulated activities and includes detailed provisions specifying technical requirements that can be relied upon to deliver emission reduction. For instance, Article 4 states that loading and unloading equipment shall be designed and operated in accordance with the technical provisions of Annex II, which are designed to reduce the total annual loss of petrol resulting from loading and unloading of mobile containers at terminals to below the target reference value of 0,005 w/w % of the throughput.
Compared to other regulatory approaches that set national emission levels (or ceilings) but leave flexibility on the type of controls and measures to be adopted by
Evaluation of Directive 1994/63/EC and Directive 2009/126/EC
Final interim: July 2015 88
Member States, the Directive has been quite predictable in terms of the level of emissions that could be reduced.
5.2.4 What main factors have contributed to or stood in the way of achieving
these objectives? How are these factors addressed by the Directive?
(E.3)
A number of factors have contributed to or stood in the way to achieving the objectives of the Directive in line with what has been discussed in previous sections. The factors identified are classified into four broad categories, as follows:
� Technical (with reference to the equipment and approaches used);
� Financial (primarily budget availability);
� Political (in terms of implementation); and
� External (such as high petrol prices, warm climates and pressure from consumers, among others).
It is noted that the analysis for this question has relied heavily on feedback received via consultation. In this sense, the aim was to assess what have been the main successes or problems encountered by those affected by the Directive, and published literature analysing the Directive from this point of view is limited.
Technical factors
Stakeholders that responded are generally in agreement that technical factors in relation to the equipment used for VOC abatement contribute to the success of the Directive (according to 23 respondents out of 31 that responded to this question). There are mixed views in terms of the relatively prescriptive approach used in the Directive, with some regarding the approach as a success factor (4) and others as a barrier (4).
The fact that VOC I technologies are now well-established in the EU is regarded in several Member States as a contributing factor to the success of the Directive (according to 7 respondents, including industry representatives in AT, FI, IE and PT as well as authorities in FI, LU and PT).
Also, 4 respondents have noted the fact that only one equipment option exists and the design has made it easier for operators to comply with the Directive and removes the risk of potential issues arising from contractors (as raised by industry representatives in IE, SE and FR and the Member State authorities in NL and CY).
While some respondents regard the well-established nature of the legislation as a contributing factor to the success of the Directive (industry representatives in AT, FI and PT – and authorities in LU), others (authorities in FR, NL and SE and industry in DE) find the technical requirements of VOC-I Directive too detailed and in need of simplification.
Financial factors
The investments needed are regarded by 10 consultation respondents as a barrier to achieving the Directive's objectives, although 3 industry stakeholders indicated that the timeframe within which the Directive has been implemented has allowed sufficient time for operators to overcome this barrier.
The large capital investment required to install VOC I equipment is viewed as a difficulty for respondents in many Member States (industry representatives in AT, BG, FR, NL, PT and UK as well as authorities in LT, LV and PT), along with the ongoing costs of inspections and human resources (or lack thereof as referred to by authorities in BG, IE, LT, LV and RO). According to the authorities in Bulgaria the fact that the
Evaluation of Directive 1994/63/EC and Directive 2009/126/EC
Final interim: July 2015 89
capital needed is provided by operators has contributed to the success of the Directive.
A small number of respondents noted that the early adoption of VOC I controls in many cases made it easier for businesses to plan their investments within a reasonable timeframe (according to industry representatives in AT, NL and UK). Two industry stakeholders in the UK note however that the renewal cycle for trucks was an initial barrier for VOC I implementation as a critical mass was needed before the VRU at terminal became financially viable. This problem still remains in Malta where it has been reported by the competent authority that most mobile tankers still do not comply with the Directive’s requirements.
Political factors
One success factor that was raised by 5 respondents is good cooperation between the authorities and operators. However, relatively limited comments were made concerning implementation of the Directive, and issues raised are typically specific to the Member State in question and few commonalities have been identified. Nonetheless the comments that were made provide a good insight into implementation in specific Member States and a summary is provided here.
Good cooperation between the authorities and operators is identified as a success factor by industry representatives in BG, DE, DK as well as authorities in CY and DK. Other success factors identified include:
• One industry representative in Austria specifies that the fact that the authority responsible for the implementation of the Directive had a good level of knowledge contributed to the success of the Directive.
• The inspection process is well implemented and facilitates the proper functioning of the equipment (German industry representative).
• According to the Dutch authorities, the political willingness to implement environmental policies more generally is thought to have had positive implications for the implementation of the Directive.
In France, the deadline to implement the national regulation was considered to be too fast for operators to be able to comply according to one industry stakeholder. Furthermore, the implementation of the Directive in administrative terms led to difficulties in certain cases where different government departments/ agencies are responsible for different aspects of the national legislation, creating difficulties in monitoring (according to authorities in SE and LT). Similarly, authorities in Ireland note that the Directive is not enforced consistently throughout the different counties.
External factors
A number of external factors pertaining to the success of the Directive were identified by consultation stakeholders (14), with only one indicating that certain external factors have acted as barriers. There are mixed views concerning the role of consumer pressure in achieving the Directive's objectives.
The most commonly identified external factor affecting the success of the Directive is the economic incentive to operators provided by VOC I technologies through petrol savings (referred to by authorities in IE, HU and NL, along with industry stakeholders in PT and SE). This has promoted the value of vapour as an asset, which has produced innovation in technology. Equally, savings made through tax rebates, where available, is referred to by authority and industry respondents in DE, DK and NL as a success factor. One Portuguese industry stakeholder regards the lack of a tax rebate in its Member State as a barrier to achieving the objectives of the Directive.
Evaluation of Directive 1994/63/EC and Directive 2009/126/EC
Final interim: July 2015 90
Other success factors identified through the consultation include:
� The warm climate, resulting in greater petrol recovery (authorities in CY and industry PT).
� The general willingness of operators to comply (industry in CZ).
� VOC I systems reduce the fire risk at terminals, giving operators an additional incentive to comply (industry in DE, NL, UK, IE).
Overall it would seem that there are mixed views concerning the role of consumer pressure in achieving the Directive's objectives. According to 6 industry stakeholders, the general public has a low awareness of VOC I systems – this is viewed as an issue for achieving the Directive's objectives where compliance has led to greater petrol prices resulting in reduced acceptance by the general public (industry in DE and NL). On the other hand, a few responses given indicate that the low consumer awareness has in fact contributed to the success of the Directive as no extensive quality assurance or consultation processes were necessary (industry representatives in AT and DE).
5.2.5 How has the Directive contributed to achieving a common approach
within the EU towards VOC? (E.4)
As noted in the analysis to question E.1e on the internal market objective (see last point of section 5.2.2), the adoption of the Directive almost two decades ago and the high level of technical detail provided (particularly in its technical Annexes) have played a major role in ensuring consistency across the EU. National legislation is aligned to a large extent with the Directive, with a low number of discrepancies (e.g. concentration limit in VRUs) being identified. The results from the stakeholder consultation reflect this conclusion, with 49 responses indicating that the Directive has played a major role in achieving a common EU approach.
37 responses have also indicated that the two Directives have been key in driving harmonisation of standards and techniques across the EU with regards to VOC abatement. In this sense, since the adoption of the VOC I Directive a number of European CEN standards and technical reports73 have been produced which cover some of the requirements of the Directive. Further detail on the development of such standards and their implications in terms of the potential of simplification and the coherence with the Directive are described in sections 5.3.5 (question EF.4) and 5.4.2 (question C.2) respectively.
5.2.6 To what extent was the choice of management method appropriate for
maximising the impacts achieved? (E.5)
Although a Directive gives Member States a degree of flexibility in the way they chose to implement its requirements, there is substantial detail prescribed by the Directive (including annexes setting out requirements for storage installations, loading/unloading and bottom-loading). In the absence of European standards at that time, the Directive also aimed to ensure a certain degree of harmonisation in the
73 A standard is a technical document designed to be used as a rule, guideline, or definition. CEN produces European Standards which imply an obligation to implement as an identical national standard in CEN member countries. Standards are voluntary and as such do not impose any legislative requirements. However, laws and regulations may refer to certain European Standards and make compliance with them compulsory. European Standards are sometimes used to provide presumption of conformity with European Directives. By contrast, a Technical Report is a document produced within a CEN Technical Committee that provides background information, for example on how to implement standards in specific cases. Technical Reports may contain informative material not suitable to be published as a European Standard (Entec and REC, 2009).
Evaluation of Directive 1994/63/EC and Directive 2009/126/EC
Final interim: July 2015 91
approach as well as in the techniques applied to ensure the possibility of cross-border trade of petrol and equipment.
The characterisation of the management method and their appropriateness has been made by distinguishing three perspectives: 1) the legislative approach/instrument used (i.e. choice of a Directive rather than e.g. a Regulation or voluntary approach); 2) the type of Directive (i.e. level of prescription) and 3) the type and detail of the technical provisions used. Stakeholders were requested to provide their opinion on each of these as described below.
The legislative approach (meaning the use of a directive) is regarded as appropriate by 18 consultation respondents (including industry stakeholders from BG, CZ, ES, FR, NL, PT and UK as well as authorities in AT, BE-F, BG, CY, DE, EE, HU, LT, LV, MT, PT, RO and SE). One reason provided is that the Directive offers a degree of flexibility to Member States in the way that the rules are implemented – as opposed to if the requirements were set in a regulation (as specified by an industry representative in BG). The Dutch authority question whether or not VOC I controls require EU intervention. 4 consultation stakeholders indicate that there is a need for the requirements to be set under a regulation instead (according to industry stakeholders in FI and IE and authorities in HR and the UK). The main reason for this is that regulations avoid possible confusions concerning technical requirements during transposition which is considered to be important here as the VOC I Directive includes many technical requirements.
The level of prescription is regarded as appropriate by 15 consultation respondents (including industry representatives in FR, IE, PT and the UK and authorities in AT, BE, BG, CY, EE, HU, IE, LT, LV, PT and RO). However, 4 respondents regard the Directive as technically too detailed (according to industry respondents in FI and SE and the authorities in NL and SE). The Swedish authorities refer in particular to the unnecessary detail provided for terminals and mobile containers – as noted by the Dutch authorities where the Directive is considered too prescriptive, Member States lack the flexibility needed to facilitate innovation in VOC abatement technologies.
In contrast, a small share of respondents find that more technical details are needed (e.g. industry in ES and the authorities in the UK). In the UK it is felt that the level of detail needed is not possible in the legislative approach taken (i.e. that a regulation would have been more appropriate). In France, the lack of detail in certain prescriptions has reportedly led to some discrepancies in the way in which the Directive is implemented according to one industry representative (although the overall approach of the Directive is considered appropriate).
While authorities in AT, CY and LV find that the type and detail of technical provisions is appropriate, several criticisms were raised by consultation stakeholders – as follows:
� One German industry representative finds that the EU should align limit values for VOC I controls between Member States – particularly in Germany, it finds the current limit value too low. In this regard it is noted that the Directive sets a minimum standard for environmental protection and that Member States can implement stricter measures.
� Authorities in BE, BG, NL and SE find that the technical provisions are outdated and that more flexibility should be provided by the Directive to facilitate innovation and uptake of best available techniques. As noted by a French industry representative, the technological advances in VOC I controls since the Directive was issued cannot always be reflected in the detail of the technical provisions. In contrast, the Irish authorities responded that, although they feel provisions should
Evaluation of Directive 1994/63/EC and Directive 2009/126/EC
Final interim: July 2015 92
be included to encourage innovation, the technical provisions are not out of date at the time of reporting.
� According to a Spanish industry representative, more detail in the technical provisions is needed. Another industry representative (from PT) notes that there is scope for multiple interpretations of the technical provisions that makes it difficult to compare different installations, but no further specific detail is provided..
A UK industry representative notes that detail on the frequency of testing Stage I systems should be included in the Directive. At present the Directive only requires the Member States' competent authorities to ensure that the connection lines and pipe installation are checked regularly for leaks. Overall, the general perception is that the management method that was chosen to address Stage I controls seemed to be appropriate from the three perspectives analysed. While based on some responses a more or flexible approach that evolved over time in order to adapt to technical progress and innovation could have been suitable, it is noted that this could have been more costly and bureaucratic, through the need to implement regular modifications. Moreover, at the time of adoption of the Directive its requirements were not covered elsewhere (i.e. in the standards that now exist). Therefore, there appears to be a good argument for the approach chosen at the time: a highly prescriptive Directive was needed to avoid barriers to trade (e.g. trans-border petrol flows) and sufficient CEN standards were not in existence when the Directive was introduced.
5.2.7 What unexpected or unintended changes resulting from the Directive
can be identified (positive or negative)? Why have they occurred? (E.6)
A number of potential unintended consequences arising from the Directive have been identified. Stakeholders were requested to provide their opinion on each of these as shown in the chart below. It is noted that the analysis for this question has relied heavily on feedback received via consultation. In this sense, the aim was to assess what unintended/unexpected changes have been experienced by those affected by the Directive, and published literature analysing the Directive from this point of view is limited.
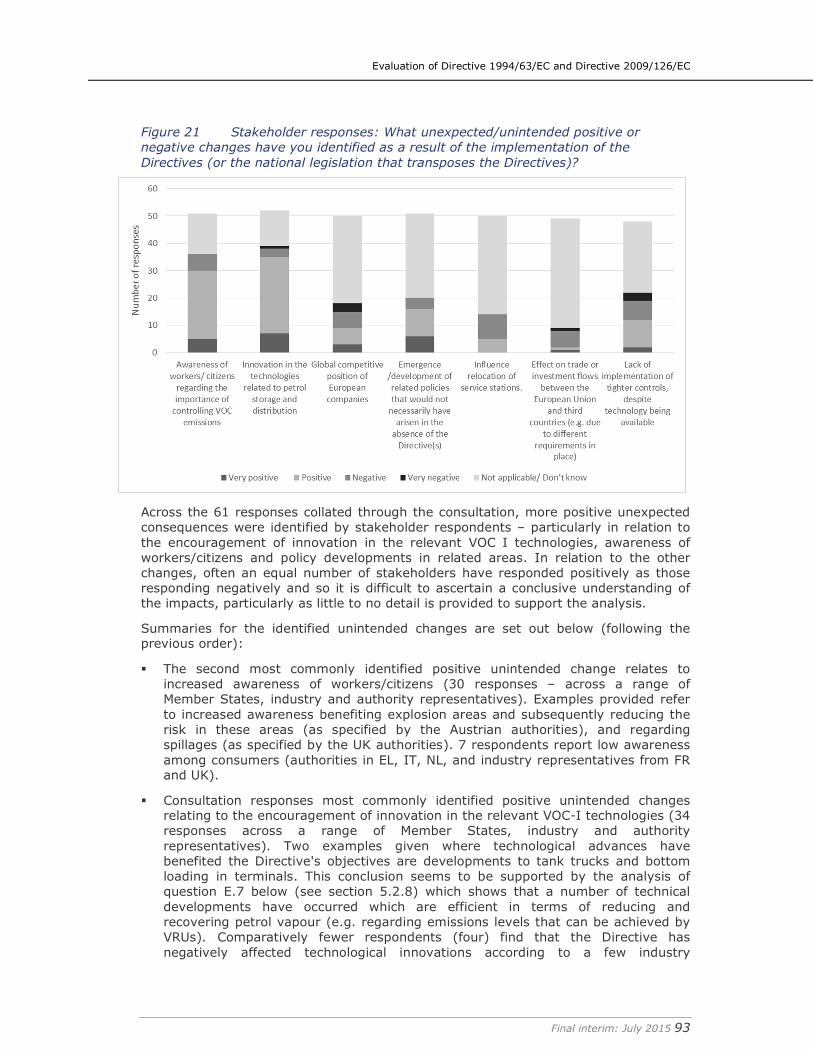
Evaluation of Directive 1994/63/EC and Directive 2009/126/EC
Final interim: July 2015 93
Figure 21 Stakeholder responses: What unexpected/unintended positive or
negative changes have you identified as a result of the implementation of the
Directives (or the national legislation that transposes the Directives)?
Across the 61 responses collated through the consultation, more positive unexpected consequences were identified by stakeholder respondents – particularly in relation to the encouragement of innovation in the relevant VOC I technologies, awareness of workers/citizens and policy developments in related areas. In relation to the other changes, often an equal number of stakeholders have responded positively as those responding negatively and so it is difficult to ascertain a conclusive understanding of the impacts, particularly as little to no detail is provided to support the analysis.
Summaries for the identified unintended changes are set out below (following the previous order):
� The second most commonly identified positive unintended change relates to increased awareness of workers/citizens (30 responses – across a range of Member States, industry and authority representatives). Examples provided refer to increased awareness benefiting explosion areas and subsequently reducing the risk in these areas (as specified by the Austrian authorities), and regarding spillages (as specified by the UK authorities). 7 respondents report low awareness among consumers (authorities in EL, IT, NL, and industry representatives from FR and UK).
� Consultation responses most commonly identified positive unintended changes relating to the encouragement of innovation in the relevant VOC-I technologies (34 responses across a range of Member States, industry and authority representatives). Two examples given where technological advances have benefited the Directive's objectives are developments to tank trucks and bottom loading in terminals. This conclusion seems to be supported by the analysis of question E.7 below (see section 5.2.8) which shows that a number of technical developments have occurred which are efficient in terms of reducing and recovering petrol vapour (e.g. regarding emissions levels that can be achieved by VRUs). Comparatively fewer respondents (four) find that the Directive has negatively affected technological innovations according to a few industry
Evaluation of Directive 1994/63/EC and Directive 2009/126/EC
Final interim: July 2015 94
representatives in AT, DE and ES, and the Dutch authorities – although no detail is provided to explain why.
� The impact on global competition is considered to have been neutral according to the consultation respondents. 9 respondents (including industry respondents operating in BG, IE, SE and UK, and authorities in EL, IE, NL and RO) find that there has been a positive impact on global competition and so no clear message either way can be derived from the consultation responses. While another 9 find that there have been negative impacts on global competition (comprising industry representatives in AT, BG, DE, FR, NL, PT and UK, as well as authorities in SK). Further detail on this provided by industry suggests that the lack of standardisation between the EU and third countries has hindered the company wide global procurement process.
� 16 consultation respondents (across a range of Member States, industry and authority representatives) note that there have been positive consequences in relation to policy developments that might not have necessarily happened otherwise, such as CEN standards for VOC equipment. In Ireland (according to an industry representative), it has had a positive impact on other policy developments in terms of policy to manage risk of explosions/hazards, encouraging service station operators to pay closer attention to the Explosion Protection Document preparation under Directive 2014/34/EU (ATEX)74. Only four respondents find that there has been a negative impact on policy developments (one industry representative in France notes that the existing requirements do not encourage stakeholders to act beyond the minimum needed to comply).
� With regards to the impact on the relocation/market of service stations there are opposing views across the consultation respondents. 9 respondents (predominantly from industry) find that the Directive has negatively influenced the relocation/market of service stations – in France and the UK for example it is noted that some service stations, particularly smaller ones, have closed as a result of the legislative requirements imposed on them. An industry stakeholder from France notes that these closures weaken the network of depots thus increasing transport on long distance. 5 respondents (including authorities in DE and IE) however find that there has been a positive influence on the relocation of service stations – one example given is that the investment barrier to proliferation of multiple small service stations has facilitated the consolidation of medium-large service stations as a more efficient market model (according to an industry representative in the UK). In addition, it is relevant to note that the shift to larger stations – which are generally located in less habited areas at the side of major roads – could result in a positive effect in terms of improved air quality in living quarters that were previously close to these service stations (EU Commission, 2008).
� Unintended negative impacts on trade have been identified by 8 respondents - comprising mostly industry stakeholders with two authorities also remarking negative unintended consequences as a result of the Directive. However, no commentary was provided.
� 12 respondents (of which 8 are authorities) find that the Directive has positively influenced the uptake of control systems, by creating a stable benchmark that has allowed industry to develop. However, 10 (of which 7 are industry respondents) responded that it has had a negative impact, preventing the uptake of these
74 Directive 2014/34/EU of the European Parliament and of the Council of 26 February 2014 on the harmonisation of the laws of the Member States relating to equipment and protective systems intended for use in potentially explosive atmospheres (recast) Text with EEA relevance OJ L 96, 29.3.2014, p. 309–356
Evaluation of Directive 1994/63/EC and Directive 2009/126/EC
Final interim: July 2015 95
controls despite technology being available. This seems to be related to the fact that the Directive has not been amended since its adoption to reflect technological developments. However, as further assessed in question R.4 (see section 5.5.5) no significant evidence was found to indicate that the fact that the Directive’s annexes have not been adapted has resulted in any major implementation issues or has prevented the uptake or development of better technology.
One additional outcome raised by an Irish industry stakeholder is the positive impact on improved safety and awareness of hazards/risks resulting from the Directive. In addition, an industry stakeholder from France notes that the Directive has increased the technical complexity linked to storage of chemicals.
5.2.8 Are there any technical or other developments since the deployment of
the directive that could contribute to achieving the objective more effectively or efficiently? (E.7)
This question assesses from a technical perspective how the degree of VOC abatement stipulated in the Directive compares with that possible with the current state of the art. Such an analysis was undertaken in the 2009 review on the status of implementation (Entec and REC, 2009). The study identified a few areas where there appears to be potential for further emission reduction:
� By lowering the emission limit values specified for vapour recovery units (VRUs).
� Through technical improvements to storage tanks at terminals.
� Through application of techniques for unloading petrol at service stations.
� Through control/capture of tank breathing emissions that would otherwise be released from pressure/vacuum relief valves.
These options are described in more detail in the following sections, taking into account the findings of the present evaluation.
Vapour recovery units
Available technology is able to achieve a level of VOC emissions in the exhaust gas well below the current limit of 35 g/Nm3. Indeed, information provided on vapour recovery units in the BREF for the Refining of Mineral Oil and Gas under the IED (2015)75 reveals that VOC emissions are directly related to VOC removal efficiency and can be as low as 10 mg/Nm3 excluding methane. At an efficiency of 99.9%, 150mg/Nm3 (excluding methane) can be achieved. The BREF describes a number of different technologies with different recovery levels that can be used in VRUs (absorption, adsorption, membrane gas separation, refrigeration/condensation and hybrid systems) with adsorption being the one most commonly used for petrol recovery in the EU. These are shown in the table below:
75http://eippcb.jrc.ec.europa.eu/reference/BREF/REF_BREF_2015.pdf
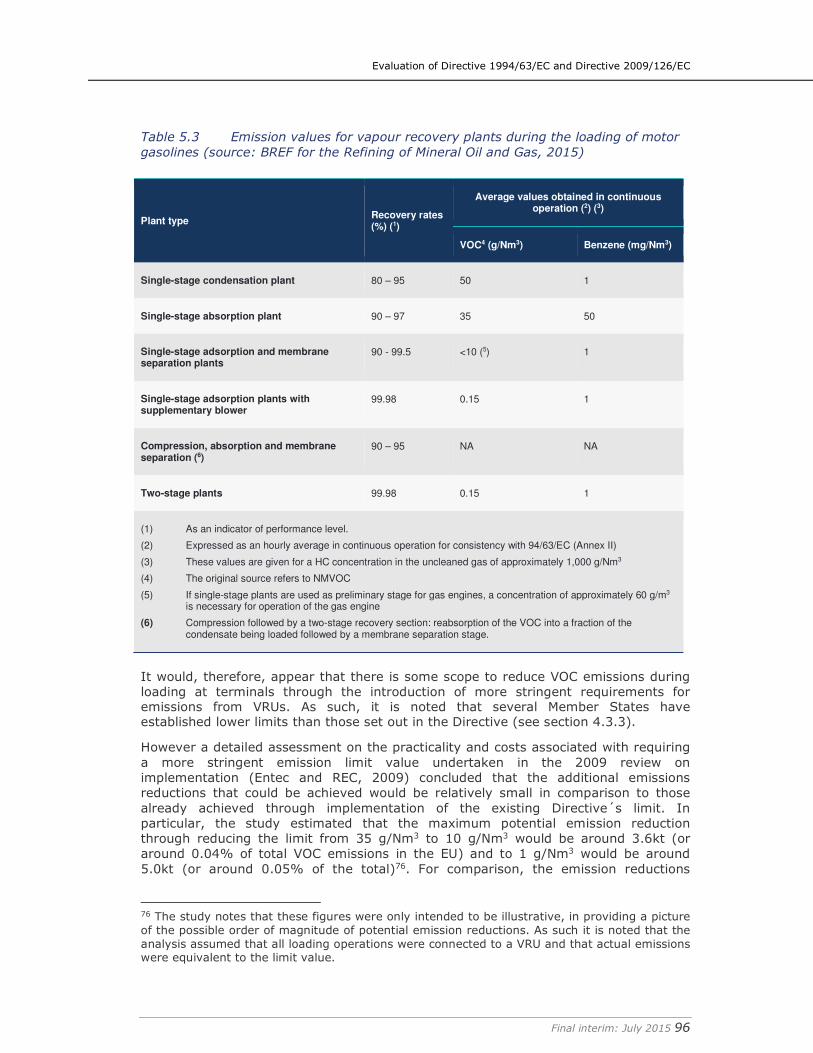
Evaluation of Directive 1994/63/EC and Directive 2009/126/EC
Final interim: July 2015 96
Table 5.3 Emission values for vapour recovery plants during the loading of motor
gasolines (source: BREF for the Refining of Mineral Oil and Gas, 2015)
Plant type Recovery rates (%) (1)
Average values obtained in continuous operation (2) (3)
VOC4 (g/Nm3) Benzene (mg/Nm3)
Single-stage condensation plant 80 – 95 50 1
Single-stage absorption plant 90 – 97 35 50
Single-stage adsorption and membrane separation plants
90 - 99.5 <10 (5) 1
Single-stage adsorption plants with supplementary blower
99.98 0.15 1
Compression, absorption and membrane separation (6)
90 – 95 NA NA
Two-stage plants 99.98 0.15 1
(1) As an indicator of performance level.
(2) Expressed as an hourly average in continuous operation for consistency with 94/63/EC (Annex II)
(3) These values are given for a HC concentration in the uncleaned gas of approximately 1,000 g/Nm3
(4) The original source refers to NMVOC
(5) If single-stage plants are used as preliminary stage for gas engines, a concentration of approximately 60 g/m3
is necessary for operation of the gas engine
(6) Compression followed by a two-stage recovery section: reabsorption of the VOC into a fraction of the condensate being loaded followed by a membrane separation stage.
It would, therefore, appear that there is some scope to reduce VOC emissions during loading at terminals through the introduction of more stringent requirements for emissions from VRUs. As such, it is noted that several Member States have established lower limits than those set out in the Directive (see section 4.3.3).
However a detailed assessment on the practicality and costs associated with requiring a more stringent emission limit value undertaken in the 2009 review on implementation (Entec and REC, 2009) concluded that the additional emissions reductions that could be achieved would be relatively small in comparison to those already achieved through implementation of the existing Directive´s limit. In particular, the study estimated that the maximum potential emission reduction through reducing the limit from 35 g/Nm3 to 10 g/Nm3 would be around 3.6kt (or around 0.04% of total VOC emissions in the EU) and to 1 g/Nm3 would be around 5.0kt (or around 0.05% of the total)76. For comparison, the emission reductions
76 The study notes that these figures were only intended to be illustrative, in providing a picture of the possible order of magnitude of potential emission reductions. As such it is noted that the analysis assumed that all loading operations were connected to a VRU and that actual emissions were equivalent to the limit value.
Evaluation of Directive 1994/63/EC and Directive 2009/126/EC
Final interim: July 2015 97
achieved by meeting 35 g/Nm3 compared to uncontrolled emissions (around 110kt) were equivalent to approximately 1.2% of total EU27 VOC emissions).
Moreover, there would be additional energy costs of achieving these emission reductions, which become much higher as the lower emission levels are approached. While the value of the fuel recovered would tend to offset the increased costs of electricity use in abatement for moderate emissions reductions, achieving the highest emissions reductions (e.g. down to 150 mg/Nm3) are likely to require significantly greater additional incremental electricity costs than the incremental value of the recovered product (for example it was estimated that to move from 1 g/Nm3 to 150 mg/Nm3 could cost around €14,000/t abated). This aspect is also highlighted by an industry stakeholder from Germany, where a limit down to 50 mg/Nm3 has been introduced in the national legislation. They note that the additional energy necessary to reach this limit caused additional CO2 emissions, thus rendering the benefits of marginally lower VOC-emissions void. They conclude that the overall balance of achieving such a lower level is not cost-effective.
Based on the above, the conclusion achieved in the 2009 review, which seems to be still valid today, was that lowering the current ELV for VRUs at terminals could result in net benefits for the EU in terms of emission reductions, though these reductions were estimated to be relatively small. As such it is evident that emissions from many installations will already be substantially below the 35g/Nm3 limit, due to differing national provisions or simply because actual performance of equipment will generally be somewhat better than the limit value. As an example Sweden reported that second generation” VRUs, using carbon adsorption are now more commonly implemented and these can achieve typically less than 5 g/Nm3 (Entec and REC, 2009). Therefore total emissions reductions from lowering the ELV would be relatively small in comparison to those already achieved by compliance with the current limit in the Directive, as compared to uncontrolled emissions.
It is also noted that those Member States that have implemented the provisions of the Gothenburg Protocol are also required to apply a lower emission limit (10 g/Nm3) for all new installations and for existing installations so far as it is technically and economically feasible, taking into consideration the costs and benefits.
Technical improvements to storage tanks at terminals
The BREF on storage (2006)77 outlines a number of technical improvements that could be applied to storage tanks at terminals. These techniques include application of BAT for external floating roof tanks and fixed roof tanks or requirements related to installation and maintenance of pumps and compressors as well as sealing systems. In relation to this latter aspect an authority from the Netherlands has noted that regular replacement of the seals is considered by industry a very expensive operation and it is not always possible to reach and renew the seals.
The 2009 review concluded that if these technical improvements were to be implemented they could achieve relatively minor reductions of VOC emissions. In addition, it is important to note that the Directive sets techniques that represent minimum standards (and also apply at installations that are not covered by the IED Directive) as compared to the BREF which establishes BAT. Also, Member States are free to set more stringent levels in national legislation.
Techniques for unloading petrol at service stations
An industry representative approved to undertake testing of Stage I systems, recommends fitting the site end of a tanker vapour recovery hose with a spring-loaded 77 Integrated Pollution Prevention and Control, Reference Document on Best Available Techniques on Emissions from Storage, July 2006.
Evaluation of Directive 1994/63/EC and Directive 2009/126/EC
Final interim: July 2015 98
valve in order to mitigate fugitive vapours on disconnecting tanker vapour recovery hose. Provided the tanker driver connects / disconnects the vapour recovery hose in the correct manner, this mitigates the potential for vapour discharges, if the tanker ullage space is pressurised either before the fuel delivery event or after the fuel delivery event. The cost of this valve is understood to be around €500 according to consultation. Further research would be needed to estimate how much emission savings this type of technology could deliver.
Releases from storage tanks at service stations (breathing emissions)
Under the Directive, a vent is required to allow “breathing” of the underground storage tank and also as a safeguard in case the vapour balancing system back to the road tanker becomes inoperable or against any over-pressurisation in the storage tank (Entec and REC, 2009). Breathing emissions are currently not regulated under the VOC-I or the VOC-II Directives and represent a relatively small proportion of VOC emissions at petrol stations compared to refuelling or unloading activities (see Figure 8 in section 2.2.4). In particular, it has been estimated that these represented around 4% of uncontrolled emissions in 1995, compared to those emitted during unloading into storage tanks (26%) and vehicle refuelling (43%).
However, these fugitive emissions become proportionately more important for service stations with both Stage I and Stage II controls in place, where a potential excessive return of petrol vapours/air during refuelling could lead to an over-pressurisation in the storage tank and an increase of these type of emissions78. As noted in section 4.3.4 the over-pressurisation problem has been generally addressed through the use of relief systems, such as by-pass valves or an orifice vent device (OVD) of up to 10 mm diameter which releases any excess pressure on an ongoing basis.
As noted by Defra (2008), the OVD solution is effective in preventing over-pressurisation while maintaining compliance with the VOC-I Directive. Moreover current designs have been able to reduce the size up to 2mm diameter, thus reducing the quantity of emissions realised between deliveries compared to the larger ones.
However, a number of other techniques could be implemented to reduce these emissions and prevent over-pressurisation in a more proactive way (as opposed to relief systems). These have been identified in a number of sources (e.g. UNECE, 2012; Defra, 2008) and through consultation and include the ones described in box below:
Box 3 “Proactive” technologies addressing tank breathing emissions
1. At pump systems which collect the vapour displaced from the vehicle tank and then condense and deliver these back to the vehicle as part of the petrol purchase. These systems are already regulated under the VOC-II Directive and their use reduces vapours returned to underground tanks. However, these systems are costly and not widespread across the EU.
2. Technologies focusing on in-tank vapour retention/recovery. These include membrane technology and condensation of vapours with abatement efficiencies up to 99% quoted (UNECE, 2012). These systems are known to be used in the USA, particularly in California, where they are commonly called “Stage III processors.” Based on information provided from one industry representative from USA the most common types of processors used include: 1) An enclosed plastic bag piped to the tank vapour space that holds vapours when pressure growth occurs, and returns the vapours when vapour shrinkage occurs; 2) Activated carbon in the vent line that adsorbs hydrocarbons during outbreathing and desorbs them during hydrocarbon vapours; and (3) A permeable membrane and mechanical pump to separate air from hydrocarbon vapours
78 Additional vapour from the liquid petrol will evaporate into the tank ullage as the system tends towards the saturated vapour concentration.

Evaluation of Directive 1994/63/EC and Directive 2009/126/EC
Final interim: July 2015 99
(note 1).
It is however noted that these systems rely on the fact that a fraction of the vehicle fleet in the USA is equipped with ORVR (see section 2.4.1), which return less vapour/air mixture to the tank when refuelling. This leads to periods where processors can have relatively few vapours to process enabling the correct functioning of the system. Therefore, as noted by three industry representatives from the USA, UK and IE these systems would be less effective in Europe.
3. Infuser technology that stabilises the incoming vapour with that of the vapour content in the storage tank, promoting a balanced stratification. The incoming air/vapour mixture enters the petrol tank by passing through the infuser and is separated, with air being released at top of the tank to settle on the vapour layer while most of the vapour filtered from it is released at the lower layer, facilitating its condensation to liquid. The cost of the infuser is around€2,500 as quoted by the manufacturer (note 2)79.
Note 1: When the tank pressure exceeds a certain value, a small compressor turns on and pulls in vapours from the tank. The extracted petrol vapour is then separated into hydrocarbons and air with a reported efficiency of 99%, with clean air released to atmosphere and hydrocarbons returned to the storage tank both as liquid petrol and as super-saturated vapour (UNECE, 2012).
Note 2: http://www.vapourcontrolsystems.co.uk/solutions-and-services/
As opposed to passive systems (e.g. OVD), “proactive” technologies reduce the emissions from venting while also preventing the over-pressurisation and expansion problem due to temperature differentials and excessive vapour return. They also offer added benefit to the service station operator by reducing the vapour generation in the tank which would otherwise be recovered in the road tanker. However they come at higher cost (particularly condensation/processing technologies) and some might not be suitable for the European market. These technologies could be further explored and encouraged where there is evidence that they achieve compliance with both Directives in a cost-effective manner. However, this is outside the scope of the current project.
5.3 Efficiency
5.3.1 Overview
The evaluation of the effectiveness of the VOC-I Directive is structured around the responses to seven principal questions and along several sub-questions, which are described in the sections below.
5.3.2 To what extent is the overall cost of the Directive proportionate to the
results and impacts being achieved? (EF.1)
The above question is broken down into three sub-questions in order to enable a more focused assessment:
� What have the overall costs associated with compliance with the Directive been?
Being a Directive that has been in place for almost two decades, limited information on associated costs has been identified through desk-based research. No ex-ante impact assessment has been identified on the VOC-I Directive. Collection of cost data has thus been highly dependent on the provision of information via consultation. The types of costs that the Directive has generated have been explored for public authorities and industry operators as described below.
Costs to public authorities
The following key categories of cost faced by competent authorities have been identified in relation to the VOC-I Directive:
79 This corresponds to a cost of £2,000 at an exchange rate of €1 = 0.78 GBP.
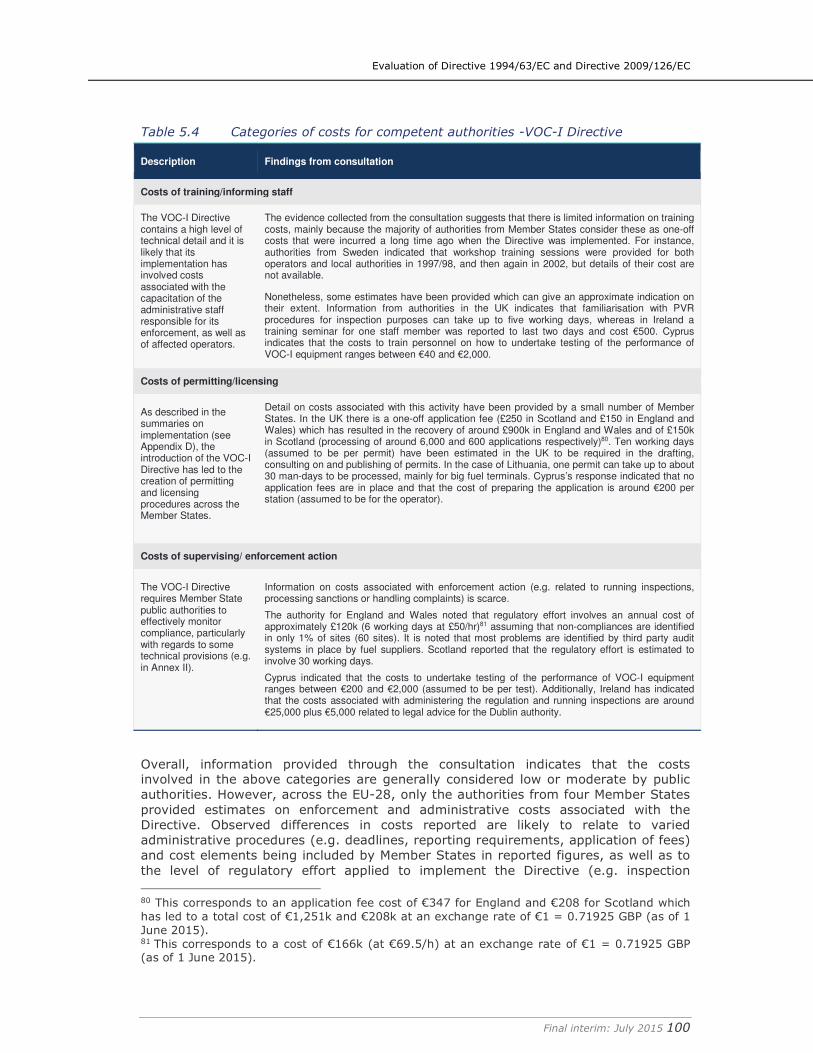
Evaluation of Directive 1994/63/EC and Directive 2009/126/EC
Final interim: July 2015 100
Table 5.4 Categories of costs for competent authorities -VOC-I Directive
Description Findings from consultation
Costs of training/informing staff
The VOC-I Directive contains a high level of technical detail and it is likely that its implementation has involved costs associated with the capacitation of the administrative staff responsible for its enforcement, as well as of affected operators.
The evidence collected from the consultation suggests that there is limited information on training costs, mainly because the majority of authorities from Member States consider these as one-off costs that were incurred a long time ago when the Directive was implemented. For instance, authorities from Sweden indicated that workshop training sessions were provided for both operators and local authorities in 1997/98, and then again in 2002, but details of their cost are not available.
Nonetheless, some estimates have been provided which can give an approximate indication on their extent. Information from authorities in the UK indicates that familiarisation with PVR procedures for inspection purposes can take up to five working days, whereas in Ireland a training seminar for one staff member was reported to last two days and cost €500. Cyprus indicates that the costs to train personnel on how to undertake testing of the performance of VOC-I equipment ranges between €40 and €2,000.
Costs of permitting/licensing
As described in the summaries on implementation (see Appendix D), the introduction of the VOC-I Directive has led to the creation of permitting and licensing procedures across the Member States.
Detail on costs associated with this activity have been provided by a small number of Member States. In the UK there is a one-off application fee (£250 in Scotland and £150 in England and Wales) which has resulted in the recovery of around £900k in England and Wales and of £150k in Scotland (processing of around 6,000 and 600 applications respectively)80. Ten working days (assumed to be per permit) have been estimated in the UK to be required in the drafting, consulting on and publishing of permits. In the case of Lithuania, one permit can take up to about 30 man-days to be processed, mainly for big fuel terminals. Cyprus’s response indicated that no application fees are in place and that the cost of preparing the application is around €200 per station (assumed to be for the operator).
Costs of supervising/ enforcement action
The VOC-I Directive requires Member State public authorities to effectively monitor compliance, particularly with regards to some technical provisions (e.g. in Annex II).
Information on costs associated with enforcement action (e.g. related to running inspections, processing sanctions or handling complaints) is scarce.
The authority for England and Wales noted that regulatory effort involves an annual cost of approximately £120k (6 working days at £50/hr)81 assuming that non-compliances are identified in only 1% of sites (60 sites). It is noted that most problems are identified by third party audit systems in place by fuel suppliers. Scotland reported that the regulatory effort is estimated to involve 30 working days.
Cyprus indicated that the costs to undertake testing of the performance of VOC-I equipment ranges between €200 and €2,000 (assumed to be per test). Additionally, Ireland has indicated that the costs associated with administering the regulation and running inspections are around €25,000 plus €5,000 related to legal advice for the Dublin authority.
Overall, information provided through the consultation indicates that the costs involved in the above categories are generally considered low or moderate by public authorities. However, across the EU-28, only the authorities from four Member States provided estimates on enforcement and administrative costs associated with the Directive. Observed differences in costs reported are likely to relate to varied administrative procedures (e.g. deadlines, reporting requirements, application of fees) and cost elements being included by Member States in reported figures, as well as to the level of regulatory effort applied to implement the Directive (e.g. inspection 80 This corresponds to an application fee cost of €347 for England and €208 for Scotland which has led to a total cost of €1,251k and €208k at an exchange rate of €1 = 0.71925 GBP (as of 1 June 2015). 81 This corresponds to a cost of €166k (at €69.5/h) at an exchange rate of €1 = 0.71925 GBP (as of 1 June 2015).
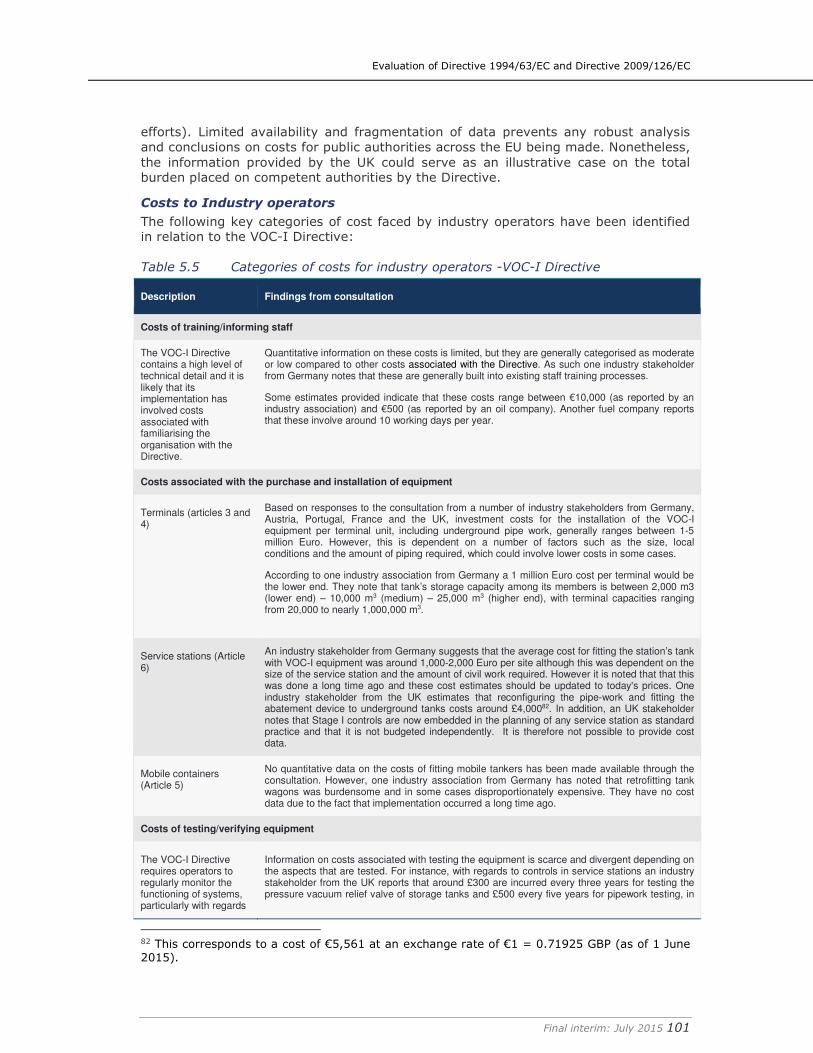
Evaluation of Directive 1994/63/EC and Directive 2009/126/EC
Final interim: July 2015 101
efforts). Limited availability and fragmentation of data prevents any robust analysis and conclusions on costs for public authorities across the EU being made. Nonetheless, the information provided by the UK could serve as an illustrative case on the total burden placed on competent authorities by the Directive.
Costs to Industry operators
The following key categories of cost faced by industry operators have been identified in relation to the VOC-I Directive:
Table 5.5 Categories of costs for industry operators -VOC-I Directive
Description Findings from consultation
Costs of training/informing staff
The VOC-I Directive contains a high level of technical detail and it is likely that its implementation has involved costs associated with familiarising the organisation with the Directive.
Quantitative information on these costs is limited, but they are generally categorised as moderate or low compared to other costs associated with the Directive. As such one industry stakeholder from Germany notes that these are generally built into existing staff training processes.
Some estimates provided indicate that these costs range between €10,000 (as reported by an industry association) and €500 (as reported by an oil company). Another fuel company reports that these involve around 10 working days per year.
Costs associated with the purchase and installation of equipment
Terminals (articles 3 and 4)
Based on responses to the consultation from a number of industry stakeholders from Germany, Austria, Portugal, France and the UK, investment costs for the installation of the VOC-I equipment per terminal unit, including underground pipe work, generally ranges between 1-5 million Euro. However, this is dependent on a number of factors such as the size, local conditions and the amount of piping required, which could involve lower costs in some cases.
According to one industry association from Germany a 1 million Euro cost per terminal would be the lower end. They note that tank’s storage capacity among its members is between 2,000 m3 (lower end) – 10,000 m3 (medium) – 25,000 m3 (higher end), with terminal capacities ranging from 20,000 to nearly 1,000,000 m3.
Service stations (Article 6)
An industry stakeholder from Germany suggests that the average cost for fitting the station’s tank with VOC-I equipment was around 1,000-2,000 Euro per site although this was dependent on the size of the service station and the amount of civil work required. However it is noted that that this was done a long time ago and these cost estimates should be updated to today's prices. One industry stakeholder from the UK estimates that reconfiguring the pipe-work and fitting the abatement device to underground tanks costs around £4,00082. In addition, an UK stakeholder notes that Stage I controls are now embedded in the planning of any service station as standard practice and that it is not budgeted independently. It is therefore not possible to provide cost data.
Mobile containers (Article 5)
No quantitative data on the costs of fitting mobile tankers has been made available through the consultation. However, one industry association from Germany has noted that retrofitting tank wagons was burdensome and in some cases disproportionately expensive. They have no cost data due to the fact that implementation occurred a long time ago.
Costs of testing/verifying equipment
The VOC-I Directive requires operators to regularly monitor the functioning of systems, particularly with regards
Information on costs associated with testing the equipment is scarce and divergent depending on the aspects that are tested. For instance, with regards to controls in service stations an industry stakeholder from the UK reports that around £300 are incurred every three years for testing the pressure vacuum relief valve of storage tanks and £500 every five years for pipework testing, in
82 This corresponds to a cost of €5,561 at an exchange rate of €1 = 0.71925 GBP (as of 1 June 2015).
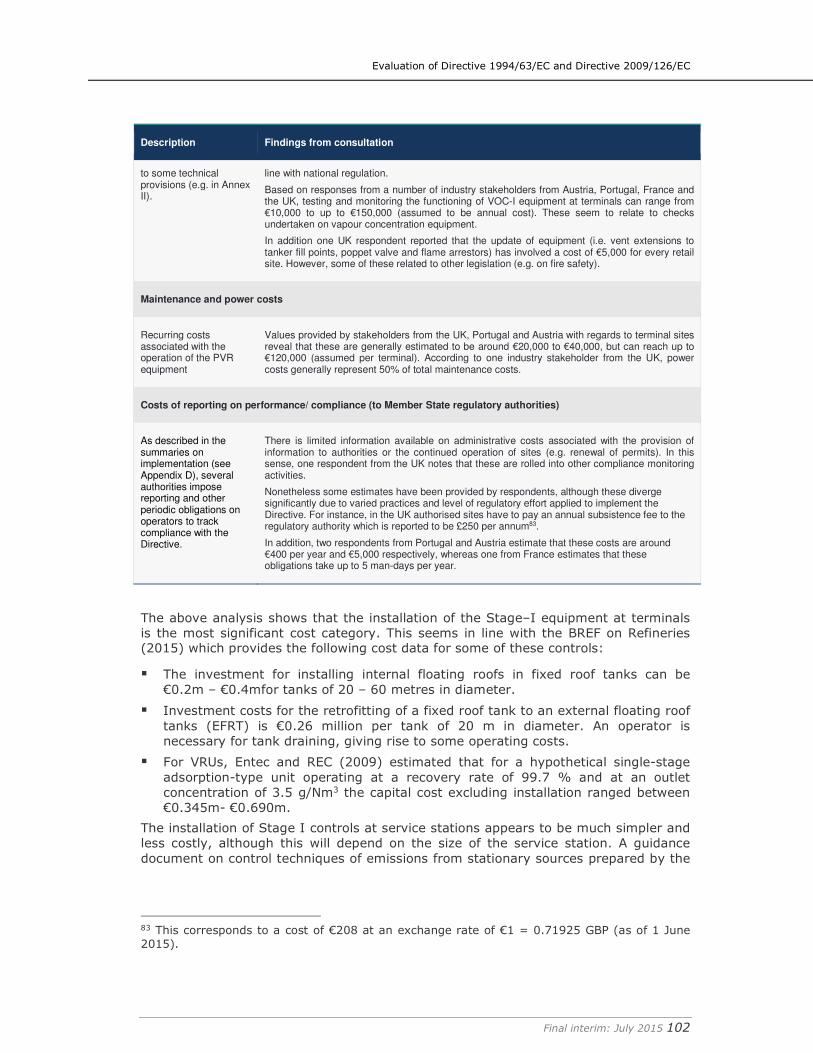
Evaluation of Directive 1994/63/EC and Directive 2009/126/EC
Final interim: July 2015 102
Description Findings from consultation
to some technical provisions (e.g. in Annex II).
line with national regulation.
Based on responses from a number of industry stakeholders from Austria, Portugal, France and the UK, testing and monitoring the functioning of VOC-I equipment at terminals can range from €10,000 to up to €150,000 (assumed to be annual cost). These seem to relate to checks undertaken on vapour concentration equipment.
In addition one UK respondent reported that the update of equipment (i.e. vent extensions to tanker fill points, poppet valve and flame arrestors) has involved a cost of €5,000 for every retail site. However, some of these related to other legislation (e.g. on fire safety).
Maintenance and power costs
Recurring costs associated with the operation of the PVR equipment
Values provided by stakeholders from the UK, Portugal and Austria with regards to terminal sites reveal that these are generally estimated to be around €20,000 to €40,000, but can reach up to €120,000 (assumed per terminal). According to one industry stakeholder from the UK, power costs generally represent 50% of total maintenance costs.
Costs of reporting on performance/ compliance (to Member State regulatory authorities)
As described in the summaries on implementation (see Appendix D), several authorities impose reporting and other periodic obligations on operators to track compliance with the Directive.
There is limited information available on administrative costs associated with the provision of information to authorities or the continued operation of sites (e.g. renewal of permits). In this sense, one respondent from the UK notes that these are rolled into other compliance monitoring activities.
Nonetheless some estimates have been provided by respondents, although these diverge significantly due to varied practices and level of regulatory effort applied to implement the Directive. For instance, in the UK authorised sites have to pay an annual subsistence fee to the regulatory authority which is reported to be £250 per annum83.
In addition, two respondents from Portugal and Austria estimate that these costs are around €400 per year and €5,000 respectively, whereas one from France estimates that these obligations take up to 5 man-days per year.
The above analysis shows that the installation of the Stage–I equipment at terminals is the most significant cost category. This seems in line with the BREF on Refineries (2015) which provides the following cost data for some of these controls:
� The investment for installing internal floating roofs in fixed roof tanks can be €0.2m – €0.4mfor tanks of 20 – 60 metres in diameter.
� Investment costs for the retrofitting of a fixed roof tank to an external floating roof tanks (EFRT) is €0.26 million per tank of 20 m in diameter. An operator is necessary for tank draining, giving rise to some operating costs.
� For VRUs, Entec and REC (2009) estimated that for a hypothetical single-stage adsorption-type unit operating at a recovery rate of 99.7 % and at an outlet concentration of 3.5 g/Nm3 the capital cost excluding installation ranged between €0.345m- €0.690m.
The installation of Stage I controls at service stations appears to be much simpler and less costly, although this will depend on the size of the service station. A guidance document on control techniques of emissions from stationary sources prepared by the
83 This corresponds to a cost of €208 at an exchange rate of €1 = 0.71925 GBP (as of 1 June 2015).
Evaluation of Directive 1994/63/EC and Directive 2009/126/EC
Final interim: July 2015 103
Expert Group on Techno-Economic Issues to the UNECE convention (2012)84 estimates investment costs of installing Stage-I controls in service-stations based on EGTEI data (2003)85. Investment costs range from €19,800 to €27,000 for stations larger than 3,000 m3, €12,600 – €17,500 for stations from 500 to 3,000 m3 and €6,400 – €9,800 for smaller stations. On the other hand annualised costs range between €789 -€3,329.
Estimation of overall costs
At this stage it has not been possible to undertake a detailed cost analysis based on information available. The limited availability and fragmentation of data obtained through consultation alongside the lack of ex-ante cost estimates at EU level prevents any robust analysis and conclusions on costs of the VOC-I Directive across the EU being made. Any estimation will require a significant number of assumptions and will be subject to a high level of uncertainty.
[We will try to obtain further information on costs through interaction with stakeholders at the workshop.]
� What have the overall impacts/benefits associated with compliance with the Directive been?
In general terms, the reduction of the harmful effects on health and the environment associated with VOC emissions can be considered the main benefit of the application of Stage I controls. Key concerns associated with the formation of ground-level ozone and exposure to harmful substances such as benzene has been detailed in Section 2.3. Additionally, it is also relevant to consider financial benefits to operators from sales of recovered petrol that would otherwise have evaporated.
Views from the consultation
Evidence gathered from the consultation does not provide sufficient information to allow a quantitative estimation of the effects and benefits of applying Stage I controls. Nonetheless, stakeholders have provided their view on the significance of these benefits. These are summarised below:
84http://www.unece.org/fileadmin/DAM/env/documents/2012/air/WGSR_50th/Informal/Informal_document_no2_stationary_sources_rev.pdf 85 http://www.citepa.org/old/forums/egtei/14-service_stations_version3-07-11-05.pdf
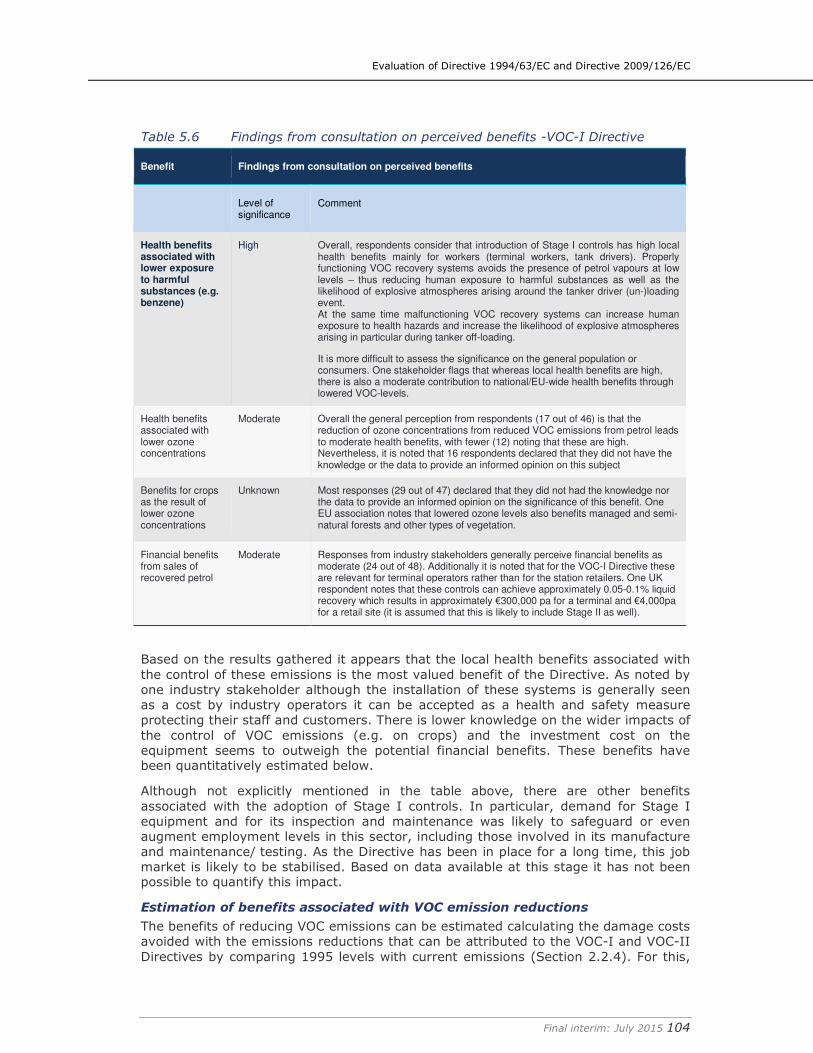
Evaluation of Directive 1994/63/EC and Directive 2009/126/EC
Final interim: July 2015 104
Table 5.6 Findings from consultation on perceived benefits -VOC-I Directive
Benefit Findings from consultation on perceived benefits
Level of significance
Comment
Health benefits associated with lower exposure to harmful substances (e.g. benzene)
High Overall, respondents consider that introduction of Stage I controls has high local health benefits mainly for workers (terminal workers, tank drivers). Properly functioning VOC recovery systems avoids the presence of petrol vapours at low levels – thus reducing human exposure to harmful substances as well as the likelihood of explosive atmospheres arising around the tanker driver (un-)loading event. At the same time malfunctioning VOC recovery systems can increase human exposure to health hazards and increase the likelihood of explosive atmospheres arising in particular during tanker off-loading.
It is more difficult to assess the significance on the general population or consumers. One stakeholder flags that whereas local health benefits are high, there is also a moderate contribution to national/EU-wide health benefits through lowered VOC-levels.
Health benefits associated with lower ozone concentrations
Moderate Overall the general perception from respondents (17 out of 46) is that the reduction of ozone concentrations from reduced VOC emissions from petrol leads to moderate health benefits, with fewer (12) noting that these are high. Nevertheless, it is noted that 16 respondents declared that they did not have the knowledge or the data to provide an informed opinion on this subject
Benefits for crops as the result of lower ozone concentrations
Unknown Most responses (29 out of 47) declared that they did not had the knowledge nor the data to provide an informed opinion on the significance of this benefit. One EU association notes that lowered ozone levels also benefits managed and semi-natural forests and other types of vegetation.
Financial benefits from sales of recovered petrol
Moderate Responses from industry stakeholders generally perceive financial benefits as moderate (24 out of 48). Additionally it is noted that for the VOC-I Directive these are relevant for terminal operators rather than for the station retailers. One UK respondent notes that these controls can achieve approximately 0.05-0.1% liquid recovery which results in approximately €300,000 pa for a terminal and €4,000pa for a retail site (it is assumed that this is likely to include Stage II as well).
Based on the results gathered it appears that the local health benefits associated with the control of these emissions is the most valued benefit of the Directive. As noted by one industry stakeholder although the installation of these systems is generally seen as a cost by industry operators it can be accepted as a health and safety measure protecting their staff and customers. There is lower knowledge on the wider impacts of the control of VOC emissions (e.g. on crops) and the investment cost on the equipment seems to outweigh the potential financial benefits. These benefits have been quantitatively estimated below.
Although not explicitly mentioned in the table above, there are other benefits associated with the adoption of Stage I controls. In particular, demand for Stage I equipment and for its inspection and maintenance was likely to safeguard or even augment employment levels in this sector, including those involved in its manufacture and maintenance/ testing. As the Directive has been in place for a long time, this job market is likely to be stabilised. Based on data available at this stage it has not been possible to quantify this impact.
Estimation of benefits associated with VOC emission reductions
The benefits of reducing VOC emissions can be estimated calculating the damage costs avoided with the emissions reductions that can be attributed to the VOC-I and VOC-II Directives by comparing 1995 levels with current emissions (Section 2.2.4). For this,
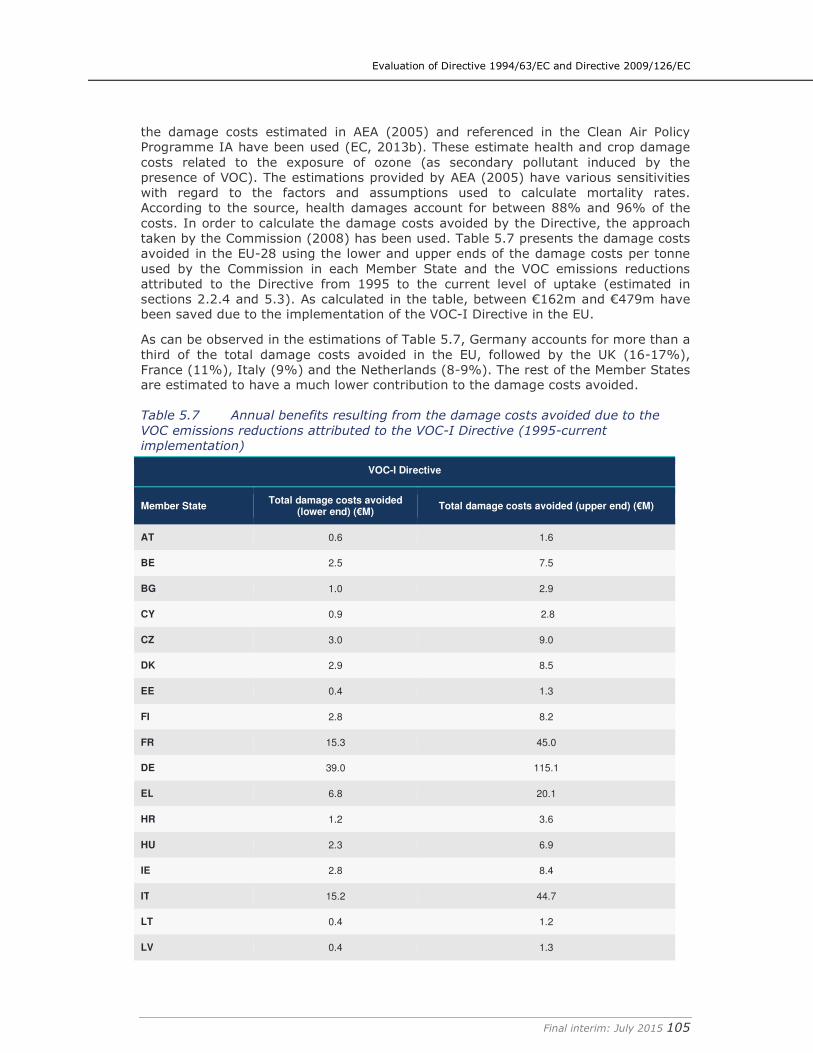
Evaluation of Directive 1994/63/EC and Directive 2009/126/EC
Final interim: July 2015 105
the damage costs estimated in AEA (2005) and referenced in the Clean Air Policy Programme IA have been used (EC, 2013b). These estimate health and crop damage costs related to the exposure of ozone (as secondary pollutant induced by the presence of VOC). The estimations provided by AEA (2005) have various sensitivities with regard to the factors and assumptions used to calculate mortality rates. According to the source, health damages account for between 88% and 96% of the costs. In order to calculate the damage costs avoided by the Directive, the approach taken by the Commission (2008) has been used. Table 5.7 presents the damage costs avoided in the EU-28 using the lower and upper ends of the damage costs per tonne used by the Commission in each Member State and the VOC emissions reductions attributed to the Directive from 1995 to the current level of uptake (estimated in sections 2.2.4 and 5.3). As calculated in the table, between €162m and €479m have been saved due to the implementation of the VOC-I Directive in the EU.
As can be observed in the estimations of Table 5.7, Germany accounts for more than a third of the total damage costs avoided in the EU, followed by the UK (16-17%), France (11%), Italy (9%) and the Netherlands (8-9%). The rest of the Member States are estimated to have a much lower contribution to the damage costs avoided.
Table 5.7 Annual benefits resulting from the damage costs avoided due to the
VOC emissions reductions attributed to the VOC-I Directive (1995-current
implementation)
VOC-I Directive
Member State Total damage costs avoided
(lower end) (€M) Total damage costs avoided (upper end) (€M)
AT 0.6 1.6
BE 2.5 7.5
BG 1.0 2.9
CY 0.9 2.8
CZ 3.0 9.0
DK 2.9 8.5
EE 0.4 1.3
FI 2.8 8.2
FR 15.3 45.0
DE 39.0 115.1
EL 6.8 20.1
HR 1.2 3.6
HU 2.3 6.9
IE 2.8 8.4
IT 15.2 44.7
LT 0.4 1.2
LV 0.4 1.3
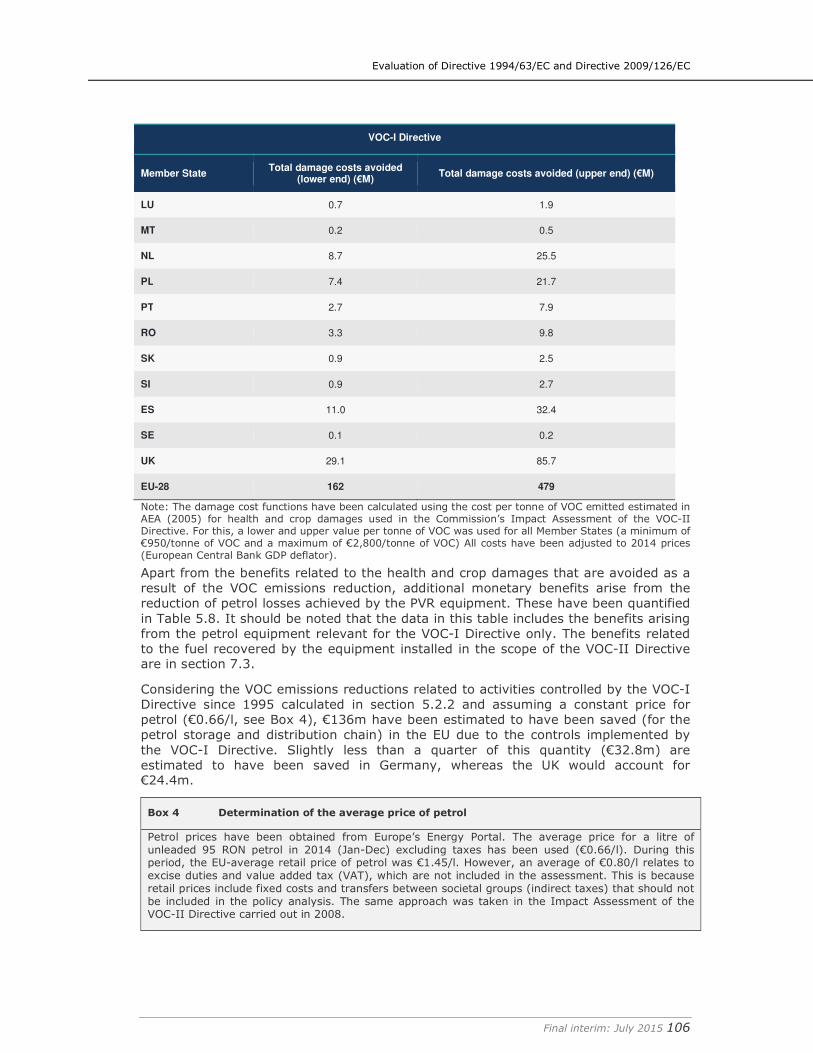
Evaluation of Directive 1994/63/EC and Directive 2009/126/EC
Final interim: July 2015 106
VOC-I Directive
Member State Total damage costs avoided
(lower end) (€M) Total damage costs avoided (upper end) (€M)
LU 0.7 1.9
MT 0.2 0.5
NL 8.7 25.5
PL 7.4 21.7
PT 2.7 7.9
RO 3.3 9.8
SK 0.9 2.5
SI 0.9 2.7
ES 11.0 32.4
SE 0.1 0.2
UK 29.1 85.7
EU-28 162 479
Note: The damage cost functions have been calculated using the cost per tonne of VOC emitted estimated in AEA (2005) for health and crop damages used in the Commission’s Impact Assessment of the VOC-II Directive. For this, a lower and upper value per tonne of VOC was used for all Member States (a minimum of €950/tonne of VOC and a maximum of €2,800/tonne of VOC) All costs have been adjusted to 2014 prices (European Central Bank GDP deflator).
Apart from the benefits related to the health and crop damages that are avoided as a result of the VOC emissions reduction, additional monetary benefits arise from the reduction of petrol losses achieved by the PVR equipment. These have been quantified in Table 5.8. It should be noted that the data in this table includes the benefits arising from the petrol equipment relevant for the VOC-I Directive only. The benefits related to the fuel recovered by the equipment installed in the scope of the VOC-II Directive are in section 7.3.
Considering the VOC emissions reductions related to activities controlled by the VOC-I Directive since 1995 calculated in section 5.2.2 and assuming a constant price for petrol (€0.66/l, see Box 4), €136m have been estimated to have been saved (for the petrol storage and distribution chain) in the EU due to the controls implemented by the VOC-I Directive. Slightly less than a quarter of this quantity (€32.8m) are estimated to have been saved in Germany, whereas the UK would account for €24.4m.
Box 4 Determination of the average price of petrol
Petrol prices have been obtained from Europe’s Energy Portal. The average price for a litre of unleaded 95 RON petrol in 2014 (Jan-Dec) excluding taxes has been used (€0.66/l). During this period, the EU-average retail price of petrol was €1.45/l. However, an average of €0.80/l relates to excise duties and value added tax (VAT), which are not included in the assessment. This is because retail prices include fixed costs and transfers between societal groups (indirect taxes) that should not be included in the policy analysis. The same approach was taken in the Impact Assessment of the VOC-II Directive carried out in 2008.
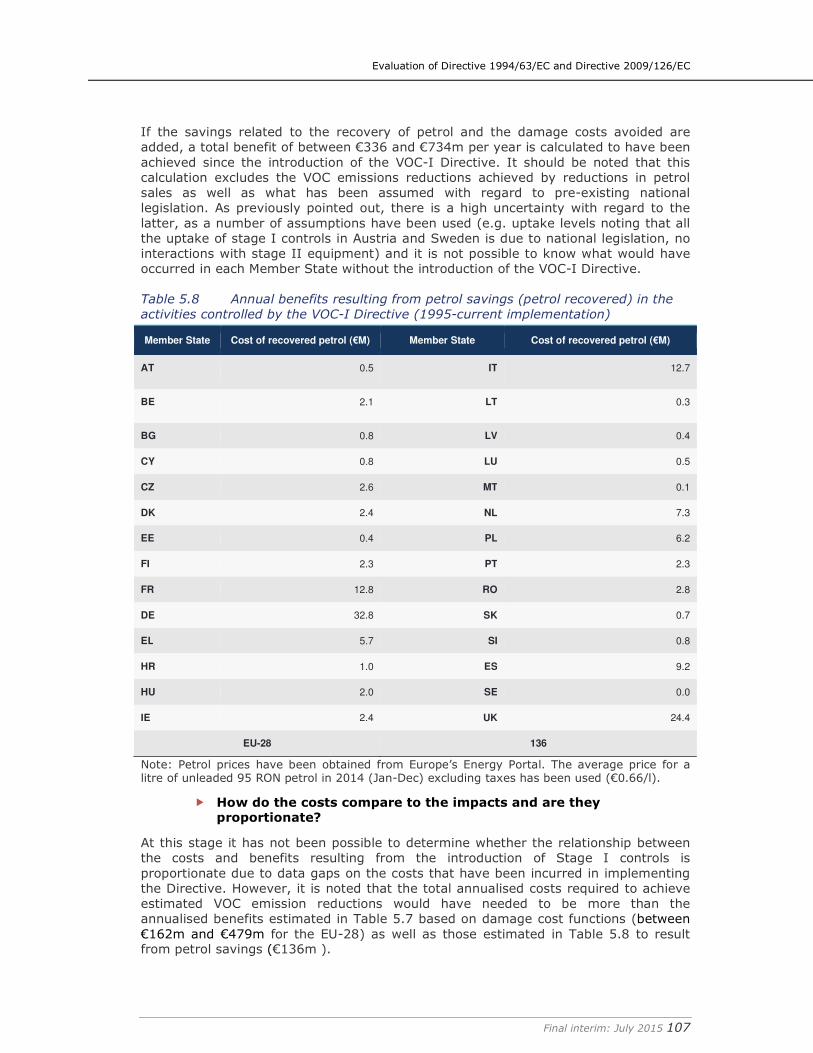
Evaluation of Directive 1994/63/EC and Directive 2009/126/EC
Final interim: July 2015 107
If the savings related to the recovery of petrol and the damage costs avoided are added, a total benefit of between €336 and €734m per year is calculated to have been achieved since the introduction of the VOC-I Directive. It should be noted that this calculation excludes the VOC emissions reductions achieved by reductions in petrol sales as well as what has been assumed with regard to pre-existing national legislation. As previously pointed out, there is a high uncertainty with regard to the latter, as a number of assumptions have been used (e.g. uptake levels noting that all the uptake of stage I controls in Austria and Sweden is due to national legislation, no interactions with stage II equipment) and it is not possible to know what would have occurred in each Member State without the introduction of the VOC-I Directive.
Table 5.8 Annual benefits resulting from petrol savings (petrol recovered) in the
activities controlled by the VOC-I Directive (1995-current implementation)
Member State Cost of recovered petrol (€M) Member State Cost of recovered petrol (€M)
AT 0.5 IT 12.7
BE 2.1 LT 0.3
BG 0.8 LV 0.4
CY 0.8 LU 0.5
CZ 2.6 MT 0.1
DK 2.4 NL 7.3
EE 0.4 PL 6.2
FI 2.3 PT 2.3
FR 12.8 RO 2.8
DE 32.8 SK 0.7
EL 5.7 SI 0.8
HR 1.0 ES 9.2
HU 2.0 SE 0.0
IE 2.4 UK 24.4
EU-28 136
Note: Petrol prices have been obtained from Europe’s Energy Portal. The average price for a litre of unleaded 95 RON petrol in 2014 (Jan-Dec) excluding taxes has been used (€0.66/l).
� How do the costs compare to the impacts and are they proportionate?
At this stage it has not been possible to determine whether the relationship between the costs and benefits resulting from the introduction of Stage I controls is proportionate due to data gaps on the costs that have been incurred in implementing the Directive. However, it is noted that the total annualised costs required to achieve estimated VOC emission reductions would have needed to be more than the annualised benefits estimated in Table 5.7 based on damage cost functions (between €162m and €479m for the EU-28) as well as those estimated in Table 5.8 to result from petrol savings (€136m ).
Evaluation of Directive 1994/63/EC and Directive 2009/126/EC
Final interim: July 2015 108
5.3.3 If any inefficient provisions or disproportionate sources of cost can be
identified, what has caused them? (EF.2)
Whilst the implementation of the Directive has been a source of cost for both, regulators and operators (as detailed above), it includes mechanisms that aim to reduce the regulatory burden:
� The VOC-I Directive introduced flexibility in the speed of implementation, by allowing for different implementation phases for new and existing sites and time-framed derogations/exemptions. This allowed operators to wait until renovation of equipment before achieving the limit values, as well as the deployment of reliable abatement technologies at a commercial scale.
� The investment in Stage I controls may become inefficient/disproportionate at sites that are small or with low population exposure (i.e. remote locations). To some extent, this is addressed by the Directive by allowing the possibility to apply exemptions to small terminals (Article 4(4)) and service stations (Article 6(4)) that take into account considerations such as their location in small remote islands or in a geographical area or on a site where vapour emissions are unlikely to contribute significantly to environmental or health problems. The fact that few Member States have applied permitted derogations suggests that the Directive´s requirements were considered appropriate and not too burdensome by national authorities.
Despite the above, the 2009 review on the implementation of status of the VOC-I (Entec and REC, 2009) noted that implementation of some of the technical provisions of the annexes would lead to disproportionate costs in Sweden and Finland due to pre-existing practices that would require significant equipment and operational changes86. As noted above this has led to some divergences in the way these requirements are applied in those Member States.
5.3.4 If the implementation cost should differ from the estimated cost
(where such data is available), what has caused this difference and
what lessons can be learned? (EF.3)
No ex-ante impact assessment with cost estimates is publicly available on the VOC-I Directive. Due to the fact that the Directive was adopted almost 20 years ago cost estimates prior to implementation are scarce and generally limited to particular regions. In particular, relevant data are available for the UK where the potential to implement the derogation set out in Article 6 (4) was assessed for existing petrol stations with a throughput less than 500m3/year. A report published in this regard87 estimated the following costs for complying with the VOC-I Directive in petrol stations:
86 For instance, it was estimated that modifying 3 inch liquid and vapour collection couplings to 4 inch would achieve no additional reduction in VOC emissions and would cost 400 million SEK to rebuild the 48 terminals in Sweden alone. This corresponded to €40 million at an exchange rate of €1 = 0.100 SEK (as of 10 November 2008, not taking into account inflation). 87http://www.gov.scot/Publications/2004/07/19727/40767
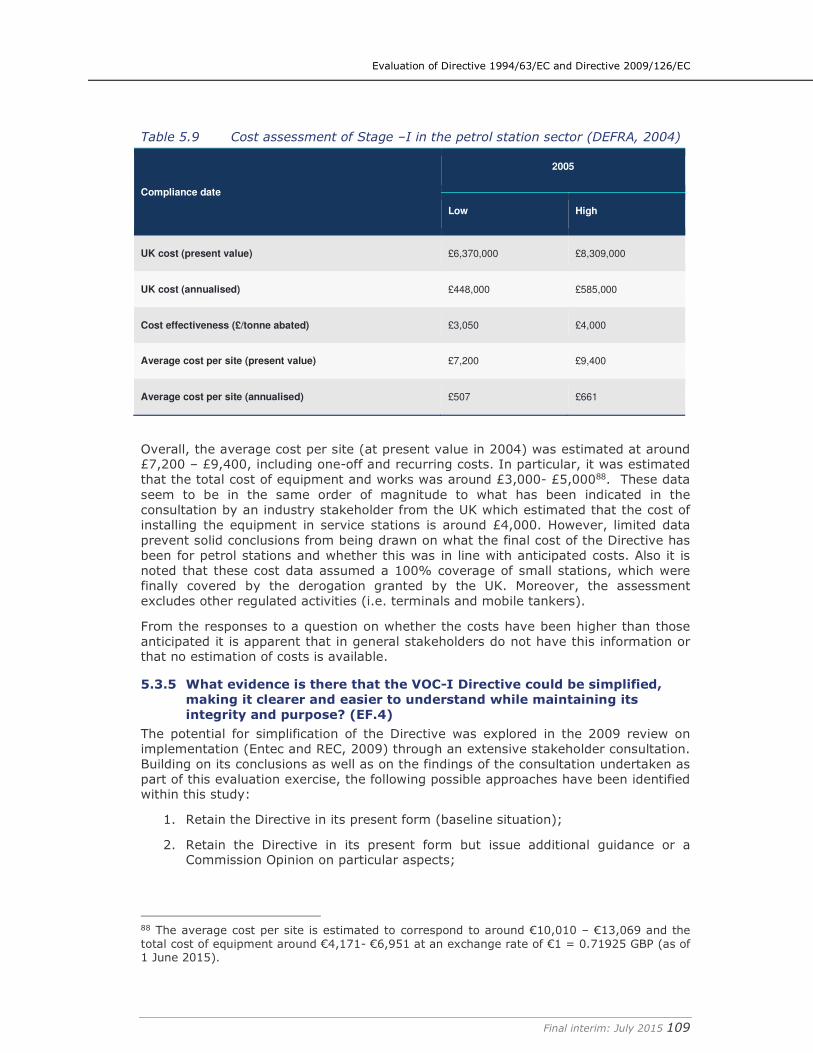
Evaluation of Directive 1994/63/EC and Directive 2009/126/EC
Final interim: July 2015 109
Table 5.9 Cost assessment of Stage –I in the petrol station sector (DEFRA, 2004)
Compliance date
2005
Low High
UK cost (present value) £6,370,000 £8,309,000
UK cost (annualised) £448,000 £585,000
Cost effectiveness (£/tonne abated) £3,050 £4,000
Average cost per site (present value) £7,200 £9,400
Average cost per site (annualised) £507 £661
Overall, the average cost per site (at present value in 2004) was estimated at around £7,200 – £9,400, including one-off and recurring costs. In particular, it was estimated that the total cost of equipment and works was around £3,000- £5,00088. These data seem to be in the same order of magnitude to what has been indicated in the consultation by an industry stakeholder from the UK which estimated that the cost of installing the equipment in service stations is around £4,000. However, limited data prevent solid conclusions from being drawn on what the final cost of the Directive has been for petrol stations and whether this was in line with anticipated costs. Also it is noted that these cost data assumed a 100% coverage of small stations, which were finally covered by the derogation granted by the UK. Moreover, the assessment excludes other regulated activities (i.e. terminals and mobile tankers).
From the responses to a question on whether the costs have been higher than those anticipated it is apparent that in general stakeholders do not have this information or that no estimation of costs is available.
5.3.5 What evidence is there that the VOC-I Directive could be simplified,
making it clearer and easier to understand while maintaining its
integrity and purpose? (EF.4)
The potential for simplification of the Directive was explored in the 2009 review on implementation (Entec and REC, 2009) through an extensive stakeholder consultation. Building on its conclusions as well as on the findings of the consultation undertaken as part of this evaluation exercise, the following possible approaches have been identified within this study:
1. Retain the Directive in its present form (baseline situation);
2. Retain the Directive in its present form but issue additional guidance or a Commission Opinion on particular aspects;
88 The average cost per site is estimated to correspond to around €10,010 – €13,069 and the total cost of equipment around €4,171- €6,951 at an exchange rate of €1 = 0.71925 GBP (as of 1 June 2015).
Evaluation of Directive 1994/63/EC and Directive 2009/126/EC
Final interim: July 2015 110
3. Remove certain technical requirements and replace them with emission limits to be met in a manner that the Member States are to determine independently;
4. Remove certain specific technical requirements in the Annexes and replace these with references to external documents such as CEN standards;
5. Merge the VOC-I Directive with the VOC-II Directive.
1. Retain the Directive in its present form (baseline situation)
The first approach suggests leaving the Directive in its current form. As noted by 9 stakeholders, simplification of the directive is not considered necessary; it is viewed as relatively simple piece of legislation that has been in place for a long time. Regulatory authorities and operators are familiar with the requirements in their current form and changing them may increase the regulatory burden, particularly if this only involves minor adaptations. As such the costs of adapting national legislation would be probably higher than the benefits.
2. Retain the Directive in its present form but issue additional guidance or a
Commission Opinion on particular aspects
Findings from this evaluation have revealed that there are a few areas that could require further attention from the regulators, but which could be addressed without the need to modify the Directive. As such the Commission could consider issuing guidance or an Opinion on the following:
� The current practices implemented in Sweden and Finland, which differ to those established in the Directive (section 4.3.1).
� The interactions between Stage I and Stage II systems, addressing the risk of pressure build-up in underground storage tank ullage spaces. Guidance on this regard could present the different relief and proactive technologies (see section 5.2.8) that are available as a means of hazard/risk mitigation and emission control.
� Training material directed to forecourt staff and tanker drivers, so that the connections between the tanker and the underground storage tank are properly made.
3. Remove certain technical requirements and replace them with emission
limits
The third approach is to remove the technical provisions of the Annexes whilst retaining the overall emissions target(s) and to allow the individual Member States to meet this target in whichever way was felt to be most appropriate. This approach is based on the opinions provided by some organisations consulted during this study (e.g. from Finland, Denmark, Bulgaria) and the previous 2009 review, which indicate that the Directive should not provide too much technical detail, leaving more decision space for the Member States on the type of controls and measures to be adopted to meet the emission levels. In other words they consider that the Directive should be more an obligation of results instead of an obligation of means. The advantage of this approach is that the Member States would be free to shape national regulations so that they are appropriate for the local conditions (e.g. the case of Sweden and Finland). The disadvantages of this method are that separate national regulations may create barriers to trade and that it may become more difficult to assess compliance with the Directive. In this sense, there are stakeholders that have noted the need to complete the harmonisation of technical solutions across all Member States.
With particular reference to the specific situation of Sweden and Finland, the VOC-I Directive could be slightly modified to reflect their current practices. Such a change would only involve changes for those Member States and therefore the regulatory
Evaluation of Directive 1994/63/EC and Directive 2009/126/EC
Final interim: July 2015 111
burden would be minimal on other countries. However, a Commission Opinion could serve the same purpose and would be less burdensome to implement than an amendment of Directive.
4. Remove certain specific technical requirements in the Annexes and replace
these with references to external documents
Within this approach there are a number of external documents that respondents have suggested could be referred to during consultation for this study and the previous 2009 review. These include the following:
� EU legislation (Directive 2008/68/EC) and/or UNECE agreements on the transport of dangerous goods (ARD, RID and ADN) which could be referred to with regards to certain requirements applicable to mobile tankers (Annex IV). However, at the time of the study it appeared that not all relevant requirements of the VOC-I Directive (those set out in Annex IV in particular) were directly covered by these rules, therefore being unlikely to be appropriate to refer to compliance with these instead of retaining the technical provisions of the Directive (Entec & REC, 2009). Further analysis on coherence-related aspects of this legislation is described in section 5.4 (see questions C.1 and C.2).
� CEN standards and technical reports drawn up by the European Committee for Standardisation (CEN) produced which cover some of the requirements of the Directive. These includes two main types:
o Those that have been developed by “CEN TC 296 - Tanks for the Transport of Dangerous Goods”89 which cover some of the requirements of Annex IV (mobile tankers) including those referenced by relevant UNECE agreements90.
o Those that have been developed by the “CEN/TC 393 Equipment for storage tanks and for filling stations”91 which cover some of the requirements related to underground storage tanks. This committee is the one that has developed the relevant standards on Stage II controls that are referred to in the VOC-II Directive (EN 16321:2013).
There is therefore scope for simplifying the Directive (or at least removing some of the technical detail of the Annexes) through referring to such standards, though this would presumably require some updates and some of the requirements currently set out in Technical Reports to be included in formal Standards. In this sense, the 2009 review noted that almost all requirements of Annex IV were covered by CEN standards and technical reports. This approach would presumably involve retaining the target emission levels within the main body of the Directive.
The main advantage of referring to such standards is that it would ensure consistency with the current state of the art and practices in the design and operation of relevant equipment which could potentially be achieved without necessarily needing to adapt the VOC-I Directive again in the future. This approach is the one that has been followed in the VOC-II Directive which already refers to CEN standards for the type approval and testing of Stage II equipment in order to ensure harmonised implementation and adaptation to technical progress.
89 List of CEN standards and technical reports produced by CEN TC 296 (accessed on May 2015): http://standards.cen.eu/dyn/www/f?p=204:105:0::::: 90 European standards are referred currently in the UN legislation regulating the safe carriage of dangerous goods. The following list gives an idea of the type of standards referred to: ftp://ftp.cencenelec.eu/CEN/WhatWeDo/Fields/Transport/DangerousGoods/TransportDangerousGoodsCatalog.pdf 91 List of CEN standards and technical reports produced by CEN TC 393 (accessed on May 2015): http://standards.cen.eu/dyn/www/f?p=204:105:0:::::
Evaluation of Directive 1994/63/EC and Directive 2009/126/EC
Final interim: July 2015 112
The main disadvantage of this option is that the Commission would have less control to positively influence the inclusion of technical requirements in such external documents, although it would retain the ability to exclude any undesirable amendments from the Directive. Moreover, application of harmonised standards might remove some control from the authorities in terms of determining the way in which emissions are controlled (Entec and REC, 2009). Furthermore, for stakeholders who are not familiar with the CEN standard, it would be more advantageous for them to have the technical specifications described in the Directive itself rather than consulting a separate technical document.
� A few stakeholders have noted that referring to the BREF policy and application of BAT-conclusions could be explored as a mean to stimulate innovation and adaptation to technical progress. In this field the BREFs on Storage (2006) and Refining (2015) are relevant, though it is important to note that the BREF sets out emission levels associated with the use of best available techniques whereas the emission limit values and techniques set out in Directive 94/63/EC represent minimum standards.
5. Merge the VOC-I Directive with the VOC-II Directive
Lastly, two stakeholders have suggested the possibility of merging the VOC-I Directive with the VOC-II Directive in one single instrument as a means of simplification. In particular, an industry stakeholder from Ireland notes that a single Directive would enable the interactions of Stage I and of Stage II systems to be addressed. However, as noted in section 5.4.2 most of the stakeholder responses tend to not agree with this possibility as they point out that each directive addresses different phases of petrol storage and distribution and this would involve an additional legislative process, which could create unnecessary administrative burden compared to the potential benefits.
Summary
Based on the above analysis it appears that there is scope to simplify the Directive through its amendment and the removal of certain technical requirements. However, a number of disadvantages associated with this approach have been described, including the creation of significant administrative burden compared to the potential benefits. Issuing guidance would enable some of the issues identified around the Directive to be addressed without involving such burden for Member States and industry.
5.3.6 If any adverse consequences of the directive have been identified,
what (if anything) caused differences in impact on large enterprises on
the one hand and micro, small or medium sized enterprises on the
other? (EF.5)
� Have the Directives resulted in any adverse consequences, with
differing impacts on large companies and SME?
When assessing this question it is important to note that large companies and SME can operate sites of different sizes (i.e. terminals/stations with large throughputs do not necessarily need to be owned by large companies and vice versa with small sites).
A guidance document on control techniques of emissions from stationary sources prepared by the Expert Group on Techno-Economic Issues to the UNECE convention (2012)92 presents (in Table 4) the approximate costs of installing Stage I in service stations broken down by annual petrol throughput. This demonstrates that the cost efficiency ratio of installing Stage I controls decreases significantly with decreases of the size of the station. As such costs range from 495 to 882 €/t VOC abated for 92http://www.unece.org/fileadmin/DAM/env/documents/2012/air/WGSR_50th/Informal/Informal_document_no2_stationary_sources_rev.pdf
Evaluation of Directive 1994/63/EC and Directive 2009/126/EC
Final interim: July 2015 113
stations larger than 3,000 m3 per year and increase up to 5,879 €/t VOC abated for stations delivering between 500 m3 and 100 m3 per year. The price increases considerably to 24,955 €/t VOC abated for the smallest stations delivering less than 100 m3, however, these were exempted under the scope of the Directive.
Costs are likely to represent a significantly greater proportion of profit and gross margin associated with petrol sales for smaller service stations, particularly for those that only rely on petrol sales (e.g. no shop trade). This has been also indicated by two respondents from the UK and Germany, which note that stations with low throughput and thus low income have difficulties in bearing the high investment costs required to install PVR controls.
Similar data are not available for terminal operators or mobile tankers owners, but responses from the consultation (from FR and DE) have indicated that smaller terminals (not necessarily SME) with lower throughputs had to face high investments. This led to a situation where a number of small terminals stopped storing petrol because they could not recover the investment costs, which could ran into the million Euros. However, it is relevant to note that some sites can be operated by large companies (potentially with multiple sites), which are likely to have more resources to bear the high investment costs required to install Stage I controls (even at small sites) than those sites owned by SME. In this regard, two industry stakeholders from France have specifically noted that the costs associated with the VOC-I Directive were financially unbearable for smaller independent firms.
� If companies of different size have been disproportionally impacted, what has caused these differences?
Small throughput sites, especially those operated by SME, face higher compliance costs due to economies of scale and relative lack of sufficient resources to meet requirements (i.e. service stations with lower throughputs when installing the PVR system will face a higher cost per litre of petrol sold). Moreover, smaller companies might face more difficulties with the interpretation of the Directive’s requirements. Larger companies are more able to absorb the costs of specialists responsible for obtaining permits and conforming to the requirements of the Directive.
However, three respondents from the consultation have noted that the fact that small fuel depots/terminals or service stations are facing financial difficulties or even closing down is due to a combination of reasons, including the regulatory burden placed on them with regards to aspects such as safety or soil and air pollution prevention. As such it is difficult to determine the impact that the VOC-I Directive actually had on small sites.
5.3.7 If there are any differences between Member States (e.g.
implementation costs), what is causing them and what effect are they having on the observed results and impacts? (EF.6)
� Are there significant cost differences between Member States?
As mentioned in section 5.3.2, it has not been possible to gather data on the costs, per Member State, of implementing the VOC-I Directive.
� If so, what are the main reasons for these differences and what effects are these having?
While no information is available on differences in costs between Member States, it is expected that the implementation of the VOC-I Directive will result in different costs. These are due to:
Evaluation of Directive 1994/63/EC and Directive 2009/126/EC
Final interim: July 2015 114
� Whether national legislation places stricter requirements than the Directive. A key issue has been the imposition of different limits for VRU units. In particular, Germany has the tightest limits and several stakeholders have indicated that this has involved high investment costs compared to other countries. However, it should be noted that not all of these costs can be attributed to the directive – the additional costs of the tighter levels of emission controls are attributed to national legislation. This also applies to some other Member States.
� Their annual petrol throughput and the national pattern of consumption of petrol against diesel use. For instance, although Germany and France are the two most populated countries in the EU (80.5 million and 65.5 million respectively), petrol sales in Germany are triple those of France, due to the high share of diesel consumption in the latter (see section 2.2.4).
� Local market conditions, for instance affecting retail prices of equipment and maintenance.
� Other reasons associated with implementation such as the existence of funding national programmes for relevant technologies, different permitting approaches (e.g. depending on whether permit application fees are imposed such as in the UK), stakeholder acceptability/engagement, and enforcement and inspection action. Details on these aspects are provided in the individual summaries on implementation of each Member State (Appendix D).
5.3.8 What good practices in terms of cost-effective implementation of the
Directive in Member States can be identified? (EF.7)
The identification of good practices in terms of cost-effective implementation of the Directive could only be assessed to some extent. The stakeholder workshop will provide a forum to further identify and exchange experience on potential cost-effective good practices amongst the different activities covered by the Directive. This will be supported by further analysis of the individual summaries on implementation (see Appendix D).
Initial areas of good practice have been identified and will be further discussed at the workshop:
� Practices that drive and support innovation in technology. These contribute to increasing the economic incentive to operators provided by VOC I technologies through greater petrol savings. For instance, the BREF on Refineries (2015) notes that in France, since the end of 1990, subsidies to support investment have been provided to companies to achieve more ambitious targets than the regulatory framework for recovery of vapours from loading facilities. One process uses adsorption on activated carbon with vacuum desorption. This process allows the VOC emission level to be reduced to 2 g/Nm3, below the regulatory target of 35 g/Nm3.
� Fiscal incentives such as use of tax rebates as reported in section 5.2.4 for some countries (DE, DK and NL). In particular, an OECD environmental performance review of Denmark (2007) notes that since 1995, a 0.03DKK/l tax rebate had been granted to petrol sold from service stations with a vapour recovery system. The application of tax refunds on the recovered product to avoid double taxation by some EU authorities make vapour recovery a better investment and reduces the financial burden placed on operators.
� Public-private cooperation and provision of guidance and training materials. As noted in the 2009 implementation review (Entec and EC, 2009) and in the individual summaries in Appendix D, several Member States (e.g. UK, NL, DE) have issued guidance to facilitate implementation of the Directive addressed to
Evaluation of Directive 1994/63/EC and Directive 2009/126/EC
Final interim: July 2015 115
operators and authorities. In this regard it is relevant to mention an industry-based initiative supported by the UK government to increase the competence skills of tanker drivers; the Petroleum Driver Passport (PDP)93. This provides a benchmark and training standard to ensure that all tanker drivers achieve and demonstrate a minimum level of competency, including on aspects related to the management of petrol vapour recovery.
� Practices related to inspection and enforcement of the legislation. For instance in some Member States (e.g. SE, IE) inspections must be handled by companies that are accredited by relevant accreditation bodies or inspectors.
5.4 Coherence
5.4.1 Overview
The evaluation of the coherence of the VOC-I Directive is structured around the responses to two principal questions and several sub-questions, which are described in sections below.
While it has been important to separate the evaluation carried out for each Directive, a general overview of the policy context (i.e. improving air quality) has been kept in mind so that any significant aspects related to coherence are highlighted. The analysis also considers legal coherence (consistency in use of terms, timetables, scope, etc.) and practical coherence (how well the two Directives work together and with other policies).
5.4.2 To what extent is the VOC-I Directive satisfactorily integrated and
coherent with other EU legislation with similar objectives and with the
Clean Air Programme for Europe? (C.1)
The above question is broken down into three sub-questions in order to respond to all related coherence aspects between the VOC-I Directive and other relevant legislation.
� How do the objectives of the VOC-I and VOC-II Directives interact and complement each other?
Assessment of the functioning of the VOC-I and VOC-II Directives as a policy package indicates that they have both contributed to significantly reducing the amount of VOC emissions from petrol storage, distribution and refuelling (see section 5.2.2 and 7.2.2 under effectiveness of the Directive for further details).
Concerning the objectives of the VOC Directives, both Directives address the petrol supply sector and aim at reducing the emissions of VOC during petrol storage and distribution (VOC-I) and vehicle refuelling (VOC-II). Clear distinctions and definitions are made with regard to the scope of both Directives and which activities they cover during the petrol vapour recovery process, therefore they do not overlap in scope, but rather complement each other by ensuring that the key phases of petrol vapour recovery (PVR) are covered. In fact, the 2008 impact assessment report of the VOC-II Directive clearly states that the benefit of Stage I controls would be maximised if Stage II PVR controls were also installed at the same service stations.
Further examination of the specific articles of the Directives indicates that the terms and definitions used are also complementary. Paragraph 6 of the VOC-II Directive explicitly states that petrol vapour emitted during the refuelling of motor vehicles should be recovered in a manner consistent with the previsions of the VOC-I Directive. In Article 2 of both Directives, definitions are provided. There do not appear to be any
93 http://www.pdpassport.com/mini/30922.html
Evaluation of Directive 1994/63/EC and Directive 2009/126/EC
Final interim: July 2015 116
inconsistencies between these definitions. In the VOC-II Directive, for certain definitions such as for “petrol”, and “service station”, direct references are made to the definitions for these terms under the VOC-I Directive. Furthermore, VOC-I was established in 1995 and VOC II in 2009. As such, VOC II provides further detailed clarifications compared to VOC-I to take into account developments since the adoption of the VOC-I Directive. For example, the VOC-II Directive defines “new service station” in a different way compared to the VOC-I Directive. Article 2(5) of VOC II defines a ‘new service station’ means a service station which is built or for which an individual planning permission, construction licence or operating licence is granted on or after 1 January 2012. Article 2(h) of VOC I specifies that ‘new’ shall mean such installations, service stations which are not covered by paragraph g: ‘existing’ service stations which were in operation before 1995. The main difference between the two definitions is the different dates specified and the mention of construction and operating licenses under the VOC-II Directive.
During the stakeholder consultation launched in the context of this study, a question was asked about the possibilities of merging the two Directives together for simplicity purposes and to reduce the administrative and technical burdens of EU legislation. Most of the stakeholder responses received indicate that they tend to not agree with this possibility. The reasons for keeping the Directives separate provided by stakeholders included:
� Stage I and Stage II systems are largely separate systems addressing different phases of petrol storage and distribution, with Stage I being possible without Stage II. Furthermore, there are opportunities for Stage II to develop independently of Stage I for example by encouraging the development of new technologies and innovation.
� The VOC-I Directive has been in place for several years and is already fully implemented with national regulations in place. Therefore, merging the Directives would entail an additional legislative process, which could create unnecessary administrative burden compared to the potential benefits.
� The stakeholders affected by both Directives are quite different (with the exception of service station operators). Therefore it is important to keep the Directives separate.
� The implementation periods of both Directives are very different. VOC-I should already be fully implemented and VOC-II is still in its implementation phase. If any merging occurs now, it should be more a layout change rather than a revision in content or requirements.
The few stakeholders who agreed with the proposition of a single Directive stated that it could achieve an ease of reference and simplicity. This was particularly the case for Member States that address some of the requirements of both Directives under one piece of national legislation. For example, according to the authority in Bulgaria, a single Directive would make sense for them as the requirements of the two Directives are addressed under the same national legislation. The authority from Luxembourg also voiced the same opinion as some of the provisions included in the two Directives have been addressed by a single national regulation since 1996. In addition an industry stakeholder from Ireland notes that a single Directive would enable the interactions of Stage I and of Stage II systems to be addressed (i.e. risk of pressure build-up in underground storage tank ullage spaces) and take account of “whole-site” vapour processing technologies as a means of hazard/risk mitigation. However, these were only minority opinions from a few stakeholders as the majority felt that the Directives work better as two separate pieces of legislation.
Evaluation of Directive 1994/63/EC and Directive 2009/126/EC
Final interim: July 2015 117
� What are the other pieces of EU law and policy with similar objectives?
Are these and the Clean Air Programme for Europe coherent with the
Directives?
Table 2.1 in section 2.1 provides a general overview of the different EU, international and sector specific legislation that include provisions related to the control of VOC emissions. With the exception of some of the sector-specific legislation, all the listed EU and international legislation aim to control VOC emissions with the overall objective of improving air quality by reducing harmful emissions into the atmosphere.
Further analysis is provided in this section regarding the extent that the objectives of the VOC-I Directive are coherent with the Clean Air Programme and other pieces of EU legislation. The following EU and international obligations have been identified to assess the extent that objectives, targets, timelines, scope and definitions of the VOC Directives are complementary, mutually supportive and non-contradictory.
2013 Clean Air Programme for Europe
The 2013 Clean Air Programme for Europe94 (which supersedes and replaces the 2005 Thematic Strategy on Air Pollution) provides a strategic framework for European air quality policy until 2030. The Directives contribute to the overall EU objective of improved air quality and reduction of pollutants in the atmosphere by targeting the reduction of VOC emissions from a specific sector: petrol storage and distribution from terminals to service stations. The objectives of the VOC-I and VOC-II Directives are coherent with the overall objectives of the Clean Air Programme as the Programme specifically states that meeting the air pollutant targets established in Directive 2001/81/EC on National Emission Ceilings for certain pollutants (NECD)95 and further reducing VOC emissions relies on the full implementation of the existing source legislation, whilst also suggesting that Member States may have to take additional measures.
NECD/ Gothenburg Protocol
Directive 2001/81/EC on National Emission Ceilings for certain pollutants (NECD)96 lays down limits on total national emissions for VOC which contribute to the formation of ground-level ozone. It had to be achieved from 2010 onwards for each Member State. Under the Clean Air Policy Package the Commission presented a proposal for a revised Directive which includes updated national ceilings for 2020 and 2030. One of the drivers for the NEC Directive has been the process within the context of the UN/ECE Convention on Long-Range Transboundary Air Pollution (Gothenburg Protocol) to define critical loads and to agree on the national emission reduction targets necessary to ensure that critical loads are not exceeded, at the lowest overall cost97.
The Gothenburg Protocol was amended in 2012 and sets emission ceilings for 202098. Revision of the Gothenburg Protocol aimed at broadening the participation and ratification of the EU's eastern neighbours and set 2020/2030 ceilings for the pollutants covered by the current NEC Directive. It has also been extended to cover particulate matter (PM2.5) and black carbon (a component of PM2.5).
The objectives of the VOC Directives are coherent with both the EU and international objectives specified in the NECD and Gothenburg Protocol since reduced VOC emissions from petrol storage and distribution contribute to meeting these targets. S A potential inconsistency was identified between the VOC-I Directive and NECD/
94http://ec.europa.eu/environment/air/clean_air_policy.htm 95http://ec.europa.eu/environment/air/pollutants/ceilings.htm 96http://ec.europa.eu/environment/air/pollutants/ceilings.htm 97 http://ec.europa.eu/environment/archives/cafe/activities/pdf/case_study2.pdf 98http://www.unece.org/ro/env/lrtap/multi_h1.html
Evaluation of Directive 1994/63/EC and Directive 2009/126/EC
Final interim: July 2015 118
Gothenburg Protocol pertaining to the differing emissions limits. This aspect is discussed in more detail under question C2 in section 5.4.3.
Air Quality Directive (AQD)
Directive 2008/50/EC on ambient air quality and cleaner air for Europe (AQD)99 sets local air quality limits for ground-level ozone and benzene. The AQD is of particular relevance in terms of the VOC Directives as the AQD includes targets for benzene and ground-level ozone, both of which are affected by emissions from petrol. In terms of the interaction between the Directives and the AQD, the objectives of the Directives are coherent with the AQD because the Directives address VOC emissions from a specific source (petrol storage and distribution). This contributes to reducing concentrations of VOC in the atmosphere and limiting transboundary air pollution. This objective is connected to the AQD because the AQD sets local concentration limit values for the air pollutants most harmful to health, and achieving the air quality standards often requires a combination of local actions addressing particular air pollution hotspots, and reducing emissions by implementing source legislation such as the VOC Directives.
Transport of Dangerous Goods Directive (TDG Directive)
Directive 2008/68/EC of the European Parliament and of the Council of 24 September 2008 on the inland transport of dangerous goods (TDG Directive)100 establishes a common regime for all aspects of the inland transport of dangerous goods, by road, rail and inland waterways within the EU. It incorporates related international/ UNECE agreements and standards: the European Agreement concerning the International Carriage of Dangerous Goods by Road (ADR) and the Regulations concerning the International Carriage of Dangerous Goods by Rail (RID). The objectives of the TDG Directive are coherent with the objectives of the VOC-I Directive as the TDG covers all aspects of inland transport of dangerous goods by rail, road and inland waterways, whereas the VOC-I Directive addresses road tankers in particular. There is some indication of possible areas for simplification regarding the technical requirements included in both Directives for road tankers e.g. leakproofness testing and testing of the satisfactory operation of all relevant equipment. Further discussion on the potential overlaps with this legislation is provided under question C2 in section 5.4.3.
The Marpol Convention
This international legislation is relevant to the VOC-I Directive because it ensures that standards on vapour control and recovery systems apply to both installations and ships. The International Convention for the Prevention of Marine Pollution from Ships (Marpol Convention)101 is the main international convention on preventing ships polluting from operational or accidental causes. Annex VI of the Marpol Convention regulates the emission to the atmosphere of specified pollutants from ships, including VOC. Regulation 15 states that in ports where there is a need to control the emission of VOC, there is also a requirement for the ports to ensure appropriate recovery facilities are available. To ensure coherence with the requirements of the Marpol Convention, the VOC-I Directive makes specific reference to International Maritime Organisation (IMO) standards and the need to ensure that standards are drawn up at IMO level for vapour control and recovery systems to apply to both loading installations and ships. Literature indicates that the emissions from the loading of petrol on ships is relatively small and that the abatement measures are very high in
99http://eur-lex.europa.eu/legal-content/EN/TXT/?uri=celex:32008L0050 100 http://ec.europa.eu/transport/road_safety/topics/dangerous_goods/index_en.htm 101http://www.imo.org/About/Conventions/ListOfConventions/Pages/International-Convention-for-the-Prevention-of-Pollution-from-Ships-(MARPOL).aspx
Evaluation of Directive 1994/63/EC and Directive 2009/126/EC
Final interim: July 2015 119
cost102. The conclusion was that more efforts should instead be focused in other sectors where VOC emissions are more important. Therefore, at the moment no further amendments have been made to the VOC-I Directive regarding the inclusion of vapour control and recovery systems for loading installations and ships.
Fuel Quality Directive (FQD)
The objectives of Directive 98/70/EC on Fuel Quality (FQD)103 are in line with and complementary to the VOC-I Directive as the FQD regulates the contents of certain VOC including benzene (1% v/v) and oxygenates (e.g. ethanol, methanol) in motor fuels, as well as other fuel quality parameters such as petrol vapour pressure (RVP), which is a key determinant in the extent of emissions from petrol storage and distribution. Both pieces of legislation aim to reduce harmful pollutants being released into the air. The possibility to grant exemptions to allow higher vapour pressure fuel (in Member States with low ambient temperature and where bioethanol is used) also affects the degree of VOC emissions from petrol. This topic is further discussed under question C2 in section 7.4.3.
Industrial Emissions Directive (IED)
The IED104 is relevant in the context of application of BAT to the petrol sector through BAT Reference Documents (BREFs) on mineral oil and gas refineries, which cover petrol storage tanks at terminals. The objectives of the IED and VOC-I are coherent because, even though the BREF on refineries includes more stringent emission limits than those in the VOC-I Directive, the BREF sets out emission levels associated with the use of best available techniques whereas the emission limit values and techniques set out in the VOC-I Directive represent minimum standards (see question C.2. in section 5.4.3).
To summarise the above paragraphs, no major incoherencies were identified between the objectives of the VOC-I Directive and other related legislation. Most of the related legislation was designed with similar objectives: to improve air quality in the EU and to reduce the emission of harmful pollutants into the atmosphere. The main difference pertains to the scope of the legislation and some of the technical requirements and provisions. Some potential overlaps regarding specific technical provisions and requirements were identified and are further discussed under question C.2 (section 5.4.3).
Overall, the stakeholder responses received during the consultation process reflect a general consensus that the Directives are coherent with the objectives of EU and international legislation. Some specific comments include for example, those from an EU industry association, which considers that the Directives are important complements to several other EU initiatives on air quality, including Directives 2001/81 (NECD) and Directive 2008/50 (AQD). An industry stakeholder from Germany also stated that the impacts of the Directives (in terms of overall reduction in VOC emissions) are used in the base scenario in defining the objectives and targets for NECD and AQD. Therefore, it is important that the VOC Directives exist, in order to provide a basis for any future revisions within the context of overarching legislation such as NECD and AQD e.g. to help determine whether overall emission limits need to be stricter. An industry stakeholder from Finland added that there are no significant overlaps between the objectives of the Directive and other legislations because the VOC Directives address a very specific sector.
102 AEA Technology (2001), Measures to reduce emissions of VOC during loading and unloading of ships in the EU, available online: http://ec.europa.eu/environment/air/pdf/vocloading.pdf 103http://ec.europa.eu/environment/air/transport/fuel.htm 104http://ec.europa.eu/environment/industry/stationary/ied/legislation.htm
Evaluation of Directive 1994/63/EC and Directive 2009/126/EC
Final interim: July 2015 120
� How can the Directives and other policy and legislation work better together?
Several areas can be identified where the different air quality and emissions legislation along with the VOC-I Directive and VOC-II Directive can work better together. The areas described below were identified through literature review and stakeholder feedback.
International cooperation and greater links between air quality and other
related sectors such as transport, public health and climate change
Air pollution is a transboundary problem, making international cooperation essential to improving air quality in the EU. Much progress has already been made in the EU in terms of air policy, however it is important to ensure that existing legislation is implemented in the short term, and that strategies and actions are put into place so that the overall air quality objective can be achieved in the longer term. In this context, efforts must be made by Member States and relevant industry stakeholders to fully implement and comply with the VOC Directives, which contributes to the overall objective of improved air quality and reduction in harmful emissions. The Commission also has a role to play in encouraging better implementation of the Directives by providing relevant guidance and assistance in helping Member States and industry tackle any implementation issues. Ensuring that the VOC Directives are kept up to date and coherent with international agreements is thus key in ensuring that EU air policy is effective.
Furthermore, air quality touches upon many different sectors and greater links between air quality legislation and other related areas could render polices more effective in achieving overarching objectives such as improving impacts on public health.
Links between health and the environment could also be further strengthened through knowledge exchange. This could be facilitated through the creation of working groups that include experts specialised in different sectors or legislative areas that could meet regularly or on an ad-hoc basis to discuss areas for potential synergies and common objectives to be achieved. For example, an industry stakeholder from Belgium commented that it would be important for the automotive industry to be present at such discussions in order to avoid contradictions between Directives and facilitate knowledge exchange on technical aspects that are common across various sectors. A Member State representative from Bulgaria also suggested having one committee at the EU level responsible for both Directives, rather than two separate committees to facilitate knowledge exchange and harmonised data on air quality and VOC emissions from petrol storage and distribution.
Innovation and growth
The Commission Staff Working Paper on the implementation of EU Air Quality Policy identifies the significant role that air quality and emission control measures play as drivers for innovation and growth (EC, 2011). EU air quality standards are amongst the most stringent around the world; therefore they strongly encourage technical innovations. The VOC Directives in particular hold great potential for technological innovation related to increasing the efficiency of petrol vapour recovery units, storage techniques and refuelling processes. For example, technologies such as carbon absorption, refrigeration and hybrid membrane/absorption employed in modern vapour recovery units (VRUs) are capable of reducing emissions to significantly below the limit of 35 g/Nm3 specified in the Directive (Entec & REC, 2009). Therefore, the innovative and dynamic nature of technology development could be exploited to a greater extent in the in the context of the VOC Directives through EU and national initiatives that encourage technological innovations e.g. research programmes and
Evaluation of Directive 1994/63/EC and Directive 2009/126/EC
Final interim: July 2015 121
grants, workshops on advancements in technologies in the sector, etc. This suggestion was reflected in stakeholder feedback. In relation to the Directive on national emission ceilings, the Netherlands indicated that there is a need to introduce long-term innovative techniques for the storage of VOC. Innovative techniques which are feasible (including costs and investments) are seen as the way forward in reducing emissions of VOC from storage under the VOC-I Directive.
5.4.3 What gaps, overlaps, discrepancies, contradictions or similar issues
regulated in other relevant legal acts, standards or activities can be
identified which hampered or improved achievement of the objectives
in the VOC-I Directive? (C.2)
This question aims to provide responses related to whether there are any overlaps, gaps and/or inconsistencies between the VOC-I Directive and relevant legal acts, standards, activities or international obligations and whether there are any opportunities for simplification. It should be noted that a potential overlap or “duplication” between the Directive and other legislation does not necessarily act as a barrier towards achievement of the Directive’s objectives. In the context of the analysis, overlaps or duplications refer to when several pieces of legislation make reference to the same or similar technical standards or requirements and objectives. Some of the issues that were identified and further described in the following sections include:
� Technical provisions on road tankers (Annex IV pf the VOC-I Directive)
� CEN standards
� Local conditions of certain Member States
� BREFs and emission levels
� Different emission limits compared to the Gothenburg Protocol
Technical provisions on road tankers (Annex IV of the VOC-I Directive)
The assessment of the implementation of the VOC-I Directive report (Entec & REC, 2009) highlights several potential overlaps (or duplications) with the VOC-I Directive and other related legislation. The main overlaps concern particularly the technical provisions on road tankers included in Annex IV of the VOC-I Directive and relevant CEN standards and the ADR Agreement (The European Agreement concerning the International Carriage of Dangerous Goods by Road), which is transposed into EU legislation under Directive 2008/68/EC.
The ADR agreement includes requirements for tankers carrying liquids such as petrol. In particular, a leakproofness test and testing of the satisfactory operation of all relevant equipment is required (Chapter 6.8.2.4 of the ADR). Similarly, Article 5(1)(d) of the VOC-I Directive requires authorities to ensure regular testing for vapour tightness and periodic inspection for correct functioning of vacuum/pressure values. However, the ADR agreement provides further details regarding regular inspections and leakproofness testing by indicating the time duration between initial, intermediate and periodic inspections as well as how to carry out the leakproofness test of tank shells.
Analysis of the legislative tests indicate that although both regimes refer to regular inspections and testing, there appears to be no significant overlap that would hamper achievement of the objectives of the VOC-I Directive. Further, no information from the literature reviewed or from stakeholders indicates that this overlap has created challenges in the implementation of either Directive. In fact, some Member States are understood to fulfil the requirements of Directive 94/63/EC through their national implementation of the ADR agreement requirements (Entec and Rec, 2009).
Evaluation of Directive 1994/63/EC and Directive 2009/126/EC
Final interim: July 2015 122
CEN standards
Concerning CEN standards, there exists a wide range of standards developed by CEN, particularly in the context of tanks for the transport of dangerous goods (which is addressed by Annex IV of the VOC-I Directive).
A closer look into the CEN standards and the requirements outlined in Directive 94/63/EC indicate that most of the provisions of the Directive are covered by CEN standards and/or technical reports. An in-depth analysis of the links between the Directive and CEN standards was not possible within the scope of the current study, but based on short summaries and general descriptions of the some of the CEN standards, some overall observations have been made on whether any of the requirements could hamper effective implementation of the Directive. The table below lists some the CEN standards relevant to the VOC-I Directive:
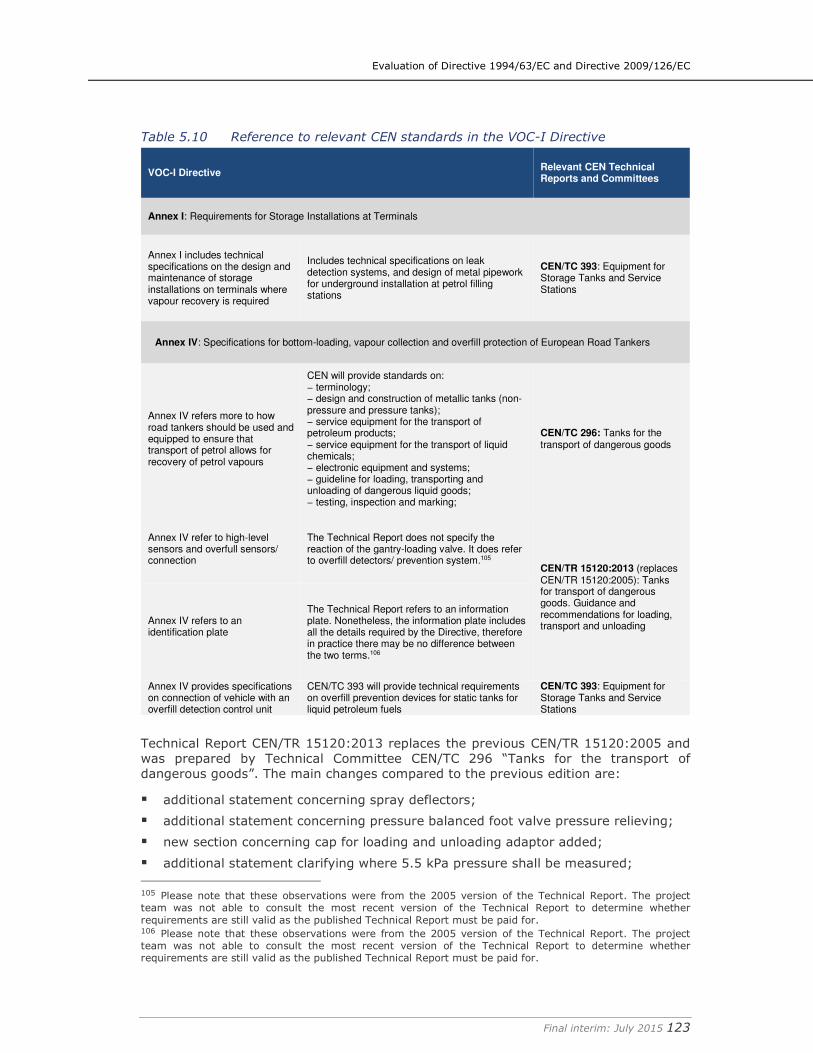
Evaluation of Directive 1994/63/EC and Directive 2009/126/EC
Final interim: July 2015 123
Table 5.10 Reference to relevant CEN standards in the VOC-I Directive
VOC-I Directive Relevant CEN Technical Reports and Committees
Annex I: Requirements for Storage Installations at Terminals
Annex I includes technical specifications on the design and maintenance of storage installations on terminals where vapour recovery is required
Includes technical specifications on leak detection systems, and design of metal pipework for underground installation at petrol filling stations
CEN/TC 393: Equipment for Storage Tanks and Service Stations
Annex IV: Specifications for bottom-loading, vapour collection and overfill protection of European Road Tankers
Annex IV refers more to how road tankers should be used and equipped to ensure that transport of petrol allows for recovery of petrol vapours
CEN will provide standards on: − terminology; − design and construction of metallic tanks (non-pressure and pressure tanks); − service equipment for the transport of petroleum products; − service equipment for the transport of liquid chemicals; − electronic equipment and systems; − guideline for loading, transporting and unloading of dangerous liquid goods; − testing, inspection and marking;
CEN/TC 296: Tanks for the transport of dangerous goods
Annex IV refer to high-level sensors and overfull sensors/ connection
The Technical Report does not specify the reaction of the gantry-loading valve. It does refer to overfill detectors/ prevention system.105
CEN/TR 15120:2013 (replaces CEN/TR 15120:2005): Tanks for transport of dangerous goods. Guidance and recommendations for loading, transport and unloading
Annex IV refers to an identification plate
The Technical Report refers to an information plate. Nonetheless, the information plate includes all the details required by the Directive, therefore in practice there may be no difference between the two terms.106
Annex IV provides specifications on connection of vehicle with an overfill detection control unit
CEN/TC 393 will provide technical requirements on overfill prevention devices for static tanks for liquid petroleum fuels
CEN/TC 393: Equipment for Storage Tanks and Service Stations
Technical Report CEN/TR 15120:2013 replaces the previous CEN/TR 15120:2005 and was prepared by Technical Committee CEN/TC 296 “Tanks for the transport of dangerous goods”. The main changes compared to the previous edition are:
� additional statement concerning spray deflectors;
� additional statement concerning pressure balanced foot valve pressure relieving;
� new section concerning cap for loading and unloading adaptor added;
� additional statement clarifying where 5.5 kPa pressure shall be measured; 105 Please note that these observations were from the 2005 version of the Technical Report. The project team was not able to consult the most recent version of the Technical Report to determine whether requirements are still valid as the published Technical Report must be paid for. 106 Please note that these observations were from the 2005 version of the Technical Report. The project team was not able to consult the most recent version of the Technical Report to determine whether requirements are still valid as the published Technical Report must be paid for.
Evaluation of Directive 1994/63/EC and Directive 2009/126/EC
Final interim: July 2015 124
� flame arrester specification updated to meet latest standards;
� additional statement concerning positioning of an overfill probe;
� Annex A – statement concerning height of loading adaptors changed to reflect Directive 94/63/EC;
� Annex A – additional statement defining minimum adaptor spacing added.107
Furthermore, it is also worth noting that the CEN standard includes specific reference to the VOC-I Directive: “The European Parliament and Council Directive 94/63/EC
(VOC Directive) requires operators to ensure that petroleum vapours are not emitted
into the atmosphere during loading and unloading. The recommendations and
guidance given in this document are intended to assist users in meeting the
requirements of this Directive.”
In the draft business plan for CEN/TC 393: Equipment for Storage Tanks and for Service Stations, specific reference is made to both the VOC-I and VOC-II Directive as CEN/TC 393 covers tank equipment e.g. overfill-prevention devices, leakage detection systems, nozzles etc. used in the context of the VOC Directives108. In particular, one of the objectives of CEN/TC 393 is to elaborate standards on requirements, testing and marking on tank equipment.
No evidence has been identified through the comparison exercise shown in the table above, literature or stakeholder feedback of potential overlaps between the VOC-I Directive and CEN standards that have created implementation challenges. Most of the potential inconsistencies identified appear to be minor i.e. in terms of terminology (information plate vs. identification plate). A deeper analysis would be needed of the actual technical standards and technical reports to determine whether there are any other requirements that are contradictory with the VOC Directive. Further discussion on possibilities for simplifying the Directive by removing some of the technical detail and referring to CEN standards is provided under question E.4 in section 5.3.5.
Local conditions of certain Member States
An additional potential discrepancy that was identified in the literature and mentioned by stakeholders concerns some of the technical provisions of Annex IV of the Directive and the local conditions of certain Member States (Sweden and Finland). This has been explained in detail in section 4.3.1.
In relation to this, the text of the Technical Report CEN/TR 15120:2013, acknowledged that, for climatic and logistical reasons, alternative technical solutions are commonly used in the Arctic Region. A few options are possible to reflect this situation as described in section 5.3.5: the Directive could be amended to take into account the local conditions of Member States such as Sweden and Finland or alternatively guidance or a Commission Opinion could be provided on the issue. The second option would serve the same purpose and be less burdensome to implement than an amendment of Directive. This would not necessarily affect other Member States, but could result in easier implementation conditions for the Member States concerned.
BREFs and emission levels
The BREF (Best Available Techniques reference document) on Mineral Oil and Gas Refineries (published in 2015)109 outlines a number of best available techniques to reduce VOC emissions to air from storage and from unloading and loading operations.
107 Technical Report Tanks for transport of dangerous goods - Guidance and recommendations for loading, transport and unloading (May 2013), Technical Committee CEN/TC 296, summary version available here: www.nsai.ie/NSAI/files/54/54566346-8bba-4cc5-9917-dd8d1a7060e6.pdf 108 http://standards.cen.eu/BP/679233.pdf 109BREF document available here: http://eippcb.jrc.ec.europa.eu/reference/BREF/REF_BREF_2015.pdf
Evaluation of Directive 1994/63/EC and Directive 2009/126/EC
Final interim: July 2015 125
In particular, the BREF indicates that the BAT-associated emission levels (BAT AEL) for non-methane VOC (NMVOC) emissions to air from loading and unloading operations of volatile liquid hydrocarbon compounds should be 0.15 – 10 g/Nm3 (hourly average110). The VOC-I Directive sets the emission limit at 35 g/Nm3. The BREF on emissions from storage is also relevant to the VOC-I Directive (published in 2005) and provides BAT for underground storage tanks111. However, the BREF does not propose emission limit values. Five stakeholders provided specific comments on this aspect (four Member State authorities and one EU trade association). For example, one of the Belgian authorities states that the VOC-I Directive is not in line with BAT and that the legislation should be changed according to the BAT conclusions of the BREF on storage/refineries e.g. by lowering the emission limit values. A similar reflection was also made by the Bulgarian authority and an industry association – the specific technical requirements of the Directives make it difficult to use Best Available Techniques, therefore (according to them) the technical requirements should be more flexible by updating the Directives to reflect current BAT.
Although, the BREF on refineries includes more stringent emission levels (those that can be achieved through the use of BAT) than the levels required by the VOC-I Directive, it is important to note that the BREF sets out BAT-AELs associated with the use of best available techniques whereas the emission limit values and techniques set out in Directive 94/63/EC represent minimum standards. This means that Member States must meet the minimum standards set out in the Directive and are free to set more stringent levels in national legislation. By setting a minimum limit of emissions, the Directive ensures to a certain extent a level playing field among the Member States by obligating them all to meet at least the minimum requirements. This finding leads into the next topic that was mentioned by several stakeholders during the consultation process: the differences in the VOC emission limits between the Directive and the Gothenburg Protocol.
Different emission limits compared to the Gothenburg Protocol
Although some of the feedback received from stakeholders reflected the idea that the Directives are important to fulfil international obligations under the Gothenburg Protocol, many stakeholders felt that the Directive is not sufficiently integrated and coherent with the Gothenburg Protocol. In particular, the 35 g/Nm³ VOC emission limit for vapour recovery units in the VOC-I Directive is considerably higher than the 10 g/Nm³ limit under the Gothenburg Protocol and some Member States’ national regulations (as outlined in Table 4.1 in section 4.3.3). Several comments were received from stakeholders indicating that this aspect should be harmonised by lowering the limit in the VOC-I Directive. Examples of the Member States that felt this way included Belgium, Sweden, Slovakia and Hungary. Industry stakeholders from France, Belgium and Germany also agreed with this.
Even though the requirements of the Gothenburg Protocol go beyond the requirements of the VOC-I Directive as regards the emission limit value applied for vapour recovery units, it should be noted that the actual performance rates seen in Member States indicate that they are reaching VOC emission rates much lower than what is stipulated by the VOC-I Directive and even the Gothenburg Protocol. Therefore it does not appear that the Directive in its current form is preventing Member States from fulfilling the objectives of the Directive, international obligations or going beyond the emission limits stipulated by the Directive. Further investigation would be needed to determine whether the difference in emission limits between the Directive and international agreements have affected intra-EU trade activities.
110 Hourly values in continuous operation expressed and measured according to European Parliament and Council Directive 94/63/EC (OJ L 365, 31.12.1994, p. 24). 111 BREF document available here: http://eippcb.jrc.ec.europa.eu/reference/BREF/esb_bref_0706.pdf
Evaluation of Directive 1994/63/EC and Directive 2009/126/EC
Final interim: July 2015 126
5.5 Relevance
5.5.1 Overview
Evaluation of the relevance of the VOC-I Directive takes into account how technology and society has evolved over time since the implementation of the Directive, and whether the legislation needs to be amended to reflect possible changes in today’s society compared to the societal/environmental context when the legislation was originally proposed. Developments in recent years could affect the Directive, as well as determine whether the existing legislation meets today’s needs.
The evaluation of the relevance of the VOC-I Directive is structured around the responses to five principal questions, which are described in the following sections.
5.5.2 Are the key needs, problems and concerns related to VOC emissions
from petrol addressed by the current Directive? (I.e. to what extent
are the objectives still relevant to meet current needs) (R.1)
This question aims to identify whether the VOC-I Directive addresses the key needs, problems and concerns related to VOC emissions from petrol. As findings from section 2.2 and 2.3 indicate, the need to control VOC emissions and ambient air quality (benzene as well as ozone) remain relevant in several Member States and across the EU. This is also highlighted by the need for tighter national ceilings in 2020 and 2030. There is also an EU trend towards limiting the use of diesel, which will have an impact on petrol consumption trends. Moreover, there is potential to further reduce emissions e.g. through tighter emission limit values (ELVs) for Stage I, and control of other sources from petrol stations under VOC-II Directive (e.g. drips, spillage, tank breathing – see section 5.2.8 for further details on tank breathing). Therefore, in this context, both Directives remain relevant to achieving the EU’s overall aim of improving air quality and reducing harmful emissions. Furthermore, as one UK industry stakeholder states, the Directive has promoted the value of vapour as an asset, which has produced innovation in technology.
Both industry stakeholders and Member State authorities also commented on the continued relevance of the VOC-I Directive in terms of meeting national and local air quality limits for VOC emissions and for ozone and benzene concentrations. The figure below presents the stakeholder response to this question.
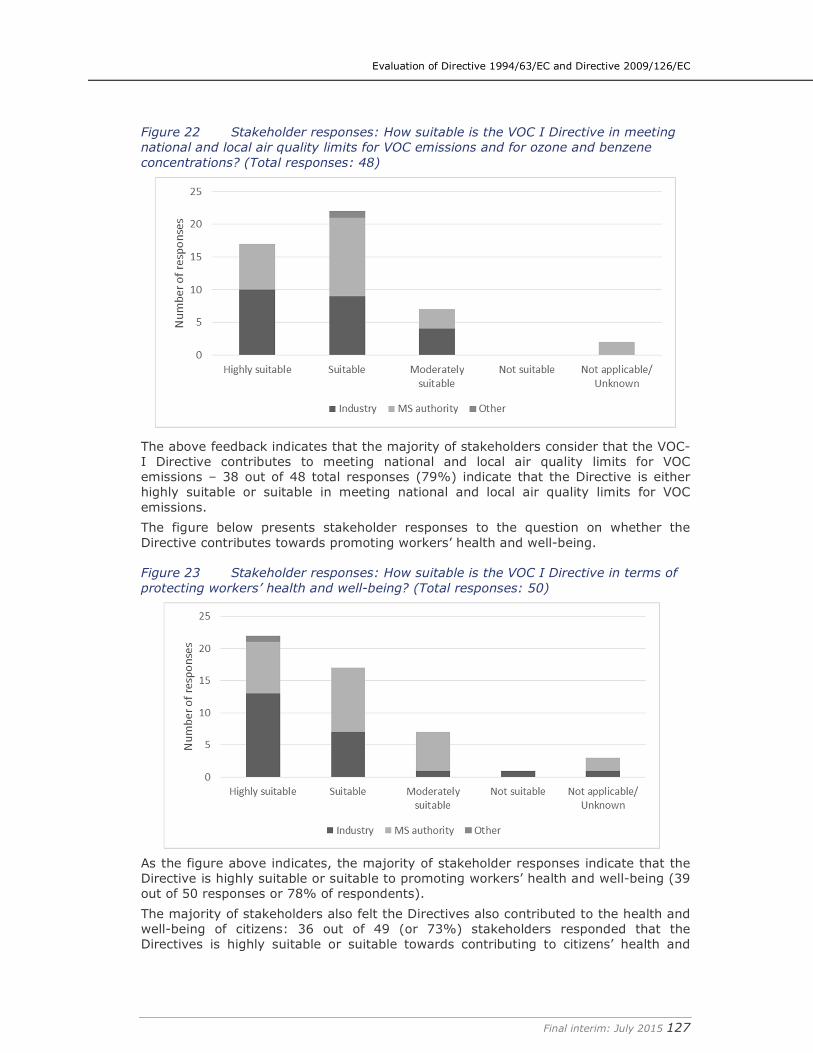
Evaluation of Directive 1994/63/EC and Directive 2009/126/EC
Final interim: July 2015 127
Figure 22 Stakeholder responses: How suitable is the VOC I Directive in meeting
national and local air quality limits for VOC emissions and for ozone and benzene
concentrations? (Total responses: 48)
The above feedback indicates that the majority of stakeholders consider that the VOC-I Directive contributes to meeting national and local air quality limits for VOC emissions – 38 out of 48 total responses (79%) indicate that the Directive is either highly suitable or suitable in meeting national and local air quality limits for VOC emissions.
The figure below presents stakeholder responses to the question on whether the Directive contributes towards promoting workers’ health and well-being.
Figure 23 Stakeholder responses: How suitable is the VOC I Directive in terms of
protecting workers’ health and well-being? (Total responses: 50)
As the figure above indicates, the majority of stakeholder responses indicate that the Directive is highly suitable or suitable to promoting workers’ health and well-being (39 out of 50 responses or 78% of respondents).
The majority of stakeholders also felt the Directives also contributed to the health and well-being of citizens: 36 out of 49 (or 73%) stakeholders responded that the Directives is highly suitable or suitable towards contributing to citizens’ health and
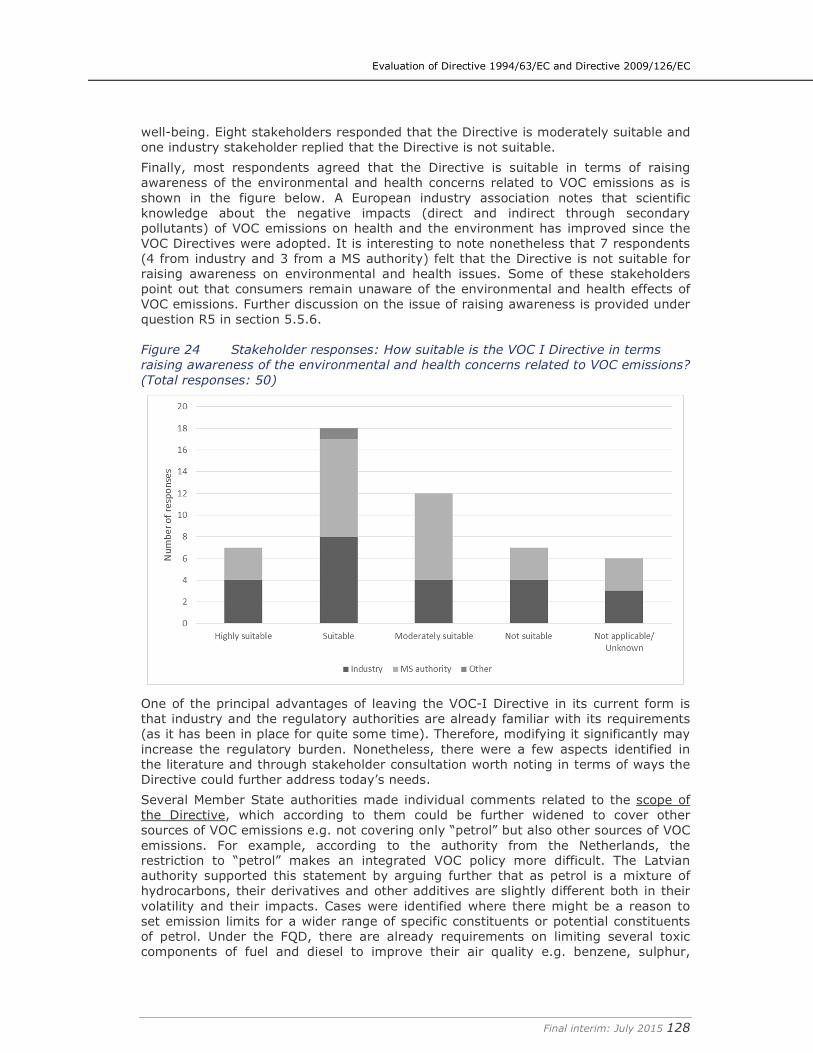
Evaluation of Directive 1994/63/EC and Directive 2009/126/EC
Final interim: July 2015 128
well-being. Eight stakeholders responded that the Directive is moderately suitable and one industry stakeholder replied that the Directive is not suitable.
Finally, most respondents agreed that the Directive is suitable in terms of raising awareness of the environmental and health concerns related to VOC emissions as is shown in the figure below. A European industry association notes that scientific knowledge about the negative impacts (direct and indirect through secondary pollutants) of VOC emissions on health and the environment has improved since the VOC Directives were adopted. It is interesting to note nonetheless that 7 respondents (4 from industry and 3 from a MS authority) felt that the Directive is not suitable for raising awareness on environmental and health issues. Some of these stakeholders point out that consumers remain unaware of the environmental and health effects of VOC emissions. Further discussion on the issue of raising awareness is provided under question R5 in section 5.5.6.
Figure 24 Stakeholder responses: How suitable is the VOC I Directive in terms
raising awareness of the environmental and health concerns related to VOC emissions?
(Total responses: 50)
One of the principal advantages of leaving the VOC-I Directive in its current form is that industry and the regulatory authorities are already familiar with its requirements (as it has been in place for quite some time). Therefore, modifying it significantly may increase the regulatory burden. Nonetheless, there were a few aspects identified in the literature and through stakeholder consultation worth noting in terms of ways the Directive could further address today’s needs.
Several Member State authorities made individual comments related to the scope of the Directive, which according to them could be further widened to cover other sources of VOC emissions e.g. not covering only “petrol” but also other sources of VOC emissions. For example, according to the authority from the Netherlands, the restriction to “petrol” makes an integrated VOC policy more difficult. The Latvian authority supported this statement by arguing further that as petrol is a mixture of hydrocarbons, their derivatives and other additives are slightly different both in their volatility and their impacts. Cases were identified where there might be a reason to set emission limits for a wider range of specific constituents or potential constituents of petrol. Under the FQD, there are already requirements on limiting several toxic components of fuel and diesel to improve their air quality e.g. benzene, sulphur,
Evaluation of Directive 1994/63/EC and Directive 2009/126/EC
Final interim: July 2015 129
nitrogen oxides, unburnt hydrocarbons, particulate matter, carbon monoxide, and other toxic exhaust emissions; therefore, it would be important to investigate whether it would really be necessary to include any other substances under the Directive in terms potential environmental and health benefits. Further, it should be noted that as these types of emissions are already covered by other legislation, it could be quite burdensome to amend (expand scope of) the Directives to include these aspects.
According to the Swedish authority, the VOC-I Directive should also cover sea going vessels. The VOC-I Directive nonetheless makes reference to International Maritime Organisation (IMO) commitments, which relate to vapour control and recovery systems to apply to ships and port installations servicing ships. As indicated in the preamble to the VOC-I Directive, the preference has been for standards to be drawn up at the IMO level. In this regard, a previous study for the Commission112 has concluded that measures in other sectors would be more effective in reducing VOC emissions in the context of national emission ceilings.
The Bulgarian authority stated that the requirements of the Directives should cover all petrol stations (regardless of size or throughput of the service station). However, evidence shows that some Member States such as Austria already apply the Directive’s requirements to all service stations regardless of size or throughput. With the above suggestions in mind, it should be said that the Directive as it stands is not a barrier for Member States to apply more stringent requirements or extend the Directive’s scope with national legislation. Rather, the Directive sets up a minimum level of requirements for controlling VOC emissions from petrol storage, therefore Member States are technically able to implement tighter controls as long as it is in compliance with the Directive.
An industry stakeholder from France and one from Ireland also mentioned the aspect of BAT, which was discussed previously under question C2 in section 5.4.3. The stakeholder from France noted that, to go further, the Directive could explicitly mention devices and technologies resulting from technical progress, such as in situ condensation. This type of technology would condense petrol vapours back into its liquid form for reuse as fuel. However, the technology is expensive, therefore they suggest that it would be important to keep in mind that these should not be imposed on stations whose volumes would not allow a quick enough return on investment (from the value generated from recovered petrol vapours). Further information on costs are provided under question EF.1 in section 5.3.2. According to an industry stakeholder from Ireland, one of the challenges with the VOC-I Directive is the monitoring of the proper functioning of the seals of floating roof tanks, which could be solved through the use of IR camera technology. Other stakeholder comments concerning challenges related to seals are provided in section 5.2.8.
Finally, inclusion of emissions from underground storage tanks in the Directive was also mentioned by a few stakeholders (see section 5.2.8 for more information). However, evidence indicates that the VOC emissions from tank breathing are very low compared emissions resulting from loading into storage tanks and vehicle tanks. Moreover, it would be difficult to measure tank breathing losses in use for service stations, therefore the benefit of including tank breathing does not appear to outweigh the costs and administrative burden associated with amending the Directive.
5.5.3 How does the Directive facilitate achieving the international
obligations of the EU? (R.2)
The Directive facilitates achieving the international obligations of the EU by placing controls on VOC emissions from petrol storage and distribution which contributes to overall improved air quality and reduction of harmful emissions into the atmosphere. 112 Measures to reduce emissions of VOCs during loading and unloading of ships in the EU, AEA Technology, August 2001 (http://ec.europa.eu/environment/air/pdf/vocloading.pdf)
Evaluation of Directive 1994/63/EC and Directive 2009/126/EC
Final interim: July 2015 130
Furthermore, the Directive makes reference to international obligations under the International Maritime Organisation (IMO) and API standards in Annex IV (although the latter are US-based, and have in some cases been supplemented by EU standards since the adoption of the Directive – see the table of relevant CEN standards in section 5.4.3.). Some potential overlaps and inconsistencies were identified with international obligations under the Gothenburg Protocol, however analysis indicates that has not been a barrier for Member States achieving international obligations– see responses to question C2 in section 5.4.3 and R3 in the following section 5.5.4. Further information related to this question is also provided under the evaluation of effectiveness in section 5.2.2, as this goal links to core objectives of the Directive.
5.5.4 What (if any) obsolete provisions in the Directive can be identified and
why are such provisions obsolete? (R.3)
This question aims to provide responses on whether there are any specific provisions in the Directive that are no longer relevant, including those related to past deadlines and timescales. The responses here are interlinked with the responses provider under question C2 on the identification of gaps and overlaps and question R1 on whether the Directive continues to address current needs. Finally, to some extent the response to this question is also linked to the evaluation of the Directive’s effectiveness in section 5.2.2.
Analysis indicates that there are no particular provisions in the Directive that would be considered obsolete, apart from those related to past deadlines and timescales. However, there has been discussion on whether some of the technical requirements could be either referenced in external documents (CEN standards), or amended to reflect the local conditions of some Member States or the latest technological developments and BAT. Further information is also provided under question C2 in section 5.4.3 and question E7 in section 5.2.8.
5.5.5 How has the Directive adapted to any technical or other developments
since its adoption? (R.4)
This question aims to determine whether the Directive has responded to and adapted to progress and in what ways. The technical or other progress that has been made since the adoption of the Directive is also discussed.
� What technical or other progress has been made since the adoption of the Directive?
The Directive has driven innovation and technology developments because, since its adoption, there has been progress in technology seen in vapour recovery units (e.g. carbon absorption, refrigeration and hybrid membrane/absorption technologies) that are capable of reducing emissions that are significantly below the limit of 35 g/Nm3 specified in the Directive. Further information on technical and other progress is also provided in section 5.2.8.
� How has the Directive responded to and adapted to progress?
In terms of how the Directive has responded to and adapted to progress, the Directive provides a procedure (described in Articles 7 and 8) for adapting the Annexes to technical progress e.g. a committee should be set up to assist the Commission in adapting the Annexes of the Directive to technical progress. Adaptations have been proposed since late 1990s (based on Environmental Fuels Expert Group recommendations). However, the VOC-I Directive has not been adapted since its adoption. Despite the fact that the Directive’s annexes have not been adapted to reflect technical progress, no significant evidence was found to indicate that this has resulted in any major implementation issues or has prevented the uptake or
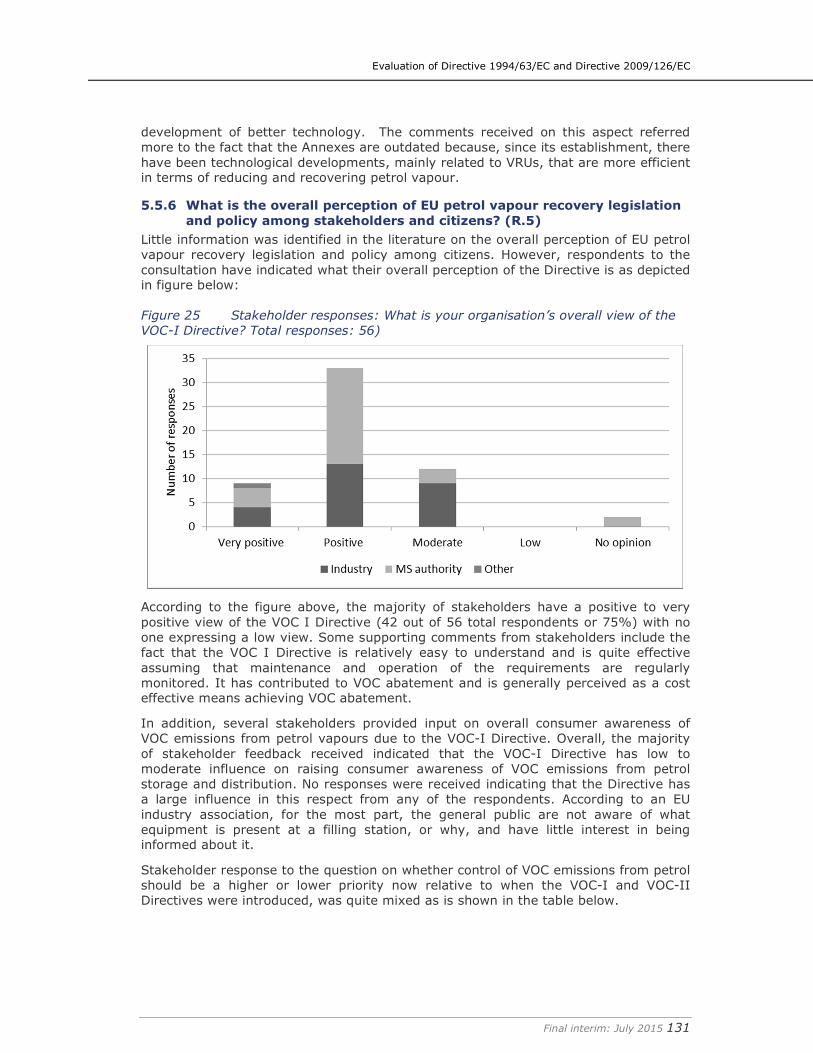
Evaluation of Directive 1994/63/EC and Directive 2009/126/EC
Final interim: July 2015 131
development of better technology. The comments received on this aspect referred more to the fact that the Annexes are outdated because, since its establishment, there have been technological developments, mainly related to VRUs, that are more efficient in terms of reducing and recovering petrol vapour.
5.5.6 What is the overall perception of EU petrol vapour recovery legislation
and policy among stakeholders and citizens? (R.5)
Little information was identified in the literature on the overall perception of EU petrol vapour recovery legislation and policy among citizens. However, respondents to the consultation have indicated what their overall perception of the Directive is as depicted in figure below:
Figure 25 Stakeholder responses: What is your organisation’s overall view of the
VOC-I Directive? Total responses: 56)
According to the figure above, the majority of stakeholders have a positive to very positive view of the VOC I Directive (42 out of 56 total respondents or 75%) with no one expressing a low view. Some supporting comments from stakeholders include the fact that the VOC I Directive is relatively easy to understand and is quite effective assuming that maintenance and operation of the requirements are regularly monitored. It has contributed to VOC abatement and is generally perceived as a cost effective means achieving VOC abatement.
In addition, several stakeholders provided input on overall consumer awareness of VOC emissions from petrol vapours due to the VOC-I Directive. Overall, the majority of stakeholder feedback received indicated that the VOC-I Directive has low to moderate influence on raising consumer awareness of VOC emissions from petrol storage and distribution. No responses were received indicating that the Directive has a large influence in this respect from any of the respondents. According to an EU industry association, for the most part, the general public are not aware of what equipment is present at a filling station, or why, and have little interest in being informed about it.
Stakeholder response to the question on whether control of VOC emissions from petrol should be a higher or lower priority now relative to when the VOC-I and VOC-II Directives were introduced, was quite mixed as is shown in the table below.
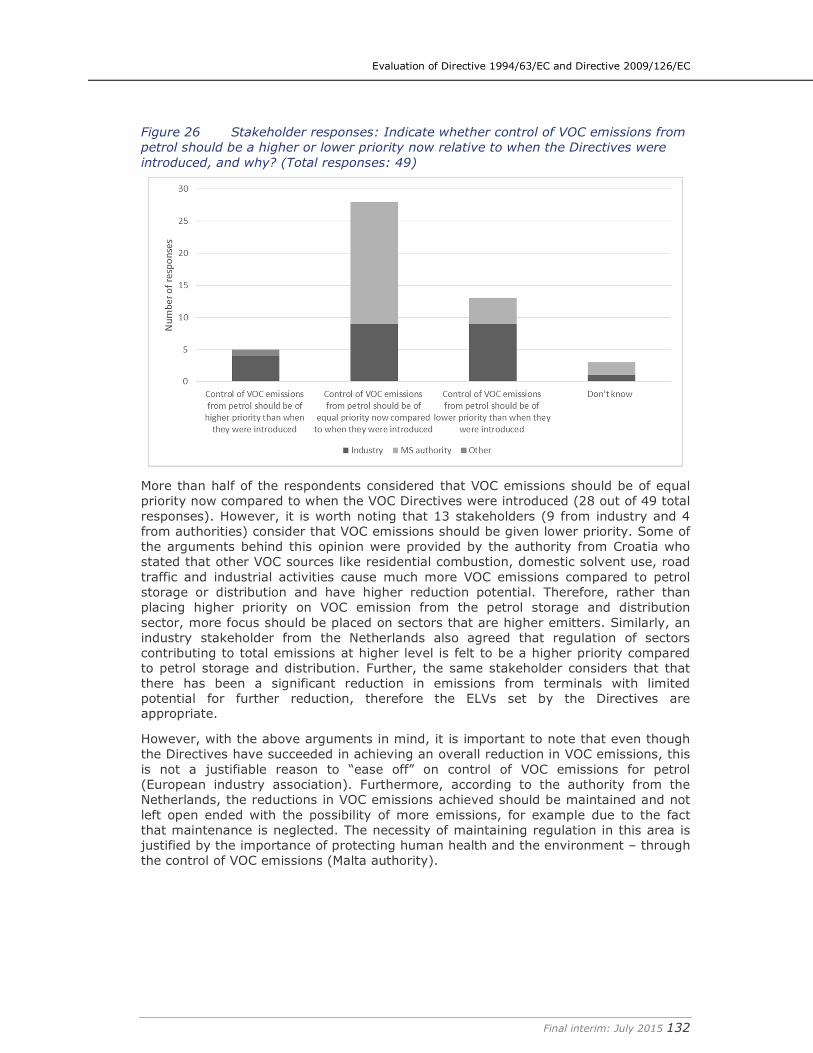
Evaluation of Directive 1994/63/EC and Directive 2009/126/EC
Final interim: July 2015 132
Figure 26 Stakeholder responses: Indicate whether control of VOC emissions from
petrol should be a higher or lower priority now relative to when the Directives were
introduced, and why? (Total responses: 49)
More than half of the respondents considered that VOC emissions should be of equal priority now compared to when the VOC Directives were introduced (28 out of 49 total responses). However, it is worth noting that 13 stakeholders (9 from industry and 4 from authorities) consider that VOC emissions should be given lower priority. Some of the arguments behind this opinion were provided by the authority from Croatia who stated that other VOC sources like residential combustion, domestic solvent use, road traffic and industrial activities cause much more VOC emissions compared to petrol storage or distribution and have higher reduction potential. Therefore, rather than placing higher priority on VOC emission from the petrol storage and distribution sector, more focus should be placed on sectors that are higher emitters. Similarly, an industry stakeholder from the Netherlands also agreed that regulation of sectors contributing to total emissions at higher level is felt to be a higher priority compared to petrol storage and distribution. Further, the same stakeholder considers that that there has been a significant reduction in emissions from terminals with limited potential for further reduction, therefore the ELVs set by the Directives are appropriate.
However, with the above arguments in mind, it is important to note that even though the Directives have succeeded in achieving an overall reduction in VOC emissions, this is not a justifiable reason to “ease off” on control of VOC emissions for petrol (European industry association). Furthermore, according to the authority from the Netherlands, the reductions in VOC emissions achieved should be maintained and not left open ended with the possibility of more emissions, for example due to the fact that maintenance is neglected. The necessity of maintaining regulation in this area is justified by the importance of protecting human health and the environment – through the control of VOC emissions (Malta authority).
Evaluation of Directive 1994/63/EC and Directive 2009/126/EC
Final interim: July 2015 133
5.6 EU added-value
5.6.1 Overview
The aim of this section is to assess the additional value resulting from the Directive, compared to what could be achieved by Member States at national and/or regional levels. The evaluation of the EU-added value of the VOC-I Directive is structured around the responses to four principal questions which are described in sections below.
5.6.2 What has been the EU added value of the VOC-I Directive? (AV.1)
As presented in section 5.2.2, Stage I controls were in place in some Member States prior to the adoption of the VOC-I Directive (e.g. in Sweden since 1991 and Austria since 1993). Moreover, some industry stakeholders had started to implement these systems at their sites (e.g. in Finland). This represented a risk for industry as the development of different regulatory systems across the Member States could affect the correct functioning of the internal market and lead to distortion of competition. In particular, harmonised techniques regarding the equipment for loading of mobile tankers were relevant to ensure the possibility of cross-border trade of petrol and equipment.
In this context, the adoption of the VOC-I Directive contributed to establishing a level playing field by laying down minimum and harmonised requirements that Member States should impose regarding the control of VOC emissions from Stage I operations.
However, without the EU intervention, there is limited evidence to suggest that national or regional legislation would have been introduced. Notwithstanding this, the international obligations under the Gothenburg Protocol are relevant, as these would also act as a driver for Member States to apply Stage I controls. However, the Gothenburg Protocol and the VOC-I Directive are clearly linked, and the Protocol may not have evolved in its current form without the existence of the VOC-I Directive.
Evidence gathered from stakeholders suggest that the VOC-I Directive has been instrumental in reducing emissions of VOC at EU level, and that the EU wide approach was appropriate and justified. Stakeholders confirmed that the EU approach was correct to ensure a harmonised approach, reduce technical barriers and reduce competitiveness issues.
5.6.3 To what extent do the issues addressed by the Directive continue to
require action at EU level? (AV.2)
Respondents mostly acknowledged the benefits in having VOC emissions abatement from petrol storage and transport being administered at EU level, harmonising approaches and providing a safety net to ensure a minimum level of health and environmental protection.
Out of the 39 responses received in this regard, 27 stated that VOC emissions from this sector are sufficiently addressed at EU (and Member State) level by the VOC-I Directive and no additional action is required. Four respondents added that there is little gain expected from further EU action (Estonia, Hungary, Spain, and the UK).
As to further EU action that might be required, two industry stakeholders from Germany consider that harmonisation of requirements globally would be beneficial. However, as noted in section 2.4 the approach to regulating Stage I controls in other regions – the USA, Canada and Australia - mirrors that adopted in the EU.
Evaluation of Directive 1994/63/EC and Directive 2009/126/EC
Final interim: July 2015 134
5.6.4 What would be the most likely impacts of repealing the Directive?
(AV.3)
Repealing the Directive could lead to the fragmentation of approaches in Member States, in particular with regards to setting testing, certification standards and thresholds. This could in turn cause technical barriers and result in uneven environmental performance amongst Member States. Competitiveness of companies could also be affected.
No evidence was identified suggesting that the VOC-I Directive should be repealed.
A few Member States (Latvia and the Netherlands) highlighted that EU level legislation makes it difficult to take into account local conditions such as climatic conditions. As a result it is likely that, were the Directive to be repealed, these Member States would adopt different thresholds for vapour recovery which would be based on their specific local conditions. This could in turn lead to competitiveness and technical barriers issues.
Finally ozone is a transboundary air pollutant for which EU-wide action has been found to be justified in numerous instances. Disjointing actions on ozone pollution would likely reduce the efficiency of the existing framework.
5.6.5 How does the Directive contribute to improving air quality and health
in the Union? (AV.5)
The answer to this question is linked to the analysis undertaken in the effectiveness section which assesses how the Directive has contributed to VOC emission reductions and subsequent lower concentrations of ozone and hazardous substances.
At the time of the introduction of the VOC-I Directive, emissions of VOC from storage and distribution of petrol were estimated to represent around 500,000 tonnes per year (5% of total anthropogenic VOC emissions in the European Community). The review of the emission factor for the sector (1990-2012) at the European level (expressed as tonnes of VOC per million of litres sold) showed that the emission factor from the distribution of oil products sector decreased sharply from 1990 to 2000 (2.7 to 1.4 t/million litres sold) with the highest decrease from 1995 to 2000 (37% decrease), which coincides with the first years of implementation of the VOC-I Directive (see Section 2.2.4). After 2000, there is a steadier reduction of the emission factor of a further 20% from 2000 to 2012 (1.4 to 1.1 t/million litres sold).
From the feedback of stakeholders, it is clear that experts in the field believe that the EU-level approach has greatly contributed to the reduction of VOC emissions by ensuring a harmonised approach throughout the Member States. Out of the 54 responses provided on the contribution of the VOC-I Directive to the reduction of VOC emissions, 28 responses indicated that the VOC-I Directive was to a large extent responsible for the VOC emissions reduction. Furthermore, only 4 respondents indicated that the VOC-I Directive contributed to no extent to the reduction of VOC emissions.
Evaluation of Directive 1994/63/EC and Directive 2009/126/EC
Final interim: July 2015 135
6. Results and analysis – Implementation of Directive
2009/126/EC (VOC-II)
6.1 Overview
This section provides an overview of the current status of implementation of the Directive across the EU-28. The overview is based on the Member State specific analyses (presented in Appendix D).
Given its recent adoption in 2009, the status of implementation of the VOC-II Directive has not been assessed until now. Article 7 required the Commission to review, by 31 December 2014, the status of implementation of the Directive and to inform the European Parliament and the Council on the results, with particular attention to the following elements:
� The 100 m3/year threshold referred to in Article 3(1)(b) and (2)(b) of the Directive and Article 6(3) of Directive 94/63/EC;
� The in-service compliance record of Stage II petrol vapour recovery systems (Article 5); and
� The need for automatic monitoring equipment (Article 5).
The Directive does not establish a systematic reporting framework requiring Member States to report to the Commission on their status of implementation. Therefore, the majority of the information required for this analysis was derived from extensive consultation, notably with relevant organisations responsible for implementing the Directive, as well as from the review of relevant literature. In particular this included the review of the findings of the 2005 Commission study evaluating the potential scope for and costs of further reductions of emissions of VOC from refuelling operations at service stations (“Stage II”) in the EU-28 (Entec, 2005).
6.2 Horizontal Status of implementation (EU wide)
6.2.1 Introduction of VOC-II requirements in national regulatory frameworks
All Member States have transposed the Directive (which established January 2012 as a transposition deadline) into their national legal systems. In this respect, the Commission has provided the project team with a table containing the full list of transposing national acts per Member State, together with the notification dates. It is of note that 11 infringements for late transposition were launched in March 2012 against Austria, Bulgaria, Cyprus, Germany, Greece, Italy, Poland, Portugal, Romania, Slovenia and Sweden. Nine of those infringements were closed in 2012 and two in 2013 following complete notification by Member States of all their transposing measures.
However, late transposition is not synonymous with late implementation or of lack of uptake of Stage II controls in service stations. As such, according to the impact assessment that accompanied the VOC-II Directive, only 9 Member States of the EU-28 did not, prior to the Directive, have either (a) legislation in place to require Stage II controls; (b) planned legislation for the near future; or (c) significant implementation of Stage II without legislation (i.e. in the majority of petrol stations). In particular, of the 11 countries that were delayed, only Greece, Portugal and Romania did not fall into any of the above categories.
The fact that Stage II controls were already required or introduced in most Member States makes it relevant to explore how the new requirements of the Directive have
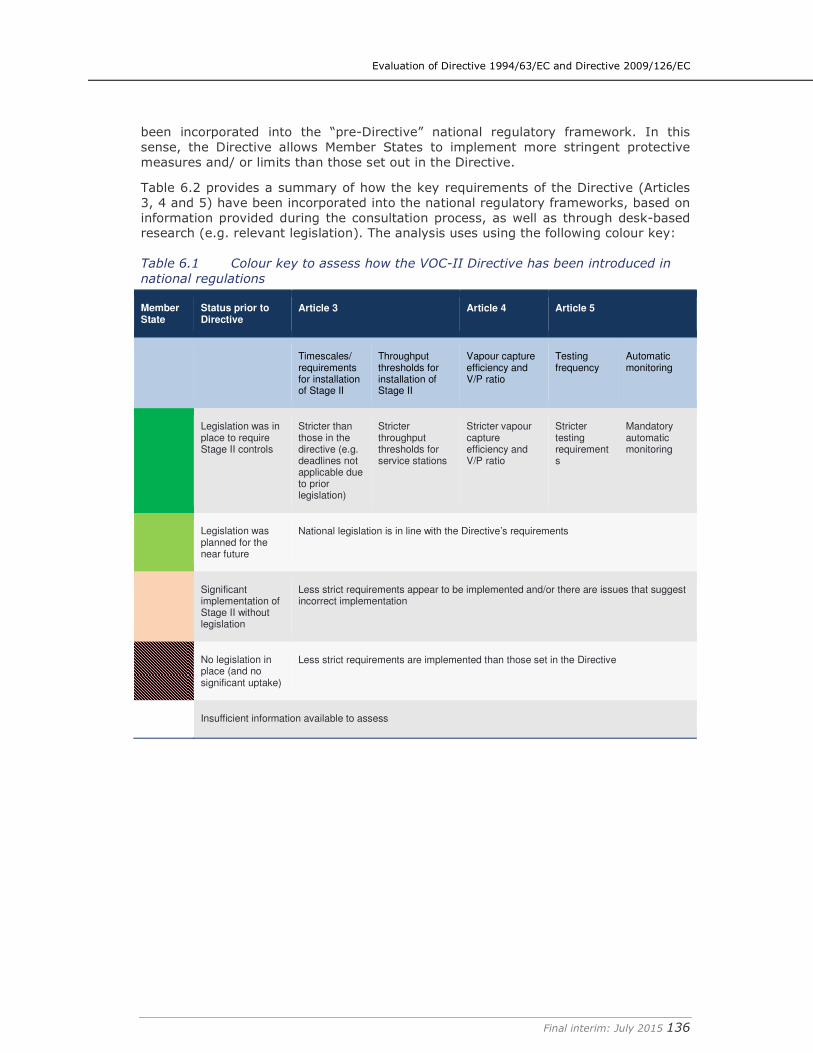
Evaluation of Directive 1994/63/EC and Directive 2009/126/EC
Final interim: July 2015 136
been incorporated into the “pre-Directive” national regulatory framework. In this sense, the Directive allows Member States to implement more stringent protective measures and/ or limits than those set out in the Directive.
Table 6.2 provides a summary of how the key requirements of the Directive (Articles 3, 4 and 5) have been incorporated into the national regulatory frameworks, based on information provided during the consultation process, as well as through desk-based research (e.g. relevant legislation). The analysis uses using the following colour key:
Table 6.1 Colour key to assess how the VOC-II Directive has been introduced in
national regulations
Member State
Status prior to Directive
Article 3 Article 4 Article 5
Timescales/ requirements for installation of Stage II
Throughput thresholds for installation of Stage II
Vapour capture efficiency and V/P ratio
Testing frequency
Automatic monitoring
Legislation was in place to require Stage II controls
Stricter than those in the directive (e.g. deadlines not applicable due to prior legislation)
Stricter throughput thresholds for service stations
Stricter vapour capture efficiency and V/P ratio
Stricter testing requirements
Mandatory automatic monitoring
Legislation was planned for the near future
National legislation is in line with the Directive’s requirements
Significant implementation of Stage II without legislation
Less strict requirements appear to be implemented and/or there are issues that suggest incorrect implementation
No legislation in place (and no significant uptake)
Less strict requirements are implemented than those set in the Directive
Insufficient information available to assess
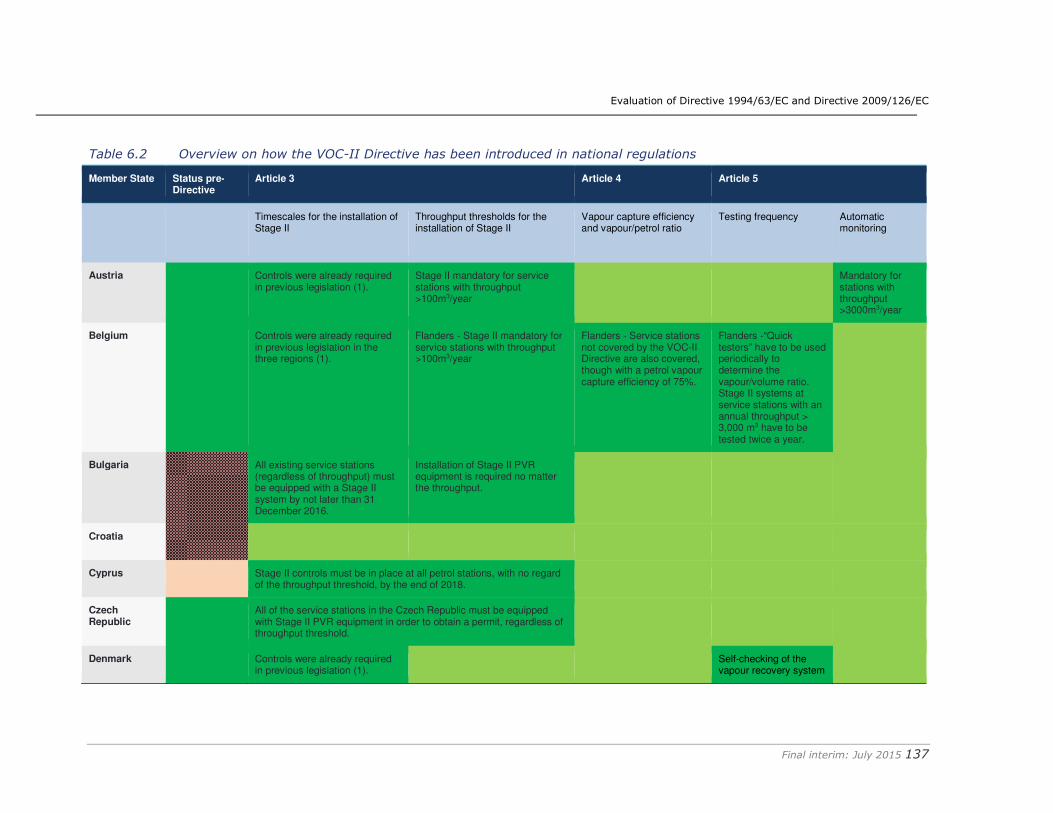
Evaluation of Directive 1994/63/EC and Directive 2009/126/EC
Final interim: July 2015 137
Table 6.2 Overview on how the VOC-II Directive has been introduced in national regulations
Member State Status pre-Directive
Article 3 Article 4 Article 5
Timescales for the installation of Stage II
Throughput thresholds for the installation of Stage II
Vapour capture efficiency and vapour/petrol ratio
Testing frequency Automatic monitoring
Austria Controls were already required in previous legislation (1).
Stage II mandatory for service stations with throughput >100m3/year
Mandatory for stations with throughput >3000m3/year
Belgium Controls were already required in previous legislation in the three regions (1).
Flanders - Stage II mandatory for service stations with throughput >100m3/year
Flanders - Service stations not covered by the VOC-II Directive are also covered, though with a petrol vapour capture efficiency of 75%.
Flanders -“Quick testers” have to be used periodically to determine the vapour/volume ratio. Stage II systems at service stations with an annual throughput > 3,000 m3 have to be tested twice a year.
Bulgaria All existing service stations (regardless of throughput) must be equipped with a Stage II system by not later than 31 December 2016.
Installation of Stage II PVR equipment is required no matter the throughput.
Croatia
Cyprus Stage II controls must be in place at all petrol stations, with no regard of the throughput threshold, by the end of 2018.
Czech Republic
All of the service stations in the Czech Republic must be equipped with Stage II PVR equipment in order to obtain a permit, regardless of throughput threshold.
Denmark Controls were already required in previous legislation (1).
Self-checking of the vapour recovery system
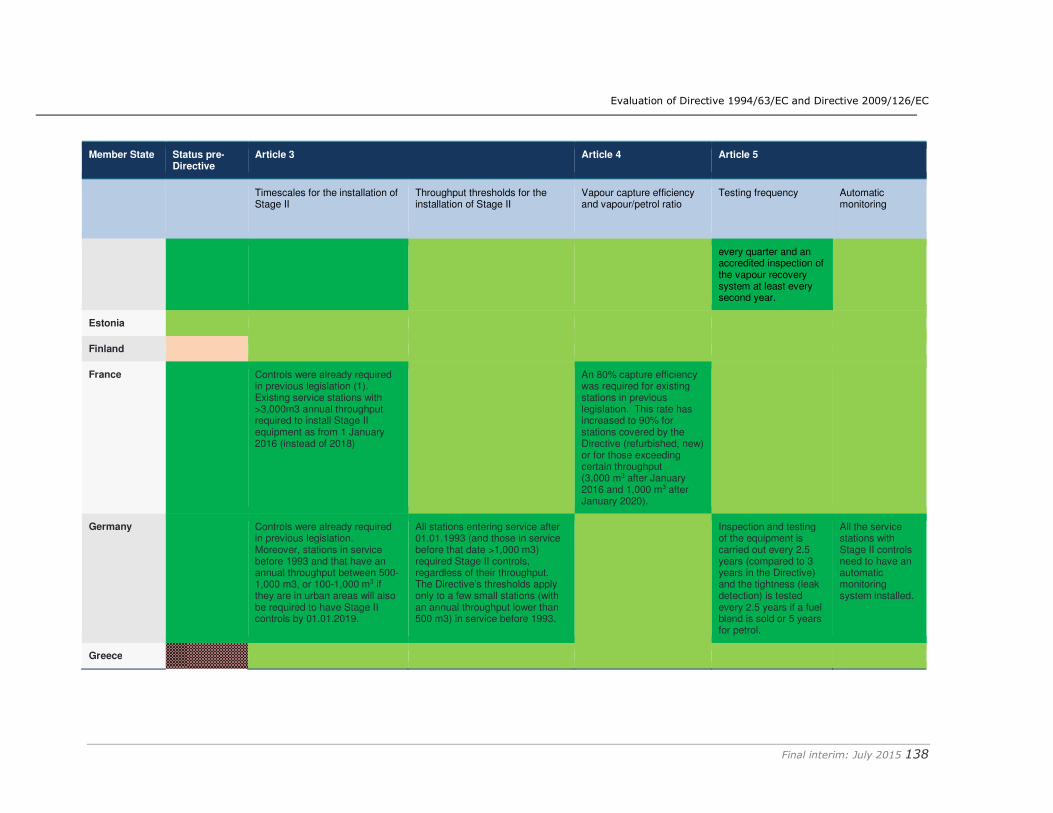
Evaluation of Directive 1994/63/EC and Directive 2009/126/EC
Final interim: July 2015 138
Member State Status pre-Directive
Article 3 Article 4 Article 5
Timescales for the installation of Stage II
Throughput thresholds for the installation of Stage II
Vapour capture efficiency and vapour/petrol ratio
Testing frequency Automatic monitoring
every quarter and an accredited inspection of the vapour recovery system at least every second year.
Estonia
Finland
France Controls were already required in previous legislation (1). Existing service stations with >3,000m3 annual throughput required to install Stage II equipment as from 1 January 2016 (instead of 2018)
An 80% capture efficiency was required for existing stations in previous legislation. This rate has increased to 90% for stations covered by the Directive (refurbished, new) or for those exceeding certain throughput (3,000 m3 after January 2016 and 1,000 m3 after January 2020).
Germany Controls were already required in previous legislation. Moreover, stations in service before 1993 and that have an annual throughput between 500-1,000 m3, or 100-1,000 m3 if they are in urban areas will also be required to have Stage II controls by 01.01.2019.
All stations entering service after 01.01.1993 (and those in service before that date >1,000 m3) required Stage II controls, regardless of their throughput. The Directive’s thresholds apply only to a few small stations (with an annual throughput lower than 500 m3) in service before 1993.
Inspection and testing of the equipment is carried out every 2.5 years (compared to 3 years in the Directive) and the tightness (leak detection) is tested every 2.5 years if a fuel blend is sold or 5 years for petrol.
All the service stations with Stage II controls need to have an automatic monitoring system installed.
Greece
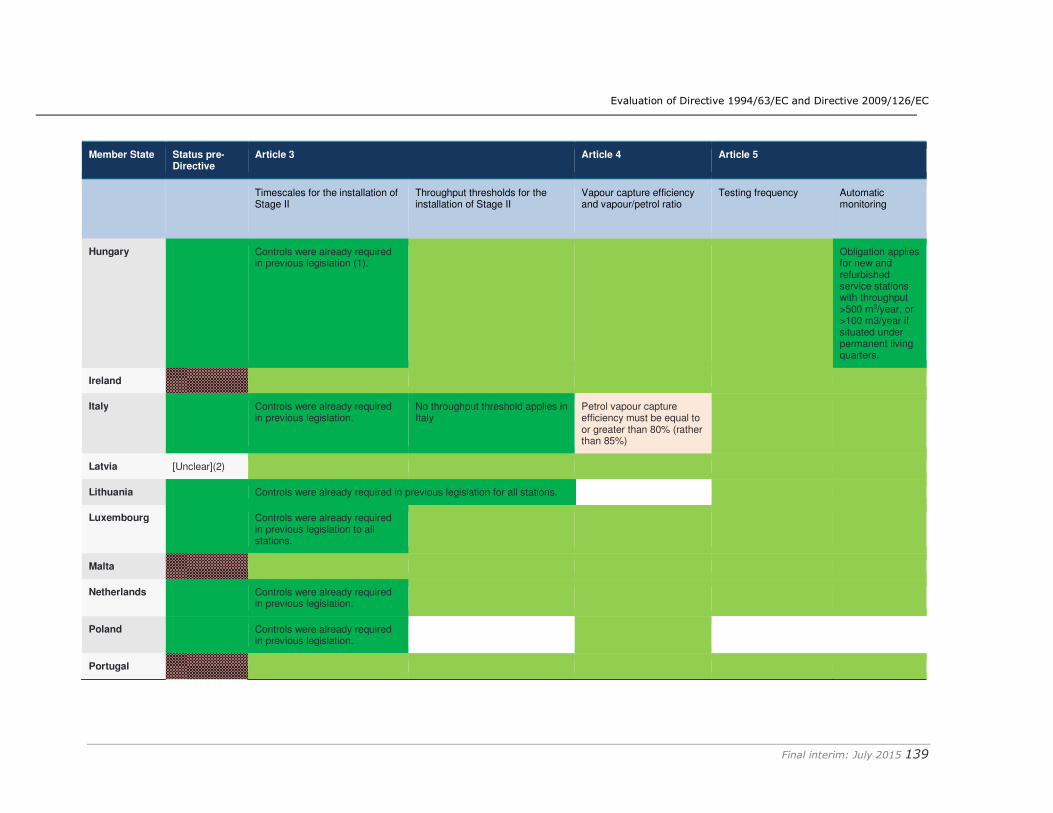
Evaluation of Directive 1994/63/EC and Directive 2009/126/EC
Final interim: July 2015 139
Member State Status pre-Directive
Article 3 Article 4 Article 5
Timescales for the installation of Stage II
Throughput thresholds for the installation of Stage II
Vapour capture efficiency and vapour/petrol ratio
Testing frequency Automatic monitoring
Hungary Controls were already required in previous legislation (1).
Obligation applies for new and refurbished service stations with throughput >500 m3/year, or >100 m3/year if situated under permanent living quarters.
Ireland
Italy Controls were already required in previous legislation.
No throughput threshold applies in Italy
Petrol vapour capture efficiency must be equal to or greater than 80% (rather than 85%)
Latvia [Unclear](2)
Lithuania Controls were already required in previous legislation for all stations.
Luxembourg Controls were already required in previous legislation to all stations.
Malta
Netherlands Controls were already required in previous legislation.
Poland Controls were already required in previous legislation.
Portugal
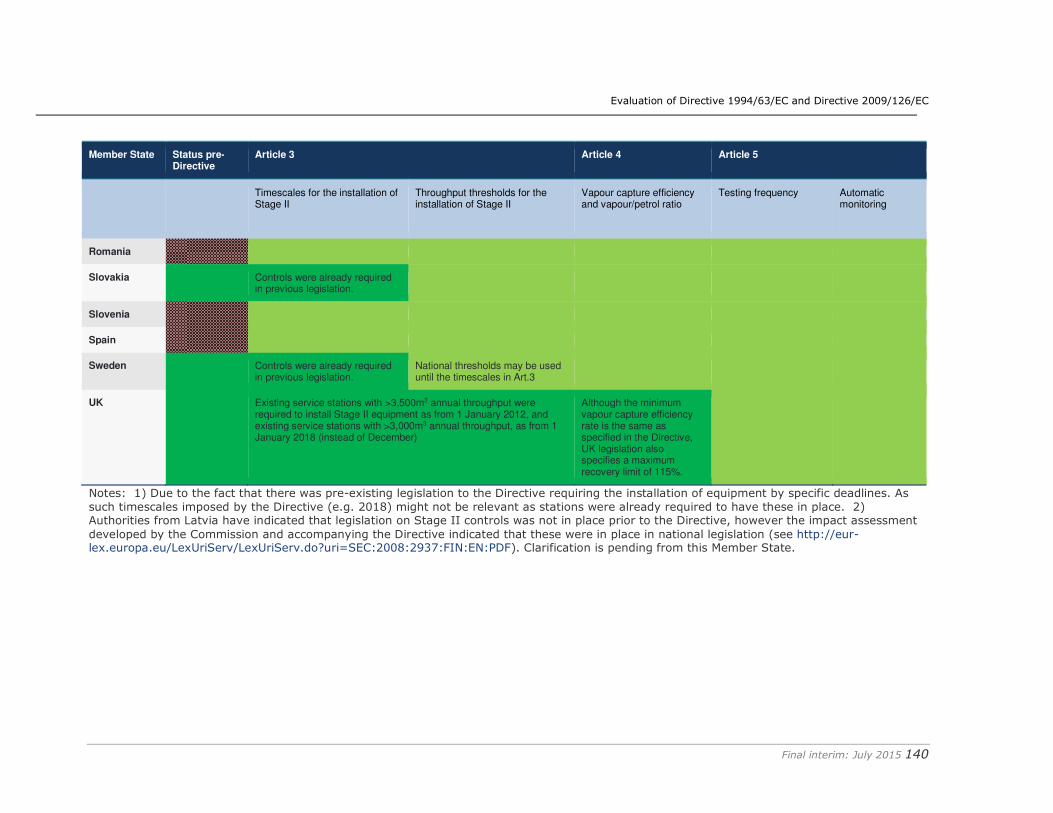
Evaluation of Directive 1994/63/EC and Directive 2009/126/EC
Final interim: July 2015 140
Member State Status pre-Directive
Article 3 Article 4 Article 5
Timescales for the installation of Stage II
Throughput thresholds for the installation of Stage II
Vapour capture efficiency and vapour/petrol ratio
Testing frequency Automatic monitoring
Romania
Slovakia Controls were already required in previous legislation.
Slovenia
Spain
Sweden Controls were already required in previous legislation.
National thresholds may be used until the timescales in Art.3
UK Existing service stations with >3,500m3 annual throughput were required to install Stage II equipment as from 1 January 2012, and existing service stations with >3,000m3 annual throughput, as from 1 January 2018 (instead of December)
Although the minimum vapour capture efficiency rate is the same as specified in the Directive, UK legislation also specifies a maximum recovery limit of 115%.
Notes: 1) Due to the fact that there was pre-existing legislation to the Directive requiring the installation of equipment by specific deadlines. As such timescales imposed by the Directive (e.g. 2018) might not be relevant as stations were already required to have these in place. 2) Authorities from Latvia have indicated that legislation on Stage II controls was not in place prior to the Directive, however the impact assessment developed by the Commission and accompanying the Directive indicated that these were in place in national legislation (see http://eur-lex.europa.eu/LexUriServ/LexUriServ.do?uri=SEC:2008:2937:FIN:EN:PDF). Clarification is pending from this Member State.
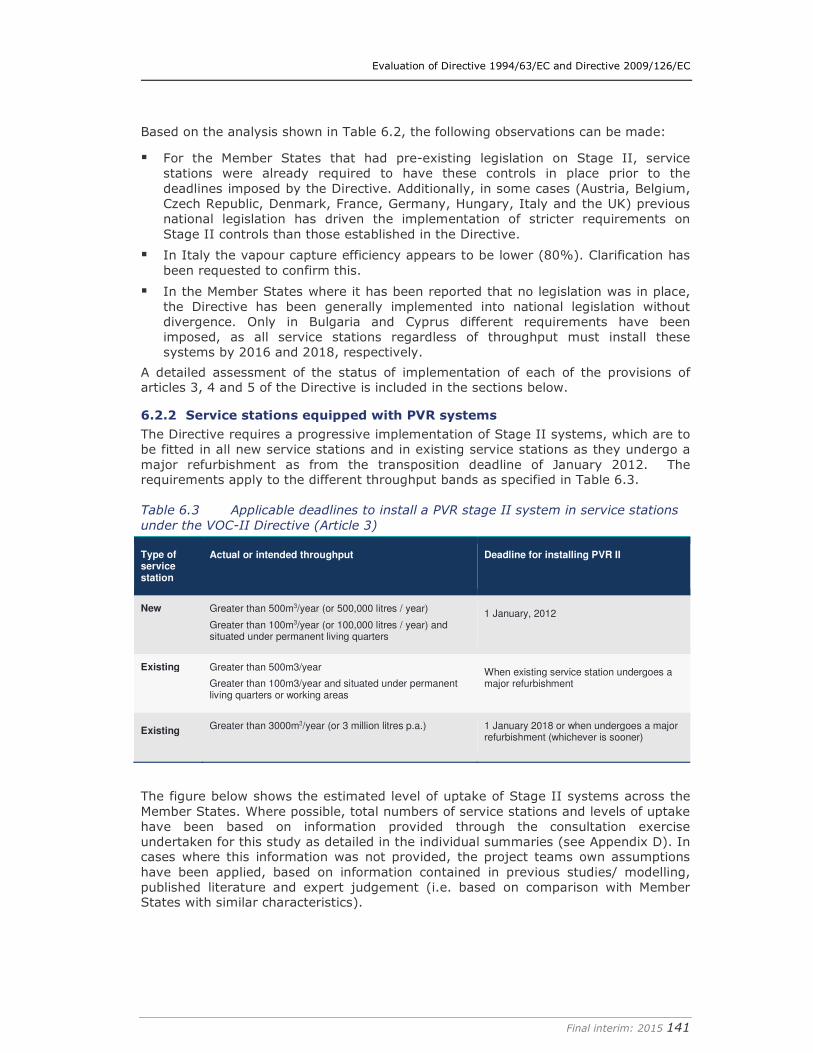
Evaluation of Directive 1994/63/EC and Directive 2009/126/EC
Final interim: 2015 141
Based on the analysis shown in Table 6.2, the following observations can be made:
� For the Member States that had pre-existing legislation on Stage II, service stations were already required to have these controls in place prior to the deadlines imposed by the Directive. Additionally, in some cases (Austria, Belgium, Czech Republic, Denmark, France, Germany, Hungary, Italy and the UK) previous national legislation has driven the implementation of stricter requirements on Stage II controls than those established in the Directive.
� In Italy the vapour capture efficiency appears to be lower (80%). Clarification has been requested to confirm this.
� In the Member States where it has been reported that no legislation was in place, the Directive has been generally implemented into national legislation without divergence. Only in Bulgaria and Cyprus different requirements have been imposed, as all service stations regardless of throughput must install these systems by 2016 and 2018, respectively.
A detailed assessment of the status of implementation of each of the provisions of articles 3, 4 and 5 of the Directive is included in the sections below.
6.2.2 Service stations equipped with PVR systems
The Directive requires a progressive implementation of Stage II systems, which are to be fitted in all new service stations and in existing service stations as they undergo a major refurbishment as from the transposition deadline of January 2012. The requirements apply to the different throughput bands as specified in Table 6.3.
Table 6.3 Applicable deadlines to install a PVR stage II system in service stations
under the VOC-II Directive (Article 3)
Type of service station
Actual or intended throughput Deadline for installing PVR II
New Greater than 500m3/year (or 500,000 litres / year)
Greater than 100m3/year (or 100,000 litres / year) and situated under permanent living quarters
1 January, 2012
Existing Greater than 500m3/year
Greater than 100m3/year and situated under permanent living quarters or working areas
When existing service station undergoes a major refurbishment
Existing Greater than 3000m3/year (or 3 million litres p.a.)
1 January 2018 or when undergoes a major refurbishment (whichever is sooner)
The figure below shows the estimated level of uptake of Stage II systems across the Member States. Where possible, total numbers of service stations and levels of uptake have been based on information provided through the consultation exercise undertaken for this study as detailed in the individual summaries (see Appendix D). In cases where this information was not provided, the project teams own assumptions have been applied, based on information contained in previous studies/ modelling, published literature and expert judgement (i.e. based on comparison with Member States with similar characteristics).
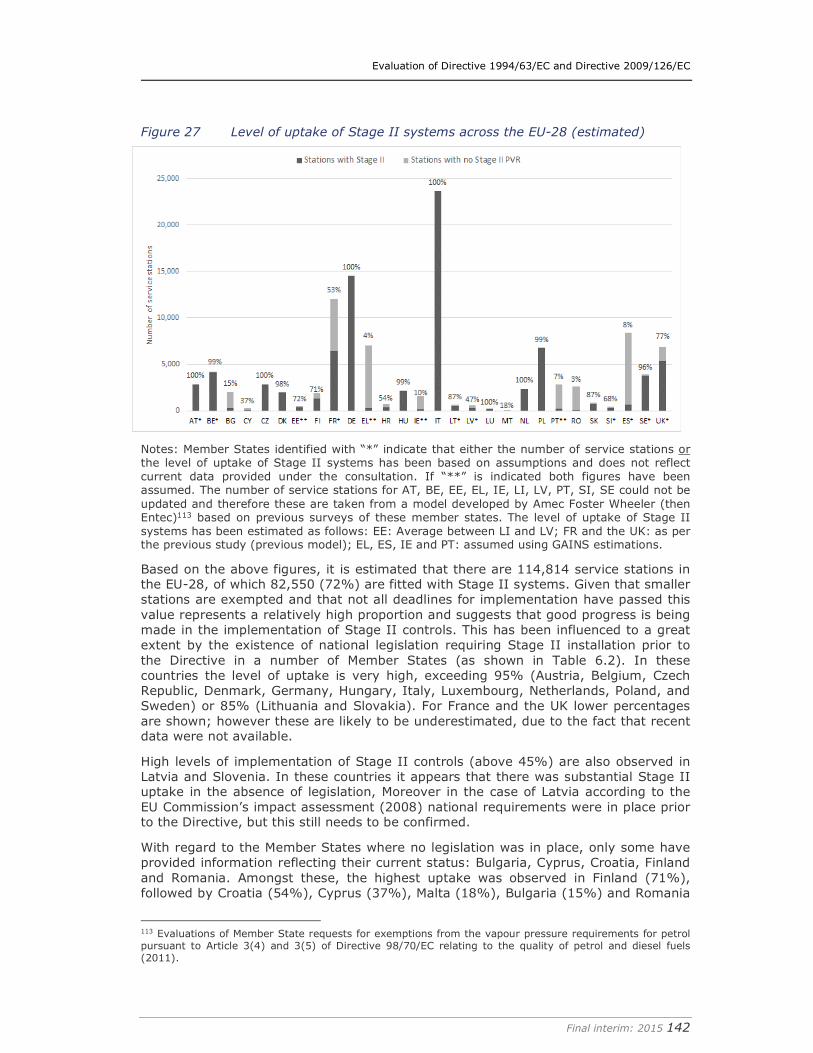
Evaluation of Directive 1994/63/EC and Directive 2009/126/EC
Final interim: 2015 142
Figure 27 Level of uptake of Stage II systems across the EU-28 (estimated)
Notes: Member States identified with “*” indicate that either the number of service stations or the level of uptake of Stage II systems has been based on assumptions and does not reflect current data provided under the consultation. If “**” is indicated both figures have been assumed. The number of service stations for AT, BE, EE, EL, IE, LI, LV, PT, SI, SE could not be updated and therefore these are taken from a model developed by Amec Foster Wheeler (then Entec)113 based on previous surveys of these member states. The level of uptake of Stage II systems has been estimated as follows: EE: Average between LI and LV; FR and the UK: as per the previous study (previous model); EL, ES, IE and PT: assumed using GAINS estimations.
Based on the above figures, it is estimated that there are 114,814 service stations in the EU-28, of which 82,550 (72%) are fitted with Stage II systems. Given that smaller stations are exempted and that not all deadlines for implementation have passed this value represents a relatively high proportion and suggests that good progress is being made in the implementation of Stage II controls. This has been influenced to a great extent by the existence of national legislation requiring Stage II installation prior to the Directive in a number of Member States (as shown in Table 6.2). In these countries the level of uptake is very high, exceeding 95% (Austria, Belgium, Czech Republic, Denmark, Germany, Hungary, Italy, Luxembourg, Netherlands, Poland, and Sweden) or 85% (Lithuania and Slovakia). For France and the UK lower percentages are shown; however these are likely to be underestimated, due to the fact that recent data were not available.
High levels of implementation of Stage II controls (above 45%) are also observed in Latvia and Slovenia. In these countries it appears that there was substantial Stage II uptake in the absence of legislation, Moreover in the case of Latvia according to the EU Commission’s impact assessment (2008) national requirements were in place prior to the Directive, but this still needs to be confirmed.
With regard to the Member States where no legislation was in place, only some have provided information reflecting their current status: Bulgaria, Cyprus, Croatia, Finland and Romania. Amongst these, the highest uptake was observed in Finland (71%), followed by Croatia (54%), Cyprus (37%), Malta (18%), Bulgaria (15%) and Romania
113 Evaluations of Member State requests for exemptions from the vapour pressure requirements for petrol pursuant to Article 3(4) and 3(5) of Directive 98/70/EC relating to the quality of petrol and diesel fuels (2011).
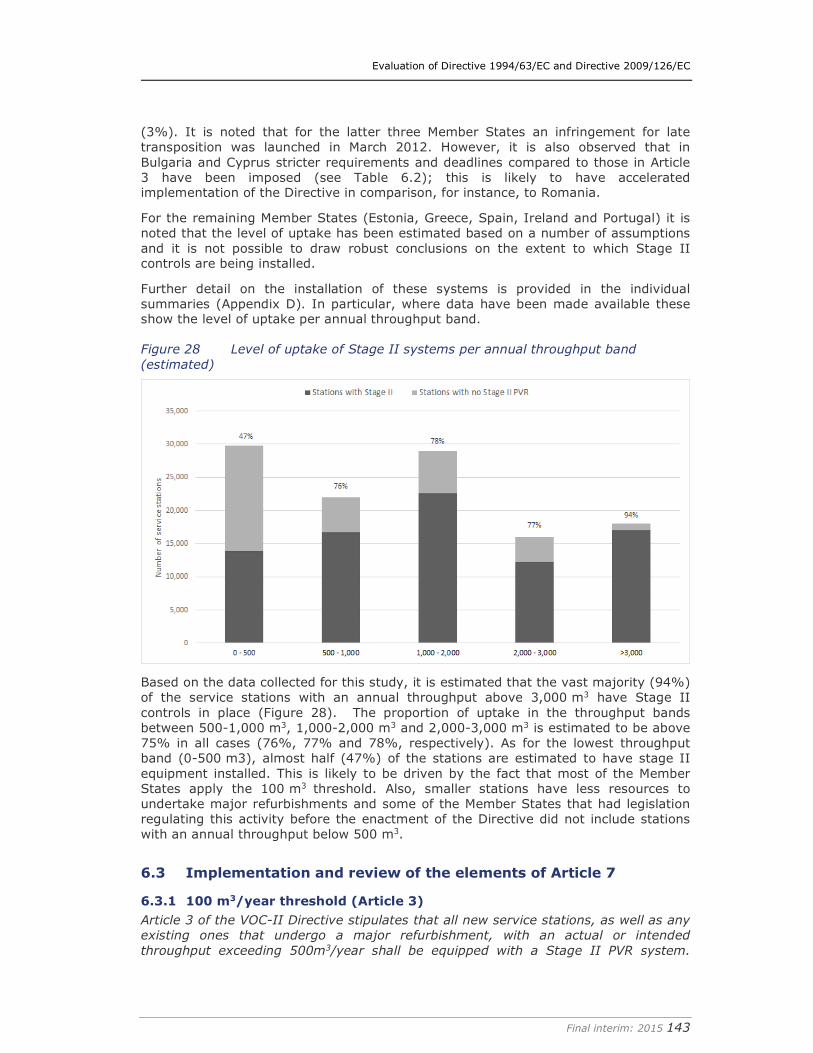
Evaluation of Directive 1994/63/EC and Directive 2009/126/EC
Final interim: 2015 143
(3%). It is noted that for the latter three Member States an infringement for late transposition was launched in March 2012. However, it is also observed that in Bulgaria and Cyprus stricter requirements and deadlines compared to those in Article 3 have been imposed (see Table 6.2); this is likely to have accelerated implementation of the Directive in comparison, for instance, to Romania.
For the remaining Member States (Estonia, Greece, Spain, Ireland and Portugal) it is noted that the level of uptake has been estimated based on a number of assumptions and it is not possible to draw robust conclusions on the extent to which Stage II controls are being installed.
Further detail on the installation of these systems is provided in the individual summaries (Appendix D). In particular, where data have been made available these show the level of uptake per annual throughput band.
Figure 28 Level of uptake of Stage II systems per annual throughput band
(estimated)
Based on the data collected for this study, it is estimated that the vast majority (94%) of the service stations with an annual throughput above 3,000 m3 have Stage II controls in place (Figure 28). The proportion of uptake in the throughput bands between 500-1,000 m3, 1,000-2,000 m3 and 2,000-3,000 m3 is estimated to be above 75% in all cases (76%, 77% and 78%, respectively). As for the lowest throughput band (0-500 m3), almost half (47%) of the stations are estimated to have stage II equipment installed. This is likely to be driven by the fact that most of the Member States apply the 100 m3 threshold. Also, smaller stations have less resources to undertake major refurbishments and some of the Member States that had legislation regulating this activity before the enactment of the Directive did not include stations with an annual throughput below 500 m3.
6.3 Implementation and review of the elements of Article 7
6.3.1 100 m3/year threshold (Article 3)
Article 3 of the VOC-II Directive stipulates that all new service stations, as well as any
existing ones that undergo a major refurbishment, with an actual or intended
throughput exceeding 500m3/year shall be equipped with a Stage II PVR system.
Evaluation of Directive 1994/63/EC and Directive 2009/126/EC
Final interim: 2015 144
Where situated under permanent living quarters or working areas, Stage II PVR shall
be fitted when the actual or intended throughput is greater than 100m3/year. The
Article further stipulates that any existing service station with a throughput greater
than 3,000 m3/year shall be equipped with Stage II PVR by 31 December 2018. Article
7 of the VOC-II Directive specifies that the provisions to apply a threshold of 100m3/year shall be reviewed by 31 December 2014.
The 100 m3/year limit for unloading at petrol stations was introduced in VOC-I because of the relative cost-inefficiency of introducing controls at such service stations (costs were likely to lead to service station closure), including inter alia at service stations in remote (e.g. island) locations. The Directive also allows Member States to exempt those with throughput <500 m3/year where vapour emissions are unlikely to contribute significantly to environmental or health problems114. The exemptions were carried forward into the VOC-II directive, as outlined above.
As shown in Table 6.2, there are only a few Member States that have gone beyond what is established in the Directive in this regard. In Bulgaria, Cyprus, Czech Republic, Germany (for stations operated after 1993) and Italy, installation of Stage II PVR equipment is required no matter what the throughput. In the case of Austria and the region of Flanders Stage II is mandatory for service stations with annual throughput above 100m3, regardless whether they are located under permanent living quarters or working areas.
Given the provisions of the Directive under Article 7 to review the 100m3/year threshold by 31 December 2014, as part of this consultation, stakeholders were explicitly asked how appropriate they find the 100 m3/year threshold. The responses are summarised in the box and figure below:
Box 5 Stakeholder responses: Do you think the 100 m3 throughput threshold is appropriate?
Several Member State authorities did not provide an opinion as to how appropriate they regard the 100m3/year. No opinion was provided by nine Member States (CY, EL, FI, FR, HR, LT, RO, SE and UK)115. Of these, only a few gave a reason for abstaining: Sweden responded that it sees both advantages and disadvantages of the threshold, giving no opinion one way or the other, while Croatia responded that there is insufficient evidence to determine whether or not the threshold is appropriate or not and Cyprus stated that there is only one station with throughput below 100 m3/year which is not situated under permanent living quarters or working areas.
Of the Member State authorities that did respond, the majority (12/16) regard the threshold as appropriate (AT, BE, DE, DK, IE, NL, LV, HU, LU, PT, SI and SK). Two argue that no threshold should apply and that Stage II equipment should be installed at all service stations regardless of the annual throughput (IT and CZ - both of which have mandatory Stage II for all service stations). Furthermore, although the Austrian authorities regard the threshold as appropriate, it applies the 100 m3/year threshold to all new service stations and to all existing service stations that undergo major refurbishment regardless of where they are is situated, thus suggesting that it does not find the 500m3/year threshold to be appropriate. Additional criticisms of the threshold were made by authorities in Bulgaria and Estonia that felt that it should be up to the Member State to determine (BG), and that the 100m3/year threshold is too low (EE).
There is a greater response rate among industry respondents with 20 responding to the question (out of the 29 that responded in total)116. However, there is greater divergence of opinion among industry stakeholders compared to the authorities – industry responses are set out below:
114In some cases, entire member states have had such a derogation applied, such as the UK which implemented it in December 2004 after a consultation process: (http://archive.defra.gov.uk/environment/quality/air/airquality/eu-int/eu-directives/pvr/pvr1.htm). 115 Note also that no response was submitted by authorities for Poland and Spain. 116 Note that in some cases there are multiple responses from one Member State for industry stakeholders.
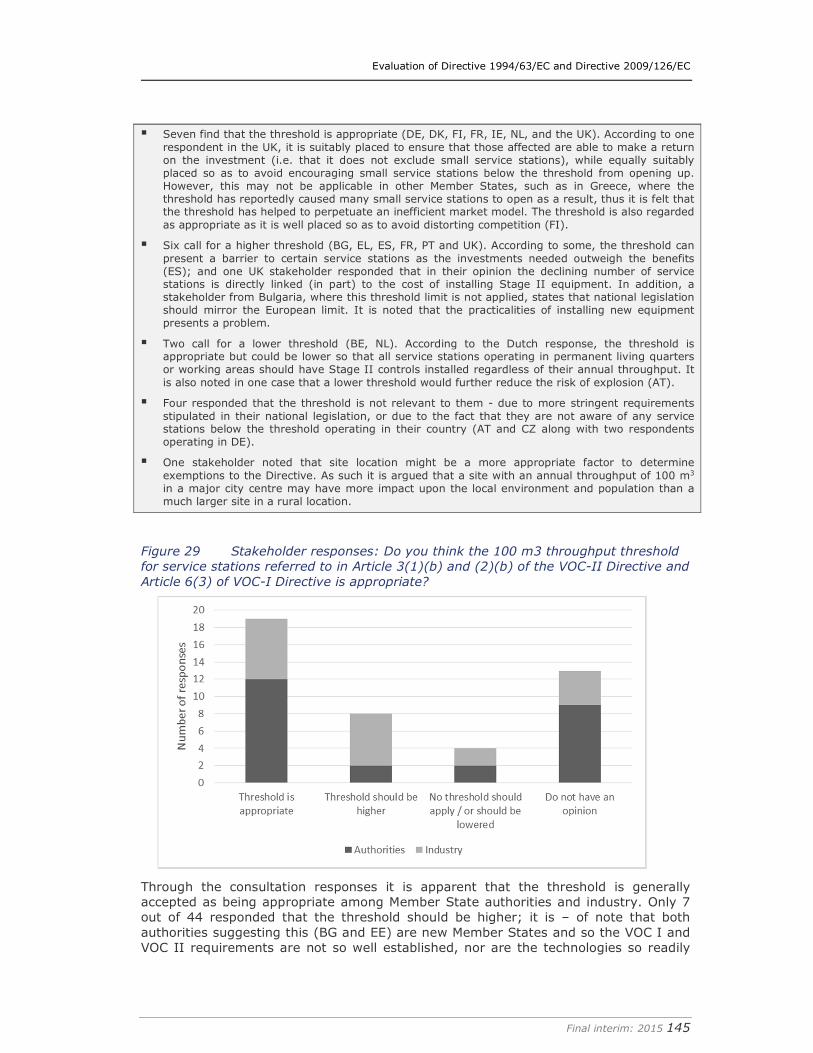
Evaluation of Directive 1994/63/EC and Directive 2009/126/EC
Final interim: 2015 145
� Seven find that the threshold is appropriate (DE, DK, FI, FR, IE, NL, and the UK). According to one respondent in the UK, it is suitably placed to ensure that those affected are able to make a return on the investment (i.e. that it does not exclude small service stations), while equally suitably placed so as to avoid encouraging small service stations below the threshold from opening up. However, this may not be applicable in other Member States, such as in Greece, where the threshold has reportedly caused many small service stations to open as a result, thus it is felt that the threshold has helped to perpetuate an inefficient market model. The threshold is also regarded as appropriate as it is well placed so as to avoid distorting competition (FI).
� Six call for a higher threshold (BG, EL, ES, FR, PT and UK). According to some, the threshold can present a barrier to certain service stations as the investments needed outweigh the benefits (ES); and one UK stakeholder responded that in their opinion the declining number of service stations is directly linked (in part) to the cost of installing Stage II equipment. In addition, a stakeholder from Bulgaria, where this threshold limit is not applied, states that national legislation should mirror the European limit. It is noted that the practicalities of installing new equipment presents a problem.
� Two call for a lower threshold (BE, NL). According to the Dutch response, the threshold is appropriate but could be lower so that all service stations operating in permanent living quarters or working areas should have Stage II controls installed regardless of their annual throughput. It is also noted in one case that a lower threshold would further reduce the risk of explosion (AT).
� Four responded that the threshold is not relevant to them - due to more stringent requirements stipulated in their national legislation, or due to the fact that they are not aware of any service stations below the threshold operating in their country (AT and CZ along with two respondents operating in DE).
� One stakeholder noted that site location might be a more appropriate factor to determine exemptions to the Directive. As such it is argued that a site with an annual throughput of 100 m3 in a major city centre may have more impact upon the local environment and population than a much larger site in a rural location.
Figure 29 Stakeholder responses: Do you think the 100 m3 throughput threshold
for service stations referred to in Article 3(1)(b) and (2)(b) of the VOC-II Directive and
Article 6(3) of VOC-I Directive is appropriate?
Through the consultation responses it is apparent that the threshold is generally accepted as being appropriate among Member State authorities and industry. Only 7 out of 44 responded that the threshold should be higher; it is – of note that both authorities suggesting this (BG and EE) are new Member States and so the VOC I and VOC II requirements are not so well established, nor are the technologies so readily
Evaluation of Directive 1994/63/EC and Directive 2009/126/EC
Final interim: 2015 146
available. There is comparatively little support from consultation stakeholders to lower the threshold, with just two Member State authorities and two industry stakeholders calling for a lower threshold. Moreover, only 7 Member State authorities have decided to implement stricter requirements.
Analysis of the approach taken outside the EU shows that limits to small petrol stations have been also implemented elsewhere. For instance, the State of New South Wales (Australia) follows a similar approach to that in the EU, as stage II controls are mandatory for all new stations and those that undergo a major refurbishment if the petrol throughput is more than 500m3 per year.
Additionally, in the U.S.A. there is a limit of 10,000 gallons/month for large private companies (equivalent to around 450 m3/year) and 50,000 gallons/month (around 2,250 m3/year) for independent owners. This limit is higher than that applied in the EU, but introduces a new perspective by exempting sites based on whether the owner is a large corporation or an independent owner, rather than solely on the threshold throughput. The opinion given by an industry representative from the U.S.A. is that the threshold in the EU should be lower than that stated in the USA. It is reasoned that as the EU Stage II requirements do not include provisions for Onboard Refuelling Vapour Recovery (ORVR), as they do in the USA (see Section 2.4), the threshold for which service stations should install Stage II equipment should be much lower than in the U.S.A. and possibly go beyond the current limit (as it is the only means of control in small stations).
Overall, views from the consultation as well as comparison with other non-EU approaches, suggests that the threshold is seen as appropriate and appears to be in line with standard practice in other countries. Moreover, it is relevant to note that lowering the threshold is unlikely to have significant impact in terms of environmental benefit compared to the costs based on the following:
� Emissions from service stations with a throughput below 500 m3 represent around 14% (6kt) of total current emissions (42 kt) estimated for the activities covered by the VOC-II Directive (see section 2.2.4). Emission data for the smallest service stations below 100 m3 are not available but this are likely to be relatively small.
� The stations below 500 m3 (29,823) represent 26% of the total number of stations in the EU (114,804) and account for 17% of the stations that have been installed with Stage II systems. It is noted that almost half (47%) of the stations below 500 m3 are estimated to have stage II equipment installed. The number of stations below 100 m3 is thus expected to be very low, as confirmed by some Member States (e.g. UK, Cyprus), and within these implementation of these systems is already mandatory as required by 5 Member States.
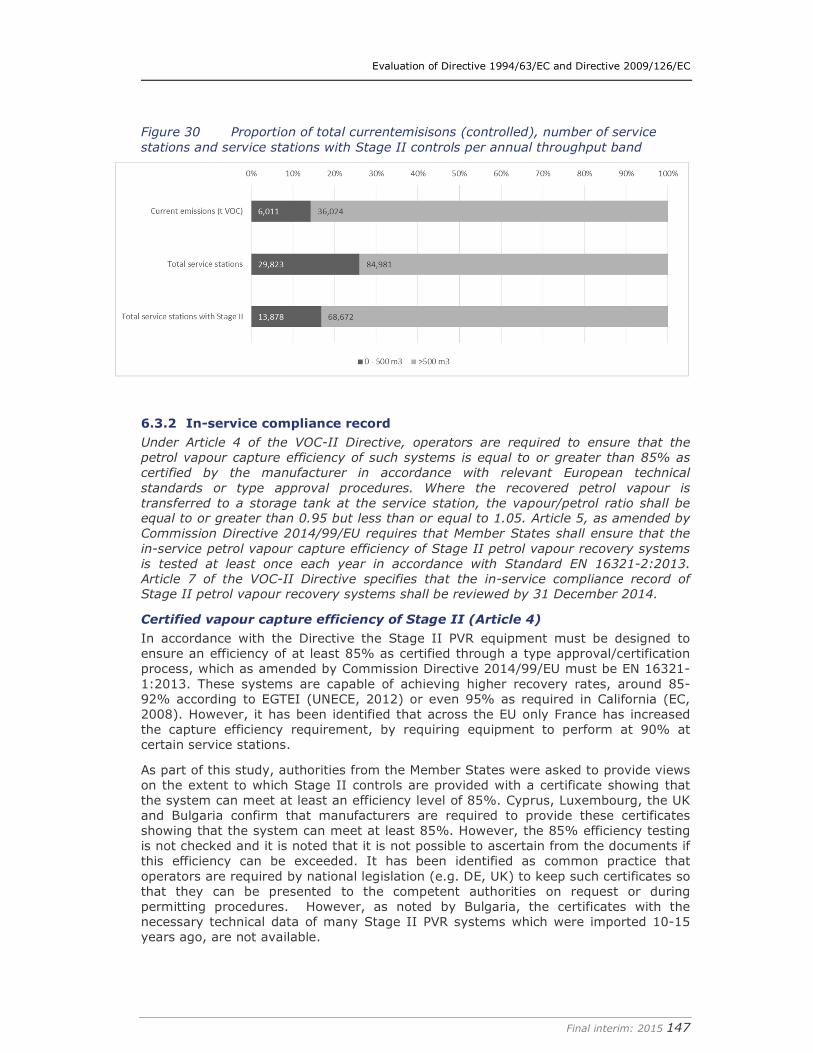
Evaluation of Directive 1994/63/EC and Directive 2009/126/EC
Final interim: 2015 147
Figure 30 Proportion of total currentemisisons (controlled), number of service
stations and service stations with Stage II controls per annual throughput band
6.3.2 In-service compliance record
Under Article 4 of the VOC-II Directive, operators are required to ensure that the
petrol vapour capture efficiency of such systems is equal to or greater than 85% as
certified by the manufacturer in accordance with relevant European technical
standards or type approval procedures. Where the recovered petrol vapour is
transferred to a storage tank at the service station, the vapour/petrol ratio shall be equal to or greater than 0.95 but less than or equal to 1.05. Article 5, as amended by Commission Directive 2014/99/EU requires that Member States shall ensure that the
in-service petrol vapour capture efficiency of Stage II petrol vapour recovery systems
is tested at least once each year in accordance with Standard EN 16321-2:2013.
Article 7 of the VOC-II Directive specifies that the in-service compliance record of Stage II petrol vapour recovery systems shall be reviewed by 31 December 2014.
Certified vapour capture efficiency of Stage II (Article 4)
In accordance with the Directive the Stage II PVR equipment must be designed to ensure an efficiency of at least 85% as certified through a type approval/certification process, which as amended by Commission Directive 2014/99/EU must be EN 16321-1:2013. These systems are capable of achieving higher recovery rates, around 85-92% according to EGTEI (UNECE, 2012) or even 95% as required in California (EC, 2008). However, it has been identified that across the EU only France has increased the capture efficiency requirement, by requiring equipment to perform at 90% at certain service stations.
As part of this study, authorities from the Member States were asked to provide views on the extent to which Stage II controls are provided with a certificate showing that the system can meet at least an efficiency level of 85%. Cyprus, Luxembourg, the UK and Bulgaria confirm that manufacturers are required to provide these certificates showing that the system can meet at least 85%. However, the 85% efficiency testing is not checked and it is noted that it is not possible to ascertain from the documents if this efficiency can be exceeded. It has been identified as common practice that operators are required by national legislation (e.g. DE, UK) to keep such certificates so that they can be presented to the competent authorities on request or during permitting procedures. However, as noted by Bulgaria, the certificates with the necessary technical data of many Stage II PVR systems which were imported 10-15 years ago, are not available.
Evaluation of Directive 1994/63/EC and Directive 2009/126/EC
Final interim: 2015 148
In addition, the Netherlands notes that it is expected that between 90-100% of systems have been certified to meet this efficiency level, whereas an authority from Sweden indicates that approximately 7.4% of available systems are provided with such a certificate showing 85% efficiency. It is noted that Sweden explained that while vapour recovery has been mandatory for all petrol stations for several years the threshold for vapour ratio has been 70% instead of 85% as implemented through its national type approval procedure TSFS 2012:63. The national type approval procedure can be used until 12 may 2016 but the threshold for recovery shall be the same as in the VOC-II Directive thereafter.
Finally, Germany notes that the efficiency measured in the testing laboratory is exceeded at the station by an average of 3%. This is because the service station operates at a slightly higher temperature (inside the vehicle) which positively affects efficiency, as long as these systems run at a vapour/petrol ratio (V/P ratio) between 95% and 105%.
Monitoring vapour capture efficiency of Stage II (Article 5)
The efficiency achieved in practice (rather than under test conditions) will vary according to the specific equipment and how it is used (e.g. filler-neck design), as well as the level and effectiveness of maintenance and monitoring. In addition the effectiveness of the system will be also influenced by external factors out of control of the system including the temperature and the composition (vapour pressure and ethanol content) of the fuel in the tanks (JRC, 2012).
In cases where vapour is transferred back to the storage tank, one of the key factors influencing effectiveness is the control of the V/P ratio, which has to be in line with what is stipulated in the Directive (95%-105%). If the ratio is less, the quantity of petrol being recovered is lowered. However, when the ratio is higher, there will be a net increase in the volume of petrol (both liquid and vapours) in the underground storage tank. This will lead to a loss of some of the recovered petrol vapours through the pressure vacuum relief valve.
Therefore, routine tests need to be regularly undertaken by operators and/or authorities to monitor the correct functioning of the equipment. If this is not done, the recovery efficiency cannot be maintained effectively during the entire life time of the system as the V/P ratio deviates easily from the optimal values and can easily lose calibration (JRC, 2012). Moreover, is also essential to ensure that no leaks are present on the vapour line, as this will decrease vapour recovery (UNECE, 2012).
In view of this, a study from the Joint Research Centre of the European Commission (2012) notes that Stage II systems typically provide a wide range (55-90%) of recovery efficiency which will be dependent on whether the V/P ratio established in the Directive is achieved and to the level of maintenance of the equipment. The Directive includes a requirement to monitor this parameter, in order to provide a degree of assurance that performance is as expected.
In particular, the VOC-II Directive requires that the in-service petrol vapour capture efficiency of Stage II petrol vapour recovery systems is tested at least once each year in accordance with an appropriate methodology. Following adoption of Commission Directive 2014/99/EU the testing methodology for the verification of the V/P ratio is defined in Standard EN 16321-2:2013. This standard specifies that the testing can be done electronically (dry method) or hydraulically (wet method). The dry method117 is the one that has been traditionally most used. It is noted that the testing frequency is
117 This method uses an electronic system to simulate the fuel flow by reading the electronic data from the dispenser using a type-approved handset, which itself is pre-calibrated with the relevant parameters (Entec, 2005).
Evaluation of Directive 1994/63/EC and Directive 2009/126/EC
Final interim: 2015 149
increased to every three years if automatic systems are used. These systems are described in section 6.3.3.
Consultation has been undertaken with authorities on the extent to which systems are regularly tested and achieve this V/P ratio. In terms of testing frequency most of the authorities that have responded (8 out of 14) report that testing in accordance with Article 5 occurs in 100% of the systems (AT, DE, DK, EE, HU, LU, NL, RO) whereas in four (CY, CZ, LV, SE) this was estimated to be between 75%-99%. Only in Bulgaria and Ireland was the proportion below 25%. In the case of Ireland it is noted that data have been only provided for the Dublin area. Bulgaria indicates that this is due to difficulties encountered in terms of connecting the reference equipment with the system to be verified due to the large variety of the Stage II PVR systems in place. In addition, another frequently encountered problem is that for many Stage II systems imported 10-15 years ago, the certificates with the necessary technical data are not available. The UK notes that operators are required to carry out annual checks and therefore the percentage should be 100%, however authorities do not routinely inspect sites to ensure compliance.
In relation to the performance of the equipment, responses from Germany, Bulgaria, Netherlands, Luxembourg and Cyprus show that, in general, systems in place are able to achieve the ratio in almost 100% of systems. Sweden notes that tests have been undertaken in 58% of available vapour recovery systems and that results showed that these had a V/P ratio between 95-105%.
Additionally, industry stakeholders were also asked to identify the share of dispensers at service stations without automatic monitoring that need adjustment on an annual basis. The share varies significantly between responses, from 2 to 100% of dispensers. This can be explained by a number of factors, as outlined by one respondent. For example, flame arresters in the systems which are used to manage explosion safety become clogged with dirt so the vapour/liquid ratio will change over time, with subsequent effects upon the connection between the dispenser and the forecourt piping (for instance). This issue is addressed in different ways across the EU, for example, in France additional flame arresters are used, while in the Netherlands quick connect systems are in place, and in the UK shear valves are used. The different approaches taken and the nature of the problems encountered affect the share of dispensers that require adjustment on an annual basis, thus in France ~30% require adjustment, in Austria between 20% and 100% require adjustment, while responses for the UK indicate that just 2-5% require adjustment.
Experience from the USA also provides information on the efficiency of Stage II controls, which was found to rely on regular maintenance. Thus although these could potentially operate at 95% efficiency, the working average was estimated to be 70%. However there is potential for greater efficiency (e.g. up to 92%) where semi-annual inspection and strong follow-up enforcement are imposed. Annual inspection is estimated to result in 86% efficiency on average whereas only 62% efficiency is estimated to result with minimal inspection (ICCT, 2011). This data suggests that reducing the annual frequency of testing established in Article 5 as proposed by three stakeholders would not be appropriate.
Overall, monitoring is essential to the correct functioning of Stage II vapour recovery, as it highlights deficiencies with the equipment and ensures that repairs are carried out. The Directive addresses this by prescribing an annual frequency to verify the V/P ratio. However, there are a number of other reasons that may influence its effectiveness such as controlling the air and vapour tightness. Such testing is not covered by EN 16321-2:2013, though it has been identified that some Member States require vapour tightness to be tested. In Germany the tightness (leak detection) test
Evaluation of Directive 1994/63/EC and Directive 2009/126/EC
Final interim: 2015 150
is tested every 2.5 years if a fuel blend is sold or every 5 years for petrol. In the UK this has to be tested every 3 years. This could be further considered by the Commission in future developments of the Standard as it would increase the effectiveness of the system.
Notwithstanding with the above, it is relevant to note that deviations from the emission abatement certified under testing conditions and the one achieved in practice are true for almost any sort of abatement. Therefore a balance needs to be achieved between the costs imposed and the level of certainty in emissions abatement.
6.3.3 Need for automatic monitoring equipment
Under Article 5 of the VOC-II Directive, operators are required to carry out periodic
checks for the petrol vapour capture efficiency of the installed Stage II PVR
equipment. The periodic checks can be carried out either manually or automatically.
Where an automatic monitoring system is installed, the system shall automatically
detect faults in the system, inform the operator and stop the flow of petrol from the
faulty dispenser if the fault is not addressed within seven days. Petrol vapour capture
efficiency shall be checked at least once a year where monitoring is manual and once
every three years where an automatic monitoring system is in place. Article 7 of the VOC-II Directive specifies that the need for automatic monitoring equipment in relation to periodic checks shall be reviewed by 31 December 2014.
The use of mandatory automatic monitoring is included in the national legislation for three Member States (AT, HU and DE). In Austria automatic monitoring is mandatory for service stations with an annual throughput exceeding 3,000m3 whereas in Hungary it is required for all new and refurbished stations exceeding 500m3 (or 100m3 under permanent living quarters). In Germany automatic monitoring is mandatory for all service stations with Stage II equipment installed and dispensers are automatically closed if the fault is not addressed within 72 hours of being detected. The German authority reports that 100% of Stage II controls use automatic monitoring, whereas in Hungary this proportion is below 25% (as it does not apply to existing stations). These data are not available for Austria.
In Germany (according to an industry respondent), there are two automatic monitoring systems available to operators – these are a data supply system, which only provides periodic data and indicates faults to a control room; and a self-regulated system, which provides data and automatically regulates the pump in the event of a fault. The latter is most commonly used by operators. According to the German authorities, these systems are the only way to ensure long-lasting functioning of the equipment. Without this, all failures and malfunctioning are detected during the following inspection which could be months after the failure occurs. Findings from checks of these systems conducted in some Länder (regions) between 2002 and 2007 found failures of up to 30% of gas recirculation systems in Stage II PVR equipment and up to 50% of the systems malfunctioned. The main causes were technical deficiencies and lack of maintenance by the service-station operator (DGMK, 2003 as cited by the German authorities in their consultation response).
In the rest of the countries the uptake of automatic monitoring is voluntary in line with the requirements of the Directive. 8 Member State authorities have provided information on the estimated proportion of Stage II controls that are automatically monitored. These represent less than 25% in Cyprus, Denmark, Ireland, Luxembourg, Netherlands and Sweden. In the Czech Republic and Hungary there are estimated to be used for around 25%-50% of Stage II controls.
Although automatic monitoring systems are mandatory in three Member States, a handful of Member State authorities and industry stakeholders recognise the benefits
Evaluation of Directive 1994/63/EC and Directive 2009/126/EC
Final interim: 2015 151
associated with automatic monitoring over the disadvantages (CZ, HU and NL along with an EU-wide industry association and other industry stakeholders operating in AT, CZ and UK). The main benefits identified refer to the speed with which automatic monitoring can respond to faulty dispensers, improved safety conditions (as the equipment is generally better maintained), that there is less scope for human error, and reduced administrative burden (due to less paperwork required from fewer periodic checks being conducted). For example, the authorities in Germany note that the use of automatic monitoring systems has reduced the amount of time needed for periodic checks (from once every year to once every 2 to 5 years).
One drawback identified by 4 respondents (authorities in CZ and HU along with industry in DE and CZ) is the investment costs needed to install the system – one German industry respondent indicated that the cost of retrofitting an automatic monitoring system is as costly as fitting the Stage II PVR equipment itself. Another drawback identified only by 3 industry representatives (AT, CZ and UK) are the running costs of maintaining the automatic monitoring systems. The Austrian respondent further notes that the cost of maintaining the Stage II PVR equipment is also greater with automatic monitoring systems in place as when a fault is identified it must be addressed in a short timeframe which incurs greater costs for the operator.
A few Member States maintain that there is not enough experience to report any of the pros or cons (EE, HR and LV), while the majority of Member State authorities have not responded.
In addition to information gathered from the consultation, the EGTEI (UNECE, 2012) has also discussed the pros and cons of automatic monitoring compared to manual checking. While the theoretical VOC emission recovery efficiency for both systems is estimated to be about 85% to 92% wt., in practice automatic monitoring is designed to keep the efficiency stable during the life time of the system (by automatically detecting faults and adjusting any deviation from optimal values) and consequently enables achieving a larger efficiency. However, it also notes that the combination of routine dry-tests (e.g. as described in EN 16321-2:2013), regular visual inspections and the installation of a 'fault code' system to check correct functioning (e.g. that the vapour pump is functional) can achieve consistently high recovery efficiencies at approximately one tenth of the cost of the automatic monitoring system (UNECE, 2012).
Note that the Commission's Impact Assessment on the VOC-II Directive highlighted that automatic monitoring systems could reduce the cost of inspections (reported to cost €200-250 per dispenser). The cost of retro-fitting automatic monitoring systems was estimated at €2000 per dispenser, and the costs of fitting automatic monitoring to new systems was likely to be less than this, although no firm estimates were available. During this consultation, one industry stakeholder from the UK has noted that the costs of retrofitting a service stations are typically around €15,000 per site compared to a cost of €2,000 for the installation of new site dispensers. On top of this, the running costs of maintaining the automatic monitoring systems are also relevant though no robust figures from the consultation have been obtained.
As discussed here, there are several benefits to installing automatic monitoring systems, while the key negative factors associated with automatic monitoring systems are the high capital costs required to install the system and the running maintenance costs. As yet, only three Member States have implemented requirements for mandatory automatic monitoring systems to accompany Stage II PVR equipment. The lack of information and knowledge concerning these automatic monitoring systems thus appears to be a major deterrent, particularly when set against the cost of the equipment. One solution to overcome this could be for service stations to conduct
Evaluation of Directive 1994/63/EC and Directive 2009/126/EC
Final interim: 2015 152
cost-benefit analyses to determine whether the costs outweigh the benefits before installing the automatic monitoring systems. According to one industry respondent operating in the U.S.A, the use of automatic monitoring should be based on the outcomes from a cost-benefit analysis. As noted by this stakeholder, automatic monitoring systems have only been installed in the state of California where it was calculated that the increased efficiency associated with installing the system would yield a certain amount of VOC reductions that could justify the cost of installation (as referenced by an American consultation stakeholder).
Overall, the current voluntary approach implemented in the EU seems to be appropriate as it enables service stations to decide on an individual basis whether the costs to install automatic monitoring systems outweigh the benefits compared to manual monitoring, taking into account their particular circumstances (e.g. size of the station, incorporation as part of refurbishment) and their potential for recovering the investment. As such it has been observed that the fact that is not mandatory has not prevented industry stakeholders from adopting these systems where these were identified as the most cost-effective option. It is noted that it has not been possible to derive an EU wide estimation of the total emission savings that mandatory automated equipment could achieve as this would be subject to a high level of uncertainty, though these savings are likely to be small compared to a situation where Stage II systems are well maintained and monitored on a manual basis.
6.4 Key issues with implementation
Based on the consultation held during the study, most Member States seem to have experienced few, if any, technical issues with regard to specific requirements of the directive and/ or interpretation problems. This can be partly explained by the fact that the majority of Member States had pre-existing legislation and were already familiar with its requirements.
There are a few observations or issues worth emphasising:
� The Directive foresees the possibility of using two technologies to recover petrol vapour: the “conventional system”, which transfers recovered vapours to the underground tank and the “at pump” system in which the vapour recovered is cooled and condensed into liquid petrol which is directly transferred back to the petrol dispenser for resale. Being a more mature technology, use of the conventional system is widespread across the EU. The ‘at-pump’ system is also being applied at various service stations, but uptake has reportedly been less than initially envisaged. In this regard, industry stakeholders from Italy and the UK note that this has been due to lack of reliable technologies and technical/testing requirements for these systems. Further discussion is included in section 7.2.7.
� What constitutes a “major refurbishment” has generally been interpreted differently across Member States, and several have expressed difficulties in clarifying what it means in practice. Although it is briefly reasoned in recital 9 of the Directive, this could be further explained or defined at EU level to avoid confusion and varying degrees of interpretation. This is further discussed in section 7.3.5 discussing the potential for simplification of the directive.
� As noted earlier in section 4.3 for the VOC-I Directive, problems have been encountered with the interaction of Stage I and Stage II controls (i.e. use of stage II systems can result in excessive pressure building up in the underground storage tanks). This is further discussed in sections 5.2.8 and 7.2.7.
� One particular concern has been raised by a stakeholder from Germany, who notes that they experienced problems with the established limitations of the ambient air
Evaluation of Directive 1994/63/EC and Directive 2009/126/EC
Final interim: 2015 153
temperature during the verification of the V/P ratio (+5°C to +25 °C) but these are not detailed.
� In addition the JRC report (2012) notes that the introduction in the market of petrol-powered vehicles which can run on ethanol concentrations as high as 85% (E85), may require the installation of a dedicated Stage II system at refuelling stations. However, this can be problematic as since no Stage II equipment certified for E85 seems to be commercially available. It is also noted that use of E85 also involves a potential safety issue since the gas atmosphere in an E85 system will have a compound within the explosion range more often than is the case with petrol. For this reason some manufacturers producing flexible-fuel vehicles have already adopted ORVR systems.
Evaluation of Directive 1994/63/EC and Directive 2009/126/EC
Final interim: 2015 154
7. Results and analysis–Evaluation of Directive
2009/126/EC (VOC-II)
7.1 Summary of evaluation results
This section summarises the key findings from the evaluation of the VOC-II Directive.
When assessing the expected results achieved by the VOC-II Directive it is relevant to note that most Member States already had legislation in place on Stage II controls when the VOC-II Directive was introduced. Therefore the effects concerning improvement of environmental conditions, costs and benefits are more relevant for the Member States having no pre-existing legislation at that date. For the countries where legislation was in place, particularly those showing a high level of uptake of Stage II, the impact of the Directive on this aspect is likely to have been minor. For these countries the most significant effect of the Directive is related to the harmonisation and improved functioning of the internal market.
However, as noted in section 2.2 it is important to note that the VOC-I Directive already anticipated the development of legislation to control refuelling emissions (Stage II) and therefore provided an incentive for Member States to develop their national legislation. Based on this argument, it is quite difficult to isolate the VOC reductions (and impacts) that have been achieved as a result of the VOC-II Directive (or of EU action as a whole) compared to those that can only be attributed to national action.
Effectiveness
The effectiveness of the Directive can be observed in the changes it has encouraged regarding its key objectives.
� As shown in the table below, current annual emissions from the activities covered by the Directive have been estimated to be 159 kt less than the annual emission levels in 1995 (201kt). This represents on average a reduction of 9kt per year since 1995.These can be largely attributed to the uptake of Stage II controls required under the Directive (54% of the reduction), though other factors also had an influence (43% of reductions due to decrease in petrol consumption and a further 3% from national legislation adopted prior to 1995). Several other Member States had Stage II controls prior to the Directive, but the specific effect of post-1995 legislation has not been possible to quantify in the results.
� Future reductions in the sector are also included in table below. These have been estimated to be 17.1 kt, of which 10 kt (59%) is estimated to be caused by a decrease in petrol consumption, whereas the rest 7 kt (39%) is expected to be caused by the Directive. It should be noted that these projections are very uncertain, as future petrol consumption trends are difficult to predict, and data on expected future uptake of Stage II controls is incomplete.
� By comparison, the reductions in VOC emissions from all man-made sources are estimated to be an average of 374 kt per year over the same period. As such the total reductions that may be attributed to the uptake of Stage II systems since 1995 (86 kt) corresponds to 1% of the total reductions of anthropogenic VOC emissions that occurred from 1995 to 2012 according to the EEA (6,361 kt). Estimated current emissions collectively represent around 0.6% of the total man-made VOC emissions in the EU-28.
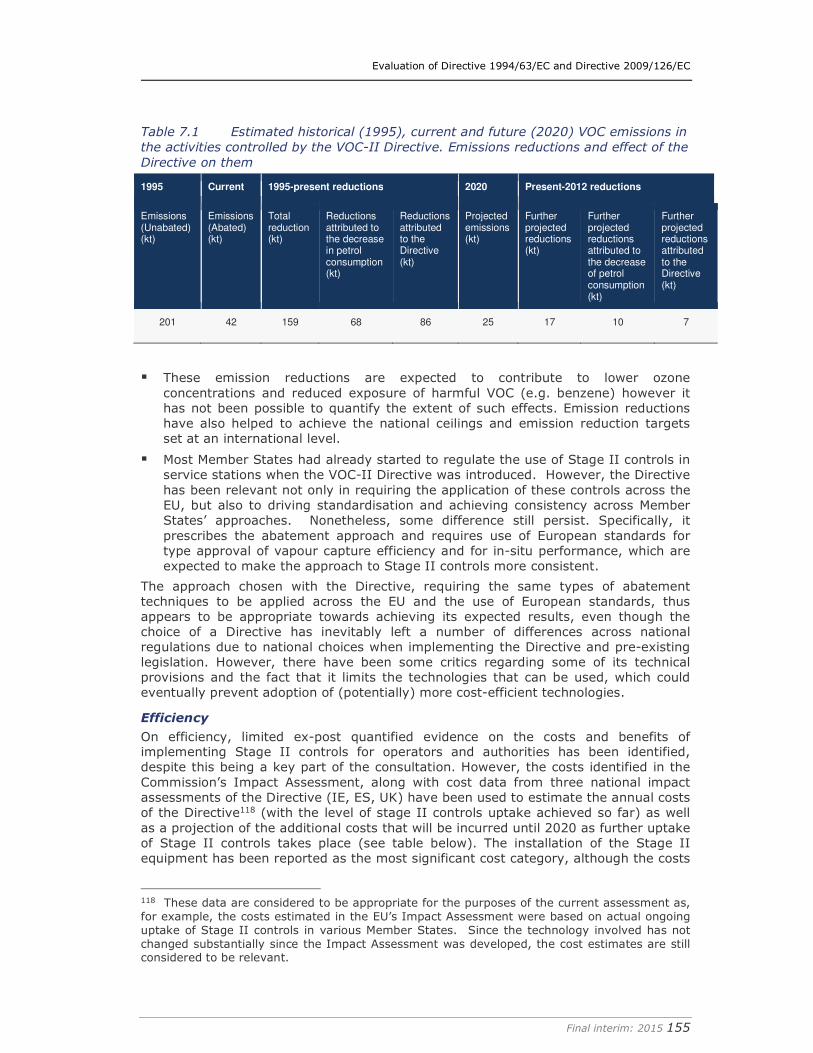
Evaluation of Directive 1994/63/EC and Directive 2009/126/EC
Final interim: 2015 155
Table 7.1 Estimated historical (1995), current and future (2020) VOC emissions in
the activities controlled by the VOC-II Directive. Emissions reductions and effect of the
Directive on them
1995 Current 1995-present reductions 2020 Present-2012 reductions
Emissions (Unabated) (kt)
Emissions (Abated) (kt)
Total reduction (kt)
Reductions attributed to the decrease in petrol consumption (kt)
Reductions attributed to the Directive (kt)
Projected emissions (kt)
Further projected reductions (kt)
Further projected reductions attributed to the decrease of petrol consumption (kt)
Further projected reductions attributed to the Directive (kt)
201 42 159 68 86 25 17 10 7
� These emission reductions are expected to contribute to lower ozone concentrations and reduced exposure of harmful VOC (e.g. benzene) however it has not been possible to quantify the extent of such effects. Emission reductions have also helped to achieve the national ceilings and emission reduction targets set at an international level.
� Most Member States had already started to regulate the use of Stage II controls in service stations when the VOC-II Directive was introduced. However, the Directive has been relevant not only in requiring the application of these controls across the EU, but also to driving standardisation and achieving consistency across Member States’ approaches. Nonetheless, some difference still persist. Specifically, it prescribes the abatement approach and requires use of European standards for type approval of vapour capture efficiency and for in-situ performance, which are expected to make the approach to Stage II controls more consistent.
The approach chosen with the Directive, requiring the same types of abatement techniques to be applied across the EU and the use of European standards, thus appears to be appropriate towards achieving its expected results, even though the choice of a Directive has inevitably left a number of differences across national regulations due to national choices when implementing the Directive and pre-existing legislation. However, there have been some critics regarding some of its technical provisions and the fact that it limits the technologies that can be used, which could eventually prevent adoption of (potentially) more cost-efficient technologies.
Efficiency
On efficiency, limited ex-post quantified evidence on the costs and benefits of implementing Stage II controls for operators and authorities has been identified, despite this being a key part of the consultation. However, the costs identified in the Commission’s Impact Assessment, along with cost data from three national impact assessments of the Directive (IE, ES, UK) have been used to estimate the annual costs of the Directive118 (with the level of stage II controls uptake achieved so far) as well as a projection of the additional costs that will be incurred until 2020 as further uptake of Stage II controls takes place (see table below). The installation of the Stage II equipment has been reported as the most significant cost category, although the costs
118 These data are considered to be appropriate for the purposes of the current assessment as, for example, the costs estimated in the EU’s Impact Assessment were based on actual ongoing uptake of Stage II controls in various Member States. Since the technology involved has not changed substantially since the Impact Assessment was developed, the cost estimates are still considered to be relevant.
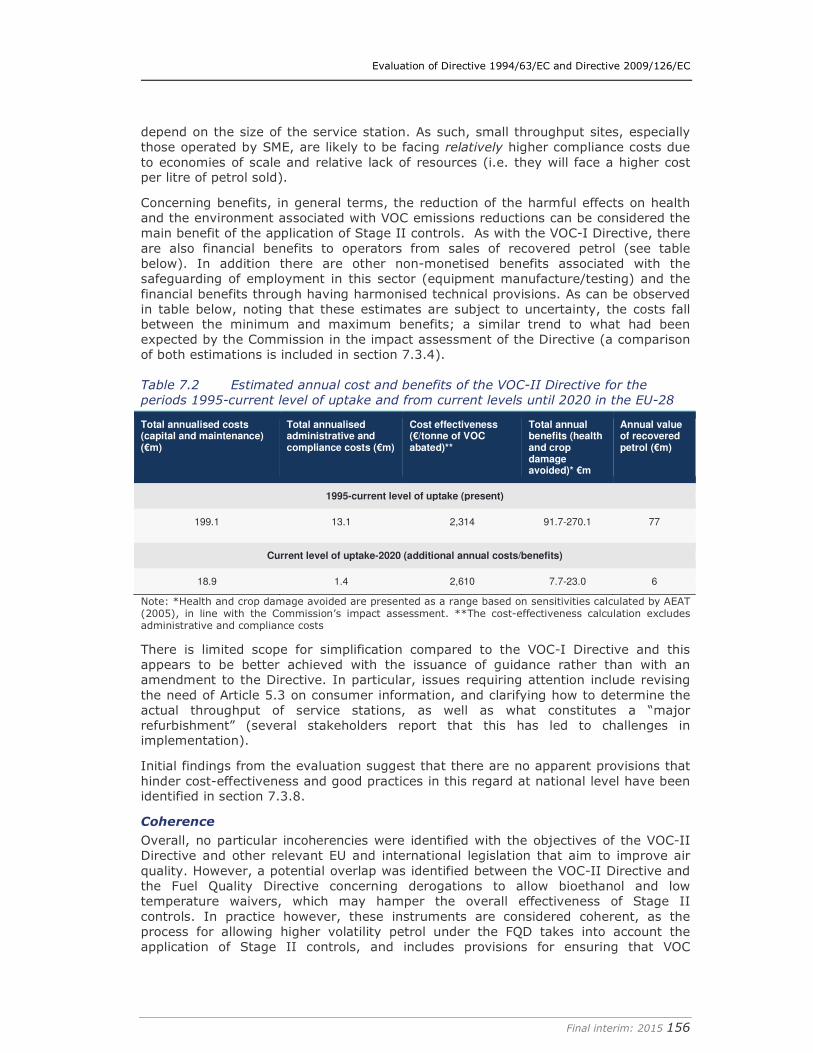
Evaluation of Directive 1994/63/EC and Directive 2009/126/EC
Final interim: 2015 156
depend on the size of the service station. As such, small throughput sites, especially those operated by SME, are likely to be facing relatively higher compliance costs due to economies of scale and relative lack of resources (i.e. they will face a higher cost per litre of petrol sold).
Concerning benefits, in general terms, the reduction of the harmful effects on health and the environment associated with VOC emissions reductions can be considered the main benefit of the application of Stage II controls. As with the VOC-I Directive, there are also financial benefits to operators from sales of recovered petrol (see table below). In addition there are other non-monetised benefits associated with the safeguarding of employment in this sector (equipment manufacture/testing) and the financial benefits through having harmonised technical provisions. As can be observed in table below, noting that these estimates are subject to uncertainty, the costs fall between the minimum and maximum benefits; a similar trend to what had been expected by the Commission in the impact assessment of the Directive (a comparison of both estimations is included in section 7.3.4).
Table 7.2 Estimated annual cost and benefits of the VOC-II Directive for the
periods 1995-current level of uptake and from current levels until 2020 in the EU-28
Total annualised costs (capital and maintenance) (€m)
Total annualised administrative and compliance costs (€m)
Cost effectiveness (€/tonne of VOC abated)**
Total annual benefits (health and crop damage avoided)* €m
Annual value of recovered petrol (€m)
1995-current level of uptake (present)
199.1 13.1 2,314 91.7-270.1 77
Current level of uptake-2020 (additional annual costs/benefits)
18.9 1.4 2,610 7.7-23.0 6
Note: *Health and crop damage avoided are presented as a range based on sensitivities calculated by AEAT (2005), in line with the Commission’s impact assessment. **The cost-effectiveness calculation excludes administrative and compliance costs
There is limited scope for simplification compared to the VOC-I Directive and this appears to be better achieved with the issuance of guidance rather than with an amendment to the Directive. In particular, issues requiring attention include revising the need of Article 5.3 on consumer information, and clarifying how to determine the actual throughput of service stations, as well as what constitutes a “major refurbishment” (several stakeholders report that this has led to challenges in implementation).
Initial findings from the evaluation suggest that there are no apparent provisions that hinder cost-effectiveness and good practices in this regard at national level have been identified in section 7.3.8.
Coherence
Overall, no particular incoherencies were identified with the objectives of the VOC-II Directive and other relevant EU and international legislation that aim to improve air quality. However, a potential overlap was identified between the VOC-II Directive and the Fuel Quality Directive concerning derogations to allow bioethanol and low temperature waivers, which may hamper the overall effectiveness of Stage II controls. In practice however, these instruments are considered coherent, as the process for allowing higher volatility petrol under the FQD takes into account the application of Stage II controls, and includes provisions for ensuring that VOC
Evaluation of Directive 1994/63/EC and Directive 2009/126/EC
Final interim: 2015 157
emission increases do not detract from meeting national and international emissions and air quality obligations.
In addition, several areas can be identified where the different air quality and emissions legislation along with the VOC-II Directive could work better work together. In particular, there are potential synergies with legislation directly affecting the composition of petrol vapour under the FQD e.g. benzene content.
Relevance
The VOC-II Directive appears to be still relevant and responds to the environmental and health objectives of the EU by contributing to the reduction of harmful VOC emissions into the atmosphere from petrol storage and distribution. This is also highlighted by the recently reaffirmed need for tighter national ceilings for VOC emissions in 2020 and 2030. As such it is noted that the majority of stakeholders have a positive to very positive view of the VOC-II Directive (65% of total respondents).
The Directive has kept up with technological developments and progress as seen through the recent amendment of the Directive, which makes reference to recent CEN standards concerning Stage II systems.
Concerning the existence of obsolete provisions, the analysis of stakeholder feedback indicate that Article 5(3) of the VOC-II Directive may be obsolete in terms of its usefulness in informing consumers of the existence of Stage II controls at service stations. According to several stakeholders, this is because consumers are not interested or looking for this information and are instead influenced by fuel price and convenience of location of the service station, rather than the existence (or non-existence) of Stage II controls. Despite the drawbacks raised concerning Article 5(3), leaving the Directive as is may result in less administrative and regulatory burden compared to amending the Directive, especially since the Directive has already been recently amended. The provision of guidance could serve the same purpose at less cost.
EU-added value
Considering that many Member States had already started to adopt national legislation to regulate the use of Stage II controls, the VOC-II Directive has been relevant in establishing an EU wide common approach to addressing emissions from Stage II operations. However, it is noted that it is not feasible to determine accurately what would have happened in each Member State if the Directive was not in place, especially given the introduction of the Gothenburg protocol at the wider international level. Indeed, it is understood that some member states introduced their national legislation on Stage II controls (in advance of the Directive) because EU-wide Stage II controls were already envisaged at the time that the VOC-I Directive was introduced.
Moreover, respondents to the consultation acknowledged the benefits of this field being regulated at EU level. Repealing the Directive would likely most affect those Member States that had no prior legislation and which are still in the implementation process.
7.2 Effectiveness
7.2.1 Overview
Following the same approach as for the VOC-I Directive as described in Section 0 the subsequent sections provide preliminary findings on the evaluation of effectiveness, which has been structured around the responses to seven principal questions and along several sub-questions.
Evaluation of Directive 1994/63/EC and Directive 2009/126/EC
Final interim: 2015 158
7.2.2 Does the VOC-II show the expected results? (E.1)
The above question is broken down into five sub-questions in order to assess individually each of the expected results/impacts pursued by the VOC-I Directive, as outlined in the intervention logic (see Figure 15).
When assessing the expected results achieved by the VOC-II Directive it is relevant to note that most Member States already had legislation in place on Stage II controls prior to the introduction of the Directive. Therefore the positive effects concerning improvement of environmental conditions (e.g. ozone protection, harmful VOC emissions) are more relevant for the Member States having no pre-existing legislation at that time. For the countries where legislation was in place the most significant effect of the Directive is related to the harmonisation and improved functioning of the internal market.
However, as noted in section 2.2 it is important to note that the VOC-I Directive already anticipated the development of legislation to control refuelling emissions and therefore provided an incentive for Member States to develop their legislation. Based on this argument, it is quite difficult to isolate the VOC reductions (and impacts) that have been achieved as a result of the VOC-II Directive (or EU action more generally) compared to those that can only be attributed to national action.
� Has the Directive resulted in reductions of VOC emissions from petrol? (E.1a)
As can be observed in Figure 11, the total VOC emissions from the petrol storage and distribution sector have decreased since 1995. This figure includes the overall reduction that can be attributed to the two Directives (a total decrease of 428 kt). Section 2.2.4 compares this reduction with the official data that has been reported to the EEA on emissions (270 kt). The analysis of the official data includes a comparison of the evolution of historical VOC emissions from the sector and the historical petrol sales (emission factor), confirming a declining trend in the VOC emissions arising from this sector.
For the assessment of the effectiveness of the VOC-II Directive, it should be noted that the Directive had to be transposed by 2012. Some of the data used in this study is not available after 2012, so the assessment has taken into account uptake of Stage II controls with the current uptake compared to 1995, even though part of this technology was taken up before the Directive was introduced.
As outlined in section 2.2.4, the emission model calculates that 42 kt are emitted from the refuelling of vehicles at service stations, which equates to emission reductions of 159 kt VOC from 1995 to current uptake levels. These 42 kt represent 0.6% of the total man-made VOC emissions in the EU-28. As in the VOC-I Directive analysis, the 1995 emissions data assume that no Stage II controls were in place except in Austria and Sweden. Also, it assumes the same number and size of service stations in 1995 and 2012, due to lack of available data.
Of this reduction, 68 kt is estimated to be due to a decrease in petrol sales, whereas 86 kt (or 54% of the total reduction) is estimated to be due to the controls imposed in the Directive. The rest (5 kt) is estimated to be due to national legislation enacted in Austria and Sweden before 1995. Several other Member States had Stage II controls prior to the Directive, but the specific effect of post-1995 legislation has not been possible to quantify in the results.
Figure 31 includes the emissions reductions outlined in the paragraph above split between different throughput bands of service stations. The majority (49%) of the emissions reductions have been estimated to arise from the largest stations
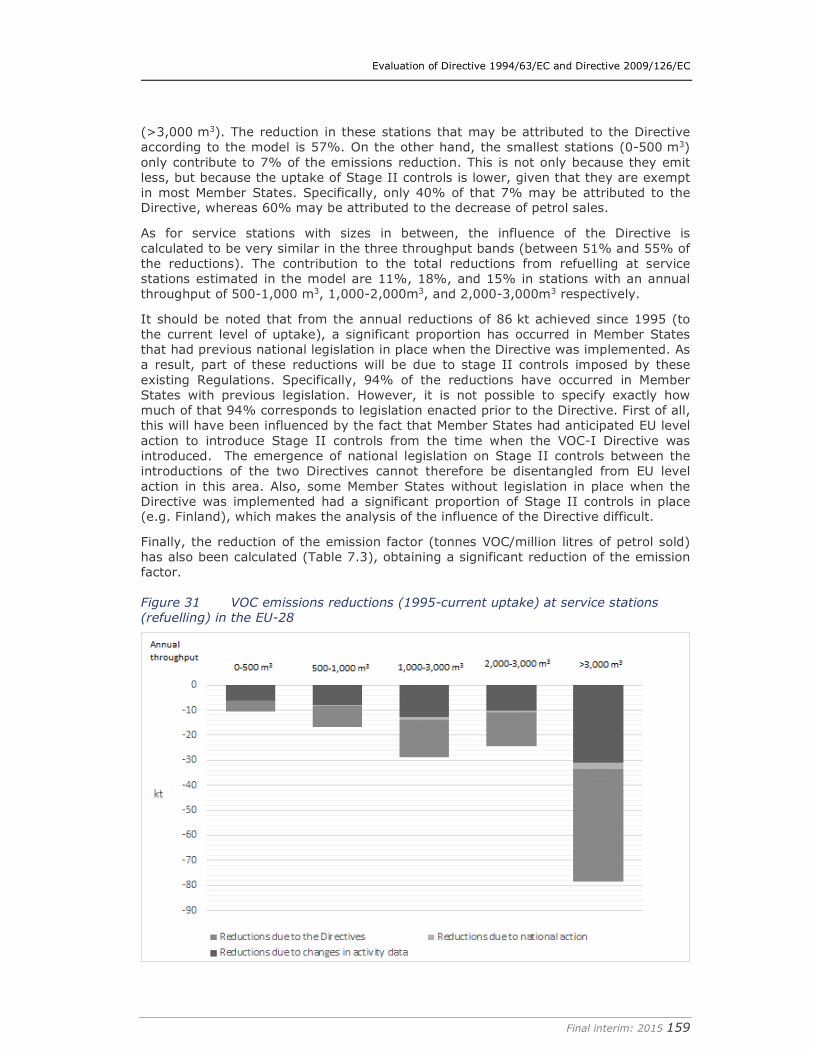
Evaluation of Directive 1994/63/EC and Directive 2009/126/EC
Final interim: 2015 159
(>3,000 m3). The reduction in these stations that may be attributed to the Directive according to the model is 57%. On the other hand, the smallest stations (0-500 m3) only contribute to 7% of the emissions reduction. This is not only because they emit less, but because the uptake of Stage II controls is lower, given that they are exempt in most Member States. Specifically, only 40% of that 7% may be attributed to the Directive, whereas 60% may be attributed to the decrease of petrol sales.
As for service stations with sizes in between, the influence of the Directive is calculated to be very similar in the three throughput bands (between 51% and 55% of the reductions). The contribution to the total reductions from refuelling at service stations estimated in the model are 11%, 18%, and 15% in stations with an annual throughput of 500-1,000 m3, 1,000-2,000m3, and 2,000-3,000m3 respectively.
It should be noted that from the annual reductions of 86 kt achieved since 1995 (to the current level of uptake), a significant proportion has occurred in Member States that had previous national legislation in place when the Directive was implemented. As a result, part of these reductions will be due to stage II controls imposed by these existing Regulations. Specifically, 94% of the reductions have occurred in Member States with previous legislation. However, it is not possible to specify exactly how much of that 94% corresponds to legislation enacted prior to the Directive. First of all, this will have been influenced by the fact that Member States had anticipated EU level action to introduce Stage II controls from the time when the VOC-I Directive was introduced. The emergence of national legislation on Stage II controls between the introductions of the two Directives cannot therefore be disentangled from EU level action in this area. Also, some Member States without legislation in place when the Directive was implemented had a significant proportion of Stage II controls in place (e.g. Finland), which makes the analysis of the influence of the Directive difficult.
Finally, the reduction of the emission factor (tonnes VOC/million litres of petrol sold) has also been calculated (Table 7.3), obtaining a significant reduction of the emission factor.
Figure 31 VOC emissions reductions (1995-current uptake) at service stations
(refuelling) in the EU-28
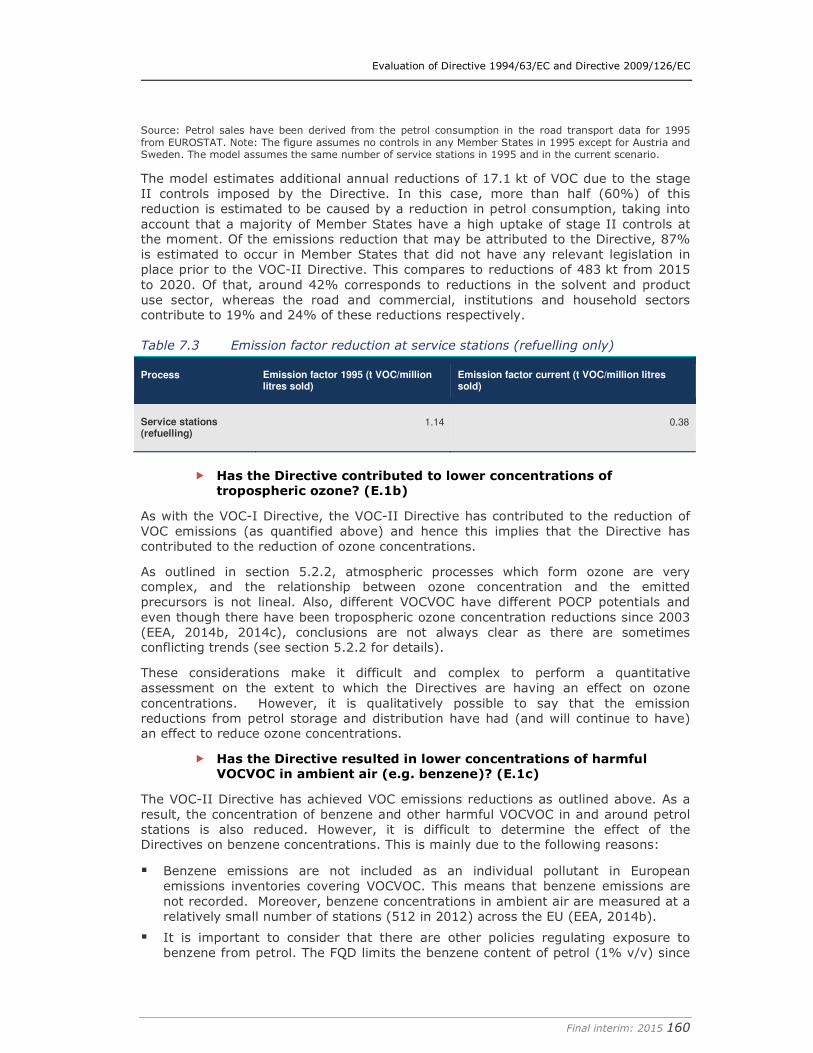
Evaluation of Directive 1994/63/EC and Directive 2009/126/EC
Final interim: 2015 160
Source: Petrol sales have been derived from the petrol consumption in the road transport data for 1995 from EUROSTAT. Note: The figure assumes no controls in any Member States in 1995 except for Austria and Sweden. The model assumes the same number of service stations in 1995 and in the current scenario.
The model estimates additional annual reductions of 17.1 kt of VOC due to the stage II controls imposed by the Directive. In this case, more than half (60%) of this reduction is estimated to be caused by a reduction in petrol consumption, taking into account that a majority of Member States have a high uptake of stage II controls at the moment. Of the emissions reduction that may be attributed to the Directive, 87% is estimated to occur in Member States that did not have any relevant legislation in place prior to the VOC-II Directive. This compares to reductions of 483 kt from 2015 to 2020. Of that, around 42% corresponds to reductions in the solvent and product use sector, whereas the road and commercial, institutions and household sectors contribute to 19% and 24% of these reductions respectively.
Table 7.3 Emission factor reduction at service stations (refuelling only)
Process Emission factor 1995 (t VOC/million litres sold)
Emission factor current (t VOC/million litres sold)
Service stations (refuelling)
1.14 0.38
� Has the Directive contributed to lower concentrations of
tropospheric ozone? (E.1b)
As with the VOC-I Directive, the VOC-II Directive has contributed to the reduction of VOC emissions (as quantified above) and hence this implies that the Directive has contributed to the reduction of ozone concentrations.
As outlined in section 5.2.2, atmospheric processes which form ozone are very complex, and the relationship between ozone concentration and the emitted precursors is not lineal. Also, different VOCVOC have different POCP potentials and even though there have been tropospheric ozone concentration reductions since 2003 (EEA, 2014b, 2014c), conclusions are not always clear as there are sometimes conflicting trends (see section 5.2.2 for details).
These considerations make it difficult and complex to perform a quantitative assessment on the extent to which the Directives are having an effect on ozone concentrations. However, it is qualitatively possible to say that the emission reductions from petrol storage and distribution have had (and will continue to have) an effect to reduce ozone concentrations.
� Has the Directive resulted in lower concentrations of harmful VOCVOC in ambient air (e.g. benzene)? (E.1c)
The VOC-II Directive has achieved VOC emissions reductions as outlined above. As a result, the concentration of benzene and other harmful VOCVOC in and around petrol stations is also reduced. However, it is difficult to determine the effect of the Directives on benzene concentrations. This is mainly due to the following reasons:
� Benzene emissions are not included as an individual pollutant in European emissions inventories covering VOCVOC. This means that benzene emissions are not recorded. Moreover, benzene concentrations in ambient air are measured at a relatively small number of stations (512 in 2012) across the EU (EEA, 2014b).
� It is important to consider that there are other policies regulating exposure to benzene from petrol. The FQD limits the benzene content of petrol (1% v/v) since
Evaluation of Directive 1994/63/EC and Directive 2009/126/EC
Final interim: 2015 161
the year 2000 whereas Regulation (EC) N° 715/2007 on the type approval of motor vehicles restricts the emissions of hydrocarbons from road vehicles (including VOC emissions although benzene is not targeted specifically). Therefore, it is difficult to allocate the extent to which the VOC-I Directive has contributed to reductions of VOCVOC in comparison to other regulatory instruments, so a quantitative estimate has not been possible.
Nonetheless, as noted in section 5.2.2, published literature shows that Stage I as well as Stage II systems have been effective in reducing exposure to benzene and other hazardous substances (i.e. Edokpolo et al. 2014).
� Has the Directive contributed to compliance with international
obligations? (E.1d)
As described in section 2.1 (see Table 2.1), the key international obligations in the field of VOC emissions are the 1979 Geneva Protocol and the 1999 Gothenburg Protocol (recently revised in 2012) which have been ratified/signed by the European Union and most Member States. Under these protocols specific VOC emission reduction targets and national emission ceilings for VOC have been established.
Analysis under question E.1a, has shown that uptake of Stage II systems regulated under the VOC-II Directive has resulted in reductions of VOC emissions to the atmosphere, thus contributing to progress made in achieving the emission targets set at an international level.
However, as noted in section 2.2, it is difficult to isolate and determine the specific contribution of the VOC-II Directive to achieving these targets, mainly because VOC emissions result from a number of sources (e.g. solvent use) and are influenced by a wide range of causes (e.g. petrol consumption trends). In this sense, analysis under section 2.2 indicates that petrol storage and distribution have contributed to reductions of around to reductions of around 202 kt VOC since 1995, of which 86 kt (36%) corresponds to reductions in the activities controlled by the VOC-II Directive. On the other hand, emissions data reported to the EEA by Member States demonstrates that reductions in the road transport, solvents and commercial and institution combustion sectors have been much more significant in the same period of time (3,865 kt, 1,131 and 408 kt, respectively). These three sectors account for 43% of the total reductions achieved in the EU. Therefore, the regulation of other sources seems to have played a larger role in contributing to compliance with international targets.
In line with this, 22 responses to the consultation from both industry stakeholders and Member State authorities have expressed that the VOC-II Directive has only contributed “to some extent” to compliance with international obligations, with fewer (14) considering that the contribution has been large. This seems to reflect the relatively low weight of this sector compared to other sources of VOC emissions but could also be due to the fact that Stage II controls are not yet implemented in all service stations (since not all deadlines have elapsed). As such only one respondent indicated that the VOC II Directive contributed to no extent and this is because it is considered to not be fully implemented in its Member State (Portugal).
Moreover, these protocols also require use of best available techniques, including particular reference to Stage II controls. The Directive therefore contributes to implementation of such techniques across the EU and hence to meeting these international obligations. Further analysis on coherence-related aspects of international obligations is provided in section 5.4 (see questions C.1 and C.2).
� Has the Directive improved the functioning of the internal market? (E.1e)
Evaluation of Directive 1994/63/EC and Directive 2009/126/EC
Final interim: 2015 162
Prior to the adoption of the VOC II Directive, some Member States had already started to regulate the use of Stage II controls in service stations. This is the case for Austria, Belgium, Czech Republic, Denmark, France, Germany, Hungary, Italy, Latvia, Lithuania, Luxembourg, the Netherlands, Poland, Slovenia, Slovakia, Sweden and the UK. In addition, Estonia was considering adopting legislation on Stage II controls when the European legislation was introduced.
This situation led to the possibility of requirements and standards being set differently at national level. Member States were also opting for different PVR equipment, some of which were less efficient than what was then determined by the Directive (e.g. “passive” Stage II controls in place historically in some Member States). The adoption of the VOC-II Directive was therefore relevant to driving standardisation and achieving consistency across Member States’ approaches.
For 22 respondents, the VOC II Directive has to a large extent (6) or to some extent (16) improved the functioning of the European internal market. By harmonising the requirements for Stage II controls the Directive has avoided a situation where Stage II controls would be regulated by a multitude of national initiatives which could have created competitiveness issues and challenges for pan-European trading firms. However, the review of Member States’ practices (see Table 6.2) has shown that, for some, the national regulation transposing the requirements of the VOC-II Directive goes beyond its requirements. These divergences could explain why most respondents consider that the Directive has contributed only to some extent or even to no extent (11) to improved functioning of the internal market. In this regard, one industry stakeholder notes that it has marked “to some extent” because some countries were already following the regulatory approach implemented by Germany prior to the Directive as well as due to the fact that some countries still have occasional additional requirements (e.g. France has 90% hydrocarbon capture ratio in place of 85% at type approval stage, for some service stations).
In addition, an industry stakeholder notes that while a level playing field exists this has in effect allowed equipment manufacturers from those countries where legislation was previously in place (particularly Germany) to come to dominate the European market.
7.2.3 How has the Directive contributed to achieving the objective of
reducing VOC emissions? What was its impact? (E.2)
The aim of the VOC II Directive is to limit fugitive emissions of petrol vapours during refuelling in service stations. The Directive includes a defined emission reduction expectation for the equipment used (85% vapour capture efficiency) and provisions designed to ensure that the equipment is maintained in order to achieve this emission reduction level in practice.
The implementation of Stage II petrol recovery equipment in the Member States has required the capture of these fugitive emissions, that otherwise would have been emitted to the air. According to the respondents’ feedback, for 41 out of 46 respondents the installation of such equipment has contributed, at least to some extent, to reductions in VOC emissions in their territories.
However, the positive effects derived from the Directive concerning reduction of VOC emissions is most relevant for those Member States having no legislation on Stage II when the Directive was introduced. For those countries where legislation was already in place and most stations were already equipped with Stage II controls, the effect on VOC reductions is considered negligible. In fact for some Member States, transposition of the Directive might actually lead to lower control of VOC emissions (in theory, if not in practice). For instance, in Sweden the VOC-II Directive has led to the introduction
Evaluation of Directive 1994/63/EC and Directive 2009/126/EC
Final interim: 2015 163
of threshold limits for small stations, whereas before Stage II systems were mandatory for all stations.
7.2.4 What main factors have contributed to or stood in the way of achieving
these objectives? How are these factors addressed by the Directive?
(E.3)
The factors identified are classified into four broad categories, as follows:
� Technical (with reference to the equipment and approaches used);
� Financial (primarily budget availability);
� Political (in terms of implementation); and
� External (such as high petrol prices, warm climates and pressure from consumers, among others).
It is noted that the analysis for this question has relied heavily on feedback received via consultation. In this sense, the aim was to assess the main successes or problems encountered by those affected by the Directive. Published literature analysing the Directive from this point of view is limited.
Technical factors
According to 7 respondents, the well-established nature of the legislation has contributed to the success of the Directive, particularly as Stage II requirements were already established in the respective Member States before the Directive was adopted at EU level (industry representatives in AT and the UK – and authorities in HU, LT and SE). Authorities and industry stakeholders in Sweden further note that this has meant VOC II technologies are now readily available which has further contributed to the success of the Directive.
On the other hand, according to 8 industry stakeholders some technical issues have stood in the way of achieving the Directive’s objectives – as outlined below:
• Effectiveness of the Stage II equipment is below expectations (industry stakeholder from ES and BG authority). Similarly the authority from Malta notes that there is a lack of confidence among service station operators that the Stage II requirements can effectively reduce ambient VOC emissions.
• Equipment requires high monitoring and controls to avoid malfunctioning and ensure it delivers the Directive’s objectives (industry stakeholder from IENL).
• In some cases, the need to use certified contractors to install the equipment presented a barrier to achieving the Directive’s objectives – where demand was greater than supply driving costs up (as noted by industry respondents from FR, SE). In this regard inconsistencies in the fees charged by certified contractors has been highlighted as a barrier by the authority from Ireland.
• Low levels of knowledge with respect to Stage II equipment among the competent authorities along with a lack of resources was also voiced as a barrier by an industry stakeholder from Bulgaria. However, this barrier is more related to national implementation rather than to the Directive itself.
Financial factors
The capital and maintenance investment needs are regarded by 10 consultation respondents as a barrier to achieving the Directive’s objectives, although 3 of the stakeholders report that the timeframe within which the Directive operates has allowed sufficient time for operators to overcome this barrier.
Evaluation of Directive 1994/63/EC and Directive 2009/126/EC
Final interim: 2015 164
The large capital investment required to install Stage II equipment is viewed as a difficulty for 11 respondents (industry representatives in AT, ES, FR, NL, PT as well as authorities in LV and PT), along with the ongoing costs of inspections and human resources (or lack thereof as referred to by authorities in BG, IE, LT, LV, MT, RO and SE). According to a French industry representative, the capital investment needed to install Stage II equipment has affected the smaller operators more than larger ones as the smaller operators were obliged to pass on the costs to the consumer whereas the larger ones were not and so there is a noticeable difference between their prices. Furthermore, the same respondent notes that many of the systems installed are not well maintained in France because operators cannot afford the costs.
In contrast, 3 stakeholders reported that the early adoption of VOC II controls made it easier for businesses to plan their investments within a reasonable timeframe (according to industry representatives in AT, UK - and authorities in NL).
Political factors
One success factor that was raised by 5 stakeholders is good cooperation between the authorities and operators. However, relatively limited comments were otherwise made concerning implementation of the Directive, and issues raised are typically specific to the Member State in question and few commonalities have been identified. Nonetheless the comments that were made provide a useful insight into implementation in specific Member States and a summary is provided here.
Good cooperation between the authorities and operators is identified as a success factor by industry representatives in BG, DE and DK as well as authorities in CY and DK. Other success factors identified include:
• One industry representative in Austria specifies that the fact that the authority responsible for the implementation of the Directive had a good level of knowledge contributed to the success of the Directive.
• The inspection process is well implemented and facilitates the proper functioning of the equipment (German industry representative).
• According to the Dutch authorities, the political willingness to implement environmental policies more generally is thought to have had positive implications for the implementation of the Directive.
In France, the deadline to implement the national regulation was considered to be too fast for operators to be able to comply with it according to one industry stakeholder. Furthermore, the implementation of the Directive in administrative terms is reported to have led to difficulties in certain cases where different government departments/agencies are responsible for different aspects of the national legislation, creating difficulties in monitoring (according to authorities in SE and LT). Similarly, authorities in Ireland note that the Directive is not enforced consistently throughout the different counties.
External factors
6 external factors pertaining to the success of the Directive were identified by 15 consultation stakeholders, compared to 2 barriers (by 2 respondents).
One success factor is the economic incentive to operators provided by VOC II technologies through petrol savings (referred to by authorities in CY, HU, MT and NL, along with industry stakeholders from SE – a total of 4 stakeholders). Equally, savings made through tax rebates, where available, is referred to as a success factor by authorities in DK and industry respondents in DE, DK and NL (a total of 5 stakeholders).
Evaluation of Directive 1994/63/EC and Directive 2009/126/EC
Final interim: 2015 165
Furthermore, 5 responses highlight the fact that retrofitting the stations with Stage II controls involved no discernible or visible changes in process or equipment for consumers, who have remained unaware of the change, avoiding the need to train consumers and undertake extensive customer Q&A processes (industry representatives in AT, DE, NL and UK). According to 2 industry stakeholders though, the low awareness of the general public is a barrier (NL and SE); for example it is viewed as an issue for achieving the Directive’s objectives in the Netherlands where compliance has led to greater petrol prices resulting in reduced acceptance by the general public, though no quantitative figures on the extent of such impact have been provided.
Other success factors identified through the consultation include:
� Warm climate, resulting in greater petrol recovery (authorities in CY)
� The general willingness of operators to comply (industry in CZ)
� Reduced fire risk giving operators an additional incentive to comply (industry in DE, NL, UK)
Although particular to Malta, the second barrier noted relates to difficulties implementing Stage II requirements where Stage I requirements have not been fully implemented. No road tankers in Malta are equipped to recover petrol vapours and so no service stations are inclined to install Stage II equipment.
7.2.5 How has the Directive contributed to achieving a common approach
within the EU towards VOC? (E.4)
The adoption of the VOC-II Directive has driven standardisation and achieved a consistency in Member States’ approaches. Specifically, it requires broadly the same types of abatement techniques to be applied at service stations across the EU. Furthermore, standards for type approval of vapour capture efficiency and for in-situ performance (in the 2014 update to the Directive) are expected to make the approach to VOC controls more consistent.
By harmonising the requirements for Stage II controls the Directive has avoided a situation where Stage II controls would be regulated by a multitude of national initiatives which could have created competitiveness issues and challenges for pan-European trading firms.
Respondents to the survey confirmed that the main added value of the VOC-II Directive is to harmonise the approach to VOC emissions reductions across Europe (out of 49 responses, 44 indicated that the VOC-II Directive contributed to a large or some extent to this) and the harmonisation of standards and techniques (out of 49 responses 35 indicated that the VOC-II Directive contributed to a large or some extent to this). In this sense, the VOC-II Directive has led to the development of the European Standard EN 16321:2013.
7.2.6 To what extent was the choice of management method appropriate for
maximising the impacts achieved? (E.5)
Although Member States have a degree of flexibility provided to them in the way they chose to implement the Directive, the abatement approach prescribed by the Directive does limit the technologies that can be used to Stage II PVR equipment. Generally, consultation stakeholders find the use of a directive to regulate Stage II PVR to be appropriate (according to 24 respondents), and while 13 regard the prescriptions as also appropriate and up to date, some concerns are raised that the provisions are too prescriptive and that this may prevent new technologies from being adopted at a later date (as raised by 6 respondents).
Evaluation of Directive 1994/63/EC and Directive 2009/126/EC
Final interim: 2015 166
The legislative approach (meaning the use of a directive) is generally regarded as appropriate by consultation respondents (including industry stakeholders from BG, CZ, ES, NL and UK as well as authorities in AT, BE, BG, CY, DE, EE, HU, LT, LV, MT, PT, RO). An EU trade association that responded to the consultation also notes that having an EU-wide binding legal instrument ensures consistency between Member States and makes things easier for industry bodies operating between countries. Although this view was not shared by the Dutch authority (despite nonetheless recognising that the Directive is a driver for an internal EU market).
On the other hand a few consultation stakeholders raised concerns that the legislative approach taken (i.e. Directive versus Regulation) can cause possible confusion with regard to the transposition of the technical requirements into national legislation (according to industry stakeholders in IE and authorities in HR and the UK). An additional comment was made by the Irish authorities pertaining to the lack of guidance and equipment testing accompanying the Directive.
Lastly, one industry stakeholder from the UK disagrees with the legislative approach but does not provide any detail as to why.
The level of prescription is regarded as appropriate by 17 consultation respondents (including industry representatives in FR, IE, UK, an EU trade association - and authorities in AT, BE, BG, CY, EE, HR, HU, IE, LT, LV, NL, PT and RO). However, a few issues were raised by respondents, including:
� According to one German industry representative, monitoring is more effective when automatic systems are used, and it maintains that the Directive should be amended to include provisions requiring Member States to enforce automatic monitoring systems for Stage II equipment. It refers to findings from multiple studies in Germany that only ~40% of the PVR systems worked to the efficiency rate claimed by the manufacturers and the limit stipulated in the Directive. Subsequently, in 2002, amendments were made to the national legislation requiring the installation of automatic monitoring systems to Stage II equipment and that the dispenser be switched off when the limit is not met.
� The level of prescription limits the potential to adopt less expensive, more efficient VOC reduction technologies (according to industry representatives in DE, IE and UK and an EU trade association along with authorities in IE). The Irish authorities do also note that they do not view the technical provisions as out of date at the time of reporting.
� 3 authorities find that a definition for “major refurbishment” is needed in the Directive (IE, HU and HR).
� According to a Spanish industry representative, more detail in the technical provisions is needed. Another industry representative, commenting about Stage II technologies used more broadly across the EU, noted that some aspects of Stage II equipment are unreliable and should be regulated at an EU level to prevent usage. The example given refers to the use of “orifice plates” which in their view compromise the overall efficiency of the system (in this regard see section 4.3.4).
� Difficulties complying with the CEN standards were noted by authorities in Sweden and the UK although no further details are provided.
7.2.7 Are there any technical or other developments since the deployment of
the directives that could contribute to achieving the objective more
effectively or efficiently? (E.7)
A number of potential unintended consequences arising from the Directive have been identified. Stakeholders were requested to provide their opinion on each of these as listed below (and shown in Figure 21):
Evaluation of Directive 1994/63/EC and Directive 2009/126/EC
Final interim: 2015 167
� Increased awareness of workers/citizens
� Encouragement of innovation in the relevant VOC II technologies
� Improved global competition among EU companies
� Emergence of related polices/policy developments
� Relocation of service stations,
� Trade, and
� Lack of tighter controls, despite technology being available
Across the 61 responses collated through the consultation, more positive unexpected consequences were identified by stakeholder respondents compared to negative ones – particularly in relation to the encouragement of innovation in the relevant Stage II technologies, awareness of workers/ citizens and policy developments in related areas. In relation to the other changes, often an equal number of stakeholders have responded positively as those responding negatively and so it is difficult to ascertain a conclusive understanding of the impacts, particularly as little to no detail is provided.
Very few responses distinguish between VOC I and VOC II technologies and as a result the summary of consultation responses provided for the VOC-I Directive is also applicable here (please refer to Section 5.2.7 for the detail). The differences between the unintended impacts are as follows:
� Increased awareness of workers/citizens – no difference.
� The encouragement of innovation in the relevant VOC II technologies – slightly fewer positive responses (31 rather than 34 – due to industry representatives (BE, ES, FR) that only responded in relation VOC I technologies). The number of negative responses is the same for both.
� Global competition – no difference in the overall opinion given.
� Policy developments – no difference.
� The relocation of service stations – no difference.
� Trade – no difference.
� Weaker control systems where uptake has been hindered despite technology being available – no difference.
The additional outcome raised by an Irish industry stakeholder concerning the positive impact on improved safety (e.g. related to fire/explosion protection) and awareness of hazards/risks resulting from the Directive is also applicable to Stage II equipment.
7.2.8 Are there any technical or other developments since the deployment of
the directives that could contribute to achieving the objective more
effectively or efficiently? (E.7)
The Impact Assessment prepared for the VOC-II Directive (EC, 2008) identified three possible controls to reduce VOC emissions during refuelling. Two of them were introduced in the VOC-II Directive (‘conventional’ active systems and ‘at pump’ systems) and are installed at service stations.
Conventional systems are the most commonly applied nowadays. These return petrol vapour initially to the underground storage tank and then to the refinery or terminal to be resold. The station has to be equipped with Stage IB controls for the system to be
Evaluation of Directive 1994/63/EC and Directive 2009/126/EC
Final interim: 2015 168
efficient. At pump systems collect vapour displaced from the vehicle tank and then condense and deliver these back to the vehicle as part of the petrol purchase. These two controls are considered to be technically suitable according to the feedback received but the uptake of the “at pump” system has been lower than initially envisaged. These “at pump” systems affect the cost-effectiveness of the controls (through the value of recovered petrol for the service operator) and also reduce vapours returned to underground tanks, thus reducing the risk of excessive pressure built-up. Two stakeholders from the UK noted that the equipment is costly for the average retailer and as such limits the benefits from the implementation of the VOC-II Directive.
The third possibility identified by EC (2008) was onboard refuelling vapour recovery (ORVR). This system is placed on vehicles and consists of a canister with activated carbon that absorbs petrol vapour displaced during refuelling. The fuel recovered is then combusted in the engine. As outlined in section 2.4, the system was introduced in the USA in 1998, but was not taken up as part of the VOC-II Directive. The main reasons behind this decision were the time between the adoption of the measures and the delivery of the benefits (ORVR can only be applied to new vehicles and the Commission estimated that 15 years were necessary for vehicle fleet renewal) as well as estimates of lower cost-effectiveness and performance compared to Stage II controls at service stations. Moreover, it is relevant to note that at the time of implementation of the Directive, most Member States already required the application of Stage II systems. However, according to the feedback received in the consultation by several stakeholders this technique is now mature and has provided positive results in the USA and Canada (see Section 2.4 for more details). Stakeholders from Germany, Finland and the UK (five respondents) see ORVR systems as very efficient, allowing consumers to retain the fuel and its vapour that they have purchased. An industry stakeholder from Portugal added that this technique has the potential for being more cost effective than Stage II in service stations. Another industry stakeholder added that these systems should be considered in case of revision of the Directive.
In relation to this, it should be noted that the consideration of ORVR is outside the scope of VOC-II Directive (and hence of the present study) which only addresses the station’s equipment and not the vehicle itself. If implemented, the ORVR would fall under the scope of the vehicle type approval legislation (Euro standards), though there would have to consider the VOC-II Directive. This discussed in detail in a report by the JRC (2012) on the control of vehicle evaporative emissions which recommends a detailed analysis of technical feasibility, performance and costs of introducing ORVR in the EU, taking into consideration the current legislative context and the level of implementation of Stage II systems.
In view that around 72% of stations have already installed Stage II controls (as noted in section 6.2.2), such assessment would need to consider one of the following options: a) Introduction of ORVR and Stage II retention, assessing potential compatibility problems, b) Introduction of ORVR and Stage II discontinuation, c) Non-introduction of ORVR.
7.3 Efficiency
7.3.1 Overview
Following the same approach as for the VOC-I Directive as described under section 5.3 the subsequent sections provide preliminary findings on the evaluation of efficiency, which has been structured around the responses to seven principal questions and along several sub-questions.
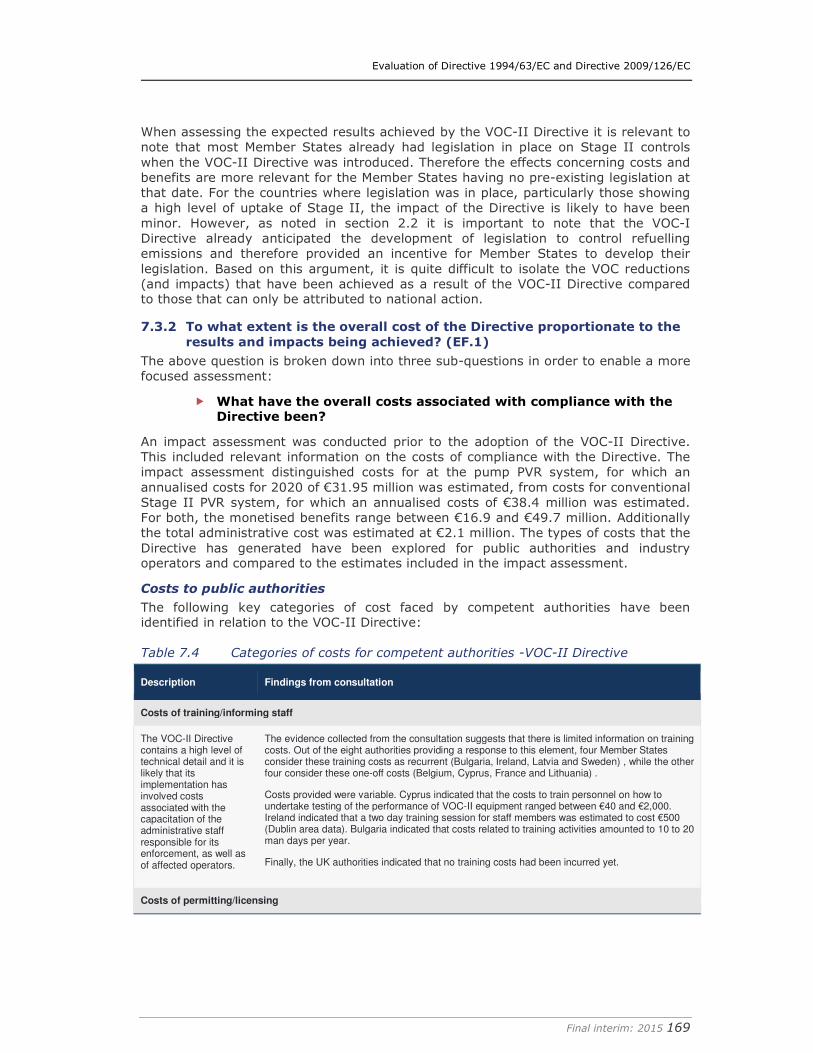
Evaluation of Directive 1994/63/EC and Directive 2009/126/EC
Final interim: 2015 169
When assessing the expected results achieved by the VOC-II Directive it is relevant to note that most Member States already had legislation in place on Stage II controls when the VOC-II Directive was introduced. Therefore the effects concerning costs and benefits are more relevant for the Member States having no pre-existing legislation at that date. For the countries where legislation was in place, particularly those showing a high level of uptake of Stage II, the impact of the Directive is likely to have been minor. However, as noted in section 2.2 it is important to note that the VOC-I Directive already anticipated the development of legislation to control refuelling emissions and therefore provided an incentive for Member States to develop their legislation. Based on this argument, it is quite difficult to isolate the VOC reductions (and impacts) that have been achieved as a result of the VOC-II Directive compared to those that can only be attributed to national action.
7.3.2 To what extent is the overall cost of the Directive proportionate to the
results and impacts being achieved? (EF.1)
The above question is broken down into three sub-questions in order to enable a more focused assessment:
� What have the overall costs associated with compliance with the Directive been?
An impact assessment was conducted prior to the adoption of the VOC-II Directive. This included relevant information on the costs of compliance with the Directive. The impact assessment distinguished costs for at the pump PVR system, for which an annualised costs for 2020 of €31.95 million was estimated, from costs for conventional Stage II PVR system, for which an annualised costs of €38.4 million was estimated. For both, the monetised benefits range between €16.9 and €49.7 million. Additionally the total administrative cost was estimated at €2.1 million. The types of costs that the Directive has generated have been explored for public authorities and industry operators and compared to the estimates included in the impact assessment.
Costs to public authorities
The following key categories of cost faced by competent authorities have been identified in relation to the VOC-II Directive:
Table 7.4 Categories of costs for competent authorities -VOC-II Directive
Description Findings from consultation
Costs of training/informing staff
The VOC-II Directive contains a high level of technical detail and it is likely that its implementation has involved costs associated with the capacitation of the administrative staff responsible for its enforcement, as well as of affected operators.
The evidence collected from the consultation suggests that there is limited information on training costs. Out of the eight authorities providing a response to this element, four Member States consider these training costs as recurrent (Bulgaria, Ireland, Latvia and Sweden) , while the other four consider these one-off costs (Belgium, Cyprus, France and Lithuania) .
Costs provided were variable. Cyprus indicated that the costs to train personnel on how to undertake testing of the performance of VOC-II equipment ranged between €40 and €2,000. Ireland indicated that a two day training session for staff members was estimated to cost €500 (Dublin area data). Bulgaria indicated that costs related to training activities amounted to 10 to 20 man days per year.
Finally, the UK authorities indicated that no training costs had been incurred yet.
Costs of permitting/licensing
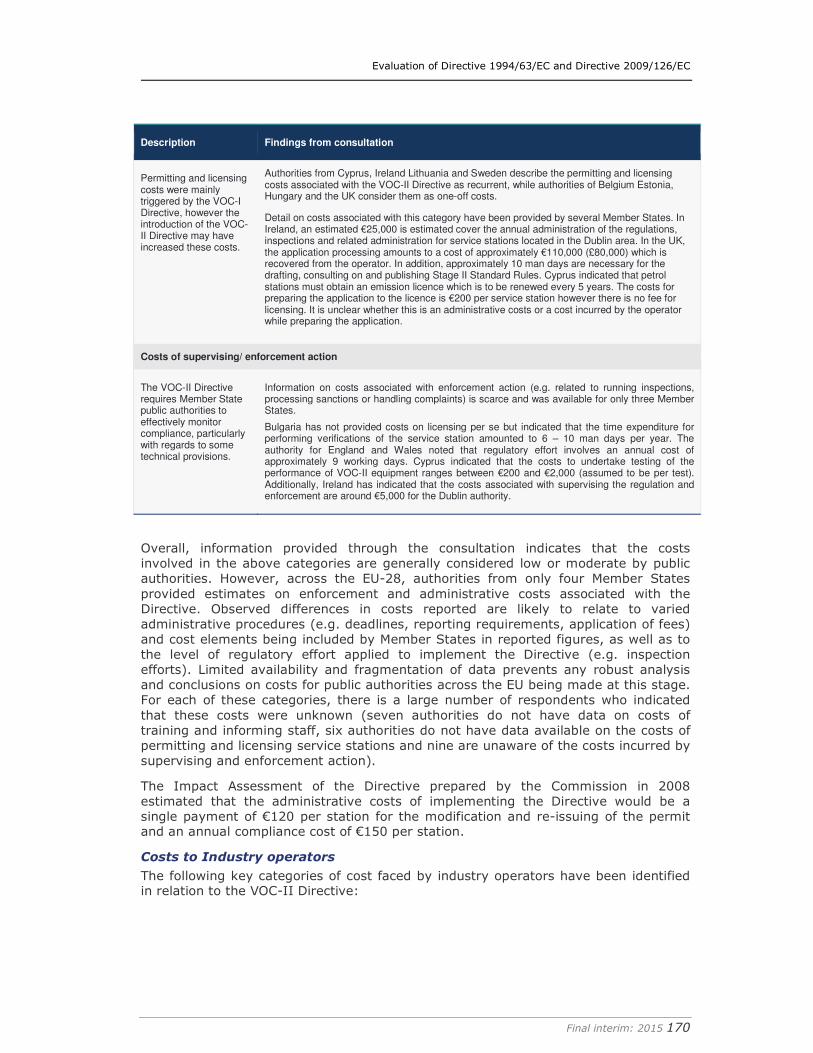
Evaluation of Directive 1994/63/EC and Directive 2009/126/EC
Final interim: 2015 170
Description Findings from consultation
Permitting and licensing costs were mainly triggered by the VOC-I Directive, however the introduction of the VOC-II Directive may have increased these costs.
Authorities from Cyprus, Ireland Lithuania and Sweden describe the permitting and licensing costs associated with the VOC-II Directive as recurrent, while authorities of Belgium Estonia, Hungary and the UK consider them as one-off costs.
Detail on costs associated with this category have been provided by several Member States. In Ireland, an estimated €25,000 is estimated cover the annual administration of the regulations, inspections and related administration for service stations located in the Dublin area. In the UK, the application processing amounts to a cost of approximately €110,000 (£80,000) which is recovered from the operator. In addition, approximately 10 man days are necessary for the drafting, consulting on and publishing Stage II Standard Rules. Cyprus indicated that petrol stations must obtain an emission licence which is to be renewed every 5 years. The costs for preparing the application to the licence is €200 per service station however there is no fee for licensing. It is unclear whether this is an administrative costs or a cost incurred by the operator while preparing the application.
Costs of supervising/ enforcement action
The VOC-II Directive requires Member State public authorities to effectively monitor compliance, particularly with regards to some technical provisions.
Information on costs associated with enforcement action (e.g. related to running inspections, processing sanctions or handling complaints) is scarce and was available for only three Member States.
Bulgaria has not provided costs on licensing per se but indicated that the time expenditure for performing verifications of the service station amounted to 6 – 10 man days per year. The authority for England and Wales noted that regulatory effort involves an annual cost of approximately 9 working days. Cyprus indicated that the costs to undertake testing of the performance of VOC-II equipment ranges between €200 and €2,000 (assumed to be per test). Additionally, Ireland has indicated that the costs associated with supervising the regulation and enforcement are around €5,000 for the Dublin authority.
Overall, information provided through the consultation indicates that the costs involved in the above categories are generally considered low or moderate by public authorities. However, across the EU-28, authorities from only four Member States provided estimates on enforcement and administrative costs associated with the Directive. Observed differences in costs reported are likely to relate to varied administrative procedures (e.g. deadlines, reporting requirements, application of fees) and cost elements being included by Member States in reported figures, as well as to the level of regulatory effort applied to implement the Directive (e.g. inspection efforts). Limited availability and fragmentation of data prevents any robust analysis and conclusions on costs for public authorities across the EU being made at this stage. For each of these categories, there is a large number of respondents who indicated that these costs were unknown (seven authorities do not have data on costs of training and informing staff, six authorities do not have data available on the costs of permitting and licensing service stations and nine are unaware of the costs incurred by supervising and enforcement action).
The Impact Assessment of the Directive prepared by the Commission in 2008 estimated that the administrative costs of implementing the Directive would be a single payment of €120 per station for the modification and re-issuing of the permit and an annual compliance cost of €150 per station.
Costs to Industry operators
The following key categories of cost faced by industry operators have been identified in relation to the VOC-II Directive:
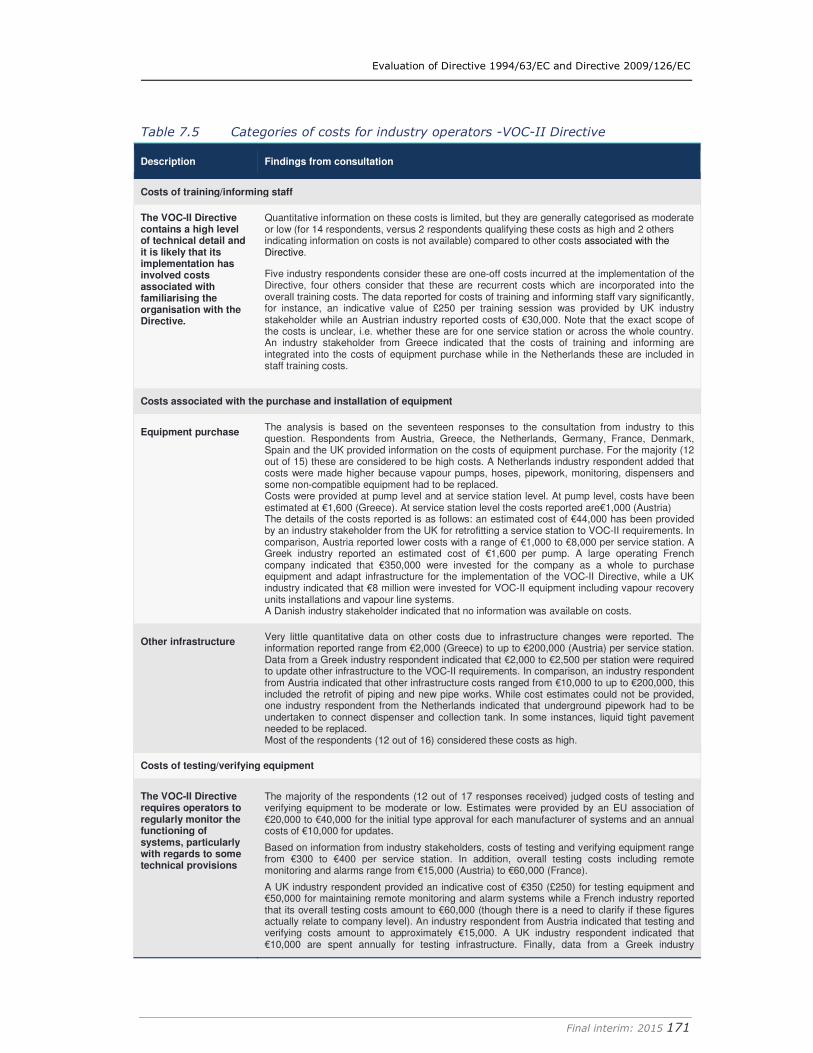
Evaluation of Directive 1994/63/EC and Directive 2009/126/EC
Final interim: 2015 171
Table 7.5 Categories of costs for industry operators -VOC-II Directive
Description Findings from consultation
Costs of training/informing staff
The VOC-II Directive contains a high level of technical detail and it is likely that its implementation has involved costs associated with familiarising the organisation with the Directive.
Quantitative information on these costs is limited, but they are generally categorised as moderate or low (for 14 respondents, versus 2 respondents qualifying these costs as high and 2 others indicating information on costs is not available) compared to other costs associated with the Directive.
Five industry respondents consider these are one-off costs incurred at the implementation of the Directive, four others consider that these are recurrent costs which are incorporated into the overall training costs. The data reported for costs of training and informing staff vary significantly, for instance, an indicative value of £250 per training session was provided by UK industry stakeholder while an Austrian industry reported costs of €30,000. Note that the exact scope of the costs is unclear, i.e. whether these are for one service station or across the whole country. An industry stakeholder from Greece indicated that the costs of training and informing are integrated into the costs of equipment purchase while in the Netherlands these are included in staff training costs.
Costs associated with the purchase and installation of equipment
Equipment purchase The analysis is based on the seventeen responses to the consultation from industry to this question. Respondents from Austria, Greece, the Netherlands, Germany, France, Denmark, Spain and the UK provided information on the costs of equipment purchase. For the majority (12 out of 15) these are considered to be high costs. A Netherlands industry respondent added that costs were made higher because vapour pumps, hoses, pipework, monitoring, dispensers and some non-compatible equipment had to be replaced. Costs were provided at pump level and at service station level. At pump level, costs have been estimated at €1,600 (Greece). At service station level the costs reported are€1,000 (Austria) The details of the costs reported is as follows: an estimated cost of €44,000 has been provided by an industry stakeholder from the UK for retrofitting a service station to VOC-II requirements. In comparison, Austria reported lower costs with a range of €1,000 to €8,000 per service station. A Greek industry reported an estimated cost of €1,600 per pump. A large operating French company indicated that €350,000 were invested for the company as a whole to purchase equipment and adapt infrastructure for the implementation of the VOC-II Directive, while a UK industry indicated that €8 million were invested for VOC-II equipment including vapour recovery units installations and vapour line systems. A Danish industry stakeholder indicated that no information was available on costs.
Other infrastructure Very little quantitative data on other costs due to infrastructure changes were reported. The information reported range from €2,000 (Greece) to up to €200,000 (Austria) per service station. Data from a Greek industry respondent indicated that €2,000 to €2,500 per station were required to update other infrastructure to the VOC-II requirements. In comparison, an industry respondent from Austria indicated that other infrastructure costs ranged from €10,000 to up to €200,000, this included the retrofit of piping and new pipe works. While cost estimates could not be provided, one industry respondent from the Netherlands indicated that underground pipework had to be undertaken to connect dispenser and collection tank. In some instances, liquid tight pavement needed to be replaced. Most of the respondents (12 out of 16) considered these costs as high.
Costs of testing/verifying equipment
The VOC-II Directive requires operators to regularly monitor the functioning of systems, particularly with regards to some technical provisions
The majority of the respondents (12 out of 17 responses received) judged costs of testing and verifying equipment to be moderate or low. Estimates were provided by an EU association of €20,000 to €40,000 for the initial type approval for each manufacturer of systems and an annual costs of €10,000 for updates.
Based on information from industry stakeholders, costs of testing and verifying equipment range from €300 to €400 per service station. In addition, overall testing costs including remote monitoring and alarms range from €15,000 (Austria) to €60,000 (France).
A UK industry respondent provided an indicative cost of €350 (£250) for testing equipment and €50,000 for maintaining remote monitoring and alarm systems while a French industry reported that its overall testing costs amount to €60,000 (though there is a need to clarify if these figures actually relate to company level). An industry respondent from Austria indicated that testing and verifying costs amount to approximately €15,000. A UK industry respondent indicated that €10,000 are spent annually for testing infrastructure. Finally, data from a Greek industry
Evaluation of Directive 1994/63/EC and Directive 2009/126/EC
Final interim: 2015 172
Description Findings from consultation
indicated that testing and verifying equipment requires €300-€400 per service station.
Automatic monitoring Opinions on the costs of automatic monitoring are considered to be mostly moderate or low (7 respondents vs 4 respondents indicating these are high).
One UK industry indicated that £200 per annum are paid in contract fees, while another indicated that €200,000 are paid for maintenance contracts and running costs of automatic monitoring. Finally, an industry stakeholder from Austria indicated that these costs range from €45,000 to €100,000 per service station.
Apart from these data, little information was available on the costs of automatic monitoring, with industries in Greece, France and Denmark responding not being aware of the costs from automatic monitoring.
Maintenance and power costs
Recurring costs associated with the operation of the PVR equipment
Very little information was available on costs associated with the maintenance and power costs. Out of the 16 respondents, 11 indicated that these were moderate or low costs, 2 that these were high and 3 had no information on these costs. A French industry stakeholder indicated that its company estimated a cost of €60,000 for monitoring and testing included maintenance and power costs.
Costs were provided per service station by two respondents: a Greek industry indicated that €60 per station are spent on maintenance and power costs while an Austrian industry representative reported that between €1,500 and up to €6,000 are spent every each per station for maintenance.
Costs of reporting on performance/ compliance (to Member State regulatory authorities)
As described in the summaries on implementation (see Appendix D), several authorities impose reporting and other periodic obligations on operators to track compliance with the Directive.
There is limited information available on administrative costs associated with the provision of information to authorities or the continued operation of sites (e.g. regulatory certificate and compliance approval). Out of the 16 responses provided to this question, 11 consider that the costs of reporting on performance and compliance are low or moderate.
Costs data were reported only by one respondent from the UK, who notes that these are rolled into permitting costs and amount to €560 annually.
The installation of Stage II controls at service stations appears to be the most costly part of the implementation of the VOC-II Directive, although this will depend on the size of the service station and the extent of other work to be undertaken (e.g. pipe work). As a result of this, the cost estimations obtained from the consultation are diverse and often not comparable. For instance, Austria has reported equipment costs between €1,000 and €8,000 per station, whereas an industry stakeholder from the UK has reported costs that are five times higher.
In comparison, the costs included in the Impact Assessment conducted prior to the adoption of the VOC-II Directive are presented in the Table below.
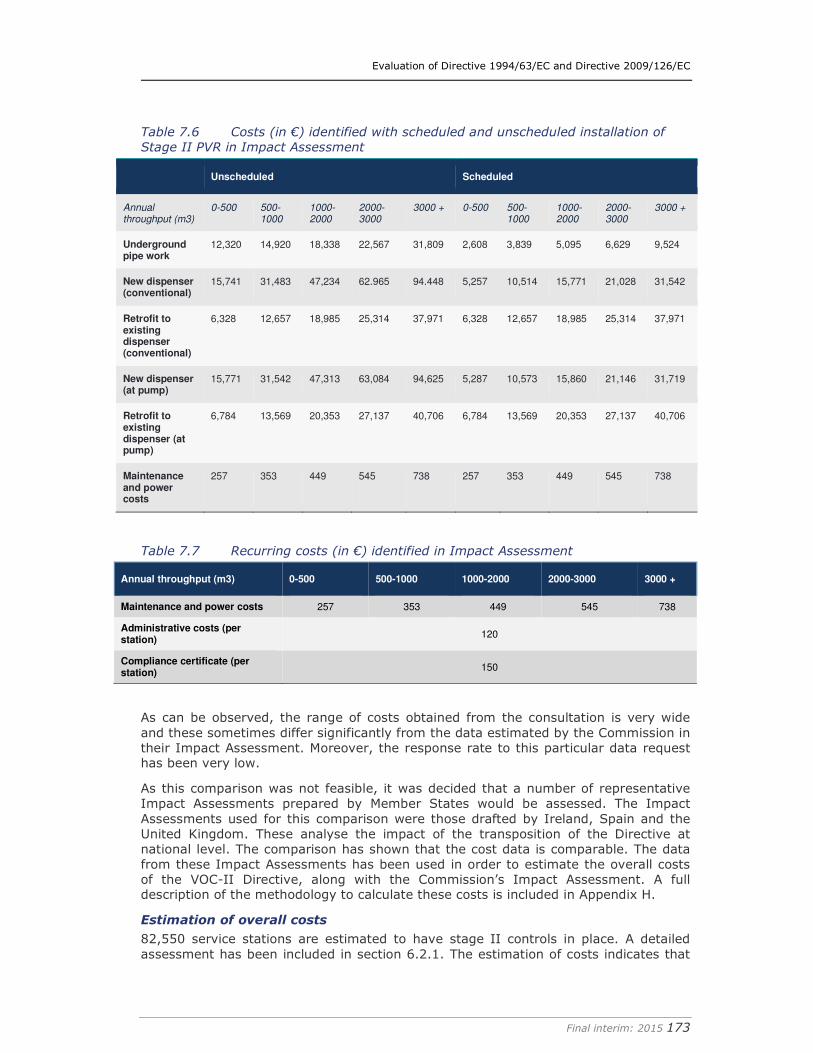
Evaluation of Directive 1994/63/EC and Directive 2009/126/EC
Final interim: 2015 173
Table 7.6 Costs (in €) identified with scheduled and unscheduled installation of
Stage II PVR in Impact Assessment
Unscheduled Scheduled
Annual throughput (m3)
0-500 500-1000
1000-2000
2000-3000
3000 + 0-500 500-1000
1000-2000
2000-3000
3000 +
Underground pipe work
12,320 14,920 18,338 22,567 31,809 2,608 3,839 5,095 6,629 9,524
New dispenser (conventional)
15,741 31,483 47,234 62.965 94.448 5,257 10,514 15,771 21,028 31,542
Retrofit to existing dispenser (conventional)
6,328 12,657 18,985 25,314 37,971 6,328 12,657 18,985 25,314 37,971
New dispenser (at pump)
15,771 31,542 47,313 63,084 94,625 5,287 10,573 15,860 21,146 31,719
Retrofit to existing dispenser (at pump)
6,784 13,569 20,353 27,137 40,706 6,784 13,569 20,353 27,137 40,706
Maintenance and power costs
257 353 449 545 738 257 353 449 545 738
Table 7.7 Recurring costs (in €) identified in Impact Assessment
Annual throughput (m3) 0-500 500-1000 1000-2000 2000-3000 3000 +
Maintenance and power costs 257 353 449 545 738
Administrative costs (per station)
120
Compliance certificate (per station)
150
As can be observed, the range of costs obtained from the consultation is very wide and these sometimes differ significantly from the data estimated by the Commission in their Impact Assessment. Moreover, the response rate to this particular data request has been very low.
As this comparison was not feasible, it was decided that a number of representative Impact Assessments prepared by Member States would be assessed. The Impact Assessments used for this comparison were those drafted by Ireland, Spain and the United Kingdom. These analyse the impact of the transposition of the Directive at national level. The comparison has shown that the cost data is comparable. The data from these Impact Assessments has been used in order to estimate the overall costs of the VOC-II Directive, along with the Commission’s Impact Assessment. A full description of the methodology to calculate these costs is included in Appendix H.
Estimation of overall costs
82,550 service stations are estimated to have stage II controls in place. A detailed assessment has been included in section 6.2.1. The estimation of costs indicates that
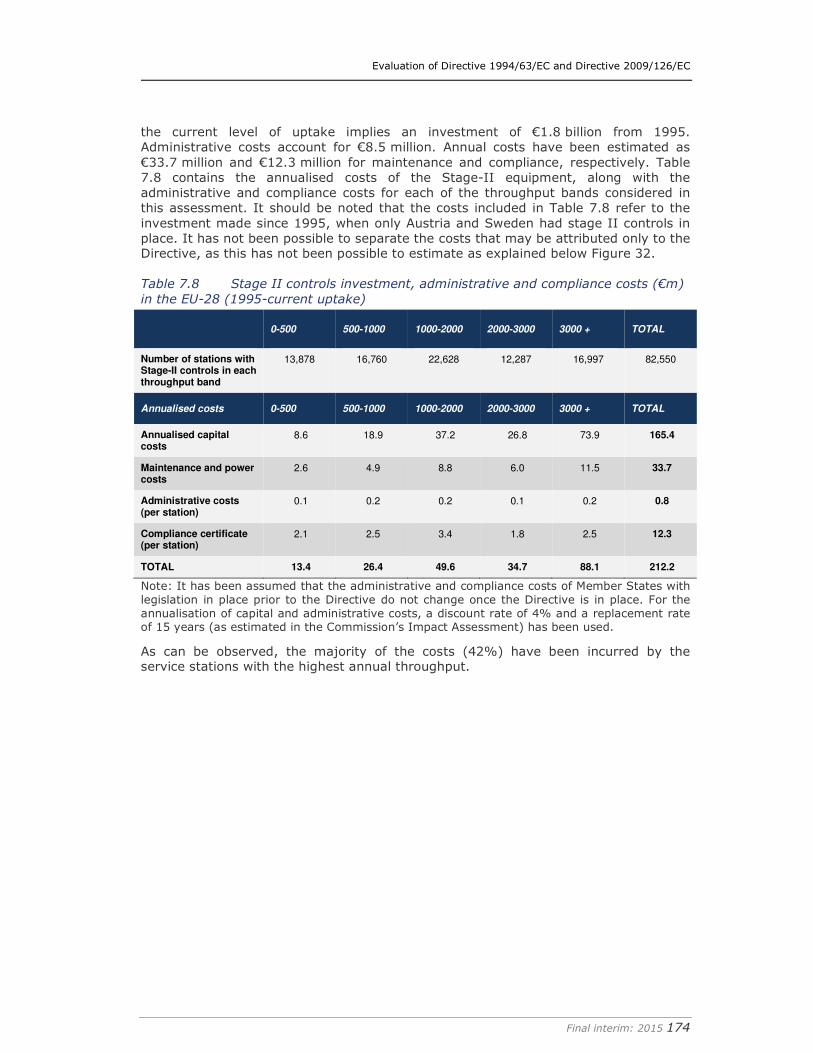
Evaluation of Directive 1994/63/EC and Directive 2009/126/EC
Final interim: 2015 174
the current level of uptake implies an investment of €1.8 billion from 1995. Administrative costs account for €8.5 million. Annual costs have been estimated as €33.7 million and €12.3 million for maintenance and compliance, respectively. Table 7.8 contains the annualised costs of the Stage-II equipment, along with the administrative and compliance costs for each of the throughput bands considered in this assessment. It should be noted that the costs included in Table 7.8 refer to the investment made since 1995, when only Austria and Sweden had stage II controls in place. It has not been possible to separate the costs that may be attributed only to the Directive, as this has not been possible to estimate as explained below Figure 32.
Table 7.8 Stage II controls investment, administrative and compliance costs (€m)
in the EU-28 (1995-current uptake)
0-500 500-1000 1000-2000 2000-3000 3000 + TOTAL
Number of stations with Stage-II controls in each throughput band
13,878 16,760 22,628 12,287 16,997 82,550
Annualised costs 0-500 500-1000 1000-2000 2000-3000 3000 + TOTAL
Annualised capital costs
8.6 18.9 37.2 26.8 73.9 165.4
Maintenance and power costs
2.6 4.9 8.8 6.0 11.5 33.7
Administrative costs (per station)
0.1 0.2 0.2 0.1 0.2 0.8
Compliance certificate (per station)
2.1 2.5 3.4 1.8 2.5 12.3
TOTAL 13.4 26.4 49.6 34.7 88.1 212.2
Note: It has been assumed that the administrative and compliance costs of Member States with legislation in place prior to the Directive do not change once the Directive is in place. For the annualisation of capital and administrative costs, a discount rate of 4% and a replacement rate of 15 years (as estimated in the Commission’s Impact Assessment) has been used.
As can be observed, the majority of the costs (42%) have been incurred by the service stations with the highest annual throughput.
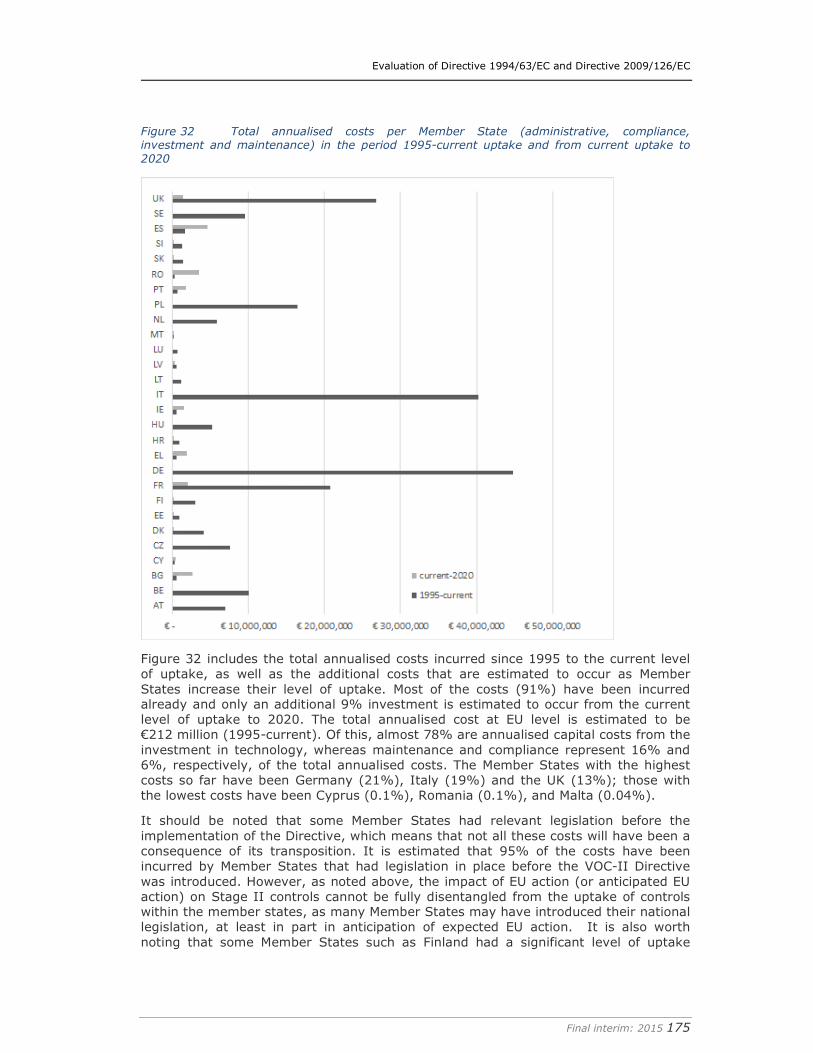
Evaluation of Directive 1994/63/EC and Directive 2009/126/EC
Final interim: 2015 175
Figure 32 Total annualised costs per Member State (administrative, compliance, investment and maintenance) in the period 1995-current uptake and from current uptake to
2020
Figure 32 includes the total annualised costs incurred since 1995 to the current level of uptake, as well as the additional costs that are estimated to occur as Member States increase their level of uptake. Most of the costs (91%) have been incurred already and only an additional 9% investment is estimated to occur from the current level of uptake to 2020. The total annualised cost at EU level is estimated to be €212 million (1995-current). Of this, almost 78% are annualised capital costs from the investment in technology, whereas maintenance and compliance represent 16% and 6%, respectively, of the total annualised costs. The Member States with the highest costs so far have been Germany (21%), Italy (19%) and the UK (13%); those with the lowest costs have been Cyprus (0.1%), Romania (0.1%), and Malta (0.04%).
It should be noted that some Member States had relevant legislation before the implementation of the Directive, which means that not all these costs will have been a consequence of its transposition. It is estimated that 95% of the costs have been incurred by Member States that had legislation in place before the VOC-II Directive was introduced. However, as noted above, the impact of EU action (or anticipated EU action) on Stage II controls cannot be fully disentangled from the uptake of controls within the member states, as many Member States may have introduced their national legislation, at least in part in anticipation of expected EU action. It is also worth noting that some Member States such as Finland had a significant level of uptake
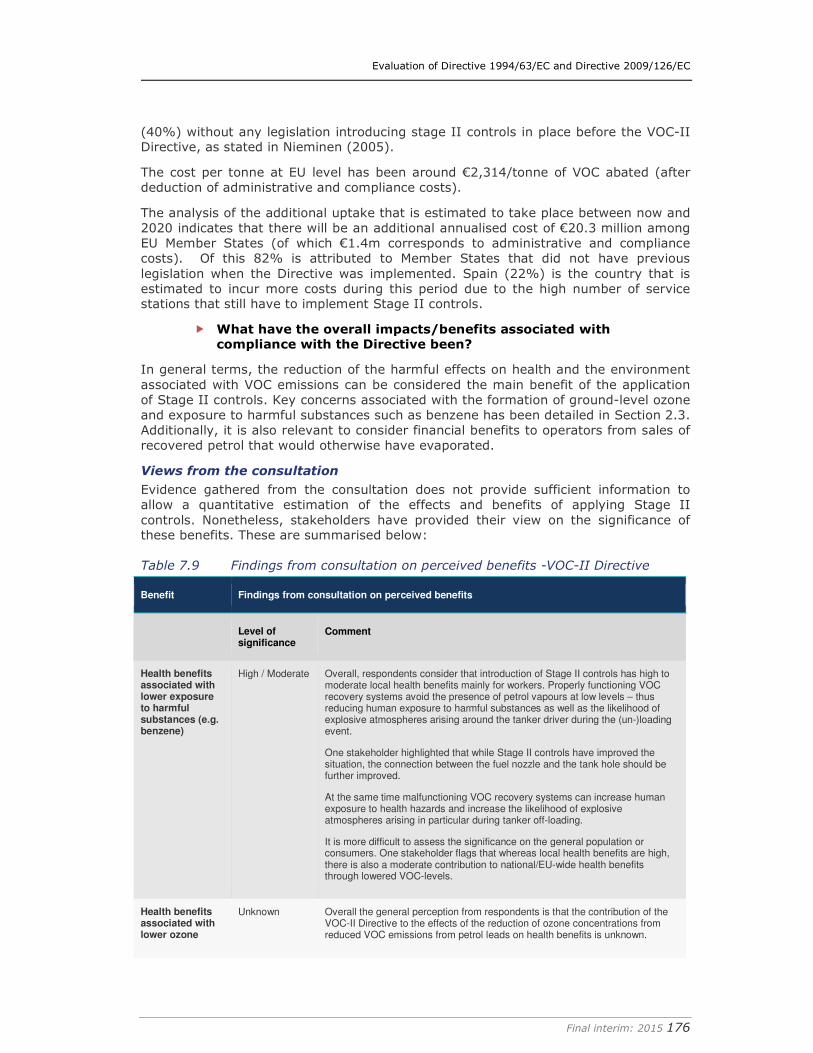
Evaluation of Directive 1994/63/EC and Directive 2009/126/EC
Final interim: 2015 176
(40%) without any legislation introducing stage II controls in place before the VOC-II Directive, as stated in Nieminen (2005).
The cost per tonne at EU level has been around €2,314/tonne of VOC abated (after deduction of administrative and compliance costs).
The analysis of the additional uptake that is estimated to take place between now and 2020 indicates that there will be an additional annualised cost of €20.3 million among EU Member States (of which €1.4m corresponds to administrative and compliance costs). Of this 82% is attributed to Member States that did not have previous legislation when the Directive was implemented. Spain (22%) is the country that is estimated to incur more costs during this period due to the high number of service stations that still have to implement Stage II controls.
� What have the overall impacts/benefits associated with compliance with the Directive been?
In general terms, the reduction of the harmful effects on health and the environment associated with VOC emissions can be considered the main benefit of the application of Stage II controls. Key concerns associated with the formation of ground-level ozone and exposure to harmful substances such as benzene has been detailed in Section 2.3. Additionally, it is also relevant to consider financial benefits to operators from sales of recovered petrol that would otherwise have evaporated.
Views from the consultation
Evidence gathered from the consultation does not provide sufficient information to allow a quantitative estimation of the effects and benefits of applying Stage II controls. Nonetheless, stakeholders have provided their view on the significance of these benefits. These are summarised below:
Table 7.9 Findings from consultation on perceived benefits -VOC-II Directive
Benefit Findings from consultation on perceived benefits
Level of significance
Comment
Health benefits associated with lower exposure to harmful substances (e.g. benzene)
High / Moderate Overall, respondents consider that introduction of Stage II controls has high to moderate local health benefits mainly for workers. Properly functioning VOC recovery systems avoid the presence of petrol vapours at low levels – thus reducing human exposure to harmful substances as well as the likelihood of explosive atmospheres arising around the tanker driver during the (un-)loading event.
One stakeholder highlighted that while Stage II controls have improved the situation, the connection between the fuel nozzle and the tank hole should be further improved.
At the same time malfunctioning VOC recovery systems can increase human exposure to health hazards and increase the likelihood of explosive atmospheres arising in particular during tanker off-loading.
It is more difficult to assess the significance on the general population or consumers. One stakeholder flags that whereas local health benefits are high, there is also a moderate contribution to national/EU-wide health benefits through lowered VOC-levels.
Health benefits associated with lower ozone
Unknown Overall the general perception from respondents is that the contribution of the VOC-II Directive to the effects of the reduction of ozone concentrations from reduced VOC emissions from petrol leads on health benefits is unknown.
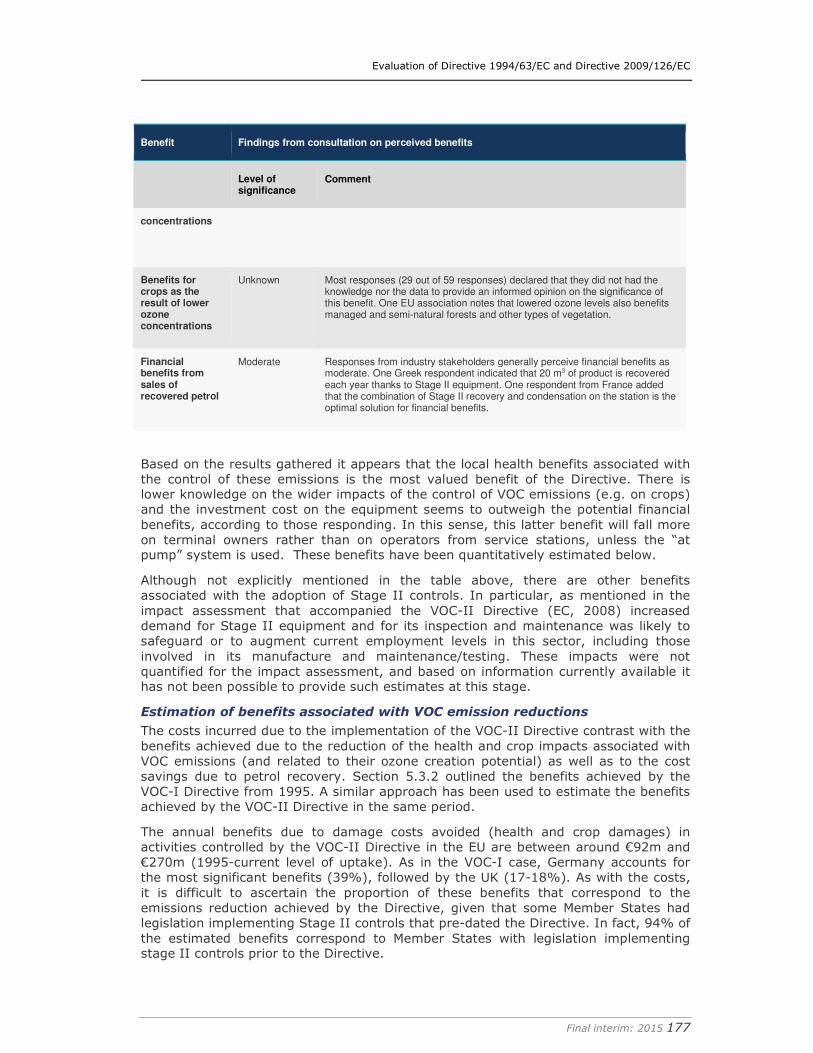
Evaluation of Directive 1994/63/EC and Directive 2009/126/EC
Final interim: 2015 177
Benefit Findings from consultation on perceived benefits
Level of significance
Comment
concentrations
Benefits for crops as the result of lower ozone concentrations
Unknown Most responses (29 out of 59 responses) declared that they did not had the knowledge nor the data to provide an informed opinion on the significance of this benefit. One EU association notes that lowered ozone levels also benefits managed and semi-natural forests and other types of vegetation.
Financial benefits from sales of recovered petrol
Moderate Responses from industry stakeholders generally perceive financial benefits as moderate. One Greek respondent indicated that 20 m3 of product is recovered each year thanks to Stage II equipment. One respondent from France added that the combination of Stage II recovery and condensation on the station is the optimal solution for financial benefits.
Based on the results gathered it appears that the local health benefits associated with the control of these emissions is the most valued benefit of the Directive. There is lower knowledge on the wider impacts of the control of VOC emissions (e.g. on crops) and the investment cost on the equipment seems to outweigh the potential financial benefits, according to those responding. In this sense, this latter benefit will fall more on terminal owners rather than on operators from service stations, unless the “at pump” system is used. These benefits have been quantitatively estimated below.
Although not explicitly mentioned in the table above, there are other benefits associated with the adoption of Stage II controls. In particular, as mentioned in the impact assessment that accompanied the VOC-II Directive (EC, 2008) increased demand for Stage II equipment and for its inspection and maintenance was likely to safeguard or to augment current employment levels in this sector, including those involved in its manufacture and maintenance/testing. These impacts were not quantified for the impact assessment, and based on information currently available it has not been possible to provide such estimates at this stage.
Estimation of benefits associated with VOC emission reductions
The costs incurred due to the implementation of the VOC-II Directive contrast with the benefits achieved due to the reduction of the health and crop impacts associated with VOC emissions (and related to their ozone creation potential) as well as to the cost savings due to petrol recovery. Section 5.3.2 outlined the benefits achieved by the VOC-I Directive from 1995. A similar approach has been used to estimate the benefits achieved by the VOC-II Directive in the same period.
The annual benefits due to damage costs avoided (health and crop damages) in activities controlled by the VOC-II Directive in the EU are between around €92m and €270m (1995-current level of uptake). As in the VOC-I case, Germany accounts for the most significant benefits (39%), followed by the UK (17-18%). As with the costs, it is difficult to ascertain the proportion of these benefits that correspond to the emissions reduction achieved by the Directive, given that some Member States had legislation implementing Stage II controls that pre-dated the Directive. In fact, 94% of the estimated benefits correspond to Member States with legislation implementing stage II controls prior to the Directive.
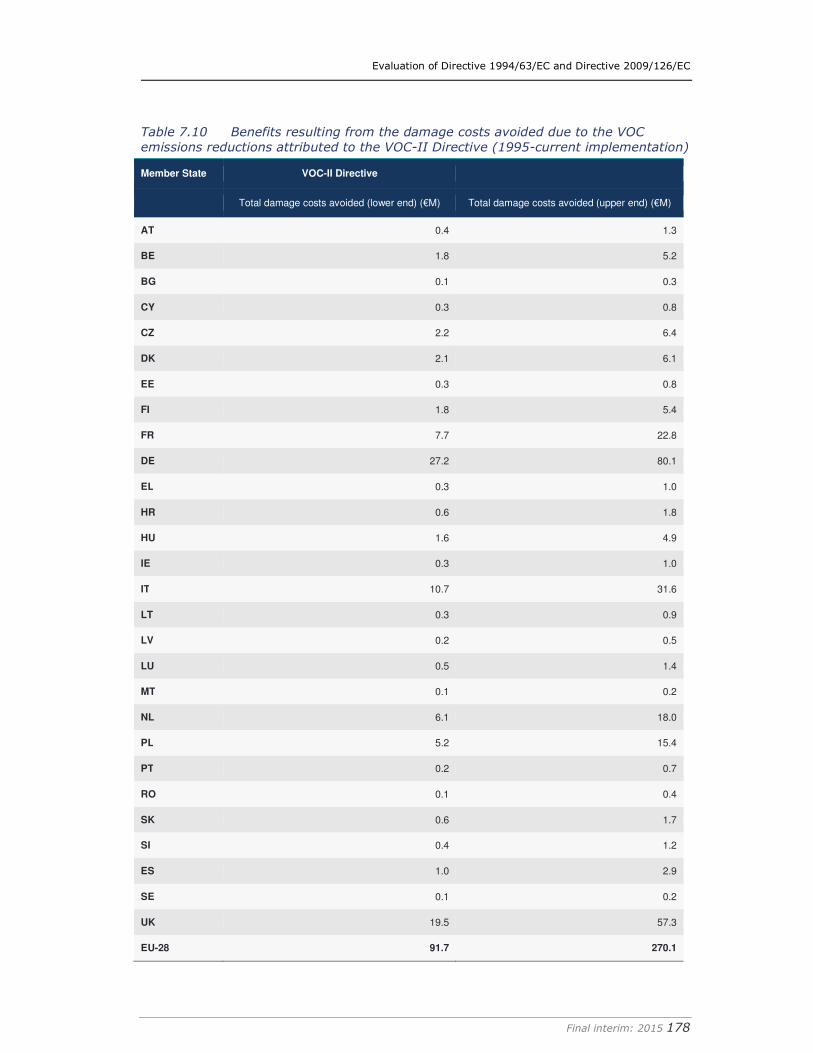
Evaluation of Directive 1994/63/EC and Directive 2009/126/EC
Final interim: 2015 178
Table 7.10 Benefits resulting from the damage costs avoided due to the VOC
emissions reductions attributed to the VOC-II Directive (1995-current implementation)
Member State VOC-II Directive
Total damage costs avoided (lower end) (€M) Total damage costs avoided (upper end) (€M)
AT 0.4 1.3
BE 1.8 5.2
BG 0.1 0.3
CY 0.3 0.8
CZ 2.2 6.4
DK 2.1 6.1
EE 0.3 0.8
FI 1.8 5.4
FR 7.7 22.8
DE 27.2 80.1
EL 0.3 1.0
HR 0.6 1.8
HU 1.6 4.9
IE 0.3 1.0
IT 10.7 31.6
LT 0.3 0.9
LV 0.2 0.5
LU 0.5 1.4
MT 0.1 0.2
NL 6.1 18.0
PL 5.2 15.4
PT 0.2 0.7
RO 0.1 0.4
SK 0.6 1.7
SI 0.4 1.2
ES 1.0 2.9
SE 0.1 0.2
UK 19.5 57.3
EU-28 91.7 270.1
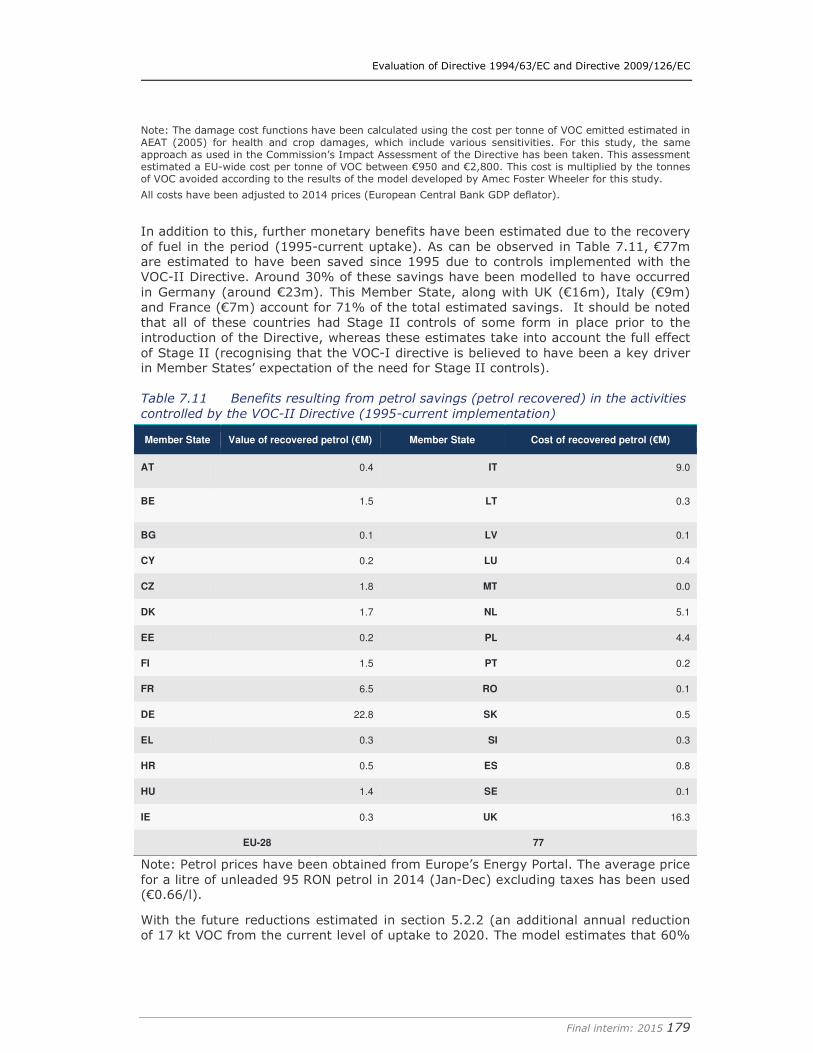
Evaluation of Directive 1994/63/EC and Directive 2009/126/EC
Final interim: 2015 179
Note: The damage cost functions have been calculated using the cost per tonne of VOC emitted estimated in AEAT (2005) for health and crop damages, which include various sensitivities. For this study, the same approach as used in the Commission’s Impact Assessment of the Directive has been taken. This assessment estimated a EU-wide cost per tonne of VOC between €950 and €2,800. This cost is multiplied by the tonnes of VOC avoided according to the results of the model developed by Amec Foster Wheeler for this study.
All costs have been adjusted to 2014 prices (European Central Bank GDP deflator).
In addition to this, further monetary benefits have been estimated due to the recovery of fuel in the period (1995-current uptake). As can be observed in Table 7.11, €77m are estimated to have been saved since 1995 due to controls implemented with the VOC-II Directive. Around 30% of these savings have been modelled to have occurred in Germany (around €23m). This Member State, along with UK (€16m), Italy (€9m) and France (€7m) account for 71% of the total estimated savings. It should be noted that all of these countries had Stage II controls of some form in place prior to the introduction of the Directive, whereas these estimates take into account the full effect of Stage II (recognising that the VOC-I directive is believed to have been a key driver in Member States’ expectation of the need for Stage II controls).
Table 7.11 Benefits resulting from petrol savings (petrol recovered) in the activities
controlled by the VOC-II Directive (1995-current implementation)
Member State Value of recovered petrol (€M) Member State Cost of recovered petrol (€M)
AT 0.4 IT 9.0
BE 1.5 LT 0.3
BG 0.1 LV 0.1
CY 0.2 LU 0.4
CZ 1.8 MT 0.0
DK 1.7 NL 5.1
EE 0.2 PL 4.4
FI 1.5 PT 0.2
FR 6.5 RO 0.1
DE 22.8 SK 0.5
EL 0.3 SI 0.3
HR 0.5 ES 0.8
HU 1.4 SE 0.1
IE 0.3 UK 16.3
EU-28 77
Note: Petrol prices have been obtained from Europe’s Energy Portal. The average price for a litre of unleaded 95 RON petrol in 2014 (Jan-Dec) excluding taxes has been used (€0.66/l).
With the future reductions estimated in section 5.2.2 (an additional annual reduction of 17 kt VOC from the current level of uptake to 2020. The model estimates that 60%
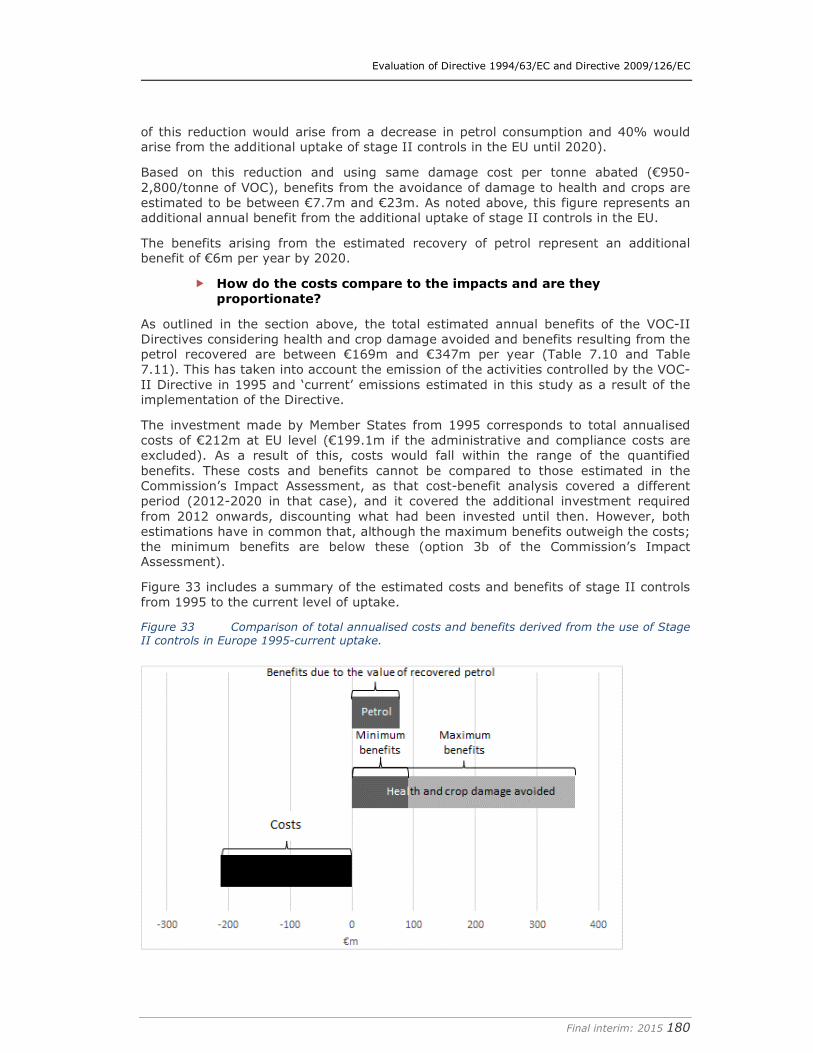
Evaluation of Directive 1994/63/EC and Directive 2009/126/EC
Final interim: 2015 180
of this reduction would arise from a decrease in petrol consumption and 40% would arise from the additional uptake of stage II controls in the EU until 2020).
Based on this reduction and using same damage cost per tonne abated (€950-2,800/tonne of VOC), benefits from the avoidance of damage to health and crops are estimated to be between €7.7m and €23m. As noted above, this figure represents an additional annual benefit from the additional uptake of stage II controls in the EU.
The benefits arising from the estimated recovery of petrol represent an additional benefit of €6m per year by 2020.
� How do the costs compare to the impacts and are they
proportionate?
As outlined in the section above, the total estimated annual benefits of the VOC-II Directives considering health and crop damage avoided and benefits resulting from the petrol recovered are between €169m and €347m per year (Table 7.10 and Table 7.11). This has taken into account the emission of the activities controlled by the VOC-II Directive in 1995 and ‘current’ emissions estimated in this study as a result of the implementation of the Directive.
The investment made by Member States from 1995 corresponds to total annualised costs of €212m at EU level (€199.1m if the administrative and compliance costs are excluded). As a result of this, costs would fall within the range of the quantified benefits. These costs and benefits cannot be compared to those estimated in the Commission’s Impact Assessment, as that cost-benefit analysis covered a different period (2012-2020 in that case), and it covered the additional investment required from 2012 onwards, discounting what had been invested until then. However, both estimations have in common that, although the maximum benefits outweigh the costs; the minimum benefits are below these (option 3b of the Commission’s Impact Assessment).
Figure 33 includes a summary of the estimated costs and benefits of stage II controls from 1995 to the current level of uptake.
Figure 33 Comparison of total annualised costs and benefits derived from the use of Stage II controls in Europe 1995-current uptake.
Evaluation of Directive 1994/63/EC and Directive 2009/126/EC
Final interim: 2015 181
In terms of the additional costs and benefits of continued uptake from the current level to 2020 calculated above, the costs would fall between the range of benefits estimated for that period (annualised costs of €20.3m or €18.9m if the administrative and compliance costs are excluded, compared to benefits between €7.7m and €23m). Therefore, the installation of additional stage II controls in those Member States with a lower level of uptake does not seem to imply disproportionate costs, as these are estimated to be outweighed by the benefits resulting from the damage avoided and the recovery of petrol.
7.3.3 If any inefficient provisions or disproportionate sources of cost can be
identified, what has caused them? (EF.2)
Whilst the implementation of the Directive has been a source of cost for both, regulators and operators (as detailed above), it includes mechanisms that aim to reduce the regulatory burden. For example, the VOC-II Directive introduced flexibility in the speed of implementation, by allowing for different implementation phases for new and existing sites. This allowed operators to plan for refurbishment. In addition, exemptions are applied for the smaller sites as discussed in detail in section 6.3.1 discussing the appropriateness of the 100m3 threshold, which is seen as appropriate by most stakeholders.
Based on the above and the analysis undertaken in previous sections, there seems to be no apparent provisions that hinder cost-effectiveness or that cause disproportionate sources of costs. This will be further discussed during the upcoming workshop.
7.3.4 If the implementation cost should differ from the estimated cost
(where such data is available), what has caused this difference and
what lessons can be learned? (EF.3)
An impact assessment was conducted prior to the adoption of the VOC-II Directive. This included relevant information on the costs of compliance with the Directive. The impact assessment distinguished costs for the ‘at pump’ PVR system, for which an annualised costs for 2020 of €31.95 million was estimated, from costs for conventional Stage II PVR system, for which an annualised costs of €38.4 million was estimated. In addition, Annex II of the impact assessment presents a table with a detailed breakdown of costs per technology and across different annual throughputs (m3).
This study includes an estimation of costs and benefits arising from 1995 up to the current level of uptake as well as an estimation of additional costs and benefits from the current level of uptake to 2020. As outlined in section 7.3.2, the costs of implementing these controls represent €212.2m per year (€2,314/tonne of VOC abated, excluding administrative and compliance costs). On the other hand, the benefits represent between €91m and €270m per year (€169m-€347m if the value of recovered petrol is included). These values are not comparable to the Impact Assessment as they cover the whole uptake of stage II controls in the EU-28 since 1995, whereas the Commission’s Impact Assessment considered the additional uptake from 2012 to 2020.
The Commission’s Impact Assessment projected an emissions reduction of 17.8 kt of VOC and benefits between €16.9m and €49.7m (or between €28m and €50.8m if the value of recovered petrol is included). The estimation in the present report for the period is slightly lower than the Impact Assessment (17.1 kt compared to 17.8 kt). This can be explained through the results obtained in our model that future reductions of petrol consumption will influence emissions reductions by 60%. Therefore, the benefits estimated in this study have only taken into account the additional reduction of 7.2 kt of VOC (the remaining 40%) that has been attributed to the Directive (resulting in benefits of €7.7m-€23m). It should also be noted that the uptake levels
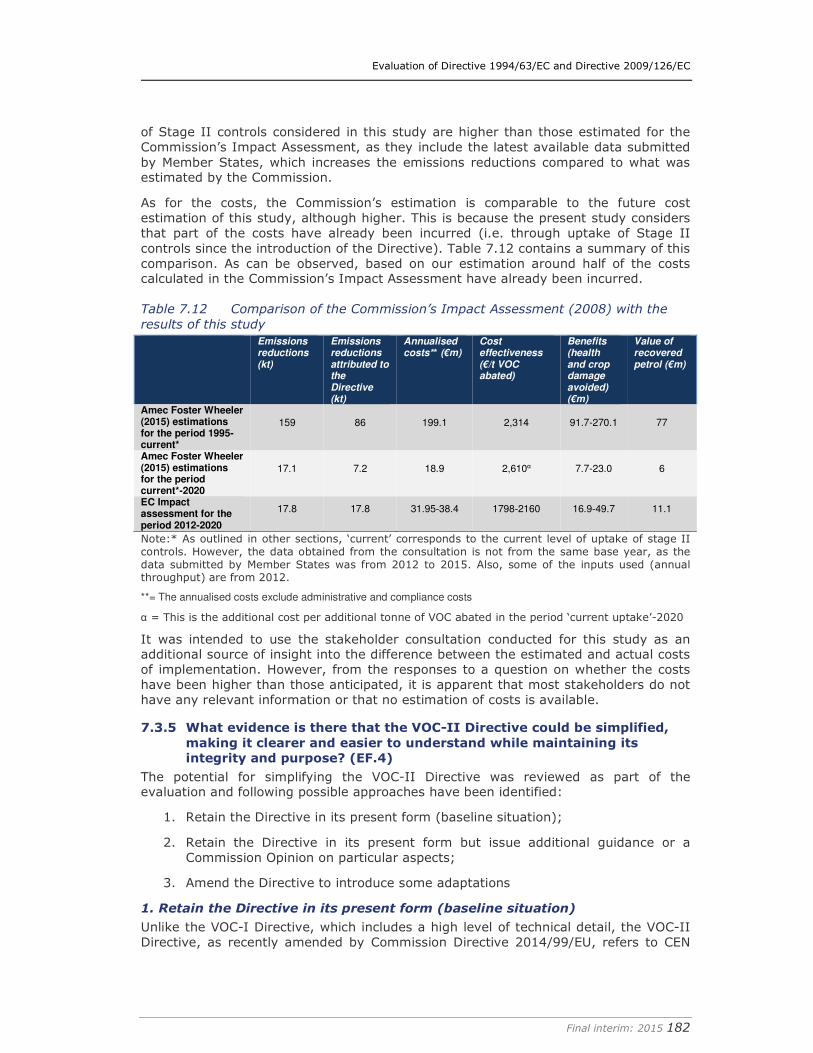
Evaluation of Directive 1994/63/EC and Directive 2009/126/EC
Final interim: 2015 182
of Stage II controls considered in this study are higher than those estimated for the Commission’s Impact Assessment, as they include the latest available data submitted by Member States, which increases the emissions reductions compared to what was estimated by the Commission.
As for the costs, the Commission’s estimation is comparable to the future cost estimation of this study, although higher. This is because the present study considers that part of the costs have already been incurred (i.e. through uptake of Stage II controls since the introduction of the Directive). Table 7.12 contains a summary of this comparison. As can be observed, based on our estimation around half of the costs calculated in the Commission’s Impact Assessment have already been incurred.
Table 7.12 Comparison of the Commission’s Impact Assessment (2008) with the
results of this study
Emissions reductions (kt)
Emissions reductions attributed to the Directive (kt)
Annualised costs** (€m)
Cost effectiveness (€/t VOC abated)
Benefits (health and crop damage avoided) (€m)
Value of recovered petrol (€m)
Amec Foster Wheeler (2015) estimations for the period 1995-current*
159 86 199.1 2,314 91.7-270.1 77
Amec Foster Wheeler (2015) estimations for the period current*-2020
17.1 7.2 18.9 2,610α 7.7-23.0 6
EC Impact assessment for the period 2012-2020
17.8 17.8 31.95-38.4 1798-2160 16.9-49.7 11.1
Note:* As outlined in other sections, ‘current’ corresponds to the current level of uptake of stage II controls. However, the data obtained from the consultation is not from the same base year, as the data submitted by Member States was from 2012 to 2015. Also, some of the inputs used (annual throughput) are from 2012.
**= The annualised costs exclude administrative and compliance costs
α = This is the additional cost per additional tonne of VOC abated in the period ‘current uptake’-2020
It was intended to use the stakeholder consultation conducted for this study as an additional source of insight into the difference between the estimated and actual costs of implementation. However, from the responses to a question on whether the costs have been higher than those anticipated, it is apparent that most stakeholders do not have any relevant information or that no estimation of costs is available.
7.3.5 What evidence is there that the VOC-II Directive could be simplified,
making it clearer and easier to understand while maintaining its
integrity and purpose? (EF.4)
The potential for simplifying the VOC-II Directive was reviewed as part of the evaluation and following possible approaches have been identified:
1. Retain the Directive in its present form (baseline situation);
2. Retain the Directive in its present form but issue additional guidance or a Commission Opinion on particular aspects;
3. Amend the Directive to introduce some adaptations
1. Retain the Directive in its present form (baseline situation)
Unlike the VOC-I Directive, which includes a high level of technical detail, the VOC-II Directive, as recently amended by Commission Directive 2014/99/EU, refers to CEN
Evaluation of Directive 1994/63/EC and Directive 2009/126/EC
Final interim: 2015 183
standards for the type approval and testing of Stage II equipment in order to ensure harmonised implementation and adaptation to technical progress. The technical details are thus defined in external documents which can be more easily updated to reflect the state of art without necessarily needing to adapt the VOC-II Directive again in the future, thus reducing regulatory burden on authorities.
In view of this, there is less potential to simplify the VOC-II Directive than the VOC-I Directive, as described in section 5.3.5. As such, a majority of responses from stakeholders suggest leaving the Directive in its current form. As noted by 12 stakeholders, simplification of the directive is not considered necessary; it is viewed as a relatively simple piece of legislation and straightforward to implement. Two stakeholders (France and the UK) have added that the emphasis is now on the enforcement of the legislation.
2. Retain the Directive in its present form but issue additional guidance or a
Commission Opinion on particular aspects
Findings from this evaluation have revealed that there are a few areas that could require further clarification, but which could be addressed without the need of modifying the Directive. As such the Commission could consider issuing guidance or a Commission´s Opinion on the following:
� The relevance of Art. 5.3 on consumer information has been questioned by a number of stakeholders as described later in section 7.5.6 (question R.5 on relevance). Several stakeholders felt that this requirement has little impact on consumer awareness. To improve this, further guidance on best approaches to increase awareness of consumers could be developed.
� The interactions between Stage I and Stage II systems, addressing the risk of pressure build-up in underground storage tank ullage spaces (as noted in section 5.3.5).
� What constitutes “major refurbishment” is briefly described in recital 9 of the Directive but this could be further explained or defined at EU level to avoid confusion and differences in interpretation. Similarly guidance could be also issued on how to determine the actual throughput of service stations (i.e. clarifying whether this refers to an average throughput of different years and how to address and monitor changes across years in a service station’s threshold). Guidance with suggestions on how best to interpret and define these terms could take into account the Opinion of the European Economic and Social Committee (EESC, 2008)119 at the time of adoption of the VOC-II Directive (see box below) as well as the different approaches adopted at national level (as described in Appendix D).
Box 6 Opinion of the European Economic and Social Committee (EESC, 2008) on the VOC-
II Dircetive
� Regarding the determination of the threshold throughput the EESC recommends the following:
o 3.1.2. The EESC would like the following phrase to be added after ‘500 m3 per annum’: ‘Service stations shall declare their throughput within three months of opening’.
o 3.1.3. The EESC considers it necessary that all new service stations with a capacity of less than 500m3 should be required to declare any increases that bring their throughput to over 500m3 per annum. The declaration must be made within three months of the beginning of the year after the year when the increase occurred; the equipment must be installed within six months in the same year.
o 3.3.1. The EESC recommends that the following sentence be added: ‘Service stations with a throughput of less than 3 000 m3 per annum must declare any increase in throughput,
119 COM(2008) 812 final — 2008/0229 (COD)
Evaluation of Directive 1994/63/EC and Directive 2009/126/EC
Final interim: 2015 184
beyond 3,000 m3 in the course of a calendar year’; the equipment must be installed within six months in the same year.
� Regarding the definition of “major refurbishment” the EESC recommends the following:
o 3.2.1. The EESC considers that the term ‘major refurbishment’ needs to be clarified. It feels that it must entail a significant change, such as an increase in the throughput of petrol distribution and filling equipment of over 20 % in comparison to the equivalent initial throughput or the transition from a manned self-service installation to an unmanned one.
o 3.2.2. The EESC calls for the following not to be classified as major refurbishments or significant changes: changing a service station’s display sign; changing from a traditional full-service installation to a self-service operation with an attendant; or bringing the installation into line with existing regulations.
3. Amend the Directive to introduce some adaptations
The points that have been described above as potentially requiring further guidance could be also considered for a potential amendment of the Directive, which could include:
� Revising or removing Article 5.3 on consumer information.
� Further clarifying how to determine the actual throughput and what constitutes a “major refurbishment”.
However, it should be noted that leaving the Directive as it is would probably result in less administrative and regulatory burden compared to amending the Directive, especially since the Directive has already been recently amended. Providing further definitions could create additional burdens and some conflict for some Member States and operators which have defined these terms taking into account their national circumstances e.g. in cases where Member States need to measure throughput for other purposes e.g. metrology (measuring amounts of petrol).
7.3.6 If any adverse consequences of the directive have been identified,
what (if anything) caused differences in impact on large enterprises on
the one hand and micro, small or medium sized enterprises on the
other? (EF.5)
� Has the Directive resulted in any adverse consequences, with differing impacts on large companies and SME?
When assessing this question it is important to note that large companies (some of them multinational) and SME can operate stations of different throughput sizes (i.e. stations with large throughputs are not necessarily owned by large companies and vice versa with small sites).
The impact assessment on the VOC-II Directive, estimated that for the smallest service stations with a throughput of 500 m3 per annum, the necessary investment costs for a worst case unscheduled installation of Stage II equipment are approximately €16-28,000. It concluded that no significant impact was expected on net income levels of service station operators as costs were likely to be passed onto to consumers.
However, it is relevant to note that some service stations can be operated by large companies (potentially with multiple sites), which are likely to have more resources to bear the high investment costs required to install Stage II controls (even at small stations) than those stations owned by SME. As such, for two respondents from the UK and Germany the application of the VOC-II Directive is not viable and disproportionately burdensome for many SME. A German respondent also noted that for several SME it has been proven more expensive to retrofit to suit the VOC-II Directive than to build the service station in the first place. According to the French
Evaluation of Directive 1994/63/EC and Directive 2009/126/EC
Final interim: 2015 185
industry representative, smaller operators were obliged to pass on the costs to the consumer which impacted their prices in comparison to larger retailers.
As contextual background, it is relevant to note a market review of the European petroleum retail sector (CBRE, 2013) reports that major and international oil companies hold approximately 50% of Europe’s service stations network, even though their market share has fallen by 5% since 2009. As such 52% of the service stations in the EU (~90,000) were owned by the top eight companies in 2013. However, in this same period, national and independent networks have grown by approximately 10%. Data in this regard by the association of independent European oil traders (UPEI)120 notes that independent retailers from major oil companies - mainly SME - are active in all Member States, though their relative importance and market share varies across countries due to the different market structures and historical backgrounds. As an example, in Poland 45 percent of filling stations belong to SME whereas in Italy, more than one third of all filling stations are operated by independents (UPEI, 2009)121. Moreover, the importance of SME in the service station sector is increasing due to the withdrawal of major oil companies from the supply downstream sector.
Despite the above, it has been noted by Sweden that in previous national regulation all petrol stations with low throughput were included and therefore SME and micro sized enterprises, have been positively impacted by the Directive which led to the introduction of thresholds in national legislation.
� If companies of different size have been disproportionally impacted, what has caused these differences?
Small throughput sites, especially those operated by SME, face higher compliance costs due to economies of scale and relative lack of sufficient resources to meet requirements (i.e. service stations with lower throughputs when installing the PVR system will face a higher cost per litre of petrol sold).
In addition, an industry stakeholder responding on behalf of a large company that operates in multiple countries notes that they were able to apply and transfer their experience from markets in which Stage II controls were required prior to the VOC-II Directive to implement a consistent and reliable solution. Based on this, in Member States where there was no pre-existing legislation, multinational companies have a competitive advantage over national (small) operators with no previous experience and limited knowledge.
However, three respondents from the consultation have noted that the fact that small service stations are facing financial difficulties or even closing down is due to a combination of reasons, including the regulatory burden placed on them with regards to aspects such as safety or soil and air pollution prevention. As such it is difficult to determine the impact that the VOC-II Directive actually had on small sites.
In this regard, as noted in the impact assessment on the VOC-II Directive, there was already a shift towards larger stations with shops and it is difficult to determine the contribution of the Directive to this trend. As such, according to Verdict Retail (2014)122 the total number of service stations across Europe is expected to decline 2.5% between 2014 and 2019. Shrinking margins are expected to result in the closure of low volume retail sites by fuel retailers, as part of their strategy to focus on their upstream activities. However this has been influenced by a number of factors.
120 http://www.upei.org/aboutus/index.html (accessed in May 2015) 121 http://www.upei.org/release/english_version_UPEI.pdf 122 http://www.verdictretail.com/european-commercial-fuel-market-to-be-worth-nearly-e600bn-by-2018/
Evaluation of Directive 1994/63/EC and Directive 2009/126/EC
Final interim: 2015 186
7.3.7 If there any differences between Member States (e.g. implementation
costs), what is causing them and what effect are they having on the
observed results and impacts? (EF.6)
� Are there significant cost differences between Member States?
Figure 32 in section 7.3.2 provides a detailed analysis of costs incurred to date per Member State. These have been estimated mainly on the basis of the current number and size of service stations with Stage II controls and average cost data at EU level. As a result the analysis does not take into other factors affecting the overall cost of the Directive such differences in the implementation approach or local market conditions. This prevents solid conclusions from being drawn on whether there are significant cost differences in the Member States.
As expected, the results show how those Member States with more petrol stations fitted with Stage II systems, particularly in the higher throughput bands (> 2,000 m3), have incurred in the highest costs: Germany (21%), Italy (19%) and UK (13%). On the other end, countries with low uptake levels and where small stations represent a higher share present significantly lower costs: Cyprus (0.1%), Romania (0.1%), and Malta (0.04%). The same applies to expected additional costs up to 2020, with the highest costs being reported by Spain, as this is the member state that still needs to retrofit most service stations.
Looking at the cost incurred per tonne of VOC abated per Member State (after deduction of administrative and compliance costs), this has ranged from €958/tonne (Netherlands) to €3,830/tonne (Bulgaria) and a maximum of €5,672/tonne (Belgium). On average it has been around €2,314/tonne of VOC abated123.
� If so, what are the main reasons for these differences and what effects are these having?
As noted above, differences in costs between Member States are expected to be mainly related to:
� The pre-existence of national legislation and the level of uptake of Stage II systems prior to the adoption of the Directive.
� Whether national legislation places stricter requirements than the Directive (e.g. requiring Stage II controls on all stations regardless of threshold). As noted in the consultation (e.g. by Cyprus, Bulgaria) this has resulted in higher costs for these Member States and some competiveness issues (e.g. France 90% hydrocarbon capture ratio in place of 85% at type approval). However, it should be noted that not all of these costs can be attributed to the directive – the additional costs of the tighter levels of emission controls are attributed to national legislation.
� Their annual throughput and the national pattern of consumption of petrol against diesel use.
� Other reasons associated with implementation such as the existence of funding national programmes for relevant technologies, different permitting approaches (e.g. depending on whether permit application fees are imposed such as in the UK), stakeholder acceptability/engagement, and enforcement and inspection action. Details on these aspects are provided in the individual summaries on implementation of each Member State (Appendix D).
� Local market conditions, for instance affecting retail prices of equipment and maintenance.
123 The main reason for the differences in cost per Euro of tonne abated mainly relates to differences in numbers of petrol stations of different sizes amongst the Member States.
Evaluation of Directive 1994/63/EC and Directive 2009/126/EC
Final interim: 2015 187
7.3.8 What good practices in terms of cost-effective implementation of the
Directive in Member States can be identified? (EF.7)
The identification of good practices in terms of cost-effective implementation of the Directive could only be assessed to some extent. The stakeholder workshop will provide a forum to further identify and exchange experience on potential cost-effective good practices amongst the different activities covered by the Directive.
Initial areas of good practice to be further discussed at the workshop have been identified in section 5.3.8 for the VOC-I Directive and are also applicable here. Relevant findings include:
� Practices that drive technological uptake and innovation. These contribute to increasing the economic incentive to operators provided by VOC II technologies. For instance, the authorities from Scotland have established a grant scheme for rural petrol stations124. The grant is available to some petrol stations to cover capital expenditure on fuel supply equipment including new storage tanks, vapour recovery equipment, pumps and associated pipework. Funds are usually available to cover a maximum of 50% of total works costs.
� Fiscal incentives such as use of tax rebates as reported in section 5.2.4 for some countries (DE, DK and NL). The application of tax refunds on the recovered product to avoid double taxation by some EU authorities make vapour recovery a better investment and reduces the financial burden placed on operators.
� Public-private cooperation and provision of guidance and training materials. Appendix E includes a table with all identified guidance material published by national authorities on the VOC-II Directive.
� Practices related to inspection and enforcement of the legislation. For instance in some Member States (e.g. SE, IE) inspections must be handled by companies that are accredited by relevant accreditation bodies or inspectors.
7.4 Coherence
7.4.1 Overview
Following the same approach as for the VOC-I Directive, the following sections provide preliminary findings on the evaluation of coherence, which has been structured around two principal questions.
7.4.2 To what extent is the VOC-II Directive satisfactorily integrated and
coherent with other EU legislation with similar objectives and with the Clean
Air Programme for Europe? (C.1)
The above question has been broken down into three sub-questions in order to respond to all related coherence aspects between the VOC-II Directive and other relevant legislation.
� How do the objectives of the VOC-I and VOC-II Directives interact and complement each other?
See the response provided for the same question addressed in section 5.4.2 for the VOC-I Directive.
� What are the other pieces of EU law and policy with similar objectives?
Are these and the Clean Air Programme for Europe coherent with the
Directives?
124 http://www.gov.scot/Publications/2004/08/19629/40008
Evaluation of Directive 1994/63/EC and Directive 2009/126/EC
Final interim: 2015 188
The other pieces of EU law and policy with similar objectives are described in the corresponding question for the VOC-I Directive under question C1 in section 5.4.2. In addition to the analysis provided, there more specific issues on the interaction of VOC II and other EU and international legislation that can also be highlighted. In particular, the Regulations on Euro 5/V and Euro 6/VI standards or vehicle approval types and the FQD are relevant to the objectives of the VOC-II Directive.
Regulation (EC) No 715/2007 on type approval of motor vehicles with respect to emissions from light passenger and commercial vehicles and on access to vehicle repair and maintenance information125 (Euro V) restricts emissions of hydrocarbons (including VOC) from vehicles (conventional petrol-powered and diesel-powered) and their specific replacement parts. Regulation 595/2009 on type-approval of motor vehicles and engines with respect to emissions from heavy duty vehicles (Euro VI) and on access to vehicle repair and maintenance information (Euro VI HDV)126 restricts emissions of hydrocarbons (including VOC) from heavy duty vehicles and their specific replacement parts. Both Regulations covers tailpipe emissions, evaporative emissions and crankcase emissions. The objectives of these Regulations are coherent with the objectives of the VOC-II Directive as they aim to limit VOC emissions into the atmosphere. The Euro 5 and Euro 6 Regulations also work in a complementary way with the VOC-II Directive as they effect the level of VOC emissions emitted during refuelling of the vehicles covered by the Regulations.
The Fuel Quality Directive 2009/30/EC (FQD) was amended in 2009 to reflect developments in fuel and engine technology, to promote the development of lower carbon fuels, including biofuels, and to meet air-quality objectives set out in a 2005 Clean Air Strategy, inter alia, by reducing emissions of sulphur and PAHs (Poly Aromatic Hydrocarbons) from diesel. It applies to all petrol, diesel and biofuels used in road transport, as well as to gasoil used in non-road-mobile machinery. In particular the FQD includes requirements related to control of vapour pressure, limits on the content of hydrocarbons (e.g. olefins, aromatics, benzene), oxygen content, oxygenates (e.g. methanol, ethanol, ethers, etc.), sulphur and lead content found in petrol and diesel.
In relation to the volatility (or vapour pressure), the FQD describes the requirements and allows EU Member States to apply for a relaxation (waiver) of the summer vapour pressure limit for gasoline if using bioethanol and if air quality criteria are met. The FQD therefore works complementarily to the VOC-II Directive due to the possibility of granting derogations to allow higher vapour pressure fuel (in Member States with low ambient temperature and where bioethanol is used) which affects the degree of VOC emissions from petrol. The process for obtaining exemptions under the FQD explicitly recognises the issue of VOC emissions and the fact that higher VOC emissions from petrol storage and distribution may result. According to the Commission’s guidance, Member States must provide evidence in relation to (a) national emissions of VOC, (b) air quality: ozone, (c) air quality: benzene when applying for an exemption.127 Member States must be able to demonstrate that the change in Reid Vapour Pressure (RVP) or vapour pressure resulting from the waiver does not compromise the ability to meet air quality requirements. The Commission analysed the impact of these derogations while considering the expected uptake of Stage II controls in deciding whether to agree to the exemptions.
This topic is further discussed under question C2 in section 7.4.3.
125http://eur-lex.europa.eu/LexUriServ/LexUriServ.do?uri=CONSLEG:2007R0715:20080731:EN:PDF 126http://ec.europa.eu/enterprise/sectors/automotive/environment/eurovi/index_en.htm 127 http://ec.europa.eu/clima/policies/transport/fuel/docs/guidance_note_vapour_pressure_en.pdf
Evaluation of Directive 1994/63/EC and Directive 2009/126/EC
Final interim: 2015 189
� How can the Directive and other policy and legislation work better together?
In addition to the responses provided under the same question for the VOC-I Directive (see section 5.4.2), specific aspects can also be highlighted for the VOC-II Directive in terms of potential synergies with other Directives that could allow for the legislation to work better together. For example there are potential synergies with legislation directly impacting the composition of petrol vapour under the FQD. Further discussion on this aspect is provided under the following question (C2).
7.4.3 What gaps, overlaps, discrepancies, contradictions or similar issues
regulated in other relevant legal acts, standards or activities can be
identified which hampered or improved achievement of the objectives
in the VOC-II Directive? (C.2)
This question aims to provide responses related to whether there are any overlaps, gaps and/or inconsistencies between the VOC-II Directive and relevant legal acts, standards, activities or international obligations and whether there are any opportunities for simplification.
The key issue that has been identified relates to the coherence of the VOC-II Directive with the FQD. Possible discrepancies have been identified between the VOC-II Directive and the FQD, which includes exemptions to allow bioethanol (and low temperature waivers) resulting in higher RVP of petrol, which may hamper the overall effectiveness of Stage II controls (and Stage I controls). In April 2009, Directive 2009/30/EC was adopted revising the Fuel Quality Directive [Directive 98/70/EC]. It amends a number of elements of the petrol and diesel specifications as well as introducing in Article 7a, a requirement on fuel suppliers to reduce the greenhouse gas intensity of energy supplied for road transport (Low Carbon Fuel Standard). The amended Directive proposes new standards for transport fuels that will reduce their contribution to climate change and air pollution, including through greater use of biofuels. In particular, it facilitates the blending of ethanol in petrol through an increase in the maximum ethanol content to 10% and foresees the possibility for Member States to apply for an exemption from the maximum permitted petrol vapour pressure. The rationale behind this is that a new petrol blend that allows higher content of the biofuel ethanol reduces emissions of dangerous dust particles. However, increased use of ethanol is likely to lead to higher VOC permeation from vehicles (EC, 2008a).
Furthermore, overall emissions of VOC associated with petrol refuelling operations depend on the vapour pressure of the fuel and the ambient temperature. Changes in ambient temperature and vapour pressure can have a significant impact on VOC emissions from vehicle petrol refuelling. Therefore, to compensate for an increase in emissions of polluting vapours that result from greater use of ethanol, the Commission introduced the VOC-II Directive to cover vapour recovery equipment at filling stations. In parallel, the amended FQD includes provisions to reduce petrol evaporative emissions and therefore VOC, by setting a maximum limit on the vapour pressure of petrol of 60 kilo pascals (kPa). As the vapour pressure of the petrol is linked to the ambient temperature (the higher the temperature the higher the volatility) Member States with a low ambient temperature can have petrol during summer time with a higher vapour pressure of a maximum 70 kPa. Furthermore, petrol that has a higher RVP during months with colder temperatures allows the fuel to evaporate at low temperatures in order for the engine to operate properly, especially when the engine is cold. Having a lower RVP in summertime months prevents excessive evaporation when outside temperatures rise. Therefore, reducing the volatility of summer petrol decreases emissions. According to the new FQD those Member States are Denmark, Estonia, Finland, Ireland, Latvia, Lithuania, Sweden and the UK (Biofuels International,
Evaluation of Directive 1994/63/EC and Directive 2009/126/EC
Final interim: 2015 190
2009)128. When ethanol is blended into petrol, the vapour pressure can increase by up to 8kPa and therefore under normal circumstances go well over the 60kPa limit stipulated by the FQD. Therefore, allowing the use of ethanol under the FQD could create some implementation challenges in relation to the VOC-II Directive as the higher RVP will result in increased VOC emissions. In consequence, due to an increased amount of VOC emissions, certain Member States may need to make greater efforts to fulfil the 85 % recovery rate of petrol vapours from refuelling under the VOC-II Directive. Nonetheless, as discussed in section 7.1, in practice these instruments can be considered coherent as the FQD takes into account Stage II controls and includes provisions to ensure that, despite possible increases in VOC emissions as a result of higher vapour pressure fuel (with bio-ethanol), member states are still able to (and required to) meet national and international air quality obligations.
7.5 Relevance
7.5.1 Overview
Following the same approach as for the VOC-I Directive as described under section 5.5 the subsequent sections provide preliminary findings on the evaluation of relevance.
7.5.2 Are the key needs, problems and concerns related to VOC emissions
from petrol addressed by the current Directive? (I.e. to what extent
are the objectives still relevant to meet current needs) (R.1)
As findings from section 2.2 and 2.3 indicate, the need to control VOC emissions and ambient air quality (benzene as well as ozone) remain relevant in several Member States and across the EU. The total EU inventory of VOC emissions comprises many diverse sources and economic sectors, which justifies the need to address VOC emissions from small sources (EC, 2008a). Without the Stage II controls under the VOC-II Directive, the petrol vapour occupying the head space in a car's petrol tank would be displaced during refuelling and vented to the atmosphere. Spillages and drips from the filler nozzle would also evaporate.
In addition, VOC emissions and ambient air quality (benzene as well as ozone) remain relevant in several Member States and across the EU, as highlighted by the need for tighter national ceilings in 2020 and 2030 in the context of the revised NECD and the recently amended Gothenburg Protocol, which sets emission ceilings for 2020. VOC are precursors of ground-level ozone, which has harmful effects on human health, vegetation and building materials. Petrol vapours also contain benzene, which is a human carcinogen. Reducing VOC emissions from service stations reduces regional and local air pollution.
Furthermore, a significant number of Member States mandated the use of Stage II control techniques before the establishment of the VOC Directive. National regulations vary in scope in terms of the minimum size of petrol station concerned, the required vapour collection efficiency and the post-installation compliance regime (EC, 2008). The VOC-II Directive stipulates minimum technical requirements at EU level to ensure the free movement of goods in the EU and enhance the functioning of the internal market in stage 2 equipment.
Literature review and stakeholder feedback also indicate that there is potential to further reduce emissions through the control of other sources from petrol stations under the VOC-II Directive (e.g. drips, spillage, tank breathing from refuelling
128These are, in principle, those Member States where the average temperature for a majority of their territory is below 12˚C for at least two of the three months of June, July and August.
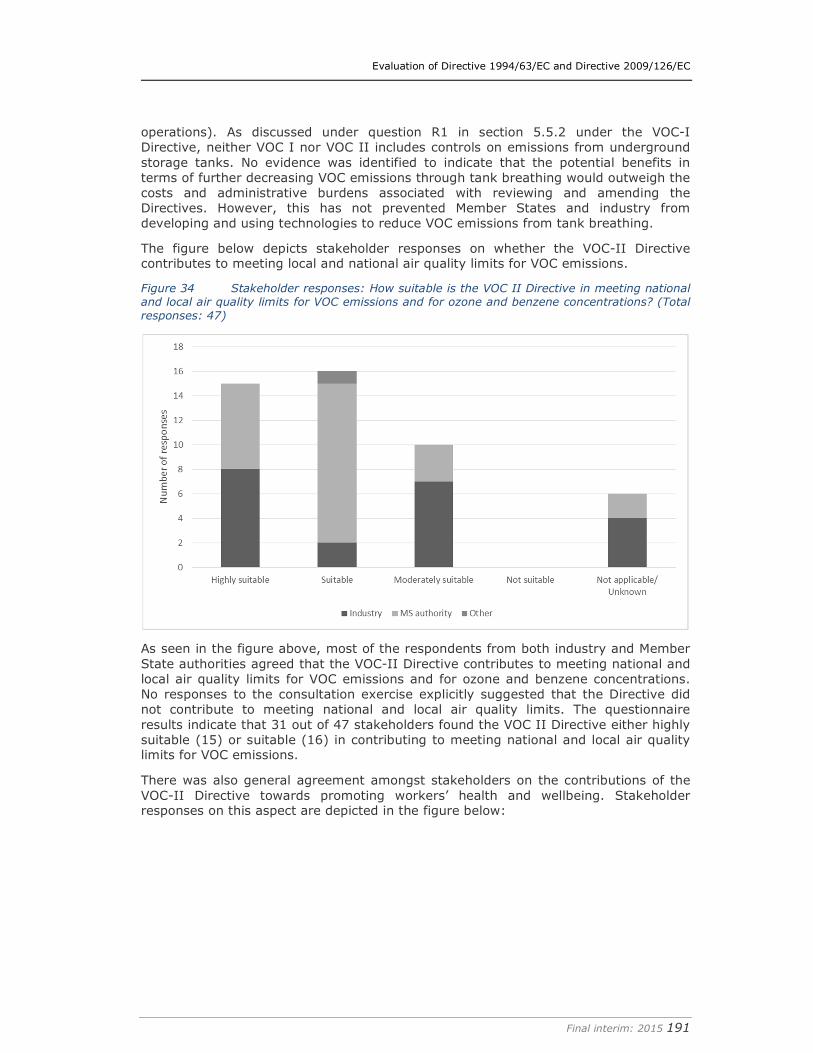
Evaluation of Directive 1994/63/EC and Directive 2009/126/EC
Final interim: 2015 191
operations). As discussed under question R1 in section 5.5.2 under the VOC-I Directive, neither VOC I nor VOC II includes controls on emissions from underground storage tanks. No evidence was identified to indicate that the potential benefits in terms of further decreasing VOC emissions through tank breathing would outweigh the costs and administrative burdens associated with reviewing and amending the Directives. However, this has not prevented Member States and industry from developing and using technologies to reduce VOC emissions from tank breathing.
The figure below depicts stakeholder responses on whether the VOC-II Directive contributes to meeting local and national air quality limits for VOC emissions.
Figure 34 Stakeholder responses: How suitable is the VOC II Directive in meeting national and local air quality limits for VOC emissions and for ozone and benzene concentrations? (Total
responses: 47)
As seen in the figure above, most of the respondents from both industry and Member State authorities agreed that the VOC-II Directive contributes to meeting national and local air quality limits for VOC emissions and for ozone and benzene concentrations. No responses to the consultation exercise explicitly suggested that the Directive did not contribute to meeting national and local air quality limits. The questionnaire results indicate that 31 out of 47 stakeholders found the VOC II Directive either highly suitable (15) or suitable (16) in contributing to meeting national and local air quality limits for VOC emissions.
There was also general agreement amongst stakeholders on the contributions of the VOC-II Directive towards promoting workers’ health and wellbeing. Stakeholder responses on this aspect are depicted in the figure below:
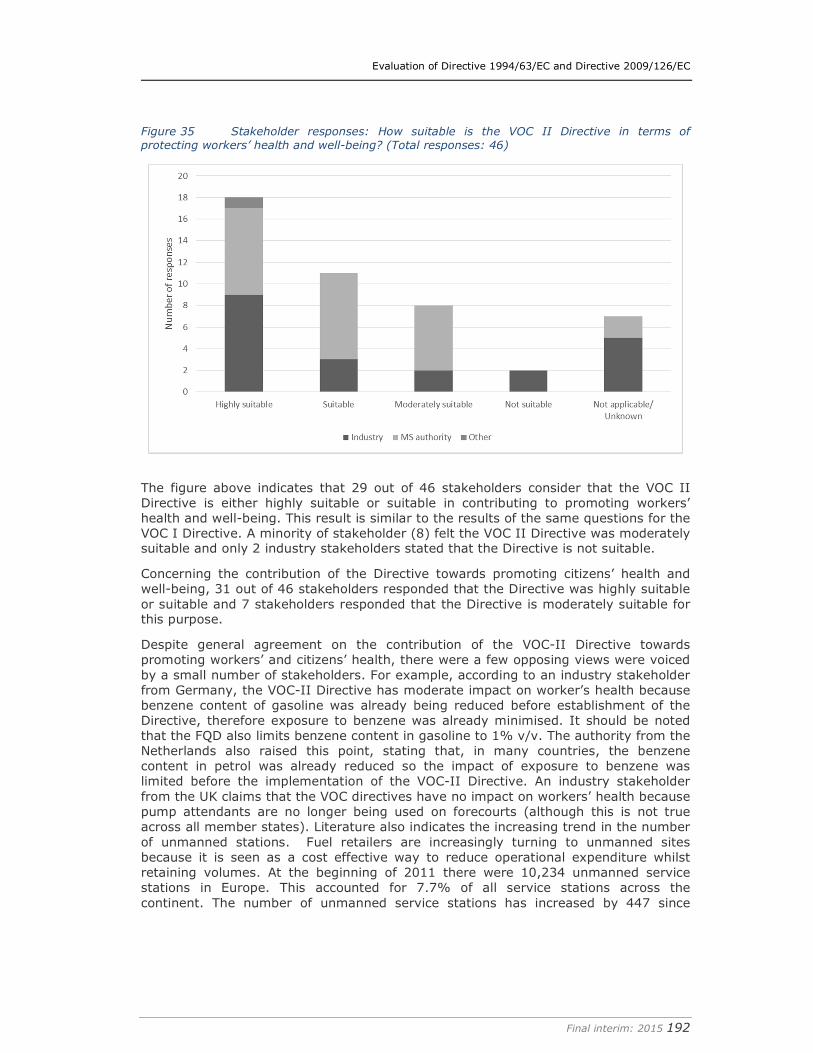
Evaluation of Directive 1994/63/EC and Directive 2009/126/EC
Final interim: 2015 192
Figure 35 Stakeholder responses: How suitable is the VOC II Directive in terms of
protecting workers’ health and well-being? (Total responses: 46)
The figure above indicates that 29 out of 46 stakeholders consider that the VOC II Directive is either highly suitable or suitable in contributing to promoting workers’ health and well-being. This result is similar to the results of the same questions for the VOC I Directive. A minority of stakeholder (8) felt the VOC II Directive was moderately suitable and only 2 industry stakeholders stated that the Directive is not suitable.
Concerning the contribution of the Directive towards promoting citizens’ health and well-being, 31 out of 46 stakeholders responded that the Directive was highly suitable or suitable and 7 stakeholders responded that the Directive is moderately suitable for this purpose.
Despite general agreement on the contribution of the VOC-II Directive towards promoting workers’ and citizens’ health, there were a few opposing views were voiced by a small number of stakeholders. For example, according to an industry stakeholder from Germany, the VOC-II Directive has moderate impact on worker’s health because benzene content of gasoline was already being reduced before establishment of the Directive, therefore exposure to benzene was already minimised. It should be noted that the FQD also limits benzene content in gasoline to 1% v/v. The authority from the Netherlands also raised this point, stating that, in many countries, the benzene content in petrol was already reduced so the impact of exposure to benzene was limited before the implementation of the VOC-II Directive. An industry stakeholder from the UK claims that the VOC directives have no impact on workers’ health because pump attendants are no longer being used on forecourts (although this is not true across all member states). Literature also indicates the increasing trend in the number of unmanned stations. Fuel retailers are increasingly turning to unmanned sites because it is seen as a cost effective way to reduce operational expenditure whilst retaining volumes. At the beginning of 2011 there were 10,234 unmanned service stations in Europe. This accounted for 7.7% of all service stations across the continent. The number of unmanned service stations has increased by 447 since
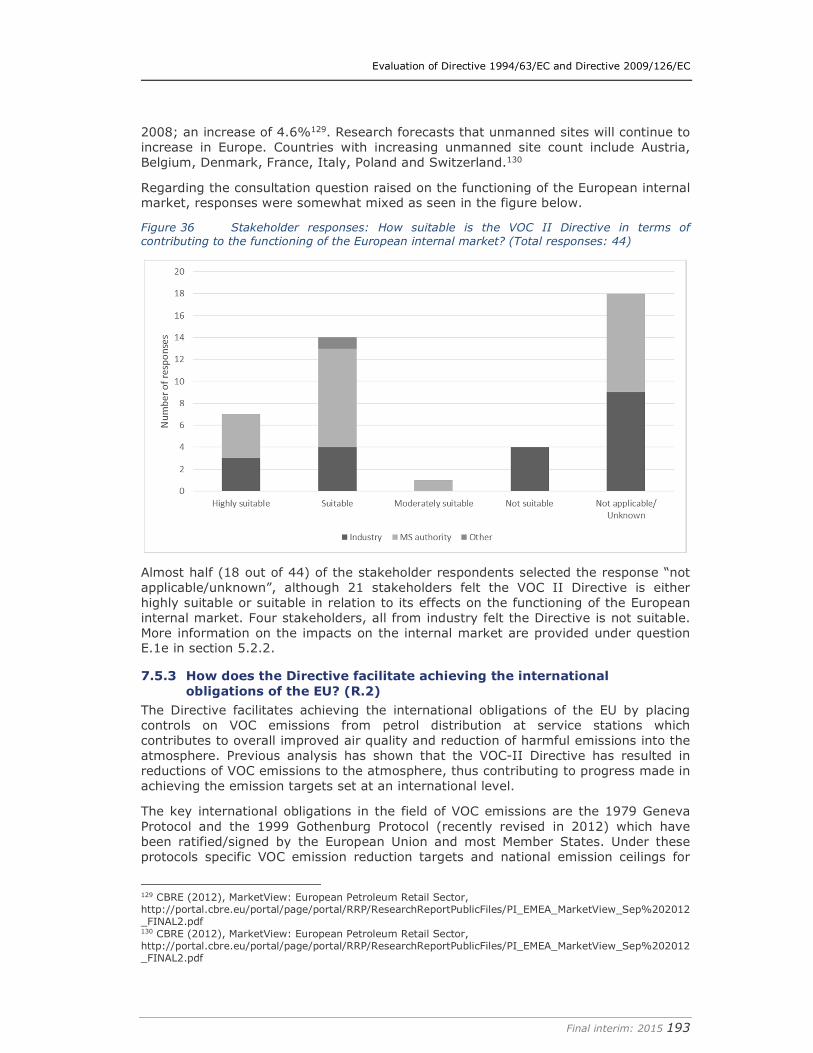
Evaluation of Directive 1994/63/EC and Directive 2009/126/EC
Final interim: 2015 193
2008; an increase of 4.6%129. Research forecasts that unmanned sites will continue to increase in Europe. Countries with increasing unmanned site count include Austria, Belgium, Denmark, France, Italy, Poland and Switzerland.130
Regarding the consultation question raised on the functioning of the European internal market, responses were somewhat mixed as seen in the figure below.
Figure 36 Stakeholder responses: How suitable is the VOC II Directive in terms of
contributing to the functioning of the European internal market? (Total responses: 44)
Almost half (18 out of 44) of the stakeholder respondents selected the response “not applicable/unknown”, although 21 stakeholders felt the VOC II Directive is either highly suitable or suitable in relation to its effects on the functioning of the European internal market. Four stakeholders, all from industry felt the Directive is not suitable. More information on the impacts on the internal market are provided under question E.1e in section 5.2.2.
7.5.3 How does the Directive facilitate achieving the international
obligations of the EU? (R.2)
The Directive facilitates achieving the international obligations of the EU by placing controls on VOC emissions from petrol distribution at service stations which contributes to overall improved air quality and reduction of harmful emissions into the atmosphere. Previous analysis has shown that the VOC-II Directive has resulted in reductions of VOC emissions to the atmosphere, thus contributing to progress made in achieving the emission targets set at an international level.
The key international obligations in the field of VOC emissions are the 1979 Geneva Protocol and the 1999 Gothenburg Protocol (recently revised in 2012) which have been ratified/signed by the European Union and most Member States. Under these protocols specific VOC emission reduction targets and national emission ceilings for
129 CBRE (2012), MarketView: European Petroleum Retail Sector, http://portal.cbre.eu/portal/page/portal/RRP/ResearchReportPublicFiles/PI_EMEA_MarketView_Sep%202012_FINAL2.pdf 130 CBRE (2012), MarketView: European Petroleum Retail Sector, http://portal.cbre.eu/portal/page/portal/RRP/ResearchReportPublicFiles/PI_EMEA_MarketView_Sep%202012_FINAL2.pdf
Evaluation of Directive 1994/63/EC and Directive 2009/126/EC
Final interim: 2015 194
VOC have been established. In particular, the Geneva Protocol included specific requirements related to petrol vapour recovery.
There was no significant indication from the literature review or stakeholder feedback suggesting that the Directive hampers the achievement of international obligations. Further information related to this question is provided under the evaluation of effectiveness under question E.1d in section 7.2.1, as this goal links to core objectives of the Directive.
7.5.4 What (if any) obsolete provisions in the Directive can be identified and
why are such provisions obsolete? (R.3)
This question aims to provide responses on whether there are any specific provisions in the Directive that are no longer relevant. The responses here are interlinked with the responses provider under question C2 on the identification of gaps and overlaps and question R1 on whether the Directive continues to address current needs. To some extent the response to this question is also linked to the evaluation of the Directive’s effectiveness in section 7.2.
Little information from literature or stakeholder feedback has been identified to indicate whether or not there are any obsolete provisions in the VOC-II Directive. This could be due to the fact that the Directive is still in an implementation phase with the deadline planned for 2018 (for installations with a throughput greater than 3000m3). Likewise it could simply be because there are no obsolete provisions.
One particular issue that was highlighted concerns the requirements under Article 5(3) on consumer information. A few stakeholders felt that this requirement has little impact on consumer awareness, and was therefore not necessary. Further discussion on this aspect is provided under question R5 in section 7.5.6.
7.5.5 How has the Directive adapted to any technical or other developments
since its adoption? (R.4)
This question aims to determine whether and how the Directive has responded to and adapted to progress. The technical or other progress that has been made since the adoption of the Directives is also discussed.
� What technical or other progress has been made since the adoption of
the Directive?
The Directive has driven innovation and technology developments because since its adoption, there has been progress in technology seen in vapour recovery technologies during refuelling. For example, an industry stakeholder stated that the Directive focuses on the value of vapour as an asset, which has driven innovation in technology. Furthermore, according to a UK industry stakeholder, the Directive has remained stable in terms of performance requirements, and is therefore quite useful in allowing for continuous technological developments in equipment without an overlay of performance changes. However, the stakeholder points out that there has been no re-examination of the relative performance of on-vehicle systems (ORVR), which are now routine in the US from all global vehicle manufacturers. However, as has been noted in the analyses above, ORVR is not considered to be within the scope of VOC-II as this is not part of the station's equipment but of the vehicle, which is governed by other legislation e.g. the EURO 5 and 6 Regulations, etc. Further information on this issue is provided in question E7 in section 5.2.8.
� How has the Directive responded to and adapted to progress?
Article 8 of the VOC_II Directive addresses technical adaptations to ensure consistency with relevant standards drawn up by the European Committee for Standardisation
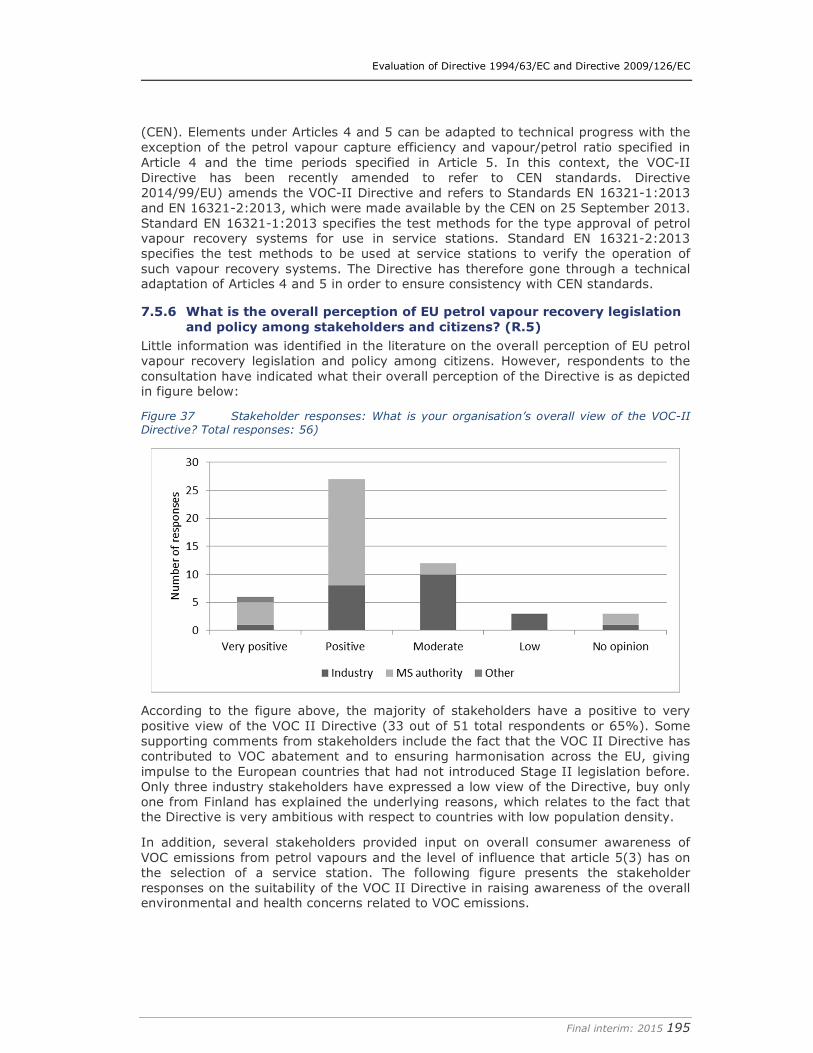
Evaluation of Directive 1994/63/EC and Directive 2009/126/EC
Final interim: 2015 195
(CEN). Elements under Articles 4 and 5 can be adapted to technical progress with the exception of the petrol vapour capture efficiency and vapour/petrol ratio specified in Article 4 and the time periods specified in Article 5. In this context, the VOC-II Directive has been recently amended to refer to CEN standards. Directive 2014/99/EU) amends the VOC-II Directive and refers to Standards EN 16321-1:2013 and EN 16321-2:2013, which were made available by the CEN on 25 September 2013. Standard EN 16321-1:2013 specifies the test methods for the type approval of petrol vapour recovery systems for use in service stations. Standard EN 16321-2:2013 specifies the test methods to be used at service stations to verify the operation of such vapour recovery systems. The Directive has therefore gone through a technical adaptation of Articles 4 and 5 in order to ensure consistency with CEN standards.
7.5.6 What is the overall perception of EU petrol vapour recovery legislation
and policy among stakeholders and citizens? (R.5)
Little information was identified in the literature on the overall perception of EU petrol vapour recovery legislation and policy among citizens. However, respondents to the consultation have indicated what their overall perception of the Directive is as depicted in figure below:
Figure 37 Stakeholder responses: What is your organisation’s overall view of the VOC-II Directive? Total responses: 56)
According to the figure above, the majority of stakeholders have a positive to very positive view of the VOC II Directive (33 out of 51 total respondents or 65%). Some supporting comments from stakeholders include the fact that the VOC II Directive has contributed to VOC abatement and to ensuring harmonisation across the EU, giving impulse to the European countries that had not introduced Stage II legislation before. Only three industry stakeholders have expressed a low view of the Directive, buy only one from Finland has explained the underlying reasons, which relates to the fact that the Directive is very ambitious with respect to countries with low population density.
In addition, several stakeholders provided input on overall consumer awareness of VOC emissions from petrol vapours and the level of influence that article 5(3) has on the selection of a service station. The following figure presents the stakeholder responses on the suitability of the VOC II Directive in raising awareness of the overall environmental and health concerns related to VOC emissions.
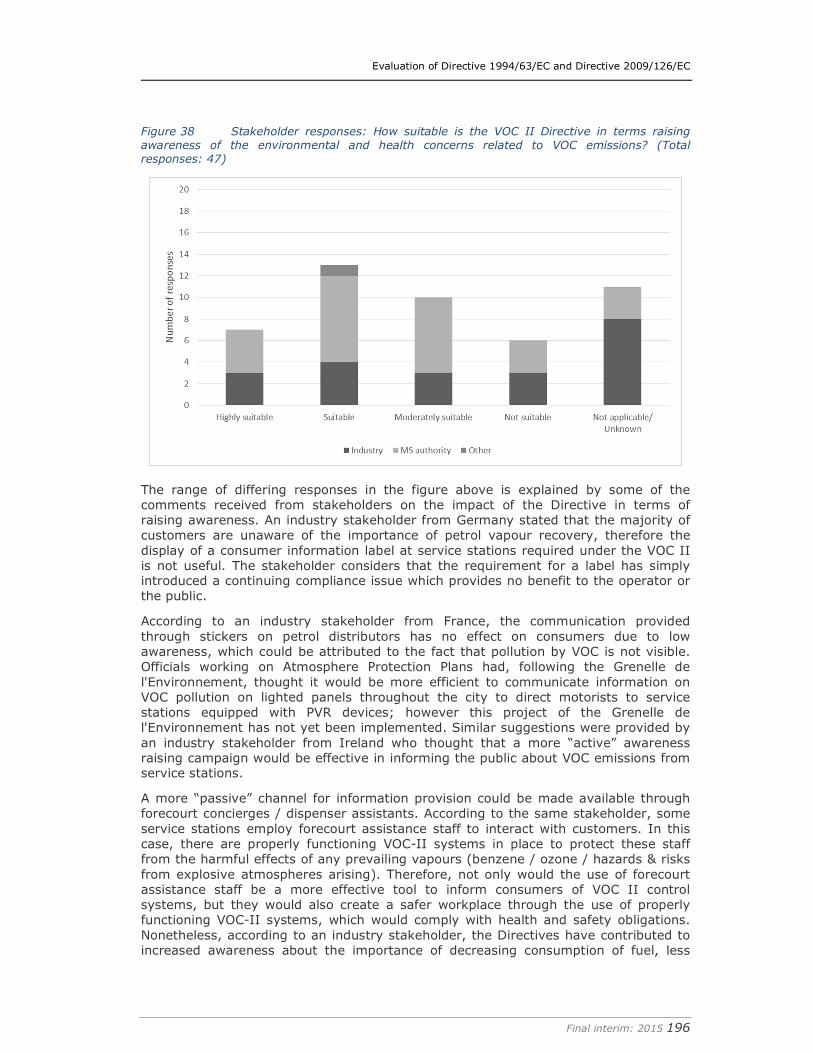
Evaluation of Directive 1994/63/EC and Directive 2009/126/EC
Final interim: 2015 196
Figure 38 Stakeholder responses: How suitable is the VOC II Directive in terms raising
awareness of the environmental and health concerns related to VOC emissions? (Total
responses: 47)
The range of differing responses in the figure above is explained by some of the comments received from stakeholders on the impact of the Directive in terms of raising awareness. An industry stakeholder from Germany stated that the majority of customers are unaware of the importance of petrol vapour recovery, therefore the display of a consumer information label at service stations required under the VOC II is not useful. The stakeholder considers that the requirement for a label has simply introduced a continuing compliance issue which provides no benefit to the operator or the public.
According to an industry stakeholder from France, the communication provided through stickers on petrol distributors has no effect on consumers due to low awareness, which could be attributed to the fact that pollution by VOC is not visible. Officials working on Atmosphere Protection Plans had, following the Grenelle de l'Environnement, thought it would be more efficient to communicate information on VOC pollution on lighted panels throughout the city to direct motorists to service stations equipped with PVR devices; however this project of the Grenelle de l'Environnement has not yet been implemented. Similar suggestions were provided by an industry stakeholder from Ireland who thought that a more “active” awareness raising campaign would be effective in informing the public about VOC emissions from service stations.
A more “passive” channel for information provision could be made available through forecourt concierges / dispenser assistants. According to the same stakeholder, some service stations employ forecourt assistance staff to interact with customers. In this case, there are properly functioning VOC-II systems in place to protect these staff from the harmful effects of any prevailing vapours (benzene / ozone / hazards & risks from explosive atmospheres arising). Therefore, not only would the use of forecourt assistance staff be a more effective tool to inform consumers of VOC II control systems, but they would also create a safer workplace through the use of properly functioning VOC-II systems, which would comply with health and safety obligations. Nonetheless, according to an industry stakeholder, the Directives have contributed to increased awareness about the importance of decreasing consumption of fuel, less
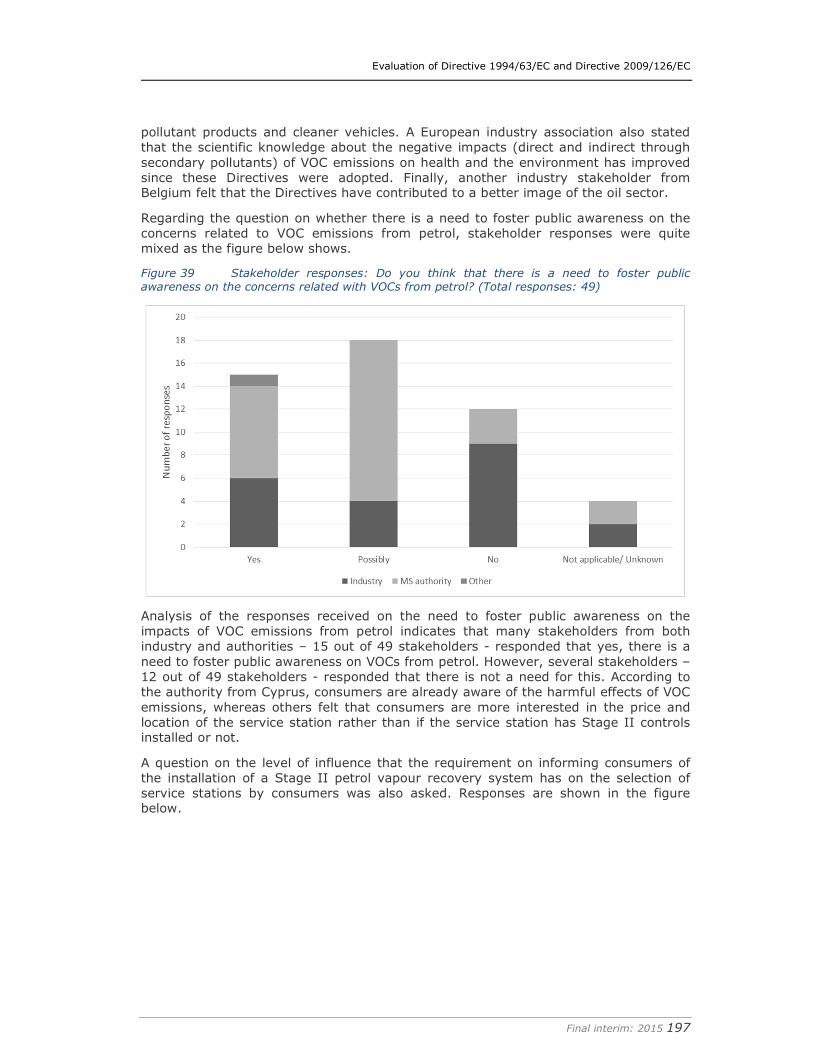
Evaluation of Directive 1994/63/EC and Directive 2009/126/EC
Final interim: 2015 197
pollutant products and cleaner vehicles. A European industry association also stated that the scientific knowledge about the negative impacts (direct and indirect through secondary pollutants) of VOC emissions on health and the environment has improved since these Directives were adopted. Finally, another industry stakeholder from Belgium felt that the Directives have contributed to a better image of the oil sector.
Regarding the question on whether there is a need to foster public awareness on the concerns related to VOC emissions from petrol, stakeholder responses were quite mixed as the figure below shows.
Figure 39 Stakeholder responses: Do you think that there is a need to foster public awareness on the concerns related with VOCs from petrol? (Total responses: 49)
Analysis of the responses received on the need to foster public awareness on the impacts of VOC emissions from petrol indicates that many stakeholders from both industry and authorities – 15 out of 49 stakeholders - responded that yes, there is a need to foster public awareness on VOCs from petrol. However, several stakeholders – 12 out of 49 stakeholders - responded that there is not a need for this. According to the authority from Cyprus, consumers are already aware of the harmful effects of VOC emissions, whereas others felt that consumers are more interested in the price and location of the service station rather than if the service station has Stage II controls installed or not.
A question on the level of influence that the requirement on informing consumers of the installation of a Stage II petrol vapour recovery system has on the selection of service stations by consumers was also asked. Responses are shown in the figure below.
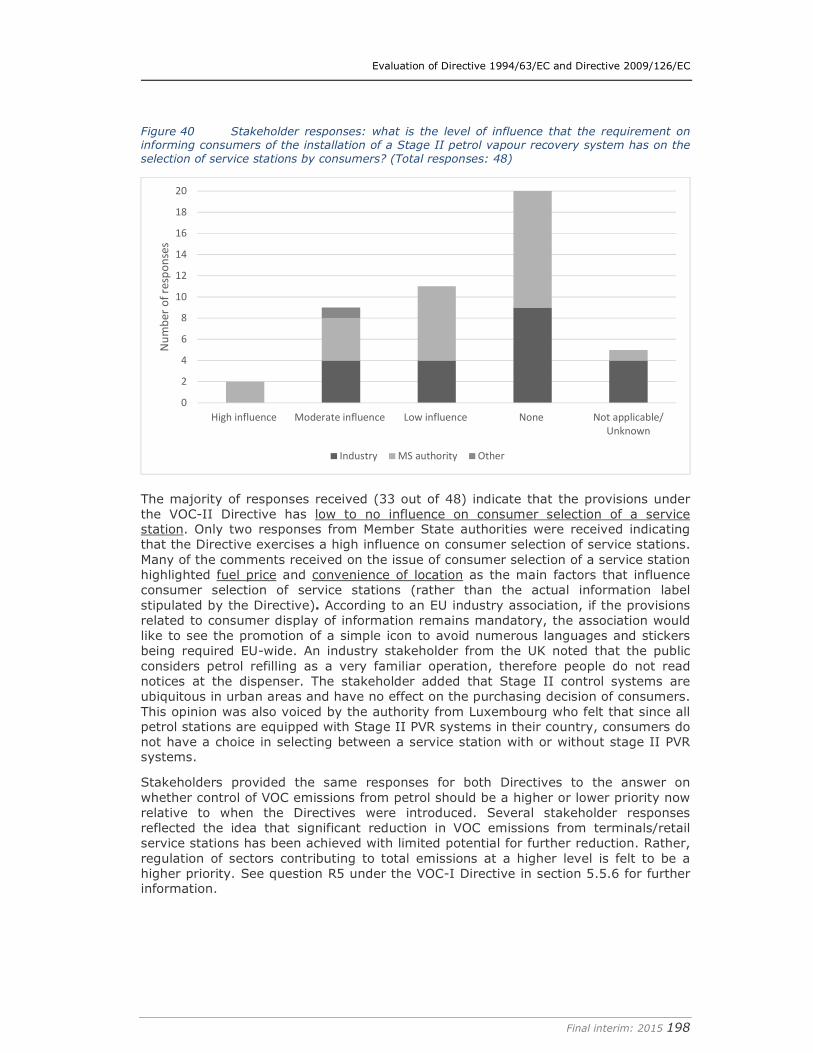
Evaluation of Directive 1994/63/EC and Directive 2009/126/EC
Final interim: 2015 198
Figure 40 Stakeholder responses: what is the level of influence that the requirement on informing consumers of the installation of a Stage II petrol vapour recovery system has on the
selection of service stations by consumers? (Total responses: 48)
The majority of responses received (33 out of 48) indicate that the provisions under the VOC-II Directive has low to no influence on consumer selection of a service station. Only two responses from Member State authorities were received indicating that the Directive exercises a high influence on consumer selection of service stations. Many of the comments received on the issue of consumer selection of a service station highlighted fuel price and convenience of location as the main factors that influence consumer selection of service stations (rather than the actual information label stipulated by the Directive). According to an EU industry association, if the provisions related to consumer display of information remains mandatory, the association would like to see the promotion of a simple icon to avoid numerous languages and stickers being required EU-wide. An industry stakeholder from the UK noted that the public considers petrol refilling as a very familiar operation, therefore people do not read notices at the dispenser. The stakeholder added that Stage II control systems are ubiquitous in urban areas and have no effect on the purchasing decision of consumers. This opinion was also voiced by the authority from Luxembourg who felt that since all petrol stations are equipped with Stage II PVR systems in their country, consumers do not have a choice in selecting between a service station with or without stage II PVR systems.
Stakeholders provided the same responses for both Directives to the answer on whether control of VOC emissions from petrol should be a higher or lower priority now relative to when the Directives were introduced. Several stakeholder responses reflected the idea that significant reduction in VOC emissions from terminals/retail service stations has been achieved with limited potential for further reduction. Rather, regulation of sectors contributing to total emissions at a higher level is felt to be a higher priority. See question R5 under the VOC-I Directive in section 5.5.6 for further information.
0
2
4
6
8
10
12
14
16
18
20
High influence Moderate influence Low influence None Not applicable/
Unknown
Nu
mb
er
of
resp
on
ses
Industry MS authority Other
Evaluation of Directive 1994/63/EC and Directive 2009/126/EC
Final interim: 2015 199
7.6 EU added-value
7.6.1 Overview
Following the same approach as for the VOC-I Directive as described under section 0 the subsequent sections provide preliminary findings on the evaluation of EU added-value, which has been structured around the responses to five principal questions and along several sub-questions. The aim of this section is to assess the additional value resulting from the Directive, compared to what could be achieved by Member States at national and/or regional levels.
7.6.2 What has been the EU added value of the VOC-II Directive? (AV.1)
Before the adoption of the VOC-II Directive, the majority of Member States already required the use of Stage II PVR equipment in service stations. This is the case of Austria, Belgium, Czech Republic, Denmark, France, Germany, Hungary, Italy, Lithuania, Luxembourg, the Netherlands, Poland, Slovakia, Sweden and the UK. In addition, Estonia was considering adopting legislation on Stage II controls when the European legislation was introduced and it appears that Latvia had some kind of requirements in place, though this still needs to be confirmed.
This situation created the potential for requirements and standards being set differently at national level. Member States were also opting for different PVR equipment, some of which were less efficient than what was then determined by the Directive (e.g. passive Stage II controls).
The adoption of the VOC-II Directive was therefore relevant to driving standardisation and achieving consistency across Member States’ approaches. The Directive has therefore amended a situation where Stage II controls were being regulated by a multitude of national initiatives with potential for impacts on competitiveness and creating challenges for pan-European trading firms. However, the review of Member States’ practices (see Table 6.2) has shown that, whilst the Directive has been successful in creating a minimum standard, some national regulations (11) transposing the requirements of the VOC-II Directive (or which were introduced prior to the Directive) have gone beyond its requirements.
Respondents to the survey confirmed that the main added value of the VOC-II Directive is to harmonise the approach to VOC emissions reductions across Europe (out of 49 responses, 44 indicated that the VOC-II Directive contributed to a large or some extent to this) and the harmonisation of standards and techniques (out of 49 responses 35 indicated that the VOC-II Directive contributed to a large or some extent to this).
7.6.3 To what extent do the issues addressed by the Directive continue to
require action at EU level? (AV.2)
Respondents mostly acknowledged the benefits in having VOC emissions abatement from petrol storage and transport being administered at EU level, harmonising approaches and providing a safety net to ensure a minimum level of health and environmental protection.
Out of the 38 responses received in this regard, 25 stated that VOC emissions from this sector are sufficiently addressed at EU (and Member State) level, and four respondents added that with the adoption and implementation of the VOC-II Directive there is little gain expected from further EU action (Estonia, Hungary, Spain, and the UK).
Some issues were identified by respondents which may need further actions at EU level. Understanding what constitutes “major refurbishment” was found to be
Evaluation of Directive 1994/63/EC and Directive 2009/126/EC
Final interim: 2015 200
challenging by some competent authorities and industry respondents in some Member States including Croatia, Greece, Hungary, Ireland, Spain and the UK. The determination of the actual throughput of petrol was also highlighted as source of confusion. More information is included on this issue in Section 7.3.5. In addition, some stakeholders have provided additional suggestions: One stakeholder (EU wide association) indicated that more action is needed to ensure air pollution, including VOC emissions from petrol storage and distribution, are reduced. One Member State (France) noted that the issue of explosion risk was not addressed sufficiently by the Directive (though this is arguably outside its scope). The German Competent Authority also indicated that changes should be made to the legislation to require a mandatory use of automatic monitoring which would ensure the correct functioning of PVR equipment (this has been discussed in detail in section 6.3.3).
7.6.4 What would be the most likely impacts of repealing the Directive?
(AV.3)
Considering that Member States had already started to adopt national legislation to regulate the use of Stage II controls, repealing the Directive would affect mostly those Member States that had no prior legislation and that still in the process of applying Stage II controls (prior to the 2018 deadline and for new/refurbished stations). Indeed, without the introduction of the VOC-II Directive several Member States would still have adopted legislation on Stage II controls.
Furthermore, the international obligations under the Gothenburg Protocol are relevant, as these would also act as a driver for Member States to apply Stage II controls (indeed this was the driver for introduction of controls in the UK).
In case the Directive was repealed it is of note that CEN standards are now available and cover most of the provisions under the Directives. Nonetheless, it is possible that without the Directive, emission controls would cease to be tested and verified and/or to be required for new facilities. On the other hand, it is likely that industry might continue to operate them due to the benefit associated with petrol recovery and resale.
A few Member States (Latvia and the Netherlands) highlighted that EU level legislation makes it difficult to take into account local conditions such as climatic conditions. As a result it is likely that, were the Directive to be repealed, these Member States would adopt vapour recovery thresholds more suited to their local conditions. This could in turn lead to competitiveness and technical barriers issues.
Finally ozone is a transboundary air pollutant for which EU wide action has been found to be justified in numerous instances. Disjointing actions on ozone pollution would likely reduce the efficiency of the existing framework.
7.6.5 How did VOC-II provide added value to those Member States in which
similar measures were already in place and how did those Member
States profit from implementing VOC-II in Member States where such
measures were not in place? (AV.4)
Fifteen Member States had adopted Stage II control measure prior to the adoption and implementation of the VOC-II Directive. Their feedback indicated that the adoption of the VOC-II Directive has ensured that the competitiveness of these Member States was not negatively affected.
In Member States that had similar measures to the VOC-II Directive already in place in their national legislation, no difficulty was identified with the implementation of the Directive. Their pre-existing experience with implementing and enforcing Stage II control measures has proven to be a positive aspect. In addition, an industry
Evaluation of Directive 1994/63/EC and Directive 2009/126/EC
Final interim: 2015 201
stakeholder notes that while a level playing field exists this has in effect allowed equipment manufacturers from those countries where legislation was previously in place (particularly Germany) to come to dominate the European market.
For other Member States, for which such measures were not in place, the VOC-II Directive has ensured the harmonisation with other Member States. Respondents from Croatia and Ireland indicated that it was doubtful that a voluntary approach would have achieved the same benefits and that without the Directive, Stage II controls would not have been applied as uniformly and with the same mandatory obligations.
7.6.6 How does the Directive contribute to improving air quality and health
in the Union? (AV.5)
The VOC-II Directive has entered into force recently. Its requirement apply to new service stations since 2012 and to existing service stations with a throughput threshold above 3,000 m3 from 2018. As a result it is too early to fully quantify the benefits to air quality and health brought about by the Directive. Nonetheless emission reductions have been quantified in section 7.2.2, whereas benefits to date have been estimated in section 7.3.2.
Evaluation of Directive 1994/63/EC and Directive 2009/126/EC
Final interim: 2015 202
8. Conclusions and recommendations
8.1 Overview
This section presents preliminary conclusions and recommendations based on the findings outlined above for both Directives.
It is noted that this interim report represents a snapshot of progress made to date with the study and that there are a number of key areas that will be investigated further following its submission and discussion with the Steering group. It also relevant to take into account the data limitations outlined in section 3.3.4.
8.2 Overall conclusions and recommendations for VOC-I Directive
Based on the evaluation of the VOC-I Directive, several preliminary conclusions and recommendations can be made at this stage:
Key conclusions
The overall picture arising from the implementation assessment and the evaluation can be summarised as follows:
Implementation
� Despite some data gaps, the vast majority of work to implement the VOC-I Directive by the Member States and the affected industry has already been done and, with a few seemingly minor exceptions (based on the data available), the provisions seem to have been fully implemented.
� Most Member States seemed to have experienced few, if any, technical problems in implementing the Directive although specific issues have been identified for the Sweden and Finland in that they do not fully comply with the requirements in Annex IV (on mobile tankers), in relation to differences in the concentration limits for VOC emissions at vapour recovery units (VRUs) as well as concerning the interaction of Stage I controls with Stage II controls in service stations, which can lead to excessive pressure building up in the storage tank.
Evaluation
� The VOC-I Directive has led to changes in the petrol storage and distribution sector that have contributed to its objectives of harmonisation and effective operation of the single market, contribution to compliance with international obligations and reduction of VOC emissions.
� The legislation has helped to create a level playing field and common approach amongst the Member States. National legislation is generally aligned with the Directive, with only some exceptions. The legal framework has been key in promoting cross-border trade of petrol and equipment by including detailed provisions specifying technical requirements (e.g. on the sizing of equipment).
� Current annual emissions from the activities covered by the Directive have been estimated to be around 259 kt less than the annual emission levels in 1995 (399kt), which is on average a reduction of 15kt per year. These can be largely attributed to the Directive (59% of the reduction), though other factors also had an influence (39% of reductions were due to decrease in petrol consumption and a further 2% from national legislation pre-dating the Directive). Future reductions in the sector have been also estimated (10Kt). It has not been possible to establish exactly what may be attributed to the Directive, although it is expected that the vast majority of the reductions will occur due to a decrease in petrol consumption, as most of the Member States have already achieved an uptake of Stage I controls
Evaluation of Directive 1994/63/EC and Directive 2009/126/EC
Final interim: 2015 203
of 100%. It should be noted that this estimation is subject to a high level of uncertainty associated with the use of a number of assumptions.
� By comparison, the total reductions that may be attributed to the VOC-I Directive since 1995 (153 kt) correspond to 2% of the total reductions of anthropogenic VOC emissions that occurred from 1995 to 2012 according to the EEA (6,361 kt). Collectively, the current emissions of the activities controlled by the VOC-I Directive represent around 0.1% of the total man-made VOC emissions in the EU-28.
� The reductions in VOC emissions achieved by the Directive help the member states and the EU to achieve the national ceilings and emission reduction targets set at an international level. They contribute to lower ozone concentrations and reduced exposure to harmful VOC (e.g. benzene), although it has not been possible to quantify these effects.
� Limited quantified evidence (both ex-ante and ex-post) on the costs and benefits of implementing Stage I controls for operators and authorities has been identified, mainly due to its implementation a long time ago. Fitting Stage I equipment at terminals appears to have been more costly and complex than retrofitting service stations. Small throughput sites, especially those operated by SME, are likely to have faced higher compliance costs.
� Total annualised costs required to achieve estimated VOC emission reductions would have needed to be more than the estimated annualised benefits resulting from the reduction of the harmful effects on health and the environment associated with VOC emissions reductions (between €162m and €479m for the EU-28) and the financial benefits from sales of recovered petrol (€136m), although it is noted that these estimates are subject to uncertainty. In addition there other non-monetised benefits associated with the safeguarding of employment in this sector (equipment manufacture/testing) and the financial benefits through having harmonised technical provisions.
� Despite the fact that the VOC-I Directive has been established for several years in the EU, it remains relevant because it responds to the environmental and health objectives of the EU by contributing to the reduction of harmful VOC emissions into the atmosphere from petrol storage and distribution.
� Overall, the Directive’s objectives are coherent with other EU and international legislation on air quality, although some overlaps were identified regarding some of the technical requirements and provisions in terms of potential for simplification.
� Whilst the approach chosen with the Directive, involving the establishment of emission limits and detailed technical provisions, may have been appropriate at the time it was introduced, some stakeholders consulted for the study have suggested that a more flexible approach that enables the Directive to be adapted to technical progress and innovation could have led to further reductions in emissions. However, this has not prevented Member States from setting stricter emission limits in their national legislation and reaching performance levels beyond those stipulated by the Directive.
� The Directive has not been adapted to technological progress and developments, though it includes a mechanism for doing so in principle. Since the adoption of the Directive, there have been technological and practical improvements that have the potential to increase the efficiency of petrol vapour recovery, though it has been estimated that these would only achieve relatively minor VOC reductions compared with the current situation. Such technologies and practices are not necessarily covered by the Directive, therefore there is potential for the Directive to better respond to today’s needs by better addressing these. In this context, a few approaches, including the provision of guidance, have been identified that could be
Evaluation of Directive 1994/63/EC and Directive 2009/126/EC
Final interim: 2015 204
applied to make the Directive simpler and consistent with the current state of art while maintaining its integrity and purpose. It should nevertheless be noted that this has not prevented Member States and industry from implementing technological improvements.
Recommendations
Several possible recommendations have been identified through the analysis of literature and stakeholder input that deserve further investigation:
� A potential decision to harmonise the VOC emission limit for VRUs established in the VOC-I Directive (35 g/m³) with that established in the Gothenburg Protocol (10 g/m³) would require further analysis to determine whether the benefits would outweigh the costs and potential administrative burdens of a revision. This analysis would need to take into consideration the following:
o The Directive as it stands is not a barrier for Member States to apply more stringent requirements or extend the scope of application through national legislation. Rather, the Directive sets up a minimum level of requirements for controlling VOC emissions from petrol storage and ensures, to a certain extent, a level playing field among the Member States by obliging them all to meet at least the minimum requirements.
o Lowering the current ELV for VRUs at terminals could result in net benefits for the EU in terms of emission reductions, though these reductions are estimated to be relatively small. This is because emissions from many installations will already be substantially below the Directive´s limit, due to stricter national provisions or because actual performance of equipment will generally be better than the limit value.
� Further emission reductions from the activities covered by the Directive could be achieved through application of technical improvements to storage tanks at terminals and during the unloading of petrol. Moreover further reductions could be achieved through the control/capture of tank breathing emissions that would otherwise be released from pressure/vacuum relief valves, and which are currently not regulated under the VOC-I Directive. Overall, it appears that if these technical improvements were to be implemented they could achieve relatively minor reductions of VOC emissions, compared to the current situation. Therefore the potential benefits compared to the costs and administrative burden of integrating these into Directive appears to be limited. Moreover, as noted previously, the Directive has not prevented Member States and industry from implementing technological improvements. Alternatively, the Commission could consider exploring and encouraging the implementation of these technologies/techniques through other instruments, including the publication of guidance, best-practice or the support of initiatives that encourage the uptake of more efficient technologies as well as those that contribute to preventing over-pressurisation and expansion in the underground storage tanks which could arise from the use of Stage II systems.
� Related to the above, several areas could be further investigated so that the different air quality and emissions legislation along with the VOC-I Directive can work better work together. These include the promotion of greater international cooperation in this field (e.g. promotion of training activities/seminars) and of initiatives that encourage technological innovation.
� There is scope to simplify the Directive through its amendment and the removal of certain technical requirements, which could be replaced with references to external documents such as CEN Standards. However, a number of disadvantages associated with this approach have been described, including the creation of significant administrative burden compared to the potential benefits. In comparison the issuance of guidance would enable some of the issues identified to
Evaluation of Directive 1994/63/EC and Directive 2009/126/EC
Final interim: 2015 205
be addressed (e.g. the particular situation of Sweden and Finland due to their local conditions) without imposing a significant burden on Member States (e.g. time and resources associated with negotiating the new directive, amending national legislation, familiarisation, etc.).
8.3 Overall conclusions and recommendations for VOC-II Directive
Based on the evaluation of the VOC-II Directive, several preliminary conclusions and recommendations can be made at this stage.
Key conclusions
The overall picture arising from the implementation assessment and the evaluation can be summarised as follows:
Implementation
� All Member States have transposed the Directive into their national legal systems, though in some cases (particularly those that had pre-existing legislation on Stage II controls) national regulations have gone beyond its requirements. Overall, it has been estimated that there are around 114,814 service stations in the EU-28, of which 82,550 (72%) are fitted with Stage II systems. Differences in the levels of implementation are influenced to a great extent by the prior existence of national legislation requiring Stage II installation. It is however noted that this estimation involves a degree of uncertainty, as it is based on a number of assumptions, which were necessary in the absence of data provided by some Member States on their level of uptake.
� With regards to the issues covered by Article 7, the following is noted:
o Based on the consultation responses, the 100 m3/year threshold is generally accepted as being appropriate. Moreover, analysis of the approach taken outside the EU shows that exemptions for small petrol stations have been also implemented elsewhere. Moreover, lowering the threshold is unlikely to have significant impact in terms of environmental benefit compared to the costs.
o Analysis of the requirement to test the in-service petrol vapour capture efficiency of Stage II systems has highlighted the importance of undertaking these routine tests (at least annually) to monitor the correct functioning of the equipment and hence the desired emission reductions. Some Member States also require testing of vapour tightness, which is not currently covered by the Directive. Without robust monitoring and control regimes, there is a risk that the intended VOC emissions reductions would not be achieved. As such Stage II systems typically provide a wide range (55-90%) of recovery efficiency which will be dependent on whether the V/P ratio established in the Directive is achieved and to the level of maintenance of the equipment.
o With regard to automatic monitoring systems, their use is only mandatory in three Member States, although some level of uptake (below 25%) has been also reported in those (which have provided data) where use is voluntary. While there are several benefits to installing automatic monitoring systems (including increased reliability and hence increased emission reductions), the key negative factors are the high capital costs and the ongoing operational and maintenance costs, as well as a lack of information and knowledge in some cases. Overall, the current voluntary approach implemented by the Directive seems to be appropriate in terms of cost-effectiveness, considering that overall emission savings from making these mandatory are likely to be small compared to a situation where Stage II systems are properly maintained. This approach enables service stations and regulatory authorities to decide on an individual basis whether the costs outweigh the benefits.
Evaluation of Directive 1994/63/EC and Directive 2009/126/EC
Final interim: 2015 206
� Most Member States seemed to have experienced few, if any, technical problems in implementing the Directive although specific issues have been identified with regard to the uptake of the “at pump” system in that reliable technologies do not seem to available, in relation to clarification of some terms (e.g. “major refurbishment”) as well as concerning the interaction of Stage I controls with Stage II controls in service stations. The introduction in the market of flexible-fuel vehicles that run on high ethanol concentrations has been flagged as a problem.
Evaluation
� Although the deadline for implementation of all provisions has not yet been reached (implementation of Stage II controls is ongoing), the VOC-II Directive has led to changes in the petrol storage and distribution sector that have contributed to its objectives of harmonisation and effective operation of the single market, contribution to compliance with international obligations and reduction of VOC emissions.
� Most Member States had already started to regulate the use of Stage II controls in service stations when the VOC-II Directive was introduced. However, the Directive has been relevant not only in requiring the application of these controls across the EU, but also to driving standardisation and achieving consistency across Member States’ approaches. Nonetheless, some differences still persist.
� An assessment has been made of the extent to which the Directive has been effective in reducing emissions. However, it is not feasible to determine accurately what would have happened in each Member State if the Directive had not been introduced, especially given the introduction of the Gothenburg protocol at the wider international level, which also requires the application of Stage II controls.
� Current annual emissions from the activities covered by the Directive have been estimated to be 159 kt less than the annual emission levels in 1995 (201kt), which is on average a reduction of 9kt per year since 1995. These can be largely attributed to the uptake of Stage II controls required under the Directive (54% of the reduction), though other factors also had an influence (43% of reductions being due to a decrease in petrol consumption and a further 3% from national legislation pre-dating 1995). Several other Member States had Stage II controls prior to the Directive, but it has not been possible to quantify the specific effect of post-1995 legislation in the results.
� Future reductions in the sector have been estimated to be 17.1 kt, of which 10 kt (59%) is estimated to be caused by a decrease in petrol consumption, whereas the remaining 7 kt (39%) is expected to be caused by the Directive, though it is noted that this is subject to a high level of uncertainty.
� By comparison, total reductions that may be attributed to the uptake of Stage II systems since 1995 (86 kt) corresponds to 1% of the total reductions of anthropogenic VOC emissions that occurred from 1995 to 2012 according to the EEA (6,361 kt). Estimated current emissions collectively represent around 0.6% of the total man-made VOC emissions in the EU-28.
� The reductions in VOC emissions achieved by the Directive help the Member States and the EU to achieve the national ceilings and emission reduction targets set at an international level. They contribute to lower ozone concentrations and reduced exposure to harmful VOC (e.g. benzene), although it has not been possible to quantify these effects.
� Limited quantified ex-post evidence on the costs and benefits of implementing Stage II controls for operators and authorities has been identified. However, available ex-ante data from the impact assessments developed on the Directive by the Commission and some Member States have been used to estimate the annual
Evaluation of Directive 1994/63/EC and Directive 2009/126/EC
Final interim: 2015 207
costs of implementing Stage II systems (i.e. not discounting the costs incurred prior to adoption of the Directive). It has been estimated that the investment made by Member States from 1995 corresponds to total annualised costs of €212m at EU level (€199.1m if the administrative and compliance costs are excluded). As a result of this, costs would fall within the range of the quantified annualised benefits estimated from health and crop damage avoided and benefits resulting from the petrol recovered (between €169m and €347m).
� Considering the additional costs and benefits of the uptake increase from the current level to 2020 calculated above, the costs would fall between the range of benefits estimated for that period (costs of €20.3m or €18.9m if the administrative and compliance costs are excluded, compared to benefits between €7.7m and €23m). Further there are other non-monetised benefits relating to employment or financial benefits from harmonisation.
� It appears that small throughput sites, especially those operated by SME, face higher compliance costs due to economies of scale and relative lack of resources.
� The VOC-II Directive appears to remain relevant because it responds to the environmental and health objectives of the EU by contributing to the reduction of harmful VOC emissions into the atmosphere from petrol storage and distribution.
� It appears that the Directive has kept up with technological developments and progress as seen through the recent amendment of the Directive, which makes reference to recent CEN standards. However, some stakeholders suggested that there is a need to consider onboard refuelling vapour recovery (ORVR) as cost-effective technology in delivering emission reductions. Nevertheless, although ORVR is very much linked to petrol vapour recovery, it is important to highlight that ORVR does not fall within the scope of the VOC-II Directive (and is outside the scope of the current study) as this concerns the vehicle’s equipment and not the service station equipment.
� Overall, no particular incoherencies were identified with the objectives of the VOC-II Directive and other relevant EU and international legislation that aim to improve air quality. However, a potential overlap was identified between the VOC-II Directive and the Fuel Quality Directive concerning derogations to allow bioethanol and low temperature waivers, which may hamper the overall effectiveness of Stage II controls. In practice, these instruments are considered coherent, as the process for allowing higher volatility petrol under the FQD takes into account the application of Stage II controls, and includes provisions for ensuring that VOC emission increases do not detract from meeting national and international emissions and air quality obligations.
Recommendations
Based on the analysis of literature and stakeholders, some potential recommendations have been identified that deserve further investigation:
� The interaction between the VOC-II Directive and the FQD. A synergy that could be explored relates to the fact that the FQD directly affects the composition of petrol vapour. As such the possibility to impose additional limits to harmful VOC that are petrol components could be explored. This would need to be further analysed to determine whether the benefits would outweigh the costs and potential administrative burdens of a revision.
� There is limited scope for simplification compared to the VOC-I Directive, and any such simplification appears to be better achieved with the issuance of guidance rather than with an amendment to the directive. In particular, the following issues may warrant further attention:
Evaluation of Directive 1994/63/EC and Directive 2009/126/EC
Final interim: 2015 208
o Assess ways to improve the effectiveness of Article 5.3 on consumer information, which as noted by several stakeholders is believed to have little impact on consumer awareness. As suggested by several stakeholders, the majority of customers are unaware of the importance of petrol vapour recovery and current label systems do not seem to be effective. This could be addressed by the compilation and exchange of ideas on best practice and the implementation of awareness raising campaigns.
o The interactions between Stage I and Stage II systems and the impact of flexible-fuel vehicles that run on high ethanol concentrations (E85). This could be addressed as part of a CEN standard or in a Commission Opinion as noted before for the VOC-I Directive.
o How to determine the actual throughput and what constitutes a “major refurbishment” could be further clarified. This could take into account the Opinion of the European Economic and Social Committee (EESC, 2008)131 at the time of adoption of the VOC-II Directive as well as the different approaches adopted at national level (as described in Appendix D).
131 COM(2008) 812 final — 2008/0229 (COD)
Evaluation of Directive 1994/63/EC and Directive 2009/126/EC
Final interim: 2015 209
Appendix A References
A.1 EU Legislation/ Communications
European Parliament and Council Directive 94/63/EC of 20 December 1994 on the control of volatile organic compound (VOC) emissions resulting from the storage of petrol and its distribution from terminals to service stations (OJ L 365, 31/12/1994, p. 24-33)
Directive 2009/126/EC of the European Parliament and of the Council of 21 October 2009 on Stage II petrol vapour recovery during refuelling of motor vehicles at service stations (OJ L 285, 31/10/2009, p. 36-39)
Directive 2001/81/EC of the European Parliament and of the Council of 23 October 2001 on national emission ceilings for certain atmospheric pollutants (OJ L 309, 27.11.2001, p.22)
Directive 2004/42/CE of the European Parliament and of the Council of 21 April 2004 on the limitation of emissions of volatile organic compounds due to the use of organic solvents in certain paints and varnishes and vehicle refinishing products and amending Directive 1999/13/EC (OJ L 143, 30/04/2004, p. 87-96)
Directive 2008/50/EC of the European Parliament and of the Council of 21 May 2008 on ambient air quality and cleaner air for Europe (OJ L 152, 11/06/2008, p. 1-44)
Directive 2010/75/EU of the European Parliament and of the Council of 24 November 2010 on industrial emissions (integrated pollution prevention and control), OJ L 334, 17/12/2010, p. 17-119
1999 Protocol to Abate Acidification, Eutrophication and Ground-level Ozone to the Convention on Long-range Transboundary Air Pollution, as amended on 4 May 2012
EU Commission (2008): Communication on the Impact Assessment accompanying Directive 2009/126/EC (COM(2008) 812 final).
EU Commission (2011): Commission Staff Working Paper on the implementation of EU Air Quality Policy and preparing for its comprehensive review (SEC(2011)342 final).
EU Commission (2013 a): Commission Staff Working Document executive summary of the impact assessment (SWD(2013) 532 final).
EU Commission (2013 b): Communication on the Impact Assessment accompanying the Clean Air Policy Package (SWD(2013)531 final).
EU Commission (2013 c): Communication “Strengthening the foundations of Smart Regulation – improving evaluation” (COM(2013) 686 final).
Treaty concerning the accession of the Republic of Croatia to the European Union; Chapter 27 Environment: http://www.mvep.hr/custompages/static/hrv/files/pregovori/ZSEUEN/27.pdf
Evaluation of Directive 1994/63/EC and Directive 2009/126/EC
Final interim: 2015 210
A.2 Literature
References for information used on individual member states are included in Appendix D. The following references relate to sources quoted in the main part of this report.
A.2.1 Commission studies on the Directives
European Commission (2012) Quality of petrol and diesel fuel used for road transport in the European Union Eleventh annual report. Report from the commission to the European Parliament and the Council.
Entec (2011) Evaluations of Member State requests for exemptions from the vapour pressure requirements for petrol pursuant to Article 3(4) and 3(5) of Directive 98/70/EC relating to the quality of petrol and diesel fuels. Report for the European Commission
Entec UK limited& REC (2009) Assessment of the implementation of the VOC Stage I Directive (1994/63/EC)
COWI (2007), Analysis of costs associated with the mandatory deployment of Stage 2 Petrol Vapour Recovery Equipment
Entec UK limited (2005), Stage II Petrol Vapour Recovery – Final report
Entec UK Limited & REC (2005), Service Contract to assist the Commission identify and assess obstacles and difficulties for the implementation of Directive 94/63/EC (Stage 1) in new Member States and Candidate Countries
A.2.2 Other literature
AEAT (2002) Speciation of UK emissions of non-methane volatile organic compounds. AEA Technology
AEAT (2005) Damages per tonne emission of AEAT (2005) Damages per tonne emission of PM2.5, NH3, SO2, NOx and VOC from each EU25 Member State excluding Cyprus) and surrounding seas. AEA Technology
Aksoyoglu, S., Keller, J., Ciarelli, G. et al. (2014) A model study on changes of European and Swiss particulate matter, ozone and nitrogen deposition between 1990 and 2020 due to the revised Gothenburg protocol. European air quality in 2020: success story for PM2.5
Australian Petroleum Industry Contractors Association (2010) Recommended practices for the installation and testing of vapour recovery systems at petrol stations PICA RP - 004/2010
Australian Environment Protection Authority (2012) Standards and best practice guidelines for vapour recovery at petrol service stations
Biofuels International (2009) The new EU directive on fuel quality standards and its implications
Canada national legislation consolidated amendments (as of 27 April 2015): Official status of consolidations: Gasoline and gasoline blend dispensing flow rate regulations. SOR/2000-43. Published by the Minister of Justice. http://laws-lois.justice.gc.ca/PDF/SOR-2000-43.pdf
Canadian Council of Ministers of the Environment (1991) CCME Environmental Code of Practice for Vapour Recovery in Gasoline Distribution Networks (Stage 1)
Evaluation of Directive 1994/63/EC and Directive 2009/126/EC
Final interim: 2015 211
Canadian Council of Ministers of the Environment (1995) CCME Environmental Code of Practice for Vapour Recovery during Vehicle Refuelling at Service Stations and Other Gasoline Dispensing Facilities
Canadian Statutory Authority (1999) Gasoline and gasoline blend dispensing flow rate regulations. Statutory Authority, Canadian Environmental Protection Act. Regulatory impact analysis statement (5 June 1999) Gazette du Canada Partie I
Castronovo, C (2000) Enhanced vapour recovery. Presentation by the CARB Monitoring and Laboratory Division at the July 13-14, 2000 workshop titled “EVR: Impact of New California Regulations”
Defra (2000) The Measurement of Benzene Concentrations in the Vicinity of Petrol Stations
Defra (2004) Consultation on Petrol Vapour Recovery Phase I Derogation
Defra (2005) Final Regulatory Impact Assessment on Petrol Vapour Recovery Stage II Controls
Defra (2005a) Consultation paper on the implementation of Petrol Vapour Recovery Stage II Controls
Defra (2008) AQ05(08) Additional guidance from DEFRA and the Welsh Assembly Government: Petrol vapour recovery at service stations: explanatory notes on the use of orifice vent devices, pressure vacuum relief valves and applications for Stage II
Delli, K. (2015) Draft report on sustainable urban mobility. Report 2014/2242(INI) for the European Commission. Committee on Transport and Tourism.
Department of Environment and Climate Change of New South Wales (2007) Discussion Paper, ACTION FOR AIR, Improving Air Quality through Vapour Recovery at Service Stations
Department of Environment and Climate Change of New South Wales (2009a) Better Regulation Statement; Expansion of Vapour Recovery at Petrol Service Stations in the NSW Greater Metropolitan Region
Department of Environment and Climate Change of New South Wales (2009b) Best practice guidelines for maximising vapour recovery
DGMK (2003): Gasrückführung und selbstüberwachende Systeme an Tankstellen - Durchführung von praktischen Feldtests / Testphase im ganzheitlichen System, Deutsche Wissenschaftliche Gesellschaft für Erdöl, Erdgas und Kohle e.V., September 2004, April 2003
Edokpolo, B., Yu, Q. J., Connell, D. (2014) Health Risk Assessment of Ambient Air Concentrations of Benzene, Toluene and Xylene (BTX) in Service Station Environments. International Journal of Environmental Research & Public Health, 11, 6354–6374
EEA (2014a) Exceedance of air quality limit values in urban areas (CSI 004) - Assessment published Nov 2014
EEA (2014b), Air quality in Europe – 2014 report
EEA (2014c), Air pollution by ozone across Europe during summer 2013 - Overview of exceedances of EC ozone threshold values: April–September 2013, EEA Technical report No 3/2014, European Environment Agency
Evaluation of Directive 1994/63/EC and Directive 2009/126/EC
Final interim: 2015 212
EEA (2013) Sectoral guidance chapter 1.A.3.b.v - Gasoline evaporation. Air pollutant emission inventory guidebook
Environmental fuels expert group (EFEG), technical sub-group on the implementation of Directive 94/63 VOC Stage I, minutes of the meeting on 20 October 2007
Government of Canada (2009), Gasoline Evaporative Losses from Retail Gasoline Outlets Across Canada
Impel Network (2002), Phase 3 Testing of the Review Scheme
IIASA (2013), Policy Scenarios for the Revision of the Thematic Strategy on Air Pollution
IIASA (2014) The Final Policy Scenarios of the EU Clean Air Policy Package. TSAP Report No. 11. International Institute for Applied Systems Analysis
Institute of Petroleum (2000), Guidelines for the design and operation of gasoline vapour emission controls, second edition, October 2000
ICCT (2011) WORKING PAPER 2011-12; Onboard Refueling Vapor Recovery: Evaluation of the ORVR Program in the United States. International Council on Clean Transportation
JRC (2012) Review of the European Test Procedure for Evaporative Emissions: Main Issues and Proposed Solutions
Klimont, Z., Amann, M., Cofala, J. (2000) Estimating Costs for Controlling Emissions of Volatile Organic Compounds (VOC) from Stationary Sources in Europe. Interim report (IR-00-51). IIASA
Kountouriotis, A., Aleiferis, P.G., Charalambides, A.G. (2014) Numerical investigation of VOC levels in the area of petrol stations. Science of the Total Environment 470–471, 1205–1224
MECA (2014) Reducing Evaporative Emissions - the Largest Source of VOC Emissions Leading to Haze, PM2.5 and Ozone Formation in China's Major Cities: A Macro and Micro Analysis with Information on International Experience and Related Implications for China
MINETUR (2011) Memoria Del Impacto Normativo. Ficha Del Resumen Ejecutivo. Ministerio de Industria, Turismo y comercio (Spanish Ministry of Industry, tourism and trade)
Morales-Terres, I.M., Doval-Miñarro, M., González-Ferradas, E., Baeza-Caracena, A., Barberá-Rico, J. (2010) Assessing the impact of petrol stations on their immediate surroundings. Journal of Environmental Management 91, 2754-2762
MWH (2014), Air Quality Governance in ENPI East Countries; Subtask 1.6.5 Recommendations for ELVs and other conditions setting for selected installations
Nieminem (2005), Environmental protection Standards at Petrol Stations: A comparative study between Finland and selected European countries
PELG (2014), Petrol Filling Stations Guidance on Managing The Risks of Fire & Explosion (the Red Guide) updated 2014; Petroleum Enforcement Liaison Group (PELG); Energy Institute.
Rudd,J. & Nikolas, A. (2001), Measures to Reduce Emissions of VOC during Loading and Unloading of Ships in the EU (AEAT/ENV/R/0469 Issue 2)
Evaluation of Directive 1994/63/EC and Directive 2009/126/EC
Final interim: 2015 213
Scottish Government (2004), Consultation on Petrol Vapour Recovery Phase 1 Derogation
Texas Commission on Environmental Quality (2014), Information on Stage I and II gasoline vapor recovery programs including equipment, testing, and operation requirements
Thomas, L.M. (1989) A US perspective on hydrocarbon controls at service stations
UNECE (2012) Guidance document on control techniques for emissions of sulphur, NOx, VOC and dust (including PM10, PM2,5 and black carbon) from stationary sources
USA Environmental Protection Agency (2012) EPA rule ID No. EPA–HQ–OAR–2010–1076; Air Quality: Widespread Use for Onboard Refueling Vapour Recovery and Stage II Waiver
USA Environmental Protection Agency (1994) Final Rulemaking for ORVR. Federal Register
Evaluation of Directive 1994/63/EC and Directive 2009/126/EC
Final interim: 2015 214
Appendix B Glossary of terms
ACGIH54 American Conference of Governmental Industrial Hygienists
ADR European Agreement concerning the International Carriage of Dangerous Goods by Road (UNECE)
API American Petroleum Institute
AQD Air Quality Directive
BAT Best Available Technique
BAT-AEL Best Available Technique Associated Emission Levels
BAU Business as usual. Relates to projected activity, emissions, etc. with currently implemented policies and measures in place.
Biofuel Liquid or gaseous fuel for transport produced from biomass.
BREF Best Available Techniques Reference Document
CARB California Air Resources Board
CEN European Committee for Standardization
CLP Classification, Labelling and Packaging
CMR (substances)
Carcinogenic, Mutagenic or Toxic for Reproduction
CO Carbon
CO2 Carbon dioxide
EC European Commission
EEA European Environment Agency
EEA-32 European Economic Association, 32 country grouping includes countries of the EU-28 and EFTA-4 (Iceland, Liechtenstein, Switzerland and Norway).
EEA-33 EEA-32 and Turkey
EESC European Economic and Social Committee
EFEG Environmental Fuels Expert Group
EFRT External floating roof tank
EFTA European Fair Trade Association
ELV Emission Limit Values
EU European Union. EU28 includes the 28 current Member States. EU27 includes all Member States except for Croatia. EU12 includes Member States that joined in 2004 and 2007.
EMEP The Co-operative programme for monitoring and evaluation of the long range transmission of air pollutants in Europe (linked to LRTAP).
ETC/ACM The European Topic Centre on Air Pollution and Climate Change Mitigation
Evaluation of Directive 1994/63/EC and Directive 2009/126/EC
Final interim: 2015 215
Euro 5 and Euro 6
Regulation (EC) No 715/2007 on type approval of motor vehicles with respect to emissions from light passenger and commercial vehicles and on access to vehicle repair and maintenance information
Euro VI HDV Regulation 595/2009 on type-approval of motor vehicles and engines with respect to emissions from heavy duty vehicles (Euro VI) and on access to vehicle repair and maintenance information
FQD Directive 98/70/EC on Fuel Quality
GAINS model The Greenhouse Gas and Air Pollution Interactions and Synergies Model
GDP Gross domestic product
GHG Greenhouse gas
IA Impact Assessment
IED Directive 2010/75/EU on industrial emissions
IIASA International Institute for Applied Systems Analysis
IMO International Maritime Organisation
IPPCD Integrated Pollution Prevention and Control Directive
kPa KiloPascals (Pascals x 103)
kt Kilotonnes (tonnes x 103)
n.a. Not applicable.
LED Light emitting diode.
LRTAP Convention on Long-Range Transboundary Air Pollution
MARPOL International Convention for the Prevention of Marine Pollution from Ships
MS Member State
NECD National Emission Ceilings Directive (2001/81/EC)
NFR Nomenclature For Reporting
NGO Non-governmental organisation
NH3 Ammonia
NIOSH US National Institute for Occupational Safety and Health
NMVOC Non-methane volatile organic compound
NOx Generic term for mono-nitrogen oxides
NRMM Non-road mobile machinery
NRMMD Directive 97/68/EC on the approximation of the laws of the Member States relating to measures against the emission of gaseous and particulate pollutants from internal combustion engines to be installed in non-road mobile machinery
O3 Ozone
OEL Occupational Exposure Limits
ORVR Onboard Refuelling Vapour Recovery
Evaluation of Directive 1994/63/EC and Directive 2009/126/EC
Final interim: 2015 216
OSHA US Occupational Safety and Health Organisation
OVD Orifice vent device
Paints Directive Directive 2004/42/EC on the limitation of emissions of volatile organic compounds due to the use of organic solvents in decorative paints and varnishes and vehicle refinishing products
Petrol Any petroleum derivative, with or without additives, having a reid vapour pressure of 27,6 kilopascals or more, which is intended for use as a fuel for motor vehicles, except liquefied petroleum gas (LPG) (definition from Directives 94/63/EC and 2009/126/EC).
PJ Petajoules (joules x 1015).
PM2.5 Particulate matter smaller than 2.5 micrometres
POCP Photochemical ozone creation potential
PRIMES Energy Systems Model of the National Technical University of Athens
PVR Petrol Vapour Recovery.
RAINS The Regional Air pollution Information and Simulation model
REFIT The European Commission's Regulatory Fitness and Performance programme
Reid Vapour Pressure (RVP)
The absolute pressure exerted by the gas produced by evaporation from the liquid, as measured by Reid apparatus under the specific conditions of test temperature, vapour/liquid ratio and air saturation.
RID Regulations concerning the International Carriage of Dangerous Goods by Rail
RON Research Octane Number
SED Solvent emissions directive
SEK Swedish Krona
SMESME Small medium enterprises
SO2 Sulphur dioxide
Stage I Recovery of petrol vapours during petrol storage and loading at terminals/refineries (Stage IA) and during filling of storage tanks at service Stations (Stage IB).
Stage II Recovery of petrol vapours during refuelling of vehicles at service stations.
TDG Directive on the inland transport of dangerous goods
True vapour pressure (TVP)
The absolute pressure exerted by the gas produced by evaporation from a liquid when the gas and liquid are in equilibrium at the prevailing temperature.
Throughput The total annual quantity of petrol unloaded and/or sold at a service station.
TSAP Thematic Strategy on Air Pollution
TSFS Approval procedure (in Sweden)
UNECE United Nations Economic Commission for Europe
Evaluation of Directive 1994/63/EC and Directive 2009/126/EC
Final interim: 2015 217
USA United States of America
USD United States Dollar
UST Underground storage tank.
Vapour Taken to mean any gaseous compound which evaporates from petrol.
V/P Vapour petrol ratio
Vapour-recovery unit (VRU)
Equipment for the recovery of petrol from vapours including any buffer reservoir systems at a terminal
VOC Volatile organic compound. Defined as any organic compound as well as the fraction of creosote, having at 293,15K a vapour pressure of 0,01kPa or more, or having a corresponding volatility under the particular conditions of use (definition from Directive 2010/75/EU).
VOC-I Directive Directive 1994/63/EC on the control of volatile organic compound (VOC) emissions resulting from the storage of petrol and its distribution from terminals to service stations
VOC-II Directive
Directive 2009/126/EC on Stage II Petrol Vapour Recovery during refuelling of motor vehicles at service stations
WHO World Health Organisation
WID Waste incineration directive
Acronyms for Member States
AT- Austria BE- Belgium BG - Bulgaria CY- Cyprus
CZ- Czech Republic DE- Germany DK- Denmark EE – Estonia
EL – Greece ES - Spain FI – Finland FR- France
HU– Hungary HR – Croatia IE – Ireland IT – Italy
LT– Lithuania LU-Luxembourg
LV – Latvia MT – Malta
NL– Netherlands PL - Poland PT – Portugal RO - Romania
SE - Sweden SI – Slovenia SK - Slovakia UK–United Kingdom
Evaluation of Directive 1994/63/EC and Directive 2009/126/EC
Final interim: 2015 218
Appendix C Analytical framework
Information contained in the appendices has been provided in a separate document, provided alongside this report. Please refer to that document.
Evaluation of Directive 1994/63/EC and Directive 2009/126/EC
Final interim: 2015 219
Appendix D
Member States summaries on implementation
Information contained in the appendices have been provided in a separate document, provided alongside this report. Please refer to that document.
Evaluation of Directive 1994/63/EC and Directive 2009/126/EC
Final interim: 2015 220
Appendix E
List of Member State guidance
Information contained in the appendices have been provided in a separate document, provided alongside this report. Please refer to that document.
Evaluation of Directive 1994/63/EC and Directive 2009/126/EC
Final interim: 2015 221
Appendix F List of stakeholders contacted
Information contained in the appendices have been provided in a separate document, provided alongside this report. Please refer to that document.

Evaluation of Directive 1994/63/EC and Directive 2009/126/EC
Final interim: 2015 222
Appendix G Workshop
Evaluation of Directive 1994/63/EC and Directive 2009/126/EC
Final interim: 2015 223
Appendix H Additional background information
Information contained in the appendices have been provided in a separate document, provided alongside this report. Please refer to that document.