evaluation of a portable markerless finger position capture device: accuracy of the leap motion...
TRANSCRIPT

Title: Evaluation of a portable markerless finger position capture device: accuracy of the Leap 1
Motion controller in healthy adults 2
Authors: James Y Tung1, Tea Lulic2, Dave A Gonzalez2, Johnathan Tran2, Clark R Dickerson2, 3
Eric A Roy2 4
5
Affiliations: 1Department of Mechanical and Mechatronics Engineering; 2Department of 6
Kinesiology, University of Waterloo, Waterloo, ON, N2L 3G1 7
8
Corresponding author: James Y Tung (PhD, PEng), Department of Mechanical and Mechatronics 9
Engineering, 200 University Ave. W, Waterloo, ON, N2L 3G1 Canada, Tel. 519-888-4567 10
x33445, Email. [email protected] 11
12
Short title: Leap Motion controller finger position accuracy in healthy adults 13
14
Keywords: motor control, upper limb, kinematics, motion capture 15
16
Word count (not incl figures, tables, references, and abstract): 3,257 17
18

Abstract 19
Although motion analysis is frequently employed in upper limb motor assessment (e.g., 20
visually-guided reaching), they are resource-intensive and limited to laboratory settings. This study 21
evaluated the reliability and accuracy of a new markerless motion capture device, the Leap Motion 22
controller, to measure finger position. Testing conditions that influence reliability and agreement 23
between the Leap and a research-grade motion capture system were examined. Nine healthy young 24
adults pointed to 1 of 15 targets on a computer screen under 2 conditions: 1) touching the target 25
(Touch) and 2) 4 cm away from the target (No-Touch). Leap data was compared to an Optotrak 26
marker attached to the index finger. Across all trials, root mean square (RMS) error of the Leap 27
system was 17.30±9.56 mm (mean±SD), sampled at 65.47±21.53 Hz. The % viable trials and mean 28
sampling rate were significantly lower in the Touch condition (44% versus 64%, p < 0.001; 29
52.02±2.93 versus 73.98±4.48 Hz, p=0.003). While linear correlations were high (horizontal: r2 = 30
0.995, vertical r2 = 0.945), the limits of agreement were large (horizontal: -22.02 to +26.80 mm, 31
vertical: -29.41 to +30.14 mm). While not as precise as more sophisticated optical motion capture 32
systems, the Leap Motion controller is sufficiently reliable for measuring motor performance in 33
pointing tasks that do not require high positional accuracy (e.g., reaction time, Fitt’s, trails, 34
bimanual coordination). 35
36
37

1.0 Introduction 38
Assessment of upper limb impairment and function is critical for diagnosis, treatment, and 39
rehabilitation of musculoskeletal and neural disorders affecting the hand and digits. Hand and digit 40
function are commonly impaired following stroke and are among the least likely to fully recover 41
with conventional rehabilitation (Schieber et al. 2009). Assessment of upper limb function using 42
clinical instruments, such as the Nine Hole Peg Test (Oxford Grice et al. 2003) and Chedoke-43
McMaster Stroke Assessment(CMSA) scale (Gowland et al. 1993) is fundamental to developing 44
rehabilitation goals, monitoring recovery, and adapting treatment based on progress. While such 45
assessments are widely used, they may not sufficiently measure small, but clinically significant 46
changes which may better infer the state of recovery (Gladstone et al. 2002). Further, these 47
assessments require valuable time by trained therapists and are typically limited to episodic 48
intervals. As a result, there may be suboptimal feedback to clinicians and patients in the 49
rehabilitation process, leading to hindered or limited recovery. 50
In contrast, commercial motion tracking systems (e.g., Vicon, Optotrak) are capable of 51
collecting quantitative three-dimensional kinematics across a wide range of tasks (e.g., pointing, 52
reaching, grasping). These systems allow generation of in-depth kinematic measures, such as limb 53
positions and velocities accurate to sub-millimeter level (Windolf et al. 2008), to assess functional 54
capabilities. For example, kinematics of reaching and pointing tasks have been used to assess upper 55
limb impairment and recovery following stroke (Levin 1996; Coderre et al. 2010; Kitago et al. 56
2013; Kamper et al. 2002). Although optical motion analysis systems (e.g., Optitrak, Optotrak, 57
Vicon) are frequently employed in research, they are expensive (ranging from $7,500 to $415,000 58
USD in recent comparisons (Thewlis et al. 2013; Carse et al. 2013)), require training, setup time 59
for affixing markers and calibration, are sensitive to lighting conditions, need a line of sight, and 60

are typically only used in dedicated laboratory settings. These limitations present major barriers to 61
the wide clinical use of data from these motion capture systems (Rosenhahn et al. 2008) and to the 62
emerging development of at-home rehabilitation technologies (Borghese et al. 2013; Slijper et al. 63
2014; Pastor et al. 2012). 64
Advances in sensor technologies have increased accessibility and portability of upper limb 65
kinematics assessments. Inertial measurement units (IMUs), incorporating combinations of 66
accelerometer, gyroscope, and magnetometer sensors, have gained increasing use to measure 67
physical activity, gait and posture, and gross limb movements (Gebruers et al. 2010). While the 68
use of IMUs are validated for measuring the duration and intensity of upper limb movements, their 69
use in capturing the quality of upper limb movements, such as kinematics, smoothness, and 70
movement type (e.g., voluntary vs. unintentional), remains limited (Lemmens et al. 2014). 71
Furthermore, IMU techniques are susceptible to artifacts due to nearby metal objects (Brodie et al. 72
2008). While instrumented gloves (Kortier et al. 2012; Simone & Kamper 2005) for the capture of 73
hand and digit kinematics exist, their use is limited by difficulties in donning and removing the 74
gloves, especially in patients with functional impairments. A number of robotic systems, such as 75
the KinARM (Scott 1999), HapticMaster (Lemmens et al. 2014), and BONES (Milot et al. 2014) 76
systems, have also been developed to facilitate delivery of rehabilitation training. While these 77
systems are capable of high-accuracy position measurements, their utility is limited by relatively 78
high costs and long setup time. 79
Low-cost markerless optical systems have been examined as potential upper limb 80
assessment tools. The Kinect sensor (Microsoft Inc., Redmond, WA), which projects and detects 81
changes in structured infrared light patterns (i.e., dot pattern) to track the movement of body 82
segments in 3D, represents a potential alternative to measure gross body movement in a clinical 83

setting (Kurillo et al. 2013; Mobini et al. 2014). However, the spatial resolution of the Kinect limits 84
the accuracy of measuring movements of small segments (Khoshelham & Elberink 85
2012)(Khoshelham & Elberink 2012), such as fingers. To improve accuracy of estimating pointing 86
position, new techniques using proximal joint (i.e., wrist, elbow) angles to calculate pointing 87
vectors are under development (Fürntratt & Neuschmied 2014)(Fürntratt & Neuschmied 2014). 88
According to company reports, the Leap Motion controller is comprised of two 89
monochromatic stereo cameras and 3 infrared (wavelength = 850 nm) LEDs to reconstruct the 90
scene in 3D and track hand and finger position (Colgan 2014). The system’s low cost (retail 91
$80USD) and minimal set-up time, coupled with initial reports of high accuracy, indicates its 92
potential for assessment of finger movement in three-dimensional space. Independent evaluations 93
using an industrial robot with a pen-like tip reported mean squared error between the tip position 94
and position measured by the Leap system was <0.2 mm in static trials, and <2.5 mm in dynamic 95
trials (Weichert et al. 2013). In an evaluation using a plastic arm model, Guna et al. found the Leap 96
system accurate to <0.5mm in static conditions (Guna et al. 2014), further indicating initial promise 97
for clinical assessment. Furthermore, a recent comparison reported a considerably lower end-to-98
end latency of the Leap (85 ms) compared to the Kinect (170 ms) (Brown et al. 2014)(Brown et 99
al. 2014). Considering the variability in human performance compared to robotic arms is well-100
documented (e.g., van der Smagt et al. 2009), an important next step prior to clinical use is to 101
evaluate the system’s validity and reliability with human participants. 102
The purpose of this study was to evaluate the Leap system for measuring finger position 103
for clinically relevant neuromotor assessments, such as reaching and pointing, in human 104
participants. Specifically, the objectives of this study were to: 1) examine testing conditions that 105
influence the system’s reliability to measure finger position, particularly the effect of touching 106

external objects (e.g., targets on computer screen), and finger location relative to the sensor’s field 107
of view (FOV) and 2) evaluate the validity and limits of agreement between the Leap and a 108
validated research-grade optical motion capture systems. It was hypothesized that reliability of the 109
Leap system to measure finger position, indicated by % of viable trials and mean sampling rate, 110
would be compromised when touching visual stimuli presented on a computer screen compared to 111
a condition where the finger was not touching the screen. We also hypothesized that reliability will 112
be high for targets located in the reported 150 degree field of view and reduced at the margins. 113
With regards to validity and limits of agreement, it was hypothesized that correlation between the 114
Leap and Optotrak systems, measured by r2, and accuracy, measured by root mean square (RMS) 115
error, would be sufficient for reach and point tasks typically used in neuromotor assessments based 116
on previously reported upper limb assessments following stroke (e.g., Coderre et al., 2010; Kamper 117
et al., 2002; Levin, 1996). 118
119
2.0 Methods 120
2.1 Participants 121
Nine healthy right hand dominant younger adults between 18 and 30 years of age (6 122
females; 3 males) participated in this study. Participants did not report any musculoskeletal or 123
neurological disorders, and provided informed consent. This study was approved by the Office of 124
Research Ethics at the University of Waterloo. 125
2.2 Apparatus 126
A desktop computer was used to display a visual stimulus chosen randomly from 15 square 127
targets via E-prime (v 1.2, Psychology Software Tools, Inc., Sharpsberg, PA, USA). Figure 1 128
depicts the target locations and dimensions of the experimental setup. An Infrared Emitting Diode 129
(Ired) was placed on the distal phalange of the index finger and an Optotrak 3020 (Northern Digital 130
Inc., Waterloo, ON, Canada) motion capture system was used to record the location of the finger. 131
A Leap Motion controller system (version 1.2.0, Leap Motion Inc., San Francisco, CA, US), 132
connected to a laptop computer (Lenovo G550, Lenovo Inc., Beijing, China) was used to measure 133
the index finger location using a custom-built C# application to collect the Leap data stream. 134
Briefly, three infrared LEDs on the controller emit a pattern of dots which are measured using two 135
IR cameras and synthesized into 3-D positional data using a proprietary algorithm (Leap Motion 136
Inc., San Francisco, CA, US). Based on recommended placement in the user guide, the Leap sensor 137
was situated 7.5 cm in front of the display monitor and 26 cm from edge of the table (see Figure 138
1), with axes aligned with the Optotrak coordinate frame. 139
2.3 Procedure 140
From an initial starting position, participants were instructed to move their finger to 1 of 141
15 targets presented on the computer monitor (Figure 1) and maintain this position. Participants 142
were asked to perform two variations of this task: 1) touching the monitor (Touch condition) and 143
2) holding their finger 4 cm away from the screen perpendicular to the monitor at the target location 144
(No-Touch condition). In the No-Touch condition, a 4 cm diameter ball was used to control the 145
distance between the finger and monitor and was removed prior to each trial. Once the participants’ 146
fingers were in the final position, three seconds of data were collected using the Optotrak (sampling 147
rate: 120 Hz) and the Leap (sampling rate range: 50 – 120 Hz) systems. Data acquisition was 148
synchronized by simultaneous pressing of mouse buttons by the researchers. While this procedure 149
is not suitable for frame-by-frame comparisons, the reported static positions averaged over a 3 150
second trial duration is largely independent of the small variations in synchronization. 151

Participants performed 3 trials at each of 15 targets and 2 conditions for a total of 90 trials. 152
Target location was randomized for each trial. The Touch/No-Touch conditions were tested in 153
blocks, with order of presentation randomized across participants. After 5 participants were tested 154
for both Touch/No-Touch conditions, it was apparent that the Touch condition produced unreliable 155
results (56% of trials with no data, see Table 1). The remaining 4 participants were tested in the 156
No- Touch condition only. 157
2.4 Data Processing 158
All data was processed using Matlab R13 (Mathworks Inc., Natick, MA, USA). Trials in 159
which the Leap system collected 80 points or less were labeled as ‘No data’. For trials with >80 160
points, mean sampling rate was calculated as the number of points collected over the 3 s trial 161
duration. For anti-aliasing purposes, Leap and Optotrak data were digitally filtered using a dual 162
low-pass Butterworth filter (3rd order), with a cut off of 10Hz. To permit digital filtering, position 163
data collected by the Leap system was resampled at a consistent 60 Hz using a piecewise cubic 164
hermite interpolating polynomial (pchip Matlab function). To compare the Leap and Optotrak 165
systems, the center target (Target 8) was chosen as the reference origin due to the target’s high 166
reliability and consistent sampling rate (see Table 1). The reference origin was calculated as the 167
mean finger position for Target 8 trials for each participant. All position data was referenced to 168
the corresponding participants’ calculated origin. 169
2.5 Analyses 170
To evaluate the influence of the Touch condition on measurement reliability, the proportion 171
of viable trials and mean sampling rates were compared to the No-Touch condition. Reliability 172
was measured by comparing the proportion (%) of viable trials (i.e., 80 or more data points) and 173

mean sampling rate. Accuracy was measured by calculating the mean RMS error of the Leap 174
position compared to the measured Optotrak position. Fisher’s exact test was used to test the null 175
hypothesis that Touch and No-Touch conditions produced the same proportion of viable trials. 176
Similarly, task-dependent difference in mean sampling rate was compared using a paired t-test. To 177
examine the influence of field of view (FOV), the proportion of viable trials from targets at the 178
Outside edges of the grid (Targets 1, 5, 6, 10, 11, and 15) were compared to targets in the Center 179
(Targets 3, 8, and 13). Fisher’s exact test was used to test the null hypothesis that the Outside and 180
Center targets produced the same proportion of viable trials. 181
Validity and limits of agreement between the Leap and Optotrak systems were examined 182
using correlation and Bland-Altman analyses. Separate analyses were conducted for the horizontal 183
and vertical axes. In the correlation analysis, a least-squares regression line was fitted (regress 184
Matlab function). The coefficient of determination (r2) was used as a measure of linear fit. Used 185
extensively to evaluate the limits of agreement between two techniques, Bland-Altman plots were 186
constructed to examine systematic bias and estimate confidence intervals of measurement error. 187
Plots were generated using the mean of the two methods as the abscissa (x-axis) and difference 188
between Leap and Optotrack positions as the ordinate (y-axis) values. The mean errors and 95% 189
confidence intervals for each plane were reported. Considering the negative impact of the Touch 190
condition on reliability, only the No Touch data were examined in the correlation and Bland-191
Altman analyses. 192
193
3.0 Results 194
Across all conditions and targets, the mean (±SD) RMS error of the Leap system was 17.30 195
(±9.56) mm, sampled at 65.47 (±21.53) Hz, with 244/450 (54.2%) viable trials. Table 1 reports 196

descriptive statistics of means and standard deviations of RMS error, sampling rate, and % viable 197
trials by condition and target. 198
3.1 Touching vs No-Touching 199
Touching the computer screen negatively impacted the proportion of trials with viable data 200
(i.e., 80 or more data points) and mean sampling rate. As hypothesized, touching the computer 201
monitor (Touch) reduced the proportion of viable trials compared to the not touching (No Touch) 202
condition (44% versus 64%, p < 0.001). Table 2 reports contingency tables of viable trials by 203
condition. Mean (±SE) sampling rate was also lower in the Touch condition compared to the No 204
Touch condition (52.02±2.93 versus 73.98±4.48 Hz, p=0.003). 205
3.2 Outside vs Center 206
Target location affected the ability to collect finger position data. The proportion of viable 207
trials was greater in the Centre locations compared to the Outside locations (78% versus 60%, 208
p=0.009). However, in comparing the Centre and Outside targets, there was no difference in mean 209
(±SE) sampling rates (65.06±1.94 versus 68.21±1.99 Hz, p = 0.263). 210
3.3 Correlation 211
Considering the influence of the Touch condition on the reliability of the Leap system, only 212
the No Touch condition results are reported in the concurrent validity (i.e., correlation) and limits 213
of agreement (i.e., Bland-Altman) analyses. To evaluate the concurrent validity of the Leap and 214
Optotrak systems, the linear correlation between measured finger positions was examined. Overall, 215
our results show high correlation and coefficient of determination in both the horizontal (r = 0.953, 216
r2 = 0.995, Fig. 2 left) and vertical (r=0.991, r2 = 0.945, Fig. 2 right) directions. 217

3.3 Bland-Altman 218
To examine the limits of agreement between the Leap and Optotrak systems, Bland-Altman 219
plots were generated for the horizontal (Fig. 3, left) and vertical (Fig. 3, right) directions. Similar 220
to the correlation analysis, only the No Touch condition data were used due to poorer reliability in 221
the Touch condition. For the horizontal axis, the mean difference between the two systems was 222
+2.39 mm (Fig. 3, left, solid line), with lower and higher 95% limits of agreement between -22.02 223
and +26.80 mm (Fig. 3, left, dashed lines). In the vertical axis, the mean difference was +0.37 mm 224
(Fig. 3, right, solid line), with limits of agreement between -29.41 and +30.14 mm (Fig. 3, right, 225
dashed lines). 226
227
4.0 Discussion 228
To improve care and facilitate recovery of the hand and its digits, such as paresis of the 229
hand and digits following stroke, there is a need to develop new portable tools for rapid clinic- and 230
home-based assessment. Towards this goal, the purpose of this study was to evaluate the utility 231
of a new markerless kinematics capture device, the Leap Motion Controller, to measure static 232
finger position in a group of healthy younger adults. Comparison of the finger positions measured 233
by the Leap system and a research-grade optoelectronic motion capture system demonstrate that 234
the Leap system: 1) is less reliable when touching visual stimuli presented on a monitor, 2) is 235
inconsistent near the ranges of the device’s field of view (FOV), 3) provides valid measures of 236
finger position indicated by high coefficients of determination (r2), and 4) has a relatively high 237
mean RMS error and limits of agreement. While not as precise as more sophisticated systems, the 238
overall reliability and accuracy of Leap system is sufficient for pointing tasks that do not require 239
high positional accuracy measures over a limited functional space and when the finger does not 240
contact an object, such as a computer screen. However, the RMS error and limits of agreement 241
suggest that the Leap system is not precise enough to measure impaired path deviations in motor-242
impaired populations. 243
As hypothesized, the reliability of the Leap system was significantly reduced when 244
touching visual stimuli and approaching the periphery of the range of the field of view, indicated 245
by a lowered proportion of viable trials and mean sampling rate. In the current study, touching 246
targets resulted in a 20% reduction in viable trials and 21% decrease in mean sampling rate 247
compared to the No Touch condition. This may be attributable to merging of the finger and screen 248
by the Leap system, making differentiation of the two impossible. This limitation restricts the 249
ability to employ assessment tasks that require tactile interaction with buttons (e.g., reaction time), 250
screens (e.g., Trail Making Test), or objects (e.g., blocks, tools). In the evaluation of reliability, 251
outer targets demonstrated 18% less viable trials compared with targets along the center line, with 252
no difference in sampling rate. This reduction may be attributed to occlusions or merging 253
associated with the position and orientation of the hands and fingers relative to the sensor. At wider 254
angles, the pointing finger was more likely to be obstructed from view by individual hand and 255
finger orientations and anatomical dimensions. 256
The Leap system demonstrated a high degree of correlation and thus concurrent validity 257
with a validated Optotrak system (r2 = 0.995 and 0.945 in horizontal and vertical axes, 258
respectively). However, the mean RMS error (17.30 mm) in the current study is considerably 259
higher compared to previous evaluations of the Leap accuracy. Weichert et al.’s study (2013) 260
reported position error was less than 0.17 mm, and Guna et al. (2014) found a maximum standard 261
deviation of 0.49 mm across a similar space. The large differences in error are likely attributable 262
to variability in human data in the current study compared to robotic actuators (van der Smagt et 263

al. 2009). While the previous evaluations document the baseline capabilities of the technology 264
under ideal conditions, the current study better reflects conditions for clinical use. 265
The limits of agreement and mean RMS error are relatively large compared to clinically-266
relevant measures of path deviation and active range of motion in visually-guided reaching tasks. 267
In stroke studies, Levin reported a mean difference of 12.5 mm in end-point accuracy comparing 268
impaired (i.e., affected) and unimpaired arms in a rapid pointing task (Levin 1996). Schaefer et 269
al. found less than 15 mm differences in constant error between healthy controls and stroke 270
survivors (Schaefer et al. 2007; Schaefer et al. 2009). Considering the limits of agreement and 271
RMS error found in the current study are greater than these reported effect sizes, we do not 272
recommend using the Leap system to measure positional accuracy in rapid pointing tasks. 273
Despite its shortcomings in positional accuracy and precision, the Leap may be suitable for 274
a subset of motor assessment tasks, such as Trail-Making or bimanual coordination, with 275
appropriate design modifications. Adapting tasks to use non-contact targets or cues, such as 276
auditory or virtual feedback, are appropriate modifications to address contacting object limitations 277
of the Leap system. An adapted Trail-Making task (Reitan 1958), for example, could 278
simultaneously display finger position and targets on a screen to assess motor planning 279
capabilities. Auditory cues, such as a metronome, may be used to cue bimanual motor coordination 280
tasks such as circle-drawing (Bangert et al. 2010). Considering the poorer accuracy of the Leap at 281
the limits of the evaluation space, we recommend designing tasks in the center of the functional 282
volume. In particular, we recommend maintaining a height of approximately 20 cm above the 283
sensor in light of the poor reliability results at lower heights. With regards to sensitivity in the 284
depth dimension, the current study is limited to examining Leap sensitivity across varying 285

positions in the vertical and horizontal planes. Sensitivity to sensor placement in the depth 286
dimension remains to be examined. 287
Given the Leap Motion costs significantly less relative to laboratory motion tracking 288
devices, the findings in this study are promising despite the reduced accuracy. As a portable tool, 289
the sensor can be used to collect data in a patient’s home, integrated as a feedback system, and as 290
a clinical rehabilitation tool. The present findings were executed on the first commercially-291
available version of the Leap Motion sensor (version 1.2.0). Since the company is working towards 292
improving the tracking capabilities of the device, the results presented in this study may differ 293
from the findings in future studies, which use later, more refined device versions. Furthermore, 294
research is needed to examine dynamic response characteristics to evaluate the Leap’s ability to 295
measure additional kinematic variables (i.e., velocities and acceleration). 296
297
Conclusion 298
The LEAP sensor successfully measured relative 2-D coordinates of the index finger with 299
the highest correlations achieved in the left-right and up-down axes in the No Touch condition, 300
using the Optotrak system as a gold standard. Overall, the Leap system’s accuracy for finger 301
location was 17.3±9.56SD mm compared to criterion standard optical motion capture system 302
(Optotrak). However, some caution is warranted considering the relatively large limits of 303
agreement (horizontal: -22.0 to 26.8 mm, vertical: -29.4 to 30.1 mm) and limitations with 304
contacting objects. Hence, Leap Motion should provide a portable 3-D motion capture system for 305
performing basic clinical assessments in tasks such as trail-making, Fitts, or simple/choice reaction 306
time. One of the major advantages of Leap sensor is its ability to generate continuous data as the 307

hands are moved in space. Thus, it is capable of collecting a greater quantity and quality of 308
information relative to the conventional physiotherapy tools. 309
310
Acknowledgements 311
We acknowledge the assistance of Leah van Draanen with collection of data for this study. The 312
authors declare no conflicts of interest in association with this study. 313
314
315
References 316
Bangert, A.S. et al., 2010. Bimanual coordination and aging: neurobehavioral implications. 317 Neuropsychologia, 48(4), pp.1165–70. 318
Borghese, N.A. et al., 2013. Computational Intelligence and Game Design for Effective At-319 Home Stroke Rehabilitation. Games for health journal, 2(2), pp.81–88. 320
Brodie, M.A., Walmsley, A. & Page, W., 2008. Dynamic accuracy of inertial measurement units 321
during simple pendulum motion. Computer methods in biomechanics and biomedical 322 engineering, 11(3), pp.235–42. 323
Brown, M.A., Stuerzlinger, W. & Filho, E.J.M., 2014. The performance of un-instrumented in-324 air pointing. In Proceedings of the 2014 Graphics Interface Conference. Canadian 325
Information Processing Society, pp. 59–66. 326
Carse, B. et al., 2013. Affordable clinical gait analysis: an assessment of the marker tracking 327 accuracy of a new low-cost optical 3D motion analysis system. Physiotherapy, 99(4), 328 pp.347–51. 329
Coderre, A.M. et al., 2010. Assessment of upper-limb sensorimotor function of subacute stroke 330 patients using visually guided reaching. Neurorehabilitation and neural repair, 24(6), 331 pp.528–41. 332
Colgan, A., 2014. How does the Leap Motion Controller work? blog.leapmotion.com, 333 p.http://blog.leapmotion.com/hardware–to–software–ho. Available at: 334
http://blog.leapmotion.com/hardware-to-software-how-does-the-leap-motion-controller-335 work/. 336
Fürntratt, H. & Neuschmied, H., 2014. Evaluating Pointing Accuracy on Kinect V2 Sensor. In 337 International Conference on Multimedia and Human-Computer Interaction (MHCI). 338

Gebruers, N. et al., 2010. Monitoring of Physical Activity After Stroke: A Systematic Review of 339
Accelerometry-Based Measures. Archives of physical medicine and rehabilitation, 91(2), 340 pp.288–297. 341
Gladstone, D.J., Danells, C.J. & Black, S.E., 2002. The Fugl-Meyer Assessment of Motor 342 Recovery after Stroke: A Critical Review of Its Measurement Properties. 343 Neurorehabilitation and Neural Repair, 16(3), pp.232–240. 344
Gowland, C. et al., 1993. Measuring physical impairment and disability with the Chedoke-345 McMaster Stroke Assessment. Stroke, 24(1), pp.58–63. 346
Guna, J. et al., 2014. An analysis of the precision and reliability of the leap motion sensor and its 347
suitability for static and dynamic tracking. Sensors, 14(2), pp.3702–20. 348
Kamper, D.G. et al., 2002. Alterations in reaching after stroke and their relation to movement 349 direction and impairment severity. Archives of Physical Medicine and Rehabilitation, 83(5), 350 pp.702–707. 351
Khoshelham, K. & Elberink, S.O., 2012. Accuracy and resolution of Kinect depth data for indoor 352
mapping applications. Sensors, 12(2), pp.1437–54. 353
Kitago, T. et al., 2013. Improvement after constraint-induced movement therapy: recovery of 354 normal motor control or task-specific compensation? Neurorehabilitation and neural 355
repair, 27(2), pp.99–109. 356
Kortier, H.G. et al., 2012. Ambulatory assesment of hand kinematics : using an instrumented 357
glove. In XII International Symposium on 3D Analysis of Human Movement. Universita di 358
Bologna, pp. 19–29. 359
Kurillo, G. et al., 2013. Upper extremity reachable workspace evaluation with Kinect. Studies in 360 health technology and informatics, 184, pp.247–53. 361
Lemmens, R.J.M. et al., 2014. Accelerometry measuring the outcome of robot-supported upper 362 limb training in chronic stroke: a randomized controlled trial. PloS one, 9(5), p.e96414. 363
Levin, M.F., 1996. Interjoint coordination during pointing movements is disrupted in spastic 364 hemiparesis. Brain, 119(1), pp.281–293. 365
Milot, M.-H. et al., 2014. Corticospinal Excitability as a Predictor of Functional Gains at the 366 Affected Upper Limb Following Robotic Training in Chronic Stroke Survivors. 367 Neurorehabilitation and neural repair, 28(9), pp.819–827. 368
Mobini, A., Behzadipour, S. & Saadat Foumani, M., 2014. Accuracy of Kinect’s skeleton 369 tracking for upper body rehabilitation applications. Disability and rehabilitation. Assistive 370 technology, 9(4), pp.344–52. 371

Oxford Grice, K. et al., 2003. Adult norms for a commercially available Nine Hole Peg Test for 372
finger dexterity. In American journal of occupational therapy. pp. 570–3. 373
Pastor, I., Hayes, H.A. & Bamberg, S.J.M., 2012. A feasibility study of an upper limb 374 rehabilitation system using Kinect and computer games. Engineering in Medicine and 375 Biology Society (EMBC), 2012 Annual International Conference of the IEEE, 2012, 376 pp.1286–9. 377
Reitan, R.M., 1958. Validity of the Trail Making Test as an indicator of organic brain damage. 378 Perceptual and Motor Skills, 8(3), pp.271–276. 379
Rosenhahn, B., Klette, R. & Metaxas, D. eds., 2008. Human Motion, Dordrecht: Springer 380
Netherlands. 381
Schaefer, S.Y., Haaland, K.Y. & Sainburg, R.L., 2009. Dissociation of initial trajectory and final 382 position errors during visuomotor adaptation following unilateral stroke. Brain research, 383 1298, pp.78–91. 384
Schaefer, S.Y., Haaland, K.Y. & Sainburg, R.L., 2007. Ipsilesional motor deficits following 385
stroke reflect hemispheric specializations for movement control. Brain, 130(8), pp.2146–58. 386
Schieber, M.H. et al., 2009. Selective activation of human finger muscles after stroke or 387 amputation. Advances in experimental medicine and biology, 629, pp.559–75. 388
Scott, S.H., 1999. Apparatus for measuring and perturbing shoulder and elbow joint positions 389 and torques during reaching. Journal of Neuroscience Methods, 89(2), pp.119–127. 390
Simone, L.K. & Kamper, D.G., 2005. Design considerations for a wearable monitor to measure 391 finger posture. Journal of neuroengineering and rehabilitation, 2(1), p.5. 392
Slijper, A. et al., 2014. Computer game-based upper extremity training in the home environment 393 in stroke persons: a single subject design. Journal of neuroengineering and rehabilitation, 394
11(1), p.35. 395
Van der Smagt, P. et al., 2009. Robotics of human movements. Journal of physiology, Paris, 396 103(3-5), pp.119–32. 397
Thewlis, D. et al., 2013. Next-generation low-cost motion capture systems can provide 398
comparable spatial accuracy to high-end systems. Journal of applied biomechanics, 29(1), 399 pp.112–7. 400
Weichert, F. et al., 2013. Analysis of the accuracy and robustness of the leap motion controller. 401
Sensors, 13(5), pp.6380–93. 402

Windolf, M., Götzen, N. & Morlock, M., 2008. Systematic accuracy and precision analysis of 403
video motion capturing systems--exemplified on the Vicon-460 system. Journal of 404 biomechanics, 41(12), pp.2776–80. 405
406
407
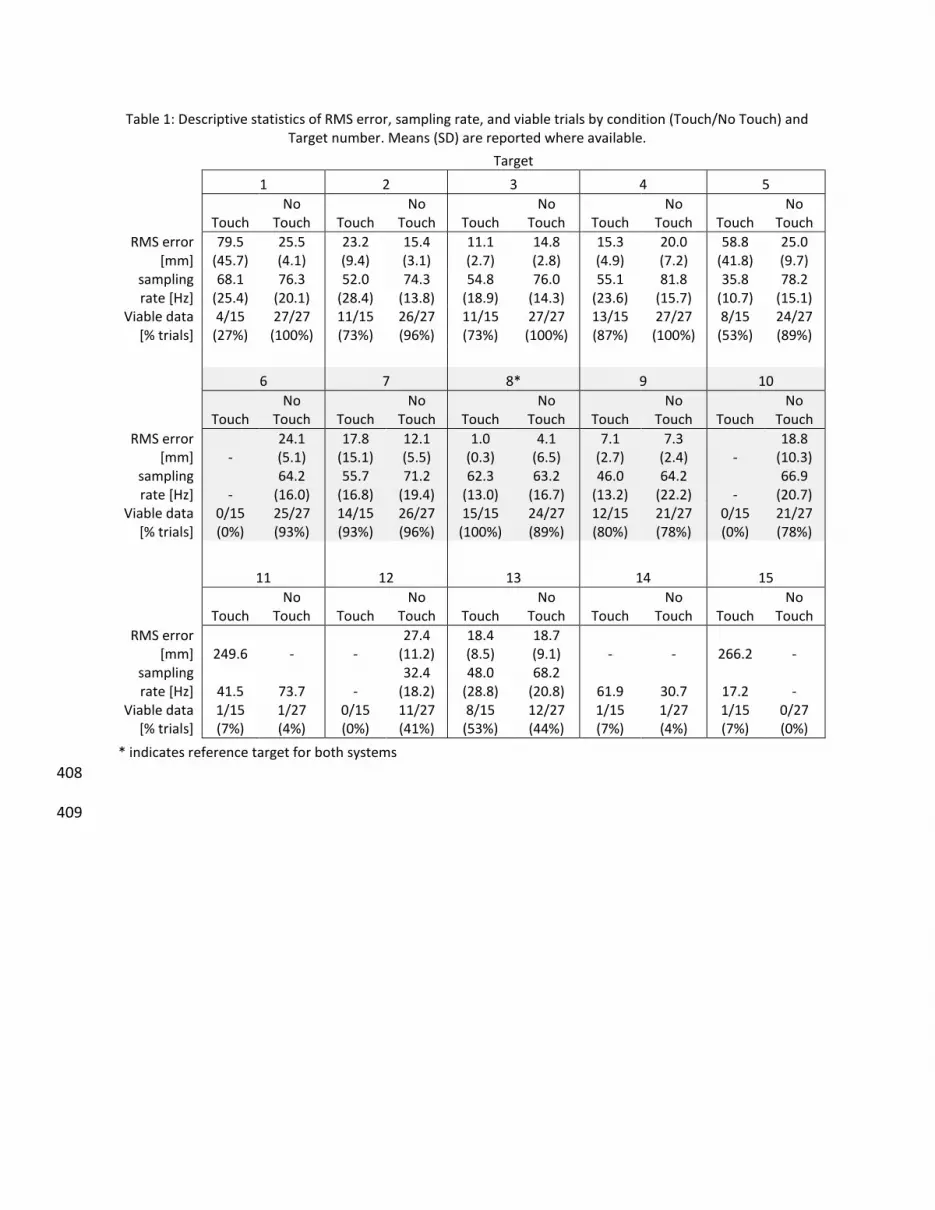
Table 1: Descriptive statistics of RMS error, sampling rate, and viable trials by condition (Touch/No Touch) and Target number. Means (SD) are reported where available.
Target
1 2 3 4 5
Touch No
Touch Touch No
Touch Touch No
Touch Touch No
Touch Touch No
Touch
RMS error [mm]
79.5 (45.7)
25.5 (4.1)
23.2 (9.4)
15.4 (3.1)
11.1 (2.7)
14.8 (2.8)
15.3 (4.9)
20.0 (7.2)
58.8 (41.8)
25.0 (9.7)
sampling rate [Hz]
68.1 (25.4)
76.3 (20.1)
52.0 (28.4)
74.3 (13.8)
54.8 (18.9)
76.0 (14.3)
55.1 (23.6)
81.8 (15.7)
35.8 (10.7)
78.2 (15.1)
Viable data [% trials]
4/15 (27%)
27/27 (100%)
11/15 (73%)
26/27 (96%)
11/15 (73%)
27/27 (100%)
13/15 (87%)
27/27 (100%)
8/15 (53%)
24/27 (89%)
6 7 8* 9 10
Touch No
Touch Touch No
Touch Touch No
Touch Touch No
Touch Touch No
Touch
RMS error [mm] -
24.1 (5.1)
17.8 (15.1)
12.1 (5.5)
1.0 (0.3)
4.1 (6.5)
7.1 (2.7)
7.3 (2.4) -
18.8 (10.3)
sampling rate [Hz] -
64.2 (16.0)
55.7 (16.8)
71.2 (19.4)
62.3 (13.0)
63.2 (16.7)
46.0 (13.2)
64.2 (22.2) -
66.9 (20.7)
Viable data [% trials]
0/15 (0%)
25/27 (93%)
14/15 (93%)
26/27 (96%)
15/15 (100%)
24/27 (89%)
12/15 (80%)
21/27 (78%)
0/15 (0%)
21/27 (78%)
11 12 13 14 15
Touch No
Touch Touch No
Touch Touch No
Touch Touch No
Touch Touch No
Touch
RMS error [mm] 249.6 - -
27.4 (11.2)
18.4 (8.5)
18.7 (9.1) - - 266.2 -
sampling rate [Hz] 41.5 73.7 -
32.4 (18.2)
48.0 (28.8)
68.2 (20.8) 61.9 30.7 17.2 -
Viable data [% trials]
1/15 (7%)
1/27 (4%)
0/15 (0%)
11/27 (41%)
8/15 (53%)
12/27 (44%)
1/15 (7%)
1/27 (4%)
1/15 (7%)
0/27 (0%)
* indicates reference target for both systems
408
409

410
411
412
413
414
415
416
417
Table 2: Contingency tables of viable trials
Touching vs. No-Touching
Viable Data No Data % Viable
Touching 99 126 44%
No-Touching 145 80 64%
Fisher’s Exact test, p < 0.001
Outside vs Center targets
Viable Data No Data % Viable
Outside 98 64 60%
Center 63 18 78%
Fisher’s Exact test, p = 0.009

418
Figure Captions 419
Figure 1.Schematic of the experimental design. 420
Figure 2.Correlation between Optotrak and Leap systems for horizontal (left panel) and vertical 421
(right panel) finger position. 422
Figure 3.Bland-Altman plots for horizontal (left panel) and vertical (right panel) for the No-423
Touching condition. 424
425

426
427
428
429
430
Figure 1 431
432

433
434 435
436

437