evaluating the environmental impacts of conventional and organic apple production in nova scotia,...
TRANSCRIPT
lable at ScienceDirect
Journal of Cleaner Production xxx (2015) 1e12
Contents lists avai
Journal of Cleaner Production
journal homepage: www.elsevier .com/locate/ jc lepro
Evaluating the environmental impacts of conventional and organicapple production in Nova Scotia, Canada, through life cycle assessment
Sarah Keyes*, Peter Tyedmers, Karen BeazleySchool for Resource and Environmental Studies, Faculty of Management, Dalhousie University, 6100 University Avenue, Suite 5010, Kenneth C. RoweManagement Building, Halifax NS, B3H 3J5, Canada
a r t i c l e i n f o
Article history:Received 6 January 2015Received in revised form26 April 2015Accepted 11 May 2015Available online xxx
Keywords:Life cycle assessmentApple supply chainsEnvironmental impactsConventionalOrganicAgriculture
* Corresponding author. Present address: 119 JameK7K 1Z5, Canada. Tel.: þ1 011 1 613 929 6145.
E-mail addresses: [email protected] (S. Key(P. Tyedmers), [email protected] (K. Beazley).
http://dx.doi.org/10.1016/j.jclepro.2015.05.0370959-6526/© 2015 Published by Elsevier Ltd.
Please cite this article in press as: Keyes, S., eScotia, Canada, through life cycle assessmen
a b s t r a c t
Life cycle assessment (LCA) was used to characterize the environmental performance and potentialimprovement opportunities related to conventional and organic apple systems in Nova Scotia, Canada.The goal was to quantify and evaluate resources and energy required for production, storage, andtransportation, determining how each supply chain sub-system contributes to relevant global scaleenvironmental burdens. Importantly, scenario models were constructed to explore performanceimprovement opportunities related to key supply chain inputs. Results indicate that up to point ofharvest, the combustion of diesel fuel, production and associated field-level emissions of fertilizers (i.e.synthetic and manure), and inputs to pest and disease management were major contributors to envi-ronmental impacts on both conventional and organic orchards. Extending system boundaries to cradle-to-retail locations (both local and distal), revealed, somewhat surprisingly, that electricity needed forlong-term storage resulted in substantial burdens, highlighting the problems of coal-based electricitygeneration in Nova Scotia. Consuming locally produced apples when in season was found to be envi-ronmentally preferable to those requiring year round storage, while transport by freight ship is morefavorable than long distance transport truck delivery.
© 2015 Published by Elsevier Ltd.
1. Introduction
Global food systems are contingent on resource and energy in-puts, as they are required for the production and provision of food.This consumption is associated with environmental alterationsincluding changes to habitat and biodiversity loss (Butler et al.,2007), emissions to air, water, and soil (Foster et al., 2006), andpotentially unsustainable depletion of materials and non-renewable energy (Matson et al., 1997; Carlsson-Kanyama et al.,2003). With the productive capacity of current and future agricul-tural systems in mind, some farmers have begun to employ man-agement techniques that attempt to protect the environment andimprove biological and natural processes. Apple producers in NovaScotia, Canada are engaging in these practices, where upwards of95 percent of growers employ some measure of integrated pest
s St. Apt. 2 Kingston, Ontario.
es), [email protected]
t al., Evaluating the environmt, Journal of Cleaner Product
management (IPM), and organic production is beginning to emerge(Canadian Horticultural Council, 2009).
Understanding how, and to what extent, conventional im-provements such as IPM and organic production practicescontribute to relative environmental burdens is a prerequisite tomoving towards more sustainable food systems (van der Werf andPetit, 2002; Roy et al., 2009). Although there is a growing body ofliterature with this focus (e.g., Cederberg and Mattsson, 2000; Haaset al., 2001; Pimentel et al., 2005; Pelletier et al., 2008; De Backeret al., 2009; Mouron et al., 2012; Venkat et al., 2012), furtherresearch is required at local scales to address unique challenges andopportunities. Life cycle assessment (LCA) was used here to eval-uate the environmental performance of apple systems in NovaScotia, Canada, with the intention of pinpointing areas wheregreater resource and energy efficiencies could be achieved, anessential step in minimizing environmental impacts of agriculture.
LCAwas employed to quantify the material and energy inputs ofapple production in Nova Scotia, measuring its contribution toseveral global-scale resource depletion and environmental con-cerns. LCA is well suited to inform how orchard activities andbeyond are affecting both resource depletion and emission-based
ental impacts of conventional and organic apple production in Novaion (2015), http://dx.doi.org/10.1016/j.jclepro.2015.05.037
S. Keyes et al. / Journal of Cleaner Production xxx (2015) 1e122
impact categories, as results can pinpoint sub-systems in the lifecycle where the greatest improvements in environmental perfor-mance can be achieved. The four-step analytical LCA frameworkprovided by ISO-standardized guidelines (ISO, 2006a,b) was fol-lowed in the present study.
LCA has been used to study apple production systems in the past(e.g., Stadig, 1997; Blanke and Burdick, 2005; Mouron et al.,2006a,b; Mila i Canals et al., 2006; 2007; Sim et al., 2007;Saunders and Barber, 2008; Cerutti et al., 2013), but to date noresearch of this kind has been conducted in an Atlantic Canadiancontext despite the prominence of the sector regionally. Thus theimpetus for this research was to identify opportunities to improvethe environmental performance of regional conventional andemerging organic apple supply chains to better position the sectorsin the face of inevitable increased environmental scrutiny. Morebroadly, it is hoped that substantive and methodological insightsfrom the work will benefit the broader food system and LCApractice communities.
2. Materials and methods
Apple production is a significant industry in Canada, valued at$148.5 million in 2010 (Agriculture and Agri-Food Canada, 2012).Nova Scotia represents approximately 10 percent of the Canadianapple industry and contributes substantially in terms of eco-nomic impact for the province. In 2010, the 33,700 tonnes ofapples produced had a farm-gate value of $12.2 million and awider economic spin-off of $61 million (Statistics Canada, 2012).Within Nova Scotia, production is located primarily in theAnnapolis Valley, where over 150 farms produce apples onapproximately 1850 ha of land (Statistics Canada, 2012). Applesproduced in Nova Scotia are destined for diverse markets,including local retail, processing into value-added products (e.g.,juice, pies, and ciders), and export.
The central objectives of this project were to characterize the lifecycle environmental performance of typical commercial applesystems and of the emerging organic apple system in Nova Scotia.Direct comparisons of the two modes of production have not beenmade because substantial differences exist between them,including the age of operations, scales of production, and levels ofoutput. Comparing conventional orchards e with decades ofadditional experience in developing farm efficiencies and honinghigh yield practices e to organic production in Nova Scotia was notjustifiable. Conventional and organic apple systems were thuscharacterized independently and results presented as such.
2.1. Data collection
Data were collected and analyses undertaken on both cradle-to-farm-gate and cradle-to-retail-gate system boundaries for con-ventional and organic apple production. Noteworthy, while acradle-to-retail-gate system scope was modeled for organic pro-duction, data on storage inputs obtained for this study reflectconventional apple storage. This scenario model was developed tounderstand how organic production would fair if post-productionsystems of storage in organic mirrored those of conventional pro-duction. The 2010 growing season was the temporal scope ofanalysis used in this study, while one tonne of apples produced wasthe functional unit of analyses employed.1
1 Mass and area-based functional measures provide information relevant todetermining preferable levels of production intensity (Nemecek et al., 2011). Referto Keyes (2013) for per hectare results and analyses for both conventional andorganic apple systems.
Please cite this article in press as: Keyes, S., et al., Evaluating the environmScotia, Canada, through life cycle assessment, Journal of Cleaner Product
2.2. System boundaries
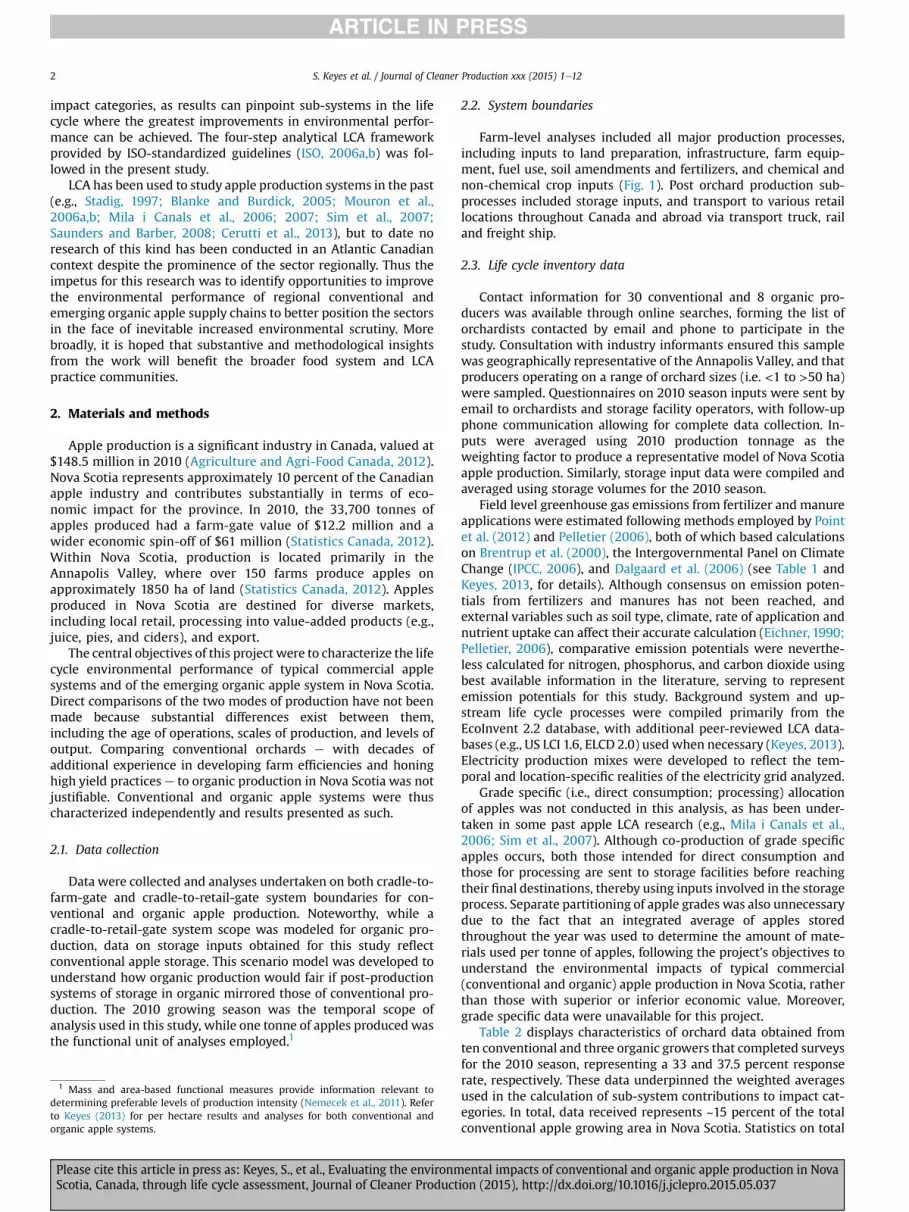
Farm-level analyses included all major production processes,including inputs to land preparation, infrastructure, farm equip-ment, fuel use, soil amendments and fertilizers, and chemical andnon-chemical crop inputs (Fig. 1). Post orchard production sub-processes included storage inputs, and transport to various retaillocations throughout Canada and abroad via transport truck, railand freight ship.
2.3. Life cycle inventory data
Contact information for 30 conventional and 8 organic pro-ducers was available through online searches, forming the list oforchardists contacted by email and phone to participate in thestudy. Consultation with industry informants ensured this samplewas geographically representative of the Annapolis Valley, and thatproducers operating on a range of orchard sizes (i.e. <1 to >50 ha)were sampled. Questionnaires on 2010 season inputs were sent byemail to orchardists and storage facility operators, with follow-upphone communication allowing for complete data collection. In-puts were averaged using 2010 production tonnage as theweighting factor to produce a representative model of Nova Scotiaapple production. Similarly, storage input data were compiled andaveraged using storage volumes for the 2010 season.
Field level greenhouse gas emissions from fertilizer and manureapplications were estimated following methods employed by Pointet al. (2012) and Pelletier (2006), both of which based calculationson Brentrup et al. (2000), the Intergovernmental Panel on ClimateChange (IPCC, 2006), and Dalgaard et al. (2006) (see Table 1 andKeyes, 2013, for details). Although consensus on emission poten-tials from fertilizers and manures has not been reached, andexternal variables such as soil type, climate, rate of application andnutrient uptake can affect their accurate calculation (Eichner, 1990;Pelletier, 2006), comparative emission potentials were neverthe-less calculated for nitrogen, phosphorus, and carbon dioxide usingbest available information in the literature, serving to representemission potentials for this study. Background system and up-stream life cycle processes were compiled primarily from theEcoInvent 2.2 database, with additional peer-reviewed LCA data-bases (e.g., US LCI 1.6, ELCD 2.0) used when necessary (Keyes, 2013).Electricity production mixes were developed to reflect the tem-poral and location-specific realities of the electricity grid analyzed.
Grade specific (i.e., direct consumption; processing) allocationof apples was not conducted in this analysis, as has been under-taken in some past apple LCA research (e.g., Mila i Canals et al.,2006; Sim et al., 2007). Although co-production of grade specificapples occurs, both those intended for direct consumption andthose for processing are sent to storage facilities before reachingtheir final destinations, thereby using inputs involved in the storageprocess. Separate partitioning of apple grades was also unnecessarydue to the fact that an integrated average of apples storedthroughout the year was used to determine the amount of mate-rials used per tonne of apples, following the project's objectives tounderstand the environmental impacts of typical commercial(conventional and organic) apple production in Nova Scotia, ratherthan those with superior or inferior economic value. Moreover,grade specific data were unavailable for this project.
Table 2 displays characteristics of orchard data obtained fromten conventional and three organic growers that completed surveysfor the 2010 season, representing a 33 and 37.5 percent responserate, respectively. These data underpinned the weighted averagesused in the calculation of sub-system contributions to impact cat-egories. In total, data received represents ~15 percent of the totalconventional apple growing area in Nova Scotia. Statistics on total
ental impacts of conventional and organic apple production in Novaion (2015), http://dx.doi.org/10.1016/j.jclepro.2015.05.037
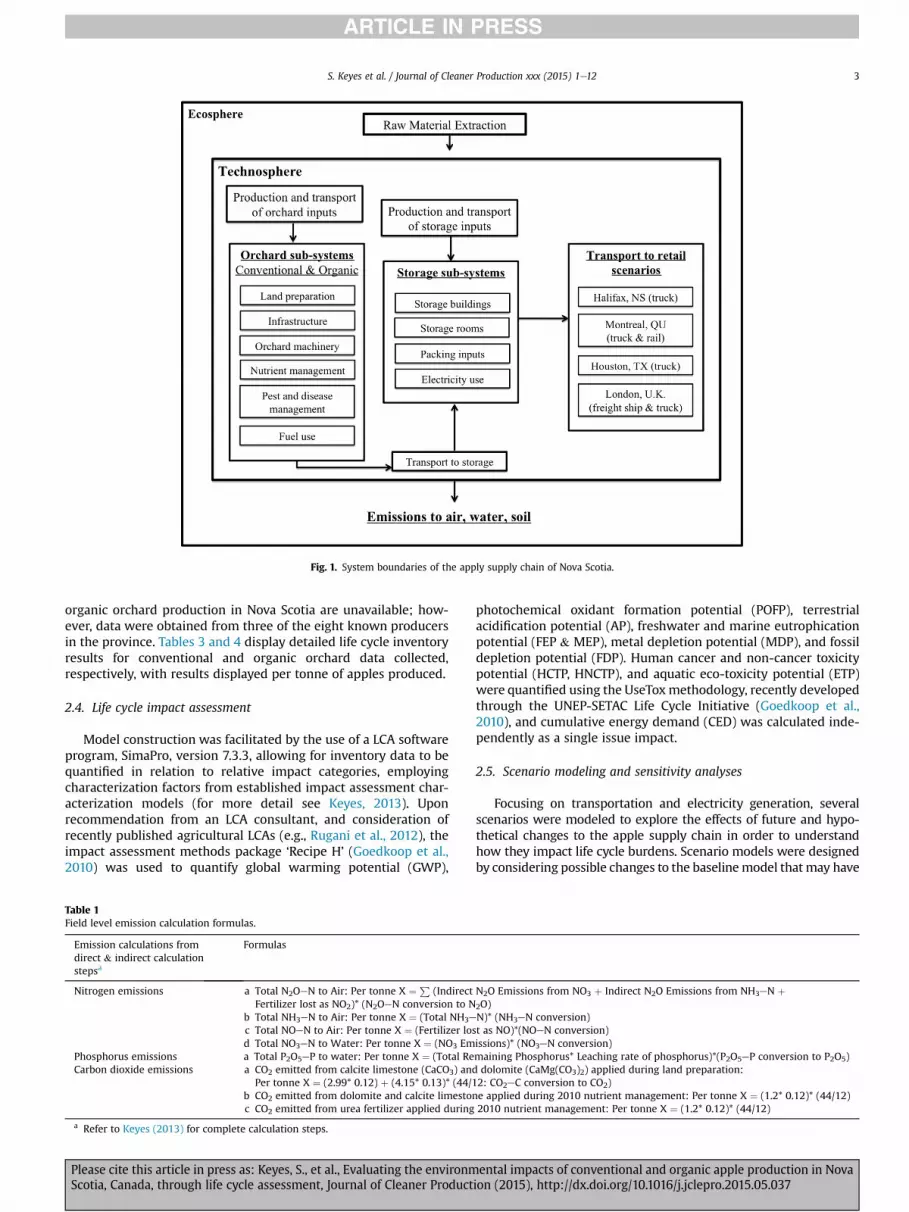
Fig. 1. System boundaries of the apply supply chain of Nova Scotia.
S. Keyes et al. / Journal of Cleaner Production xxx (2015) 1e12 3
organic orchard production in Nova Scotia are unavailable; how-ever, data were obtained from three of the eight known producersin the province. Tables 3 and 4 display detailed life cycle inventoryresults for conventional and organic orchard data collected,respectively, with results displayed per tonne of apples produced.
2.4. Life cycle impact assessment
Model construction was facilitated by the use of a LCA softwareprogram, SimaPro, version 7.3.3, allowing for inventory data to bequantified in relation to relative impact categories, employingcharacterization factors from established impact assessment char-acterization models (for more detail see Keyes, 2013). Uponrecommendation from an LCA consultant, and consideration ofrecently published agricultural LCAs (e.g., Rugani et al., 2012), theimpact assessment methods package ‘Recipe H’ (Goedkoop et al.,2010) was used to quantify global warming potential (GWP),
Table 1Field level emission calculation formulas.
Emission calculations fromdirect & indirect calculationstepsa
Formulas
Nitrogen emissions a Total N2OeN to Air: Per tonne X ¼ P(Indirect
Fertilizer lost as NO2)* (N2OeN conversion to Nb Total NH3eN to Air: Per tonne X ¼ (Total NH3e
c Total NOeN to Air: Per tonne X ¼ (Fertilizer losd Total NO3eN to Water: Per tonne X ¼ (NO3 Em
Phosphorus emissions a Total P2O5eP to water: Per tonne X ¼ (Total ReCarbon dioxide emissions a CO2 emitted from calcite limestone (CaCO3) and
Per tonne X ¼ (2.99* 0.12) þ (4.15* 0.13)* (44/1b CO2 emitted from dolomite and calcite limestonc CO2 emitted from urea fertilizer applied during
a Refer to Keyes (2013) for complete calculation steps.
Please cite this article in press as: Keyes, S., et al., Evaluating the environmScotia, Canada, through life cycle assessment, Journal of Cleaner Product
photochemical oxidant formation potential (POFP), terrestrialacidification potential (AP), freshwater and marine eutrophicationpotential (FEP & MEP), metal depletion potential (MDP), and fossildepletion potential (FDP). Human cancer and non-cancer toxicitypotential (HCTP, HNCTP), and aquatic eco-toxicity potential (ETP)were quantified using the UseToxmethodology, recently developedthrough the UNEP-SETAC Life Cycle Initiative (Goedkoop et al.,2010), and cumulative energy demand (CED) was calculated inde-pendently as a single issue impact.
2.5. Scenario modeling and sensitivity analyses
Focusing on transportation and electricity generation, severalscenarios were modeled to explore the effects of future and hypo-thetical changes to the apple supply chain in order to understandhow they impact life cycle burdens. Scenario models were designedby considering possible changes to the baselinemodel that may have
N2O Emissions from NO3 þ Indirect N2O Emissions from NH3eN þ2O)N)* (NH3eN conversion)t as NO)*(NOeN conversion)issions)* (NO3eN conversion)maining Phosphorus* Leaching rate of phosphorus)*(P2O5eP conversion to P2O5)dolomite (CaMg(CO3)2) applied during land preparation:2: CO2eC conversion to CO2)e applied during 2010 nutrient management: Per tonne X ¼ (1.2* 0.12)* (44/12)2010 nutrient management: Per tonne X ¼ (1.2* 0.12)* (44/12)
ental impacts of conventional and organic apple production in Novaion (2015), http://dx.doi.org/10.1016/j.jclepro.2015.05.037
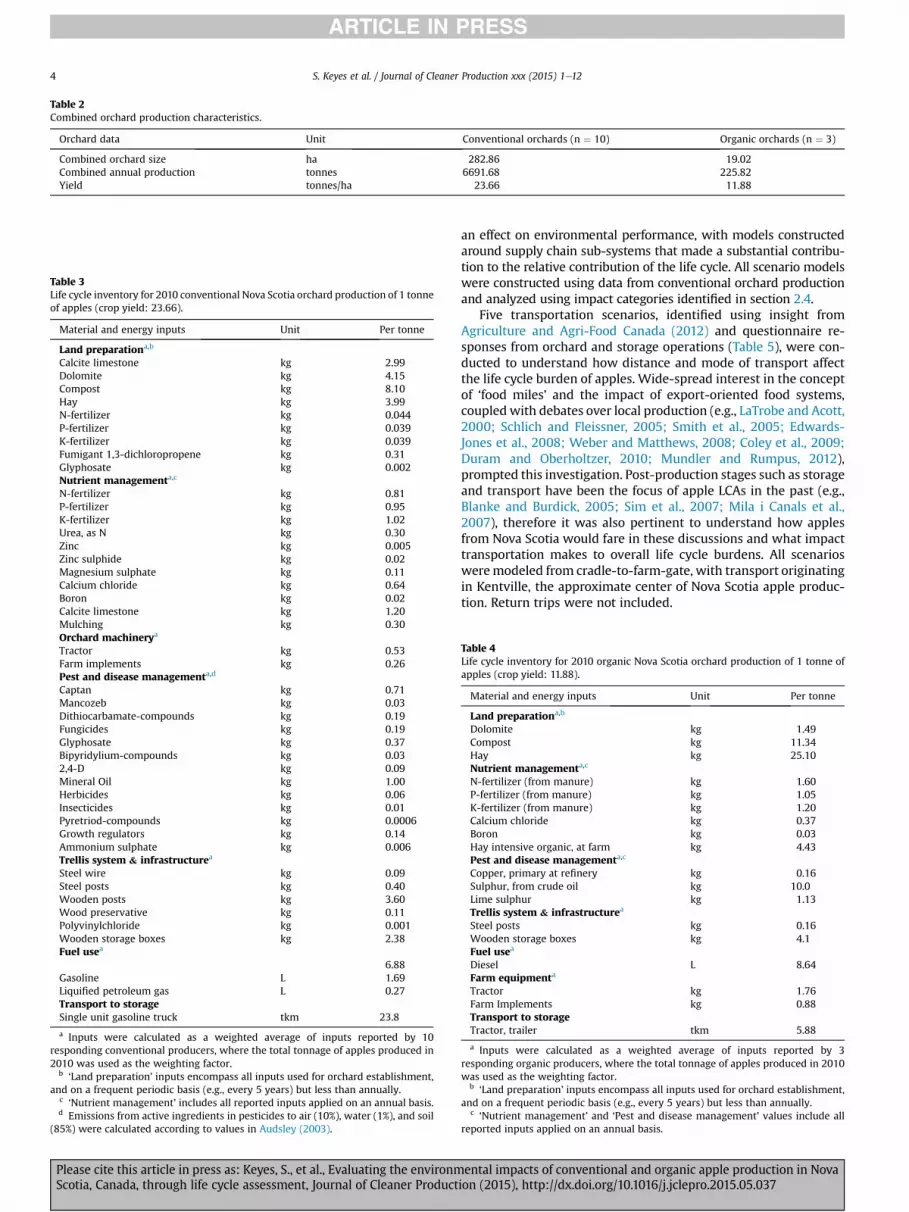
Table 2Combined orchard production characteristics.
Orchard data Unit Conventional orchards (n ¼ 10) Organic orchards (n ¼ 3)
Combined orchard size ha 282.86 19.02Combined annual production tonnes 6691.68 225.82Yield tonnes/ha 23.66 11.88
Table 3Life cycle inventory for 2010 conventional Nova Scotia orchard production of 1 tonneof apples (crop yield: 23.66).
Material and energy inputs Unit Per tonne
Land preparationa,b
Calcite limestone kg 2.99Dolomite kg 4.15Compost kg 8.10Hay kg 3.99N-fertilizer kg 0.044P-fertilizer kg 0.039K-fertilizer kg 0.039Fumigant 1,3-dichloropropene kg 0.31Glyphosate kg 0.002Nutrient managementa,c
N-fertilizer kg 0.81P-fertilizer kg 0.95K-fertilizer kg 1.02Urea, as N kg 0.30Zinc kg 0.005Zinc sulphide kg 0.02Magnesium sulphate kg 0.11Calcium chloride kg 0.64Boron kg 0.02Calcite limestone kg 1.20Mulching kg 0.30Orchard machinerya
Tractor kg 0.53Farm implements kg 0.26Pest and disease managementa,d
Captan kg 0.71Mancozeb kg 0.03Dithiocarbamate-compounds kg 0.19Fungicides kg 0.19Glyphosate kg 0.37Bipyridylium-compounds kg 0.032,4-D kg 0.09Mineral Oil kg 1.00Herbicides kg 0.06Insecticides kg 0.01Pyretriod-compounds kg 0.0006Growth regulators kg 0.14Ammonium sulphate kg 0.006Trellis system & infrastructurea
Steel wire kg 0.09Steel posts kg 0.40Wooden posts kg 3.60Wood preservative kg 0.11Polyvinylchloride kg 0.001Wooden storage boxes kg 2.38Fuel usea
6.88Gasoline L 1.69Liquified petroleum gas L 0.27Transport to storageSingle unit gasoline truck tkm 23.8
a Inputs were calculated as a weighted average of inputs reported by 10responding conventional producers, where the total tonnage of apples produced in2010 was used as the weighting factor.
b ‘Land preparation’ inputs encompass all inputs used for orchard establishment,and on a frequent periodic basis (e.g., every 5 years) but less than annually.
c ‘Nutrient management’ includes all reported inputs applied on an annual basis.d Emissions from active ingredients in pesticides to air (10%), water (1%), and soil
(85%) were calculated according to values in Audsley (2003).
S. Keyes et al. / Journal of Cleaner Production xxx (2015) 1e124
Please cite this article in press as: Keyes, S., et al., Evaluating the environmScotia, Canada, through life cycle assessment, Journal of Cleaner Product
an effect on environmental performance, with models constructedaround supply chain sub-systems that made a substantial contribu-tion to the relative contribution of the life cycle. All scenario modelswere constructed using data from conventional orchard productionand analyzed using impact categories identified in section 2.4.
Five transportation scenarios, identified using insight fromAgriculture and Agri-Food Canada (2012) and questionnaire re-sponses from orchard and storage operations (Table 5), were con-ducted to understand how distance and mode of transport affectthe life cycle burden of apples. Wide-spread interest in the conceptof ‘food miles’ and the impact of export-oriented food systems,coupled with debates over local production (e.g., LaTrobe and Acott,2000; Schlich and Fleissner, 2005; Smith et al., 2005; Edwards-Jones et al., 2008; Weber and Matthews, 2008; Coley et al., 2009;Duram and Oberholtzer, 2010; Mundler and Rumpus, 2012),prompted this investigation. Post-production stages such as storageand transport have been the focus of apple LCAs in the past (e.g.,Blanke and Burdick, 2005; Sim et al., 2007; Mila i Canals et al.,2007), therefore it was also pertinent to understand how applesfrom Nova Scotia would fare in these discussions and what impacttransportation makes to overall life cycle burdens. All scenariosweremodeled from cradle-to-farm-gate, with transport originatingin Kentville, the approximate center of Nova Scotia apple produc-tion. Return trips were not included.
Table 4Life cycle inventory for 2010 organic Nova Scotia orchard production of 1 tonne ofapples (crop yield: 11.88).
Material and energy inputs Unit Per tonne
Land preparationa,b
Dolomite kg 1.49Compost kg 11.34Hay kg 25.10Nutrient managementa,c
N-fertilizer (from manure) kg 1.60P-fertilizer (from manure) kg 1.05K-fertilizer (from manure) kg 1.20Calcium chloride kg 0.37Boron kg 0.03Hay intensive organic, at farm kg 4.43Pest and disease managementa,c
Copper, primary at refinery kg 0.16Sulphur, from crude oil kg 10.0Lime sulphur kg 1.13Trellis system & infrastructurea
Steel posts kg 0.16Wooden storage boxes kg 4.1Fuel usea
Diesel L 8.64Farm equipmenta
Tractor kg 1.76Farm Implements kg 0.88Transport to storageTractor, trailer tkm 5.88
a Inputs were calculated as a weighted average of inputs reported by 3responding organic producers, where the total tonnage of apples produced in 2010was used as the weighting factor.
b ‘Land preparation’ inputs encompass all inputs used for orchard establishment,and on a frequent periodic basis (e.g., every 5 years) but less than annually.
c ‘Nutrient management’ and ‘Pest and disease management’ values include allreported inputs applied on an annual basis.
ental impacts of conventional and organic apple production in Novaion (2015), http://dx.doi.org/10.1016/j.jclepro.2015.05.037
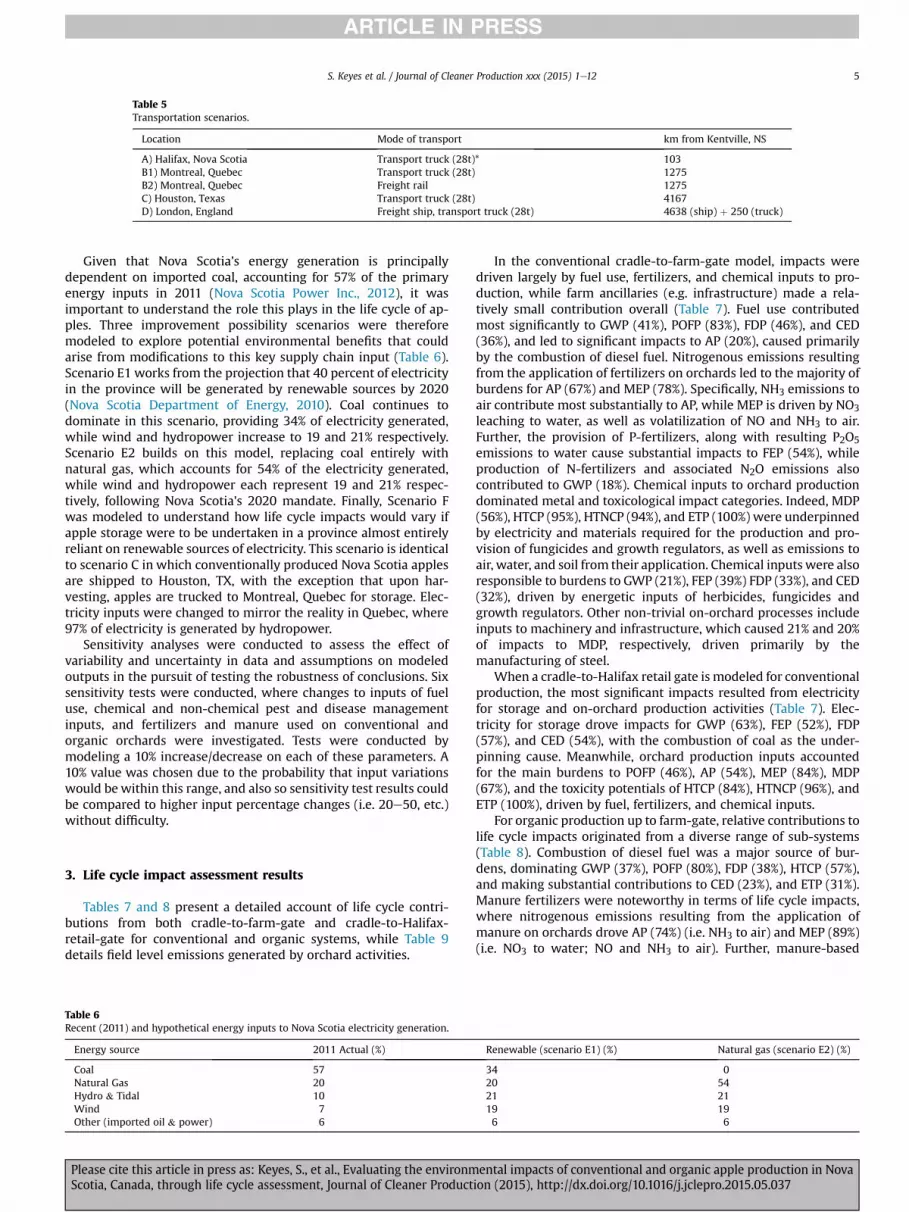
Table 5Transportation scenarios.
Location Mode of transport km from Kentville, NS
A) Halifax, Nova Scotia Transport truck (28t)* 103B1) Montreal, Quebec Transport truck (28t) 1275B2) Montreal, Quebec Freight rail 1275C) Houston, Texas Transport truck (28t) 4167D) London, England Freight ship, transport truck (28t) 4638 (ship) þ 250 (truck)
S. Keyes et al. / Journal of Cleaner Production xxx (2015) 1e12 5
Given that Nova Scotia's energy generation is principallydependent on imported coal, accounting for 57% of the primaryenergy inputs in 2011 (Nova Scotia Power Inc., 2012), it wasimportant to understand the role this plays in the life cycle of ap-ples. Three improvement possibility scenarios were thereforemodeled to explore potential environmental benefits that couldarise from modifications to this key supply chain input (Table 6).Scenario E1 works from the projection that 40 percent of electricityin the province will be generated by renewable sources by 2020(Nova Scotia Department of Energy, 2010). Coal continues todominate in this scenario, providing 34% of electricity generated,while wind and hydropower increase to 19 and 21% respectively.Scenario E2 builds on this model, replacing coal entirely withnatural gas, which accounts for 54% of the electricity generated,while wind and hydropower each represent 19 and 21% respec-tively, following Nova Scotia's 2020 mandate. Finally, Scenario Fwas modeled to understand how life cycle impacts would vary ifapple storage were to be undertaken in a province almost entirelyreliant on renewable sources of electricity. This scenario is identicalto scenario C in which conventionally produced Nova Scotia applesare shipped to Houston, TX, with the exception that upon har-vesting, apples are trucked to Montreal, Quebec for storage. Elec-tricity inputs were changed to mirror the reality in Quebec, where97% of electricity is generated by hydropower.
Sensitivity analyses were conducted to assess the effect ofvariability and uncertainty in data and assumptions on modeledoutputs in the pursuit of testing the robustness of conclusions. Sixsensitivity tests were conducted, where changes to inputs of fueluse, chemical and non-chemical pest and disease managementinputs, and fertilizers and manure used on conventional andorganic orchards were investigated. Tests were conducted bymodeling a 10% increase/decrease on each of these parameters. A10% value was chosen due to the probability that input variationswould bewithin this range, and also so sensitivity test results couldbe compared to higher input percentage changes (i.e. 20e50, etc.)without difficulty.
3. Life cycle impact assessment results
Tables 7 and 8 present a detailed account of life cycle contri-butions from both cradle-to-farm-gate and cradle-to-Halifax-retail-gate for conventional and organic systems, while Table 9details field level emissions generated by orchard activities.
Table 6Recent (2011) and hypothetical energy inputs to Nova Scotia electricity generation.
Energy source 2011 Actual (%)
Coal 57Natural Gas 20Hydro & Tidal 10Wind 7Other (imported oil & power) 6
Please cite this article in press as: Keyes, S., et al., Evaluating the environmScotia, Canada, through life cycle assessment, Journal of Cleaner Product
In the conventional cradle-to-farm-gate model, impacts weredriven largely by fuel use, fertilizers, and chemical inputs to pro-duction, while farm ancillaries (e.g. infrastructure) made a rela-tively small contribution overall (Table 7). Fuel use contributedmost significantly to GWP (41%), POFP (83%), FDP (46%), and CED(36%), and led to significant impacts to AP (20%), caused primarilyby the combustion of diesel fuel. Nitrogenous emissions resultingfrom the application of fertilizers on orchards led to the majority ofburdens for AP (67%) and MEP (78%). Specifically, NH3 emissions toair contribute most substantially to AP, while MEP is driven by NO3leaching to water, as well as volatilization of NO and NH3 to air.Further, the provision of P-fertilizers, along with resulting P2O5emissions to water cause substantial impacts to FEP (54%), whileproduction of N-fertilizers and associated N2O emissions alsocontributed to GWP (18%). Chemical inputs to orchard productiondominated metal and toxicological impact categories. Indeed, MDP(56%), HTCP (95%), HTNCP (94%), and ETP (100%) were underpinnedby electricity and materials required for the production and pro-vision of fungicides and growth regulators, as well as emissions toair, water, and soil from their application. Chemical inputswere alsoresponsible to burdens to GWP (21%), FEP (39%) FDP (33%), and CED(32%), driven by energetic inputs of herbicides, fungicides andgrowth regulators. Other non-trivial on-orchard processes includeinputs to machinery and infrastructure, which caused 21% and 20%of impacts to MDP, respectively, driven primarily by themanufacturing of steel.
When a cradle-to-Halifax retail gate is modeled for conventionalproduction, the most significant impacts resulted from electricityfor storage and on-orchard production activities (Table 7). Elec-tricity for storage drove impacts for GWP (63%), FEP (52%), FDP(57%), and CED (54%), with the combustion of coal as the under-pinning cause. Meanwhile, orchard production inputs accountedfor the main burdens to POFP (46%), AP (54%), MEP (84%), MDP(67%), and the toxicity potentials of HTCP (84%), HTNCP (96%), andETP (100%), driven by fuel, fertilizers, and chemical inputs.
For organic production up to farm-gate, relative contributions tolife cycle impacts originated from a diverse range of sub-systems(Table 8). Combustion of diesel fuel was a major source of bur-dens, dominating GWP (37%), POFP (80%), FDP (38%), HTCP (57%),and making substantial contributions to CED (23%), and ETP (31%).Manure fertilizers were noteworthy in terms of life cycle impacts,where nitrogenous emissions resulting from the application ofmanure on orchards drove AP (74%) (i.e. NH3 to air) and MEP (89%)(i.e. NO3 to water; NO and NH3 to air). Further, manure-based
Renewable (scenario E1) (%) Natural gas (scenario E2) (%)
34 020 5421 2119 196 6
ental impacts of conventional and organic apple production in Novaion (2015), http://dx.doi.org/10.1016/j.jclepro.2015.05.037

Table 7Life cycle impact assessment results of 2010 conventional Nova Scotian apple production to farm-gate and Halifax retail-gate per tonne of apples produced/delivered.
GWP (kg CO2 eq) POFP (kg NMVOC) AP (kg SO2 eq) FEP (kg P eq) MEP (kg N eq) MDP (kg Fe eq) FDP (kg oil eq) CED (MJ) HTCP (CTUh) HTNCP (CTUh) ETP (CTUe)
Land prep.1 (%)* 7.69Eþ00 12.0% 1.13E-02 1.9% 8.15E-02 5.6% 1.63E-03 2.6% 3.94E-03 1.8% 1.11E-01 1.2% 6.72E-01 3.2% 1.06Eþ02 9.7% 1.61E-10 0.3% 3.55E-10 0.1% 5.92E-01 0.0%Nutrient & Fert.2 (%)* 1.12Eþ01 17.5% 1.10E-02 1.9% 9.77E-01 66.5% 3.43E-02 53.9% 1.66E-01 77.5% 1.45E-01 1.6% 1.86Eþ00 9.0% 8.19Eþ01 7.5% 2.80E-10 0.5% 6.07E-10 0.2% 3.36E-03 0.0%Crop mgmt.3 (%)* 1.37Eþ01 21.4% 5.35E-02 9.2% 1.01E-01 6.9% 2.47E-02 38.7% 2.64E-02 12.3% 5.17Eþ00 55.7% 6.90Eþ00 33.3% 3.52Eþ02 32.1% 5.66E-08 94.7% 2.37E-07 93.7% 6.96Eþ03 100.0%Infrastructure (%)* 1.32Eþ00 2.1% 5.16E-03 0.9% 6.78E-03 0.5% 1.04E-03 1.6% �5.00E-04 -0.2% 1.88Eþ00 20.2% 3.88E-01 1.9% 8.16Eþ01 7.4% 1.06E-10 0.2% 2.16E-09 0.9% �6.88E-04 0.0%Machinery (%)* 3.63Eþ00 5.7% 1.73E-02 3.0% 1.30E-02 0.9% 2.03E-03 3.2% 5.73E-04 0.3% 1.99Eþ00 21.4% 1.41Eþ00 6.8% 7.73Eþ01 7.0% 2.62E-10 0.4% 3.27E-09 1.3% 1.10E-02 0.0%Fuel use (%)* 2.65Eþ01 41.4% 4.86E-01 83.2% 2.89E-01 19.7% 0.00Eþ00 0.0% 1.78E-02 8.3% 0.00Eþ00 0.0% 9.47Eþ00 45.8% 3.98Eþ02 36.3% 2.33E-09 3.9% 9.56E-09 3.8% 3.29E-02 0.0%
Total OrchardProduction (%)**
6.41Eþ01 23.2% 5.84E-01 46.4% 1.47Eþ00 54.1% 6.37E-02 44.6% 2.14E-01 84.1% 9.29Eþ00 67.2% 2.07Eþ01 24.1% 1.10Eþ03 26.8% 5.98E-08 84.2% 2.53E-07 95.9% 6.96Eþ03 99.9%
Transport to Storage (%)** 3.77Eþ00 1.4% 2.80E-02 2.2% 1.80E-02 0.7% 0.00Eþ00 0.0% 9.20E-04 0.4% 0.00Eþ00 0.0% 1.37Eþ00 1.6% 5.76Eþ01 1.4% 1.15E-11 0.0% 7.79E-12 0.0% 3.92E-03 0.0%Storage and Packing (%)** 2.00Eþ01 7.3% 7.17E-02 5.7% 5.76E-02 2.1% 4.15E-03 2.9% 4.63E-03 1.8% 2.68Eþ00 19.4% 8.86Eþ00 10.3% 4.65Eþ02 11.4% 1.39E-09 2.0% 7.52E-09 2.8% 3.51Eþ00 0.1%Electricity for Storage (%)** 1.73Eþ02 62.9% 4.35E-01 34.6% 1.09Eþ00 40.2% 7.37E-02 51.5% 3.02E-02 11.9% 1.07Eþ00 7.7% 4.85Eþ01 56.6% 2.20Eþ03 53.6% 4.45E-09 6.3% 2.33E-09 0.9% 6.54E-02 0.0%Transport to Halifax (%)** 1.45Eþ01 5.3% 1.39E-01 11.1% 8.12E-02 3.0% 1.41E-03 1.0% 4.76E-03 1.9% 7.72E-01 5.6% 6.35Eþ00 7.4% 2.83Eþ02 6.9% 5.40E-09 7.6% 9.16E-10 0.3% 3.90E-02 0.0%
Total LC to Halifax Retail 2.76Eþ02 1.26Eþ00 2.71Eþ00 1.43E-01 2.54E-01 1.38Eþ01 8.58Eþ01 4.10Eþ03 7.10E-08 2.64E-07 6.96Eþ03
Notes: 1) Land preparation; 2) Nutrients and fertilizers; 3) Cropmanagement (i.e. synthetic pesticides); (%)*¼ Relative contribution per tonne of apples from cradle-to-farm-gate; (%)**¼ Relative contribution per tonne of applesfrom cradle-to-Halifax-retail-gate.
Table 8Life cycle impact assessment results of 2010 organic Nova Scotian apple production to farm-gate and Halifax retail-gate per tonne of apples produced/delivered.
GWP (kg CO2 eq) POFP (kg NMVOC) AP (kg SO2 eq) FEP (kg P eq) MEP (kg N eq) MDP (kg Fe eq) FDP (kg oil eq) CED (MJ) HTCP (CTUh) HTNCP (CTUh) ETP (CTUe)
Land prep.1 (%)* 9.27Eþ00 12.7% 2.83E-02 4.4% 3.98E-01 13.1% 2.97E-03 5.4% 1.56E-02 4.5% 7.49E-01 5.9% 8.71E-01 3.4% 5.30Eþ02 30.0% 5.11E-10 12.2% 2.52E-09 4.7% 5.69E-03 5.3%Nutrient & Fert.2 (%)* 1.76Eþ01 24.1% 1.42E-02 2.2% 2.23Eþ00 73.5% 3.71E-02 67.1% 3.07E-01 88.9% 1.62E-01 1.3% 2.29Eþ00 9.0% 1.85Eþ02 10.5% 2.86E-10 6.8% 5.46E-10 1.0% 4.57E-03 4.3%Crop mgmt.3 (%)* 6.92Eþ00 9.4% 2.52E-02 3.9% 5.22E-02 1.7% 8.51E-03 15.4% 1.53E-03 0.4% 5.20Eþ00 41.2% 8.07Eþ00 31.7% 3.48Eþ02 19.7% 1.39E-10 3.3% 3.01E-08 55.9% 2.73E-02 25.4%Infrastructure (%)* 3.63E-01 0.5% 1.72E-03 0.3% 1.30E-03 0.0% 1.57E-04 0.3% 7.16E-05 0.0% 3.20E-01 2.5% 1.16E-01 0.5% 4.86Eþ01 2.8% 3.50E-11 0.8% 3.79E-11 0.1% 2.46E-04 0.2%Machinery (%)* 1.17Eþ01 16.0% 5.62E-02 8.8% 4.21E-02 1.4% 6.54E-03 11.8% 1.84E-03 0.5% 6.19Eþ00 49.1% 4.57Eþ00 17.9% 2.51Eþ02 14.2% 8.28E-10 19.7% 1.08E-08 20.1% 3.63E-02 33.8%Fuel use (%)* 2.73Eþ01 37.2% 5.13E-01 80.3% 3.10E-01 10.2% 0.00Eþ00 0.0% 1.92E-02 5.6% 0.00Eþ00 0.0% 9.56Eþ00 37.5% 4.01Eþ02 22.8% 2.39E-09 57.1% 9.83E-09 18.3% 3.33E-02 31.0%
Total OrchardProduction (%)**
7.32Eþ01 25.9% 6.38E-01 49.1% 3.03Eþ00 71.0% 5.53E-02 41.0% 3.45E-01 89.6% 1.26Eþ01 72.2% 2.55Eþ01 28.4% 1.76Eþ03 37.2% 4.19E-09 27.0% 5.38E-08 82.8% 1.07E-01 2.9%
Transport to Storage (%)** 1.82Eþ00 0.6% 1.54E-02 1.2% 1.01E-02 0.2% 4.38E-04 0.3% 5.64E-04 0.1% 3.21E-01 1.8% 6.00E-01 0.7% 3.10Eþ01 0.7% 7.83E-11 0.5% 4.14E-10 0.6% 3.51E-03 0.1%Storage and Packing (%)** 2.00Eþ01 7.1% 7.17E-02 5.5% 5.76E-02 1.3% 4.15E-03 3.1% 4.63E-03 1.2% 2.68Eþ00 15.4% 8.86Eþ00 9.9% 4.65Eþ02 9.8% 1.39E-09 8.9% 7.52E-09 11.6% 3.51Eþ00 94.2%Electricity for Storage (%)** 1.73Eþ02 61.3% 4.35E-01 33.5% 1.09Eþ00 25.5% 7.37E-02 54.6% 3.02E-02 7.8% 1.07Eþ00 6.1% 4.85Eþ01 54.0% 2.20Eþ03 46.3% 4.45E-09 28.7% 2.33E-09 3.6% 6.54E-02 1.8%Transport to Halifax (%)** 1.45Eþ01 5.1% 1.39E-01 10.7% 8.12E-02 1.9% 1.41E-03 1.0% 4.76E-03 1.2% 7.72E-01 4.4% 6.35Eþ00 7.1% 2.83Eþ02 6.0% 5.40E-09 34.8% 9.16E-10 1.4% 3.90E-02 1.0%
Total LC to Halifax Retail 2.83Eþ02 1.30Eþ00 4.27Eþ00 1.35E-01 3.85E-01 1.75Eþ01 8.98Eþ01 4.74Eþ03 1.55E-08 6.50E-08 3.73Eþ00
Notes: 1) Land preparation; 2) Nutrients and fertilizers; 3) Crop management (i.e. non-synthetic pesticides); (%)* ¼ Relative contribution per tonne of apples from cradle-to-farm-gate; (%)** ¼ Relative contribution per tonne ofapples from cradle-to-Halifax-retail-gate.
S.Keyeset
al./Journal
ofCleaner
Productionxxx
(2015)1e12
6Pleasecite
thisarticle
inpress
as:Keyes,S.,et
al.,Evaluatingthe
environmentalim
pactsofconventionaland
organicapple
productionin
Nova
Scotia,Canada,throughlife
cycleassessm
ent,JournalofCleaner
Production(2015),http://dx.doi.org/10.1016/j.jclepro.2015.05.037
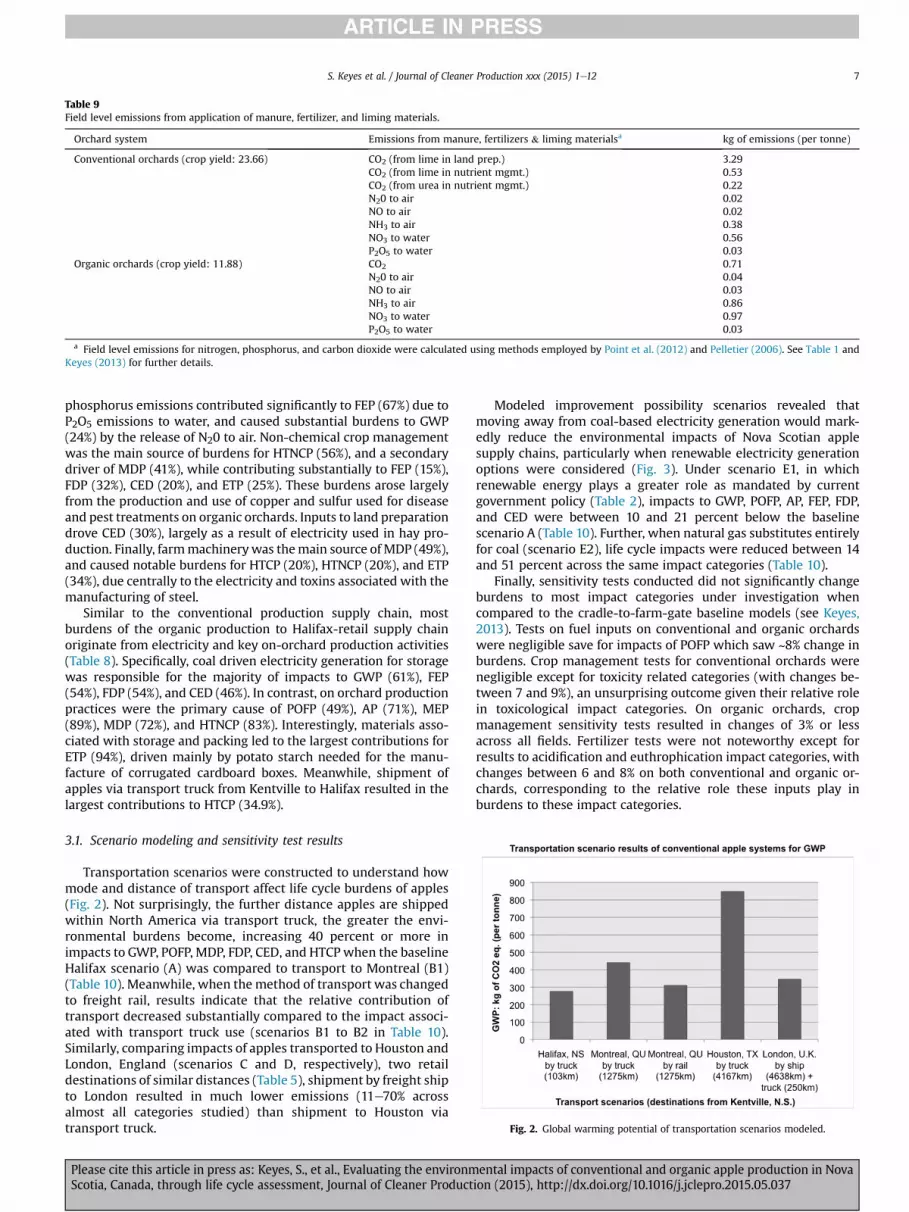
Fig. 2. Global warming potential of transportation scenarios modeled.
Table 9Field level emissions from application of manure, fertilizer, and liming materials.
Orchard system Emissions from manure, fertilizers & liming materialsa kg of emissions (per tonne)
Conventional orchards (crop yield: 23.66) CO2 (from lime in land prep.) 3.29CO2 (from lime in nutrient mgmt.) 0.53CO2 (from urea in nutrient mgmt.) 0.22N20 to air 0.02NO to air 0.02NH3 to air 0.38NO3 to water 0.56P2O5 to water 0.03
Organic orchards (crop yield: 11.88) CO2 0.71N20 to air 0.04NO to air 0.03NH3 to air 0.86NO3 to water 0.97P2O5 to water 0.03
a Field level emissions for nitrogen, phosphorus, and carbon dioxide were calculated using methods employed by Point et al. (2012) and Pelletier (2006). See Table 1 andKeyes (2013) for further details.
S. Keyes et al. / Journal of Cleaner Production xxx (2015) 1e12 7
phosphorus emissions contributed significantly to FEP (67%) due toP2O5 emissions to water, and caused substantial burdens to GWP(24%) by the release of N20 to air. Non-chemical crop managementwas the main source of burdens for HTNCP (56%), and a secondarydriver of MDP (41%), while contributing substantially to FEP (15%),FDP (32%), CED (20%), and ETP (25%). These burdens arose largelyfrom the production and use of copper and sulfur used for diseaseand pest treatments on organic orchards. Inputs to land preparationdrove CED (30%), largely as a result of electricity used in hay pro-duction. Finally, farmmachinerywas themain source of MDP (49%),and caused notable burdens for HTCP (20%), HTNCP (20%), and ETP(34%), due centrally to the electricity and toxins associated with themanufacturing of steel.
Similar to the conventional production supply chain, mostburdens of the organic production to Halifax-retail supply chainoriginate from electricity and key on-orchard production activities(Table 8). Specifically, coal driven electricity generation for storagewas responsible for the majority of impacts to GWP (61%), FEP(54%), FDP (54%), and CED (46%). In contrast, on orchard productionpractices were the primary cause of POFP (49%), AP (71%), MEP(89%), MDP (72%), and HTNCP (83%). Interestingly, materials asso-ciated with storage and packing led to the largest contributions forETP (94%), driven mainly by potato starch needed for the manu-facture of corrugated cardboard boxes. Meanwhile, shipment ofapples via transport truck from Kentville to Halifax resulted in thelargest contributions to HTCP (34.9%).
3.1. Scenario modeling and sensitivity test results
Transportation scenarios were constructed to understand howmode and distance of transport affect life cycle burdens of apples(Fig. 2). Not surprisingly, the further distance apples are shippedwithin North America via transport truck, the greater the envi-ronmental burdens become, increasing 40 percent or more inimpacts to GWP, POFP, MDP, FDP, CED, and HTCP when the baselineHalifax scenario (A) was compared to transport to Montreal (B1)(Table 10). Meanwhile, when themethod of transport was changedto freight rail, results indicate that the relative contribution oftransport decreased substantially compared to the impact associ-ated with transport truck use (scenarios B1 to B2 in Table 10).Similarly, comparing impacts of apples transported to Houston andLondon, England (scenarios C and D, respectively), two retaildestinations of similar distances (Table 5), shipment by freight shipto London resulted in much lower emissions (11e70% acrossalmost all categories studied) than shipment to Houston viatransport truck.
Please cite this article in press as: Keyes, S., et al., Evaluating the environmScotia, Canada, through life cycle assessment, Journal of Cleaner Product
Modeled improvement possibility scenarios revealed thatmoving away from coal-based electricity generation would mark-edly reduce the environmental impacts of Nova Scotian applesupply chains, particularly when renewable electricity generationoptions were considered (Fig. 3). Under scenario E1, in whichrenewable energy plays a greater role as mandated by currentgovernment policy (Table 2), impacts to GWP, POFP, AP, FEP, FDP,and CED were between 10 and 21 percent below the baselinescenario A (Table 10). Further, when natural gas substitutes entirelyfor coal (scenario E2), life cycle impacts were reduced between 14and 51 percent across the same impact categories (Table 10).
Finally, sensitivity tests conducted did not significantly changeburdens to most impact categories under investigation whencompared to the cradle-to-farm-gate baseline models (see Keyes,2013). Tests on fuel inputs on conventional and organic orchardswere negligible save for impacts of POFP which saw ~8% change inburdens. Crop management tests for conventional orchards werenegligible except for toxicity related categories (with changes be-tween 7 and 9%), an unsurprising outcome given their relative rolein toxicological impact categories. On organic orchards, cropmanagement sensitivity tests resulted in changes of 3% or lessacross all fields. Fertilizer tests were not noteworthy except forresults to acidification and euthrophication impact categories, withchanges between 6 and 8% on both conventional and organic or-chards, corresponding to the relative role these inputs play inburdens to these impact categories.
ental impacts of conventional and organic apple production in Novaion (2015), http://dx.doi.org/10.1016/j.jclepro.2015.05.037

Table 10Transportation and improvement scenario analyses results per tonne of conventional apples delivered.
GWP (kg CO2 eq) POFP (kg NMVOC) AP (kg SO2 eq) FEP (kg P eq) MEP (kg N eq) MDP (kg Fe eq) FDP (kg oil eq) CED (MJ) HTCP (CTUh) HTNCP (CTUh) ETP (CTUe)
A: Kentville toHalifax a %Transport d
2.76Eþ02 5.3% 1.26Eþ00 11.1% 2.71Eþ00 3.0% 1.43E-01 1.0% 2.54E-01 1.9% 1.38Eþ01 5.6% 8.58Eþ01 7.4% 4.10Eþ03 6.9% 7.10E-08 7.6% 2.64E-07 0.3% 6.96Eþ03 0.0%
B1: Kentville toMontreal a %Transport e
4.41Eþ02 40.8% 2.84Eþ00 60.6% 3.64Eþ00 27.6% 1.59E-01 11.0% 3.09E-01 19.1% 2.26Eþ01 42.3% 1.58Eþ02 49.7% 7.32Eþ03 47.9% 1.32E-07 50.5% 2.75E-07 4.1% 6.96Eþ03 0.0%
B2: Kentville toMontreal b %Transport e
3.11Eþ02 16.2% 1.41Eþ00 20.4% 2.89Eþ00 9.0% 1.73E-01 18.4% 2.66E-01 6.2% 1.97Eþ01 33.9% 9.47Eþ01 16.1% 4.77Eþ03 20.1% 6.84E-08 4.2% 2.67E-07 1.5% 6.96Eþ03 0.0%
C: Kentville toHouston a
8.48Eþ02 6.75Eþ00 5.92Eþ00 1.99E-01 4.42E-01 4.43Eþ01 3.36Eþ02 1.53Eþ04 2.84E-07 3.00E-07 6.96Eþ03
D: Kentville toLondon c
3.46Eþ02 2.23Eþ00 3.84Eþ00 1.54E-01 2.90E-01 1.57Eþ01 1.12Eþ02 5.29Eþ03 7.95E-08 2.66E-07 6.96Eþ03
% Change f ¡59.2% ¡67.0% ¡35.1% ¡22.7% ¡34.5% ¡64.6% ¡66.8% ¡65.3% ¡72.0% ¡11.4% 0.0%% Transport g 24.5% 49.8% 31.5% 7.9% 13.8% 16.7% 28.9% 27.9% 17.5% 1.1% 0.0%
E1: 40% Renewableenergy scenario %Change h
2.19Eþ02 -20.4% 1.11Eþ00 -11.8% 2.39Eþ00 -11.9% 1.14E-01 -20.5% 2.43E-01 -4.4% 1.39Eþ01 0.6% 7.16Eþ01 -16.6% 3.68Eþ03 -10.3% 7.07E-08 -0.5% 2.64E-07 -0.1% 6.96Eþ03 0.0%
E2: Natural gasscenario % Change h
1.84Eþ02 -33.4% 9.72E-01 -22.7% 2.33Eþ00 -14.1% 7.03E-02 -50.8% 2.28E-01 -10.3% 1.35Eþ01 -2.4% 7.01Eþ01 -18.3% 3.61Eþ03 -12.0% 7.46E-08 5.0% 2.64E-07 -0.2% 6.96Eþ03 0.0%
F: Hydropowerscenario % Change i
6.91Eþ02 -18.5% 6.55Eþ00 -3.0% 4.92Eþ00 -16.9% 1.27E-01 -36.2% 4.17E-01 -5.6% 4.44Eþ01 0.4% 2.95Eþ02 -12.4% 1.42Eþ04 -7.1% 2.88E-07 1.5% 2.99E-07 -0.4% 6.96Eþ03 0.0%
a Via transport truck.b Via freight rail.c Via freight ship and transport truck.d Relative contribution of transport in cradle-to-Halifax retail baseline model (%).e Relative contribution of transport in cradle-to-Montreal-retail model (%).f Percentage change to life cycle emissions between scenario C (transport to Houston, TX) and D (transport to retail in the U.K.).g Relative contribution of transport in cradle-to-London-retail model (%).h Percentage change to life cycle emissions between Halifax baseline (A) and scenario E1 and E2.i Percentage change to life cycle emissions between scenario C and F.
S.Keyeset
al./Journal
ofCleaner
Productionxxx
(2015)1e12
8Pleasecite
thisarticle
inpress
as:Keyes,S.,et
al.,Evaluatingthe
environmentalim
pactsofconventionaland
organicapple
productionin
Nova
Scotia,Canada,throughlife
cycleassessm
ent,JournalofCleaner
Production(2015),http://dx.doi.org/10.1016/j.jclepro.2015.05.037
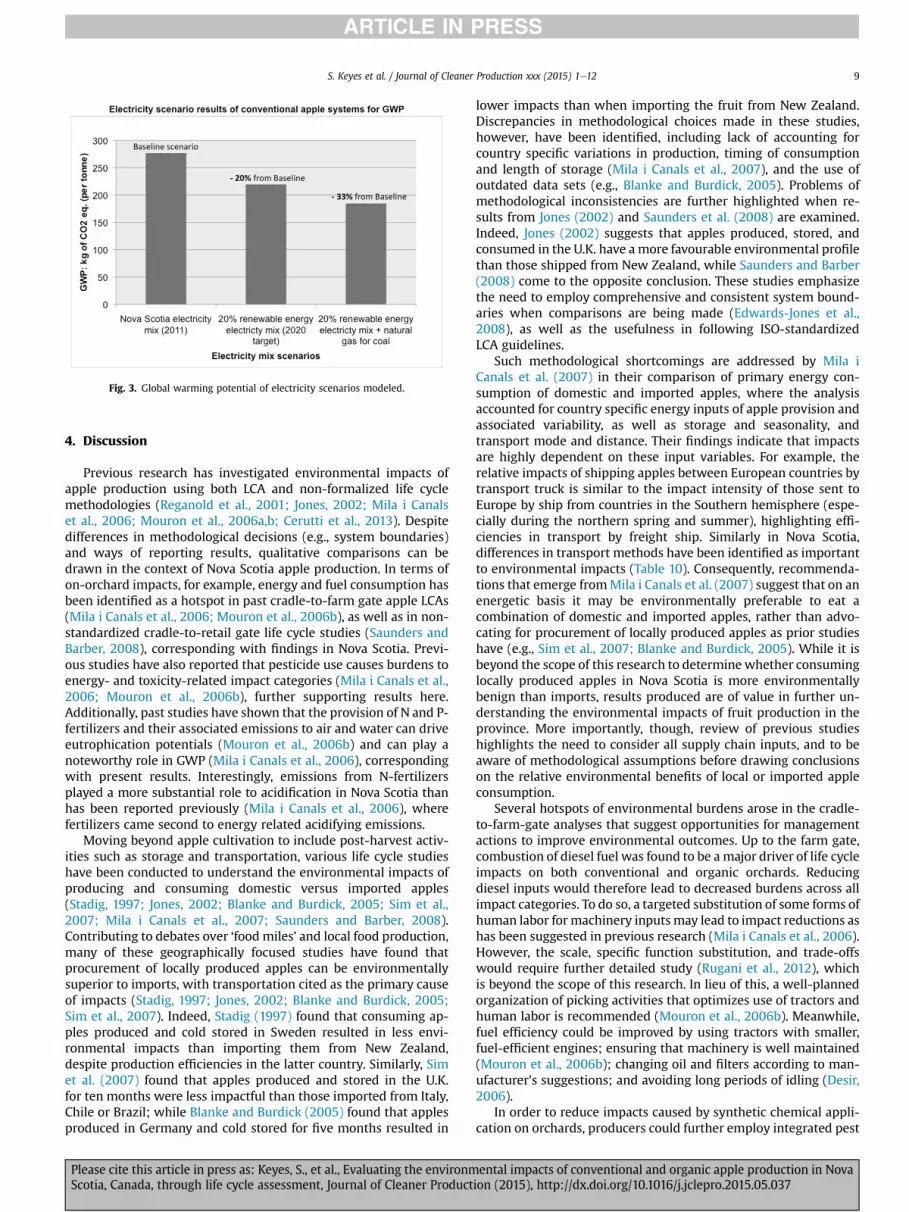
Fig. 3. Global warming potential of electricity scenarios modeled.
S. Keyes et al. / Journal of Cleaner Production xxx (2015) 1e12 9
4. Discussion
Previous research has investigated environmental impacts ofapple production using both LCA and non-formalized life cyclemethodologies (Reganold et al., 2001; Jones, 2002; Mila i Canalset al., 2006; Mouron et al., 2006a,b; Cerutti et al., 2013). Despitedifferences in methodological decisions (e.g., system boundaries)and ways of reporting results, qualitative comparisons can bedrawn in the context of Nova Scotia apple production. In terms ofon-orchard impacts, for example, energy and fuel consumption hasbeen identified as a hotspot in past cradle-to-farm gate apple LCAs(Mila i Canals et al., 2006; Mouron et al., 2006b), as well as in non-standardized cradle-to-retail gate life cycle studies (Saunders andBarber, 2008), corresponding with findings in Nova Scotia. Previ-ous studies have also reported that pesticide use causes burdens toenergy- and toxicity-related impact categories (Mila i Canals et al.,2006; Mouron et al., 2006b), further supporting results here.Additionally, past studies have shown that the provision of N and P-fertilizers and their associated emissions to air and water can driveeutrophication potentials (Mouron et al., 2006b) and can play anoteworthy role in GWP (Mila i Canals et al., 2006), correspondingwith present results. Interestingly, emissions from N-fertilizersplayed a more substantial role to acidification in Nova Scotia thanhas been reported previously (Mila i Canals et al., 2006), wherefertilizers came second to energy related acidifying emissions.
Moving beyond apple cultivation to include post-harvest activ-ities such as storage and transportation, various life cycle studieshave been conducted to understand the environmental impacts ofproducing and consuming domestic versus imported apples(Stadig, 1997; Jones, 2002; Blanke and Burdick, 2005; Sim et al.,2007; Mila i Canals et al., 2007; Saunders and Barber, 2008).Contributing to debates over ‘food miles’ and local food production,many of these geographically focused studies have found thatprocurement of locally produced apples can be environmentallysuperior to imports, with transportation cited as the primary causeof impacts (Stadig, 1997; Jones, 2002; Blanke and Burdick, 2005;Sim et al., 2007). Indeed, Stadig (1997) found that consuming ap-ples produced and cold stored in Sweden resulted in less envi-ronmental impacts than importing them from New Zealand,despite production efficiencies in the latter country. Similarly, Simet al. (2007) found that apples produced and stored in the U.K.for ten months were less impactful than those imported from Italy,Chile or Brazil; while Blanke and Burdick (2005) found that applesproduced in Germany and cold stored for five months resulted in
Please cite this article in press as: Keyes, S., et al., Evaluating the environmScotia, Canada, through life cycle assessment, Journal of Cleaner Product
lower impacts than when importing the fruit from New Zealand.Discrepancies in methodological choices made in these studies,however, have been identified, including lack of accounting forcountry specific variations in production, timing of consumptionand length of storage (Mila i Canals et al., 2007), and the use ofoutdated data sets (e.g., Blanke and Burdick, 2005). Problems ofmethodological inconsistencies are further highlighted when re-sults from Jones (2002) and Saunders et al. (2008) are examined.Indeed, Jones (2002) suggests that apples produced, stored, andconsumed in the U.K. have a more favourable environmental profilethan those shipped from New Zealand, while Saunders and Barber(2008) come to the opposite conclusion. These studies emphasizethe need to employ comprehensive and consistent system bound-aries when comparisons are being made (Edwards-Jones et al.,2008), as well as the usefulness in following ISO-standardizedLCA guidelines.
Such methodological shortcomings are addressed by Mila iCanals et al. (2007) in their comparison of primary energy con-sumption of domestic and imported apples, where the analysisaccounted for country specific energy inputs of apple provision andassociated variability, as well as storage and seasonality, andtransport mode and distance. Their findings indicate that impactsare highly dependent on these input variables. For example, therelative impacts of shipping apples between European countries bytransport truck is similar to the impact intensity of those sent toEurope by ship from countries in the Southern hemisphere (espe-cially during the northern spring and summer), highlighting effi-ciencies in transport by freight ship. Similarly in Nova Scotia,differences in transport methods have been identified as importantto environmental impacts (Table 10). Consequently, recommenda-tions that emerge fromMila i Canals et al. (2007) suggest that on anenergetic basis it may be environmentally preferable to eat acombination of domestic and imported apples, rather than advo-cating for procurement of locally produced apples as prior studieshave (e.g., Sim et al., 2007; Blanke and Burdick, 2005). While it isbeyond the scope of this research to determinewhether consuminglocally produced apples in Nova Scotia is more environmentallybenign than imports, results produced are of value in further un-derstanding the environmental impacts of fruit production in theprovince. More importantly, though, review of previous studieshighlights the need to consider all supply chain inputs, and to beaware of methodological assumptions before drawing conclusionson the relative environmental benefits of local or imported appleconsumption.
Several hotspots of environmental burdens arose in the cradle-to-farm-gate analyses that suggest opportunities for managementactions to improve environmental outcomes. Up to the farm gate,combustion of diesel fuel was found to be amajor driver of life cycleimpacts on both conventional and organic orchards. Reducingdiesel inputs would therefore lead to decreased burdens across allimpact categories. To do so, a targeted substitution of some forms ofhuman labor formachinery inputs may lead to impact reductions ashas been suggested in previous research (Mila i Canals et al., 2006).However, the scale, specific function substitution, and trade-offswould require further detailed study (Rugani et al., 2012), whichis beyond the scope of this research. In lieu of this, a well-plannedorganization of picking activities that optimizes use of tractors andhuman labor is recommended (Mouron et al., 2006b). Meanwhile,fuel efficiency could be improved by using tractors with smaller,fuel-efficient engines; ensuring that machinery is well maintained(Mouron et al., 2006b); changing oil and filters according to man-ufacturer's suggestions; and avoiding long periods of idling (Desir,2006).
In order to reduce impacts caused by synthetic chemical appli-cation on orchards, producers could further employ integrated pest
ental impacts of conventional and organic apple production in Novaion (2015), http://dx.doi.org/10.1016/j.jclepro.2015.05.037

S. Keyes et al. / Journal of Cleaner Production xxx (2015) 1e1210
management (IPM) practices that integrate behavioral, biologicaland chemical tactics to control pests rather than relying predomi-nantly on chemical-based targeted spraying regimes (MacHardy,2000).2 Education on IPM tactics, sharing of spray reduction tech-niques between orchardists, and the use of low-impact and lesstoxic pesticides is essential in these efforts (Craig, 2010). Producerscould also plant disease resistant cultivars and employ new tech-nologies such as drift reducing measures to help reduce chemicaluse on orchards (Mouron et al., 2012).
These measures could also be taken up by organic producers toreduce copper and sulphur use, which contributed substantially tolife cycle impacts of organic production. All apple producers couldbenefit from promoting an ecological balance and facilitatingoverall tree health (e.g., by use of foliar nutrients; organized or-chard architecture) to help reduce susceptibility to disease (Phillips,2005). Taking a non-allopathic approach to pest and disease man-agement can be beneficial for both conventional and organic pro-duction systems (Keyes, 2013). Reducing the amount of pesticidetreatments may not only decrease environmental burdens, it canalso lead to less toxicological exposure to both humans and naturalsystems, which is of increasing concern to consumers in terms ofpersonal and ecological health, as well as food safety and quality(Bourn and Prescott, 2002). Furthermore, economic incentives existfor reducing such inputs, in terms of monetary costs for their pur-chase and labor for their application.
The provision of nitrogen and phosphorus based fertilizers (i.e.synthetic and manure) and their related emissions to air and waterwere the cause of the majority of eutrophication and acidifyingimpacts on both conventional and organic orchards, and also led tonoteworthy contributions to global warming potential. On top ofreducing the overall volume of fertilizers used on orchards, addi-tional options for decreasing impacts associated with fertilizersinclude planting nitrogen fixing cover crops (Pelletier et al., 2008);expansion of cultivars with high nutrient uptake capacities, as wellas varieties with low nitrogen requirements (e.g. Cortland, McIn-tosh, Gravenstein, and Golden Delicious); ensuring a balanced andproperly executed nutrient management regime (e.g., lower vol-umes applied at well-planned and seasonally sensitive times) (Milai Canals et al., 2006); and choosing fertilizers andmanures with lessnitrogen content and those less prone to subsequent field-levelemissions (Brentrup et al., 2001). Fertilizer improvement, howev-er, must be undertaken in parallel with the maintenance of fruitquality and optimal yields, as these are all essential factors in suc-cessful apple production.
The importance of how energy is generated in Nova Scotia isrevealed in the cradle-to-Halifax retail analyses for both conven-tional and organic production, as results show that the contributionof electricity for controlled atmosphere and cold room storage issubstantial. Despite the fact that packing and storage facilities inthe province operate in a highly efficient manner, the electricityneeded for their operations reflects a poor environmental profile,highlighting the challenge of extending local seasons throughstorage when electricity generation is produced primarily usingcoal. The government of Nova Scotia is well aware of the problemsinherent in coal-based electricity production and has designedpolicy changes to ameliorate the issue, which can be seen in theirrenewable energy targets for 2020 and beyond (see Nova ScotiaDepartment of Energy, 2009, 2010, 2012). Unfortunately, sce-narios E1 and E2 show that even with the actualization of thesetargets, electricity generation will continue to be a hotspot in the
2 While IPM tactics are used in Nova Scotia, the degree to which they areemployed ranges significantly between producers, similar to other apple growingregions (Mouron et al., 2012).
Please cite this article in press as: Keyes, S., et al., Evaluating the environmScotia, Canada, through life cycle assessment, Journal of Cleaner Product
life cycle of apple production, albeit on a reduced scale. In light ofthese findings, it is crucial that provincial energy targets currentlyin place are achieved and further advancements are made forenvironmental improvements to be realized. This can be assisted bypolicies and investments in renewable energy, energy efficiencyand conservation, the implementation of which could both helpreduce environmental burdens and lead to economic benefits interms of cost-effective tactics for storage facility operators.
Although results allowed for the development of importantimprovement recommendations, limitations did occur during thisresearch project. Temporally constraints were experienced: despitethe fact that whole tree life cycles and full crop rotations arepreferable in agricultural LCAs (Cowell, 1998 in Mila i Canals, 2003),production and storage data was collected solely for the 2010season given both time and financial restrictions. As well, somespatial factors (i.e. orchard management practices and farm loca-tions) were not specifically accounted for, since analysis was con-ducted using aggregated data instead of comparison on a case-by-case basis. Nemecek and Gaillard (2010) argue, however, that largesamples can serve to obtain representative and reliable LCA data toaccount for variability amongst farms, a condition met in thisresearch. Finally, this LCA did not conduct a full cradle-to-graveanalysis. Decisions to exclude processing, consumer (e.g., trans-port and storage at the household level) and disposal methodsweresupported by boundaries of agricultural LCAs in the past (e.g., Mila iCanals et al., 2007a; Sim et al., 2007), and were not required giventhe project's research aims.
5. Conclusion
The vulnerabilities of global food systems and their deleteriouseffects on the Earth have been identified for decades, amplifyingthe impetus for research on ways to improve methods of produc-tion, distribution, and consumption (Ehrlich and Ehrlich, 2013).Indeed, ensuring that food systems are both resource and energyefficient is crucial in reducing the environmental impacts theyproduce. LCA is well positioned to aid in this process, providing arobust evaluation of environmental performance so that soundpolicy and praxis decisions can be made. Further, as life cyclethinking has been declared a prerequisite for any rigorous sus-tainability assessment (Kl€opffer, 2003), the application of LCA toapple production systems in Nova Scotia is important given thevalue of the industry in the province by helping ensure the appleindustry is in line with objectives expressed in the province'sEnvironmental Goals and Sustainable Prosperity Act and greenhousegas emission reduction targets. More broadly, results of agriculturalLCAs can aid in reducing the ecological impacts of food supplychains by identifying hotspots in production and developingimprovement recommendations, which could ultimately assist inestablishing more productive and resilient food systems.
This LCA investigated the environmental performance of con-ventional and organic apple production systems in Nova Scotia inorder to understand how life cycle sub-systems contribute torelevant environmental impact categories. Findings indicate thatfuel use, N and P-fertilizers, and inputs for pest and disease man-agement on both conventional and organic orchards were thedrivers of burdens to impact categories under investigation. Whensystem boundaries were extended to retail locations, attention isdrawn to the electricity used for storage and the role of trans-portation, highlighting problems of coal-based electricity genera-tion in Nova Scotia, as well as the efficiency of freight ship and railwhen compared to trucking over long distances. Taking thesehotspots into consideration, improvement recommendations weredeveloped with the goal of reducing the life cycle environmentalimpacts of apple supply chains.
ental impacts of conventional and organic apple production in Novaion (2015), http://dx.doi.org/10.1016/j.jclepro.2015.05.037

S. Keyes et al. / Journal of Cleaner Production xxx (2015) 1e12 11
In line with conclusions drawn by Mila i Canals et al. (2006), weargue that while the scientific evidence provided by LCA studies isessential, of perhaps equal importance is the implementation ofimprovement recommendations, for mitigating the impacts ofglobal food systems means that real world changes must be made.As such, effective dissemination of LCA results is paramount, pro-ducing and communicating improvement possibilities in ways thatare relevant to producers, industry, and government they affect. Todo so, presenting results in such ways that relate to socio-economicand political needs is crucial, contextualizing improvements so thatbenefits can be understood beyond the ecological realm (Mila iCanals et al., 2006).3 This can be carried out, for example, bycombining decision-support models with LCA (e.g., Zimmermannet al., 2011). Although beyond the scope of this article, this is anavenue for future research endeavors.
Acknowledgments
Funding that permitted this research was granted by the SocialScience and Humanities Research Council (SSHRC) and the Schoolfor Resource and Environmental Studies (Alumni ExcellenceScholarship). The authors would like to thank the research partic-ipants from the Nova Scotia apple industry who provided their timeand information to make this project possible. Gratitude also goesto Charles Embree, Dr. Goretty Dias, and Nathan Ayer for theirguidance and support throughout parts of this research.
References
Agriculture and Agri-Food Canada, 2012. A Snapshot of the Canadian Apple In-dustry, 2010. Available from: http://www4.agr.gc.ca/AAFC-AAC/display-afficher.do?id¼1334147419910&lang¼eng (accessed January 2012.
Audsley, E., 2003. Harmonisation of Environmental Life Cycle Assessment forAgriculture. Final Report, Concerted Action AIR3-CT94-2028. CE DG VI-Centrede documentation.
Blanke, M., Burdick, B., 2005. Food (miles) for thought: energy balance for locally-grown versus imported apple fruit. Environ. Sci. Pollut. Res. 12 (3), 125e127.
Bourn, D., Prescott, J., 2002. A comparison of the nutritional value, sensory qualitiesand food safety of organically and conventionally produced foods. Crit. Rev.Food Sci. Nutr. 42 (1), 1e34.
Brentrup, F., Küsters, J., Lammel, J., Kuhlmann, H., 2000. Methods to estimate on-field nitrogen emissions from crop production as an input to LCA studies in theagricultural sector. Int. J. Life Cycle Assess. 5, 349e357.
Brentrup, F., Küsters, J., Kuhlmann, H., Lammel, J., 2001. Application of the life cycleassessment methodology to agricultural production: an example of sugar beetproduction with different forms of nitrogen fertilizers. Eur. J. Agron. 14 (3),221e233.
Butler, S.J., Vickery, J.A., Norris, K., 2007. Farmland biodiversity and the footprint ofagriculture. Science 315 (5810), 381e384. http://dx.doi.org/10.1126/science.1136607.
Canadian Horticultural Council, 2009. Crop Protection e a Better Future for Canada.Available from: http://www.hortcouncil.ca/uploads/file/English/Crop%20Plant%20Protection%20and%20Environment/Integrated_Pest_Management_Strategies_Eng.pdf (accessed September 2012).
Carlsson-Kanyama, A., Ekstr€om, M.P., Shanahan, H., 2003. Food and Life Cycle En-ergy inputs: consequences of diet and ways to increase efficiency. Ecol. Econ. 44(2e3), 293e307.
Cederberg, C., Mattson, B., 2000. Life cycle assessment of milk production e acomparison of conventional and organic farming. J. Clean. Prod. 8, 49e60.
Cerutti, A., Bruun, S., Donno, D., Beccaro, G., Bounous, G., 2013. Environmentalsustainability of traditional foods: the case of ancient apple cultivars inNorthern Italy assessed by multifunctional LCA. J. Clean. Prod. 52, 245e252.http://dx.doi.org/10.1016/j.jclepro.2013.03.029.
Coley, D., Howard, M., Winter, M., 2009. Local food, food miles and carbon emis-sions: a comparison of farm shop and mass distribution approaches. FoodPolicy 34 (2), 150e155. http://dx.doi.org/10.1016/j.foodpol.2008.11.001.
Craig, B., 2010. Best Management Practices for Nova Scotia Apple Production.AgraPoint International Inc. Available from: http://perennia.ca/Fact%20Sheets/Horticulture/Fruit/Orchard%20Fruit/REV_Best%20Management%20Practices%
3 Several communication attempts occurred (via email and phone) with resultspresented in lay and in socio-economic context, but with only 2 responses fromNova Scotian producers, we are under the impression that 2010 conditions continueto apply as no major changes in circumstances are evident to date.
Please cite this article in press as: Keyes, S., et al., Evaluating the environmScotia, Canada, through life cycle assessment, Journal of Cleaner Product
20for%20Nova%20Scotia%20Apple%20Production.pdf (accessed September2012).
Dalgaard, R., Halberg, N., Kristensen, I.S., Larsen, I., 2006. Modeling representativeand coherent Danish farm types based on farm accountancy data for use inenvironmental assessments. Agric. Ecosyst. Environ. 117, 223e237.
De Backer, E., Aertsens, J., Vergucht, S., Steurbaut, W., 2009. Assessing theecological soundness of organic and conventional agriculture by means of lifecycle assessment. Br. Food J. 111 (10) http://dx.doi.org/10.1108/00070700910992916.
Desir, F., 2006. Energy Opportunities: Tips to Reduce Fuel Consumption, Fact Sheet.Ontario Ministry of Agriculture, Food, and Rural Affairs, pp. 06e091. Availablefrom: http://www.omafra.gov.on.ca/english/engineer/facts/06-091.pdf(accessed September 2012).
Duram, L., Oberholtzer, L., 2010. A geographic approach to place and naturalresource use in local food systems. Renew. Agric. Food Syst. 25 (2), 99e108.http://dx.doi.org/10.1017/S1742170510000104.
Edwards-Jones, G., Mil�a i Canals, L., Hounsome, N., Truninger, M., Koerber, G.,Hounsome, B., Cross, P., et al., 2008. Testing the assertion that “local food isbest”: the challenges of an evidence-based approach. Trends Food Sci. Technol.19 (5), 265e274. http://dx.doi.org/10.1016/j.tifs.2008.01.008.
Ehrlich, P.R., Ehrlich, A.H., 2013. Can a collapse of global civilization be avoided?Proc. R. Soc. B 280. http://dx.doi.org/10.1098/rspb.2012.2845, 20122845.
Eichner, M., 1990. Nitrous oxide emissions from fertilized soils: summary of avail-able data. J. Environ. Qual. 19, 272e280.
Foster, C., Green, K., Belda, M., Dewick, P., Evans, B., Flynn, A., Mylan, J., 2006.Environmental Impacts of Food Production and Consumption: a Report to theDepartment for Environment, Food and Rural Affairs. Manchester BusinessSchool. Defra, London.
Goedkoop, M., Oele, M., de Schryver, A., Vieira, M., Hegger, S., (PR�e Consultants),2010. SimaPro Database Manual e Methods Library, 2.4. PR�e Consultants, TheNetherlands.
Haas, G., Wetterich, F., Kopke, U., 2001. Comparing intensive, extensified andorganic grassland farming in southern Germany by process of life cycleassessment. Agric. Ecosyst. Environ. 83, 43e53.
Intergovernmental Panel on Climate Change, 2006. 2006 IPCC Guidelines for Na-tional Greenhouse Gas Inventories. In: Agriculture, Forestry and Other LandUse, Chapter 11: N2O Emissions Fro Managed Soils, and CO2 Emissions fromLime and Urea Application, vol. 4. Available from: http://www.ipcc-nggip.iges.or.jp/public/2006gl/index.html (accessed January 2011).
ISO, 2006a. ISO 14040 Environmental Management e Life Cycle Assessment ePrinciples and Framework (Geneva, Switzerland).
ISO, 2006b. ISO 14044 Environmental Management e Life Cycle Assessment e
Requirements and Guidelines (Geneva, Switzerland).Jones, A., 2002. An environmental assessment of food supply chains: a case study on
dessert apples. Environ. Manag. 30 (4), 560e567.Keyes, S., 2013. Evaluating the Environmental Impacts of Apple Production in Nova
Scotia, Canada, through Life Cycle Assessment. Thesis (M.E.S.). DalhousieUniversity.
Kl€opffer, W., 2003. Life-cycle based methods for sustainable product development.Int. J. LCA 8 (3), 157e159.
LaTrobe, H.L., Acott, T.G., 2000. Localising the global food system. Int. J. Sustain. Dev.World Ecol. 7 (4), 309e320.
MacHardy, W.E., 2000. Current status of IPM in apple orchards. Crop Prot. 19 (8e10),801e806. http://dx.doi.org/10.1016/S0261-2194(00)00107-1.
Matson, P.A., Parton, W.J., Power, A.G., Swift, M.J., 1997. Agricultural intensificationand ecosystem properties. Science 277, 504e509.
Mila i Canals, L.M., 2003. Contributions to LCA Methodology for Agricultural Sys-tems: Site-Dependency and Soil Degradation Impact Assessment (Ph.D. thesis).Universitat Aut�onoma de Barcelona. Available from: http://www.tdx.cesca.es/TDX-1222103-154811.
Mila i Canals, L., Burnip, G., Cowell, S., 2006. Evaluation of the environmental im-pacts of apple production using life cycle assessment (LCA): case study in NewZealand. Agric. Ecosyst. Environ. 114 (2e4), 226e238.
Mila i Canals, L., Cowell, S.J., Sim, S., Basson, L., 2007. Comparing domestic versusimported apples: a focus on energy use. Environ. Sci. Pollut. Res. 14 (5),338e344.
Mouron, P., Scholz, R.W., Nemecek, T., Weber, O., 2006a. Life cycle management onSwiss fruit farms: relating environmental and income indicators for apple-growing. Ecol. Econ. 58 (3), 561e578.
Mouron, P., Nemecek, T., Scholz, R.W., Weber, O., 2006b. Management influence onenvironmental impacts in an apple production system on Swiss fruit farms:combining life cycle assessment with statistical risk assessment. Agric. Ecosyst.Environ. 114, 311e322.
Mouron, P., Heijne, B., Naef, A., Strassemeyer, J., Hayer, F., Avilla, J., Alaphilippe, A.,et al., 2012. Sustainability assessment of crop protection systems: SustainOSmethodology and its application for apple orchards. Agric. Syst. 113, 1e15.http://dx.doi.org/10.1016/j.agsy.2012.07.004.
Mundler, P., Rumpus, L., 2012. The energy efficiency of local food systems: a com-parison between different modes of distribution. Food Policy 37, 609e615.
Nemecek, T., Gaillard, G., 2010. Challenges in assessing the environmental impactsof crop production in horticulture. In: Sonesson, U., Berlin, J., Ziegler, F. (Eds.),Environmental Assessment and Management in the Food Industry: Life CycleAssessment and Related Approaches. Woodhead publishing limited, Cambridge,UK.
ental impacts of conventional and organic apple production in Novaion (2015), http://dx.doi.org/10.1016/j.jclepro.2015.05.037

S. Keyes et al. / Journal of Cleaner Production xxx (2015) 1e1212
Nemecek, T., Dubois, D., Huguenin-Elie, O., Gaillard, G., 2011. Life cycle assessmentof Swiss farming systems: I. Integrated and organic farming. Agric. Syst. 104 (3),217e232. http://dx.doi.org/10.1016/j.agsy.2010.10.002.
Nova Scotia Power, Inc, 2012. How We Make Electricity. Retrieved from. https://www.nspower.ca/en/home/about-us/how-we-make-electricity/default.aspx(accessed September 2012).
Nova Scotia Department of Energy, 2009. Toward a Greener Future: Nova Scotia's2009 Energy Strategy, pp. 1e40. Available from: www.gov.ns.ca/energy/energystrategy (accessed September 2012).
Nova Scotia Department of Energy, 2010. Renewable Electricity Plan: a Path to GoodJobs, Stable Prices, and a Cleaner Environment, pp. 1e32. Available from: www.gov.ns.ca/energy (accessed September 2012).
Nova Scotia Department of Energy, 2012. Statement of Mandate 2012e2013,pp. 1e22. Available from: http://www.gov.ns.ca/energy/resources/spps/statement-of-mandate/Energy-Statement-of-Mandate-2012.pdf (accessedSeptember 2012).
Pelletier, N., 2006. Life Cycle Measures of Biophysical Sustainability in Feed Pro-duction for Conventional and Organic Salmon Aquaculture in the NortheastPacific. Thesis (M.E.S.). Dalhousie University.
Pelletier, N., Arsenault, N., Tyedmers, P., 2008. Scenario modeling potential eco-efficiency gains from a transition to organic agriculture: life cycle perspectiveson Canadian canola, corn, soy and wheat production. J. Environ. Manag. 42,989e1001. http://dx.doi.org/10.1007/s00267-008-9155-x.
Phillips, M., 2005. The Apple Grower: a Guide for the Organic Orchardists. ChelseaGreen Publishing Company, Vermont.
Pimentel, D., Hepperly, P., Hanson, J., Douds, D., Seidel, R., 2005. Environmental,energetic, and economic comparisons of organic and conventional farmingsystems. Bioscience 55 (7), 573e582.
Point, E., Tyedmers, P., Naugler, C., 2012. Life cycle environmental impacts of wineproduction and consumption in Nova Scotia, Canada. J. Clean. Prod. 27, 11e20.http://dx.doi.org/10.1016/j.jclepro.2011.12.035.
Reganold, J.P., Glover, J.D., Andrews, P.K., Hinman, H.R., 2001. Sustainability of threeapple production systems. Nature 410 (6831), 926e930. http://dx.doi.org/10.1038/35073574.
Roy, P., Nei, D., Orikasa, T., Xu, Q., Okadome, H., Nobutaka, N., Shiina, T., 2009.A review of life cycle assessment (LCA) on some food products. J. Food Eng. 90,1e10. http://dx.doi.org/10.1016/j.bbr.2011.03.031.
Please cite this article in press as: Keyes, S., et al., Evaluating the environmScotia, Canada, through life cycle assessment, Journal of Cleaner Product
Rugani, B., Panasiuk, D., Benetto, E., 2012. An inputeoutput based framework toevaluate human labour in life cycle assessment. Int. J. Life Cycle Assess. 17 (6),795e812. http://doi.org/10.1007/s11367-012-0403-1.
Saunders, C., Barber, A., 2008. Carbon footprints, life cycle analysis, food miles:global trade trends and market issues. Polit. Sci. 60 (1), 73e88. http://dx.doi.org/10.1177/003231870806000107.
Schlich, E., Fleissner, U., 2005. The ecology of scale: assessment of regional energyturnover and comparison with global food. Int. J. Life Cycle Assess. 10 (3),219e223.
Sim, S., Barry, M., Clift, R., Cowell, S.J., 2007. The relative importance of transport indetermining an appropriate sustainability strategy for food Sourcing. Int. J. LifeCycle Assess. 12 (6), 422e431.
Smith, A., Watkiss, P., Tweddle, G., McKinnon, A., Browne, M., Hunt, A., et al., 2005.The Validity of Food Miles as an Indicator of Sustainable Development. Defra,Oxon, UK. ED50254, -103. Available from: http://archive.defra.gov.uk/evidence/economics/foodfarm/reports/documents/foodmile.pdf (accessed September2012).
Stadig, M., 1997. Life Cycle Assessment of Apple Production e Case Studies forSweden, New Zealand and France. SIK, Gothenburg, Sweden. SIK report 6301997.
Statistics Canada, 2012. Table 1: Estimate of Area, Commercial Production and FarmGate Value of Fruits in Canada, by Province, 2010. Available from: http://www.statcan.gc.ca/pub/22-003-x/2011002/t029-eng.htm (accessed January 2013).
van der Werf, H.M.G., Petit, J., 2002. Evaluation of the environmental impact ofagriculture at the farm level: a comparison and analysis of 12 indicator-basedmethods. Agric. Ecosyst. Environ. 93, 131e145.
Venkat, K., 2012. Comparison of twelve organic and conventional farming systems:a life cycle greenhouse gas emissions perspective. J. Sustain. Agric. 36 (6),620e649. http://dx.doi.org/10.1080/10440046.2012.672378.
Weber, C., Matthews, S., 2008. Food-Miles and the relative climate impacts of foodchoices in the United States. Environ. Sci. Technol. 42, 3508e3513.
Zimmermann, A., Baumgartner, D., Nemecek, T., Gaillard, G., 2011. Are public pay-ments for organic farming cost-effective? Combining a decision-support modelwith LCA. Int. J. Life Cycle Assess. 16 (6), 548e560. http://dx.doi.org/10.1007/s11367-011-0286-6.
ental impacts of conventional and organic apple production in Novaion (2015), http://dx.doi.org/10.1016/j.jclepro.2015.05.037