eu enlargement and the evolution of european production networks
TRANSCRIPT

1
EU enlargement and the evolution of European production networks
Louise Curran, Toulouse Business School
&
Soledad Zignago, Banque de France
Abstract
We analyse the regionalisation of the European Union's production networks and the impact of
enlargement by looking at trends in trade in intermediate and final products at different technology
levels between 1995 and 2007. We find that enlargement has coincided with quite major changes in the
structure of trade within and beyond the EU. Overall we find that the EU12 has become a more
important trading partner both for the sub-region itself and for the EU15.
We look at trends in different types of products and technologies. We find that there has been greater
regional consolidation of production networks in lower tech goods, while in high tech goods global
sources of inputs - especially ASEAN+3 - are becoming more important. Overall the EU12 is becoming
a more important source of both intermediate and final products, especially within its own sub-region.
This evolution makes the companies in the sub-region very dependent on the EU home market.
Keywords: EU trade; EU enlargement; High Tech trade; EU supply chains
1. Introduction
The enlargement of the European Union (EU) from 15 to 27 members between 2004 and 2007
was one of the defining developments in its recent history. The Union had never before
experienced such a major change in its structure and economic geography in such a short
period of time. The economies involved in earlier enlargements had neither the heterogeneity
between new members nor the divergence from the EU economic mean which this new
enlargement involved (Huber, 2008; Dupuch, Jennequin and Mouhoud, 2004). Prior to
enlargement there was much concern about the impact of the integration of economies with
such different cost structures on industry in the existing EU and in particular industrial
employment in the EU15 (Jacoby, 2010). This concern motivated several studies on the likely
economic impacts of enlargement which mainly concluded that the impacts would be far
greater on the EU12 than on the EU15 (Buch and Piazolo, 2000; Dupuch et al, 2004; Bchir,
Fontagné and Zanghieri, 2003).
These studies have explored several likely impacts from the EU’s eastern enlargement
including on wage rates and welfare (Bchir, Fontagné and Zanghieri, 2003), foreign direct
investment (FDI) (Dupuch, Jennequin and Mouhoud, 2004; Buch and Piazolo, 2000), portfolio
investment (Buch and Piazolo, 2000) and trade (Bchir, Fontagné and Zanghieri, 2003; Buch
and Piazolo, 2000; Dupuch, Jennequin and Mouhoud, 2004). We focus on the later issue – the
trade impacts of enlargement. We seek to explore actual impacts through a new database of
world trade – BACI – developed in CEPII1 and covering all trade flows between 1995 and
2007. The objective is to highlight key changes in the EU trade structure since the process of
1 Centre d'Etudes Prospectives et d'Informations Internationales in Paris. See www.cepii.fr

2
enlargement began in earnest and the extent to which this reveals wider changes in the manner
in which production is spread across the enlarged Union. To do this we differentiate between
products at different stages of production – specifically final products and intermediate or
primary products – and products at different technology levels.
Little empirical work has looked at actual developments in trade at different levels of the supply
chain in the enlarged EU. Kaminsky and Ng (2001) explored trade in parts and components
using the UN SITC categorisation and covering the period 1993-97 well before formal
enlargement. Even over that period they identified large increases in trade in these products.
The process of fragmentation of production was particularly developed in furniture, automobile
products and information technology. Their work identified significant differences within the
CEEC 10.
Curran and Zignago (2010) explored trade in intermediate products by technology and market
level within the EU27. They found that the EU12 countries were becoming particularly
important sources of intermediate products for the EU in medium and high tech products and
intermediate goods at medium and high market levels. Overall, the EU has collectively ceded
certain types of intermediates production – particularly high-tech and downmarket – to extra-
EU sources, while consolidating production structures for its traditional strengths – medium-
tech and upmarket goods – within the Union. However, that work only focused on intermediate
goods trade, explored trade mainly at country level and did not make the link to final products
trade. This is the added value which we aim to bring to the debate.
Beyond the issue of EU enlargement as such, the evolution of trade within the EU is also
relevant to wider debates within the International Business (IB) literature. The EU is the most
economically integrated of the key Triad zones, which tend to be the focus of much of the work
within IB. This high level of integration is one of the motivations for the hypothesis defended
by Rugman and his co-authors (Rugman and Verbeke, 2004; Rugman and Collinson, 2005)
that international business is not so much international, but regionally oriented. This debate on
the level of regionality in international business has motivated a series of articles (Aggarwal et
al, 2011; Osegowitsch and Sammartino, 2008; Dunning, Fujita and Yakova, 2007; Kali and
Reyes, 2007) which explore the question from a variety of standpoints, mostly focusing on the
operations of key multinational companies. The only one of the above articles that looks at
trade data is Kali and Reyes (2007). Their paper analyses international trade from a network
perspective and provides clear indications that trade activity tends to cluster around regions
(Kali and Reyes, 2007). However, the main focus of the research was not on the regionalization
of trade and the results are not reported by region.
In addition there is evidence that different types of MNEs may internationalise to differing
degrees. in particular, recent analysis of 760 MNEs found that higher technological intensity
tends to increase the international orientation of companies (Banalieva and Dhanaraj, 2010).
This seems to imply that there may be a relation between technology level and the level of
regionalization. Further support for this hypothesis comes from Cerrato (2009) who, in his
research on Italian companies, found a significantly stronger international orientation amongst
the higher technology companies studied. These findings indicate that higher technology
sectors may be different to low tech sectors in their internationalization process and that trade
structure is thus likely to differ between technologies.
Overall, therefore, although trends in trade are clearly regional, little analysis of this kind of
macro data has been highlighted in the debate. Thus a further motivation for this research was
the better understand how the regionalization of company activity within the EU manifests
itself in trade flows and the extent to which that regionalisation differed by technology.
According to Rugman and Collinson (2005), in 2001 63% of the sales of the tope EU

3
multinationals were in Europe. We wanted to explore whether similar levels of home region
bias were evident in trade flows and explore differences between different types of flows.
Amongst our key findings we would highlight the following:
Firstly, over the period covered the EU12 has increased its trade integration with both the EU15
and within the home sub-region, leading to a post-enlargement trade structure for the EU12
which is very heavily focused on the EU27. However the EU27 as a whole has not increased its
level of integration further to enlargement and some of the key dynamics in trade over the
period are in relation to non-EU actors, in particular East Asia.
Secondly, in terms of production networks within Europe, as evidenced by trade in intermediate
products, there has been some increased EU integration, but the trend is not uniform. In
particular, although there is a visible shift in intermediates trade within the EU from the EU15
to the EU12, there has also been a shift towards non-EU sources, especially in HT
intermediates. This increased trends towards sourcing intermediates in the EU12 is also
reflected in the increased sourcing of final goods from that sub-region, especially in the
important MT consumer goods sector.
Finally, the trends in trade differ by technology. Most strikingly trade in higher technology
goods tend to be more globally oriented, both for intermediate products and final goods.
Production networks in the EU HT sector appear to be more global than those in other
technologies, while the important MT sector remains very regionally integrated.
The rest of this paper is structured as follows. Firstly we will summarise previous work on the
issue of the economic impacts of enlargement, then we will develop the key research questions
which we sought to address. The data and methodological approach used will then be
explained. The results will be presented in terms of each of the four research questions and we
will conclude with some key implications of the research.
2. EU Enlargement – anticipated impacts
The eastern enlargement of the EU stimulated several studies on its likely economic impacts.
One of the most comprehensive was from Buch and Piazolo (2001) at the Kiel Institute. They
looked not only at trade, but also at capital flows of all kinds, including FDI. On this latter issue
they found that certain countries – specifically the Czech Republic, Hungary and Poland had
already attracted significantly more FDI than would be expected for a non-EU member. The
paper used a gravity model to explore the potential for further trade expansion after
enlargement and found that at that stage (1998 figures) only Hungary had reached the expected
level of trade with the sample of EU countries which were explored, with the majority of
candidate countries well below their potential. The authors concluded that there was potential
for further increases in trade and capital flows in the run-up and following enlargement.
Bussière, Fidrmuc and Schnatz (2005) at the European Central Bank also used a gravity model
to explore existing and potential trade between the Central and Eastern European Countries
(CEECs) and the rest of the world. They found that in 2003, even before formal enlargement,
the region was already well integrated in trade terms with the Union, although trade links with
the rest of the world were less well developed. This is to be expected considering the long
isolation of the region during the period of Soviet domination (Kancs, 2007).
Bchir et al (2003) in CEPII use a Computable General Equilibrium (CGE) approach to explore
the likely impact of enlargement on a range of economic factors, including welfare, wages and
trade. Impacts vary by country, but overall the trade impacts were forecast to be mildly negative
(in 2005) for total exports (except in Poland and the Baltic states) and positive for total imports

4
(except in the Baltic States) although the scale and even direction of the changes varies over
time (up to 2015).
Dupuch et al (2004) take a more descriptive approach. They explore the potential of
enlargement within a New Economic Geography (NEG) framework. They look at FDI stocks in
the CEECs (in 2002) and find them to be highly concentrated both in destination and source,
but still, overall, at relatively low levels. They note that FDI in medium-high tech industries
with high growth potential was particularly important. The paper also explores the trade
specialisation of the candidate countries. They find major differences both between the core and
the periphery of the enlarged union and within the enlargement countries themselves. Candidate
countries were found to be mainly specialised in resource-intensive industries like metals and
wood and labour intensive goods like clothing and textiles.
However there were differences between countries, with central CEEC countries having trade
profiles more similar to existing members, especially Spain and Portugal and peripheral CEEC
countries less similar to the core EU members and more similar to Greece. The paper concludes
that the enlargement process could re-enforce the core-periphery model within the EU, with
certain central European countries integrating to the EU core. Kancs (2007) also uses a
framework based on NEG. He concludes that enlargement would reduce the specialisation of
the CEECs, which have a regional specialisation pattern which was highly distorted under the
previous regime. A more theoretical paper from Crozet and Koenig (2004) indicates that EU
integration through enlargement will favour agglomeration in border regions.
It is notable that all of the papers discussed above focus only on Eastward enlargement. Malta
and Cyprus are not included in the analyses. The 10 countries covered are usually the 10 CEEC
countries now members of the EU, not the original EU10 in the first enlargement. Although this
may be justified by the small economic size of the two southern new members, it is at least
surprising that they are ignored in most analyses.
Many of these analyses look both at trade and Foreign Direct Investment (FDI). The link
between the trade and FDI impacts of a liberalisation process like enlargement is complex. FDI
can vary in its key strategic objective with the key modes often differentiated between market
seeking; efficiency seeking and resource seeking (Dunning, 1988). Clearly FDI within the new
member states could be focused on any one of these objectives and the links with trade (trade
creating or trade reducing) will vary depending on the objective. What is clear is that FDI has
increased over the years since the CEECs opened up to outside investment. Indeed this
liberalisation process has been linked empirically to increased FDI from Italian firms (Majocchi
and Strange, 2007). These flows have tended to be from within the EU15, leading to an
increased regionalisation of EU FDI, with EU15 FDI often linked to production fragmentation
within the enlarged Union (Kaminsky and Ng, 2001). A further recent development is the
increase in outward FDI from the EU12 countries, most of which seems to be directed within
the sub-region itself (Rugaff, 2010). Dunning, Fujita and Yakova, (2007) have highlighted this
tendency for increased regionalization of FDI amongst certain EU countries. They concluded:
‘The opportunities offered by the completion of the European internal market, and the opening
up of Central and Eastern Europe to inbound FDI, was almost certainly one of the main reasons
for the continued regionalisation of European MNEs in the 1990s.’ (Dunning et al, 2007,
p.183)
Certainly trade is frequently related to FDI, as companies invest in regions with particular
advantages in certain stages of the supply chain in terms of resources or costs, in order to reap
the benefits for the enterprise as a whole. Recent research by Anwar and Nguyen (2011)
confirmed the link between FDI and trade for Vietnam and includes an extensive literature
review of existing research on the issue, which broadly tends to support the link. Within the

5
CEECs, analysis of the impact of trade liberalisation and increased FDI, indicated that it has led
to a relocation of productive activity towards border regions, which have clear geographic
advantages for trade (Damijan and Kostevc, 2011). However how much of the CEEC’s trade is
linked to FDI and inter-firm flows is unknown. Figures for the US and Japan indicate that a
third of exports are intra-firm trade (OECD, 2002). Although exact figures on intra-firm trade
in the EU are difficult to come by (official figures do not identify trade by company), FDI in
Eastern Europe by Austrian and German companies has been shown to be related to increased
trade in intermediate goods (Marin, 2008), while Filatotchev, Stephan and Jindra (2008) found
that foreign equity involvement is associated with export intensity in transition economies.
Most recent figures indicate that investment from the ‘old’ member states – the EU15 -to the
new member states – the EU 122 – increased in the run up to enlargement reaching 14% of
EU15 outflows of FDI in 2004 and remaining at that level since then. In 2006, the EU15s FDI
stocks in the EU12 reached over €270bn. Germany was the main investor, followed by Spain
and Austria. Over two thirds of that stock was in three countries – Hungary, the Czech Republic
and Poland (Karkkainen, 2008).
It is likely that increased cross-border financial involvement by companies within the enlarged
EU has fostered trade, both from EU15 companies sending goods to EU12 subsidiaries for final
assembly, followed by re-export or local sale and from EU12 subsidiaries sending intermediate
products to EU15 assembly plants or final goods for local consumption. Although we cannot
link this investment empirically to cross-border flows of goods, it must be kept in mind that a
substantial amount of the increase in trade which we will highlight below is likely to be related
to some extent to FDI.
The period which we analyse is 1995-2007. It is important to note that, well before formal
enlargement, this period coincided with increasing the liberalisation of trade within the EU
region. Firstly the Association Agreements between the EU15 and the EU12 substantially
liberalised exchanges. Then the formal accession of ten countries in 2004 and two in 2007
(Romania and Bulgaria) eliminated any remaining barriers. Under the Association Agreements
the EU12 already had substantially free access to the EU-15 markets since the mid 90s (Buch
and Piazolo, 2000). The exact timing of the implementation of these agreements is provided in
Spies and Marques (2009). Agreements with all of the largest candidate countries were in place
by 1995.
Enlargement not only resulted in free trade between the EU12 and the EU15, it also changed
the EU12’s trade policy in relation to the rest of the world. On accession to the EU the new
member states were required to apply the common external tariff of the EU, including the
preferential access to developing countries and other preferential trade partners which is part of
the ‘acquis communautaire’. In most cases this represented a liberalization of trade policy
(Avery and Cameron, 1998; Buch and Piazolo, 2000)3. This trade opening would in any event
be expected to foster trade as its costs fall (Bchir et al, 2003). What we seek to explore here is
the extent to which it re-enforced the regionalization of EU trade, especially in certain products.
Clearly our data only covers a relatively short period after formal enlargement, however given
that trade within the enlarged EU was substantially liberalised prior to 2004/7 we could expect
that trade impacts would be seen well before accession.
2 Throughout this paper the EU15 includes Austria, Belgium, Denmark, Finland, France, Germany, Greece,
Ireland, Italy, Luxembourg, Netherlands, Portugal, Spain, Sweden and the UK, while the EU12 includes Bulgaria,
Cyprus, Czech Republic, Estonia, Hungary, Latvia, Lithuania, Malta, Poland, Romania, Slovakia, and Slovenia. 3 The Baltic states had a very liberal trading regime before enlargement and so were little impacted by change I
relation to their trade policy with the rest of the world.
6
3. Development of the research questions
Global trade flows represent a variety of exchanges of different types of goods embodying
different levels of skills, technology and capacities and representing different stages of the
production process. One way to better understand the nature of trade exchanges is to
differentiate trade flows between intermediate and final goods. Looking at how cross-border
flows of different types of products are structured gives us an insight into the manner in which
companies are managing their international division of labour. This process can have important
implications for competitiveness. Firms which integrate themselves into the global economy
seem to be more productive than those which don’t, although there is some debate on the
direction and nature of causality. Research has consistently shown that firms which tend to
import their inputs are also the most productive and drive the productivity of their sector (e.g.
Fernandes, 2003, Kasahara and Rodriguez, 2004).
Work in Europe has tended to confirm this. Halpern Koren and Szeidl (2005) analysed data
from Hungarian firms over the period 1992-2001. They found the role of imports in
productivity to be significant. Imports were responsible for 30% of the growth in aggregate
total factor productivity in Hungary during the period studied. About 50% of this effect is due
to the increase in firm level productivity through imports, while the remaining 50% comes from
the reallocation of capital and labour to importers.
In their study of Belgian firms, Coucke and Sleuwaegen (2008) found that companies with
international sourcing activities had a higher probability of survival than those that didn’t
source abroad – the probability of exit was calculated to fall by 10 percentage points if a firm
chose to source abroad. Another recent study of Belgian companies also found higher
productivity in importing companies (17% more productive than non-traders) although the
highest productivity was seen in two-way traders (those that import and export) which were
27% more productive than non-traders (Muûls and Pisu, 2007).
German companies have been particularly active users of international sourcing strategies and
several researchers have examined the manner and extent to which German companies use
international production networks and the effects on their competitiveness as well as the wider
economy. They have highlighted the extensive and increasing level of integration between the
economies of Germany and the new member states and the resulting impacts on wage costs
(Geishecker, 2006) and competitiveness (Marin, 2008). Of course the internationalisation of the
German production system is not new. In 1980 Froebel and his colleagues highlighted the
complex and growing level of integration of the German manufacturing system with the rest of
the world (Froebel et al, 1980). What does appear to be new, however, is the role of other EU
members, which were rather unimportant in the early years of German international integration.
We will see in the analysis outlined below that as the EU has expanded, other EU members
have become more important sources for EU15 industry. This seems likely to be, at least partly
a reflection of the complementary capacities which the new member states bring to the Union.
Other researchers have explored the importance of inputs from within the firm in fostering
competitiveness. Increasing use of imports from foreign subsidiaries by US MNEs was
highlighted in work by Kotabe and Scott-Swan (1994) which indicated that the use of offshore
sourcing (defined as imports from subsidiaries abroad) helped companies to retain market share
in the 1990s. Marin (2008) analysed firm level data from 660 German and Austrian firms who
had invested in Eastern Europe. She found clear evidence of ‘offshoring’, with high levels of
intra-firm imports in total imports for the firms surveyed over the period covered (1997-2000),
7
especially in Austria where 69% of the surveyed companies’ imports from Eastern Europe were
intra-form imports.
There is also an extensive literature exploring global value chains (GVCs) and Global
Production Networks (GPNs) which highlights, amongst other things, the importance of the
socio-institutional context to the establishment and strengthening of links in the supply chain
(Coe, Dicken and Hess, 2008; Gereffi, 1995). Government policy, in particular in relation to
trade, is a key framing factor in this context and can have important impacts on the supply
chain choices of actors within the chain (Gereffi, 1999). For example, Pickles and Smith (2010)
have demonstrated how a positive trade policy environment together with geographic proximity
has enabled EU12 suppliers to retain their position in the EU clothing supply chain against
strong competition from low wage alternatives.
The enlargement of the EU has harmonised the institutional context across the region and
provided a more supportive institutional environment for the development of regional supply
chains – both those linked to equity involvement through increased FDI as discussed above and
supply chains linking un-related companies. We will explore the extent to which trade flows
since enlargement reflect a more integrated supply chain and whether there are differences
within these chains depending on the level of embodied technology. The literature on
GVCs/GPNs lends support to the idea that different industrial sectors will have different levels
of international orientation. In particular, Gereffi’s differentiation between buyer-driven and
producer driven chains is very much linked to the embodied technology of the chains in
question – buyer driven being more low tech goods like clothing and footwear and producer
driven more medium and high tech goods like cars and computers (Gereffi, 1999). It seems
highly likely that such differences within production systems would have implications for the
level and nature of internationalisation.
In this paper, we seek to elucidate the evolving role of the new member states of the Union in
the division of labour within the EU at different stages of the production process and for
different types of goods. It is hoped that this analysis will shed light on the nature and
development of the regional integration of production by companies operating within the EU.
With the exception of Kaminsky and Ng (2001), little empirical work has been done on this
issue. Their analysis is now very old and much may have changed since 1997, their final year of
analysis.
Overall the key questions which we seek to explore are:
1. Has the importance of EU12 countries to EU15 trade increased as a result of
enlargement and if so in what sub-sectors?
2. Are there differences in the structure of EU12 and EU15 trade between goods with
different levels of embodied technology?
3. Has the division of labour within the region increased and if so in what kinds of
products?
4. Has the location of final production shifted within the Union and if so in what kinds of
products?
To answer these question we need to deconstruct trade by technology level and differentiate
between exchanges of final goods (both consumer goods and machinery) and intermediate
goods. In addition, most of these questions require us to compare developments over time. We

8
choose to do so by comparing the situation in the first year for which we have data – 1995 –
with the last year – 2007.
It needs to be acknowledged at the outset that trade figures are very macro level indicators of
trends which are used here in a highly aggregated form (EU15 and EU12). They provide
indications of broad developments but need to be complemented by more micro and qualitative
data (e.g. Pickles and Smith, 2010) in order to give a more comprehensive view of impacts.
However, it is hoped that the results of this analysis can provide pointers for sectors where
developments are particularly dynamic or interesting and help to better focus further research
on such areas.
Macro data can provide us with interesting insights on structures and trends in the broad
economy. Although widely used as the basis for much work in international economics
literature, it has been relatively little exploited in either the IB literature on the regionalisation/
globalisation debate or the GVC/GPN literature on the distribution of industrial production
across space. This is a curious omission. The IB literature has tended to focus on the operations
of the largest global companies, but smaller companies are important international actors (ref?)
whose internationalisation profile is little integrated into this literature. The latter literature on
GVC/GPNs tends to focus on relations between firms – of varying sizes – and relies heavily on
qualitative data. Macro data is sometimes included as a backdrop to the broader discussion (e.g.
Gereffi, 1999; Nadvi et al, 2011) but is little exploited. However trade data is a rich source of
information to aid understanding of the outcomes of firm level decisions in the aggregate. We
seek to explore this data in greater detail in order to shed light on these current debates on
international firm activities and inter and intra-firm exchanges.
4. Methodology
The trade data used here is from the BACI database, a database for the analysis of international
trade developed by Gaulier and Zignago (2010)4. BACI uses the data from the UN
COMTRADE database, but avoids the discrepancies which emerge due to the use of CIF (cost,
insurance and freight) import values and FOB (free on board) export values, by reconciling
both to FOB values. Thus, exports from exporter i to importer j are equal to j‘s imports from i.
The database is not yet updated for more recent years as UN data collection takes time, as does
the transfer to BACI. However given the fact that trade was very much impacted by the
financial crisis in 2008 and 2009, with the EU12 particularly hard hit (Curran and Zignago,
2011a; Curran, 2010), using these years as base years would probably have biased results.
BACI is denominated in dollars, which could be seen as problematic in analysing European
trade, which will today mainly be denominated in euros. However the euro did not exist in the
beginning of the time period covered. In addition, as much of our analysis is based on
percentage shares of trade, rather than absolute values, the currency used is less important than
consistency in that currency.
The key disruptive event which over the time period covered is the enlargement of the EU.
Thus we have chosen to look at trade figures by EU sub-region, that is differentiating between
the (old) EU15 and the EU12 new member states. Several researchers including Marin (2008),
De Simone (2007) and Geishecker (2006) have already identified specific trends in trade
between the EU 15 and the new member states to the East and South. In addition to the EU the
other two regions highlighted here are NAFTA and ASEAN+35. These groupings were chosen
4 BACI is available to COMTRADE users at: http://www.cepii.fr/anglaisgraph/bdd/baci.htm. 5 Association of South East Asian Nations (ASEAN) members plus Japan, China and Korea
9
as they represent the most integrated core countries, in terms of trade policy, in the extended
‘Triad’ zones. We also include a rest of the world (RoW) grouping.
In seeking to secure the best possible coverage, we analyse actual trade flows using an approach
based on the Broad Economic Categories (BEC) of the UN translated into the categories of the
harmonized system (HS) of trade on which BACI is based. Trade flows are thus differentiated
by end use between consumer goods, intermediate products used in production, capital goods,
resource-based goods and primary products. As such, all goods, at HS6 level, are identified as
belonging to one of these categories. The approach developed here has been used in previous
work reported in Fontagné et al (1996) which highlighted both the importance of intermediate
goods to trade within and between the EU and other Triad regions and the differences in the
structure of that trade between these different trade partners and sectors. It is these differences
which we seek to explore in more recent trade flows. More detailed explanation of such an
approach and its advantages over alternatives are provided in Curran and Zignago (2010),
which uses a similar database.
In our work, to avoid possible distortions from price variations, which are particularly high in
the minerals and hydrocarbons sector, we exclude mineral products as well as specific and non-
classified products (i.e. chapters 25, 26, 27, 97, 98 and 99 of the Harmonized System). The
database therefore consists of trade in all goods, excluding minerals. Thus rather than looking at
trade flows by industrial sector as others such as De Simone (2007), Feenstra (1998) and
Nordas (2004) have done, we cover all trade.
Furthermore, as pointed out above there is evidence that the technology orientation of
companies impacts on their level of internationalisation. We wished to explore whether these
differences identified at company level could be identified in EU trade data. In addition, recent
analysis has highlighted the fact that the EU is particularly competitive in medium technology,
where the region consistently out-performs its competitors in terms of share of global trade
(Curran and Zignago, 2009; Fontagné, Gaulier and Zignago, 2008). We were thus also
interested in exploring whether the inter-EU division of labour is particularly marked in the
types of products in which EU exporters excel.
To distinguish between different technology types we use the classification of products defined
by Lall (2000), which allows us to classify products in terms of the level of embodied
technology. Lall’s product categories used here are (with acronyms in parentheses): high-tech
manufactures (HT), medium-tech manufactures (MT), low-tech manufactures (LT) and primary
products (PP). We will focus here particularly on the first three categories, which represent the
EU’s key industrial output.
5. Results and discussion
The results will be explored in the light of the four key questions which we highlighted above.
1. Have EU12 countries have become more important for EU15 trade as a result of
enlargement and if so in what types of products?
To explore this question, we will firstly look at general trends in trade over the period. Table 1
shows the nominal growth rates in dollars of EU12 and EU15 imports and exports from
different regions of the world over the time period covered. It is clear that EU12 trade has been
far more dynamic than EU15 trade, particularly in relation to trade within the EU12 subregion,

10
where trade increased by 552%6. Although EU12 trade with the EU15 also increased, the
magnitude of the change was lower. What is clear, however is that trade between the EU15 and
the EU 12 was much more dynamic than trade within the EU15, which registered rather low
growth rates of 115%, lower than the growth rates for EU15 exports to NAFTA. The highest
growth rates in the table, however are those related to EU12 imports from ASEAN+3 which
have multiplied by a factor of almost 9. Thus in terms of the research question, EU12 trade is
becoming more important to imports and exports of the EU overall, but particularly so within
the E12 sub-region.
Table 1 about here
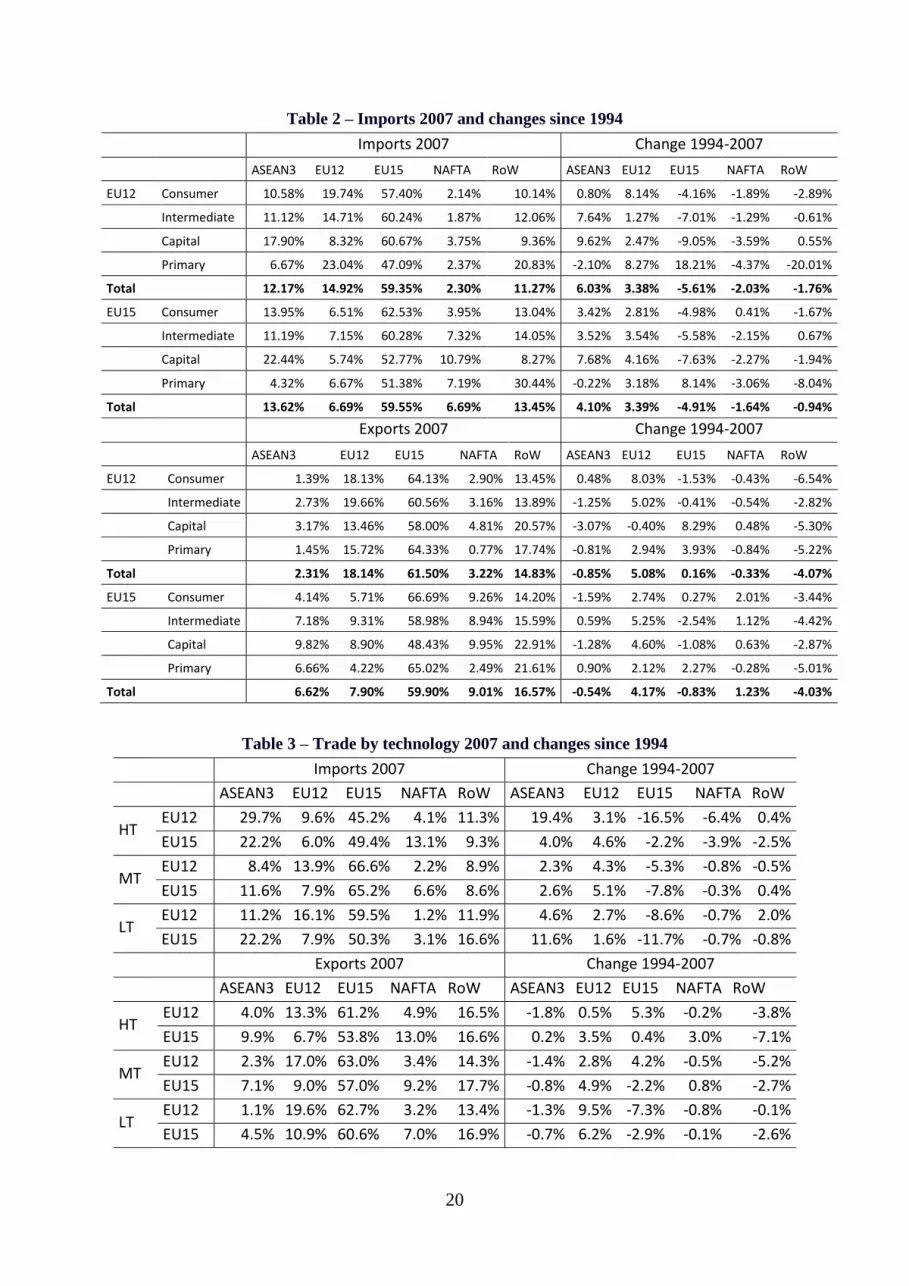
Looking now at the structure of trade and changes over time, Table 2 shows the figures for
trade in the different regions of the enlarged EU by type of product and changes since 1995. If
we look firstly at the structure of import trade, clearly the EU15 is the most important source of
imports in the EU12, representing almost 60% of trade, although its importance varies by
product. The EU15 is particularly important in intermediate and capital goods and less so in
primary products. It is evident that there has been significant restructuring in trade over the
period, both in the old and new member states. Rather surprisingly, perhaps, the EU12
countries are importing less of their goods from the ‘old’ member states. In consumer goods,
the region is increasingly sourcing from itself, whereas in intermediate products and capital
goods, the key change is a switch in sourcing from EU15 to ASEAN+3. As we shall see below,
this switch has been particularly important in certain technologies.
Primary products are the only type of good where EU15 is becoming an increasingly important
source, mainly at the expense of the RoW group. This switch is likely to be linked to the way in
which agricultural goods trade is regulated within the Union under the Common Agricultural
policy (CAP) and its related restrictions on imports in agricultural primary products. Overall the
increased importance of the ASEAN+3 region is notable. This is a fairly generalised
phenomenon globally and is also visible at EU27 level and within NAFTA and the ASEAN+3
itself (Curran and Zignago, 2011b).
Table 2 about here
In the EU15, we see similar levels of importance for the ‘home’ region in trade as for EU12
trade – at close to 60%, although the structure is different. EU15 is most important in consumer
and intermediate goods and less so in capital and, once more, primary goods. The dynamic of
change is similar to that in EU12 imports – increased importance of EU12 and reductions in
importance in EU15, especially in capital goods. Once more the exception is primary products,
where intra-regional trade is increasing in the EU15. Overall there is a notably higher level of
dependence on the EU27 region for imports in the EU12 than in the EU15 (adding EU12 and
15 together we get 74% regional sourcing for EU12 compared to 66% for EU15). However this
dependence is largely due to the greater weight of EU12 in the former’s imports rather than
differences in relation to the weight of the EU15.
6 Because BACI corrects for inconsistencies between export and import data, the exports of each EU region are the
same as their corresponding imports. Hence the figures on increases in imports in each sub-region of the EU to
themselves are the same as corresponding increases in exports.

11
In terms of exports, the two sub-regions have rather different levels of global reach in their
sales. Within the EU12 we see high levels of dependence on both the sub-regional (EU12) and
regional (EU15) markets, whereas the EU15 is more varied in its reach with higher levels of
export share in all regions of the world. The EU12 is dependent on the EU for 80% of its
exports and has indeed increased that dependence over time, mainly in relation to the EU12
sub-region itself. There are differences across different types of products, with the EU15
particularly important for consumer and primary products and less so for capital goods – where
non-EU regions all have a higher share of exports than for other sectors. However the trend in
this sub-sector is towards greater dependence on the EU15.
For the EU15 the level of dependence on the EU market is substantially lower than for the
EU12 - ‘only’ 68%. What increases there has been over the time period are in relation to the
EU12, with a 4% increase in their export share doubling the region’s importance for EU15
exporters. The highest growth has been in the products most related to production intermediate
and capital goods. The highest level of dependence on the EU15 is seen in consumer goods and
primary products – for both of which the EU12 is less important.
Overall in terms of the trade structure and dynamic within the EU27 region the EU12 is very
reliant on the home region for imports and exports. The EU15 is less so and while overall the
level of regional orientation in exports within the EU27 has increased thanks to growth in the
importance of the EU12, the importance of the home region in imports has decreased. In terms
of the research question of the importance of the EU12 to EU15 trade, it certainly is becoming
more important. Thus the EU12 sub-region is becoming increasingly integrated with the EU15.
However this has not prevented the EU region overall losing market share in terms of its total
imports, mainly to ASEAN+3, because of the loss of EU15 market share.
2. Are there differences in the trade structure between goods with different levels of embodied
technology?
Trade flows were categorised in terms of embodied technology as defined in the methodology.
Table 3 shows the structure of trade of the two EU sub-regions by technology. It is
immediately evident that HT trade has a different structure for the EU12 compared to the other
two technology types. Specifically, in imports, ASEAN+3 is far more important to HT sourcing
making up nearly 30%, the highest share of the region in any sector or sub-region. For the
EU15 it is also the case that this region is very important to HT goods imports, but this is also
so in LT goods. In the EU15 this latter sector has a very similar structure to HT goods (apart
from a major difference between the relative importance of NAFTA and the RoW). Given the
high importance of factor costs like labour in sourcing decisions in LT goods like clothing
(Pickles and Smith, 2011), this latter finding is rather unsurprising, although the importance for
HT is more counter-intuitive.
It is perhaps also surprising that the majority of LT goods in the EU still come from within the
region. Although the EU 15 has lost significant market share, balanced only marginally by
increases in the EU12’s share the share of the EU27 remains well over 50% in both subregions.
Nevertheless the trend is downwards and when we look at the table it is clear that EU15
producers are losing market share across the board, especially in HT in EU12 and LT in EU15.
EU12’s generally small increases in market share are inadequate to balance these losses except
in HT imports to the EU15.
Table 4 about here

12
Looking now at exports we see a strong focus on the EU market for the EU12 subregion across
the board. This dependence on the EU27 increases as the technological level falls from 75% in
HT to 82% in LT. The EU15 shows the same tendency towards lower levels of home-region
dependence at higher technology levels, but overall home region dependence is lower – from
60% to 72%. The EU15 is re-orienting exports from EU15 to EU12, especially in LT goods.
While the EU12 is exporting more to both sub-regions, except in LT goods where it has re-
oriented trade from global and especially EU15 markets to the home sub-region, which now
makes up 20% of its exports.
In terms of the research question, these broad trends indicate that there are important
differences in trade trends between the different technologies, with very different trade
structures evident at different technology levels and HT trade tending to be less regionally
focused than others, as previous research has suggested. However these trade flows are made up
of all kinds of goods – both final products and the intermediate goods which generally make up
about 50% of trade (Curran and Zignago, 2011b). It could be that these overall trends mask
even larger changes at subsectoral level. The next sections will explore the extent to which
different types of products show different trade structures and dynamics.
3. Has the division of labour in industry within the region increased? If so in what types of
products?
We can explore this question by looking at trends in intermediate product trade, reproduced in
Table 4, but also shown in Table 2. What we can see from the figures is that the importance of
the EU15 to intermediates trade is very similar across sub-regions and direction of trade. What
varies is the importance of EU12, which is far more important within its own sub-region. In
terms of the dynamic the EU15 is becoming less important across the board, especially in
imports, while the EU12 is becoming more important especially in exports.
Thus there is a visible shift in intermediates trade within the EU from the EU15 to the EU12,
however there is also a shift towards the ASEAN+3 region in imports. Thus the extent of the
overall division of labour within the EU region has not increased in terms of its overall
importance in sourcing intermediate goods. Rather there has been a reduction in the importance
of the EU15 which has been taken up partly by the EU12, but also by the ASEAN+3 region. In
terms of exports of intermediate products both regions increasingly send their intermediates to
the EU12, which implies a certain concentration of the regional production structures within
that sub-region, indicative of the shifting of production networks towards the EU12.
Table 4 about here
To explore the extent to which there are differences in the structure and dynamics of the supply
chain across technologies we looked at intermediates trade by technology as defined by Lall
(2000). The results are shown in Table 5. On the import side it is clear that there are large
differences across technologies in the sourcing of intermediates products. In particular, the HT
sector has a very different structure to the other two, with low levels of sourcing from both
EU12 and EU15 and a high level of sourcing from ASEAN+3. This latter source is especially
important for EU12 which has substantially re-oriented imports to that region over time, largely
at the expense of suppliers in EU15, but also in North America.
13
In both the MT and LT sectors the EU as a whole is a much more important source of
intermediates especially for EU12 (approximately 81% of imports in both sectors). In both
sectors, the EU15 has lost market share to the EU12 and ASEAN+3. Thus across the board in
intermediates trade we see a trend towards both sub-regions of the EU importing more of the
inputs to production from EU12, but also a much stronger reliance on global sources –
especially ASEAN+3 -in the HT sector than others as a result of a major shift from EU15 to the
latter source.
Table 5 about here
Looking now at the export side in more detail, we once more see differences between the
technology levels, but less so than in sourcing. The EU15 is most important to the EU12 as a
destination for intermediates in MT goods, while the EU15 exports higher levels to itself the
lower down the technological ladder we go – in other words the markets for HT intermediates
manufacturers in the EU15 are more global in HT than MT and LT. This is also the case for
EU12 but there MT and LT are very similar in terms of dependence on overall EU27, although
the importance of the sub-regions is different. This is once more consistent with previous work
indicating more global orientation in HT companies.
The EU15 has become less important as an export market for inputs to production in all cases
except MT exports (parts for machinery, cars) from the EU12. This is the sector of the EU’s
historical strength. The EU12 has become a more important destination for exports of
intermediate products across the board, but especially in LT (textiles, leather), while the
importance of intra-trade in the sub-region is particularly high and growing in MT and
especially LT sectors. This is likely to be at least partly due to the importance of the clothing
and textile industry in the region (Pickles and Smith, 2011) and its historic specialisation in
labour intensive goods (Dupuch et al 2004 ). Thus overall trends in exports of intermediate
products confirm the trends seen in imports – EU15 becoming less important as a production
centre compared to EU12. In contrast to imports, ASEAN+3 is not an important destination for
intermediates from the EU (with the possible exception of the 14% of HT intermediates
exported from EU15). Thus the increasing integration of the EU’s production networks with
that region is largely uni-directional.
4. Has the location of final production shifted to the EU12?
In exploring the previous question, we find evidence that intermediates trade within the EU27 is
increasingly oriented towards EU12. Is this sub-region becoming an increasingly important
production hub and, by implication, source of final goods? To explore this question, we look at
trends in trade for consumer goods and capital goods – the two sub-sectors of final goods
differentiated in the BACI database. The results are presented in Table 9.
In relation to imports in the high tech sector, the most striking finding is the overarching
importance of ASEAN+3 as a source of imports in HT capital goods. This is the sector, along
with LT consumer goods, where the region represents the highest share of EU markets. Thus at
two ends of the technology spectrum we see a strong performance from the East Asian region
in EU final goods markets. Changes within the EU are secondary to the major changes in
relation to ASEAN+3 in these two sub-sectors, although it is interesting that in MT and HT
consumer goods, the latter region has stable or falling market share. Thus gains are
concentrated in HT capital goods and LT goods.
14
Table 6 about here
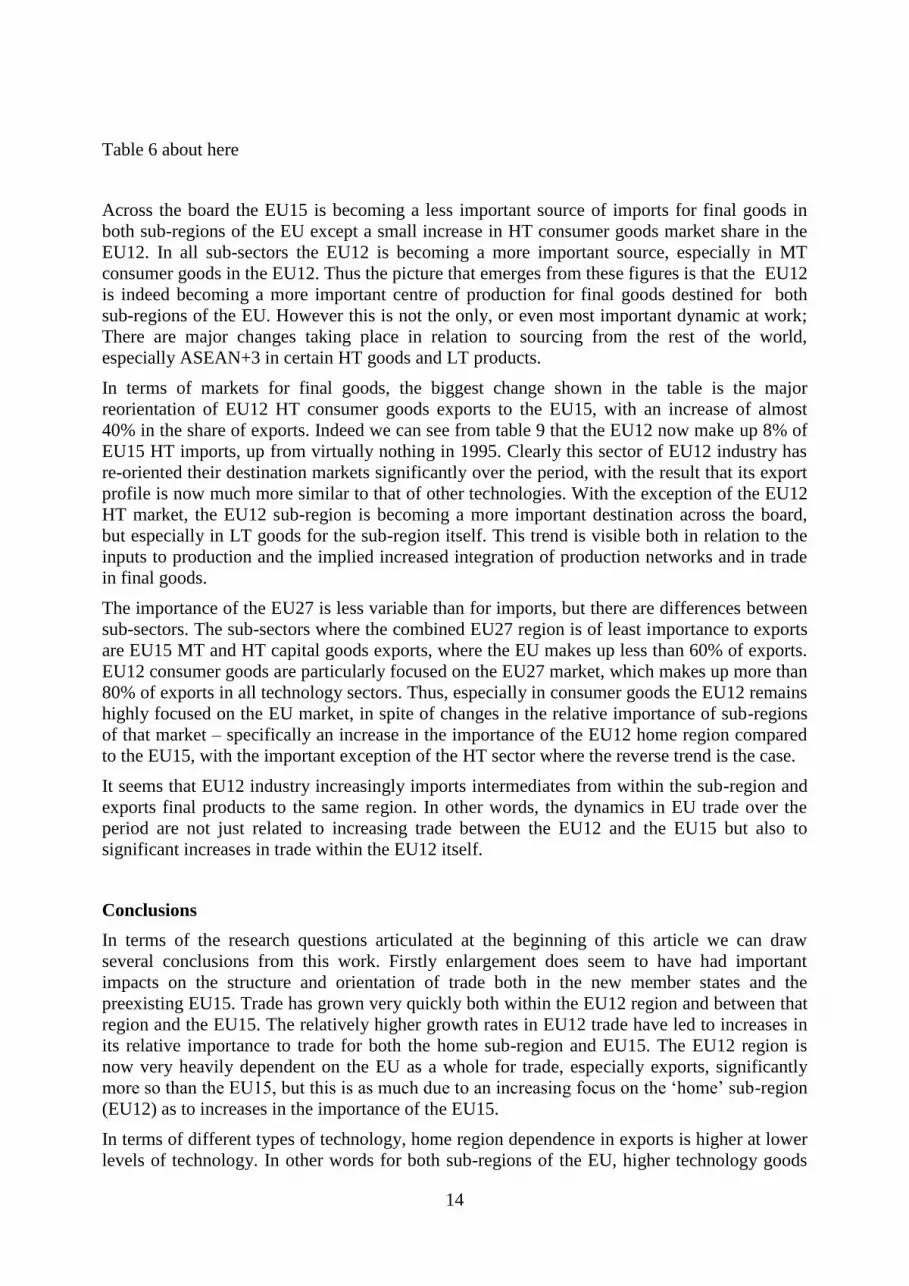
Across the board the EU15 is becoming a less important source of imports for final goods in
both sub-regions of the EU except a small increase in HT consumer goods market share in the
EU12. In all sub-sectors the EU12 is becoming a more important source, especially in MT
consumer goods in the EU12. Thus the picture that emerges from these figures is that the EU12
is indeed becoming a more important centre of production for final goods destined for both
sub-regions of the EU. However this is not the only, or even most important dynamic at work;
There are major changes taking place in relation to sourcing from the rest of the world,
especially ASEAN+3 in certain HT goods and LT products.
In terms of markets for final goods, the biggest change shown in the table is the major
reorientation of EU12 HT consumer goods exports to the EU15, with an increase of almost
40% in the share of exports. Indeed we can see from table 9 that the EU12 now make up 8% of
EU15 HT imports, up from virtually nothing in 1995. Clearly this sector of EU12 industry has
re-oriented their destination markets significantly over the period, with the result that its export
profile is now much more similar to that of other technologies. With the exception of the EU12
HT market, the EU12 sub-region is becoming a more important destination across the board,
but especially in LT goods for the sub-region itself. This trend is visible both in relation to the
inputs to production and the implied increased integration of production networks and in trade
in final goods.
The importance of the EU27 is less variable than for imports, but there are differences between
sub-sectors. The sub-sectors where the combined EU27 region is of least importance to exports
are EU15 MT and HT capital goods exports, where the EU makes up less than 60% of exports.
EU12 consumer goods are particularly focused on the EU27 market, which makes up more than
80% of exports in all technology sectors. Thus, especially in consumer goods the EU12 remains
highly focused on the EU market, in spite of changes in the relative importance of sub-regions
of that market – specifically an increase in the importance of the EU12 home region compared
to the EU15, with the important exception of the HT sector where the reverse trend is the case.
It seems that EU12 industry increasingly imports intermediates from within the sub-region and
exports final products to the same region. In other words, the dynamics in EU trade over the
period are not just related to increasing trade between the EU12 and the EU15 but also to
significant increases in trade within the EU12 itself.
Conclusions
In terms of the research questions articulated at the beginning of this article we can draw
several conclusions from this work. Firstly enlargement does seem to have had important
impacts on the structure and orientation of trade both in the new member states and the
preexisting EU15. Trade has grown very quickly both within the EU12 region and between that
region and the EU15. The relatively higher growth rates in EU12 trade have led to increases in
its relative importance to trade for both the home sub-region and EU15. The EU12 region is
now very heavily dependent on the EU as a whole for trade, especially exports, significantly
more so than the EU15, but this is as much due to an increasing focus on the ‘home’ sub-region
(EU12) as to increases in the importance of the EU15.
In terms of different types of technology, home region dependence in exports is higher at lower
levels of technology. In other words for both sub-regions of the EU, higher technology goods

15
have a more global market. For LT goods, the EU12 is particularly strongly oriented towards
intra-EU trade. In MT, the region remains highly integrated. HT trade has a different structure
to other trade, especially for EU12 where ASEAN+3 accounts for a far higher level of imports
than in any other sector – almost 30%. For EU15 imports of HT and LT show similar levels of
sourcing from EU and ASEAN+3 sources.
In terms of the division of labour in industry, the figures on trade in intermediate goods show
similar trends to all goods – that is an increase in the importance of EU12 and a fall in the
importance of EU15, particularly in the share of imports. Looking at the latter in more detail, it
is in HT intermediate imports that we see the most global sourcing patterns amongst the sub-
sectors covered in this work, especially in EU12 where ASEAN+3 represents almost 38% of
imports in HT intermediates. This is a relatively new development and is largely at the expense
of EU15 sources whose importance to EU12 imports fell by 26 p.p. Thus overall the structure
and trends in intermediate goods sourcing point to an increase in global sourcing in HT
intermediates, most notably for EU12, with a general increase in the importance of EU12
sources compared to a fall in the importance of EU15 sources across the board. Export data
tend to confirm this latter finding. The regional orientation of the EU’s industrial production
networks is therefore neither uniform nor stable. In certain sectors, especially HT trade, the EU
is relying increasingly on extra-EU sources, while in others, the level of integration of
production within the Union remains high.
Finally we looked at trade in finished goods. Here again we note a reduction in the importance
of the EU15 as a source of imports for all EU sub-regions and sectors except for a very small
increase in market share in EU12 HT consumer goods imports. In contrast EU12 is increasing
its market share across the board, particularly in MT consumer goods in the home sub-region.
Major changes are also taking place in relation to trade with the rest of the world especially in
LT consumer goods in the EU15, where ASEAN+3 has seen large increases in market share.
Overall in relation to the important EU15 final goods market, EU12 sources are expanding their
market share mainly in HT and MT products, especially consumer goods. The result is that
EU12 consumer goods producers are very dependent on the EU home market, which makes up
more than 80% of exports in all sectors. Given the recent economic difficulties of the Euro-zone
and the EU as a whole, this heavy dependence on the region is likely to be problematic for
EU12 companies.
Of course correlation does not always imply causation. The changes we highlight co-incided
with enlargement but some were perhaps independent of it. Although there are certainly other
factors at work over the period covered, making it difficult to say with certainty that
enlargement was the key motivating factor, it seems highly likely that the impact of market
opening and institutional homogenisation involved in the enlargement process was nevertheless
a key factor in these emerging trade dynamics.
However some of the most significant changes we see in trade during the period covered were
in relation to trade with ASEAN+3. It is likely that the Chinese membership of the World Trade
Organisation (WTO) in 2001 and the consequent increase in its market access were at least
partly behind these changes. In addition the increased openness to world market sources
involved in the adoption of the acquis communitaire by the EU12 made all imports in these
countries cheaper, including those from East Asia. Thus here again, institutional factors seem to
be a motivating factor behind changes in the structure of trade across production networks.
The figures we analyse are aggregate trade figures. They are the concrete result of a multitude
of individual sourcing and investment decisions made over time by enterprises in the EU and
elsewhere. Clearly they only provide us with a very macro level overview of the situation at
industry level, but they enable us to shed light on general trends and highlight some notable

16
developments. They also enable us to better understand the manner in which production
networks within the EU region are evolving as new members accede to the political institutions
which underpin it.
As the EU has changed, so have the sourcing strategies of companies within the region. The
addition of twelve new member states in 2004 and 2007 added new industrial capacities with
different cost structures and strengths to the Union (Dupuch et al, 2004). The figures analysed
here indicate that these capacities have been increasingly exploited by other companies in the
region through sourcing of intermediate and final products to supplement their own
competitiveness. Overall the result has been to maintain a high level of intra-regional trade
within the Union, making it consistently the most highly regionally integrated of world regions.
However the structure of this trade is changing, with the EU15 generally seeing reductions in
its trade share while EU12 trade has increased its regional importance.
A key issue in better understanding these patterns is the extent to which the trade developments
which we have seen are linked to FDI. As highlighted in the introduction, the links between the
two are complex, not least because FDI can have quite differing motivations and thus varied
impacts on trade. Further work is needed to better articulate trade dynamics and equity
involvement across countries. Our work indicates that increased trade within the EU12 sub-
region coincides with increasing intra-EU12 FDI, while the highly regionally integrated MT
sector is also the sector where researchers have noted high FDI flows into the EU12 from the
EU15 (Dupuch et al, 2004). However, we cannot link these two developments empirically
using this methodology.
In conclusion, the EU’s enlargement does seem to have resulted in a restructuring of production
networks within the Union. However this development has not led to a reduction of extra-EU
linkages. Rather the EU has collectively ceded certain types of production – particularly high
tech intermediates goods and low tech final goods -to extra-EU sources, while consolidating
production structures for its traditional strengths, especially medium tech goods, within the
Union. Thus different types of production systems have reacted to the changes in the
institutional structure differently. The MT sector in the EU12 has become more strongly
integrated with the EU15, while in HT trade the EU region as a whole has tended to look
increasingly beyond its borders. In LT the picture is more mixed. How successful this strategy
will be in maintaining EU competitiveness, only time will tell, but clearly enlargement has
impacted on the way all types of companies manage their production networks within the new
EU.
References
Aggarwal, R., J. Berrill, E. Hutson and C. Kearney (2011), 'What is a multinational
corporation? Classifying the degree of firm-level multinationality'. International Business
Review. 20 (5): 557-577.
Athukorala Prema-chandra, (2006). Product Fragmentation and Trade Patterns in East Asia,
Asian Economic Papers, 4 (3): 1-27.
Anwar, S and Nguyen, L.P (2011). Foreign Direct Investment and trade: The case of Vietnam.
Research in International Business and Finance, 25(1): 39-52.
Avery, G. and Cameron, F. (1998). The Enlargement of the European Union, Sheffield, UK:
Sheffield Academic Press.
Banalieva, E., and Dharanaj, C. 2010. Home region bias in multinational enterprises.
Presentation at the UKIAIB 2010 Conference, Dublin, April 2010.

17
Bchir, H, Fontagné, L and Zanghieri, P (2003). The Impact of EU Enlargement on Member
States : A CGE Approach. CEPII Working Papers 10. Paris: CEPII.
Buch, C and Piazolo, D (2001). Capital and Trade Flows in Europe and the Impact of
Enlargement. Economic Systems, 25 (3): 183-214.
Bussière, M, Fidrmuc, J and Schnatz, B (2005). Trade integration of Central and Eastern
European countries: lessons from a gravity model. Working Paper 545. Frankfurt: European
Central Bank.
Cerrato, D. 2009. Does innovation lead to global orientation? Empirical evidence from a
sample of Italian firms. European Management Journal, 27, (5): 366-376 .
Coe, N., Dicken, P. and Hess, M. (2008) Global Production Networks: Realising the potential.
Journal of Economic Geography, 8: 271-295.
Coucke, K. and Sleuwaegen, L. (2008). Offshoring as a survival strategy: evidence from
manufacturing firms in Belgium, Journal of International Business Studies, 39(8): 1261-1277.
Crozet, M and Koenig, P. S (2004) EU enlargement and the internal geography of countries.
Journal of Comparative Economics, 32 (2): 265–279.
Curran, L and Zignago, S (2011a). The Financial Crisis and Trade – Key impacts, Interactions
and Outcomes. Thunderbird International Business Review. 53(2): 115-128.
Curran, L and Zignago, S. (2011b). Intermediate products and the regionalization of trade. The
Multinational Business Review, 19 (1) : 6-25.
Curran, L and Zignago, S. (2010). How Regional is the Supply Chain in the Enlarged EU? The
Multinational Business Review. 18(1): 25-49.
Curran, L (2010) The impact of the crisis on EU competitiveness in international trade,
Intereconomics, September/October, 2009
Curran, L. and Zignago, S., (2009). Evolution of EU and its member states’ competitiveness in
international trade, CEPII Working Paper 11. Paris: CEPII.
Damijan, J and Kostevc, C (2011) Trade liberalisation and economic geography in CEE
countries: the role of FDI in the adjustment pattern of regional wages. Post-Communist
Economies . 23 (2):163 -189
De Simone, G. (2008). Trade in parts and components and the Industrial Geography of Central
and Eastern European Countries, Review of World Economics, 144 (3): 428-457.
Dupuch, S, Jennequin, H. And Mouhoud, E-M (2004). EU Enlargement: What does it change
for European Economic Geography? Revue de l’OFCE, Special Issue, April 2004: 241-274.
Dunning, J, Fujita, M and Yakova, N (2007). Some macro-data on the regionalisation/
globalisation debate: a comment on the Rugman/Verbeke analysis, Journal of International
Business Studies, 38(1): 177-199.
Dunning, J (1988). The Eclectic Paradigm of International Production: a restatement and some
extensions, Journal of International Business Studies, 19(1): 1-31.
Feenstra, R.C. (1998). Integration of Trade and Disintegration of Production in the Global
Economy, Journal of Economic Perspectives, 12 (4): 31-50.
Fernandes, A. (2003). Trade policy, trade volumes, and plant-level productivity in Colombian
manufacturing industries, World Bank Policy Research Working Paper Series, No. 3064,
Washington: The World Bank.

18
Filatotchev, I. Stephan, J. and Jindra B. (2008). Ownership structure, strategic controls and
export intensity of foreign owned forms in transition economies, Journal of International
Business Studies, 39(7): 1133-1148.
Fontagné, L. G. Gaulier and S. Zignago (2008). Specialisation across Varieties and North-South
Competition, Economic Policy 23(1): 51-91.
Fontagné, L , Freudenberg, M and Ünal-Kesenci D (1996) Les échanges de biens
intermediaries de la Triade, Economie Internationale, 65 : 143-168.
Froebel, F. Heinricks, J. and Kreye, O. (1980). The New International Division of Labour,
Cambridge, UK: Cambridge University Press.
Gaulier, G. and Zignago, S. (2010). BACI: A World Database of International Trade Analysis
at the Product Level, CEPII Working Paper. Paris: CEPII.
Geishecker, I. (2006). Does outsourcing to Central and Eastern Europe really threaten manual
workers’ jobs in Germany? The World Economy, 29(5) pp. 559-583.
Gereffi, G. (1999). International trade and industrial upgrading in the apparel commodity chain.
Journal of International Economics. 48: 37-70.
Gereffi, G (1995). Global Production Systems and third world development. In: Stallings, B.
(ed). Global Change, Regional response: the new international context of development.
Cambridge UP: New York.
Halpern, L., Koren, M. and Szeidl, A. (2005). Imports and Productivity, CEPR Discussion
Paper No. 5139. London: The Centre for Economic Policy Research. Available at SSRN:
http://ssrn.com/abstract=785127
Huber, P (2008). Did Previous EU Enlargements Change the Regional Distribution of
Production? International Journal of Public Policy, 3(3): 187-206.
Hummels D., Ishii J. and Yi, K-M., (2001). The nature and growth of vertical specialization in
world trade, Journal of International Economics, 54: 75-96.
Jacoby, W (2010). Managing globalization by managing Central and Eastern Europe: the EU's
backyard as threat and opportunity. Journal of European Public Policy. 17(3): 416-432.
Kali, R. and Reyes, J. (2007) The architecture of globalization: A network approach to
international economic integration. Journal of International Business Studies, 38 (4): 595-620.
Kaminski B., and Ng F., (2001). Trade and Production Fragmentation: Central European
Economies in EU Networks of Production and Marketing, Policy Research Working Paper
Series no. 2611. Washington: The World Bank.
Karkkainen, A. (2008). EU-15 Foreign Direct Investment in the new member states, Eurostat,
Statistics in Focus, 71/2008 at: http://www.eds-destatis.de/de/downloads/sif/sf_08_071.pdf
Kasahara, H. and Rodriguez J. (2004). Does the Use of Imported Intermediates Increase
Productivity? Queen’s University Working Paper, Kingston, Ontario.
Kotabe, M and Scott-Swan, K (1994). Offshore sourcing: Reaction, maturation and
consolidation of US multinationals, Journal of International Business Studies, 25 (1): 115-140.
Lall, S. (2000). The Technological Structure and Performance of Developing Country
Manufactured Exports, 1985-1998, Oxford Development Studies, 28 (3): 337-369.

19
Majocchi,A and Strange, R (2007) Trade and Market Liberalisation in Eastern Europe: The
Effects on the FDI Location Decisions of Italian Firms. Journal of East-West Business, 13
(2/3): 93-114.
Marin, D. (2008). The New Corporation in Europe, Bruegel Policy Brief 07, September 2008,
Brussels: Bruegel.
Muûls, M and Pisu, M (2007). Imports and Exports at the level of the firm: Evidence from
Belgium, Centre for Economic Performance, Discussion Paper 801. London School of
Economics.
Nadvi, K., Lund-Thomsen, P. Xue, H and Khara, N. (2011) Playing against China: global
value chains and labour standards in the international sports goods industry. Global Networks.
11(3): 334-54.
Nordas, H (2004). Determinants of Vertical Specialisation, presentation at Ecomod Input-
Output and General Equilibrium Conference, Brussels, September 2004. Accessible at:
http://www.ecomod.net/conferences/iioa2004/iioa2004_papers/543.pdf
OECD, (2002). Intra-industry and intra-form trade and the internationalisation of production,
OECD Economic Outlook 71, Paris: OECD. Available at:
http://www.oecd.org/dataoecd/6/18/2752923.pdf
Osegowitsch, T. and Sammartino, A. (2008). Reassessing (home-) regionalisation. Journal of
International Business Studies, 39 (2): 184-196.
Pickles, J. and Smith, A. (2011) De-localisation and Persistence in the European Clothing
Industry: the Reconfiguration of Trade and Production Networks. Regional Studies, 45 (2):
167-185.
Rugman A. and. Verbeke, A (2004). A perspective on regional and global strategies of
multinational enterprises. Journal of International Business Studies, 35 (1): 3-18.
Rugraff, E (2010). Strengths and weaknesses of the outward FDI paths of the Central European
countries. Post-Communist Economies. 22 (1): 1-17
Spies, J and Marques, H (2009) Trade effects of the Europe agreements: A theory-based gravity
approach. Journal of International Trade and Economic Development. 18(1) :11-35
TABLES
Table 1 – Nominal growth rates of trade (in Euro) 1995-2007
ASEAN3 EU12 EU15 NAFTA RoW Total
Exports EU12 243.3 551.5 370.4 325.9 268.2 369.1
EU15 101.3 360.4 114.7 151.9 75.1 117.7
Imports EU12 898.4 551.5 360.4 167.3 335.9 403.9
EU15 232.4 370.4 114.7 86.7 117.2 132.4
20
Table 2 – Imports 2007 and changes since 1994
Imports 2007 Change 1994-2007
ASEAN3 EU12 EU15 NAFTA RoW ASEAN3 EU12 EU15 NAFTA RoW
EU12 Consumer 10.58% 19.74% 57.40% 2.14% 10.14% 0.80% 8.14% -4.16% -1.89% -2.89%
Intermediate 11.12% 14.71% 60.24% 1.87% 12.06% 7.64% 1.27% -7.01% -1.29% -0.61%
Capital 17.90% 8.32% 60.67% 3.75% 9.36% 9.62% 2.47% -9.05% -3.59% 0.55%
Primary 6.67% 23.04% 47.09% 2.37% 20.83% -2.10% 8.27% 18.21% -4.37% -20.01%
Total 12.17% 14.92% 59.35% 2.30% 11.27% 6.03% 3.38% -5.61% -2.03% -1.76%
EU15 Consumer 13.95% 6.51% 62.53% 3.95% 13.04% 3.42% 2.81% -4.98% 0.41% -1.67%
Intermediate 11.19% 7.15% 60.28% 7.32% 14.05% 3.52% 3.54% -5.58% -2.15% 0.67%
Capital 22.44% 5.74% 52.77% 10.79% 8.27% 7.68% 4.16% -7.63% -2.27% -1.94%
Primary 4.32% 6.67% 51.38% 7.19% 30.44% -0.22% 3.18% 8.14% -3.06% -8.04%
Total 13.62% 6.69% 59.55% 6.69% 13.45% 4.10% 3.39% -4.91% -1.64% -0.94%
Exports 2007 Change 1994-2007
ASEAN3 EU12 EU15 NAFTA RoW ASEAN3 EU12 EU15 NAFTA RoW
EU12 Consumer 1.39% 18.13% 64.13% 2.90% 13.45% 0.48% 8.03% -1.53% -0.43% -6.54%
Intermediate 2.73% 19.66% 60.56% 3.16% 13.89% -1.25% 5.02% -0.41% -0.54% -2.82%
Capital 3.17% 13.46% 58.00% 4.81% 20.57% -3.07% -0.40% 8.29% 0.48% -5.30%
Primary 1.45% 15.72% 64.33% 0.77% 17.74% -0.81% 2.94% 3.93% -0.84% -5.22%
Total 2.31% 18.14% 61.50% 3.22% 14.83% -0.85% 5.08% 0.16% -0.33% -4.07%
EU15 Consumer 4.14% 5.71% 66.69% 9.26% 14.20% -1.59% 2.74% 0.27% 2.01% -3.44%
Intermediate 7.18% 9.31% 58.98% 8.94% 15.59% 0.59% 5.25% -2.54% 1.12% -4.42%
Capital 9.82% 8.90% 48.43% 9.95% 22.91% -1.28% 4.60% -1.08% 0.63% -2.87%
Primary 6.66% 4.22% 65.02% 2.49% 21.61% 0.90% 2.12% 2.27% -0.28% -5.01%
Total 6.62% 7.90% 59.90% 9.01% 16.57% -0.54% 4.17% -0.83% 1.23% -4.03%
Table 3 – Trade by technology 2007 and changes since 1994
Imports 2007 Change 1994-2007
ASEAN3 EU12 EU15 NAFTA RoW ASEAN3 EU12 EU15 NAFTA RoW
HT EU12 29.7% 9.6% 45.2% 4.1% 11.3% 19.4% 3.1% -16.5% -6.4% 0.4%
EU15 22.2% 6.0% 49.4% 13.1% 9.3% 4.0% 4.6% -2.2% -3.9% -2.5%
MT EU12 8.4% 13.9% 66.6% 2.2% 8.9% 2.3% 4.3% -5.3% -0.8% -0.5%
EU15 11.6% 7.9% 65.2% 6.6% 8.6% 2.6% 5.1% -7.8% -0.3% 0.4%
LT EU12 11.2% 16.1% 59.5% 1.2% 11.9% 4.6% 2.7% -8.6% -0.7% 2.0%
EU15 22.2% 7.9% 50.3% 3.1% 16.6% 11.6% 1.6% -11.7% -0.7% -0.8%
Exports 2007 Change 1994-2007
ASEAN3 EU12 EU15 NAFTA RoW ASEAN3 EU12 EU15 NAFTA RoW
HT EU12 4.0% 13.3% 61.2% 4.9% 16.5% -1.8% 0.5% 5.3% -0.2% -3.8%
EU15 9.9% 6.7% 53.8% 13.0% 16.6% 0.2% 3.5% 0.4% 3.0% -7.1%
MT EU12 2.3% 17.0% 63.0% 3.4% 14.3% -1.4% 2.8% 4.2% -0.5% -5.2%
EU15 7.1% 9.0% 57.0% 9.2% 17.7% -0.8% 4.9% -2.2% 0.8% -2.7%
LT EU12 1.1% 19.6% 62.7% 3.2% 13.4% -1.3% 9.5% -7.3% -0.8% -0.1%
EU15 4.5% 10.9% 60.6% 7.0% 16.9% -0.7% 6.2% -2.9% -0.1% -2.6%

21
Table 4 – Intermediates trade and trends
Intermediates trade 2007 Change 1994-2007
ASEAN3 EU12 EU15 NAFTA RoW ASEAN3 EU12 EU15 NAFTA RoW
EU12 Imports 11.1% 14.7% 60.2% 1.9% 12.1% 7.6% 1.3% -7.0% -1.3% -0.6%
EU12 Exports 2.7% 19.7% 60.6% 3.2% 13.9% -1.2% 5.0% -0.4% -0.5% -2.8%
EU15 Imports 11.2% 7.2% 60.3% 7.3% 14.0% 3.5% 3.5% -5.6% -2.1% 0.7%
EU15 Exports 7.2% 9.3% 59.0% 8.9% 15.6% 0.6% 5.2% -2.5% 1.1% -4.4%
Table 5 –Trade in intermediate products by technology
Imports 2007 Changes 1994-2007
ASEAN3 EU12 EU15 NAFTA RoW ASEAN3 EU12 EU15 NAFTA RoW
HT EU12 37.9% 5.5% 40.2% 3.3% 13.0% 27.1% 0.9% -26.0% -5.3% 3.4%
EU15 23.9% 4.6% 44.6% 15.2% 11.7% 4.1% 2.5% -2.2% -4.1% -0.3%
MT EU12 7.6% 14.3% 66.5% 1.8% 9.7% 4.5% 2.6% -5.1% -1.1% -1.0%
EU15 9.3% 8.9% 64.2% 7.4% 10.3% 3.0% 5.5% -7.8% -1.1% 0.4%
LT EU12 6.2% 16.5% 64.7% 1.0% 11.6% 4.0% 0.4% -6.3% -0.6% 2.4%
EU15 11.1% 8.5% 64.8% 3.1% 12.5% 6.2% 3.3% -9.5% -0.5% 0.6%
Exports 2007 Change 1994-2007
ASEAN3 EU12 EU15 NAFTA RoW ASEAN3 EU12 EU15 NAFTA RoW
HT
EU12 8.6% 12.1% 59.2% 7.3% 12.8% 1.5% 5.4% -8.2% 0.9% 0.3%
EU15 13.8% 7.8% 51.6% 12.5% 14.3% 3.1% 4.5% -1.2% 1.5% -7.9%
MT
EU12 2.4% 16.8% 64.8% 3.3% 12.6% -0.9% 2.4% 3.4% -0.9% -3.9%
EU15 7.5% 9.8% 58.5% 8.5% 15.7% 1.3% 5.7% -3.2% 0.3% -4.0%
LT
EU12 0.7% 25.2% 56.4% 2.2% 15.4% -3.8% 9.0% -0.9% -1.5% -2.9%
EU15 4.1% 13.7% 59.5% 5.9% 16.8% -0.3% 8.0% -5.1% -0.1% -2.5%

22
Table 6 – Structure of trade in final goods – 2007 and changes since 1994
Imports 2007 Changes 1994-2007
ASEAN3 EU12 EU15 NAFTA RoW ASEAN3 EU12 EU15 NAFTA RoW
HT
EU12 Cons 5.1% 21.7% 58.7% 2.6% 11.9% -0.4% 3.7% 1.1% 0.5% -4.9%
Cap. 31.9% 8.7% 44.6% 5.6% 9.2% 20.0% 5.2% -14.8% -10.0% -0.4%
EU15 Cons 6.7% 7.9% 68.2% 8.4% 8.7% -1.6% 6.7% -4.3% 3.3% -4.1%
Cap. 29.7% 6.1% 42.3% 14.2% 7.7% 10.6% 5.3% -8.5% -3.8% -3.6%
MT
EU12 Cons. 11.3% 21.8% 57.9% 2.9% 6.0% -3.3% 13.1% -8.8% 0.2% -1.3%
Cap. 7.9% 7.6% 72.5% 2.5% 9.4% 1.3% 0.9% -2.3% -0.8% 0.9%
EU15 Cons. 13.6% 8.2% 68.5% 4.6% 5.1% -0.2% 6.1% -8.2% 1.7% 0.6%
Cap. 15.1% 5.2% 63.6% 7.3% 8.7% 4.9% 3.0% -7.5% -0.4% 0.0%
LT
EU12 Cons. 20.8% 15.2% 50.0% 1.6% 12.3% 6.5% 6.1% -12.9% -0.8% 1.1%
Cap. 9.5% 19.6% 56.3% 2.0% 12.6% 7.0% 5.7% -17.3% -0.3% 4.8%
EU15 Cons. 30.9% 7.3% 38.9% 2.9% 19.9% 15.5% 0.2% -12.7% -0.9% -2.1%
Cap. 12.2% 8.0% 61.9% 6.0% 11.9% 6.9% 3.4% -7.9% 0.1% -2.4%
Exports 2007 Change 1994-2007
ASEAN3 EU12 EU15 NAFTA RoW ASEAN3 EU12 EU15 NAFTA RoW
HT EU12 Cons. 0.3% 17.6% 65.4% 1.2% 15.5% -1.3% -
11.8% 38.9% -2.3% -23.4%
Cap. 3.8% 11.0% 59.6% 6.1% 19.5% -3.0% -0.1% 2.3% 1.7% -0.9%
EU15 Cons. 4.3% 5.0% 59.3% 15.4% 16.0% -2.4% 1.3% 0.5% 8.1% -7.6%
Cap. 11.3% 7.0% 51.1% 11.4% 19.2% 1.4% 4.1% -1.0% 1.4% -5.9%
MT EU12 Cons. 2.0% 18.1% 63.2% 3.3% 13.5% 0.5% 5.7% -3.4% 2.4% -5.1%
Cap. 2.6% 15.8% 56.0% 3.5% 22.1% -3.8% 1.1% 10.4% -1.1% -6.6%
EU15 Cons. 4.4% 5.9% 65.0% 10.9% 13.9% -2.5% 3.3% -2.2% 2.6% -1.3%
Cap. 9.1% 10.2% 46.3% 9.1% 25.4% -3.2% 4.9% -0.8% 0.1% -1.0%
LT EU12 Cons. 1.5% 13.4% 69.7% 4.3% 11.1% 0.9% 8.7% -11.2% 0.0% 1.7%
Cap. 1.3% 21.8% 59.2% 2.1% 15.6% -0.5% 4.5% -5.7% 0.8% 0.9%
EU15 Cons. 5.0% 7.5% 62.4% 8.4% 16.8% -1.1% 4.0% -0.1% 0.0% -2.8%
Cap. 5.5% 7.8% 57.4% 8.4% 20.8% -0.9% 2.3% -2.2% 2.5% -1.7%