etihad airways report
TRANSCRIPT
Table of Contents
1.Executive summary……………………………………………………………………………………………..12 Introduction……………………………………………………………………………………………………….23 Control Charts……………………………………………………………………………………………………2
3.1 Variable Control Charts…………………………………………………………………………33.2 Attribute Control Charts……………………………………………………………………….3
4 Flight performance and delays…………………………………………………………………………..45.Measurment focus………………………………………………………………………………………………5
5.1 data collection………………………………………………………………………………………5.2 data description…………………………………………………………………………………..5.3 data analysis…………………………………………………………………………………………
6 s-chart analysis……………………………………………………………………………………………………6.1 x-bar analysis………………………………………………………………………………………..
7. Capability Analysis…………………………………………………………………………………………….8. Recommendations………………………………………………………………………………………………9.Conclusion…………………………………………………………………………………………………………..10.Refrences……………………………………………………………………………………………………………
1.Executive Summary
In this report, data of Etihad airways flight performance and
delays were collected in order to analyze the findings of the
flight performance overall, by calculating it through the Control
charts by X-bar and R since the sample is more than ten, along with
a capability analysis, also mentioned in the report the causes of
flight delays, and how Etihad airways can overcome controllable and
uncontrollable flight delays in future terms.
2.Introduction
Etihad Airways is the national airline of Abu Dhabi, its
considered one of the fastest growing airlines in the region and
history of aviation, by 2010, their fleet of 56 aircrafts closely
operation to more than 1,000 flights per week and serving an
international network of 66 destinations in 43 countries. Eithad
airways have gained international respect during their excellent
performance and many areas, and received multiple awards since 2004,
just last year they received very respectful awards , including,
Airline Of The Year - Aviation Business Awards 2010, World’s Leading
Airline - World Travel Awards (WTA) 2010, Middle East's Leading
Airline - World Travel Awards Middle East 2010, and Best Airline to
the Middle East and Africa - Irish Travel Trade Awards 2010. (Etihad
airways 2011). Passengers numbers have grown over the years, in 2009
passengers number increased to be 6.3 million and the revenue
passenger kilometers reports to have a growth of 15.2%, and their
revenue exceeded to be $2.3 billion dollars in the year 2009.eitihad
airways is committed to provide its guest with the best traveling
experience, so new improved classes and aircrafts are going o be
available at the end of 2011 . (Etihad airways 2011).
3.Control Charts
Control charts are basically a graphical device used as a
statistical method to detect a problem, and to measure when a
process goes out of control in order to correct the malfunction and
restore the control of the current process (D.Montgomery 2009).
Actually we can determine if a process is under control when the
points on the control chart fluctuate randomly between the control
limits. The control chart must contain a centerline, an upper
control limit and a lower control limit, any point that sets out of
the upper control requires the company or the individual to further
investigate a corrective action to find and eliminate assignable
causes. If all points fall between the control limits, then the
process is under control and no actions are required. There are two
types of control charts, the variable control charts and the
attribute control charts. (D.Montgomery 2009).
3.1Variable Control ChartIt is a quantitative approach to measure variable data in
terms of its quality features, that is showcased by numbers such
as, time , length , temperature etc. the variable control charts
consists of : (D.Montgomery 2009)
x-bar and R-charts
x-bar and s-charts
Median and R chart
Charts for individuals (x-charts) & MR chart
3.2Attribute control chartIt is a qualitative approach used to measure product
distinctiveness through separate answers, such as yes/no, good/bad,
etc. The Attribute Control Chart consists of: (D.Montgomery 2009)
For “defectives” (p-chart, np-chart)
For “defects” (c-chart, u-chart)
Figure.1- Chart Below Showcases the Types of Variable Attribute
Data and its forms
4. Flight performance and delays
The major quality issue that would be discussed in this case
is the flight performance and the number of delays a passenger may
encounter. The major complain any airline can encounter is flight
delays, it could have many reasons , like weather ,flight
traffic , human error , or environmental issues that most un
controllable and un predictable. Flight delays directly affects
customers to the level of importance to them in terms of
punctuality, so it would affect the level of customers satisfaction
and also may result in not using the same airline again for one
delay encounter, and it wont be very beneficial to the company it
self, since their aim is satisfy their customers and achieve
customer loyalty and at the same time achieve a competitive
advantage. Flight delays can be separate in some parts, small
delays, fair delays , and major delays which means 1 hour or more,
which is totally in convenient if the passenger have a business
meeting , and from a strategic point of view, the aim of attracting
customer from the existing customers list is more affordable and
efficient, then creating marketing campaigns to gain new customers
attention.(RITA 2011)
Flight delays are extremely costly; the airline may lose their
customers for causing them to be unsatisfied with the service,
according to the joint economic committee that the domestic flight
delays can cause the airline industry and passengers 40.7 billion
dollars (2007) which is a very huge number , so the airline should
look at the causes of these delays and look for possible solutions
in order to control it as much as possible. As mentioned earlier ,
the major causes of delays are the weather , environmental factors,
maintenance, operations , and flight traffic, although most of the
are uncontrollable like the weather , or environmental political
encounters that force the airport to stop its operations , the
company should look at human error before hand , in order to
measure it and analyze solutions to it. Defiantly flight delays
have a negative impact for both the passenger and the airline it
self , and it will result in dissatisfaction , customer turn over ,
and major costs to both sides.( joint economic committee,2007).
Although its major problem to the airline industry, there is many
ways to overcome this problem, in this quantitative research paper
I will be showcasing the nature of delays in etihad airways and
look at the factors that may result in order to give a proper
solution.
5. Measurement focus
The measurement focus of this quantitative research study was
to study , analyze and track the flight delays of Etihad airways ,
Using the Variable Control charts since it consists of quantitative
data, to showcase the areas that is possibly out of control , and
the areas which are under control and find solutions to the
problems. And most importantly to identify if the process if in out
of control or in control.
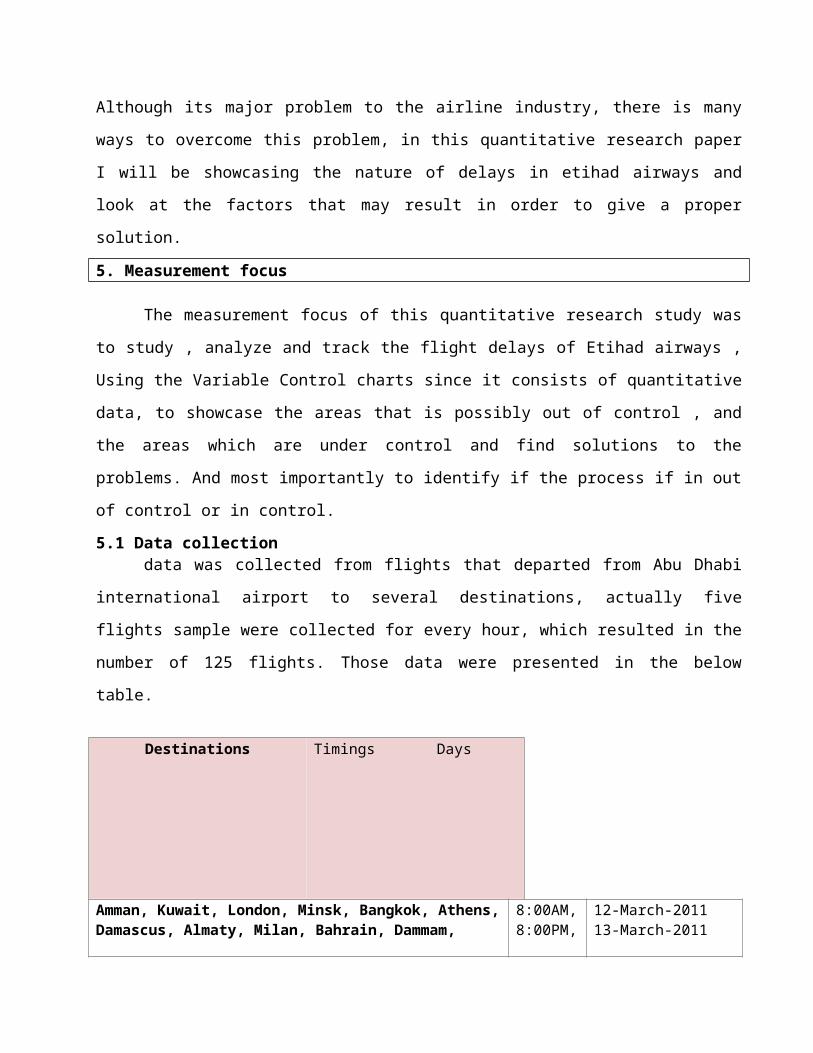
5.1 Data collection data was collected from flights that departed from Abu Dhabi
international airport to several destinations, actually five
flights sample were collected for every hour, which resulted in the
number of 125 flights. Those data were presented in the below
table.
Destinations Timings Days
Amman, Kuwait, London, Minsk, Bangkok, Athens,Damascus, Almaty, Milan, Bahrain, Dammam,
8:00AM,8:00PM,
12-March-201113-March-2011
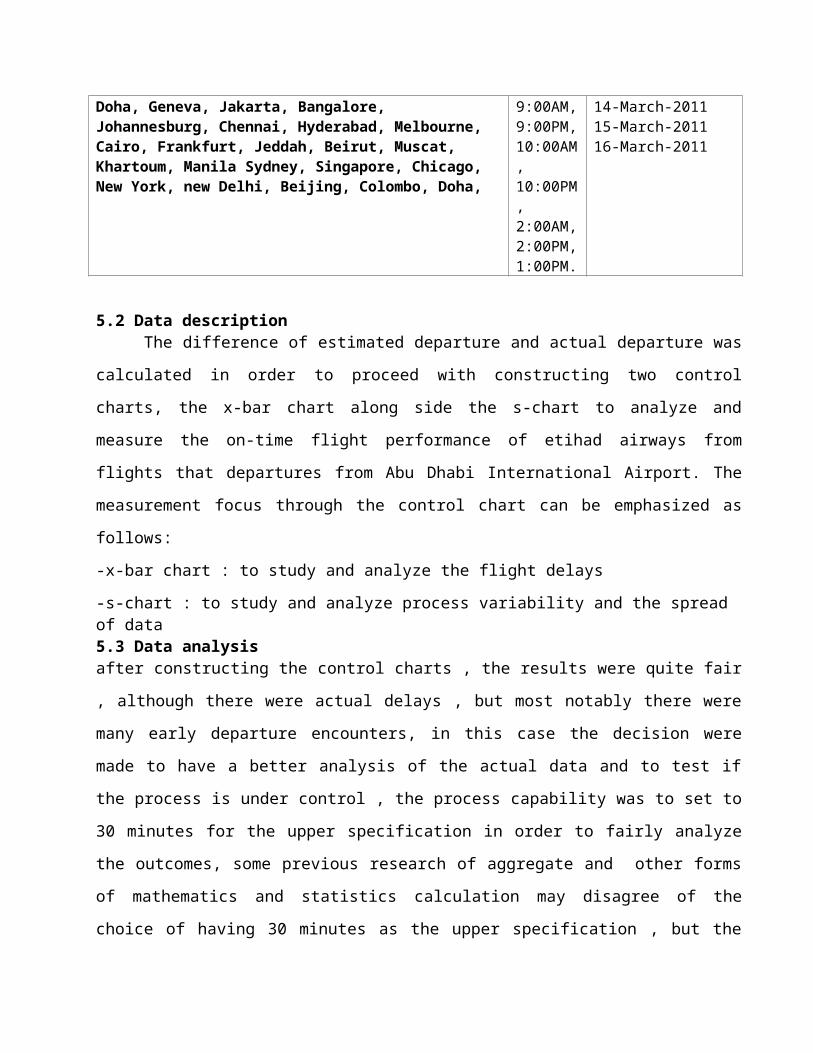
Doha, Geneva, Jakarta, Bangalore, Johannesburg, Chennai, Hyderabad, Melbourne, Cairo, Frankfurt, Jeddah, Beirut, Muscat, Khartoum, Manila Sydney, Singapore, Chicago, New York, new Delhi, Beijing, Colombo, Doha,
9:00AM,9:00PM,10:00AM, 10:00PM, 2:00AM,2:00PM,1:00PM.
14-March-201115-March-201116-March-2011
5.2 Data descriptionThe difference of estimated departure and actual departure was
calculated in order to proceed with constructing two control
charts, the x-bar chart along side the s-chart to analyze and
measure the on-time flight performance of etihad airways from
flights that departures from Abu Dhabi International Airport. The
measurement focus through the control chart can be emphasized as
follows:
-x-bar chart : to study and analyze the flight delays
-s-chart : to study and analyze process variability and the spread of data5.3 Data analysisafter constructing the control charts , the results were quite fair
, although there were actual delays , but most notably there were
many early departure encounters, in this case the decision were
made to have a better analysis of the actual data and to test if
the process is under control , the process capability was to set to
30 minutes for the upper specification in order to fairly analyze
the outcomes, some previous research of aggregate and other forms
of mathematics and statistics calculation may disagree of the
choice of having 30 minutes as the upper specification , but the
fact is its very relevant in this case since etihad airways have a
very respectful early departure timings. And we want to maintain
the level of satisfaction to all customers, so the 30 minutes bear
is very reasonable to all customer segments of passengers.
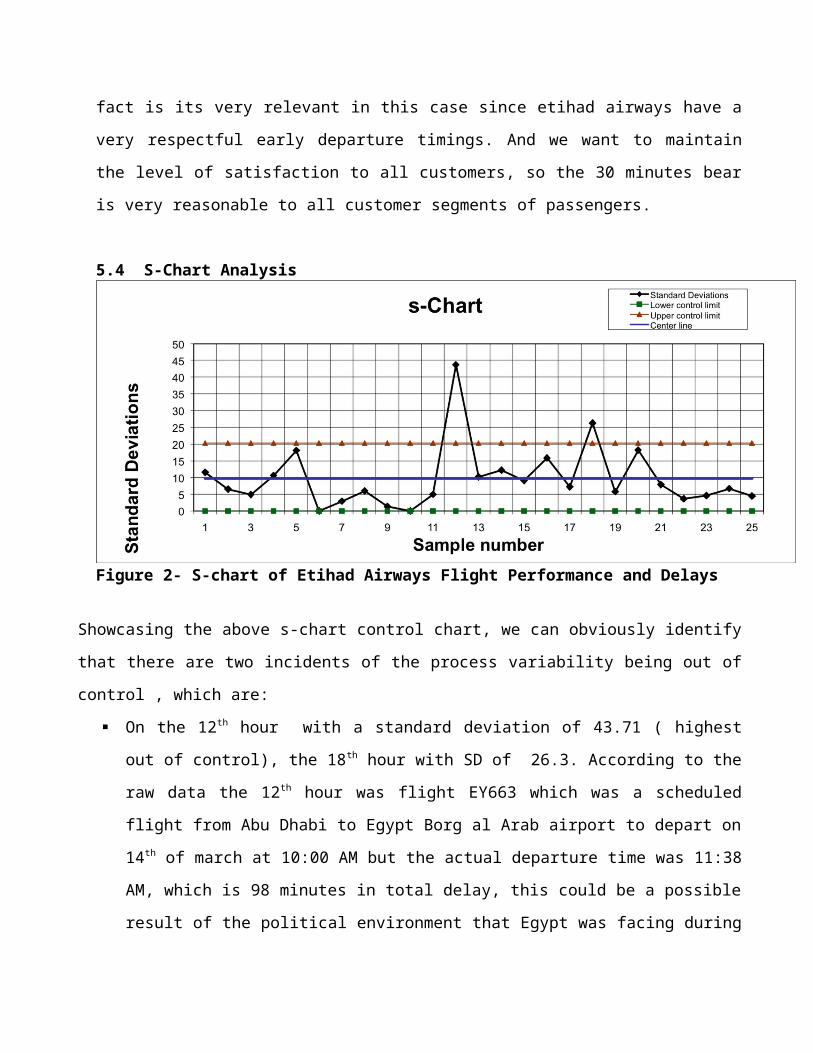
5.4 S-Chart Analysis
Figure 2- S-chart of Etihad Airways Flight Performance and Delays
Showcasing the above s-chart control chart, we can obviously identify
that there are two incidents of the process variability being out of
control , which are:
On the 12th hour with a standard deviation of 43.71 ( highest
out of control), the 18th hour with SD of 26.3. According to the
raw data the 12th hour was flight EY663 which was a scheduled
flight from Abu Dhabi to Egypt Borg al Arab airport to depart on
14th of march at 10:00 AM but the actual departure time was 11:38
AM, which is 98 minutes in total delay, this could be a possible
result of the political environment that Egypt was facing during
that time that required etihad airways to have a long unusual
delay which is considered as un controllable factor.
On the 18 hour, flight EY472 was scheduled to departure from Abu
Dhabi to Jakarta on the 15th of march at 2:45 AM, but it actual
departure was 3:32 AM, which it was delayed 47 minutes in total,
there is no possible reason for this delay and etihad airways
didn’t provide any reasons for that matter, and its defiantly
not a weather cause, since it was clear and sunny the exact day
in Abu Dhabi.
According to the S-control chart the lower control limit is SD 0, the
center line is SD 9.72, and the upper control limit is SD 20.32,
going back to flight EY663 , its SD is 23.93 above the upper control
limit, which is very high considering the other variables which were
very much under control, unfortunately etihad airways don’t have much
on their hands to provide a solution in terms of weather or political
problems that some countries face, although customers can understand
the cause , but it does cost them and the airline a lot by facing
unpredictable delays.
In terms of flight EY472, the SD was higher by 5.98 from the upper
control limit, which is very low and quiet reasonable , although no
reasons can be explain the cause of the delay.
Overall , the standard deviation for the rest of the variables were
very much under control, and 8% was out of control, 24% was above the
centerline and 68% was under the centerline, which means that 92% of
the flights were on-time or even earlier , this defiantly indicated
that Etihad airways manages their flights precisely on time and pay
much attention on maintaining flights performance and operations on
track to avoid delays cost and customer dissatisfaction.
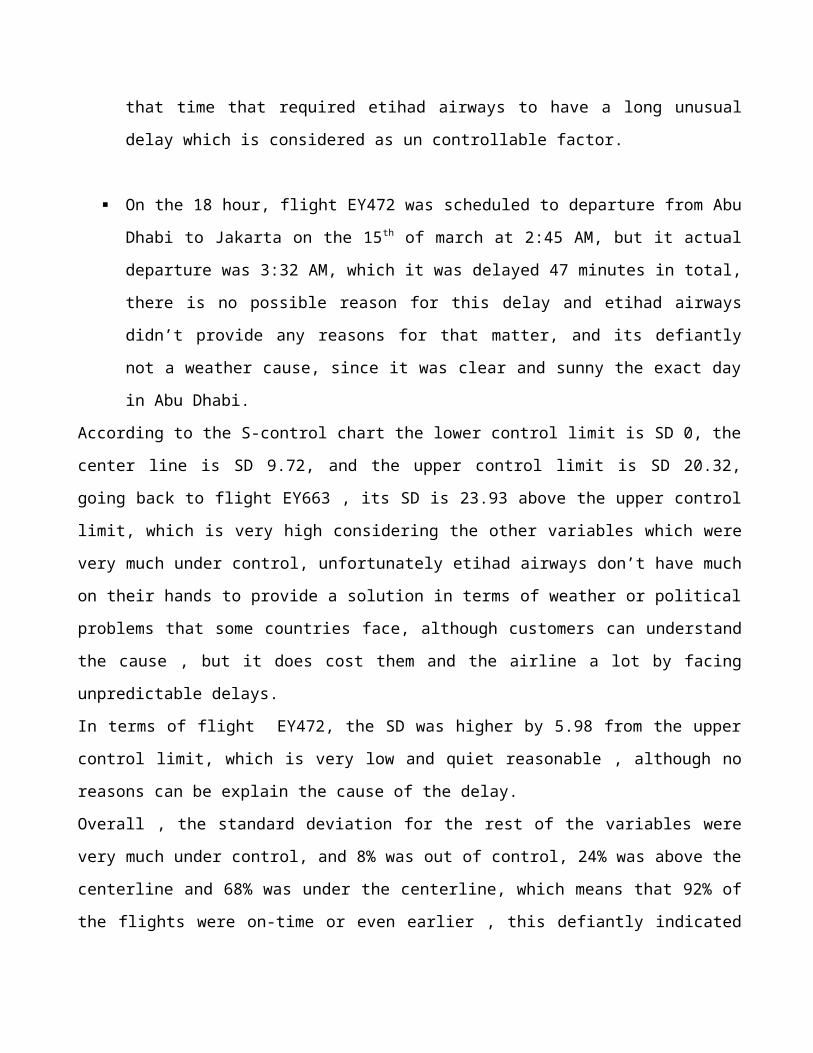
Figure 3- S-chart Summary of in control and out of control flight
performance percentages
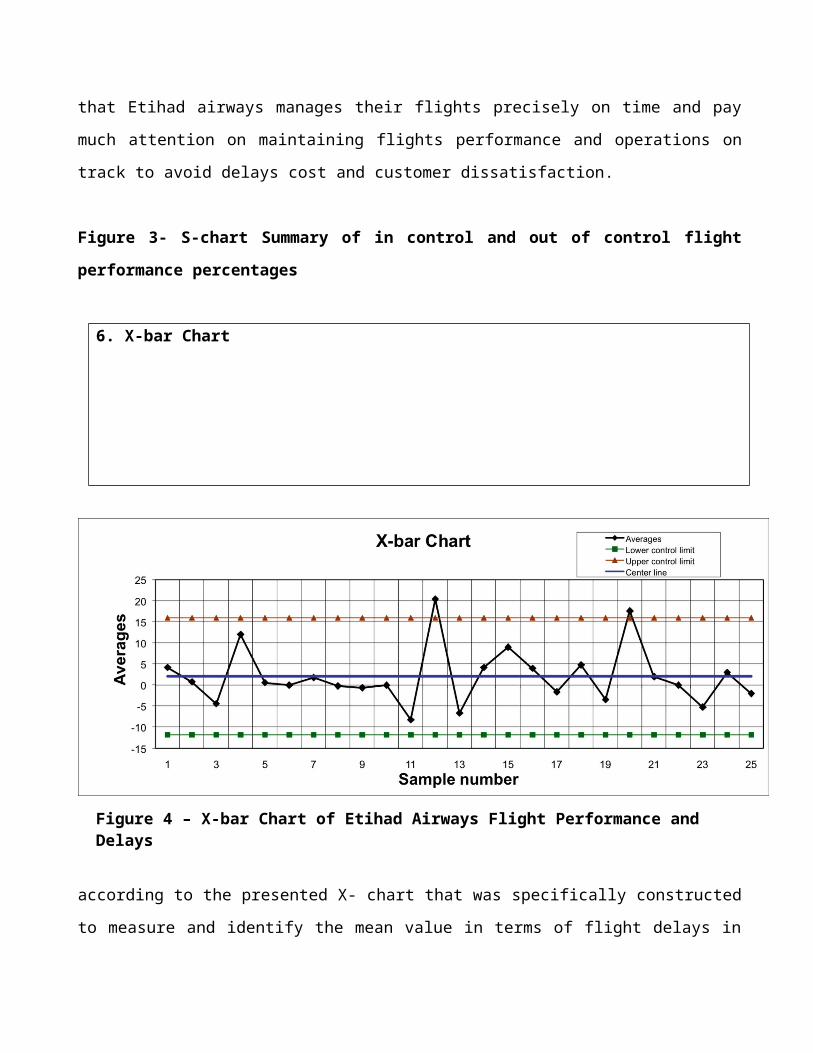
6. X-bar Chart
Figure 4 – X-bar Chart of Etihad Airways Flight Performance and Delays
according to the presented X- chart that was specifically constructed
to measure and identify the mean value in terms of flight delays in
Etihad Airways, there was two out of control variables , first one
was hour 12 (mean value of 20) , which was flight EY663 , that was
delayed for 98 minutes,
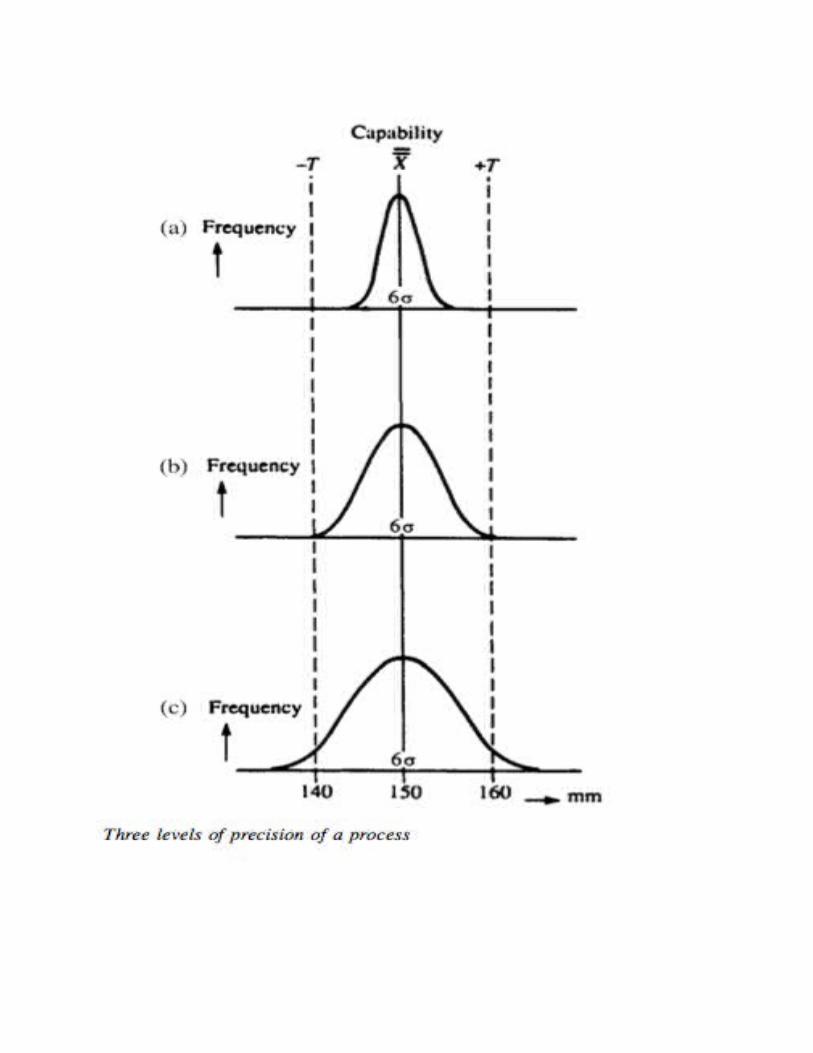
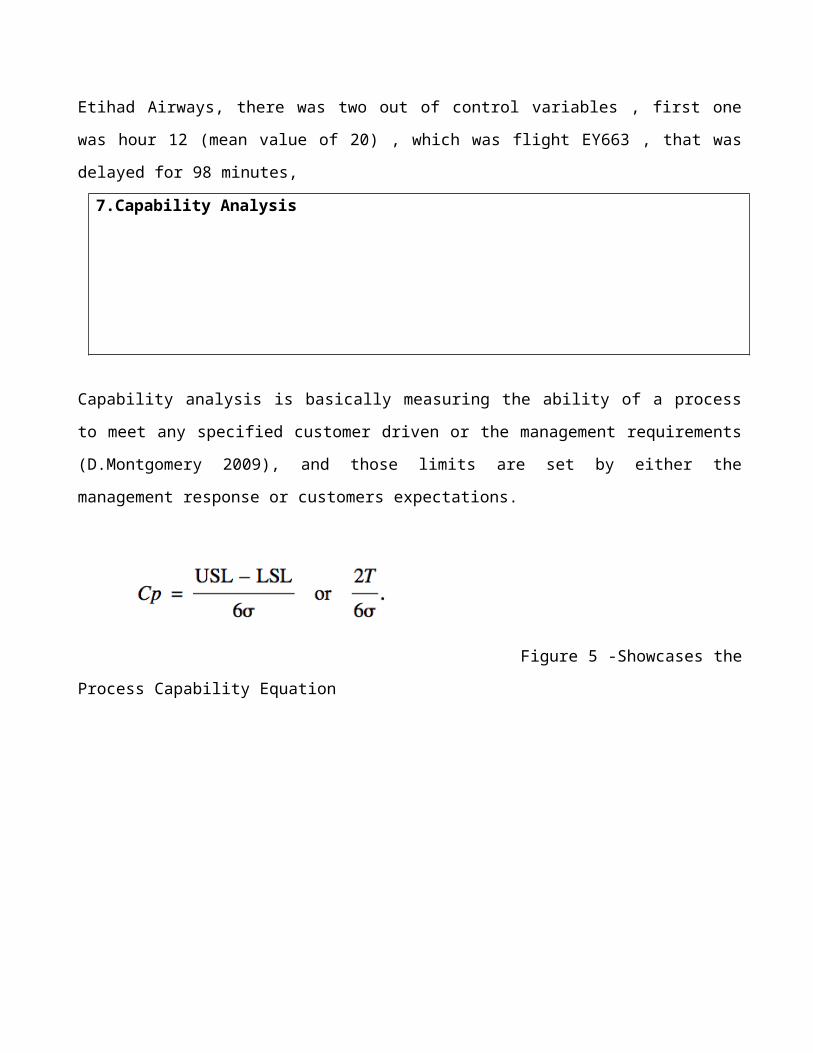
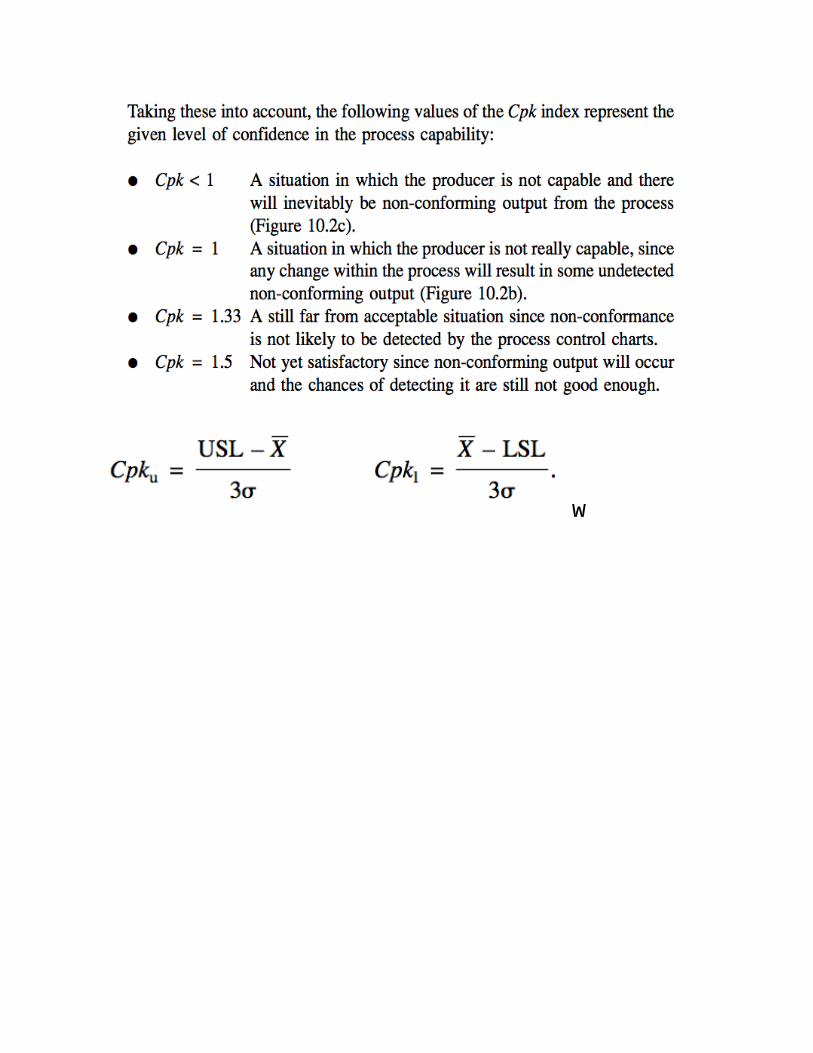
7.Capability Analysis
Capability analysis is basically measuring the ability of a process
to meet any specified customer driven or the management requirements
(D.Montgomery 2009), and those limits are set by either the
management response or customers expectations.
Figure 5 -Showcases the
Process Capability Equation
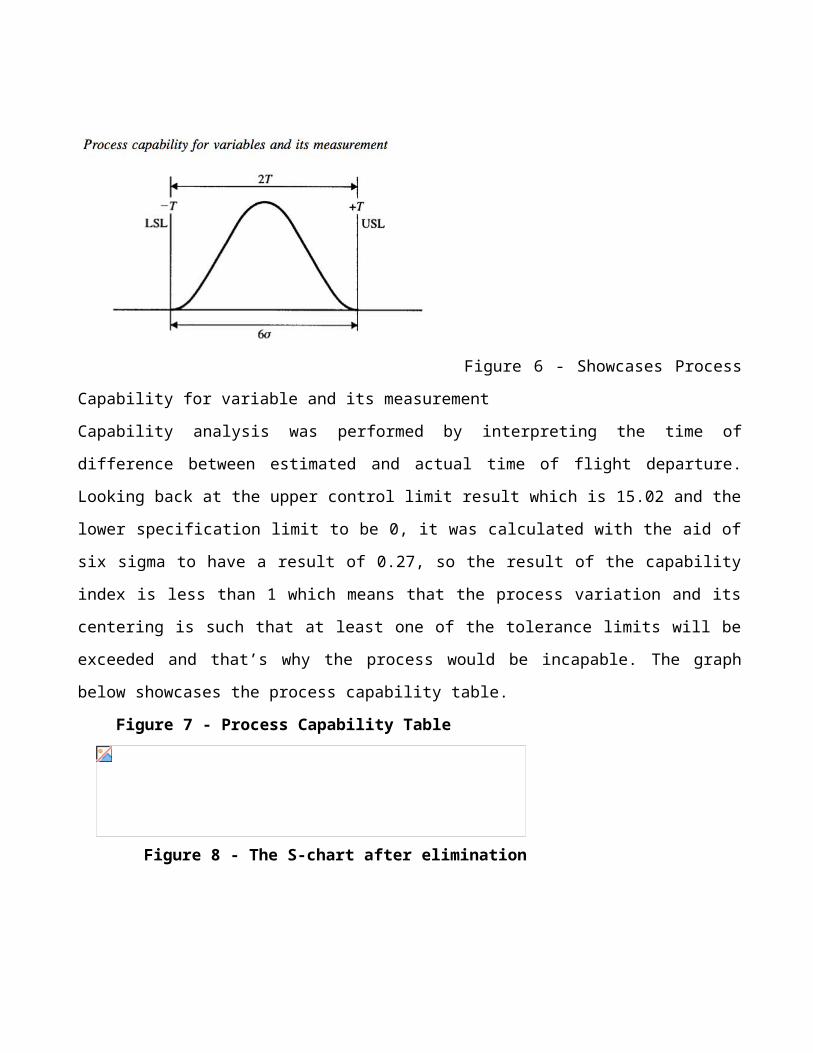
Figure 6 - Showcases Process
Capability for variable and its measurement
Capability analysis was performed by interpreting the time of
difference between estimated and actual time of flight departure.
Looking back at the upper control limit result which is 15.02 and the
lower specification limit to be 0, it was calculated with the aid of
six sigma to have a result of 0.27, so the result of the capability
index is less than 1 which means that the process variation and its
centering is such that at least one of the tolerance limits will be
exceeded and that’s why the process would be incapable. The graph
below showcases the process capability table.
Figure 7 - Process Capability Table
Figure 8 - The S-chart after elimination
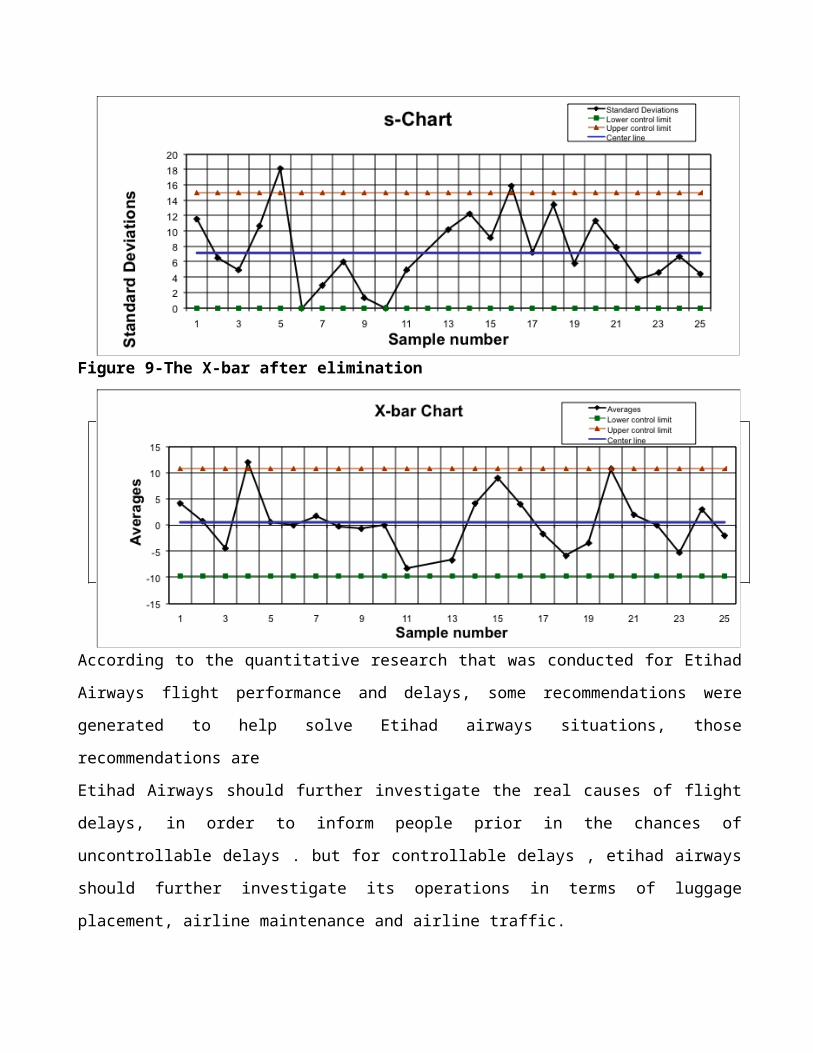
Figure 9-The X-bar after elimination
8.Recommendations
According to the quantitative research that was conducted for Etihad
Airways flight performance and delays, some recommendations were
generated to help solve Etihad airways situations, those
recommendations are
Etihad Airways should further investigate the real causes of flight
delays, in order to inform people prior in the chances of
uncontrollable delays . but for controllable delays , etihad airways
should further investigate its operations in terms of luggage
placement, airline maintenance and airline traffic.
Its crucial for passengers to be informed about the possible delays
and the reasons for that , since each passenger is the priority for
the airline to satisfy and eliminated discomfort or anger, and insure
their passengers will respect etihad airlines honestly and
professionalism in order to choose it again for future flight trips
9. Conclusion
Overall, Etihad Airways really declared it self as the national
airline for the UAE that is headquartering in Abu Dhabi , and after
showcasing the results of the research , Etihad airways had initially
an impressive flight performance in terms of having earlier flights,
but unfortunately it did have some major delays in two incidents, one
was uncontrollable and the other we had no further information about,
and it didn’t stand the capability analysis. Which requires Etihad
airways to manage their timings more efficiently to avoid delays
which will result in customer dissatisfaction and operational costs.
10. Reference
Douglas C. Montgomery 2009, Statistical Quality Control A
Modern Introduction, 6h Edition, Wiley
Etihad Airways (2011), Our History, Available [Online] :
http://www.etihadairways.com/sites/Etihad/ae/en/aboutetihad/et
ihadstory/Pages/EtihadHistory.aspx , Retrieved on 9th April
2011.
Etihad Airways (2011), Our History, Available [Online] :
http://www.etihadairways.com/sites/Etihad/ae/en/aboutetihad/Pa
ges/OurAwards.aspx
K,Sim, S,Song (2010) Service quality, service recovery, and
financial performance: An analysis of the US airline
industry,Available [Online] :
http://dx.doi.org.ezproxy.uow.edu.au/10.1108/S1474-
7871(2010)0000018005
RITA (2011), Understanding the Reporting of Causes of Flight
Delays and Cancellations, Available [Online] :
http://www.bts.gov/help/aviation/html/understanding.html
V, Bhat, International Journal of Quality & Reliability
Management (1995), A multivariate analysis of airline flight
delays, Available [Online] :
http://dx.doi.org.ezproxy.uow.edu.au/10.1108/02656719510080613
Nelson, Loyd S. (1985), "Interpreting Shewhart X Control
Charts", Journal of Quality Technology, 17:114-16
Steel, R. G. D. and J. H. Torrie (1980), Principles and
Procedures of Statistics. New York: McGraw-Hill.
J.Oakland, Statistical process control , 5th edition (2003),
Butterworth & Heinmann
Duncan, A.J. (1986) Quality Control and Industrial Statistics,
5th Edn, Irwin, Homewood IL, USA.
Grant, E.L. and Leavenworth, R.S. (1996) Statistical Quality
Control, 7th Edn, McGraw-Hill, New York, USA.
Wheeler, D.J. and Chambers, D.S. (1992) Understanding
Statistical Process Control, 2nd Edn,SPC Press, Knoxville TN,
USA.
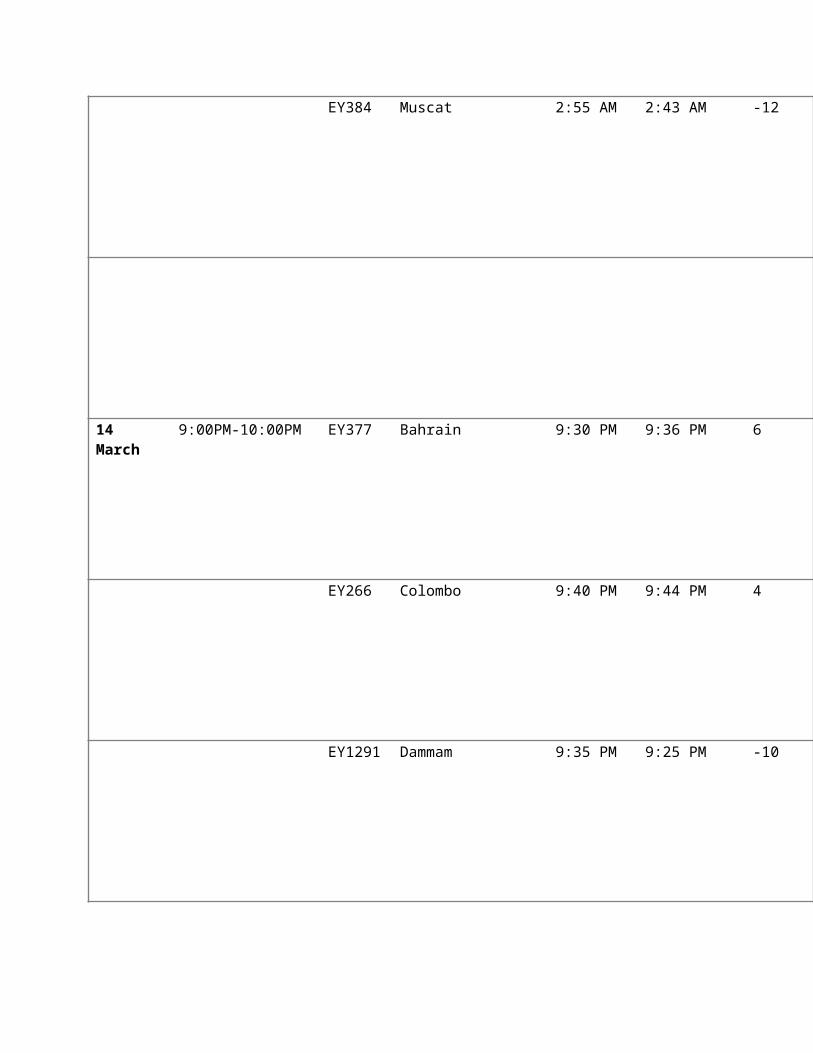
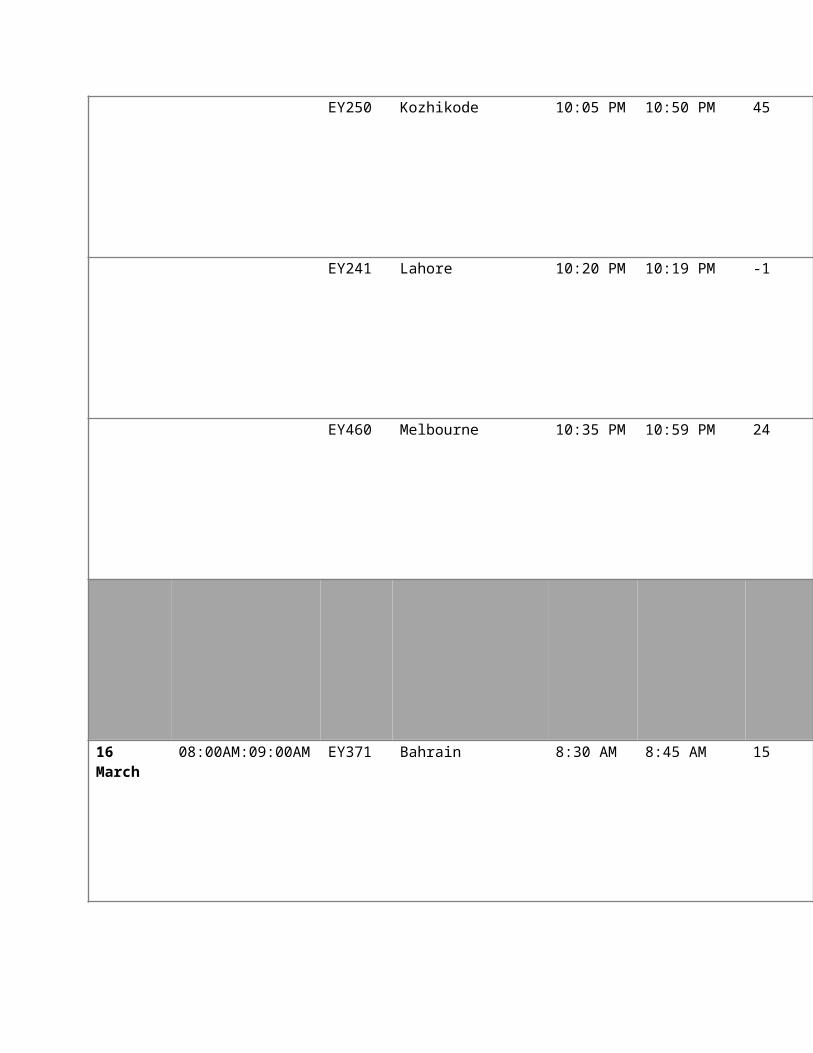
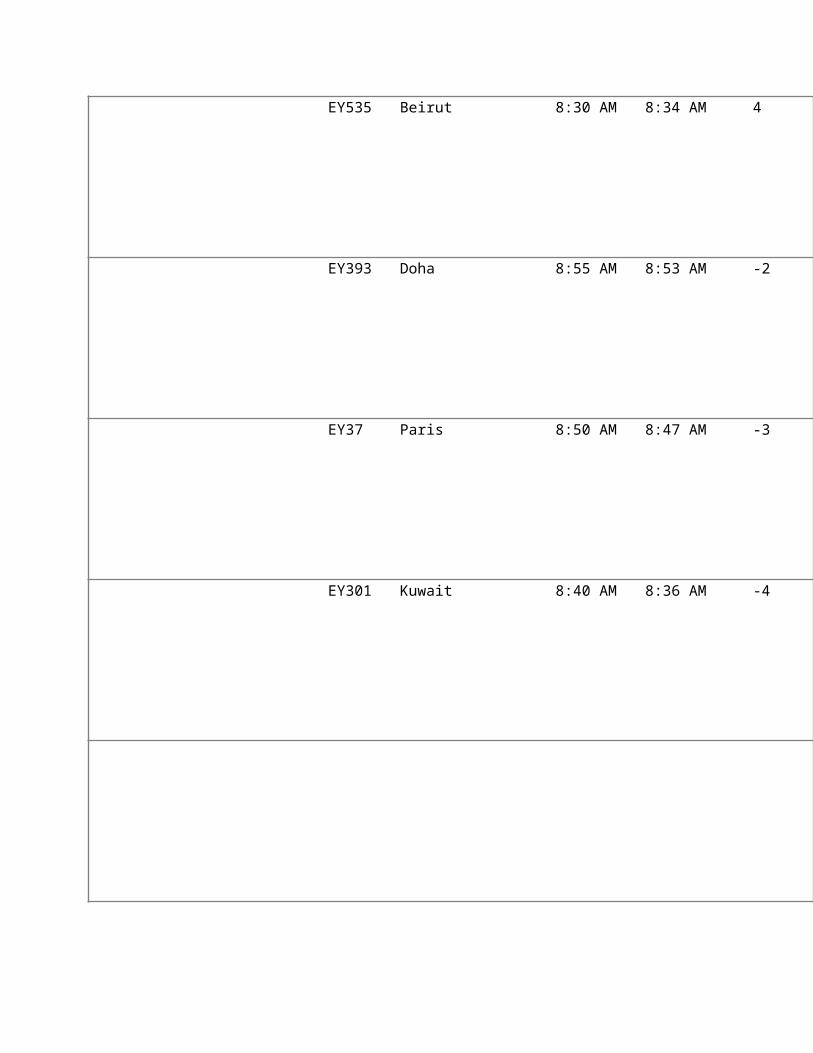
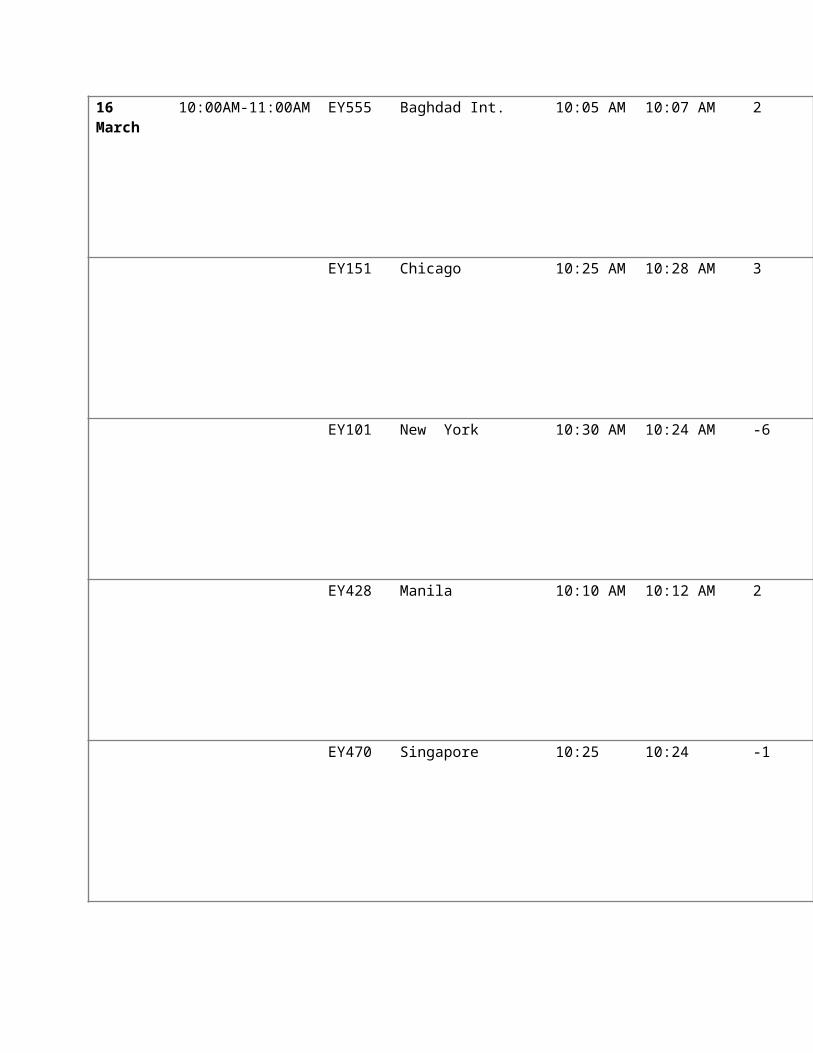
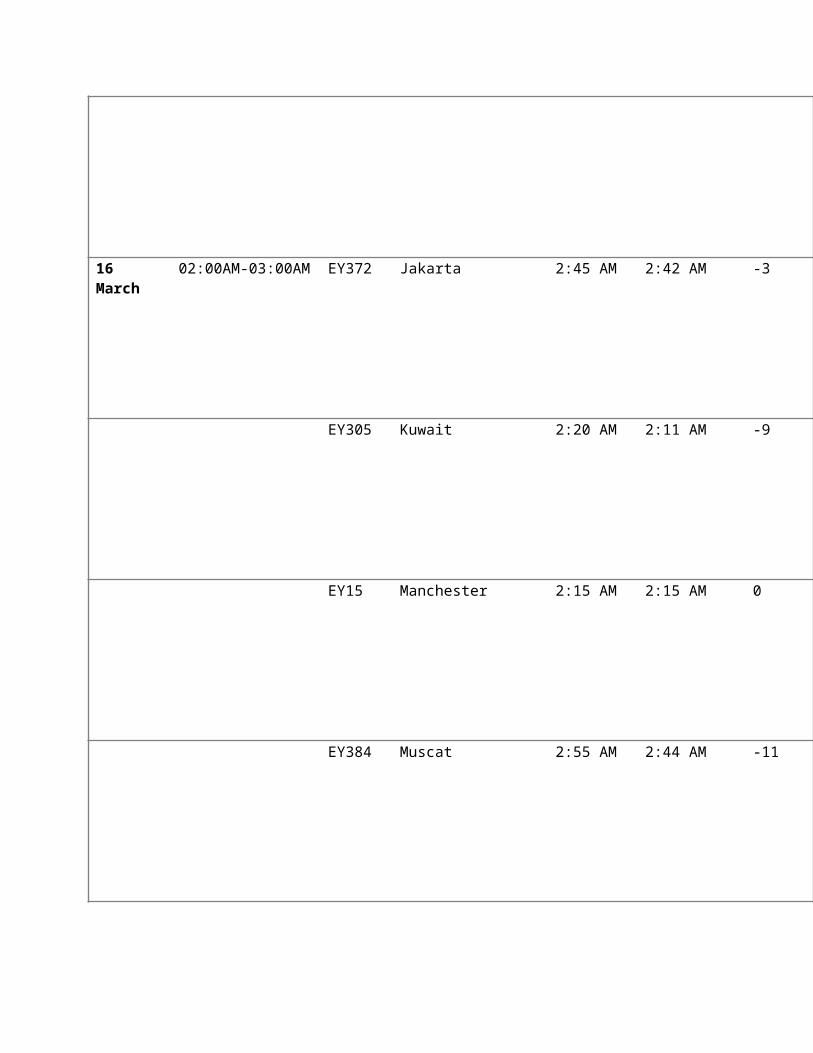
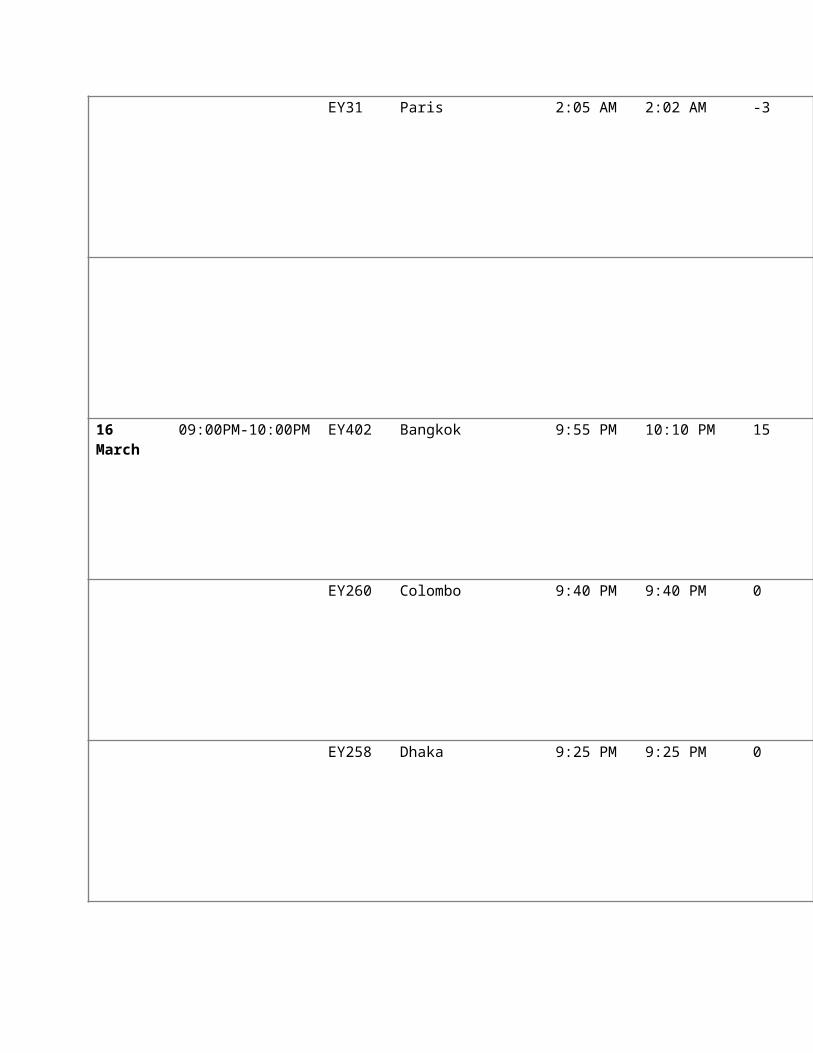
Appendix
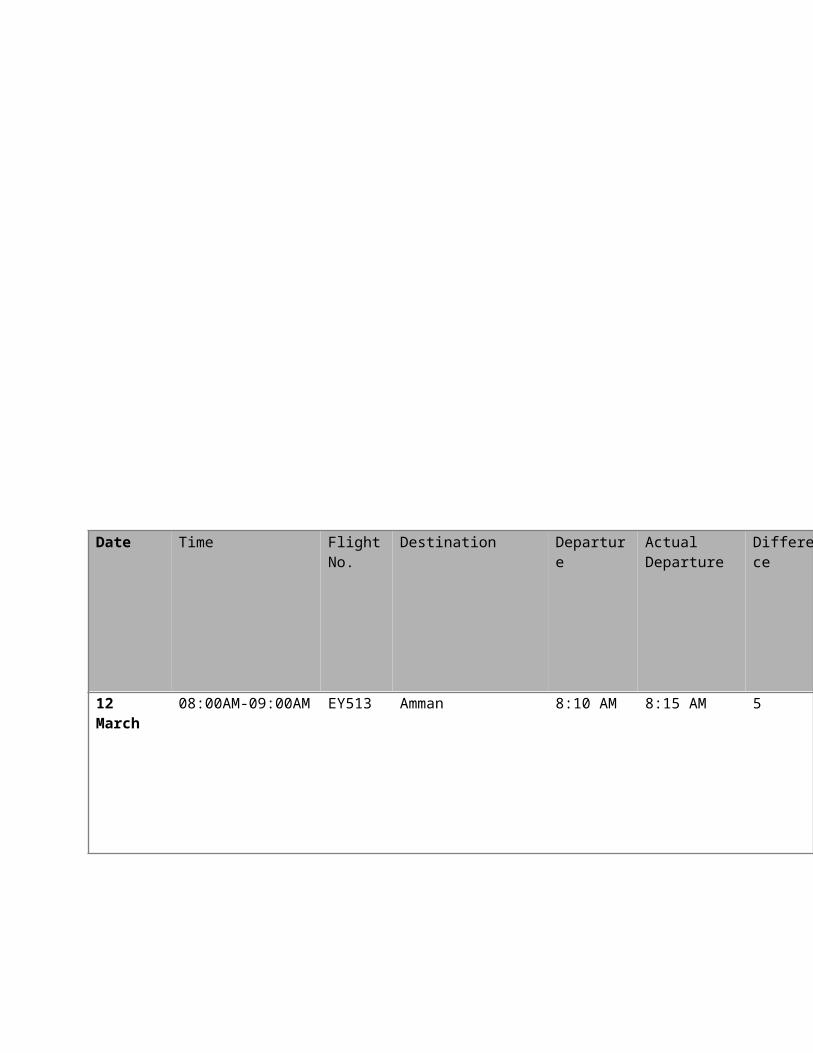
Date Time FlightNo.
Destination Departure
Actual Departure
Difference
12 March
08:00AM-09:00AM EY513 Amman 8:10 AM 8:15 AM 5
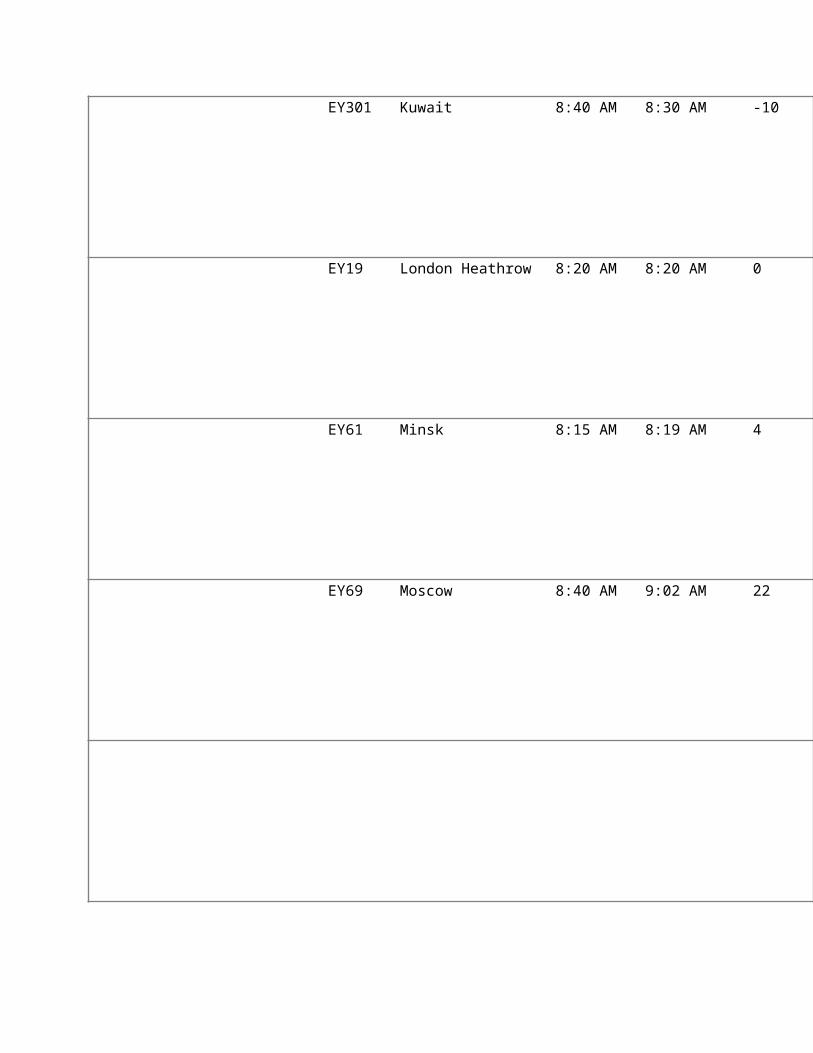
EY301 Kuwait 8:40 AM 8:30 AM -10
EY19 London Heathrow 8:20 AM 8:20 AM 0
EY61 Minsk 8:15 AM 8:19 AM 4
EY69 Moscow 8:40 AM 9:02 AM 22
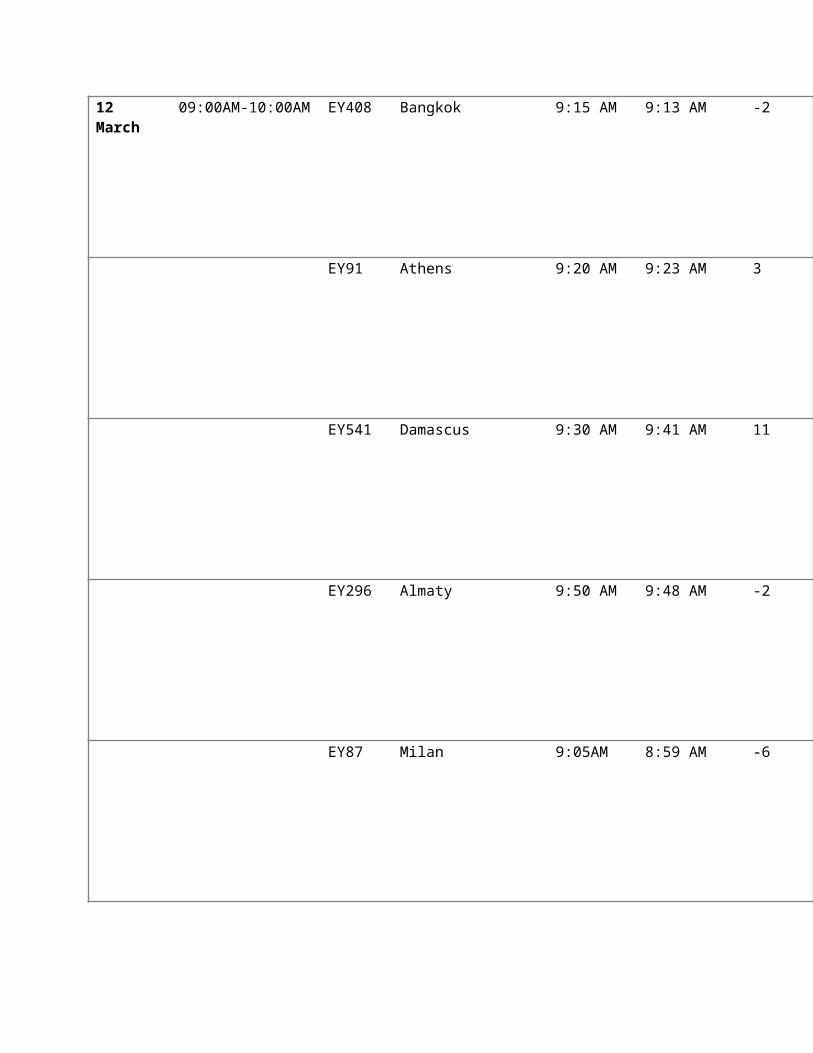
12 March
09:00AM-10:00AM EY408 Bangkok 9:15 AM 9:13 AM -2
EY91 Athens 9:20 AM 9:23 AM 3
EY541 Damascus 9:30 AM 9:41 AM 11
EY296 Almaty 9:50 AM 9:48 AM -2
EY87 Milan 9:05AM 8:59 AM -6
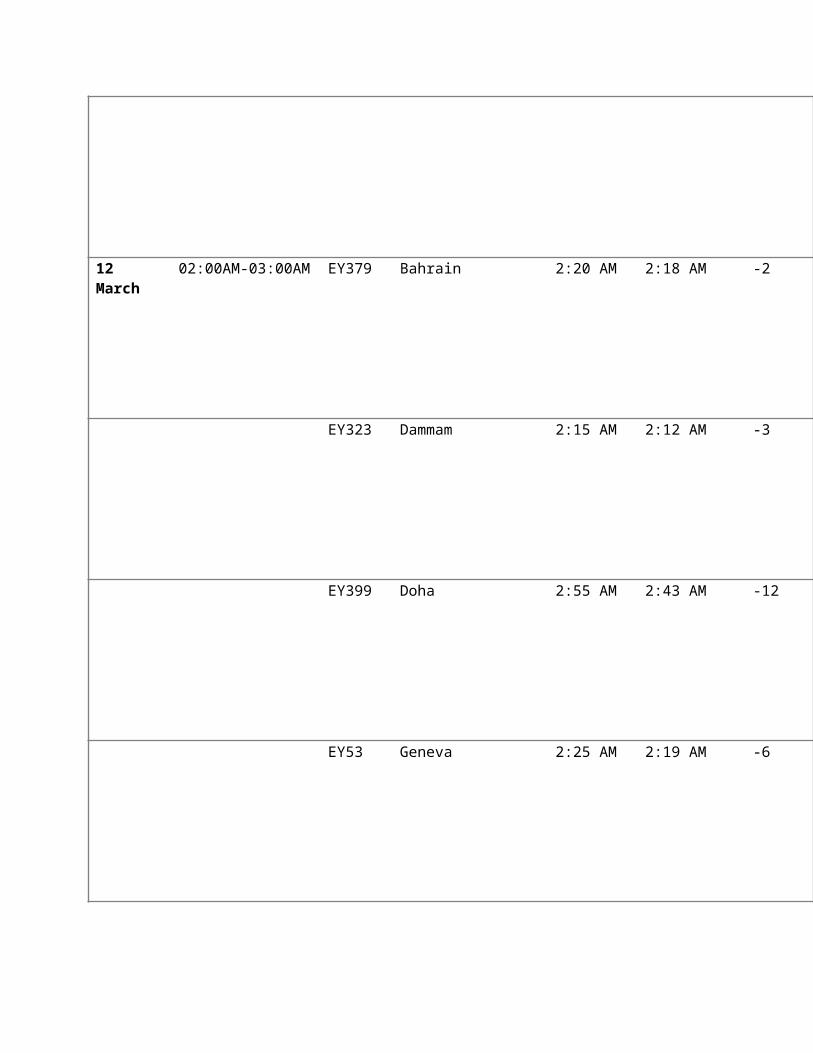
12 March
02:00AM-03:00AM EY379 Bahrain 2:20 AM 2:18 AM -2
EY323 Dammam 2:15 AM 2:12 AM -3
EY399 Doha 2:55 AM 2:43 AM -12
EY53 Geneva 2:25 AM 2:19 AM -6
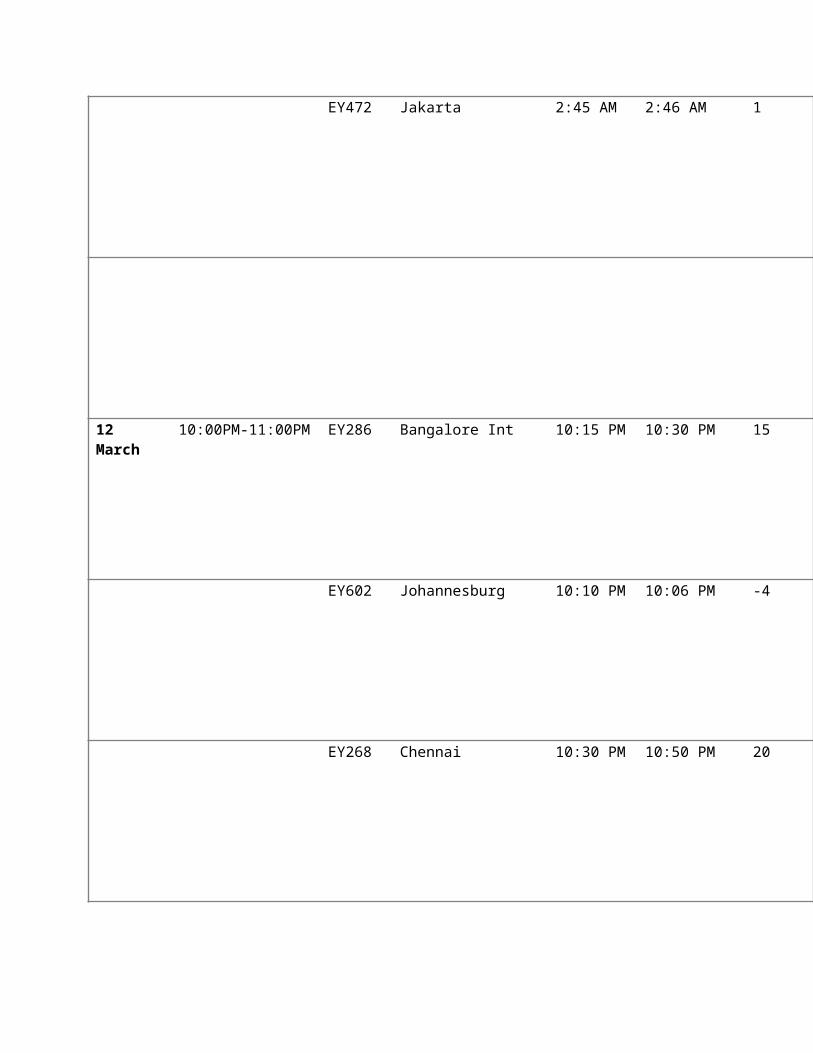
EY472 Jakarta 2:45 AM 2:46 AM 1
12 March
10:00PM-11:00PM EY286 Bangalore Int 10:15 PM 10:30 PM 15
EY602 Johannesburg 10:10 PM 10:06 PM -4
EY268 Chennai 10:30 PM 10:50 PM 20
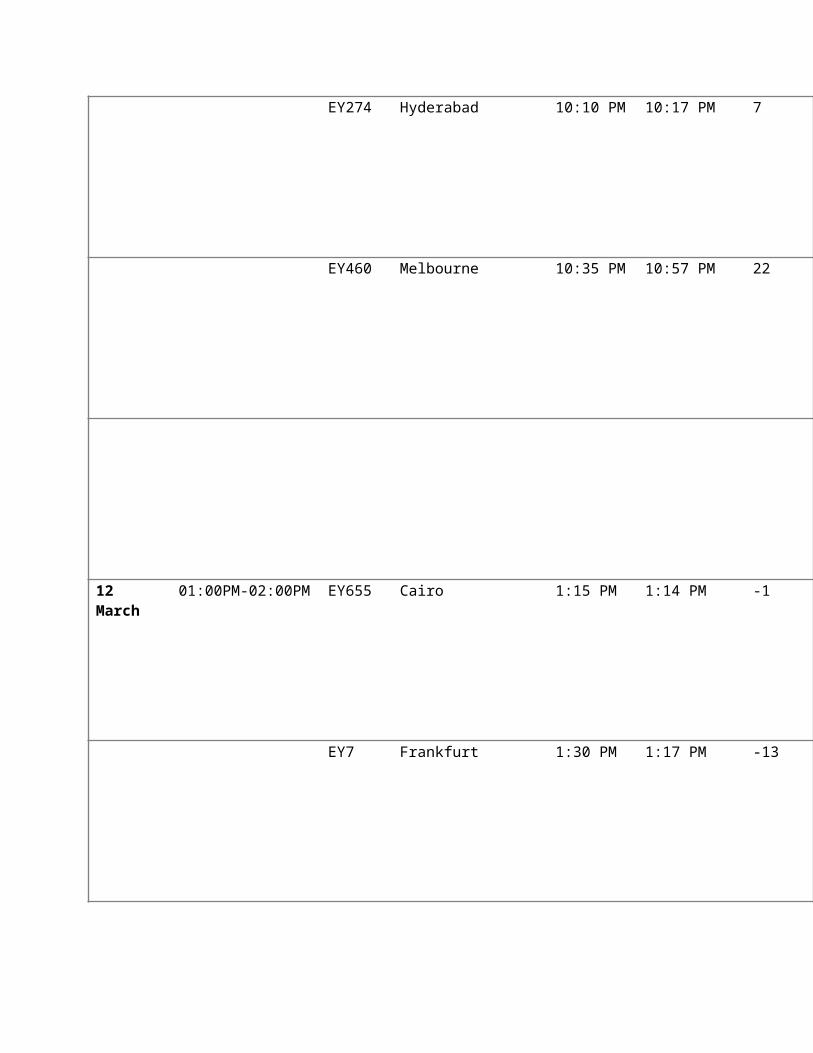
EY274 Hyderabad 10:10 PM 10:17 PM 7
EY460 Melbourne 10:35 PM 10:57 PM 22
12 March
01:00PM-02:00PM EY655 Cairo 1:15 PM 1:14 PM -1
EY7 Frankfurt 1:30 PM 1:17 PM -13
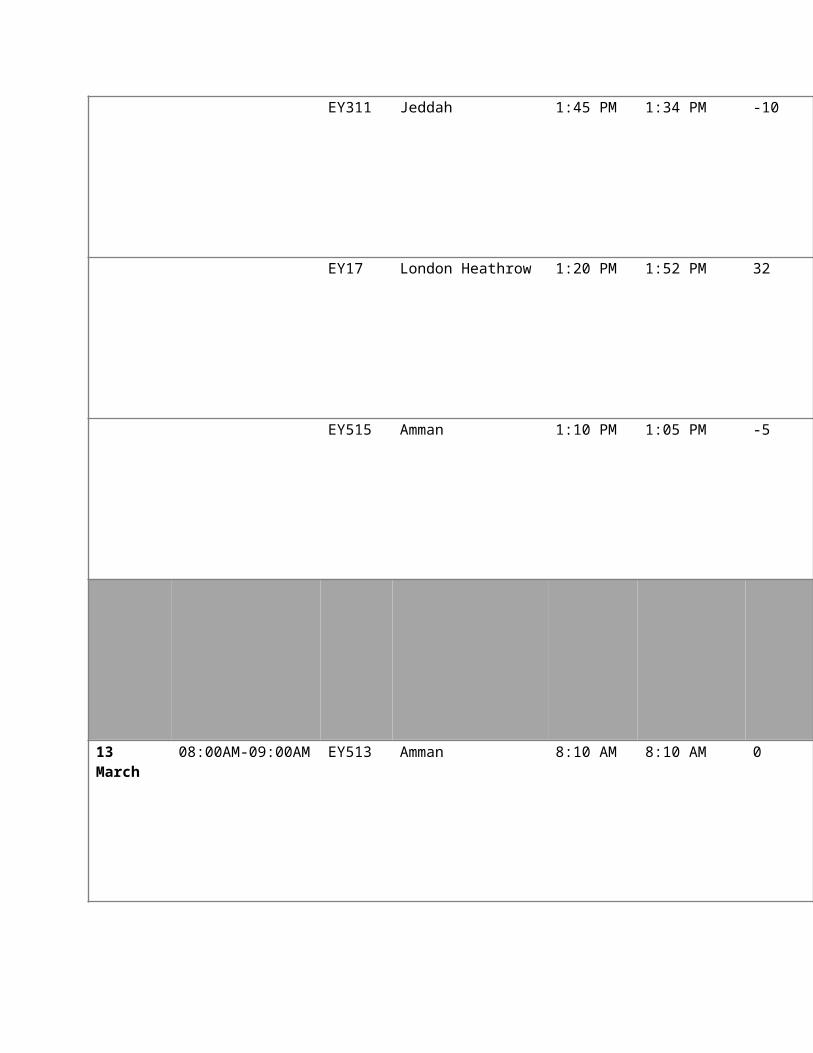
EY311 Jeddah 1:45 PM 1:34 PM -10
EY17 London Heathrow 1:20 PM 1:52 PM 32
EY515 Amman 1:10 PM 1:05 PM -5
13 March
08:00AM-09:00AM EY513 Amman 8:10 AM 8:10 AM 0
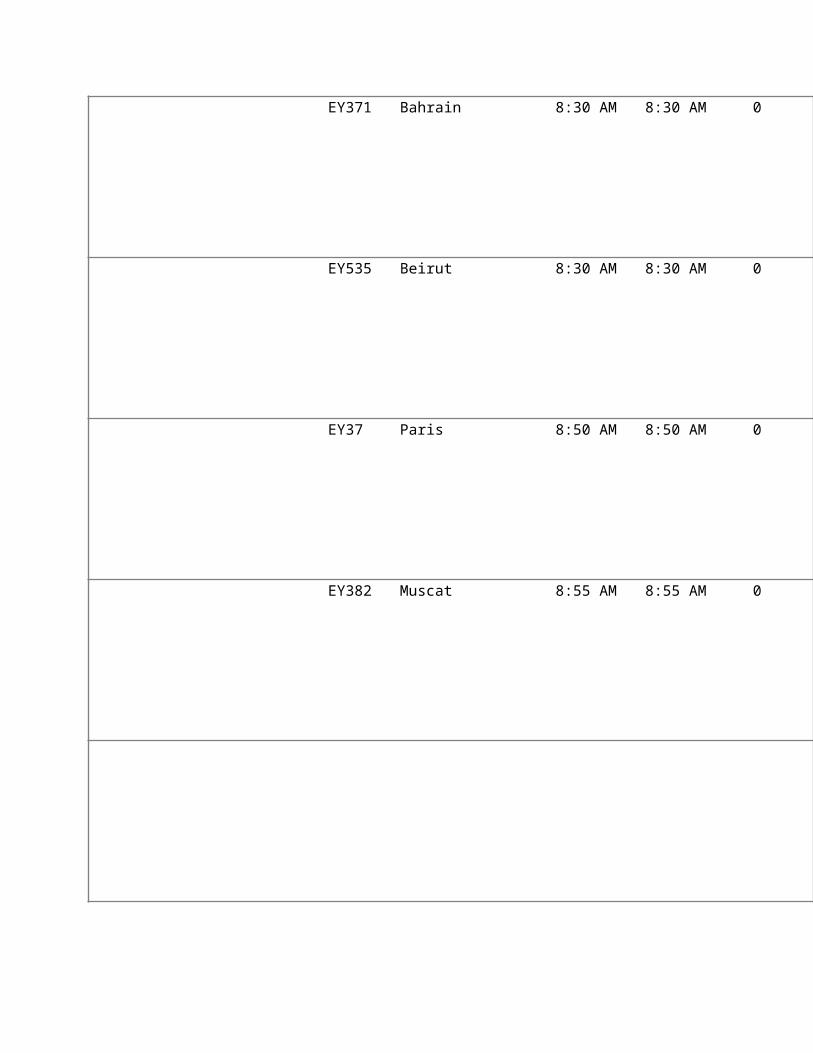
EY371 Bahrain 8:30 AM 8:30 AM 0
EY535 Beirut 8:30 AM 8:30 AM 0
EY37 Paris 8:50 AM 8:50 AM 0
EY382 Muscat 8:55 AM 8:55 AM 0
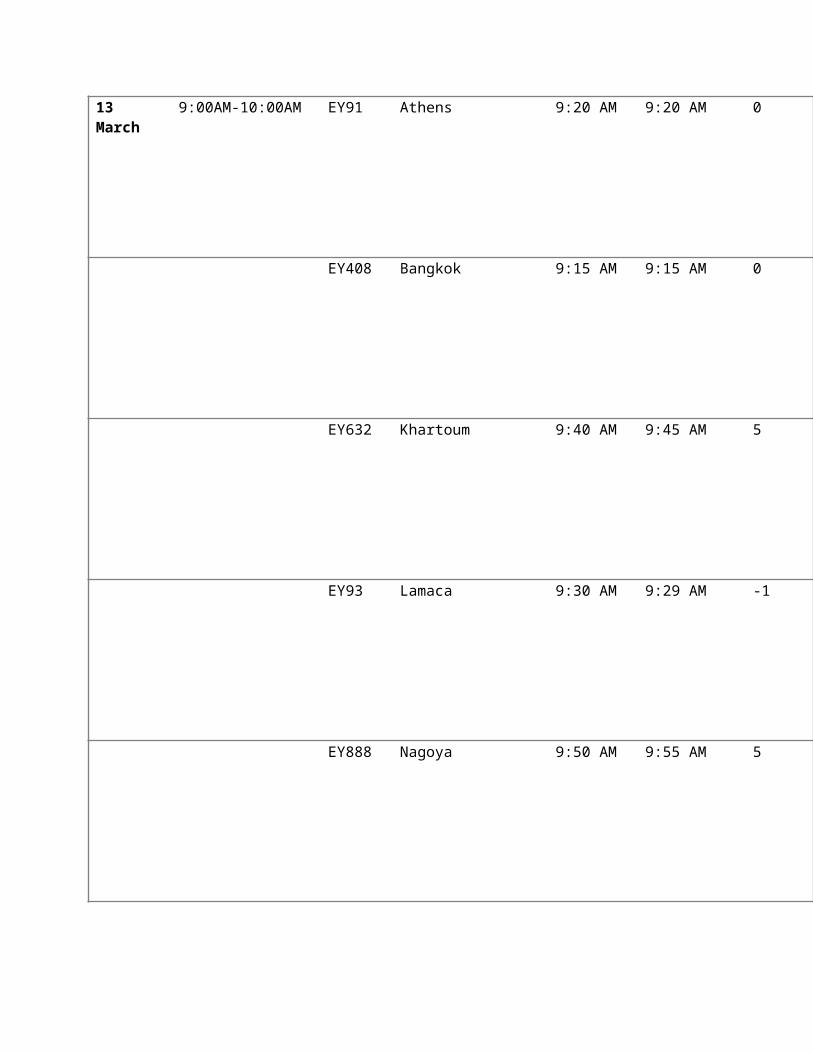
13 March
9:00AM-10:00AM EY91 Athens 9:20 AM 9:20 AM 0
EY408 Bangkok 9:15 AM 9:15 AM 0
EY632 Khartoum 9:40 AM 9:45 AM 5
EY93 Lamaca 9:30 AM 9:29 AM -1
EY888 Nagoya 9:50 AM 9:55 AM 5
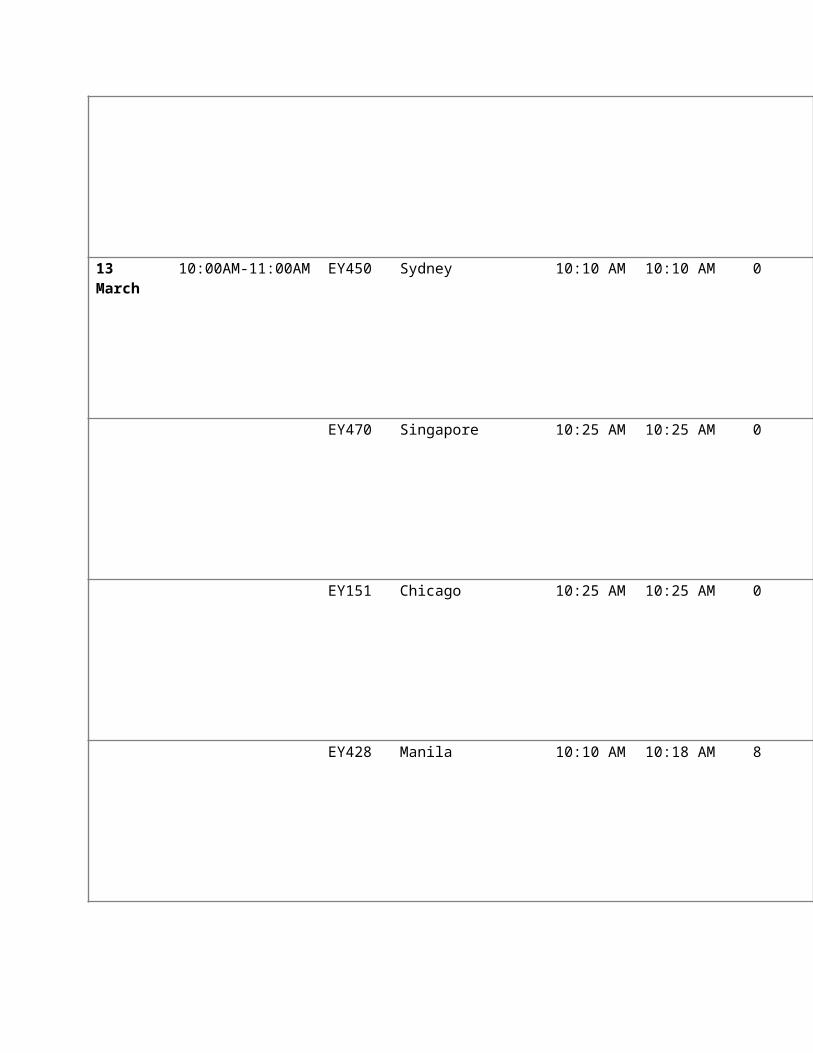
13 March
10:00AM-11:00AM EY450 Sydney 10:10 AM 10:10 AM 0
EY470 Singapore 10:25 AM 10:25 AM 0
EY151 Chicago 10:25 AM 10:25 AM 0
EY428 Manila 10:10 AM 10:18 AM 8
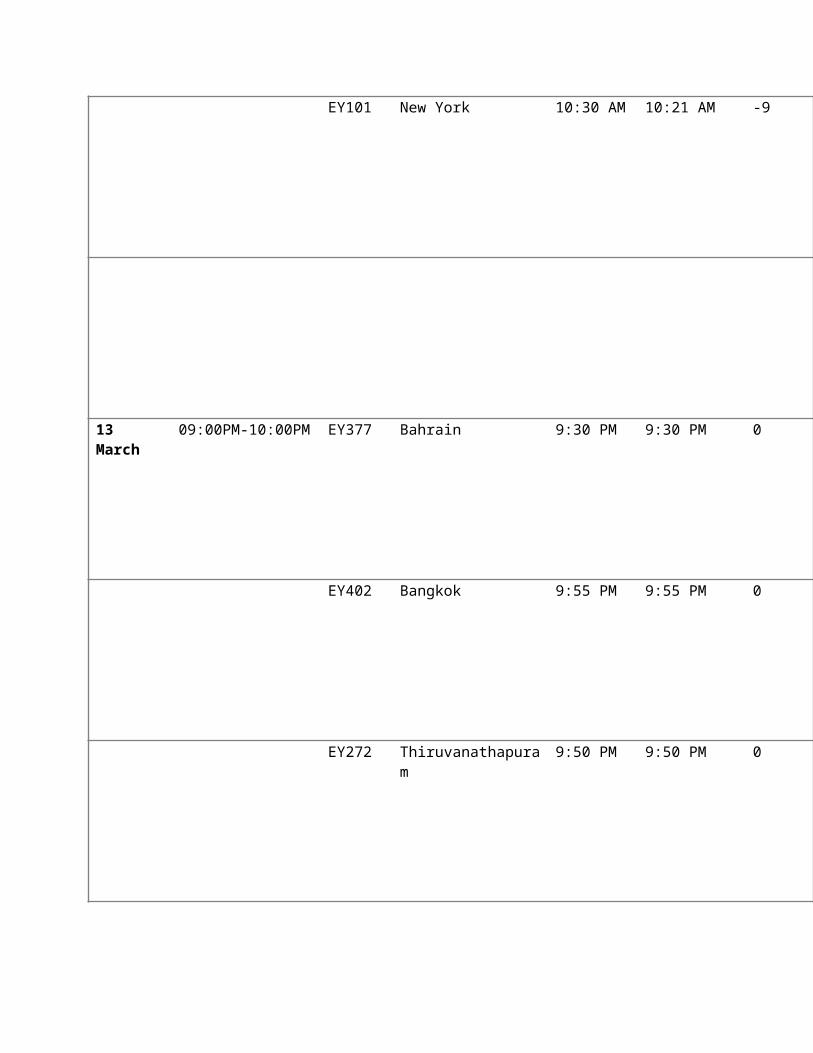
EY101 New York 10:30 AM 10:21 AM -9
13 March
09:00PM-10:00PM EY377 Bahrain 9:30 PM 9:30 PM 0
EY402 Bangkok 9:55 PM 9:55 PM 0
EY272 Thiruvanathapuram
9:50 PM 9:50 PM 0
EY388 Muscat 9:35 PM 9:35 PM 0
EY391 Doha 9:50 PM 9:47 PM -3
13 March
10:00PM-11:00PM EY878 Tokyo 10:00 PM 10:00 PM 0
EY454 Sydney 10:25 PM 10:25 PM 0

EY876 Incheon Airport 10:45 PM 10:45 PM 0
EY218 New Delhi 10:05 PM 10:05 PM 0
EY888 Beijing 10:00 PM 10:00 PM 0
14 March
8:00AM-9:00AM EY513 Amman 8:10 AM 8:05 AM -5
EY371 Bahrain 8:30 AM 8:29 AM -1
EY535 Beirut 8:30 AM 8:18 AM -12
EY321 Dammam 8:25 AM 8:13 AM -12
EY393 Doha 8:55 AM 8:44 AM -11
14 March
10:00AM-11:00AM EY663 Borg El Arab 10:00 AM 11:38 AM 98
EY555 Baghdad Int. 10:05 AM 10:01 AM -4
EY653 Cairo 10:15 AM 10:25 AM 10
EY151 Chicago 10:25 AM 10:25 AM 0
EY428 Manila 10:10 AM 10:08 AM -2
14 March
2:00AM-3:00AM EY418 Kuala Lampur 2:50 AM 3:11 AM -21
EY305 Kuwait 2:20 AM 2:25 AM 5
EY11 London Heathrow 2:40 AM 2:40 AM 0
EY81 Milan 2:25 AM 2:20 AM -5
EY384 Muscat 2:55 AM 2:43 AM -12
14 March
9:00PM-10:00PM EY377 Bahrain 9:30 PM 9:36 PM 6
EY266 Colombo 9:40 PM 9:44 PM 4
EY1291 Dammam 9:35 PM 9:25 PM -10
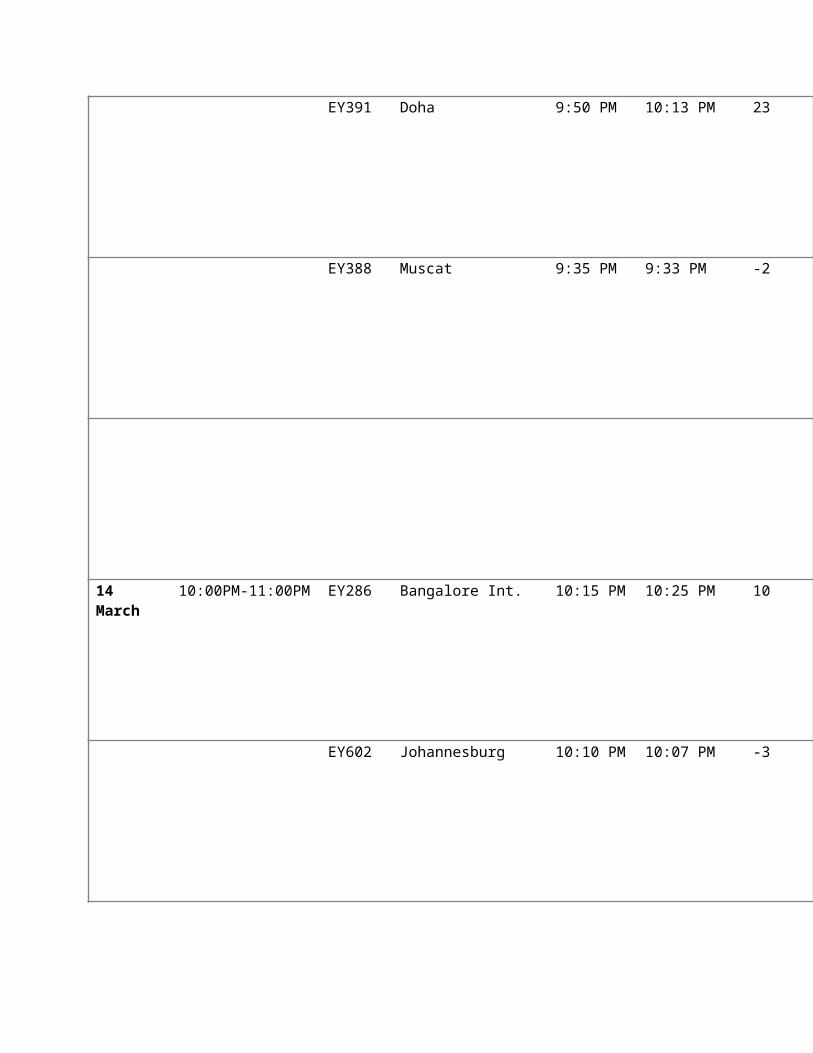
EY391 Doha 9:50 PM 10:13 PM 23
EY388 Muscat 9:35 PM 9:33 PM -2
14 March
10:00PM-11:00PM EY286 Bangalore Int. 10:15 PM 10:25 PM 10
EY602 Johannesburg 10:10 PM 10:07 PM -3
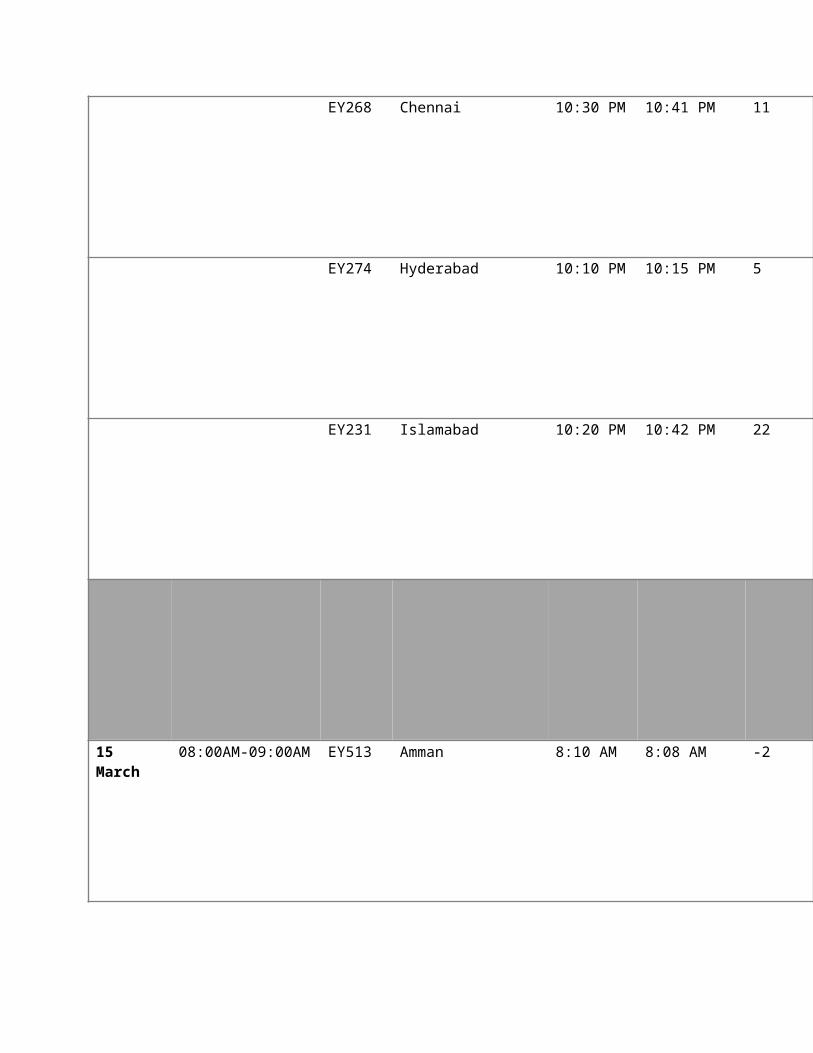
EY268 Chennai 10:30 PM 10:41 PM 11
EY274 Hyderabad 10:10 PM 10:15 PM 5
EY231 Islamabad 10:20 PM 10:42 PM 22
15 March
08:00AM-09:00AM EY513 Amman 8:10 AM 8:08 AM -2
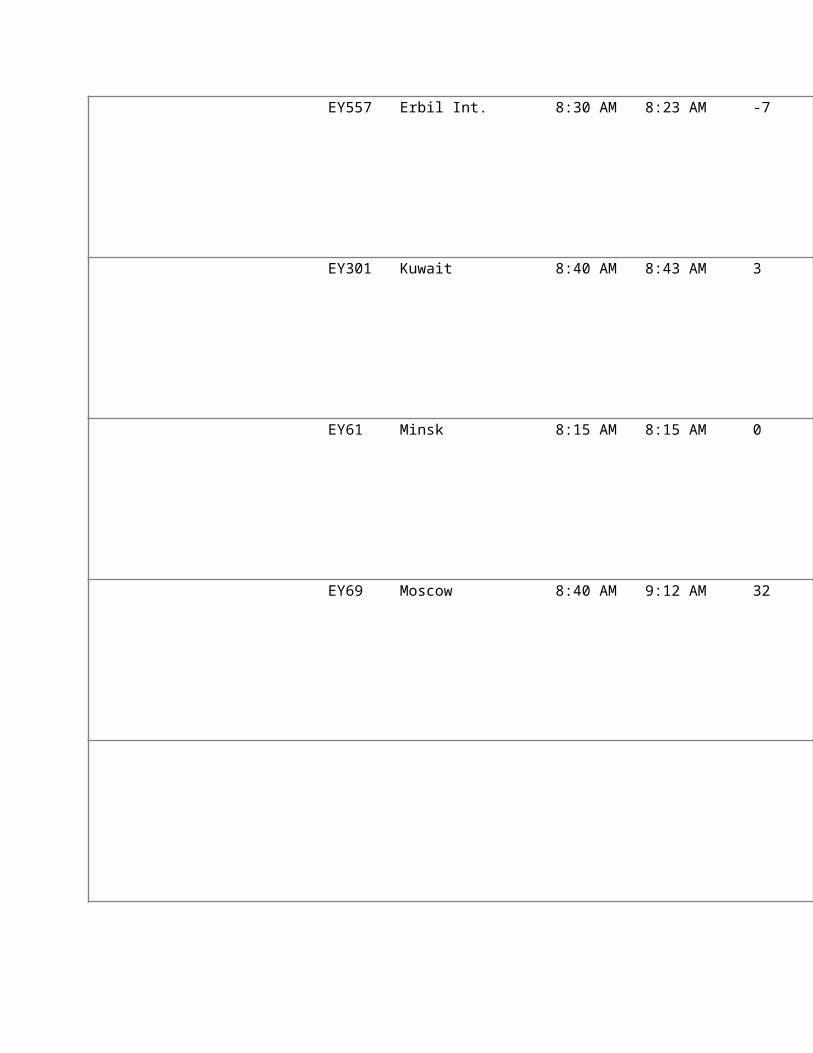
EY557 Erbil Int. 8:30 AM 8:23 AM -7
EY301 Kuwait 8:40 AM 8:43 AM 3
EY61 Minsk 8:15 AM 8:15 AM 0
EY69 Moscow 8:40 AM 9:12 AM 32
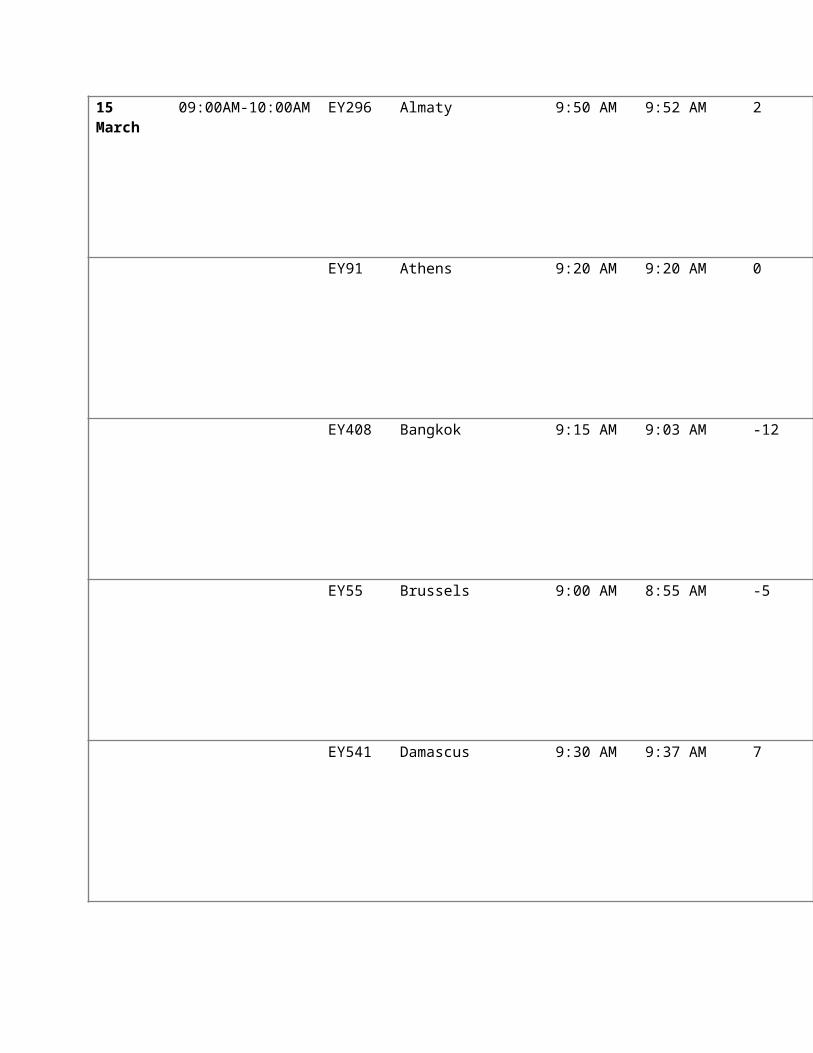
15 March
09:00AM-10:00AM EY296 Almaty 9:50 AM 9:52 AM 2
EY91 Athens 9:20 AM 9:20 AM 0
EY408 Bangkok 9:15 AM 9:03 AM -12
EY55 Brussels 9:00 AM 8:55 AM -5
EY541 Damascus 9:30 AM 9:37 AM 7
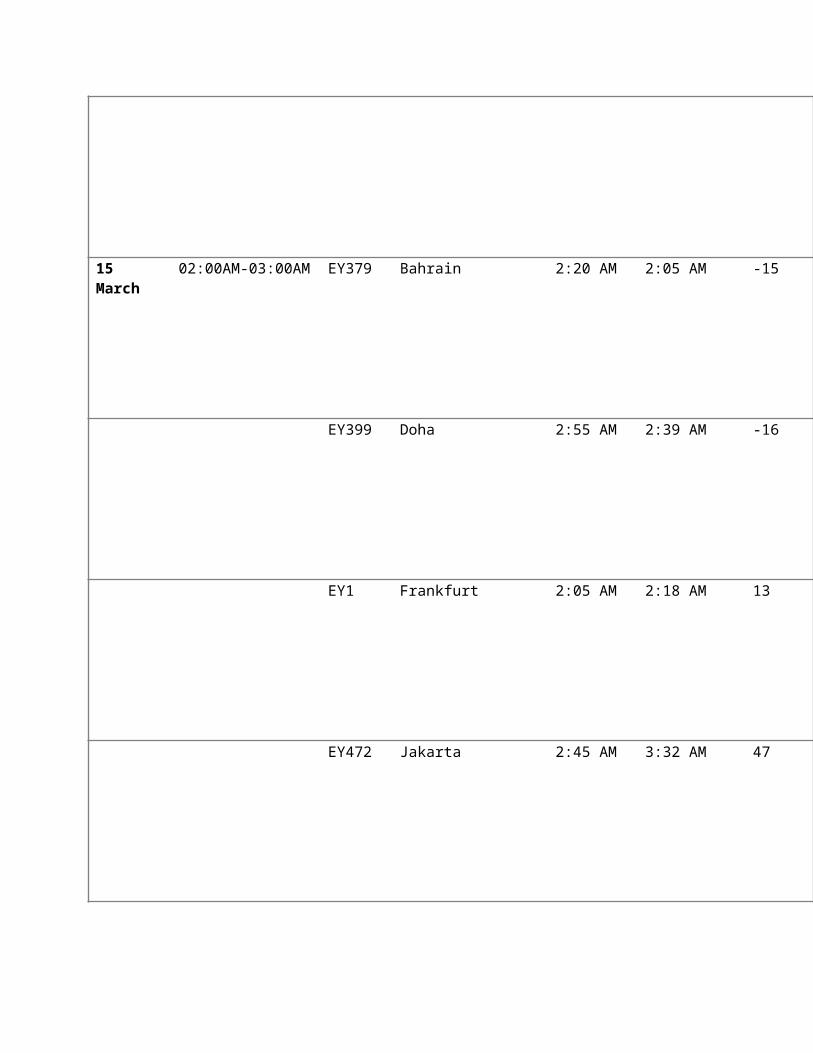
15 March
02:00AM-03:00AM EY379 Bahrain 2:20 AM 2:05 AM -15
EY399 Doha 2:55 AM 2:39 AM -16
EY1 Frankfurt 2:05 AM 2:18 AM 13
EY472 Jakarta 2:45 AM 3:32 AM 47
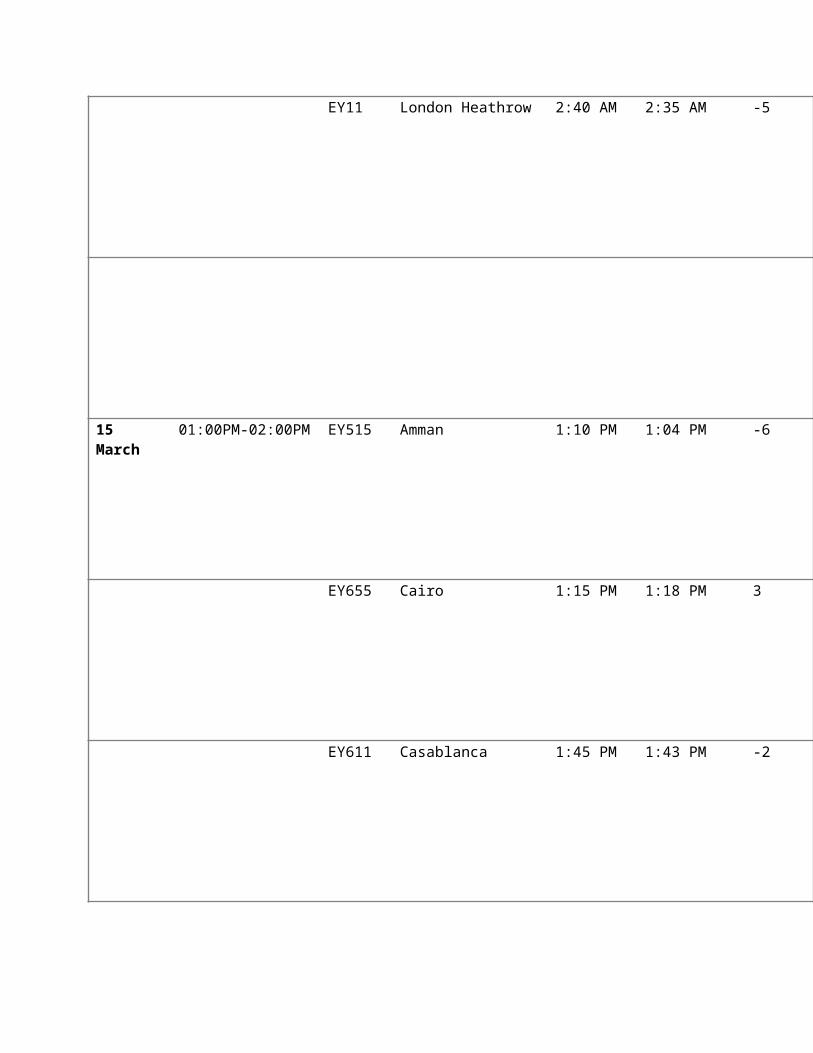
EY11 London Heathrow 2:40 AM 2:35 AM -5
15 March
01:00PM-02:00PM EY515 Amman 1:10 PM 1:04 PM -6
EY655 Cairo 1:15 PM 1:18 PM 3
EY611 Casablanca 1:45 PM 1:43 PM -2
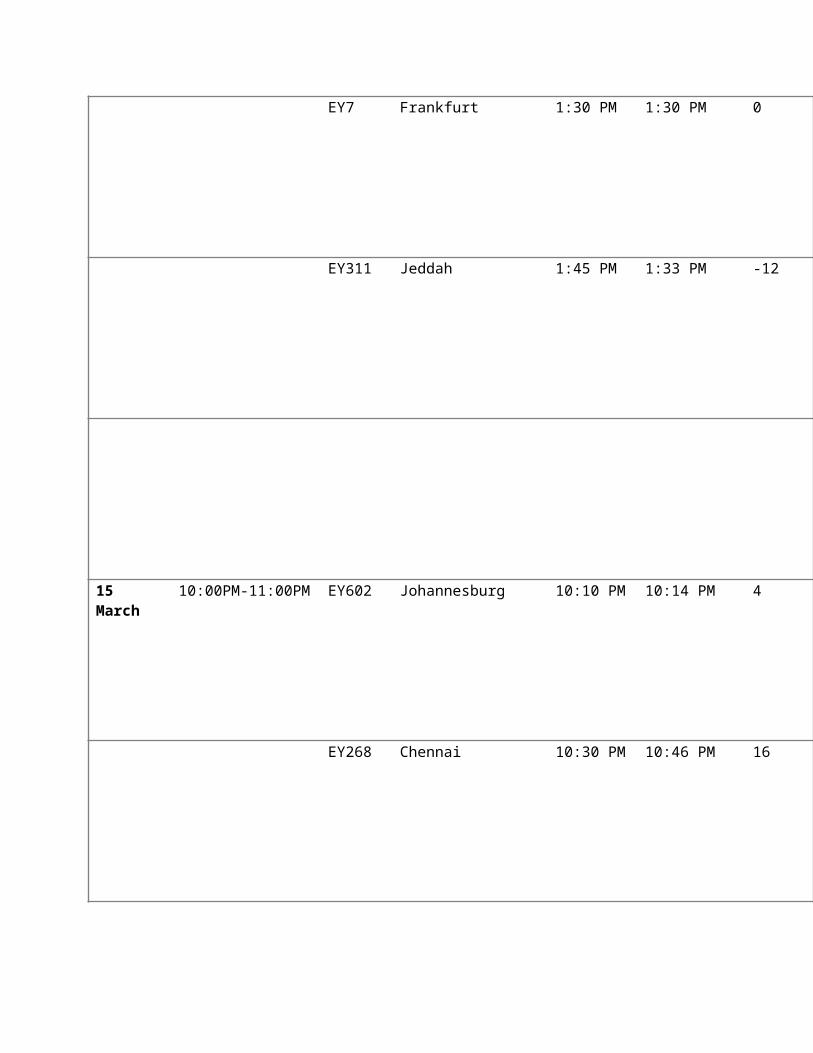
EY7 Frankfurt 1:30 PM 1:30 PM 0
EY311 Jeddah 1:45 PM 1:33 PM -12
15 March
10:00PM-11:00PM EY602 Johannesburg 10:10 PM 10:14 PM 4
EY268 Chennai 10:30 PM 10:46 PM 16
EY250 Kozhikode 10:05 PM 10:50 PM 45
EY241 Lahore 10:20 PM 10:19 PM -1
EY460 Melbourne 10:35 PM 10:59 PM 24
16 March
08:00AM:09:00AM EY371 Bahrain 8:30 AM 8:45 AM 15
EY535 Beirut 8:30 AM 8:34 AM 4
EY393 Doha 8:55 AM 8:53 AM -2
EY37 Paris 8:50 AM 8:47 AM -3
EY301 Kuwait 8:40 AM 8:36 AM -4
16 March
10:00AM-11:00AM EY555 Baghdad Int. 10:05 AM 10:07 AM 2
EY151 Chicago 10:25 AM 10:28 AM 3
EY101 New York 10:30 AM 10:24 AM -6
EY428 Manila 10:10 AM 10:12 AM 2
EY470 Singapore 10:25 10:24 -1
16 March
02:00AM-03:00AM EY372 Jakarta 2:45 AM 2:42 AM -3
EY305 Kuwait 2:20 AM 2:11 AM -9
EY15 Manchester 2:15 AM 2:15 AM 0
EY384 Muscat 2:55 AM 2:44 AM -11
EY31 Paris 2:05 AM 2:02 AM -3
16 March
09:00PM-10:00PM EY402 Bangkok 9:55 PM 10:10 PM 15
EY260 Colombo 9:40 PM 9:40 PM 0
EY258 Dhaka 9:25 PM 9:25 PM 0
EY391 Doha 9:50 PM 9:50 PM 0
EY388 Muscat 9:35 PM 9:35 PM 0
16 March
10:00PM-11:00PM EY454 Sydney 10:25 PM 10:25 PM 0
EY888 Bejing 10:00 PM 10:00 PM 0
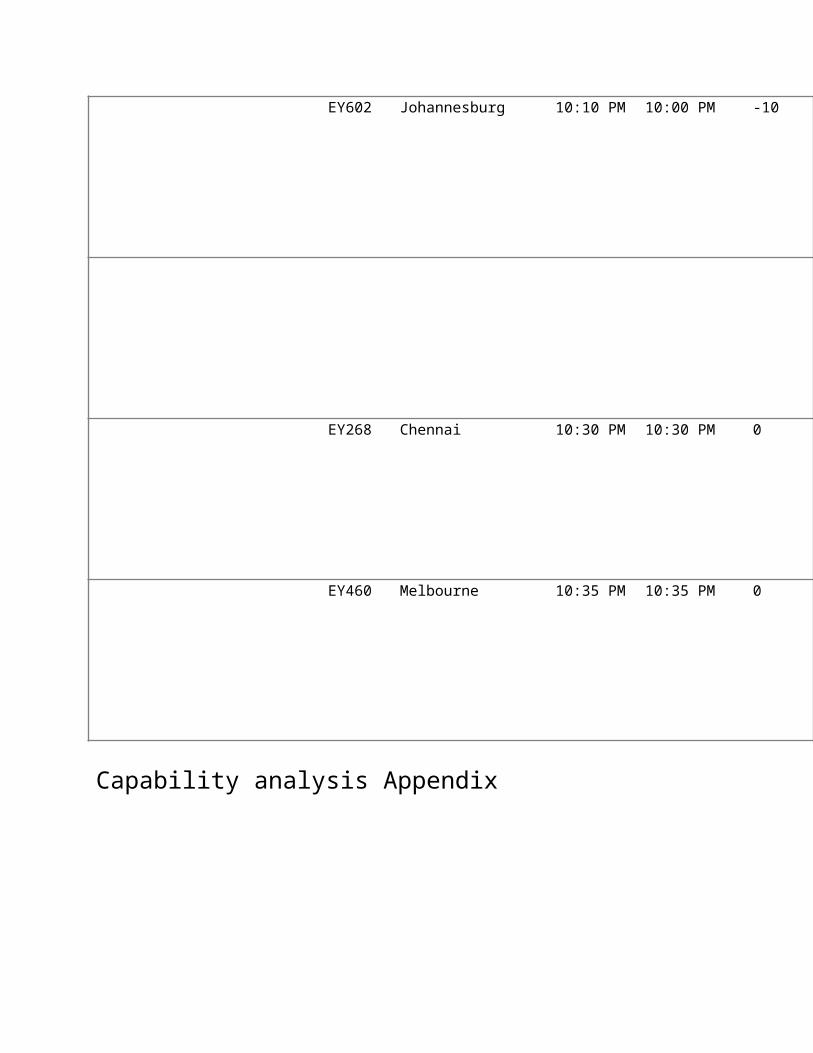
EY602 Johannesburg 10:10 PM 10:00 PM -10
EY268 Chennai 10:30 PM 10:30 PM 0
EY460 Melbourne 10:35 PM 10:35 PM 0
Capability analysis Appendix
w