estimation of the electric power potential using pressure retarded osmosis in the leon river's...
TRANSCRIPT
Estimation of the Electric Power Potential Using Pressure Retarded Osmosis in the Leon River’s
Mouth: A First Step for the Harnessing of Saline Gradients in Colombia
O. Álvarez-Silva, A. Osorio, S. Ortega, P. Agudelo-Restrepo
Grupo de Investigación en Oceanografía e Ingeniería Costera (OCEANICOS) Universidad Nacional de Colombia, Facultad de Minas
Carrera 80 # 65 -223, Medellin Colombia
Abstract- One of the fundamental requirements for harnessing osmotic power potential is to find an area where there is a strong salinity
gradient in a short geographical distance and that such gradient is approximately constant year-round. This paper presents the results of the study of the spatial and temporal structure of the salinity in the Leon River’s mouth, located in the Colombian Caribbean Coast. This study was made using field data and numeric simulation of the hydrodynamics of the river mouth, representing the different climatic seasons that occur in the region. It also takes into account the variability of the macroclimatic forcing due to the different phases of the ENSO –El Niño Southern Oscillation – phenomenon. The results show that the river mouth presents a strong vertical salinity gradient with seasonal variation. However, this variation still permits to have salinity differences of 35PSU between the surface and the 20m deep water during the whole length of the year, regardless of the influence of the ENSO. With these results, the theoretical, technical and ecological generation potential is calculated, assuming the use of the Pressure Retarded Osmosis (PRO) Technology.
Keywords: osmotic power, salinity gradients, hydrodynamics, Caribbean Sea river mouths
I. INTRODUCTION
One of the marine energy sources with greater estimated global potential is the energy freed when the fresh water of the rivers mixes with the salt water of the ocean [1]. This is a completely renewable energy source, as this mixture is part of the natural water cycle. One of the technologies used to harness this source of energy is the Pressure Retarded Osmosis (PRO). The first researches aiming to use the salinity gradient between two water masses as a source of energy and to use PRO membrane technology to do so was developed in the seventies, coinciding with the 1973 Oil Crisis, but the vast majority of the studies striving to develop this technology have been developed in the last decade.[2]. Up to date, there is a 4kW pilot plant working with this technology in Tofte, Norway, owned by Statkraft.
Some of the most recent studies have estimated the regional and global potentials using PRO [3]; others have made valuable advances in the criteria for site selection for the osmotic power projects [4]. According to these authors, the Caribbean is one of the places of the world with the most adequate conditions and dynamics for harnessing osmotic energy. The operation of an osmotic power plant requires availability of fresh and a highly saline ocean body. As fresh water flows into the ocean it lowers the salinity of the ocean at a local scale. In some mouths, such as the León River’s, the fresh water mixes in the first meters of depth and the water column presents a salt-wedge and a high salinity gradient. This phenomenon often occurs in micro-tidal areas, and may be used for osmotic generation as there is saline water mass only a few meters depth. Colombia is a country with very large rivers flowing into the Pacific Ocean and the Caribbean Sea, but as the Caribbean has a micro-tidal range; it can be a very interesting place for studying the osmotic power technology.
Under this background, and using field measurements and hydrodynamic simulation, this paper describes the process used to estimate the salinity structure and the osmotic power generation potential in the mouth of the León River, a Colombian river that discharges its water in the Caribbean Sea. This research becomes highly relevant for the sustainable energy future of the region, and represents a first step in the road of estimating and harnessing the osmotic electric potential in Colombia and its neighboring countries.
II. STUDY AREA
The León River’s mouth is a delta located in the southwest end of the Urabá gulf, in the Colombian Caribbean Sea (Fig. 1). Near this mouth lays the municipality of Apartadó, a town with 120,000 habitants and a port for exporting the agricultural
978-1-61284-4577-0088-0/11/$26.00 ©2011 IEEE
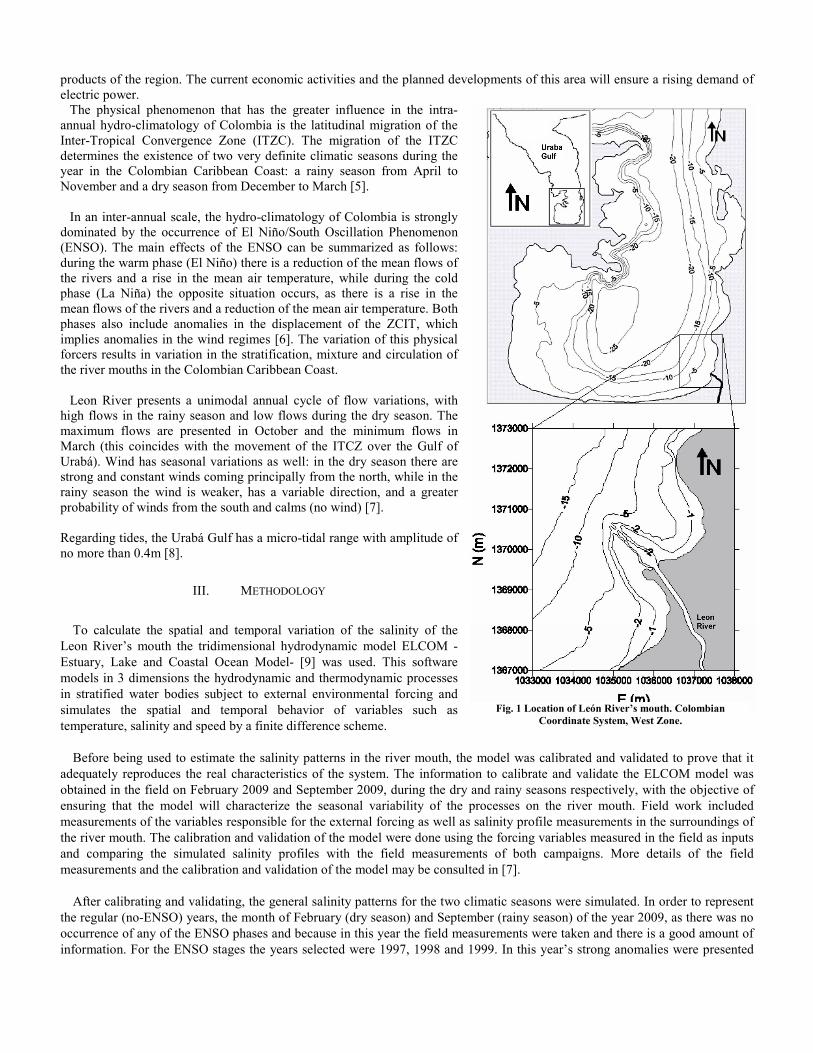
products of the region. The current economic activities and the planned developments of this area will ensure a rising demand of electric power.
The physical phenomenon that has the greater influence in the intra-annual hydro-climatology of Colombia is the latitudinal migration of the Inter-Tropical Convergence Zone (ITZC). The migration of the ITZC determines the existence of two very definite climatic seasons during the year in the Colombian Caribbean Coast: a rainy season from April to November and a dry season from December to March [5].
In an inter-annual scale, the hydro-climatology of Colombia is strongly
dominated by the occurrence of El Niño/South Oscillation Phenomenon (ENSO). The main effects of the ENSO can be summarized as follows: during the warm phase (El Niño) there is a reduction of the mean flows of the rivers and a rise in the mean air temperature, while during the cold phase (La Niña) the opposite situation occurs, as there is a rise in the mean flows of the rivers and a reduction of the mean air temperature. Both phases also include anomalies in the displacement of the ZCIT, which implies anomalies in the wind regimes [6]. The variation of this physical forcers results in variation in the stratification, mixture and circulation of the river mouths in the Colombian Caribbean Coast.
Leon River presents a unimodal annual cycle of flow variations, with
high flows in the rainy season and low flows during the dry season. The maximum flows are presented in October and the minimum flows in March (this coincides with the movement of the ITCZ over the Gulf of Urabá). Wind has seasonal variations as well: in the dry season there are strong and constant winds coming principally from the north, while in the rainy season the wind is weaker, has a variable direction, and a greater probability of winds from the south and calms (no wind) [7].
Regarding tides, the Urabá Gulf has a micro-tidal range with amplitude of no more than 0.4m [8].
III. METHODOLOGY
To calculate the spatial and temporal variation of the salinity of the
Leon River’s mouth the tridimensional hydrodynamic model ELCOM -Estuary, Lake and Coastal Ocean Model- [9] was used. This software models in 3 dimensions the hydrodynamic and thermodynamic processes in stratified water bodies subject to external environmental forcing and simulates the spatial and temporal behavior of variables such as temperature, salinity and speed by a finite difference scheme.
Before being used to estimate the salinity patterns in the river mouth, the model was calibrated and validated to prove that it
adequately reproduces the real characteristics of the system. The information to calibrate and validate the ELCOM model was obtained in the field on February 2009 and September 2009, during the dry and rainy seasons respectively, with the objective of ensuring that the model will characterize the seasonal variability of the processes on the river mouth. Field work included measurements of the variables responsible for the external forcing as well as salinity profile measurements in the surroundings of the river mouth. The calibration and validation of the model were done using the forcing variables measured in the field as inputs and comparing the simulated salinity profiles with the field measurements of both campaigns. More details of the field measurements and the calibration and validation of the model may be consulted in [7].
After calibrating and validating, the general salinity patterns for the two climatic seasons were simulated. In order to represent
the regular (no-ENSO) years, the month of February (dry season) and September (rainy season) of the year 2009, as there was no occurrence of any of the ENSO phases and because in this year the field measurements were taken and there is a good amount of information. For the ENSO stages the years selected were 1997, 1998 and 1999. In this year’s strong anomalies were presented
Fig. 1 Location of León River’s mouth. Colombian Coordinate System, West Zone.
and there was a shift from El Niño to La Niña stages. To represent the warm phase of the ENSO, the simulation was made in the months of September 1997 and February 1998; and for the cold phase of the ENSO the moths chosen were September 1998 and February 1999.
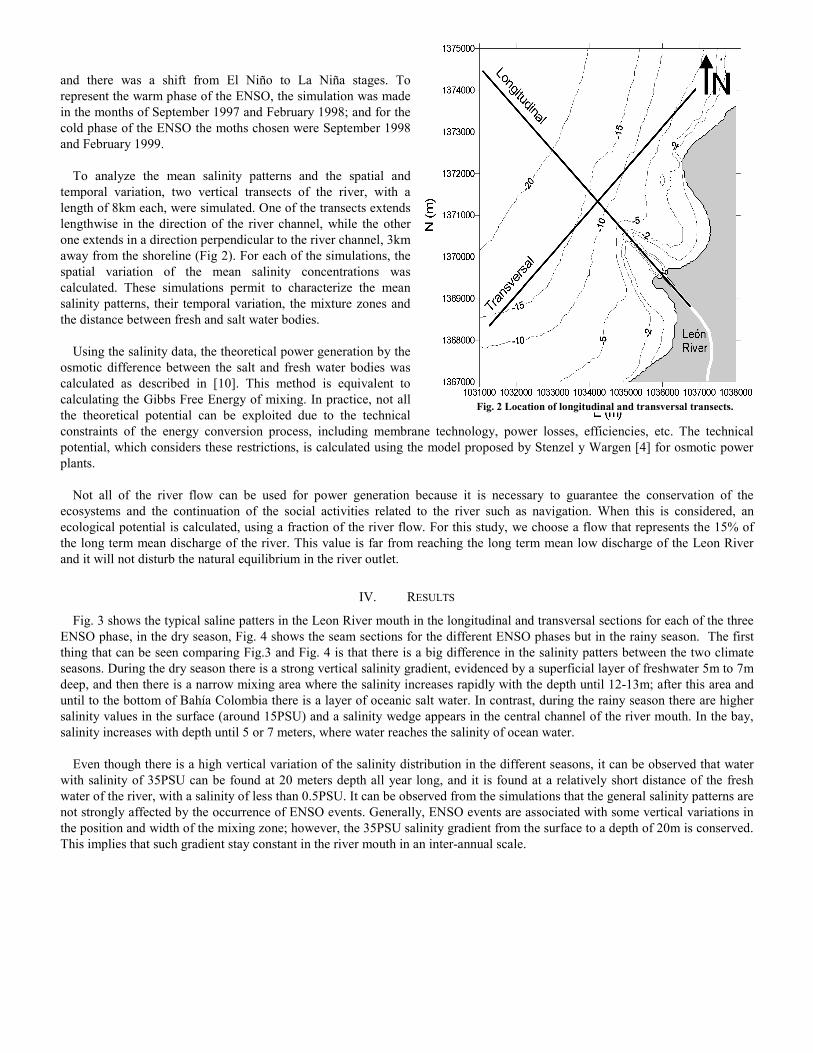
To analyze the mean salinity patterns and the spatial and
temporal variation, two vertical transects of the river, with a length of 8km each, were simulated. One of the transects extends lengthwise in the direction of the river channel, while the other one extends in a direction perpendicular to the river channel, 3km away from the shoreline (Fig 2). For each of the simulations, the spatial variation of the mean salinity concentrations was calculated. These simulations permit to characterize the mean salinity patterns, their temporal variation, the mixture zones and the distance between fresh and salt water bodies.
Using the salinity data, the theoretical power generation by the
osmotic difference between the salt and fresh water bodies was calculated as described in [10]. This method is equivalent to calculating the Gibbs Free Energy of mixing. In practice, not all the theoretical potential can be exploited due to the technical constraints of the energy conversion process, including membrane technology, power losses, efficiencies, etc. The technical potential, which considers these restrictions, is calculated using the model proposed by Stenzel y Wargen [4] for osmotic power plants.
Not all of the river flow can be used for power generation because it is necessary to guarantee the conservation of the
ecosystems and the continuation of the social activities related to the river such as navigation. When this is considered, an ecological potential is calculated, using a fraction of the river flow. For this study, we choose a flow that represents the 15% of the long term mean discharge of the river. This value is far from reaching the long term mean low discharge of the Leon River and it will not disturb the natural equilibrium in the river outlet.
IV. RESULTS
Fig. 3 shows the typical saline patters in the Leon River mouth in the longitudinal and transversal sections for each of the three ENSO phase, in the dry season, Fig. 4 shows the seam sections for the different ENSO phases but in the rainy season. The first thing that can be seen comparing Fig.3 and Fig. 4 is that there is a big difference in the salinity patters between the two climate seasons. During the dry season there is a strong vertical salinity gradient, evidenced by a superficial layer of freshwater 5m to 7m deep, and then there is a narrow mixing area where the salinity increases rapidly with the depth until 12-13m; after this area and until to the bottom of Bahía Colombia there is a layer of oceanic salt water. In contrast, during the rainy season there are higher salinity values in the surface (around 15PSU) and a salinity wedge appears in the central channel of the river mouth. In the bay, salinity increases with depth until 5 or 7 meters, where water reaches the salinity of ocean water.
Even though there is a high vertical variation of the salinity distribution in the different seasons, it can be observed that water
with salinity of 35PSU can be found at 20 meters depth all year long, and it is found at a relatively short distance of the fresh water of the river, with a salinity of less than 0.5PSU. It can be observed from the simulations that the general salinity patterns are not strongly affected by the occurrence of ENSO events. Generally, ENSO events are associated with some vertical variations in the position and width of the mixing zone; however, the 35PSU salinity gradient from the surface to a depth of 20m is conserved. This implies that such gradient stay constant in the river mouth in an inter-annual scale.
Fig. 2 Location of longitudinal and transversal transects.
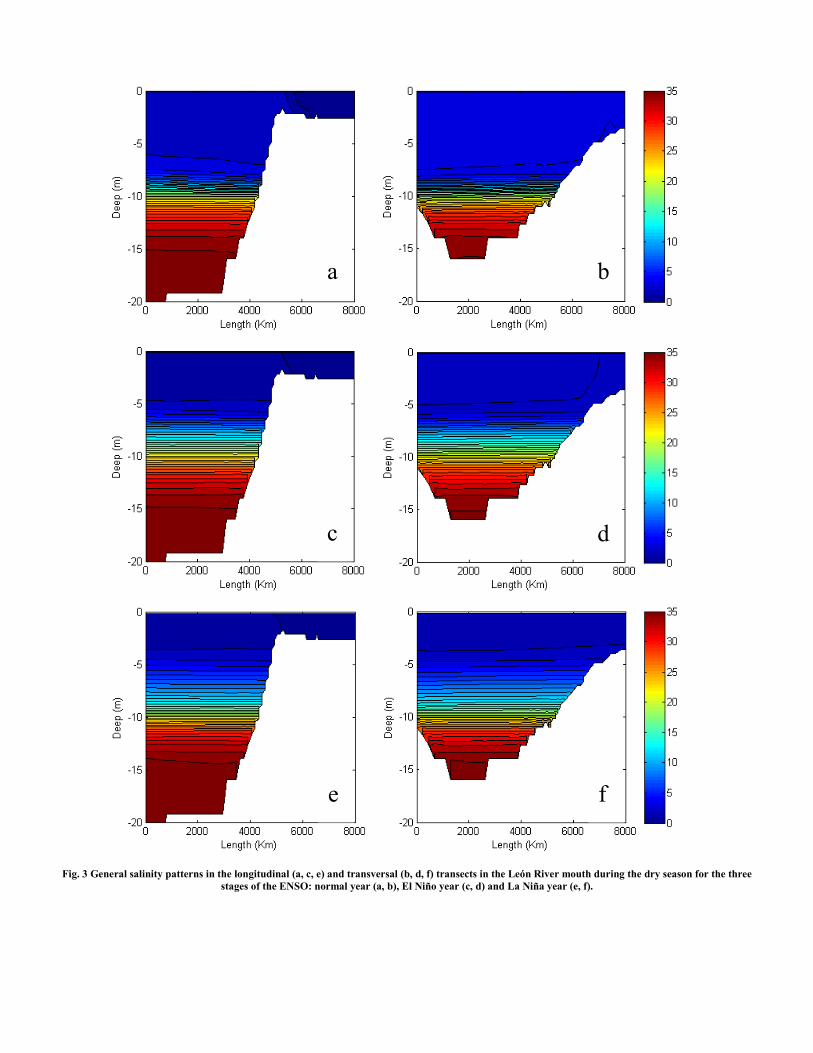
Fig. 3 General salinity patterns in the longitudinal (a, c, e) and transversal (b, d, f) transects in the León River mouth during the dry season for the three stages of the ENSO: normal year (a, b), El Niño year (c, d) and La Niña year (e, f).
a b
c d
e f
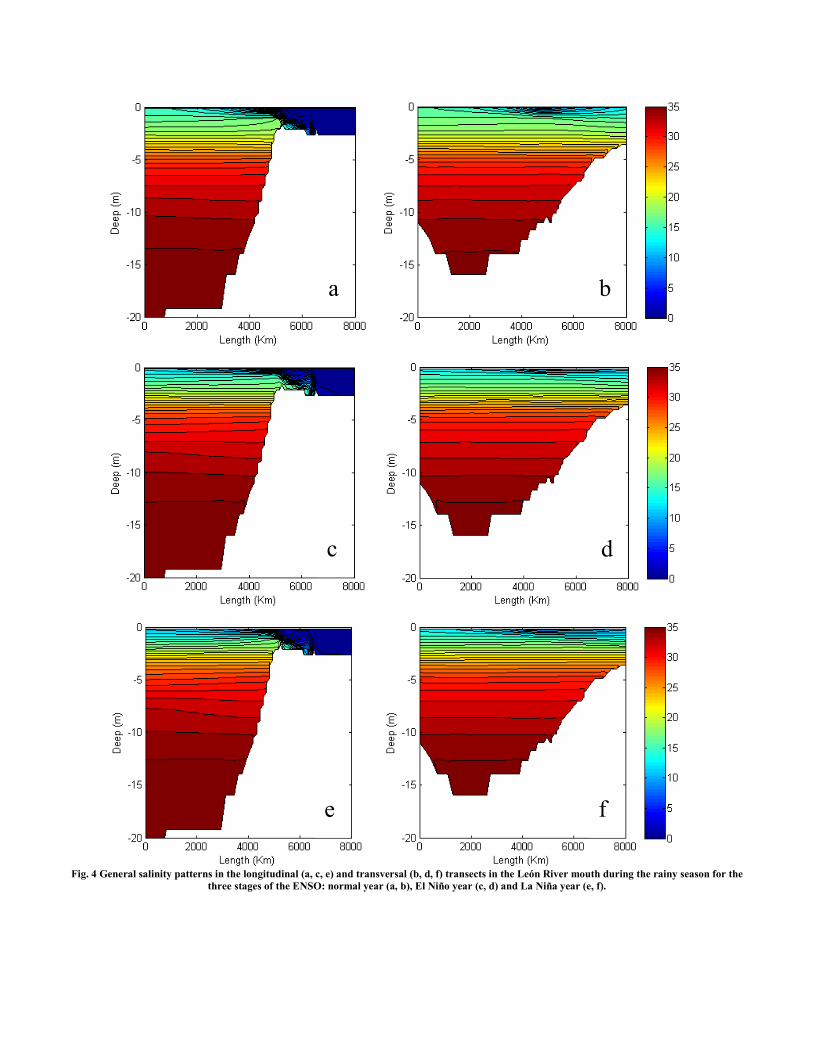
Fig. 4 General salinity patterns in the longitudinal (a, c, e) and transversal (b, d, f) transects in the León River mouth during the rainy season for the
three stages of the ENSO: normal year (a, b), El Niño year (c, d) and La Niña year (e, f).
a b
c d
e f
It is important to notice that during the dry season, where the river flows are lower the salinity profile has a larger component of freshwater. At first sight this situation does not seem logical, but it can be explained by the fact that at the north of the Leon River mouth, the Atrato River flows into the ocean. The Atrato River has one of the larger flows of the Caribbean Rivers (2740 m3/s), and due to the action of the winds in the dry season, its water is pushed into the south of the Urabá Gulf, increasing the share of freshwater in the salinity profile.
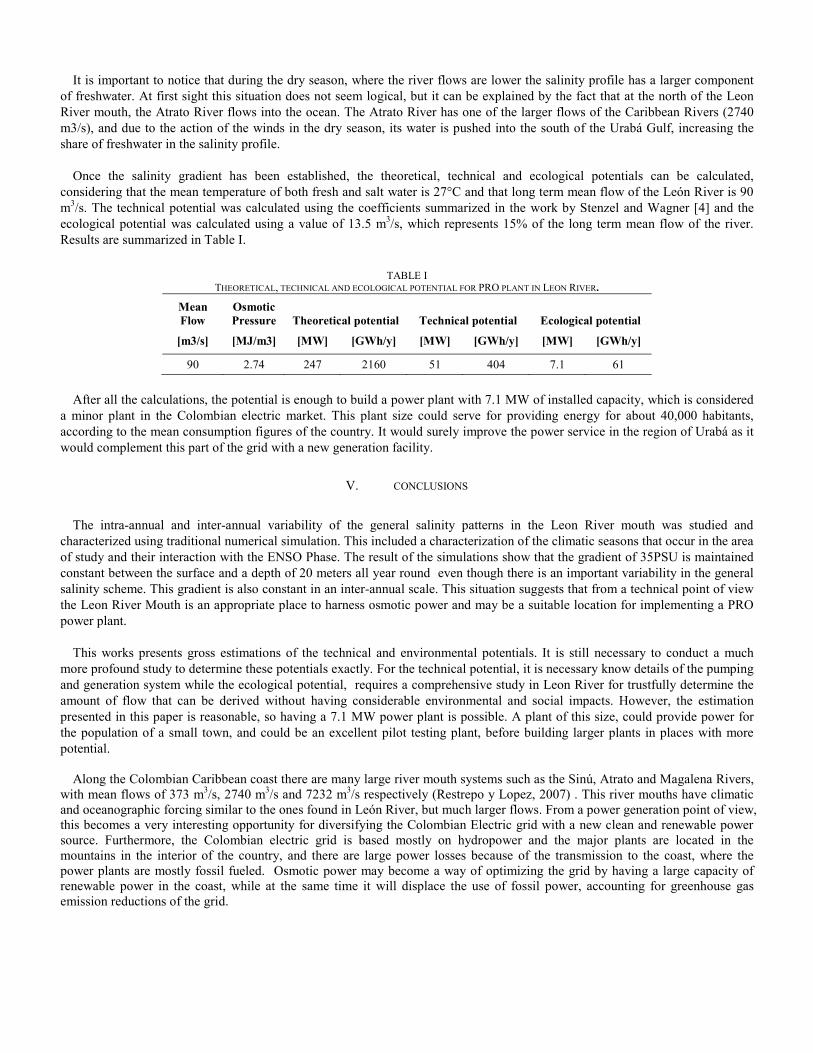
Once the salinity gradient has been established, the theoretical, technical and ecological potentials can be calculated,
considering that the mean temperature of both fresh and salt water is 27°C and that long term mean flow of the León River is 90 m3/s. The technical potential was calculated using the coefficients summarized in the work by Stenzel and Wagner [4] and the ecological potential was calculated using a value of 13.5 m3/s, which represents 15% of the long term mean flow of the river. Results are summarized in Table I.
TABLE I THEORETICAL, TECHNICAL AND ECOLOGICAL POTENTIAL FOR PRO PLANT IN LEON RIVER.
Mean Flow
Osmotic Pressure Theoretical potential Technical potential Ecological potential
[m3/s] [MJ/m3] [MW] [GWh/y] [MW] [GWh/y] [MW] [GWh/y]
90 2.74 247 2160 51 404 7.1 61 After all the calculations, the potential is enough to build a power plant with 7.1 MW of installed capacity, which is considered
a minor plant in the Colombian electric market. This plant size could serve for providing energy for about 40,000 habitants, according to the mean consumption figures of the country. It would surely improve the power service in the region of Urabá as it would complement this part of the grid with a new generation facility.
V. CONCLUSIONS
The intra-annual and inter-annual variability of the general salinity patterns in the Leon River mouth was studied and
characterized using traditional numerical simulation. This included a characterization of the climatic seasons that occur in the area of study and their interaction with the ENSO Phase. The result of the simulations show that the gradient of 35PSU is maintained constant between the surface and a depth of 20 meters all year round even though there is an important variability in the general salinity scheme. This gradient is also constant in an inter-annual scale. This situation suggests that from a technical point of view the Leon River Mouth is an appropriate place to harness osmotic power and may be a suitable location for implementing a PRO power plant.
This works presents gross estimations of the technical and environmental potentials. It is still necessary to conduct a much
more profound study to determine these potentials exactly. For the technical potential, it is necessary know details of the pumping and generation system while the ecological potential, requires a comprehensive study in Leon River for trustfully determine the amount of flow that can be derived without having considerable environmental and social impacts. However, the estimation presented in this paper is reasonable, so having a 7.1 MW power plant is possible. A plant of this size, could provide power for the population of a small town, and could be an excellent pilot testing plant, before building larger plants in places with more potential.
Along the Colombian Caribbean coast there are many large river mouth systems such as the Sinú, Atrato and Magalena Rivers, with mean flows of 373 m3/s, 2740 m3/s and 7232 m3/s respectively (Restrepo y Lopez, 2007) . This river mouths have climatic and oceanographic forcing similar to the ones found in León River, but much larger flows. From a power generation point of view, this becomes a very interesting opportunity for diversifying the Colombian Electric grid with a new clean and renewable power source. Furthermore, the Colombian electric grid is based mostly on hydropower and the major plants are located in the mountains in the interior of the country, and there are large power losses because of the transmission to the coast, where the power plants are mostly fossil fueled. Osmotic power may become a way of optimizing the grid by having a large capacity of renewable power in the coast, while at the same time it will displace the use of fossil power, accounting for greenhouse gas emission reductions of the grid.
However, as the PRO technology is still in development, it is very difficult to have real data of the implementation and operation costs of a power plant. These costs must be clear in order to evaluate the real feasibility of Osmotic Power in Colombia, and to know exactly how important it may become for the electric system.
ACKNOWLEDGMENTS
This work was made during the research project “ASSEMENT OF THE MARINE POWER POTENTIAL IN COLOMBIA AND ANALYSIS OF THE INSTRUMENTATION AND GENERATION TECHNOLOGIES FOR ELECTRIC POWER GENERATION AT COMMERCIAL SCALE” developed by Universidad Nacional de Colombia, Universidad Pontifica Bolivariana, Centro de Investigaciones Oceanograficas e Hidrográficas – CIOH and Empresas Publicas de Medellín, as part of the CIIEN – Centro de Investigación e Innovación en Energía – iniciative.
The authors wish to thank thanks the members of Group OCEANICOS of Universidad Nacional de Colombia, for the continuous support and various collaborations regarding this research, and to the Center for Water Research – CWR - of the University of Western Australia, for the license to use the ELCOM model.
REFERENCES [1] Jones A.T., Finley W., 2003. Recent developments in salinity gradient power. Oceans 2003 MTS/IEEE conference, San Diego California, USA. [2]Achilli A., Childress A.E., 2010. Pressure retarded osmosis: From the vision of Sidney Loeb to the first prototype installation — Review. Desalination. 261,
205–211. [3]Thorsen T., Holt T., 2005. Finding hidden energy in membrane processes, Filtration & Separation 42, 28–30. [4]Stenzel P., Wagner H.J., 2010. Osmotic power plants: Potential analysis and site criteria. 3rd International Conference on Ocean Energy, October 6, Bilbao. [5] Andrade C., 1993. Análisis de la velocidad del viento sobre el Mar Caribe. Boletín Científico CIOH. 13, 33–44. [6] Poveda G., 2004. La hidroclimatología de Colombia: una síntesis desde la escala inter-decadal hasta la escala diurna. Rev. Acad. Colomb. Cienc. 28(107), pp
201-222. [7] Alvarez-Silva O., 2011. Modelacion morfodinamica de desembocaduras a escala intra-anial. Tesis de Maestria. Universidad Nacional de Colombia, Medellin. [8] Correa I.D. y Vernette G, 2004. Introducción al problema de la erosión litoral en Urabá (sector Arboletes – Turbo) Costa Caribe Colombiana. Boletín de
Investigaciones Marinas y Costeras. 33, 7 – 28. [9] Hodges B. y Dallimore C., 2006. Estuary, lake and coastal ocean model: ELCOM, science manual. Centre of Water Research: Univ. of Western Australia. [10] Kalada 2010. How are osmotic Pressure and power calculated?. Technical white paper. On the web: http://abstraktdesigns.net/OSMOTIC-PRESSURE-
POWER-CALCULATED013130.pdf. Cited 25/03/2011.