ersa conference–porto, 25 th–29 th august 2004
TRANSCRIPT

1
ERSA CONFERENCE – PORTO, 25TH – 29TH AUGUST 2004
THE EFFECT OF TOURISM ON THE HOUSE MARKET: THE CASE OF SARDINIA1
Bianca BIAGI*, Alessandra FAGGIAN**
* University of Sassari, Economic Department and CRENoS University of Cagliari and Sassari, Italy. [email protected] ** University of Reading, Economics Department (URS), Whiteknights PO Box 219, Reading, U.K. [email protected] (PRELIMINARY VERSION, NOT TO BE QUOTED WITHOUT THE AUTHORS’ PERMISSION)
1 Though the work is the result of a joint effort of the two authors B. Biagi is responsible for the writing of sections 1, 2 and 5, while A.Faggian of sections 3 and 4.

2
1. Introduction
Tourism activity involves consumption of many goods and services, all of them
supplied by different firms (hotels, restaurants, travel agencies, local public and private
services) and required by different consumers (tourists and residents). For this reason
the tourism product is defined as a basket of goods and services (Gilbert 1990, Candela
1996, Sinclair and Stabler 1997) which includes natural, cultural and man-made
resources. This heterogeneity makes it not an easy task to calculate the actual and
overall effect of tourism on a local economy. Generally, the impact of tourism has been
studied applying standard approaches, such as input–output and keynesian multipliers
which calculate the direct, indirect and induced effects of the activity at local, regional
or national level. One part of the literature goes in the direction of applying - or
considering the possibility of applying- other methodologies in order to include non-
priced goods in the economic evaluation of tourism (Stabler, 1998). Nevertheless, all
these approaches do not take into account the economic relationship between house
prices and tourism.
The main purpose of the paper is to investigate the correlation between house prices and
tourism in order to confirm the general expectation that local housing market should
benefit from the presence of the vacation industry, i.e. the more tourist the urban area is,
the higher the prices of houses located there are. Using the HPM, we estimate the
implicit value of tourism which is embodied in house prices for the case of Sardinia
(Italy) at municipality level. Before reaching the final estimations, however, we pass
through one fundamental step: the creation of a reliable tourist index through which
discriminating in a scientific manner among the locations under analysis. The purpose
here is to go beyond the too general binary classification based on the subjective
knowledge of the region or on rough data to create objective indices using different
methodologies. In the final step, the two indices are included in the hedonic model to
test the effect of tourism. Both performed as we expected confirming the hypothesis of
positive and significant correlation between tourism activity and house price.
The organisation of this paper is as follows:
section 2 introduces the theoretical framework of HPM;
section 3 explains the methodologies on the basis of the two indices and the hedonic
regression used in this case;
section 4 describes the results obtained for the Sardinian municipalities;

3
section 5 highlights the main conclusions and further development of the paper.
2. HPM: a theoretical framework
In the case of heterogeneous goods, hedonic price measures the contribution of each
qualitative attribute to the total price. From a technical point of view the implicit price
of attributes are obtained regressing them against the total price of the good itself. One
of the first studies on HPM is due to Waugh’s work in 1929 (Sheppard, 1999).
However, the term “hedonic” dates back to 1939, when Andrew Court used it, for the
first time, to indicate “the analysis of prices and demand for the individual source of
pleasure” (Sheppard 1999, p. 1597). After Court’s contribution HPM is not applied until
the 1960s, in which Griliches (1961, 1971) gives the popularity to the method2. Until
that moment, however, HPM is considered exclusively a statistical technique not linked
to any economic theory. It is Rosen (1974) to offer the fundamental theoretical
framework for hedonic analysis. In his theoretical framework, consumers see
heterogeneous goods as bundle of quantitatively measurable characteristics. The prices
difference among similar goods reflects the concentration and composition of
characteristics.
The HPM has not been broadly used in tourism studies. Some contributions analyse the
price competitiveness of holiday packages promoting London and Paris (Clewer et al
1992), others calculate the competition between Mediterranean resorts starting by the
inclusive tour holidays supplied by tour operators (Papatheodorou 2002, Espinet et al.
2003, Clerides et al. 2003, Mangion et al. 2003) and other studies estimate hedonic
price models for tourist resorts (Sinclair et al. 1990 for the case of Malaga).
Conversely, the hedonic literature on housing is quite extensive, the implicit price of
each characteristic find through the regression represents the equilibrium between
demand and supply. As in Rosen the consumer’s utility is represented by:
),,( αYZuu = (2.1)
where: Z = characteristics of the house;
2 According to Goodman (1998), the reasons behind this gap in time is due to the major interests of academic world during the 50s and 60s for more macroeconomic themes along with the difficulty to apply techniques requiring sophisticated computer programmes which allow to individuate the most suitable functional form and the most significative variables among the explicative ones.

4
Y = composite good;
α = vector of consumer attributes (such as education, income, social status).
The budget of each individual is constraint by the income, the price of Y (all the other
goods) and the price of housing (function itself of housing characteristics). Therefore,
for each level of income and utility the willingness to pay (θ) for housing or “bid rent
function” is:
),,,( αβθ uMZ= (2.2)
where: Z= the quantity of attributes of the house;
M= consumer’s income;
u= the satisfaction of buying other goods;
α= individual’s preferences.
Implicitly the (2.2) assumes that consumer’s utility is:
),,( αβ−= MZuu (2.3)
where: Z= vector of attributes of the house
M – β= amount of income used for other goods
α= consumer’s preferences
The first derivative of the bid rent function is ∂β/∂Zi, i is the finite number of house
attributes. This derivative indicates the consumer’s willingness to pay each attribute
maintaining constant the level of his total utility. Given preferences and income, the
maximisation of individual’s utility in consuming both, the house and the composite
good is:
YZ
YZuu,
),,(max α= (2.4)
s.t.
M ≥ P(Z) + Y
where: P(Z)= income used to buy the house
Y = income used to buy others goods

5
The first order condition in this case is:
iiY
i Puu
∀= (2.5)
where: ui = ∂u/∂Zi
Pi = ∂P/∂Zi
The derivative Pi represents the demand implicit hedonic price for characteristic i (while
P(Z) represents the hedonic function of the total price).
If we equal the first order condition (2.5) to the derivative of the bid rent function we
obtain the consumer optimum:
iY
i
i
Puu
Z==
δδβ (2.6)
To introduce the supply side in the model, let us start by defining the cost function of
each firm:
),,( γNZCC = (2.7)
where: Z= characteristics of the house;
N= number of houses already produced
γ = vector of producer attributes which are different among producers (the cost
of the production factors and the parameters of the production function).
Each producer is price-taker with respect to the total market price P(Z), the optimum
profit is obtained when the difference between total revenue and total cost is
maximised:
NZ
NZCNZP,
),,()(max γπ −∗= (2.8)
The first order condition to maximise the profit is:
CiPi = (2.9a)
NCZP =)( (2.9b)

6
where: Ci= marginal cost of an additional unit of characteristic i;
CN = marginal cost of an additional house.
Equation (2.9a) implies that each characteristic will be produced until the marginal cost
to produce will be equal to the marginal price (the hedonic price). The (2.9b) means that
a new house will be produced until the marginal cost of producing an additional house
is equal to the total market marginal price of the house (which itself depends on the
characteristics embodied in the house).
Given the profit, the producer bid rent function is the combinations between house
attributes and the price the firm is willing to receive for each type he produces:
),,( γπφ Z= (2.10)
where: Z= quantity of attributes of the house
π= desired profit;
γ= costs of production.
The supplier is price- taker with a market price equal to P(Z) and, in order to maximise
the profit, the total market price has to be equal to the his willingness to receive for each
attributes (the reservation price):
)()( ZZP φ= (2.11) Finally, in the equilibrium situation for each house type exists an hedonic price
function P(Z) for which demand is equal to supply (the willingness to pay, the
willingness to accept and the hedonic price are the same).
This theoretical framework is behind the following general hedonic function use by the
housing literature3:
( , )HP f S QE= (2.12) where: HP = vector of housing price
S = vector of structural characteristics of housing
3 For a survey on this literature see Sheppard (1999).

7
QE = vector of location characteristics (level of amenities and disamenities
which affect housing price).
Among the several functional forms expressing the (2.12), the most common one is the
linear: ' 'HP S QEα β γ= + + (2.13)
where: β = vector of coefficients of the structural factors S
γ = vector of coefficients of external factors QE
As said before, the implicit price of each attribute indicates how much the total price
increases if the characteristic k (either structural or environmental) increases of one
marginal unit. The expected signs of the vectors are:
β' > 0 (∂P/∂S )
γ' > 0 (∂P/∂QE > 0) if the QE factor represents an amenity
γ' < 0 (∂P/∂QE < 0) if the QE factor represents a disamenity
3. Methodology
3.1. Indices of Tourism
To achieve the first goal of the paper, i.e. building reliable tourism indices for the
Sardinian municipalities, we apply two different methodologies and compare the final
classifications resulting from them.
The first of the two methodologies is based on a ranking procedure. Firstly, we collect
data on six variables linked with tourism: expenditure in the recreation and tourism
sector, number of summer houses, total number of recreational structures (hotels,
campings and tourist villages), number of employees in the tourism industry (which was
used to calculate location quotients), distance from the coast and altitude of each
municipality. Secondly, we create six different rankings, one for each variable, for all
municipalities. To do this, we used the Van der Waerden ranking scores (VdW), which
is a type of fractional rank. In order to understand what a fractional rank is, let us call

8
our observations iy and the corresponding case-weight4 Wi with i=1,2,…,377. After
defining A=377
1i
iW
=∑ , a “fractional rank” can be expressed as /i iRF R A= where iR is the
rank of each observation. Van der Waerden slightly modified this index proposing the
following formula:
/( 1)i iVdW R A= + (3.1)
The VdW fractional rank is simply a way of standardising scores5 so that they range
from 1/(n+1) to n/(n+1). In our case, with n=377, the domain of the scores is between a
value of around 0.0026 to a value of 0.9973. Note that a higher score corresponds to less
touristic areas and vice versa. After having calculated the VdW index for each touristic
variable separately, we average out the six scores to obtain the final index of tourism
(INDTUR4):
6
14i ij
jINDTUR VDW
=
= ∑ / 6 (3.2)
The second methodology borrowed the idea of Euclidean distance, which is at the core
of cluster analysis. Cluster analysis is a statistical procedure used to create groups of
similar cases from a sample of observations. Our initial thought was to use cluster
analysis to create different groups with increasing levels of tourism (from low to high
tourist locations). However, this would not provide a sequential ranking of all the
municipalities, which is essential for a comparison with the previous VdW index. Even
tough cluster analysis calculates the distance of each observation from the centroid of its
corresponding cluster, it says nothing about the direction away from the centroid.
Therefore, it is impossible to know whether the distance means that the specific
municipality is more or less touristic than the central observation of its cluster. To
overcome this problem, we selected a priori the municipality with the highest values for
the 6 tourist variables under analysis and we then calculated an n-dimensional (n=6)
4 We decided to give the same weight to all cases, but this hypothesis can be removed and weights like the population or the surface of each municipalities can be used to create a more sophisticated index. 5 For alternative ways of standardising scores see Tukey (1962) and Blom (1958)

9
Euclidean distance from this top-touristic municipality and each of the observations6.
The municipality we selected as a benchmark was Alghero. This urban area has 61
recreational structures, a location quotient of 2.14 for the tourism sector, an index per-
capita expenditure for recreational activities of 25.01, an average of 0.19 summer
houses per inhabitant, a distance from the coast of just 0.54 km and an altitude of 7
meters. After we select Alghero as a benchmark, we calculate the Euclidean distance
from it and the rest of the municipalities. The Euclidean distance between two items, i
and j, is the square root of the sum over the 6 variables of the difference in values
squared. In our case the Euclidean distance between Alghero (point A) and another
municipality (point ym) is expressed as:
62
1
( )mAy j m j
j
E A y=
= −∑ m=1, 2,..,377 (3.3)
These distances can be easily calculated by creating a cluster for each observation in the
sample (i.e. 377 clusters in our case) and using the distance matrix that is included in
the outcome of the cluster analysis. The distance matrix gives all the distances between
pairs of observations. By looking at the column (or row) corresponding to Alghero, we
had all the distances needed for our index (INDTUR5).
5m my AyINDTUR E= (3.4)
with A=Alghero, m=1,…,377
This index has a lower bound of zero (specifically Alghero with itself), but no upper
bound since the distance can take any value. In the future, one might consider
standardising this index, but we are not concerned with that here. All we care about is
that a lower value of INDTUR5 corresponds to a higher degree of tourism vocation of
the area as the case for the previous INDTUR4 index.
3.2. Hedonic Regression
6 The top-touristic location is also included

10
The indices described in the previous section, INDTUR4 and INDTUR5, are now
incorporated in an hedonic regression of type:
( , , , )i i i i iHP f S E QL T= (3.5)
with i=1,2,…,377
where HP=housing market variable
S=Vector of structural characteristics of the housing market
E=Vector of economic and location characteristics of the municipality
QL=Vector of quality of life variables at the municipality level
T = municipality tourist indices (either INDTUR4 or INDTUR5)
The function in equation (3.5) can be expressed using a variety of different forms. In
this work, we choose a simple linear form, not having any a-priori reason to assume a
different functional form. Equation (3.5) becomes therefore:
'( ) ( ) '( ) ( ) '( ) ( )k k m m p p
i i i i i iHP S E QL Tα β γ δ φ ε= + + + + + (3.6)
with i=1,2,…,377
where k=number of structural characteristics
m=number of economic and location characteristics of the municipality
p=number of quality of life variables
Notice that β , γ and δ are vectors and φ is a scalar, which gives us the effect of
tourism on the house market. We expect tourism to have a positive effect on housing
market, which means, recalling the way tourist indices have been built, that we expect
0i
i
HPT
φ∂= <
∂.
4. Results of the empirical Analysis Before analysing the results of our empirical analysis, it is important to give some
information about Sardinia. Sardinia is the second main island of Italy and is seven
hours away from the mainland by boat (around one hour by plane). It has a surface of
24.089 square km. (7,9% of the national surface) and a coastal line of 1.731 km.

11
Bathing water is safe in 847 kilometres of the coast (17% of the Italian safe coasts). The
island belongs to that group of Italian regions having a special statute (that means
among other legislative autonomy). Administratively the island is divided in four
provinces: Cagliari (in the South), Nuoro (in the East), Oristano (in the West) and
Sassari (in the North). The province of Cagliari has 108, Nuoro 104, Oristano 78 and
Sassari 90.
More than one and half million people live in Sardinia (1,651,888 in 1999, 2.8% of
Italian population). 50% of these live in the province of Cagliari and 28% in the
province of Sassari. The average population density is less than one third7 the average
population density of Italy (67 inhabitants per km2 versus 191). Sardinia relies upon five
ports (Arbatax, Cagliari, Golfo Aranci and Olbia) and three airports (Alghero, Cagliari
and Olbia). Since the 1960’s, when the tourism industry started developing very fast,
the province of Sassari has been the strongest attraction of Sardinia. Nowadays, 50% of
tourist demand is concentrated in Sassari and so are 50% of all the tourist beds (hotels,
camping sites and tourist villages).
This background information on the economy and tourism industry in Sardinia helps us
better understand the results of the empirical analysis, which are presented in the next
two sections.
4.1 Tourism indices As already explained in the previous paragraph, we devised two different
methodologies to create an index of how “touristic” each municipality is. The results of
the first index (INDTUR4), based on the Van Der Waerden proportional ranks, are
given in Figure 1 (see Table A.1, Appendix A, for a full list of the indices by
municipality).
7 More precisely 112 in Cagliari, 61 in Sassari, 60 in Oristano and 39 in Nuoro

12
Figure 1: Classification of Sardinian municipality according to INDTUR4
ConIndici030604 by Indtur4
0.65 to 0.821 (76)0.57 to 0.65 (70)0.5 to 0.57 (81)0.39 to 0.5 (72)0.06 to 0.39 (78)
Tourist municipalities are mainly located along the coastal line, as it is reasonable to
expect, while the central municipalities, more rural and less densely populated, are the
least tourist.
A similar result is obtained by applying the second methodology based on cluster
analysis (INDTUR5). Figure 2 presents the outcome of this (see Table A.2, Appendix
A, for a full list of indices by municipalities).
13
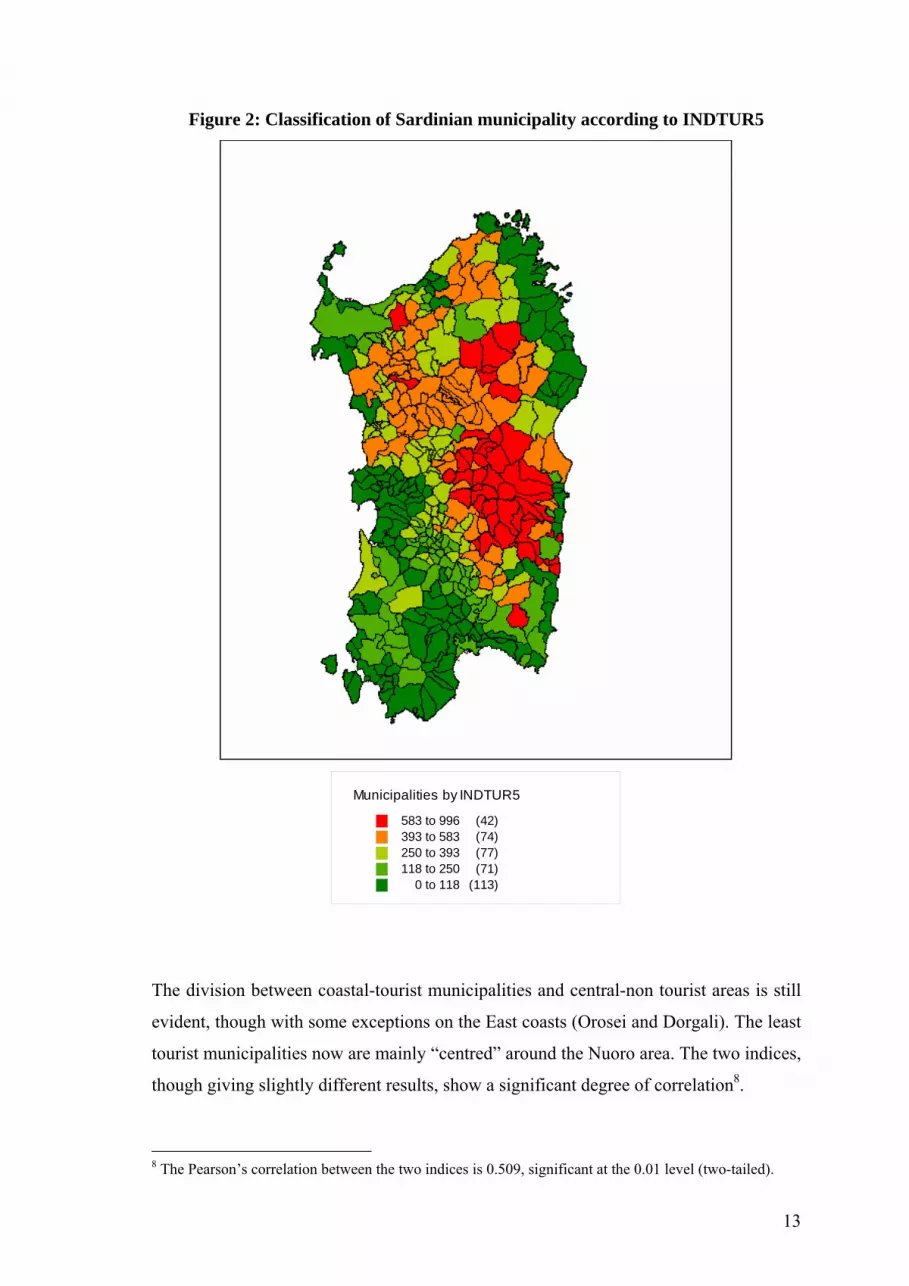
Figure 2: Classification of Sardinian municipality according to INDTUR5
Municipalities by INDTUR5
583 to 996 (42)393 to 583 (74)250 to 393 (77)118 to 250 (71)
0 to 118 (113)
The division between coastal-tourist municipalities and central-non tourist areas is still
evident, though with some exceptions on the East coasts (Orosei and Dorgali). The least
tourist municipalities now are mainly “centred” around the Nuoro area. The two indices,
though giving slightly different results, show a significant degree of correlation8.
8 The Pearson’s correlation between the two indices is 0.509, significant at the 0.01 level (two-tailed).

14
4.1 Hedonic regression analysis
The main aim of this section is to evaluate the effect of tourism on local house market,
i.e. are prices affected by tourism and, if so, is this effect significant?
To answer this question, we add the two statistical indices of tourism created in the
previous section in a hedonic regression analysis in which we regress the average house
rents on structural characteristics of houses, quality of life variables and economic
characteristics of the municipalities. A list of the explanatory variables used in the
analysis is shown in Table 1.
Table 1: definition of explanatory variables
Variable name Definition Type of variable (see equation 3.6)
Source
MEDSUPOC Average surface of houses (square meters)
S ISTAT
MEDROOM Average number of rooms per houses
S ISTAT
RED_ABI Average individual income (Euros)
E ISTAT
DENS Population density E Tagliacarne Institute
CONS_ABI Average individual consumption
E Tagliacarne Institute
CRIME Average of attack from 1994 to 1998 to institutional persons and their properties
QL UNCEM - ANCI Sardegna
DISTPRO Distance from the province E Our elaboration (MapInfo G.I.S)
RAIN Yearly rain (mm) QL Istituto Agro Meteorologico della Sardegna
INDTUR4 Index of tourism based on Van Der Waerden ranking procedure
T Our elaboration
INDTUR5 Index of tourism based on Euclidean distances
T Our elaboration
Table 2 presents the results of the final regression models. Model 1 includes structural
house characteristics (medsupoc and medroom), economic and location variables
(red_abi, dens, distpro) and quality of life variables (rain and crime) both at
municipality level. Model 1 gives us an idea of how the explanatory variables perform
15
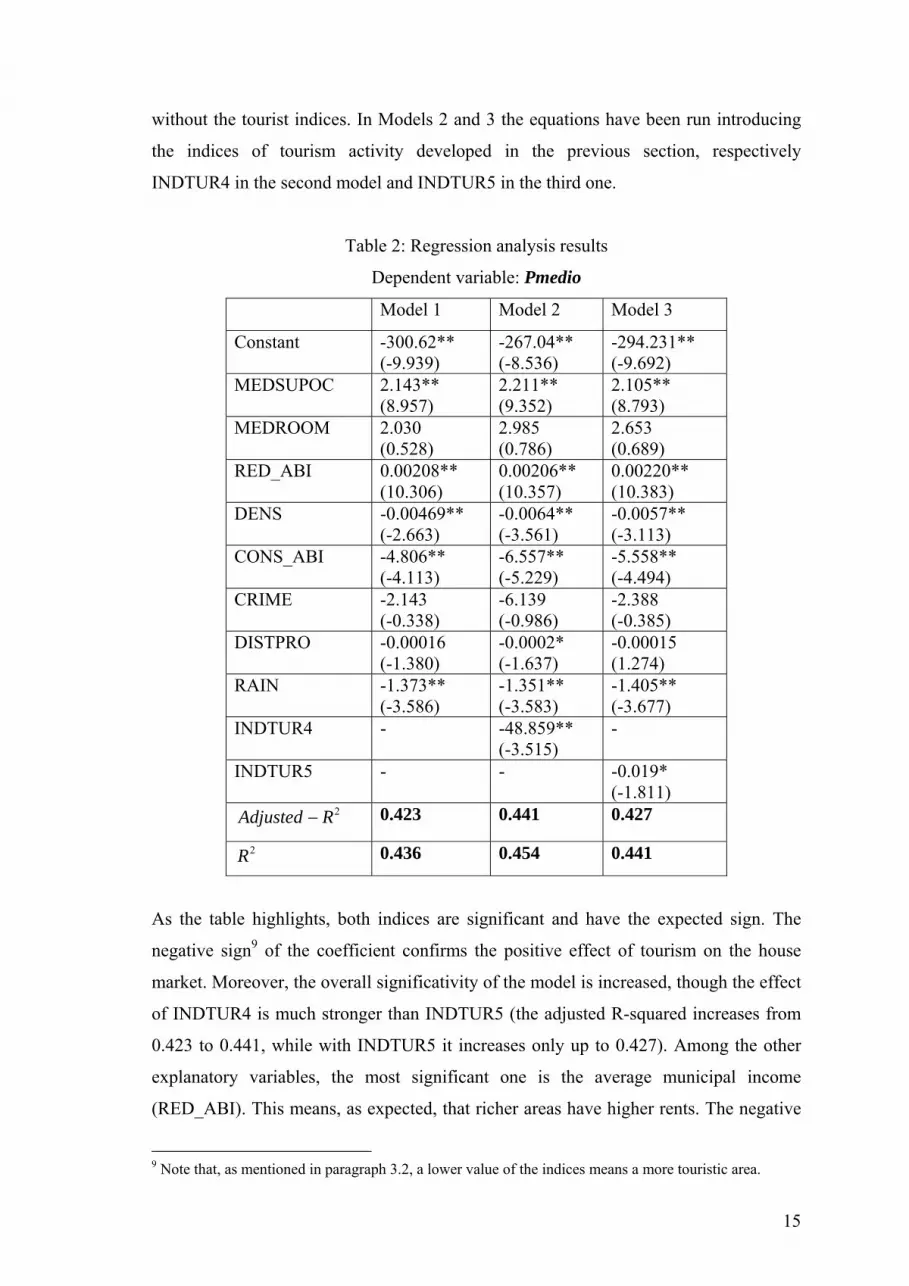
without the tourist indices. In Models 2 and 3 the equations have been run introducing
the indices of tourism activity developed in the previous section, respectively
INDTUR4 in the second model and INDTUR5 in the third one.
Table 2: Regression analysis results
Dependent variable: Pmedio
Model 1 Model 2 Model 3
Constant -300.62** (-9.939)
-267.04** (-8.536)
-294.231** (-9.692)
MEDSUPOC 2.143** (8.957)
2.211** (9.352)
2.105** (8.793)
MEDROOM 2.030 (0.528)
2.985 (0.786)
2.653 (0.689)
RED_ABI 0.00208** (10.306)
0.00206** (10.357)
0.00220** (10.383)
DENS -0.00469** (-2.663)
-0.0064** (-3.561)
-0.0057** (-3.113)
CONS_ABI -4.806** (-4.113)
-6.557** (-5.229)
-5.558** (-4.494)
CRIME -2.143 (-0.338)
-6.139 (-0.986)
-2.388 (-0.385)
DISTPRO -0.00016 (-1.380)
-0.0002* (-1.637)
-0.00015 (1.274)
RAIN -1.373** (-3.586)
-1.351** (-3.583)
-1.405** (-3.677)
INDTUR4 - -48.859** (-3.515)
-
INDTUR5 - - -0.019* (-1.811)
2Adjusted R− 0.423 0.441 0.427
2R 0.436 0.454 0.441
As the table highlights, both indices are significant and have the expected sign. The
negative sign9 of the coefficient confirms the positive effect of tourism on the house
market. Moreover, the overall significativity of the model is increased, though the effect
of INDTUR4 is much stronger than INDTUR5 (the adjusted R-squared increases from
0.423 to 0.441, while with INDTUR5 it increases only up to 0.427). Among the other
explanatory variables, the most significant one is the average municipal income
(RED_ABI). This means, as expected, that richer areas have higher rents. The negative
9 Note that, as mentioned in paragraph 3.2, a lower value of the indices means a more touristic area.

16
coefficient on population density seems to confirm that density is a proxy for congestion
rather than agglomeration economies (therefore having a negative effect on housing).
Another reasonable result is the sign of the coefficients of quality of life variables, such
as rain and crime, which have a negative impact on house prices. Being distant from the
province (an index of “centrality”) affects negatively the house market although the
negative coefficients are not very significant (only in Model 2 the coefficients is
significant at 10% level). Out of the two structural housing characteristics, only
MEDSUPOC is significantly and positively correlated with the rent, while MEDROOM
is insignificant in all three models. An unexpected result was the sign on the average
consumption variable. The significant and negative sign seems to testify a substitution
effect between consumption and housing (crowding out).
5. Conclusions
This paper develops two levels of analysis. The first one is dominated by the believe
that the discrimination between tourist and non-tourist location should be scientific and
should take into account the complex character of the tourism good. Therefore, two
indices have been developed using two different methodologies with the purpose to
compare their results regarding the municipalities classification. In general, both indices
gives sensible results, though slightly different final rankings, and are significantly
correlated.
The second level of investigation tries to find insights on the relationship between
tourist activity and house prices. In order to do this, we use an hedonic function
implying the dependence among house price and, respectively, the structural attributes
of the good, the quality of the place in which the house is located, and the “tourist”
characteristic of the place. The findings confirm the expectations, house market is
affected by tourism in a positive way, namely, the more touristic is the place, the higher
is the competitive pressure on the house market.
The results of the analysis are rather encouraging in continuing to research in this
direction. One of the possible future developments of the work will be the introduction
of a more complex hedonic equation to allow for a non-linear relationship between
houses prices (therefore implicit prices) and the explanatory variables. Furthermore, it

17
would be important to consider spatial effects arising from the proximity of the
municipalities under analysis. Some refinements of the indices could also be devised.
References
Blom, G. (1958), Statistical estimates and transformed beta variables, John Wiley &
Sons, New York. Candela, G. (1996), Manuale di Economia del turismo, Clueb, Bologna.
Clerides, S.K., Nearchou, P. and Pashardes, P. (2003), ‘Price and quality in international
tourism’, preliminary draft.
Clewer, A., Pack, A. and Sinclair, M.T. (1992), ‘Price competitiveness and inclusive
tour holidays in European cities’, in P. Johnson and B. Thomas (eds), Choice and Demand in Tourism, London, Mansell.
Espinet, J.M., Saez, M. Coendus, G. and Fluvià, M. (2003), ‘Effect on prices of the
attributes of holiday hotels: a hedonic approach’, Tourism Economics, 9, 2, pp 165-177.
Gilbert, D.C. (1990), "Conceptual Issues in Meaning of Tourism" in Cooper C.P.,
Progress in Tourism. Recreation and Hospitality Management, Belhaven Press, London.
Griliches, Z. (1961), “Hedonic price indexes for automobiles: an econometric analysis
of quality change”, The Price Statistics of the Federal Government, 73. Griliches, Z. (1971), “Price Indexes and Quality Change: Studies in New Methods of
Measurement, Harvard University Press, Cambridge, MA. Mangion, M.L., Durbarry, R., Sinclair, M.T. (2003), ‘AIDS and the hedonic pricing
models, their relevance to tourism practitioners’, preliminary draft. Papatheodorou, A. (2002), ‘Exploring competitiveness in Mediterranean resorts,
Tourism Economics, 8, 2, pp 133-150. Rosen, S. (1974), “Hedonic Prices and implicit market: product differentiation in pure
competition”, Journal of Political Economy, 82, pp 34-55. Sheppard, S. (1999), “Hedonic Analysis of Housing Market”, in Handbook of Regional
and Urban Economics, E. S. Mills and P. Cheshire (eds), Elsevier Science. Sinclair M.T., Stabler M. (1997), The Economics of Tourism, Routledge, London.

18
Sinclair, M.T. Clewer, A. and Pack, A. (1990), ‘Hedonic prices and the mastering of package holidays: the case of tourism resorts in Malaga’, in G.J. Ashworth and B. Goodall (eds), Marketing Tourism Places, London and New York, Routledge.
Stabler, M. (1998), “The economic evaluation of the role of conservation and tourism in
the regeneration of historic urban destinations”, in Laws E. et al. (eds), Embracing and Managing Change in Tourism, Routledge, London.
Stabler, M. (1999), “Environmental Aspects of Tourism: Application of Cost-Benefit
Analysis” in Baum T. e Mudambi R. (eds) , Economic and Management Method for Tourism Hospitality Research, Wiley and Sons, New York.
Tukey, J. W. (1962), The future of data analysis, The Annals of Mathematical Statistics,
No. 33, pp 1–67 University of Hamburg (2004), Algorithem für SPSS 11.5,
http://www.rrz.unihamburg.de/RRZ/Software/SPSS/Algorith.115/
Appendix A
Table A.1: Ranking of municipalities by INDTUR4
Ranking COMUNE VdW Score 1 Palau 0.06129 1 Alghero 0.06129 3 Pula 0.06900 4 S.Teresa di Gallura 0.08135 5 La Maddalena 0.08245 6 S.Teodoro 0.08488 7 Bosa 0.09590 8 Olbia 0.09766 9 Arzachena 0.09832 10 Muravera 0.09854 11 Villasimius 0.10428 12 Carloforte 0.10670 13 Budoni 0.10913 14 Golfo Aranci 0.11464 15 Orosei 0.12412 16 Calasetta 0.12698 17 Valledoria 0.12831 18 Stintino 0.13514 19 S.Antioco 0.13558 20 Castelsardo 0.14749 21 Teulada 0.15057 22 Siniscola 0.15675 23 Posada 0.15983 24 S.Anna Arresi 0.16071 25 Quartu S.Elena 0.16116 26 Bari Sardo 0.16182 27 Domus De Maria 0.16204

19
28 Sorso 0.17504 29 Badesi 0.19092 30 Cabras 0.19356 31 Fluminimaggiore 0.19577 32 Villaputzu 0.19819 33 Dorgali 0.20018 34 Loiri Porto S.Paolo 0.20326 35 Trinita' d'Agultu e Vi 0.20459 36 Buggerru 0.20723 37 Lotzorai 0.21274 38 Cagliari 0.22354 39 Tortoli' 0.22840 40 Castiadas 0.23567 41 Cuglieri 0.24184 42 Oristano 0.24691 43 Tertenia 0.24846 44 Cardedu 0.24912 45 Sinnai 0.25022 46 Baunei 0.25044 47 Maracalagonis 0.25441 48 S.Vero Milis 0.25639 49 Narbolia 0.26213 50 Arbus 0.27050 51 Sarroch 0.27734 52 Portoscuso 0.28086 53 Magomadas 0.28439 54 Aglientu 0.28704 55 Gonnesa 0.29299 56 Selargius 0.29365 57 Terralba 0.29696 58 Porto Torres 0.30049 59 Tresnuraghes 0.30732 60 Torpe' 0.31724 61 Girasole 0.33466 62 Capoterra 0.34854 63 Telti 0.35097 64 Arborea 0.35604 65 Quartucciu 0.35913 66 Masainas 0.36243 67 S.Vito 0.36354 68 Lode' 0.36442 69 S.Maria Coghinas 0.36772 70 Sassari 0.36883 71 Tratalias 0.37059 72 Perfugas 0.37125 73 Villamassargia 0.37456 74 Loceri 0.37654 75 Jerzu 0.37941 76 Assemini 0.38095 77 Berchidda 0.38183 78 Monserrato 0.38228 79 S.Giovanni Suergiu 0.38889 80 Solarussa 0.39220 81 Iglesias 0.39660

20
82 Pozzomaggiore 0.39683 83 Palmas Arborea 0.39705 84 Nurachi 0.39969 85 Oschiri 0.40476 86 Villa S.Pietro 0.41027 87 Riola Sardo 0.41270 88 Santadi 0.41601 89 Guspini 0.42284 90 Narcao 0.42284 91 Bortigiadas 0.42328 92 Padria 0.42681 93 Villaurbana 0.43011 94 Galtelli' 0.43011 95 Santu Lussurgiu 0.43034 96 Uras 0.43034 97 Fordongianus 0.43386 98 Monti 0.43519 99 Gonnosfanadiga 0.43651 100 Sennori 0.43849 101 S.Sperate 0.43893 102 S.Giusta 0.43915 103 Baratili S.Pietro 0.44114 104 Pau 0.44136 105 Abbasanta 0.44158 106 S.Nicolo' D'Arcidano 0.44180 107 Bauladu 0.44466 108 Simaxis 0.44489 109 Villanova Monteleone 0.44511 110 Uta 0.44577 111 Sardara 0.44643 112 S.Antonio di Gallura 0.44974 113 Tempio Pausania 0.45018 114 Oliena 0.45040 115 Villanova Truschedu 0.45150 116 Sennariolo 0.45282 117 Irgoli 0.45326 118 Laerru 0.45392 119 Tuili 0.45525 120 Viddalba 0.45547 121 Carbonia 0.45569 122 Olmedo 0.45657 123 Bonarcado 0.45657 124 Bonorva 0.46010 125 Elmas 0.46010 126 S.Gavino Monreale 0.46098 127 Seneghe 0.46208 128 Villasor 0.46384 129 Bulzi 0.46407 130 Allai 0.46539 131 Triei 0.46583 132 Ollastra Simaxis 0.46649 133 Marrubiu 0.47156 134 Montresta 0.47200 135 Siamaggiore 0.47685

21
136 Arzana 0.47817 137 Villacidro 0.47884 138 Giba 0.47994 139 Lanusei 0.48038 140 Masullas 0.48082 141 Samassi 0.48236 142 Bolotana 0.48369 143 Tramatza 0.48391 144 Gairo 0.48523 145 Villagrande Strisaili 0.48545 146 Seui 0.48765 147 Ballao 0.48787 148 Ales 0.49140 149 Sorgono 0.49449 150 Mores 0.49493 151 Gavoi 0.49537 152 Tonara 0.49537 153 Gonnoscodina 0.49669 154 Ghilarza 0.49691 155 Milis 0.49802 156 Luras 0.49934 157 Villaperuccio 0.50088 158 Nuoro 0.50198 159 Aritzo 0.50265 160 Senorbi' 0.50287 161 Vallermosa 0.50375 162 Sestu 0.50485 163 Luogosanto 0.50529 164 Desulo 0.50573 165 Monastir 0.50794 166 Nulvi 0.50948 167 Villa Verde 0.50948 168 Macomer 0.50970 169 Decimomannu 0.51058 170 Nuraminis 0.51058 171 Osilo 0.51124 172 Ossi 0.51190 173 Ittiri 0.51323 174 Tergu 0.51411 175 Padru 0.51477 176 Siliqua 0.51477 177 Settimo S.Pietro 0.51543 178 Sedini 0.51918 179 Tadasuni 0.52006 180 Perdasdefogu 0.52160 181 Sanluri 0.52293 182 Serramanna 0.52359 183 Uri 0.52535 184 Borore 0.52557 185 Onifai 0.52756 186 Suni 0.52844 187 Ula Tirso 0.53020 188 Perdaxius 0.53153 189 Modolo 0.53175

22
190 Gonnostramatza 0.53263 191 Soleminis 0.53307 192 Osini 0.53351 193 Domusnovas 0.53373 194 Mamoiada 0.53417 195 Thiesi 0.53483 196 Seulo 0.53616 197 Scano di Montiferro 0.53638 198 Bono 0.53704 199 Banari 0.53726 200 Villanovaforru 0.53902 201 Musei 0.54034 202 Escalaplano 0.54123 203 Piscinas 0.54211 204 Tula 0.54431 205 Barumini 0.54541 206 Bultei 0.54630 207 Fonni 0.54630 208 Ozieri 0.54740 209 Orgosolo 0.54784 210 Senis 0.54850 211 Calangianus 0.54872 212 Decimoputzu 0.54894 213 Onani' 0.54916 214 Pabillonis 0.54938 215 Ploaghe 0.55004 216 Ortacesus 0.55071 217 Sindia 0.55115 218 Paulilatino 0.55159 219 Zeddiani 0.55203 220 Norbello 0.55225 221 Nuxis 0.55644 222 Budduso' 0.55710 223 Albagiara 0.55754 224 Usini 0.55886 225 Serrenti 0.56063 226 Martis 0.56085 227 Dolianova 0.56107 228 Nughedu S.Vittoria 0.56195
229 Monteleone RoccaDoria 0.56217
230 Mogoro 0.56261 231 Ussassai 0.56349 232 Samugheo 0.56504 233 Simala 0.56548 234 Bidoni' 0.56592 235 Ortueri 0.56636 236 Florinas 0.56768 237 Pompu 0.57231 238 Armungia 0.57518 239 Bortigali 0.57628 240 Mara 0.57628 241 Borutta 0.57804 242 Isili 0.57848 243 Zerfaliu 0.57870

23
244 Bonnannaro 0.57892 245 Nureci 0.58047 246 Sedilo 0.58047 247 Busachi 0.58422 248 Ulassai 0.58444 249 Urzulei 0.58466 250 Ussana 0.58840 251 Baressa 0.58951 252 Gergei 0.58951 253 Sini 0.59039 254 Gesturi 0.59061 255 Ussaramanna 0.59061 256 Tiana 0.59083 257 Assolo 0.59281 258 Flussio 0.59347 259 Lunamatrona 0.59722 260 Cossoine 0.59810 261 Tinnura 0.59854 262 Giave 0.59899 263 Talana 0.60009 264 Villaspeciosa 0.60229 265 Loculi 0.60384 266 Usellus 0.60406 267 Codrongianos 0.60780 268 Ilbono 0.60957 269 Chiaramonti 0.61067 270 Romana 0.61287 271 Elini 0.61486 272 Illorai 0.61508 273 Villa S.Antonio 0.61684 274 Donori 0.61706 275 Genuri 0.61772 276 Sagama 0.61772 277 Ottana 0.61861 278 Segariu 0.61993 279 Villasalto 0.62037 280 Erula 0.62213 281 Tissi 0.62257 282 Goni 0.62280 283 Bitti 0.62434 284 Nuragus 0.62434 285 Nurallao 0.62566 286 Aggius 0.62765 287 Guasila 0.63117 288 Curcuris 0.63228 289 Boroneddu 0.63338 290 Orune 0.63426 291 Benetutti 0.63646 292 Serdiana 0.63779 293 Ollolai 0.63845 294 Villamar 0.63911 295 Siamanna 0.64308 296 Ardauli 0.64396 297 Torralba 0.64396

24
298 Anela 0.64418 299 S.Nicolo' Gerrei 0.64418 300 Ardara 0.64484 301 Esterzili 0.64484 302 Morgongiori 0.64616 303 Villanovafranca 0.64638 304 Silanus 0.64660 305 Siligo 0.64660 306 Siris 0.65035 307 Ruinas 0.65123 308 S.Andrea Frius 0.65123 309 Siapiccia 0.65278 310 Gonnosno' 0.65366 311 Laconi 0.65454 312 Silius 0.65564 313 Suelli 0.65829 314 Orroli 0.66005 315 Turri 0.66204 316 Sarule 0.66248 317 Meana Sardo 0.66424 318 Aidomaggiore 0.66468 319 Esporlatu 0.66512 320 Putifigari 0.66601 321 Cargeghe 0.66645 322 Collinas 0.66909 323 Orotelli 0.67086 324 Bottidda 0.67174 325 Pattada 0.67240 326 Sadali 0.67306 327 Las Plassas 0.67394 328 S.Basilio 0.67416 329 Samatzai 0.67416 330 Semestene 0.67416 331 Ala' dei Sardi 0.67681 332 Siddi 0.67747 333 Belvi' 0.68166 334 Barrali 0.68210 335 Baradili 0.68254 336 Bessude 0.68342 337 Selegas 0.68386 338 Lula 0.68673 339 Gadoni 0.68717 340 Cheremule 0.68739 341 Setzu 0.68981 342 Burcei 0.69026 343 Nurri 0.69026 344 Soddi 0.69070 345 Pimentel 0.69158 346 Neoneli 0.69246 347 Siurgus Donigala 0.69687 348 Gesico 0.69731 349 Muros 0.70216 350 Dualchi 0.70282 351 Villanova Tulo 0.70304
25
352 Sorradile 0.70392 353 Furtei 0.71032 354 Guamaggiore 0.71076 355 Ovodda 0.71186 356 Mandas 0.71605 357 Asuni 0.71715 358 Nughedu S.Nicolo' 0.71892 359 Burgos 0.71914 360 Olzai 0.71980 361 Atzara 0.72134 362 Pauli Arbarei 0.72443 363 Noragugume 0.72619 364 Austis 0.73280 365 Orani 0.73369 366 Mogorella 0.73369 367 Lodine 0.73567 368 Ittireddu 0.73743 369 Birori 0.74228 370 Genoni 0.75000 371 Serri 0.75463 372 Nule 0.75750 373 Lei 0.75992 374 Teti 0.76499 375 Osidda 0.77072 376 Oniferi 0.78219 377 Escolca 0.81680
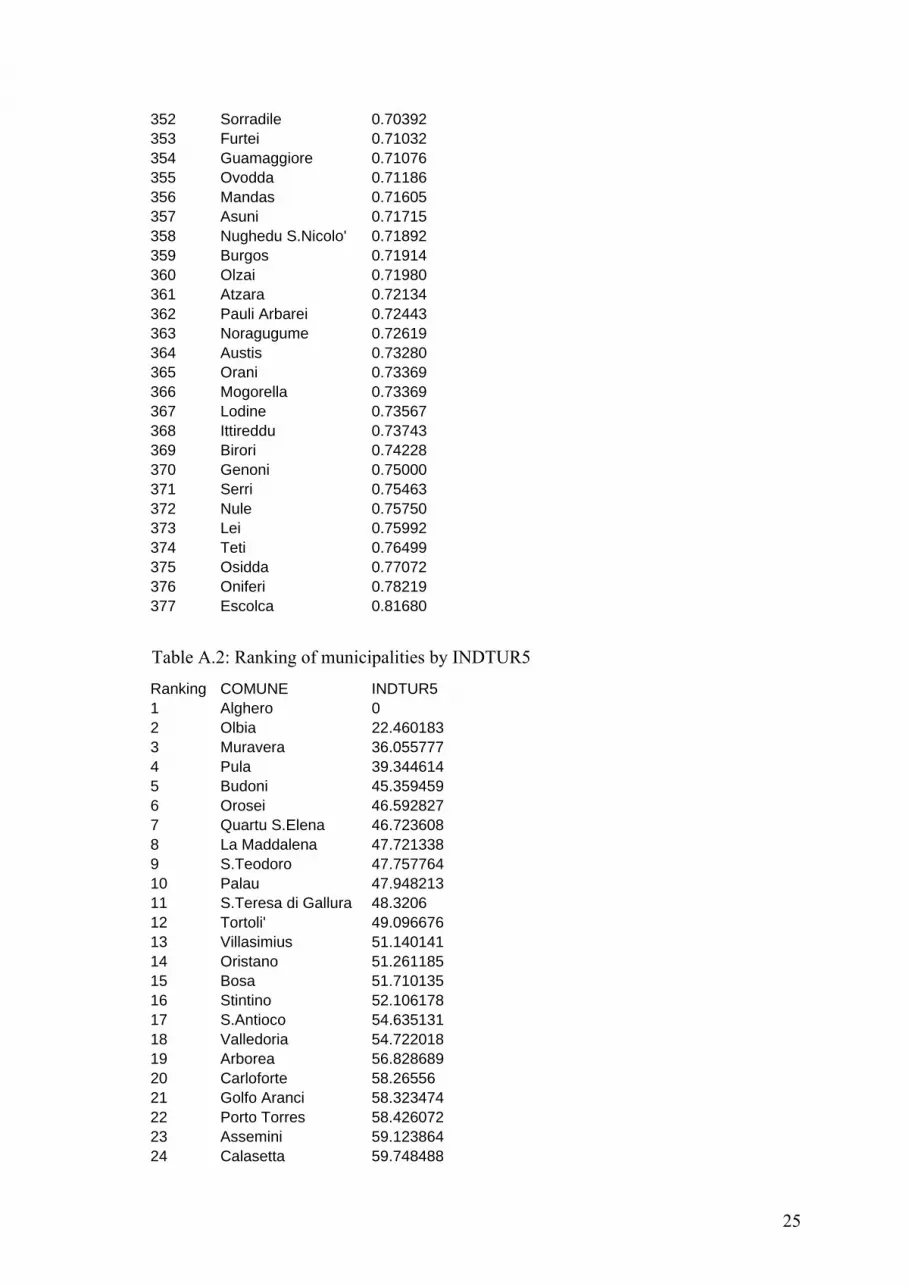
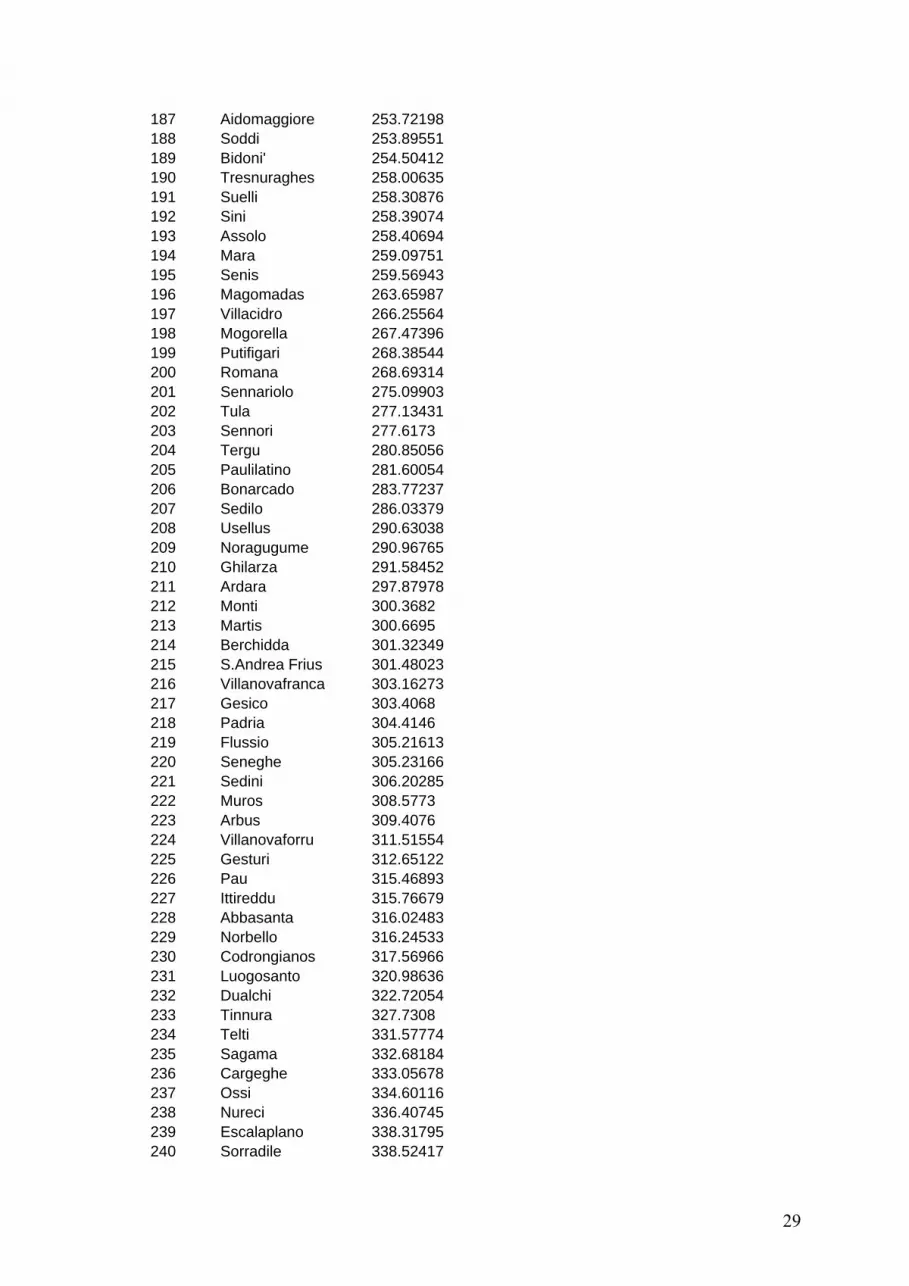
Table A.2: Ranking of municipalities by INDTUR5
Ranking COMUNE INDTUR5 1 Alghero 0 2 Olbia 22.460183 3 Muravera 36.055777 4 Pula 39.344614 5 Budoni 45.359459 6 Orosei 46.592827 7 Quartu S.Elena 46.723608 8 La Maddalena 47.721338 9 S.Teodoro 47.757764 10 Palau 47.948213 11 S.Teresa di Gallura 48.3206 12 Tortoli' 49.096676 13 Villasimius 51.140141 14 Oristano 51.261185 15 Bosa 51.710135 16 Stintino 52.106178 17 S.Antioco 54.635131 18 Valledoria 54.722018 19 Arborea 56.828689 20 Carloforte 58.26556 21 Golfo Aranci 58.323474 22 Porto Torres 58.426072 23 Assemini 59.123864 24 Calasetta 59.748488

26
25 Lotzorai 60.075373 26 Monserrato 60.647473 27 Cabras 60.763697 28 Selargius 60.792851 29 Villaputzu 61.316444 30 Portoscuso 61.914202 31 Posada 62.657377 32 Terralba 63.429879 33 S.Vero Milis 63.691429 34 Siniscola 63.726678 35 Quartucciu 63.831641 36 S.Giusta 64.676197 37 Girasole 64.844061 38 Elmas 64.900443 39 Uta 65.045372 40 S.Giovanni Suergiu 65.272798 41 S.Maria Coghinas 65.468174 42 Marrubiu 65.631503 43 Nurachi 65.978585 44 Riola Sardo 66.100769 45 Palmas Arborea 66.117132 46 Decimomannu 66.210639 47 Baratili S.Pietro 66.411432 48 Siamaggiore 66.451223 49 Zeddiani 66.603153 50 Solarussa 66.796377 51 S.Nicolo' D'Arcidano 66.824518 52 Padru 67.047663 53 Simaxis 67.476386 54 Torpe' 67.704861 55 Irgoli 67.750159 56 Villaspeciosa 67.958688 57 Zerfaliu 68.006905 58 Tramatza 68.125572 59 Decimoputzu 68.69359 60 Gonnesa 68.813154 61 Viddalba 68.827705 62 Uras 68.964892 63 Loculi 69.402827 64 Tratalias 69.632591 65 Onifai 69.685613 66 Ollastra Simaxis 69.773701 67 Villasor 69.906269 68 Villa S.Pietro 70.437084 69 Galtelli' 70.73599 70 Bari Sardo 71.842513 71 Cardedu 71.848491 72 Teulada 72.718483 73 Sarroch 73.220026 74 S.Sperate 73.420767 75 Serramanna 73.516638 76 Fluminimaggiore 73.994034 77 Sestu 74.154344 78 Bauladu 74.520133

27
79 Capoterra 75.266734 80 Fordongianus 75.792327 81 Pabillonis 76.019699 82 Buggerru 77.497136 83 Siamanna 80.142515 84 Arzachena 80.671957 85 Masainas 81.267801 86 Narbolia 81.314123 87 S.Gavino Monreale 83.145309 88 Giba 83.80234 89 Domus De Maria 84.21314 90 Villanova Truschedu 84.672133 91 Samassi 86.580113 92 Piscinas 88.749351 93 Olmedo 88.893314 94 Allai 89.056148 95 Siapiccia 89.081827 96 Villaperuccio 90.341279 97 Settimo S.Pietro 90.597123 98 Siliqua 90.962562 99 S.Anna Arresi 91.949051 100 Milis 93.153389 101 Vallermosa 94.712148 102 Maracalagonis 100.00413 103 Monastir 101.15596 104 Villaurbana 102.74259 105 Perfugas 107.31292 106 Ballao 108.35157 107 Badesi 109.07582 108 Nuraminis 110.44817 109 Loiri Porto S.Paolo 110.8593 110 Perdaxius 112.88668 111 Ussana 112.88851 112 Furtei 113.21647 113 Gonnostramatza 113.81585 114 Castelsardo 118.22839 115 Carbonia 120.99588 116 Villamar 126.60678 117 Gonnoscodina 126.67282 118 Serrenti 128.62711 119 Tertenia 130.98659 120 Musei 131.22464 121 Villamassargia 131.90855 122 Segariu 134.02636 123 Narcao 135.35645 124 Guspini 138.8918 125 S.Vito 139.86914 126 Masullas 140.31842 127 Sorso 140.34984 128 Sinnai 140.92317 129 Curcuris 141.68675 130 Mogoro 142.58816 131 Modolo 143.11968 132 Cagliari 144.18982

28
133 Santadi 144.25163 134 Sanluri 146.85645 135 Triei 148.40486 136 Pauli Arbarei 148.96768 137 Barrali 151.12341 138 Donori 151.8353 139 Pompu 156.3126 140 Uri 157.9564 141 Domusnovas 159.85148 142 Las Plassas 160.48124 143 Sardara 162.86183 144 Pimentel 163.7469 145 Simala 163.89363 146 Ussaramanna 167.87181 147 Siris 168.82334 148 Samatzai 170.88722 149 Castiadas 171.60869 150 Ortacesus 171.7198 151 Turri 173.356 152 Baressa 173.57154 153 Baradili 173.92088 154 Serdiana 177.33674 155 Laerru 182.60758 156 Gonnosfanadiga 185.19101 157 Tadasuni 187.99325 158 Lunamatrona 188.01505 159 Siddi 191.45493 160 Loceri 194.58634 161 Ottana 195.08694 162 Nuxis 195.27242 163 Ales 199.43192 164 Gonnosno' 201.07533 165 Iglesias 201.50942 166 Soleminis 203.96327 167 Usini 204.42911 168 Bulzi 205.02132 169 Senorbi' 205.851 170 Guamaggiore 206.62779 171 Oschiri 207.79098 172 Villa Verde 208.95454 173 Barumini 209.02149 174 Setzu 212.38381 175 Tuili 213.66201 176 Dolianova 215.59099 177 Guasila 217.5521 178 Albagiara 219.73929 179 Boroneddu 221.4341 180 Tissi 228.20647 181 Sassari 231.39334 182 Genuri 234.75213 183 Asuni 237.69013 184 Selegas 239.33199 185 Villa S.Antonio 250.79725 186 Collinas 252.48186
29
187 Aidomaggiore 253.72198 188 Soddi 253.89551 189 Bidoni' 254.50412 190 Tresnuraghes 258.00635 191 Suelli 258.30876 192 Sini 258.39074 193 Assolo 258.40694 194 Mara 259.09751 195 Senis 259.56943 196 Magomadas 263.65987 197 Villacidro 266.25564 198 Mogorella 267.47396 199 Putifigari 268.38544 200 Romana 268.69314 201 Sennariolo 275.09903 202 Tula 277.13431 203 Sennori 277.6173 204 Tergu 280.85056 205 Paulilatino 281.60054 206 Bonarcado 283.77237 207 Sedilo 286.03379 208 Usellus 290.63038 209 Noragugume 290.96765 210 Ghilarza 291.58452 211 Ardara 297.87978 212 Monti 300.3682 213 Martis 300.6695 214 Berchidda 301.32349 215 S.Andrea Frius 301.48023 216 Villanovafranca 303.16273 217 Gesico 303.4068 218 Padria 304.4146 219 Flussio 305.21613 220 Seneghe 305.23166 221 Sedini 306.20285 222 Muros 308.5773 223 Arbus 309.4076 224 Villanovaforru 311.51554 225 Gesturi 312.65122 226 Pau 315.46893 227 Ittireddu 315.76679 228 Abbasanta 316.02483 229 Norbello 316.24533 230 Codrongianos 317.56966 231 Luogosanto 320.98636 232 Dualchi 322.72054 233 Tinnura 327.7308 234 Telti 331.57774 235 Sagama 332.68184 236 Cargeghe 333.05678 237 Ossi 334.60116 238 Nureci 336.40745 239 Escalaplano 338.31795 240 Sorradile 338.52417

30
241 Suni 339.44627 242 Lode' 344.33643 243 Ula Tirso 349.00257 244 Morgongiori 350.76119 245 S.Antonio di Gallura 354.2959 246 Ruinas 359.26286 247 Nuragus 360.45228 248 Trinita' d'Agultu e Vi 362.3587 249 S.Nicolo' Gerrei 364.86644 250 Armungia 365.59167 251 Mores 366.70896
252 Monteleone RoccaDoria 367.22866
253 Samugheo 370.32574 254 Gergei 375.56409 255 Oliena 377.34673 256 Scano di Montiferro 378.82378 257 Busachi 379.19886 258 Goni 382.75413 259 Dorgali 385.6422 260 Ozieri 390.0828 261 Nurallao 391.13424 262 Borore 393.27502 263 Bottidda 397.13375 264 Ittiri 398.34927 265 Ilbono 398.56401 266 Semestene 404.10092 267 Bonnannaro 404.37828 268 Siligo 405.53249 269 Benetutti 406.37255 270 Orotelli 406.63917 271 Montresta 408.23051 272 Florinas 415.75889 273 Escolca 416.67394 274 Aglientu 417.26208 275 Banari 417.87341 276 S.Basilio 419.55151 277 Ardauli 420.64107 278 Ploaghe 423.66499 279 Jerzu 424.94305 280 Chiaramonti 428.44656 281 Torralba 429.08308 282 Silanus 431.33836 283 Pozzomaggiore 436.16404 284 Bessude 445.92499 285 Genoni 446.54422 286 Anela 446.83863 287 Siurgus Donigala 451.47292 288 Erula 455.17221 289 Lei 455.27535 290 Mandas 456.80517 291 Thiesi 459.16014 292 Birori 462.55091 293 Borutta 469.63358 294 Elini 469.79713

31
295 Bolotana 471.00338 296 Esporlatu 472.68564 297 Olzai 473.33556 298 Nulvi 475.54513 299 Bortigiadas 476.75719 300 Baunei 477.08981 301 Oniferi 477.09104 302 Cuglieri 479.85129 303 Onani' 480.10142 304 Nughedu S.Vittoria 494.9293 305 Calangianus 497.82492 306 Villasalto 499.74228 307 Santu Lussurgiu 500.12181 308 Bortigali 503.14735 309 Luras 505.59981 310 Bonorva 505.82579 311 Sindia 507.43872 312 Urzulei 508.30525 313 Bultei 508.79287 314 Aggius 511.47183 315 Lula 513.66633 316 Illorai 514.11564 317 Orani 519.46089 318 Isili 521.73482 319 Cossoine 526.6741 320 Orroli 528.04042 321 Cheremule 537.68572 322 Bono 538.98708 323 Atzara 539.02499 324 Nuoro 545.17369 325 Bitti 545.59363 326 Laconi 548.53325 327 Neoneli 552.26173 328 Burgos 559.64087 329 Macomer 559.74601 330 Tiana 562.49505 331 Tempio Pausania 562.51804 332 Silius 562.57485 333 Villanova Monteleone 563.63608 334 Villanova Tulo 569.09929 335 Nughedu S.Nicolo' 575.48793 336 Ortueri 583.04425 337 Meana Sardo 586.40221 338 Nurri 587.75993 339 Lanusei 591.35593 340 Giave 592.33173 341 Perdasdefogu 595.76365 342 Osilo 611.60131 343 Serri 615.02967 344 Orgosolo 616.66018 345 Sarule 623.54518 346 Mamoiada 640.88466 347 Osini 641.53473 348 Burcei 644.48809

32
349 Nule 647.71428 350 Osidda 647.84128 351 Belvi' 657.56126 352 Ala' dei Sardi 660.02212 353 Ussassai 666.65525 354 Arzana 668.14583 355 Talana 678.2212 356 Gairo 681.2233 357 Sorgono 685.63428 358 Gadoni 693.3927 359 Villagrande Strisaili 696.03957 360 Budduso' 697.1422 361 Sadali 701.88939 362 Ovodda 707.22174 363 Teti 711.41807 364 Esterzili 727.6961 365 Austis 734.39344 366 Orune 746.31891 367 Ulassai 770.84821 368 Pattada 775.03123 369 Gavoi 786.33511 370 Aritzo 792.49727 371 Seulo 795.52829 372 Seui 816.10394 373 Lodine 880.1687 374 Desulo 884.00033 375 Tonara 896.07165 376 Ollolai 916.12401 377 Fonni 995.47069