erp indices of undifferentiated visual attentional search strategies in 5 years old preterm children
TRANSCRIPT

ERP indices of undifferentiated visual attentional search
strategies in 5 years old preterm children.
Rémy Dupin*, Jean-Paul Laurent*, Johannes E. A. Stauder**, Eric Degiovani***,
Elie Saliba*,
* INSERM 316, Médecine Néonatale, Hôpital de Clocheville, 49 bd Béranger, 37044 Tours Cedex, France. ** Faculteit der Psychologie, Universiteit Maastricht, Postbus 616, 6200 MD Maastricht, Pays-Bas. *** Service d’exploration Fonctionelle, CHU Bretonneau, 2 bd Tonnelé, 37044 Tours Cedex 1, France

ERP indices of attentional dysfunction in 5 year old premature children 1
ABSTRACT
The assumption that preterm children have difficulties in maintaining their
selective attention was tested in a serial and automatic visual task. Ten 5 year old
premature children were compared to ten full-term children, matched for age and
IQ, using a search paradigm. Subjects had to detect a random target defined by a
feature (pop-out task) or a conjunction of two features (serial task) among 7
distractors. Accuracy and RT were analyzed and event-related potentials (ERP)
were recorded from 8 scalp sites, at F3, Fz, F4, T4, Cz, T5, Pz, Oz sites.
Behavioral and electrophysiological data were analyzed in repeated measure
Manovas. Results showed a significant group by task effect on N2b and P3
amplitude at anterior sites, and group by task by block effect on P3 amplitude at
posterior sites. There was no significant group effect on RT. These data support
the view that, in contrast to full-term children, 5 years old premature children are
not able to modulate visual search strategies according to task difficulty.
Key Words: Event-Related Potentials, attention, children, prematurity, cognition,
electrophysiology

ERP indices of attentional dysfunction in 5 year old premature children 2
INTRODUCTION
Preterm children have an increased incidence of cognitive deficits as
compared with healthy full-term children (Ornstein et al. 1991, Saigal et al. 1991).
These problems are of considerable importance as they can result in school failure
and many high-risk children ultimately require special education services. Even
within one standard deviation IQ mean scores, 19-23 % of 8-9 year old preterm
children cannot follow normal schooling compared to 6-14 % of age-paired
full-term children (Francis-William & Davies, 1974; Calame et al., 1986; Hille et
al., 1994; Roth et al., 1993). The reason for these scholastic difficulties is yet to be
adequately determined. According to some authors, learning disabilities could be
the consequence of visual processing abnormalities and attentional disorders in
preterm children. Attention is a fundamental prerequisite for learning, and more
serious form of attention deficits are often associated with learning disorders
(Cantwell et al., 1978). Children, whose primary complaints is poor learning, also
frequently have attentional problems (Ackerman et al.,1987). Damman et al.
(1996) investigated neurological and psychological sequelae of preterm birth at
the age of six years old. They found that a dysfunction of the visuomotor
integration was frequently related with attentional disorders and that visuomotor
development was clearly influenced by the neurological status. The Scottish low
birth weight study (1992) attempted to provide a picture of the performance of
premature children just before they entered school. One of their results indicated
that the visual recognition subscale, which assesses visual organizational skills,
was most affected, with 30% of the cohort performing below the 10th centile for
the test. They also found that a high proportion of the premature children

ERP indices of attentional dysfunction in 5 year old premature children 3
exhibited features of attention deficit. Teplin et al. (1991) showed, in 6 year old
premature group compared with a control group born at term, a significant group
difference for scores on visual-motor function, visual-perceptual abilities and
attention span. Klein et al. (1985, 1989) found that 5 year old premature children,
matched by race, sex and family background with classmate control children born
at full term, performed significantly less well on the Spatial Relations subtest of
the Woodcock-Johnson and on the Visual Motor Integration test, although no
significant differences in IQ were found between groups. Retesting these subjects
at 9 years of age, they found that the premature children scored significantly lower
than controls on reading and mathematics achievement. Saigal and al. (1991)
reported also that premature children, at 9 years old, did less well than matched
full term control group on the reading, spelling and mathematics test. Their visual-
motor integration performance were poorer as well (Beery developmental test of
visual-motor integration).
Event-related potentials (ERPs) have been found to provide a valuable
noninvasive method for studying human brain maturation associated with
perceptual and cognitive maturation (see review by Steinschneider et al ., 1992).
ERPs are scalp-recorded electrical potentials generated by neural activity
associated with specific sensory, cognitive and motor processes (Donchin et al.,
1986). Unlike behavioral data (such as reaction time and accuracy), ERPs
provide a continuous index of processing between the stimulus and the response,
allowing the study of mental chronometry. As a result, ERP data can be used to
isolate different processing stages (Hillyard & Munte, 1984; Renault et al., 1982).
In developmental research, Van de Stelt et al (1998) reported an age
related decrease in latencies of a frontal selection positivity, N2b and P3b that

ERP indices of attentional dysfunction in 5 year old premature children 4
paralleled decrease in reaction time in normal subjects ranging in age from 7 to 24
years using a visual (color) selective attention paradigm. The occipital selection
negativity amplitude increased with advancing age, whereas both N2b and P3b
showed changes in scalp topography. The authors concluded that their data
showed evidence that the efficiency of visual selective processes increases during
childhood and adolescence.
Several studies have investigated attention deficit in full term children
using “oddball” paradigm and recording ERP mainly in auditory modality. These
studies concluded that the P3 component was smaller and more frontally
distributed for Attention Deficit and Hyperactivity Disorders (ADHD) children
than for normal children. The ERP differences were unrelated to performance, as
both groups performed equally well. (Frank et al., 1994; Johnstone et al., 1996;
Kemner et al., 1996; Jonkan et al, 1997).
Visual studies have also been conducted to assess behavioral performance
and ERP components comparing a reading disability group to a control group.
Taylor et al. (1990) studied dyslexic compared to normal children in three visual
reading-related tasks. They found that N2-P3 components were usually longer in
latency and P3 was smaller in amplitude in the dyslexic than in the normal
children. The P3 also had a flatter, broader distribution in the dyslexics. Stelmack
et al (1995) outlined the current status of research on learning disabilities and
intelligence in children using ERP methods: Children with reading disabilities
(RD) exhibit longer P3 latency and smaller P3 amplitude than normal controls.
These group effects reflect an inadequate direction of attention in learning
disabilities and attentional problems, which must occur early in the information
processing sequence, and is related to both automatic and controlled processing .

ERP indices of attentional dysfunction in 5 year old premature children 5
With visual search paradigm, ADHD children were studied and compared to
normal children. Taylor et al. (1993) investigated ADHD children undergoing a
4 week double-blind medication assessment (methylphenidate) and normal
controls in a visual feature detection task. There were no significant differences in
RTs, but P3a and P3b latencies were significantly longer in the ADHD group. The
results of a visual-modality ERP study by Harter et al. (1998) are interesting from
an interpretive viewpoint. The results showed larger visual P3b amplitude in the
fronto-central region in children with ADHD (and comorbid reading disability).
These authors suggest that the increased fronto-central P3b amplitude may reflect
the clinical group’s attempt to compensate for their disorder as a group difference
was not found on performance. Unfortunately, the studies reviewed above are of
great diversity, and their results are not always consistent. One source of confound
may be the diversity of stimuli used in the different studies. Moreover, Stelmack
et al. (see above) pointed out that reading or learning disabled children do not
constitute a homogenous group.
At this time, few ERP studies have been conducted to investigate cognitive
disabilities in prematures. In an auditory oddball task, and without any specific
instruction, Tokioka et al.(1995) observed a reduction of P550 amplitude (possible
equivalent of P3 in the adult) for the rare sound in one year premature children,
With the same type of auditory task, but in 5 year old premature children, Lavoie
et al. (1997) did not find any significant difference of P240 (P3a) amplitude,
between the rare vs. frequent sound conditions. In a visual oddball task, the same
authors found differences in P280 and P650 amplitudes between non-targets and
targets, but no group effect.

ERP indices of attentional dysfunction in 5 year old premature children 6
Behavioral researches of selective attention have suggested that the
capacities to differentiate between relevant and irrelevant stimuli progressively
increase with age (Kail, 1991). Studying the modulation of ERP components
could offer major insights into the physiological basis for changes in processing
selectivity. In addition, insight could be provided into changes in the timing and
organization of different levels of selective information processing, which are
more difficult to infer from behavioral indices alone, such reaction time. To date,
no study has yet examined the effects of attentional manipulations on visual
ERPs in order to determine if attention deficit could contribute to learning
disabilities in premature children.
From the literature it appears that a lot of preterm children, with normal
IQ and without clinical attention deficit, may exhibit some subtle selective visual
attention difficulties which have implications later in their learning disabilities and
failure in school. Although the nature of this cognitive deficit is still matter of
debate we attempted to investigate these disabilities in visual search tasks. In these
tasks, an array of stimuli is presented and subjects must report the presence or
absence of a specified target item within this array. In a series of investigations
conducted in adults, Luck and colleagues (1990, 1993, 1994) have showed that
the amplitude and latency of N2 and P3 component can differentiate between two
classes of search tasks.
Based on the literature summarized above, the present study assessed
possible attentional strategy differences between premature and full-term children.
We suggest that premature children cannot engage controlled strategy to processes
complex visual stimuli. In this paper, we have approached this problem with the

ERP indices of attentional dysfunction in 5 year old premature children 7
following general strategies. (a) Reduce the heterogeneity of the premature
population by excluding subjects with neurological deficits, significant cerebral
ultrasonography anomalies or clinical attentional disorders, (b) Using a cognitive
task that has been explored in normal adult populations in order to highlight the
link between ERP modulations and the underlying cognitive process. (c) using a
two factor-within-subject design to identify a deficit as task specific, it is
necessary to isolate an independent variable (in our study pop-out and serial tasks)
that, when systematically manipulated, interacts with and increases the magnitude
of the deficit in the premature subjects. Consequently, using ERPs and RTs as
dependent variables we set out to test the assumption that only five year old full-
term children will show N2 and P3 amplitude modulation with task manipulation,
namely a N2 amplitude decrease and P3 increase in the serial task compared to
the pop-out task .
METHOD
Subjects
Ten 5 year old preterm children (between 26 and 32 completed weeks of
gestation; mean = 30.3; SD = 1.8), and ten same non corrected age controls born
at term (more than 37 weeks of gestation) participated in the experiment. The
premature children were born between July 1991 and march 1992, in Clocheville
Pediatric hospital (Tours). Psychological, pediatric, ophthalmologic and
audiometric assessments were performed by systematic exams at one, two, four
and five years: all records were appropriate (weight, cranial perimeter) for

ERP indices of attentional dysfunction in 5 year old premature children 8
gestational age (birth weight between 1380 and 2200g; mean = 1645; SD = 306.7
and birth cranial perimeter between 27 and 30; mean = 28.7; SD = 1.0). All
subjects had normal or corrected to normal eyesight. None of the premature
children had neuromotor impairment (hemiparesia, hemiplegia, cerebral palsy,
etc.) and the cerebral ultrasonography was evaluated normal for eight subjects and
grade 1 for two subjects.
The premature group was composed of 7 boys and 3 girls (7 were right
handed and 3 left handed), and the full-term group of 8 boys and 2 girls (8 were
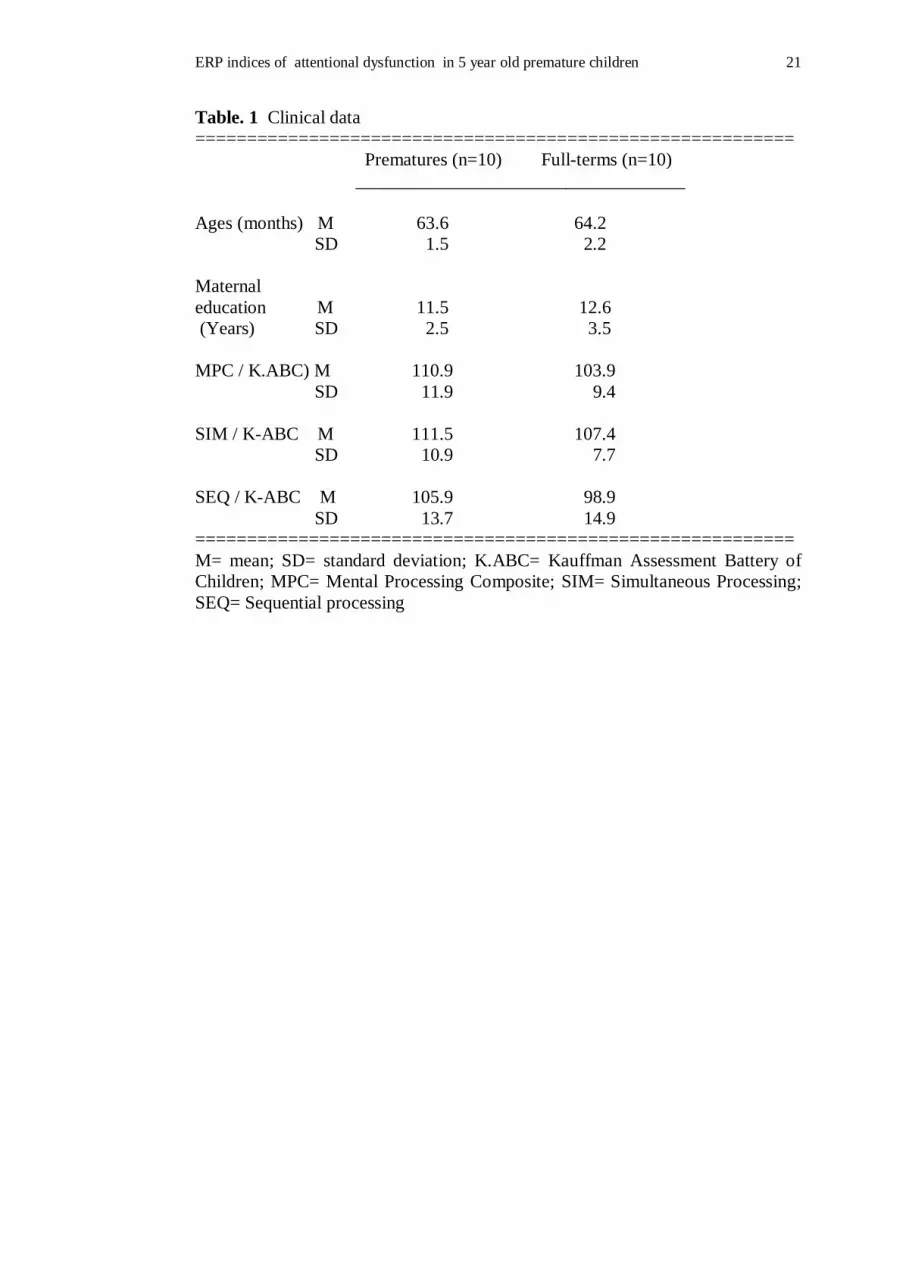
right hands and 2 left handed). They all had a normal intellectual level, as tested
by the Kaufman Assessment Battery for Children (K-ABC) according the
standardized protocol (Kaufman & Kaufman, 1983). Their cognitive
competencies were within the normal range in the full K-ABC processing scale
(Mental Processing Composite, MPC). Furthermore, they scored between 92 and
127 (mean = 109.5) in the Simultaneous Processing tasks (visuo-spatial skills, in
which spatial stimuli are integrated at once), and from 85 to 139 (mean = 102.4)
in the Sequential Processing tasks (working memory and motor planning, in
which stimuli are integrate into temporally organized series). In addition, a
behavioral evaluation was performed using the Conners Parents Rating Scale to
exclude children with attention deficit disorder, hyperactivity or impulsivity from
this experiment. School performance was satisfactory for all participating children
(no school failure, special education or extra-school support). The same exclusion
criteria were used with the children in the full-term group.
Preterm children were matched with the control group according to
mother's educational years and the global socio-economic status.

ERP indices of attentional dysfunction in 5 year old premature children 9
-------------------------------------- Insert Table 1. Here -----------------------------------
Stimuli, apparatus and procedure
Each subject arrived at 9:30 am in the morning and the recording session
began at 10 am. The stimuli were presented foveally on a PC VGA screen that
was placed 80 cm in front of the subject's eyes. The fixation point was in the
center of their horizontal straight-ahead line of sight.
Pop-out task was a parallel processing task. The standard stimuli (n = 96)
comprised a group of eight small blue vertical rectangles. Within target stimuli (n
= 32), one of the rectangles was red. Non-target pop-out trials (n = 32) were also
presented in which one of the blue rectangles was horizontally oriented. Targets
and non-targets pop out occurred with a 20 % probability each. The order of
presentation was pseudo-randomized, so that two targets were never presented
successively to avoid ERP components overlapping. Subjects used their preferred
hand to press a keyboard space bar. The interval between trials (ISI) varied from
2000 to 2500 ms. The stimulus array was presented for 250 ms.
In serial task, deviant targets are defined by the association of color (red)
and size (thick size). The subjects had to identify the target (large red bar,
probability 20%) and press the spacing-bar (non-target stimuli can be either red
or thick). There were no deviant non-target stimuli. The others presentation
parameters were kept unchanged.

ERP indices of attentional dysfunction in 5 year old premature children 10
Recording and data analysis
EEG was recorded with 8 Ag-AgCl electrodes (Fz, Cz, Pz, Oz, F7, F8, T3
and T4), according to the 10-20 system. All electrodes were referenced to the
nose. Horizontal EOG was recorded bipolarly from electrodes at the outer canthus
of each eye, vertical EOG was recorded from electrodes above and beside the
right eye. Electrode impedance was kept below 5 Kohms. Eye movements were
removed using regression analysis in the frequency domain (R.GREEG, Dr JC.
Woesterburg, 1994). The EEG signal was amplified by a Medelec 1A93 device
with a bandpass between 0.1 and 30 Hz and was digitalized at 256 points per
channel. Digital filtering was done offline with a bandpass between 0.5 and 12
Hz. EEG and EOG were epoched off-line into periods of 1000 ms (50 ms prior to
the onset of the stimulus and 950 ms after).
Mean ERP amplitudes were computed as the maximum positive or
negative voltage between 90-180 ms (anterior N1, posterior P1), 150-300 ms
(anterior P2, posterior N2a), 275-525 ms (N2b), 525-750 ms (P3b in Pop-out
task) and 550-750 ms (P3b in serial task).
Statistical analyses
Statistical analysis were conducted using subject groups as a between-
subjects factor (two levels), and task conditions (two levels) and electrodes (four
levels at anterior sites FZ CZ F7 F8, two levels at posterior site Pz, Oz) as within
factors in repeated measure Manovas. Statsoft Statistica® software was used to

ERP indices of attentional dysfunction in 5 year old premature children 11
perform these analysis. Scheffé comparison test was also performed to assess
post-hoc significant effects.
RESULTS
Behavioral data
The tables 2 and 3 present the behavioral performances for each attentional
task and for each group. There were not significant interactions or group main
effects found. The task 2 (serial task) showed longer RTs and fewer correct hits
as compared to the task 1 (Pop-out task) (Rao’s R (2,17)= 32.82 p<.000, RTs:
F(1,18) = 25.78 p < .000, Correct hits: F(1,18)= 56,71, p <.000). This task effect
on correct response was significant mainly in the first half of the trials (Rao’s R
(5,17)= 5.08 p= .019, F(1.18)= 4.70 p= .044).
-----------------------------------Insert Tables 2 and 3 here--------------------------------
Electrophysiological data Fig. 1 and 2 illustrate ERPs elicited by the targets (solid line) and the
standards (dotted line) at each electrode site for task 1 and 2, respectively for
fullterm and preterm groups. The waveforms show that the N1 and P2
components are larger at midline than at lateral sites, and that these components
invert in polarity between anterior and posterior leads. Table 4 summarizes the

ERP indices of attentional dysfunction in 5 year old premature children 12
statistical significant results, as assessed by Anova procedures; F and p values for
the Group and Task factors are given.
----------------------------------Insert Table 4 here -----------------------------------------
Task effect
At posterior site N2b amplitude is larger and latency shorter for stimuli in
task 1 (-2.8 uV, 282 ms) than in task 2 (0.7 uV, 311 ms :Rao’s R(4,14)= 14.62 ;
p< .000). For standard stimuli task 2 elicited greater P3 amplitude then task 1
(10.8 uV vs. 3.8 uV: S x T interaction: Rao’s R(4,14)= 9.36 ; p= .001).
---------------------------------Insert Figure 1 and 2 here ----------------------------------
Group effect
In Table 5, N2b and P3b target amplitudes at anterior sites are presented
for each attentional task and according to preterm and full-term groups. In the
full-term group, N2b target amplitude is greater for task 1 than 2. In the preterm
P3b target amplitude is smaller in task 2 than 1. These effects appear in a
significant Group x Task x stimulus interaction: (Rao’s R(4,15)= 4.41 ; p= .015).
Moreover, only for the full-term group N2b amplitude is larger for target
(-5.56 uV) compared to standard stimuli at Oz (0.73 uV: Rao’s R(4,14)= 3.45 ; p=
.037).

ERP indices of attentional dysfunction in 5 year old premature children 13
----------------------------------Insert Table 5 here ----------------------------------------- In Table 6, P3b mean amplitude, for Cz and Pz pooled sites on task 2
between first of half trials (block1) and last of half trials (block2), is presented
according to preterm and full-term group. In block 2 the amplitude is larger in the
full-term compared to the preterm group (group by block interaction: F(18,1)=
6.76 p= .018). Scheffé post hoc test indicates that this difference is significant
between the groups in the second bloc (p= .034).
----------------------------------Insert Table 6 here -----------------------------------------
DISCUSSION
Behavioral Performance.
As in adult studies, this experiment shows that search for feature
conjunction targets among distractors is a more difficult task than single feature
search as indicated by a RT increase and detection decrease. Moreover our data
show that 5 year old children present learning effects in this serial task as assessed
by the performance improvement from the first to second half of the session.
Neurophysiological assessment of visual search strategy

ERP indices of attentional dysfunction in 5 year old premature children 14
Full-term group.
Our experimental data support the main hypothesis that only full-term 5
years old children demonstrate visual search strategy analogous to adult. Task and
stimulus effects do not affect early components but only N2 and P3. This N2 and
P3 amplitude modulation by the task indicates clearly that the subjects were
engaged in different types of search strategy, thus supporting the parallel/serial
distinction. As Luck et al. (1994) described in adults, pop-out targets elicited
enlarged anterior and posterior N2b components.
The P3 amplitude is sensitive to stimulus probability and task demand : the
amplitude is higher for targets than for standards and for serial than for pop-out
targets. As stimuli differ in probability (20% for targets and 60% for standards)
the P3 amplitude enhancement for targets is obvious. On the other hand, standard
amplitude increased between pop-out and serial tasks although the probabilities
have expanded from 60 % (pop-out) to 80 % (serial task). This indicates that
standards were processed at a more extensive level in serial than in the pop-out
task. This amplitude enhancement cannot be accounted for by a global probability
effect since it was increased in the serial task in comparison to the pop-out task..
As suggested by Luck et al. (1990), if the detection of conjunction targets implies
a serial search process, this will lead to an increase of P3 amplitude compared to
pop-out task. Indeed, P3 amplitude is highly sensitive to global (over an entire
block) and local (over the immediately preceding stimuli) probability. In serial
search both probabilities are low because this process represents a sequence of
decisions regarding stimulus identity, one for each item in the array. Compared to
pop-out task the global probability is higher but the local probability is smaller.
Otherwise, if the process requires a limited capacity, parallel process, this will

ERP indices of attentional dysfunction in 5 year old premature children 15
produce a reduction in P3 amplitude. This decrease will reflect the decreased
levels of confidence due to capacity limitations and the global probability
augmentation; previous studies have demonstrated this for less confident
perceptual decision (Johnson, 1986). In our 5 years old full-term group as in
adults, the experimental data favor a feature integration theory (Treisman et al.,
1980) which posits the existence of two different target detection processes.
Premature group.
In the pop-out task, ERP component modulation is in agreement with Luck
et al. studies: automatic feature detection results in a larger anterior and posterior
N2b followed by a large P3. In the preterm group the P3 component is widely
distributed from the frontal to the parietal lobe. This suggests a frontal P3a and a
parietal P3b overlap (Squires N.K et al. 1975). This may reflect that premature
subjects present an orienting reflex for all classes of stimuli that do not seem to
habituate across the experimental blocks. In the premature group, ERP
modulation does not differ in the two tasks (pop-out and serial condition). The
presence of an enhanced N2b component and a P3 amplitude decrease across the
serial task supports a single, attention demanding detection process for both
target types. Taken together the neurophysiological data advocate a parallel
process model for both tasks. This is supported by a P3 amplitude reduction, in
serial task, reflecting a channel capacity limitation. The same pattern of task
effect is found, by our group, in a 4 year old full-term group (Laurent et al. in
preparation). In contrast N2 and P3 latency is 80 ms delayed in the 4 year old
compared to the 5 year old group. Possibly this difference reflects neural
maturational improvement between 4 and 5 years. These results suggest that

ERP indices of attentional dysfunction in 5 year old premature children 16
premature attentional disabilities are more linked to psychological than
neurological developmental mechanisms.
Are these findings specific to premature? Children with attention
hyperactivity disorder (ADHD) exhibit problems in areas of attention,
distractibility, impulse control and overactivity (Douglas, 1983). It is a serious
disorder markedly affecting academic achievement (Barkley, 1990). There are a
number of studies that have investigated ERPs in children with ADHD (for review
see Taylor et al. 1993). The results have generally shown a lack of N2 and P3
modulation by instructions in the auditory or visual modality. But important
differences in experimental design between studies do not allow any decisive
conclusion. Future studies, comparing ADHD and premature groups, should
examine more specifically attentional deficit in each group.
In summary, the general pattern of results indicates that premature children
cannot engage in two classes of search strategy supporting the parallel/serial
distinction. When they have to pay attention to process complex stimuli they use
the same procedures as they do with an easy one. In addition the present results
show that their performances are reduced despite the subjects engaged more
capacities in the task. Longitudinal studies will have to be conducted in order to
determinate whether this lack of differentiation in attention strategies may
underly learning disabilities.

ERP indices of attentional dysfunction in 5 year old premature children 17
REFERENCES
Ackerman P.T., Dykman R.A., Oglesby D.M., (1987). Epidemiological comparisons of American and Dutch children: II Behavioral/emotional problems reported by teachers for 6 to 11. Journal of the American Academy of Child Psychiatry, 26, 317-325. Barkley, R. A. (1990), Attention deficit hyperactivity disorder. New York: Guilford Press. Calame, A., Fawer, C.L., Claeys, V., Arrazola, L., Ducret, S., Jaunin, L. (1986). Neurodevelopmental outcome and school performance of very-low-birth-weight infants at 8 years of age. European Journal of Pediatrics, 145, 461-466. Cantwell P.D., Satterfield J.F. (1978). The prevalence of academic underachievement in hyperactive children. Journal of Pediatric Psychology, 3, 168-171. Dammann, O., Walther, H., Allers, B., Schröder, M., Drescher, J., Lutz, D., Veelken, N., Schulte, F.J. (1996). Development of a regional cohort of very-low-birthweight children at six years : cognitive abilities are associated with neurological disability and social background. Developmental Medicine and Child Neurology. 38, 97-108. Donchin, E., Karis D., Bashore T. R., Coles M. G. H., Graton G . (1986).Cognitive psychophysiology and human performance processing. In M. G. H. Coles, E. Donchin, S. W. Porges (Eds.), Psychophysiology: Systems, processes and applications (244-267). New York: Guilford. Douglas, V. T. (1983), Attention and cognitive problems. In M. Rutter (Ed.) Developmental neuropsychiatry (pp280-329), New-York: Guilford Press. Francis-Williams, J., Davies, P.A. (1974). Very low birthweight and later intelligence. Developmental Medecine and Child Neurology. 16, 709-28. Frank Y., Seiden J.A., Napolitano B. (1994). Event-related potentials to an oddball auditory paradigm in children with learning disabilities with or without attention deficit hyperactivity disorder. Clinical Electroencephalography, 25, 4, 136-141. Harter M.R., Anllo-Vento L., Wood F.B., Schroeder M.M. (1988. Separate brain potential characteristics in children with reading disability and attention deficit disorder: color and letter relevance effects. Brain and Cognition, 7, 115-140. Hille, E.T.M., Den Ouden, A.L., Bauer, L., Van den Oudenrijn, C., Brand, R. & Verloove-Vanhorick, S.P. (1994) School performance at nine years of age in very

ERP indices of attentional dysfunction in 5 year old premature children 18
premature and very low birth weight infants : perinatal risk factors and predictors at five years of age. The Journal of Pediatrics, 125, 3, 426-434. Hillyard, S. A., Münte, T. F. (1984) Selective attention to color and location: An analysis with event-related brain potentials. Perception & Psychophysics, 36, 185-198. Johnson, R. Jr. (1986). A triarchic model of P300 amplitude. Psychophysiology, 26, 651-667. Johnson, R. Jr. (1986). A triarchic model of P300 amplitude. Psychophysiology, 26, 651-667. Johnstone S.J., Barry R.J. (1996). Auditory event-related potentials to a two-tone discrimination paradigm in attention deficit hyperactivity disorder. Psychiatry Research, 64, 179-192. Jonkman L.M., Kemmer C., Verbaten M.N., Koelega H.S., Camfferman G., van der Gaag .J., Buitelaar J.K., van Engeland H. (1997). Event-related potentials and performance of attention-deficit hyperactivity disorder: children and normal controls in auditory and visual selective attention tasks. Biological Psychiatry, 41, 5, 595-611. Kail R (1991). Developmental change in speed of processing during childhood and adolescence. Psychological Bulletin, 109, 490-501. Kaufman, A.S., Kaufman, N.L.(1983). Kaufman Assessment Battery for Children. Circle Pines, MN : American Guidance Service. Kemmer C., Verbaten M.N., Koelega H.S., Buitelaar J.K., van der Gaag .J., Camfferman G., van Engeland H. (1996). Event-related brain potentials in children with attention-deficit and hyperactivity disorder: effects of stimulus deviancy and task relevance in the visual and auditory modality. Biological Psychiatry, 40, 6, 522-534. Klein, N.K., Hack, M., Breslau, N. (1989). Children who were very Low Birth Weight : Development and Academic Achievement at nine years of age. Developmental and Behavioral Pediatrics, 10, 1, 32-37. Klein, N.K., Hack, M., Gallagher, J. & Fanaroff, A.A. (1985). Preschool performance of children with normal intelligence who where Wery Low-Birth-Weight infants. Pediatrics, 75, 531-537. Laurent J-P., Dupin R., Maurage C., Saliba E. (in preparation). Developmental changes in auditory and visual attention in children between 4 and 5 years old.. Lavoie, M.E., Robaey, P., Stauder, J.E.A., Glorieux, J., Lefebvre, F. (1997). A topographical ERP study of healthy premature 5 years old children in the auditory and visual modalities. Electroencephalography and Clinical Neurophysiology, 104, 228-243.

ERP indices of attentional dysfunction in 5 year old premature children 19
Luck S.J. & Hillyard S.A. (1990) Electrophysiological evidence for parallel and serial processing during visual search. Perception and psychophysics, 48, 603-617. Luck, S. J. , Fan S., Hillyard S. A. (1993). Attention-related modulation of sensory-evoked brain activity in visaul search task. Journal of Cognitive Neuroscience, 5, 188-195. Luck S.J., Hillyard S.A. (1994) Electrophysiological correlates of feature analysis during visual search. Psychophysiology, 31, 291-308. Ornstein, M., Ohlsson, A., Edmonds, J., Asztalos, E. (1991). Neonatal follow-up of very low birth weight/extremely low birth weight infants to school age : a critical overview. Acta Paediatrica Scandinavica, 80, 741-748. Renault B., Ragot R., Lesevre N., Remond A. (1982). Onset and offset od brain events as indices of mental chronometry, Science, 215, 1413-1414. Roth, S.C., Baudin, J., McCormick, D.C., Edwards, A.D., Townsend, J., Stewart, A.N. & Reynolds, E.O.R. (1993) Relation between ultrasound appearance of the brain of very preterm infants and neurodevelopmental impairment at eight years. Developmental Medicine and Child Neurology. 35, 755-768. Saigal, S., Szatmari, P., Rosenbaum, P., Campbell, D. & King, S. (1991) Cognitive abilities and school performance of extremely low birth weight children and matched term control children at age 8 years : A regional study. The Journal of Pediatrics, 118, 5, 751-760. Scottish low birthweight study (The) (1992). : II. Language attainment, cognitive status, and behavioural problems. Archives of Disease in Chidhood, 67, 682-686. Squires, N.K., Squires, K.C., Hillyard, S.A. (1975). Two varieties of long-latency positive evoked by unpredictable auditory stimuli in man. Electroencephalography and Clinical Neurophysiology, 38, 387-401. Steinschneider M., Kurtzberg D., Jauhan Jr. H. G., (1992).Event-related potentials in developmental neuropsychology. In I. Rapin & S.J. Segalowitz (Eds.), Handbook of neuropsychology, Vol 6: Child neuropsychology. Amsterdam : Elsevier (pp.239-299). van der Stelt O., Kok A., Smulders F.T.Y., Snel J., Gunning W.B. (1998). Cerebral event-related potentials associated with selective attention to color: Developmental changes from childhood to adulthood. Psychophysiology, 35, 227-239. Stelmack R.M., Rourke B.P., van der Vlugt H. (1995) Intelligence, learning disabilities and event-related potentials, Developmental neuropsychology, 11, 4, 445-465.

ERP indices of attentional dysfunction in 5 year old premature children 20
Taylor M.J., Keenan N.K. (1990). Event-related potentials to visual and language stimuli in normal and dyslexic children. Psychophysiology, 27, 3, 318-327. Taylor M.J., Voros J.G., Logan W.J., Malone M.A. (1993). Changes in event-related potentials with stimulant medication in children with attention deficit hyperactivity disorder. Biological Psychology, 36, 139-156. Teplin, S.W., Burchinal, M., Johnson-Martin, N., Humphry, R.A. & Kraybill, E.N. (1991). Neurodevelopmental, health, and growth status at age 6 years of children with birth weights less than 1001 grams. The Journal of Pediatrics, 118, 5, 768-777. Tokioka, A.B., Pearce, J.W., Crowell, D.H. (1995). Endogenous event-related-potentials in term and preterm infants. Journal of Clinical Neurophysiology, 12, 468-75. Treisman, A. M. & Gelade, G. (1980). A feature integration theory of attention. Cognitive Psychology, 12, 97-136.
ERP indices of attentional dysfunction in 5 year old premature children 21
Table. 1 Clinical data ========================================================== Prematures (n=10) Full-terms (n=10) ____________________________________ Ages (months) M 63.6 64.2 SD 1.5 2.2 Maternal education M 11.5 12.6 (Years) SD 2.5 3.5 MPC / K.ABC) M 110.9 103.9 SD 11.9 9.4 SIM / K-ABC M 111.5 107.4 SD 10.9 7.7 SEQ / K-ABC M 105.9 98.9 SD 13.7 14.9 ========================================================== M= mean; SD= standard deviation; K.ABC= Kauffman Assessment Battery of Children; MPC= Mental Processing Composite; SIM= Simultaneous Processing; SEQ= Sequential processing

ERP indices of attentional dysfunction in 5 year old premature children 22
Table 2. .Behavioral performance. ====================================================== Pop-out task Serial task Preterm Fullterm Preterm Fullterm ___________________________________________ |¯¯¯¯¯¯¯¯¯ ** ¯¯¯¯¯¯¯¯¯| RT (ms) M 693.6 659.8 803.6 772.1 |__________ ** _________| SD 117.6 83.5 106.2 84.8 |¯¯¯¯¯¯¯¯¯ *** ¯¯¯¯¯¯¯¯¯| Hit (%) M 91.8 94.0 77.2 79.3 |__________ *** ________| SD 7.5 4.8 11.3 11.5 ======================================================= M= mean, SD= standard deviation, ** p < .00 *** p < .000

ERP indices of attentional dysfunction in 5 year old premature children 23
Table 3. Behavioral performance. Analysis by block =========================================================== Pop-out task Serial task Preterm Fullterm Preterm Fullterm Block 1 Block2 Block 1 Block2 Block 1 Block2 Block 1 Block2 __________________________________________________ RT (ms) M 697.7 688.9 826.0 793.3 643.4 675.1 788.0 755.9 SD 130.2 111.1 112.4 166.6 75.5 104.7 82.8 103.7 Hit (%) M 93.7* 90.0 95.0 93.1 70.6* 84.4 79.4 80.0 SD 6.6 10.7 6.5 6.9 13.8 11.9 15.6 14.1 =========================================================== M= mean, SD= standard deviation, * p < .02

ERP indices of attentional dysfunction in 5 year old premature children 24
Table 4. ANOVAs: neurophysiological results. ========================================================== Vector Of dependant Factor df(1,2) F value p value variable _________________________________________________________________ Anterior sites Fz, Cz, F8,F7 N2b amplitude G x T x S 1,18 7.78 .012 P3b amplitude G x T x S 1,18 11.77 .003 _________________________________________________________________ Posterior sites Pz, Oz N2b amplitude Task 1,17 5.40 .033 G x S 1,17 7.94 .012 latency Task 1,17 43.46 .000 P3b amplitude T x S 1,17 12.74 .002
G: group; T: task ; S: stimulus

ERP indices of attentional dysfunction in 5 year old premature children 25
Table 5. Mean amplitude of N2b and P3b components in each group and for each task (pop-out and serial search). Full-term group Preterm group N2b Pop-out M - 5.1* - 2.5 SD 6.5 7.3 Serial M -1.0* - 5.5 SD 6.6 6.9 P3b Pop-out M +12.6 +22.9** SD 12.2 12.8 Serial M +16.7 +14.6** SD 14.7 15.5 M= Mean, SD= standard deviation, ** p < .005 ; * p < .05

ERP indices of attentional dysfunction in 5 year old premature children 26
Table 6 . P3 mean amplitude in uV for each Group for the serial task in blocks 1 and 2 ================================== Pre-term Full-term ______________________ Block1 M 37.2* 29.5* SD 19.9 16.2 Block2 M 27.0* 39.9* SD 11.8 17.4 =================================== M= mean SD= standard deviation, * p <.02

ERP indices of attentional dysfunction in 5 year old premature children 27
LEGEND
Figure 1: Electrode and stimulus effect. Task and group conditions are pooled.
Solid line represents waveform elicited by targets, dotted line waveform elicited
by standards. Positivities are displayed up.
Figure 2 : Group effect. Left side shows fullterm group effect on N2b between
pop-out task (solid line) and serial task (dotted line). Right side displays
premature group effect on P3b between pop-out task and serial task.