ergonomic solutions for the process industries
TRANSCRIPT


Ergonomic Solutions for the Process Industries
FM.qxd 11/21/03 09:18 PM Page i

FM.qxd 11/21/03 09:18 PM Page ii

Ergonomic Solutions for the Process Industries
Dennis A. AttwoodJoseph M. DeebMary E. Danz-Reece
AMSTERDAM • BOSTON • HEIDELBERG • LONDONNEW YORK • OXFORD • PARIS • SAN DIEGO
SAN FRANCISCO • SINGAPORE • SYDNEY • TOKYOGulf Professional Publishing is an imprint of Elsevier
FM.qxd 11/21/03 09:18 PM Page iii

Gulf Professional Publishing is an imprint of Elsevier200 Wheeler Road, Burlington, MA 01803, USALinacre House, Jordan Hill, Oxford OX2 8DP, UK
Copyright © 2004, Elsevier Inc. All rights reserved.
No part of this publication may be reproduced, stored in a retrieval system, ortransmitted in any form or by any means, electronic, mechanical, photocopying,recording, or otherwise, without the prior written permission of the publisher.
Permissions may be sought directly from Elsevier’s Science & Technology RightsDepartment in Oxford, UK: phone: (+44) 1865 843830, fax: (+44) 1865 853333, e-mail: [email protected]. You may also complete your request on-line viathe Elsevier homepage (http://elsevier.com), by selecting “Customer Support” and then“Obtaining Permissions.”
Recognizing the importance of preserving what has been written, Elsevier prints itsbooks on acid-free paper whenever possible.
Library of Congress Cataloging-in-Publication DataApplication submitted.
British Library Cataloguing-in-Publication DataA catalogue record for this book is available from the British Library.
ISBN: 0-7506-7704-X
For information on all Gulf Professional Publishing publications visit our website at www.gulfpp.com
03 04 05 06 07 08 10 9 8 7 6 5 4 3 2 1
Printed in the United States of America
FM.qxd 11/21/03 09:18 PM Page iv

Contents
Preface . . . . . . . . . . . . . . . . . . . . . . . . . . . . . . . . . . . . . . . . . . . . . xiiiAcknowledgments. . . . . . . . . . . . . . . . . . . . . . . . . . . . . . . . . . . . . xvDisclaimer . . . . . . . . . . . . . . . . . . . . . . . . . . . . . . . . . . . . . . . . . . xvii
1. Introduction . . . . . . . . . . . . . . . . . . . . . . . . . . . . . . . . . . . . . . . 11.1 Introduction . . . . . . . . . . . . . . . . . . . . . . . . . . . . . . . . . . . . 11.2 Chapter Review . . . . . . . . . . . . . . . . . . . . . . . . . . . . . . . . . 5
1.2.1 Chapter 2. Personal Factors . . . . . . . . . . . . . . . . . . . 51.2.2 Chapter 3. Physical Factors . . . . . . . . . . . . . . . . . . . 51.2.3 Chapter 4. Environmental Factors. . . . . . . . . . . . . . . 61.2.4 Chapter 5. Equipment Design. . . . . . . . . . . . . . . . . . 61.2.5 Chapter 6. Workplace Design . . . . . . . . . . . . . . . . . . 61.2.6 Chapter 7. Job Factors . . . . . . . . . . . . . . . . . . . . . . . 71.2.7 Chapter 8. Information Processing . . . . . . . . . . . . . . 81.2.8 Chapter 9. The Use of Human Factors in Project
Planning, Design, and Execution . . . . . . . . . . . . . . 101.3 Proposed Model for the Systematic Implementation of
Ergonomics/Human Factors . . . . . . . . . . . . . . . . . . . . . . . 10The “DOT” Process for Prioritizing Issues . . . . . . . . . . . . . . 21
2. Personal Factors . . . . . . . . . . . . . . . . . . . . . . . . . . . . . . . . . . . 292.1 Introduction . . . . . . . . . . . . . . . . . . . . . . . . . . . . . . . . . . . 292.2 Sensory and Cognitive Capabilities . . . . . . . . . . . . . . . . . . 30
2.2.1 Visual Sense . . . . . . . . . . . . . . . . . . . . . . . . . . . . . 312.2.2 Auditory Sense . . . . . . . . . . . . . . . . . . . . . . . . . . . 38
v
FM.qxd 11/21/03 09:18 PM Page v
2.2.3 Cognitive Capabilities . . . . . . . . . . . . . . . . . . . . . . 392.2.4 Summary of Information Processing . . . . . . . . . . . . 47
2.3 Physical Capabilities. . . . . . . . . . . . . . . . . . . . . . . . . . . . . 482.3.1 Muscular Strength and Endurance . . . . . . . . . . . . . 492.3.2 Anthropometry: Body Size. . . . . . . . . . . . . . . . . . . 52
2.4 Case Study. . . . . . . . . . . . . . . . . . . . . . . . . . . . . . . . . . . . 572.4.1 Method . . . . . . . . . . . . . . . . . . . . . . . . . . . . . . . . . 582.4.2 Data Collected. . . . . . . . . . . . . . . . . . . . . . . . . . . . 592.4.3 Conclusion . . . . . . . . . . . . . . . . . . . . . . . . . . . . . . 60
3. Physical Factors . . . . . . . . . . . . . . . . . . . . . . . . . . . . . . . . . . . 653.1 Musculoskeletal Disorders . . . . . . . . . . . . . . . . . . . . . . . . 663.2 Manual Handling Tasks . . . . . . . . . . . . . . . . . . . . . . . . . . 68
3.2.1 Manual Handling Risk Factors . . . . . . . . . . . . . . . . 683.2.2 Methods for Evaluating Manual Handling Tasks . . . 72
3.3 Hand-Intensive Repetitive Tasks . . . . . . . . . . . . . . . . . . . . 813.3.1 Risk Factors . . . . . . . . . . . . . . . . . . . . . . . . . . . . . 813.3.2 Survey and Observation Tools . . . . . . . . . . . . . . . . 833.3.3 Hand Tools . . . . . . . . . . . . . . . . . . . . . . . . . . . . . . 83
3.4 Behavior . . . . . . . . . . . . . . . . . . . . . . . . . . . . . . . . . . . . . 853.5 Ergonomics Program . . . . . . . . . . . . . . . . . . . . . . . . . . . . 88
3.5.1 Planning an Ergonomics Program. . . . . . . . . . . . . . 893.5.2 Risk Assessment Process . . . . . . . . . . . . . . . . . . . . 913.5.3 Solutions. . . . . . . . . . . . . . . . . . . . . . . . . . . . . . . . 933.5.4 Evaluating the Ergonomics Program . . . . . . . . . . . . 94
3.6 Case Study. . . . . . . . . . . . . . . . . . . . . . . . . . . . . . . . . . . . 95Appendix 3-1. Material Handling Screening Checklist: Risk
Identification and Priorities. . . . . . . . . . . . . . . . 97Appendix 3-2. Musculoskeletal Ergonomics Program
Gap Analysis . . . . . . . . . . . . . . . . . . . . . . . . . 103
4. Environmental Factors. . . . . . . . . . . . . . . . . . . . . . . . . . . . . . 1114.1 Introduction . . . . . . . . . . . . . . . . . . . . . . . . . . . . . . . . . . 1124.2 Illumination . . . . . . . . . . . . . . . . . . . . . . . . . . . . . . . . . . 112
4.2.1 Lighting Quantity . . . . . . . . . . . . . . . . . . . . . . . . 1144.2.2 Task Factors . . . . . . . . . . . . . . . . . . . . . . . . . . . . 1154.2.3 Age Factors . . . . . . . . . . . . . . . . . . . . . . . . . . . . . 1164.2.4 Lighting Quality . . . . . . . . . . . . . . . . . . . . . . . . . 117
vi Contents
FM.qxd 11/21/03 09:18 PM Page vi

4.3 Temperature . . . . . . . . . . . . . . . . . . . . . . . . . . . . . . . . . . 1214.3.1 Effects of Heat on Performance . . . . . . . . . . . . . . 1224.3.2 Effects of Cold on Performance . . . . . . . . . . . . . . 1244.3.3 Effects of Heat on Health . . . . . . . . . . . . . . . . . . . 1254.3.4 Comfort and Discomfort Zones . . . . . . . . . . . . . . 1284.3.5 Work Tolerance in Hot Environment . . . . . . . . . . . 1294.3.6 Recommendations to Improve Working
Conditions. . . . . . . . . . . . . . . . . . . . . . . . . . . . . . 1314.4 Noise . . . . . . . . . . . . . . . . . . . . . . . . . . . . . . . . . . . . . . 133
4.4.1 Effects of Noise on Performance . . . . . . . . . . . . . 1344.4.2 Effects of Noise on Health . . . . . . . . . . . . . . . . . . 1374.4.3 Guidelines to Control Noise . . . . . . . . . . . . . . . . . 139
4.5 Vibration . . . . . . . . . . . . . . . . . . . . . . . . . . . . . . . . . . . . 1424.5.1 Effects of Vibration on Performance . . . . . . . . . . . 1434.5.2 Effects of Vibration on Health . . . . . . . . . . . . . . . 1454.5.3 Guidelines to Reduce or Control Vibration . . . . . . 146
4.6 Case Study . . . . . . . . . . . . . . . . . . . . . . . . . . . . . . . . . . . 1474.6.1 Method . . . . . . . . . . . . . . . . . . . . . . . . . . . . . . . . 1484.6.2 Results . . . . . . . . . . . . . . . . . . . . . . . . . . . . . . . . 1484.6.3 Recommendations . . . . . . . . . . . . . . . . . . . . . . . . 1484.6.4 Installation of a Pilot Lighting System . . . . . . . . . 1504.6.5 Final Results . . . . . . . . . . . . . . . . . . . . . . . . . . . . 151
5. Equipment Design. . . . . . . . . . . . . . . . . . . . . . . . . . . . . . . . . 1575.1 Human/System Interface . . . . . . . . . . . . . . . . . . . . . . . . . 1575.2 Controls . . . . . . . . . . . . . . . . . . . . . . . . . . . . . . . . . . . . . 158
5.2.1 Physical Requirements of Operating Controls . . . . 1605.2.2 Types of Controls . . . . . . . . . . . . . . . . . . . . . . . . 1615.2.3 Control Labels and Identification . . . . . . . . . . . . . 1635.2.4 Stereotypes . . . . . . . . . . . . . . . . . . . . . . . . . . . . . 1645.2.5 Access to Operate . . . . . . . . . . . . . . . . . . . . . . . . 1655.2.6 Preventing Accidental Operation. . . . . . . . . . . . . . 1655.2.7 Valves . . . . . . . . . . . . . . . . . . . . . . . . . . . . . . . . . 166
5.3 Visual Displays. . . . . . . . . . . . . . . . . . . . . . . . . . . . . . . . 1695.3.1 Types of Displays . . . . . . . . . . . . . . . . . . . . . . . . 1705.3.2 Mounting Displays. . . . . . . . . . . . . . . . . . . . . . . . 172
5.4 Relationship between Controls and Visual Displays . . . . . 1745.5 Auditory Displays. . . . . . . . . . . . . . . . . . . . . . . . . . . . . . 175
Contents vii
FM.qxd 11/21/03 09:18 PM Page vii
5.6 Field Control Panels . . . . . . . . . . . . . . . . . . . . . . . . . . . . 1775.6.1 Field Panel Layout. . . . . . . . . . . . . . . . . . . . . . . . 1775.6.2 Field Panel Labels . . . . . . . . . . . . . . . . . . . . . . . . 1815.6.3 Improving Field Control Panels . . . . . . . . . . . . . . 184
5.7 Process Control Displays . . . . . . . . . . . . . . . . . . . . . . . . 1855.7.1 Process Control Display Interface . . . . . . . . . . . . . 1875.7.2 Approach for Developing Process Control
Displays . . . . . . . . . . . . . . . . . . . . . . . . . . . . . . . 1955.8 Case Study . . . . . . . . . . . . . . . . . . . . . . . . . . . . . . . . . . . 204Appendix 5-1. Checklist for Equipment Design . . . . . . . . . . . 206
6. Workplace Design . . . . . . . . . . . . . . . . . . . . . . . . . . . . . . . . . 2136.1 Introduction . . . . . . . . . . . . . . . . . . . . . . . . . . . . . . . . . . 2146.2 Workplace Design Principles . . . . . . . . . . . . . . . . . . . . . . 215
6.2.1 Introduction. . . . . . . . . . . . . . . . . . . . . . . . . . . . . 2156.2.2 Controls and Displays Must Be
Optimally Located . . . . . . . . . . . . . . . . . . . . . . . . 2156.2.3 Equipment Must Be Visually Accessible . . . . . . . 2156.2.4 The Workplace Must Be Designed for the User
Population . . . . . . . . . . . . . . . . . . . . . . . . . . . . . 2156.2.5 Equipment Must Be Physically Accessible . . . . . . 2206.2.6 Work Must Be Positioned as Best for the
Operator . . . . . . . . . . . . . . . . . . . . . . . . . . . . . . . 2306.2.7 Workstations and Seating Must Be Designed
According to Accepted Human Factors Standards . . . 2376.2.8 Maintenance and Maintainability . . . . . . . . . . . . . 2536.2.9 Summary of Design Principles . . . . . . . . . . . . . . . 256
6.3 Analytical Techniques in Workplace Design . . . . . . . . . . . 2566.3.1 Activity Analysis . . . . . . . . . . . . . . . . . . . . . . . . . 2586.3.2 Task Analysis . . . . . . . . . . . . . . . . . . . . . . . . . . . 2606.3.3 Link Analysis . . . . . . . . . . . . . . . . . . . . . . . . . . . 260
6.4 Human Factors Design Processes for Existing and NewWorkstations. . . . . . . . . . . . . . . . . . . . . . . . . . . . . . . . . . 2626.4.1 Existing Workstations . . . . . . . . . . . . . . . . . . . . . 2626.4.2 New Workstations . . . . . . . . . . . . . . . . . . . . . . . . 265
6.5 Case Study . . . . . . . . . . . . . . . . . . . . . . . . . . . . . . . . . . . 2666.5.1 Familiarization . . . . . . . . . . . . . . . . . . . . . . . . . . 267
viii Contents
FM.qxd 11/21/03 09:18 PM Page viii
6.5.2 Problem Identification . . . . . . . . . . . . . . . . . . . . . 2676.5.3 Background . . . . . . . . . . . . . . . . . . . . . . . . . . . . . 2686.5.4 Data Collection and Analysis . . . . . . . . . . . . . . . . 2696.5.5 Evaluation . . . . . . . . . . . . . . . . . . . . . . . . . . . . . . 2726.5.6 Recommendations and Redesign. . . . . . . . . . . . . . 277
7. Job Factors . . . . . . . . . . . . . . . . . . . . . . . . . . . . . . . . . . . . . . 2877.1 Introduction . . . . . . . . . . . . . . . . . . . . . . . . . . . . . . . . . . 2887.2 Shift Work and Work Schedules . . . . . . . . . . . . . . . . . . . 288
7.2.1 Sleep and Sleep Disorders . . . . . . . . . . . . . . . . . . 2897.2.2 Effects of Shift Work on Performance. . . . . . . . . . 2957.2.3 Effects of Shift Work on Health . . . . . . . . . . . . . . 2967.2.4 Effects of Shift Work on the Psychosocial Life . . . 2977.2.5 Shift Work Schedule Design. . . . . . . . . . . . . . . . . 2997.2.6 Coping Strategies with Shift Work . . . . . . . . . . . . 3027.2.7 Process for Creating or Changing
Shift Schedules . . . . . . . . . . . . . . . . . . . . . . . . . . 3077.3 Stress . . . . . . . . . . . . . . . . . . . . . . . . . . . . . . . . . . . . . . 308
7.3.1 Sources and Causes of Stress . . . . . . . . . . . . . . . . 3087.3.2 Coping Strategies. . . . . . . . . . . . . . . . . . . . . . . . . 310
7.4 Job Analysis . . . . . . . . . . . . . . . . . . . . . . . . . . . . . . . . . . 3107.4.1 Task Analysis . . . . . . . . . . . . . . . . . . . . . . . . . . . 3107.4.2 Critical-Task Identification and Analysis . . . . . . . . 315
7.5 Team-Based Approach . . . . . . . . . . . . . . . . . . . . . . . . . . 3227.5.1 Cognitive Problem-Solving Style (KAI) . . . . . . . . 3227.5.2 Drexler-Sibbet High-Performance Team Model . . . 3237.5.3 ACUMEN. . . . . . . . . . . . . . . . . . . . . . . . . . . . . . 3247.5.4 Systematic Multilevel Observation of Groups
(SYMLOG) . . . . . . . . . . . . . . . . . . . . . . . . . . . . . 3247.6 Behavior-Based Safety . . . . . . . . . . . . . . . . . . . . . . . . . . 325
7.6.1 Lessons Learned . . . . . . . . . . . . . . . . . . . . . . . . . 3257.6.2 Recommended Core and Ancillary Elements of
BBS Programs. . . . . . . . . . . . . . . . . . . . . . . . . . . 3287.7 Case Study . . . . . . . . . . . . . . . . . . . . . . . . . . . . . . . . . . . 331
7.7.1 Introduction. . . . . . . . . . . . . . . . . . . . . . . . . . . . . 3317.7.2 Task Analysis . . . . . . . . . . . . . . . . . . . . . . . . . . . 3317.7.3 Biomechanical Analysis . . . . . . . . . . . . . . . . . . . . 335
Contents ix
FM.qxd 11/21/03 09:18 PM Page ix
8. Information Processing . . . . . . . . . . . . . . . . . . . . . . . . . . . . . 3398.1 Human Error . . . . . . . . . . . . . . . . . . . . . . . . . . . . . . . . . 340
8.1.1 Introduction. . . . . . . . . . . . . . . . . . . . . . . . . . . . . 3408.1.2 Why Humans Make Errors . . . . . . . . . . . . . . . . . . 3418.1.3 Mental Errors . . . . . . . . . . . . . . . . . . . . . . . . . . . 3418.1.4 Display Errors . . . . . . . . . . . . . . . . . . . . . . . . . . . 3468.1.5 Environmental Causes . . . . . . . . . . . . . . . . . . . . . 3478.1.6 System Factors That Lead to Error . . . . . . . . . . . . 347
8.2 Plant Signs and Labels . . . . . . . . . . . . . . . . . . . . . . . . . . 3508.2.1 Equipment Labeling Program . . . . . . . . . . . . . . . . 3518.2.2 Designing Signs and Labels . . . . . . . . . . . . . . . . . 3528.2.3 Guidelines for Specific Types of Signs and
Labels . . . . . . . . . . . . . . . . . . . . . . . . . . . . . . . . . 3578.3 Procedures . . . . . . . . . . . . . . . . . . . . . . . . . . . . . . . . . . . 361
8.3.1 Guidelines for Determining When a Procedure Is Needed . . . . . . . . . . . . . . . . . . . . . . . . . . . . . . . . 362
8.3.2 Developing Procedures . . . . . . . . . . . . . . . . . . . . 3638.3.3 Formatting Written Procedures . . . . . . . . . . . . . . . 3648.3.4 Determining Why a Procedure Was Not Used . . . . 3658.3.5 Evaluating Written Procedures . . . . . . . . . . . . . . . 366
8.4 Training . . . . . . . . . . . . . . . . . . . . . . . . . . . . . . . . . . . . . 3678.4.1 Developing Training . . . . . . . . . . . . . . . . . . . . . . 3688.4.2 Task Analysis for Training Development. . . . . . . . 3698.4.3 Content of a Training Package . . . . . . . . . . . . . . . 3708.4.4 Training for Trainers . . . . . . . . . . . . . . . . . . . . . . 3718.4.5 When to Provide Training . . . . . . . . . . . . . . . . . . 3718.4.6 Evaluating Training . . . . . . . . . . . . . . . . . . . . . . . 372
8.5 Vigilance . . . . . . . . . . . . . . . . . . . . . . . . . . . . . . . . . . . . 3728.5.1 Transportation Systems . . . . . . . . . . . . . . . . . . . . 3748.5.2 Control Room Operations. . . . . . . . . . . . . . . . . . . 3748.5.3 Mining Operations . . . . . . . . . . . . . . . . . . . . . . . . 3768.5.4 Driving Performance . . . . . . . . . . . . . . . . . . . . . . 3778.5.6 Factors Contributing to Vigilance Decrement . . . . 3778.5.7 Operator Workload Analysis . . . . . . . . . . . . . . . . . 378
8.6 Case Study . . . . . . . . . . . . . . . . . . . . . . . . . . . . . . . . . . . 3828.6.1 Narrative: How to Change a Tire . . . . . . . . . . . . . 382
Appendix 8-1. Procedures Evaluation Checklist . . . . . . . . . . . 384
x Contents
FM.qxd 11/21/03 09:18 PM Page x

9. The Use of Human Factors in Project Planning, Design, and Execution . . . . . . . . . . . . . . . . . . . . . . . . . . . . . . . . . . . . 3939.1 Introduction . . . . . . . . . . . . . . . . . . . . . . . . . . . . . . . . . . 3949.2 Project Management . . . . . . . . . . . . . . . . . . . . . . . . . . . . 395
9.2.1 Management of Major Projects. . . . . . . . . . . . . . . 3959.2.2 Management of Base Projects. . . . . . . . . . . . . . . . 397
9.3 Human Factors Tools for Project Management . . . . . . . . . 3989.3.1 Human Factors Tracking Database . . . . . . . . . . . . 3989.3.2 HF Review: Planning Phase . . . . . . . . . . . . . . . . . 3999.3.3 Safety, Health, and Environmental Review . . . . . . 4009.3.4 Human Factors Training for the Project Team . . . . 4019.3.5 Human Factors in the Hazard and Operability
Reviews . . . . . . . . . . . . . . . . . . . . . . . . . . . . . . . 4049.3.6 Procedures. . . . . . . . . . . . . . . . . . . . . . . . . . . . . . 4099.3.7 Analysis Techniques . . . . . . . . . . . . . . . . . . . . . . 4109.3.8 Quality Assurance/Quality Control Review
Process . . . . . . . . . . . . . . . . . . . . . . . . . . . . . . . . 4169.3.9 Prestart-up Human Factors Review . . . . . . . . . . . . 4259.3.10 HF Awareness for Construction Contractors and
Company Personnel . . . . . . . . . . . . . . . . . . . . . . . 4269.3.11 Postproject Review . . . . . . . . . . . . . . . . . . . . . . . 427
Appendix 9-1. HAZOP Human Factors Screening Lists . . . . . 430Appendix 9-2. Assistance Using HAZOP Screening Lists. . . . 434Appendix 9-3. Quality Assurance/Quality Control Checklist . . 435Appendix 9-4. Maintenance Review Checklist . . . . . . . . . . . . 438Appendix 9-5. Walkthrough/Rounds Review Checklist . . . . . . 439Appendix 9-6. Prestart-up Human Factors Review
Checklist . . . . . . . . . . . . . . . . . . . . . . . . . . . . 441Appendix 9-7. Summary of Recommendations to Construction
Workers Installing Field-Run Equipment . . . . . 450
Index . . . . . . . . . . . . . . . . . . . . . . . . . . . . . . . . . . . . . . . . . . . . 453
Contents xi
FM.qxd 11/21/03 09:18 PM Page xi

FM.qxd 11/21/03 09:18 PM Page xii
Preface
Let’s begin by understanding what the title means to users of this book.First, the distinction between ergonomics and human factors has beendebated in every major national technical human factors and ergonomicssociety for decades. Our solution is simple—we make no distinctionbetween human factors and ergonomics and we use the terms inter-changeably throughout the book.
Second, the term process industries is intended to include not only theintegrated oil and petrochemical industry, in which we work, but alsoindustries where process technology is the kernel that controls the pro-duction of the product. The product may be electricity from nuclear orfossil fuel power plants, treated waste from municipal facilities, cleanwater from desalination operations, or manufactured products from virtu-ally any continuous process.
Third, the term solutions was chosen intentionally. In the more than 60years since the start of the Second World War, when ergonomics began,academic research in this area has mushroomed. Many great scholars,including Sanders and McCormick (1993), Grandjean (1988), Welford(1968), and Chapanis (1959), have written books on the general subjectof human factors. In addition, books have been written on specific topicsin the field, such as Konz (1979), van Cott and Kinkade (1972), andAttwood (1996). Each provides students and practitioners with the basicresearch that they can use to set hypotheses and develop tools. Our objec-tive in this book is not to provide more academic information to ergonom-ics specialists but to focus this book on the nonspecialist users of humanfactors, to use the theory created by academics to develop simple toolsand procedures that the nonspecialist can use to apply ergonomics inside
xiii
FM.qxd 11/21/03 09:18 PM Page xiii

the plant gates. To do so, it is necessary to provide some theory, but onlyenough to explain and justify the application.
With this in mind, it’s important to understand our position on humanfactors and ergonomics. We believe that an educated, experienced plantpractitioner can implement any of the human factors tools and processescontained within these pages. This does not imply that we believe humanfactors and ergonomics are mere “common sense.” We believe that, at theplant level, operators and supervisors who are dedicated to making a dif-ference, have the right tools, and have been trained to use them properlycan identify the issues, set priorities, collect and analyze the data, developinterventions, and measure their effects. The specialists have their place,but their place is not performing the routine human factors duties thatrequire local knowledge of the people and plant. In our opinion, the humanfactors/ergonomics specialist is a resource that should be used to developprograms, train the practitioners, and provide the detailed knowledgerequired to mobilize the plant staff.
So, we invite you to use the knowledge and the tools that are containedin this book. We hope that we have adequately explained how and whyto use the years of human factors/ergonomics knowledge that is at theheart of this book in a deliberate, systematic way.
REFERENCES
Attwood, D. A. (1996) The Office Relocation Sourcebook. New York: John Wiley & Sons.
Chapanis, A. (1959) Research Techniques in Human Engineering. Baltimore: The JohnsHopkins Press.
Grandjean, E. (1988) Fitting the Task to the Man. London: Taylor and Francis.
Konz, S. (1979) Work Design. Columbus, OH: Grid Publishing Inc.
Sanders, M. S., and McCormick, E. J. (1993) Human Factors in Engineering and Design.Seventh Ed. New York: McGraw-Hill.
Van Cott, H. P., and Kinkade, R. G. (1972) Human Engineering Guide to EquipmentDesign. Washington, DC: American Institutes for Research.
Welford, A. T. (1968) Fundamentals of Skill. London: Methuen and Company Ltd.
xiv Preface
FM.qxd 11/21/03 09:18 PM Page xiv

Acknowledgments
Many people have contributed to this project. It is our pleasure toacknowledge, in alphabetical order, the following individuals whoreviewed the manuscript and provided us valuable recommendations forrevisions: John Alderman, Risk Reliability and Safety Engineering; JohnBloodworth, ExxonMobil Chemical Americas; Larry Csengery, ShellGlobal Solutions; Dave Fennell, Imperial Oil Resources; Bernd Froehlich,ExxonMobil Chemical Central Europe; John Gelland, ExxonMobil Refining and Supply; Mike Henderek, ExxonMobil Corporate SafetyHealth and Environment; Dave Johnson, ExxonMobil Refining andSupply; Jere Noerager, Human Factors Consultant; Debby Rice, ExxonMobil International Medicine and Occupational Health; TammySmolar, ExxonMobil Biomedical Sciences, Inc.; Eric Swensen, ExxonMobil Biomedical Sciences, Inc.; Dan Taft, ExxonMobil Develop-ment Company; Evan Thayer, ExxonMobil Biomedical Sciences, Inc.;Theo van der Smeede, ExxonMobil Chemical Belgium.
We also extend our sincere thanks to the management of ExxonMobilBiomedical Sciences, Inc. (EMBSI) and ExxonMobil Research and Engi-neering (EMRE) for giving us permission to use much of the informationcontained in this book. We especially thank Patty Sparrell, EMBSImanager, and Al Lopez, EMRE vice president (retired), for their effortson our behalf.
We dedicate this book to our families for their support and under-standing during the its preparation.
Dennis A. Attwood thanks Pamela, Gordon, Cathy, and SeanJoseph M. Deeb thanks Carol, Alexander, and Lauren Mary E. Danz-Reece thanks Timothy, Eugene, Vivianne, and Eric
xv
FM.qxd 11/21/03 09:18 PM Page xv

FM.qxd 11/21/03 09:18 PM Page xvi

Disclaimer
The information in this publication represents the authors’ own viewsabout the application of human factors analysis in the process industry.The information consists of general guidance of facts, concepts, princi-ples, and other information for developing and implementing ergonomicsor human factors. The information in this book is furnished without warranty of any kind from the authors or the publisher.
The book is not intended to provide specific guidance for the opera-tions of any company, facility, unit, process, business, system, or equip-ment; and neither the authors nor publisher assumes any liability for itsuse or misuse in any particular circumstances. Readers should make theirown determination of the suitability or completeness of any material orprocedure for a specific purpose and adopt such safety, health, and otherprecautions as may be necessary.
The information provided in this publication is no substitute for internal management systems and operating facilities standards that mayinclude company-specific, facility-specific, or unit-specific operating andmaintenance procedures, checklists, equipment descriptions, or safetypractices. Users are advised that the information included here should notbe applied if it contradicts government regulations governing their sites.
xvii
FM.qxd 11/21/03 09:18 PM Page xvii

FM.qxd 11/21/03 09:18 PM Page xviii

1
Introduction
1.1 Introduction1.2 Chapter Review
1.2.1 Chapter 2. Personal Factors1.2.2 Chapter 3. Physical Factors1.2.3 Chapter 4. Environmental Factors1.2.4 Chapter 5. Equipment Design1.2.5 Chapter 6. Workplace Design1.2.6 Chapter 7. Job Factors1.2.7 Chapter 8. Information Processing1.2.8 Chapter 9. The Use of Human Factors in Project Planning, Design,
and Execution 1.3 Proposed Model for the Systematic Implementation of Ergonomics/Human Factors
The “DOT” Process for Prioritizing Issues
1.1 INTRODUCTION
At 03:00 hours of his fifth consecutive night shift, a process controloperator in a chemical plant received a “Group 1” alarm on the visualdisplay monitor of the plant’s distributed control system (DCS). He wasnot alert at this time of the morning. He recalled that, during the shiftchange meeting, a colleague reported that this alarm had gone off severaltimes during the previous shift. Each time the problem was traced to afaulty transducer on a fin-fan. So, the operator acknowledged the alarmwithout checking further. If he had checked, he would have found that thistime, the “group” alarm was notifying him that power to the DCS hadbeen lost and the entire system was now on battery. In 4 hours, when thebatteries discharged, the DCS failed and the control valves on the furnaces
1
Ch01.qxd 11/21/03 09:17 PM Page 1
2 Introduction
went fully open. The ensuing temperature increase burst the tubes in thefurnace and started a major fire. Without power to the DCS, the controlvalves could not be closed. The damage was $30 million. Fortunately,nobody was hurt.
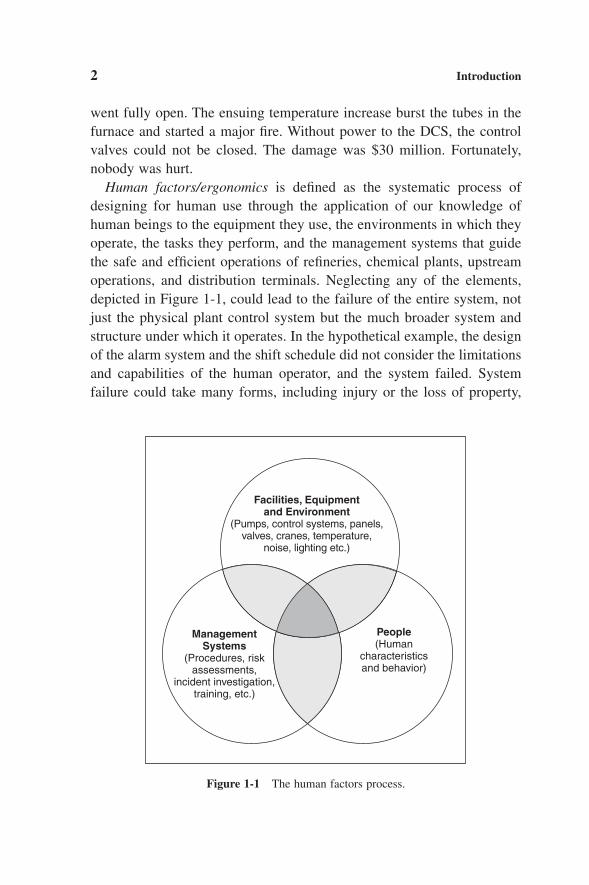
Human factors/ergonomics is defined as the systematic process ofdesigning for human use through the application of our knowledge ofhuman beings to the equipment they use, the environments in which theyoperate, the tasks they perform, and the management systems that guidethe safe and efficient operations of refineries, chemical plants, upstreamoperations, and distribution terminals. Neglecting any of the elements,depicted in Figure 1-1, could lead to the failure of the entire system, notjust the physical plant control system but the much broader system andstructure under which it operates. In the hypothetical example, the designof the alarm system and the shift schedule did not consider the limitationsand capabilities of the human operator, and the system failed. Systemfailure could take many forms, including injury or the loss of property,
Facilities, Equipmentand Environment
(Pumps, control systems, panels,valves, cranes, temperature,
noise, lighting etc.)
ManagementSystems
(Procedures, riskassessments,
incident investigation,training, etc.)
People(Human
characteristicsand behavior)
Figure 1-1 The human factors process.
Ch01.qxd 11/21/03 09:17 PM Page 2

hardware, or information. The key word in the definition is systematic.Clearly, human factors and ergonomics have been considered to someextent in the design of process plants for many years. But, the implemen-tation of this technology has not been systematic in most instances. Humancapabilities and limitations have typically been considered in new appli-cations because the old design did not work properly or a user was injuredbecause the equipment was too difficult to reach or operate. This trial-and-error approach to human factors can also cause the work system to failand lead to retrofits that can be very expensive. The systematic applicationof ergonomics can also be termed a right-the-first-time approach.
The principles of human factors can be applied in any operation where humans interact with their working environment. To understandhow humans interact with the systems they operate it may be useful tobriefly review the classic model of the human/system interface shown inFigure 1-2.
A system, shown in the bottom box of the Figure 1-2, may take manyforms. It may be as complicated as the process control console of a
Introduction 3
Huma nS tressorsHuman Stressors
Higher MentalProcesses
SensesSenses
DisplaysDisplays
Responses
System sSystems
Actual Output (A∞) Desired Output (D∞)
System Input
Device s
System InputDevices
D∞ - A∞
System StressorsSystem Stressors
Figure 1-2 The human/system interface.
Ch01.qxd 11/21/03 09:17 PM Page 3
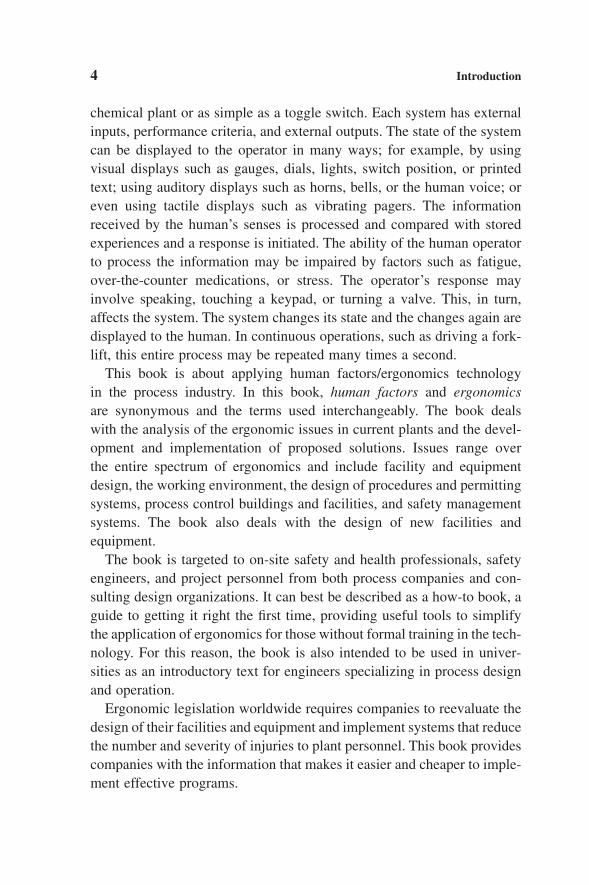
chemical plant or as simple as a toggle switch. Each system has externalinputs, performance criteria, and external outputs. The state of the systemcan be displayed to the operator in many ways; for example, by usingvisual displays such as gauges, dials, lights, switch position, or printedtext; using auditory displays such as horns, bells, or the human voice; oreven using tactile displays such as vibrating pagers. The informationreceived by the human’s senses is processed and compared with storedexperiences and a response is initiated. The ability of the human operatorto process the information may be impaired by factors such as fatigue,over-the-counter medications, or stress. The operator’s response mayinvolve speaking, touching a keypad, or turning a valve. This, in turn,affects the system. The system changes its state and the changes again aredisplayed to the human. In continuous operations, such as driving a fork-lift, this entire process may be repeated many times a second.
This book is about applying human factors/ergonomics technology in the process industry. In this book, human factors and ergonomicsare synonymous and the terms used interchangeably. The book deals with the analysis of the ergonomic issues in current plants and the devel-opment and implementation of proposed solutions. Issues range over the entire spectrum of ergonomics and include facility and equipment design, the working environment, the design of procedures and permittingsystems, process control buildings and facilities, and safety managementsystems. The book also deals with the design of new facilities and equipment.
The book is targeted to on-site safety and health professionals, safetyengineers, and project personnel from both process companies and con-sulting design organizations. It can best be described as a how-to book, aguide to getting it right the first time, providing useful tools to simplifythe application of ergonomics for those without formal training in the tech-nology. For this reason, the book is also intended to be used in univer-sities as an introductory text for engineers specializing in process designand operation.
Ergonomic legislation worldwide requires companies to reevaluate thedesign of their facilities and equipment and implement systems that reducethe number and severity of injuries to plant personnel. This book providescompanies with the information that makes it easier and cheaper to imple-ment effective programs.
4 Introduction
Ch01.qxd 11/21/03 09:17 PM Page 4

The standard for presenting each ergonomics topic is to
• Provide limited theory to outline the human/system interface issues.
• Present the “tools” developed to address these issues.
• Demonstrate how the tools are used.
• Provide a case study to show the reader how to apply them.
At the end of each chapter, we provide review questions so you can testyour knowledge of the information in that chapter.
The following paragraphs outline the contents of the book.
1.2 CHAPTER REVIEW
1.2.1 Chapter 2. Personal Factors
This chapter introduces the capabilities and limitations of workers thataffect their performance in the process workplace. Topics include
• Sensory capabilities, mainly vision and hearing, and how they varywith age.
• Cognitive capabilities, including attention, perception, memory, anddecision making.
• Physical capabilities, including body size, muscular strength, andendurance and how they vary among different major groups (nation-ality, gender, age).
1.2.2 Chapter 3. Physical Factors
The chapter highlights two major physical activity factors, manual handling and cumulative trauma disorders.
1.2.2.1 Manual Handling
The reader is introduced to the notion that the body is limited in theamount of force it can apply and continually exceeding that force can be
Introduction 5
Ch01.qxd 11/21/03 09:17 PM Page 5

injurious. Manual handling is defined in terms of the types of tasks per-formed in operations and maintenance, from the basics of lifting throughto the more complex tasks involving unusual or dynamic body position-ing. Finally, methods of assessing the safety of manual handling tasks isdescribed with examples and computer-based tools.
1.2.2.2 Cumulative Trauma Disorders
This section focuses on the effects of repeated soft tissue injury on theability of workers to perform over long periods of time. The section identifies those critical risk factors that determine how people get hurt andprovides methods to evaluate a job for risk factors and modify the job toreduce the potential for injury.
The tools used to assess and modify tasks with the potential for acuteor cumulative injury are presented. A case study shows how these toolscan be used to improve the work system.
1.2.3 Chapter 4. Environmental Factors
This chapter discusses the effects of four major environmental variableson performance: lighting, noise, vibration, and temperature (hot and cold). It reviews the limitations of the human operator to work where theenvironmental stressors are at high levels. It also provides recommenda-tions for mitigating against the effects of environmental stressors on performance.
1.2.4 Chapter 5. Equipment Design
The chapter is divided into three major sections: controls, displays, andfield control panels.
1.2.5 Chapter 6. Workplace Design
This chapter has three objectives:
6 Introduction
Ch01.qxd 11/21/03 09:17 PM Page 6

1. To identify the principles involved in the design, installation, oper-ation, and maintenance of workplaces. A list of the literature thatsupports each of these principles is provided.
2. To review the techniques in place to analyze work situations thatdetermine workplace and workstation design.
3. To provide guidance (models) on the evaluation and redesign ofexisting and new (grassroots) workstations. A case study is presentedon the use of these models in the design of a control room.
1.2.6 Chapter 7. Job Factors
This chapter discusses the nonequipment factors in a job that can affectperformance. The following paragraphs summarize the topics included inthis chapter.
1.2.6.1 Work Schedules: Fatigue and Rotating Shifts
This section examines the effects of work schedules on the perform-ance of human operators. It provides guidance on the alleviation of fatiguethrough the use of coping strategies implemented by the shift worker, thecompany, and the family.
1.2.6.2 Stress
A certain amount of stress is required by the body to maximize per-formance. Too much or too little stress can affect performance and health.This chapter talks about sources and causes of stress and the strategiesdesigned to help cope with it.
1.2.6.3 Job Analysis
This section describes the use of task analyses and the methodologyused to identify and rank critical tasks.
1.2.6.4 Team Processes
This section describes the growing use of team-based processes toimprove safety performance and the methods that can be used to create
Introduction 7
Ch01.qxd 11/21/03 09:17 PM Page 7

high-performing teams in process plants. The analyses used to create highperforming teams include
1. The cognitive problem-solving style (Kirton Adaptive-InnovativeSurvey).
2. Drexler-Sibbet High-Performance Team Model.
3. ACUMEN.
4. SYMLOG (the systematic multilevel observation of groups).
1.2.6.5 Behavior-Based Safety
Behavior refers to the acts or actions by individuals that can be observedby others. It is what a person does or says not what he or she thinks, feels,or believes. Behavior-based safety (BBS) programs are based on the reinforcement of safe acts or actions and the elimination of at-risk acts or actions. This chapter reviews the principles on which behavior-basedsafety programs are founded, the techniques used to identify at-risk behavior, and the strategies used to create safe behavior. It also reviews some of the most popular commercially available behavior-based pro-grams and provides a gap analysis that can be used at a site to determinewhether it would benefit from the implementation of a BBS program.
1.2.7 Chapter 8. Information Processing
1.2.7.1 Human Error Theory and Methodology
The reader is provided with limited theory on the principles of humanerror and the contribution of error to major accidents in the process indus-try. The theory is used to derive principles for recognizing and dealingwith the causes of error in process operation.
1.2.7.2 Plant Signs and Labels
Plant signs and labels help plant personnel identify equipment andcaution operators on its use. So, signs and labels serve three critical pur-
8 Introduction
Ch01.qxd 11/21/03 09:17 PM Page 8

poses in plant operations. First, they ensure that the references to equip-ment provided in procedures and on process and instrumentation draw-ings (P&IDs) are the same as on the equipment. Second, labels and signsprovide critical learning information for new operators unfamiliar with theprocess plant. Third, they provide prompts and cues for experienced oper-ators on critical operating information. Consequently, it is critical that the labels and signs are accurate, complete, consistent, meaningful, andlegible.
1.2.7.3 Procedures
Procedures are a core part of every process operation. They ensure jobsare performed in a consistent manner. Procedures are also a major aid fortraining new workers. This section provides information on how to deter-mine whether a procedure is required and how to develop and analyzeprocedures from a human factors viewpoint.
1.2.7.4 Training
Training is a major factor in preparing a new process employee for hisor her job and maintaining the skill level of the process plant. The objec-tives of every training program are to maximize skills and knowledgewhile minimizing the time required to learn them. This section examinesthe human factors requirements of a training program and illustrates howto determine whether the training program is effective.
1.2.7.5 Mental Workload
Humans operate best when they are neither too busy nor too bored.Today, the efficiencies that each process company is trying to achievemeans that process operators are likely more busy than bored and, in somecases, too busy.
This section provides the reader the tools necessary to assess operatorworkload and identify those activities in an operator’s job descriptioncausing overload and provides methods for balancing the “boring” and“busy” cycles that may occur in a single job.
Introduction 9
Ch01.qxd 11/21/03 09:17 PM Page 9
1.2.8 Chapter 9. The Use of Human Factors in Project Planning,Design, and Execution
Each phase in the design and execution of process facilities requiresconsideration of the human/system interface. This chapter is about theinclusion of human factors in local and major projects. It provides a modelthat shows how to manage human factors in projects; when to applyhuman factors tools during the planning, design, and implementation ofthe project; and the tools available. The distinction between the way majorcapital projects are conducted and the way local projects are conductedprofoundly influences the way human factors is considered in each typeof project and the design of the tools used. It is important for the readerto remember that not all “projects” are created equal.
Finally, the chapter provides the reader a description of the tools devel-oped to assist process and mechanical engineers to analyze the require-ments of their particular project and specify the best design.
1.3 PROPOSED MODEL FOR THE SYSTEMATICIMPLEMENTATION OF ERGONOMICS/HUMAN FACTORS
This section introduces a model that guides the systematic process ofdesigning for human use. The purpose of the model is to provide a sys-tematic and deliberate method for solving human factors issues in the mostcost-effective way. It describes how
a. Issues are identified and priorities set.
b. Analyses are conducted.
c. Solutions are implemented.
d. Results are measured and follow-up actions taken.
e. Systems are affected
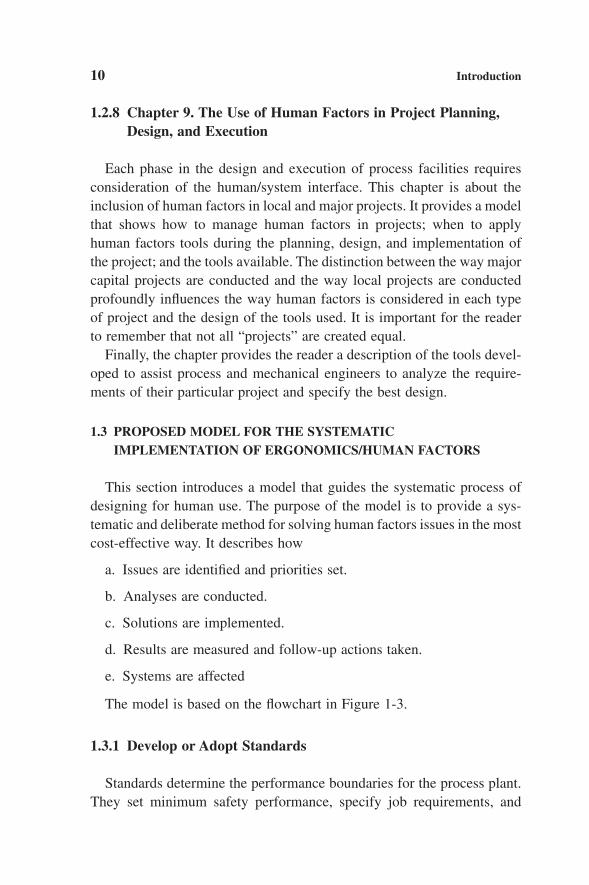
The model is based on the flowchart in Figure 1-3.
1.3.1 Develop or Adopt Standards
Standards determine the performance boundaries for the process plant.They set minimum safety performance, specify job requirements, and
10 Introduction
Ch01.qxd 11/21/03 09:17 PM Page 10

Develop/Adopt Standards forProcess, Equipment, and Facilities
Design
Management Awareness
Awareness Training for HumanPerformance Implementation Team(Site personnal training-long term)
Issue Identification and Definition• Workplace Design• Equipment Design• Work Environment• Physical Activities• Job Design• Information Transfer• Personal Factors
Issue Priorities (high level)
Analysis of Issues
Gap between Results and Standards
Conduct Cost/Benefit Analysis
Re-rank Issues
Develop Strategy for TopIssue and Implement
Measure Results
Yes(Select NextIssue)
No(Select NewStrategy)
Long-Term Implementation(Continuous Improvement)
Success?
Figure 1-3 Model forhuman performance assessmentand intervention.
Ch01.qxd 11/21/03 09:17 PM Page 11

ensure that equipment and facilities meet minimum engineering designrequirements. They provide a benchmark for measurement. They are usedto set priorities for issues. They help guide the selection of strategies andmeasure the effectiveness of the implementation. For this reason, themodel begins with the development or adoption of standards and endswith performance measured against standards.
Standards may be developed by companies (in-house standards), indus-try associations, international organizations, or legislation. For example,in-house standards or guidelines may be developed for the design of plantequipment and facilities. Standards may also be developed for the designof offices. Style guides may be created to guide the design of proceduresto ensure that each is formatted the same way. Industry technical organi-zations, such as the American Petroleum Institute (API) or the CanadianChemical Producers Society (CCPS), develop guidelines for member com-panies to adapt to their operations. Industry standards serve several pur-poses. For one thing, it is more efficient for member companies to pay forpart of the development of a set of guidelines than for each company todevelop its own. Moreover, industry standards are generally consensus documents. They contain the best information from each of the contribut-ing companies. So, the standards should be as good or better than thosedeveloped by any one member company. Finally, they provide consistencyfor regulators. Regulators who are comfortable with the standards tend tospend less time auditing the companies that adopt them.
Most regulatory agencies have developed minimum performance anddesign standards to which the process industries are required to adhere.Examples include
• OSHA Regulation (Standards-29CFR) Process safety management ofhighly hazardous chemicals; 1910.119.
• California Code of Regulations, Title 8, Section 5110, RepetitiveMotion Injuries, Article 106—Ergonomics.
• Washington State, WAC 296-62-051 Ergonomics.
• Contra Costa County, California, Ordinance 98-48, Section 450-8.016 (B) Requirements to develop a written human factors (HF)program.
12 Introduction
Ch01.qxd 11/21/03 09:17 PM Page 12

• European Union Council Directive 90/270/EEC “Work with DisplayScreen Equipment,” May 29, 1990.
• British Columbia, Canada, OHS Regulation Part 4, General Condi-tions, Ergonomics, 1998.
International bodies have developed standards that cut across countryboundaries. Examples include
• ISO/DIS6385: 2002—Ergonomic principles in the design of worksystems.
• International Standards Organization (ISO) Ergonomic requirementsfor office work with visual display terminals, 1992.
• ISO 2631-1 (1997) Mechanical vibration and shock—Evaluation ofhuman exposure to whole-body vibration.
1.3.2 Management Awareness Sessions
We all know that no program succeeds without full managementsupport. And, management will not support something that it does notunderstand. With this is mind, it is important that management understandthe science of human factors, how it can benefit the plant in both the short-and long-term, and how it will be implemented.
In preparation for management awareness sessions, information aboutthe status of human factors in the plant should be collected.
Existing worksite data should be reviewed and summarized. Availabledata could include
• Absenteeism.
• Workers Compensation costs.
• Occupational illness statistics.
• Injury statistics.
• Turnover.
• Previously identified human factors issues.
Introduction 13
Ch01.qxd 11/21/03 09:17 PM Page 13
14 Introduction
• Results from incident investigations.
• Results from risk assessments.
Stakeholders should be interviewed to determine
• What they think the issues are.
• What they want the program to achieve.
• Any resistance to the initiative and why.
• What they believe is their role in the program.
• How they feel they can participate.
Management sessions should be short, graphic, and to the point. Theyshould comprise at least the following information:
1. Review of worksite data (from above).
2. Stakeholder opinions (from above).
3. Description of the program.• Proposed program activities, such as training, issue development
(observations, incident analysis, risk assessment), issue priorities,analyses, strategy development.
• Program schedule that maps activities against a timeline.• Standards of performance used.• How performance is measured and stewarded.
4. What benefits are expected.
5. What costs are anticipated, both level of effort from worksite personnel and costs for equipment and outside support.
6. Long-term benefits.
7. Roles of management and worksite personnel.
1.3.3 Educate Site Personnel
All site personnel should be educated about human factors (HF). Thelength of the training and the amount of theory and practice the trainingcontains depend on the roles and responsibilities assigned the attendees.
Ch01.qxd 11/21/03 09:17 PM Page 14
Technical staff, for example, require a different human factors focus thanworksite operations personnel. Safety committee members need addi-tional training time and to become more proficient with ergonomicmethods than general worksite staff. Safety specialists, in addition, mayhave the responsibility to conduct training and awareness sessions withall worksite personnel, to make them aware of human factors/ergonomicsand the program being launched for the site. With this is mind, a detailedtraining awareness session should be tailored to the roles and responsi-bilities of the worksite personnel. Table 1-1 provides a “training require-ments model,” which assigns training courses to key positions by jobcategory. These courses may have to be developed by an outside HF specialist for use by internal trainers. We strongly recommend that eachsite develop a matrix similar to Table 1-1.
The outcomes of HF training programs include
1. Awareness. Participants are aware of the scope of human factors andthe capabilities and limitations of workers.
2. Knowledge and skills. Participants gain sufficient knowledge andhands-on skills to use the tools and techniques to identify andanalyze human factors issues.
3. Sharing. Training sessions provide an opportunity for the partici-pants to discuss worksite human factors issues.
4. Worksite issues identified. Training can be an opportunity to iden-tify worksite issues. If the training is graphic and contains genericexamples, most attendees can make the mental leap from the train-ing examples to their own worksite issues. If their issues can be captured and given priority, they have a good start to developing an issue identification list. Based on our experience, the strategy ofteaching by examples and case studies has been successful inencouraging worksite personnel to accept human factors.
1.3.4 Identify Issues
The key to an effective human factors program is the identification ofpotential worksite issues. A number of processes have been developed toidentify human factors:
Introduction 15
Ch01.qxd 11/21/03 09:17 PM Page 15
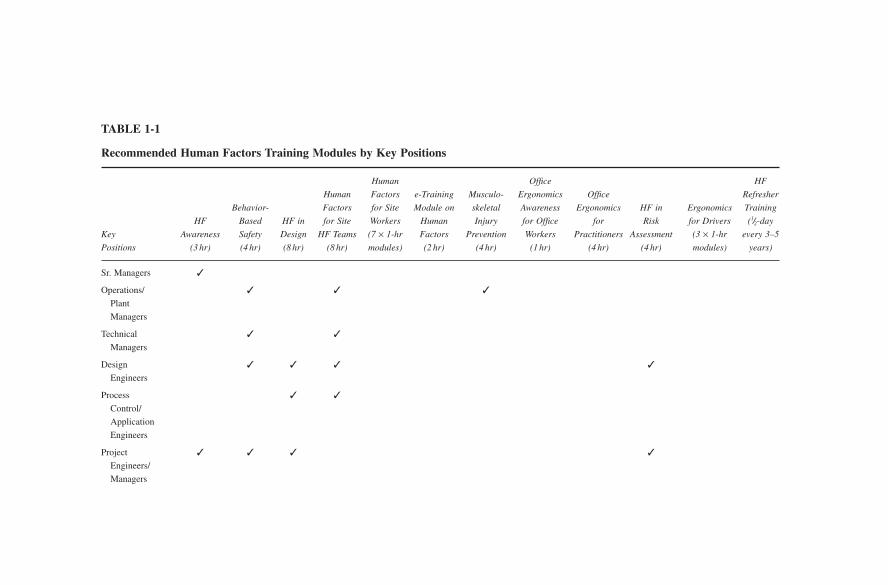
TABLE 1-1
Recommended Human Factors Training Modules by Key Positions
Human Office HF
Human Factors e-Training Musculo- Ergonomics Office Refresher
Behavior- Factors for Site Module on skeletal Awareness Ergonomics HF in Ergonomics Training
HF Based HF in for Site Workers Human Injury for Office for Risk for Drivers (1/2-day
Key Awareness Safety Design HF Teams (7 ¥ 1-hr Factors Prevention Workers Practitioners Assessment (3 ¥ 1-hr every 3–5
Positions (3 hr) (4 hr) (8 hr) (8 hr) modules) (2 hr) (4 hr) (1 hr) (4 hr) (4 hr) modules) years)
Sr. Managers ✓
Operations/ ✓ ✓ ✓
Plant
Managers
Technical ✓ ✓
Managers
Design ✓ ✓ ✓ ✓
Engineers
Process ✓ ✓
Control/
Application
Engineers
Project ✓ ✓ ✓ ✓
Engineers/
Managers
Ch01.qxd 11/21/03 09:17 PM Page 16

Instrument ✓ ✓
Technicians
Safety/Health ✓ ✓ ✓ ✓ ✓ ✓ ✓ ✓
Advisors
Risk ✓ ✓ ✓ ✓
Assessment
Specialists
Designated ✓ ✓
Change
Authorities
Team Leaders/ ✓ ✓ ✓ ✓ ✓
Supervisors
(1st & 2nd
Line)
HF Site ✓ ✓ ✓ ✓ ✓
Implementation
Team
Operations/ ✓ ✓ ✓
Mechanical
Employees
Office ✓ ✓
Employees/
Managers
Office ✓
Ergonomics
Practitioners
Ch01.qxd 11/21/03 09:17 PM Page 17

• Team training, as already described.
• Observation of behavior.
• Musculoskeletal risk assessments.
• Task analyses.
• Office ergonomics assessments.
• Incident analyses.
• Risk analyses, such as job safety analyses or last minute risk assessments.
• Employee interviews.
• Site assessment by HF specialists.
• Site safety inspections by safety specialists.
Each issue should be captured in a simple database that categorizes itby plant location or human factors/ergonomics focus. Each issue shouldalso be identified by date of submission and source.
It is important that the processes used to identify human factors issuesrecord every issue proposed and that each participant feels free to proposeany issue that he or she wants. The success of this program depends onencouraging site personnel to identify as many issues as possible, nomatter how insignificant they may initially appear. You will find that theprocess of proposing issues can be valuable. In addition, the process of setting priorities screens the issues and ensures that only the mostimportant ones are considered.
1.3.5 Setting Priorities
No company can afford to spend money and commit resources on issuesthat have little benefit to the operation. So, it is essential to set prioritieson the list of issues generated and continue to work only on those thathave an impact on plant metrics, such as safety, health, or productivity.
Before continuing, it is important to note that every issue has an owner.So, every issue is important to someone in the plant. People who
18 Introduction
Ch01.qxd 11/21/03 09:17 PM Page 18

TABLE 1-2
A Simplified Risk Matrix for Ranking Human Factors Issues
Consequence Categories Probability
Public High LowSafety Financial Disruption Environmental >1 time <1 time
per year per year
HIGH LTI >$100k >1-DAY Fine/MA NotificationRWC
LOW FA <$100k <1-DAY No fine orNotification
Where:LTI = Lost time incidentMA = Medical aid incidentRWC = Restricted work case incidentFA = First aid incident
contribute to the identification process expect that their issue(s) will beresolved. So, they must be told whether their issues are going forward ornot. And, if they are not going forward, why not?
There are many ways to conduct an initial screening of potential issues.Each method typically revolves around cost and benefit or risk. We findthat worksite personnel can easily categorize issues into the conse-quence/probability risk matrix shown in Table 1-2.
Column headings specify the probability that an issue will occur. Thehigh level, for example, could be one or more occurrences per year. Thelow level would then be less than one occurrence per year. Row headingsspecify the consequences if an issue occurs. Consequences can beexpressed in several ways, as shown in Table 1-2. The consequence categories can include safety and health, profit and loss, the effect on the public, and the effect on the environment.
The highest priority issues are those having a high probability of occurring and a high consequence when they occur. A simple process foridentifying the most important issues is explained on page 21.
Introduction 19C
onse
quen
ce
Ch01.qxd 11/21/03 09:17 PM Page 19

1.3.6 Analyze the Issues and Assess the Gap against Standards
In this step, the top priority issues identified are analyzed. The resultsare compared against the performance standards established in the firststep of the model.
The type of analysis selected depends on the issue topic. For example,if the issue is musculoskeletal (e.g., lifting, reach, posture), the analyticaltools could include a task analysis followed by one of these:
1. National Institute of Occupational Safety and Health (NIOSH)lifting analysis or equations.
2. University of Michigan, three-dimensional analysis tool or checklists.
3. Lumbar motion monitor (Marras et al., 1993).
4. Cumulative trauma disorder (CTD) analyses such as rapid upperlimb assessment (RULA) (McAtamney and Corlett, 1993).
Each analysis provides a result that can be compared against previouslyestablished standards.
If, for example, the issue is the inadequate design of a visual display,standards have been established to cover all aspects of display design,including character size (IPC, 1974), contrast (Sanders and McCormick,1993) and lighting (Grandjean, 1988). Various analytical techniques areidentified and explained in the chapters to follow.
If an analysis indicates that the issue is in compliance with acceptedstandards, then it is noted, and the “owner” is notified. If the analysis indi-cates that the issue is not in compliance with accepted standards, it entersthe next phase of screening and cost/benefit analysis.
1.3.7 Conduct Cost-Benefit Analysis
Every solution to an issue has a cost: capital, personnel time, scheduledisruption, public criticism. And every solution has a benefit: standardscompliance, profit, risk reduction, safety improvement, public endorse-ment, productivity improvement. This step estimates the costs and the benefits associated with solutions to each issue. We find that, on a high level,
20 Introduction
Ch01.qxd 11/21/03 09:17 PM Page 20

Introduction 21
TABLE 1-3
Simplified Cost/Benefit Matrix
Cost
Benefit High Low
High
Low
worksite personnel can make the estimates for costs and benefits using thesimple 2 ¥ 2, cost/benefit matrix shown in Table 1-3. The process for select-ing the most cost-effective solutions is explained in the following box.
The “DOT” Process for Prioritizing Issues
In sections 1.3.5 and 1.3.7 of this chapter, the systematic modelrequired that a list of many issues be reduced to a small set of high pri-ority issues by using either a simple 2 ¥ 2 risk decision matrix, or a 2¥ 2 cost/benefit decision matrix. The procedure explained below, is asimple way to identify the top priority issues. We term this procedurethe “DOT” process.
The table on page 22 shows a 2 ¥ 2 matrix that is identical to Table1-2 in the text. The set of columns is labeled PROBABILITY and theset of rows CONSEQUENCE. (If “Cost/benefit” was being determined,the columns would be labeled COST and the rows would be labeledBENEFIT as in Table 1-3).
One of the columns is labeled HIGH, the other LOW. Similarly, oneof the rows is labeled HIGH, the other one LOW.
Let us assume that the objective of the process is to identify thoseissues that have the highest risk, i.e., the highest probability of occur-ring and the highest consequence when they occurred; in other words the issues that fall into the cell “HIGH Probability” and “HIGH Con-sequence.” We provide each participant in the procedure with a set ofdots. (For this example, we’ll use GREEN, but the color doesn’t
Continued
Ch01.qxd 11/21/03 09:17 PM Page 21

22 Introduction
matter.) The number of GREEN dots given to each participant is nor-mally about 1/3 of the number of issues being evaluated. Participantsare instructed as follows:
1. Familiarize yourself with each issue
2. Identify issues that are duplicates or very similar and combinethem into one issue. (you don’t want to be splitting votes betweensimilar issues)
3. Decide “Which issues, if resolved, would have the highest probability of occurrence?”
4. Place one GREEN dot on each issue that he or she feels has thehighest probability of occurrence
At the end of this process, some issues will be covered by many dots,some by not so many, and some by no dots at all.
The second step is to supply each participant with another set of dotshaving a different color from the first set. In this example, our second
Risk Matrix for Ranking Human Factors Issues
Consequence Categories Probability
Public High LowSafety Financial Disruption Environmental >1 time <1 time
per year per year
HIGH LTI >$100k >1-DAY Fine/MA NotificationRWC
LOW FA <$100k <1-DAY No fine orNotification
Where: LTI = Lost time incidentMA = Medical aid incidentRWC = Restricted work case incidentFA = First aid incident
Con
sequ
ence
Ch01.qxd 11/21/03 09:17 PM Page 22
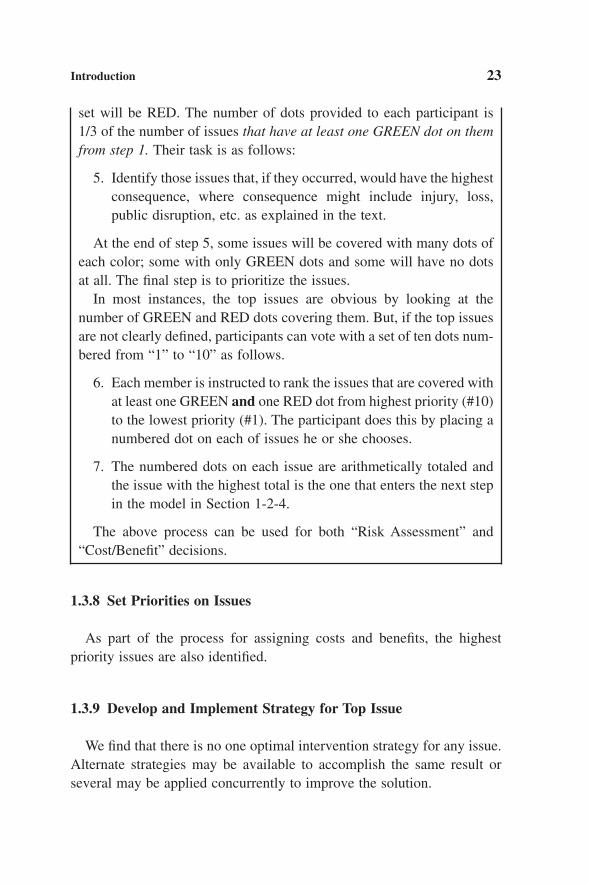
set will be RED. The number of dots provided to each participant is1/3 of the number of issues that have at least one GREEN dot on themfrom step 1. Their task is as follows:
5. Identify those issues that, if they occurred, would have the highestconsequence, where consequence might include injury, loss,public disruption, etc. as explained in the text.
At the end of step 5, some issues will be covered with many dots ofeach color; some with only GREEN dots and some will have no dotsat all. The final step is to prioritize the issues.
In most instances, the top issues are obvious by looking at thenumber of GREEN and RED dots covering them. But, if the top issuesare not clearly defined, participants can vote with a set of ten dots num-bered from “1” to “10” as follows.
6. Each member is instructed to rank the issues that are covered withat least one GREEN and one RED dot from highest priority (#10)to the lowest priority (#1). The participant does this by placing anumbered dot on each of issues he or she chooses.
7. The numbered dots on each issue are arithmetically totaled andthe issue with the highest total is the one that enters the next stepin the model in Section 1-2-4.
The above process can be used for both “Risk Assessment” and“Cost/Benefit” decisions.
1.3.8 Set Priorities on Issues
As part of the process for assigning costs and benefits, the highest priority issues are also identified.
1.3.9 Develop and Implement Strategy for Top Issue
We find that there is no one optimal intervention strategy for any issue.Alternate strategies may be available to accomplish the same result orseveral may be applied concurrently to improve the solution.
Introduction 23
Ch01.qxd 11/21/03 09:17 PM Page 23

Human factors intervention strategies can be grouped by category asfollows:
1. Engineering/interface design. Changes or additions are made to thedesign of the physical workspace, equipment, or environment toimprove worker performance.
2. Training. To improve the knowledge and skill of the worker. Training could be given both on and off the job. On-the-job train-ing could also include “work hardening,” a process whereby theworker gradually becomes adapted to the physical and mentalstresses of the task.
3. Job or task design. The task conditions are modified. Modificationsmight include• Changing the activity sequence in a task.• Improving procedures or permitting systems.• Reassigning task steps to different work posts.• Modifying work or shift schedules.
4. Selection. In some limited circumstances, a rational interventionstrategy might consist of choosing people with capabilities thatmatch the job. We would not ask a physician to perform an engi-neering analysis or ask a color-deficient person to install color-codedcables. “Selection” must be performed responsibly and within thelaws that many jurisdictions have enacted to prevent discrimination.
5. Behavior. Behavior is defined as “what people do or say” (Geller,1996). Behavior is observable and measurable. It can be affected byinterface design, job design and training, or strategies specificallydesigned to change behavior. These can include• Creating positive consequences for desired behavior.• Removing negative consequences for desired behavior (make it
easier).• Influencing risk perception among workers.• Creating negative consequences for undesired behaviors.• Providing coaching and corrective feedback for undesired
behaviors.
In the chapters that follow, detailed examples of potential interventionsare proposed for each of these categories.
24 Introduction
Ch01.qxd 11/21/03 09:17 PM Page 24
Burke (1992) developed an “intervention discovery” guide for muscu-loskeletal issues. The guide consists of a series of 38 worksheets that walkthe user from the initial issue through to a potential solution. Similar“smart” guides could be developed for other types of issues.
1.3.10 Measure Results
If you cannot measure the effects of an intervention, you cannot knowwhether performance has improved. We find that the effects of any inter-vention can be measured. The measures may be quantitative, such as totalrecordable injury rates (TRIR), or qualitative, such as results of anemployee survey both before and after the intervention strategy wasimplemented. In the chapters to follow, example performance measuresare developed for use in this process.
The measurement selected should tell us whether the intervention notonly improved performance but by how much. If performance improvesto the levels required by established standards, the intervention was asuccess and the next issue in the priority queue can be selected for action.If, however, performance does not improve to a satisfactory level, thestrategy may have to be modified and reimplemented.
1.3.11 Improve Management Systems
Major process mishaps that occurred in the 1980s spawned an initia-tive in the1990s to develop and implement management systems whosepurpose is to improve the safety of the process industry (CCPS, 1993).Many of the base management systems deal with and are influenced bythe human factors topics that are covered here. For human factors to besuccessful over the long term, the results from implementing strategiesmust be used to continuously improve each management system by integrating human factors into the systems.
REVIEW QUESTIONS
Test your understanding of the material in this chapter.
Introduction 25
Ch01.qxd 11/21/03 09:17 PM Page 25
1. Identify an ergonomic initiative within your company, then list the major standards that determine your initiative’s success.Categorize the standards by group:Internal standards.Industry standards.Technical association standards.International standards.
2. Explain how your safety management systems will change as aresult of success with your initiative.
3. Identify the risk management process that you will use to deter-mine which ergonomic issues that you identify will go forward for analysis.
4. Briefly discuss how you would measure the effectiveness of ahuman factors training program.
5. Standards are used for the following reasons (True or False):a. To conduct a gap analysis of the results and issues analysis.b. To obtain funding for an ergonomics program.c. To provide a basis for measuring the results of strategy
implementation.d. To ensure that the cost/benefit analyses are valid.
6. Which of the following items are desired outcomes of a humanfactors training program?a. Behavioral observations.b. Identification of worksite issues.c. Complete task analyses.d. Awareness of the capabilities and limitations of workers.
7. Which should be conducted first at your site, management aware-ness or site personnel training?
8. Discuss briefly how you would prioritize the potential humanfactors issues identified at your site.
9. Discuss briefly how you would conduct a cost/benefit analysis forthe issues identified in a process control system analysis.
26 Introduction
Ch01.qxd 11/21/03 09:17 PM Page 26

10. What, in your opinion, would be a valid intervention strategy fora valve that was found to be too high to reach and operate?
REFERENCES
Burke, M. (1992) Applied Ergonomics Handbook. Boca Raton, FL: Lewis.
CCPS. (1993) Guidelines for Auditing Process Safety Management Systems. New York:Center for Chemical Process Safety of the American Institute of Chemical Engineers.
Geller, E. S. (1996) Working Safe. Radnor PA: Chilton Book Company.
Grandjean, E. (1988) Fitting the Task to the Man. London: Taylor and Francis.
IPC. (1974) Applied Ergonomics Handbook. Guildford, Surrey: IPC Science and Technology Press.
Marras, W.S., Lavender, S.A., Leurgans, S.E., Rajulu, S.L., Allread, W.G., and Ferguson,S.A. (1993) “The role of dynamic three-dimensional trunk motion in occupationally-related low back disorders.” Spine, 18(5), 617–628.
McAtamney, L., and Corlett, N. (1993) “RULA: A survey method for the investigation ofwork-related upper limb disorders.” Applied Ergonomics, 24(2), 91–99.
Pheasant, S. (1996) Bodyspace: Anthropometry Ergonomics and the Design of Work.Second Ed. Philadelphia, Taylor and Francis.
Sanders, M. S., and McCormick, E. J. (1993) Human Factors in Engineering and Design.Seventh Ed. New York: McGraw-Hill.
Introduction 27
Ch01.qxd 11/21/03 09:17 PM Page 27

Ch01.qxd 11/21/03 09:17 PM Page 28
2
Personal Factors
2.1 Introduction2.2 Sensory and Cognitive Capabilities
2.2.1 Visual Sense2.2.2 Auditory Sense2.2.3 Cognitive Capabilities2.2.4 Summary of Information Processing
2.3 Physical Capabilities2.3.1 Muscular Strength and Endurance2.3.2 Anthropometry: Body Size
2.4 Case Study2.4.1 Method2.4.2 Data Collected 2.4.3 Conclusion
2.1 INTRODUCTION
In the human/system interface (HSI) model (Figure 1-2), the operatorcontinuously receives information from the environment and processes it.There may or may not be follow-up action. If a response is required, thenthe appropriate information is transmitted back to the system in the formof manual manipulation of controls (e.g., valves) and buttons, lifting balesof rubber, climbing ladders and stairs, and so forth. This, in turn, changesthe status of the system. The operator receives new information from thedisplays about the status of the system and, again, may or may not takeaction to bring the system to the desired level or maintain its status. Fur-thermore, the information the operator receives does not come only fromdisplays of machines. As an example, when using a hand tool such as asaw, the external status of the line to be cut is perceived by the operator
29
Ch02.qxd 11/1/03 4:17 PM Page 29

and continuous corrections are made to end up with a straight cut. Thus,the word display has a more general meaning than just a temperature orpressure gauge.
This HSI model functions as a closed-loop system. This means that, aslong as we interact with something (i.e., machine, tools, other humans, oreven animals), we continuously receive information, process information,look for status changes, receive new information, and so on. The first setof limitations that can affect the efficient working of this HSI closed-loopsystem is the sensory, perceptual, and cognitive capabilities of the opera-tor. The second set of limitations is the physical capabilities that allow thebody to move in the desired way. This chapter discusses both sets of limitations.
At the end of this chapter is a case study related to examining humanforce capabilities when interacting with valves at different positions. Inaddition, a set of review questions are included to help check your under-standing of the material covered in this chapter.
2.2 SENSORY AND COGNITIVE CAPABILITIES
Among the human sensory mechanisms are the five senses (vision,hearing, touch, smell, and taste). These senses deal with stimuli externalto the body and are referred to as the exteroceptors. In addition, we havesenses that deal with the position of our body in space and assist us injumping, climbing stairs and ladders, reaching, and the like. These arereferred to as proprioceptors and are embedded in the muscles, tendons,joints, and inner ear. This section covers the exteroceptors, specificallyvision and hearing, for two reasons:
1. The majority of information we need to perform tasks is receivedthrough the visual and hearing senses, such as written procedures,warning labels and signs, control position, dials, warning lights, andalarms.
2. The majority of human factors research has been conducted in thevisual and auditory senses.
30 Personal Factors
Ch02.qxd 11/1/03 4:17 PM Page 30

2.2.1 Visual Sense
Vision has been the most studied and researched sense. In addition,given current technologies, vision is probably the most overloaded senseat work. Our visual system receives energy from the environment aroundus and converts the energy into something meaningful for us to under-stand. Our visual system works on two levels: physiological, includes theeyes and brain, and psychological, involves both the immediate visual sen-sation (energy received) and our interpretation of it based on our knowl-edge and experience (the perception process).
In general, we receive visual information either directly (direct obser-vation of a coworker similar to the observation process of a behavior-based safety program) or indirectly (seeing things through a computer,television, radar, or the like).
The most important part of the eye is the retina, which covers the backof the eye. It converts energy from the environment (i.e., light) into elec-trical energy and passes it to the brain through optic nerves. The retina ismade up mostly of cones and rods (so-called because of their shape).Cones function at high illumination levels and are responsible for day-light vision. Cones are also important in visual acuity (ability of the eyeto see details) and differentiate extremely well among colors. Rods, onthe other hand, respond to low illumination levels, such as at night. Rodsalso differentiate between shades of black and white.
Because of the characteristics of the cones and rods, the eyes functionwell over a wide range of illumination levels. However, several factorsdetermine visual capabilities and effectiveness, and have important impli-cations in designing visual displays. These factors are discussed next.
2.2.1.1 Accommodation of the Eye
Accommodation refers to changing the shape of the lens in the eye toproperly focus the image on the retina. In other words, accommodation isthe ability of the eye to focus on objects at different distances. Forexample, the ability to read signs on the side of the road is an example offar vision. The ability of a control room operator to monitor displays isan example of near vision.
Personal Factors 31
Ch02.qxd 11/1/03 4:17 PM Page 31

In normal accommodation, the lens of the eye flattens to focus a farobject on the retina and bulges to focus a near object. The eyes may notaccommodate an object for two reasons:
• Nearsightedness. Individuals cannot focus on far objects. The lenstends to remain in a bulged condition and the light from the far objectis focused in front of the retina. Nearsightedness is also referred toas myopia.
• Farsightedness. Individuals cannot focus on near objects. The lenstends to remain in a flattened condition and the light from the nearobject is focused in the back of the retina.
With aging, there is a reduction in the ability of the eyes to accom-modate. This is related to the gradual loss of the elasticity of the lens. Thisreduction is measured by the closest distance (near point) at which theeyes can focus. The table below lists average near point distances againstage.
32 Personal Factors
Age Near Point in cm (in.)
10 7 (2.8)15 8 (3.2)30 11 (4.4)45 25 (10)50 50 (20)60 85 (34)70 100 (40)
2.2.1.2 Visual Field
Visual field is defined as “what can be seen when head and eyes arekept fixed (motionless).” We divide the visual field roughly into threeareas (Grandjean, 1988):
1. Optimal field of view with an angle of view of 1° where objects aresharp and seen clearly with details.
2. Middle field with a visual angle ranging between 1° and 40°, whereobjects are not sharp; however, movements and strong contrasts arenoticed.
Ch02.qxd 11/1/03 4:17 PM Page 32

3. Outer field with a visual angle ranging between 40° and 70° whereobjects are not sharp or clear. Objects must move to be noticeable.
It is important that the objects we need to see clearly are located in theoptimal field area. This subject is discussed in detail in Chapter 5, “Equip-ment Design.”
2.2.1.3 Adaptation Process
Adaptation is the process or ability of the eyes to adjust to different lightlevels. We need time to adapt to darkness or brightness before we can dis-criminate details. For example, when we first move from bright sunlightto a dark movie theater, we have difficulty finding our way around. Aftera while, we begin to see distinct objects and faces. This process is calleddark adaptation. Dark adaptation is the process of transitioning from coneto rod vision. The process can take from 30 minutes to an hour dependingon the initial illumination levels. Conversely, moving from darkness tobright sunlight, we experience high glare and find it difficult to see details.The process of transitioning from dark to light is called light adaptation.Light adaptation is the process of transitioning from rod to cone vision.Light adaptation is completed relatively fast, a minute or two. The processof adaptation has practical work implications:
1. Allows sufficient time for the eyes to adapt when performing tasksat low levels of lighting.
2. Avoids excessive changes in illumination levels, since the constantneed for adaptation results in visual fatigue.
3. Avoids excessive differences in brightness in all important surfaceswithin the visual filed.
2.2.1.4 Color Vision
Color, in the workplace, is used to help the operator to distinguish objectsin the visual field. For example, the green-colored areas on a temperaturedisplay indicate acceptable levels, yellow means caution, and red meansunacceptably high levels. It is important to point out here that the eyes donot have the same sensitivity to color under different lighting conditions.
Personal Factors 33
Ch02.qxd 11/1/03 4:17 PM Page 33
When it is bright, the eyes are more sensitive to red and less sensitive toblue. The reverse occurs when it is dark. Therefore, we need to considerthe lighting conditions under which the colored-coded temperature displayis viewed. More details on lighting are provided in Chapter 4.
People with normal color vision are capable of distinguishing amonghundreds of different colors. Complete lack of color vision (color blind-ness) is extremely rare.
Color deficiency, such as the inability to discriminate between red andgreen is more common. Usually, these colors are seen as poorly saturatedyellows and browns. Overall, about 8% of the male population and lessthan 1% of the female population have this form of color deficiency.Therefore, color should always be used as a redundant (additional) methodof coding, and not the primary method.
2.2.1.5 Visual Acuity
Acuity refers to sharpness of vision. Visual acuity is the ability to seefine details; for example, detecting differences in the position of two con-trols, recognizing the presence of an object in the visual field, inspectinga tank for cracks, or even reading the small details on a bottle of a pre-scription drug. A small distinction between visibility and visual acuity iswarranted at this point. The ability the see the pressure gauge on a fielddisplay panel refers to visibility, whereas the ability to identify thenumbers on the gauge refers to visual acuity.
Visual acuity depends largely on the individual’s visual capabilities,such as accommodation of the eyes, visual field, the process of adapta-tion, color vision, and age (discussed in Section 2.2.1.6) and situationalfactors. Situational factors include:
• Size of the object. As the size of the object increases, so does ourability to see the object (Figure 2-1). However, this depends on theviewing distance. The further away we are from the object, the lessis our visual acuity to see details. For example, we can see many moreground details when sitting in an airplane at an altitude of 2000 feetthan at 35,000 feet. Similar logic can be applied in the work envi-ronment. If we need to design a sign in the plant or a visual displayin the control room, we need to consider what will be the greatestviewing distance (Figure 2-2). For example, a process control room
34 Personal Factors
Ch02.qxd 11/1/03 4:17 PM Page 34
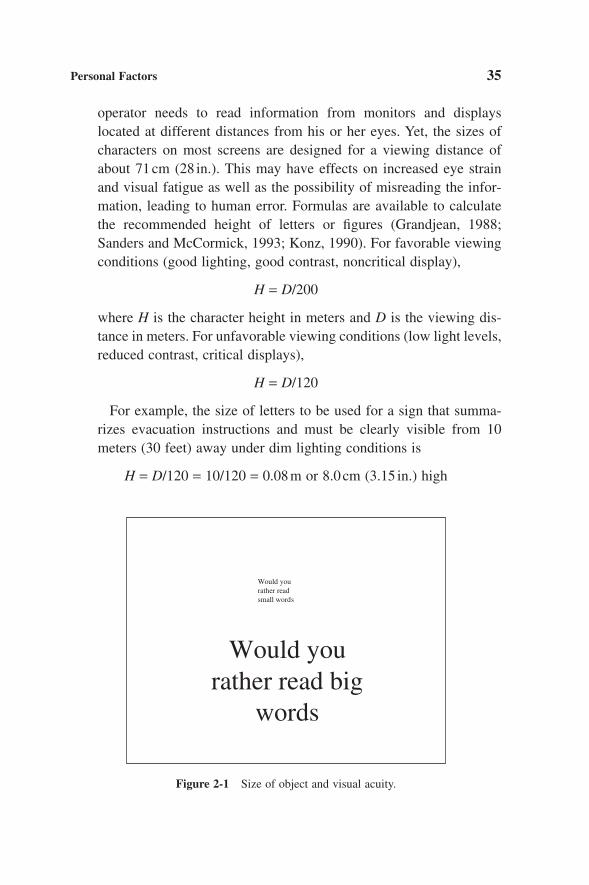
operator needs to read information from monitors and displayslocated at different distances from his or her eyes. Yet, the sizes ofcharacters on most screens are designed for a viewing distance ofabout 71cm (28 in.). This may have effects on increased eye strainand visual fatigue as well as the possibility of misreading the infor-mation, leading to human error. Formulas are available to calculatethe recommended height of letters or figures (Grandjean, 1988;Sanders and McCormick, 1993; Konz, 1990). For favorable viewingconditions (good lighting, good contrast, noncritical display),
H = D/200
where H is the character height in meters and D is the viewing dis-tance in meters. For unfavorable viewing conditions (low light levels,reduced contrast, critical displays),
H = D/120
For example, the size of letters to be used for a sign that summa-rizes evacuation instructions and must be clearly visible from 10meters (30 feet) away under dim lighting conditions is
H = D/120 = 10/120 = 0.08m or 8.0cm (3.15 in.) high
Personal Factors 35
Would you rather read small words
Would you rather read big
words
Figure 2-1 Size of object and visual acuity.
Ch02.qxd 11/1/03 4:17 PM Page 35

• Contrast. This refers to the difference in brightness between a visualtarget and its background. Generally, as the contrast increases, theability to see details (visual acuity) increases. For example, detectingdark (black) characters on white background (90% contrast) is mucheasier than detecting dark characters on relatively darker background(Figure 2-3).
• Illumination. Up to a point, visual acuity and contrast sensitivity (theability of the eye to detect the smallest difference, contrast, betweena lighter and a darker spatial area) increase, or improve, with increas-ing illumination. However, high, intense levels of illumination are notalways warranted, as they may contribute high levels of glare, weakeninformation clarity, and lead to temporary blindness. Therefore, theamount of illumination necessary to perform visual tasks is taskdependent. Illumination is discussed in detail in Chapter 4.
• Exposure time. Visual acuity increases with increased exposure time.The longer we view and focus on an object, the more details we see.
• Observer or target movement. Our visual acuity decreases as theobserver or target move. This is so because movement affects expo-
36 Personal Factors
TURN OFF RADAR SETTURN OFF RADAR SETBEFORE APPROACHINGBEFORE APPROACHING
WITHIN 15 FEETWITHIN 15 FEETOF THISOF THIS
ANTENNAANTENNA
Figure 2-2 Poor design of a warning sign; the text is too small to be read from 15feet away.
Ch02.qxd 11/1/03 4:17 PM Page 36

sure time. For example, consider the difficulty in reading the detailsof an object on the side of the road while driving a car at 100km perhour (65 miles per hour).
2.2.1.6 Age
The fact that our visual abilities and visual performance decline withage should not be a point of dispute or debate. For example, our visualacuity is reduced by about 30% between the ages of 20 and 60 years.Faster depreciation of vision generally takes place after age 40, and wewonder why we cannot read the fine print on the bottle of a prescriptiondrug.
This decrease in visual acuity is related to the following changes in thestructure of the eye:
• Yellowing of the lens, where the amount of light reaching the retinais significantly reduced.
• Decrease in the accommodation power of the eye around the age of40, which affects depth perception and distance vision. This is causedby deterioration in the muscles that contract and change the lensshape. Depth perception is our ability to judge our distance fromobjects and the distance between objects in three-dimensional space.
• Retina and nervous system changes around the age of 60, affectingthe size of the visual field and sensitivity to low quantities of light.
Personal Factors 37
Dark letters on a darkbackground are hard to read
Dark letters on a lightbackground are easy to read
Figure 2-3 Example of poor and good contrast.
Ch02.qxd 11/1/03 4:17 PM Page 37
If the workforce is older, special considerations must be made to accom-modate workers who are more likely to experience visual difficulties.Some of these considerations are:
• Higher levels of lighting and larger targets such as characters.
• More viewing time to absorb the information.
• Higher level of contrast between the target and its background, suchas black characters on white background.
• Targets set at the same distance from the eyes, since speed of accom-modation decreases with age. For example, the displays viewed by acontrol room process operator should be at the same distance fromthe eyes.
2.2.2 Auditory Sense
Hearing is second only to vision in providing information throughwhich we can understand and adjust to our surroundings. For example, afield operator and a control room operator communicate through a radioto change a state of a system such as opening or closing specific valves.Other areas where hearing is key is in the design of warning signals onmachines, a buzzer on a fire alarm, speech communication, and the like.
The two defining characteristics of any auditory stimulus are frequencyand intensity. The corresponding subjective attribute (what people hear)for frequency is tone and, for intensity, is loudness. This area is discussedin detail in Chapter 4 in the section on noise. In many situations, thedesigner has to choose between using visual and auditory displays or evena combination of the two. The decision on when to use an auditory orvisual presentation of information depends on:
• The nature of the message. An alarm that calls for immediate actionshould be auditory. The message here is short and simple and dealswith events in time. Moreover, a person need not look at an alarm tohear it.
• Characteristics of people involved, such as young versus older people(refer to the noise section in Chapter 4).
38 Personal Factors
Ch02.qxd 11/1/03 4:17 PM Page 38

• Conditions under which information must be received. For instance,if the visual system is overburdened, then a buzzer makes sense toalert operators of equipment failure without having to look at a visualdisplay.
In deciding on the type and role of auditory displays, a number of factorsmust be considered:
• Signal characteristics, which include sound frequency, intensity,duration, and rate of sound occurrence like the on/off emergencysignal. Signal characteristics are discussed in Chapter 4.
• Individual characteristics, which include the hearing ability and expe-rience of the person, age, and length of exposure to signal.
• Environmental characteristics, which include the type and amount ofbackground (masking) noise.
2.2.3 Cognitive Capabilities
In the previous section, we discussed how people receive informationfrom the environment through their visual and auditory senses. Thissection reviews how we process and interpret this information and theassociated limiting factors.
The senses (eyes, ears, etc.) receive signals (data) from the environmentand pass them to the brain through nerves. Such data are referred to assensory information. The brain acts on the sensory information throughcomplex processing mechanisms to give it meaning. This is referred to as information processing. Information processing influences people’sbehavior, and people’s behavior at work is a consequence of informationprocessing.
Information processing involves several different processes: attention,perception, memory, and decision making. These processes are inter-dependent and serve different functions in the flow and interpretation ofinformation. As we will see and repeat later, receiving and interpretinginformation requires knowledge, experience, mental alertness, skills, andthe ability to formulate new ideas. More discussion on information pro-cessing in terms of procedure writing and evaluation, vigilance, andhuman error can be found in Chapter 8.
Personal Factors 39
Ch02.qxd 11/1/03 4:17 PM Page 39

2.2.3.1 Attention
Consider the following two examples to illustrate the process of attention:
1. When driving a car, we want to ensure that we are watching the road,steering the car, maintaining velocity by looking at the speedometerand adjusting the pressure on the gas pedal, listening to the radio,and perhaps talking to a passenger and drinking coffee.
2. A control room process operator scans and monitors a number ofdisplays (each display presenting different information, temperatureand pressure of different units), talks to coworkers, answers thephone, and communicates through the radio with an operator in thefield.
It is clear that we are continuously bombarded with information fromthe environment around us. However, because we have limited capacityto process the information we receive, we must select out the importantmessages and ignore all other information. Attention is the process ofinformation reduction. It allows us to select important information, and itcontrols which information is processed further. Occasionally, we do not“pay attention” and miss important information that may be the cause oftask errors and accidents. For example, while driving the car we decidedto change the radio station (most important activity at that moment). Nowthe attention is diverted from the road and, suddenly, a bumper-to-bumperincident takes place. The limiting factors here are:
1. We behave like a single-channel information processing device. Wemake active decisions about one thing at a time, even though wethink we are attending to all things going around us, at all times.
2. We process information at a constant rate because of our limitedchannel capacity in terms of speed and quantity.
For example, we behave roughly like the automatic feeder of a photo-copy machine. If we put in a stack of 100 pages to copy, a single feeder(single channel) takes in a fixed number of pages (process at constant rate)per minute or hour. Four types of situations define the direction of atten-tion (Goldstein and Dorfman, 1978; Broadbent, 1982; Brouwer et al.,1991; Parasuraman and Nestor, 1991; Wickens, 1992):
40 Personal Factors
Ch02.qxd 11/1/03 4:17 PM Page 40
• Selective attention is a conscious decision to attend voluntarily toimportant (relative to the individual) information. For example, thecontrol room process operator scans the displays to detect unexpectedbut important events, such as excessive temperature or pressure.
• Focused attention allows us to filter out unwanted information and attend to one source of important information. For example, thedriver changing the radio station is focused on the radio as the onesource of important information at that moment.
• Divided attention occurs where we need to attend to several things atonce. For example, the control room operator monitors displays andtalks to coworkers while eating.
• Sustained attention, also known as vigilance, is where we mustmonitor a situation for a long period of time. For example, operatorsscan the radar in an airport control tower.
2.2.3.2 Perception
After the signals from the environment enter the brain through the eyesor ears, for example, they are interpreted to produce a recognizable patternof sight or sound. This process, called perception, is entirely subjective innature because it is greatly influenced by the individual’s knowledge,experience, expectations, feelings, and wishes (Anderson, 1995). A fewfacts about perception follow:
• Perception is a complex, active process that can occur with or withoutexternal input. Internal input could be a stomach ache, eye pain, orthe like.
• It overrides what we know to be true.
• It takes place without awareness (subconsciously).
• It need not correspond with reality.
• Our behavior is determined by perceived rather than actual infor-mation.
The main interest for an ergonomist is to design the actual outcome of a job to fit in with the operator’s perception of the expected outcome.
Personal Factors 41
Ch02.qxd 11/1/03 4:17 PM Page 41
Two issues can be briefly discussed here: adaptation and direction ofmovement.
Adaptation is the process of adapting to our environment, which affectsour expectations in making a decision and response. For example, if acontrol room process operator, over a period of time, experiences a highnumber of false alarms, the expectation is that the next alarm is also false.Therefore, over time, the alarms no longer arouse the operator, and thenext true alarm will not be responded to accordingly. Therefore, we shouldkeep the occurrence of alarms to a minimum and ensure that attention isdrawn to priority conditions so that arousal level stays high.
The direction of movement or expected relationship between controlsand displays needs to meet population stereotypes. Population stereotypesare what most of the population will do on most occasions. For example,in North America, we push a light switch up to turn on the lights. In otherparts of the world, the switch is pushed down (see Chapter 5 for moredetail).
2.2.3.3 Memory
Memory is the mechanism of storing and retrieving information. Theinformation stored in the memory is based on our learning and past expe-riences. For example, driving a car, operating machines, using tools, mon-itoring a process in the control room—all depend on our capacity to learnand store information. Three stages of memory can be identified. Eachstage has different levels of information processing, storage capacity, rep-resentation of information, and time span for retention. A simple modelof memory is in Figure 2-4.
This simple model shows that the stimuli are captured and perceivedby the senses (eye, ears, etc.) and held briefly in the sensory memorystorage. The filtering process, through attention, passes on the informa-tion considered relatively important to the individual to the short-termmemory storage. Further rehearsal (i.e., repeating, rereading, reviewingmaterial) of the stimuli allows information to pass on and be stored inlong-term memory (Bailey, 1989; Wickens, 1992; Anderson, 1995; Best,1995). Each of the stages is briefly presented.
Sensory memory (SM) is relatively automatic in nature, meaning weneed not attend to the information for it to be maintained at this stage.
42 Personal Factors
Ch02.qxd 11/1/03 4:17 PM Page 42

This memory is specific to the sensory system (visual, auditory, etc.) beingstimulated. For example, visual information is held in the visual sensorystorage (iconic memory), and auditory information is held in the auditorysensory storage (echoic memory). Iconic memory storage lasts for about1 second, while echoic memory storage can last for 3–5 seconds beforethe information is lost or decayed. For example, a phone number for anadvertised product is flashed briefly on the television screen. As we startwriting down the first digits we forget the last ones simply because it waslost from the visual sensory storage. Or, someone is talking to us and wedo not hear a single word the person has said. The reasons some of theinformation is lost in the sensory memory are: (1) decay, where informa-tion fades very rapidly; and (2) because material considered important andattended to (paying attention) is passed on to short-term memory, the restis lost.
In addition, the sensory memory stage serves as a limiting factor in atask sequence. For example, a control room process operator has the taskof scanning many pages of alarm messages on a display throughout theshift. While the operator thinks he may have scanned all the importantmessages, one or more messages did not register and may not have beenpassed on into the long-term memory for proper action. This is becausethe messages were not attended to properly and the memory trace waslost.
Short-term memory (STM), also referred to as working memory, is thestage where we maintain information we consider important and paydirect attention to. It is also the stage where we try to organize and encodeinformation into the long-term memory through the process of rehearsal.An example of encoding is Morse code, where either of two codes
Personal Factors 43
Sensory Memory Short-Term Memory
Long-Term
Memory
Information: sight, sound,smell, feel, taste
Figure 2-4 Stages of memory storage.
Ch02.qxd 11/1/03 4:17 PM Page 43
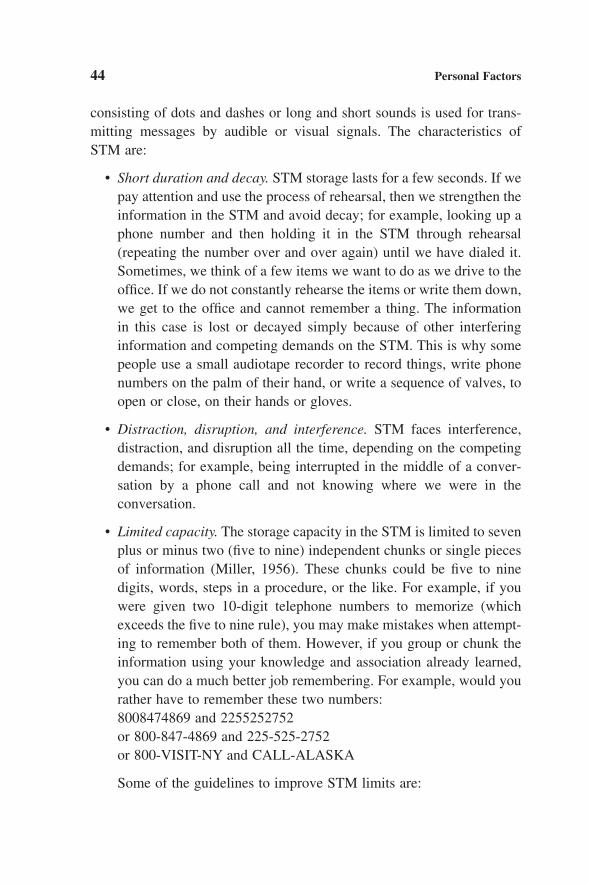
consisting of dots and dashes or long and short sounds is used for trans-mitting messages by audible or visual signals. The characteristics of STM are:
• Short duration and decay. STM storage lasts for a few seconds. If wepay attention and use the process of rehearsal, then we strengthen theinformation in the STM and avoid decay; for example, looking up aphone number and then holding it in the STM through rehearsal(repeating the number over and over again) until we have dialed it.Sometimes, we think of a few items we want to do as we drive to theoffice. If we do not constantly rehearse the items or write them down,we get to the office and cannot remember a thing. The informationin this case is lost or decayed simply because of other interferinginformation and competing demands on the STM. This is why somepeople use a small audiotape recorder to record things, write phonenumbers on the palm of their hand, or write a sequence of valves, toopen or close, on their hands or gloves.
• Distraction, disruption, and interference. STM faces interference,distraction, and disruption all the time, depending on the competingdemands; for example, being interrupted in the middle of a conver-sation by a phone call and not knowing where we were in the conversation.
• Limited capacity. The storage capacity in the STM is limited to sevenplus or minus two (five to nine) independent chunks or single piecesof information (Miller, 1956). These chunks could be five to ninedigits, words, steps in a procedure, or the like. For example, if youwere given two 10-digit telephone numbers to memorize (whichexceeds the five to nine rule), you may make mistakes when attempt-ing to remember both of them. However, if you group or chunk theinformation using your knowledge and association already learned,you can do a much better job remembering. For example, would yourather have to remember these two numbers:8008474869 and 2255252752or 800-847-4869 and 225-525-2752or 800-VISIT-NY and CALL-ALASKA
Some of the guidelines to improve STM limits are:
44 Personal Factors
Ch02.qxd 11/1/03 4:17 PM Page 44

Minimize the load in terms of time and number; for example, a touchtone phone is faster to enter numbers and, therefore, the memorytime is less than when operating a rotary phone.
Use chunking as just discussed: Use three to four letters or numbersper chunk (Bailey, 1989). For example, 800-847-4869.
Use letters instead of numbers where possible and meaningful; forexample, CALL-ALASKA.
Keep letters and numbers separate (Preczewski and Fisher, 1990); forexample, car license plate B68RN2 is harder to remember than 628BRN or BRN 628.
Create meanings for characters; for example, the number 628 BRNcan have the following meaning: 6 + 2 = 8, and BRN can be anabbreviation for the color word brown.
The transfer of information from STM to long-term memory (LTM)relies on the attention and rehearsal processes. The rehearsal process mustinvolve not just rote repetition but the use of associations (informationanalyzed, compared, and related to other information) between the newinformation and information already in LTM. This makes retrieving infor-mation later on much easier; for example, storing the number 225-252-2752 versus CALL-ALASKA. LTM contains all the learning, knowledge,and experience we obtain during our lifetime. Retrieving information fromLTM presents challenges for some of us. We often have difficulty recall-ing a 25-step procedure or meeting times, names, or even more seriousevents such as birthday and anniversary dates. However, we do better inrecognition (i.e., faces, checklists) than recall. Some of the characteristicsof recall and recognition are:
Personal Factors 45
Recall Recognition
Limited Almost unlimitedAbout 2000 words About 100,000 wordsIdentify about 8 colors Discriminate between 500 colors
The factors that affect our ability to remember are:
• Initial learning: how well we analyze, compare, and relate new infor-mation to that already learned determines how much and how well
Ch02.qxd 11/1/03 4:17 PM Page 45

we learn. Factors that affect this process are motivation and the desireto learn, prior learning, anxiety or stress—too much anxiety and stresscan affect learning, and the method of learning.
• Importance and meaningfulness of the material we are trying to learn.
• Interference, which is best illustrated with an example. An individ-ual who learned to drive a car on the right-hand side of the road is ina different country, learning to drive on the left-hand side. After awhile, she is back driving on the right-hand side. Learning the newleft-hand side driving interferes with her previous learning and affectsher ability to drive safely on the right-hand side for a while, untilrelearning take place.
• Age: memory ability declines with age and can affect day-to-dayactivities, as most of us Baby Boomers experience.
2.2.3.4 Decision Making
Decision making is the process of evaluating alternatives and selectingan action. We tend to search for information related to the problem at hand,estimate the probabilities of different alternatives, and attach meaningsand values to anticipated outcomes. Therefore, decisions are a choiceamong courses of actions. People who must make too many decisions tooquickly have to trade off speed of decision making against accuracy ofdecision outcome. In addition, the time to make an accurate decision isrelated to the amount of uncertainty in the decision. Naturally, the moreuncertainty we have, the longer it takes us to search for the information,estimate probabilities of different alternatives, and attach values to out-comes. Possibilities to improve human decision making include:
• Design or redesign support systems. Designing the support systemappropriately improves decision making and therefore performance.For example, if we eliminate the need to make manual mathematicalcalculations by the control room process operator and build that intothe process control system, we enhance the speed and accuracy of thedecision-making process and eliminate any possibility for humanerror due to miscalculation.
46 Personal Factors
Ch02.qxd 11/1/03 4:17 PM Page 46
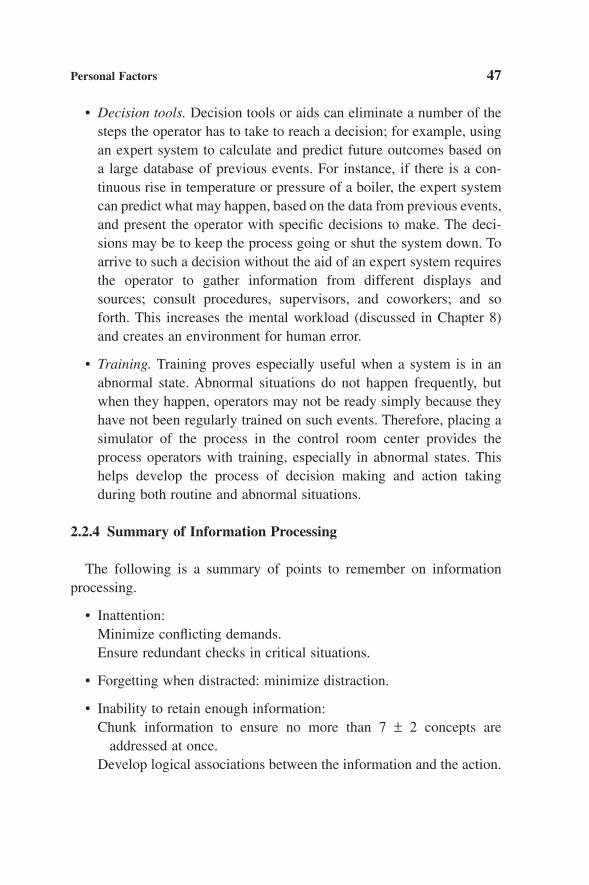
• Decision tools. Decision tools or aids can eliminate a number of thesteps the operator has to take to reach a decision; for example, usingan expert system to calculate and predict future outcomes based ona large database of previous events. For instance, if there is a con-tinuous rise in temperature or pressure of a boiler, the expert systemcan predict what may happen, based on the data from previous events,and present the operator with specific decisions to make. The deci-sions may be to keep the process going or shut the system down. Toarrive to such a decision without the aid of an expert system requiresthe operator to gather information from different displays andsources; consult procedures, supervisors, and coworkers; and soforth. This increases the mental workload (discussed in Chapter 8)and creates an environment for human error.
• Training. Training proves especially useful when a system is in anabnormal state. Abnormal situations do not happen frequently, butwhen they happen, operators may not be ready simply because theyhave not been regularly trained on such events. Therefore, placing asimulator of the process in the control room center provides theprocess operators with training, especially in abnormal states. Thishelps develop the process of decision making and action takingduring both routine and abnormal situations.
2.2.4 Summary of Information Processing
The following is a summary of points to remember on information processing.
• Inattention:Minimize conflicting demands.Ensure redundant checks in critical situations.
• Forgetting when distracted: minimize distraction.
• Inability to retain enough information:Chunk information to ensure no more than 7 ± 2 concepts are
addressed at once.Develop logical associations between the information and the action.
Personal Factors 47
Ch02.qxd 11/1/03 4:17 PM Page 47

• Inability to retain information for prolonged periods: design systemsto retain information until it is no longer needed by the operator.
• System demands exceed information processing ability: design calculations into the process control system.
• Inability to recall information from long-term memory:Replace “recall” with “recognition” through the use of cues and
reminders, such as checklists, pull-down menus, help screens, setpoints.
Conduct refresher training (using procedures).Design systems to eliminate the need for procedures or the use of
long-term memory.
• Performing activities out of sequence or too slow: design a logicalrelationship between one activity and the next, such as buildingsequence into the task.
• Confusion due to information presentation:Ensure that plant equipment operates in ways that the operator
expects and understands.Make the design compatible with operator’s expectations.
2.3 PHYSICAL CAPABILITIES
This section of the human system interface (HSI) model, discussed inSection 2.1, deals with converting a decision to an action. This is wherethe operator communicates with the system using bodily actions such aspulling a lever, pressing a button, or speaking over the radio to commu-nicate with others in the plant. For the body, or parts of it, to move, reach,and push a button, or turn a valve requires the involvement of the mus-culoskeletal (muscles, bones, and connective tissues) system, which pro-vides the primary components for muscular activity. Musculoskeletalmovement is also referred to as motor performance.
When an operator is called on to perform a physical activity like turninga valve, the amount of work required must be within his or her physicalcapabilities. The aspects of anthropometry (operator’s relevant bodydimensions) and biomechanics (mobility of bones, joints, and muscles)
48 Personal Factors
Ch02.qxd 11/1/03 4:17 PM Page 48

define these capabilities. Muscles, in particular, play a key role as limit-ing factors in many physical tasks and activities. This section considersthe factors that limit motor performance to ensure that the operator canreach and apply the necessary force to activate a control. It focuses mainly on two areas of interest: muscular strength and endurance andanthropometry.
2.3.1 Muscular Strength and Endurance
Muscles have limits to their strength and their ability to maintain thatstrength and resist fatigue (also referred to as muscular endurance).Strength is defined as the maximum force one can exert voluntarily. It ismeasured in kilograms (kg) or pounds (lb). The work that muscles mayhave to do is classified into two types:
• Static work, also referred to as static effort, is characterized by long-term muscular contraction without body motion occurring; forexample, when a posture must be held for long periods like sitting,standing in one place, bending, and twisting to perform a maintenancejob.
• Dynamic work, also referred to as dynamic effort, is characterized bybody motion accompanying muscular tension; for example, repeatedmuscular contractions with rest periods in between, such as walking.
Most physical activities have both static and dynamic work compo-nents. Take, for example, carrying jars filled with products from a sam-pling point in the plant back to the laboratory. The upper body, especiallythe arms, shoulders, and back muscles, is under static effort to support theweight and maintain (stabilize) the body in an upright position. However,the lower body, especially the legs, is under dynamic effort to allow thebody to move.
Strength is strictly defined as “the maximal force muscles can exert isometrically in a single, voluntary effort” (Kroemer, 1970; Chaffin,1975). However, strength under dynamic conditions can also be measured(Sanders and McCormick, 1993). Information about isometric muscularstrength capability is needed to specify, for example, the minimum valveresistances and the forces required to safely carry bags of chemicals. Most
Personal Factors 49
Ch02.qxd 11/1/03 4:17 PM Page 49

tasks or activities that operators perform require the integrated exertion ofmany muscle groups. For example, lifting a bag of chemicals off the floorrequires squatting, extending arms, grabbing the bag with both hands,lifting the bag with the arms and shoulders, lifting the body using the legs,and the like. In this complex situation, the maximum force that can beexerted is determined by the weakest link in the different muscle groupsinvolved.
2.3.1.1 Factors Affecting Strength
There is a wide range of muscular strength capabilities among people,from heavy weight lifters to sedentary TV watchers. In addition, manyvariables play the role of limiting factors and can influence muscularstrength:
• Age. Strength increases rapidly in the teens, reaches its peak in themiddle to late twenties, levels off, and starts decreasing, slightly inthe forties and faster in the fifties and sixties. Most tasks and jobs aredesigned around the young worker. But, the strength required mayexceed the capacity of older groups. This is truly an issue today, sincethe current workforce contains many older workers.
• Gender. In general, women have less-developed muscles and theiroverall mean strength is about 67% that of males (Hettinger, 1961;Roebuck, Kroemer, and Thomson, 1975; Lauback, 1976). However,we must not generalize this figure (Wilmore, 1975; Redgrove, 1979;Pheasant, 1983; O’Brien, 1985; Chaffin and Andersson, 1991;Sanders and McCormick, 1993). The reasons are:1. This 67% is an average value from various groups of muscles. The
range is 35 to 85% of male mean strength.2. For the lower extremities, the average strength of females is com-
parable with males. This may reflect the use of lower extremitiesby both males and females for daily regular activities. But, ingeneral, men use their upper extremities more than women.
3. Trained female athletes are stronger than many untrained men.In terms of designing manual tasks, such as lifting, the maximum
weight that can be lifted is determined by the weakest member of thetwo genders involved.
50 Personal Factors
Ch02.qxd 11/1/03 4:17 PM Page 50

• Occupation. Relates to the different levels of muscle use (exertion)by people in different occupations; for example, a process operatorversus a desk clerk given that neither is a fitness fanatic.
• Physical training. Physical training, especially weight lifting, tendsto increase muscular strength and endurance by as much as 30–50%.
• Others. Other factors that have been associated with influencing mus-cular strength are:1. Gloves. Wearing gloves, on average, results in a loss of about 20%
in grip strength. Of course, this depends on the thickness of thegloves: the thicker the gloves, the less the strength.
2. Body dimension, such as height and weight. Body weight is animportant determinant of arm strength. Likewise, height correlateshighly with pulling strength.
3. Body position. For example, the strength of elbow flexion is at amaximum with the elbow at about 90° but drops off to about halfthis value at extreme angles.
4. Diet. Inadequate and improper nutrition decrease body strength.5. Other personal factors: genetics, health, fatigue, drugs, motivation.
2.3.1.2 Endurance and Fatigue
As mentioned earlier in this chapter, muscular endurance refers to theability of the muscle to continue to work. In the case of static work, thelength of time (endurance) a force can be maintained depends on the pro-portion of the available strength being exerted. For example, maximumforce can be maintained for a very short time (few seconds). However,the smaller the force exerted, the longer it can be maintained (Caldwell,1963, 1964; Monod, 1985; Deeb, 1988). The applications of these dataare important. If we expect an operator to apply and maintain static forceto hold an object (i.e., a drill weighing 15kg or 33 lb) for a period of time,the designer must consider endurance. In the case of dynamic work,endurance is defined in terms of force and frequency of repetition.However, the endurance time is significantly longer. For example, 25%maximum voluntary contraction (MVC) can be maintained for about 10minutes under static contraction compared with over 4 hours underdynamic work.
Personal Factors 51
Ch02.qxd 11/1/03 4:17 PM Page 51
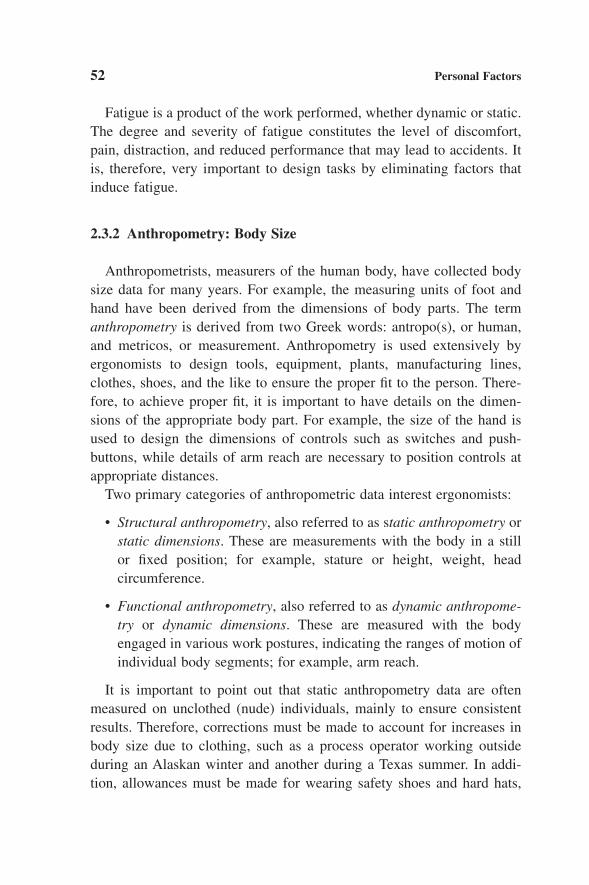
Fatigue is a product of the work performed, whether dynamic or static.The degree and severity of fatigue constitutes the level of discomfort,pain, distraction, and reduced performance that may lead to accidents. Itis, therefore, very important to design tasks by eliminating factors thatinduce fatigue.
2.3.2 Anthropometry: Body Size
Anthropometrists, measurers of the human body, have collected bodysize data for many years. For example, the measuring units of foot andhand have been derived from the dimensions of body parts. The termanthropometry is derived from two Greek words: antropo(s), or human,and metricos, or measurement. Anthropometry is used extensively byergonomists to design tools, equipment, plants, manufacturing lines,clothes, shoes, and the like to ensure the proper fit to the person. There-fore, to achieve proper fit, it is important to have details on the dimen-sions of the appropriate body part. For example, the size of the hand isused to design the dimensions of controls such as switches and push-buttons, while details of arm reach are necessary to position controls atappropriate distances.
Two primary categories of anthropometric data interest ergonomists:
• Structural anthropometry, also referred to as static anthropometry orstatic dimensions. These are measurements with the body in a still or fixed position; for example, stature or height, weight, head circumference.
• Functional anthropometry, also referred to as dynamic anthropome-try or dynamic dimensions. These are measured with the bodyengaged in various work postures, indicating the ranges of motion ofindividual body segments; for example, arm reach.
It is important to point out that static anthropometry data are oftenmeasured on unclothed (nude) individuals, mainly to ensure consistentresults. Therefore, corrections must be made to account for increases inbody size due to clothing, such as a process operator working outsideduring an Alaskan winter and another during a Texas summer. In addi-tion, allowances must be made for wearing safety shoes and hard hats,
52 Personal Factors
Ch02.qxd 11/1/03 4:17 PM Page 52
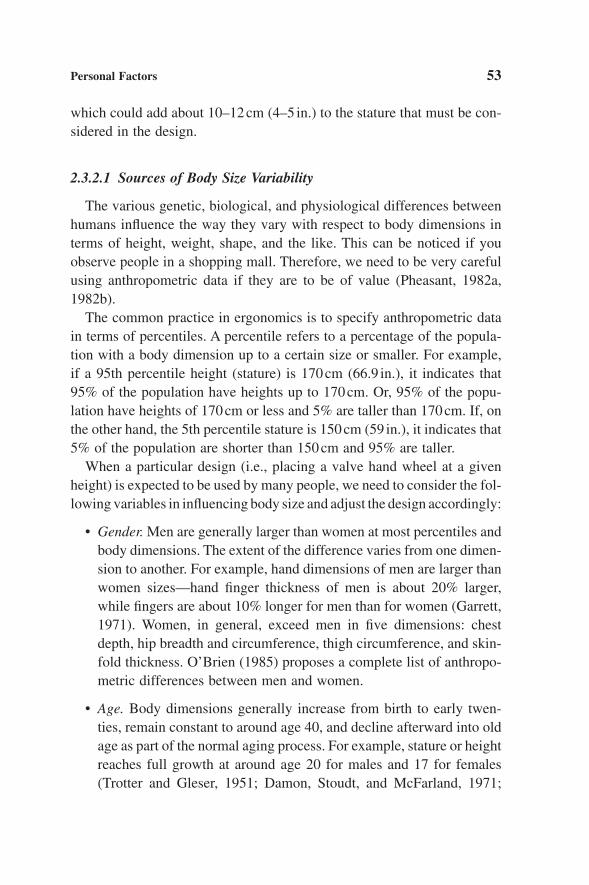
which could add about 10–12cm (4–5 in.) to the stature that must be con-sidered in the design.
2.3.2.1 Sources of Body Size Variability
The various genetic, biological, and physiological differences betweenhumans influence the way they vary with respect to body dimensions interms of height, weight, shape, and the like. This can be noticed if youobserve people in a shopping mall. Therefore, we need to be very carefulusing anthropometric data if they are to be of value (Pheasant, 1982a,1982b).
The common practice in ergonomics is to specify anthropometric datain terms of percentiles. A percentile refers to a percentage of the popula-tion with a body dimension up to a certain size or smaller. For example,if a 95th percentile height (stature) is 170cm (66.9 in.), it indicates that95% of the population have heights up to 170cm. Or, 95% of the popu-lation have heights of 170cm or less and 5% are taller than 170cm. If, onthe other hand, the 5th percentile stature is 150cm (59 in.), it indicates that5% of the population are shorter than 150cm and 95% are taller.
When a particular design (i.e., placing a valve hand wheel at a givenheight) is expected to be used by many people, we need to consider the fol-lowing variables in influencing body size and adjust the design accordingly:
• Gender. Men are generally larger than women at most percentiles andbody dimensions. The extent of the difference varies from one dimen-sion to another. For example, hand dimensions of men are larger thanwomen sizes—hand finger thickness of men is about 20% larger,while fingers are about 10% longer for men than for women (Garrett,1971). Women, in general, exceed men in five dimensions: chestdepth, hip breadth and circumference, thigh circumference, and skin-fold thickness. O’Brien (1985) proposes a complete list of anthropo-metric differences between men and women.
• Age. Body dimensions generally increase from birth to early twen-ties, remain constant to around age 40, and decline afterward into oldage as part of the normal aging process. For example, stature or heightreaches full growth at around age 20 for males and 17 for females(Trotter and Gleser, 1951; Damon, Stoudt, and McFarland, 1971;
Personal Factors 53
Ch02.qxd 11/1/03 4:17 PM Page 53
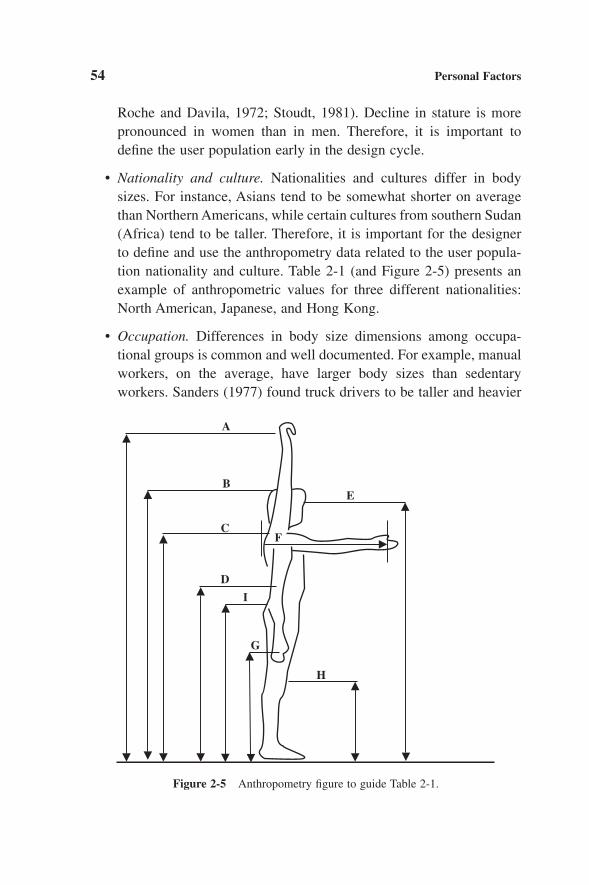
Roche and Davila, 1972; Stoudt, 1981). Decline in stature is morepronounced in women than in men. Therefore, it is important todefine the user population early in the design cycle.
• Nationality and culture. Nationalities and cultures differ in bodysizes. For instance, Asians tend to be somewhat shorter on averagethan Northern Americans, while certain cultures from southern Sudan(Africa) tend to be taller. Therefore, it is important for the designerto define and use the anthropometry data related to the user popula-tion nationality and culture. Table 2-1 (and Figure 2-5) presents anexample of anthropometric values for three different nationalities:North American, Japanese, and Hong Kong.
• Occupation. Differences in body size dimensions among occupa-tional groups is common and well documented. For example, manualworkers, on the average, have larger body sizes than sedentaryworkers. Sanders (1977) found truck drivers to be taller and heavier
54 Personal Factors
A
B
C
D
E
H
I
G
F
Figure 2-5 Anthropometry figure to guide Table 2-1.
Ch02.qxd 11/1/03 4:17 PM Page 54
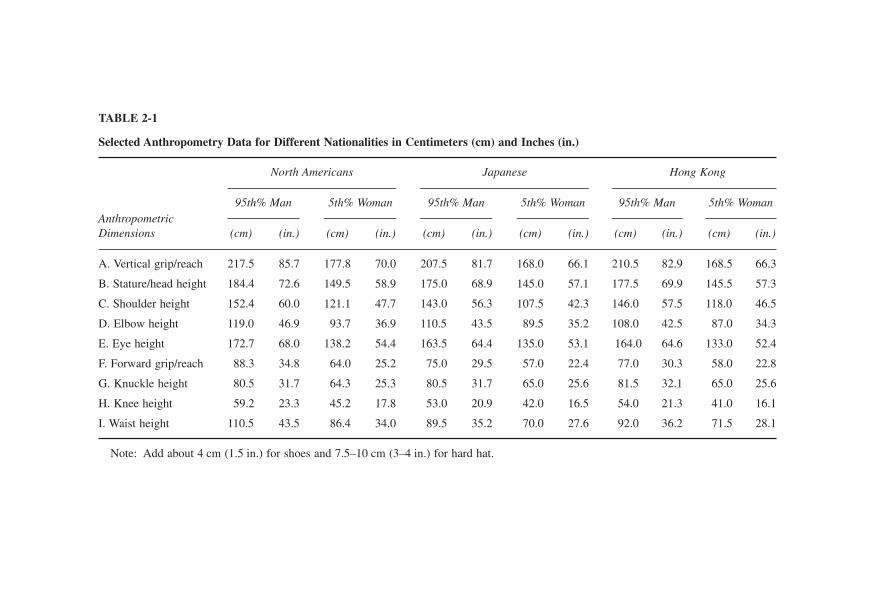
TABLE 2-1
Selected Anthropometry Data for Different Nationalities in Centimeters (cm) and Inches (in.)
North Americans Japanese Hong Kong
Anthropometric95th% Man 5th% Woman 95th% Man 5th% Woman 95th% Man 5th% Woman
Dimensions (cm) (in.) (cm) (in.) (cm) (in.) (cm) (in.) (cm) (in.) (cm) (in.)
A. Vertical grip/reach 217.5 85.7 177.8 70.0 207.5 81.7 168.0 66.1 210.5 82.9 168.5 66.3
B. Stature/head height 184.4 72.6 149.5 58.9 175.0 68.9 145.0 57.1 177.5 69.9 145.5 57.3
C. Shoulder height 152.4 60.0 121.1 47.7 143.0 56.3 107.5 42.3 146.0 57.5 118.0 46.5
D. Elbow height 119.0 46.9 93.7 36.9 110.5 43.5 89.5 35.2 108.0 42.5 87.0 34.3
E. Eye height 172.7 68.0 138.2 54.4 163.5 64.4 135.0 53.1 164.0 64.6 133.0 52.4
F. Forward grip/reach 88.3 34.8 64.0 25.2 75.0 29.5 57.0 22.4 77.0 30.3 58.0 22.8
G. Knuckle height 80.5 31.7 64.3 25.3 80.5 31.7 65.0 25.6 81.5 32.1 65.0 25.6
H. Knee height 59.2 23.3 45.2 17.8 53.0 20.9 42.0 16.5 54.0 21.3 41.0 16.1
I. Waist height 110.5 43.5 86.4 34.0 89.5 35.2 70.0 27.6 92.0 36.2 71.5 28.1
Note: Add about 4 cm (1.5 in.) for shoes and 7.5–10 cm (3–4 in.) for hard hat.
Ch02.qxd 11/1/03 4:17 PM Page 55
than the general civilian population. This difference among occupa-tions may be the result of1. Diet.2. Exercise.3. Physical activities imposed by the job (i.e., manual handling).4. Imposed selection, such as individuals need to be a certain height
to be accepted in a particular job.5. Self-selection, such as individuals with a given height choose a
particular job for practical or sociological reasons.We must take great care of not using anthropometric data
obtained from groups of one occupation, such as armed forces, todesign the environment of another, such as office workers.
• Historical trends. The average size of people has been increasing overthe years. For instance, the average adult height in Western Europeand the United States increased about 1cm (0.4 in.) per decade(Sanders and McCormick, 1993). This is so, perhaps, because ofbetter diet, medical care, hygiene, and living conditions. As design-ers, we need to consider present-day users as well as future genera-tions to ensure proper systems design few decades down the road.
• Body position. Posture affects body size. For example, restraints suchas seat belts, affect data applicability of forward reach.
• Clothing. As mentioned earlier, almost all anthropometric data areobtained from nude individuals. Therefore, the type (material) andamount of clothing add to body size and can also create restrictionof movement such as affecting overhead and forward reach. Anotherexample is the use of gloves where allowance must be made toaccommodate different thicknesses of gloves.
2.3.2.2 Principles of Body Size Application
When determining the proper anthropometric data to be used in adesign, the following must be observed: we need to carefully define thepopulation or group we are designing for and ensure that the data are rea-sonably representative. For most purposes, a range of dimensions fromthe 5th to the 95th percentile is generally acceptable. The range can also
56 Personal Factors
Ch02.qxd 11/1/03 4:17 PM Page 56
increase, if possible, from the 2nd to the 98th percentile or even larger.The choice of design percentile is largely a matter of cost. Three generalprinciples of body size application to specific design problems areaccepted (Chapter 6 covers these principles in detail):
1. Design for the average. The average value is taken as the 50th per-centile, meaning 50% of the population is above and 50% below thisvalue.
2. Design for the extreme. In designing for the extreme, the ergono-mists constantly apply the following two principles:• Design fit or clearance dimensions for the largest individual.• Design reach dimensions for the smallest individual.
It is frequently the practice to use the 95th percentile male for theclearance or fit dimensions and the 5th percentile female for reachdimensions. Therefore, it is safe to say that a design that wouldaccommodate individuals at one extreme would also accommodatevirtually the entire population.
3. Design for the adjustable range. Designing for the adjustable rangeis generally the preferred method to accommodate individuals ofvarying sizes. This use of adjustability can be seen in car seats, officechairs, desk heights, bench heights in a maintenance shop, adjustabletables for manual materials handling jobs, and the like. However,this may not always be possible:• If we strictly use the range, then we must accommodate people
from 3 feet tall to 9 feet tall and weighing from 23kg (50 lb) to227kg (500 lb). This is why the 5th and 95th percentile values aretraditionally advocated.
• Adjustability may not have any practical value and the cost out-weighs the benefit; for example, an eye wash station in a plant ora bathroom toilet height.
2.4 CASE STUDY
The force an operator is able to apply to a valve hand wheel dependson the location of the wheel relative to the operator, the orientation of thevalve stem, the diameter of the wheel, and the quality of the interface
Personal Factors 57
Ch02.qxd 11/1/03 4:17 PM Page 57

between the wheel and the hands. The objective of this study was to createa database of human force capabilities, to apply a hand wheel to open orclose a valve, that can be used by plant designers in the selection, place-ment, and orientation of valves. A summarized version of this study is presented here. For more details, consult Attwood et al. (2002).
2.4.1 Method
2.4.1.1 Participants
Sixty-six volunteer process operators participated in the study. Datafrom nine volunteers were rejected: Seven subjects were removed becauseof irregularities in their data; two women were removed to provideuniform gender data. Analyses were performed on 57 men.
Subjects were screened for health problems before participation. Subjects signed a consent form.
Warm-up and practice sessions were conducted. Each subject was provided with a small token of appreciation.
2.4.1.2 Equipment
Force data were collected on the “primus” device manufactured by the Baltimore Therapeutic Equipment Company, Hanover, Maryland(Figure 2-6).
2.4.1.3 Procedure
• Nine valve positions were identified to represent typical heights andstem angles.
• Valve positions were tested randomly within low, medium, and highheights.
• Operators completed three exertions at each valve position.
• Operators were instructed to assume standard position and exertmaximum force on valve wheel in a counterclockwise direction,increasing force smoothly to maximum and holding for 6 seconds.
58 Personal Factors
Ch02.qxd 11/1/03 4:17 PM Page 58

• Operators were allowed 30 seconds rest between each repetition and2 minutes rest between different valve positions.
2.4.2 Data Collected
• Age, gender, height, weight, and functional reach were comparedwith population norms.
• Average force, 3–5 seconds into repetition.
• Peak force per repetition.
2.4.2.1 Data Analyses
The maximum average force was identified from three repetitions per par-ticipant for each valve position. Also determined were the mean and stan-dard deviation of force for each of the nine valve positions, as well as the5th percentile of force for each valve position and the relationship betweenforce and the stature of the operator.
Personal Factors 59
Figure 2-6 Subject participating in study.
Ch02.qxd 11/1/03 4:17 PM Page 59

2.4.3 Conclusion
The data suggested a relationship between stature and force capability.The valve locations that produced the highest turning forces differ from those typically used by designers. The 5th percentile force capability ismuch lower than recommended historically. Figure 2-7 presents the 5thpercentile force (in lb) as a function of valve height and stem orientation.
The recommendations for existing operations are
• Identify critical manually operated valves that are operated fre-quently, in an emergency, and have time constraint for operation.
• Measure the valve force required to crack critical valves.
• Modify those that exceed operator force capability (for the existinglocation and orientation).
60 Personal Factors
43.5¢¢
58¢¢
72¢¢Overhead
25¢¢
Zone 5 Zone 4 Zone 3 Zone 2 Zone 1
Knee
28¢¢
KneeVertical
55
Shoulder45°
45°
74
ShoulderVertical
62
22¢¢Knee
Horizontal
70
70
ShoulderHorizontal
83
WaistVertical
97
87WaistHorizontal
78
Increasing Force
Hei
ght (
in)
Figure 2-7 The 5th percentile force (in lb) as a function of valve height and stem orientation. Note: Means within the same column are not statistically different from eachother but are different from those in different columns. Each column is defined as a “Zone.”
REVIEW QUESTIONS
1. What is the function of the retina of the eye?
2. Define accommodation of the eye.
Ch02.qxd 11/1/03 4:17 PM Page 60

3. What is nearsightedness and farsightedness?
4. What are the areas of the visual field?
5. Describe the process of adaptation of the eye.
6. Why should we not use color as the primary method of coding?
7. What situational factors affect visual acuity?
8. Describe how attention is essential in processing information.
9. Why is perception a subjective and not an objective process?
10. Describe the three stages of memory: sensory, short-term, and long-term.
11. Describe what to do to improve the limited capacity of short-termmemory.
12. What factors affect strength?
13. What is anthropometry?
14. Discuss the concept of adjustable design.
15. Why there is no such thing as an average human?
16. Give examples of the two categories of anthropometry.
17. List the sources of body size variability.
18. What does percentile mean?
19. Discuss the three principles of body size application.
20. Why design for the extremes? Give examples.
REFERENCES
Anderson, J. R. (1995) Cognitive Psychology. Fourth Ed. New York: W. H. Freeman.
Attwood, D. A., Nicolich, M. J., Doney, K. P., Smolar, T. J., and Swensen, E. E. (2002)“Valve Wheel Rim Force Capabilities of Process Operators.” Journal of Loss Prevention in the Process, 15, pp. 233–239.
Bailey, R. W. (1989) Human Performance Engineering. Second Ed. Englewood Cliffs, NJ:Prentice-Hall.
Personal Factors 61
Ch02.qxd 11/1/03 4:17 PM Page 61

Best, J. B. (1995) Cognitive Psychology. Fourth Ed. St. Paul, MN: West Publishing.
Broadbent, D. (1982) “Task Combination and Selective Intake of Information.” Acta Psychologica 50, pp. 253–290.
Brouwer, W. H., Waterink, W., Van Wolffelaar, P. C., and Rothengatter, T. (1991) “DividedAttention in Experienced Young and Older Drivers: Lane Tracking and Visual Analy-sis in a Dynamic Driving Simulator.” Human Factors 33, pp. 573–582.
Caldwell, L. S. (1963) “Relative Muscle Loading and Endurance.” Journal of Engineer-ing Psychology 2, pp. 155–161.
Caldwell, L. S. (1964) “Measurement of Static Muscle Endurance.” Journal of Engineer-ing Psychology 3, pp. 16–22.
Chaffin, D. (1975) “Ergonomics Guide for the Assessment of Human Strength.” Ameri-can Industrial Hygiene Association Journal 35, pp. 505–510.
Chaffin, D., and Andersson, G. (1991) Occupational Biomechanics. Second Ed. New York:Wiley.
Damon, A., Stoudt, H. W., and McFarland, R. A. (1971) The Human Body in EquipmentDesign. Cambridge, MA: Harvard University Press.
Deeb, J. M. (1988) “An Exponential Model of Isometric Muscular Fatigue as a Functionof Age and Muscle Group.” Dissertation, Department of Industrial Engineering, StateUniversity of New York at Buffalo.
Garrett, J. W. (1971) “The Adult Human Hand: Some Anthropometric and Biomechani-cal Considerations.” Human Factors 13, pp. 117–131.
Goldstein, I., and Dorfman, P. (1978) “Speed Stress and Load Stress as Determinants ofPerformance in a Time-Sharing Task.” Human Factors 20, pp. 603–610.
Grandjean, E. (1988) Fitting the Task to the Man. London: Taylor and Francis.
Hettinger, T. (1961) Physiology of Strength. Springfield, IL: Charles C Thomas.
Konz, S. (1990) Work Design: Industrial Ergonomics. Third Ed. Worthington, OH: Publishing Horizons.
Kroemer, K. H. E. (1970) “Human Strength: Terminology, Measurement, and Interpreta-tion of Data.” Human Factors 12, pp. 297–313.
Lauback, L. L. (1976) “Comparative Muscular Strength of Men and Women: A Reviewof the Literature.” Aviation, Space, and Environmental Medicine 47, pp. 534–542.
Miller, G. (1956) “The Magical Number Seven, Plus or Minus Two: Some Limits on OurCapacity for Processing Information.” Psychological Review 63, pp. 81–97.
Monod, H. (1985) “Contractility of Muscle during Prolonged Static and RepetitiveDynamic Activity.” Ergonomics 28, pp. 81–89.
O’Brien, M. (1985) “Women in Sport.” Applied Ergonomics 16, pp. 25–39.
Parasuraman, R., and Nestor, P. G. (1991) “Attention and Driving Skills in Aging andAlzheimer’s Disease.” Human Factors 33, pp. 539–557.
Pheasant, S. T. (1982a) “A Technique for Estimating Anthropometric Data from the Parameters of the Distributions of Stature.” Ergonomics 25, pp. 981–992.
62 Personal Factors
Ch02.qxd 11/1/03 4:17 PM Page 62

Pheasant, S. T. (1982b) “Anthropometric Estimates for British Civilian Adults.” Ergonomics 25, pp. 993–1001.
Pheasant, S. T. (1983) “Sex Differences in Strength—Some Observations on Their Variability.” Applied Ergonomics 14, pp. 205–211.
Preczewski, S. C., and Fisher, D. L. (1990) “The Selection of Alphanumeric CodeSequences.” Proceedings of the Human Factors Society 34th Annual Meeting, SantaMonica, CA, pp. 224–228.
Redgrove, J. (1979) “Fitting the Job to the Women: A Critical Review.” Applied Ergonomics 10, pp. 215–223.
Roche, A. F., and Davila, G. H. (1972) “Late Adolescent Growth in Stature.” Pediatrics50, pp. 874–880.
Roebuck, J., Kroemer, K., and Thomson, W. (1975) Engineering Anthropometry Methods.New York: Wiley-Interscience.
Sanders, M. S. (1977) “Anthropometric Survey of Truck and Bus Drivers: Anthropome-try, Control Reach, and Control Force.” Westlake Village, CA: Canyon ResearchGroup. Cited in M. S. Sanders and E. J. McCormick, Human Factors in Engineer-ing and Design. New York, McGraw-Hill, 1993.
Sanders, M. S., and McCormick, E. J. (1993) Human Factors in Engineering and Design.New York: McGraw-Hill.
Stoudt, H. W. (1981) “The Anthropometry of the Elderly.” Human Factors 23, no.1, pp.29–37.
Trotter, M., and Gleser, G. (1951) “The Effect of Aging upon Stature.” American Journalof Physical Anthropometry 9, pp. 311–324.
Wickens, C. D. (1992) Engineering Psychology and Human Performance. Second Ed.New York: HarperCollins.
Wilmore, J. H. (1975) “Inferiority of Female Athletes: Myth or Reality?” Journal of SportsMedicine 3, pp. 1–6.
Personal Factors 63
Ch02.qxd 11/1/03 4:17 PM Page 63

Ch02.qxd 11/1/03 4:17 PM Page 64

3
Physical Factors
3.1 Musculoskeletal Disorders3.2 Manual Handling Tasks
3.2.1 Manual Handling Risk Factors3.2.2 Methods for Evaluating Manual Handling Tasks
3.3 Hand-Intensive Repetitive Tasks3.3.1 Risk Factors3.3.2 Survey and Observation Tools3.3.3 Hand Tools
3.4 Behavior3.5 Ergonomics Programs
3.5.1 Planning an Ergonomics Program3.5.2 Risk Assessment Process3.5.3 Solutions3.5.4 Evaluating the Ergonomics Program
3.6 Case StudyAppendix 3-1. Material Handling Screening Checklist: Risk Identification and PrioritiesAppendix 3-2. Musculoskeletal Ergonomics Program Gap Analysis
The objective of this chapter is to provide an overview and methods onhow to reduce work-related risk factors that contribute to musculoskele-tal disorders (MSDs). A musculoskeletal disorder is an injury that affectsthe bones, muscles, or other related tissues of the body joints.
In petrochemical operations, the two primary types of physical worktasks on which to focus are manual handling tasks and repetitive tasks.Since numerous physical work tasks are done at a plant, it is important toidentify the tasks that hold high priority; that is, those that should havereduced risk factors to reduce the potential for MSDs. A qualitative screen-ing approach assists in selecting the physical work tasks that need furtherattention and possible risk reduction. The screening approach categorizes
65
Ch03.qxd 11/1/03 4:18 PM Page 65

work tasks into high-, medium-, and low-priority groups based on rela-tive risk.
In some cases, further assessment of a task is needed to focus in on thespecific risks that need reduction and guide interventions to reduce therisks. This chapter includes an overview of the main tools for assessingrisk factors in manual handling and repetitive tasks. The focus is onassessment tools for the practitioner to use to evaluate the tasks and lessreliance is placed on self-reporting by the individuals doing the task, sincepeople tend to be inaccurate at estimating weights and forces, especiallyin unfamiliar situations (Wiktorin et al., 1996).
This chapter also offers a framework for an ergonomics program so thatrisk identification and reduction can be sustained on an ongoing basis. Theergonomics program recommended in this chapter is a specific applica-tion of the general program model presented in Chapter 1.
3.1 MUSCULOSKELETAL DISORDERS
Musculoskeletal disorders affect the bones and muscles of the body andthe tissues that form the body joints. There are two categories of disor-ders, based on the type of event that caused it: (1) conditions caused byan acute trauma, such as a slip or fall resulting in, for example, a strainedback, bruised leg, or sprained ankle; and (2) conditions due to exposureto a repeated, or chronic, type of physical activity, resulting in, forexample, soreness from inflamed tendons or ligaments. Conditions asso-ciated with repeated exposure to physical activity are called cumulativetrauma disorders (CTDs). Repetitive strain injury (RSI) is another termfor a cumulative trauma disorder specifically related to repetitive tasks.Examples of CTDs include
• Tendon disorders: tendinitis, tenosynovitis, DeQuervain’s disease.
• Nerve disorders: carpal tunnel syndrome, ulnar or radial nervedamage.
• Neurovascular disorders: thoracic outlet syndrome, white finger(Raynaud’s syndrome).
Some people also consider low back pain a type of CTD, if a singleacute cause cannot be identified. CTDs can result from, be precipitated
66 Physical Factors
Ch03.qxd 11/1/03 4:18 PM Page 66

by, or be aggravated by intense, repeated, sustained, or insufficient recov-ery from exertion, motions of the body, vibration, or cold. CTDs gener-ally develop over periods of weeks, months, and years. Physical activityrisk factors related to CTDs include (Occupation Safety and HealthAdministration, 1995)
• Application of force. Higher forces translate into higher loads on themuscles, tendons, and joints, which can quickly lead to muscularfatigue.
• Repetitive motion. This is defined as performing the same motionevery 30 seconds or less or where 50% of the work cycle involvessimilar upper extremity motion patterns.
• Awkward posture. An awkward posture requires more muscular forcebecause muscles cannot work as effectively.
• Contact stress. Tools, objects, or equipment that create pressureagainst the body (usually the hands and arms) can inhibit nerve func-tion and blood flow.
• Overall muscular fatigue. Insufficient recovery time between mus-cular contractions may lead to overall muscular fatigue.
The magnitude of risk associated with a specific quantity of exposureto these factors is not well defined, but there is consensus that exposureto high levels or combinations of these risk factors increases the risk ofthe CTDs. For example, force and repetition are recognized multiplica-tive factors; that is, if they are simultaneous risk factors, the interactionbetween them likely results in an increased risk of CTD compared to asingle factor. Also, tasks with high repetition and high forces are 14 timesas likely to be associated with a type of CTD in the wrist called carpaltunnel syndrome (CTS) than low-repetition, low-force tasks (Silverstein,Fine, and Armstrong, 1987).
Because there can be multiple confounded causes of an MSD, and par-ticularly a CTD, it is often difficult to determine whether a condition iswork or nonwork related. The ergonomist’s goal is to identify the mostcritical risk factors that may be present in the work setting that couldaggravate or contribute to the cause of an injury. The critical risk factorsare those that the ergonomist believes are most important to address forthe best possibility of reducing the risk of an injury.
Physical Factors 67
Ch03.qxd 11/1/03 4:18 PM Page 67

To identify the critical risk factors, an ergonomist conceptually cate-gorizes the physical work activities into two types, those that consistmainly of single exertions involving the entire body and those that aremore repetitive and most likely involve more intensive use of the upperbody or arms and hands. The physical work activities that involve whole-body exertions typically involve carrying or moving an object, so they arecalled manual handling tasks. The ergonomist uses different approachesfor assessing the risk factors depending on whether the task is a manualhandling task or a more repetitive task.
3.2 MANUAL HANDLING TASKS
Manual handling tasks are activities during which workers move objectsfrom place to place by lifting, lowering, carrying, pushing, or pulling. Inpetrochemical plants, examples of manual handling activities include
• Lifting a sack of additive and holding the sack while pouring the contents into a mixer.
• Picking up boxes of packaged motor oil from a pallet.
• Pushing and pulling a loaded pallet jack.
• Tilting and rolling drums of chemicals in staging areas.
• Grasping and turning a handwheel to manually open and close avalve.
• Holding and pouring a large bottle of liquid additive into a blender.
• Picking up a hose, dragging it, and holding it in position to connectat a manifold station.
• Picking up and carrying plant spare parts or toolboxes.
3.2.1 Manual Handling Risk Factors
There are general guidelines that can be used to screen out the taskswhere the force required could be a concern. A task that involves any ofthe following features may pose risk that could be reduced:
68 Physical Factors
Ch03.qxd 11/1/03 4:18 PM Page 68

• Repetitive or prolonged kneeling or squatting.
• Significant sideways twisting of the body.
• Repetitive or prolonged reaching with hands above shoulder height.
• Performance in a confined area that restricts natural posture.
• More than 16–27kg (35–60 lb) handled and cannot be held close tothe chest or torso.
• More than 27kg (60 lb) handled.
• More than 8kg (17 lb) lifted from or below knee height or aboveshoulder height.
• Unbalanced carrying or lifting (e.g., the bulk of the load supportedby one side of the body).
• More than 5kg (10 lb) handled by only one hand (e.g., a heavy tool).
• Unstable, unbalanced, difficult, or awkward to handle loads beingmoved.
• Object of more than 75cm (30 in.) in two dimensions carried or lifted.
• Object weighing more than 8kg (17 lb) carried more than 9m (30 ft).
• Combinations of physical tasks performed for more than 1 hour at atime.
• Physical tasks requiring heavy exertion performed more than onceper minute for continuous periods of more than 15 minutes.
For manual handling tasks in petrochemical plants, the ergonomist’sconcern is usually about the maximum force required in a single or just afew exertions. The MSD risk of a manual materials handling task is deter-mined by comparing the force actually required to execute the task to anestimate of the maximum force that would be safe for this person to exertin similar circumstances. For a lifting task, the actual weight that must belifted is compared to a recommended weight limit for that situation. Forpulling, the force required to pull an object can be measured with a forcegauge and compared to the recommended maximum pulling forces thatcan be safely exerted under various circumstances (see Figure 3-1).
Physical Factors 69
Ch03.qxd 11/1/03 4:18 PM Page 69
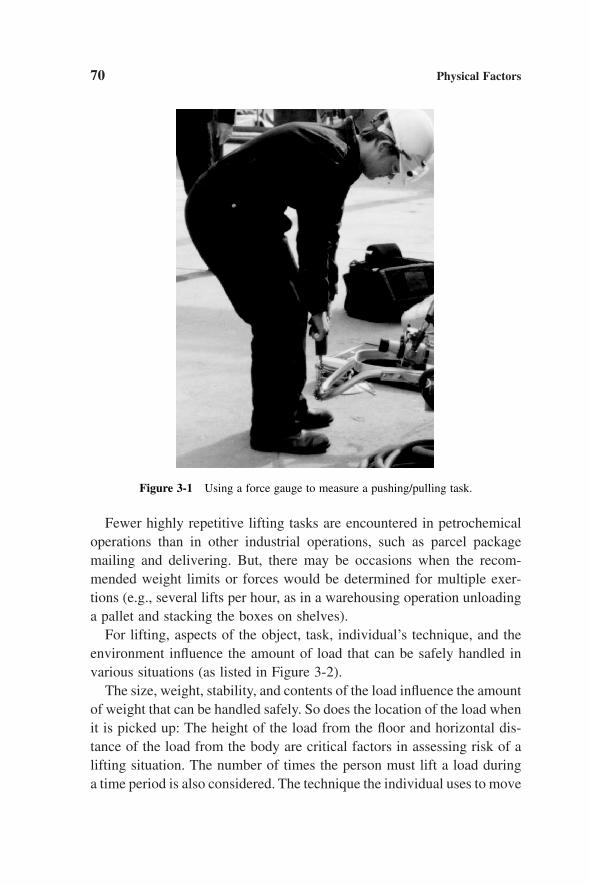
Fewer highly repetitive lifting tasks are encountered in petrochemicaloperations than in other industrial operations, such as parcel packagemailing and delivering. But, there may be occasions when the recom-mended weight limits or forces would be determined for multiple exer-tions (e.g., several lifts per hour, as in a warehousing operation unloadinga pallet and stacking the boxes on shelves).
For lifting, aspects of the object, task, individual’s technique, and theenvironment influence the amount of load that can be safely handled invarious situations (as listed in Figure 3-2).
The size, weight, stability, and contents of the load influence the amountof weight that can be handled safely. So does the location of the load whenit is picked up: The height of the load from the floor and horizontal dis-tance of the load from the body are critical factors in assessing risk of alifting situation. The number of times the person must lift a load duringa time period is also considered. The technique the individual uses to move
70 Physical Factors
Figure 3-1 Using a force gauge to measure a pushing/pulling task.
Ch03.qxd 11/13/03 3:33 PM Page 70
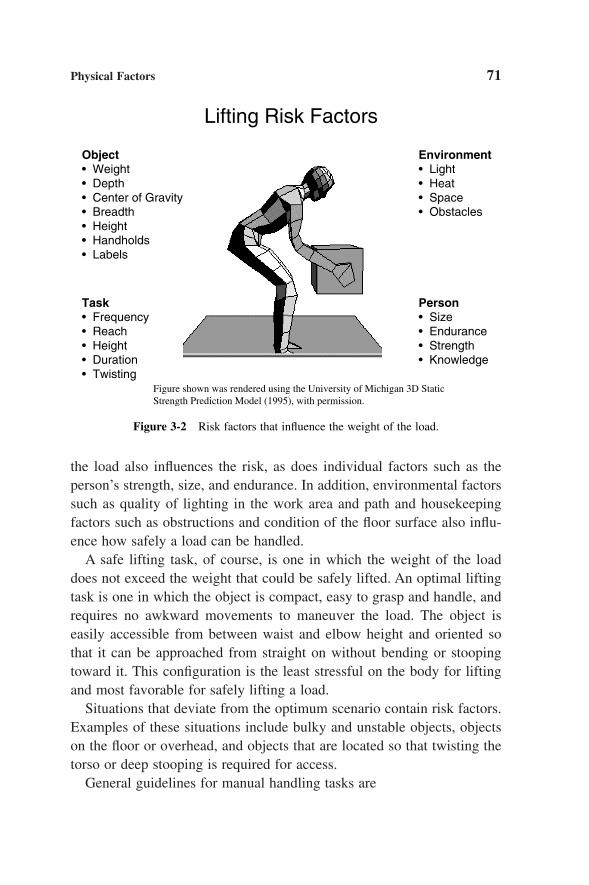
the load also influences the risk, as does individual factors such as theperson’s strength, size, and endurance. In addition, environmental factorssuch as quality of lighting in the work area and path and housekeepingfactors such as obstructions and condition of the floor surface also influ-ence how safely a load can be handled.
A safe lifting task, of course, is one in which the weight of the loaddoes not exceed the weight that could be safely lifted. An optimal liftingtask is one in which the object is compact, easy to grasp and handle, andrequires no awkward movements to maneuver the load. The object iseasily accessible from between waist and elbow height and oriented sothat it can be approached from straight on without bending or stoopingtoward it. This configuration is the least stressful on the body for liftingand most favorable for safely lifting a load.
Situations that deviate from the optimum scenario contain risk factors.Examples of these situations include bulky and unstable objects, objectson the floor or overhead, and objects that are located so that twisting thetorso or deep stooping is required for access.
General guidelines for manual handling tasks are
Physical Factors 71
Lifting Risk Factors
Object• Weight• Depth• Center of Gravity• Breadth• Height• Handholds• Labels
Task• Frequency• Reach• Height• Duration• Twisting
Environment• Light• Heat• Space• Obstacles
Person• Size• Endurance• Strength• Knowledge
Figure shown was rendered using the University of Michigan 3D Static Strength Prediction Model (1995), with permission.
Figure 3-2 Risk factors that influence the weight of the load.
Ch03.qxd 11/13/03 4:07 PM Page 71
• Avoid static work as much as possible.
• Analyze and redesign jobs requiring the manual handling (lifting,pulling, and pushing) of heavy material and equipment, as necessary.
• Provide mechanical assistance for jobs in which manual forcesexceed the limits of the operator.
• Provide mechanical assistance for jobs requiring frequent handlingof heavy loads.
• Design manual handling jobs to avoid twisting as much as possible.
3.2.2 Methods for Evaluating Manual Handling Tasks
Three main tools are available to evaluate MSD risk of manual handlingtasks: (1) checklists and postural observation, (2) National Institute ofOccupational Safety and Health (NIOSH) lifting equation, and (3) math-ematical models based on biomechanical principles. By design these toolstend to yield conservative results. Evaluations from any single tool shouldnot be solely relied on, but should be considered as input into the prioriti-zation and decision-making process. The training and skill required to usethese tools depends on the type of tool. The checklists and postural obser-vation tools described in this chapter can be effectively used by personnelwho have minimal ergonomics training. Use of other tools, such as theNIOSH lifting equation, is more complex and requires more training forproficiency. For example, Dempsey et al. (1991) show that trained indi-viduals can effectively apply the NIOSH lifting equation but untrainedindividuals make critical errors when using the equation. Use of mathe-matical and biomechanical models is not appropriate for the layperson andbest left to the trained specialists. Training to use the models is available,however, and those that may have to use the model frequently get moreout of the training than those who use it infrequently.
3.2.2.1 Postural Observation Checklists for Manual Handling Tasks
The objective of postural observation methods is to identify the tasksor portions of tasks most physically stressful. To use most postural obser-vation methods, all that is needed is the worksheet and a pencil, but formost methods it is recommended that the task be videotaped so that it can
72 Physical Factors
Ch03.qxd 11/1/03 4:18 PM Page 72

be reviewed while scoring the worksheet. Two available methods are rapidentire body assessment (REBA), developed by Hignett and McAtamney(2000), and Ovako working posture analyzing system (OWAS), developedand validated by Karhu, Kansi, and Kuorinka (1977). Subsequently,OWAS was applied in industrial settings and the analyses published(Karhu, Harkonen, Sorvali, and Vepsalainen, 1981; Kivi and Mattila,1991; Mattila, Karwowski, and Vilkki, 1993; Scott and Lambe, 1996). TheOWAS method is intended to be applied to whole body analyses, such asfor manual handling tasks, and therefore, it provides very little precisionfor upper limb assessment. The method was developed specifically so thatit could be used successfully by untrained personnel and provide unam-biguous answers. The procedure and forms for using the OWAS can befound in Karhu et al. (1981).
Attachment 1 is a worksheet that can be used to evaluate and set pri-orities for materials handling tasks to identify those of highest priority forreducing MSD risk. The worksheet provides a rating system for eachaspect that affects the safety of a manual handling task, such as nature ofthe object, weight lifting, posture used, repetition, and other conditions ofthe task. The ergonomist fills out one worksheet per task and tallies thescore for the entire task. Then, tasks are compared and tasks with thehigher scores receive the higher priority for follow-up.
3.2.2.2 Calculation of Weight Limit for Two-Handed Lifting Tasks
NIOSH used a conservative approach to develop an equation to calcu-late the recommended weight limit (RWL) for simple two-handed liftingtasks (Waters et al., 1993; Waters, Putz-Anderson, and Garg, 1994). Theequation is applicable to specific types of lifting tasks and requires train-ing for effective application (Dempsey et al., 1991). Table 3-1 is a check-list that allows the user to determine when the NIOSH equation shouldnot be used. If the task meets any of these conditions, then the equationcannot be used and other means of determining a recommended weightlimit should be applied.
The NIOSH lifting equation is
RWL (Recommended Weight Limit) = LC ¥ HM ¥ VM ¥ DM ¥ AM ¥ FM ¥ CM
The variables are defined in Table 3-2, and Figure 3-3.
Physical Factors 73
Ch03.qxd 11/1/03 4:18 PM Page 73

74 Physical Factors
The multipliers and the task variables (which determine the values of themultipliers) listed in the equation are summarized in Table 3-2. Finally,Tables 3-3 and 3-4 outline the values for the frequency multiplier (FM)and the coupling multiplier (CM).
Figure 3-4 illustrates use of an electronic spreadsheet programmed withthe NIOSH equation to determine the recommended weight limit (RWL)
TABLE 3-1
Criteria for Determining When the NIOSH Lifting Equation Is Not Applicable
Lifting or lowering with one hand.
Lifting or lowering for over 8 hours.
Lifting or lowering while seated or kneeling.
Lifting or lowering in a restricted work space.
Lifting or lowering unstable objects.
Lifting or lowering while carrying, pushing, or pulling.
Lifting or lowering with wheelbarrows or shovels.
Lifting or lowering with high-speed motion (faster than about 30 in. per second).
Lifting or lowering with unreasonable foot or floor coupling (<0.4 coefficient of friction between the sole of the shoe and the floor).
Lifting or lowering in an unfavorable environment (i.e., the temperature significantly outside the 19–26°C [66–79°F] range, relative humidity outside the 35–50% range).
The Initial Lifting Task Two Different Scenarios
Twist 90°
Turn withfeet and walk totable.
V = 25 in.
H = 12.5 in.
D = 10 in.
1. Twist
2. No twist
Figure 3-3 Demonstration of the use of the NIOSH (1991) lifting guidelines.
Ch03.qxd 11/1/03 4:18 PM Page 74

Physical F
actors75
TABLE 3-2
Summary of NIOSH Multipliers and Task Variables
Multiplier U.S. Customary TaskMultiplier Name Abbreviation Metric Equations Equations Variable
Load constant LC 23 kg 51 lb NoneHorizontal multiplier HM (25/H) (10/H) HVertical multiplier VM 1 - (0.003|V - 75|) 1 - (0.0075|V - 30|) VDistance multiplier DM 0.82 + (4.5/D) 0.82 + (1.8/D) DAsymmetric multiplier AM 1 - (0.0032 ¥ A) 1 - (0.0032 ¥ A) AFrequency multiplier FM See Table 3-3 See Table 3-3 NoneCoupling multiplier CM See Table 3-4 See Table 3-4 None
H = horizontal distance of hands from midpoint between the ankles. Measure at the origin and the destination of the lift (cm or in.).V = vertical distance of the hands from the floor. Measure at the origin and destination of the lift (cm or in.).D = vertical travel distance between the origin and the destination of the lift (cm or in.).A = angle of asymmetry, angular displacement of the load from the sagittal plane. Measure at the origin and destination of the lift
(degrees).F = average frequency rate of lifting measure in lifts/min. Duration is specified <1 h, <2 h, or <8 h, assuming appropriate recovery
allowances.C = coupling factor from Table 3-4.
Ch03.qxd 11/1/03 4:18 PM Page 75

76 Physical Factors
TABLE 3-3
Frequency Multipliers
Work Duration
Frequency<1 h <2 h <8 h
(lifts/min) V < 75 V ≥ 75 V < 75 V ≥ 75 V < 75 V ≥ 75
0.2 1.00 1.00 0.95 0.95 0.85 0.85
0.5 0.97 0.97 0.92 0.92 0.81 0.81
1 0.94 0.94 0.88 0.88 0.75 0.75
2 0.91 0.91 0.84 0.84 0.65 0.65
3 0.88 0.88 0.79 0.79 0.55 0.55
4 0.84 0.84 0.72 0.72 0.45 0.45
5 0.80 0.80 0.60 0.60 0.36 0.35
6 0.75 0.75 0.50 0.50 0.27 0.27
7 0.70 0.70 0.42 0.42 0.22 0.22
8 0.60 0.60 0.35 0.35 0.18 0.18
9 0.52 0.52 0.30 0.30 0.00 0.15
10 0.45 0.45 0.26 0.26 0.00 0.13
11 0.41 0.41 0.00 0.23 0.00 0.00
12 0.37 0.37 0.00 0.21 0.00 0.00
13 0.00 0.34 0.00 0.00 0.00 0.00
14 0.00 0.31 0.00 0.00 0.00 0.00
15 0.00 0.28 0.00 0.00 0.00 0.00>15 0.00 0.00 0.00 0.00 0.00 0.00
TABLE 3-4
Coupling Multipliers
Coupling Multipliers
Couplings V < 75 cm (30 in.) V > 75 cm (30 in.)
Good 1.00 1.00
Fail 0.95 1.00
Poor 0.90 0.90
Ch03.qxd 11/1/03 4:18 PM Page 76
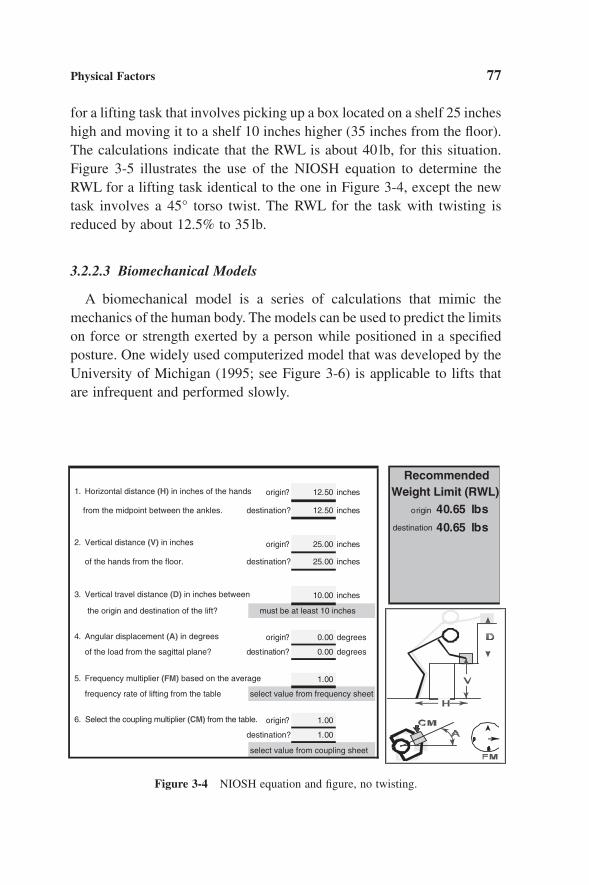
Physical Factors 77
for a lifting task that involves picking up a box located on a shelf 25 incheshigh and moving it to a shelf 10 inches higher (35 inches from the floor).The calculations indicate that the RWL is about 40 lb, for this situation.Figure 3-5 illustrates the use of the NIOSH equation to determine theRWL for a lifting task identical to the one in Figure 3-4, except the newtask involves a 45° torso twist. The RWL for the task with twisting isreduced by about 12.5% to 35 lb.
3.2.2.3 Biomechanical Models
A biomechanical model is a series of calculations that mimic themechanics of the human body. The models can be used to predict the limitson force or strength exerted by a person while positioned in a specifiedposture. One widely used computerized model that was developed by theUniversity of Michigan (1995; see Figure 3-6) is applicable to lifts thatare infrequent and performed slowly.
Recommended1. Horizontal distance (H) in inches of the hands origin? 12.50 inches Weight Limit (RWL) from the midpoint between the ankles. destination? 12.50 inches origin 40.65 lbs
destination 40.65 lbs2. Vertical distance (V) in inches origin? 25.00 inches
of the hands from the floor. destination? 25.00 inches
3. Vertical travel distance (D) in inches between 10.00 inches
the origin and destination of the lift? must be at least 10 inches
4. Angular displacement (A) in degrees origin? 0.00 degrees
of the load from the sagittal plane? destination? 0.00 degrees
5. Frequency multiplier (FM) based on the average 1.00
frequency rate of lifting from the table select value from frequency sheet
6. Select the coupling multiplier (CM) from the table. origin? 1.00
destination? 1.00
select value from coupling sheet
Figure 3-4 NIOSH equation and figure, no twisting.
Ch03.qxd 11/1/03 4:18 PM Page 77
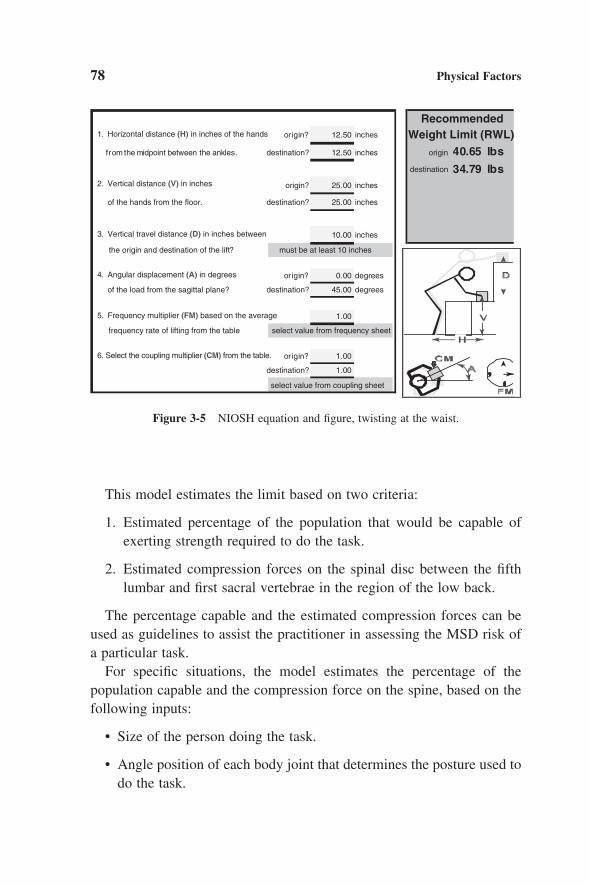
78 Physical Factors
Recommended1. Horizontal distance (H) in inches of the hands or igin? 12.50 inches Weight Limit (RWL) from the midpoint between the ankles. destination? 12.50 inches origin 40.65 lbs
destination 34.79 lbs2. Vertical distance (V) in inches origin? 25.00 inches
of the hands from the floor. destination? 25.00 inches
3. Vertical travel distance (D) in inches between 10.00 inches
the origin and destination of the lift? must be at least 10 inches
4. Angular displacement (A) in degrees or igin? 0.00 degrees
of the load from the sagittal plane? destination? 45.00 degrees
5. Frequency multiplier (FM) based on the average 1.00
frequency rate of lifting from the table select value from frequency sheet
6. Select the coupling multiplier (CM) from the table. or igin? 1.00
destination? 1.00
select value from coupling sheet
Figure 3-5 NIOSH equation and figure, twisting at the waist.
This model estimates the limit based on two criteria:
1. Estimated percentage of the population that would be capable ofexerting strength required to do the task.
2. Estimated compression forces on the spinal disc between the fifthlumbar and first sacral vertebrae in the region of the low back.
The percentage capable and the estimated compression forces can beused as guidelines to assist the practitioner in assessing the MSD risk ofa particular task.
For specific situations, the model estimates the percentage of the population capable and the compression force on the spine, based on thefollowing inputs:
• Size of the person doing the task.
• Angle position of each body joint that determines the posture used todo the task.
Ch03.qxd 11/1/03 4:18 PM Page 78

Physical Factors 79
• Weight of the object or the force being applied by the hands to theobject being handled.
• Description of how the hands apply force to the object (e.g., liftingupward, pushing downward, pushing or pulling horizontally).
When the percentage capable is less than 99% for men and 75% forwomen, the force required by the task is categorized as the strength designlimit (SDL), which is similar to an “action limit” (NIOSH, 1981). Whenless than 25% of men and less than 1% of women are capable, the taskrequires force at the strength upper limit (SUL), which is, in effect, a“maximum permissible limit.” If the maximum permissible limit wereexceeded, there may be an increased risk of MSD injury.
If the compression force exceeds 770 lb (3400 Newton), then the backcompression design limit (BCDL), or “action limit,” is exceeded. Com-pressive forces over 1430 lb (6400 Newton) exceed the back compressionupper limit (BCUL), or “maximum permissible limit.” The SDL andBCDL guidelines were developed to be “consistent with the biomechan-
0
500
1000
1500
2000
2500
3000
0 20 40 60 80 100 120 140 160 180 200 220
Weight of Load in Hands (lb)
Co
mp
ress
ion
Fo
rce
on
5th
Lu
mb
ar V
erte
bra
(lb
)
Load 8 inches away frombody
Load 16 inches away frombody
Back Compression Design Limit(BCDL)
Upper Strength Limit forElbow and Shoulder
Compression force calculations, strength and compression limits and figures are output of the University of Michigan 3D Static Strength Prediction Model (1995), with permission
Load 8 inches away from the body
Load 16 inches away from the body
Back Compression Upper Limit(BCUL)
Figure 3-6 University of Michigan model: Plot of load (lb) versus compression force(lb) for 8≤ horizontal and 18≤ horizontal for best lifting posture.
Ch03.qxd 11/13/03 4:07 PM Page 79
ical and psychophysical criteria used to develop the NIOSH lifting equa-tion.” Whenever the upper limits are exceeded, engineering controls oralterations in work practices are highly recommended. If the design limitsare exceeded, decisions regarding workplace changes must be made withregard to
1. The percentage capable of safely performing the task considered.
2. The costs and benefits associated with the introduction of engineer-ing controls.
3. Work practice alterations to accommodate the percentage of the pop-ulation not capable of performing that task.
The NIOSH equation and the biomechanical models can be used fordoing sensitivity (i.e., what if?) analyses on various situations to explorehow dimensions of the work area can affect the ergonomic risk factors.Various task parameters, such as lifting height or weight of the load, canbe increased or decreased and the equations used to recalculate the rec-ommended weight limit, the percentage capable, and the spinal forces.The recalculated values can then be compared to the original case to deter-mine how much risk reduction can be achieved with various modifica-tions to the work setup.
Other tools also can be used to determine if the force requirement of amanual handling task exceeds recommended limits. Numerous tables ofacceptable forces are listed in Ayoub, Mital, and Nicholson (1992) andpublished papers can be consulted for specific situations (e.g., Woldstad,McMulkin, and Bussi, 1995, for hand wheels). Suggested limits forpushing and pulling a cart, such as a flatbed, can be determined by refer-ring to tabled values of maximum acceptable forces published by Snookand Ciriello (1991). The tables were developed by measuring the max-imum acceptable forces that industrial workers chose to exert duringpushing and pulling tasks. The maximum acceptable forces are indexedin tables according to height of the hands while pulling or pushing,number of times per minute the pushing or pulling is required, and gender.To determine if a pulling or pushing task requires excessive force, theactual force can be compared to the corresponding maximum acceptableforce. To do this, the actual force required to execute the push or pull is
80 Physical Factors
Ch03.qxd 11/1/03 4:18 PM Page 80

measured with a force gauge. More extensive tables for pushing andpulling, as well as lifting, tasks can be found in Ayoub et al. (1992).
3.3 HAND-INTENSIVE REPETITIVE TASKS
For hand-intensive repetitive tasks, the emphasis of the assessment ison identifying which of the five CTD risk factors (force, repetition,awkward posture, contact stress, and muscular fatigue) are significantenough to warrant reduction. In petrochemical operations, some jobsconsist of many different tasks, each possibly containing various combi-nations of the risk factors. Highly repetitive tasks that are repeated hun-dreds of times per hour are not as likely, compared to other industries suchas electronics assembly and word processing.
3.3.1 Risk Factors
If the task involves any of the following features, then it may pose arisk of MSD. More commonly, more than one of the risk factors is present:
• Reaching frequently reaching behind the body or more than 30cm(12 in.) away from the body.
• Repetitive or prolonged reaching with hands above shoulder height.
• Repetitive or prolonged work with the hands above elbow height.
• Repetitive or prolonged finger-pinch gripping or hand grasping.
• Repetitive or prolonged rotation of the forearm (e.g., motion whileusing a screwdriver).
• Repetitive or prolonged awkward wrist posture (see Figure 3-7).
• The same or similar hand, arm, or upper body motions repeated frequently.
• Force is exerted by the hands over prolonged periods of time.
• Tool handle or grasped object digs into palm or fingers.
Physical Factors 81
Ch03.qxd 11/1/03 4:18 PM Page 81
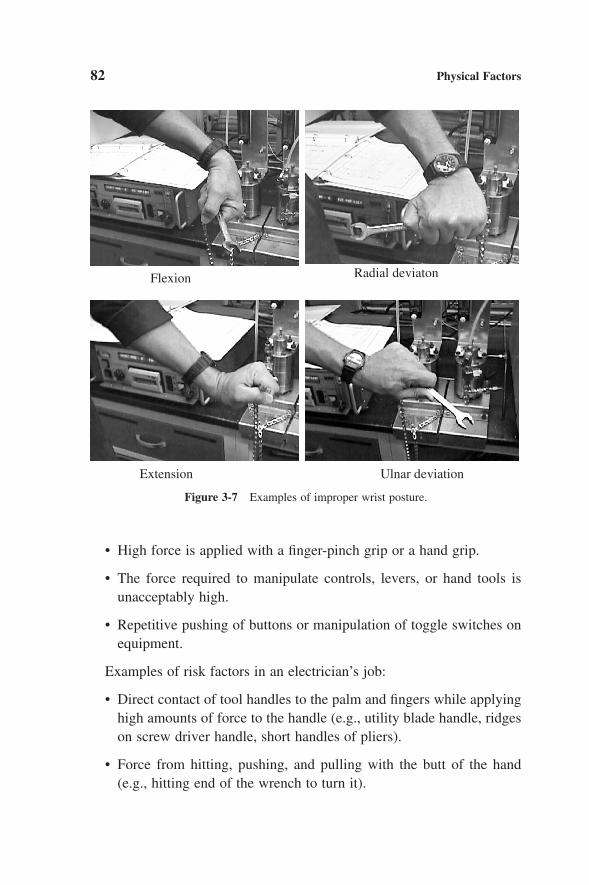
82 Physical Factors
• High force is applied with a finger-pinch grip or a hand grip.
• The force required to manipulate controls, levers, or hand tools isunacceptably high.
• Repetitive pushing of buttons or manipulation of toggle switches onequipment.
Examples of risk factors in an electrician’s job:
• Direct contact of tool handles to the palm and fingers while applyinghigh amounts of force to the handle (e.g., utility blade handle, ridgeson screw driver handle, short handles of pliers).
• Force from hitting, pushing, and pulling with the butt of the hand(e.g., hitting end of the wrench to turn it).
Flexion
Extension Ulnar deviation
Radial deviaton
Figure 3-7 Examples of improper wrist posture.
Ch03.qxd 11/1/03 4:18 PM Page 82
• Static grip and squeezing motion required to operate hand tool andsupport the weight of the hand tool with its power cord (e.g., cuttingcable, power tools).
• Repetitive twisting motion of the hand and forearm to prep the workarea while manually removing protective covers or threaded fasten-ers as well as replacing them after the electrical work is completed.
3.3.2 Survey and Observation Tools
More detailed analyses can be conducted by using one of the observa-tion methods for tasks that involve use of the hands and arms. Thesemethods are approaches for ranking tasks according to relative risk andare not measures of risk. In other words, a task scoring 4 according to thismethod is judged to contain more risk than a task scoring 2, but the taskscoring a 4 need not have twice the risk of the task scoring 2.
Many methods are available for scoring tasks, but the best option is tochoose a tool shown to be both valid and reliable for detecting risks relatedto CTDs. A valid tool reasonably identifies the risks related to the fiveCTD risk factors, the risk factors listed in the previous section. A reliabletool produces relatively similar results when tasks are scored by differentraters.
One of these methods is the rapid upper limb assessment (RULA)method, developed by McAtamney and Corlett (1993) for analyzingupper-limb-intensive tasks (see Figure 3-8). RULA is easy for anuntrained individual to apply to rate priority for tasks involving the hand,arm, and shoulder.
3.3.3 Hand Tools
Use of hand tools potentially involves the five CTD risk factors as wellas potential risk for acute injury, such as a finger pinch. Work areas andhand tools used by personnel with jobs where hand tools are used exten-sively, such as pipefitting, electrical, mechanical, and shop areas, shouldbe evaluated for features that may contribute either to cumulative or acuteinjuries. The features of the hand tool that should be evaluated are
Physical Factors 83
Ch03.qxd 11/13/03 3:37 PM Page 83

84 Physical Factors
• Weight and balance.
• Grip characteristics.
• Trigger or other controls.
• Vibration (described in Chapter 4).
• Posture while using the tool.
In general, a tool should be easy to grasp and operate. The grip area incontact with the hand should minimize hard edges. Vibration should beminimized where possible. Heavy tools should be equipped for two-handed use. The following is a summary of tool guidelines based ondetailed specifications found in Eastman Kodak Company (1983).
The recommended upper weight of a hand tool is about 4.5 lb (2kg) witha maximum of 6 lb (2.7kg) supported with one hand. If the tool is heavier,then provide an external device to counter or support the tool weight. Atool designed to be operated with two hands distributes forces, provides amore stable grip, overcomes torque, and provides the user better controlover the tool. The hand or arm muscles should not have to be used to coun-teract a tool that does not have the weight balanced correctly.
A grip shape that is circular or oval with a diameter of 1.25 to 1.75 in.(3.1 to 4.4cm) is recommended. If the grip requires a span across a lever
Wrist Twist And Scores:
1. Twisting at wrist isabsent or only in themid-range
2. Twisting isextreme, at or nearthe end of the range
Wrist Postures And Scores:
1. No wrist flexion orextension
2. Wrist flexed orextended up to 15°
15°
0°
0°
15°
15°
15°3. Wrist flexed orextended beyond 15°
Note:Add 1 if the wrist isbent away from themidline
+1 +1
Figure 3-8 Excerpt of RULA observation worksheet for wrist postures (McAtamneyand Corlett, 1993).
Ch03.qxd 11/1/03 4:18 PM Page 84
(such as the handles of pliers), then the span should be in a range 2–3 in.(5–7.5cm). All the hand and fingers should comfortably fit onto the grip.Operation of the tool should not require a restricted portion of the finger(such as the tip of the finger) or hand to provide prolonged static pressureon the tool. The thumb and index finger should slightly overlap around aclosed grip for maximum strength. The grip is where the hands and fingersapply force to the tool, so it should be covered with a soft material thatreduces hard edges and pressure points. The covering should protect thehands from the temperature of the tool (e.g., hot or cold surface) andreduce the slipperiness of the tool in the hand. Some coverings also claimto attenuate vibration exposure to the hand.
The manner in which the tool is used also influences the potential forinjury. Hand and wrist postures are important indicators. Tools should beable to be used without extreme bending of the wrist or awkward armposture. The work should be arranged at about elbow height to avoidawkward arm and shoulder posture. The work should also be designed tominimize the need for static posture, such as prolonged gripping with thehands or holding out an outstretched arm. A correct glove fit is also impor-tant. Tight-fitting gloves can put pressure on the hands, while loose-fittinggloves reduce grip strength and dexterity.
3.4 BEHAVIOR
Individual work tasks can, of course, be assessed as needed with oneor a few of the tools described in the previous sections of the chapter. Theactual challenge of assessing work tasks, however, is to assess multiplework tasks and relative risk so that intervention efforts and resources canbe focused at high-priority conditions—the aspects of work tasks identi-fied as the highest potential contributors to a MSD injury.
The procedures described in this chapter are used to assess the risk asso-ciated with job and task characteristics. Risks associated with the workenvironment, human behavior, and management systems can be identifiedand addressed with other tools.
Conditions of the work environment that could contribute to a MSDinjury, such as a back injury resulting from a slip, trip, or fall, include
Physical Factors 85
Ch03.qxd 11/1/03 4:18 PM Page 85

good housekeeping and adequate illumination of work areas. Examples ofenvironmental issues that could contribute to an injury are
• Poor housekeeping (e.g., obstacles, such as hoses, left on the floor orin areas traversed by personnel carrying loads).
• Slippery walking surfaces (e.g., ice, rain, or slick substances).
• Dark areas, where the walking surface is not adequately illuminated.
These types of issues should be identified during safety inspections, jobsafety analyses, and task risk assessments.
Individuals can contribute to controlling MSD risk by proper behaviorwhile doing physical tasks. Human behaviors that can help prevent MSDinjuries are, but not limited to,
• Proper lifting technique.
• Proper pushing and pulling technique.
• Use of lift assist devices when indicated.
Proper lifting technique involves
• Planning the lift.
• Positioning the feet.
• Using good posture.
• Getting a firm grip.
• Keeping close to the load.
• Lifting the load smoothly.
• Moving the feet.
• Putting down, then adjusting the load.
Proper pushing and pulling technique involves
• Where possible, pushing instead of pulling.
• Where possible, locating the hands at about elbow height when stand-ing erect.
86 Physical Factors
Ch03.qxd 11/1/03 4:18 PM Page 86
Physical Factors 87
• Staggering the feet, one foot forward.
• Not using sudden movements.
• Leaning slightly forward.
The results of studies on the effectiveness of back belts in preventingback injuries are equivocal, including the most recently published ones(Krause et al., 1996; NIOSH, 1994; Magnusson and Pope, 1996). The useof back belts as injury prevention devices should not be considered a sub-stitute for a comprehensive ergonomics program. To prevent back injuries,it is necessary to train individuals to lift properly, provide adequate engi-neering controls, and ensure that injuries are reported early, so they canbe treated and the situation ameliorated before any further, more serious,injury might occur.
To address behavioral risk factors, the site behavior-based safetyprogram can incorporate critical behaviors that help prevent MSDs. In thistype of program, critical MSD injury prevention behaviors can be identi-fied and evaluated as safe or at risk during routine observations conductedas part of the program and are addressed as needed. As an example, forone program, the observers watch for the following critical lifting,bending, and twisting behaviors during a safety observation of warehouseemployees:
• While lifting, is the employee using primarily the legs, keeping acurve in the back, the breastbone facing forward, and the load closeto the body?
• Are the shoulders in line with the hips?
• Is the load held isometrically with the arms, as much as possible?
• Is the lift balanced and controlled?
• Does the employee avoid lifting or moving heavy or bulky objectswithout assistance?
• Is the load held close to the body?
• Does the employee keep frequently lifted material at a level betweenthe waist and shoulders?
Ch03.qxd 11/1/03 4:18 PM Page 87
88 Physical Factors
• While bending, is the employee keeping a curve in the back, and shoulders in line with hips?
• Does the employee bend from the hips or knees rather than from thewaist, using a wide base of support as much as possible?
• Does the employee avoid bending where possible?
• Does the employee avoid twisting the spine at all times, keeping theshoulders in line with the hips?
• Does the employee turn by moving the feet and taking steps?
3.5 ERGONOMICS PROGRAM
An ergonomics program provides a process to assess, evaluate, andcontrol the risks associated with work-related MSD injuries. The follow-ing basic principles are recommended as a basis for any ergonomicsprogram:
• Ergonomic processes are supported at every level of the organization.
• Ergonomic processes are proactive, designed with input from alllevels of the organization and aligned with the culture, complexity,and level of risk of the site.
• Ergonomics applications are integrated into corporate safety prac-tices, standards and management systems.
• Management is actively involved through participation in goalsetting, training, and stewardship.
• Ergonomic processes support risk identification, assessment andinterventions to reduce risks.
• The program complies with local ergonomics regulation.
The ergonomics program recommended in this chapter is a specificapplication of the general program model presented in Chapter 1. Thereare other sources of recommendations for ergonomics program structures,such as those by NIOSH (1997), which grew from the proposed ergonom-ics regulations in the United States.
Ch03.qxd 11/1/03 4:18 PM Page 88

3.5.1 Planning an Ergonomics Program
The stages of ergonomics program implementation are planning, train-ing, assessment, interventions, control, and continuous improvement.
Planning the program involves the following steps:
1. Develop the site plan and documentation (e.g., reference materials,manual).
2. Develop the training package.
3. Identify key site personnel and contacts.
4. Define the goals of the ergonomics program.
Training, awareness, and expertise in ergonomics should be developedand maintained. This includes the initial orientation and awareness training and periodic ongoing and refresher training for managers, super-visors, professionals, and other employees as appropriate. Training can beintegrated into existing or ongoing safety and health training courses.
The level of training depends on the employee’s role in the program.(Table 3-5 is an example of assigned roles and responsibilities for anergonomics program.) General awareness training for all employeesshould include
• Common MSDs, signs and symptoms.
• The importance of reporting MSDs early.
• How to report MSDs, signs, and symptoms.
• Risk factors, jobs, and work activities associated with MSD hazards.
• Proper lifting and material handling techniques.
• A description of relevant local regulations and standards.
Safety meetings may be used to provide supplemental job specificergonomic training, such as use of checklists, worksheets, and calcula-tions. Management, supervisors, medical, and safety directors and the siteskilled contacts should receive training on risk identification, setting riskpriorities, and assessment. The site skilled contacts or subject matterexperts should receive training on how to use detailed risk assessmenttools for ergonomics agents (e.g., how to assess lifting, pushing, pulling,
Physical Factors 89
Ch03.qxd 11/1/03 4:18 PM Page 89

90 Physical Factors
TABLE 3-5
Example Roles and Responsibilities for an Ergonomics Site Program
Management Ensure implementation, execution, and maintenance of programsponsor Participate in an annual review of the program, facilitating
improvements to the program and manual as necessaryAssure that the management and local program manual
administrators are properly trained and qualifiedIdentify the responsible and accountable resources (administrator and
skilled contacts) and ensure they are trained
Program Oversee the programadministrator Conduct periodic evaluations of the effectiveness of the ergonomics
control program for the management sponsorPeriodically review the program manual for necessary changesAssure that applicable personnel are properly trainedAssure appropriate records are maintained, including key
performance indicatorsNotify the employee and his or her supervisors of the results of the
workplace evaluations
Line supervisor Assure the program is implemented for their work areasPromote participation in the programEnsure proposed changes that affect the program are addressed
through the management of change processConsider ergonomic principles when designing or reviewing job tasksEnsure employees receive ergonomics trainingPresent job-specific ergonomics topics at safety meetingsPromptly refer employees to medical personnel if they report
symptoms and initiate incident investigation procedures asnecessary
Request workplace ergonomic evaluations as neededSupport implementation of interventions and controls
Site skilled Implement the program at each field locationcontact Ensure site-specific procedures are written
Ensure worker training is conductedMaintain records and trainingArrange general awareness training for site personnelEvaluate work environment or job tasks as indicated by risk
assessment or referral (e.g., after an incident)Identify, prioritize, and assess risksWork with other personnel to develop and implement controlsReport key performance indicators
continued
Ch03.qxd 11/1/03 4:18 PM Page 90

Physical Factors 91
and upper extremity repetitive tasks). The project engineers and designspecialists should receive training on how to consider minimizing designfeatures that affect ergonomic hazards or risks.
3.5.2 Risk Assessment Process
The risk assessment process should cover the following:
• Reactive (e.g., response to incidents) and proactive (preventative)risk assessment.
• Screening using the following data to set priorities on tasks that needassessment: safety incident data, health illness data, absenteeism data,
TABLE 3-5
Example Roles and Responsibilities for an Ergonomics Site Program Continued
Serve as the subject matter expert (SME) for field-related questionsReview injury, illness, and incident reports for ergonomic trends
Health clinic Evaluate persons reporting discomforts or concerns with MSD signs or medical and symptomspersonnel Report ergonomics injuries and illnesses to safety and management
personnel for workplace evaluation follow-upEvaluate employee’s fitness for work as needed
Trainer Maintain documentation of ergonomics training
Ergonomist Assist with development of training packagesTrain site contacts and other key personnel to assess risksAssure quality of data and analysesProvide technical expertise as neededAssist with intervention and controls as needed
Site engineer Assist development of controlsInclude ergonomic principles in new design and modification projectsEnsure project employees receive ergonomics trainingInclude ergonomics considerations in design execution, including
design reviews
Employees Attend and participate in scheduled ergonomics trainingUse tools and equipment as instructedUse proper work practices as instructed in ergonomics trainingReport symptoms of injury or illness at their first appearanceReport workplace hazards or conditions
Ch03.qxd 11/1/03 4:18 PM Page 91

92 Physical Factors
behavior-based safety observations on ergonomics (e.g., followinglifting procedures, using proper lifting technique).
• Detailed assessments (e.g., use of NIOSH lifting equation, biome-chanical model) on specific high-risk tasks.
• Review of projects for new facilities or modified plant areas.
There are two levels of risk assessment for proactively assessing exist-ing operations: screening and detailed. The first level is a screeningprocess that may be used to proactively assess a specific job or task forpotential risk factors to prevent injuries. The screening process is used toqualitatively assess a job or task, identify obvious concerns or conditionsthat can be quickly fixed, and assess priorities on interventions to reducerisk or initiate further detailed assessment.
When using these tools, a higher score indicates that a task contains arelatively high number of key MSD risk factors. Management should consider these jobs or tasks at the highest priority for risk reduction. High-or moderate-risk tasks that have no simple or quick solution are quantita-tively assessed with the best exposure assessment methods available.Tools such as simple checklists, postural observation, and task analysisworksheets are appropriate for screening and have already been describedin this chapter. Data such as injury reports, medical, management, andemployee concerns should also be considered in the screening process toassign priority to tasks for follow-up.
The second level is a detailed assessment process, which is used whenquick fixes to high or moderate risks are not immediately evident or theidentified solutions are considered costly or resource intensive. Detailedassessments take more effort and skill to conduct, but they provide quantita-tive insights that can help target the intervention for effective use ofresources. The detailed assessment process is quantitative where possibleand based on the best-available exposure assessment methods. Quantitativeassessment provides insight on which portions of a job or tasks contributethe most risk, therefore guiding the cost-effective solution that most effec-tively reduces risk. In addition, quantitative assessments can be used toconduct sensitivity analyses, in which the tasks or jobs can be modeled withthe proposed changes and the risk reduction estimated before any designchanges actually take place. This process is illustrated in Figure 3-9.
More comprehensive analysis approaches encompass risk identificationof factors beyond the physical risk factors. One approach, described by
Ch03.qxd 11/1/03 4:18 PM Page 92

Physical Factors 93
the Canadian Association of Petroleum Producers (2000), involves the useof a series of forms that guide the risk identification and assessmentprocess. Several potential risk factors are reviewed on the forms, includ-ing a signs and symptoms questionnaire and posture, force, repetition,organizational, and environmental factors. The scores on each form aresummarized and the tasks are categorized into low-, medium-, and high-risk categories based on the aggregate task score.
Another comprehensive approach is by NIOSH (1997) as part of pro-posed ergonomics regulations. This approach is based on criteria, calledtriggers, that initiated aspects of an ergonomics program based on certainconditions.
3.5.3 Solutions
Timely, successful solutions, regardless of size, build credibility, whichis the foundation on which to support a longer-term process. In the solu-tion development phase of the project, the emphasis is to “design in”ergonomic improvements in selected workplaces and implement appro-priate engineering, work-practice, and administrative controls. These solu-
Is ergonomistneeded?
Yes
Yes
Implement and share solution
No
Seek existing solution
Refer to study team
Develop cost- effective control
Ergonomics expert
Yes
No
Identify work tasks
Stop
Assess periodically (e.g., 5 years)
No
Screen tasks for potential ergonomic exposure
Potential for
exposure?
Yes
Detailed assessment
Definite or probable
exposure?
Is low-cost control
possible?
No
Figure 3-9 Flowchart on risk assessment process.
Ch03.qxd 11/1/03 4:18 PM Page 93
tions take the form of modifying equipment, tools, or materials; changingwork procedures; or modifying work schedules, where appropriate, by dis-tributing difficult tasks among employees and shifts or job rotation.
In some cases, simple solutions are available through modifications inpurchasing specifications, procedural changes, and the like. In other cases,solutions are not as obvious and require further development. Where solu-tions are costly or complex, it may be useful to request input from othersimilar operations, consultants, or equipment designers.
Engineering controls are physical changes to a job that reduce MSDhazards. Examples of engineering controls include changing or redesign-ing workstations, tools, facilities, materials, or work processes (refer toChapter 6 for more detail). Examples of tools that reduce hazards include
• Box tables to raise loads.
• Tools to move loads (pallets, drums, boxes, or furniture).
• Hoists to assist lifting.
• Scissor lifts to keep loads at an appropriate height.
• Tilt tables to improve access.
• Portable stairs to prevent stretching.
Administrative controls are changes in the way work in a job is assignedor changes to schedules that reduce the magnitude, frequency, or durationof exposure to ergonomic risk factors. Examples of administrative con-trols include
• Rotating employees in positions to vary physical activity.
• Recombining jobs or tasks to adjust the physical workload.
• Providing alternative tasks.
• Changing the work pace (if the work pace is not under the control ofthe employee, such as a conveyor belt with product moving past).
3.5.4 Evaluating the Ergonomics Program
The ergonomics program should be assessed periodically to evaluateits effectiveness and identify improvement areas. Some indicators ofeffectiveness may include
94 Physical Factors
Ch03.qxd 11/1/03 4:18 PM Page 94

• Percentage of incidents related to MSD injury.
• Evaluation of local work area.
• Percent training completed.
• Relative percentage safe and at-risk behavior observed.
The program evaluation checklist in Appendix 3 can used to conduct agap assessment on existing programs.
3.6 CASE STUDY
This is a study on how to apply the musculoskeletal risk identificationtools available from the Canadian Association of Petroleum Producers(CAPP, 2000). The risk identification process that it recommends consistsof two levels: (1) screening and (2) priority setting and detailed assessment.
The CAPP provides a series of worksheets that support the screeningand detailed assessment processes. The CAPP worksheets are used toscreen and assess a series of work tasks to change out the catalyst in areactor. The work tasks are
• Remove the 50-lb nuts from each bolt that secures the cover at thetop of the reactor, then replace them and close the cover when fin-ished changing the catalyst. This task requires hoisting an impact gunto about waist height and reaching upward to support it while it restsvertically over the nut to loosen and tighten it. The handles of theimpact gun are above shoulder height.
• While sitting at the bottom of the reactor, push a long pole verticallyup through the individual tubes within the reactor to loosen the cat-alyst so that it falls out of the reactor. Each push with the rod requiresabout 30 lb of upward force with one hand. The rod handle is a contactstress to the hand.
• While sitting near the top of the reactor, use a pneumatic drill toremove the caked catalyst from each tube within the reactor, so thatthe drilled pieces fall through the tubes to the bottom floor. Pushingthe drill through the caked material requires about 20–35 lb of forcedepending on the psi used for the drill.
Physical Factors 95
Ch03.qxd 11/1/03 4:18 PM Page 95

96 Physical Factors
• Move the drums of catalyst to the top of the reactor—400-lb drumsof catalyst are moved from an elevator to the reactor area. Drums arestaged at a height of about 41 in. from the floor.
• Pour the new catalyst in the drums into the top of the reactor bypushing with 95 lb of force on the drum to tilt it so the contents pourinto the reactor.
The level 1 screening process worksheet is shown in Figure 3-10.The CAPP screening worksheet indicates a lower potential of issues
associated drilling out the used catalyst and pouring in the new catalyst.The screening worksheet indicates that detailed assessments may be usefulon the other tasks to help further assess risk. Level 2 detailed assessmentsconsist of biomechanical analyses of the removal of the reactor cover,prodding the catalyst, and moving the drums.
Remove/replacereactor head
1.
2.
3.
4.
5.
6.
Task name
Moderate orSevere Body Part
Discomfort:(Y/N)
AwkwardWork
Postures?(Y/N)
HighEffort orForce?(Y/N)
HighRepetitionor Work
Rate? (Y/N)
ContactStress or
Skin?(Y/N)
HighMentalStress?(Y/N)
1/month:1/week:<1/week
1/day, and1/hour
Frequency andDuration TaskIs Performed
Loosencatalystwith rod
Drill cakedcatalyst
Move drums
Tilt drums topourcontents
N
N
N
N
N
Y
Y
N
N
N
Y
Y
N
Y
N
N
N
N
N
N
N
Y
N
N
N
N
N
N
N
N
1/month
1/month
1/month
1/month
1/month
Perceived risk
In distinct workactivity comprisedof several steps oractions
Figure 3-10 Level 1 summary form from CAPP risk identification process.
Ch03.qxd 11/1/03 4:18 PM Page 96

Physical Factors 97
Biomechanical assessment indicates that the recommended weight limitfor the nuts on the reactor is about 44 lb for the current height of aboutchest height. A platform is installed to bring the operator up in height sothat the work is at about 31 in. from the floor, resulting in a recommendedlimit of 50 lb. Loosening the catalyst by prodding the reactor with a vertical rod requires moderate shoulder and elbow strength and has noexcessive compression force on the spine. For handling the drums, bio-mechanical assessment indicates that most people lack the shoulderstrength to safely perform this task, although compression forces on thespine are not excessive. Drum lifting and handling equipment is acquiredto minimize the amount of manual drum movement required to maneu-ver the drums over to the reactor.
APPENDIX
APPENDIX 3-1
Manual Handling Screening Checklist: Risk Identification and Priorities (Deeb,1994)
Work Location _____________________________ Date ______________________
Task Description
_____________________________________________________________________
Task Code ______________________________________________
Assessed by _______________
Please answer the questions in all three sections. You can have multiple answers tosome questions. An asterisk next to a question means that multiple answers are possible.Please answer all questions to the best of your ability, leave no question unanswered. Ifyou are unsure about an answer to a question, go to highest answer category. Forexample, in Question 2.3, if the object weighs 30 lb (14kg), choose answer number 4.
Ch03.qxd 11/1/03 4:18 PM Page 97

98 Physical Factors
Name: ____________________ Age: ________ For
Height: __________Authorized
Weight: ___________________ Male/FemaleUse Only
Left/Right Handed
SCORE
Section 1
1. Task Characteristics1.1 The operator performs the task:
1. Sitting 2. Standing 3. Squatting or kneeling
^ ^ ^ ^
Other comments:___________________________________________________________
1.2 When performing the task, the upper body is: (multiple answers are possible)*1. Straight/erect 2. Bent forward 3. Bent backward 4. Twisted
^ ^ ^ ^
Other comments:___________________________________________________________
1.3 Performing the task involves: (multiple answers are possible)*1. Normal arm reaches2. Awkward postures, such as deviation from stable body position3. Reaching above shoulders4. Uneven distribution of body weight on the feet, such as one foot
is lower than the other
Other comments:___________________________________________________________
1.4 The task is performed at the pace of the operator1. Yes2. No
Other comments:___________________________________________________________
Ch03.qxd 11/26/03 05:10 PM Page 98
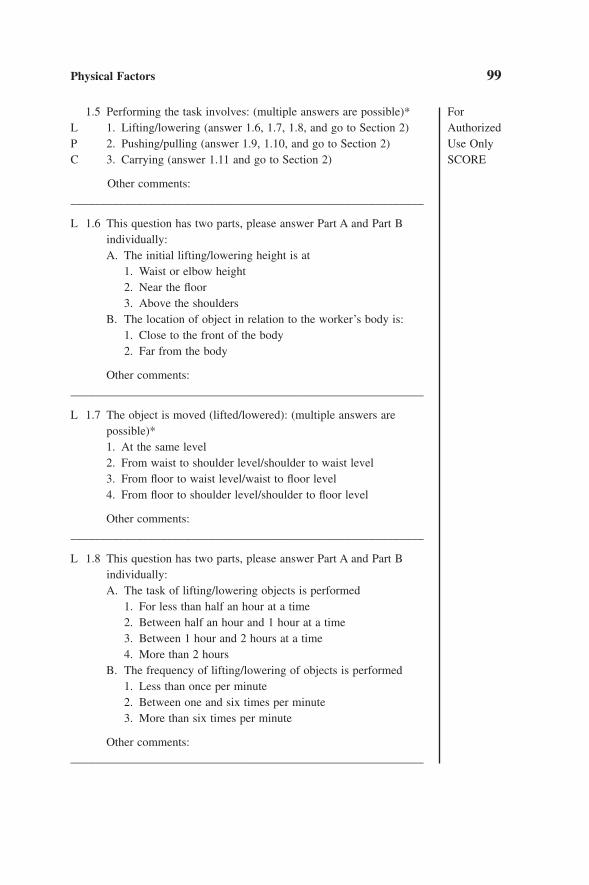
Physical Factors 99
1.5 Performing the task involves: (multiple answers are possible)* ForL 1. Lifting/lowering (answer 1.6, 1.7, 1.8, and go to Section 2) AuthorizedP 2. Pushing/pulling (answer 1.9, 1.10, and go to Section 2) Use OnlyC 3. Carrying (answer 1.11 and go to Section 2) SCORE
Other comments:___________________________________________________________
L 1.6 This question has two parts, please answer Part A and Part B individually:A. The initial lifting/lowering height is at
1. Waist or elbow height2. Near the floor3. Above the shoulders
B. The location of object in relation to the worker’s body is:1. Close to the front of the body2. Far from the body
Other comments:___________________________________________________________
L 1.7 The object is moved (lifted/lowered): (multiple answers are possible)*1. At the same level2. From waist to shoulder level/shoulder to waist level3. From floor to waist level/waist to floor level4. From floor to shoulder level/shoulder to floor level
Other comments:___________________________________________________________
L 1.8 This question has two parts, please answer Part A and Part B individually:A. The task of lifting/lowering objects is performed
1. For less than half an hour at a time2. Between half an hour and 1 hour at a time3. Between 1 hour and 2 hours at a time4. More than 2 hours
B. The frequency of lifting/lowering of objects is performed1. Less than once per minute2. Between one and six times per minute3. More than six times per minute
Other comments:___________________________________________________________
Ch03.qxd 11/1/03 4:18 PM Page 99

100 Physical Factors
P 1.9 In what direction is the pushing/pulling applied? For1. In front of the body 2. Across the front of the body Authorized
Use Only^ ^ SCORE
Other comments:___________________________________________________________
P 1.10 The force applied to push/pull the object is sustained for1. Less than 10 seconds2. Between 10 and 20 seconds3. Between 20 and 30 seconds4. More than 30 seconds
Other comments:___________________________________________________________
C 1.11 Carrying the object requires a holding grip or position for1. Less than 5 seconds2. Between 5 and 10 seconds3. More than 10 seconds
Other comments:___________________________________________________________
1.12 The task (please answer parts A, B, C, and D individually)A. Requires unusual capability to be performed (i.e., beyond
expectations of the normal worker)1. No2. Yes
B. Aggravates those with a health problem (i.e., back and muscular problems)1. No2. Yes
C. Aggravates those who are pregnant1. Not applicable (for men)2. No3. Yes
D. Requires special training/individual received training1. No/not applicable2. Yes/yes3. Yes/no
Other comments:___________________________________________________________
Total of Section 1
Ch03.qxd 11/26/03 05:10 PM Page 100
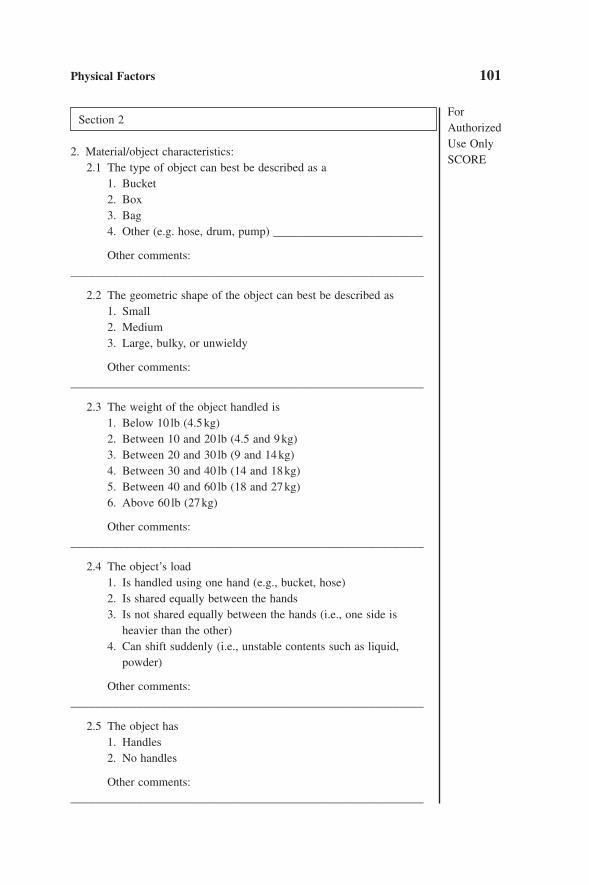
Physical Factors 101
Section 2
2. Material/object characteristics:2.1 The type of object can best be described as a
1. Bucket2. Box3. Bag4. Other (e.g. hose, drum, pump) _________________________
Other comments:___________________________________________________________
2.2 The geometric shape of the object can best be described as1. Small2. Medium3. Large, bulky, or unwieldy
Other comments:___________________________________________________________
2.3 The weight of the object handled is1. Below 10 lb (4.5kg)2. Between 10 and 20 lb (4.5 and 9kg)3. Between 20 and 30 lb (9 and 14kg)4. Between 30 and 40 lb (14 and 18kg)5. Between 40 and 60 lb (18 and 27kg)6. Above 60 lb (27kg)
Other comments:___________________________________________________________
2.4 The object’s load1. Is handled using one hand (e.g., bucket, hose)2. Is shared equally between the hands3. Is not shared equally between the hands (i.e., one side is
heavier than the other)4. Can shift suddenly (i.e., unstable contents such as liquid,
powder)
Other comments:___________________________________________________________
2.5 The object has1. Handles2. No handles
Other comments:___________________________________________________________
ForAuthorizedUse OnlySCORE
Ch03.qxd 11/1/03 4:18 PM Page 101

102 Physical Factors
2.6 The area of contact between hands/arms and object1. Presents no hazard/difficulty2. Is cold/hot3. Has sharp edges
Other comments:___________________________________________________________
Total of Section 2
Section 3
3. Workplace characteristics3.1 The task is performed in
1. An unrestricted space2. A restricted space (places constraints on posture)3. A very restricted space (places severe constraints on posture)
Other comments:___________________________________________________________
3.2 The task is performed in1. A closed environment with no strong air movement2. An open environment with strong air movement
Other comments:___________________________________________________________
3.3 The ambient temperature and humidity of the workplace is1. Within the comfortable zone (temperature between 19° and
26°C [66° and 79°F] and humidity between 35 and 65%)2. Outside the comfortable zone (hot/cold/humid conditions)
Other comments:___________________________________________________________
3.4 The workplace is considered to have (consider day and night work)1. Adequate lighting for the job2. Inadequate lighting for the job
Other comments:___________________________________________________________
3.5 The floor surface (multiple answers are possible)*1. Is even2. Has variation in levels (i.e., uneven, steps)3. Is slippery
Other comments:___________________________________________________________
ForAuthorizedUse OnlySCORE
Ch03.qxd 11/1/03 4:18 PM Page 102

Physical Factors 103
3.6 The workplace has1. Good housekeeping2. Poor housekeeping, such as crowded or waste on the floor
Other comments:___________________________________________________________
3.7 The conditions where manual materials handling tasks are performed require1. Standard protective clothing2. Additional protective clothing (e.g., chemical suits, respirators)3. Special protective clothing such as thermal coverall and gloves
Other comments:___________________________________________________________
Total of Section 3
Summary
Relative Scores
Total (max) % Severity
Section 1 (116)Section 2 (22)Section 3 (20)Total (158)
Comments/recommendations:
ForAuthorizedUse OnlySCORE
APPENDIX 3-2
Musculoskeletal Ergonomics Program Gap Analysis Checklist
ConfirmedChecklist Item (✓)
Program Feature
ImplementationThe program is implemented throughout the site
Employees/local unions support the program
A system is in place for employees to report concerns
Feedback is given to employees regarding reported concerns
continued
Ch03.qxd 11/13/03 3:37 PM Page 103

104 Physical Factors
APPENDIX 3-2
Musculoskeletal Ergonomics Program Gap Analysis Checklist Continued
ConfirmedChecklist Item (✓)
Concerns are addressed in a timely manner
The program includes the following components:PlanningSelection/priority assignment of worker groups for screeningScreening for detailed assessmentDetailed risk assessmentTraining for the general population and assessorsControl developmentMeasurement/continuous improvement
Changes to tasks triggers re-evaluation
Members of worker group are interviewed
Jobs are divided into tasks for assessment
Training and qualifications of ergonomics resources are commensurate with role and level of involvement
A program is in place to address office ergonomics
The program is part of every day practice/awareness
Management Support
The program has visible support by site management and line management
Roles in the program are clearly defined
Enough personnel to effectively implement and sustain the program
Enough time to effectively implement and sustain the program
There is enough budget to effectively implement and sustain the program
The program is linked to other site systems such as incident investigation, near miss reports, procedures development and training, risk assessments, management of change and medical system
continued
Ch03.qxd 11/13/03 3:37 PM Page 104

Physical Factors 105
APPENDIX 3-2
Musculoskeletal Ergonomics Program Gap Analysis Checklist Continued
ConfirmedChecklist Item (✓)
Training
All employees are trained with an introduction to ergonomics
Supervisors/management/medical directors trained in the screening process (overview)
Training includes consideration for equipment design that affects musculoskeletal ergonomics
Refresher training scheduled as needed
Training given new employees
Verification method in place to determine if training is adequate and understandable
General awareness training includes identification of symptoms and signs
Training addresses procedures for reporting work-related musculoskeletal disorders and concerns
Workers who change program roles have sufficient training to fill new role
Training enables managers, supervisors, and employees to identify aspects of a job that increase risk of developing work-related musculoskeletal disorders
Assigning Priorities
Jobs assigned priority prior to the screening process
Symptom surveys used across the site to assess trends
Health/illness data used to assess trends and set priorities
Absenteeism data used to assess trends and set priorities
Safety incident data used to assess trends and set priorities
Communication with similar sites used to identify potentially high-risk tasks
Outcome of employee concerns are used in assigning priorities
continued
Ch03.qxd 11/13/03 3:39 PM Page 105

106 Physical Factors
APPENDIX 3-2
Musculoskeletal Ergonomics Program Gap Analysis Checklist Continued
ConfirmedChecklist Item (✓)
Screening Tools
Screening tools are easy to use and understand
Screening tools identify tasks that require detailed assessment
Person conducting screening process is qualified
Screening based on medical data and concern of management, employees, and evaluator
All field jobs are screened based on prioritization process
Detailed Assessment Tools
Whole body posture assessed using a standardized tool
Tool/method: __________________________________
Upper extremity exposure assessed using a standardizedtool
Tool/method: ___________________________________
Vehicle operation assessed using a standardized tool
Tool/method: ____________________________________
Lifting and lowering assessed using a standardized tool
Tool/method: ____________________________________
Whole body pushing and pulling forces assessed using a standardized tool
Tool/method: ____________________________________
Energy expenditure assessed using a standardized tool
Tool/method: _____________________________________
Results for each tool mapped to an action level rating to identify relative risk
Trained evaluator observes the worker performing the task
Tasks are videotaped for later detailed analysis
Workstation measurements taken (surface heights, clearance space, etc.)
continued
Ch03.qxd 11/13/03 3:41 PM Page 106

Physical Factors 107
APPENDIX 3-2
Musculoskeletal Ergonomics Program Gap Analysis Checklist Continued
ConfirmedChecklist Item (✓)
Forces and hand positions measured
Exposure to heat, cold, and vibration considered
Repetition and duration of task considered
Hand tool usage assessed
Coefficient of friction on walking surface (slippery floor) considered
Person conducting the detailed assessment is qualified
Intervention and Controls
Solutions evaluated with considerations of relative risk and relative cost/benefit analysis
Effectiveness of solutions implemented measured for musculoskeletal risk factors and work efficiency
Solution development documented
Solutions developed and implemented in a timely manner, depending on severity of issue
Solutions and learning effectively communicated throughout the organizational levels and shifts/work groups, across similar sites, and a central resource
Employees empowered to make changes to their work environment
Employees empowered to make suggestions for changes to their work environment
Solution evaluated before implementation by a qualified skilled resource
Control strategies reported through management of change procedures
Changes in work procedures or required work effort (force, shift length, container size, etc.) trigger re-evaluation
Assessed tasks given priority for improvement according to relative risk
continued
Ch03.qxd 11/13/03 3:42 PM Page 107

3.7 REVIEW QUESTIONS
Test your understanding of the material in this chapter.
1. Which of the following is not a type of cumulative trauma disorder?(a) low back pain.(b) broken wrist.(c) carpal tunnel syndrome.(d) tendinitis.
2. What five risk factors are associated with cumulative trauma disorders?
3. How would you determine whether the weight of a box of spare partsis too heavy to be safely lifted by the warehouse attendant?
4. Which dimension, distance of the load away from the body or ver-tical location of the load, is the more significant contributor to theeffect of the load?
5. What general instructions would you give someone on how to liftsafely?
108 Physical Factors
APPENDIX 3-2
Musculoskeletal Ergonomics Program Gap Analysis Checklist Continued
ConfirmedChecklist Item (✓)
Continuous Improvement/Measurement
The program stewarded on a regular basis
The program has been continuously improved
Benchmarking data (i.e., health illness data, absenteeism data) collected
Measures of program performance in place and include safety incident data, health illness data, absenteeism data, and restricted work.
Internal and external quality assurance processes in place to evaluate data and the program
Ch03.qxd 11/13/03 3:43 PM Page 108

6. How would you identify which tasks need a detailed ergonomicassessment?
7. What topics should be covered in a general employee awarenesscourse on preventing musculoskeletal injuries?
REFERENCES
Ayoub, M. M., Mital, A., and Nicholson, A. S. (1992) A Guide to Manual Materials Handling. London: Taylor and Francis.
Canadian Association of Petroleum Producers (CAPP) and Canadian Petroleum ProductsInstitute (CPPI). (2000) Ergonomic Risk Identification and Assessment Tool. Calgary,Alberta: CPPI.
Deeb, J. (1994) Personal Communication.
Dempsey, P. G., Burdorf, A., Fathallah, F., Sorock, G., and Hashemi, L. (1991) “Influenceof Measurement Accuracy on the Application of the 1991 NIOSH Equation.” AppliedErgonomics 32, pp. 91–99.
Eastman Kodak Company. (1983) Ergonomic Design for People at Work. New York: VanNostrand Reinhold Company.
Hignett, S., and McAtamney, L. (2000) “Rapid Entire Body Assessment.” AppliedErgonomics 31, pp. 201–205.
Karhu, O., Harkonen, R., Sorvali, P., and Vepsalainen, P. (1981) “Observing Working Postures in Industry: Examples of OWAS Application.” Applied Ergonomics 12, no. 1, pp. 13–17.
Karhu, O., Kansi, P., and Kuorinka, I. (1977) “Correcting Working Postures in Industry:A Practical Method for Analysis.” Applied Ergonomics 8, no. 4, pp. 199–201.
Kivi, P., and Mattila, M. (1991) “Analysis and Improvement of Work Postures in the Building Industry: Application of the Computerized OWAS Method.” AppliedErgonomics 22, no. 1, pp. 43–48.
Kraus, J. F., Brown, K. A., McArthur, D. L., Peek-Asa, C., Samaniego, L., Kraus, C., andZhou, L. (1996) “Reduction of Acute Low Back Injuries by Use of Back Supports.”International Journal of Occupational and Environmental Health 2, pp. 264–273.
Magnusson, M., and Pope, M. (1996) “Does a Back Support have a Positive Biomechan-ical Effect?” Applied Ergonomics 27, no. 3, pp. 201–205.
Mattila, M., Karwowski, W., and Vilkki, M. (1993) “Analysis of Working Postures in Hammering Tasks on Building Construction Sites Using the Computerized OWAS Method.” Applied Ergonomics 24, no. 6, pp. 405–412.
McAtamney, L., and Corlett, N. (1993) “RULA: A Survey Method for the Investigationof Work-Related Upper Limb Disorders.” Applied Ergonomics 24, no. 2, pp. 91–99.
Physical Factors 109
Ch03.qxd 11/1/03 4:18 PM Page 109

NIOSH. (1981) Work Practices Guide for Manual Lifting. Cincinnati, OH: U.S. Depart-ment of Health and Human Services.
NIOSH. (1994) Workplace Use of Back Belts. DHHS (NIOSH) Publication No. 94-122.Cincinnati, OH: U.S. Department of Health and Human Services.
NIOSH. (1997) Elements of Ergonomics Programs. DHHS Publication No. 97-117.Cincinnati, OH: U.S. Department of Health and Human Services.
Occupational Safety and Health Administration. (1995) OSHA Proposed Ergonomic Pro-tection Standard. Washington, DC: Bureau of National Affairs.
Scott, G. B., and Lambe, N. R. (1996) “Working Practices in a Perchary System, Usingthe OVAKO Working Posture Analysing System (OWAS).” Applied Ergonomics 27,no. 4, pp. 281–284.
Silverstein, B. A., Fine, L. J. and Armstrong, T. J. (1987) “Occupational Factors and Carpal Tunnel Syndrome.” American Journal of Industrial Medicine 11, pp. 343–358.
Snook, S. H., and Ciriello, V. M. (1991) “The Design of Manual Handling Tasks: RevisedTables of Maximum Weights and Forces.” Ergonomics 34, no. 9, pp. 1197–1213.
University of Michigan, Center for Ergonomics. (1995) 3D Static Strength PredictionProgram Manual. Ann Arbor: University of Michigan.
Waters, T. R., Putz-Anderson, V., and Garg, A. (1994) Applications Manual for the RevisedNIOSH Lifting Equation. DHHS (NIOSH) Publication No. 94-110. Cincinnati, OH:U.S. Department of Health and Human Services.
Waters, T. R., Putz-Anderson, V., Garg, A., and Fine, L. J. (1993) “Revised NIOSH Equa-tion for the Design and Evaluation of Manual Lifting Tasks.” Ergonomics 36, no. 7,pp. 749–776.
Wiktorin, C., Selin, K., Ekenvall, L., Kilbom, A., and Alfredsson, L. (1996) “Evaluationof Perceived and Self-Reported Manual Forces Exerted in Occupational MaterialsHandling.” Applied Ergonomics 27, no. 4, pp. 231–239.
Woldstad, J. D., McMulkin, M. L., and Bussi, C. A. (1995) “Forces Applied to Large HandWheels.” Applied Ergonomics 26, no. 1, pp. 55–60.
110 Physical Factors
Ch03.qxd 11/1/03 4:18 PM Page 110

4
Environmental Factors
4.1 Introduction4.2 Illumination
4.2.1 Lighting Quantity4.2.2 Task Factors4.2.3 Age Factors4.2.4 Lighting Quality
4.3 Temperature4.3.1 Effects of Heat on Performance4.3.2 Effects of Cold on Performance4.3.3 Effects of Heat on Health4.3.4 Comfort and Discomfort Zones4.3.5 Work Tolerance in a Hot Environment4.3.6 Recommendations to Improve Working Conditions
4.4 Noise4.4.1 Effects of Noise on Performance4.4.2 Effects of Noise on Health4.4.3 Guidelines to Control Noise
4.5 Vibration4.5.1 Effects of Vibration on Performance4.5.2 Effects of Vibration on Health4.5.3 Guidelines to Reduce or Control Vibration
4.6 Case Study4.6.1 Method4.6.2 Results4.6.3 Recommendations4.6.4 Installation of a Pilot Lighting System4.6.5 Final Results
111
Ch04.qxd 11/1/03 4:19 PM Page 111
4.1 INTRODUCTION
This chapter discusses four environmental factors or features that arise from the surroundings (i.e., illumination and temperature) andmechanical features of the workplace (i.e., noise and vibration) that couldbe encountered at work and affect behavior. Other examples of envi-ronmental features that could be encountered at work and may affectbehavior are dangerous chemicals, radioactive materials, atmosphericpressure, and the like. These other environmental features are not discussed in this chapter.
This chapter discusses the four environmental features that can affectpeople in three ways: (1) health, (2) performance, and (3) comfort. Theaffects of these three aspects are usually combined. For example, poorhealth can lead to both poor performance and reduced comfort and, thus,reduced work satisfaction. Stressors, arising from illumination, tempera-ture, noise, vibration, or any other aspect of the environment can adverselyaffect people when they reach a certain level, although the effect may notbe apparent either to the person being affected or an observer. The idealrange for performance and comfort is narrow. Therefore, trying to adaptto conditions outside the ideal range can make people use more effort,which can lead to reduced performance and comfort; for example, aperson trying to see fine details when illumination levels are too low ortoo high.
This chapter ends with a case study examining the lighting quantity and quality in a control room. In addition, a set of review questions areincluded to help you check your understanding of the material covered inthis chapter.
4.2 ILLUMINATION
Light stimulus is characterized by its intensity and wavelength. The intensity of light is expressed in terms of the amount of luminous flux (energy) it generates. Flux is measured in candlepower (cd) or lumen, where 1 candle (or candela) is equal to 1 lumen. The wavelengthof light is measured in terms of nanometer (nm). One nanometer is one-billionth of a meter (10-9). For example, the eye discriminatesbetween different wavelengths in the range of 380 and 780nm by the sensation of color.
112 Environmental Factors
Ch04.qxd 11/1/03 4:19 PM Page 112

In our daily environment, the amount of illumination (also called illu-minance) that falls on a surface (e.g., desk) depends on the energy of thelight source, its distance from the surface, and the angle of the surface tothe light source. Most light falls on a surface perpendicular to the light.Illumination is described in terms of the rate of flux (lumens) producedby the source and the surface area over which it spreads. One lumen persquare meter is defined as 1 lux and one lumen per square foot is definedas a foot-candle (FC). Illumination meters are usually calibrated in bothmeasures. One foot-candle is about 10.76 lux (there are 10.76 square feetin a square meter). Light may fall on a surface from multiple sources or,for example, as reflections from walls, ceilings, and other objects in theimmediate environment. These reflections can be considered individuallight sources, and the efficiency of each depends on the angle at which itreflects light on the surface. In summary, the amount of light falling on asurface depends on the:
1. Light source and its luminous intensity.
2. Distance between the light source and the surface.
3. Angle of the light source to the surface.
4. Number of light sources and reflecting sources in the immediateenvironment.
We do not see the light falling on a surface but we see the light reflectedfrom a surface. Luminance is a measure of the light reflected from thesurface and is associated with the subjective sensation of brightness. Keepin mind that, depending on their surface characteristics, different bodiesabsorb and reflect different amounts and qualities of light. Luminance isexpressed in terms of candela per meter squared (cd/m2).
The subjective sensation of brightness (that is, the luminance qualitiesof an object) is perceived after the light has stimulated the retinal cells of the eye and the information passed on to the optic cortex in the brain.Then, the person reports the intensity of the object’s brightness. There-fore, the intensity is determined by the luminance of the object, the amountof light passing through the eyes and to the brain, and the subjective expe-riences of the observer. In turn, the subjective experiences depend on theobserver’s past experiences and the brightness of other bodies in the visualfield. This process in illustrated in Figure 4-1. This section discusses how
Environmental Factors 113
Ch04.qxd 11/1/03 4:19 PM Page 113
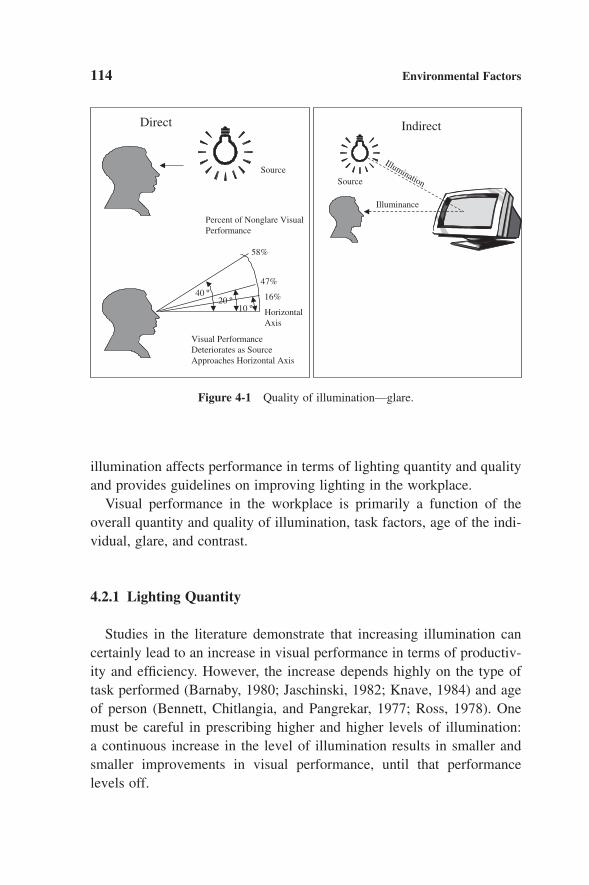
illumination affects performance in terms of lighting quantity and qualityand provides guidelines on improving lighting in the workplace.
Visual performance in the workplace is primarily a function of theoverall quantity and quality of illumination, task factors, age of the indi-vidual, glare, and contrast.
4.2.1 Lighting Quantity
Studies in the literature demonstrate that increasing illumination cancertainly lead to an increase in visual performance in terms of productiv-ity and efficiency. However, the increase depends highly on the type oftask performed (Barnaby, 1980; Jaschinski, 1982; Knave, 1984) and ageof person (Bennett, Chitlangia, and Pangrekar, 1977; Ross, 1978). Onemust be careful in prescribing higher and higher levels of illumination: a continuous increase in the level of illumination results in smaller andsmaller improvements in visual performance, until that performance levels off.
114 Environmental Factors
Direct Indirect
10 º20 º
40 º47%
16%
58%
Percent of Nonglare Visual Performance
Horizontal Axis
Visual Performance Deteriorates as Source Approaches Horizontal Axis
SourceSource
Illumination
Illuminance
Figure 4-1 Quality of illumination—glare.
Ch04.qxd 11/1/03 4:19 PM Page 114

4.2.2 Task Factors
The level of illumination needed generally depends on the task per-formed. The more visually intense the task (i.e., smaller details or lowercontrast), the higher is the illumination level required, up to a maximum,where performance levels off no matter how much more the illuminationis increased. The point at which this leveling off occurs is different for different tasks. Another approach to enhance visual performance isthrough changing the features of the task; for example, increasing the sizeof the object seen or the contrast between the object and its background(discussed in Chapter 2). The visual tasks that people perform can varyin difficulty from simple ones, such as finding a car in a parking lot atnight, to the highly demanding, such as calibrating an instrument. Withinthis wide range of task difficulties are wide ranges of illumination levelsthat can help increase performance. For example, Table 4-1 presents
Environmental Factors 115
TABLE 4-1
Illumination Levels for Different Types of Activities
Activity Illumination Range (lux)
Public area navigation 20–50
Occasional visual tasks 100–200
Visual tasks with large objects and high contrast, reading 200–500printed material
Reading poorly printed material with medium contrast or 500–1000small objects
Reading very poorly printed material with low contrast and 1000–2000very small objects for a short period
Reading very poorly printed material with low contrast and 2000–5000very small objects for a long period
Difficult visual tasks such as inspection or fine assembly 5000–10,000
Difficult visual tasks with very low contrast and very small 10,000–20,000objects
Note: To obtain the values in foot-candles, simply divide the values in lux by 10.76;for example 20 lux = 1.86 or about 2 foot-candles.
Ch04.qxd 11/1/03 4:19 PM Page 115
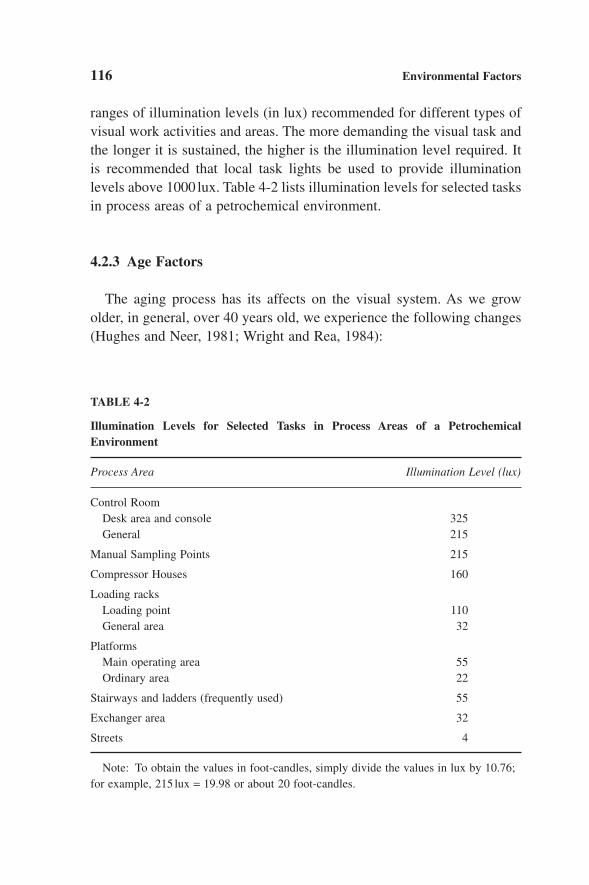
ranges of illumination levels (in lux) recommended for different types ofvisual work activities and areas. The more demanding the visual task andthe longer it is sustained, the higher is the illumination level required. Itis recommended that local task lights be used to provide illuminationlevels above 1000 lux. Table 4-2 lists illumination levels for selected tasksin process areas of a petrochemical environment.
4.2.3 Age Factors
The aging process has its affects on the visual system. As we growolder, in general, over 40 years old, we experience the following changes(Hughes and Neer, 1981; Wright and Rea, 1984):
116 Environmental Factors
TABLE 4-2
Illumination Levels for Selected Tasks in Process Areas of a Petrochemical Environment
Process Area Illumination Level (lux)
Control RoomDesk area and console 325General 215
Manual Sampling Points 215
Compressor Houses 160
Loading racksLoading point 110General area 32
PlatformsMain operating area 55Ordinary area 22
Stairways and ladders (frequently used) 55
Exchanger area 32
Streets 4
Note: To obtain the values in foot-candles, simply divide the values in lux by 10.76;for example, 215 lux = 19.98 or about 20 foot-candles.
Ch04.qxd 11/1/03 4:19 PM Page 116

• The lens of the eye atrophies and hardens, decreasing its ability toconform to the shape necessary for quick and efficient focus onobjects at different distances from the eyes. These changes are alsothe contributors to the improvement of the far vision (farsighted) andthe deterioration of the near vision (nearsighted).
• The muscles controlling the diameter of the pupil also atrophy, reducing the size of the pupil and decreasing the range and speed ofadjusting and adapting quickly and efficiently to different levels of illumination.
• A lower level of illumination reaching the retina leads to a reductionin the level and rate of dark adaptation.
• As the lens hardens, it yellows, leading older people to make errorsin sorting or matching colors in the blue-green and red regions.
• The changes in both the lens and pupil flexibility and efficiency leadto a decrease in visual acuity; the ability to see fine details.
These changes should encourage us to account for the elderly populationin the design of lighting to ensure visual comfort and efficient visual per-formance. For example, we should provide:
• More light for elderly people. This can be achieved through provid-ing adjustable personal light.
• Higher contrast. For example, for older people to see as well aspeople 20–35 years old (baseline), the following multiplicationfactors are needed to ensure higher contrast and maximize visual per-formance (Blackwell and Blackwell, 1968; Grandjean, 1988):40 years old, 1.17.50 years old, 1.58.65 years old, 2.66.
4.2.4 Lighting Quality
A number of factors have a direct effect on task visual performance andsubjective impressions of people. These are the lighting color, glare, andillumination ratio. Each factor is discussed briefly next.
Environmental Factors 117
Ch04.qxd 11/1/03 4:19 PM Page 117

4.2.4.1 Lighting Color
The objects in the visual field and the various types of lamps we inter-act with daily differ in color. In terms of lighting, color is also referred toas characteristic spectral distribution. The color of an object is deter-mined by the:
• Wavelengths of visible light that it absorbs and reflects. For example,a red object absorbs most colors in the incident light except red. Incident light is the light falling or striking on something.
• Color of the incident light. Two properties of the incident light deter-mine the resulting color of the object: the color rendering index (CRI)and the color “temperature” of the light.
The color rendering index was developed to quantify the accuracy withwhich the light source renders (reproduces) the natural colors in an object.The index varies from 0 to 100. As the CRI increases, color judgment errorstend to decrease. Sources with CRIs below 60 should be avoided whenaccurate color judgment is important (Collins and Worthey, 1985; Wotton,1986). However, CRIs greater than 80 indicate good color rendering.
Color temperature refers to the numerical assessment of a lamp’s color.The numerical assessment is based on a comparative color appearance ofglowing of light sources known as blackbodies. This is referred to as colortemperature, expressed in Kelvins (K). For example, color temperaturesup to 3000K are “warm” and make reds appear more vibrant. Color tem-peratures between 3000 and 4000K enhance most colors equally. Colortemperatures greater than 4000K enhance greens and blues. Table 4-3 provides CRI, color temperature, and life values for various types ofcommon lamps.
4.2.4.2 Glare
Glare occurs whenever one part of the field of vision is brighter thanthe level to which the eye has become adapted, causing decrease in visualperformance, annoyance, and discomfort. Glare can be characterized asdirect or indirect (refer to Figure 4-1). Direct glare is caused when thelight source appears directly in the field of view (discussed in Chapter 2),such as a lightbulb beside a hard to read instrument, the sun during the
118 Environmental Factors
Ch04.qxd 11/1/03 4:19 PM Page 118

day, or car headlights, especially high beam, at night. Indirect glare, alsoreferred to as reflected or specular glare, is caused by bright reflectionsfrom polished or glossy surfaces, such as screens of visual display termi-nals (VDTs), glossy paper, or white walls. In addition, glare is commonlyclassified into disability and discomfort glare.
Disability glare occurs when there is direct interference with visibilityand visual performance and often is accompanied by discomfort. Dis-comfort glare produces discomfort, annoyance, irritation, or distractionbut does not necessarily affect visibility or visual performance. The dis-tinction between the terms disability and discomfort is often unclear. The same lighting conditions can produce disability and discomfort glaresimultaneously.
Environmental Factors 119
TABLE 4-3
Most Common Lamp Types and Their Color Rendering Index (CRI), ColorTemperature (K), and Life in Hours
Color Rendering Color Lamp Type Index (CRI) Temperature (K) Life (hr)
Incandescent filament 100 2600–3000 1000–2000lamp
Cool white deluxe 89 4200 10,000–20,000fluorescent
High-pressure sodium 22–75 1600 10,000–15,000
Warm white deluxe 73 2900 10,000–20,000fluorescent
Metal halide 65–80 3300–5700 6000–20,000
Cool white fluorescent 66 4200 10,000–20,000
Warm white fluorescent 52 3000 10,000–20,000
Low-pressure sodium 40 1600 16,000
White fluorescent 60 3500 10,000–20,000
Tungsten halogen lamp 100 3000–3400 100–2000
Mercury lamp 15–55 55–60 12,000–24,000
Sunlight at sunrise — 1800 —
Sunlight at noon — 5000 —
Ch04.qxd 11/1/03 4:19 PM Page 119

Reducing glare is an important ergonomic consideration when designing workplaces. The guidelines presented in Table 4-4 should beconsidered.
4.2.4.3 Luminance Ratio
The ratio of the brightness (luminance) of the object of interest to theluminance of the surrounding visual field is termed the luminance ratio.Our eyes adapt to the luminance of the immediate visual field. The sur-roundings can have different distribution of luminance and, therefore,create high and low luminance ratios, which can cause transient adapta-tion problems. Transient adaptation occurs when the visual system movesfrom a bright to a dark area or vice versa (e.g., entering a dark movietheater on a bright sunny day or coming back outside after the movie).The greater the difference in luminance level (ratio of change), the greaterthe problem of transient adaptation, which can affect visibility, visualcomfort, and performance. An example of large differences in luminancelevels is found in the control room. The VDT screen has low luminance
120 Environmental Factors
TABLE 4-4
Reducing and Controlling Glare
Reduce or Control Direct Glare Reduce or Control Indirect Glare
Light source should not be directly in Position the light source or work area sothe field of vision or line of sight reflected light is not in the direction in
which the person normally needs to look to achieve maximum visibility
Use shades, hoods, or glare shields to Avoid using reflective colors and materials,reduce the brightness (luminance) such as bright metal, glass, glossy paperof the light
Use several low-intensity lamps in Use surfaces that diffuse light, such as texturedplace of few high-intensity lamps finishes, nonglossy surfaces, flat paint
When using fluorescent tubes, they Provide several low-intensity lamps in placeshould be at right angles to the of few high-intensity lamps and useline of sight indirect lighting
Use indirect lighting The brightness of the lamps (luminaires)should be kept as low as feasible
Ch04.qxd 11/1/03 4:19 PM Page 120
level as compared with background windows but about the same lumi-nance as a background wall. So, it is best to mount the VDT against thewall rather than against the window.
Contrast (or relative luminance) is defined by specifying the ratio of thetwo luminances and is calculated using the following formula:
C = (Lt - Lb)/Lb
where C = contrast, Lt = target luminance, Lb = background luminance.The following guidelines are widely accepted:
• The distribution of luminance on the major surfaces in the field ofview should be uniform with the working visual field brightness—brightest in the middle and darker toward the edges.
• The luminance ratio (brightness : contrast) between the middle of thevisual field and the immediate surroundings should not exceed 1 :3,where 1 is the task or object viewed (middle of the visual field) and3 is the immediate surroundings. The ratio between the middle of thevisual field and remote areas should not exceed 10 :1.
• The maximum luminance ratio within an office-like setting (includescontrol room) should not exceed 40 :1.
Reducing high luminance ratios can be accomplished by eliminatingbright walls, reflective and glossy surfaces, and dark or black furniture,machines, or filing cabinets. For example, Grandjean (1988) recommendsthe following reflectance for an office environment:
Ceiling, 80–90%.
Walls, 40–60%.
Furniture, 25–45%.
Machines and equipment, 30–50%.
Floor, 20–40%.
4.3 TEMPERATURE
The human body’s thermal regulation system tries to maintain a rela-tively stable internal (core) temperature of between 36.1 and 37.2°C (97
Environmental Factors 121
Ch04.qxd 11/1/03 4:19 PM Page 121

and 99°F). The core temperature must stay within a narrow range toprevent serious damage to health and performance. When physical workis performed, additional body heat is generated. If we add relatively highhumidity to the ambient temperature, the resulting condition can lead tofatigue and potential health risks.
The human body maintains heat balance by increasing blood circula-tion to the skin; therefore, we sweat on hot days. When it is cold, the bodyreduces the blood circulation to the skin and we shiver to keep the extrem-ities warm. The body generates heat through metabolism and physicalwork. To maintain the internal heat balance, the body exchanges heat (gainor loss) with the environment in four ways:
1. Convection. This process depends on the difference between the airand skin temperatures. If the air temperature is hotter than the skin,then the skin absorbs heat from the air, which becomes heat gain tothe body. If the air temperature is cooler than the skin, then the bodyloses heat.
2. Conduction. This process relates to the difference between the tem-perature of the skin and the surface contacted directly. For example,touching a hot stove, the skin gains heat and may burn.
3. Evaporation. This process depends on the difference between thewater vapor pressure of the skin and water vapor in the environment(or relative humidity).
4. Radiation. This process refers to the difference between the tem-perature of the skin and surfaces in the environment. For example,standing in sunlight, we receive radiation from the sun.
This section discusses how temperature affects performance and health.It also looks into the comfort and discomfort zones and, finally, discussesthe tools used to measure energy demands and how to reduce heat stress.Excellent information on this subject can be found in the literature (ISO,1994, 1995; Parson, 1995).
4.3.1 Effects of Heat on Performance
Many studies over the last five decades investigated the effects ofthermal conditions (heat) on performance of cognitive and physical tasks.
122 Environmental Factors
Ch04.qxd 11/1/03 4:19 PM Page 122
No firm conclusions can be drawn. For example, while many studies haveshown some performance decrement, others demonstrated no differencesor even improvements in performance (Kobrick and Fine, 1983). Thereasons may be related to the following interacting factors:
• Most studies occur in a laboratory environment.
• Subjects are mainly young healthy men.
• Different techniques and exposure conditions are used.
• Wide differences among the tasks performed.
• Subjects have different skill levels.
• Individual differences (biologically and physiologically) not con-trolled.
These reasons create difficulty generalizing the results to the generalworking population. However, despite the differences, some reasonablegeneralized conclusions can be used in the work environment. These aresummarized next. A good review of task performance in heat is providedin Ramsey (1995).
4.3.1.1 Cognitive Tasks
The effect of heat on performing cognitive (higher mental function)activities depends on the type of tasks at hand. For example, simple cognitive tasks, such as visual or auditory reaction time, mathematicalproblem solving, and short-term memory tasks, respond differently to heatexposure than complex cognitive tasks that process control operators typically do, such as monitoring DCS screens for out-of-limit conditions(Ramsey and Kwon, 1988). In simple cognitive tasks, heat does not affectperformance negatively. In fact, an improvement in performance wasobtained when these simple cognitive tasks were performed during a briefexposure to heat. On the other hand, in complex cognitive tasks, heat negatively affects performance, starting between 30 and 33°C or 86 and91.4°F (Ramsey and Kwon, 1988).
4.3.1.2 Physical Activities
Physical activities, especially heavy activities, performed in hot, humidconditions may cause fatigue and exhaustion much sooner than in more
Environmental Factors 123
Ch04.qxd 11/1/03 4:19 PM Page 123

moderate conditions. For example, sitting at rest, men can tolerate 38°C(100°F) for 3 or more hours. However, the tolerance is reduced to 30minutes (Lind, 1963) if working moderately at 4.67 kilocalories perminute (kcal/min). Kilocalories is the heat required to raise the tempera-ture of 1kg water from 15 to 16°C. In another study by Wyndham (1974)on men shoveling rocks, the productivity level was maintained until thetemperature exceeded 28°C (82.4°F). At about 30°C (84°F), productivitydropped to 90% and to 50% when the temperature reached 34°C (93°F).It is worth adding here that an increase in temperature can affect people’ssafe behavior. A large study observing the behavior of over 17,000 peopleat work found that the incidence of unsafe behavior increased as the climatic conditions fell outside the range 17–23°C or 63–73°F (Ramseyet al., 1983).
4.3.2 Effects of Cold on Performance
As an increase in core body temperature can lead to heat stress (hyper-thermia), so a small decrease in core body temperature can produce coldstress (hypothermia). However, the human body is better able to tolerateincreased heat than compensate for heat loss. Examples of jobs wherepeople work in a cold environment are oil and gas extraction, electric linerepair, gas line repair, sanitation, trucking, warehousing (especially coldstorage), and military (Sinks et al., 1987). Similar to the effects of heaton performance, the studies of the effects of cold on performing differentfunctions are not well understood and therefore lead to no firm conclu-sions. The reasons may be related to the following interacting factors:
• Differences in air flow, temperature, and humidity.
• Differences in the duration of exposure.
• The difference in exposure level to the different parts of the body.
• Individual differences (biologically and physiologically).
In spite of the interacting factors and differences in the results of thestudies, some generalized conclusions can be used from the literature.These conclusions are summarized next.
124 Environmental Factors
Ch04.qxd 11/1/03 4:19 PM Page 124
4.3.2.1 Cognitive Tasks
The effect of cold on cognitive tasks has been detected in studies onreaction time and complex mental activities. However, the effect dependson the severity of the temperature, task performed, and skill and experi-ence of subject with the task and with performing in the cold. The following is a summary of the results:
• Mental performance decreases when performing complex, demand-ing tasks requiring high levels of concentration and significant use ofthe short-term memory (Bowen, 1968; Enander, 1987, 1989).
• Cold does not affect the cognitive efficiency of well-motivated subjects (Baddeley et al., 1975).
• Cold acts as a distractor that interferes with some types of mental performance tasks (Enander, 1989).
4.3.2.2 Physical Activities
Cold significantly affects physical work. The reduction in limb or wholebody temperature reduces physical capacity. For example, reduced limbtemperature (i.e., arm and hand) affects motor ability, causes a loss ofcutaneous (touch) sensitivity, affects the limb’s muscular control, andreduces dexterity, muscular strength, and endurance abilities (Lockhart,1968; Morton and Provins, 1960; Enander, 1989). The reduction in wholebody temperature reduces the rate of metabolism within the muscles of the extremities and, in turn, the performance due to shivering. Indeed,Lockhart (1968) suggested that part of the reason performance decreasesin tasks involving dexterity activities may be due to shivering.
In practice, gloves and heavy thermal boots and clothing can protectoperators in cold weather. In severely cold temperatures, the clothes andgloves can affect the ability of operators to perform tasks that requirestrength or dexterity by limiting body motion.
4.3.3 Effects of Heat on Health
4.3.3.1 Hot Environment
Exposure to high levels of heat can affect a person’s health in two ways.First, increased temperature on the skin can lead to tissue damage from
Environmental Factors 125
Ch04.qxd 11/1/03 4:19 PM Page 125

burning (e.g., over 45°C or 113°F). This situation is usually manageablebecause it is observable and the people react to it by distancing themselvesfrom the heat. The second way heat can affect health is more serious anddangerous. It deals with increased core body temperature to about 42°C(108°F), where heat stroke (hyperthermia) occurs. This rise in core bodytemperature results in an increase in metabolism, which in turn produceheat that needs to be dissipated. If the cycle is allowed to continue, deathcan ensue. This cycle is referred to as Q10 effect (for every 1°C increasein deep body temperature, metabolism rises 10%). There are two pos-sible reasons why the heat generated does not leave the body: The bodyis exposed to heat and humidity that reduces the sweat evaporation; andsome protective clothing acts as insulation.
The continuous exposure to hot environmental conditions and the heatstress it generates can lead to several forms of heat illnesses, with heatstroke being the most serious:
• Heat rash, also known as prickly heat—where the skin erupts withred pimples with intense itching and tingling caused by inflammationaround the sweat gland ducts.
• Heat cramps—spasms of the muscles result from loss of salt.
• Heat exhaustion—results from dehydration, with a general feeling ofheadache, loss of performance through muscular weakness, dizziness,possible vomiting.
• Heat stroke—a significant and alarming increase in core body tem-perature and the failure of the body to loose the heat. The generalsymptoms are headache, dizziness, vomiting, shortness of breath,strange behavior, and eventually loss of consciousness and death.
Heat stroke is caused mainly by strenuous physical work or exercise inhot conditions, duration of exposure to extreme heat sources, and highlymotivated and competitive individuals (i.e., sports).
In addition, the exposure and tolerance to heat stress is a function of individual differences (Burse, 1979; Strydom, 1971; Sanders andMcCormick, 1993):
• Gender. Generally, women are less tolerant to hot environmental con-ditions and, therefore, more vulnerable to heat illnesses than men.
126 Environmental Factors
Ch04.qxd 11/1/03 4:19 PM Page 126

• Age. Older people are more vulnerable to heat illnesses than youngerpeople.
• Physical fitness. The more the person is physically fit, the longer isthe tolerance to hot environmental conditions, up to a point.
• Body fat. Body fat acts as an insulating layer blocking the release ofheat. It also acts as an extra weight to move around, increasing thelevel of physical activity leading to higher body heat and energyexpenditure.
• Alcohol. Alcohol affects peripheral nervous functioning and producesdehydration.
4.3.3.2 Cold Environment
Exposure to cold can lead to a drop in core or deep body temperature,likely to produce a risk to health. When the core body temperature fallsbelow 35°C (95°F), the state is referred to as hypothermia or cold stress.With core body temperature below 35°C (95°F), the risk of disorientation,hallucination, and unconsciousness increases, leading to cardiac arrhyth-mia as the core temperature drops even further and subsequent death fromcardiac arrest.
As the body is exposed to cold and the core body temperature starts todrop, the body automatically and rapidly uses its regulation system andproduces two physiological reactions to cold stress:
• Shivering—Shivering is characterized by increased muscular activi-ties and contractions to produce heat rapidly; the colder it is and thefaster the core body temperature drops, the faster and more intenseshivering becomes, leading to exhaustion, until core body tempera-ture reaches 30–33°C (86–91°F), where shivering gradually isreplaced by muscular rigidity.
• Constriction of blood vessels, also known as vasoconstriction—Vasoconstriction is characterized by an increase in the constriction ofthe peripheral (skin and extremities) blood vessels and an eventualshut off of blood flow to these regions as the core body temperaturedrops further, leading to an increase in blood pressure. This process
Environmental Factors 127
Ch04.qxd 11/1/03 4:19 PM Page 127

serves two main purposes: First, the warm blood is diverted from thecold skin, such as hands, fingers, and face, and distributed to the inter-nal organs, so less body heat is lost. Second, the insulating capacityof the skin is increased up to six times by cutting off the flow of blood(Sanders and McCormick, 1993). As the constriction of blood vesselsincreases and blood flow is shut off, the temperature of all exposedareas (hands, fingers, toes, face, nose) rapidly approaches the air tem-perature, causing freezing of body tissues (cold injury) or frostbite.
In addition, the exposure and tolerance to cold exposure is a function ofindividual differences (Timbal, Loncle, and Boutelier, 1976):
• Body composition—amount of subcutaneous (under the skin) fataround the body, which acts as good insulating material. This is espe-cially important when blood vessels constrict in response to the coldand blood is diverted away from the body surface toward the inter-nal organs for survival.
• Individual size and weight—since the degree of heat loss is propor-tional to the body’s surface area, the bigger an individual is in termsof height and weight, the greater is the amount of heat that can begenerated by shivering. Note that the heat generated through shiver-ing depends on the mass of active muscular tissues in the body.
• Physical fitness—the better the physical fitness, the more efficient theproduction of heat through the shivering process and the longer it ismaintained with delayed physical exhaustion.
4.3.4 Comfort and Discomfort Zones
Comfort in the comfort zone is perceived when the body’s physiolog-ical responses to the environmental temperature and humidity are withinthe normal regulatory responses. However, when those physiologicalresponses exceed the normal regulatory responses, individuals perceivediscomfort. People’s perception of comfort, in the comfort zone, is influ-enced by the following environmental factors:
Air temperature—comfort zone, 20–25°C (68–78°F).
Relative humidity—comfort zone, 30–70%.
128 Environmental Factors
Ch04.qxd 11/1/03 4:19 PM Page 128

Air velocity—comfort zone, 0.1–0.3m/sec (20–60 ft/sec).Other factors that contribute to the perception of comfort are
• Workload. The heavier the work load, the lower the upper limits ofthe temperature and humidity must be.
• Radiant heat. Examples are furnaces, sun, ovens, radiant-heat lamps.
• Clothing. The type and amount of clothing worn and its insulationvalue determine how much the upper limits of temperature andhumidity must be lowered.
• Age. Elderly people prefer higher temperatures than younger people,since the metabolism rate decreases slightly with age.
• Gender. Women have a lower metabolic rate than men and, in general,might prefer a warmer environment.
• Color. Color of the surroundings can influence an individual’s thermalcomfort. This influence is psychological in nature; for example, whenred predominates, individuals feel warmer. The color blue elicits theopposite response.
4.3.5 Work Tolerance in a Hot Environment
A key factor to examine and quantify a warm working environment isthe energy that the human body consumes to perform the job. Throughthe metabolism process, the body uses oxygen to convert food and bodyfat into mechanical energy and heat. In turn, the body consumes energyto stay alive. The total energy consumption (measured in kilocalories,kcal, per unit time) is composed of three components:
1. Basic metabolism—the number of kcal used during sleeping, breath-ing, and the like to keep the organs alive.
2. Leisure calories—the number of kcal used when performing activi-ties such as reading or playing a musical instrument.
3. Work calories—the number of kcal used when performing differ-ent physical movements to accomplish a task, such as typing a
Environmental Factors 129
Ch04.qxd 11/1/03 4:19 PM Page 129
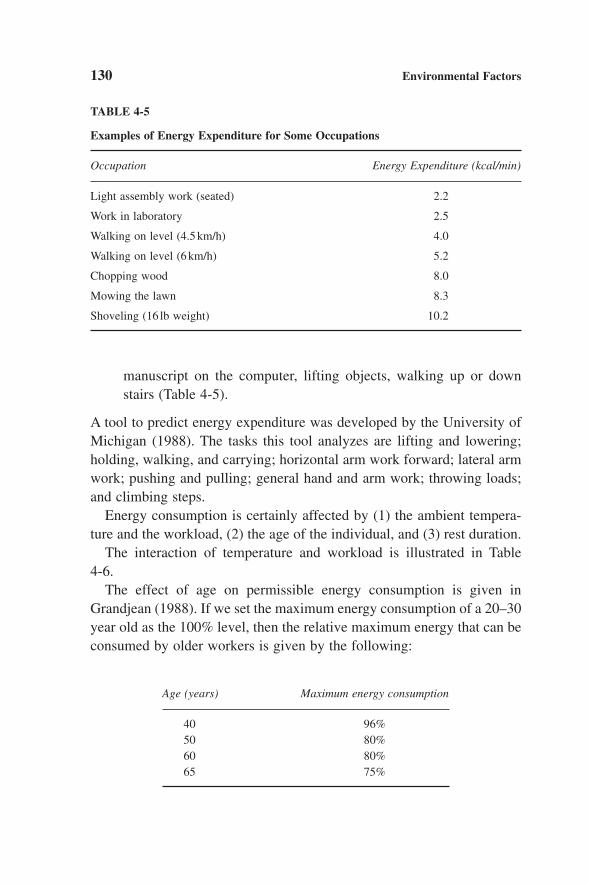
manuscript on the computer, lifting objects, walking up or downstairs (Table 4-5).
A tool to predict energy expenditure was developed by the University ofMichigan (1988). The tasks this tool analyzes are lifting and lowering;holding, walking, and carrying; horizontal arm work forward; lateral armwork; pushing and pulling; general hand and arm work; throwing loads;and climbing steps.
Energy consumption is certainly affected by (1) the ambient tempera-ture and the workload, (2) the age of the individual, and (3) rest duration.
The interaction of temperature and workload is illustrated in Table 4-6.
The effect of age on permissible energy consumption is given in Grandjean (1988). If we set the maximum energy consumption of a 20–30year old as the 100% level, then the relative maximum energy that can beconsumed by older workers is given by the following:
130 Environmental Factors
TABLE 4-5
Examples of Energy Expenditure for Some Occupations
Occupation Energy Expenditure (kcal/min)
Light assembly work (seated) 2.2
Work in laboratory 2.5
Walking on level (4.5km/h) 4.0
Walking on level (6km/h) 5.2
Chopping wood 8.0
Mowing the lawn 8.3
Shoveling (16 lb weight) 10.2
Age (years) Maximum energy consumption
40 96%50 80%60 80%65 75%
Ch04.qxd 11/1/03 4:19 PM Page 130

The rest duration is determined in terms of the energy consumed toperform a particular task. For example, if we take an individual who worksin a warehouse, lifts and stacks bags of chemical powder over the day,and consumes energy at an estimated rate of 7.5kcal/min, then using thefollowing equation we can determine the rest time needed to be able tocontinue the job without fatigue:
Rest time (as % of work time) = (kcal/min - 1) ¥ 100% = 87.5%
The results suggest that, for 10 minutes (600sec) of steady work, he orshe may need about 525sec (about 9min) rest.
4.3.6 Recommendations to Improve Working Conditions
The following recommendations for improving both working condi-tions in hot and cold environments are summarized from several sourcesin the literature (Grandjean, 1988; Sanders and McCormick, 1993;Eastman Kodak, 1983; Konz, 1990).
4.3.6.1 Guidelines for Heat Conditions
The recommended guidelines to achieve a level of comfort working in hot conditions follow a systematic approach by making changes to
Environmental Factors 131
TABLE 4-6
Maximum Working Temperature by Workload
Energy Consumption, Maximum Effectivekcal/min Type of Work Temperature, °C (°F)
6.7 Heavy manual work (walking 26–28°C (78.8–82.4°F)with a 66-lb load (30kg)
4.2 Moderate heavy work at 29–31°C (84.2–87.8°F)2.5miles/hr (4km/hr)
1.7 Light sedentary work 33–35°C (91.4–95°F)
Ch04.qxd 11/1/03 4:19 PM Page 131
the ambient conditions, the task, the personal protective equipment, andfinally the individual:
• A worker, new to a hot environment, should be acclimatized to heatby initially spending only 50% of the working time in the heat andincreasing this by 10% each day.
• Train workers to recognize signs of heat illness, and provide andlocate drinking water close to workers and the task performed.
• The greater is the heat load and the greater the physical effort per-formed under heat stress, the longer and more frequent should be therest or cooling periods.
• If the limit of heat tolerance is being exceeded, the working day mustbe shortened.
• Where the radiant heat is excessive (i.e., blast furnaces), the workermust be protected by special goggles, screens, and special protectiveclothing against the risk of burning the eyes and hands. Special protective clothing includes such equipment as ice vests and vortexcooling suits.
• Where radiant heat is excessive (sun heat in the middle of July in tra-ditionally warm states and countries), provide cooling facilities (coolrooms) for individuals to use for their work breaks or when needed.
• Match the workload to ambient temperature and relative humidity,where possible.
• Increase the flow of air in the workplace, where possible, using, forexample, fixed or portable fans.
4.3.6.2 Guidelines for Cold Conditions
The recommended guidelines to achieve a level of comfort working incold conditions are
• Design to ensure that the work is performed in a protected environ-ment (e.g., provide windproofing around a task normally performedoutside).
132 Environmental Factors
Ch04.qxd 11/1/03 4:19 PM Page 132

• Block the source of air flow with a shield.
• Change the work area location, if possible, away from the air flowsource.
• Increase the ambient temperature where possible. If not, provideadjustable auxiliary heaters to accommodate individual differences.For continuously moving and changing locations, this may not bepossible.
• Recommend and provide proper warm clothing to extend the toler-ance to cold conditions.
• In extremely cold environments, if the limit of cold tolerance is beingexceeded, the working periods must be shortened.
• Provide warming facilities (warm rooms) for individuals to use fortheir work breaks or when needed.
• Use proper gloves to protect hands and fingers. When finger dexter-ity is required, use partial gloves that cover the hands but expose thefingers.
• Train people to recognize signs of cold stress.
4.4 NOISE
Noise is an aspect of our work and daily living environment producedby equipment, machines, and tools. Noise is commonly referred to asunwanted sound. Burrows (1960) clearly defines noise as “an auditorystimuli bearing no informational relationship to the presence or comple-tion of the immediate task.” However, it depends on the individual’s subjective reaction whether to consider a sound source as noise or not. In addition, sound labeled noise on one occasion may not be noise in a different occasion or environment.
Sound is defined in terms of two parameters, frequency and intensity,because a sound is a vibration stimulus experienced through the air. Frequency is an acoustic energy reflecting the number of vibrations per
Environmental Factors 133
Ch04.qxd 11/1/03 4:19 PM Page 133

second, expressed in Hertz (Hz). One Hertz is equal to 1 cycle per second.The range of frequency between 2 and 20,000Hz defines the frequencylimits of the ear. People subjectively perceive frequency as pitch. Inten-sity is related to the sound pressure variation caused by the sound source.People subjectively perceive intensity as loudness. Intensity is specifiedin terms of sound pressure level (SPL) and expressed in the logarithmicunits of decibels (dBA). Being logarithmic, a 10-fold increase in power(intensity) occurs with each 10dBA increase. For example, 60dBA on thedecibel scale is not twice as intense as 30dBA but 1000 times as intenseas 30dBA. Table 4-7 presents some examples of sources of noise. Thissection discusses how noise affects performance and health. It also pro-vides guidelines on how to reduce and control noise in living and workingenvironments.
4.4.1 Effects of Noise on Performance
The effects of noise on performance have been studied for many yearswith mixed results. While some studies showed performance decrements,others showed no effects or even an improvement in performance (Kryter,1970; Gawron, 1982). Similar to the studies on the effects of temperature
134 Environmental Factors
TABLE 4-7
Examples of Sources of Noise
Sound dBA Level Sound Power Increase
Rock concert 30m from speakers 120 1,000,000,000,000 (1012)
Pneumatic hammer 100 10,000,000,000 (1010)
Average traffic 80 100,000,000 (108)
Vacuum cleaner (10 ft) 70 10,000,000 (107)
Conversational speech 60 1,000,000 (106)
Quiet office 40 10,000 (104)
Bedroom at night 30 1000 (103)
Normal breathing 10 10 (101)
Ch04.qxd 11/1/03 4:19 PM Page 134
on performance, the mixed results of noise effects are related to the following interacting factors:
• Most studies are in a laboratory environment.
• Different techniques used to produce noise (e.g., office noise to rocket noise) and different exposure conditions (i.e., definition ofquiet ranged from 0 to 90dBA).
• Wide differences among tasks, from reaction time and number checking all the way through to accuracy of shooting; because of thedifferent nature of difficulty, these tasks require relatively differentdemands on memory, cognitive, and motor capabilities of thosetested.
• Individual differences (biologically and physiologically) in the wayhumans respond to noise or a noise and task combination.
• Different techniques of experimental design used to test the effectsof noise.
Despite the mixed results, reasonable conclusions can be made about theeffects of noise on performance. These are summarized next. It is safe tosay at this point that noise has little or no effect on manual work, and thisis not discussed further.
4.4.1.1 Speech and Communication
Speech and communication depend highly on the listener’s ability toreceive and decode the sounds. This means that the listener must hear thesignal (speech or auditory display) and understand the message. There-fore, the speech and communication comprehension depends on the loud-ness of the voice as well as the level of background noise.
Hearing and understanding the signal may be masked (blocked) by a noisy environment. If the signal intensity remains constant and themasking intensity increases, then more masking occurs. The reverse isalso true. Similarly, as the frequency of the masker approaches that of thesignal, more masking occurs. From a practical side, it is important to knowthe intensity and frequency of both the signal and masker. For example,
Environmental Factors 135
Ch04.qxd 11/1/03 4:19 PM Page 135
if the intensity and frequency of an auditory display are much higher thanthose of the noise, then masking does not occur. Otherwise, performancereductions (not hearing and understanding) due to masking occurs andcorrective measures must be considered (this is discussed in detail in thesection on how to control noise).
4.4.1.2 Cognitive Performance
The relationship between noise and cognitive performance is similar to that between heat or cold and cognitive performance. The results areagain mixed. Even so, some reasonable conclusions can be made aboutthe effects of noise on cognitive performance for specific types of tasks:
• Generally speaking, noise clearly has an effect on overall perform-ance, especially when it reaches a level over 90dBA.
• Noise levels over 100dBA can affect monitoring performance overrelatively long duration (Jerison, 1959).
• Tasks with large short-term memory component (i.e., mathematicalcalculations) are affected by high noise levels (Poulton, 1976, 1977).The reasoning here is that we can not hear ourselves think in noise.
• Noise produces more errors in complex rather than simple tasks(Boggs and Simon, 1968).
• Tasks performed continuously without rest pauses between responsesare affected by noise (Davies and Jones, 1982).
• Tasks requiring high perceptual or information processing capacity(i.e., high mental demands, complexity, and considerable detail) areaffected by noise (Eschenbrenner, 1971).
• Noise does not reduce performance on simple routine tasks or motorperformance (i.e., manual work). Positive noise, in the eyes of thebeholder, such as music, may facilitate an improvement in perform-ance and satisfaction. The reasoning here is that music can aid inreducing boredom and fatigue associated with these tasks (Fox,1971).
136 Environmental Factors
Ch04.qxd 11/1/03 4:19 PM Page 136

4.4.1.3 Nuisance and Distraction
Noise is considered a nuisance (annoying or unpleasant) when it inter-feres with our ability to carry out an activity. Thus, the response is sub-jective. This subjective nature indicates that what is annoying to oneindividual may not be to another. Furthermore, what is a nuisance on oneoccasion may not be at another time. For example, people are not dis-turbed by the noise generated by their own activities. A few observationscan be made regarding this point:
• Loud, high-frequency noises are considered a nuisance or annoying.They contribute to performance decrements by creating a distractionand affecting concentration and effective communication.
• More familiar noises are perceived as less annoying (Grandjean,1988).
• Sound features that contribute to the different degrees of “noise perceived annoyance” are intensity, frequency, duration, and themeaning to the listener. For example, the annoyance level increasesas the intensity and frequency of sound increases, the longer itremains, the less meaningful it is to the listener (Kryter and Pearsons, 1966).
• Overhearing conversations is also considered, by most people,annoyance (Waller, 1969).
• Intermittent noise can reduce performance on mental tasks more thancontinuous noise.
4.4.2 Effects of Noise on Health
The most important and obvious effect of noise on health is hearingloss and deafness. Hearing loss and deafness can have two causes: conduction deafness and nerve deafness. Conduction deafness is causedby the inability of the sound waves to reach the inner ear and vibrate theeardrum adequately. Conditions that may lead to conduction deafness arewax in the ear canal and infection or scars in the middle ear or eardrum.Conduction deafness is not the product of a noisy environment and does
Environmental Factors 137
Ch04.qxd 11/1/03 4:19 PM Page 137

not result in complete hearing loss. Nerve deafness is caused by reducedsensitivity in the inner ear due to damage or degeneration of nerve cells.The hearing loss here is in the higher frequencies, whereas conductiondeafness is more even across frequencies.
Establishing a strong relationship between hearing loss and exposure toa specific noise is not easy. This is simply because during the normal agingprocess we are exposed to nonoccupational noises (vehicles, TV, vacuumcleaners, etc.) as well as occupational noises. The combined effects andthe cumulative nature of the process make it difficult to point to a specificcause. The degree to which hearing is affected depends on the type, inten-sity, frequency of noise, exposure duration and, individual sensitivity andsusceptibility. Two types of hearing loss are discussed here: aging, whichis a normal process, and noise-induced temporary and permanent hearingloss.
4.4.2.1 Aging Hearing Loss
As a result of the normal aging process, hearing loss can occur due tochanges in the structure of the auditory system. The change is more notice-able in men than in women. This hearing loss is also more noticeable atthe higher frequencies. The decline in hearing loss is not consistent in allindividuals simply because of individual biological and physiological differences and susceptibility. Taking a frequency of 3000Hz as standard,Grandjean (1988) reports the loss of hearing to be expected at various ages as
138 Environmental Factors
Age (years) Expected Hearing Loss (dBA)
50 1060 2570 35
4.4.2.2 Noise-Induced Hearing Loss
Noise-induced hearing loss or deafness can be related to continuous ornoncontinuous exposure to noise. This noise-induced deafness can be tem-
Ch04.qxd 11/1/03 4:19 PM Page 138
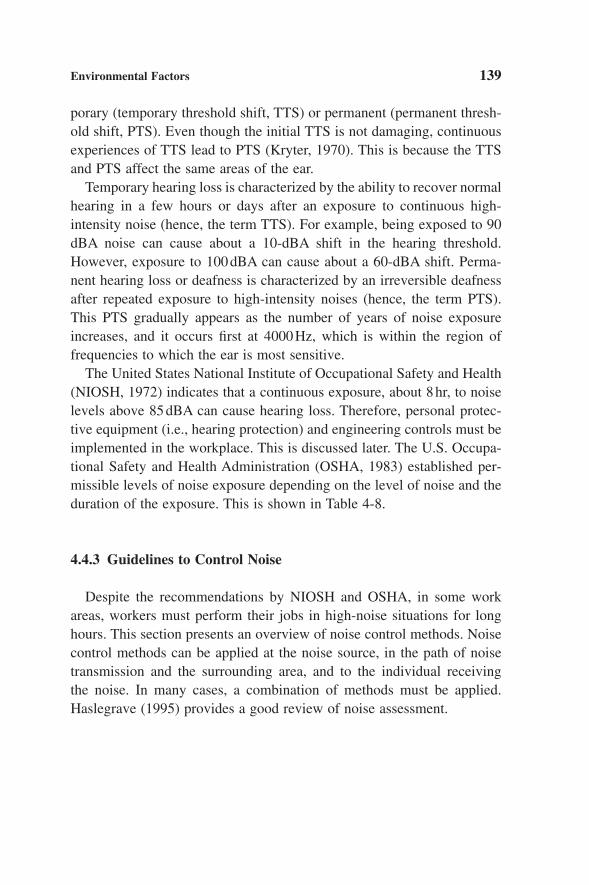
porary (temporary threshold shift, TTS) or permanent (permanent thresh-old shift, PTS). Even though the initial TTS is not damaging, continuousexperiences of TTS lead to PTS (Kryter, 1970). This is because the TTSand PTS affect the same areas of the ear.
Temporary hearing loss is characterized by the ability to recover normalhearing in a few hours or days after an exposure to continuous high-intensity noise (hence, the term TTS). For example, being exposed to 90dBA noise can cause about a 10-dBA shift in the hearing threshold.However, exposure to 100dBA can cause about a 60-dBA shift. Perma-nent hearing loss or deafness is characterized by an irreversible deafnessafter repeated exposure to high-intensity noises (hence, the term PTS).This PTS gradually appears as the number of years of noise exposureincreases, and it occurs first at 4000Hz, which is within the region of frequencies to which the ear is most sensitive.
The United States National Institute of Occupational Safety and Health(NIOSH, 1972) indicates that a continuous exposure, about 8hr, to noiselevels above 85dBA can cause hearing loss. Therefore, personal protec-tive equipment (i.e., hearing protection) and engineering controls must beimplemented in the workplace. This is discussed later. The U.S. Occupa-tional Safety and Health Administration (OSHA, 1983) established per-missible levels of noise exposure depending on the level of noise and theduration of the exposure. This is shown in Table 4-8.
4.4.3 Guidelines to Control Noise
Despite the recommendations by NIOSH and OSHA, in some workareas, workers must perform their jobs in high-noise situations for longhours. This section presents an overview of noise control methods. Noisecontrol methods can be applied at the noise source, in the path of noisetransmission and the surrounding area, and to the individual receiving the noise. In many cases, a combination of methods must be applied.Haslegrave (1995) provides a good review of noise assessment.
Environmental Factors 139
Ch04.qxd 11/1/03 4:19 PM Page 139
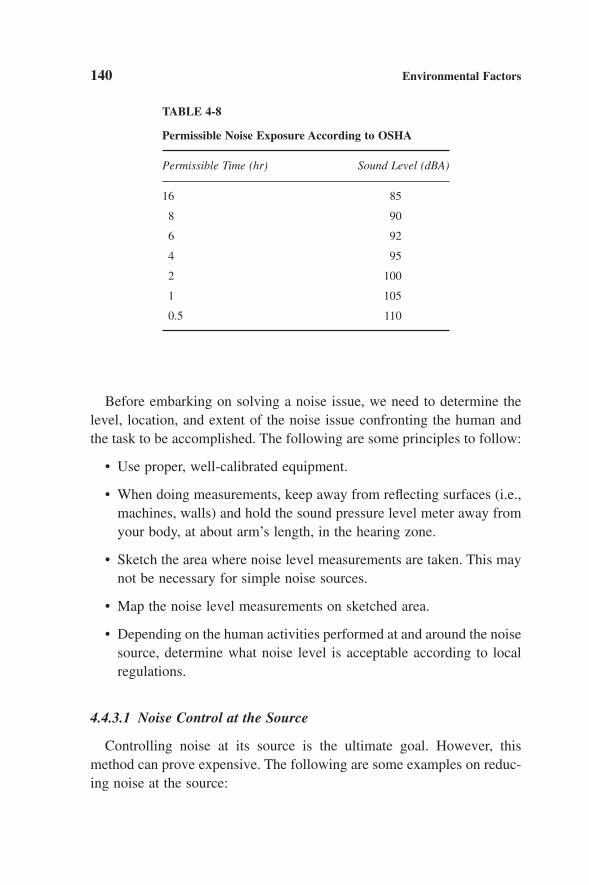
Before embarking on solving a noise issue, we need to determine thelevel, location, and extent of the noise issue confronting the human andthe task to be accomplished. The following are some principles to follow:
• Use proper, well-calibrated equipment.
• When doing measurements, keep away from reflecting surfaces (i.e.,machines, walls) and hold the sound pressure level meter away fromyour body, at about arm’s length, in the hearing zone.
• Sketch the area where noise level measurements are taken. This maynot be necessary for simple noise sources.
• Map the noise level measurements on sketched area.
• Depending on the human activities performed at and around the noisesource, determine what noise level is acceptable according to localregulations.
4.4.3.1 Noise Control at the Source
Controlling noise at its source is the ultimate goal. However, thismethod can prove expensive. The following are some examples on reduc-ing noise at the source:
140 Environmental Factors
TABLE 4-8
Permissible Noise Exposure According to OSHA
Permissible Time (hr) Sound Level (dBA)
16 85
8 90
6 92
4 95
2 100
1 105
0.5 110
Ch04.qxd 11/1/03 4:19 PM Page 140

• Enclose the source area with sound-absorbing material. This canreduce radiated noise by 20–30dBA. High-frequency noise can bebetter contained and absorbed by barriers than low-frequency noise;for example, barriers around the flare of an offshore platform, bafflesfor air intakes such as in furnaces, and mufflers such as on steamvents with high-volume air.
• Routinely maintain, lubricate, and align equipment to reduce vibra-tion and therefore noise levels.
• Choose and use tools and equipment that generate low-frequencynoise. This may not always be possible because such tools may notexist commercially and a special order may be costly.
4.4.3.2 Noise Control in the Path of Noise Transmission
This method can be used either in addition to or after all the possibili-ties of controlling noise at the source have been exhausted. Some of theapplied principles here are
• Place a barrier, such as a shield or wall, between the human and noisesource to deflect and absorb noise. Please note that the reduction oflow-frequency noise (below 1000Hz) is not possible, since it travelsover and around barriers.
• Cover walls, ceilings, and floors with sound-absorbing panels toreduce noise reflection back into the work area. It is worth noting thatthe overall noise reduction, using this technique, is rather limited;however, it does further reduce noise.
• Take advantage of distance from the source, since the level of noisereduces with the square of the distance traveled.
4.4.3.3 Noise Control at the Receiver
If the two preceding methods fail to reduce noise to a safe level, thenthis final method involves the use of personal hearing protection. Theapplied principles here are
• Make available and properly train individuals on the use of hearingprotection devices. These can include ear plugs, which can reduce
Environmental Factors 141
Ch04.qxd 11/1/03 4:19 PM Page 141

noise level by up to 30dBA and are suggested use for noise levels of85dBA and above; ear muffs, which can reduce noise level by about40–50dBA and are suggested use for noise levels over 100dBA; acombination of the use of ear plugs and muffs; and soundproofhelmets, which cover the head and ears.
• Provide instructions and train people on how to use hearing protection.
• Rotate jobs to reduce exposure time.
4.5 VIBRATION
Vibration is any regular or irregular movement of a body about its fixedposition. Regular vibration (such as experienced in machinery like pumps,compressors, or power saws) is known to have a predictable waveformthat repeats itself at regular intervals. Random vibration is irregular,unpredictable, and the most common type encountered in the real world;for example, vibration experienced in trucks, tractors, trains, and airplanes.
Vibration is characterized by its direction and amount (frequency andacceleration). The body can vibrate and move in one or more directions.The movement direction is described in terms of three orthogonal components: X, Y, and Z, where
X direction is back to chest.
Y direction is right side to left side.
Z direction is foot or buttocks to head.
For example, looking at Figure 4-2, if the person is standing or sitting onan up and down vibrating platform, the vibration is in the Z direction. Ifthe person is lying on his or her back, the vibration is in the X direction.
Frequency of movement expresses the speed of vibration. Frequency ismeasured in Hertz (Hz), where 1Hz = 1 cycle per second. For example,1 cycle is the body movement from its fixed reference point to its highestpoint, to its lowest point, back to its reference point. Therefore, the higherthe speed and the faster the body vibrates, the more cycles take place persecond.
142 Environmental Factors
Ch04.qxd 11/1/03 4:19 PM Page 142
Intensity of vibration is expressed in terms of the maximum amount(amplitude or displacement) the body moves from its fixed reference point,measured in inches or meters. Intensity can also be specified in terms ofacceleration. Acceleration can be expressed in terms of inch per secondsquared (in./s2) or meter per second squared (m/s2). Acceleration can alsobe expressed in terms of gravity (g) where 1g is the amount of accelera-tion needed to lift the body off the earth’s surface. The metric system defines1g as equal to 9.81m/s2. This section discusses how vibration affects per-formance and health. It also provides guidelines on how to reduce andcontrol vibration. Griffin (1990) provides a full review of the subject.
4.5.1 Effects of Vibration on Performance
The principal effects of vibration on performance are reduced motor(i.e., hand steadiness) and visual (i.e., eye fixation) control. No strong
Environmental Factors 143
X: Back to ChestY: Right Side to Left SideZ: Foot (or Buttocks) to Head
Z Z
Y
X
X
Z
Y
Figure 4-2 Direction of vibration relative to torso.
Ch04.qxd 11/1/03 4:19 PM Page 143

evidence exists to suggest vibration affects information processing, reac-tion time, pattern recognition, or any intellectual (cognitive) tasks.
4.5.1.1 Motor Control
Considerable research has consistently demonstrated the effects ofvibration on motor performance (Hornick, 1973; Levison, 1976; Lewisand Griffin, 1978, 1979a). A summary of the findings follows:
• Vibration has residual effects that may last up to half an hour afterexposure.
• At low vibration frequencies (less than about 15Hz), performancereduction is related to the amount of vibration experienced by thecontrolling limb.
• As the vibration intensity transmitted to the related limb increases,tracking performance decreases.
• Manual performance degradation depends primarily on the intensityof the vibration.
• Manual performance degradation occurs where the task demandsmovement in the axis in which the individual is being vibrated. Forexample, performing vertical tracking is affected more by the vibra-tion in the Z axis than the Y or X axis.
4.5.1.2 Visual Performance
Examples of the effects of vibration on visual performance are observedin work situations such as driving trucks or tractors or riding trains. Themost commonly reported problems associated with these situations areblurry images in the visual field and reduced visual acuity (ability to seefine details).This is probably due to the instability of the image on theretina. A summary review of the findings (Griffin, 1976; Meddick andGriffin, 1976; Barnes, Benson, and Prior, 1978; Griffin and Lewis, 1978;Lewis and Griffin, 1979b; Moseley and Griffin, 1986) follows:
• When both object and person are vibrating, the twoMay be vibrating at different frequencies and intensities.
144 Environmental Factors
Ch04.qxd 11/1/03 4:19 PM Page 144

May or may not be moving in phase.May or may not be moving in the same axis.
• The effects of vibration on visual performance depend on the size ofobject observed and its distance from the observer.
• Visual performance degradation is determined mainly by the vibra-tion frequency. For example, visual performance impairment occursin the frequency range 10–25Hz.
• Low frequency vibration affects the ability of the eye to track targetsand maintain a stable image on the retina (e.g., reading a book on atrain ride).
• High-frequency vibration creates blurry images.
4.5.2 Effects of Vibration on Health
Exposure to vibration, especially long term, leads basically to twohealth issues: damage to body organs due to whole-body vibration, whichis a function of high-intensity vibration; and damage to blood vessels,body tissues, and nervous system to the fingers, hands, and arms due tosegmental vibration, which is a function of high-frequency vibration. Themajority of studies in the literature focus on tractor drivers, truck drivers,and workers using power tools (Rosseger and Rosseger, 1960; Ramsey,1975; Abrams and Suggs, 1977; Whitham and Griffin, 1978; Seidel andHeide, 1986; Grandjean, 1988; Sanders and McCormick, 1993).
Whole-body vibration is mainly the product of vertical vibration (Zaxis), when standing or sitting (Figure 4-2), absorbed through the feetwhen standing and the buttocks and feet when sitting. The most commonsituations where individuals are exposed to long-term, high-intensity,whole-body vibration are driving trucks, buses, tractors, and operatingconstruction and heavy equipment. The most common physiologicaleffects and complaints of whole body vibration are
• Stomach or abdominal pain and spinal disorders at the low back andneck regions. In addition, traces of blood in the urine have beenfound, probably due to kidney damage.
Environmental Factors 145
Ch04.qxd 11/1/03 4:19 PM Page 145

• Chest and abdominal pain from operating within the frequency range4–10Hz.
• Back and neck aches within the range 8–12Hz.
• Headaches, muscular tension, and irritation in the intestines andbladder within the range 10–20Hz.
Segmental vibration is mainly the product of long exposure to high-frequency vibrating objects absorbed through the fingers, hands, and arms.The most common situations where individuals are exposed to long-term,high-frequency segmental vibration come from examples of using hand-held power tools such as grinders, chain saws, pneumatic road drills andhammers, or polishing machines. Further, the design, size, and weight ofthe power tool also affects its vibration level (Abrams and Suggs, 1977).The most common physiological affects and complaints of segmentalvibration are
• Structural damage to blood vessels and nerves, mainly in the fingersand hands, with vibration frequencies between 40 and 500Hz. Thearms could also be affected over time.
• Damage to bones, joints, tendons, and muscles of hands and armswith vibration frequencies less than 40Hz.
• Symptoms associated with these situations are referred to as whitefingers condition, Raynaud’s disease, or vibration-induced whitefingers and consist ofPain, stiffness, and numbness of the fingers and hands.Blanching (white or bluish color) of either all or part of the hands
and fingers.Loss of muscular control and strength.
4.5.3 Guidelines to Reduce or Control Vibration
There are basically two ways to reduce or control the effects of vibra-tion on the individual: engineering and administrative controls (EastmanKodak, 1983; Grandjean, 1988, Sanders and McCormick, 1993). Engi-neering controls can basically be achieved through two approaches:
146 Environmental Factors
Ch04.qxd 11/1/03 4:19 PM Page 146

• Reducing vibration at the source byProper equipment maintenance.Mounting equipment on pads or springs.Modifying equipment to reduce speed and acceleration.
• Preventing vibration from reaching the individual byPlacing special spring suspensions under seats and platforms to
absorb vibration.Using rubber mats for standing tasks.Designing hand-operated power tools with damping-isolating mate-
rials, especially between the hand and hand-grip of the tool.Using special vibration-absorbing gloves and, reducing the time spent
working in cold conditions.Designing the size and weight of the hand-operated power tools (i.e.,
using counterweight tools) to minimize the force needed to grip,balance, and operate them.
Administrative controls focuses on three approaches to reduce exposureto vibration:
1. Train individuals on the issues associated with vibration in terms ofperformance and health effects.
2. Provide the proper personal protection equipment, such as specialgloves, and invest in properly designed equipment.
3. Rotate individuals among work tasks to control and reduce exposure. For example, Bovenzi, Petroniv, and DiMarino (1980) recommend the use of a chipping hammer (used to remove cakedmaterial from metal surfaces) should not exceed 4 hours per personper shift.
4.6 CASE STUDY
The proper quality and quantity of lighting in a control room environ-ment is critical to the efficiency and safety of the petrochemical plant. Thiscase study deals with the evaluation of an existing lighting system in aprocess control center, and recommendations for follow-up.
Environmental Factors 147
Ch04.qxd 11/1/03 4:19 PM Page 147
4.6.1 Method
The evaluation methods include
• Recording the illumination levels at each writing surface of thecontrol room (with the brightness adjusted to a “personnel prefer-ence” level by each control room operator). The levels are typicallyselected to minimize glare reflected from the screens and the stain-less steel panels.
• Discussion with individual operators about the lighting in their areas.
• Photos of qualitative HF concerns.
4.6.2 Results
We determine the following:
• Illumination levels are too low for reading tasks.
• Stainless steel panels are highly reflective. The ratio of luminancefrom stainless steel panels to the luminance of the screens in mostcases is greater than the maximum recommended luminance ratio, 10 :1.
• Small cell parabolics (Figure 4-3) are not located or used correctly:Control equipment is located beneath the luminaires that provide illu-
mination for paper-and-pencil tasks. The operators decrease thebrightness of these lights to reduce glare.
The luminaires located around the room periphery cause less screenglare, but they are not lit, since they would cast shadows on thewriting surfaces.
• The large circular light (Figure 4-4) structure in the center of the roomis a glare source for each console. It is composed of “egg crate” filtersover recessed fluorescent lights. The cut-off angle for the egg cratesis poor, resulting in spillover of illumination.
4.6.3 Recommendations
The recommendations for the new lighting system are
148 Environmental Factors
Ch04.qxd 11/1/03 4:19 PM Page 148

149
Figure 4-3 Parabolic light.
Figure 4-4 Large circular light.
Ch04.qxd 11/1/03 4:19 PM Page 149
• Task lights. Ceiling mounted spotlights should be installed to lightthe writing surfaces in each of the console areas.
• Ambient illumination. Drop-down indirect lighting units are recom-mended to eliminate glare from overhead fixtures.
Recommendations for existing lighting systems are
• Replace the large circular illuminated area in the center of the controlroom by small-cell parabolics (at the current location of the eggcrates) to eliminate screen glare, ceiling-mounted track lights, orinexpensive portable task lights located on the work surfaces that surround the center pole in the room.
• Diffuse the glare on the control system stainless steel panels by sand-blasting the existing panels; painting them with a flat, matte-finishpaint (an electrostatic paint process may work here); or install a mattefinish covering over the panels.
4.6.4 Installation of a Pilot Lighting System
The goal here is to design and install a retrofit lighting system for evaluation. The system consists of two components.
The first component is an indirect lighting luminaire that hangs about24 in. from the ceiling. The luminaire is inverted and throws its light up,onto the ceiling, from which it is reflected onto the surfaces below. Theintensity of the light is continuously adjustable from off to full intensity.
Owing to the even dispersion of the light on the ceiling, no “hot spots”reflect on the panels below, and the light from the luminaire is evenly dis-persed across the control space.
The second component of the lighting system is a “spot” task (track)light recessed into the ceiling. The light is equipped with a lens that shinesa focused, 3-ft diameter spot of light on the worktable located in the centerof the control space. The brightness of the light is continuously adjustablefrom off to full intensity.
The illumination levels provided by the new lighting system areobtained at several locations around the control space. Each reading isrecorded with the indirect light source at full intensity. Readings areobtained with the spotlight off or the light adjusted to full intensity.
150 Environmental Factors
Ch04.qxd 11/1/03 4:19 PM Page 150

4.6.5 Final Results
The illumination levels provided by the combination of an indirect,ceiling-hung luminaire and track lights are acceptable for the operators’tasks. Levels at each console location are very similar, 2–3FC (20–30 lux),whether the spotlight is on or off. With the spotlight adjusted to full inten-sity, the levels for reading at the operator’s worktable are higher thanrequired.
The overhead indirect light causes little glare on the console and thetask (track) light is so directional that it provides virtually no spilloverfrom a spot of light about 3 ft in diameter on the reading table.
Operators report being very pleased with the result and managementhas decided to install the indirect lighting system throughout the space.The number and size of the indirect luminaires will be determined fromlighting surveys by the contractor. The number and location of the tracklights will be determined by where the operators want reading levels ofillumination.
REVIEW QUESTIONS
1. Light stimulus is characterized by its intensity and wavelength.Define light intensity and wavelength.
2. What lighting factors affect performance in the workplace?
3. How is age affected by the light quantity and quality?
4. What types of glare do people experience?
5. What is the luminance ratio and why is it important?
6. How does heat affect physical performance?
7. How does cold affect physical performance?
8. What are the forms of heat illness?
9. What does shivering do to the human body?
10. Define the human comfort zone.
11. How do you calculate rest duration when working in the heat?
Environmental Factors 151
Ch04.qxd 11/1/03 4:19 PM Page 151
12. Define noise and its parameters.
13. How does noise affect people’s speech and communication?
14. How can noise lead to a hearing disorder?
15. How can noise be controlled?
16. What is vibration?
17. What are the signs of Raynaud’s disease (also known as whitefingers disease)?
18. What are the effects of vibration on visual performance and motorcontrol?
19. How can vibration be controlled?
REFERENCES
Abrams, C. F., and Suggs, C. W. (1977) “Development of a Simulator for Use in the Mea-surement of Chain Saw Vibration.” Applied Ergonomics 8, no. 2, pp. 130–134.
Baddeley, A. D., Cuccaro, W. J., Egstrom, G. H., Weltman, G., and Willis, M. A. (1975)“Cognitive Efficiency of Divers Working in Cold Water.” Human Factors 17, pp.446–454.
Barnaby, J. F. (1980) “Lighting for Productivity Gains.” Lighting Design and Application10, no. 2, pp. 20–28.
Barnes, G. R., Benson, A. J., and Prior, A. R. J. (1978) “Visual-Vestibular Interaction inthe Control of Eye-Movement.” Aviation, Space and Environmental Medicine 49, pp.557–564.
Bennett, C., Chitlangia, A., and Pangrekar, A. (1977) “Illumination Levels and Perfor-mance of Practical Visual Tasks.” Proceedings of the Human Factors Society 21stannual meeting, Santa Monica, CA, pp. 322–325.
Blackwell, H. R., and Blackwell, O. M. (1968) “The Effects of Illumination Quantity uponthe Performance of Different Visual Tasks. Illumination Engineering 63, pp. 143–152.
Boggs, D. H., and Simon, J. R. (1968) “Differential Effect of Noise on Tasks of VaryingComplexity.” Journal of Applied Psychology 52, pp. 148–153.
Bovenzi, M. L., Petroniv, L., and DiMarino, F. (1980) “Epidemiological Survey of Shipyard Workers Exposed to Hand-Arm Vibration.” International Archives of Occupational and Environmental Health 46, pp. 251–266.
Bowen, H. M. (1968) “Driver Performance and the Effects of Cold.” Human Factors 10,pp. 445–464.
152 Environmental Factors
Ch04.qxd 11/1/03 4:19 PM Page 152

Burrows, A. A. (1960) “Acoustic Noise, and Informational Definition.” Human Factors2, no. 3, pp. 163–168.
Burse, R. (1979) “Sex Differences in Human Thermoregulatory Response to Heat andCold Stress.” Human Factors 21, no. 6, pp. 687–699.
Collins, B., and Worthey, J. (1985) “Lighting for Meat and Poultry Inspection.” Journalof the Illuminating Engineering Society 15, pp. 21–28.
Davies, D., and Jones, D. (1982) “Hearing and Noise.” In W. Singleton (ed.), The Bodyat Work. New York: Cambridge University Press.
Eastman Kodak Co. (1983) Ergonomic Design for People at Work, vol. 1. New York: VanNostrand Reinhold Company.
Enander, A. (1987) “Effects of Moderate Cold on Performance of Psychomotor and Cognitive Tasks.” Ergonomics 30, no. 10, pp. 1431–1445.
Enander, A. (1989) “Effects of Thermal Stress on Human Performance.” ScandinavianJournal of Work and Environmental Health 15, supplement 1, pp. 27–33.
Eschenbrenner, A. J. (1971) “Effects of Intermittent Noise on the Performance of aComplex Psychomotor Task.” Human Factors 13, no. 1, pp. 59–63.
Fox, J. G. (1971) “Background Music and Industrial Productivity—A Review.” AppliedErgonomics 2, pp. 70–73.
Gawron, V. (1982) “Performance Effects of Noise Intensity, Psychological Set, and TaskType and Complexity.” Human Factors 24, pp. 225–243.
Grandjean, E. (1988) Fitting the Task to the Man. London: Taylor and Francis.
Griffin, M. J. (1976) “Eye Motion during Whole-Body Vibration.” Human Factors 18, pp.601–606.
Griffin, M. J. (1990) Handbook of Human Vibration. London: Academic Press.
Griffin, M. J., and Lewis, C. H. (1978) “A Review of the Effects of Vibration on VisualAcuity and Continuous Manual Control: Part I. Visual Acuity.” Journal of Sound andVibration 56, pp. 383–413.
Haslegrave, C. M. (1995) “Auditory Environment and Noise Assessment.” In J. R. Wilsonand E. N. Corlett, Evaluation of Human Work. London: Taylor and Francis.
Hornick, R. (1973) Vibration in Bioastronautics Data Book. Second Ed. NASA Sp-3006.Washington, DC: National Aeronautics and Space Administration.
Hughes, P., and Neer, R. (1981) “Lighting for the Elderly: A Psychobiological Approachto Lighting.” Human Factors 23, pp. 65–85.
ISO. (1994) Moderate Thermal Environment—Determination of the PMV and PPDIndices and Specification of the Conditions for Thermal Comfort. ISO 7730. International Standards Organization.
ISO. (1995) Hot Environment—Estimate of the Heat Stress on Working Man, Based onthe WBGT-Index (Wet Bulb Globe Temperature). ISO 7243. International StandardsOrganization.
Jaschinski, W. (1982) “Conditions of Emergency Lighting.” Ergonomics 25, pp. 363–372.
Environmental Factors 153
Ch04.qxd 11/1/03 4:19 PM Page 153

Jerison, H.J. (1959) “Effects of Noise on Human Performance.” Journal of Applied Psychology 43, pp. 96–101.
Knave, B. (1984) “Ergonomics and Lighting.” Applied Ergonomics 15, no. 1, pp. 15–20.
Kobrick, J. L., and Fine, B. J. (1983) “Climate and Human Performance.” In D. J. Oborneand M. M. Gruneberg (ed.), The Physical Environment at Work. Chichester, UK: JohnWiley.
Konz, S. (1990) Work Design: Industrial Ergonomics. Third Ed. Worthington, OH: Publishing Horizon.
Kryter, K. D. (1970) The Effects of Noise on Man. New York: Academic Press, pp.545–585.
Kryter, K. D., and Pearson, K. S. (1966) “Some effects of spectrum content duration onperceived noise level.” Journal of the Acoustical Society of America 39, pp. 451–464.
Levison, W. H. (1976) Biomechanical Response and Manual Tracking Performance inSinusoidal, Sum of Sines, and Random Variation Environments. Army MedicalResearch Laboratory Report AMRL-TR-75–94.
Lewis, C. H., and Griffin, M. J. (1978) “A Review of the Effects of Vibration on VisualAcuity and Normal Control. Part II. Continuous Manual Control.” Journal of Soundand Vibration 56, pp. 415–457.
Lewis, C. H., and Griffin, M. J. (1979a) “Mechanics of the Effects of Vibration Frequency,Level, and Duration on Continuous Manual Control Performance.” Ergonomics 22,pp. 855–889.
Lewis, C. H., and Griffin, M. J. (1979b) “The Effect of Character Size on the Legibilityof a Numeric Display during Vertical Whole-Body Vibration.” Journal of Sound andVibration 67, pp. 562–565.
Lind, A. R. (1963) “Tolerable Limits for Prolonged and Intermittent Exposure to Heat.”In J. D. Hardy (ed.), Temperature—Its Measurement and Control in Science andIndustry, vol. 3. New York: Reinhold.
Lockhart, J. M. (1968) “Extreme Body Cooling and Psychomotor Performance.”Ergonomics 11, pp. 249–260.
Meddick, R. D. L., and Griffin, M. J. (1976). “The Effect of Two-Axis Vibration on theLegibility of Reading Material.” Ergonomics 19, pp. 21–33.
Morton, R., and Provins, K. A. (1960) “Finger Numbness after Acute Local Exposure toCold.” Journal of Applied Psychology 15, pp. 149–154.
Moseley, M., and Griffin, M. J. (1986) “Effects of Display Vibration and Whole-BodyVibration on Visual Performance.” Ergonomics 29, pp. 977–983.
NIOSH. (1972) Criteria for a Recommended Standard—Occupational Exposure to Noise.Cincinnati OH: U.S. Department of Health, Education, and Welfare. National Insti-tute for Occupational Safety and Health.
OSHA. (1983) “Occupational Noise Exposure: Hearing Conservation Amendment.”Federal Register 48, pp. 9738–9783.
154 Environmental Factors
Ch04.qxd 11/1/03 4:19 PM Page 154
Parson, K. C. (1995) “Ergonomics Assessment of Thermal Environments.” In J. R. Wilson and E. N. Corlett, Evaluation of Human Work. London: Taylor and Francis.
Poulton, E. C. (1976) “Continuous Noise Interferes with Work by Masking Auditory Feed-back and Inner Speech.” Applied Ergonomics 7, pp. 79–84.
Poulton, E. C. (1977) “Continuous Intense Noise Masks Auditory Feedback and InnerSpeech.” Psychological Bulletin 84, pp. 977–1001.
Ramsey, J., Burford, C., Beshir, M., and Jensen, R. (1983) “Effects of Workplace Thermal Conditions on Safe Work Behavior.” Journal of Safety Research 14, pp.105–114.
Ramsey, J., and Kwon, Y. (1988) “Simplified Decision Rules for Predicting PerformanceLoss in the Heat.” In Proceedings on Heat Stress Indices. Luxembourg: Commissionof the European Communities. Cited in M. S. Sanders and E. J. McCormick, HumanFactors in Engineering and Design. Seventh Ed. New York: McGraw-Hill, 1993, pp.570–571.
Ramsey, J. D. (1975) “Occupational Vibration.” In C. Zenz (ed.), Occupational Medicine:Principles and Practical Applications, pp. 553–562.
Ramsey, J. D. (1995) “Task Performance in Heat: A Review.” Ergonomics 38, no. 1, pp.154–165.
Ross, D. (1978) “Task Lighting—Yet Another View.” Lighting Design and Application pp.37–42.
Rosseger, R., and Rosseger, S. (1960) “Health Effects of Tractor Driving.” Journal of Agricultural Engineering Research 5, pp. 241–275.
Sanders, M. S., and McCormick, E. J. (1993) Human Factors in Engineering and Design.Seventh Ed. New York: McGraw-Hill, pp. 551–588.
Seidel, H., and Heide, R. (1986) “Long-Term Effects of Whole-Body Vibration: A Criti-cal Survey of the Literature.” International Archives of Occupational and Environ-mental Health 58, pp. 1–26.
Sinks, T., Mathias, C., Halpern, W., Timbrook, C., and Newman, S. (1987) “Surveillanceof Work-Related Cold Injuries Using Workers’ Compensation Claims.” Journal ofOccupational Health and Safety 29, pp. 505–509.
Strydom, N. (1971) “Age as a Causal Factor in Heat Stroke.” Journal of the South AfricanInstitute of Mining and Metallurgy 72, pp. 112–114.
Timbal, J., Loncle, M., and Boutelier, C. (1976) “Mathematical Model of Man’s Toler-ance to Cold Using Morphological Factors.” Aviation, Space and EnvironmentalMedicine 47, pp. 958–964.
University of Michigan. (1988) Energy Expenditure Prediction Model. Ann Arbor: University of Michigan.
Waller, R. A. (1969) “Office Acoustics—Effect of Background Noise.” Applied Acoustics2, pp. 121–130.
Environmental Factors 155
Ch04.qxd 11/1/03 4:19 PM Page 155

Whitham, E. M., and Griffin, M. J. (1978) “The Effects of Vibration Frequency and Direction on the Location of Areas of Discomfort Caused by Whole-Body Vibration.”Applied Ergonomics 9, no. 4, pp. 231–239.
Wotton, E. (1986) “Lighting the Electronic Office.” In R. Lueder (ed.), The ErgonomicsPayoff, Designing the Electronic Office. Toronto: Holt, Rinehart and Winston, pp.196–214.
Wright, G., and Rea, M. (1984) “Age, a Human Factor in Lighting.” In D. Attwood andC. McCann (ed.), Proceedings of the 1984 International Conference on OccupationalErgonomics. Rexdale, Ont., Canada: Human Factors Association of Canada, pp.508–512.
Wyndham, C. (1974) “Research in the Human Sciences in the Gold Mining Industry.”American Industrial Hygiene Association Journal pp. 113–136.
156 Environmental Factors
Ch04.qxd 11/1/03 4:19 PM Page 156

5
Equipment Design
5.1 Human/System Interface5.2 Controls
5.2.1 Physical Requirements of Operating Controls5.2.2 Types of Controls5.2.3 Control Labels and Identification5.2.4 Stereotypes5.2.5 Access to Operate5.2.6 Preventing Accidental Operation5.2.7 Valves
5.3 Visual Displays5.3.1 Types of Displays5.3.2 Mounting Displays
5.4 Relationship between Controls and Visual Displays5.5 Auditory Displays5.6 Field Control Panels
5.6.1 Field Panel Layout5.6.2 Field Panel Labels5.6.3 Improving Field Control Panels
5.7 Process Control Displays5.7.1 Process Control Display Interface5.7.2 Approach for Developing Process Control Displays
5.8 Case StudyAppendix 5-1. Checklist for Equipment Design
5.1 HUMAN/SYSTEM INTERFACE
One main way that operators interact with plant equipment is by moni-toring instrument displays and manipulating the process via controls orswitches on control panels or a keyboard. Therefore, good design of the
157
Ch05.qxd 11/21/03 09:22 PM Page 157

displays that provide information to the operator about the status of the process and the control devices that are available to the operator for manipulating the process can minimize the potential for error. Theoperator’s interaction with the controls and displays is represented by theshaded portions of the human system interface shown in Figure 5-1.
This chapter discusses how displays and controls should be designedto minimize the potential for human error. Appendix 5-1 contains a check-list for displays, controls, control panels, and process control displays forreviewing aspects of this equipment that may contribute to human errorat a site.
5.2 CONTROLS
Controls are physical devices used to send signals to plant equipment.Some controls require little manual effort to operate, such as panel-mounted pushbuttons, rocker switches, toggle switches, knobs, and slide
158 Equipment Design
Human StressorsHuman Stressors
Higher Mental Processes
Higher Mental Processes
SensesSenses
DisplaysDisplays
ResponsesResponses
SystemsSystemsActual Output (A∞) Desired Output (D∞)
System Input Devices
System Input Devices
D∞ - A∞
System StressorsSystem Stressors
Figure 5-1 Human/system interface.
Ch05.qxd 11/21/03 09:22 PM Page 158
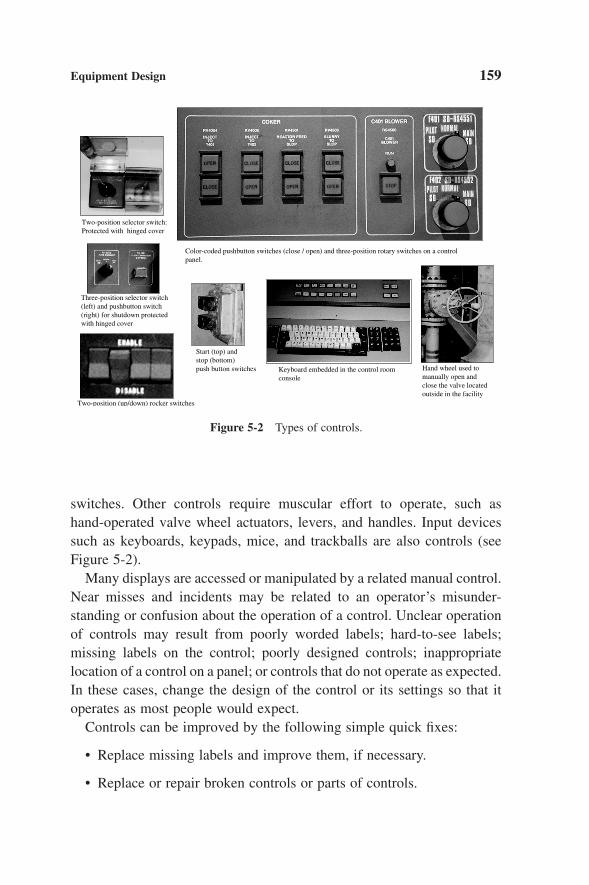
switches. Other controls require muscular effort to operate, such as hand-operated valve wheel actuators, levers, and handles. Input devicessuch as keyboards, keypads, mice, and trackballs are also controls (seeFigure 5-2).
Many displays are accessed or manipulated by a related manual control.Near misses and incidents may be related to an operator’s misunder-standing or confusion about the operation of a control. Unclear operationof controls may result from poorly worded labels; hard-to-see labels;missing labels on the control; poorly designed controls; inappropriatelocation of a control on a panel; or controls that do not operate as expected.In these cases, change the design of the control or its settings so that itoperates as most people would expect.
Controls can be improved by the following simple quick fixes:
• Replace missing labels and improve them, if necessary.
• Replace or repair broken controls or parts of controls.
Equipment Design 159
Two-position selector switch:Protected with hinged cover
Color-coded pushbutton switches (close / open) and three-position rotary switches on a control panel.
Start (top) and stop (bottom)push button switches
Three-position selector switch (left) and pushbutton switch (right) for shutdown protected with hinged cover
Hand wheel used to manually open and close the valve located outside in the facility
Keyboard embedded in the control room console
Two-position (up/down) rocker switches
Figure 5-2 Types of controls.
Ch05.qxd 11/21/03 09:22 PM Page 159
• Group controls (e.g., on a panel) by function or sequence with labeling schemes, such as color-coded escutcheon plates or linedemarcation.
• Remove controls that are permanently out of service.
• Replace controls that operate in a manner inconsistent with similarcontrols.
Several issues should be considered when selecting controls for use ina plant or evaluating a work situation that involves the use of controls:
• Physical design of the control itself—types of controls appropriatefor various tasks (e.g., dimensions of the control).
• Physical requirements related to musculoskeletal injury risk factors(force, repetition, posture and contact stress).
• Appropriate labeling to clearly identify the controls.
• The way the controls operate matches operators’ expectations.
• Physical access to operate the control.
• Guarding against inadvertent operation.
• Relationship of the control to the equipment it operates and therelated displays of equipment status.
5.2.1 Physical Requirements of Operating Controls
The physical requirements to operate the control should be considered.Controls should not require excessive force to operate; for example, stren-uous exertion to turn a valve hand wheel or excessive force by leaningdown with the whole body on a lever to activate it. If excessive force isneeded, then the contact force of the control on the hands and fingers (e.g.,pressure points and sharp edges) may be a concern. Details on the rec-ommended maximum activation forces for different types of controls areavailable in Eastman Kodak (1983).
A force gauge is used to measure the actual force required to operatethe control; then the actual force can be compared to the recommended
160 Equipment Design
Ch05.qxd 11/21/03 09:22 PM Page 160

maximum force. However, a simpler qualitative approach is for operatorsto identify the controls that need to be examined further as those thatrequire strenuous exertion or that dig into the fingers or hand during repet-itive control operation. Other aspects of the physical requirements towatch include repetition and awkward body posture. Repetitive controlmanipulation and awkward body postures, with an extended and out-reached arm, may be involved in repetitive or prolonged operations, such as operating a crane or operating a batch process via a local controlpanel.
5.2.2 Types of Controls
The type of control to install depends on what the control must do; thatis, does the operator use the control to select a discrete setting or is thecontrol used to select a setting from a continuous scale? A problem in thisarea is often related to the type of control or switch being inappropriatefor the function it is supposed to perform. The following features shouldbe considered when selecting the controls to be installed on a control panel(Eastman Kodak, 1983):
• The speed and accuracy of signal the operator needs to send to theplant or equipment via the control.
• The surface area available on the equipment or control panel forinstallation of the control.
• Ease of use—how intuitively clear is the operation of the control tothe operator?
• The consistency of the operation of the control with other controls inthe plant with a similar function.
Push buttons are suitable for two-position controls. They can be oper-ated quickly and, depending on size, with the fingers, thumb, or palm ofthe hand. A push button needs some means to indicate its position, eithera physical displacement or indicator lights. Examples of the use of pushbuttons are on/off and start/stop switches.
Equipment Design 161
Ch05.qxd 11/21/03 09:22 PM Page 161

Rocker switches and toggle switches are most often used for two-position controls, although they can be used for three-position controls aswell. They are fast and easy to operate. Their position can be used to indicate their setting. They are not suitable for continuous control. Exam-ples of the use of rocker switches and toggle switches are on/off,open/close, and up/down controls.
Slide switches and thumb wheels are used for continuous control. Theyoffer a wide range of settings and usually have no indents or indicators toindicate position of the switch. Since they require fine motion, the handshould be supported when they are used. Examples of the use of slideswitches and thumb wheels are to increase flow, temperature, or pressurecontrols.
Rotary switches and lever-type handles are used for both discrete andcontinuous settings. When used for discrete settings, detents should beprovided. Ensure that the number of knob discrete choices match thenumber of selections that can be made. Do not use a knob with three posi-tions if only two choices available, such as on/off. The rotary knob is suit-able for a large range of continuous motions, whereas the lever is suitablefor only a smaller range. Rotary controls operated by the fingers shouldhave knurled or textured surfaces. For rotary controls, avoid selectionpoints that are 180° apart. Examples of the use of rotary switches andlever-type handles are controls to change flow lines and multiposition controls.
More details and specifications on various types of controls can befound in Kodak and McCormick Controls are used to communicate withequipment. If the design does not clearly indicate the position of thecontrol, then the operator may make an error in either interpreting thecurrent setting or making changes by setting the control in a different posi-tion. Figure 5-3 shows the difference between good and bad designs fora selector switch.
Dimensions of controls are important, especially when multiple con-trols, such as thumb wheels, buttons, or switches, are located on a singlepanel. Clearance between the controls reduces the potential for inadver-tent operation. The size of the controls must be large enough to fit thefingers and hands of the operators. The use of gloves should be consid-ered when designing the space required for effective operation of controls.The dimensions of the control and the clearance required between
162 Equipment Design
Ch05.qxd 11/21/03 09:22 PM Page 162

controls are determined by finger anatomy dimensions, and are availablefrom Eastman Kodak (1983).
The following points should also be considered for selecting controlsto use in the plant:
• Controls should operate in the way that the operator expects.
• Controls that perform the same function should be of the same designand operate in the same manner.
• Discrete controls should have a positive indicator that the control hasactivated. This can be an indent, a click (only in quiet environment),an indicator light, or a large displacement of the switch.
5.2.3 Control Labels and Identification
All controls and associated displays should be labeled. The content ofthe labels should be clear and use complete words (e.g., Surge Pump Pres-sure) instead of acronyms or abbreviations (i.e., SPP). Labels of controlsthat are important, such as those that identify emergency equipment,should also be color-coded to facilitate quick identification. The labelshould be located above the control, or between a control and its associ-ated display as shown in figure 5-4.
Equipment Design 163
STOP START
Good Design. The design clearlyindicates the position.
STOP START
Bad Design. The pointer is in themiddle. Operator does not know if thecontrol is on START or STOP
Do this Not thisFigure 5-3 Good and bad designs for a selector switch.
Ch05.qxd 11/21/03 09:22 PM Page 163

5.2.4 Stereotypes
It is important that operators are able to manipulate specific controls ina manner consistent with their expectations. For example, the expectedbehavior for operating valve hand wheels are counterclockwise turns to“open” the valve and clockwise turns to “close” the valve. The operator’sexpectation is called a stereotype. A strong stereotype is one in which 85%of a user population has the same expectation of how a control operates.Equipment operated by plant personnel should operate consistently withtheir stereotypes. If the design of the equipment conflicts with a stereo-type, there is more potential for error when operating it. Although it ispossible to educate people to operate systems that do not follow the stereo-types, their performance may deteriorate, especially when in an emer-gency situation. Such controls should be simple to use without theoperator’s hesitation and require minimal decision making. Individualcontrols should be designed so that the direction in which the control ismoved to achieve a desired setting or result is clear to the operator anddoes not violate any expectations.
Stereotypes for expectations on how controls should operate may differamong countries. Therefore, the design of a control panel arrangement inone country may not be effective for operators of a plant in a differentcountry, especially for emergency operations. Stereotypes also apply to
164 Equipment Design
Do this
EngineSpeed rpm
Not this
EngineSpeed rpm
Figure 5-4 Placement of control labels.
Ch05.qxd 11/21/03 09:22 PM Page 164

the meaning of color coding for signs and labels. For example, the colorred is associated with danger in both the United States and in Hong Kong,but in the United States this stereotype is very strong, while in Hong Kongit is weaker. Color stereotypes in the United States for colors associatedwith Caution and Warning also are not as strong as the color red forDanger.
If controls are difficult to use because they are the wrong type for thesituation or if controls operate in an unexpected manner, then these poseserious problems. These controls should be replaced or redesigned so thatthey operate according to expectations.
5.2.5 Access to Operate
A properly designed panel locates controls within the functional reachof smaller operating personnel, specifically within the functional reach ofthe smallest 5% of the personnel expected to operate the plant. This meansthat 95% of the population can reach a control comfortably and 5% canreach the control but not so comfortably. For a smaller operator to reachthe control, it may require an undesirable working posture by extendingthe upper half of the body and while perhaps standing on tiptoes. Emer-gency controls, such as emergency shutdown valves and emergency iso-lation valves, should be within comfortable reach of all operators.
5.2.6 Preventing Accidental Operation
Once the location of controls has been set, the design should considerwhether those locations prevent the controls from being accidentally acti-vated. For example, if too little space is provided between adjacent con-trols or if the controls are arranged so that the operator’s limb movementsare such that they pass over (with the danger of touching) another control,the “wrong” control may be activated. Even if controls are in ideal posi-tions, they can still be activated accidentally. A list of techniques to guardagainst accidental activation follows:
• Recess the control.
• Cover the control with a hinged cover (plastic see-through covers).
Equipment Design 165
Ch05.qxd 11/21/03 09:22 PM Page 165

• Lock the control.
• Increase control resistance, the force required to activate the control.
• Operationally sequence a set of controls; for example, ensure thatcontrol 2 cannot be operated until control 1 has been activated.
5.2.7 Valves
Hand wheel actuators that operators grasp and turn to manually openand close valves are a major type of control device used in a petrochem-ical plant (see Figure 5-5). For valves that must be manually operated, theforce that the operator must exert on a hand wheel to open, or unseat, a
166 Equipment Design
Figure 5-5 Example of good valve stem orientation.
Ch05.qxd 11/21/03 09:22 PM Page 166
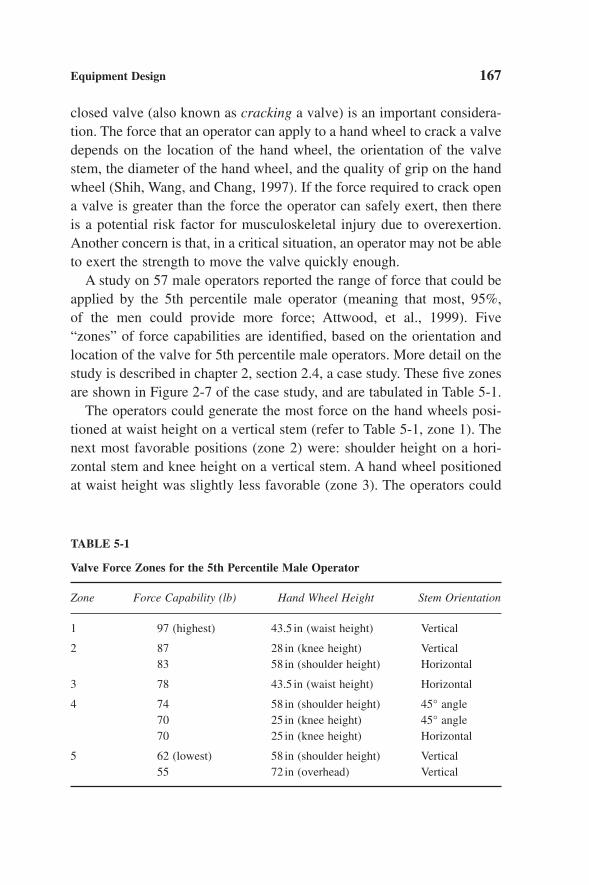
closed valve (also known as cracking a valve) is an important considera-tion. The force that an operator can apply to a hand wheel to crack a valvedepends on the location of the hand wheel, the orientation of the valvestem, the diameter of the hand wheel, and the quality of grip on the handwheel (Shih, Wang, and Chang, 1997). If the force required to crack opena valve is greater than the force the operator can safely exert, then thereis a potential risk factor for musculoskeletal injury due to overexertion.Another concern is that, in a critical situation, an operator may not be ableto exert the strength to move the valve quickly enough.
A study on 57 male operators reported the range of force that could beapplied by the 5th percentile male operator (meaning that most, 95%, of the men could provide more force; Attwood, et al., 1999). Five “zones” of force capabilities are identified, based on the orientation andlocation of the valve for 5th percentile male operators. More detail on thestudy is described in chapter 2, section 2.4, a case study. These five zonesare shown in Figure 2-7 of the case study, and are tabulated in Table 5-1.
The operators could generate the most force on the hand wheels posi-tioned at waist height on a vertical stem (refer to Table 5-1, zone 1). Thenext most favorable positions (zone 2) were: shoulder height on a hori-zontal stem and knee height on a vertical stem. A hand wheel positionedat waist height was slightly less favorable (zone 3). The operators could
Equipment Design 167
TABLE 5-1
Valve Force Zones for the 5th Percentile Male Operator
Zone Force Capability (lb) Hand Wheel Height Stem Orientation
1 97 (highest) 43.5 in (waist height) Vertical
2 87 28 in (knee height) Vertical83 58 in (shoulder height) Horizontal
3 78 43.5 in (waist height) Horizontal
4 74 58 in (shoulder height) 45° angle70 25 in (knee height) 45° angle70 25 in (knee height) Horizontal
5 62 (lowest) 58 in (shoulder height) Vertical55 72 in (overhead) Vertical
Ch05.qxd 11/21/03 09:22 PM Page 167

generate the least force on hand wheels that were positioned overhead orat shoulder heights on a vertical stem (zone 5). Hand wheels positionedat knee and shoulder heights on a 45° angle stem, and at knee height ona horizontal stem were only slightly better (zone 4) than the worst case.
Shih et al. (1997) reported that operators could exert more force onknurled and textured than smooth hand wheels for small valves. In addi-tion to the type of hand wheel and its location and orientation, the avail-ability of clearance for the operator to assume an advantageous postureand the working environment also affects the force that can be applied tothe hand wheel (Amell and Kumar, 2001). An advantageous posture isdetermined by the distance required to reach the valve and the clearancein front of the valve for the operator to assume a preferred position toexert force on the hand wheel.
Operators should be able to reach the hand wheel to turn it from amaximum horizontal distance of 24 in. (610mm), with the preferablerange between 16 and 20 in. (410–510mm). The recommended minimumclearance behind a hand wheel for a valve that must be manually oper-ated is 30 in. (760mm), with the preferable range between 40 and 48 in.(1010–1220mm), depending on the height of the hand wheel location. Usethe higher end of the preferable range of clearance if access requires theoperator to squat or kneel on one knee.
For existing plants, a hand wheel actuator survey can be used to iden-tify valves that may require too much force for safe manual operation,valves that may cause overexertion due to high force requirements, andvalves that require a high number of repetitions to manually open or close.These valves may contribute to a musculoskeletal injury, be difficult toquickly close during an emergency, or require the use of a wrench toprovide the torque necessary to move the valve. Plant surveys indicatethat few modern continuous facility petrochemical operations requirehighly repetitive operation of valves by a single operator. At the high endof the range was a batch unit operation at a single plant that required upto 70 valves to be operated over a shift by an individual operator. For thatoperation, a unit survey was conducted to identify and replace valves withexcessive force requirements and high numbers of hand wheel revolutionsrequired to open and close them.
For screening purposes, operators can point out the valves that obvi-ously require very high exertion to open or close. These valves can be
168 Equipment Design
Ch05.qxd 11/21/03 09:22 PM Page 168
replaced during equipment upgrades and turnarounds. After these valvesare identified, the next in priority are valves with hand wheel actuatorslocated below knee height or above shoulder height and that exceed rec-ommended force. The force required to operate these valves can be meas-ured with a torque wrench and compared to the force for the zones listedin Table 5-1. Depending on the frequency at which the valve is opened orclosed and the critical nature of the valve, remaining valves can beassigned priorities for replacement as equipment is upgraded or modified.
Other considerations for valve operation include labels and hand clear-ance around the hand wheel to avoid hand or finger pinches. Hand clear-ance should be a minimum of 4 in. (1010mm) extended from the rim ofthe hand wheel and a minimum of 2 in. (50mm) behind the hand wheel.Severe hand clearance situations can also be reviewed in the survey andfixed by adjusting the heights of the hand wheels to alternate higher andlower to provide clearance.
There are many documented incidents in which operators out in theplant thought they were turning a hand wheel that moved the valve thatthey intended to operate but in error moved a different valve (Kletz, 1998).Each valve should be clearly labeled to avoid this type of error. The valvelabels should match other references to the valve, such as those in processdiagrams, process displays, control panels, or procedures documents.
One method for identifying and correcting problem valves is to incor-porate the identification and follow-up actions into an existing manage-ment system, such as the maintenance system. Criteria for identifyingproblem valves can include one or combinations of the following: highrim pull force, high repetitions, awkward or difficult access, confusinglayout, and lack of or poor labels.
5.3 VISUAL DISPLAYS
To display the information required by the operator, the goal is tochoose the correct type of display to minimize error when reading andinterpreting information acquired from visual displays. To accomplish thisgoal, one needs a full analysis of the task that the operator has to under-take, which can be matched against the display’s ability to carry out theserequirements.
Equipment Design 169
Ch05.qxd 11/21/03 09:22 PM Page 169
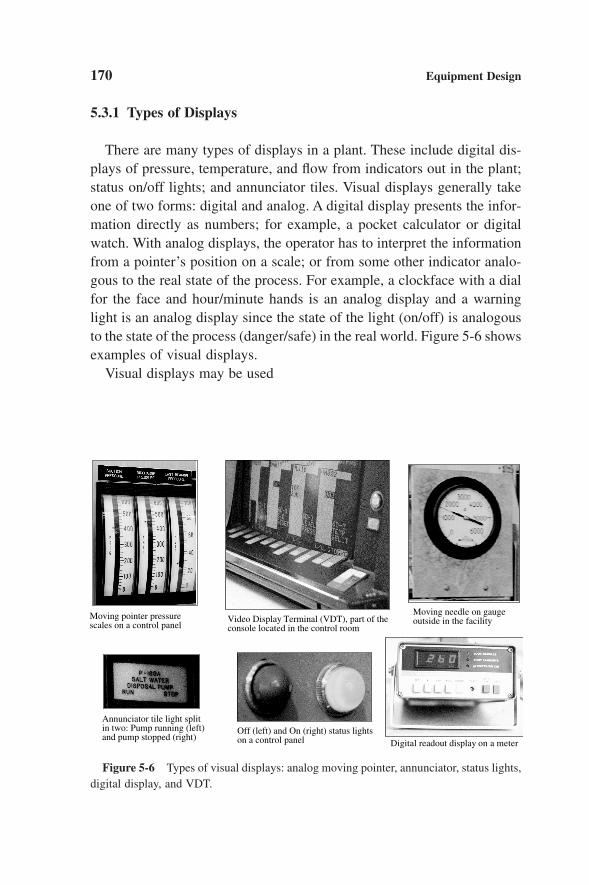
5.3.1 Types of Displays
There are many types of displays in a plant. These include digital dis-plays of pressure, temperature, and flow from indicators out in the plant;status on/off lights; and annunciator tiles. Visual displays generally takeone of two forms: digital and analog. A digital display presents the infor-mation directly as numbers; for example, a pocket calculator or digitalwatch. With analog displays, the operator has to interpret the informationfrom a pointer’s position on a scale; or from some other indicator analo-gous to the real state of the process. For example, a clockface with a dialfor the face and hour/minute hands is an analog display and a warninglight is an analog display since the state of the light (on/off) is analogousto the state of the process (danger/safe) in the real world. Figure 5-6 showsexamples of visual displays.
Visual displays may be used
170 Equipment Design
Moving needle on gauge outside in the facilityVideo Display Terminal (VDT), part of the
console located in the control roomMoving pointer pressure scales on a control panel
Digital readout display on a meter
Annunciator tile light split in two: Pump running (left) and pump stopped (right)
Off (left) and On (right) status lights on a control panel
Figure 5-6 Types of visual displays: analog moving pointer, annunciator, status lights,digital display, and VDT.
Ch05.qxd 11/21/03 09:22 PM Page 170

• To make quantitative readings, to read the state of a machine orprocess in numerical terms. For example, a digital display of pro-duction volume provides the fastest and most accurate source ofinformation to the operator.
• To make qualitative readings, to infer the “quality” of the machinestate, such as temperature and pressure ranges. A moving indicatorcan provide qualitative temperature ranges cold, warm, or hot ratherthan the precise temperature. Changes are easy to detect.
• To check readings, to determine if parameters are within some“normal” bounds or that several parameters are equal, such as Hi/Lo pressure or excessive revolutions per minute (rpms). Forexample, check reading would draw a response such as “All pressures are normal.” For check readings, zone markings can be used to help quickly determine if the check reading is within normalrange.
• To make adjustments, such as setting an indicator to a desired value,to modify set points on control information.
• To provide status indicators. For example, a High Pressure status light indicates that a specific discrete condition, high pressure, is occurring.
• To monitor a status indicator in a mimic display, to determine con-dition and location; for example, an Emergency Shutdown (ESD)indicator in a mimic panel.
Specific types of displays are best for certain types of information; forexample (Eastman Kodak Company, 1983).
• A moving pointer is best for qualitative or check reading and someadjustments.
• A digital readout is best for numerical readings.
• A graph (pen recording or trend plot) is best for detecting trends andqualitative readings.
• An annunciator light, best for giving operating instructions on acontrol panel where many functions are monitored.
Equipment Design 171
Ch05.qxd 11/21/03 09:22 PM Page 171

Depending on the circumstance and the nature of the informationneeded by the operator, displays are designed to present information bothin quantitative and qualitative forms. Quantitative information providesprecise numeric values, such as “the temperature is 85°F.” Qualitativeinformation is used to read an approximate value, a trend, rate of change,or change in direction, such as a moving pointer that indicates that “thepressure is rising.” Another qualitative type of information is the use ofcolor codes for status, such as the color red for “hot” and blue for “cool.”Once these guidelines have been adopted, they should serve the goal ofbeing consistent in designing displays that present formation of the sametype. For example, a digital counter for quantitative information, movingpointers and color coding for qualitative or status information.
5.3.2 Mounting Displays
Displays that are read during operator surveillance rounds in the plantshould be readable from the surveillance path. This means that they shouldbe oriented so that the operator can accurately read them.
The letters and numbers on displays, such as gauge dials and digitalinstrument readouts, need to be readable from normal working positionsor surveillance paths. The operator should be able to read the display fromhead on, perpendicular to the operator’s line sight. This avoids parallaxerror, a misreading due to looking at the gauge or level indicator from aside angle. Safety-related displays should be in the operator’s primaryfield of vision (see Figure 5-7).
The required height of the displayed characters to be readable dependson the viewing distance and the criticality of the information. If a displayis to be viewed at a greater distance from normal working positions, the features have to be enlarged to maintain the same visual angle. Thefollowing formula may be used:
For example, if the viewing distance is 28 in. (0.7m) the height of acharacter should be between 0.1 and 0.2 in. (2 and 5mm). For a viewingdistance of 6 feet, the character height should be between 0.3 and 0.5 in.(7 and 13mm). If the viewing conditions are suboptimal, divide by 120instead of 200 to increase the character height.
Height of letters or figures in inchesviewing distance in inches
200=
172 Equipment Design
Ch05.qxd 11/21/03 09:22 PM Page 172
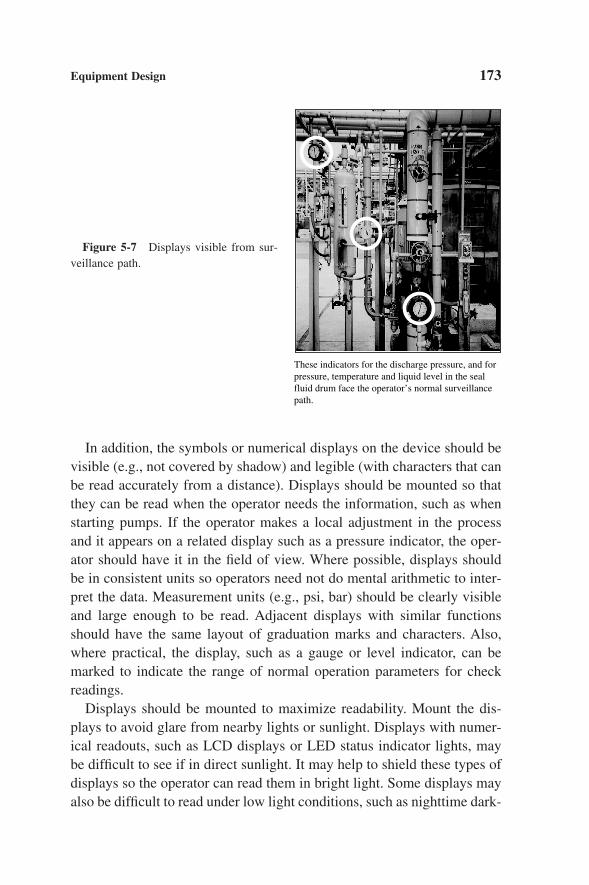
In addition, the symbols or numerical displays on the device should bevisible (e.g., not covered by shadow) and legible (with characters that canbe read accurately from a distance). Displays should be mounted so thatthey can be read when the operator needs the information, such as whenstarting pumps. If the operator makes a local adjustment in the processand it appears on a related display such as a pressure indicator, the oper-ator should have it in the field of view. Where possible, displays shouldbe in consistent units so operators need not do mental arithmetic to inter-pret the data. Measurement units (e.g., psi, bar) should be clearly visibleand large enough to be read. Adjacent displays with similar functionsshould have the same layout of graduation marks and characters. Also,where practical, the display, such as a gauge or level indicator, can bemarked to indicate the range of normal operation parameters for checkreadings.
Displays should be mounted to maximize readability. Mount the dis-plays to avoid glare from nearby lights or sunlight. Displays with numer-ical readouts, such as LCD displays or LED status indicator lights, maybe difficult to see if in direct sunlight. It may help to shield these types ofdisplays so the operator can read them in bright light. Some displays mayalso be difficult to read under low light conditions, such as nighttime dark-
Equipment Design 173
These indicators for the discharge pressure, and for pressure, temperature and liquid level in the seal fluid drum face the operator’s normal surveillance path.
Figure 5-7 Displays visible from sur-veillance path.
Ch05.qxd 11/21/03 09:22 PM Page 173

ness or in shadow. If possible, avoid unwanted shadows that shroud dis-plays. Also avoid optical distortion of the display caused by domed coversby using flat glass covers instead.
5.4 RELATIONSHIP BETWEEN CONTROLS AND VISUAL DISPLAYS
If a control and a display are related both in the machine and the oper-ator’s mind, it is important to ensure that the directions of their movingparts are compatible with each other and conform to the operator’s move-ment expectations. Further, the direction in which controls are moved toachieve a given result should be consistent throughout those parts of thecontrol system used by the same operator.
It should also be clear to the operator which equipment or status isaffected by the control being operated (see Figures 5-8 and 5-9). Forexample, if a control panel is for pumps used to fill three separate tanks,then it should be clear which control operates each pump that correspondsto the appropriate tank, as shown in figure 5-9.
174 Equipment Design
CloseStopOpen
Close
Stop
Open
Emergency Block Valves
Indicator Light
Control Button
(a) A variation of a control panel layout for operating a set of emergency block valves
Emergency Block Valves
Indicator Lights
Control Buttons
“Opening /Opened”
“Closing / Closed”
(b) Another variation of a control panel layout for operating a set of emergency block valves
Figures (a) and (b) are variations of a control panel layout for operating a set of emergency block valves. Displays and control that perform similar functions should be laid out in the same way. It is preferable to use consistent layouts within a facility—that is, consistently use either layout (a) or layout (b), but not both.
Figure 5-8 Consistency of motor operated valve controls and indicators.
Ch05.qxd 11/21/03 09:22 PM Page 174

A classic example of the relationship between controls and displays isthe burners on a kitchen stove and the knobs that turn each of the burnerson or off. Many studies have been conducted to understand which indi-vidual knobs people associate with each of the burners. Some importantlearning from these studies is that the arrangement people prefer may notbe the one that results in the fastest performance or fewest errors (Sandersand McCormick, 1987). In addition, there are population differences inpreference for the relationships of the knobs to the controls. And, theresults appear to be affected by whether the subjects are shown a drawingof a stove on paper or a physical model.
Therefore, just asking personnel for their opinions of how controls anddisplays should be arranged on an emergency control panel is not enough.The design effort should be augmented to include evaluation of a physi-cal prototype of the panel that measures the number of correct responsesof operators being able to operate the correct sequence of controls on thepanel. The prototype panel can be mimicked by using a paper and pencilsurvey with a rendering of the panel as a drawing or sketch, but the bestapproach appears to be a physical mock-up.
5.5 AUDITORY ALARMS
The advantage of using an auditory signal is that the operator need notbe looking at the display to notice it. Auditory alarms should be used to
Equipment Design 175
Panels Are Laid Out in the Same Order as the Equipment They Control
East Center West
East West Center
Not This
East Center West
East Center West
Do This
Figure 5-9 Consistency of control location in relation to plant equipment.
Ch05.qxd 11/21/03 09:22 PM Page 175

attract attention to a condition that requires action and not to announceinformation that requires no action. Auditory alarms are used to attractattention to local plant conditions (e.g., field panel alarms), attract and send messages to plantwide personnel (e.g., fire alarms, evacuationalarms, or mustering alarms), and attract the attention of operators withinthe control room.
Our perception of an alarm is determined by its frequency, amplitude,and modulating pattern. An audible signal that modulates is a signal withfluctuating frequency or amplitude over time. Sirens and warble tones arecommon examples of modulating alarm signals. For plant alarms, modu-lating signals are best because they tend to attract human attention betterthan signals made from a single tone (Eastman Kodak Company, 1983).
Each audible plant alarm that requires a unique response should havea clearly distinct signal. Studies at a nuclear power facility indicate thatpersonnel are able to identify 12 distinct signals when they can be com-pared to each other. But, if a person must choose to respond based onhearing a single alarm, limit the number of alarms to at most five distinctaudible signals (Sanders and McCormick, 1987). The best alarm signalsare those that
• Elicit fast response times from people who hear them.
• Are readily recognizable and the response action needed is clear.
• Can be heard over ambient noise (about 10dB above ambient noiseis recommended for emergency alarms) (Eastman Kodak Company,1983).
The following are characteristics for different types of plant alarmsbased on frequency (Sanders and McCormick, 1987):
• Best for quick response times (Sanders and McCormick, 1987) are“Yeow” (descending from 800 to 100Hz every 1.4 sec) and “Beep”(425Hz, on for 0.7 sec and off for 0.6 sec).
• Best frequencies for signal to travel through the plant are 500–1000Hz.
• Best for noise penetration and attracting attention are sirens andhorns.
176 Equipment Design
Ch05.qxd 11/21/03 09:22 PM Page 176
For control rooms, it is important to avoid alarms that cause “startle”responses, as some research indicates that startle responses degrade theperformance of the desired response and may cause mental stress (Sandersand McCormick, 1987). The best frequencies for control room alarms are200–1000Hz, and if there is ambient noise, a warbling signal is recom-mended (Eastman Kodak Company, 1987).
5.6 FIELD CONTROL PANELS
Field control panels contain displays and controls used to monitor andcontrol the operation of process equipment in a local area of the plant.The purpose of a field control panel is to provide important local infor-mation to the operator and local access to the plant equipment for safeprocess operation.
Important aspects of field panels include
• Completeness and accuracy of labels, signs, and instructions.
• All lights and indicators working, no “live” readings from discon-nected equipment.
• Good arrangement of controls and displays on the panel.
• Emergency panels and components are clearly visible and readilyaccessible.
One indicator of opportunity for the improvement of existing controlpanels is the presence of handwritten notes or labels that give instructionsor reminders, placed on the panels by operators or maintenance person-nel. These notes may be evidence of a history of confusion that someoneattempted to clarify by labeling the panel for others. This type of handlabeling has problems in that it may be inaccurate, difficult to read,unclear, and nonpermanent.
5.6.1 Field Panel Layout
When an operator walks up to a control panel, the function and iden-tity of each control on the panel should be obvious. This involves knowing
Equipment Design 177
Ch05.qxd 11/21/03 09:22 PM Page 177

what each control does to the status of the plant, and how the manipula-tion of the control results in that action. Some of this is achieved by good labels on the panel. An important contributor to the operator’s understanding of how the panel should be operated is the arrangement ofcontrols in relation to the displays or indicators and plant equipmentaffected. Another important consideration is how the arrangement of thecontrols and displays aligns with what the operator might expect.
When deciding how controls and displays should be arranged in frontof the operator, the goal is always that they can be used quickly, accu-rately, and without physical fatigue. For this reason an attempt is normallymade to ensure that complementary sets of components are arranged sothat they suggest to the operator how they should be used.
Decisions on how to group the controls and displays for a field controlpanel are based on five criteria (Sanders and McCormick, 1987):
1. Emergency use. Locate emergency controls in easily identified andeasily reached positions.
2. Functional grouping. Related functions are located together in aneasily identifiable fashion.
3. Sequence of use. Determine the more common operations performedat the control panel, then position the controls so those operationscan be performed by sequentially moving from one control to thenext (for North American operations, the standard sequence is fromleft to right and top to bottom).
4. Frequency of use. Displays with more frequent use should be locatedin the primary visual area and controls placed closer to the hands.
5. Relation of the panel itself to the equipment it operates. The panellayout of controls and displays be should be arranged on the controlpanel in a layout similar to the geographical locations of the equip-ment in the plant (see Figure 5-9).
The sequence of use can be divided into time sequence and functionalsequence. Time sequence suggests that, if controls or displays are nor-mally operated in some sequence, for example, switching a machine on,increasing rpm, moving spindles together, then they should be arrangedin that sequence. All the operator needs to do is follow the arrangementprovided, rather than work in an apparently random fashion.
178 Equipment Design
Ch05.qxd 11/21/03 09:22 PM Page 178

Function sequence suggests that controls and displays can be arrangedin terms of function, either within the temporal sequence or in terms of atemporal sequence of different functions. For example, the workspacearound an operator may include components concerning the start/stop, tem-perature, pressure, status, shutdown, and the like. It is suggested that allthe controls and displays related to any one of these functions be groupedtogether. Also, the different functions may be used in a temporal sequence.For example, the start/stop, then the temperature, then pressure, then status,and so forth. In such a case, group components not only according to theirfunction but also according to the order in which they are used.
The frequency of use principle suggests that controls and displaysshould be arranged in terms of how frequently they are used by the oper-ator. More frequently used components should be placed within easy sightand reach of the operator. On the other hand, some situations may arisein which rarely used but extremely important components, such as emer-gency controls, might be positioned well outside of the operator’s effec-
Equipment Design 179
(a) Emergency Shutdown (ESD) Panel without controls grouped by function
(b) Emergency Shutdown (ESD) Panel with controls grouped by function by placing shaded regions behind the buttons
Figure 5-10 Functional grouping on a control panel.
Ch05.qxd 11/21/03 09:22 PM Page 179

tive area if we rely only on the frequency of use principle. By their nature,they are operated infrequently, but when they are used, they need to beoperated quickly and accurately. The frequency of use principle, there-fore, must be tempered by importance.
The design, layout, arrangement, and installation of visual displays and controls affect the performance of the operator. Frequency of use,sequence of use, and importance are principles used to guide the designerto the best design. No single principle applies to all control panel designs.However, the principles should be used to create control and displaylayouts that are consistent from one location to another. This consistencyenhances human performance and reduces the potential for error (seeFigure 5-8).
Other guidelines for field control panel design include
• For large groups of controls use mimics instead of traditional panels.Mimics are control panels in which the displays and controls areimbedded within a schematic of the process flow depicted graphicallyon the panel.
180 Equipment Design
Do not use “Mirror Image” layouts like the arrangement of controls and displays shown in the bottom pair of panels.
96.0
Do This
1A 1B 1C 2A 2B 2C
1A 1B 1C 2A2B2C
Not This
96.0
96.0
96.0
Figure 5-11 Do not use “Mirror Image” layouts such as the arrangement of controlsand displays shown in the bottom pair of panels.
Ch05.qxd 11/21/03 09:22 PM Page 180

• Avoid mirror image layouts (See figure 5-11).
• Locate displays above their associated controls. Displays may belocated beside their controls if the association is clear controls andthe displays they affect should be as close together as possible.
• Ensure that the panel can be accessed by the user population (seeFigure 5-12).
• Ensure adequate control instructions and feedback that the control hasbeen activated.
• Select and mount the various panel components so that cleaninginstrument displays, recorders, and control devices should be possi-ble without affecting the process or requiring much dismantling.
5.6.2 Field Panel Labels
Each control panel should be identified with a human readable label,such as “title,” located at the top-center of the panel. The various com-ponents of the control panel should also be labeled: subsections or dedi-cated areas of the panel, displays, and controls. For the subsection labels,center the labels with the title for the panel subsection at the top of thesection and within the demarcation lines. The label placement, terminol-ogy, and text should be consistent within the control panel and across theplant (see Figure 5-13).
Avoid using one large label at the top or bottom of a series of controlsor displays. Label each set of controls and displays separately. Labels forthe controls and displays should include a functional description on thetop line and the process tag number of the equipment below the functionaldescription.
Control labels should be centered above the control so the worker’shands do not obstruct the label while manipulating the control. For con-trols, the labels that indicate the position of the control should indicate thefunctional result of the movement; for example, ON, OFF, PUSH TOTEST, and INCREASE (see Figure 5-14).
Labels for displays should be centered on or under the display. For dis-plays of measurements, such as gauges, dials, or digital readouts, the labeltext should indicate what is measured, such as level, voltage, or pressure.
Equipment Design 181
Ch05.qxd 11/21/03 09:22 PM Page 181

2030 80
1780 70
1525 60
1270 50
1015 40
765 30
510 20
255 10
0 0
mm inches
Precise Displays• precision reading • frequently used• emergency
1189–1790 mm (46.8–70.5 in)
**Gross Controls510–945 mm
(20–37 in)
Gross Displays1790–2030 mm
(70.5–80 in)
ClearanceMinimum = 28 in (710 mm)
Preferred = 36 in (915 mm)
(a) Control Panel Layout—North American/European
Gross Displays• status lights• low accuracy
510–1189 mm(20–46.8 in)
No controls and displays below 510 mm (20 in.)
**Gross Controls1333–1650 mm
(52–65 in)
*Precision Controls 945–1333 mm
(37–52 in)
*Precision Controls are frequently used controls that require accurate and specific settings such as rotary selector switches and thumbwheels
**Gross Controls are controls that do not require precision such as push buttons, levers, and cranks
mm inchesClearance
Minimum = 28 in (710 mm)Preferred = 36 in (915 mm)
(b) Control Panel Layout—Singaporean2030 80
1780 70
1525 60
1270 50
1015 40
765 30
510 20
255 10
0 0
Precise Displays• precision reading• frequently used• emergency
1054–1669 mm (41.5–65.7 in)
**Gross Controls 465–790 mm
(18–31 in)
Gross Displays1669–1950 mm(65.7–76.79 in)
Gross Displays• status lights• low accuracy465–1054 mm(18–41.5 in)
No controls and displays below 465 mm (18 in.)
**Gross Controls1255–1570 mm
(49.4–62 in)
*Precision Controls 790–1255 mm(31.1–49.4 in)
*Precision Controls are frequently used controls that require accurate and specific settings such as rotary selector switches and thumbwheels
**Gross Controls are controls that do not require precision such as push buttons, levers, and cranks
Figure 5-12 Panel design for populations with different physical sizes: (A) NorthAmerican, (B) Singaporean.
Ch05.qxd 11/21/03 09:22 PM Page 182

The units of measure (meters, volts, psi) should appear on the face of thedisplay not on the label. If the label is for a sensor, then it should indicatethe equipment it is sensing; for example,
Ballast PumpPressure Safety LowPSL-1200
The text on the labels should be readable from the operator’s viewingdistance; for example, while using the panel or scanning the panel to selecta display or control. The label should be mounted horizontally where pos-sible, so that the text can be read from left to right. Black text on white
Equipment Design 183
Label
Subsection 1 Label
Label
Label
Label
Label
Subsection 2Label
Main Control PanelLabel
Figure 5-13 Placement of labels on a field panel.
Ch05.qxd 11/21/03 09:22 PM Page 183

labels is recommended for most situations. Use all uppercase letters if thelabel consists of three or fewer words, and use mixed upper- and lower-case for labels consisting of more than three words.
Labels should be made out of a durable material, such as engravedplastic or UV-protected vinyl. If engravings become filled with dirt, theycan be covered with clear plastic. Attach labels using a permanent method,such as adhesive or screws. Do not place labels on controls that can turn.
Escutcheon plates are large labels used to show groupings of displaysand controls. The escutcheon plates may be simple shapes or designed asgraphic illustrations of the component being labeled.
5.6.3 Improving Field Control Panels
Many improvements can be made to field panels without redesigningthem from scratch. In some cases, just clarifying the labels and addingmarkings to clarify groupings is a good enough fix. In cases where thereis confusion about which controls operate which equipment or which indicators link to which equipment, the controls should be fixed so thatconfusion is eliminated.
184 Equipment Design
Do This
Not This
Burner Power
OFFON
Burner ON-OFF
Figure 5-14 Design of label content for controloperation.
Ch05.qxd 11/21/03 09:22 PM Page 184

Equipment Design 185
Finally, redesign of the control panel may be indicated if several of theabove improvements are needed and some controls must be moved tolocate them within reach, out of the range for accidental activation, withina functional group, or close to the corresponding display. Any related dis-plays should also be considered in the redesign effort.
The general steps to design or modify a control panel are
1. Identify type of information that should be displayed and adjust-ments to be made.
2. Select instrument types for controls and displays that best match thetypes of information displayed and the adjustments to be made.
3. Specify the design of each control and display based on humanfactors design guidelines (refer to Control Panel Layout in Appen-dix 5-1). Determine strategy to prevent accidental activation of con-trols that could result in serious misoperation.
4. Select a scheme for organizing the panel elements. The preferredway to organize panel elements is by function, layout consistency,and critical instruments. Secondary criteria are sequence and fre-quency of use. If a mimic is used, ensure that it accurately followsthe process.
5. Work out the overall layout of the panel and determine spacingrequirements between elements and groups, placement of labels,supporting demarcation or details to define the groupings, and label-ing or coding techniques.
6. Specify access (physical and visual) requirements for maintenanceand operation and lighting requirements.
5.7 PROCESS CONTROL DISPLAYS
Process control displays are the screens that a control room operatoruses to monitor the process via a computerized distributed control system(DCS). These displays are typically on video display unit (VDU) moni-tors; for example, desktop computer monitors. Some control rooms mayhave additional displays that are “hardwired” emergency systems. These
Ch05.qxd 11/21/03 09:22 PM Page 185
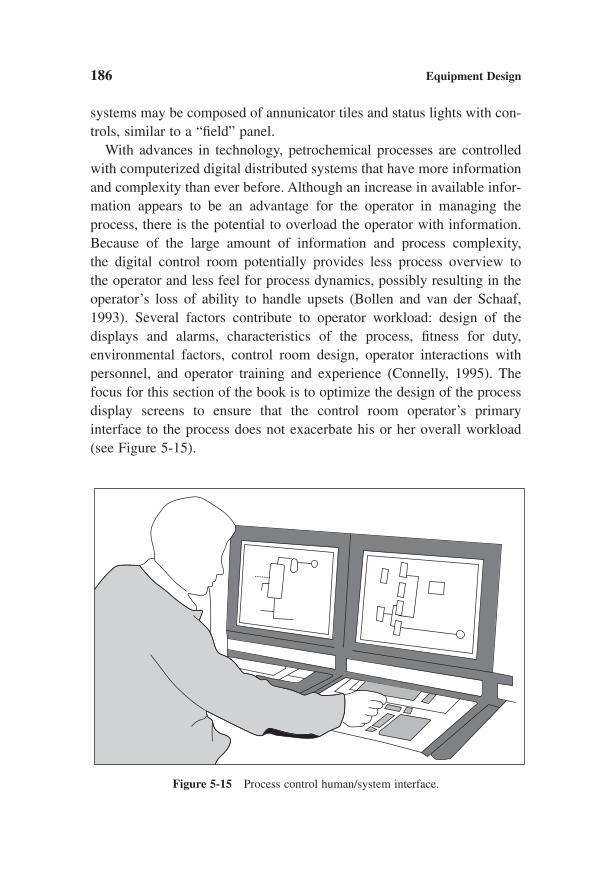
systems may be composed of annunicator tiles and status lights with con-trols, similar to a “field” panel.
With advances in technology, petrochemical processes are controlledwith computerized digital distributed systems that have more informationand complexity than ever before. Although an increase in available infor-mation appears to be an advantage for the operator in managing theprocess, there is the potential to overload the operator with information.Because of the large amount of information and process complexity, the digital control room potentially provides less process overview to the operator and less feel for process dynamics, possibly resulting in theoperator’s loss of ability to handle upsets (Bollen and van der Schaaf,1993). Several factors contribute to operator workload: design of the displays and alarms, characteristics of the process, fitness for duty, environmental factors, control room design, operator interactions withpersonnel, and operator training and experience (Connelly, 1995). Thefocus for this section of the book is to optimize the design of the processdisplay screens to ensure that the control room operator’s primary interface to the process does not exacerbate his or her overall workload(see Figure 5-15).
186 Equipment Design
Figure 5-15 Process control human/system interface.
Ch05.qxd 11/21/03 09:22 PM Page 186
The optimal interface takes best advantage of the technology, helps theoperator effectively manage normal and abnormal operations, yet does notoverload the operator during abnormal operations. The operator interfaceconsists of information and alarms displays in the screens as well as theconsole unit (e.g., keyboard, touch screen, control panels). It is the majortool used by the operator to sense what is happening with the process andmake adjustments. Therefore, the design of the operator interface is critical because it influences how the operator perceives, understands, andacts on the process.
The guidelines summarized in this chapter describe the features ofeffective process control display screens. The content of the displaysshould be designed with the approach described in Section 5.7.2.
5.7.1 Process Control Display Interface
Examples of potential problems with process control interfaces include
• Nuisance alarms and alarm flooding.
• Lack of coding for alarm priority.
• Alarm sounds that have been disengaged because they startle theoperators.
• Inconsistent or overuse of color coding for data and especially ongraphics.
• Information displayed in groups that are not functionally related.
• Graphics that are inconsistent with the actual process.
• Individual displays that exceed the recommended density of infor-mation packed onto a single screen.
• Critical values or equipment that are unlabeled.
• Instrumentation that is out of service but displays a “live” inaccuratevalue.
The operator is usually able to compensate for any one of these situationsin normal and smooth operating conditions, but the compensation strat-
Equipment Design 187
Ch05.qxd 11/21/03 09:22 PM Page 187

egy may break down during periods of high stress, such as unusual orupset situations, or if the operator must compensate for multiple andsimultaneous problems.
The International Standards Organization has standards for controldisplay interfaces (ISO, 1999a, 1999b), as do several other organizations(International Instrument Users’ Associations, 1998a, 1998b, 1998c;Instrument Society of America, 1985, 1986, 1992, 1993, 1995a, 1995b;Mulley, 1994; Gilmore, Gertman, and Blackman, 1989). Other sources ofcontrol system guidelines include industry and government regulations forfossil and nuclear power plants (O’Hara et al., 1994; O’Hara, 1993;Rankin et al., 1985; U.S. Nuclear Regulatory Commission, 1981; ElectricPower Research Institute, 1981). These sources include lessons learnedand recommendations that have been published on disasters such as Three Mile Island, Piper Alpha, and Bohpal. Because the operator interacts witha digitally controlled plant through a computer, some human/computerinterface guidelines are also appropriate (U.S. Nuclear Regulatory Commission, 1982).
5.7.1.1 Display Hierarchy
Levels of hierarchy help the operator navigate the process control dis-plays. The top level is a system overview that contains key process andemergency alarms, fire and gas alarms, and key process information. Inaddition, this level could also display locations of open hot work permits.The next level of displays provides process overviews for each area of theplant. These displays include schematics of process flow, equipment, andintegrated alarms within the process. Within this level of hierarchy alsoshould be a start-up display that includes the parameters the operatorneeds to monitor the start-up process. A third level of hierarchy containsmore detail about subsections of the plant or equipment (e.g., detail oftrays in a tower or multiple temperatures in an exchanger). Ready accessto the shutdown controls should be provided without forcing the operatorto dig down into the hierarchy to find them.
5.7.1.2 Contents of Displays
Display contents should be based on the operator’s tasks. Contents ofdisplay screens consist of both static and dynamic components. Static
188 Equipment Design
Ch05.qxd 11/21/03 09:22 PM Page 188

information remains the same on the screen and does not change, such asthe process flow lines, titles, and equipment symbols. Dynamic informa-tion is the portion of the display that changes, such as displays of real-time instrument readings and status of equipment. Examples of dynamicinformation include pressure, temperature, and flow data and the status ofvalves and pumps. A single display screen may include a schematic of theprocess, with a table of critical values, a trend chart for one of the criti-cal values, and a selectable pop-up of temperatures within a reactor. Given the increasing display capabilities of distributed control systems,contents of displays need to be thought out to avoid producing cluttereddisplays that are poorly structured and increase the operator’s mentalworkload.
It is important to systematically select and organize the information theoperator needs on the display screens, as there are thousands of data pointsfrom which to choose. Connelly (1995) recommends that display systemsavoid overloading short-term memory by minimizing the number of dis-plays and placing more functionally related information on each display.It is better to have operators comparing information on a single screenthan to try to make comparisons of data across screens by holding the datain short-term memory. Displays that are dense but well structured can be suitable and clear to expert operators (Connelly, 1995). To support high-density displays, ensure that alarm signals are salient and key processvariables and alarms are available in an overview. To increase displaydensity while minimizing a “cluttered” effect, use effective color codingand “pop-up” supplementary data in windows. Consider providing anoverview that displays status of key process variables and other indications.
5.7.1.3 Display Layout
The components of each display, such as the display title, alarm list,dedicated navigation targets, and main area for graphics, should be locatedconsistently on the screen. For example, the title always is at the top left,the list of areas of the plant with active alarms is always at the top rightof the screen, and the navigation targets (back, next, overview) are locatedbelow and to the left of the main screen area.
Equipment Design 189
Ch05.qxd 11/21/03 09:22 PM Page 189

5.7.1.4 Abbreviations and Labels
Abbreviations and labels should be standardized and used consistentlywithin the system. Equipment should be labeled within the graphic areathat defines the equipment. Exceptions are pumps, filters, heaters, andvalves, which have shapes and corresponding tag numbers that identifythem to the operators.
5.7.1.5 Alarms
An alarm requires operator action; therefore, only the conditions thatrequire operator action should be assigned an alarm priority. An alarm pri-ority scheme ranks each alarm level and ensures that the alarms are con-sistently assigned appropriate priority. One example of a scheme for anuclear power plant is based on the following criteria (Chang et al., 1999):
• Role of component, essential versus support. A component is essentialif equipment accomplishes a main function; otherwise, it is support.
• Impact. Severe means that the situation threatens operability, middlemeans that it degrades performance, slight means that performanceis minimally affected.
• Response time. Urgent means that the situation requires immediateoperator attention, imminent threat; intermediate means that action isrequired but not immediately.
An established alarm priority scheme avoids problems with inconsistentinterpretation and assignment of high-priority alarms. One example ofhow a team can develop an alarm philosophy and standardize alarm cat-egorization is to use a matrix such as the one shown in Figure 5-16, basedon potential severity and urgency to classify alarms consistently.
This way, there is no doubt by the operator in interpreting the relativepriority of the alarm. The use of this method also helps prevent too manyalarm states from being identified as high-priority alarms. Another aspectof the alarm philosophy is how an active alarm is consistently presentedto and acknowledged by the operator.
Each alarm should be assigned a consistent code, such as color, symbol,and tone, with codes selected to convey the priority of the alarm to theoperator.
190 Equipment Design
Ch05.qxd 11/21/03 09:22 PM Page 190

The following are some alarm guidelines:
• Rationalize the alarm system to an acceptable relative number ofalarms.
• Use a minimum number of priority levels; for example, three (high,medium, and low).
• Do not assign alarms to status information that requires no operatoraction.
• Minimize nuisance alarms.
• Ensure alarm priority is consistently assigned.
• Ensure that the alarm coding scheme is meaningful to the operatorsand conveys appropriate priority.
• Ensure that alarms are coded by combinations of schemes, such asboth color and symbol, and audible tone.
• For control rooms, avoid alarm tones and loudness that startle theoperator.
Technologies are being developed to aid the operator in identifying apotential abnormal process condition, tracking its development, and inter-
Equipment Design 191
Urgency
Severity
Minor Major Severe
<5 min
5–30 min
>30 min
Emergency
Warning
Caution
Figure 5-16 Example alarm priority matrix.
Ch05.qxd 11/21/03 09:22 PM Page 191

vening to resolve the problem. One concept of this type of tool is a seriesof windows that bring up relevant process diagrams, alarm trends, andprocess parameter trends for a particular problem (Kawai, 1997). Anotherconcept integrates online emergency procedures linked to process variables and relevant displays to confirm steps of the procedure (Changet al., 1999).
5.7.1.6 Text Messages
Text messages in displays should be simple, use mixed upper- and low-ercase letters, and be understandable to the operator.
5.7.1.7 Lines and Arrows
In displays, lines are used to represent process flow lines, and arrowsrepresent the direction that the contents are flowing. Distinguish betweenmain and secondary flows by line thickness. The standard flow directionis from left to right. Label all entry and exit path lines. Avoid crossinglines, clearly distinguish them. The preference is that, if lines cross, themain line should remain intact and the crossing line can be representedby an arc across the line or by leaving space on either side of the mainline. Ensure arrowheads look different than valves.
5.7.1.8 Numeric Values
Display numbers only to the significant decimal point needed by theoperator for accuracy (e.g., does the operator need to know that the pressure is 75.046, 75.05, 75.1, or 75psi?). Suppress leading zeroes except for use in decimals, where one leading zero should be used. Display all numbers upright and include units of measurement next to the number. For values in columns or imbedded tabled values, line up the decimal points. The operator may need only a qualitative indicationof a data point, in which case it is better to provide that than a numericvalue. Do not require the operator to hold figures or numbers in memoryto perform mental arithmetic, calculations, or conversions between units.
192 Equipment Design
Ch05.qxd 11/21/03 09:22 PM Page 192

5.7.1.9 Use of Color
The effective use of color can decrease the time required to search forsalient signals, such as alarms (Van Laar and Deshe, 2002). When devel-oping a display, a suggested way to prevent the overuse of color is todevelop the layout and design of the display before introducing the color-coded elements. Color is typically used for coding priority of alarms, indi-cating if valves are open or closed, on/off status of equipment, identifyingmaterials in the process flow, or distinguishing between plant areas, suchas two identical process trains. The use of color on process displays shouldbe meaningful, and the color on the display should not be used just foraesthetics. Where color is used as an identification code, ensure it is usedconsistently within each display, between displays, and with other codingsystems the operator encounters. The use of color coding should be redun-dant with another coding scheme, as shown in Table 5-2.
Equipment Design 193
TABLE 5-2
Example of a Color Coding Scheme for Process Displays
Display Feature Color Code Additional (Redundant) Codes
Emergency, high-priority alarm Red Letter H for high priority, flashing symbol
Caution, medium-priority alarm Yellow Letter M for medium priority, flashing symbol
Warning, low-priority alarm Cyan Letter L for low priority, flashing symbol
Utilities feeder/returns, reagent White Line style-thin line, text labelsfeeds, drains
Crude oil, processed oil Green Line style: medium thickness; text labels
Condensate, produced water Orange Line style: medium thickness; text labels
Gas, vents, flare lines Magenta Line style: medium thickness; text labels
Background detail, control Blue Line style; dashedlogic connections
Source: Modified from Danz-Reece and Noerager, 1998.
Ch05.qxd 11/21/03 09:22 PM Page 193
Attention-getting features such as bright colors (red, yellow, cyan) andflashing or blinking should be limited to portions of the display thatdemand operator attention. For example, flashing or blinking should notbe used just to indicate that a piece of equipment (e.g., a fan) is undernormal operation. Good uses for flashing are to indicate unacknowledgedalarms and indicate valves changing position; that is, in the process ofmoving.
5.7.1.10 Display Access
The operator should be able to readily locate each display as well ascritical controls from within the system. The operator should have multiple approaches available for calling up the displays. Examples ofthese approaches include
• Menu list of available displays by title and area covered.
• Process overview overlaid with navigation targets for access to moredetail on an area schematic.
• Process lines labeled with targets that the operator can use to viewthe next schematic downstream or upstream of the current view.
• Alarm summary list with access to the page of each alarm.
• Text input of title name.
• Search tool by phrase or name of display.
• Next and Previous navigation buttons.
Active or “hot” areas on the display that support navigation, such as arrowsymbols or named rectangular targets, should be obvious to the operator.One method of doing this is to change the appearance of the target if themouse cursor floats over it (e.g., from an arrow to a hand).
5.7.1.11 Symbols
In process displays, equipment is represented by symbols. The symbolsused should be standard, used consistently, and meaningful to the opera-tors. In addition, the symbols should be clearly distinct from one another.
194 Equipment Design
Ch05.qxd 11/21/03 09:22 PM Page 194

The Instrument Society of America (ISA) provides a standard for graphicsymbols in process displays (1986).
To summarize some guidelines for process control displays, we recommend
• Displays support the operators’ tasks.
• Navigation through the displays be compatible with how peopleoperate.
• Displays allow selecting directly and moving backward and forward.
• Displays not be cluttered.
• Display layouts be consistent.
• Screens be labeled and similar screens for different processes not beconfused.
• Display information be presented in the proper format.
• Symbols be standardized.
• Color be used as a redundant code to clarify information.
• Information be grouped for clarity.
• Information not require mental conversion to be usable.
• Text messages be simplified to aid understanding.
5.7.2 Approach for Developing Process Control Displays
Optimal design of the operator interface begins with the conceptualdesign. Although the application of human factors techniques can signif-icantly improve an existing interface, it is preferable to apply these tech-niques during the initial design of the control system. Human factorsprinciples apply to all stages of design, including new acquisition, modi-fication, upgrade, or near-term enhancement of equipment. Human factorsprinciples are integrated into the design process in steps that correspondto increasing levels of detail design. The steps to design the interfaceaspects of the process control system are best approached by a team con-
Equipment Design 195
Ch05.qxd 11/21/03 09:22 PM Page 195

sisting, at least, of a process engineer, control system technician, experi-enced board operator, inexperienced board operator, and a human factorsspecialist. Human factors should be thoroughly considered throughout thedesign process, beginning with the initial scoping of the project and selec-tion of equipment to the conceptual and preliminary design of the screens,as well as at the detailed design level. The activities to integrate humanfactors into the control system design are (Danz-Reece and Noerager,1998).
• Conduct an initial survey.
• Scope the design or improvement effort.
• Prepare the design team.
• Brief the board operators.
• Execute the design.
• Obtain user feedback.
• Transfer to the new system.
5.7.2.1 Initial Survey
Conduct an initial survey of the existing system to identify aspects thatcan be improved. A human factors specialist is trained to evaluate thesystem interface according to specific design criteria. Examples of toolsthat specialists use include guidelines to perform a tabletop review of theexisting displays, interviews, questionnaires administered to users of thesystem, and objective assessments such as mental workload while per-forming a task on the system. If a complete transfer from analog to digitalcontrol will take place, the initial survey is more detailed and emphasizesthe identification of the performance requirements and goals of the newsystem rather than evaluation of the existing system.
The design process differs slightly depending on whether the controlsystem is being implemented for the first time, converted from an analogto a digital system, or upgraded to an improved digital system. In all cases,provisions must be made for involving the users (board operators, systemtechnicians, and system maintainers) in the design process and the inter-
196 Equipment Design
Ch05.qxd 11/21/03 09:22 PM Page 196

face evaluation and developing training and providing structured userpractice on the new system.
5.7.2.2 Scope the Improvements
Based on the results of the initial survey, define the scope of improve-ments. These can include near-term improvements such as simple quickfixes and long-term improvements such as modifications or upgrades. Ifa new system is to be acquired, human factors considerations should beincluded in the equipment selection. Human factors considerations varyaccording to whether the system is analog or digitally controlled, withcontrol panels or computer screens as interfaces to the operator.
For example, a number of near-term fixes for existing analog systemsand corresponding control panels can be applied to improve the organi-zation of information to the operator. Some examples include addingdemarcation lines to group panels of displays or controls, adding labelsto indicate sequence of control use or display checking, identifying thematrix of annunciator tiles with row and column codes, and organizingannunciator tiles in process groups. These enhancements to the organiza-tion of information are more complex in a computerized digital systembecause screens and the items on them may have to be reprogrammed andreinstalled on the system.
Planned milestones and resources may be revised after the design teamhas been trained and further examines the system. At that time, neededevaluations and actions can be better defined, and the plan may needrefinement.
5.7.2.3 Prepare the Interface Design Team
The operators are the key players in the interface design process andprovide an abundance of useful information for design decisions. Whileoperator preference and opinion is important, it must be drawn out andapplied judiciously. Research studies have shown that situations preferredby users do not necessarily result in the best performance outcome. Rather,the situation designed with human factors principles results in the bestperformance and fewest errors while performing the task. The approachdescribed by Eason (1994) is to “design for the users with the users,”instead of “design for the users” or “design by the users.” This is accom-
Equipment Design 197
Ch05.qxd 11/21/03 09:22 PM Page 197

plished by operator participation on the interface design team and train-ing the team in basic human factors principles and techniques applied toprocess control design.
5.7.2.4 Brief the Board Operators
Successful introduction of a new system depends on board operatorbuy-in. Earn the buy-in of the operators who use the system by providingthem awareness about human factors and process control design. Opera-tors aware of human factors examples are well equipped to add value tothe design process and survey activities.
Use operator input constructively to improve the design throughout thedesign process. Invite operator input on the control system setup and dis-plays by posting paper mock-ups in a special area of the control room bul-letin board easily accessed by operators; invite volunteers to review themock-ups and lead informal discussions. Additional review and designevaluation techniques, such as usability tests, are covered in the section“Obtain Operator Feedback.”
Advise operators of the design team’s progress. Notify them about theprogress by posting a special project newsletter and announcing mile-stones at shift meetings.
5.7.2.5 Execute the Interface Design
Design of the interface occurs over three phases: conceptual, prelimi-nary, and detailed design (Stultz and Schroeder, 1988). The conceptualdesign phase is the most important phase from a human factors point ofview because critical decisions are made about how the interface willpresent information to the operator. Once these basic issues are addressed,the preliminary and detailed design phases are used to assign specificcontent and format to the information presented to the operator.
Conceptual design involves the development of the relationshipsbetween the groups of displays within the system and their organizationand hierarchy according to the process. This phase is a checkpoint fordetermining if the features of the selected hardware accommodate the con-ceptual design criteria, such as the number of available areas and groupsand the format of alarms. Other issues addressed during conceptual design
198 Equipment Design
Ch05.qxd 11/21/03 09:22 PM Page 198
include the number of keystrokes and the type of input/output device usedto access each level of the hierarchy, response requirements of the hard-ware based on results of task analysis, control strategies (such as accessto displays and changing set points and controller states), and feedbackfrom the system to the user. Availability of menus, overviews, help, func-tion keys, and custom keys should also be planned during the conceptualdesign.
Whether in an initial design or a retrofit, the organization of informa-tion determines the criteria for the remaining design decisions for thecontrol system. Analysis of operator functions, such as start-up or shut-down of a particular system, is used to determine several fundamentaldesign decisions, including the minimum number of monitors required, thenumber and identification of areas, and the number and identification ofgroups and graphics within the areas. The relationship of the groups andareas to each other is also important; for example, in chemical operationsit may be necessary for the operator to clearly distinguish one train fromanother. The use of functional analysis also aids the development of pro-cedures quite well, so the effort invested is effectively used (Pikaar, 1986).
To make these decisions, the design team can be trained to use a tech-nique called task analysis to define and analyze operator functions in managing the process. Examples of operator functions include start-up,shutdown, changing batches, handling various upsets, and monitoringnormal operations. Task analysis techniques are discussed in Chapter 7 ofthis book. A recommended practice to analyze the operator control roomtasks is available from the Instrument Society of America (1993). Thetasks required to successfully complete each function are defined and analyzed for the following information (Staples, 1993):
• The cue that prompts the operator to perform the task.
• The information that tells the operator the computer has understoodthe task request.
• The communication contacts required to perform the task.
• The criteria the operator evaluates to determine if the task was per-formed correctly or incorrectly.
• The factors that affect the likelihood of successful task completion.
Equipment Design 199
Ch05.qxd 11/21/03 09:22 PM Page 199
• The information the operator needs to know to take an action (e.g.,procedures).
• The physical actions required to complete the task.
• The potential errors.
• The likely causes of each potential error.
• The consequences of each potential error,
• The ways in which the potential errors can be recovered.
• The priorities of the consequences.
• Rating the task itself on time criticality and importance.
The information identified in the task analysis is used in the preliminaryand detailed design phases to select the contents of displays, identify nec-essary special displays, analyze mental workload and staffing issues, iden-tify training needs, and perhaps develop operating procedures.
The tasks and functions are analyzed to determine whether the opera-tor or the computerized system is better equipped to perform particulartasks and actions. This, called functional allocation, assigns tasks andfunctions to a person or computer depending on the type of task, its com-plexity, frequency of execution, and the like (Boff and Lincoln, 1988).More advanced analysis techniques can be used to develop displays thatcan improve operator understanding of the technical complexity anddynamics of specific multivariable processes (Olsson and Lee, 1994;Vicente and Rasmussen, 1990).
Information from the operators who will use the system supplementsthe task analysis and helps tailor the control system interface to the spe-cific site needs. For example, the board operators provide input on howan existing interface could be improved by answering questions abouttheir most difficult or confusing tasks, features of the system they find difficult to use, features of the system that they prefer, the colors that they associate with the priority of alarms or parts of the process. Inter-views with open-ended questions can be used as well as questionnaires(Pennycook and Danz-Reece, 1994). In addition, objective methods can be used to measure mental workload while using the existing system(see more in the “Obtain Operator Feedback” section).
200 Equipment Design
Ch05.qxd 11/21/03 09:22 PM Page 200

Another source of information used to supplement the task analysis is the lessons learned from industry and site incidents, near misses, andoperator logs. Site records may indicate particularly difficult functions or upset situations and those functions or tasks prone to error in pro-duction, quality, or safety. Lessons learned from the industry are examples of complex scenarios that resulted in severe consequences, andrecommendations in reports can be reviewed and included in the designif appropriate.
The preliminary design phase involves the determination of the total number of displays needed, development of the alarm philosophy,identification of special displays, type of information required on each display, and development of the coding philosophy, such as identi-fication of transmitters, controllers, areas of the process, materials, and so forth.
During this phase, the team develops and agrees on the interface designstandards that will be documented as a “style guide” for the project. Inter-face standards should be used consistently for all displays.
During the detailed design phase, each display is planned and enteredinto the system. During this phase decisions are reached about the formatof the information on each display; for example, the information could bedisplayed as columnar data, in a plot, in a chart, as a figure, written astext, or as a combination of these on a single page. For retrofit situations,each display is evaluated and, if necessary, targeted for improvement. Thepriority of the information is assigned, and the format of the informationis selected so that the priority and content of the information are best conveyed to the operator. Guidelines for detailed interface design are discussed in Section 5.7.1.
5.7.2.6 Obtain Operator Feedback
Evaluation of the design is not actually a final step in a series but a stepthat should occur in parallel with the previously described steps. Designevaluation can be in the form of informal and formal surveys, mini-testsor trials with groups of operators, situation walk-throughs using paper orcomputerized mock-ups, and full evaluation of a single new controlstation (van der Schaaf and Kragt, 1992). Evaluations can also include
Equipment Design 201
Ch05.qxd 11/21/03 09:22 PM Page 201

objective measurement of an operator’s mental workload under varioussituations and observation of how the operator locates data and what dataare important to the operator’s current decision.
The difference between user preference and performance is an impor-tant distinction when evaluating user feedback. Feedback from usersshould be structured so that areas of improvement are indicated by theoutcome of using the system while performing a trial (van der Schaaf,1989, 1991). For example, some observations might be “could not locatescreen for controller P-141,” “schematic on the A unit is confusing,”“operator did not know where to find the tag description,” or “locating thecontrollers that indirectly lower the plate #5 temperature took longer than we can allow under actual circumstances.” Observations like these are based on the results of an operator using the system to performa task (or a simulated task) rather than a judgment of a screen’s appear-ance, such as “the colors look nice—in fact, add more of them—I like lotsof color.”
Incorporating operator feedback and experience into the system shouldbe an ongoing process. Operator feedback on new individual screens canbe obtained from paper or computer screen mock-ups. The paper mock-ups can be examined by each operator for accuracy and consistency inlayout. In addition, a group of paper mock-ups can be used to simulatethe series of screens that would be used to handle a particular situation,to determine if the information required by the operator is actually avail-able on the screen.
A software prototyping tool can be used to mock up a series of screenswith dynamic features to more closely mimic the actual system. This toolcan be used to evaluate different color coding and alarm coding strate-gies. Also, operators could keep a log book to record their difficulties with using the system to help identify aspects of the system that needimprovement.
5.7.2.7 Transfer to the New System
It is recommended that transfers to a new system occur gradually(Bollen and van der Schaaf, 1993, recommend 9 months). The first trans-fer step actually begins during the design process, as operators evaluatethe proposed mock-ups. The mock-ups can be made available to the oper-
202 Equipment Design
Ch05.qxd 11/21/03 09:22 PM Page 202

ators by installing a single read-only unit in the control room early in thedesign. It is suggested that the completed screens in view-only format beprovided to the operators for an extended period of time (Bollen and vander Schaaf recommend 6 months) before the old screens are dismantled.During this period, formal and structured training should be provided toorient the operators to the new system and its features. After the formalfamiliarization period, the new units can be made operational in parallelwith the old system (Bollen and van der Schaaf recommend 3 months).After this period to ensure familiarization and confidence with the newsystem, the old system can be dismantled.
The training and adjustment of the operator to the new system is criti-cal, particularly in the case of converting from an analog to digital controlsystem. In the analog setup, the operator was accustomed to the informa-tion available at a single hierarchy—a glance around the room. The oper-ator had a mental picture of the room and the process, and there wasprobably a “blackboard” concept in effect, meaning that, if the unit wasoperating within limits, the displays were not lit or lit green (Rankin et al., 1985). However, introducing a digital control system requires thatthe information be layered and accessed in steps through the computerinterface. The operator now has to modify the mental image of the processfrom a single hierarchy to a layered hierarchy, which steps from area togroups by increasing levels of detail. Also, the glance around the room isno longer available to the operator as a status check; this is replaced witha walk-through of selected computer displays.
The effectiveness of operator training on the new system not onlyinvolves familiarization with the organization of the screens but also withthe hardware itself. This includes a thorough understanding of codes andsymbols as well as the functions of all keys and available display options.These concepts are best learned with a formal introduction to the systemfollowed by structured practice.
5.7.2.8 Summary
Integration of human factors/ergonomics considerations into the designof the process control interface requires coordinating and executing teamactivities to optimize usability of the interface, resulting in numerous benefits:
Equipment Design 203
Ch05.qxd 11/21/03 09:22 PM Page 203

• Reduced rework of the system after it has been installed. Some mod-ifications and adjustments are expected, just not as many and not asdrastic as they might have been without human factors input to thedesign.
• Concurrent development of sound and well-documented operatingprocedures based on human factors principles, preventing a dupli-cated effort to produce procedures after the fact.
• Identification of specific training needs for board operators.
• Identification of specific tasks and functions that are documented andcan be incorporated into the description of the board operator’sresponsibilities.
• Selection of control hardware and software features that accommo-date the process goals and the operators’ capabilities.
• Thoroughly considered potential for errors, consequences, and pointsof recovery for the tasks. This information is used for the humanfactors considerations in human reliability assessments and is avail-able for further analysis.
• Operator and personnel buy-in and understanding of the new system.
• Members of the design team trained in human factors and ergonom-ics principles have lasting practical knowledge that can be applied toother projects.
• Most important, a control system interface configured to help theoperator manage the normal operations and control the upsets, toreduce the potential for error in operation.
5.8 CASE STUDY
This case study shows how an emergency control panel was improvedsolely by improving the labeling (Swensen, personal communication,2000). A review of the original design, shown in Figure 5-17, indicatedthe following deficiencies:
204 Equipment Design
Ch05.qxd 11/21/03 09:22 PM Page 204

• Lack of color coding to indicate that the panel contains controls toisolate an area in the event of an emergency.
• Labels placed below the controls, so that they could be obscured bythe hands while activating the controls.
• Lack of clarifying instructions on how the controls on the panelsshould be operated.
• Placement of labels that does not make it obvious to which controleach label corresponds.
The improved labels on the control panel had the following features (seeFigure 5-18):
• Large color-coded sign placed above the control panel to indicatecontrols to perform emergency isolation.
• Revised the labels to use the full names of the equipment where possible.
• Labels placed above the controls.
• Improved the association between the labels and push buttons.
• Used mixed-case letters to improve readability.
• Clearly identified the emergency stop control button.
Equipment Design 205
Not Used
2. Labels Under the
Controls
3. Association between
Label and Control
Ambiguous
4. Emergency Stop Not
Readily Identified
1. Plain Language Labels
Figure 5-17 Original design of an emergency isolation valve control panel.
Ch05.qxd 11/21/03 09:22 PM Page 205

APPENDIX 5-1. CHECKLIST FOR EQUIPMENT DESIGN
Displays
1. The type of display selected must be appropriate for its use.
2. LED and LCD displays must be capable of being read under allpossible lighting conditions.
3. All numbers on displays must increase in a clockwise, upward, orleft-to-right direction.
4. Multiple pointers and multiple scales on the same display must beavoided.
5. Color-coded zone markings must be clear and understandable (e.g.,red for danger, yellow for caution, green for acceptable).
6. Displays must be mounted where each can be seen from the oper-ator’s normal working position.
7. Safety critical displays must be mounted in the primary field ofview.
206 Equipment Design
1. Full Names Used
Where Possible
2. Labels Above Controls
3. Association between
Labels and Push Buttons
Improved
4. Mixed Case Letters
Improve Readability
5. Emergency Stop
Clearly Identified
Figure 5-18 Improved design of an emergency isolation valve control panel.
Ch05.qxd 11/21/03 09:22 PM Page 206

8. Similar functions must have the same layout of graduation marksand characters.
9. Displays must be free of parallax and glare.
10. All displays must have labels.
Controls
1. Controls must be selected to be appropriate for their use.
2. Correct colors must be used for each control.
3. It must be easy to understand the position of each control.
4. All controls must operate as expected.
5. Similar controls must operate the same way.
6. Controls must be large enough to be easily grasped.
7. Adequate room around each control avoids the chance of inadver-tent activation of the wrong control.
8. Safeguards on emergency controls must avoid accidental operation.
9. All controls must be labeled.
Control Panel Layout
1. Related functions at each control panel must be grouped together.
2. Frequently used controls and displays must be located in primaryareas.
3. “Mirror image” layouts must be avoided.
4. Displays must be located above their associated controls.
5. Each display must be viewable while its associated control is beingoperated.
6. Emergency controls must be easily identified, readily accessibleallow quick activation.
Equipment Design 207
Ch05.qxd 11/21/03 09:22 PM Page 207

7. Distinct subunits of panels must be grouped together for safer,easier operation.
8. Seated control panels must have the controls within 65–113cm(26–45 in.) and the displays within 75–150cm (30–60 in.) above thefloor.
9. Standing control panels must have the controls within 50–133cm(20–55 in.) and the displays within 50–160cm (20–64 in.) above thefloor.
10. At least 79cm (28 in.) of free access space must be allowed in frontof standing control panels.
11. Control panels must be viewable from normal operator work loca-tions (e.g., from a walkway when on rounds).
12. Adequate space for maintenance must be provided.
13. Controls and displays operated sequentially must be oriented leftto right.
14. Controls and displays must be located for use by the user population, or from top to bottom.
15. Field graphic displays (LCD, LED) must be readable under alllighting conditions.
16. Controls must be mounted near the displays they affect.
17. Safety-critical displays must be mounted in the primary field ofview.
18. Safety critical controls must be mounted in the primary area forhand use.
19. All displays and controls must be labeled.
Process Control Displays
1. Displays must support the operators task.
2. Navigation through the displays must be compatible with howpeople operate.
208 Equipment Design
Ch05.qxd 11/21/03 09:22 PM Page 208
3. Operators have access to multiple ways to call up specific displayscreens.
4. Displays must not be complex or cluttered.
5. Display layouts must be consistent.
6. Screens must be labeled and similar screens for different processesmust not be confused.
7. Display information must be presented in the proper format.
8. Symbols must be standardized.
9. Color must be used as a redundant code to clarify information.
10. Information must be grouped for clarity.
11. Information must not require mental conversion to be usable.
12. Text messages must be simplified to aid understanding.
REVIEW QUESTIONS
Test your understanding of the material in this chapter.
1. In what three ways can controls be easily improved?
2. What is redundant coding? Give an example of redundant codingfor process control displays.
3. You are selecting new field temperature instruments that will havedigital readouts. What features of the digital temperature displaywould you evaluate to determine if the instruments are suitable forcheck reading by operators during their plant walk-throughs?
4. When you assess the process control interface, what aspects of thealarm system do you evaluate?
REFERENCES
Amell, T. K., and Kumar, S. (2001) “Industrial Handwheel Actuation and the Human Operator: A Review.” International Journal of Industrial Ergonomics 28, pp. 291–302.
Equipment Design 209
Ch05.qxd 11/21/03 09:22 PM Page 209

Attwood, D. A., Nicolich, M. J., Pritchard, K. K., Smolar, T. J., and Swensen, E. E. (1999)“Valve Wheel Rim Force Capabilities of Process Operators.” Human Factors andErgonomics Society 43rd Annual Meeting, Houston TX.
Boff, K. R., and Lincoln, J. E. (1988) Engineering Data Compendium: Human Percep-tion and Performance. Wright-Patterson Air Force Base, Fairborn, OH: AAMRL.
Bollen, L. A., and van der Schaaf, T. W. (1993) “How to Survive Process Control Automation.” Fifth International Conference on Human Computer Interaction, vol.1. Orlando, FL: Harcourt.
Chang, S. H., Choi, S. S., Park, J. K., Heo, G., and Kim, H. G. (1999) “Development ofan Advanced Human-Machine Interface for Next Generation Nuclear Power Plants.”Reliability Engineering and System Safety 64, pp. 109–126.
Connelly, C. S. (1995) “Toward an Understanding of DCS Control Operator Workload.”Instrument Society of America Transactions 34, pp. 175–184.
Danz-Reece, M. E., and Noerager, J. A. (1998) “Process Control Interface Issues in theUpstream.” Paper No. SPE 46425. Society of Petroleum Engineers International Conference on Health, Safety and Environment. Caracas, Venezuela.
Eason, K. D. “User Centered Design: For Users or by Users?” Inaugural lecture at the IEAAnnual Meeting, Toronto Canada, 1994.
Eastman Kodak Company. (1983) Ergonomic Design for People at Work. New York: VanNostrand Reinhold Company.
Electric Power Research Institute. (1981) Human Factors Review of Electric Power Dispatch Control Centers, vol. 2. Palo Alto, CA: Electric Power Research Institute.
Gilmore, W. E., Gertman, D. I., and Blackman, H. S. (1989) The User-Computer Interface in Process Control. San Diego: Academic Press.
Instrument Society of America. (1985) Human Engineering for Control Centers. Recom-mended practice ISA-RP60.3. Research Triangle Park, NC: Instrument Society ofAmerica.
Instrument Society of America. (1986) Graphic Symbols for Process Displays. AmericanNational Standard ANSI/ISA-S5.5-1985. Research Triangle Park, NC: InstrumentSociety of America.
Instrument Society of America. (1992) Instrumentation Symbols and Identification.American National Standard ANSI/ISA-S5.1-1984(R1992). Research Triangle Park,NC: Instrument Society of America.
Instrument Society of America. (1993) Human-Machine Interface: Task Analysis. Draftrecommended practice ISA-dRP77.65. Research Triangle Park, NC: InstrumentSociety of America.
Instrument Society of America. (1995a) Human-Machine Interface: CRT Displays. Drafttechnical report ISA-dTR77.64.01. Research Triangle Park, NC: Instrument Societyof America.
Instrument Society of America. (1995b) Human-Machine Interface: Alarms. Draft recommended practice ISA-dRP77.62. Research Triangle Park, NC: InstrumentSociety of America.
210 Equipment Design
Ch05.qxd 11/21/03 09:22 PM Page 210
International Instrument Users’ Associations (WIB) (1998a) Ergonomics in ProcessControl Rooms. Part 1. Engineering Guidelines. Report M2655X98. The Hague.
International Instrument Users’ Associations (WIB) (1998b) Ergonomics in ProcessControl Rooms. Part 2. Design Guidelines. Report M2656X98. The Hague.
International Instrument Users’ Associations (WIB) (1998c) Ergonomics in ProcessControl Rooms. Part 3. Analysis. Report M2657X97. The Hague.
ISO. (1999a) Ergonomic Requirements for the Design of Displays and Control Actuators.Part 1. Human Interactions with Displays and Control Actuators. ISO 9355–1:1999.Geneva: International Standards Organization.
ISO. (1999) Ergonomic Requirements for the Design of Displays and Control Actuators.Part 2. Displays. Geneva: International Standards Organization.
Kawai, K. (1997) “An Intelligent Mulitmedia Human Interface for Highly AutomatedCombined-Cycle Plants.” Control Engineering Practice 3, pp. 401–406.
Kletz, T. (1998) What Went Wrong? Case Histories of Process Plant Disasters, Fourth Ed.Houston, TX: Gulf.
Mulley, R. (1994) Control System Documentation. Research Triangle Park, NC: Instrument Society of America.
O’Hara, J. (1993) Advanced Human-System Interface Design Review Guideline.NUREG/CR-5908, Washington DC: U.S. Nuclear Regulatory Commission.
O’Hara, J., Brown, W., Higgins, J., and Stubler, W. (1994) Human Factors EngineeringGuidance for the Review of Advanced Alarm Systems. NUREG/CR-6105, Washing-ton DC: U.S. Nuclear Regulatory Commission.
Olsson, G., and Lee, P. L. (1994) “Effective Interfaces for Process Operators—APrototype.” Journal of Process Control 4, no. 2.
Pennycook, W. A., and Danz-Reece, M. E. (1994) “Practical Examples of Human ErrorAnalysis in Operations.” Paper SPE27262. Proceedings of the 1994 Society of Petroleum Engineer’s Conference on Health, Safety and Environment in Oil and GasExploration and Production in Jakarta, Indonesia.
Pikaar, R. N. (1986) “Man-Machine Interaction in Process Control.” In H. P. Willumeit(ed.), Human Decision Making and Manual Control. Amsterdam: North Holland:Elsevier Science Publishers B.V.
Rankin, W. L., Rideout, T., Trigs, T., and Ames, K. (1985) Computerized Annun-ciator Systems. NUREG/CR-3987. Washington DC: U.S. Nuclear Regulatory Commission.
Sanders, M. S., and McCormick, E. J. (1987) Human Factors in Engineering and Design,Sixth Ed. New York: McGraw-Hill.
Shih, Y., Wang, M. J., and Chang, C. (1997) “The Effect of Valve Hand Wheel Type, Operating Plane and Grasping Posture on Peak Torque Strength of Young Men AndWomen.” Human Factors 39, no. 3, pp. 489–496.
Staples, L. J. (1993) “The Task Analysis Process for a New Reactor.” In Proceedings ofthe Human Factors and Ergonomics Society 37th Annual Meeting. Santa Monica,CA: Human Factors and Ergonomics Society.
Equipment Design 211
Ch05.qxd 11/21/03 09:22 PM Page 211

Stultz, S., and Schroeder, L. R. (1988) “Incorporating human engineering principles in dis-tributed controls upgrades.” Paper 88-0421, 1988. Research Triangle Park, NC:Instrument Society of America.
Swensen, E. (2000) Personal Communication.
U.S. Nuclear Regulatory Commission. (1981) Guidelines for Control Room Reviews.NUREG-0700. Washington, DC: U.S. Nuclear Regulatory Commission, 1981.
U.S. Nuclear Regulatory Commission. (1982) Human Engineering Design Considerationsfor Cathode-Ray-Tube Generated Displays. NUREG/CR-2496. Washington, DC:U.S. Nuclear Regulatory Commission.
van der Schaaf, T. W. (1989) Interface Design for Process Control Tasks. ReportEUT/BDK/45, Eindhoven, the Netherlands: Eindhoven University of Technology.
van der Schaaf, T. W., and Kragt, H. (1992) “Redesigning a Control Room from anErgonomic Point of View: A Case Study of User Participation in a Chemical Plant.”In Enhancing Industrial Performance. H. Kragt, Ed. London: Taylor and Francis.
Van Laar, D., and Deshe, O. (2002) Evaluation of a Visual Layering Methodology forColour Coding Control Room Displays. Applied Ergonomics 33, pp. 371–377.
Vicente, K. J., and Rasmussen, J. (1990) “The Ecology of Human-Machine Systems II:Mediating ‘Direct Perception’ in Complex Work Domains.” Ecological Psychology2, no. 3, pp. 207–249.
212 Equipment Design
Ch05.qxd 11/21/03 09:22 PM Page 212

6
Workplace Design
6.1 Introduction6.2 Workplace Design Principles
6.2.1 Introduction6.2.2 Controls and Displays Must Be Optimally Located6.2.3 Equipment Must Be Visually Accessible 6.2.4 The Workplace Must Be Designed for the User Population6.2.5 Equipment Must Be Physically Accessible6.2.6 Work Must Be Positioned as Best for the Operator6.2.7 Workstations and Seating Must Be Designed According to Accepted
Ergonomic Standards6.2.8 Maintenance and Maintainability6.2.9 Summary of Design Principles
6.3 Analytical Techniques in Workplace Design6.3.1 Activity Analysis6.3.2 Task Analysis6.3.3 Link Analysis
6.4 Human Factors Design Processes for Existing and New Workstations6.4.1 Existing Workstations6.4.2 New Workstations
6.5 Case Study6.5.1 Familiarization6.5.2 Problem Identification6.5.3 Background6.5.4 Data Collection and Analysis6.5.5 Evaluation6.5.6 Recommendations and Redesign
213
Ch06qxd 11/21/03 09:21 PM Page 213

6.1 INTRODUCTION
At this point in the book, you have been exposed to a number of con-cepts in human factors and ergonomics, from the effects of light on humanbehavior to the design of local control panels. A good workplace designis based on the biomechanical, physiological, and psychological require-ments of the user. For the human factors practitioner, workplace design isoften a balancing act—balancing these requirements, when one can beoffset by the other. In addition, you must consider the cost of the solution.The site must survive financially, so solutions need to be practical and costeffective.
This chapter deals with two concepts in workplace design: the work-place and the workstation. In this chapter, the workplace is defined as “thephysical area where a person performs tasks.” The workplace may includephysical fixtures such as furniture, equipment, hallways, stairs, vehicles,and displays and is affected by environmental variables such as lighting,temperature, and noise (discussed in Chapter 4). A workstation is definedas “a location where the operator may spend only a portion of the workingshift.” Clearly, workstations are a subset of the workplace. An operatormay travel between and work at several different workstations in theworkplace.
This chapter also deals with two design concepts: existing and new(nonexisting) workplaces. We approach the analysis and design of eachtype of workplace by first acquiring an understanding of the designprocess involved, then illustrating the application with a case study.Finally, when you feel comfortable with the process, example design problems are included in an independent study section of the chapter.
The design of the physical workplace has been addressed in the HF literature for over 60 years. Many excellent books provide the details ofworkplace design. The purpose of this chapter is to ensure that workplacesare designed according to widely accepted human factors principles. Con-sequently, this chapter has three objectives:
1. To identify the principles involved in the design, installation, oper-ation, and maintenance of workplaces. The literature that supportseach of these principles is provided.
214 Workplace Design
Ch06qxd 11/21/03 09:21 PM Page 214
2. To review the techniques in place to analyze the work situations thatdetermine workstation design.
3. To provide guidance (models) on the evaluation and redesign ofexisting and new (grassroots) workstations. A case study is presentedon the use of these models for the redesign of a control room.
6.2 WORKPLACE DESIGN PRINCIPLES
6.2.1 Introduction
In keeping with the how-to theme of this book, recommendations for workplace design are addressed in this chapter by a series of basicdesign principles. The principles are presented in a hierarchical structurethat consists of principles and subprinciples. The approach is to provideenough theory to help the reader understand why the principle is impor-tant, then explain the principle with actual examples. A table that sum-marizes all the principles is provided at the end of this section.
Two principles that affect the design of the workplace have already beenaddressed in previous chapters. But, they need to be repeated as state-ments in this chapter to ensure that the reader has a complete list.
6.2.2 Controls and Displays Must Be Optimally Located (Refer toChapter 5 for this Discussion and Examples)
6.2.3 Equipment Must Be Visually Accessible (Refer to Chapter 2for this Discussion and Examples)
6.2.4 The Workplace Must Be Designed for the User Population
6.2.4.1 People Differ in the Characteristics Necessary to Performwithin the Workplace
The capabilities, limitations and characteristics of people are discussedin Chapter 2. The information shows that people can be classified in twoways:
Workplace Design 215
Ch06qxd 11/21/03 09:21 PM Page 215
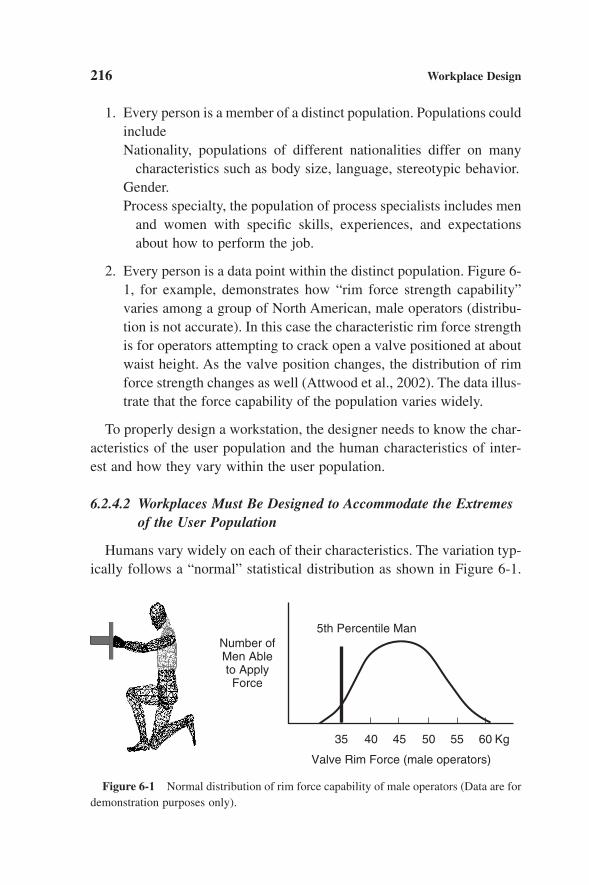
1. Every person is a member of a distinct population. Populations couldincludeNationality, populations of different nationalities differ on many
characteristics such as body size, language, stereotypic behavior.Gender.Process specialty, the population of process specialists includes men
and women with specific skills, experiences, and expectationsabout how to perform the job.
2. Every person is a data point within the distinct population. Figure 6-1, for example, demonstrates how “rim force strength capability”varies among a group of North American, male operators (distribu-tion is not accurate). In this case the characteristic rim force strengthis for operators attempting to crack open a valve positioned at aboutwaist height. As the valve position changes, the distribution of rimforce strength changes as well (Attwood et al., 2002). The data illus-trate that the force capability of the population varies widely.
To properly design a workstation, the designer needs to know the char-acteristics of the user population and the human characteristics of inter-est and how they vary within the user population.
6.2.4.2 Workplaces Must Be Designed to Accommodate the Extremesof the User Population
Humans vary widely on each of their characteristics. The variation typ-ically follows a “normal” statistical distribution as shown in Figure 6-1.
216 Workplace Design
Number ofMen Ableto ApplyForce
5th Percentile Man
35 40 45
Valve Rim Force (male operators)
50 55 60 Kg
Figure 6-1 Normal distribution of rim force capability of male operators (Data are fordemonstration purposes only).
Ch06qxd 11/21/03 09:21 PM Page 216
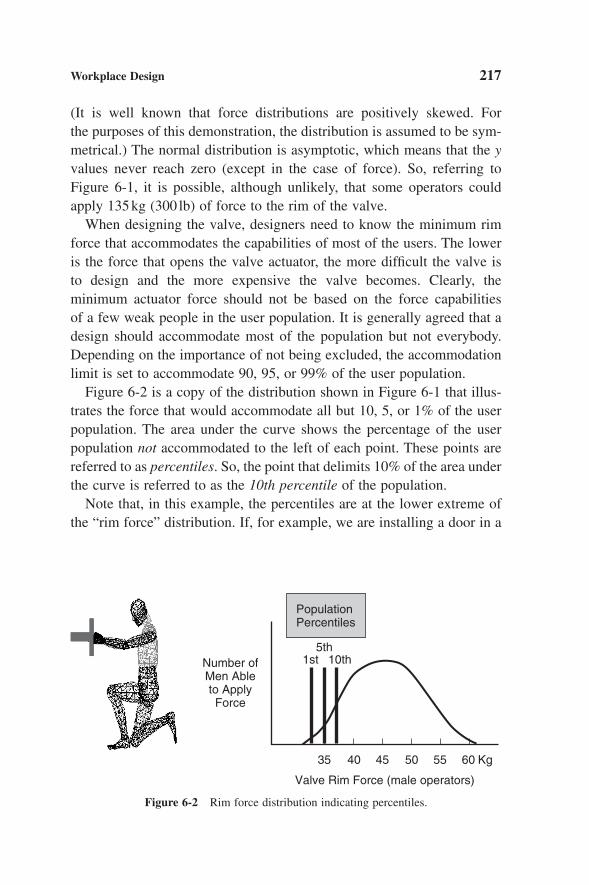
(It is well known that force distributions are positively skewed. For the purposes of this demonstration, the distribution is assumed to be sym-metrical.) The normal distribution is asymptotic, which means that the yvalues never reach zero (except in the case of force). So, referring toFigure 6-1, it is possible, although unlikely, that some operators couldapply 135kg (300 lb) of force to the rim of the valve.
When designing the valve, designers need to know the minimum rimforce that accommodates the capabilities of most of the users. The loweris the force that opens the valve actuator, the more difficult the valve isto design and the more expensive the valve becomes. Clearly, theminimum actuator force should not be based on the force capabilities of a few weak people in the user population. It is generally agreed that adesign should accommodate most of the population but not everybody.Depending on the importance of not being excluded, the accommodationlimit is set to accommodate 90, 95, or 99% of the user population.
Figure 6-2 is a copy of the distribution shown in Figure 6-1 that illus-trates the force that would accommodate all but 10, 5, or 1% of the userpopulation. The area under the curve shows the percentage of the userpopulation not accommodated to the left of each point. These points arereferred to as percentiles. So, the point that delimits 10% of the area underthe curve is referred to as the 10th percentile of the population.
Note that, in this example, the percentiles are at the lower extreme ofthe “rim force” distribution. If, for example, we are installing a door in a
Workplace Design 217
Number ofMen Ableto ApplyForce
PopulationPercentiles
5th1st 10th
35 40 45
Valve Rim Force (male operators)
50 55 60 Kg
Figure 6-2 Rim force distribution indicating percentiles.
Ch06qxd 11/21/03 09:21 PM Page 217

wall (Figure 6-3) and interested in the minimum height of the door thatwould accommodate the majority of users, the characteristic of interestwould be the stature of the user population. In this case, we want to iden-tify the taller people in the population, since if they can walk under thedoorframe without hitting their heads, shorter people would also haveclearance. Considering the extremes, this time we would want to select adoor height that, say 95% of the user population could walk throughwithout ducking their heads.
These two examples illustrate the use of population extremes in design:Extremes at the lowest and extremes at the highest ends of the populations.The lower extreme could represent maximum reach to a control lever,maximum force, or maximum test score to enter a program. The upperextreme could represent fit, such as minimum height of an opening orminimum diameter of a manway necessary to accommodate 95% of the users.
218 Workplace Design
5% Men(U.S.)
50% Men(U.S.)
95% Men(U.S.)
Figure 6-3 The need to design to fit taller operators.
Ch06qxd 11/21/03 09:21 PM Page 218
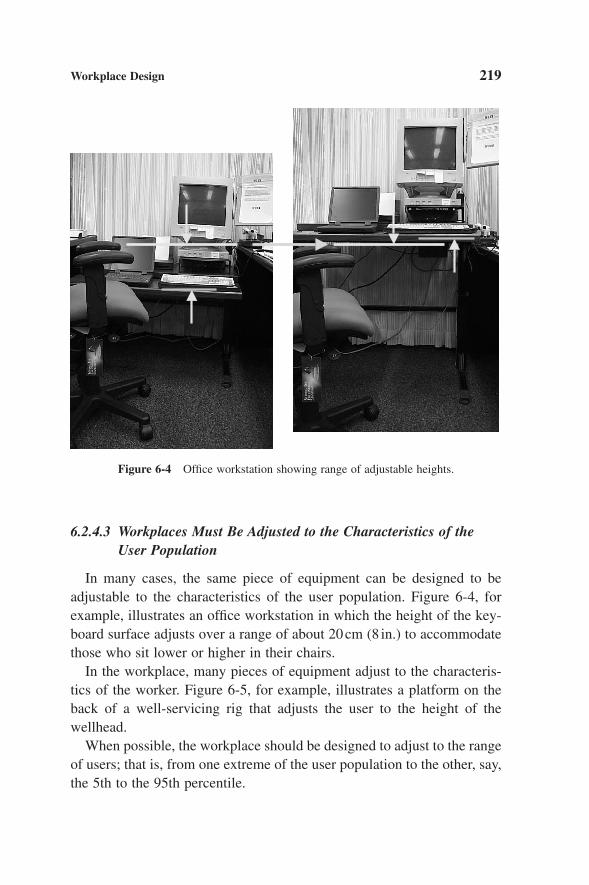
6.2.4.3 Workplaces Must Be Adjusted to the Characteristics of theUser Population
In many cases, the same piece of equipment can be designed to beadjustable to the characteristics of the user population. Figure 6-4, forexample, illustrates an office workstation in which the height of the key-board surface adjusts over a range of about 20cm (8 in.) to accommodatethose who sit lower or higher in their chairs.
In the workplace, many pieces of equipment adjust to the characteris-tics of the worker. Figure 6-5, for example, illustrates a platform on theback of a well-servicing rig that adjusts the user to the height of the wellhead.
When possible, the workplace should be designed to adjust to the rangeof users; that is, from one extreme of the user population to the other, say,the 5th to the 95th percentile.
Workplace Design 219
Figure 6-4 Office workstation showing range of adjustable heights.
Ch06qxd 11/21/03 09:21 PM Page 219

6.2.5 Equipment Must Be Physically Accessible
6.2.5.1 Aisles and Corridors
The minimum dimensions of aisles and corridors are determined byhow they are used and the “size” of the user population. If the aisle orcorridor is used to accommodate only people, the widths and heights aredetermined by how many people pass through simultaneously or walk sideby side. Minimum aisle widths are intended for a single file of people,determined by the body width of the largest users. Figure 6-6 shows thewidths and heights of 95th percentile men from two very different populations: United States and Japan (Pheasant, 1994). ABS (1998) recommends a 508-mm (20-in.) width for travel in areas with limitedaccess.
220 Workplace Design
Figure 6-5 Height adjustable platforms on a well-servicing rig.
Ch06qxd 11/21/03 09:21 PM Page 220

If the aisle is designed to permit two people to pass or walk alongsideeach other without touching, the minimum width is twice that shown inFigure 6-6 for North American or Japanese populations. There is a widevariation of recommendations of aisle widths among published guidelines.ABS (1998) suggests that the minimum width for normal two-way trafficis 36 in. (914mm), while Eastman Kodak (1983) recommends 1372mm (54 in.) as the minimum width.
If the aisle is used to move carts or equipment, its width may dependon the width of the largest pieces of equipment moved and consid-eration of how they will be moved rather than the people moving them.
In summary, the design of aisles and corridors is determined by howthey are used. Nothing substitutes for a thorough analysis of the needs ofthe facility before it is designed.
Workplace Design 221
410 mm(16.1 in.)
435 mm(17.1 in.)
1870 mm(73.6 in.)
1750 mm(68.9 in.)
Note:Nude Dimensions:[Add 25 mm (1-inch)for Shoes and 75 mm (3-inches)for Safety Helmet]
North American Japanese
Figure 6-6 Widths and heights of 95th percentile male workers from North Americaand Japan. (Data from Pheasant, 1994.)
Ch06qxd 11/21/03 09:21 PM Page 221
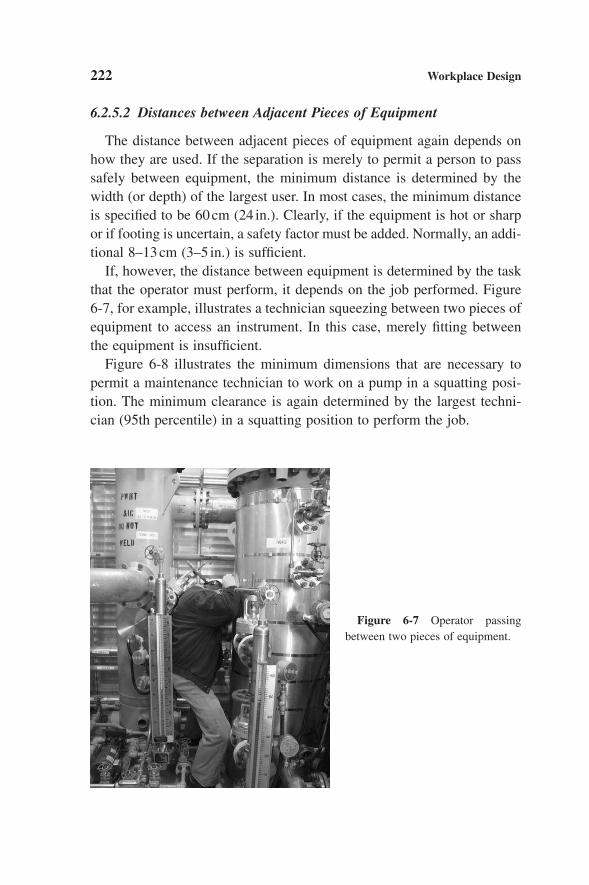
6.2.5.2 Distances between Adjacent Pieces of Equipment
The distance between adjacent pieces of equipment again depends onhow they are used. If the separation is merely to permit a person to passsafely between equipment, the minimum distance is determined by thewidth (or depth) of the largest user. In most cases, the minimum distanceis specified to be 60cm (24 in.). Clearly, if the equipment is hot or sharpor if footing is uncertain, a safety factor must be added. Normally, an addi-tional 8–13cm (3–5 in.) is sufficient.
If, however, the distance between equipment is determined by the taskthat the operator must perform, it depends on the job performed. Figure6-7, for example, illustrates a technician squeezing between two pieces ofequipment to access an instrument. In this case, merely fitting betweenthe equipment is insufficient.
Figure 6-8 illustrates the minimum dimensions that are necessary topermit a maintenance technician to work on a pump in a squatting posi-tion. The minimum clearance is again determined by the largest techni-cian (95th percentile) in a squatting position to perform the job.
222 Workplace Design
Figure 6-7 Operator passingbetween two pieces of equipment.
Ch06qxd 11/21/03 09:21 PM Page 222

6.2.5.3 Ladders, Stairs, Ramps, Walkways, and Platforms
Ladders, stairs, ramps, walkways, and platforms are fundamentallyimportant in the design of process plants. Process plants require workersto operate and maintain equipment above grade. Above-grade access canbe accomplished in many ways, but in most plants, operators climb to theequipment using ramps, stairs, and ladders. And, once at elevation,workers access equipment using walkways and platforms.
The proper design of stairs, ramps, ladders, walkways, and platforms canaffect the safety and efficiency of work above grade. Most government agen-cies responsible for the safety of process plants have enacted legislation(United States: OSHA, 1997; Norway: NPD, 1977; Great Britain: HSE,2001) that lays out the minimum requirements for the design of ladders,stairways, ramps, walkways, and platforms. Many standards organizationshave also addressed the issue (ABS, 1998) and several textbooks havereported design specifications for this equipment (Eastman Kodak, 1983;Grandjean, 1988). The purpose of this section is to advise the reader whatdesign issues are important and guide the user to appropriate standards.
Workplace Design 223
48 in. (1220 mm)Minimum Height
40 in. (1020 mm)
24 in. (612 mm)
Figure 6-8 Minimum clearance required for a technician to work on a pump from asquatting position.
Ch06qxd 11/21/03 09:21 PM Page 223

Stairs, Ladders, and Ramps
It is generally agreed that the design and use of a ramp, stairway, or aladder depends on two major issues: the angle of ascent/descent and thenature of the task. Most research suggests that ramps should be used whenthe angle of ascent/descent is between 0° and 20°. Angles above 15° aredifficult to negotiate if material is being manually pushed or pulled. So,power equipment is required. Stairs are installed when the angle ofascent/descent is between 30° and 50° to the horizontal (OSHA, 1997),and ladders are used from 50° to 90°.
Variations from traditional designs occur often in process plants.Eastman Kodak (1983), for example, describes a stair ladder, with a slopeof between 50° and 75° (Figure 6-9), which is used for operators to move“between several levels on an occasional basis.” In addition, ladders forfloating tanks can assume angles between 0° and 90° (Figure 6-10). So,they can be considered ladders or stairways and designed accordingly.
224 Workplace Design
Figure 6-9 Stair ladder installedon a conveyor line.
Ch06qxd 11/21/03 09:21 PM Page 224

When facilities permit a wide range of options, the optimum slope ofa stairway is determined by the energy required to use it. Grandjean (1988)cites research that found that the least energy consumed when climbingstairs was with a gradient of 25–30° and tread height (h) and depth (d)that met the formula
The design characteristics of a stairway are shown in Figure 6-11. Datafrom Eastman Kodak (1983) suggests that, as the slope of the stairwayincreases, the riser height should increase and the tread depth shoulddecrease. Table 6-1 provides data from three sources that illustrate thewide range of recommendations on step height, tread depth, and treadoverlap for the North American or European user populations. For stair-ways installed for use by other populations, the dimensions in Table 6-1would vary. Designers should consult the regulations in each jurisdictionto ensure that stairways meet the requirements of the user population.
Quite apart from the angle of ascent and descent, how a person ascendsor descends determines, to a large extent, what equipment is used. Laddersare cheaper to install than stairs. So, in most plants, ladders, not stairs, arethe default method of getting from one level to another. But, ladders are
2 630h d+ = mm
Workplace Design 225
Figure 6-10 Stair ladder installed on a floating roof tank.
Ch06qxd 11/21/03 09:21 PM Page 225
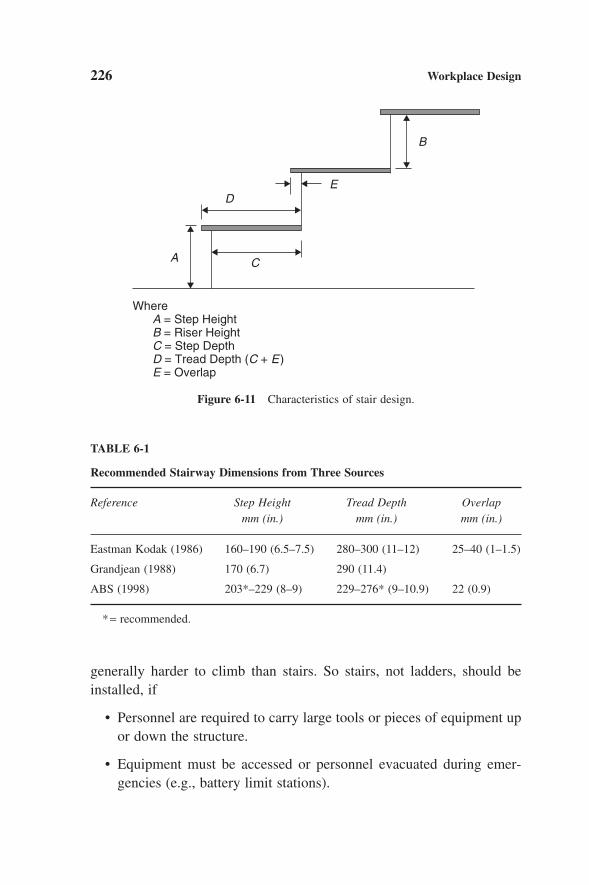
generally harder to climb than stairs. So stairs, not ladders, should beinstalled, if
• Personnel are required to carry large tools or pieces of equipment upor down the structure.
• Equipment must be accessed or personnel evacuated during emer-gencies (e.g., battery limit stations).
226 Workplace Design
D
C
E
B
A
Where A = Step Height B = Riser Height C = Step Depth D = Tread Depth (C + E ) E = Overlap
Figure 6-11 Characteristics of stair design.
TABLE 6-1
Recommended Stairway Dimensions from Three Sources
Reference Step Height Tread Depth Overlapmm (in.) mm (in.) mm (in.)
Eastman Kodak (1986) 160–190 (6.5–7.5) 280–300 (11–12) 25–40 (1–1.5)
Grandjean (1988) 170 (6.7) 290 (11.4)
ABS (1998) 203*–229 (8–9) 229–276* (9–10.9) 22 (0.9)
*= recommended.
Ch06qxd 11/21/03 09:21 PM Page 226

• Hazardous material must be carried manually between levels.
• Equipment is frequently accessed (at least once per shift on theaverage).
While climbing stairs is considered a good form of exercise, stair climb-ing can also promote wear and tear to the body if stairs are used exces-sively or not designed properly. Field data suggest, for example, thatworkers complain more about leg and knee discomfort when stairs havesteeper angles and many back and forth transitions. Depending on the wayplant areas are accessed on a day-to-day basis (e.g., surveillance rounds,preventive maintenance), a decision to provide elevators or power liftsshould be made. Based on the authors’ experience, the facility is a candi-date for a powered lift of some type if all of the following conditionsapply.
1. The height of the climb is more than 10m (32.5 ft).
2. The climb is performed by the same person more than four timesper shift (on average).
3. Equipment and tools are often carried up and down.
Other combination of climbing heights and conditions would have to beanalyzed to determine whether elevators are indicated using a combina-tion of energy expenditure and musculoskeletal analyses.
Another way to reduce the degree of discomfort from using stairs is to find an alternate way to move tools and equipment up and down the structure. When available, cranes can be used to lift and lower tools,materials, and equipment. Small elevators, sometimes referred to as dumbwaiters, can be installed for routine use. Finally, one of the best waysto reduce the wear and tear from ladders and stairs on workers is to reducetheir use. Often, moving equipment to grade (e.g., sampling stations orfield panels) or changing the work processes (e.g., rounds protocols) canreduce worker exposure to stairs and ladders.
As a final note, stairways and ladders, if not properly designed, can con-tribute to slips and falls. It is important that the stairway and ladder cov-ering is designed to maximize friction in all types of weather and for theuses intended.
Workplace Design 227
Ch06qxd 11/21/03 09:21 PM Page 227

Walkways and Platforms
Walkways and platforms provide access to equipment that is abovegrade. Platforms are required to provide access to the following facilitiesand equipment when access from grade is not possible:
• Instruments including transmitters and rod-out ports, which must bemonitored, adjusted, or serviced while the plant is in operation.
• Service and inspection openings (includes observation points on firedheaters).
• Critical valves, including control valves, emergency block valves,safety valves, and motor- or air-operated valves.
• Sample points.
The physical specifications of platforms are shown in Table 6-2.Portable platforms are acceptable for use as long as
• They are made of lightweight material.
• No one person must lift more than 23kg (51 lb) to move them.
• They are equipped with wheels on at least one end to help them move.
• Wheels can be locked when the platform is stationary.
• They are equipped with railings, as in Table 6-2, if they are more than610mm (24 in.) high.
228 Workplace Design
TABLE 6-2
Physical Specifications of Platforms
Specification Value
Maximum horizontal reach from a platform or ladder 508mm (20 in.)
Maximum overhead grip reach 1800mm (72 in.)
Minimum walkway clearance between vessels and 610mm (24 in.)protruding equipment and platform railings
Platform railing heights 915–1067mm (36–42 in.)
Height of mid-rails 457–533mm (18–21 in.)
Ch06qxd 11/21/03 09:21 PM Page 228

6.2.5.4 Pathway Obstructions
Pathway obstructions, such as the one shown in Figure 6-12, can be apotential hazard to workers. Often, they are not easy to identify becauseof location and blending in with the surroundings. Lines and valves thatcreate the most concern are located below the knees or above the eyes.Since our normal line of site is about 10° below the horizon, those obstruc-tions in the head area can be especially vicious.
It is important to identify pathway obstructions and either eliminatethem or mark them so workers can avoid them or pad them so contact haslittle effect. Moving a valve or a line during normal operations often isexpensive, but they could be tagged for elimination during a turnaroundwhen the unit is not operating. If the obstruction is marked, it is often pos-sible not only to paint or sign it but also reroute the pathway around it.
Workplace Design 229
Figure 6-12 Pathway obstruc-tions are often difficult to recognize.
Ch06qxd 11/21/03 09:21 PM Page 229
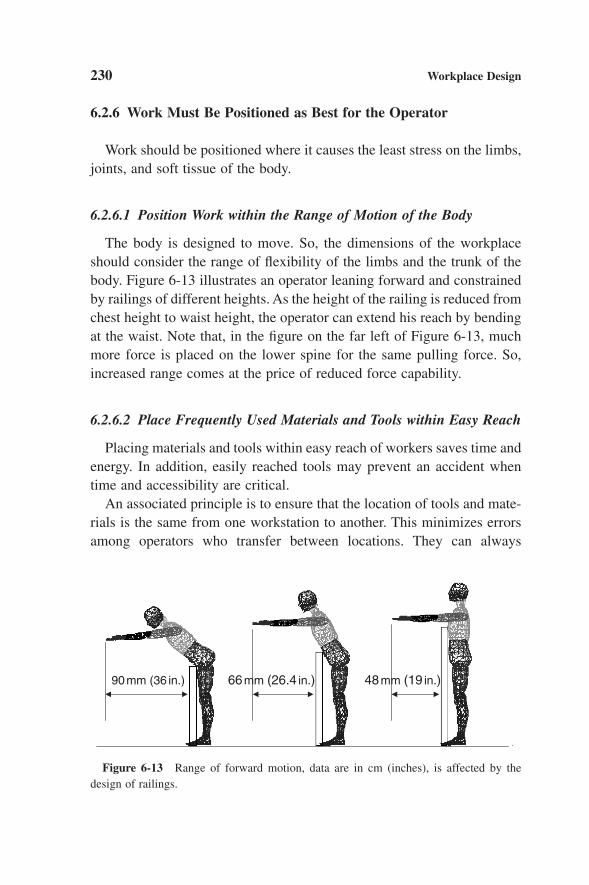
6.2.6 Work Must Be Positioned as Best for the Operator
Work should be positioned where it causes the least stress on the limbs,joints, and soft tissue of the body.
6.2.6.1 Position Work within the Range of Motion of the Body
The body is designed to move. So, the dimensions of the workplaceshould consider the range of flexibility of the limbs and the trunk of thebody. Figure 6-13 illustrates an operator leaning forward and constrainedby railings of different heights. As the height of the railing is reduced fromchest height to waist height, the operator can extend his reach by bendingat the waist. Note that, in the figure on the far left of Figure 6-13, muchmore force is placed on the lower spine for the same pulling force. So,increased range comes at the price of reduced force capability.
6.2.6.2 Place Frequently Used Materials and Tools within Easy Reach
Placing materials and tools within easy reach of workers saves time andenergy. In addition, easily reached tools may prevent an accident whentime and accessibility are critical.
An associated principle is to ensure that the location of tools and mate-rials is the same from one workstation to another. This minimizes errorsamong operators who transfer between locations. They can always
230 Workplace Design
90 mm (36 in.) 66 mm (26.4 in.) 48 mm (19 in.)
Figure 6-13 Range of forward motion, data are in cm (inches), is affected by thedesign of railings.
Ch06qxd 11/21/03 09:21 PM Page 230
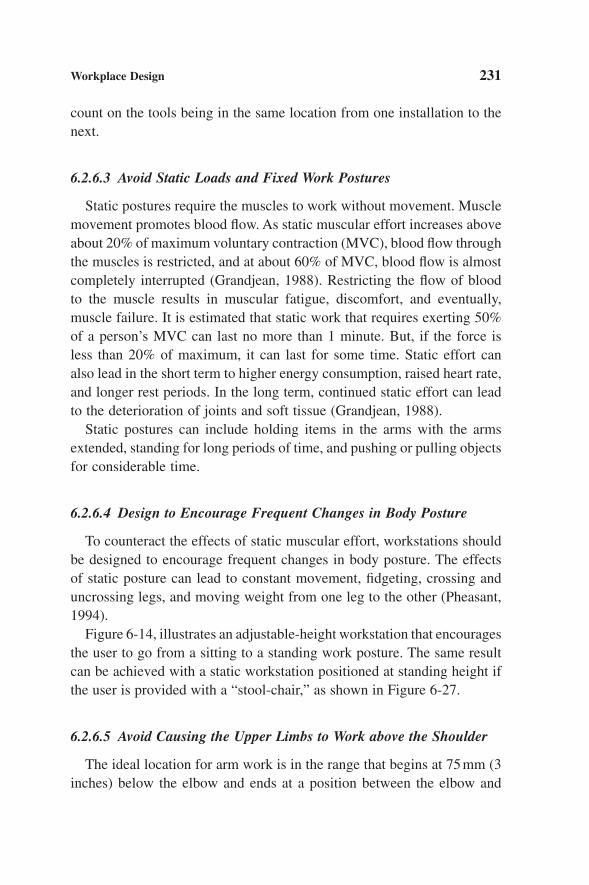
count on the tools being in the same location from one installation to thenext.
6.2.6.3 Avoid Static Loads and Fixed Work Postures
Static postures require the muscles to work without movement. Musclemovement promotes blood flow. As static muscular effort increases aboveabout 20% of maximum voluntary contraction (MVC), blood flow throughthe muscles is restricted, and at about 60% of MVC, blood flow is almostcompletely interrupted (Grandjean, 1988). Restricting the flow of bloodto the muscle results in muscular fatigue, discomfort, and eventually,muscle failure. It is estimated that static work that requires exerting 50%of a person’s MVC can last no more than 1 minute. But, if the force isless than 20% of maximum, it can last for some time. Static effort canalso lead in the short term to higher energy consumption, raised heart rate,and longer rest periods. In the long term, continued static effort can leadto the deterioration of joints and soft tissue (Grandjean, 1988).
Static postures can include holding items in the arms with the armsextended, standing for long periods of time, and pushing or pulling objectsfor considerable time.
6.2.6.4 Design to Encourage Frequent Changes in Body Posture
To counteract the effects of static muscular effort, workstations shouldbe designed to encourage frequent changes in body posture. The effectsof static posture can lead to constant movement, fidgeting, crossing anduncrossing legs, and moving weight from one leg to the other (Pheasant,1994).
Figure 6-14, illustrates an adjustable-height workstation that encouragesthe user to go from a sitting to a standing work posture. The same resultcan be achieved with a static workstation positioned at standing height ifthe user is provided with a “stool-chair,” as shown in Figure 6-27.
6.2.6.5 Avoid Causing the Upper Limbs to Work above the Shoulder
The ideal location for arm work is in the range that begins at 75mm (3inches) below the elbow and ends at a position between the elbow and
Workplace Design 231
Ch06qxd 11/21/03 09:21 PM Page 231

shoulder (Figure 6-15). For light loads requiring high levels of dexterity,the upper limit is recommended. Heavy loads should be performed at thelower end of the range.
If the arms must work beyond these ranges for prolonged periods oftime, support is required. Figure 6-16 illustrates the use of a computer,mouse where the arm is supported.
6.2.6.6 Avoid Work That Causes the Spine to Be Twisted
The spine should not be twisted while it is subjected to forces that pullthe body forward. All lifts should be performed with a straight (untwisted)spine.
6.2.6.7 Ensure That Forces on the Limbs and Joints Are withinHuman Capabilities
Each joint can sustain a certain level of force without injury. The forcethat can be safely sustained depends on the design of the joint, the direc-tion of the force, and the duration of the force. The maximum forces that
232 Workplace Design
Figure 6-14 Adjustable height workstation. (Photograph courtesy Evans ConsolesInc, Calgary, AB, Canada.)
Ch06qxd 11/21/03 09:21 PM Page 232
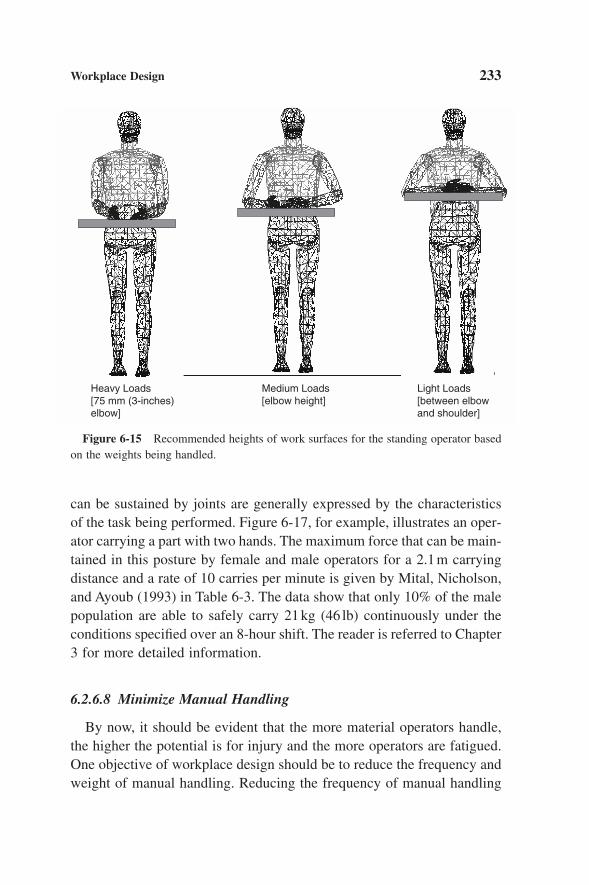
can be sustained by joints are generally expressed by the characteristicsof the task being performed. Figure 6-17, for example, illustrates an oper-ator carrying a part with two hands. The maximum force that can be main-tained in this posture by female and male operators for a 2.1m carryingdistance and a rate of 10 carries per minute is given by Mital, Nicholson,and Ayoub (1993) in Table 6-3. The data show that only 10% of the malepopulation are able to safely carry 21kg (46 lb) continuously under theconditions specified over an 8-hour shift. The reader is referred to Chapter3 for more detailed information.
6.2.6.8 Minimize Manual Handling
By now, it should be evident that the more material operators handle,the higher the potential is for injury and the more operators are fatigued.One objective of workplace design should be to reduce the frequency andweight of manual handling. Reducing the frequency of manual handling
Workplace Design 233
Medium Loads[elbow height]
Heavy Loads[75 mm (3-inches)elbow]
Light Loads[between elbowand shoulder]
Figure 6-15 Recommended heights of work surfaces for the standing operator basedon the weights being handled.
Ch06qxd 11/21/03 09:21 PM Page 233

234
Figure 6-16 Arm support installed on a CAD workstation.
Figure 6-17 Operator carrying a machine part with two hands.
Ch06qxd 11/21/03 09:21 PM Page 234
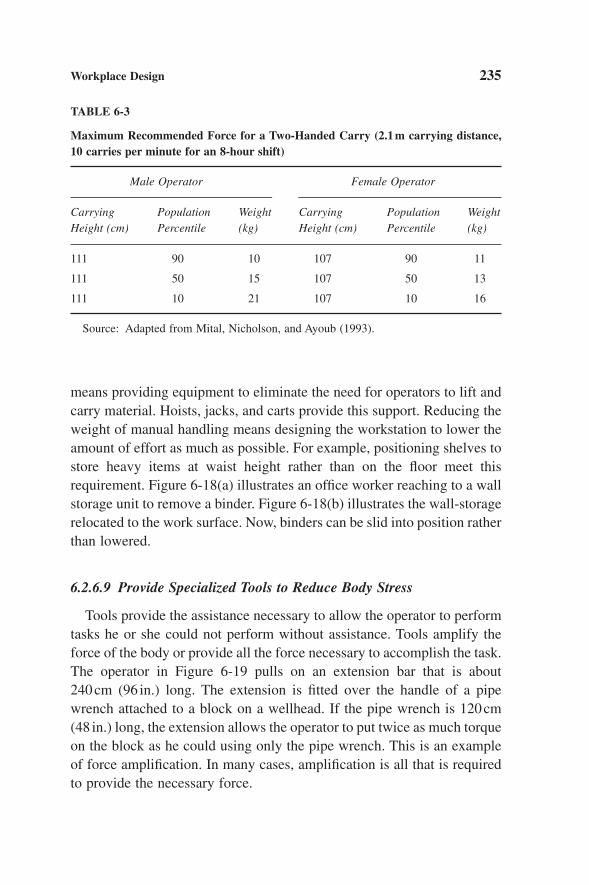
Workplace Design 235
TABLE 6-3
Maximum Recommended Force for a Two-Handed Carry (2.1m carrying distance,10 carries per minute for an 8-hour shift)
Male Operator Female Operator
Carrying Population Weight Carrying Population WeightHeight (cm) Percentile (kg) Height (cm) Percentile (kg)
111 90 10 107 90 11
111 50 15 107 50 13
111 10 21 107 10 16
Source: Adapted from Mital, Nicholson, and Ayoub (1993).
means providing equipment to eliminate the need for operators to lift andcarry material. Hoists, jacks, and carts provide this support. Reducing theweight of manual handling means designing the workstation to lower theamount of effort as much as possible. For example, positioning shelves tostore heavy items at waist height rather than on the floor meet thisrequirement. Figure 6-18(a) illustrates an office worker reaching to a wallstorage unit to remove a binder. Figure 6-18(b) illustrates the wall-storagerelocated to the work surface. Now, binders can be slid into position ratherthan lowered.
6.2.6.9 Provide Specialized Tools to Reduce Body Stress
Tools provide the assistance necessary to allow the operator to performtasks he or she could not perform without assistance. Tools amplify theforce of the body or provide all the force necessary to accomplish the task.The operator in Figure 6-19 pulls on an extension bar that is about 240cm (96 in.) long. The extension is fitted over the handle of a pipewrench attached to a block on a wellhead. If the pipe wrench is 120cm(48 in.) long, the extension allows the operator to put twice as much torqueon the block as he could using only the pipe wrench. This is an exampleof force amplification. In many cases, amplification is all that is requiredto provide the necessary force.
Ch06qxd 11/21/03 09:21 PM Page 235

236
(a)
(b)
Figure 6-18 Lowering binder storage (a) to the desk work surface (b) reduces thestress of handling binders.
Figure 6-19 Operator using an 8-ft extension to increase the force applied to a well-head block.
Ch06qxd 11/21/03 09:21 PM Page 236
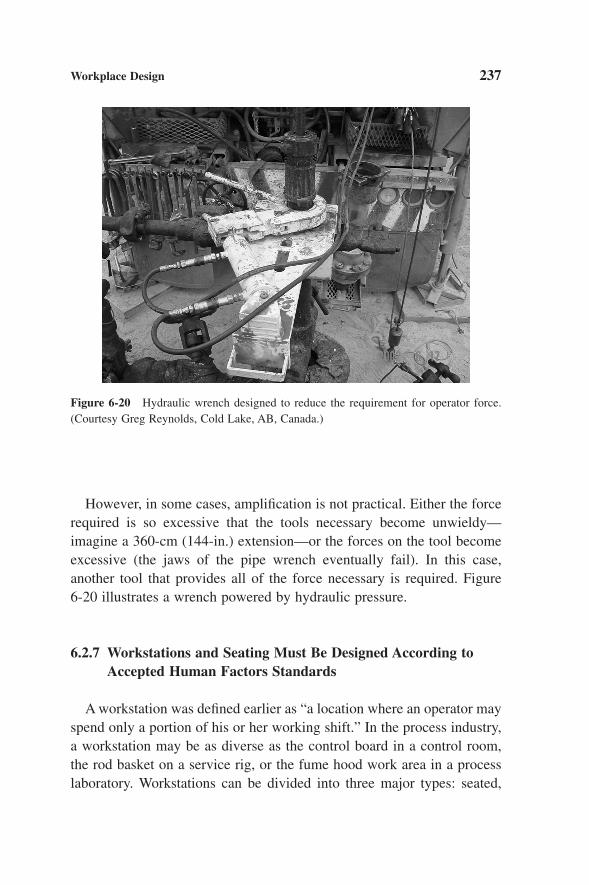
However, in some cases, amplification is not practical. Either the forcerequired is so excessive that the tools necessary become unwieldy—imagine a 360-cm (144-in.) extension—or the forces on the tool becomeexcessive (the jaws of the pipe wrench eventually fail). In this case,another tool that provides all of the force necessary is required. Figure 6-20 illustrates a wrench powered by hydraulic pressure.
6.2.7 Workstations and Seating Must Be Designed According toAccepted Human Factors Standards
A workstation was defined earlier as “a location where an operator mayspend only a portion of his or her working shift.” In the process industry,a workstation may be as diverse as the control board in a control room,the rod basket on a service rig, or the fume hood work area in a processlaboratory. Workstations can be divided into three major types: seated,
Workplace Design 237
Figure 6-20 Hydraulic wrench designed to reduce the requirement for operator force.(Courtesy Greg Reynolds, Cold Lake, AB, Canada.)
Ch06qxd 11/21/03 09:21 PM Page 237
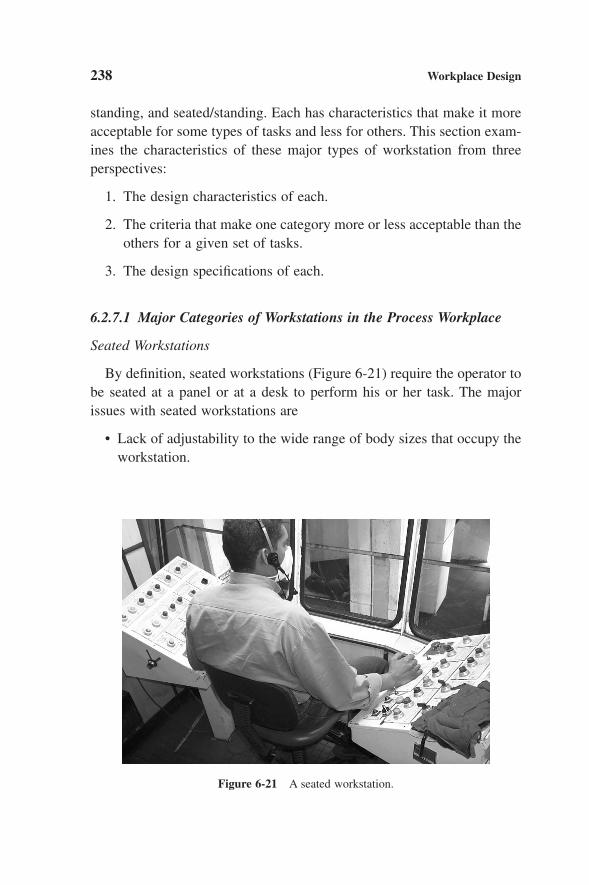
standing, and seated/standing. Each has characteristics that make it moreacceptable for some types of tasks and less for others. This section exam-ines the characteristics of these major types of workstation from three perspectives:
1. The design characteristics of each.
2. The criteria that make one category more or less acceptable than theothers for a given set of tasks.
3. The design specifications of each.
6.2.7.1 Major Categories of Workstations in the Process Workplace
Seated Workstations
By definition, seated workstations (Figure 6-21) require the operator tobe seated at a panel or at a desk to perform his or her task. The majorissues with seated workstations are
• Lack of adjustability to the wide range of body sizes that occupy theworkstation.
238 Workplace Design
Figure 6-21 A seated workstation.
Ch06qxd 11/21/03 09:21 PM Page 238

• Access to the areas that support seated work such as filing, storage,binders, communications, and computer equipment.
• Communication with other seated operators.
• The design of the operator’s chair.
• Difficult to lift objects or apply force.
Standing Workstations
Standing workstations (Figure 6-22) require the operator to stand at aworkstation, display panel, or bench to perform a task. The major issueswith standing workstations are
• Fatigue caused by long periods of standing.
• Access to tools, materials, and equipment needed to perform the task.
• Height adjustability of the work surface with regard to both thestature of the user and the type of task being performed.
Workplace Design 239
Figure 6-22 A standing workstation.
Ch06qxd 11/21/03 09:21 PM Page 239

Sit/Stand Workstations
Sit/stand workstations (Figure 6-23) are used when some of the tasksare done standing and others done sitting. The work surface is elevated toa standing height and the operator sits at the workstation on a chair thatis also elevated. The base of the chair is typically fitted with a footrest inthe form of a ring. This category of workstation can offer users the bestof all worlds since they do not suffer the fatigue found in standing work-stations, yet have more range of motion than seated workstations wouldoffer. The only disadvantage to the elevated work surface is that all otherequipment, storage, and filing facilities must be similarly elevated to beaccessed effectively.
6.2.7.2 Selecting the Optimal Workstation Design
Each of the workstations just described is more useful for some taskconditions than others. In many instances, the selection of workstation
240 Workplace Design
Figure 6-23 A sit/stand workstation. (Courtesy Brad Adams Walker Architects,Denver, Colorado.)
Ch06qxd 11/21/03 09:21 PM Page 240

category is obvious (e.g., working at a compressor control panel), but insome situations, the selection is not entirely obvious. And, if the wrongchoice is made (for example, a standing workstation rather than a sit/standone), the resulting design may be difficult to retrofit when the mistake isidentified (lack of knee room in the standing workstation for the seatedoperator). The choice of workstation is made easier by considering thecharacteristics of the task(s) performed. Table 6-4 is provided as an aid inselecting the correct workstation configuration based on the tasks per-formed. If, for example, the user is in one position over extended periodsof time, a seated or sit/stand workstation is indicated.
Workplace Design 241
TABLE 6-4
Optimizing the Selection of a Style of Workstation
Recommended Styleof Workstation
Questions S ST SS
Is a high degree of body stability required? * *
Does the user perform the same task over long work periods? * *
Does the user need to use his or her feet for control? * *
Does the user need to be continually mobile to perform *the work?
Does the user work over a counter with standing clients? * *
Does the user work with heavy loads? *
Does the user need to monitor displays that are widely * *separated?
Does the user need to monitor displays whose lines of sight * *are obstructed by other equipment?
Does the work surface need to vary widely in height from *one task to another?
S = seated workstation.ST = standing workstation.SS = sit/stand workstation.
Ch06qxd 11/21/03 09:21 PM Page 241
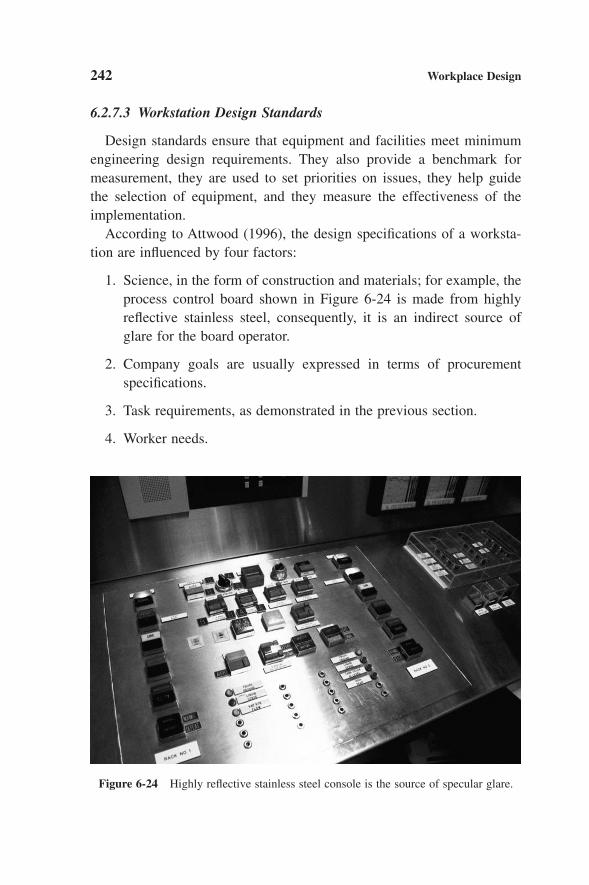
6.2.7.3 Workstation Design Standards
Design standards ensure that equipment and facilities meet minimumengineering design requirements. They also provide a benchmark formeasurement, they are used to set priorities on issues, they help guide the selection of equipment, and they measure the effectiveness of theimplementation.
According to Attwood (1996), the design specifications of a worksta-tion are influenced by four factors:
1. Science, in the form of construction and materials; for example, theprocess control board shown in Figure 6-24 is made from highlyreflective stainless steel, consequently, it is an indirect source ofglare for the board operator.
2. Company goals are usually expressed in terms of procurement specifications.
3. Task requirements, as demonstrated in the previous section.
4. Worker needs.
242 Workplace Design
Figure 6-24 Highly reflective stainless steel console is the source of specular glare.
Ch06qxd 11/21/03 09:21 PM Page 242

The last factor refers to the ability of the workstation to adjust to the char-acteristics of each user. These characteristics may be only physical, suchas arm reach or stature, or sensory, such as adjustable lighting systems tocompensate for the vision of the older operator. Keep in mind that work-station adjustability puts pressure on the design of associated systems. For example, one disadvantage of continuously adjustable work surfaceheights is the difficulty of mounting storage cabinets over the worksurface. Cabinet height might have to adjust to the work surface.
Finally, do not forget that the user is the customer for the workstation.No design should be completed without considering the requirements ofthe group of users who work at the workstation. Having said this, the spec-ification of every workstation should be determined through the use of acomprehensive task analysis or a survey such as the one in Table 6-5 forprocess control room equipment.
The physical dimensions of seated, standing, and sit/stand work-stations are well known and available in several texts (Grandjean, 1995;Sanders and McCormick, 1993; Eastman Kodak, 1983; VanCott andKinkade, 1972; Joyce and Wallersteiner, 1989; Attwood, 1996) and stan-dards (ANSI/HFS, 1988; CSA, 1989). The following paragraphs providethe basic physical design considerations for each workstation category.The ranges of adjustment cover the 5th percentile North American/Euro-pean woman to the 95th percentile North American/European man. Awider range of adjustment is necessary to account for the dimensions ofthe non-North American/European populations.
Seated Workstations
Figure 6-25 summarizes the dimensions the literature generally recom-mends for a seated workstation. The major dimensions to key on include
• The height of the top of the work surface.
• The clearance between the floor and the bottom of the work surface.
• Clearance for the knees and feet.
Work surface depth depends on that task to be conducted, such as whetherthe person is using a computer monitor.
Workplace Design 243
Ch06qxd 11/21/03 09:21 PM Page 243
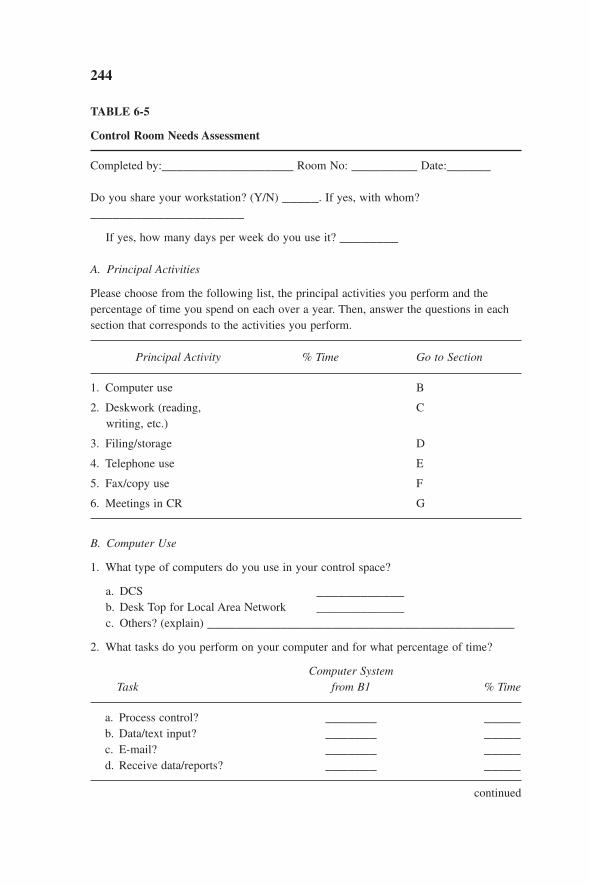
244
TABLE 6-5
Control Room Needs Assessment
Completed by:__________________ Room No: _________ Date:______
Do you share your workstation? (Y/N) _____. If yes, with whom?_____________________
If yes, how many days per week do you use it? ________
A. Principal Activities
Please choose from the following list, the principal activities you perform and thepercentage of time you spend on each over a year. Then, answer the questions in eachsection that corresponds to the activities you perform.
Principal Activity % Time Go to Section
1. Computer use B
2. Deskwork (reading, Cwriting, etc.)
3. Filing/storage D
4. Telephone use E
5. Fax/copy use F
6. Meetings in CR G
B. Computer Use
1. What type of computers do you use in your control space?
a. DCS ____________b. Desk Top for Local Area Network ____________c. Others? (explain) __________________________________________
2. What tasks do you perform on your computer and for what percentage of time?
Computer SystemTask from B1 % Time
a. Process control? _______ _____b. Data/text input? _______ _____c. E-mail? _______ _____d. Receive data/reports? _______ _____
continued
Ch06qxd 11/21/03 09:21 PM Page 244

245
3. What type of support materials do you use while operating your computer?
Computer SystemMaterial from B1 % Time
a. Documents (letter size) _______ _____b. Books (28 ¥ 43cm, 11 ¥ 17 in.) _______ _____c. Binders (28 ¥ 43cm, 11 ¥ 17 in.) _______ _____d. Printed output _______ _____
(55 ¥ 35cm, 22 ¥ 14 in.)e. Large drawings _______ _____
(60 ¥ 90cm, 24 ¥ 36 in.)
4. In addition to monitors, keyboards, and pointing devices, do you use any specializedcomputer devices? (Y/N)
a. External disk drives _______________________b. Printer/plotters _______________________c. Other devices (specify) _______________________
5. What type of pointing devices do you use for each of the systems identified inQuestion 1 (e.g., mouse, trackball, touch screen)?
ComputerSystem fromB1 Pointing Device
_________ _____________________ _____________________ ____________
6. What type of input devices do you use for each of the systems identified in Question1 (e.g., standard keyboard, specialized keypad, other [specify])?
ComputerSystem fromB1 Input Device
_________ _____________________ _____________________ ____________
continued
Ch06qxd 11/21/03 09:21 PM Page 245
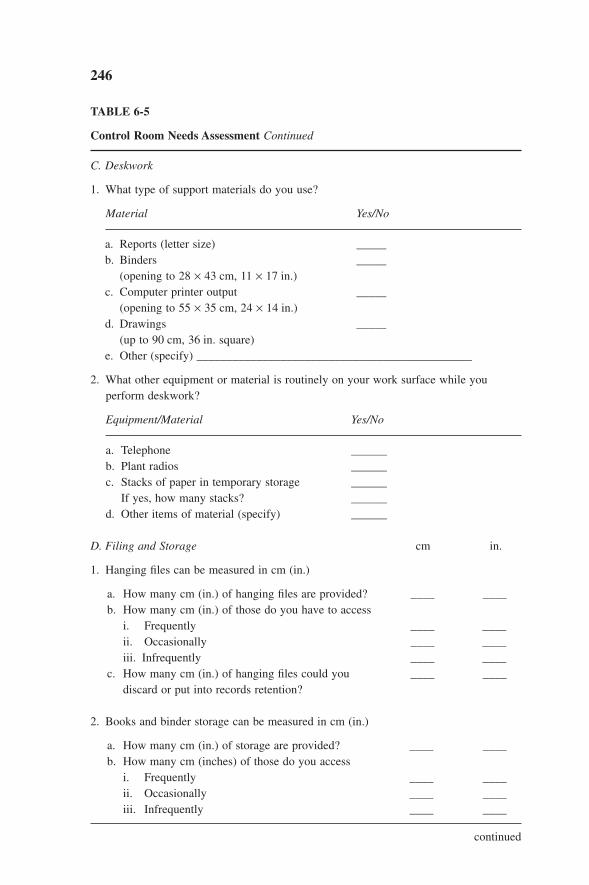
TABLE 6-5
Control Room Needs Assessment Continued
C. Deskwork
1. What type of support materials do you use?
Material Yes/No
a. Reports (letter size) _____b. Binders _____
(opening to 28 ¥ 43 cm, 11 ¥ 17 in.)c. Computer printer output _____
(opening to 55 ¥ 35 cm, 24 ¥ 14 in.)d. Drawings _____
(up to 90 cm, 36 in. square)e. Other (specify) ______________________________________________
2. What other equipment or material is routinely on your work surface while youperform deskwork?
Equipment/Material Yes/No
a. Telephone ______b. Plant radios ______c. Stacks of paper in temporary storage ______
If yes, how many stacks? ______d. Other items of material (specify) ______
D. Filing and Storage cm in.
1. Hanging files can be measured in cm (in.)
a. How many cm (in.) of hanging files are provided? ____ ____b. How many cm (in.) of those do you have to access
i. Frequently ____ ____ii. Occasionally ____ ____iii. Infrequently ____ ____
c. How many cm (in.) of hanging files could you ____ ____discard or put into records retention?
2. Books and binder storage can be measured in cm (in.)
a. How many cm (in.) of storage are provided? ____ ____b. How many cm (inches) of those do you access
i. Frequently ____ ____ii. Occasionally ____ ____iii. Infrequently ____ ____
246
continued
Ch06qxd 11/21/03 09:21 PM Page 246

c. How many cm (inches) of storage could you ____ ____discard or put into records retention?
3. Personal storage can be measured by drawers (10 cm, 4 in. high) or by cm (in.) ofshelf space.
a. How many drawers of personal storage do you have? ____b. How many cm (inches) of shelf space do you have? ____ cm? or in.?c. By how much could you reduce your personal storage?
i. Drawers? ____ii. Shelf space? ____ cm? or in.?
4. Special requirements for the storage of office supplies? (Y/N). If yes, please explain.
________________________________________________________.
E. Telephone Use
1. Which activities do you perform while using the telephone?a. Writing? (Y/N) ____b. Accessing the computer? (Y/N) ____c. Accessing files/drawers? (Y/N) ____d. Other (explain) ___________________________________
F. Fax/Copy Use
1. Do you have a fax machine on any part of yourworkstation? (Y/N) ____
2. Do you have a copy machine on any part of yourworkstation? (Y/N) ____
3. Are you required to add paper or change ribbonsor cartridges? (Y/N) ____
G. Meetings
1. How many meetings do you typically hold in thecontrol room in a week? ____
2. How many people typically attend the meetings? ____
3. What types of materials would you and your attendees bring to the meetings?a. Reports? _________________b. Open reports (23 ¥ 43cm, 11 ¥ 17 in.) _________________c. Other materials? (please explain) _________________
247
continued
Ch06qxd 11/21/03 09:21 PM Page 247

TABLE 6-5
Control Room Needs Assessment Continued
4. How long do your meetings last (on average) ____
5. Do you have enough seating for the attendees? (Y/N) ____
6. Do you have enough work surfaces for them to take notes? (Y/N) ____
H. Control Space Traffic
1. Who is permitted in your control room?a. Forepersons and supervisors? (Y/N) ____b. Outside operators? (Y/N) ____c. Contractors? (Y/N) ____d. Others (explain) ______________________________________
2. How many “guest” seats do you have available? ____
3. Does the location of exits and entrances promoteunnecessary traffic? (Y/N) ____
4. Are tasks done inside the control room that encourageunnecessary people? ____If so, explain ___________________________________________
248
Dimensionscm (in.)
1If Dimension Is Fixed D = 76 (30)2If Dimension Is Fixed C = 71 (28)
A
E
B
C 2 D1
A = 40–50 (16–20)B = 20 (8) minC = 61–74 (24–29)D = 64–76 (25–30)E = 61 (24) min
Figure 6-25 Specifications for a seated workstation.
Ch06qxd 11/21/03 09:21 PM Page 248
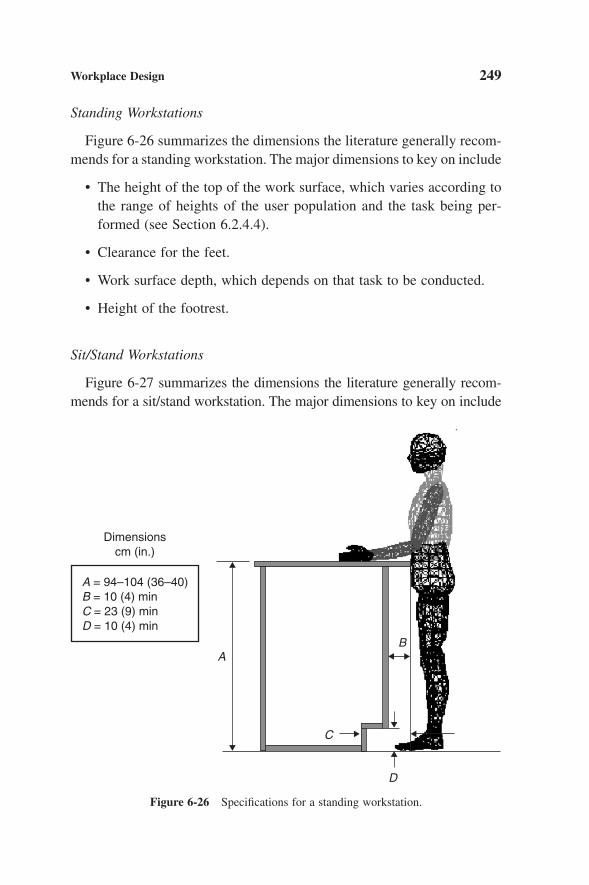
Standing Workstations
Figure 6-26 summarizes the dimensions the literature generally recom-mends for a standing workstation. The major dimensions to key on include
• The height of the top of the work surface, which varies according tothe range of heights of the user population and the task being per-formed (see Section 6.2.4.4).
• Clearance for the feet.
• Work surface depth, which depends on that task to be conducted.
• Height of the footrest.
Sit/Stand Workstations
Figure 6-27 summarizes the dimensions the literature generally recom-mends for a sit/stand workstation. The major dimensions to key on include
Workplace Design 249
Dimensionscm (in.)
A = 94–104 (36–40)B = 10 (4) minC = 23 (9) minD = 10 (4) min
A
C
B
D
Figure 6-26 Specifications for a standing workstation.
Ch06qxd 11/21/03 09:21 PM Page 249

• The height of the top of the work surface, which varies according tothe range of heights of the user population and the task being per-formed (see Section 6.2.4.4).
• Clearance for the knees and feet.
• Work surface depth, which depends on that task conducted.
• Height of the footrest on the workstation or the one attached to theseat or stool.
6.2.7.4 Seating
The worker’s chair may be his or her most important piece of personalfurniture. Certainly, it is the piece of furniture with which the sedentaryworker has the most contact.
When we change from a standing to a seated position, the curvature ofour spine changes and we put more pressure on the intervertebral discs(Grandjean, 1988). The upright seated posture is difficult to maintain forlong periods of time; hence, we slump forward, sometimes leaning on ourelbows to do our work. This posture relaxes our back muscles butincreases the pressure on our intervertebral discs.
250 Workplace Design
Dimensionscm (in.)
A = 94–104 (36–40)B = 25–35 (10–14)C = 75–85 (30–34)D = 61 (24) mina = 25° maxg = 46 (18)
A
B
D
Cag
Figure 6-27 Specifications for a sit/stand workstation.
Ch06qxd 11/21/03 09:21 PM Page 250

The more we can increase the angle between our body and legs, theless pressure we put on our discs. If we tilt the seat pan downward in thefront to increase the angle, more body weight is taken by the chair, thusreducing muscle stress. So, a seated position that allows an angle of110–120° between trunk and legs reduces the pressure squeezing our discsand the stress on our back muscles.
Unfortunately, in the process plant working environment, we cannotalways work in a reclined position. To do so, the work surface would haveto be angled.
So, for the foreseeable future, the seated worker will continue to workat a horizontal work surface and vary his or her posture between reclined,erect, and slumped forward, thus shifting the stress between differentmuscle groups. With this in mind, the job of the chair is to move with theworker and to support the way he or she works.
Seating Guidelines
Figure 6-28 illustrates a well-designed workstation chair. At aminimum, the chair requires
• Five casters for stability.
• A “gas lift” height adjustment that will raise and lower the seat panat least 10 cm (4 inches) and preferably 13 cm (6 inches).
• A seat pan that is — no more than 43 cm (17 inches) deep— firm, yet well cushioned— covered with a non-sticking fabric, and— designed with a rounded front that puts no pressure on the under-
side of the thighs.
• Good lumbar support in the backrest.
• The ability to recline (when reclined, the seat pan should remain horizontal)
• Armrests that are adjustable in height, distance apart (from eachother) and can rotate to provide support for the arm when using apointing device.
Workplace Design 251
Ch06qxd 11/21/03 09:21 PM Page 251
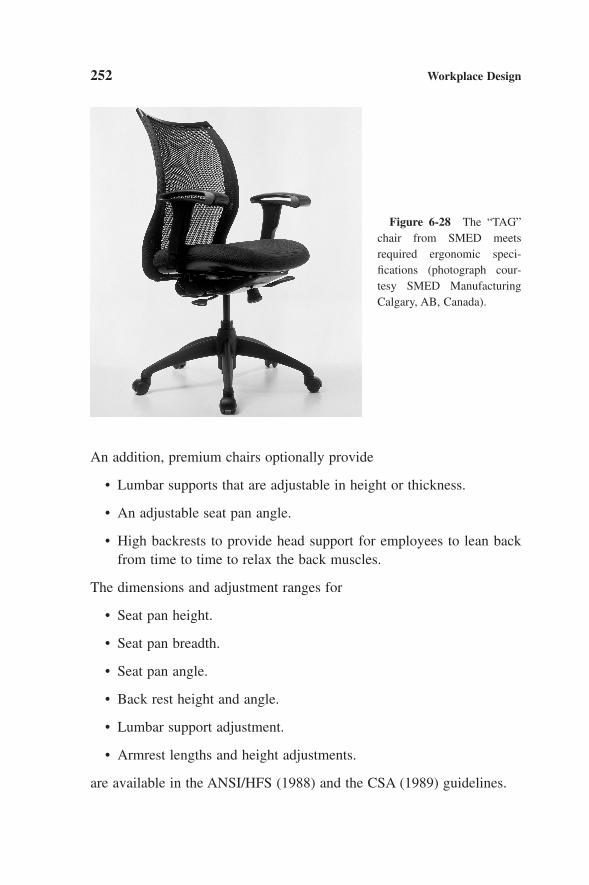
An addition, premium chairs optionally provide
• Lumbar supports that are adjustable in height or thickness.
• An adjustable seat pan angle.
• High backrests to provide head support for employees to lean backfrom time to time to relax the back muscles.
The dimensions and adjustment ranges for
• Seat pan height.
• Seat pan breadth.
• Seat pan angle.
• Back rest height and angle.
• Lumbar support adjustment.
• Armrest lengths and height adjustments.
are available in the ANSI/HFS (1988) and the CSA (1989) guidelines.
252 Workplace Design
Figure 6-28 The “TAG”chair from SMED meetsrequired ergonomic speci-fications (photograph cour-tesy SMED ManufacturingCalgary, AB, Canada).
Ch06qxd 11/21/03 09:21 PM Page 252

The quality of seating varies widely from one manufacturer to the other.It is recommended that workplace seating meet the safety and perform-ance standards set out by the Business and Institutional Furniture Manu-facturers Association (BIFMA).
6.2.8 Maintenance and Maintainability
Workstation equipment is designed for ease of maintenance and main-tainability. Malfunctioning equipment affects productivity and results incosts related to lost opportunities, idle time, and equipment replacementor repair. So, equipment should be selected and installed according to easeof maintenance.
The proper design and installation of equipment has a greater effect onmaintenance efficiency than the skill or training of maintenance techni-cians. This section, therefore, provides guidelines on equipment designand installation as they relate to maintainability and maintenance.
Basic distinctions are made in this section between maintenance andmaintainability to differentiate between the focus of different people onthe site. Maintainability is concerned with the design of equipment andsystems for ease of maintenance. Consequently, engineers and mainte-nance staff usually make maintainability decisions for procurement pur-poses. Maintenance, on the other hand, is concerned with the technicalproblems of installing the equipment after purchase so it can be main-tained properly.
6.2.8.1 Design Considerations
Equipment design should be considered when selecting equipment formaintainability and maintenance. Equipment must be designed withregard to the safety and health of the personnel who service it as well asthose who use it. These items should be looked at during the selectionprocess:
• Maintenance access, including doors and panels and labels.
• Shelves and drawers.
Workplace Design 253
Ch06qxd 11/21/03 09:21 PM Page 253

• Adjustment and lubrication points.
• Access to components that frequently wear out and must be replaced(e.g. belts, bushings).
Maintenance Access
Maintenance access should be located on the same face of the equip-ment as are the related controls, displays, instructions, and the like.Accesses to high-voltage areas should be equipped with safety interlocks.
Hinged access doors with mechanical devices for holding them openare better than cover plates and panels. Lift-off covers are acceptable ifthey can be removed and put back easily. Access covers, cases, handlesshould have rounded corners and edges.
Fasteners for covers and access panels should be kept to a minimumand hand operated whenever possible. (Avoid equipment where specialpurpose tools are required.)
Check that labels provide information on how access is to be made.Warning labels must be provided on accesses leading to hazardous equip-ment. Labels should
• Identify the controls, displays, control panels, and so forth.
• Alert the user to hazards.
• Be large enough to be read by users with corrected vision.
• Be located so users with bifocal glasses can read them.
The reader is referred to Chapter 8 for more information on labels
Shelves and Drawers
Pullout shelves and drawers are better because they make componentsaccessible from several sides. If more than one drawer can be pulled outat a time, check that equipment does not tip.
Adjustment and Lubrication Points
Equipment that must be adjusted, inspected, or lubricated frequentlyshould be equipped with easily accessible adjustment, inspection, andlubrication points.
254 Workplace Design
Ch06qxd 11/21/03 09:21 PM Page 254

6.2.8.2 Maintenance Considerations
Several things must be addressed when selecting equipment for ease of maintenance, including access by operators and maintenance personnel, space and clearance considerations, procedures, and lightingsystems.
Access
Operators and maintenance personnel must be able to access the equip-ment safely and easily to prevent injury and to enhance efficiency ofroutine inspections or preventative maintenance. Therefore,
• Locate access openings so that other equipment need not be movedto gain access.
• Provide platforms, scaffolds, stairs or ladders for technicians whenaccesses must be made at heights that exceed their reach.
• Ensure that equipment that requires more frequent service or main-tenance is in the most accessible locations.
Space and Clearance
Equipment that cannot be adequately positioned for access must beeasily moved. Sufficient clearance must be allowed within and around theoutside of the equipment to
• Use the tools necessary.
• Permit convenient removal and replacement of components.
• Permit convenient connections to utilities such as nitrogen, air orwater.
• Ensure adequate visual access and lighting on the work surfaces.
The equipment designer must pay special attention to
• Postures dictated by the maintenance task, such as stooping, kneel-ing, or reaching overhead.
• Body sizes of operators and repair technicians.
Workplace Design 255
Ch06qxd 11/21/03 09:21 PM Page 255

• Clothing factors, such as bulky clothes for winter use or protection.
• Care and handling of toxic substances.
Traffic areas should be designed to permit the necessary support equip-ment, such as portable cranes or portable stairs, to be transported to themaintenance site.
Equipment with hinged access doors or pullout shelves or drawersrequire outside space that is equal to their openings.
Space should be available for the planned growth of equipment.When possible, systems should be designed so that their functions are
not disrupted if components must be removed from the site for repair.
Procedures
Every maintenance operation should be covered by written procedures,prepared and evaluated during the development of the workstation.
Lighting Systems
The performance of lighting systems, although adequate when new,may deteriorate over time, thereby creating visual problems in the work-place, especially when dirt accumulates on fixtures, lamps burn out, powersources malfunction, or lamp output decreases (with age).
6.2.9 Summary of Design Principles
Table 6-6 summarizes the principles in this section in a checklist format.The table can be used to help identify issues. Of course, like most check-lists, this one should only be used by someone who is knowledgeable withthe subject.
6.3 ANALYTICAL TECHNIQUES IN WORKPLACE DESIGN
The following techniques are more general and deal with the worksystem rather than the worker. For a complete description of each of the
256 Workplace Design
Ch06qxd 11/21/03 09:21 PM Page 256

257
TABLE 6-6
Workplace Design Checklist
MeetsDesign
Design Principle and Chapter or Section Specs? (✓) Comments
Controls and displays are optimally located (Chapter 5)Equipment is visually accessible (Chapter 2)The workplace is designed for the user population (6.2.4)Meets the capabilities and limitations of the user
population (6.2.4.1)Accommodates the extremes of the user population (6.2.4.2)Adjusts to the characteristics of the user population (6.2.4.3)Equipment is physically accessible (6.2.5)Aisles and corridors are properly designed (6.2.5.1)Distances between adjacent pieces of equipment are
optimal (6.2.5.2)Ladders, stairs, ramps, walkways and platforms are properly
designed (6.2.5.3)Pathway obstructions are eliminated or marked to increase
recognition (6.2.5.4)Work is positioned as best for the operator (6.2.6)Position work within the range of motion of the body
(6.2.6.1)Place frequently used materials and tools within easy reach
(6.2.6.2)Avoid static loads and fixed work postures (6.2.6.3)Design to encourage frequent changes in body posture
(6.2.6.4)Avoid causing the upper limbs to work above the shoulder
(6.2.6.5)Avoid work that causes the spine to be twisted (6.2.6.6)Ensure that the forces on the limbs and joints are within
human capabilities (6.2.6.7)Minimize manual handling (6.2.6.8)Provide specialized tools to reduce body stress (6.2.6.9)Workstations and seating are designed according to
accepted ergonomic standards (6.2.7)The optimal workstation design has been selected for the
task (6.2.7.2)
continued
Ch06qxd 11/21/03 09:21 PM Page 257
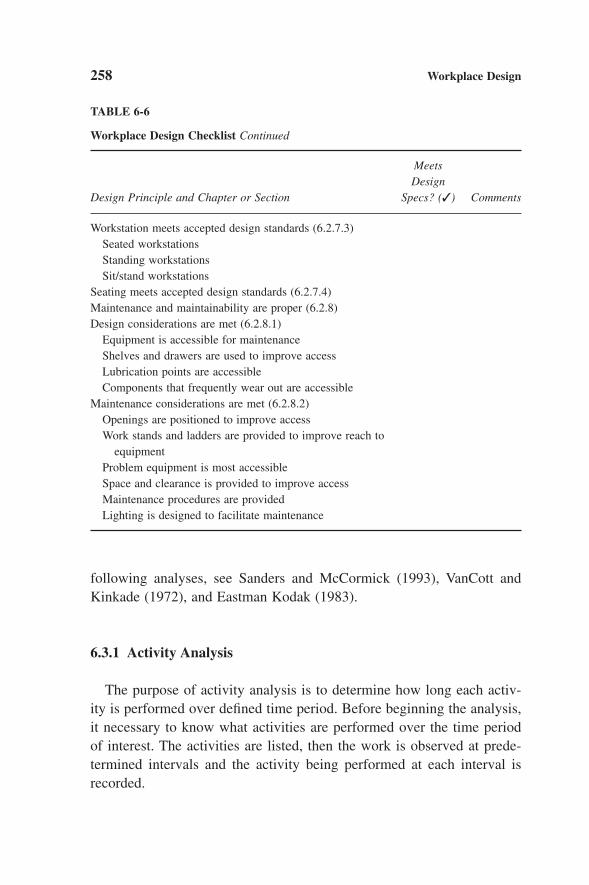
following analyses, see Sanders and McCormick (1993), VanCott andKinkade (1972), and Eastman Kodak (1983).
6.3.1 Activity Analysis
The purpose of activity analysis is to determine how long each activ-ity is performed over defined time period. Before beginning the analysis,it necessary to know what activities are performed over the time periodof interest. The activities are listed, then the work is observed at prede-termined intervals and the activity being performed at each interval isrecorded.
258 Workplace Design
TABLE 6-6
Workplace Design Checklist Continued
MeetsDesign
Design Principle and Chapter or Section Specs? (✓) Comments
Workstation meets accepted design standards (6.2.7.3)Seated workstationsStanding workstationsSit/stand workstations
Seating meets accepted design standards (6.2.7.4)Maintenance and maintainability are proper (6.2.8)Design considerations are met (6.2.8.1)
Equipment is accessible for maintenanceShelves and drawers are used to improve accessLubrication points are accessibleComponents that frequently wear out are accessible
Maintenance considerations are met (6.2.8.2)Openings are positioned to improve accessWork stands and ladders are provided to improve reach to
equipmentProblem equipment is most accessibleSpace and clearance is provided to improve accessMaintenance procedures are providedLighting is designed to facilitate maintenance
Ch06qxd 11/21/03 09:21 PM Page 258

For example, in one study, it was necessary to know how the activitiesperformed by control room operators were distributed over their shifts.Five categories of activities were identified prior to the analysis:
1. Use of the phone or radio.
2. Report preparation, paperwork.
3. Breaks, social discussions.
4. Passive monitoring.
5. Active monitoring.
The control room operator was observed at sample intervals of 2 minutes,the activity was noted, and the observer waited for another 2 minutes totake the next observation. Over a 12-hour shift, 360 samples (observa-tions) were taken. The results of the analysis are shown in Figure 6-29.
Workplace Design 259
0
2
4
6
8
10
12
14
16
0–0.5
hou
rs
0.5–1
hou
rs
1–1.5
hour
s
1.5–2
hou
rs
2–2.5
hou
rs
2.5–3
hou
rs
3–3.5
hou
rs
3.5–4
hou
rs
4–4.5
hou
rs
4.5–5
hou
rs
5–5.5
hou
rs
5.5–6
hou
rs
6–6.5
hou
rs
6.5–7
hou
rs
7–7.5
hou
rs
7.5–8
hou
rs
8–8.5
hour
s
8.5–9
hou
rs
9–9.5
hou
rs
9.5–1
0 hour
s
10–1
0.5 ho
urs
10.5–
11 ho
urs
11–1
1.5 ho
urs
11.5–
12 ho
urs
12–1
2.5 ho
urs
# O
bser
ved
Use Phone/Radio
Reports, Paperwork
Breaks / Social
Passive Monitoring
Active Monitoring
Figure 6-29 Results of an activity analysis of a control room operator over a 12-hourshift.
Ch06qxd 11/21/03 09:21 PM Page 259

The data indicate that, during the first part of the shift, the operator isbusy setting up maintenance permits, adjusting the process, and workingwith outside operators. Further into the shift, assuming no upsets, the oper-ator performs more passive monitoring and spends more time in socialactivities.
6.3.2 Task Analysis
Task analysis is the basic analytical technique of human factors spe-cialists. The technique is described in Chapters 5, 7, and 9.
6.3.3 Link Analysis
Link analysis is one of the most used analytical techniques in theprocess industry. Link analysis is a technique that optimizes the locationof people and equipment in a workplace, or a workstation.
The fundamental considerations when laying out a workplace or work-station include
• Services needed by several people should be placed in a central location.
• People and equipment should be located to maximize the communi-cation between them.
• Distances between components that are important to each other orfrequently communicate should be minimized.
• The probability of unnecessary physical contact between personnelor equipment should be reduced.
Link analyses can be applied over a wide range of layout applications,such as layout of controls and displays on a panel, a workstation, or anoffice, plant, loading area or warehouse. Let us look at an example.
Figure 6-30 shows five displays on a control panel. Let us assume thatthe importance of one display to another is determined by how often the
260 Workplace Design
Ch06qxd 11/21/03 09:21 PM Page 260

operator looks from one display to another. Techniques are available tomeasure where the eyes are looking, and these techniques can be used totell which display the operator is observing at any time. The data fromthis analysis can be used to determine the probability that the operator willlook at display x, given that he or she is now looking at display y. Thedata in Figure 6-30 illustrate these probabilities. If we assume that the dis-plays most important to each other are those that have the highest transi-tional probability, it is possible to rank the importance of one display toanother. This is illustrated in the table in Figure 6-30.
The display layout can now be optimized based on the order shown inthe table. Clearly, it is most important to put displays A and E as closetogether as possible, then displays B and D, and so forth. The resultinglayout is shown in Figure 6-31.
Link analysis is revisited in Chapter 9, at which time, a demonstrationof how the technique can be used in the design of a new project will begiven.
Workplace Design 261
0.1 0.3
0.8
0.1
0.05
0.2
0.50.9
A B C
D
E
A, B = 0.1A, C = 0.3A, D = 0.2A, E = 0.9B, C = 0.3B, D = 0.8B, E = 0.7C, D = 0.1C, E = 0.5D, E = 0.05
0.7
0.3
ConditionalProbabilities
Figure 6-30 Probability of moving the eyes from one display to another.
Ch06qxd 11/21/03 09:21 PM Page 261

6.4 HUMAN FACTORS DESIGN PROCESSES FOR EXISTING ANDNEW WORKSTATIONS
6.4.1 Existing Workstations
There are several reasons why an existing workstation may have to beredesigned (Attwood, 1985):
1. To increase efficiency. For example, production figures may showthat the throughput of a particular workstation is so low that it affectsthe output of the whole plant.
2. To improve health and safety. The employees that share a particularworkstation may be overrepresented in safety incidents or usingtoxic substances.
3. To adapt to a new work process. A change in an associated indus-trial, commercial, or business process may require a correspondingchange in the design of the workstation.
4. To adapt to a change in equipment. The workstation may have to beredesigned to accommodate a new piece of equipment.
262 Workplace Design
A
B
C
D
E
A, E = 0.9B, D = 0.8B, E = 0.7C, E = 0.5B, C = 0.3A, C = 0.3A, D = 0.2A, B = 0.1C, D = 0.1D, E = 0.05
Rank-orderedConditionalProbabilities
Figure 6-31 Rearrangement of displays to reduce the cumulative distance the eyeshave to move when using the display panel.
Ch06qxd 11/21/03 09:21 PM Page 262

The redesign of an existing workstation is often much easier to accom-plish than designing a new workstation. An existing workstation can beanalyzed, a nonexistent workstation cannot. The steps to redesign an exist-ing workstation are outlined in Table 6-7. Let us work in detail with eachof the steps shown in Table 6-7.
6.4.1.1 Familiarization
First, become familiar with the physical workstation (the equipment andequipment layout), the task, the working environment, and the work per-formance criteria. It is essential that you observe the operation and discussit with the operator and first line supervisor. This is a good opportunity tomeet the people affected by your recommendations and learn the rela-tionship between the particular workstation and the rest of the operation.At this point, also become familiar with any new processes or equipmentthe workstation accommodates.
6.4.1.2 Problem Identification
Identify the extent of the design deficiencies with the existing work-station. These indicate whether and to what extent a redesign is requiredand often give you a clue about which data to collect to develop the newdesign. Deficiencies can be identified in a number of ways:
1. Performance records may indicate a sudden increase in the scrapmaterial produced.
Workplace Design 263
TABLE 6-7
Activities in the Design Process for an Existing Workstation
1. Familiarization2. Problem identification3. Background4. Data collection and analysis5. Evaluation6. Recommendations7. Redesign8. Follow-up
Ch06qxd 11/21/03 09:21 PM Page 263

2. Employee records may show a higher than normal level of absen-teeism at certain times or on particular days. Find out what is so dif-ferent about these periods.
3. Employees may complain about discomfort.
4. Employees may modify their own workstation to make them morecomfortable.
5. Employees may have suffered an injury or experienced a near miss.
6. Safety inspections may have uncovered a deficiency.
Any of these indicators may signal that a redesign is required.Specific indicators may provide clues to the cause of the deficiency. Shoul-
der complaints for example, may indicate that the work surface is too high.High scrap levels or spills may be caused by excessive material handling.
6.4.1.3 Background
Obtain background information on these issues:
• What are the physical differences between this workstation and otherslike it that perform adequately?
• Have other studies examined the discomfort produced from similarworkstations?
• Do individual components operate the way they should?
6.4.1.4 Data Collection and Analysis
Analyze the workstation. The type of analysis to do depends on the sit-uation. Many of the techniques for musculoskeletal and physiologicalanalyses have been discussed in the previous chapters and facilities analy-ses are discussed in this chapter.
6.4.1.5 Evaluation
Compare the results of your analyses with the performance criteria thathave been developed for the workstation. The criteria may take many
264 Workplace Design
Ch06qxd 11/21/03 09:21 PM Page 264
forms, such as injury-free operation or output must exceed X bales perminute.
6.4.1.6 Recommendations
Modifications to the existing workstation are recommended based onthe results of the analyses. For example, a link analysis might recommendrelocation of equipment.
6.4.1.7 Follow-Up
The follow-up process should repeat the same steps followed whenoriginally evaluating the need for workstation redesign, comparing theseresults with original results and making sure that you achieved the desiredimprovements.
In the case study, these steps are applied to the redesign of a processcontrol room.
6.4.2 New Workstations
New workstations are designed and built everyday. The requirement fora new workstation may be to support a new process in an existing facil-ity or as part of the requirement from a new plant.
We approach the design of a new workstation in a way that is similarto that for the redesign of an existing workstation. The main difference isthat, now, we cannot take advantage of history. That is, there is nothingto improve on. We cannot become familiar with the workstation and thetask, because neither exists. We can become familiar only with the currentobjectives. We cannot analyze a workstation that never existed, althoughwe can gain background on similar workstations that are now in opera-tion. With a new workstation, the analysis and design process proposedfor existing workstations changes slightly to the following steps:
1. Develop objectives. Understand what the workstation must accom-plish and identify the performance criteria it must meet.
Workplace Design 265
Ch06qxd 11/21/03 09:21 PM Page 265

2. Familiarization. Become familiar with the design constraints (suchas workstation dimensions, the equipment specified, the workprocesses) as best you know them and the interaction with associ-ated processes that may as yet be undefined. It is important at thispoint to have as good an idea as possible of the tasks that the oper-ator must perform. Write an initial version of the procedures fromwhat you know of the process and improve them as more informa-tion becomes available.
3. Prototype (model). Develop a prototype of the proposed workstationthat meets the established objectives and work processes. Modelscan take many forms, and several different models may be devel-oped as more information comes available. The first may be a sketchof the workstation, with the various components laid out in relationto each other. The next version may be a scale drawing in plan andelevation. For complex designs, it may be useful to render the design in a 3-dimensional drawing, such as 3D-CADD. Finally,miniature cardboard or full-size, static, foam-core mockups may be developed.
4. Final design. Base the final design on the models just developed.
5. Follow-up. The follow-up process should evaluate the final designagainst the objectives.
6.5 CASE STUDY
The design of a process control room is critical to the safety and effi-ciency of a process plant. For existing plants, a control room may have tobe updated for a number of reasons, including design and construction ofnew control building or the consolidation of buildings, consolidation ofprocess control systems, introduction of new equipment, or reduction inthe potential for human error.
This case study deals with the redesign of a process control room. Itwill not address operator workload, training, or the design of the processcontrol system. For more information on these topics, see CCPS (1994),ASM (2002), EEMUA (2002), Nimmo (2002), and Strobhar (2002).
266 Workplace Design
Ch06qxd 11/21/03 09:21 PM Page 266
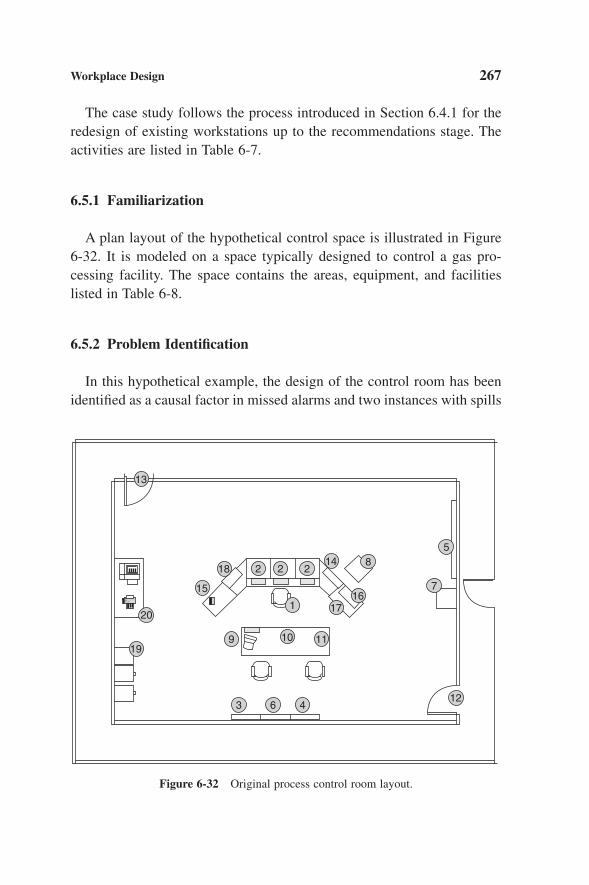
The case study follows the process introduced in Section 6.4.1 for theredesign of existing workstations up to the recommendations stage. Theactivities are listed in Table 6-7.
6.5.1 Familiarization
A plan layout of the hypothetical control space is illustrated in Figure6-32. It is modeled on a space typically designed to control a gas pro-cessing facility. The space contains the areas, equipment, and facilitieslisted in Table 6-8.
6.5.2 Problem Identification
In this hypothetical example, the design of the control room has beenidentified as a causal factor in missed alarms and two instances with spills
Workplace Design 267
18
15
13
14
1716
8
7
5
10 11
1
2 2 2
20
199
3 6 412
Figure 6-32 Original process control room layout.
Ch06qxd 11/21/03 09:21 PM Page 267

on the loading rack that were not detected in time to prevent a major event.It was felt that a reevaluation of the design of the room would help preventsimilar losses in the future. So, the objective of this redesign is to makethe control room more usable and efficient, by understanding the waypeople use the room and designing it for the way they work.
6.5.3 Background
The process control room should be designed to ensure that
• Traffic is properly routed through the control room.
• Space is used efficiently.
268 Workplace Design
TABLE 6-8
Case Study: Control Room Affinity Matrix Components
1. Board operator position2. Process control system monitors and keyboards3. Fire alarm panel4. Emergency shutdown (ESD) panel5. Defeat board/daily orders6. H2S/LeL panel (hydrogen suphide/lower explosive limit) alarm panels7. Security camera (an elevated television screen used to monitor access gates and
loading racks)8. Flare monitor (an elevated television screen used to monitor the operation of the
plant flare)9. Desktop computer (PC) used to attach to the local area network (LAN)
10. Work table (a general-use work surface used by the board operator, outsideoperators, applications engineers, and the like)
11. Work permits (a place on the work table that is reserved for issuing work permits)12. Exit to office and toilets13. Exit to locker room and plant14. Plant radio panel15. Plant telephones16. Binder (procedure) storage17. Log book work area18. Security camera controls19. Storage and files20. Printer and Fax
Ch06qxd 11/21/03 09:21 PM Page 268
• Controls and displays are located optimally (to be seen and manipu-lated by the operator).
• Work areas and equipment are located for optimal interaction.
• Entries and exits are properly located.
• Ergonomic standards are met.
In addition, the control space design should comply with the general work-station design principles introduced in Section 6.2.
6.5.4 Data Collection and Analysis
This section introduces human factors tools to identify the proper layoutof the control space.
6.5.4.1 Affinity Analysis
Affinity analysis is a technique to identify relationships among variousspaces and determine how close these spaces should be placed to eachother. The analysis starts by identifying each of the items in the controlspace that could have a relationship with others (Table 6-8). In some cases,items are physical areas such as “17. Log book work area.” While inothers, the items are pieces of equipment such as “4. Emergency shutdown (ESD) panel.” The items listed in Table 6-8 are located on the planview of the control space in Figure 6-32. Each is relisted as row headingsin Table 6-9, the affinity matrix. Note that each of the 20 items identifiedin our example is uniquely numbered. Each number is also a columnheading in Table 6-9.
The affinity analysis process consists of estimating the subjectivestrength of the relationships between each item. These are the cell valuesin Table 6-9. Typically, the opinions of several board operators areobtained and averaged in each cell in the table. The strengths of the rela-tionships are repeated here, as follows:
1
2
3
4
5
=====
Avoid closeness
Closeness unimportant
Ordinary closeness
Closeness important
Closeness absolutely important
Workplace Design 269
Ch06qxd 11/21/03 09:21 PM Page 269
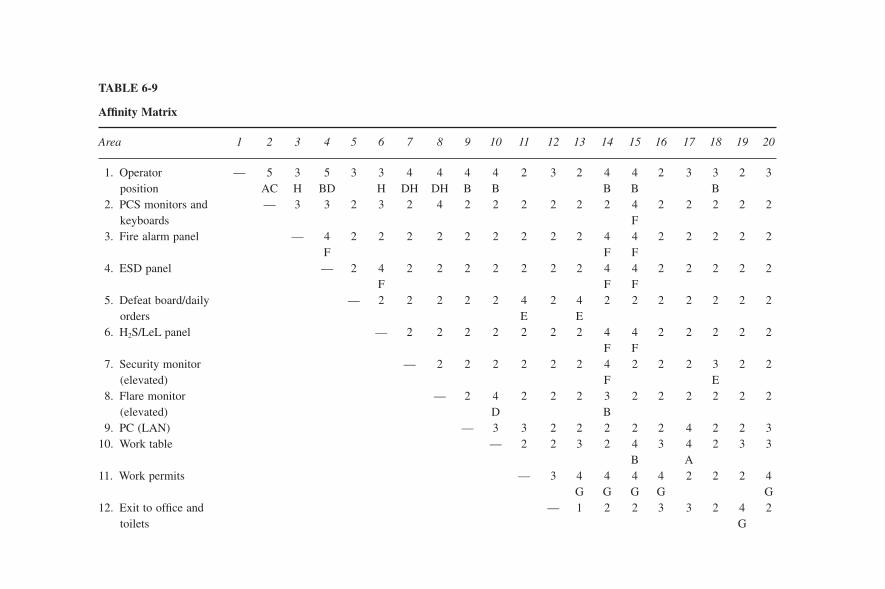
TABLE 6-9
Affinity Matrix
Area 1 2 3 4 5 6 7 8 9 10 11 12 13 14 15 16 17 18 19 20
1. Operator — 5 3 5 3 3 4 4 4 4 2 3 2 4 4 2 3 3 2 3position AC H BD H DH DH B B B B B
2. PCS monitors and — 3 3 2 3 2 4 2 2 2 2 2 2 4 2 2 2 2 2keyboards F
3. Fire alarm panel — 4 2 2 2 2 2 2 2 2 2 4 4 2 2 2 2 2F F F
4. ESD panel — 2 4 2 2 2 2 2 2 2 4 4 2 2 2 2 2F F F
5. Defeat board/daily — 2 2 2 2 2 4 2 4 2 2 2 2 2 2 2orders E E
6. H2S/LeL panel — 2 2 2 2 2 2 2 4 4 2 2 2 2 2F F
7. Security monitor — 2 2 2 2 2 2 4 2 2 2 3 2 2(elevated) F E
8. Flare monitor — 2 4 2 2 2 3 2 2 2 2 2 2(elevated) D B
9. PC (LAN) — 3 3 2 2 2 2 2 4 2 2 310. Work table — 2 2 3 2 4 3 4 2 3 3
B A11. Work permits — 3 4 4 4 4 2 2 2 4
G G G G G12. Exit to office and — 1 2 2 3 3 2 4 2
toilets G
Ch06qxd 11/21/03 09:21 PM Page 270
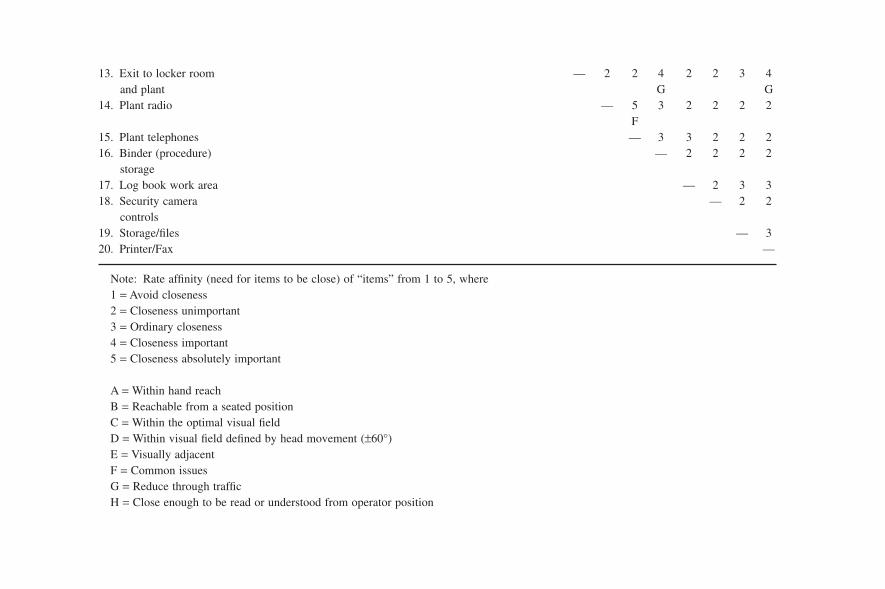
13. Exit to locker room — 2 2 4 2 2 3 4and plant G G
14. Plant radio — 5 3 2 2 2 2F
15. Plant telephones — 3 3 2 2 216. Binder (procedure) — 2 2 2 2
storage17. Log book work area — 2 3 318. Security camera — 2 2
controls19. Storage/files — 320. Printer/Fax —
Note: Rate affinity (need for items to be close) of “items” from 1 to 5, where1 = Avoid closeness2 = Closeness unimportant3 = Ordinary closeness4 = Closeness important5 = Closeness absolutely important
A = Within hand reachB = Reachable from a seated positionC = Within the optimal visual fieldD = Within visual field defined by head movement (±60°)E = Visually adjacentF = Common issuesG = Reduce through trafficH = Close enough to be read or understood from operator position
Ch06qxd 11/21/03 09:21 PM Page 271
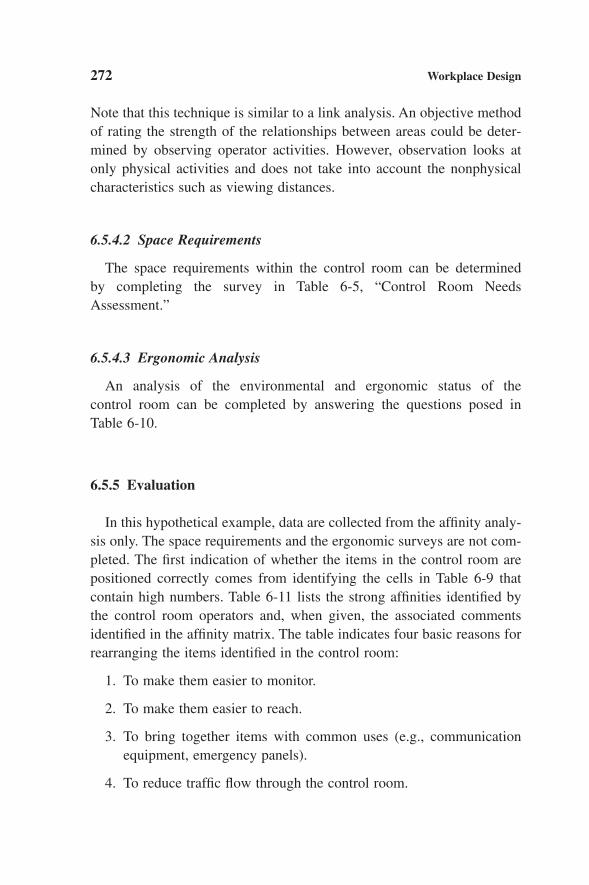
Note that this technique is similar to a link analysis. An objective methodof rating the strength of the relationships between areas could be deter-mined by observing operator activities. However, observation looks atonly physical activities and does not take into account the nonphysicalcharacteristics such as viewing distances.
6.5.4.2 Space Requirements
The space requirements within the control room can be determined by completing the survey in Table 6-5, “Control Room Needs Assessment.”
6.5.4.3 Ergonomic Analysis
An analysis of the environmental and ergonomic status of the control room can be completed by answering the questions posed in Table 6-10.
6.5.5 Evaluation
In this hypothetical example, data are collected from the affinity analy-sis only. The space requirements and the ergonomic surveys are not com-pleted. The first indication of whether the items in the control room arepositioned correctly comes from identifying the cells in Table 6-9 thatcontain high numbers. Table 6-11 lists the strong affinities identified bythe control room operators and, when given, the associated commentsidentified in the affinity matrix. The table indicates four basic reasons forrearranging the items identified in the control room:
1. To make them easier to monitor.
2. To make them easier to reach.
3. To bring together items with common uses (e.g., communicationequipment, emergency panels).
4. To reduce traffic flow through the control room.
272 Workplace Design
Ch06qxd 11/21/03 09:21 PM Page 272

273
TABLE 6-10
Control Room Environmental and Ergonomics Survey
Site –––––––––––––––––––––––– Date ––––––––––––––––––––Item Human Factors Criteria ✓ Comments
HVACAmbient 21–27°C or 70–80°F
temperatureRelative humidity 20–60% (45% at 21°C/70°F)Thermal variation No more than 10°F difference
between head and floor levelVentilation Air is introduced at minimum rate
of 15cfm per occupant,approximately two-thirds ofwhich is outside air filtered toremove dust, particles, etc.
Air velocity Maximum 45 fpm measured at headlevel and no noticeable drafts
LightingGlare No glare on control panels and
displaysNo glare on CRTs
Emergency lighting 10–50 lux (1–5FC).level
Overall illumination 92–927 lux (9–93FC), with meanof 240 lux (24FC) during the dayand 184 lux (18FC) during thenight shift
Task lighting Available in areas wherepaperwork (and other tasks) done
Illumination level Adjustable by the operator
NoiseBackground Level below 55dBA
noiseAdditional sources of No excessive noise besides
noise equipment (e.g., radio, personnel,startling alarms)
Ambient noise Free from high-frequency tones(8000Hz)
Noise interference Noise does not interfere withcommunication
continued
Ch06qxd 11/21/03 09:21 PM Page 273

TABLE 6-10
Control Room Environment and Ergonomics Survey Continued
Site –––––––––––––––––––––––– Date ––––––––––––––––––––Item Human Factors Criteria ✓ Comments
Alarms 10dBA over background
VibrationNoticeable No noticeable vibration from
vibration either standing or seated positionControlRoom LayoutMinimum 54 in. minimum in front of all
clearance around main consolescontrol panels 36 in. minimum for maintenance
Maintenance clearance aroundequipment.
Traffic Traffic does not flow throughmain operating area
Space Available for _____ personnelneeded to handle upsets
Distance between 30 in. minimum (42 in. preferred)keyboards of consoles
Visual angle Equipment within normal reachand ± 30°
Placement of Consistent with importance andequipment frequency of use
Dedicated to portions of theprocess consistent with processflow
VDTErgonomicsChairs Meet ANSI standards and in good
repair; include circular footrest of18 in. diameter
Level of midmonitor 15–117cm (6–46 in.) with 99cm(39 in.) preferred; viewing anglewithin 35° of horizontal line of sight (LOS)with 15° below LOS preferred
Viewing distance 33–80cm (13–30 in.) with 46–61cm(18–24 in.) preferred
274
continued
Ch06qxd 11/21/03 09:21 PM Page 274
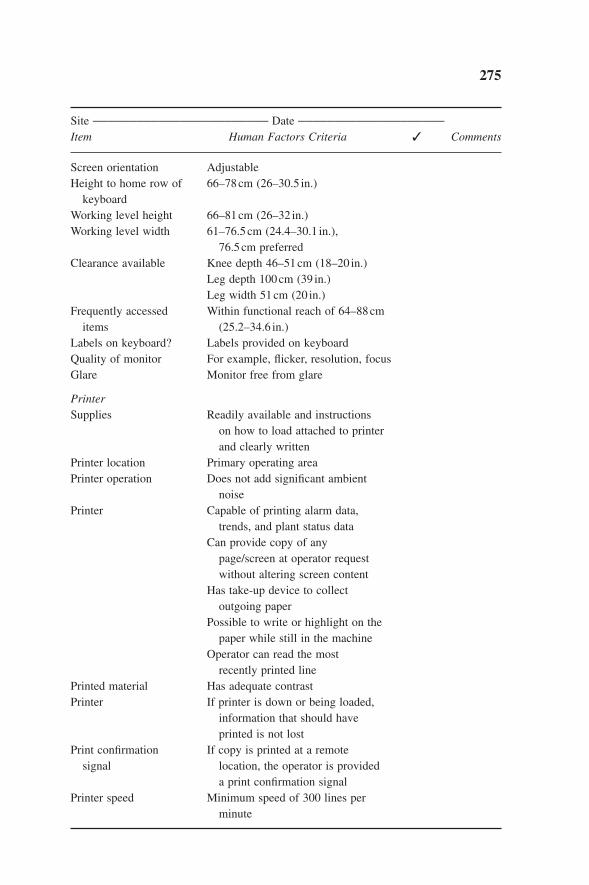
Site –––––––––––––––––––––––– Date ––––––––––––––––––––Item Human Factors Criteria ✓ Comments
Screen orientation AdjustableHeight to home row of 66–78cm (26–30.5 in.)
keyboardWorking level height 66–81cm (26–32 in.)Working level width 61–76.5cm (24.4–30.1 in.),
76.5cm preferredClearance available Knee depth 46–51cm (18–20 in.)
Leg depth 100cm (39 in.)Leg width 51cm (20 in.)
Frequently accessed Within functional reach of 64–88cmitems (25.2–34.6 in.)
Labels on keyboard? Labels provided on keyboardQuality of monitor For example, flicker, resolution, focusGlare Monitor free from glare
PrinterSupplies Readily available and instructions
on how to load attached to printerand clearly written
Printer location Primary operating areaPrinter operation Does not add significant ambient
noisePrinter Capable of printing alarm data,
trends, and plant status dataCan provide copy of any
page/screen at operator requestwithout altering screen content
Has take-up device to collectoutgoing paper
Possible to write or highlight on thepaper while still in the machine
Operator can read the mostrecently printed line
Printed material Has adequate contrastPrinter If printer is down or being loaded,
information that should haveprinted is not lost
Print confirmation If copy is printed at a remotesignal location, the operator is provided
a print confirmation signalPrinter speed Minimum speed of 300 lines per
minute
275
Ch06qxd 11/21/03 09:21 PM Page 275

276
TABLE 6-11
Item Pairs from the Affinity Matrix with Strong Associations
Item Pair Affinity Comment
1. Operator position (1)–PC 5 Within hand reachmonitors/keyboards (2) Within optimal visual field
2. Operator position (1)–ESD 5 Reachable from a seated positionpanel (4) Within visual field defined by
head movementClose enough to be read and
understood from the operatorposition
3. Plant radio (14)–plant telephones (15) 5 Common issues4. Operator position (1)–security 4 Within visual field defined by
monitor (7) head movementClose enough to be read or
understood from the operatorposition
5. Operator position (1)–flare monitor (8) 4 Within visual field defined byhead movement
Close enough to be read orunderstood from the operatorposition
6. Operator position (1)–LAN system (9) 4 Reachable from a seated position7. Operator position (1)–work table (10) 4 Reachable from a seated position8. Operator position (1)–plant radio (14) 4 Reachable from a seated position9. Operator position (1)–plant 4 Reachable from a seated position
telephones (15)10. PCS monitors and keyboards (2)–flare 4
monitor (8)11. PCS monitors and keyboards (2)–plant 4 Common issues
telephones (15)12. Fire alarm panel (3)–ESD panel (4) 4 Common issues13. Fire alarm panel (3)–plant radio (14) 4 Common issues14. Fire alarm panel (3)–plant 4 Common issues
telephones (15)15. ESD panel (4)–H2S/LeL panel (6) 4 Common issues16. ESD panel (4)–plant radio (14) 4 Common issues17. ESD panel (4)–plant telephones (15) 4 Common issues18. Defeat board/daily orders (5)–work 4 Visually adjacent
permit board (11)
continued
Ch06qxd 11/21/03 09:21 PM Page 276

Workplace Design 277
Item Pair Affinity Comment
19. Defeat board/daily orders (5)–exit to 4 Visually adjacentlocker room and plant (13)
20. H2S/LeL panel (6)–plant radio (14) 4 Common issues21. H2S/LeL panel (6)–plant 4 Common issues
telephones (15)22. Security monitor (7)–plant radio (14) 4 Common issues23. Flare monitor (8)–work table (10) 4 Within the visual field defined
by head movement24. PC LAN (9)–log book work area (17) 4 Common issues25. Work table (10)–plant telephones (15) 4 Reachable from a seated position26. Work table (10)–binder (procedure) 4 Reachable from a seated position
storage(16)27. Work permits (11)–exit to locker 4 Reduce through traffic
room and plant (13)28. Work permits (11)–plant radio (14) 4 Reduce through traffic29. Work permits (11)–plant 4 Reduce through traffic
telephones (15)30. Work permits (11)–binder (procedure 4 Reduce through traffic
storage) (16)31. Work permits (11)–printer/Fax (20) 4 Reduce through traffic32. Exit to office and toilet (12)–storage 4 Reduce through traffic
and files (19)33. Exit to locker room and plant (13)– 4 Reduce through traffic
Binder (procedure) storage (16)34. Exit to locker room and plant (13)– 4 Reduce through traffic
printer/Fax (20)
6.5.6 Recommendations and Redesign
The affinities noted and explained in Table 6-11 direct the designer tomake a number of changes in the layout of the control space. These arelisted in Table 6-12. The resulting layout is shown in Figure 6-33.
In summary, the case study suggests how the design of the control spacecan be systematically analyzed and improved.
Models drawn with ManneQuin PRO Software, courtesy of NexGenErgonomics, Montreal, Quebec, Canada.
Ch06qxd 11/21/03 09:21 PM Page 277
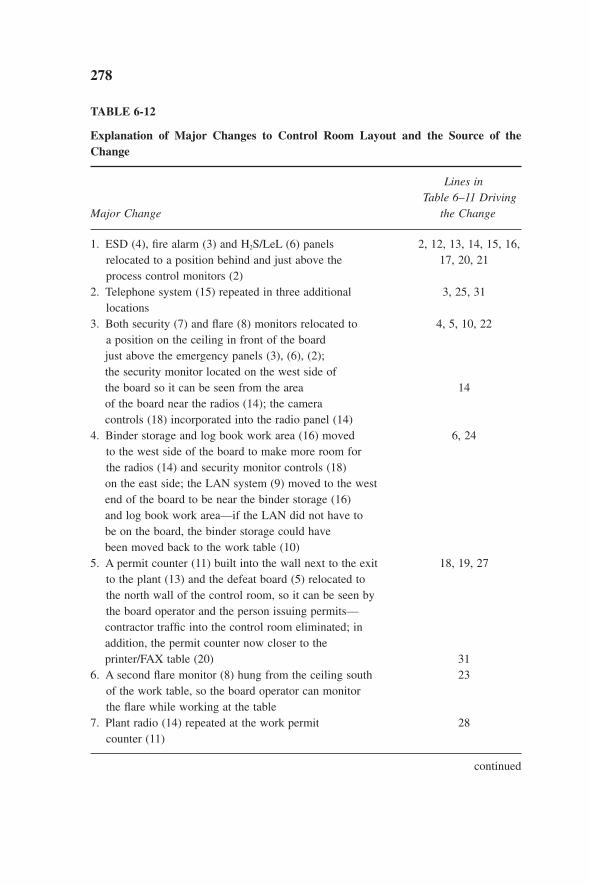
278
TABLE 6-12
Explanation of Major Changes to Control Room Layout and the Source of theChange
Lines inTable 6–11 Driving
Major Change the Change
1. ESD (4), fire alarm (3) and H2S/LeL (6) panels 2, 12, 13, 14, 15, 16,relocated to a position behind and just above the 17, 20, 21process control monitors (2)
2. Telephone system (15) repeated in three additional 3, 25, 31locations
3. Both security (7) and flare (8) monitors relocated to 4, 5, 10, 22a position on the ceiling in front of the boardjust above the emergency panels (3), (6), (2);the security monitor located on the west side ofthe board so it can be seen from the area 14of the board near the radios (14); the cameracontrols (18) incorporated into the radio panel (14)
4. Binder storage and log book work area (16) moved 6, 24to the west side of the board to make more room forthe radios (14) and security monitor controls (18)on the east side; the LAN system (9) moved to the westend of the board to be near the binder storage (16)and log book work area—if the LAN did not have tobe on the board, the binder storage could havebeen moved back to the work table (10)
5. A permit counter (11) built into the wall next to the exit 18, 19, 27to the plant (13) and the defeat board (5) relocated tothe north wall of the control room, so it can be seen bythe board operator and the person issuing permits—contractor traffic into the control room eliminated; inaddition, the permit counter now closer to theprinter/FAX table (20) 31
6. A second flare monitor (8) hung from the ceiling south 23of the work table, so the board operator can monitorthe flare while working at the table
7. Plant radio (14) repeated at the work permit 28counter (11)
continued
Ch06qxd 11/21/03 09:21 PM Page 278
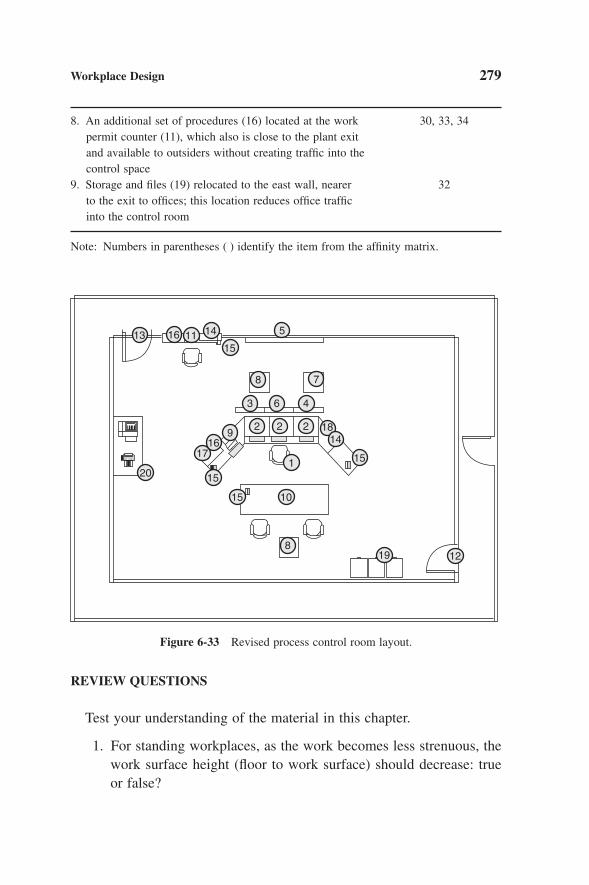
Workplace Design 279
8. An additional set of procedures (16) located at the work 30, 33, 34permit counter (11), which also is close to the plant exitand available to outsiders without creating traffic into thecontrol space
9. Storage and files (19) relocated to the east wall, nearer 32to the exit to offices; this location reduces office trafficinto the control room
Note: Numbers in parentheses ( ) identify the item from the affinity matrix.
15
5
8 7
463
9
819 12
17
15
15
15
1814
10
1
222
20
16
14111613
Figure 6-33 Revised process control room layout.
REVIEW QUESTIONS
Test your understanding of the material in this chapter.
1. For standing workplaces, as the work becomes less strenuous, thework surface height (floor to work surface) should decrease: trueor false?
Ch06qxd 11/21/03 09:21 PM Page 279
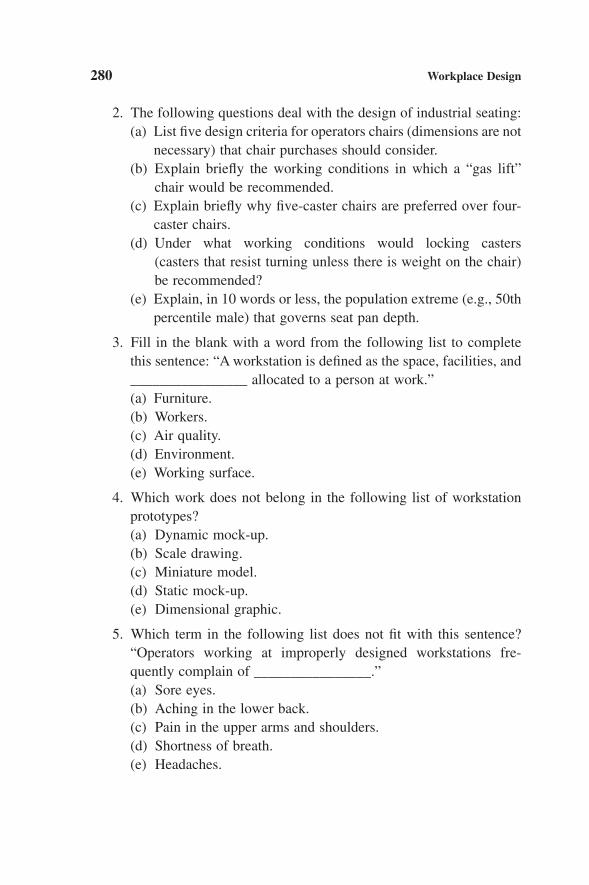
2. The following questions deal with the design of industrial seating:(a) List five design criteria for operators chairs (dimensions are not
necessary) that chair purchases should consider.(b) Explain briefly the working conditions in which a “gas lift”
chair would be recommended.(c) Explain briefly why five-caster chairs are preferred over four-
caster chairs.(d) Under what working conditions would locking casters
(casters that resist turning unless there is weight on the chair)be recommended?
(e) Explain, in 10 words or less, the population extreme (e.g., 50thpercentile male) that governs seat pan depth.
3. Fill in the blank with a word from the following list to completethis sentence: “A workstation is defined as the space, facilities, and________________ allocated to a person at work.”(a) Furniture.(b) Workers.(c) Air quality.(d) Environment.(e) Working surface.
4. Which work does not belong in the following list of workstationprototypes?(a) Dynamic mock-up.(b) Scale drawing.(c) Miniature model.(d) Static mock-up.(e) Dimensional graphic.
5. Which term in the following list does not fit with this sentence?“Operators working at improperly designed workstations fre-quently complain of ________________.”(a) Sore eyes.(b) Aching in the lower back.(c) Pain in the upper arms and shoulders.(d) Shortness of breath.(e) Headaches.
280 Workplace Design
Ch06qxd 11/21/03 09:21 PM Page 280

6. Which of the following techniques would be best to analyze thelayout of a kitchen in a process control building?(a) Link analysis.(b) Decision analysis.(c) Activity analysis.(d) Functional analysis.(e) Discomfort rating analysis.
7. Your company is undergoing a total quality program to improvecustomer service and reduce operation expenses. Management hasdecided to eliminate office space for the marketing sales force andhave them work out of their leased vehicles. You have the job ofdesigning a workplace within each salesperson’s vehicle. Theobjectives of the workplace are(a) Interference with driving must be minimal. Safety is of para-
mount importance. So, for example, while you would not beexpected to initiate cell phone calls while driving, you wouldbe expected to receive calls safely.
(b) Full voice communication between the vehicle and the officesupport staff and between the vehicle computer and thecompany’s LAN is vital.
(c) On-board computing facilities are required to access customerdatabases, prepare invoices, and so forth.
(d) The vehicle must be able to be returned to resale shape forunder $500.
(e) All equipment must be secure in the event of a sudden deceleration.
(f) Enough space must be available in the vehicle to carry one passenger.
The major pieces of equipment used in the vehicle are a cellularphone, a laptop computer, a portable printer, a Fax machine, and ahandheld portable computer. Your task is as follows:(a) Briefly discuss the principles or assumptions you developed to
determine the priorities and the locations relative to the driver(assume that the steering wheel column is the centerline for thedriver).
Workplace Design 281
Ch06qxd 11/21/03 09:21 PM Page 281
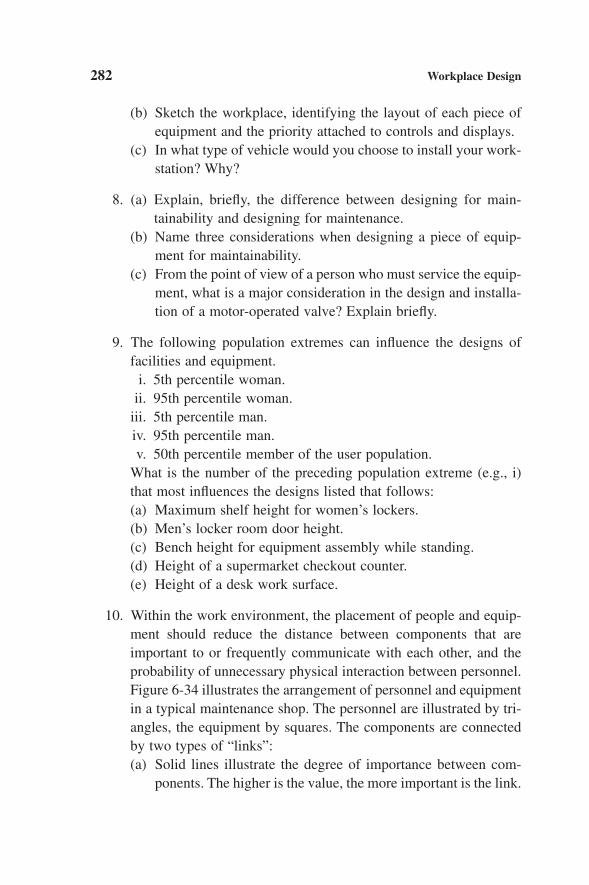
282 Workplace Design
(b) Sketch the workplace, identifying the layout of each piece ofequipment and the priority attached to controls and displays.
(c) In what type of vehicle would you choose to install your work-station? Why?
8. (a) Explain, briefly, the difference between designing for main-tainability and designing for maintenance.
(b) Name three considerations when designing a piece of equip-ment for maintainability.
(c) From the point of view of a person who must service the equip-ment, what is a major consideration in the design and installa-tion of a motor-operated valve? Explain briefly.
9. The following population extremes can influence the designs offacilities and equipment.
i. 5th percentile woman.ii. 95th percentile woman.
iii. 5th percentile man.iv. 95th percentile man.v. 50th percentile member of the user population.
What is the number of the preceding population extreme (e.g., i)that most influences the designs listed that follows:(a) Maximum shelf height for women’s lockers.(b) Men’s locker room door height.(c) Bench height for equipment assembly while standing.(d) Height of a supermarket checkout counter.(e) Height of a desk work surface.
10. Within the work environment, the placement of people and equip-ment should reduce the distance between components that areimportant to or frequently communicate with each other, and theprobability of unnecessary physical interaction between personnel.Figure 6-34 illustrates the arrangement of personnel and equipmentin a typical maintenance shop. The personnel are illustrated by tri-angles, the equipment by squares. The components are connectedby two types of “links”:(a) Solid lines illustrate the degree of importance between com-
ponents. The higher is the value, the more important is the link.
Ch06qxd 11/21/03 09:21 PM Page 282

283
TABLE 6-13
Link Analysis Data for Figure 6–34 and Review Question 10
1 2 A B C
Importance data1 — 0 1 1 72 — 1 5 3A — 0 4B — 2C —Frequency data1 — 0 4 3 32 — 2 1 6A — 0 3B — 1C —
3
3 4
63
1
27
5
1
00
00
1
141
2
3
Where
= Importance= Frequency
A
C
B
1
2
Figure 6-34 Link values between the elements in Review Question 10.
Ch06qxd 11/21/03 09:21 PM Page 283

(b) Dotted lines illustrate the frequency with which each of thecomponents interacts over a given period of time. The higheris the value, the more frequently the components interact.
A summary of the importance and frequency links between com-ponents and their values is listed in Table 6-13.Using the information given,(a) Generate a single criterion for component placement.(b) Sketch the optimal relative location of each component,
drawing in the appropriate links and their values.State all your assumptions.
REFERENCES
ABS. (1998) Guidance Notes on the Application of Ergonomics to Marine Systems. NewYork: American Bureau of Shipping.
ANSI/HFES. (1988) American National Standard for Human Factors Engineering Designof Visual Display Terminal Workstations. ANSI/HFS Standard 100-1988. SantaMonica, CA: Human Factors Society.
ASM. (2002) ASM Consortium Guidelines: Effective Operator Display Design. Minneapo-lis, MN: Abnormal Situation Management Consortium, Honeywell Laboratories.
Attwood, D. A. (1985) “Applied Workstation Design.” Distance Education in Ergonom-ics, Section 12. Post-diploma course in Occupational Safety and OccupationalHygiene. Community College Network of Ontario, Canada.
Attwood, D. A. (1996) Office Relocation Sourcebook. A Guide to Managing Staff through-out the Move. New York: John Wiley & Sons.
Attwood, D. A., Nicolich, M. J., Doney, K. P., Smolar, T. J., and Swensen, E. E. (2002)“Valve Wheel Rim Force Capabilities of Process Operators.” Journal of Loss Pre-vention in the Process Industries 15, pp. 233–239.
CCPS. (1994) Guidelines for Preventing Human Error in Process Safety. New York:Center for Chemical Process Safety of the American Institute of Chemical Engineers.
CSA. (1989) Office Ergonomics: A National Standard of Canada. CAN/CSA—Z412M89.Toronto, ON, Canada: Canadian Standards Association.
Eastman Kodak. (1983) Ergonomic Design for People at Work. New York: Van NostrandReinhold.
EEMUA. (2002) Process Plant Control Desks Utilising Human Computer Interfaces: AGuide to Design, Operational and Human Interface Issues. Technical Publication201. London: Engineering Equipment and Materials Users Association.
Grandjean, E. (1988) Fitting the Task to the Man. London: Taylor and Francis.
284 Workplace Design
Ch06qxd 11/21/03 09:21 PM Page 284

Grandjean, E. (1995) Ergonomics in Computerized Offices. New York: Taylor and Francis.
HSE (prepared by Bornel Limited). (2001) Decks, Stairways, Gangways and Their Asso-ciated Handrails. Report 2001/69. London: Health and Safety Executive.
Joyce, M., and Wallersteiner, U. (1989) Ergonomics: Humanizing the Automated Office.Cincinnati, OH: South-Western Publishing.
Mital, A., Nicholson, A. S., and Ayoub, M. M. (1993) A Guide to Manual Materials Han-dling. London: Taylor and Francis.
Nimmo, I. (2002) Determining Operator Workload and Console Loading Is More Than aSimple Loop Count. Anthem, AZ: User Centered Design Services, LLC.
NPD. (1977) Regulations Relating to the Systematic Follow-up of the Working Environ-ment in Petroleum Activities. Oslo: Norwegian Petroleum Directorate.
OSHA. (1997) Stairways and Ladders. Regulation 3124. Washington, DC: US Depart-ment of Labor, Occupational Safety and Health Administration.
Pheasant, S. (1994) Bodyspace: Anthropometry, Ergonomics, and the Design of Work.Second Ed. New York: Taylor and Francis.
Sanders, M. S., and McCormick, E. J. (1993) Human Factors in Engineering and Design.Seventh Ed. New York: McGraw-Hill.
Strobhar, D. A. (2002) Controller Workload: What Are They Doing and Why Are TheyDoing So Much of It? Dayton, OH: Beville Engineering.
VanCott, H. P., and Kinkade, R. G. (1972) Human Engineering Guide to EquipmentDesign. Sponsored by the Joint US Army-Navy-Air Force Steering Committee.Washington, DC: American Institutes for Research.
Workplace Design 285
Ch06qxd 11/21/03 09:21 PM Page 285

Ch06qxd 11/21/03 09:21 PM Page 286

7
Job Factors
7.1 Introduction7.2 Shift Work and Work Schedules
7.2.1 Sleep and Sleep Disorders7.2.2 Effects of Shift Work on Performance7.2.3 Effects of Shift Work on Health7.2.4 Effects of Shift Work on the Psychosocial Life7.2.5 Shift Work Schedule Design7.2.6 Coping Strategies with Shift Work7.2.7 Process for Creating or Changing Shift Schedules
7.3 Stress7.3.1 Sources and Causes of Stress7.3.2 Coping Strategies
7.4 Job Analysis7.4.1 Task Analysis7.4.2 Critical-Task Identification and Analysis
7.5 Team-Based Approach7.5.1 Cognitive Problem-Solving Style (KAI)7.5.2 Drexler-Sibbet High-Performance Team Model7.5.3 ACUMEN7.5.4 Systematic Multilevel Observation of Groups (SYMLOG)
7.6 Behavior-Based Safety7.6.1 Lessons Learned7.6.2 Recommended Core and Ancillary Elements of BBS Programs
7.7 Case Study7.7.1 Introduction7.7.2 Task Analysis7.7.3 Biomechanical Analysis
287
Ch07qxd 11/1/03 4:22 PM Page 287

7.1 INTRODUCTION
This chapter discusses work-related issues that can affect the processoperator. Shift work and work scheduling are reviewed in terms of design,their effects on performance, health, psychosocial life, safety, and coping.Fatigue and stress as a product of shift work are also reviewed. In addi-tion, techniques on how to analyze tasks, create a working team approach,and using behavior-based safety to improve efficiency, productivity, andsafety are discussed.
At the end of this chapter is a case study on ergonomic assessment oftasks at a loading rack using the task analysis technique. In addition, a setof review questions are included to help you check your understanding ofthe material covered in this chapter.
7.2 SHIFT WORK AND WORK SCHEDULES
For decades now, shift work has been instituted in hospitals, police andfire departments, in the military, and in petrochemical and other processindustries, on a 24-hour basis (Presser and Cain, 1983). In addition,looking at the recent workplace environment, the expectation of moreaccess to service around the clock, and the stiff competition among theservice sectors, we find that, for example, supermarkets and drug storesoperate seven days a week, 24 hours per day. This further increases thepercentage of the working population involved in shift work.
To date, no longitudinal studies have been reported that explore theeffects of a given work schedule on the business goals of increased pro-ductivity and workers’ health, safety and quality of life. In fact, the workschedules practiced today have an unknown origin and no references maybe cited from the literature. However, given past experiences and the widerecommendations found in the literature, we can design work schedulesto better meet these goals.
The goal of this section is to provide general information on shift workand work schedules and on the effects of the work schedules on sleep,fatigue, performance, and the health of the human operator. It providesguidance on coping strategies that can be implemented by the shift worker,the family, and the organization. This section is not a book on sleep
288 Job Factors
Ch07qxd 11/1/03 4:22 PM Page 288

patterns and sleep disorders or shift schedules. This section provides asummarized overview of these topics. People interested in more detail canconsult Tepas and Monk (1987); Monk and Folkard (1992); and Tepas,Paley, and Popkin (1997).
7.2.1 Sleep and Sleep Disorders
Normally, adults sleep between 7 and 8 hours per night. However, somemay sleep less or more, creating large individual differences that may berelated to age and health, stress and working hours, or social activities anddrug or alcohol use.
The 7–8 hours per night sleep is regulated by the two daily cycles thehuman organism experiences. These are “the ready to perform cycle”(ergotropic phase) during the daylight or daytime and the “relaxed phasefor recovery and replenishment of energy” (trophotropic phase) during thenight (Grandjean, 1988). Given these two phases, working at night carrieswith it physiological and medical problems, not to mention family andsocial issues, since the person is trying to perform during the relaxedphase. Therefore, work schedules and shift work should be designed toproduce the fewest negative effects on the health, family, and social lifeof the individual. This topic is elaborated on later in this chapter.
The human body experiences a biological rhythm, identified by a peri-odic change in body physical measurements, such as body temperature,heart rate, blood pressure, and chemical response (like the production ofcatecholamines such as epinephrine, norepinephrine, and dopamine, andadrenalin that function as hormones, neurotransmitters, or both). This biological rhythm fluctuates in a 24-hour cycle, referred to as circadianrhythm. Circadian is from the Latin word of circa (“about”) and dies(“day”). More specifically, this can be referred to as endogenous (internalclock) circadian rhythm and operates on a cycle of between 22 and 25hours and varies among individuals.
7.2.1.1 Normal Sleep
Obtaining the proper amount of sleep (i.e., total hours and quality) hasbeen associated with health, well being, and efficient performance. In
Job Factors 289
Ch07qxd 11/1/03 4:22 PM Page 289

determining if an individual is sleeping, two methods are employed. Thefirst measures brain electrical activity using an EEG (electroencephalo-gram). The second measures eye movements or muscle activity using anEOG (electrooculogram). We can identify two main categories, describ-ing the quality and depth of sleep, REM (rapid eye movement) and NREM(nonrapid eye movement). Table 7-1 provides a description of the two categories and their cyclical stages.
The quantity (length) of sleep and its quality are not uniform. In terms of quality, NREM and REM sleep alternate cyclically. For example,slow-wave sleep, or light sleep, dominates during the first one third of the night. However, REM, or maximum relaxation of the muscles andresistance to being awakened, dominates during the last one third of thenight.
7.2.1.2 Sleep Behavior and Disorders
The age of the worker plays a role in sleeping patterns and disorders.As people get older, they have less sound sleep and are easier to arousethan younger people. This is experienced as more and longer nighttimeawakenings, more shifts from one sleep stage to another, and more bodymovement during sleep. This fluctuation leads to a decrease in the restora-tive power of sleep (normal sleep) and an increase in daytime drowsinessand “sleepy” feelings. The buildup of sleep deprivation (younger or olderpeople) can lead to irritability, fatigue, inability to concentrate, and otherpsychological problems. When people are able or allowed to sleep afterprolonged sleep deprivation, they experience increased sleep duration aswell as an increase in the percentage of recuperative (NREM, Stages 3and 4) sleep.
Sleep disorders are divided mainly into three categories: inability to getto sleep or stay asleep, disrupted timing of sleep and waking as occurswith jet lag or shift work, and feeling too sleepy during daytime.
Shift work can aggravate sleep disorders by leading to a difficulty ininitiating and maintaining sleep (insomnia), cessation of breathing duringsleep (sleep apnea syndrome), irresistible sleepiness occurring unpre-dictably throughout the day (narcolepsy), and gastrointestinal refluxissues. In addition, the consumption of caffeine and alcohol can generallylead to a decrease in length and quality of sleep, where sleep becomes
290 Job Factors
Ch07qxd 11/1/03 4:22 PM Page 290
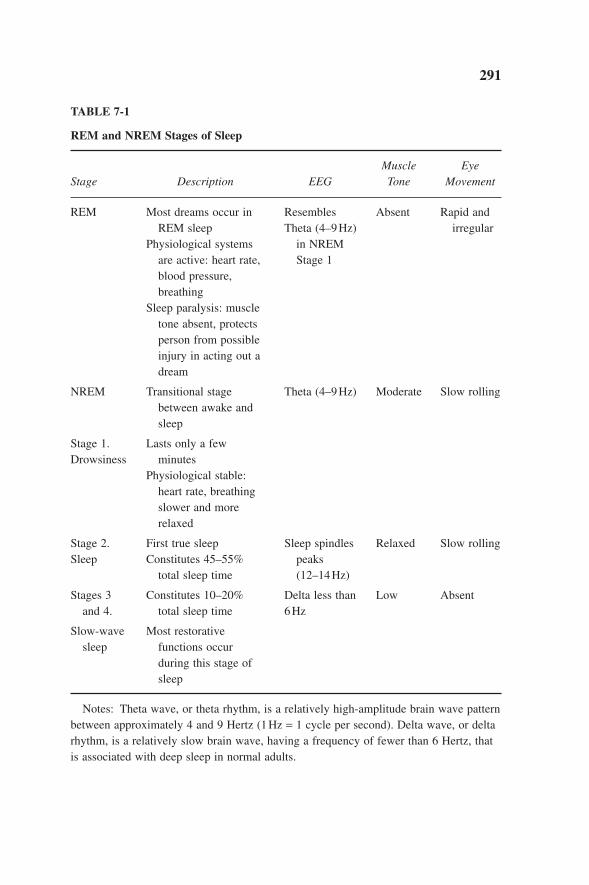
291
TABLE 7-1
REM and NREM Stages of Sleep
Muscle Eye Stage Description EEG Tone Movement
REM Most dreams occur in Resembles Absent Rapid andREM sleep Theta (4–9Hz) irregular
Physiological systems in NREMare active: heart rate, Stage 1blood pressure, breathing
Sleep paralysis: muscle tone absent, protects person from possible injury in acting out a dream
NREM Transitional stage Theta (4–9Hz) Moderate Slow rollingbetween awake and sleep
Stage 1. Lasts only a few Drowsiness minutes
Physiological stable: heart rate, breathing slower and morerelaxed
Stage 2. First true sleep Sleep spindles Relaxed Slow rollingSleep Constitutes 45–55% peaks
total sleep time (12–14Hz)
Stages 3 Constitutes 10–20% Delta less than Low Absentand 4. total sleep time 6Hz
Slow-wave Most restorative sleep functions occur
during this stage of sleep
Notes: Theta wave, or theta rhythm, is a relatively high-amplitude brain wave patternbetween approximately 4 and 9 Hertz (1Hz = 1 cycle per second). Delta wave, or deltarhythm, is a relatively slow brain wave, having a frequency of fewer than 6 Hertz, thatis associated with deep sleep in normal adults.
Ch07qxd 11/1/03 4:22 PM Page 291

lighter and more fragmented. Common sleep disorders that can be aggra-vated by shift work are:
• Insomnia, difficulty in initiating and/or maintaining sleep:Most common adult sleep complaint.Can be caused by disease or chronic pain.Most common cause is psychological, because of extreme stress,
depression, or anxiety.
• Sleep apnea syndrome, cessation of breathing during sleep:More common in working-age men.About 1% of men over 30 may suffer from sleep apnea.Commonly associated with obesity.Associated with airway disorders, causing snoring.Potentially fatal.Treatment is positive airway pressure devices worn during sleep.
• Gastrointestinal reflux, acidic stomach juices coming back up into theesophagus when a person lies down to sleep at night:Causes burning sensation and sour taste.Awakens sleepier.Common in rotating shift workers, who often have irregular sleeping
patterns and digestive problems.
• Narcolepsy, irresistible sleepiness occurring unpredictably through-out the day:Believed to be a disorder affecting the brain’s mechanism for con-
trolling sleep.People with narcolepsy fall asleep suddenly in any situation.
7.2.1.3 Fatigue
From the preceding discussion of work schedules, it becomes clear thatfatigue is a component that cannot be ignored. Fatigue is generally definedas physical or mental weariness resulting from exertion. Regardless of itsdefinition, in the context of this chapter, fatigue plays a key role in affect-ing productivity, error rates, and accident rates. For example, alertness andperformance change as a function of time of day or night that relate to thebody’s circadian rhythms. This variation undoubtedly includes a fatigue
292 Job Factors
Ch07qxd 11/1/03 4:22 PM Page 292
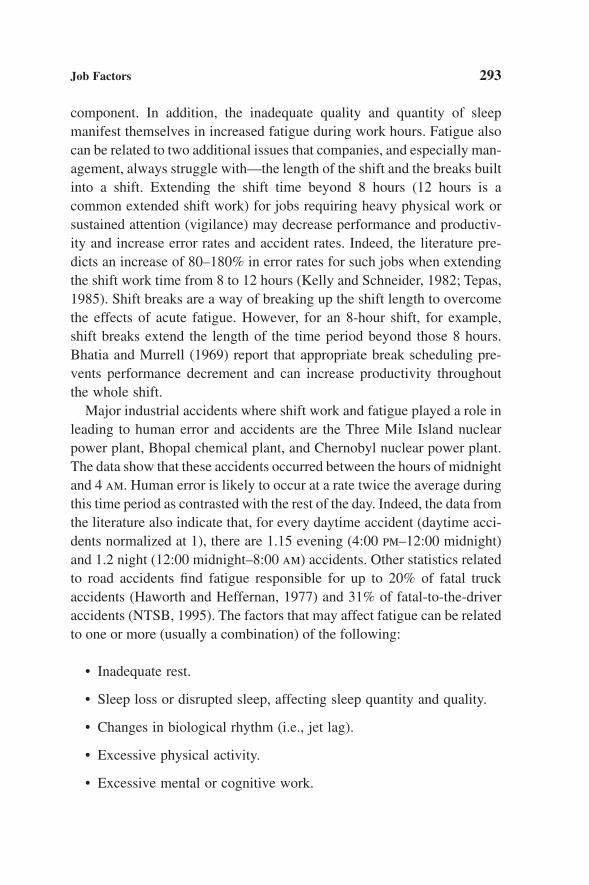
component. In addition, the inadequate quality and quantity of sleep manifest themselves in increased fatigue during work hours. Fatigue alsocan be related to two additional issues that companies, and especially man-agement, always struggle with—the length of the shift and the breaks builtinto a shift. Extending the shift time beyond 8 hours (12 hours is acommon extended shift work) for jobs requiring heavy physical work orsustained attention (vigilance) may decrease performance and productiv-ity and increase error rates and accident rates. Indeed, the literature pre-dicts an increase of 80–180% in error rates for such jobs when extendingthe shift work time from 8 to 12 hours (Kelly and Schneider, 1982; Tepas,1985). Shift breaks are a way of breaking up the shift length to overcomethe effects of acute fatigue. However, for an 8-hour shift, for example,shift breaks extend the length of the time period beyond those 8 hours.Bhatia and Murrell (1969) report that appropriate break scheduling pre-vents performance decrement and can increase productivity throughoutthe whole shift.
Major industrial accidents where shift work and fatigue played a role inleading to human error and accidents are the Three Mile Island nuclearpower plant, Bhopal chemical plant, and Chernobyl nuclear power plant.The data show that these accidents occurred between the hours of midnightand 4 am. Human error is likely to occur at a rate twice the average duringthis time period as contrasted with the rest of the day. Indeed, the data fromthe literature also indicate that, for every daytime accident (daytime acci-dents normalized at 1), there are 1.15 evening (4:00 pm–12:00 midnight)and 1.2 night (12:00 midnight–8:00 am) accidents. Other statistics relatedto road accidents find fatigue responsible for up to 20% of fatal truck accidents (Haworth and Heffernan, 1977) and 31% of fatal-to-the-driveraccidents (NTSB, 1995). The factors that may affect fatigue can be relatedto one or more (usually a combination) of the following:
• Inadequate rest.
• Sleep loss or disrupted sleep, affecting sleep quantity and quality.
• Changes in biological rhythm (i.e., jet lag).
• Excessive physical activity.
• Excessive mental or cognitive work.
Job Factors 293
Ch07qxd 11/1/03 4:22 PM Page 293

• Individual physical fitness.
• Environmental conditions, such as temperature, humidity, noise, andlight.
• Time of day, such as at 2:00 pm we feel more tired and sleepy thanthe morning hours.
• Stress.
• Substance abuse.
The fatigue state caused by these factors can be classified into acute orchronic. Acute fatigue is short term, where a short break or a good night’ssleep usually can provide relief; for example, after driving for severalhours or attending to an emergency maintenance task that needs to beaccomplished quickly. Chronic fatigue is relatively longer term, resultingfrom repeated and cumulative effect of these factors. This state requiresan extended break, relatively longer than the acute fatigue state. Table 7-2 presents the characteristics of mental and physical fatigue.
294 Job Factors
TABLE 7-2
Characteristics of Mental and Physical Fatigue
Mental Fatigue Physical Fatigue
Feeling tired after extended or repeated Temporary loss of muscle strength performance of nonphysical tasks to respond to demands
Feeling of monotony or boredom created Feeling of muscular tiredness, by lack of novel stimulation soreness, or other discomfort
Slower reaction time affecting decision Decrease in physical performancemaking and response
Significant decrease in attention, vigilance,and alertness leading to impaired judgment
Subjective feeling of loss of motivation,tiredness, and the desire for rest and sleep
Ch07qxd 11/1/03 4:22 PM Page 294
7.2.2 Effects of Shift Work on Performance
Rotating shifts are a fact of life for many workers within the petro-chemical and other process and manufacturing industries. Most refineries,chemical plants, off-shore platforms, and upstream (development) opera-tions run 24 hours a day. As we have seen earlier in this chapter, the combination of both sleep loss (quality and quantity) and low-arousal cir-cadian rhythm phase (time of day or night) leads the individual into asleepy state and thus affects all aspects of performance. When we are ina sleepy state, we experience an increase in the number of eye blinks andclosures and short duration nodding off. Performing tasks that depend onvisual input are particularly affected. In addition, performing tasks re-quiring vigilance (see Chapter 8) and other monotonous tasks are alsoaffected, since the individual is unable to sustain alertness and attention(Hildebrandt, Rohmert, and Rutenfranz, 1974; Rutenfranz and Knauth,1976; Horne, Anderson, and Wilkinson, 1983). Other situations affectedby the sleepy state involve tasks requiring (1) decision making and judg-ment; (2) information processing and memory, such as learning or storingnew information; and (3) self-initiated cognitive activity, like maintainingsituation awareness and planning.
It is important to note here that we cannot assume that all tasks showthe same performance decrement as alertness. For example, for a partic-ular work schedule and same time of day (i.e., early morning hours), per-formance is best for one type of task and poorest for another task (Folkardand Monk, 1979). Tasks with high arousal states involving interesting andexciting materials and tasks requiring physical activities are not affectedby the sleepy state. Performance is generally measured in terms of threevariables:
1. Productivity. General findings in the literature conclude that there isno reduction in productivity as a function of shift work (day versusnight).
2. Number of errors. The highest number of error rates is detected inthe 1:00–4:00 am time period. In addition, the literature reports anincreased peak in error rates occurring at about 3:00 am and a lowerpeak at about 3:00 pm.
Job Factors 295
Ch07qxd 11/1/03 4:22 PM Page 295

3. Number of accidents. The literature reports that driving accidentsshow two distinct peaks. The first peak occurs in young drivers18–20 years old between midnight and 6:00 am. The second peakoccurs in drivers 56 years old and older during the late afternoonhours (Summala and Mikkola, 1994).
7.2.3 Effects of Shift Work on Health
The actual cause of sickness among night workers is related to two mainreasons: the circadian rhythm is “out of synchrony” (desynchronizationof the internal body timekeeping mechanism that tells us when to sleep,eat, and be active) and the disturbance (eating habits, social, and level ofactivities) experienced in the change from day to night work.
Most research and surveys show a clear, direct association betweennight-shift workers and health. For example, studies made between 1948and 1959 in Norway (Aanonsen, 1964; Thiis-Evenson, 1958) show thatthe sickness rate among night-shift workers was three times higher thanthat of day workers. The ailments are due mainly to unhealthy eatinghabits and chronic fatigue and its associated symptoms of psychosomaticdisorders (Table 7-3). However, it is important to add that other studies(Barnes, 1936) also found a tendency on the part of night-shift workersto misuse drugs, such as taking stimulants during the night and sleeping
296 Job Factors
TABLE 7-3
Symptoms and Psychosomatic Disorders Associated with Chronic Fatigue.
Symptoms Psychosomatic Disorders
Mental and physical weariness Poor quality and quantity of sleep
Mental irritability and confusion Digestive problems
Loss of motivation Loss of appetite
Episodes of mood changes and depression Stomach and intestinal problems
Ulcers
Nervous disorders
Source: Grandjean (1988).
Ch07qxd 11/1/03 4:22 PM Page 296

pills during the day. This adds to the severity of the sickness rate (Grandjean, 1988).
Most companies have no medical programs for night-shift workers. Inaddition, with the trend toward cost cutting, since the middle 1990s, manycompanies either eliminated or did not initiate a regular physical exami-nation program for their employees. Yet, and ironically, almost all com-panies require applicants to undergo a physical exam to determine if theirhealth and fitness meet a required standard to gain initial employment. Itis recommended that
• A specific medical examination be in place to select and place indi-viduals for rotating shift work.
• A program be in place to ensure regular medical examination forrotating shift workers.
• Physicians be well trained and up-to-date on recent medical literaturerelated to rotating shift work. Physicians should concentrate particu-larly on issues such as sleep disorders, chronic fatigue, and thoselisted in Table 7-3.
• Educate and counsel workers and supervisors on how to cope withrotating shifts.
• Use synchronizers, such as light exposure (for example, bright lights).
7.2.4 Effects of Shift Work on the Psychosocial Life
Studies over the years have shown that the main issues and disruptionsarising from shift work are related to the psychosocial (psychological andsocial) factors. These psychosocial factors can, in turn, affect work per-formance and satisfaction. The issues and disruptions are generally relatedto three factors: the shift schedule worked, individual differences, and theworker’s personal and social life.
7.2.4.1 Shift Schedule Worked
The type of shift schedule worked can affect what the individuals cando when they are off the job. For example, workers in the first shift have
Job Factors 297
Ch07qxd 11/1/03 4:22 PM Page 297

between the middle to late afternoon and the middle or late evening hoursto attend to their own needs. The workers in the second shift have themorning to midafternoon hours. Third-shift workers usually have from themiddle afternoon until late evening hours. In reality the off-time activi-ties are mainly spent not on leisure or free time but everyday needs, suchas commuting to and from work, buying and preparing meals, doinghousework, children’s activities, and sleeping. This can directly affect thepersonal, recreational, and social events, such as family, friends, andleisure time.
7.2.4.2 Individual Differences
Individual differences have significant impact on many dimensions ofthe shift worker’s life. For example, individuals who cannot tolerate nightshift either request a change to the day shift or quit the job when they finda more-acceptable work schedule. The following is a list of some of theindividual differences:
• Age. Older people, over 40 years old (Barnes, 1949; Grandjean,1988), are less tolerant of changes in schedule, take longer to adaptto shift changes, tire more easily, are more prone to disturbed sleep,have less resistance to circadian disruption, and complain of their ill-health.
• Individual susceptibility. The symptom levels, ill health, or ailmentsaffect different people differently. Even with age, there are peoplewho are fairly flexible and resistant to changes in work/rest scheduleand “shift lag” or “jet lag,” while others show the effects dramati-cally and require more time to recover.
• Gender. In general, female shift workers, compared with maleworkers, have pressures to provide same level of home care as a dayworker, require more sleep per night, and require limited workinghours during pregnancy.
• Morning versus evening types. Some research suggests there are somedifferences between morning type and evening type individuals. In
298 Job Factors
Ch07qxd 11/1/03 4:22 PM Page 298

general, morning types do not adapt to shift work as well a eveningtypes, transfer out of shift work more often, and have difficulty inadjusting their circadian rhythms to night schedules.
• Others. Other factors that may contribute to individual differences inadjusting to shift work and shift changes are heavy domestic work-load, history of addiction to alcohol or drugs, history of sleep disor-ders, psychiatric illness, epilepsy, diabetes, and heart disease.
7.2.4.3 Personal and Social Life
A number of studies clearly demonstrated the influence of shift workon a person’s social and leisure time, including family and friends as wellas participating in recreational, educational, and community activities. For example, the second- and third-shift workers are less satisfied withthe amount of time they are able to spend with family and friends andoften pursue solitary hobbies.
The social effect of shift work is seen as a major source of dissatisfac-tion, especially when weekend work is scheduled. In general, weekendsare identified as time for religious and family activities, recreation as wellas work around the house. For single parents, shift work schedules carrieswith it difficulties in terms of raising a family. Special arrangements forthe children have to be made when the parent is at work (Wedderhum,1981). Since most human society is day oriented and most recreationaland social events are scheduled for the day worker, shift workers find itvery difficult, if not impossible, to participate. In addition, when workersare part of a rotating shift schedule, they find it difficult to develop andmaintain social interaction with friends who happen to be on differentshifts because of the rotation process. Therefore, such workers may ex-perience social isolation (Sergean, 1971).
7.2.5 Shift Work Schedule Design
The type of work schedule is identified by two major characteristics:length of shift and rotation pattern.
Job Factors 299
Ch07qxd 11/1/03 4:22 PM Page 299

7.2.5.1 Length of Shift
Rotating shifts are typically 8 or 12 hours long. Each has its advantagesand disadvantages. One is not generally considered better than the other.In fact, some operations schedule both 8- and 12-hour shifts. The advan-tages and disadvantages of 12-hour shifts compared to 8-hour shifts arelisted in Table 7-4. Because 12-hour shifts already occupy one-half of the day, shift workers should be discouraged from working overtime ordouble shifts. Extra hours should be worked by those working 8 hours,day workers, or off-duty workers.
7.2.5.2 Rotation Pattern
Rotation pattern refers to the cycle of consecutive shifts worked anddays off work. The major variables in each cycle are the direction of rota-tion, speed of rotation, and number of consecutive days off. Each of these
300 Job Factors
TABLE 7-4
Advantages and Disadvantages of 12-Hour versus 8-Hour Shifts
Disadvantages Advantages
Allows opportunity for moonlighting, Increased worker satisfaction, since itwhich may reduce the quantity of allows more days and weekends off
sleep
Women may find it difficult to arrange Fewer consecutive days spent on nighthome schedules around 12-hour shifts shifts
Replacement of absent workers may be 12-hour shifts lessen the number of shiftdifficult, or if workers are held over for changes (least productive time of ana second 12-hour shift, dangerous. operation)
Administration could be more difficult, as Absenteeism may be reducedhours of work and exposure to noise and chemicals are based on a 8-hour workday
Shift may be too long to perform Data on accidents and productivity ratesphysically demanding tasks, especially for 8- and 12-hour shifts are for older workers equivocal
Ch07qxd 11/1/03 4:22 PM Page 300

variables has an impact on the quality of life of the shift worker. Forexample, many family and social activities occur on weekends, so shiftschedules that give no weekends off are not recommended.
Direction of Rotation
For 8-hour shifts, the direction of rotation should be in a forward; thatis, days followed by evenings followed by nights.
For 12-hour shifts with a fast return, the days-to-nights and the nights-to-days rotations allow sufficient time (a 24-hour break) betweenrotations. For the days-to-nights rotation, the worker should obtain a“normal” night’s sleep before the shift, then a short nap before the shift.For nights to days, the worker should take a short nap after completingthe night shift, then obtain a normal night’s sleep before going on the day shift.
Speed of Rotation
Speed of rotation, defined by the number of consecutive shifts before a day off, can be classified into three categories: fast rotations havefour or fewer consecutive shifts, medium rotations have five to seven consecutive shifts, and slow rotations have seven or more consecutiveshifts. The advantages and disadvantages of each category are shown inTable 7-5.
Number of Consecutive Days Off
For more complex jobs, or those requiring up-to-date situation knowledge, long periods of consecutive days off can make it more dif-ficult to bring the worker up to speed on the status of the operation andcontribute to the deterioration of job skills and knowledge. In supervisorycontrol tasks, for example, a rule of thumb is to limit the operator to 4 consecutive days off. Otherwise, the operator requires an extensivebriefing on return to work. On a related issue, the work schedule shouldbe designed to provide each worker with at least one weekend off in four.
Job Factors 301
Ch07qxd 11/1/03 4:22 PM Page 301
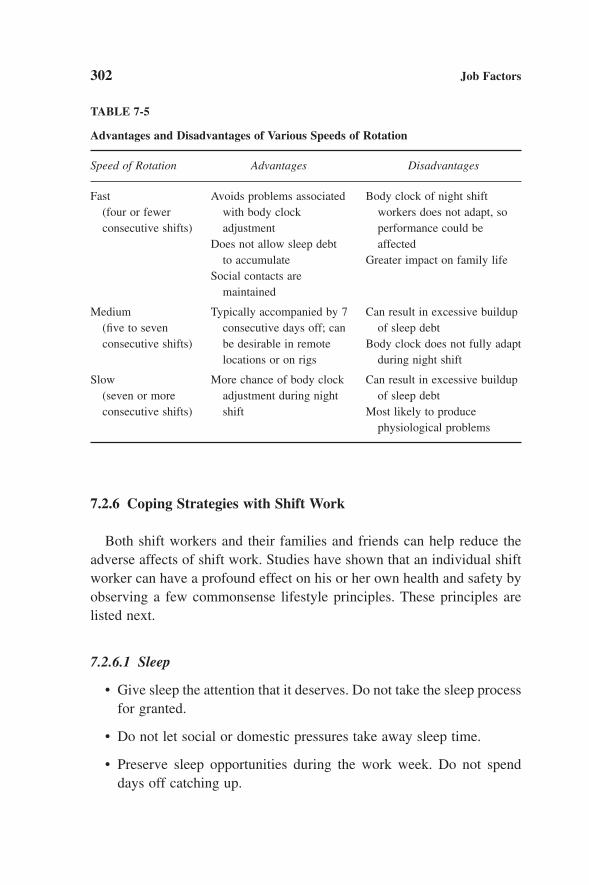
7.2.6 Coping Strategies with Shift Work
Both shift workers and their families and friends can help reduce theadverse affects of shift work. Studies have shown that an individual shiftworker can have a profound effect on his or her own health and safety byobserving a few commonsense lifestyle principles. These principles arelisted next.
7.2.6.1 Sleep
• Give sleep the attention that it deserves. Do not take the sleep processfor granted.
• Do not let social or domestic pressures take away sleep time.
• Preserve sleep opportunities during the work week. Do not spenddays off catching up.
302 Job Factors
TABLE 7-5
Advantages and Disadvantages of Various Speeds of Rotation
Speed of Rotation Advantages Disadvantages
Fast Avoids problems associated Body clock of night shift (four or fewer with body clock workers does not adapt, so consecutive shifts) adjustment performance could be
Does not allow sleep debt affectedto accumulate Greater impact on family life
Social contacts are maintained
Medium Typically accompanied by 7 Can result in excessive buildup (five to seven consecutive days off; can of sleep debtconsecutive shifts) be desirable in remote Body clock does not fully adapt
locations or on rigs during night shift
Slow More chance of body clock Can result in excessive buildup (seven or more adjustment during night of sleep debtconsecutive shifts) shift Most likely to produce
physiological problems
Ch07qxd 11/1/03 4:22 PM Page 302

• Regulate sleeping times ensuring that you sleep at the same timeduring each shift.
• Do not try to sleep on the couch in front of the TV.
• Advise family and friends of your schedule so they respect your needfor privacy.
• Develop techniques for relaxing before bedtime or work. These mightinclude reading, listening to music, or light exercise.
• Develop a regular routine of bathroom/shower use and darken theroom when sleeping during the day. This acts as a stimulus for sleepand reinforces the importance of sleep to the family.
• Prepare the house: Advise the family to be quiet and, if possible, turnoff the TV.
7.2.6.2 Diet
• Maintain regular, predictable eating patterns as much as possible.
• Pay attention to foods eaten at night. Heavy, fatty foods should beavoided.
• Drink plenty of fluids on the night shift.
• Avoid the use of stimulant drugs and medicines without medicaladvice. Do not use caffeine for 5 hours prior to your expectedbedtime.
• Alcohol is not a sleep aid. In fact, it may cause you to awaken withinseveral hours.
• Some workers find that a light snack or milk before bedtime promotessleep.
7.2.6.3 Keeping the Body Clock in Synch
As mentioned previously, each of the three categories of shift rotationspeed (fast, medium, and slow) has a different effect on the internal bodyclock that regulates body functions during a 24-hour cycle. For each class
Job Factors 303
Ch07qxd 11/1/03 4:22 PM Page 303

of rotation speed, the following strategies can help the shift worker toreduce the effects on health and well-being.
Fast Rotations
Try to maintain a daytime routine:
• Avoid heavy night meals.
• Spend some time in the daylight each day.
• Try to grab a quick nap during the “lunch” break on nights.
Medium to Slow Rotations
Try to reset the body clock from a daytime to a nighttime schedule:
• Have a light meal before sleep.
• Go to bed as soon as possible after the night shift ends. The sooner to bed, the less adjustment the body clock needs to make.
• Try to avoid daylight in the drive home after the shift (wear darkglasses) and in the house (wear eye shades to bed).
7.2.6.4 Personal and Mental Hygiene
• Take leisure seriously.
• Minimize the opportunity for stress.
• Physical fitness is important. Try to obtain a half-hour of physicalexercise (i.e., take a walk, garden) a day.
• Keep frustration out of the bedroom. Pay bills, watch TV, and discussfamily problems outside of the bedroom.
7.2.6.5 Strategies for Night Work
Plan your work schedule:
304 Job Factors
Ch07qxd 11/1/03 4:22 PM Page 304
• Schedule activities to keep active and alert.
• Take frequent short rest breaks to walk and get fresh air.
• Socialize with colleagues to the extent possible.
Diet:
• If caffeine works to increase alertness, drink coffee. But restrict caf-feine intake after about 3 am so it will not affect the morning sleep.
• Have lunch halfway through the night shift.
7.2.6.6 Organizational Strategies
In addition to promoting awareness and optimizing work schedules, the organization can contribute to a worker’s shift tolerance by the way itdesigns its work systems and work environment. The following points areprovided as examples of what other organizations have implemented.
Education
It is essential that shift workers and their families and friends be edu-cated on how to support the shift worker. Families and friends can be madeaware of shift work issues and coping strategies that shift workers developwith the use of videos and pamphlets.
Facilities Design
• Maintain proper air quality. Maintain temperature, relative humidity,air quality, and air movement within recommended limits.
• Preserve the best noise levels. Provide a varying-sound environmentto stimulate alertness. Avoid high-noise environments over prolongedperiods of time, they can induce fatigue.
• Design night jobs to maintain alertness, such as frequent changes injob tasks.
• Provide rest facilities for “on-call” or extended hours.
Job Factors 305
Ch07qxd 11/1/03 4:22 PM Page 305

• Provide exercise facilities for night-shift workers. They can maintainbody tone and stamina and promote alertness.
• Ensure that the food and beverage service at night is equivalent tothat provided during the day.
• Design and lay out facilities to increase alertness and facilitate socialinterchange.
• Provide night shift workers with bright lights (Table 7-6). Brightlights have been shown to aid in significant adjustment to night workand the “no-days-off” effect (i.e., rapid reversion to daily rhythm),improve sleep quality and quantity, aid rapid adjustment of the inter-nal clock, and enhance performance (reduced latency in respondingto alarms and improved problem solving).
• In control rooms, computer rooms, and offices, lighting can inducefatigue if not properly designed. Provide for adjustment of illumina-tion, reduce glare, and provide task lighting.
• Do not require night worker to perform tasks requiring, for example,complex mental calculations, and vigilance.
Career Opportunities
Studies show that shift workers do not have the same opportunity forcareer advancement as nonshift workers because management does not
306 Job Factors
TABLE 7-6
The Advantages and Disadvantages of Bright Lights
Advantages Disadvantages
Works to suppress melatonin, the Can be a glare source in a VDT environmenthormone that promotes sleep Does not consistently improve performance
Acts to stimulate the worker to on the night shiftstay alert on the night shift Does not prevent dozing on night shift
Employee acceptance is problematic
Ch07qxd 11/1/03 4:22 PM Page 306

see them as often and they are not available for projects that can enhancetheir careers. Consequently, effort should be made to provide shift workerswith equal opportunities by providing them the same training opportuni-ties as nonshift workers, increasing the number of day rotations, and limiting the maximum age for working shifts.
Planned Maintenance Napping
Planned maintenance napping occurs on-the-job during the work shift.Naps of 30–60 minutes can compensate for daytime sleep loss or serve asa bridge over the low point in daily alertness (e.g., 1–3 am). Maintenancenaps have been tested in Japan: 35% of manufacturing and 64% of serviceindustries use nap facilities (Matsumoto et al., 1982). Current evidencesuggests that napping during the first one or two night shifts could easethe transition from days to nights. More important, it can increase the level of alertness of the worker and decrease unplanned microsleeps(dozing).
7.2.7 Process for Creating or Changing Shift Schedules
The process employed for creating or changing shift schedules is crit-ical to the acceptance of the workforce. The following is a list of recom-mended changes (Tepas, 1985, 1993):
• Educate management and workers and their families.
• Clarify why a change is required in their shift schedule.
• Consult and plan with all parties involved:Enlist experts to help site workers develop the requirements for the
work schedule.Develop preliminary schedules tailored to the needs of the site (dif-
ferent parts of the organization may need different schedules).Put proposals to the workforce and outline the agreed-on criteria.Allow as much time for discussion as is needed.Have the workforce vote on the final shift schedule.
• Coordinate reorganization of work practices and rosters.
Job Factors 307
Ch07qxd 11/1/03 4:22 PM Page 307
• Plan evaluation techniques before the schedule is implemented.
• The trial period should be at least 6 months.
• Evaluate the work schedule and adjust it.
7.3 STRESS
The general definition of stress is the reaction of an organism (humanor animal) to a threatening situation. More specifically, stress is a bio-logical reaction to any adverse stimulus (physical, chemical, mental, emotional, internal, or external) that disturbs the organism’s homeostasis(stable or balanced state). Since stress is a necessary condition in our life,it can be classified into two main types:
• Positive stress is the desire to continue doing things in life and solvedaily and difficult problems. Generally speaking, positive stress isgood for us, and life without it can be unnatural and perhaps boring.
• Negative stress is basically the stress that we wish to live without. Itputs us in an environment or state of anger, frustration, depression,confusion, and tiredness. Continued, long-term negative stress canlead to emotional problems and physical illnesses, such as cardio-vascular disease and musculoskeletal disorders.
This section discusses, very briefly, the factors that can cause and leadto stress and how to cope with it.
7.3.1 Sources and Causes of Stress
It is almost impossible to point to only one factor as the cause of stress.Given the complexity of modern life and the dynamic changes in the workenvironment, there is no wonder why. Three main categories classify thesources of stress. Based on the literature (Karasek, 1979; Lindstrom, 1991;Buunk and Janssen, 1992; Smith and Carayon, 1995; Yang and Carayon,1995), Table 7-7 provides summary examples of the sources of stress.
Stress can be measured qualitatively (through questionnaires, inter-views, observation) or quantitatively (by measuring heart rate, heart rate
308 Job Factors
Ch07qxd 11/1/03 4:22 PM Page 308
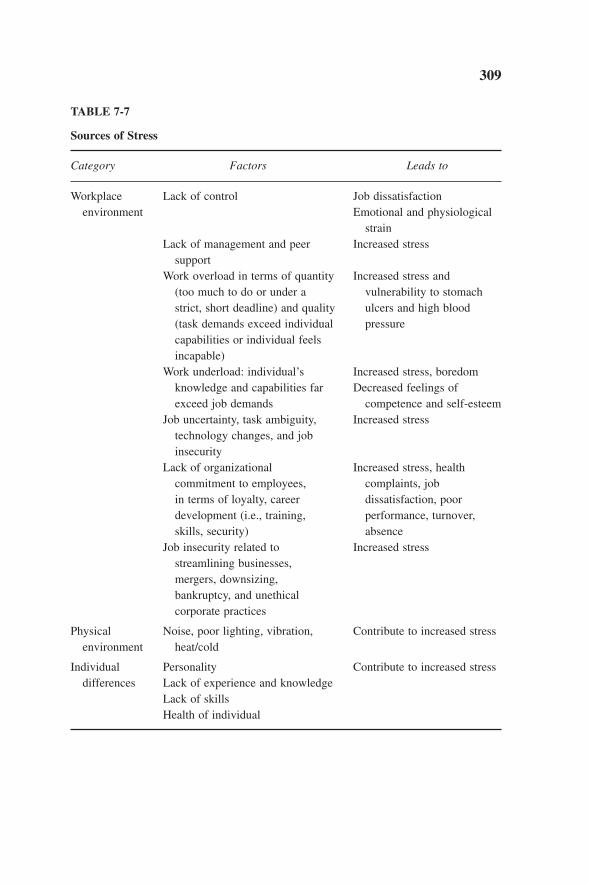
309
TABLE 7-7
Sources of Stress
Category Factors Leads to
Workplace Lack of control Job dissatisfactionenvironment Emotional and physiological
strainLack of management and peer Increased stress
supportWork overload in terms of quantity Increased stress and
(too much to do or under a vulnerability to stomachstrict, short deadline) and quality ulcers and high blood (task demands exceed individual pressurecapabilities or individual feels incapable)
Work underload: individual’s Increased stress, boredomknowledge and capabilities far Decreased feelings ofexceed job demands competence and self-esteem
Job uncertainty, task ambiguity, Increased stresstechnology changes, and job insecurity
Lack of organizational Increased stress, healthcommitment to employees, complaints, jobin terms of loyalty, career dissatisfaction, poordevelopment (i.e., training, performance, turnover,skills, security) absence
Job insecurity related to Increased stressstreamlining businesses, mergers, downsizing, bankruptcy, and unethical corporate practices
Physical Noise, poor lighting, vibration, Contribute to increased stressenvironment heat/cold
Individual Personality Contribute to increased stressdifferences Lack of experience and knowledge
Lack of skillsHealth of individual
Ch07qxd 11/1/03 4:22 PM Page 309

variability, blood pressure, respiratory rate, or levels of adrenaline, nor-adrenaline, cortisol, glucose, uric acid, or steroids in samples of urine,blood, sweat, or saliva. It is recommended that a combination of the meas-ures be used.
7.3.2 Coping Strategies
There are different approaches to cope with and manage stress. Theseapproaches can be grouped into two categories by focusing on the workplace environment or personal lifestyle. Table 7-8 summarizes the focuson each of these areas (Benson, 1985; Ivancevich and Matteson, 1988;Russell, 1991; Aryee and Tan, 1992).
7.4 JOB ANALYSIS
This section briefly discusses some of the tools that can be used toanalyze jobs. The most common, critical, and useful tool for the humanfactors specialists is the task analysis. Task analysis and critical task analy-sis are reviewed here. For workload analysis, Chapter 8 discusses mentalworkload and physical workload is reviewed in Chapter 3.
7.4.1 Task Analysis
Task analysis is a basic tool of human factors specialists in the inves-tigation and design of tasks. It provides the structure for a comparisonbetween the demands the task places on the operator and the capabilitiesthe human operator possesses. Task analysis produces detailed informa-tion relevant to the interface of humans and machines or systems. It alsocan be applied to the development of a new system or the redesign ofexisting systems. Note that task analysis does not solve problems butpoints analysts in the direction of potential solutions. This section brieflycovers the area of task analysis. For more in-depth information, consultother sources (Drury, 1983; Drury et al., 1987; Kirwan and Ainsworth,1992).
310 Job Factors
Ch07qxd 11/1/03 4:22 PM Page 310

311
TABLE 7-8
Stress Coping Strategies
Category Approach or Focus on
Workplace Work overload, underload, and time pressureenvironment Lack of control over day-to-day work
Lack of training and preparationUncertainty and ambiguity of tasks and responsibilityIndividual career and skill development through
Self-assessment toolsIndividual counselingRegular assessment and developmental programs
Stress training to modify perceptions or behavior
Personal lifestyle Physical changes:Regular exerciseYoga and other stretching exercisesBreathing exercisesVisualization, meditation, imageryStop smokingReduce alcohol consumptionImprove sleeping habits
Emotional or mental stress:Take breaks and vacationsTalk and share personal issues with friends and
significant othersIdentify what you can and cannot controlKeep real expectations of yourself, others, and
eventsSet prioritiesEnjoy music and laughter
Nutrition:Eliminate high-fat dietsEat healthier fats (i.e., olive oils, fish)Drink plenty of water, about eight 8-oz glasses/dayEat plenty of fruits and vegetables
Ch07qxd 11/1/03 4:22 PM Page 311
7.4.1.1 Purpose of Task Analysis
Task analysis techniques provide detailed information related to the pre-diction and prevention of errors and accidents. Indeed, the use of explicittask analysis approaches should therefore lead to more efficient and effec-tive integration of the human element into system design and operations.Table 7-9 outlines the principle areas where task analysis techniques andapproaches are beneficial.
7.4.1.2 When to Use Task Analysis
When task analysis is used in system design, the approach involves theanalysis of the human operator tasks in the following order:
1. In an existing system, the type and value of task analysis dependson the relevance and accessibility of the existing system(s) availablefor analysis, the tasks to be analyzed, and the level of direct corre-spondence of the tasks between the existing and future systems.
2. During the design process, task analysis is used to evaluate thedemands the task places on the operator in the new system.
3. At points during the operational life of the system (the system lifecycle), task analysis is used to update an existing system by focus-ing on specific issues rather than examining the system as a whole.For example, task analysis can be used when an important safetyissue is involved, human error is caused by technology or designdeficiency, system changes have created levels of uncertainty aboutsystem performance and reliability as well as human/system inter-action, or there are productivity and availability issues as they relateto human performance.
7.4.1.3 Who Can Perform a Task Analysis?
The users of task analysis methodologies can be grouped into threewide categories:
• System designers, the personnel responsible for the design of thesystem, equipment layout, displays and controls, and procedure
312 Job Factors
Ch07qxd 11/1/03 4:22 PM Page 312

313
TABLE 7-9
Principal Areas Where Task Analysis Techniques Are Beneficial
Principal Areas Benefits of Task Analysis
Safety Identify hazards to the operator in the workplaceAchieve a general level of safety through the achievement of
good design for human operationForm the basis for the analysis of human error in the systemDefine what went wrong and help identify remedial measures
during an incident or accident investigation
Function allocation Allocate functions between humans and machinesDefine the degree of human involvement in the control of the
system
Task specification Define the characteristics and capability requirements ofpersonnel to allow them to carry out the task effectively and safely
Task design Ensure adequate human/task interface design to carry out thetask efficiently and safely in normal and abnormal operations
Skills and Identify personnel requirements in terms of skills andknowledge of knowledgeoperators Design training programs
Design proper procedures
Job organization Define the number and variety of personnelDefine the organization of team membersDefine the communications requirements and allocation of
responsibilities
Efficiency and Identify staffing requirementsproductivity Identify specific training program to ensure efficiency and
productivity
Maintenance demands Identify maintenance demandsDefine the need for personnel and support tools and systems
of workIdentify the coordination needed among different areas of the
plant
Ch07qxd 11/1/03 4:22 PM Page 313

development. These designers, using task analysis techniques, mustdecide which functions are allocated to the machine and which to theoperator.
• Safety personnel, who are involved in risk assessment as well assafety function evaluation and training. Human Factors personnel andergonomists also fall in this category.
• Supervisors and managers, who are principally involved in thestaffing of their departments, training and support system (logistics),and organization of that staff.
7.4.1.4 The Process of Task Analysis
To achieve a meaningful comparison of system demands and operatorabilities and capabilities, the process of task analysis involves four phases.These phases follow a top-down structure, where each phase provides anadditional, detailed view of the human/system interaction requirements.The four phases are:
1. Plan for a task analysis. Performing a comprehensive, useful taskanalysis requires the preparation and participation of different typesof personnel in addition to the task analysis specialist. The per-sonnel that may contribute to the process are safety engineers andanalysts, design engineers (including instrumentation and controlengineers), training personnel, procedure writers, operators, andoperations supervisors and managers. The input from this crosssection of personnel can provide a comprehensive description of thesystem and the operations necessary to complete the tasks requiredand produce the output expected.
2. General data collection. This phase involves the collection and doc-umentation of various sources of information about the system. Themain goal is to identify all the tasks to provide an overall under-standing of the system and its components.
3. Task description. Task description includes a task list for each oper-ating sequence of the system, based on the general data collectionphase. This list should include human performance requirements andany critical aspect involved.
314 Job Factors
Ch07qxd 11/1/03 4:22 PM Page 314
4. Specific data collection. The choice of technique for data collectiondepends on two things: the status of system development and imple-mentation and the experience and availability of the personnel per-forming the analysis. Several techniques are involved in collectingdata and information. These are summarized in Table 7-10. The tech-niques can be grouped into four categories: documentation review(i.e., analysis of blueprints, plans), questionnaire survey, interview,and observation (i.e., analysis of prototypes, measurements). Toobtain complete information, a combination of these techniques isrecommended.
7.4.2 Critical-Task Identification and Analysis
As mentioned earlier, task analysis techniques can be applied to existing tasks or tasks that do not yet exist. However, the processdescribed here is concerned mainly with the identification and analysis oftasks associated with a new “project.” In this case, a “project” may be thedesign and construction of a major grassroots facility or the improvementof an existing facility. In new projects, the tasks do not yet exist. Even so, they can be analyzed and to do so, the analyst or the analysis team should have knowledge of the facility in which the operator will work,the equipment the operator will use, the environment in which the operator will perform the task, and the activities the operator will berequired to perform. Often, tasks similar to those in the new facility areperformed elsewhere and can be used as models for the “nonexistent”tasks analyzed.
For tasks with this gravity described (i.e., they are critical), the identi-fication and their analysis is a responsibility of a project (process andequipment) design team and a prerequisite for the proper human/system interface (HSI) engineering design of the facilities. People whoperform these analyses are generally trained in human factors measure-ment and familiar with the task analysis method. Once identified and ana-lyzed, the tasks can be reviewed routinely throughout the planning anddesign of the project to ensure that the human factors issues are properlyaddressed. Stages in which critical tasks are identified most effectively areduring
Job Factors 315
Ch07qxd 11/1/03 4:22 PM Page 315

316
TABLE 7-10
Techniques to Collect Information
Technique Benefits Things to Consider
Documentation Systematically gather Time consumingreview: larger amounts of Books and data Does not indicate how tasks areperiodicals specifically performedPrevious job Good for unstructured description jobsDiary (running
record of activities)
Prior reports and analyses
Questionnaire survey:Open-ended Large amount of Burden to respondentquestions information in short Must be specifically developed
time Difficult to integrate and analyze information
Data tend to be incompleteChecklist Easy to administer and Requires extensive preliminary
tabulate work to developGood for documenting Does not provide integrated
differences between picture of jobjobs and sites Does not indicate how task is
performed
Interview:Individual Can use structured Time consuming
interview interview(interviewee Combine several Depends on recallaway from job) interviews Depends on interviewee’s
Can generate complete verbal skillsdetailed information
Interviewee is not rushed as in on-the-job interview
Group interview Interaction between All participants may not (two or more interviewees initiate contributeinterviewees insight and recallaway from the Saves time over job) individual interviews
continued
Ch07qxd 11/1/03 4:22 PM Page 316
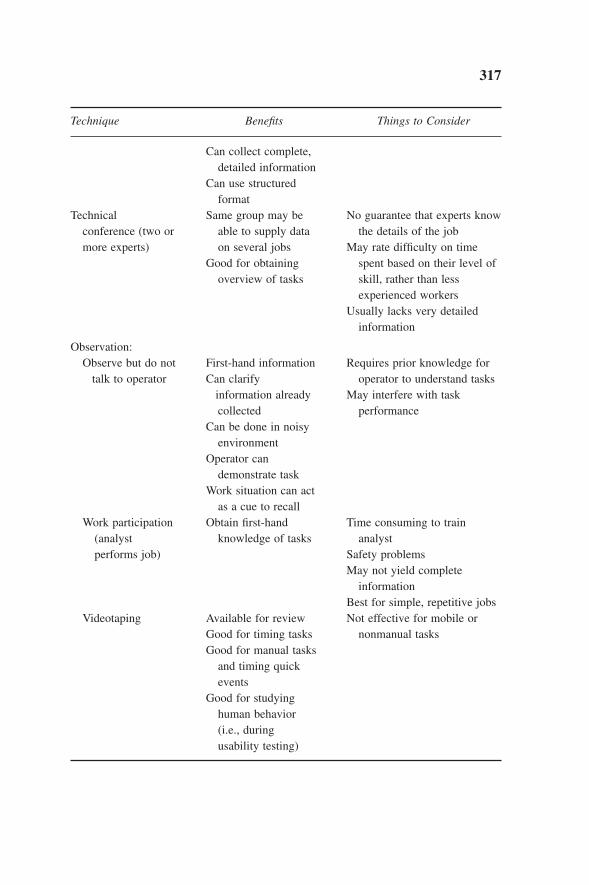
317
Technique Benefits Things to Consider
Can collect complete, detailed information
Can use structured format
Technical Same group may be No guarantee that experts know conference (two or able to supply data the details of the jobmore experts) on several jobs May rate difficulty on time
Good for obtaining spent based on their level of overview of tasks skill, rather than less
experienced workersUsually lacks very detailed
information
Observation:Observe but do not First-hand information Requires prior knowledge for
talk to operator Can clarify operator to understand tasksinformation already May interfere with task collected performance
Can be done in noisyenvironment
Operator can demonstrate task
Work situation can act as a cue to recall
Work participation Obtain first-hand Time consuming to train (analyst knowledge of tasks analystperforms job) Safety problems
May not yield complete information
Best for simple, repetitive jobsVideotaping Available for review Not effective for mobile or
Good for timing tasks nonmanual tasksGood for manual tasks
and timing quick events
Good for studying human behavior (i.e., during usability testing)
Ch07qxd 11/1/03 4:22 PM Page 317
• Front-end loading, when the major units are being developed [priorto or during design basis memorandum (DBM) or the inherent safety,health, environment (ISHE) review].
• The process design phase, when “process tasks” are defined in detailin the pre-Hazop reviews.
• The equipment design phase, when the equipment and the tasks to be performed by them are specified in the Hazop, nonprocess qualitycontrol (NPQC) or model reviews.
The critical-task identification/prioritization and analysis (CTIA) processis divided into three parts: identification of tasks whose analysis is criti-cal, analysis of the critical tasks, and follow-up.
7.4.2.1 Critical-Task Identification Process
Certain safety, health, and environment (SHE) reviews are required, to ensure hazards and risks are appropriately addressed. This processincludes hazards and risks attributed to human factors, specifically relatedto human tasks designed into the project to achieve an HSI design sup-portive of the human needs to perform a task safe and successful. There-fore, criticality is identified in terms of significant SHE risk potential andsignificant operations or reliability implications.
7.4.2.2 Critical-Task Analysis
The critical-task analysis (CTA) technique consists of two steps:
1. Preparation and description of tasks that will be analyzed. In prepa-ration for the analysis, completion of Form A (Table 7-11) is essen-tial to create the mindset of the team: Identify the people who willperform the task. They may include people remote from the facilitybut in communication with it.
2. Conducting the task analysis. Form B (Table 7-12) allows theanalyst to record the results of the analysis. Different forms may beused for unique types of analyses. The one shown in Table 7-12 isrecommended for most task analyses. The form consists of fivecolumns:
318 Job Factors
Ch07qxd 11/1/03 4:22 PM Page 318

TABLE 7-11
Form A. Task Analysis Preparation and Description
Date: ________________ Critical Task Analysis, Form A—Task Description Page _________ of _______Prepared by: Revision: _________________Job Name: _______________________________________________________________________Job Objective: ____________________________________________________________________
Job Function Description
No. of People Involved in Operating Environment When Is Task Where Is Task Personal ProtectiveTask Performed? Performed? Equipment in Addition to ❑
Normal Issue?Extreme temperatures? Day only Indoor Describe:High winds? 24-hour shift Outdoor
High vibration?
Poor lighting?
High noise?
Communication Frequency VisionVerbal? Hourly? Yearly? Need to view controls and/or displays? Yes? No ❑
Radio? Daily? As needed? Describe: __________________________________________________None? Monthly? __________________________________________________
Withwhom? _________ __________________________________________________
Review Checklist
Review Item
Insert sketch, drawing or model of area (attach drawings if applicable)
Ch07qxd 11/1/03 4:22 PM Page 319

TABLE 7-12
Form B. Conducting Task Analysis
Date: _______________ Critical Task Analysis, Form B—Results Analysis Page _______ of _______Prepared by: Revision: _______________Job Name: _______________________________________________________________Job Objective: _______________________________________________________________
Error Possibility and Ergonomic and Human Potential Solution Potential Human Factors Issues Activity Consequences Factors Concerns or Mitigation
Physical activitiesManual materials handlingHose handlingBarrels, boxesValvesHeightOrientationForceMusculoskeletalHands/wristsUpper extremity (head, neck,
shoulder)Lower extremity (lower back, leg)Access, walkways, platformsRoutes: exit, entrance, stairsReceiving informationLightingNoise interferenceDisplay designLabelingSignageColor codingProcessing informationToo much information?Menu, checklist present?Short-term memoryLong-term memoryControls/displays as expected?
Ch07qxd 11/1/03 4:22 PM Page 320
Column 1. Potential human factors issues. This column is designedto help remind people of the human factors issues that should beconsidered for each activity identified in the task (column 2).
Column 2. Activity. This column is used to identify the sequentialtasks performed in the task. Each activity should begin with anaction verb to describe the process or action of the personnel, such as installing temporary pressure gauge or filling standbyfilter.
Column 3. Possible error and consequences. This is evaluated foreach activity in column 3. What potential errors can result fromperforming the activity. When people perform tasks, basicallythree modes of (mental) information processing are involved:skill, rule, knowledge-based (SRK) information processing (Rasmussen, 1983, 1986). These are defined as follows: Skill-based processing is automated routine requiring little consciousattention; rule-based processing involves the prepackaged units of behavior released when the appropriate rule is applied; andknowledge-based is the improvisation in unfamiliar environments,where no routine or rules are available for handling tasks.
Column 4. Ergonomic and human factors concerns. For each activ-ity, the potential human factors concerns are identified using thejob aid in column 1. Once the potential issues are identified (brain-storm everything that could happen), those likely to occur arelisted.
Column 5. Potential solutions and mitigations. A solution (or solu-tions) for each likely issue is developed.
7.4.2.3 Follow-up Documentation
After the CTA is complete, a final report should be prepared that doc-uments the results. The report should be issued to the person who spon-sored the CTA from the project. The report documentation should include
• Cover letter that identifies who stewards the recommendations.
• A summary of all the recommendations or findings.
• Documentation of CTA team members and team leader.
Job Factors 321
Ch07qxd 11/1/03 4:22 PM Page 321

• A copy of the completed forms used.
• Any areas of the review that are incomplete.
7.5 TEAM-BASED APPROACH
The team-based approach tools have been successfully used to helpimprove business, plant teams, and safety performance. The goal in thissection is to provide a brief overview of four of these tools (see websiteaddresses). Other tools, not cited here, may exist on the market.
• Kirton Adaptive-Innovative (www.kaicentre.com).
• ACUMEN (www.acumen.com).
• NTL Institute (www.ntl.org).
• Type Resources (www.type-resources.com).
• Temperament Research Institute (www.tri-network.com).
• Creative Problem Solving, CPSB (www.cpsb.com).
• Human Factors International (www.human-factors.com).
7.5.1 Cognitive Problem-Solving Style (KAI)
The Kirton Adaption-Innovation (KAI) inventory or instrument is ameasure of cognitive (problem-solving approach) style of individuals aswell as for the entire team. The central construct of the Kirton theory isa cognitive-style continuum (AI), all levels of which express creativitybut vary qualitatively in terms of how that creativity expresses itself, suchas adaptively or innovatively (Kirton, 1994). The product of this instru-ment is a private, comprehensive hard-copy analysis of the individual’sposition on the AI scale. In addition, a general analysis is provided to showthe makeup of the team in terms of the AI scale.
Adaptors show relatively greater within-paradigm (structure) con-sistency, while innovators show relatively greater consistency across paradigms. It is very important to emphasize two points:
322 Job Factors
Ch07qxd 11/1/03 4:22 PM Page 322

1. The operational measure of AI yield scores that distribute normallyand the interpretations of these scores are relative to other scores.For example, a score of 85 (considered on the moderate adaptiveside) can be seen as adaptive to someone with a score of 115 (con-sidered on the innovative side). However, a score of 85 can be seenas more on the innovative side to someone with a score of 65 (con-sidered on the high adaptive side).
2. The AI dimension is independent of creative level and the “tech-nique” aspect of creativity as well as social desirability and generalcompetence, gender, age, culture, and the like.
Normally, most teams have individuals exhibiting a wide range of styles.Differences in style often lead to personal clashes. Teams become less pro-ductive and take more time and effort, sometimes requiring outside inter-vention, in achieving a desired objective. Enlightenment of styles usuallyresults in team members recognizing and accepting individual differencesor preferences in approach. Recognition and acceptance help the team collaborate, which greatly increases the team’s effectiveness.
7.5.2 Drexler-Sibbet High-Performance Team Model
The Drexler-Sibbet (DS) model describes the team process of achiev-ing high performance. The DS technique measures team progress at eachof seven stages. These seven stages are a kind of road map guiding theteam through to achieve high performance. These stages include orienta-tion, trust, goals, commitment, implementation, high performance, andrenewal. The measurement can be used at any time in a team’s life. Itquickly pinpoints what the team is doing well and problems need inter-vention. Thus, the facilitator can work with the team specifically on onlythose issues impeding the team in reaching its objectives. The recom-mended use of this technology is at the team’s beginning, and then againat midpoint of a team’s life.
Job Factors 323
Ch07qxd 11/1/03 4:22 PM Page 323

7.5.3 ACUMEN
The ACUMEN team building technology is utilized for special teamsthat have a “must do,” high-return objective. Therefore, the faster the teamcan gel and deliver the goods, the faster the profit or technical gain is real-ized. Trust issues usually get in the way of a team gelling. A facilitatedACUMEN session is aimed at resolving major trust issues and movingthe team forward. Therefore, the most optimum time for employing the ACUMEN technology is during the early stages of a team’s life.ACUMEN is a software system that privately measures “how” a personthinks and therefore is most likely to act. The analysis is comprehensiveand includes a self-perception as well as a private feedback loop requir-ing the input of four or more associates. The reports are hard copies andbelong to the individual for self-improvement. The ACUMEN softwarealso combines individual profiles (through coding for confidentiality) intoa team profile. An analysis and a hard-copy report pinpoint the team’smajor strengths and potential soft spots. This technology has been suc-cessfully utilized for major plant and pilot plant start-up teams, operations,research, and technology teams.
7.5.4 Systematic Multilevel Observation of Groups (SYMLOG)
SYMLOG is a theory of personality and group dynamics. The deliver-ables is a set of practical methods for measuring and changing behaviorand values. It is designed for specific groups in their natural environment.It is applicable to many kinds of groups, from small teams to an entireorganization, with multiple situations. Specifically, the principle purposeis to understand the group better in order to improve productivity, quality,and safety. The theory and measurements indicate specific ways in whichleaders and members can most effectively encourage desirable changes in group performance. Applications include assessment of teamwork andleadership, group composition, and team leader training.
The methods include instruments for measuring values as well as inter-personal behavior. The value measurements are adapted especially for usein survey research, program development and evaluation, cultural climate
324 Job Factors
Ch07qxd 11/1/03 4:22 PM Page 324
studies, organizational development, conflict resolution, improvementacross interfaces, and the development of organizational policy.
7.6 BEHAVIOR-BASED SAFETY
The objective of all behavior-based safety (BBS) programs is to reducethe number and severity of injuries. In general, safe behavior acts as abarrier to prevent incidents, while unsafe behavior acts as the hazard thatinitiates the incident. Even though our traits (attitudes, personalities, andvalues) can affect our behavior, what we observe, however, is only whatindividuals do or say and not the traits. Behavior-based safety programsare based on field observations, providing feedback to reinforce safebehavior and correct unsafe behavior.
The goal of this section is not to rewrite the history and application ofBBS programs. Detailed information is available from the following listof the programs and websites. The objective of this section is to presentthe lessons learned from a summary of a survey, performed by the authorsof this book, of different BBS initiatives. In addition, a list of the recom-mended core and ancillary elements of BBS programs are provided.
• ABC Aubrey Daniels (www.aubreydaniels.com).
• Behavioral Sciences Technology—Thomas Krause (www.bstsolutions.com).
• Dupont Take Two Behavior Modification (www.dupont.com/safety).
• Loss Prevention System—James Bennett (www.Lpscenter.com).
• Safety Performance Solution—E. Scott Geller (www.safetyperformance.com).
7.6.1 Lessons Learned
These lessons learned are based on a survey of BBS programs (Deeb,Danz-Reece, and Smolar, 2000).
Job Factors 325
Ch07qxd 11/1/03 4:22 PM Page 325

7.6.1.1 Implementation
• Review existing programs, study differences in cost and culture,choose one, and adapt it to fit your site.
• Get commitment (buy-in) up front from the top down and bottom up.
• Ensure management is aware of time commitment and provides continuous support.
• Everyone, including management, should be actively involved.
• Expect resistance.
• Be determined and do not rush. The process takes time and hard work.
• Choose a full-time coordinator or facilitator who is credible withmanagement and workers.
• Set up behavior-based safety as a norm or expectation just like anyother business function. “This is the way in which we conduct ourbusiness.”
• Integrate behavior programs within the operation integrity systemframework.
7.6.1.2 During Training
• Take time to explain objectives and principles to all employees.
• Do not take shortcuts in initial training.
• Experts should train the trainers, and the trainers should train theremaining employees.
• Provide more refresher training.
• Train supervisors in interpersonal skills.
7.6.1.3 Observations
• Process should not be voluntary; that is, people should have no choicewhether to be observed or not.
326 Job Factors
Ch07qxd 11/1/03 4:22 PM Page 326
• Observations should be nonpunitive.
• Establish a strong culture for feedback.
• Set targets for quality not quantity.
• Provide more employee-to-employee observations.
7.6.1.4 Measure
• Ensure regular meetings and feedback.
• Listen and respond to data.
• Ensure systems are in place for feedback.
• Conduct evaluations to measure goals and identify room for improvement.
• Clearly define and communicate the expectations of the process;components should be monitored and measurable.
7.6.1.5 Positive Outcomes
• Increased interface between salaried and wage personnel.
• Top management leadership and support.
• Groups are more cohesive and actively caring because of increasedinterface.
• Significant improvement in quality and quantity of observations andnear-miss reports.
• Dramatically improved safety record.
• Improved morale.
• Increased employee awareness.
• General acceptance at worker level.
Job Factors 327
Ch07qxd 11/1/03 4:22 PM Page 327

7.6.2 Recommended Core and Ancillary Elements of BBS Programs
At a minimum behavior-based safety programs should
• Focus attention on work behavior.
• Define expected behavior.
• Observe if behavior is demonstrated during work.
• Provide feedback to individuals if their behavior meets expectations.
7.6.2.1 Recommended Program Elements
The recommended core elements for a behavior-based safety programare summarized next.
• Implementation:The program has features that support continuous improvement.The program includes a plan for regular stewardship.
• Buy-in:The program expects employee participation.The program has visible participation by site and line management.
• Training: The program provides training for employees onBasic principles of behavioral reinforcement and correction such as
the following:Observation skills and improvement, if needed.How to deliver feedback and reinforcement.Consideration of human factors or ergonomics, both in terms of
physical activities and potential for human error.
• Observation:Persons who are observed receive immediate feedback or reinforce-
ment on safety behavior issues observed.Observers use a checklist or reminder list while observing work
activities.
• Tools:The program provides tools for consistent observations and analyses.
328 Job Factors
Ch07qxd 11/1/03 4:22 PM Page 328
The program provides plans and tools to effectively define and com-municate solutions or learning throughout the organizational levelsand shifts and work groups.
• Measurement: Implementation includes initial survey evaluation toensure that the design of the program meets the needs of the busi-ness. Measures and performance targets emphasize results and keyactivities and are used to set priorities on interventions.
• Contractors: The program extends to appropriate contractors.
For sites with existing programs, the most common questions are these:How complete is my program? How can we improve? The checklist men-tioned in Section 7.6.2.2 can also be used to assess if existing programsare complete and, if not, which elements are lacking. To answer the ques-tion, How can we improve? one approach is to conduct an assessment ofthe existing program. In an assessment approach, the perceptions by man-agers and workers about the elements of the program are surveyed andanalyzed. Areas in which perceptions differ significantly are also identi-fied as opportunities for improvement, as are any gaps in the core andancillary program elements.
7.6.2.2 Practical Considerations for Implementation
In addition to the core and ancillary elements, sites with experience inimplementing a program suggest that the following checklist items areimportant to consider:
• Has the organization evaluated its needs and determined what objec-tives the program is intended to help achieve?
• How mature and effective are the organization’s other safety systemelements?
• Are you looking for a program that focuses only on safe work behav-iors or something that fills other gaps as well?
• Does the program meet or can it be customized to meet the organi-zation’s needs?
Job Factors 329
Ch07qxd 11/1/03 4:22 PM Page 329

• Can it reasonably be integrated with existing safety systems and toolsor a mature incident investigation process?
• Does it help diagnose areas of concern and then set priorities or focusefforts on the higher-value opportunities?
• Can training and rollout be tailored to the audience (e.g., manage-ment, implementers, field personnel) or is it just a canned packagefor use with everyone?
• Are you looking for a program that is compatible with the organiza-tion’s existing culture or one that will help achieve change?
• Do you want a program that focuses on outcomes and results or onethat focuses on leading indicators? (The value of BBS is the focus onleading indicators.)
• Is the scientific basis on which the program is designed accepted byor acceptable to the organization?
• Does the program fit with the organization’s size and sophistication?
• Will advisors be readily accessible to guide the effort and help withanalysis and corrective action, or will small groups be trained and leftlargely on their own? Larger groups of people allow shared support,greater data collection and analysis, and if desired, more program elements.
• Are implementation requirements consistent with available resources(cost, time, and money)?
• Is the objective to implement a process quickly (off the shelf) or isthere time to design or customize a product for the organization?
• How much money is presently available for the project? While thecost of in-house development or use of a third-party product can benearly the same over the long term, generally a third-party approachhas higher up-front costs.
330 Job Factors
Ch07qxd 11/1/03 4:22 PM Page 330

7.7 CASE STUDY
This case study illustrates the use of the task analysis technique.
7.7.1 Introduction
An ergonomic evaluation of a loading rack was performed and con-sisted of interviews with Mr. X, the full-time technician; observation of work activities performed in this area; and a videotape recording of Mr. X performing his tasks. The on-site data were collected and analyzed(off site) using the following methods: task analysis and biomechanicalanalysis.
7.7.2 Task Analysis
The major tasks performed by the rack technician were
• Hooking up the railcars.
• Sampling.
• Gauging.
• Unhooking the railcars.
After observing Mr. X perform these tasks, it was concluded that the sam-pling and gauging activities did not pose significant ergonomic risk to thetechnician. Therefore, these activities are not addressed here. It was alsonoted that hooking the railcars essentially involved the same critical tasksas unhooking the railcars. Therefore, this task analysis focuses on thehooking task, with the understanding that any recommendations or con-cerns also address the corresponding activity as it takes place during theunhooking process. A short version of the task analysis is presented herefor demonstration purposes (Table 7-13).
Job Factors 331
Ch07qxd 11/1/03 4:22 PM Page 331
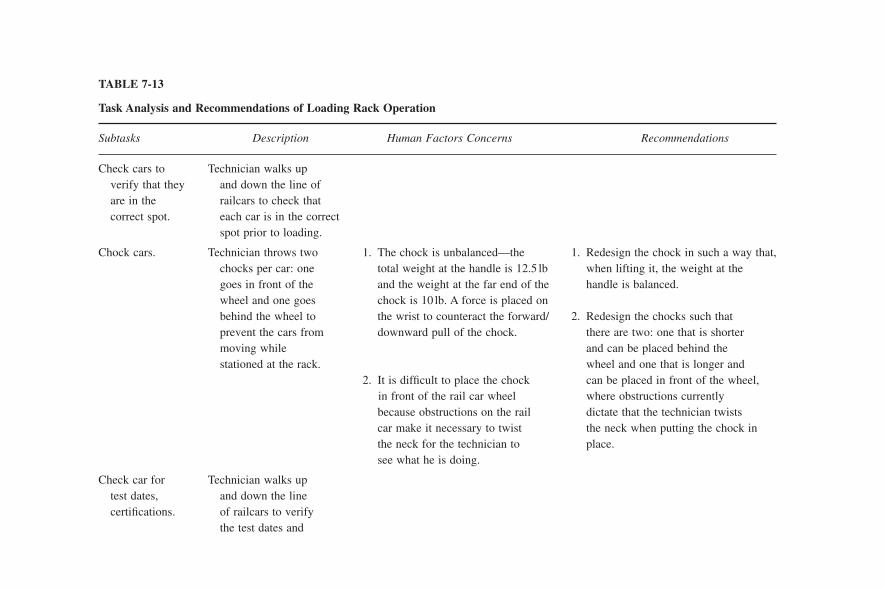
TABLE 7-13
Task Analysis and Recommendations of Loading Rack Operation
Subtasks Description Human Factors Concerns Recommendations
Check cars to Technician walks up verify that they and down the line of are in the railcars to check that correct spot. each car is in the correct
spot prior to loading.
Chock cars. Technician throws two 1. The chock is unbalanced—the 1. Redesign the chock in such a way that,chocks per car: one total weight at the handle is 12.5 lb when lifting it, the weight at the goes in front of the and the weight at the far end of the handle is balanced.wheel and one goes chock is 10 lb. A force is placed on behind the wheel to the wrist to counteract the forward/ 2. Redesign the chocks such that prevent the cars from downward pull of the chock. there are two: one that is shorter moving while and can be placed behind the stationed at the rack. wheel and one that is longer and
2. It is difficult to place the chock can be placed in front of the wheel, in front of the rail car wheel where obstructions currently because obstructions on the rail dictate that the technician twists car make it necessary to twist the neck when putting the chock in the neck for the technician to place.see what he is doing.
Check car for Technician walks up test dates, and down the line certifications. of railcars to verify
the test dates and
Ch07qxd 11/1/03 4:22 PM Page 332

certifications for each railcar before authorizing loading.
Throw Technician puts two 1. The force required to lift the cast 1. Both derailers should be made of aderailers and derailers on the tracks iron steel derailer is 188 lb; lighter material, such as aluminum. flags. (one on each track) to biomechanical analysis for a The force required to lift the
prevent another train 95th percentile man shows that aluminum derailer is much less from entering the rack the back compression upper (80 lb versus 188 lb).while cars are being limit is exceeded, and many lack However, after performing a loaded; one derailer is sufficient hip, torso, or ankle biomechanical analysis for a 95th made of cast iron steel strength to safely perform the percentile man lifting an aluminum and the other is made task. derailer, it was noted that the of aluminum. compression force on the back still
2. The derailer is located at ground exceeded the design limit. So, if level, which requires that the possible, the weight of the derailer technician bend to access it, should be reduced further.increasing the risk for lower 2. Squatting rather than bending at the back strain. The lever arm of the waist while throwing the derailer derailer is short, which makes would help reduce the compression the derailer seem heavier when forces on the low back. Alternatively, lifting and makes it more adding a handle to the outside of the difficult for the technician to get derailer and giving the technician a the hand under the derailer when hook to grab onto the derailer will lifting. minimize the amount of bending the
technician must do, thus decreasing the force on the back. This solution also solves the limited hand space/short lever arm problem.
continued
Ch07qxd 11/1/03 4:22 PM Page 333

TABLE 7-13
Task Analysis and Recommendations of Loading Rack Operation Continued
Subtasks Description Human Factors Concerns Recommendations
Throw Technician pushes loadingloading arm out arm out from the rack to car. to the car.
Release ramp. Some of the ramps are The force required to raise/lower Install all air powered lifts. Implement hydraulic, while others the lift manually is 146 lb; and maintain a maintenance schedule must be raised and biomechanical analysis for a 95th for the ramps to keep them safe and lowered manually, percentile man shows that the operating efficiently.which is accomplished strength upper limit is exceeded using one hand. for the shoulder and ankle, and
many lack the elbow strength to safely perform the task.
Pull plug on Technician must pull the dome cap. pin that keeps the
dome cap closed.
Open dome cap. Technician must lift and The force required to open the Use spring assists in all dome caps. Theopen the dome cap off dome cap is approximately force required to lift a spring-assisted the railcar. 90 lb; this exceeds the back dome cap was measured while on
compression design limit for a site. A biomechanical analysis was 95th percentile man and many performed for a 95th percentile man lack sufficient torso, hip, or ankle and showed a significant decrease strength required to safely in back compression force. Also, perform the task. implement a quality control program to
ensure that the springs used are safe and effective.
Ch07qxd 11/1/03 4:22 PM Page 334

7.7.3 Biomechanical Analyses
Biomechanical analyses, using the three-dimensional static strengthprediction program (University of Michigan Center for Ergonomics) wereperformed on the ramp manipulation, derailer, and dome cap lifting tasks.All analyses were performed using a 95th percentile man as the subject,to be consistent with Mr. X’s stature.
REVIEW QUESTIONS
1. What factors can affect sleep?
2. Define insomnia.
3. Fatigue is a state caused by a host of factors. Name the factors.
4. What individual differences may have impact on the shift worker?
5. Name and give examples of strategies for coping with shift work.
6. What organizational strategies can contribute to the worker’s shifttolerance?
7. Name the sources of stress
8. How is stress measured?
9. What is the purpose of task analysis?
10. What are some benefits of a team-based approach?
11. How does a behavior-based safety program improve safety per-formance?
REFERENCES
Aanonsen, A. (1964) Shift Work on Health. Norwegian Monographs on Medical Sciences.Oslo: Universitets Forlaget. Cited in E. Grandjean, Fitting the Task to the Man. FourthEd. London: Taylor and Francis, 1988, pp. 217–230.
Aryee, S., and Tan, K. (1992) “Antecedents and Outcomes of Career Commitment.”Journal of Vocational Behavior 40, pp. 288–305.
Job Factors 335
Ch07qxd 11/1/03 4:22 PM Page 335
Barnes, R. M. (1936) “An Investigation of Some Hand Motions Used in Factory Work.”Bulletin 6. Iowa City: University of Iowa, Studies in Engineering. Cited in E. Grandjean, Fitting the Task to the Man. Fourth Ed. London: Taylor and Francis, 1988,pp. 217–230.
Barnes, R. M. (1949) Motion and Time Study. Third Ed. New York: John Wiley. Cited inE. Grandjean, Fitting the Task to the Man. Fourth Ed. London: Taylor and Francis,pp. 217–230.
Benson, H. (1985) “The Relaxation Response.” In A. Monat and R. S. Lazarus (eds.),Stress and Coping: An Anthology. Second Ed. New York: Columbia University Press,pp. 315–321.
Bhatia, N., and Murrell, K. F. H. (1969) “An Industrial Experiment in Organized RestPauses.” Human Factors 11, pp. 167–174.
Buunk, B. P., and Janssen, P. P. M. (1992) “Relative Deprivation, Career Issues, and MentalHealth among Men in Mid-Life.” Journal of Vocational Behavior 40, pp. 338–350.
Deeb, J. M., Danz-Reece, M. E., and Smolar, T. J. (2000) “Industry Experience withBehavior-Based Safety Programs: A Survey.” Proceedings of the InternationalErgonomics Association 2000 and Human Factors and Ergonomics Society 2000Congress, San Diego, CA, vol. 2, pp. 213–215.
Drury, C. G. (1983) “Task Analysis Methods in Industry.” Applied Ergonomics 14, no. 1,pp. 19–28.
Drury, C. G., Paramore, B., Van Cott, H. P., Grey, S. M., and Corlett, E. N. (1987) “TaskAnalysis.” In G. Salvendy (ed.), Handbook of Human Factors. New York: John Wiley& Sons, pp. 370–401.
Folkand, S., and Monk, T. H. (1979) “Shift Work and Performance.” Human Factors 21,pp. 483–492.
Grandjean, E. (1988) Fitting the Task to the Man. Fourth Ed. London: Taylor and Francis.
Haworth, N., and Heffernan, C. (1977) “Information for Development of an EducationalProgram to Reduce Fatigue-Related Truck Accidents.” Report 4. Victoria, Australia:Monash University Accident Research Center.
Hildebrandt, G., Rohmert, W., and Rutenfranz, J. (1974) “Twelve and 24-Hour Rhythmsin Error Frequency of Locomotive Drivers and the Influence of Tiredness.” Interna-tional Journal of Chronobiology 2, pp. 97–110.
Horne, J. A., Anderson, N. R., and Wilkinson, R. T. (1983) “Effects of Sleep Deprivationon Signal Detection Measures of Vigilance: Implications for Sleep Function.” Sleep6, pp. 347–358.
Ivancevich, J. M., and Matteson, M. T. (1988) “Promoting the Individual’s Health andWell-Being.” In C. L. Cooper and R. Payne (eds.), Causes, Coping and Consequencesof Stress at Work. Chichester, UK: John Wiley & Sons, pp. 267–299.
Karasek, R.A. (1979) “Job Demands, Job Decision Latitude, and Mental Strain: Implica-tions for Job Redesign.” Administrative Science Quarterly 24, pp. 285–306.
336 Job Factors
Ch07qxd 11/1/03 4:22 PM Page 336

Kelly, R. J., and Schneider, M. F. (1982) “The 12-Hour Shift Revisited: Recent Trends in the Electric Power Industry.” Journal of Human Ergology 11 (supplement), pp.369–384.
Kirton, M. (1994) Adaptors and Innovators: Style of Creativity and Problem Solving.London, UK: Routledge Publisher.
Kirwan, B., and Ainsworth, L. K. (1992) A Guide to Task Analysis. London: Taylor andFrancis Publishers.
Lindstrom, K. (1991) “Well-Being and Computer-Mediated Work of Various OccupationalGroups in Banking and Insurance.” International Journal of Human-Computer Inter-action 3, no. 4, pp. 339–361.
Matsumoto, K., Matsui, T., Kawamori, M., and Kogi, K. (1982) “Effects of Night TimeNaps on Sleep Pattern of Shift Workers.” Journal of Human Ergology 11 (supple-ment), pp. 279–289.
Monk, T. H., and Folkard, S. (1992) Making Shift Work Tolerable. London: Taylor andFrancis.
National Transportation Safety Board (NTSB) (1995) Factors That Affect Fatigue inHeavy Truck Accidents, vol. 2. Case Summaries. NTSB number: ss-95/02. NTISnumber:PB95–917002. Washington, DC.
Presser, H. B., and Cain, V. S. (1983) “Shift Work among Dual-Earner Couples with Children.” Science 219, pp. 876–878.
Rasmussen, J. (1983) “Skill, Rules, Knowledge: Signals, Signs, and Symbols and OtherDistinctions in Human Performance Models.” IEEE Transactions on Systems, Man,and Cybernetics SMC-13, no. 3, pp. 257–267.
Rasmussen, J. (1986) Information Processing and Human-Machine Interaction: AnApproach to Cognitive Engineering. New York: Elsevier.
Russell, J. E. A. (1991) “Career Development Interventions in Organizations.” Journal ofVocational Behavior 38, pp. 237–287.
Rutenfranz, J., and Knauth, P. (1976) Rhythmusphysiologie und Schichtarbeit in Schicht-und Nachtarbeit. Vienna: Institut fur Gesellschafts Politik, Sensenverlag. Cited in E.Grandjean, Fitting the Task to the Man. Fourth Ed. London: Taylor and Francis, 1988,pp. 217–230.
Sergean, R. (1971) Managing Shiftwork. London: Gower Press, Industrial Society.
Smith, M. J., and Carayon, P. (1995) “New Technology, Automation and Work Organiza-tion: Stress Problems and Improved Technology Implementation Strategies.” Inter-national Journal of Human Factors in Manufacturing 5, pp. 99–116.
Summala, H., and Mikkolo, L. (1994) “Fatal Accidents among Car and Truck Drivers:Effects of Fatigue, Age, and Alcohol Consumption.” Human Factors 36, pp. 315–326.
Tepas, D. I. (1985) “Flexitime, Compressed Work Weeks, and Other Alternative WorkSchedules.” In S. Folkand and T. H. Monk (eds.), Hours of Work. New York: JohnWiley & Sons.
Job Factors 337
Ch07qxd 11/1/03 4:22 PM Page 337

Tepas, D. I. (1993) “Educational Program for Shift Workers, Their Families, and Prospec-tive Shift Workers.” Ergonomics 36, pp. 199–209.
Tepas, D. I., and Monk, T. H. (1987) “Work Schedules.” In G. Salvendy (ed.), Handbookof Human Factors. New York: John Wiley & Sons, pp. 819–843.
Tepas, D. I., Paley, M. J., and Popkin, S. M. (1997) “Work Schedules and Sustained Performance.” In G. Salvendy (ed.), Handbook of Human Factors and Ergonomics.Second Ed. New York: John Wiley & Sons, pp. 1021–1058.
Thiis-Evenson, E. (1958) “Shift Work and Health.” Industrial Medicine 27, pp. 493–497.
Weddeburn, A. A. I. (1981) “How Important Are the Social Effects of Shift Work.” In L. C. Johnson, D. I. Tepas, W. P. Colquhoun, and N. J. Colligan (eds.), BiologicalRhythms, Sleep, and Shiftwork. New York: S.P. Medical and Scientific Books, pp. 257–269.
Yang, C. L., and Carayon, P. (1995) “Effects of Job Demands and Social Support onWorker Stress: A Study of VDT Users.” Behavior and Information Technology 14(1),pp. 32–40.
338 Job Factors
Ch07qxd 11/1/03 4:22 PM Page 338

8
Information Processing
8.1 Human Error8.1.1 Introduction8.1.2 Why Humans Make Errors8.1.3 Mental Errors8.1.4 Display Errors8.1.5 Environmental Causes8.1.6 System Factors That Lead to Error
8.2 Plant Signs and Labels8.2.1 Equipment Labeling Program8.2.2 Designing Signs and Labels8.2.3 Guidelines for Specific Types of Signs and Labels
8.3 Procedures8.3.1 Guidelines for Determining When a Procedure Is Needed8.3.2 Developing Procedures8.3.3 Formatting Written Procedures8.3.4 Determining Why a Procedure Was Not Used8.3.5 Evaluating Written Procedures
8.4 Training8.4.1 Developing Training8.4.2 Task Analysis for Training Development8.4.3 Content of a Training Package8.4.4 Training for Trainers8.4.5 When to Provide Training8.4.6 Evaluating Training
8.5 Vigilance8.5.1 Transportation Systems8.5.2 Control Room Operations8.5.3 Mining Operations8.5.4 Driving Performance8.5.6 Factors Contributing to Vigilance Decrement8.5.7 Operator Workload Analysis
339
Ch08qxd 11/1/03 4:23 PM Page 339

340 Information Processing
8.6 Case Study8.6.1 Narrative: How to Change a Tire
Appendix 8-1. Procedures Evaluation Checklist
8.1 HUMAN ERROR
8.1.1 Introduction
This chapter reviews the common classifications of human error andthe typical types of errors operators make in the petrochemical industry,excerpted from a previous paper by Attwood (1998). Plant signs, proce-dures, and training are critical sources of information for personnel andshould be designed and implemented to reduce the potential for humanerror. Design of displays, another key aspect of information processing,is covered in Chapter 5.
On February 15, 1982, 84 men drowned when the Ocean Ranger, asemisubmersible oil rig, sank during a storm in the Atlantic Ocean 150miles east of St. John’s, Newfoundland. It was the worst peacetime marinedisaster in Canada’s history. The learning gained from this incidentdemonstrates how vitally important it is to provide the information thatthe operators need to identify trouble, solve problems, and make criticaldecisions (Heising and Grenzebach, 1989).
A subsequent inquiry by the Canadian Royal Commission on the OceanRanger Marine Disaster (1984) found that the rig capsized and sank afterwater flooded the ballast control room through a porthole and short-circuited the control panel causing seawater to flood the forward ballasttanks and chain lockers. The porthole collapsed because it was not prop-erly sealed. The porthole was used to read draft marks on the columns ofthe rig. The crew, according to reports, habitually left the “deadlights,”which protect the portholes, unbolted. The portholes were not strongenough to withstand the conditions in the North Atlantic.
It was determined that several subsequent errors compounded theproblem and led to the sinking. Faulty engineering, inadequate training,and poor procedures reportedly caused the errors. However, the portholeexample makes the point that the capsizing would not have begun if the
340 Information Processing
Ch08qxd 11/1/03 4:23 PM Page 340
Information Processing 341
crew had not made an error by not bolting the deadlights, and of course,if the portholes could have been designed in the first place to allow theoperators to view the draft marks without unbolting the deadlight. It isgenerally agreed that people do not intentionally make errors. With fewexceptions, the design of the system makes people make errors. So, bydesigning systems that take into account the capabilities and limitationsof humans, the potential for errors should be greatly reduced.
8.1.2 Why Humans Make Errors
When compared to machines, humans appear to be vastly inferior. Wecannot process information as fast as computers. We cannot work as fastor as long as machines without getting tired. We cannot exert as muchforce as machines or exert it as accurately or as long. We have an advan-tage over machines with our abilities to reason and learn but not with ourphysical abilities to work quickly, to work for long hours without rest, orto lift heavy objects. Even so, research in human factors founded in exper-imental and applied psychology provides us the rationale for why evenour exceptional abilities break down and we make errors. By under-standing the limitations and capabilities of humans, we can design systemsto take advantage of their strengths and minimize the impact of their weaknesses. Table 8-1 is organized into three columns. The first columnpostulates why humans make errors; the reasons are well grounded in experimentation and observation. The second column provides anexample of when this limitation might appear in practice. The thirdcolumn suggests how that system can be designed to eliminate or, at least,reduce the potential of the error being made.
8.1.3 Mental Errors
Table 8-1 illustrates several ways in which higher mental processes canlead to errors. Inattention, for example, can be due to the operator beingchallenged by conflicting demands for his or her limited attention. The
Ch08qxd 11/1/03 4:23 PM Page 341

TABLE 8-1
Why Humans Make Errors and How to Minimize Error Potential
Why Humans Make Errors Conditions That Could Contribute to Potential Errors Designing to Minimize Human Error
Mental errorsInattention Striking a limb on a sharp object or touching a steam line Minimize conflicting demands
while performing maintenance on a piece of plant equipment
Forgetting to close, bleed the air, or pull the fuses, to Initiate redundant checks by personnel in disable a remote-operated valve (ROV) critical situations
Forgetting information when Providing directions to an operator over a radio rather than Minimize distractions, interruptionsdistracted in writing, then requiring him or her to remember the Provide written checklists
directions while distracted by other dutiesUnable to retain enough Tags and labels consisting of long strings of random letters Chunk information into groups; for
information and numbers example, the number 4162910474 has more meaning when displayed as (416) 291-0474
Develop logical associations between the information and the action
Unable to retain information Requiring operator to remember large quantities of Design systems to retain information long enough information without rehearsal or a way of noting it for (visual or auditory) until no longer
later reference needed by the operatorSystem demands exceed human Control system requires operator to perform Design calculation into the process
information processing ability mathematical calculations to modify the process control systemOperators are poor at consistently making error-free
calculationsExpectations conflict with Inconsistency in the meaning of red and green between Site standards should be consistent
reality process and electrical systems causing opposite Provide another method of coding in responses to the same color addition to color
Imposing North American design standards on cultures Design to take advantage of human where the standards are different expectations, and culture
Ch08qxd 11/1/03 4:23 PM Page 342
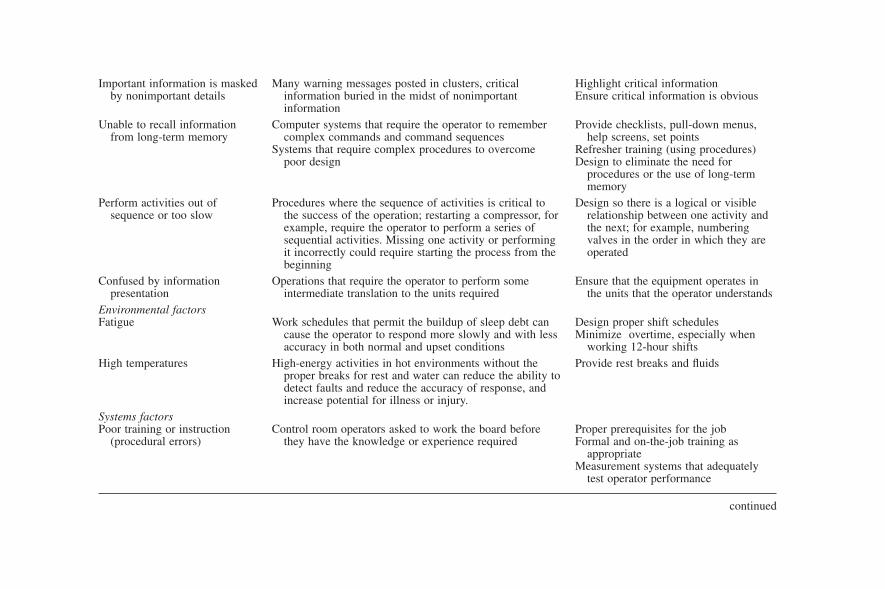
continued
Important information is masked Many warning messages posted in clusters, critical Highlight critical information by nonimportant details information buried in the midst of nonimportant Ensure critical information is obvious
informationUnable to recall information Computer systems that require the operator to remember Provide checklists, pull-down menus,
from long-term memory complex commands and command sequences help screens, set pointsSystems that require complex procedures to overcome Refresher training (using procedures)
poor design Design to eliminate the need for procedures or the use of long-term memory
Perform activities out of Procedures where the sequence of activities is critical to Design so there is a logical or visible sequence or too slow the success of the operation; restarting a compressor, for relationship between one activity and
example, require the operator to perform a series of the next; for example, numbering sequential activities. Missing one activity or performing valves in the order in which they are it incorrectly could require starting the process from the operatedbeginning
Confused by information Operations that require the operator to perform some Ensure that the equipment operates in presentation intermediate translation to the units required the units that the operator understands
Environmental factorsFatigue Work schedules that permit the buildup of sleep debt can Design proper shift schedules
cause the operator to respond more slowly and with less Minimize overtime, especially when accuracy in both normal and upset conditions working 12-hour shifts
High temperatures High-energy activities in hot environments without the Provide rest breaks and fluidsproper breaks for rest and water can reduce the ability to detect faults and reduce the accuracy of response, andincrease potential for illness or injury.
Systems factorsPoor training or instruction Control room operators asked to work the board before Proper prerequisites for the job
(procedural errors) they have the knowledge or experience required Formal and on-the-job training as appropriate
Measurement systems that adequately test operator performance
Ch08qxd 11/1/03 4:23 PM Page 343

TABLE 8-1
Why Humans Make Errors and How to Minimize Error Potential Continued
Why Humans Make Errors Conditions That Could Contribute to Potential Errors Designing to Minimize Human Error
Information presentationSpeed versus accuracy Abnormal operations when the plant is starting up, Design system for the constraints of the
shutting down, or upset task. If speed is required, design the system to assist the operator, to provide better summary information, and to be more forgiving. If accuracy is required, allow sufficient time to perform the task
Inconsistent information Inconsistent symbols or coding can slow down decision Display similar information in a presentation making or cause an operator to mistake one symbol for consistent manner. This includes
another symbols, color, and navigationPoor lighting, contrast, or use of Signs and labels improperly designed for reading: Ensure the information contrasts with the
color Contrast is poor, characters too small, or lighting background inadequate Ensure sufficient background luminance
for the taskEnsure characters large enough for the
reading conditionsColor used as the only form of coding rather than a Use color only as a redundant coding
redundant coding method methodDisplays are confusing or hard Messages conveyed by signs lead to errors because of Ensure the message is consistent
to understand confusion or illegibility Ensure the information meets the Directional signs confusing because of their location or objectives of the task
design Test the message for understanding Control activation difficult to detect and interpret, such as before implementing
the activation of electrical breakers might not be Keep the message simpleobvious visually
The messages that accompany symbolic displays might not be clear or consistent
Symbolic displays (e.g., pump designations on process control screens) might not be consistent from one application to the next
Ch08qxd 11/1/03 4:23 PM Page 344
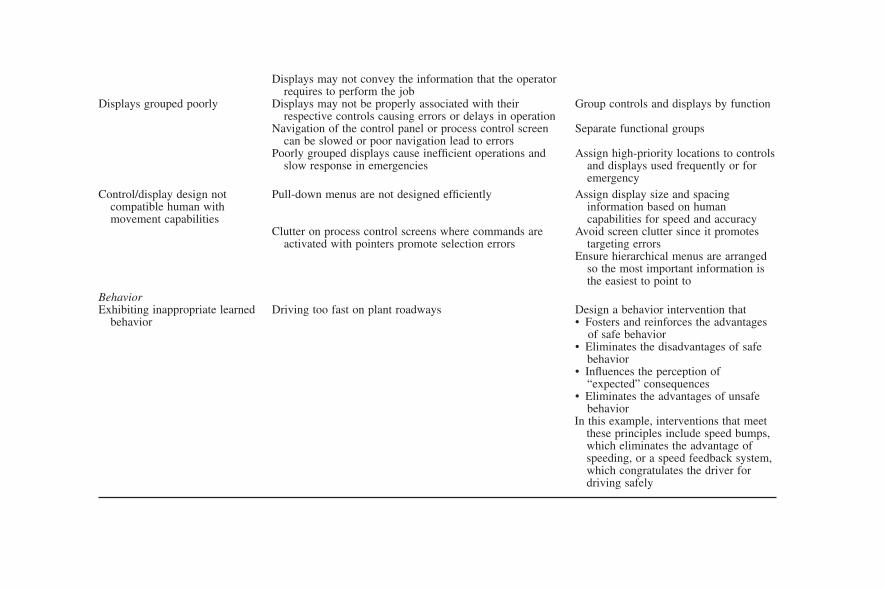
Displays may not convey the information that the operator requires to perform the job
Displays grouped poorly Displays may not be properly associated with their Group controls and displays by functionrespective controls causing errors or delays in operation
Navigation of the control panel or process control screen Separate functional groupscan be slowed or poor navigation lead to errors
Poorly grouped displays cause inefficient operations and Assign high-priority locations to controls slow response in emergencies and displays used frequently or for
emergencyControl/display design not Pull-down menus are not designed efficiently Assign display size and spacing
compatible human with information based on human movement capabilities capabilities for speed and accuracy
Clutter on process control screens where commands are Avoid screen clutter since it promotes activated with pointers promote selection errors targeting errors
Ensure hierarchical menus are arranged so the most important information is the easiest to point to
BehaviorExhibiting inappropriate learned Driving too fast on plant roadways Design a behavior intervention that
behavior • Fosters and reinforces the advantages of safe behavior
• Eliminates the disadvantages of safe behavior
• Influences the perception of “expected” consequences
• Eliminates the advantages of unsafe behavior
In this example, interventions that meet these principles include speed bumps, which eliminates the advantage of speeding, or a speed feedback system, which congratulates the driver for driving safely
Ch08qxd 11/1/03 4:23 PM Page 345
346 Information Processing346 Information Processing346 Information Processing
operator may be bombarded with so much information that all of it maybe filtered out, including the important item that should demand attention.In these situations, the error is caused when the operator does not attendto the task at hand. The solution may be to provide redundant reminders.For critical situations, such as ensuring that valves are closed or fusespulled, use duplicate checks by fellow workers, and/or prioritize infor-mation that needs immediate attention, such as, restricting alarms to con-ditions that require operator action.
Failure in the operation of short- and long-term memory can also leadto error. Short-term memory suffers from two inadequacies: lack ofstorage capacity and sensitivity to distraction. Operators may thereforeforget verbal communications or remember them incorrectly. In situationswhere the operator is required to remember items for later action, the itemsshould be written and not verbal. Long-term memory, while exhibiting anincredible ability to remember items from years past, may not recall themaccurately. As a result, operators make errors of omission, commission,or sequence. The solution is to provide operators with memory assistancein the form of checklists or pull-down or pop-up menus.
A final problem with higher mental processes is that the demands ofthe system can exceed the information processing capacity of operators.In these situations, the operator’s responses to information slow down, orin an attempt to maintain speed of response, the operator makes errors.Either way, the system is compromised. The solutions include offloadingthe information processing requirements from the operator to the systemor simplifying the way in which the information is presented to the operator.
8.1.4 Display Errors
The way we present information to the operator can determine how heor she acts on it. Coding that is inconsistent from one system to anothercan confuse the operator into slowing his or her responses or mistakingone symbol for another. This is especially the case in process controlsystems, where symbology is common in screen design. Poor lighting orcontrast can affect the legibility of alphanumeric characters or symbols,
Ch08qxd 11/1/03 4:23 PM Page 346
Information Processing 347
thus increasing the potential for reading errors. Preventing poor legibilityrequires ensuring that the combination of background luminance, con-trast, and character size are designed for the particular task the operatorperforms.
Some displays may be confusing to the operator or hard to understand.This is especially true of signs whose message has not been designedaccording to commonly accepted principles (beginning the message withan active verb, keeping the message simple, and using bullets if themessage is long). Control and display labeling is another system that canbe improperly designed, causing the operator to respond incorrectly.Grouping controls and displays is an effective method of ensuring that theoperator properly associates his or her actions with the appropriate systemresponse. Improper grouping is a common cause of operator error and oneof the easiest to eliminate during design. Finally, clutter on display panelsand process control screens can cause confusion and promote operatorselection errors.
8.1.5 Environmental Causes
Higher mental processes are affected by extremes in most environ-mental variables. Extremes in temperature and relative humidity, forexample, can reduce operators’ attention to information and affect thespeed and accuracy of their responses. Potential interventions includelocal air conditioning, such as in crane cabs or vehicles, or reducing theneed for operator attention and decision making in extreme environments.
8.1.6 System Factors That Lead to Error
Fatigue affects the operator’s ability to make decisions in much thesame way as extreme temperatures. Fatigue is often the result of inade-quate sleep caused by poorly designed work schedules. We know, forexample, that sleep debt can build from excessive numbers of back-to-back night shifts or when day shifts start too early in the morning. (See
Ch08qxd 11/1/03 4:23 PM Page 347
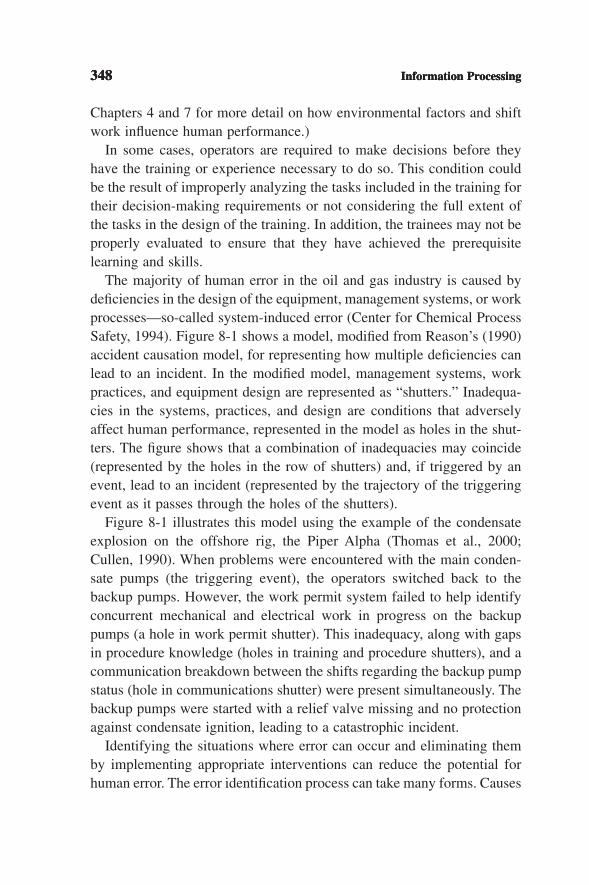
348 Information Processing
Chapters 4 and 7 for more detail on how environmental factors and shiftwork influence human performance.)
In some cases, operators are required to make decisions before theyhave the training or experience necessary to do so. This condition couldbe the result of improperly analyzing the tasks included in the training fortheir decision-making requirements or not considering the full extent ofthe tasks in the design of the training. In addition, the trainees may not beproperly evaluated to ensure that they have achieved the prerequisitelearning and skills.
The majority of human error in the oil and gas industry is caused bydeficiencies in the design of the equipment, management systems, or workprocesses—so-called system-induced error (Center for Chemical ProcessSafety, 1994). Figure 8-1 shows a model, modified from Reason’s (1990)accident causation model, for representing how multiple deficiencies canlead to an incident. In the modified model, management systems, workpractices, and equipment design are represented as “shutters.” Inadequa-cies in the systems, practices, and design are conditions that adverselyaffect human performance, represented in the model as holes in the shut-ters. The figure shows that a combination of inadequacies may coincide(represented by the holes in the row of shutters) and, if triggered by anevent, lead to an incident (represented by the trajectory of the triggeringevent as it passes through the holes of the shutters).
Figure 8-1 illustrates this model using the example of the condensateexplosion on the offshore rig, the Piper Alpha (Thomas et al., 2000;Cullen, 1990). When problems were encountered with the main conden-sate pumps (the triggering event), the operators switched back to thebackup pumps. However, the work permit system failed to help identifyconcurrent mechanical and electrical work in progress on the backuppumps (a hole in work permit shutter). This inadequacy, along with gapsin procedure knowledge (holes in training and procedure shutters), and acommunication breakdown between the shifts regarding the backup pumpstatus (hole in communications shutter) were present simultaneously. Thebackup pumps were started with a relief valve missing and no protectionagainst condensate ignition, leading to a catastrophic incident.
Identifying the situations where error can occur and eliminating themby implementing appropriate interventions can reduce the potential forhuman error. The error identification process can take many forms. Causes
348 Information Processing348 Information Processing
Ch08qxd 11/1/03 4:23 PM Page 348
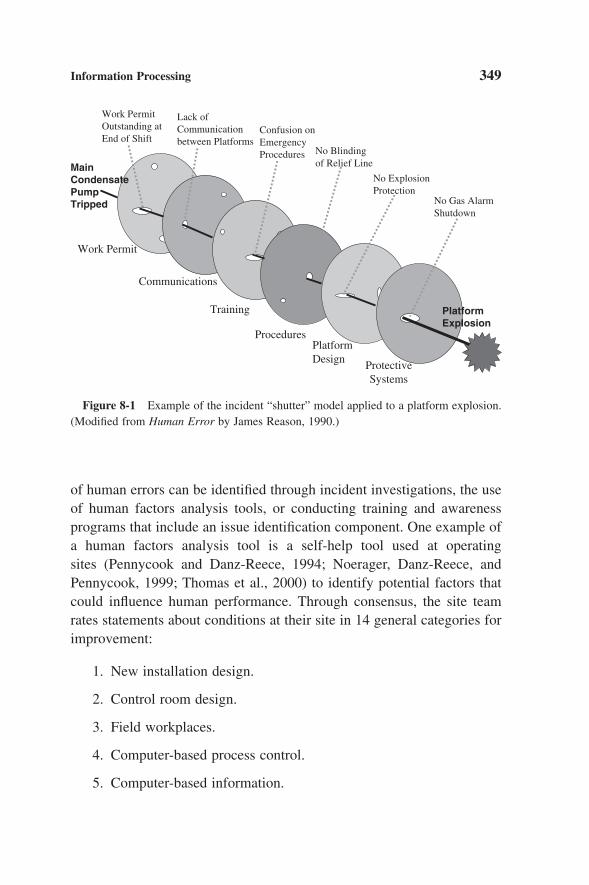
Information Processing 349
of human errors can be identified through incident investigations, the useof human factors analysis tools, or conducting training and awareness programs that include an issue identification component. One example ofa human factors analysis tool is a self-help tool used at operating sites (Pennycook and Danz-Reece, 1994; Noerager, Danz-Reece, and Pennycook, 1999; Thomas et al., 2000) to identify potential factors thatcould influence human performance. Through consensus, the site teamrates statements about conditions at their site in 14 general categories forimprovement:
1. New installation design.
2. Control room design.
3. Field workplaces.
4. Computer-based process control.
5. Computer-based information.
Work Permit
Communications
Training
No Explosion Protection
No Blinding of Relief Line
No Gas Alarm Shutdown
Work Permit Outstanding at End of Shift
Lack of Communication between Platforms
Confusion on Emergency Procedures
ProceduresPlatform Design Protective
Systems
Main Condensate Pump Tripped
Platform Explosion
Figure 8-1 Example of the incident “shutter” model applied to a platform explosion.(Modified from Human Error by James Reason, 1990.)
Ch08qxd 11/1/03 4:23 PM Page 349

350 Information Processing
6. Job design and work planning.
7. Procedures.
8. Training.
9. Work group support.
10. Shift schedules.
11. Communication structure.
12. Employee involvement and feedback.
13. Safe work practices.
14. Reporting near misses.
The tool provides input on opportunities for improvement, based on theteam priority ratings of aspects of the 14 categories. This tool was alsoused to help complete the human factors checklist for the safety case revi-sion required every 3 years for U.K. offshore operations (U.K. Health andSafety Executive, 1999; Exxon Mobil, 2001).
Interventions are as diverse as the problems identified. They can includethe redesign of operating equipment, software, work processes, and pro-cedures or the implementation of a behavior-based safety program. It isessential that the introduction of a human error program be coordinatedwith other programs within the organization. The kernel of any humanfactors program is the company’s management systems responsible forsafety, health, productivity, and loss control. Each must be updated toreflect the importance of reducing human error, and each must be visiblysupported at the highest levels of the organization.
This chapter includes the following information that is important toconsider for preventing human error: plant signs and labels, operations,maintenance and emergency procedures, and skills and knowledge training.
8.2 PLANT SIGNS AND LABELS
Labels and signs are integral to operations in that they remind opera-tors of the identity of equipment and key information, such as procedures
350 Information Processing350 Information Processing
Ch08qxd 11/1/03 4:23 PM Page 350

Information Processing 351
or directions. Kletz (1998) refers to equipment labels as a type of personalprotective equipment (PPE), meaning that they are an important featurefor safety. To help prevent errors, it is critical that plant labels and signsbe accurate, complete, consistent, meaningful, and legible. A label iden-tifies plant equipment, components, or areas. A sign contains a message,such as simple instructions, procedural reminders, personal protectiveequipment requirements, or hazard information.
8.2.1 Equipment Labeling Program
A labeling program can ensure that labels and signs minimize the poten-tial for error in processing information during operations and mainte-nance. To implement an equipment labeling program, follow these steps(U.S. Department of Energy, 1993):
1. Identify all equipment, components, and piping that require labelingfor example:CabinetsCircuit BreakersElectrical BussesElectrical Distribution and Lighting PanelsEmergency Equipment
Eyewash StationsFire Alarm Stations
Equipment ComponentsMotorsValvesPumpsEtc.
Equipment Systems and Subsystems (emergency generator, heatingand air conditioning, etc)
Exits, Evacuation RoutesFacility Location Codes (buildings, units, floor/elevation, columns/
rows)First Aid EquipmentFloor DrainsFluid and Gas Lines (piping, ventilation ducts, etc.)
Ch08qxd 11/1/03 4:23 PM Page 351

352 Information Processing
Fire Protection Systems and EquipmentFuse Blocks or Fuse LocationsGauges, Meters, and IndicatorsMotor Control CentersProtective EquipmentRoom Doors (list major equipment inside hazardous or radiation
areas)Safety DevicesStorage Containers/Rooms/SpacesTest Equipment, Special Tools
2. Check that the labels meet regulatory requirements.
3. Review procedures and check that the content of labels (e.g., names,abbreviations, and identification codes of equipment, components,plant areas, and systems) is consistent with other labels in the plantand those cross-referenced in procedures or control system displays.
4. Ensure that labels are in good condition. Ensure that the label mate-rial and the means of attachment are compatible with the compo-nents and environment where they are used.
5. Review that labels are properly placed and oriented to enhance read-ability and component.
6. Verify that labels are accurate.
7. Establish procedures to replace lost or damaged labels and acquirenew labels when needed.
8. Create lists of abbreviations for the labeling program to ensure thatabbreviations used on labels for systems and components are consistent with other site documentation, such as procedures or computer displays.
8.2.2 Designing Signs and Labels
The design of the sign or label influences how a person processes theinformation it contains. When designing the sign or label, consider the
352 Information Processing352 Information Processing
Ch08qxd 11/1/03 4:23 PM Page 352
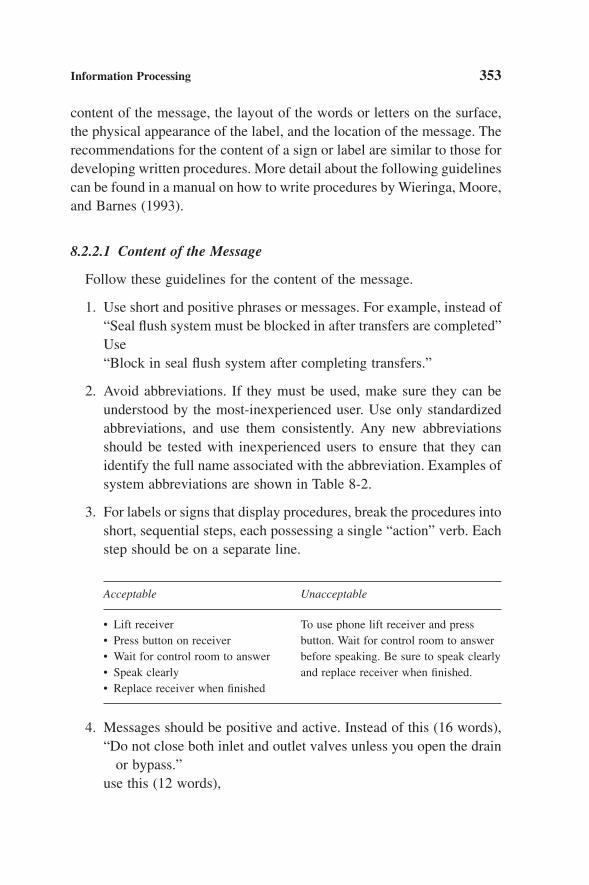
Information Processing 353
content of the message, the layout of the words or letters on the surface,the physical appearance of the label, and the location of the message. Therecommendations for the content of a sign or label are similar to those fordeveloping written procedures. More detail about the following guidelinescan be found in a manual on how to write procedures by Wieringa, Moore,and Barnes (1993).
8.2.2.1 Content of the Message
Follow these guidelines for the content of the message.
1. Use short and positive phrases or messages. For example, instead of“Seal flush system must be blocked in after transfers are completed”Use“Block in seal flush system after completing transfers.”
2. Avoid abbreviations. If they must be used, make sure they can beunderstood by the most-inexperienced user. Use only standardizedabbreviations, and use them consistently. Any new abbreviationsshould be tested with inexperienced users to ensure that they canidentify the full name associated with the abbreviation. Examples ofsystem abbreviations are shown in Table 8-2.
3. For labels or signs that display procedures, break the procedures intoshort, sequential steps, each possessing a single “action” verb. Eachstep should be on a separate line.
Acceptable Unacceptable
• Lift receiver To use phone lift receiver and press• Press button on receiver button. Wait for control room to answer• Wait for control room to answer before speaking. Be sure to speak clearly• Speak clearly and replace receiver when finished.• Replace receiver when finished
4. Messages should be positive and active. Instead of this (16 words),“Do not close both inlet and outlet valves unless you open the drain
or bypass.”use this (12 words),
Ch08qxd 11/1/03 4:23 PM Page 353

354 Information Processing354 Information Processing
“Open drain or small bypass before closing both inlet and outletvalves.”
5. Use symbols that users expect to see. Symbol signs should includea written message, if possible. Use familiar or standard symbols, ifthey already exist. New symbols should be tested with the operatorsto ensure that they understand them and the meaning of the symbolis intuitive to the viewer of the message. For a well designed symbol,at least 80% of those who see the symbol should be able to quickly,confidently, and correctly describe what the symbol means; that is,the symbol has the meaning they expect it to have. Symbols and pictographs are especially recommended for sites where multiplelanguages are spoken.
8.2.2.2 Laying out the Message
Many messages are often displayed on surfaces of limited size, dictatedby the size of small equipment and components (e.g., width of instrument
354 Information Processing
TABLE 8-2
Abbreviations for Plant Systems (DOE, 1993)
Arranged by System Name Arranged by CodeSystem Name Code Code System Name
Air, compressed CA CA Air, compressed
Air, instrument IA CW Water, cooling
Electrical, low voltage ELLV ELLV Electrical, low voltage(<240 V) (<240 V)
Electrical, medium-voltage ELMV ELMV Electrical, medium voltage(>240 V, <4.16 kV) (>240 V, <4.16 kV)
Heating, ventilation, and air HVAC HPS Steam, high pressureconditioning
Steam, high pressure HPS HVAC Heating, ventilation, and airconditioning
Waste, sanitary SWR IA Air, instrument
Water, cooling CW SWR Waste, sanitary
Source: U.S. Department of Energy (1993).
Ch08qxd 11/1/03 4:23 PM Page 354

Information Processing 355
lines and small piping, buttons, and levers within an instrument case).There may be a temptation to squeeze the message onto the surface of labelby rotating the text or writing the text around corners of the label. Thismakes the text difficult to read and could cause an error. All text should be oriented so that it can be viewed horizontally. Longer messages, such as instructions with multiple lines should be displayed on numberedlines and left justified. Shorter messages should be centered on the labelor sign.
8.2.2.3 Appearance of the Characters
The style and size of the individual characters influence how legible themessage is to the reader. If the message is more than three words, thenthe characters should be portrayed in mixed upper- and lowercase, i.e.,capital and small letters. The characters should be written in simple andclear typeface, and the use of the italic typeface style should be minimizedbecause it is difficult to read under suboptimal environmental conditions.The use of underlining for emphasis should also be minimized, if used at all.
8.2.2.4 Placement of the Sign or Label
To benefit from the content of a message on a label or sign, people mustsee the message. Therefore, the label or sign must be in the line of sightfrom where people stand if they work in the area. If a label or sign isplaced out of the field of view, then it is likely that the label or sign wouldnot be seen during a visual scan of the area and critical information con-tained on the sign may be missed. The sign or label should be clearlyvisible and unobstructed by equipment or shadows. The sign or label mustbe visible to all personnel; those that are very tall as well as those that arevery short in height. It should be obvious to what equipment or area thesign or label refers. If needed, duplicate labels can be used, such as label-ing both the equipment switches and the removable panel that covers themor when areas can be approached by personnel from more than one direc-tion or path. Table 8-3 gives examples of typical features that decrease thevisibility of characters on a posted sign or label.
Ch08qxd 11/1/03 4:23 PM Page 355

356 Information Processing356 Information Processing
TABLE 8-3
Features That Decrease the Visibility of Signs and Labels
Feature Example
Character height The appropriate height of a character is determined by the too small distance from which it will be viewed. The appropriate
minimum character height for a sign that must viewed from10 ft (3 m) is a minimum of 0.6 in. (1.6 cm). The rule ofthumb is to divide the viewing distance by 200 to calculatethe character height. However, the character may have to belarger to account for poor viewing conditions, such as dimlight; if so, then divide the viewing distance by 120 tocalculate the character height.
Inappropriate Use only simple character styles. Italics should never be used in character style labels and signs posted around the site because italicized
characters are difficult to read.
Poor color contrast Select color combinations that have good contrast and correspond to the site color code (e.g., red background or borders for warnings). Recommended combinations follow, according to the legibility in white light (Eastman Kodak Company, 1987):Very good: Black on white
White on blackGood: Yellow on black
Dark blue on whiteFair: Red on white Green on white
Red on yellow Black on yellow
Incorrect use of Write instructional or informational signs that contain more than upper- and three lines of text in mixed upper- and lowercase.lowercase Use uppercase (all capital letters) for labels such as equipment
identifiers.
Poorly lit or in Viewing displays under dim light reduces the color contrast, shadow resulting in decreased visibility of the characters. Colors (and
therefore the characters) are washed out by glare or lighting that is too bright.
Lighting should be improved so that displays designed with appropriate character sizes and colors are clearly visible under day and night viewing conditions. For example, ensure exit routes clearly identifiable in both day and night operations.
356 Information Processing
Ch08qxd 11/1/03 4:23 PM Page 356

Information Processing 357
8.2.3 Guidelines for Specific Types of Signs and Labels
The following guidelines apply to specific types of signs and labelsfound in a petrochemical plant.
8.2.3.1 Pipe Labeling (U.S. Department of Energy, 1993)
• Content should be identified with human-readable labels, such as“Acid Gas” not “MTG-601.”
• Orient text horizontally so it is read from left to right. If text must beplaced vertically, orient it to be read from top to bottom.
• Indicate flow direction with arrows that point away from the textidentifying the contents.
• Color must be supplemented with text labels (such as text label withred colored text indicating flammable substance).
• When two or more pipes lay side by side, position labels at samepoint.
• Locations to label a pipe: intervals along the pipe, at a pipe rack inter-section, where the pipe passes through a wall, and at road crossings.
8.2.3.2 Electrical Wire and Cables Labeling
• Use durable materials.
• Labels should be written with ink that is waterproof, smear resistant,and impervious to solvents.
8.2.3.3 Equipment Labels
• Provide only necessary information on the label.
• Ensure labels are consistent and understandable.
• Use durable materials.
• Locate for visibility.
357
Ch08qxd 11/1/03 4:23 PM Page 357

358 Information Processing
• Provide two pieces of information: functional description and equip-ment identification (tag) number (corresponding to the process andinstrument diagram numbers). The functional description should bespecific to the component and “human readable”; that is, not only aseries of alphanumeric characters. The functional description shouldbe placed above the equipment identification number. For example,
Glycol Reboiler Steam IsolationN350-05
• If sets of equipment are identical but on separate process trains,emphasize the difference in the code and on the label. For example,
Train 1Glycol Reboiler Steam IsolationN350-1-05
Train 2Glycol Reboiler Steam IsolationS350-2-06
8.2.3.4 Equipment Signs
• Provide information for safety and performance of critical equipment.
• Keep information short and simple.
• Use illustrations or schematics to clarify procedures.
• Utilize procedure design principles to create the signs. Outline theprocedure with simple sentences and number each sentence. Leftjustify the sentences. For nonprocedural information, use line spacesor indentation to break up or separate the information.
• Mount the sign to enable the operator to view it from the positionwhere the work is performed. The sign should be in a position so thatthe person looks directly at it while using the equipment or while con-trolling or monitoring the equipment.
358 Information Processing358 Information Processing
Ch08qxd 11/1/03 4:23 PM Page 358
Information Processing 359
8.2.3.5 Sampling Points
• Label sample bottle connections.
• If the sampling sequence is complex, provide a graphic schematic thatexplains the steps with labels that match posted labels in the plant.
8.2.3.6 Information Signs
Information signs are those that give emergency or critical information,such as regulatory information.
• For critical information, display the message redundantly; that is, usetwo types of coding to convey the importance of the message. Forexample, use combinations of text, symbols, and color to convey themessage.
• Information signs usually have signal words, such as First Aid,Lifeboats, How to shut down this mixer. The signal words should becentered and in capital letters. The phrases that follow the signalwords should be left-justified and typed in mixed-case letters. Again,use procedures design recommendations for longer instructions, andif symbols are used, use only symbols that are readily recognizableby the plant personnel.
• The number of signs needed and location for each sign is determinedby the position of the worker in the plant area and the approachesthat the worker would take in getting to the area. Provide as manyduplicate signs as there are directions of approach. Mount signs atbetween 51 and 63 in. (0.13 and 0.16m) above the floor.
• Mount directional signs in well-traveled aisles and areas.
8.2.3.7 Hazard Signs
Hazard signs must include a signal word, such as DANGER orCAUTION, and a brief description of the hazard, such as hot surface ormakes wide right turns. Although the signal words Danger, Caution, andWarning may intend to mean three levels of hazard, studies show that
Ch08qxd 11/1/03 4:23 PM Page 359

360 Information Processing
many people do not distinguish Caution from Warning (Rogers, Lamson,and Rousseau, 2000). Hazard sign format and content may be regulated,as by the U.S. OSHA, and if so these regulations supercede the follow-ing recommendations:
• Hazard signs may also include a description on how to prevent thehazard from occurring, such as “don’t follow at less than 40 feet,”“or hearing protection required.”
• Hazard signs may also describe the consequences of the hazard, “maycause explosion” or “may cause skin burns.” Text messages shouldbe structured into short, concise statements using active verbs.
• Locate the signal words in the uppermost portion of the sign. A hazardsign should contain the signal words, a description of the hazard, adescription of the possible consequences that could happen if thehazard is not heeded, and instructions on how to avoid the hazard(Sanders and McCormick, 1993). The recommended layout for ahazard sign is
SIGNAL WORDSHazard DescriptionConsequences, Preventative Measures
• The text on a hazard sign should be a bold sans serif font. The signalwords should be in capital letters twice the height of the remainingtext. The signal words should be readable in suboptimal conditionsfrom at least 5 ft (1.5m). All text should be human readable. Codesshould not be used in place of text.
• Ensure symbol use is consistent and understandable. Signs that maybe read by multilingual or illiterate persons should use symbols inaddition to written text. DANGER and CAUTION signs should alsouse symbols as well as written text.
• Colors must be used consistently. For example in the United StatesOSHA requires that the word DANGER be capitalized in white on ared oval background, and the remaining nonsignal words be black ona white background. Caution signs should have the signal word in
360 Information Processing360 Information Processing
Ch08qxd 11/1/03 4:23 PM Page 360

Information Processing 361
yellow letters on a black rectangular background, with the remainingnonsignal text in black letters on a yellow background.
• Hazard signs should be made of durable materials and mounted forvisibility.
8.3 PROCEDURES
Procedures are a core part of every process operation. There are threetypes of procedures: operating, emergency, and maintenance. Operat-ing procedures are written, step-by-step instructions and associated information (cautions, warnings, notes, etc.) for safely performing a taskwithin operating limits. Emergency operating procedures are writteninstructions that address actions to place a process in a safe, stable modefollowing a system upset. Maintenance procedures are written instructionsthat address practices needed to ensure system operability and integrity aswell as maintenance, testing, and inspection frequency.
Procedures are important because they provide rules to be followed and standardized records of safe and approved operations and mainte-nance practices. They provide consistent information across the plant andhelp minimize guesswork, leading to more efficient and safe operations.Certain aspects of procedures may be locally regulated. For example, theU.S. OSHA 29CFR 1910.119 regulation on the Process Safety Manage-ment of Highly Hazardous Chemicals requires that all safety critical workmust have procedures that specify
• Steps for each operating phase including initial start-up, normal oper-ations, temporary operations, emergency shutdown, normal shutdownand start-up following a turnaround or after an emergency shutdown;
• Consensus deviation from operating limits, and steps required toaddress deviations; and
• Safety and health considerations of: chemical hazards, precautions toprevent exposure, quality control of raw materials, and hazardouschemical inventory controls.
In addition, the 1910.119 regulation requires that the procedures beclearly written and accurate, include process safety information, be readily
Ch08qxd 11/1/03 4:23 PM Page 361

362 Information Processing362 Information Processing
accessible to workers, and be kept current. This regulation also requiressafe work practices for lockout/tagout, opening process equipment, andcontrol of entrance into a facility.
Effective procedures are usually the single most important tool forimproving safety, reducing environmental impact, and ensuring productquality. However, studies of major accidents in the nuclear industry showthat 60% of incidents related to human performance were due to ineffec-tive, incorrect, or lack of an appropriate procedure (Reason, 1998). Dis-cussions with petrochemical plant operators about why procedures maynot be followed indicate a variety of reasons implicating the nature of theprocedures: the procedures were not available or readily accessible, theyconflict with actual operations, they are outdated, or they are confusing.There are also reasons that implicate the operators’ behaviors; forexample, the operators are in a hurry, they are used to doing the job the“old” way, they feel they are too experienced to refer to a procedure, theyfeel it is acceptable to deviate from a procedure, or they are unaware thata procedure exists. These are barriers to achieving use of procedures andmust be identified and overcome to achieve compliance with procedures.
The design and access to electronic documents are as critical as the designand access to paper procedures. Electronic documentation can ensure that the most current version of a procedure is available. Maintaining hardcopies of the latest procedures in binders is difficult and may result in olderprocedures being used inadvertently. The guiding principle behind each procedure and the ultimate goal of all procedures is to increase human per-formance and reliability while reducing human error. Opportunities toimprove procedures to reduce human error associated with proceduresinclude determining when a procedure is needed, developing the procedure,determining why procedures may not be used, and evaluating the procedure.
8.3.1 Guidelines for Determining When a Procedure Is Needed
Procedures may be regulated (e.g., as described (previously) and if so,regulations supersede the following recommendations. A clearly definedprocess that identifies the tasks that need procedures should be in place.Haas (1999) recommends that the need for procedures is best determinedby (1) complexity of the tasks, (2) the frequency that the tasks are exe-cuted, and (3) the consequences of possible errors made while executingthe job tasks. Tasks with high complexity have nine or more procedural
362 Information Processing
Ch08qxd 11/1/03 4:23 PM Page 362

Information Processing 363
steps and require mental calculations and quick decisions. Tasks with lowcomplexity are simple and require fewer than five steps. Frequent tasksare performed at least once per week, and infrequent tasks are performedless than once per month.
Procedures are needed if the task is undertaken infrequently, is rela-tively complex, and poses at least a moderate consequence of error. Forcritical tasks, the procedure may include a checklist or “check-off” of keyprocedural steps. Reference procedures should be available if the task isrelatively infrequent, of moderate complexity, and the consequences aremoderate. In this case, the operator should have the option of reviewingthe reference documents or referring to the written procedure before performing the procedure. If the procedure is performed frequently, is notcomplex, and errors are not of significant consequence, then written pro-cedures may not be needed. These guidelines are summarized in Table 8-4, based on the framework by Haas (1999).
8.3.2 Developing Procedures
The method of developing the procedures should ensure that the procedurereflects how the work is done. The users of the procedures should participate
TABLE 8-4
Guidelines for When a Procedure Is Needed
Procedure, Checklist, Procedure Procedure NotTask or Sign-off Steps Available for Needed, Learned Characteristic Needed Reference or Review in Training
Severity of Moderate to high Moderate (some Low (no impact onconsequence if (e.g., injury, process impact on process process or error is made delay, equipment or safety) safety)
damage)
Complexity Moderate to high Moderate (5 to 9 Simple (less than 5(more than 9 procedure steps) steps)procedure steps,quick decisions)
Frequency Infrequent (less than Infrequent to Very frequent once per month) to frequent (multiple times frequent (weekly) per week)
Ch08qxd 11/1/03 4:23 PM Page 363

364 Information Processing364 Information Processing
in developing them. To effectively develop procedures, the developers needtraining on how to develop procedures, and the effectiveness of the trainingshould be verified by assessing the procedures that are developed.
Users should be able to readily identify the procedure for the job, and theprocedures should be available at convenient locations. A change processshould be implemented to track procedures that need modification andupdates.
8.3.3 Formatting Written Procedures
A good format of the procedures supports the operator using them andhelps prevent errors. One source of detailed information is a guide onwriting procedures for nuclear power plant operations (Wieringa et al.,1993). The site should have a style guide that specifies the format of theprocedures so that they are styled consistently. Important aspects of pro-cedure format to address in the style guide include
• The format of the procedure should emphasize the steps required toexecute the procedure. A narrative style format (consisting of full sentences in prose style similar to how this book is written) is inappro-priate for written procedures. A columnar format that clearly showsdistinct procedural steps, or groups of steps related to a subtask, is rec-ommended. An example of this format is shown in the end of thischapter case study on how to write a procedure to change a tire.
• A flowchart or decision tree diagram format is useful for proceduresthat guide troubleshooting.
• Each step in a procedure should be an action described concisely.
• Warnings should be clearly distinguished in the text and must bewritten before the step with which they are associated.
• Notes for supplemental information should be clearly distinguishablefrom the procedural action steps.
• Simpler is usually better: Use sans serif fonts and, for emphasis, useeither bold or underline style but not italics. Italics can be difficult toread in situations such as low light or shadowy areas.
364 Information Processing
Ch08qxd 11/1/03 4:23 PM Page 364

Information Processing 365
• Use 12 point font size for procedures in a book or electronic manage-ment system. If the procedure is posted as a sign or viewed from a dis-tance, follow the guidelines for character size found in section 8.2 ofthis chapter to ensure that the characters are readable from a distance.
• Use a simple numbering scheme—two levels are usually sufficient,such as
(1)(1.1)(1.2)
But three levels could be used for complex procedures:(2)
(2.1)(2.1.1)
• Each page should contain the procedure identification; that is, title,number, revision or version, date, and page number.
• Consider including job aids with the procedure, which can be pulledfor reference and used by the operator out in the plant; for example,checklists, look-up tables, troubleshooting flowchart, or diagrams.
8.3.4 Determining Why a Procedure Was Not Used
An indicator that procedures are well implemented is that employeesroutinely follow the procedures as they are written. If procedures are notused, then there should be a process to consider why they are not used.This process is similar to an incident investigation process that searchesfor a root cause by asking “why” in a series of questions.
The questions to ask to determine why a procedure was not used include
• Do conditions in the workplace ensure that procedures can be carriedout?
• Is the equipment necessary to comply with procedures readily available?
• Do users routinely follow written procedures (irrespective of skill andexperience)?
Ch08qxd 11/1/03 4:23 PM Page 365

366 Information Processing
• Are workers instructed on when to use procedures and how?
• Is enough time available to perform the task according to the procedures?
• Are the written procedures out of date?
• Does the employee feel that his or her method is better, safer, orfaster?
• Does the employee understand the consequences of deviating fromthe procedure?
• Does the culture support “hurry up” or “cutting corners”?
• Does the culture support taking additional risk at the expense of fol-lowing procedures?
• Has the example of not following procedures been set by the unitsupervisor?
• Was the employee rewarded for deviating from procedure?
If the answer to any of these questions is yes, then the improvements inthe procedures management system or other management systems, suchas training or safety, may be needed.
8.3.5 Evaluating Written Procedures
Procedures can be evaluated with one or a combination of a fewmethods: observing operators perform the procedure, evaluating thewritten procedure with a checklist, or conducting a hazard analysis. One way is to observe multiple operators performing the procedure andcompare the way they perform the procedure to the documented proce-dure to uncover deviations. Then, the operators can be interviewed withthe preceding “why” questions to determine the cause of the deviationsand help identify if the procedure, operators’ behaviors, or managementsystems require improvements.
In addition to this observation, the written procedure should be evalu-ated based on the following criteria:
366 Information Processing366 Information Processing
Ch08qxd 11/1/03 4:23 PM Page 366

Information Processing 367
• Success in directing the users to accomplish the objective.
• User-friendliness.
• Accuracy.
• Conformation to appropriate standards.
• Consistency in format and layout so users can quickly find information.
• Appropriate level of detail.
• Reference to equipment labels, identification, or names that accu-rately correspond with actual hardware and other documentation.
The checklist in the Appendix contains the detailed questions that can beused to evaluate written procedures.
8.4 TRAINING
Training is a primary source of information for employees to improvetheir job skills. The effectiveness of the training, along with practice, canhelp reduce errors by building the employee’s expertise on how to executeprocedures. The objective of every training program should be to maxi-mize skills and knowledge and achieve consistency in how procedures aredone, while minimizing the time that the trainees require for learning theskills, knowledge, and procedures. Many good books, manuals, andexperts are available on how to develop training and how to manage train-ing systems (e.g., Goldstein, 1993). This section offers some highlightsfrom a human factors perspective on training aspects that can help reducethe potential for human error.
An effective training system employs human factors principles thatensure the training program is relevant to the tasks performed, providesworkers with meaningful skills and knowledge, and measures trainingeffectiveness. Without enough practice and skills training, workers areunable to progress from novice to expert performance.
Ch08qxd 11/13/03 3:50 PM Page 367

368 Information Processing368 Information Processing
Success!
2. Develop task criteria
3. Select candidates
4. Develop course objectives
1. Task Analysis
5. Develop test criteria
6. Develop training program•Content•Methods•Training aids•Instructors
7. Train candidates
8. Evaluate candidates
9. Evaluate training:was it effective?
Improveno
yes
Figure 8-2 Flowchart of annine-step training system.
8.4.1 Developing Training
An effective way to develop training is to follow these steps (illustratedin Figure 8-2).
1. Analyze the tasks that need to be learned.
2. Identify the knowledge and skills required to carry out the tasks.
3. Select candidates that need the training.
4. Develop course objectives.
5. Develop the test criteria that must be met to demonstrate the mate-rial has been learned.
368 Information Processing
Ch08qxd 11/1/03 4:23 PM Page 368
Information Processing 369
6. Develop training resources (content, methods, training aids, instructors).
7. Train candidates.
8. Evaluate candidates. (Give the trainees a test.)
9. Evaluate the training. Ask, Was the training effective? If not, retrainthe candidates, improve or redesign the training, or both.
Gordon (1994) describes phases for designing a training program: needsassessment and functional specification, design and development, thenevaluation. The needs assessment consists of acquiring information aboutthe needs of the training candidates, such as the types of tasks theyperform and the types of knowledge and skills they need to acquire toperform the tasks well. Based on this information, the functional designspecification is written. The functional design specification describes thegoals, scope, and content of the training program and the constraints, suchas resources and timing. This document guides development of the train-ing content and materials. Next, the training package is developed basedon the functional specification. The knowledge and skills targeted in thetraining are identified by analyzing the tasks that the employee mustperform. This helps the training program content be directly relevant tothe employee’s job tasks.
8.4.2 Task Analysis for Training Development
Task analysis is a complete assessment of the tasks (or potential tasks)performed by the employee as part of the job or duties under analysis.Task analyses done with the purpose of training development involvebreaking down a job into tasks and subtasks. In addition to providing abasis for the training content, there is also potential that task analyses canprovide insight on improvements in equipment, tools, or procedures thatcould improve employee performance of the task. If a task analysis is usedto develop the procedure, then this analysis can be built on for trainingby specifying the inputs and outputs of task activity and the conditionsfor performance. Inputs are what the worker needs to know to performthe task step, such as knowledge, skill with instruments, and procedure
Ch08qxd 11/1/03 4:23 PM Page 369

370 Information Processing
steps. The outputs are what the worker should achieve when executing thetask, such as complete the procedure to calibrate a recorder or remove andreplace a pump. Examples of conditions of performance are the time inwhich the person can do the task, number of errors, or accuracy in executing the procedure. More detail on how to do a task analysis is in Chapter 7.
Gordon (1994) recommends that a technique called cognitive taskanalysis be used to develop the content of the training for jobs whereworkers must make complex decisions and solve difficult problems, suchas the duties of a control room operator. Cognitive task analysis is usedto define the knowledge and concepts the employee must understand toperform a job (comprising multiple tasks and procedures). For example,control room operators should understand how one process variable influ-ences another and be trained to identify potential mistakes, consequencesof mistakes, and recovery points in the process.
8.4.3 Content of a Training Package
“Training” can consist of one or a combination of different tools thatfacilitate the learning process. There are basically two types of tools, thosethat support the trainer in teaching subject matter (e.g., courses, lectures,procedures documentation, manuals, videos, look-up tables) and those thatprovide hands-on experience (paper and pencil exercises, group problem-solving exercises, use of mock-up equipment, and task simulations) (Chapanis, 1996). Trainees need opportunities to apprentice; that is, applyclassroom training to actual operations. The training and proceduressystems should be closely linked. Training not only provides knowledgeabout procedures and when to use them but a knowledge foundation onwhich to base decisions and discretion, since it is not possible to coverevery situation with procedures, instructions, and rules (Kletz, 1991).Training programs should include the specific procedures used on the joband be cross-referenced to the current procedures as a basis for teachingthe methods and techniques to be used at the site. Training pace is impor-tant because information should be given in stages to avoid overloadingthe trainees with more information than they can assimilate and apply.Prototype training materials, such as job aids that support written proce-
370 Information Processing370 Information Processing
Ch08qxd 11/1/03 4:23 PM Page 370
Information Processing 371
dures, should be tested with a group of trainees to get their feedback andgauge the effect of the training on their skills and knowledge beforewidely rolling out the course or program (Gordon, 1994). In some cases,several alternative design concepts (e.g., computerized self-paced instruc-tion versus classroom lecture versus progressive workbook exercises)might be generated for preliminary testing and evaluation. Testing the pro-totype program on the users is the best way to obtain feedback, becausethe developer is probably too close to the program and cannot see thetraining from the learner’s perspective. Even if the training is relativelysimple, such as training on how to use a checklist, the training should betested for effectiveness.
8.4.4 Training for Trainers
Trainers should be taught how to train effectively and efficiently. Theyshould have relevant experience in the topic areas for which they are pro-viding the training. Trainers should be aware of cultural differences andhow to accomodate them, such as variations in willingness to ask ques-tions publicly. On-the-job or hands-on training should be conducted bypersonnel with relevant operational experience and a mentor or super-visor should observe the personnel doing the tasks to check their profi-ciency. The training should be consistent, even when different trainersdeliver the training.
8.4.5 When to Provide Training
Providing training in a timely fashion and providing workers the oppor-tunity to expand on their skill sets may help reduce the probability of ahuman error related to poorly timed training programs. The need for train-ing and the timing of training is critical when
• New employees lack the requisite knowledge and skills to perform ajob.
• Workers are failing to perform some aspect their job at a satisfactorylevel.
Ch08qxd 11/1/03 4:23 PM Page 371

372 Information Processing372 Information Processing
• A new job (or job task) has been created and no workers already knowhow to accomplish the job (or job task).
• New equipment or new procedures are introduced on site.
8.4.6 Evaluating Training
Many trainers solicit feedback from the trainees after a training sessionby asking if the training was useful, met its objectives, or if some areasneed improvement. Although this feedback is important, the effectivenessof training should also be objectively measured to identify aspects thatneed improvement (National Institute of Occupational Safety and Health,1988).
Aspects of the training system that should be evaluated are
• Relevance of the training to the work tasks performed.
• Effectiveness of the training materials.
• Measurement to determine if the training system meets its objec-tives—use of testing to confirm levels of competence defined by thetraining program or assessment of on-the-job use of skills and knowl-edge gained through training.
These techniques ensure that training programs are effective in teachingworkers the knowledge and skills they need on the job and help reduceerror.
8.5 VIGILANCE
Human performance is optimal when we are neither too busy nor toobored. Although the potential for work overload is a common concern,work underload can result in loss of attention and alertness, potentiallydamaging performance. Jobs with tasks that consist of monotonous,boring work are not only nonmotivating but may be associated with unre-liable performance. In these cases, the workload could be increased by
372 Information Processing
Ch08qxd 11/1/03 4:23 PM Page 372

Information Processing 373
supplementing or replacing monotonous tasks with other meaningful (pur-poseful) work tasks with appropriate skills requirements. Where possible,different tasks can be assigned to prevent boredom and create a changeof pace in activity to prevent fatigue due repetition. The goal is to maximize a worker’s involvement in the task where appropriate while preventing worker overload and underload.
Human perception allows us to cope with the wide range of inputs thatimpinge on our senses and discriminate among events. Our attentionfocuses on those stimuli that
• Are the largest in terms of intensity, size, and time, such as an alert-ing noise.
• Differ from background “noise,” or are novel, such as white lettersamong a screen full of green letters.
• Involve movement, such as flashing lights.
• Fulfill a need, such as preventing an injury.
• Are of particular interest to the individual, such as hearing one’s namein a conversation.
• Conform to expectancy.
Perceptual performance is determined by our ability to focus and main-tain attention on the incoming events. The ability to sustain attention is what we call vigilance. In vigilance tasks, attention is directed to one or more sources of information over long unbroken periods of timeto detect small changes in the information being presented (Davies andParasuraman, 1982). In the petrochemical industry, the types of tasks thatrequire sustained attention occur in transportation systems, control roomoperations, mining operations, and driving performance.
In some operations, sustained attention is critical. The differencebetween critical and important varies with the likelihood of an incidentoccurring and of the consequence, once it happens. Few would argue thatthe consequences of reduced attention are critical in chemical and refin-ing process operations, where reactions can quickly get out of hand andthe consequences can often bed catastrophic. Accidents during the
Ch08qxd 11/1/03 4:23 PM Page 373

374 Information Processing
transport of people and materials can also be life threatening and result insubstantial losses. In some cases, accidents can have severe third-partyliability, such as a gasoline truck rupture and explosion.
8.5.1 Transportation Systems
In transportation systems, the ability to sustain attention relies on manyinternal factors. Two of the most important determinants of vigilant behavior are the “circadian state” of the operator and the degree of sleepdeprivation (both discussed in Chapter 7).
Many researchers studied the effects of circadian rhythm and the lackof sleep on a person’s ability to perform in a vigilance-like situation.D’Amico, Kaufman, and Saxe (1986) employed a full-sized ship simula-tor to assess the ability of ship’s watchkeepers to detect other ships on acollision course with their own. The watches were conducted around theclock to examine the effects of time of day on performance. In addition,half the watchkeepers were deprived of sleep before going on watch.Results indicated that the time required to detect another ship on radarincreased with the time on watch. In addition, it was observed that thevigilance decrement was exaggerated among those watchkeepers whowere deprived of sleep.
In a similar study, Donderi (1994) observed the performance of watch-keepers during a visual detection task at sea. Watchkeepers on search andrescue vessels were required to detect life rafts tethered to buoys at fixedlocations within a 375 square nautical mile area of the coast of NovaScotia. The search task was performed both day and night. Results showedthat visual detection was better during the day than at night, as would beexpected. The results also showed that performance on both day and nightwatches exhibited the classic vigilance decrement by deteriorating afterthe first half-hour on watch.
8.5.2 Control Room Operations
As the complexity of automated systems increases, the function of the operator changes from an active controller to a passive monitor whodetects malfunctions or emergency conditions and executes decisions.
374 Information Processing374 Information Processing
Ch08qxd 11/1/03 4:23 PM Page 374

Information Processing 375
Failures of vigilance among process control operators may constitute an increasingly serious problem as control systems become more automated.
On the other hand, Wickens (1984) argues that the process control taskis not a typical vigilance task and identifies two characteristics of the process control operation that distinguish it from typical laboratoryvigilance paradigms:
1. In process control, the operator does not wait passively to detectprocess control system failures but is intermittently engaged incontrol adjustment activities and the like. These activities maintainat least a moderate level of arousal (alertness).
2. When a failure occurs, it is normally indicated by a visual or audi-tory alarm sufficiently intense to call attention to itself.
Failure alerting devices, such as alarms and annunciators, are designed tobe tolerant to system variations and not to trigger false alarms. So, theoperator is expected to monitor trends on process variables and possiblytake action before the alarm occurs. This, then, is the vigilance task facingthe operator. Process control displays need to be designed to assist thetrend detection requirements of operators. One way to improve trenddetection is to make the displays more unique and attention getting. Moray(1981) suggests changing the units of displays from absolute physicalunits to those scaled in terms of their probability of normal value. Whenall process variables are “normal,” each display looks the same. However,when a process variable trends stray out of limits, the display becomesdifferent from the others and draws the operator’s attention. In summary,one of the vigilance challenges in the control room is to design displaysthat attract operator attention to impending out-of-limit situations, withoutoverloading the operator with information. The degree of automation andthe trust engendered by the operator can determine the level of vigilance.A system that produces excessive false alarms can cause a voluntary vig-ilance decrement, whereby the operator pays less attention to what are feltto be unreliable signals. And, this reduces the probability of detecting realsystem faults. On the other hand, operators may place too much trust inthe capability of the automated systems. This false sense of security canlull the operator into complacency, so he or she does not make the needed
Ch08qxd 11/1/03 4:23 PM Page 375
376 Information Processing
checks. Danaher (1980) recounts an aviation incident where an air trafficcontroller noticed the potential intersection of two jetliners but elected totrust the ATC system to decide whether they would collide. As it turnedout, collision was avoided when another controller decided that collisionwas imminent and alerted the pilots.
8.5.3 Mining Operations
Inattention is a contributing factor in off-highway driving incidents.Hulbert, Dompe, and Eirls (1982) report that driver inattention is a majorcause of surface mining haulage truck accidents. They define inattentionas a “state of mind in which the driver is unable to respond properly toan unexpected situation or is unable to make steering corrections in timeto maintain his truck on the correct pathway.”
Surface haulage driving is not the only mining task that involves vigi-lance. Other tasks or occupations that required mine workers to maintainvigilance are tasks that are prolonged and continuous, lasting for 30minutes or more; tasks that tend to be boring and monotonous; and tasksthat are seldom disrupted.
Hudack and Duchon (1989) found that over one-third of the surfacemining jobs require extreme to high levels of vigilance to adequatelyperform the job. These include operating bulldozers, dragline and powershovels, forklifts, front-end loaders, haulage trucks, mill machines, andscrapers. These occupations employed about 51% of the approximately213,000 people who worked in U.S. surface mines in 1986.
Accident statistics reported for mining in 1986 showed that thoseemployed in high-vigilance occupations had twice the accident severitylevel as those in low-vigilance occupations. When the statistics were corrected by omitting those occurring during low-vigilance activities, theoccupations most involved with high-severity accidents are operators ofhaulage trucks, front-end loaders, and scrapers. Several reasons may con-tribute to this result, including unfamiliarity with repair and maintenanceroutines and overexposure to environmental stressors, such as noise andvibration.
376 Information Processing376 Information Processing
Ch08qxd 11/1/03 4:23 PM Page 376

Information Processing 377
8.5.4 Driving Performance
Driving tasks range from maneuvering forklift trucks within ware-houses to guiding 250 ton surface haulers at mine sites. To some extent,each of these driving tasks requires sustained attention to some conditionthat, without constant monitoring, can cause an incident.
In the United States, lapses in driver attention have been identified asa significant contributing factor in as many as 90% of traffic accidents(Bishop et al., 1985). Inattention in these cases has been broadly definedas an attention state where the driver fails to respond to a critical condi-tion. In 38% of all accidents, drivers failed to take any action. In many ofthese cases, the driver may not have taken action because of drowsiness,physical fatigue, drugs, or the like. But, when all the obvious causes areremoved, the data indicate that about 3% were truly due to inattention.
8.5.6 Factors Contributing to Vigilance Decrement
Several factors can contribute to the vigilance decrement: alcohol,drugs, stress, and environmental factors. Driving and industrial tasksrequire a number of essential skills, including sensory skills, motor ability, perception, and cognition. Research over the past half-century has shown that each of these skills is affected to some extent by alcoholintoxication.
Marijuana affects the functions of the human central nervous systemthat are important for performance in complex systems (Moskowitz,1985). Time estimation can be impaired as well as speed of reactions insituations involving complex information processing. Marijuana has alsobeen shown to affect the performance of drivers and machinery operators.In practical terms, the research suggests that, under the effects of mari-juana, operators of complex systems would likely miss critical signalsentirely or their responses would be delayed for an unacceptable periodof time.
Koelaga (1993) reviews 54 studies that investigated the effects of fourstimulant drugs—amphetamine, methylphenidate, caffeine, and nicotine—on vigilance performance. In general, caffeine and nicotine showed noeffects on performance. Consult the original paper for more details on prescription drugs.
Ch08qxd 11/1/03 4:23 PM Page 377

378 Information Processing
Koelega and Brinkman (1986) conducted a detailed review of the vigilance literature over the past 50 years, looking for results that woulddemonstrate an effect of moderate levels of noise on vigilance perform-ance. They concluded, based on the results from almost 100 studies, thatthe effects of noise were equivocal. Noise has been shown to have detrimental, beneficial, and no effects on vigilance performance. Whilemoderate levels of infrequent, irregular noise can benefit signal detectionperformance, high levels of noise may actually be detrimental (Landstrum,1990).
Ray (1991) suggests that exercise generally improves monitoring performance and recommends interjecting exercise breaks for personnelengaged in vigilance-like tasks, such as process control or inspection.
Based on a study of the effects of temperature on vigilance, Norin andWyon (1992), recommend that exercise may improve monitoring per-formance (i.e., delay the onset of the vigilance decrement), and climatecontrol systems in vehicles that travel as little as a half-hour without inter-ruption should be considered a safety requirement.
8.5.7 Operator Workload Analysis
Several factors contribute to operator workload: design of the displaysand alarms, dynamic process characteristics, fitness for duty, environ-mental factors, control room design, operator interaction with personnel,and operator training and experience (Connelly, 1995). Because of themany contributing factors, using the number of control loops alone is nota good indicator for determining the span of control and, therefore, alsois a poor basis for allocating operator workload. Studies show that meas-ures of mental workload (for example, subjective measures, such as oper-ator perception of difficulty, and performance measures, such as numberof control moves or alarms per hour) correlate poorly with the number ofcontrol loops (Connelly, 1995).
Operator workload can be analyzed with many methods, for example,those that involve the subjective ratings by the workers or measurementsof physiological indicators such as heart rate. One simple-to-use methodfor evaluating workload based on subjective ratings by the workers is theNASA Task Loading Index (TLX). Using this method, the operators rate
378 Information Processing378 Information Processing
Ch08qxd 11/1/03 4:23 PM Page 378

Information Processing 379
their work tasks on the six workload dimensions described in Table 8-5(Hart and Staveland, 1988; Weimer, 1995). The operators also estimatethe percentage of the shift they perform the tasks, and the ergonomist canalso measure the percentage of the shift that the tasks are performed bywork sampling or direct observation.
The analysis indicates the operators’ perceptions of their workload foreach task they rate and for each of the six workload dimensions over allof the tasks. Operator tasks for Units A and B in a plant are listed in Table8-6. An example of the overall TLX workload ratings for Unit A and UnitB operator tasks is shown in Figure 8-3.
This analysis indicates that operators of both units do not perceive theirtasks as physically demanding. In general, the tasks performed by Unit Aoperators have higher mental demands, higher time pressure, and higherfrustration levels than Unit B tasks.
One practical use of this type of a TLX analysis is for helping to eval-uate if, and how, operator tasks could be combined. The analysis of the
TABLE 8-5
Workload Dimensions Analyzed by the NASA TLX Method
Workload Dimension Description
Physical demand Degree of physical activity (e.g., pushing, pulling, controlling,activating) required to perform the task (e.g., easy or demanding, slow or brisk, slack or strenuous, restful or laborious)
Mental demand Degree of mental and perceptual activity (e.g., thinking, deciding, calculating, remembering, looking, searching) required (e.g., easy or demanding, simple or complex, exacting or forgiving)
Performance Perception of success in accomplishing the goals of the task
Temporal demand Amount of time pressure while performing the task (e.g., slowpace and leisurely, rapid and frantic)
Frustration level Type of feelings (e.g., insecure, irritated, stressed, annoyed versus secure, gratified, content, relaxed, and complacent) while performing the task
Effort Degree of mental and physical work required to accomplish the
task
Ch08qxd 11/1/03 4:23 PM Page 379

380 Information Processing
TABLE 8-6
Operator Tasks for Units A and B
Tasks by Unit A Operator Tasks by Unit B Operator
Coordinate movement of fuel to and Approve work permitsfrom tanks
Respond to water treatment alarms Communicate with mechanics
Answer phone calls, radio Correct deviations in operations
Respond to equipment alarms Respond to alarms
Coordinate personnel at docks and off Manage tank inventorysite
Communicate with tank gauger Respond to product scheduling requirements
Monitor lab requests Communicate tankage changes
Communicate with scheduling dept Set up blends
Set up and blend fuel A Monitor lab results
Set up and blend fuel B
Set up and blend fuel C
380
0.00
50.00
100.00
150.00
200.00
250.00
Physic
al Dem
and
Men
tal D
eman
d
Perfo
rmanc
e
Tempo
ral D
eman
d
Frustr
ation
Lev
el
Effort
Workload Component
Sco
re
OMS
TCCUnit A Unit B
Figure 8-3 Overall ratings of the six workload dimensions for all Unit A and Unit Boperator tasks (average for all inside operator tasks).
Ch08qxd 11/1/03 4:23 PM Page 380

Information Processing 381
six workload dimensions for each task gives insight on which high-work-load tasks should not be performed in parallel by the same operator, unlessimprovements are made. For example, in this case, there would be poten-tial for a very high workload situation if some Unit A and Unit B taskswere to be performed simultaneously with the tools and methods currentlyin place.
Detailed analysis of each of the Unit A and Unit B operator tasks indi-cate that the highest contribution of frustration to workload is not fromoperating tasks but from telephone interruptions and the coordinating ofpersonnel. Several additional Unit A tasks are perceived as having a highmental demand, with a few of these also having a high time pressure toperform the task. In comparison, Unit B operators reported lower work-load requirements for most of the tasks and high mental demands for justa few tasks.
To determine if the high mental or time pressure demands are a poten-tial problem, the tasks should be evaluated from a risk perspective. Eachtask can be categorized according to high, medium, or low risk, related tothe risk if the integrity of the task were jeopardized, such as not completedor completed incorrectly. The results of the risk categorization can becombined with the workload analysis to identify potential workload issuesfor combined operations.
Table 8-7 lists the Unit A and Unit B operating tasks with the highestworkloads. A risk assessment indicated that the tasks marked by an * in
TABLE 8-7
Unit A and Unit B Tasks with the Highest Workload Ratings
Unit A Unit B
Communicate with scheduling *Monitor unit alarms, production, and quality department control indicators
Blending Troubleshoot unit
Loading tanks Rearrange process to achieve productscheduling requirements
*Monitor discharge
*Monitor loading
Ch08qxd 11/1/03 4:23 PM Page 381
382 Information Processing382 Information Processing
Table 8-7 were also “high” risk tasks. So, the possible pairs of tasks shownin the table should not be performed simultaneously by the operators ifthey were to operate both Units A and B, unless the current monitoringsystems and procedures are enhanced.
8.6 CASE STUDY
A narrative on how to change a tire is transformed into the written pro-cedure shown in Table 8-8, following the guidelines presented earlier inthe chapter and summarized in the procedures checklist in the Appendix.
8.6.1 Narrative: How to Change a Tire
Pull off the road, apply the parking brake and place the transmission inpark if the car is an automatic. If the car has a standard transmission, placethe shift in first gear or reverse. Activate road flares or signal reflectors towarn approaching vehicles of your presence on the roadside. Retrieve thespare tire, jack, and lug wrench. Pry off the flat tire’s hubcap using thesharp end of the lug wrench or a screwdriver. To loosen each lug nut, turnthe wrench counterclockwise about one turn while the tire is still on theground.
Place the jack under the reinforced section of the car’s body. Most vehi-cles have a picture with or near the jack, showing lift points and instruc-tions on how to use the jack. Use the jack to raise the car until the flat tireis several inches off the ground. Continue loosening the lug nuts andremove the wheel. Keep track of the lug nuts as you remove them. Liftthe spare tire onto the axle hub and align the holes. Replace the lug nutsand tighten each one lightly with your fingers. Use the jack to lower thecar to the ground and remove the jack. Then firmly tighten each lug nutby turning the wrench clockwise. As soon as possible, take the car into aservice station to have the flat tire repaired and the lug nuts tightened witha torque wrench to specifications.
Table 8-8 illustrates how this narrative should be transformed into aproper written procedure.
382 Information Processing
Ch08qxd 11/1/03 4:23 PM Page 382
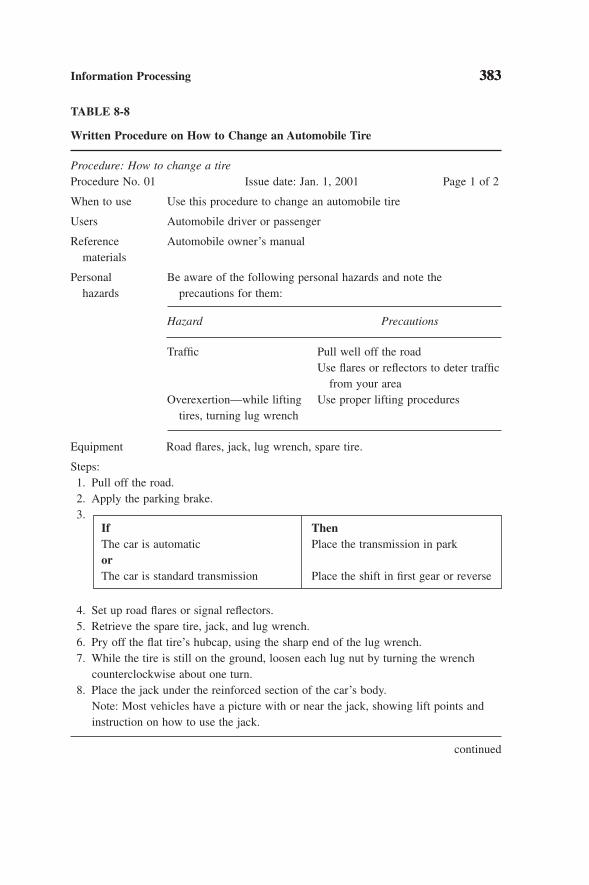
Information Processing 383383
TABLE 8-8
Written Procedure on How to Change an Automobile Tire
Procedure: How to change a tireProcedure No. 01 Issue date: Jan. 1, 2001 Page 1 of 2
When to use Use this procedure to change an automobile tire
Users Automobile driver or passenger
Reference Automobile owner’s manualmaterials
Personal Be aware of the following personal hazards and note thehazards precautions for them:
Hazard Precautions
Traffic Pull well off the roadUse flares or reflectors to deter traffic
from your areaOverexertion—while lifting Use proper lifting procedures
tires, turning lug wrench
Equipment Road flares, jack, lug wrench, spare tire.
Steps:1. Pull off the road.2. Apply the parking brake.3.
4. Set up road flares or signal reflectors.5. Retrieve the spare tire, jack, and lug wrench.6. Pry off the flat tire’s hubcap, using the sharp end of the lug wrench.7. While the tire is still on the ground, loosen each lug nut by turning the wrench
counterclockwise about one turn.8. Place the jack under the reinforced section of the car’s body.
Note: Most vehicles have a picture with or near the jack, showing lift points andinstruction on how to use the jack.
If ThenThe car is automatic Place the transmission in parkorThe car is standard transmission Place the shift in first gear or reverse
continued
Ch08qxd 11/13/03 3:53 PM Page 383

384 Information Processing384 Information Processing
TABLE 8-8
Written Procedure on How to Change an Automobile Tire Continued
9. WARNING: Beware of finger pinch points while using jack. WARNING: Do not get into, or under, the car while it is raised on the jack. Use the jack to raise the car until the flat tire is several inches off the ground.
10. Continue to loosen the lug nuts and remove the wheel. Note: Keep track of the lug nuts as you remove them.
11. Lift off the wheel with the flat tire.12. Lift the spare tire onto the axle hub and align the holes.13. Replace the lug nuts and tighten each one with your fingers.14. Use the jack to lower the car to the ground and remove the jack.15. Firmly tighten each lug nut by turning the wrench clockwise.
Note: As soon as possible, take the car into a service station to have the flat tirerepaired and the lug nuts tightened with a torque wrench to specifications.
REVIEW QUESTIONS
Test your understanding of the material in this chapter.
1. What is a system-induced error?
2. What should be the content and appearance of a label that describesthe hazardous material contained within a pipe?
3. For an investigation of an incident with a potential root cause of procedures were not used, what questions would help determine why the procedures may not have been used?
4. What type of training should be provided to ensure that technicianscan maintain and calibrate new sensors that will be installed in aplant?
Ch08qxd 11/1/03 4:23 PM Page 384

Information Processing 385
Procedures Checklist (based on Center for Chemical Process Safety, 1996, and NUSTraining Corporation, 1995, Center for Chemical Process Safety, 1994; and Wieringaet al. 1993).
Procedure Title: ________________ Plant site: ________________
Date of evaluation: ________________ Evaluator: ________________
ConfirmedChecklist Item (✓)
Presentation and Usefulness1. Does the procedure appear to be concise and easy to use?
No details that do not contribute to work performance, safety or quality
Only “need to know”No “nice to know”
2. Is the procedure written so that the detail is appropriate to the range of experience of the users and their capabilities?
Technical terms familiar to the readerNo jargonAll acronyms are familiar
3. Is the procedure written so that the detail is appropriate to the complexity of the job, including
Criticality?Potential hazards?Ease of performing?
4. Are conditional instructions easy to understand? If an action must meet more than two requirements, are the requirements listed?
5. Are calculations clear and understandable? For complicated or critical calculations, is a formula or table included or referenced?
6. Can graphs, charts, and tables be easily and accurately extracted and interpreted?
7. Are steps written in short, concise statements?8. Are the same terms used consistently for the same components
or operations?
Format, Layout, and Design9. In general, the procedures
Contain plenty of white space?Contain tab markers to help locate them quickly, such as black
continued
APPENDIX 8-1. Procedures Evaluation Checklist
Ch08qxd 11/1/03 4:23 PM Page 385
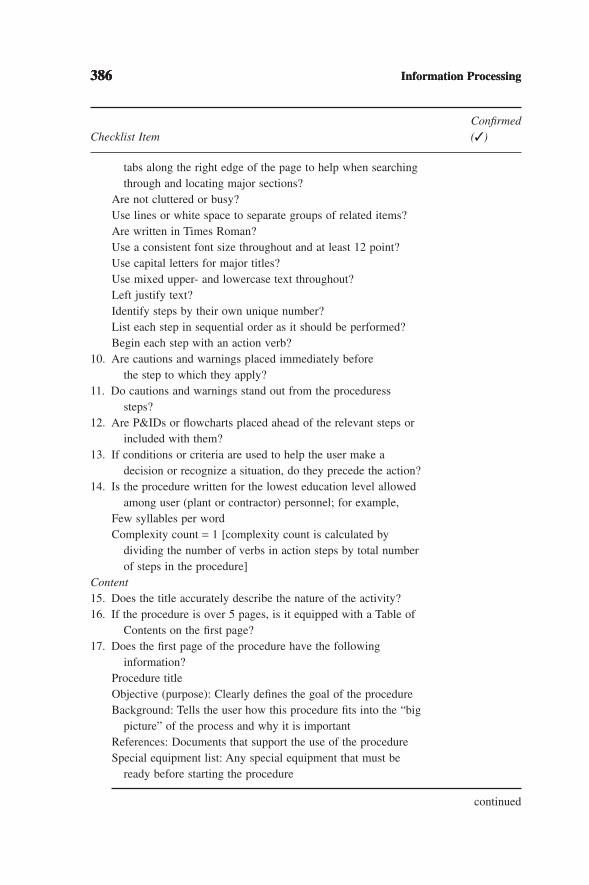
ConfirmedChecklist Item (✓)
tabs along the right edge of the page to help when searching through and locating major sections?
Are not cluttered or busy?Use lines or white space to separate groups of related items?Are written in Times Roman?Use a consistent font size throughout and at least 12 point?Use capital letters for major titles?Use mixed upper- and lowercase text throughout?Left justify text?Identify steps by their own unique number?List each step in sequential order as it should be performed?Begin each step with an action verb?
10. Are cautions and warnings placed immediately before the step to which they apply?
11. Do cautions and warnings stand out from the proceduress steps?
12. Are P&IDs or flowcharts placed ahead of the relevant steps or included with them?
13. If conditions or criteria are used to help the user make a decision or recognize a situation, do they precede the action?
14. Is the procedure written for the lowest education level allowed among user (plant or contractor) personnel; for example,
Few syllables per wordComplexity count = 1 [complexity count is calculated by
dividing the number of verbs in action steps by total number of steps in the procedure]
Content15. Does the title accurately describe the nature of the activity?16. If the procedure is over 5 pages, is it equipped with a Table of
Contents on the first page?17. Does the first page of the procedure have the following
information?Procedure titleObjective (purpose): Clearly defines the goal of the procedureBackground: Tells the user how this procedure fits into the “big
picture” of the process and why it is importantReferences: Documents that support the use of the procedureSpecial equipment list: Any special equipment that must be
ready before starting the procedure
386 Information Processing386 Information Processing386
continued
Ch08qxd 11/13/03 3:54 PM Page 386
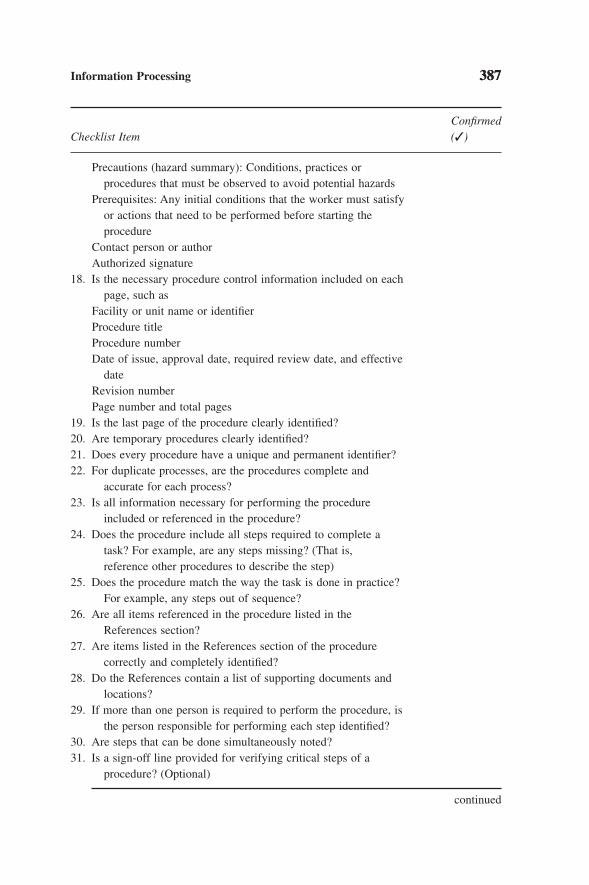
Information Processing 387
ConfirmedChecklist Item (✓)
Precautions (hazard summary): Conditions, practices or procedures that must be observed to avoid potential hazards
Prerequisites: Any initial conditions that the worker must satisfy or actions that need to be performed before starting the procedure
Contact person or authorAuthorized signature
18. Is the necessary procedure control information included on each page, such as
Facility or unit name or identifierProcedure titleProcedure numberDate of issue, approval date, required review date, and effective
dateRevision numberPage number and total pages
19. Is the last page of the procedure clearly identified?20. Are temporary procedures clearly identified?21. Does every procedure have a unique and permanent identifier?22. For duplicate processes, are the procedures complete and
accurate for each process?23. Is all information necessary for performing the procedure
included or referenced in the procedure?24. Does the procedure include all steps required to complete a
task? For example, are any steps missing? (That is, reference other procedures to describe the step)
25. Does the procedure match the way the task is done in practice? For example, any steps out of sequence?
26. Are all items referenced in the procedure listed in the References section?
27. Are items listed in the References section of the procedure correctly and completely identified?
28. Do the References contain a list of supporting documents and locations?
29. If more than one person is required to perform the procedure, is the person responsible for performing each step identified?
30. Are steps that can be done simultaneously noted?31. Is a sign-off line provided for verifying critical steps of a
procedure? (Optional)
387
continued
Ch08qxd 11/1/03 4:23 PM Page 387

388 Information Processing388 Information Processing
ConfirmedChecklist Item (✓)
32. If the procedure requires coordination with others, does it contain a checklist, sign-off, or other method for indicating the steps or actions have been performed or completed?
33. If a step contains more than two items, are they listed rather than buried in the text?
34. If two actions are included in a single step, can the actions actually be performed simultaneously or as a single action?
35. Are steps that must be performed in a fixed sequence identified as such?
36. Are operating or maintenance limits or specifications written in quantitative terms?
37. Does the procedure provide instructions for all reasonable contingencies?
38. If the contingency instructions are used, does the contingency statement precede the action statement?
39. Do procedures that specify alignment, such as valve positions, pipe and spool configurations, or hose station hookups:
Specify each item?Identify each item with a unique number or designator?Specify the position in which the item is to be placed?Indicate where the user records the position if applicable?
40. Do emergency operating procedures contain provisions for verifying
Conditions associated with an emergency? (Initiating conditions)
Automatic actions associated with an emergency?Performance of critical actions?
41. Do maintenance procedures include required follow-up actions or tests and tell the user who must be notified?
42. If a procedure must be performed by someone with a special qualification, are the required technical skill levels identified?
Note: Items 4-7, 10-11, 18-23, and 26-42, Copyright © 1996 by the American Instituteof Chemical Engineers, and reproduced by permission AIChE.
388
Ch08qxd 11/1/03 4:23 PM Page 388

REFERENCES
Attwood, D. A. (1998) “Understanding and Dealing with Human Error in the Oil, Gas andChemical Industries.” Presentation for the Center for Human Process Safety, SanAntonio, TX.
Bishop, H., Madnick, B., Walter, R., and Sussman, E. D. (1985) Potential for Driver Attention Monitoring System Development. Report DOT-TSC-NHTSA-85-1. Cambridge, MA: U.S. Department of Transportation.
Canadian Royal Commission on the Ocean Ranger Marine Disaster. (1984) Report One: The Loss of the Semisubmersible Drill Rig Ocean Ranger and Its Crew.Publication no. Z1-1982/1-1E. St. John’s, Newfoundland: Canadian GovernmentPublishing Centre.
Center for Chemical Process Safety. (1994) Guidelines for Preventing Human Error inProcess Safety. New York: American Institute of Chemical Engineers.
Center for Chemical Process Safety. (1996) Writing Effective Operating and MaintenanceProcedures. New York: American Institute of Chemical Engineers.
Chapanis, A. (1996) Human Factors in Systems Engineering. New York: John Wiley &Sons.
Connelly, C. S. (1995) “Toward an Understanding of DCS Control Operator Workload.”Instrument Society of America Transactions 34, pp. 175–184.
Cullen, Lord. (1990) Report on Piper Alpha Accident. London: Her Majesty’s StationersOffice.
D’Amico, A. D., Kaufman, E., and Saxe, C. (1986) A Simulation Study of the Effects ofSleep Deprivation, Time of Watch and Length of Time on Watch on WatchstandingEffectiveness. Tech. Rep. CAORF-16-8122-02, U.S.D.O.T. Washington, DC:National Maritime Research Center.
Danaher, J. W. (1980) “Human Error in Air Traffic Control (ATC) System Operations.”Human Factors 22, pp. 535–545.
Davies, D. R., and Parasuraman, R. (1982) The Psychology of Vigilance. New York: Academic Press.
Donderi, D. C. (1994) Visual Acuity, Color Vision and Visual Search Performance at Sea.International Ergonomics Association 1994 Congress, Vol.4, pp. 224, Toronto, August1994.
Exxon Mobil. (2001) Corporate Safety, Health and Environment Progress Report. Avail-able at ExxonMobil.com.
Goldstein, I. (1993) Training in Organizations. Belmont, CA: Wadsworth.
Gordon, S. E. (1994) Systematic Training Program Design. Englewood Cliffs, NJ: Prentice-Hall.
Haas, P. M. (1999) “Human Performance Engineering: A Practical Approach to Applica-tion of Human Factors.” Paper no. NSC-99-108. 1999 National Petrochemical Refin-ers Association (NRPA) National Safety Conference, Dallas, TX.
Information Processing 389
Ch08qxd 11/1/03 4:23 PM Page 389
Hart, S. G., and Staveland, L. E. (1988) “Development of NASA-TLX (Task Load Index):Results of Experimental and Theoretical Research.” In P. A. Hancock and N.Meshkati (eds.), Human Mental Workload. Amsterdam: North Holland Press, pp.129–183.
Heising, C. D., and Grenzebach, W. S. (1989) “The Ocean Ranger Oil Rig Disaster: ARisk Analysis.” Risk Analysis 9, no. 1, pp. 55–62.
Hudack, S. D., and Duchon, J. C. “A Safety Risk Evaluation of Vigilance Tasks in theU.S. Surface Mining Industry.” Proceedings of the International Symposium on OffHighway Haulage in Surface Mines. May 1989. Edmonton, Alberta I. S. Golosinskiand V. Srajer (eds.) Balkema Publishers.
Hulbert, S. F., Dompe, R. J., and Eirls, J. L. (1982) Driver Alertness Monitoring Systemfor Large Haulage Vehicles. Bureau of Mines OFR 119-83 Contract H0282006, p. 120, Tracor MBA, NTIS PB 83-220640. Springfield, VA.
Kletz, T. (1991) An Engineer’s View of Human Error. Rugby, Warwickshire, UK: Instituteof Chemical Engineers.
Kletz, T. (1998) What Went Wrong? Case Histories of Process Plant Disasters, Fourth Ed.Houston, TX: Gulf.
Koelega, H. S. (1993) “Stimulant Drugs and Vigilance Performance: A Review.” Psychopharmacology 111, pp. 1–16.
Koelega, H. S., and Brinkman, J.-A. (1986) “Noise and Vigilance: An Evaluative Review.”Human Factors 28(4), pp. 465–481.
Landstrom, U. (1990) “Noise and Fatigue in Working Environment.” Environment Inter-national 16, pp. 471–476.
Moray, N. (1981) “The Role of Attention in the Detection of Errors and the Diagnosis if Failures in Man-Machine Systems.” In J. Rassmussen and W. B. Rouuse (eds.), Human Detection and Diagnoses of System Failures. New York: Plenum Press.
Moskowitz, H. (1985) “Marijuana and Driving.” Accident Analysis and Prevention, 17(4),pp. 323–342.
National Institute of Occupational Safety and Health. (1988) Training Requirements inOSHA Standards and Training Guidelines. OSHA Publication No. 2254. Washing-ton, DC: U.S. Department of Labor.
Noerager, J. A., Danz-Reece, M. E., and Pennycook, W. A. (1999) “HFAST: A Tool toAssess Human Error Potential in Operations.” Offshore Technology Conference,Houston TX.
Norin, F., and Wyon, D. P. (1992) Driver Vigilance—The Effects of Compartment Temperature. Report No. 920168. Society of Automotive Engineers at SAE WorldCongress, Warrendale, PA: SAE.
NUS Training Corporation. (1995) Procedure Writing Workshop Manual. Seventh Ed.Gaithersburg, MD: NUS Training Corporation.
390 Information Processing
Ch08qxd 11/13/03 3:54 PM Page 390

Pennycook, W. A., and Danz-Reece, M. E. (1994) “Practical Examples of Human ErrorAnalysis in Operations.” Paper no. SPE 27262. Society of Petroleum Engineers Inter-national Conference on Health, Safety and Environment, Jakarta, Indonesia.
Ray, P. S. (1991) “Effects of Fatigue and Heat Stress on Vigilance of Workers in Protec-tive Clothing.” Proceedings, 35th Annual Meeting of the Human Factors Society, pp.885–889.
Reason, J. (1990) Human Error. Cambridge, UK: Cambridge University Press.
Rogers, W. A., Lamson, N., and Rousseau, G. (2000) “Warning Research: An IntegrativePerspective.” Human Factors and Ergonomics 42, no. 1, pp. 102–139.
Sanders, M. S., and McCormick, E. J. (1993) Human Factors Engineering and Design,Seventh Ed. New York: McGraw-Hill.
Thomas, J. J., Noerager, J. A., Danz-Reece, M. E., Pennycook, W. A. (2000) “SystematicAssessment of Human Error Potential in Operations.” Paper no. SPE 60999. Societyof Petroleum Engineers International Conference on Health, Safety and Environment,Stavanger, Norway.
U.K. Health and Safety Executive. (1999) Reducing Error and Influencing Behavior.HSG48. London, U.K.
U.S. Department of Energy. (1993) Guide to Good Practices for Equipment and PipingLabeling. DOE-STD-1044-93. Washington, DC: U.S. Department of Energy.
U.S. OSHA 29CFR 1910.119. Regulation on the Process Safety Management of HighlyHazardous Chemicals.
Weimer, J. (1995) Research Techniques in Human Engineering. Englewood Cliffs, NJ:Prentice-Hall.
Wickens, C. D. (1984) Engineering Psychology and Human Performance. Glenview, IL: Scott, Foresman and Company.
Wieringa, D., Moore, C., and Barnes, V. (1993) Procedure Writing. Columbus, OH: Battelle Press.
Information Processing 391
Ch08qxd 11/1/03 4:23 PM Page 391

Ch08qxd 11/1/03 4:23 PM Page 392

9
The Use of Human Factors in ProjectPlanning, Design, and Execution
9.1 Introduction9.2 Project Management
9.2.1 Management of Major Projects9.2.2 Management of Base Projects
9.3 Human Factors Tools for Project Management9.3.1 Human Factors Tracking Database9.3.2 HF Review: Planning Phase9.3.3 Safety, Health, and Environmental Review9.3.4 Human Factors Training for the Project Team9.3.5 Human Factors in the Hazard and Operability Reviews9.3.6 Procedures9.3.7 Analysis Techniques9.3.8 Quality Assurance/Quality Control Review Process9.3.9 Prestart-up Human Factors Review9.3.10 HF Awareness for Construction Contractors and Company Personnel9.3.11 Postproject Review
Appendix 9-1. HAZOP Human Factors Screening ListsAppendix 9-2. Assistance Using HAZOP Screening ListsAppendix 9-3. Quality Assurance/Quality Control ChecklistAppendix 9-4. Maintenance Review ChecklistAppendix 9-5. Walkthrough/Rounds Review ChecklistAppendix 9-6. Prestart-up Human Factors Review ChecklistAppendix 9-7. Summary of Recommendations to Construction Workers Installing
Field-Run Equipment
393
Ch09qxd 11/21/03 09:19 PM Page 393

9.1 INTRODUCTION
Previous chapters demonstrated the benefits of examining humanfactors issues in terms of the potential to reduce injuries, errors, and costs.Chapter 1 introduces a model that demonstrates how to identify issues,conduct ergonomic assessments, and develop solutions. The necessarytools to conduct assessments and design solutions are also provided. So,at this point, you know what to do, how to do it, and why. This chaptersuggests when the initiative should be taken to include human factors ina plant modification or new project.
The inclusion of a human factors perspective in capital projects hasbeen shown to be good business (Robertson, 1999). Human factors, if con-sidered early enough in the project, can be extremely cost effective. Inother words, a project costs no more to design and build while consider-ing the human during the design. This chapter explains how this is done.
In most process plants, human factors is typically built into projects toimprove equipment and facilities for one of three reasons:
1. To reduce the potential for injury.
2. To prevent potential damage to existing equipment and facilities.
3. When the benefits of making the modifications exceed the costs(Attwood and Fennell, 2001).
Experience has shown that, except for these reasons, facilities and equip-ment are unlikely be improved on strictly human factors grounds.
But, as already said, a human factors perspective, when properlyapplied, does not increase the cost of projects (even those conducted forreasons other than human factors). Projects are conducted every day in allprocess plants. They are typically not major, capital projects but smallerprojects, often local or base projects or just plant modifications. Theprocess of changing, repairing, or maintaining a major piece of equipmentis a project. So, there is now a fourth reason for considering human factorsin existing plants:
4. To ensure that local projects consider the capabilities and limitationsof humans.
394 The Use of Human Factors in Project Planning, Design, and Exceution
Ch09qxd 11/21/03 09:19 PM Page 394

This chapter is about the inclusion of human factors in base and majorprojects. It provides a model that shows how to manage human factors inprojects; when to apply human factors tools during the planning, design,and implementation of the project; and describes the tools available. Thedistinction between the way major capital projects and base projects areconducted profoundly influences the way that human factors are consid-ered in each and the design of the tools used. It is important to rememberthat not all “projects” are created equal.
9.2 PROJECT MANAGEMENT
Contrary to popular belief, the role of project management is more thanjust “on time and under budget.” Project management should also
• Integrate human factors into the project execution process.
• Identify human factors issues throughout the execution of each phaseof the project.
• Address each human factors issue during detailed design.
• Ensure that a human factors approach is applied during construction.
• Review the equipment and facilities for human factors completionprior to start-up.
• Conduct a postproject review to ensure that high learning value issuesare identified and incorporated into future projects to continuouslyimprove the application of the human factors approach.
9.2.1 Management of Major Projects
The responsibilities of the various members of the project teamthroughout the life of a major project are sketched in Figure 9-1. As thisexample illustrates, the primary responsibility for project execution shiftsfrom one project team member to another as a project progresses throughvarious phases of execution.
The Use of Human Factors in Project Planning, Design, and Exceution 395
Ch09qxd 11/21/03 09:19 PM Page 395
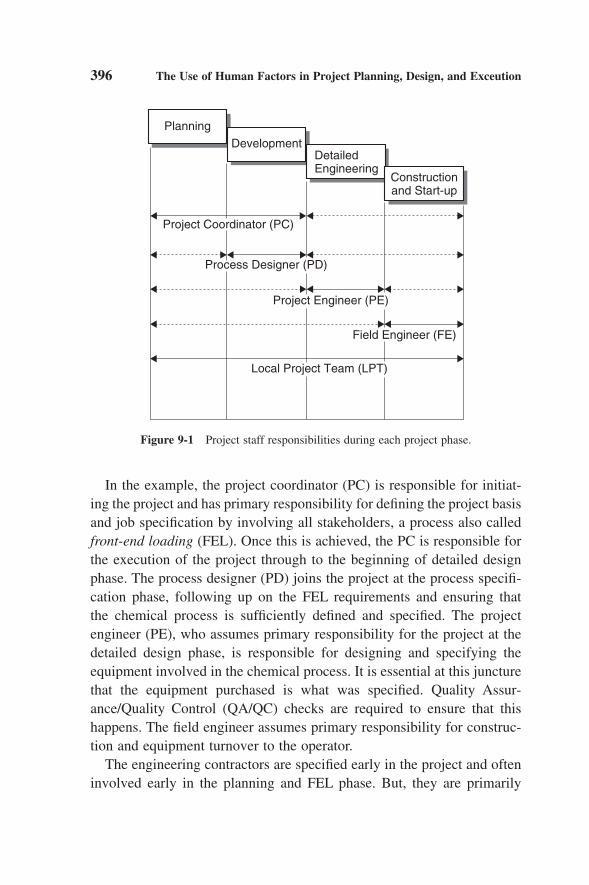
In the example, the project coordinator (PC) is responsible for initiat-ing the project and has primary responsibility for defining the project basisand job specification by involving all stakeholders, a process also calledfront-end loading (FEL). Once this is achieved, the PC is responsible forthe execution of the project through to the beginning of detailed designphase. The process designer (PD) joins the project at the process specifi-cation phase, following up on the FEL requirements and ensuring that the chemical process is sufficiently defined and specified. The projectengineer (PE), who assumes primary responsibility for the project at thedetailed design phase, is responsible for designing and specifying theequipment involved in the chemical process. It is essential at this juncturethat the equipment purchased is what was specified. Quality Assur-ance/Quality Control (QA/QC) checks are required to ensure that thishappens. The field engineer assumes primary responsibility for construc-tion and equipment turnover to the operator.
The engineering contractors are specified early in the project and ofteninvolved early in the planning and FEL phase. But, they are primarily
396 The Use of Human Factors in Project Planning, Design, and Exceution
Planning
Project Coordinator (PC)
DevelopmentDetailedEngineering
Constructionand Start-up
Process Designer (PD)
Project Engineer (PE)
Field Engineer (FE)
Local Project Team (LPT)
Figure 9-1 Project staff responsibilities during each project phase.
Ch09qxd 11/21/03 09:19 PM Page 396

responsible for detailed engineering and, in most cases (i.e., the majorprojects), procurement and construction as well.
9.2.2 Management of Base Projects
While local or base projects, such as capacity expansions, plant modi-fication, and improvement follow the same project model, the base projectis typically managed by a local project team (LPT) comprising unit operating and maintenance personnel and engineering contract staff. Theresponsibility for human factors in base projects may reside with unit first-line supervisors or plant operating staff who have been trained as specialists in human factors (HF). In the latter case, local projects fromall units would be reviewed by these HF specialists.
In addition, because of their comparatively short duration, base proj-ects have fewer established reviews throughout planning, design, and execution as major projects. Some other differences for base projectsinclude
• Contractors for base projects could be on a long-term plant contract.So, they are likely working on a number of small projects at the sametime. This differs from major projects, where the staff of the engi-neering contractor is usually dedicated to that project.
• Staff turnover within the contractors’ organizations follows the areaand local project demand cycles and is high at times.
• Project reviews are fewer and generally less rigorous. They are oftenongoing and may be unscheduled.
• Drawings are often two-dimensional CAD. Three-dimensional com-puter models are usually not available.
• Safety and health reviews are conducted only if the product beingproduced or those involved in the production meet a “trigger” levelof concern.
• Full hazard and operability (HAZOPs) reviews are not alwaysrequired; review and approval of the project specifications by theplant safety committee is normally sufficient.
The Use of Human Factors in Project Planning, Design, and Exceution 397
Ch09qxd 11/21/03 09:19 PM Page 397

9.3 HUMAN FACTORS TOOLS FOR PROJECT MANAGEMENT
Figure 9-2 illustrates the human factors tools designed for use in projectdevelopment and design and reviewed in this chapter. The figure also indi-cates the stage in the project where the tools are intended for use.
The following paragraphs describe each of the human factors toolsintroduced in Figure 9-2 and outline the recommended use of each toolby project phase and provider. Some tools stand alone, such as LINKanalysis; others are integrated into existing key project tools, such asHAZOPs.
9.3.1 Human Factors Tracking Database
The human factors tracking database (HFTDB) consists of a standardspreadsheet that captures the human factors design issues as they are iden-
398 The Use of Human Factors in Project Planning, Design, and Exceution
Planning
DevelopmentDetailedEngineering
System Analyses• Task Analysis• LINK Analysis
CriticalProcedureDevelopment
Constructionand Start-up
Human Factors Tracking Database
PlanningHF Review
HAZOP/P&IDReview
QA/QC ReviewProcess
HF Awarenessfor Construction
Workers
PostprojectReview
PrestartupHF
Review
HF Skills Training
Safety, Health, &Environmental(SHE) Review
Figure 9-2 Human factors tools for use during project planning, development, design,and construction.
Ch09qxd 11/21/03 09:19 PM Page 398
tified. The HFTDB passes through various members of the project teamas follows:
• It is initiated by the project coordinator using a generic human factorschecklist during the business planning cycle.
• It is used by the development team to specify equipment, includingpackage unit designs.
• It is handed off to the project engineer during the design phase andto the field engineer during the construction phase.
In our model, the project coordinator has overall responsibility toensure that all issues are addressed during each phase of the project. Thedatabase carries each issue through to resolution at the appropriate phaseof the project.
It is easy to envisage the HF tracking database being an integral partof the tracking tools usually required for all follow-up items in capital orbase projects. This database is valuable also as part of the project “man-agement of change” (MOC) process.
9.3.2 HF Review: Planning Phase
As soon as a project is conceived, the people involved know somethingabout what the new plant or equipment will look like and how the productwill be produced. Their knowledge may be sketchy, but it is sufficient to allow them to decide whether the engineering intentions of the newprocess unit might involve complex operations or work tasks that couldexceed the limitations and capabilities of the workforce.
The human factors tool designed for use during this phase is a list ofscreening questions intended to identify basic human factors informationabout the proposed plant. The questions are listed in Table 9-1.
If the answers to any of these questions are yes or don’t know, the issueis added to the human factors tracking database for review at some appro-priate time later in the project, as more information and process plant def-inition become available.
The Use of Human Factors in Project Planning, Design, and Exceution 399
Ch09qxd 11/21/03 09:19 PM Page 399
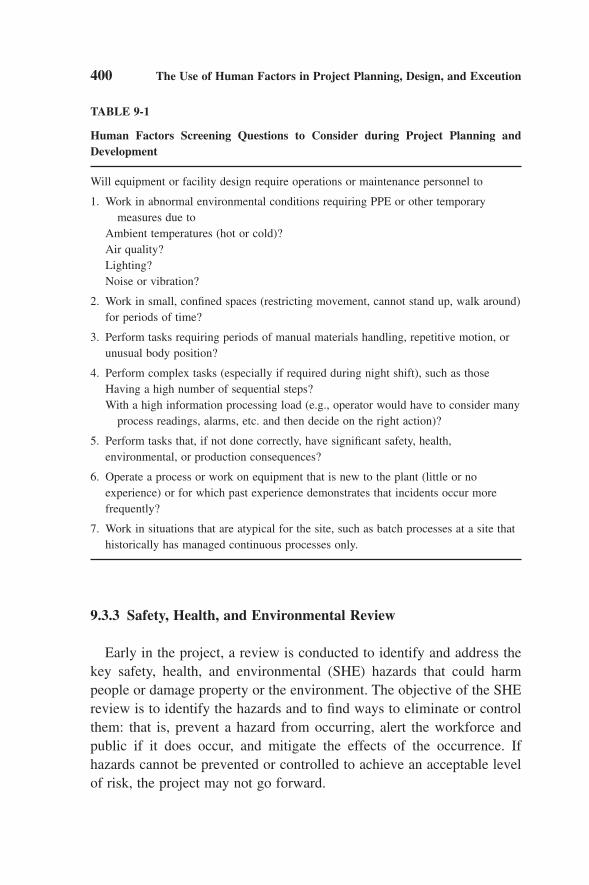
9.3.3 Safety, Health, and Environmental Review
Early in the project, a review is conducted to identify and address thekey safety, health, and environmental (SHE) hazards that could harmpeople or damage property or the environment. The objective of the SHEreview is to identify the hazards and to find ways to eliminate or controlthem: that is, prevent a hazard from occurring, alert the workforce andpublic if it does occur, and mitigate the effects of the occurrence. Ifhazards cannot be prevented or controlled to achieve an acceptable levelof risk, the project may not go forward.
400 The Use of Human Factors in Project Planning, Design, and Exceution
TABLE 9-1
Human Factors Screening Questions to Consider during Project Planning and Development
Will equipment or facility design require operations or maintenance personnel to
1. Work in abnormal environmental conditions requiring PPE or other temporary measures due to
Ambient temperatures (hot or cold)?Air quality?Lighting?Noise or vibration?
2. Work in small, confined spaces (restricting movement, cannot stand up, walk around)for periods of time?
3. Perform tasks requiring periods of manual materials handling, repetitive motion, orunusual body position?
4. Perform complex tasks (especially if required during night shift), such as thoseHaving a high number of sequential steps?With a high information processing load (e.g., operator would have to consider many
process readings, alarms, etc. and then decide on the right action)?
5. Perform tasks that, if not done correctly, have significant safety, health,environmental, or production consequences?
6. Operate a process or work on equipment that is new to the plant (little or noexperience) or for which past experience demonstrates that incidents occur morefrequently?
7. Work in situations that are atypical for the site, such as batch processes at a site thathistorically has managed continuous processes only.
Ch09qxd 11/21/03 09:19 PM Page 400
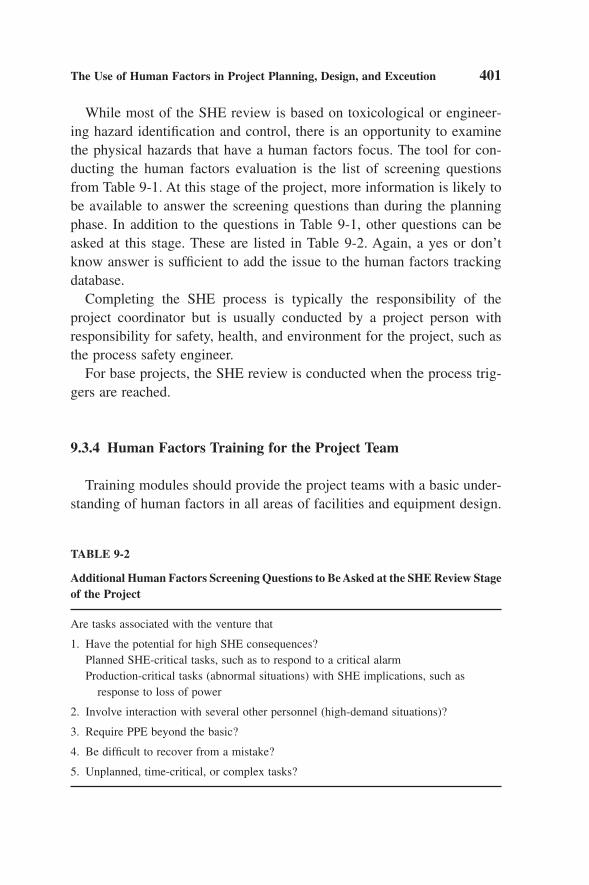
While most of the SHE review is based on toxicological or engineer-ing hazard identification and control, there is an opportunity to examinethe physical hazards that have a human factors focus. The tool for con-ducting the human factors evaluation is the list of screening questionsfrom Table 9-1. At this stage of the project, more information is likely tobe available to answer the screening questions than during the planningphase. In addition to the questions in Table 9-1, other questions can beasked at this stage. These are listed in Table 9-2. Again, a yes or don’tknow answer is sufficient to add the issue to the human factors trackingdatabase.
Completing the SHE process is typically the responsibility of theproject coordinator but is usually conducted by a project person withresponsibility for safety, health, and environment for the project, such asthe process safety engineer.
For base projects, the SHE review is conducted when the process trig-gers are reached.
9.3.4 Human Factors Training for the Project Team
Training modules should provide the project teams with a basic under-standing of human factors in all areas of facilities and equipment design.
The Use of Human Factors in Project Planning, Design, and Exceution 401
TABLE 9-2
Additional Human Factors Screening Questions to Be Asked at the SHE Review Stageof the Project
Are tasks associated with the venture that
1. Have the potential for high SHE consequences?Planned SHE-critical tasks, such as to respond to a critical alarmProduction-critical tasks (abnormal situations) with SHE implications, such as
response to loss of power
2. Involve interaction with several other personnel (high-demand situations)?
3. Require PPE beyond the basic?
4. Be difficult to recover from a mistake?
5. Unplanned, time-critical, or complex tasks?
Ch09qxd 11/21/03 09:19 PM Page 401

In addition, the training should allow the participants to identify the issuesassociated with the project. The content of the course should be tailoredto meet the needs of the attendees. The following are considered to beminimal requirements of project team training.
9.3.4.1 Course Objectives
• Familiarize participants with human capabilities and limitations.
• Generate awareness of the influence of human factors on processdesign.
• Train participants so they can identify human factors issues as theyarise.
• Provide ideas through case studies and demonstrations on how toapproach issues from a human factors perspective.
• Familiarize participants with the processes and tools for building ahuman factors approach into projects.
• Develop follow-up action plans.
9.3.4.2 Course Content
The modules for human factors training should include
• Introduction to human factors in process and equipment design inbase and capital projects.
• Influence of human capabilities and limitations on facilities andequipment design.
• Individual and group differences.
• Body size and strength.
• Physical activity factors.
• Work physiology.
• Information processing and human error.
402 The Use of Human Factors in Project Planning, Design, and Exceution
Ch09qxd 11/21/03 09:19 PM Page 402
• Control room operator issues.
• Access to facilities and equipment.
Equipment topics should include
• Displays, signs, and labels.
• Electrical buildings (equipment and instruments).
• Instruments.
• Field control panels.
• Emergency shutdown equipment.
• Operability and maintainability of equipment.
• Construction of facilities.
• Package units.
• Control room design.
• Pumps and compressors.
• Process control system (interface design).
• Procedures.
• Sample points.
• Loading racks.
• Alarm management and the hierarchy of alarms.
• HF tools for process and equipment designers.
• Issues review and an action plan for human factors implementationin projects.
• HF in project management systems.
For capital projects, training should be offered to the project team twiceduring the project. The first is during the design specification phase, wellbefore the start of detailed design. At this point, the unit’s major tasks aredefined and its procedures beginning to be developed. Critical operatortasks can be identified and analyzed for major human factors issues. Thekey training modules to be given at this time are
The Use of Human Factors in Project Planning, Design, and Exceution 403
Ch09qxd 11/21/03 09:19 PM Page 403

• Human information processing, which addresses the cognitive limi-tations of the user population.
• Alarm management, which addresses the alarm philosophy and designation.
• Control room design.
• Operability and maintainability, which addresses issues such as valveidentification and location of major equipment.
• Procedures design.
The second set of training should be conducted at the beginning of thedetailed engineering phase. For this training, all modules are applicable,but they should be selected based on the needs of the project. The targetaudience for these modules consists of equipment designers from the site’sown staff and engineering contractors.
For base projects, training should be offered at routine intervals (e.g.,every 6 months) for ongoing members of the site project community andthe contractors who support the site. New employees should attend thefirst available course.
9.3.5 Human Factors in the Hazard and Operability Reviews
For major projects, a hazard and operability (HAZOP) review analysisis conducted during the development phase, prior to detailed engineering.For base projects, a process and instrumentation drawing (P&ID) reviewis conducted during the development phase.
9.3.5.1 A Tool to Identify Human Factors Concerns during theHAZOP Process
The objective of this tool is to assist the HAZOP team in the identifi-cation of human factors concerns associated with particular pieces ofequipment while conducting the HAZOP review. The tool should alsoquickly target the major items of HF concern, be user-friendly, requireminimal training for its use, and not duplicate those design issues coveredby any HF design guidelines or standards.
404 The Use of Human Factors in Project Planning, Design, and Exceution
Ch09qxd 11/21/03 09:19 PM Page 404
Previous experience with the implementation of human factors in aHAZOP process has pointed out the following issues:
• The current HAZOP protocol is less systematic than it should be toaddress HF concerns such as human/machine interface (HMI). Itrelies on the use of a checklist without recommending a process forapplying it. Since, human factors concerns are not the prime reasonto perform a HAZOP review, the HAZOP leader often elects not toreview the checklist during the HAZOP proceedings, especiallyduring a HAZOP review for major capital projects. More likely, thechecklist is reviewed at the end of the HAZOP study, resulting in aless-critical, systematic approach.
• The principle objective of the HAZOP review is to identify processhazards, especially those that affect the containment integrity. Someof these hazards are a result of human factors; that is, with either theprocess equipment or instrumented process control. Other tools areavailable that focus on HF issues such as critical task analysis.
• The HAZOP review is a sequential process, a line-by-line and equipment-by-equipment review. It requires that each line or processsystem on the process and instrumentation drawing be followed andchecked and that the hazards associated with the equipment locatedat each node be identified and discussed. The HF issues need to behighlighted at these nodes as an integral part of the HAZOP reviewand not at the end of the review, when the team has completed eachP&ID.
This HAZOP process introduced here has the following characteristics:
• It utilizes a human factors perspective in a targeted manner.
• It determines the difference between HF-relevant and HF-irrelevantsystems quickly, so the team can move through the P&ID in a timelyfashion.
• It considers only the pieces of equipment or systems that have ahuman factors interface.
• It focuses attention on the operations that can be hazardous to theprocess, operators, or maintenance workers.
The Use of Human Factors in Project Planning, Design, and Exceution 405
Ch09qxd 11/21/03 09:19 PM Page 405
• It allows the HAZOP team to use the process with little previousknowledge and minimal practice. After a short introduction to HF anda brief exposure to the tool and its use, the team should be able toquickly distinguish between relevant and irrelevant systems and pin-point the HF concerns with the relevant systems.
• It recognizes that the procedure identifies HF issues beyond thosecovered by a design specification; that is, issues specific to the particular process and engineering design reviewed by the HAZOPteam.
Human factors engineering is seen as an integral part of the HAZOPprocess. The following outlines the process of implementing HF duringHAZOP reviews:
1. A trained HF practitioner is included on the team. For large pro-jects, this would be a HF specialist or a person with extensive HFbackground.
2. The team members, if not trained in HF, are given a short introduc-tion, which should cover:Capabilities and limitations of operators.Areas where consideration of HF may improve the safety of the
system.Familiarization with the simple tools used to distinguish between
relevant and irrelevant human-system interfaces.
3. Human factors experts on the HAZOP team, if coming from out-side the engineering function, must understand the HAZOP processand be able to read and understand the information on a P&ID. Thisincludes all the symbols (e.g., valve types) and what functions the equipment performs (e.g., a “double block and bleed” pipingarrangement).
4. Human factors “screening” lists are available to the HAZOP teamand used by designated HAZOP team members.
5. The screening lists are referred to each time a node in the P&ID isreached and considered. The purpose of the screening lists is toremind the team to determine whether the equipment requires a HF
406 The Use of Human Factors in Project Planning, Design, and Exceution
Ch09qxd 11/21/03 09:19 PM Page 406

review and follow-up. The type and format of the HF screening listis given later.
6. If a human factors concern is identified, it is recorded on the HAZOPworksheet and in the HFTDB. Sufficient information and knowledgemay be available to resolve the issue during the HAZOP review.However, the resolution of the issue most likely takes place outsidethe HAZOP review.
Each screening list is a simple checklist that identifies the most impor-tant HF characteristics of the targeted equipment or system so the teamcan quickly decide whether a potential problem exists and what action to recommend.
A screening list is designed for each of the following pieces of equipment:
• Valves—sequential, critical, frequent.
• Blind and blanks—weight, lifting, location, frequency, clearing,draining.
• Pumps and Compressors—maintaining, draining, in start-up; in shutdown.
• Field displays—critical, start-up, shutdown.
• Fire fighting and deluge systems—critical, accessing, escaping,directing.
• Field instrumentation—rodding, clearing, critical.
• Sample points—exposure, PPE.
• Reactors and dryers—critical, switching or regenerating, clearing,entering, catalyst dumping, lifting.
• Vessels (including exchangers)—cleaning, exposure, PPE, lifting,entering.
• Furnaces and fired heaters—light-off, decoking, flame controlling,switching, PPE, entering.
• Filters—switching, cleaning, clearing, PPE, weight, lifting, entering.
The Use of Human Factors in Project Planning, Design, and Exceution 407
Ch09qxd 11/21/03 09:19 PM Page 407
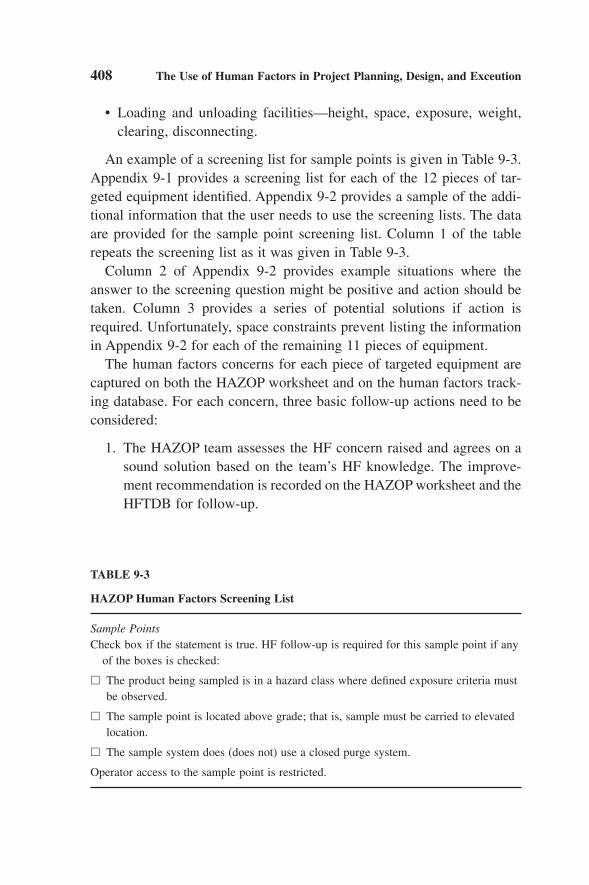
• Loading and unloading facilities—height, space, exposure, weight,clearing, disconnecting.
An example of a screening list for sample points is given in Table 9-3.Appendix 9-1 provides a screening list for each of the 12 pieces of tar-geted equipment identified. Appendix 9-2 provides a sample of the addi-tional information that the user needs to use the screening lists. The dataare provided for the sample point screening list. Column 1 of the tablerepeats the screening list as it was given in Table 9-3.
Column 2 of Appendix 9-2 provides example situations where theanswer to the screening question might be positive and action should betaken. Column 3 provides a series of potential solutions if action isrequired. Unfortunately, space constraints prevent listing the informationin Appendix 9-2 for each of the remaining 11 pieces of equipment.
The human factors concerns for each piece of targeted equipment arecaptured on both the HAZOP worksheet and on the human factors track-ing database. For each concern, three basic follow-up actions need to beconsidered:
1. The HAZOP team assesses the HF concern raised and agrees on asound solution based on the team’s HF knowledge. The improve-ment recommendation is recorded on the HAZOP worksheet and theHFTDB for follow-up.
408 The Use of Human Factors in Project Planning, Design, and Exceution
TABLE 9-3
HAZOP Human Factors Screening List
Sample PointsCheck box if the statement is true. HF follow-up is required for this sample point if any
of the boxes is checked:
� The product being sampled is in a hazard class where defined exposure criteria mustbe observed.
� The sample point is located above grade; that is, sample must be carried to elevatedlocation.
� The sample system does (does not) use a closed purge system.
Operator access to the sample point is restricted.
Ch09qxd 11/21/03 09:19 PM Page 408

2. The HAZOP team recommends a thorough examination of thehuman/machine interface design. The team recognizes the need toassess the HF concern outside the HAZOP proceedings to ensure theHF issue is addressed thoroughly using all available resources.
3. The HAZOP team recommends a critical task analysis (see Section9.3.7.1) to assess the HF problems and their solutions in a rigorous(formal, systematic, critical) approach.
All three actions ensure that appropriate HF design and engineering prin-ciples are used in the design and engineering process, so that the chanceof a human error and human injury are eliminated or adequately reduced.
9.3.6 Procedures
The purpose of a procedure is to guide a process worker, step-by-step,through the task. Not every task requires a procedure. If the task has fewsteps, if it is performed frequently, and if the consequence of error isminor, it likely does not require a procedure. However, if the task iscomplex, if it is performed infrequently, or if the consequence of makingan error is high, a procedure likely is required. The conditions for requir-ing procedures are discussed in Chapter 8.
From the viewpoint of a project, each critical task an operations ormaintenance worker performs requires a procedure. The tasks on whichthe procedure is based on should be specified prior to detailed engineer-ing, since the way in which equipment is used affects its design. Forexample, the layout of a field panel that controls the operation of a firedheater or a compressor should be based on the sequence in which theequipment is operated. The placement of equipment manifolds should bedictated by the sequence in which the valves are manipulated. And, thedesign of filters can affect the methods used to change cartridges. Thedesign and placement of each of these pieces of equipment is affected byor affects the procedures used to operate or maintain them.
Surprisingly, procedures are addressed at this early stage of design. But,every design uses people to execute numerous operations and maintenancetasks. Hence, in the early phases of a project, it is very clear which activ-ities are conducted by people and which are performed automatically by
The Use of Human Factors in Project Planning, Design, and Exceution 409
Ch09qxd 11/21/03 09:19 PM Page 409

the equipment. The earlier that the human tasks are addressed and thehazards identified, the better the human/machine interface can be designedwithout incurring additional costs.
The sequence of activities and the operations performed in each activ-ity guide the human factors considerations in each task. So, proceduresare required to perform critical-task analyses (CTAs) and link analyses.CTAs and link analyses, which are briefly discussed in the followingsection, are explained in detail in earlier chapters.
9.3.7 Analysis Techniques
Prior to detailed engineering, the human factors issues identified andincluded on the HF tracking database should be resolved, since each issuecould affect the design of the facilities and equipment. Issue resolutionoften involves analyzing worker tasks to ensure that the design of the facil-ities or equipment supports how operators work. Two tools that helpspecify the design and layout of facilities and equipment are task and linkanalyses.
9.3.7.1 Critical-Task Analysis
The critical-task analysis is discussed in detail in Chapter 7. For projects, the objective of the CTA is to provide a structured, systematicapproach for process and equipment designers to identify and analyze the tasks performed on a unit that are critical to the safe operation of the process. The tasks might be performed during abnormal or high-cognitive-demand situations, such as emergencies or when the plant is put into “standby” mode. The tasks might also be selected for analysisbecause they have the potential for serious consequences if not performedcorrectly.
People are an essential and integral part of a process plant. The designof a process plant must take into account the capabilities and limitationsof the people who operate and maintain it. The safe operation of a processrelies on the successful completion of tasks performed by people, someof whom may be critical to the safety, environmental integrity, or relia-bility of the operation. These critical tasks take precedence during the
410 The Use of Human Factors in Project Planning, Design, and Exceution
Ch09qxd 11/21/03 09:19 PM Page 410

design of the unit. Task analysis techniques can be applied to existingtasks, as demonstrated in Chapter 7, or to tasks that do not yet exist. Thetechnique is the same in each application. The difference between the twoapplications is the amount of information available for the analysis.
The process described here is concerned mainly with the identificationand analysis of tasks associated with a new project. In this case, a projectmay be the design and construction of a major grassroots facility or theimprovement of an existing facility. In new projects, the tasks do not yetexist. Even so, they can be analyzed, and to do so, the analyst or the analy-sis team should have knowledge of
• The facility in which the operator will work.
• The equipment the operator will use.
• The environment in which the operator will perform.
• The activities the operator will be required to perform, typically cap-tured by a procedure as discussed in the previous section.
Often tasks that are similar to those on the new facility are performedelsewhere can be used as models for the nonexistent tasks to be analyzed.
For projects, the critical-task analysis process is divided into two parts:the identification of critical tasks for analysis and the analysis of thosetasks.
The identification of critical tasks begins at the planning phase of theproject and continues through to the start of detailed engineering. Eachshould be identified on the HFTDB. Critical tasks are those that
• Require people to work in abnormal environmental conditions forexcessive periods.
• Are performed in confined spaces for excessive periods.
• Require substantial periods of manual materials handling.
• Have the potential for significant safety, health, or environmentalincidents.
• Require workers to perform critical procedures [e.g., under processhazard analysis (PHA) regulation definitions].
The Use of Human Factors in Project Planning, Design, and Exceution 411
Ch09qxd 11/21/03 09:19 PM Page 411

• Have the potential for serious consequences if not performed correctly.
Case Study: Change of Boron Tri-Fluoride (BF3) Spheres
The case study that follows demonstrates the CTA process conductedfor the design of a batch process plant. Table 9-4 illustrates the taskschosen by the design team as the most critical in terms of the risk to plantpersonnel and property. The analysis was conducted using the process,which was introduced in Chapter 7. The data available for the task analy-sis consisted of the plastic model shown in Figure 9-3, P&ID drawings,and some two-dimensional plans and elevations.
The process was lead by a process designer and included on the processdesign team an operations representative, a safety engineer, and a humanfactors specialist. The results of the analysis are shown in Table 9-5. Notethat the format of the table is slightly different from the one in Chapter 7.
9.3.7.2 Link Analysis
Link analysis was discussed in detail in Chapter 6. For projects, theobjective of the link analysis is to ensure that equipment is laid out toallow the operators and maintenance staff to work efficiently. The layoutof a plant depends to a large extent on the way an operator or maintenancetechnician performs the task. For this reason, it is essential that proceduresfor the tasks be written prior to detailed engineering. The case study to
412 The Use of Human Factors in Project Planning, Design, and Exceution
TABLE 9-4
Critical Tasks Identified during the Design of a Chemical Plant
Remove pump, drain, and flush
Unload fresh caustic
Change boron tri-fluoride (BF3) spheres
Preventive maintenance (PM) of leak detection system
Sampling caustic
Unload carbon monoxide (CO)
Ch09qxd 11/21/03 09:19 PM Page 412
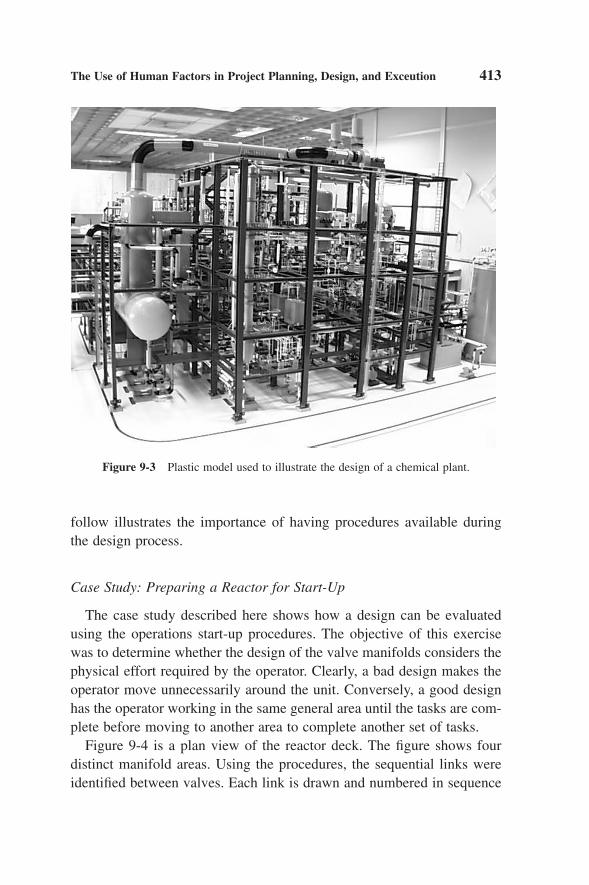
follow illustrates the importance of having procedures available duringthe design process.
Case Study: Preparing a Reactor for Start-Up
The case study described here shows how a design can be evaluatedusing the operations start-up procedures. The objective of this exercisewas to determine whether the design of the valve manifolds considers thephysical effort required by the operator. Clearly, a bad design makes theoperator move unnecessarily around the unit. Conversely, a good designhas the operator working in the same general area until the tasks are com-plete before moving to another area to complete another set of tasks.
Figure 9-4 is a plan view of the reactor deck. The figure shows fourdistinct manifold areas. Using the procedures, the sequential links wereidentified between valves. Each link is drawn and numbered in sequence
The Use of Human Factors in Project Planning, Design, and Exceution 413
Figure 9-3 Plastic model used to illustrate the design of a chemical plant.
Ch09qxd 11/21/03 09:19 PM Page 413
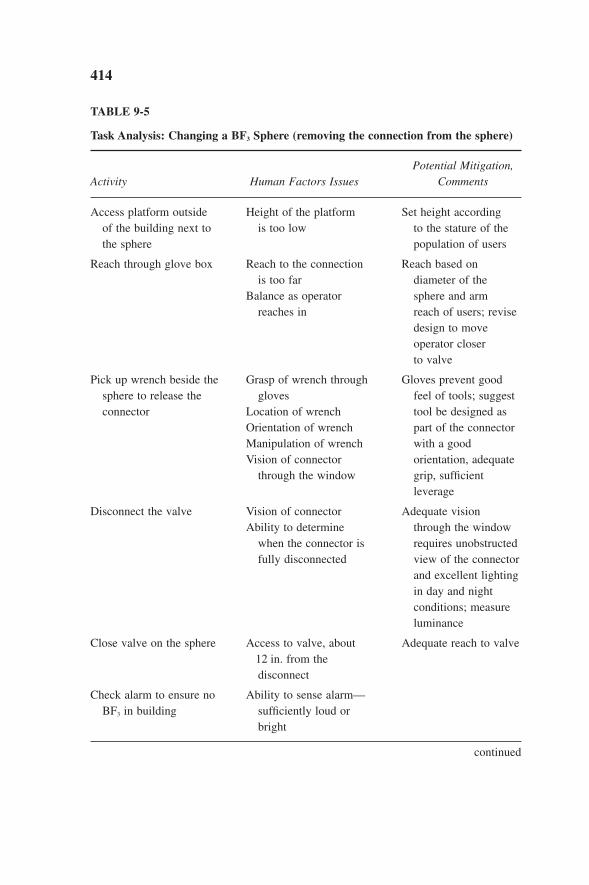
414
TABLE 9-5
Task Analysis: Changing a BF3 Sphere (removing the connection from the sphere)
Potential Mitigation,Activity Human Factors Issues Comments
Access platform outside Height of the platform Set height according of the building next to is too low to the stature of thethe sphere population of users
Reach through glove box Reach to the connection Reach based on is too far diameter of the
Balance as operator sphere and armreaches in reach of users; revise
design to move operator closerto valve
Pick up wrench beside the Grasp of wrench through Gloves prevent good sphere to release the gloves feel of tools; suggestconnector Location of wrench tool be designed as
Orientation of wrench part of the connectorManipulation of wrench with a good Vision of connector orientation, adequate
through the window grip, sufficientleverage
Disconnect the valve Vision of connector Adequate vision Ability to determine through the window
when the connector is requires unobstructedfully disconnected view of the connector
and excellent lightingin day and nightconditions; measureluminance
Close valve on the sphere Access to valve, about Adequate reach to valve12 in. from thedisconnect
Check alarm to ensure no Ability to sense alarm—BF3 in building sufficiently loud or
bright
continued
Ch09qxd 11/21/03 09:19 PM Page 414

The Use of Human Factors in Project Planning, Design, and Exceution 415
TABLE 9-5 Continued
Potential Mitigation,Activity Human Factors Issues Comments
Open door to building Interlock between alarm Ensure operator canand door prevents identify when door from opening if interlockinterlock fails, where is operates and whatemergency shower it means, byand alarm? training and signs
Complete disconnect Reach connector from Simulate before within the building finalizing the design
Orientation to the connectorManipulation of wrench
Remove sphere with Operation of forklift Should be simulated forklift Vision of sphere from using a mockup of
forklift the design prior to Room to manipulate finalizing the design
forklift of the building
Replace with new Removal of sphere from sphere storage and replacement
of spent sphereOrient new sphere so
the connectors line up
Connect sphere to line
Exit building
Open valve from glove box
in the drawing. The task starts at activity 1 and progresses sequentiallythrough to activity 17. The analysis demonstrates the following issues:
• In most cases, the process designer located the equipment so the dis-tance the operator travels between activities is minimized.
• Exceptions are apparent: Travel between activities 5 and 6 is exces-sive; travel is required to the next level (6m) to perform activity 10.
The stairs designed to travel to the next higher level are at the end ofthe structure. If a set of stairs is installed between the levels where mostof the activity takes place, the physical stress on the operator is reducedsubstantially. In addition, if valve B3 were relocated to manifold 63, the
Ch09qxd 11/21/03 09:19 PM Page 415
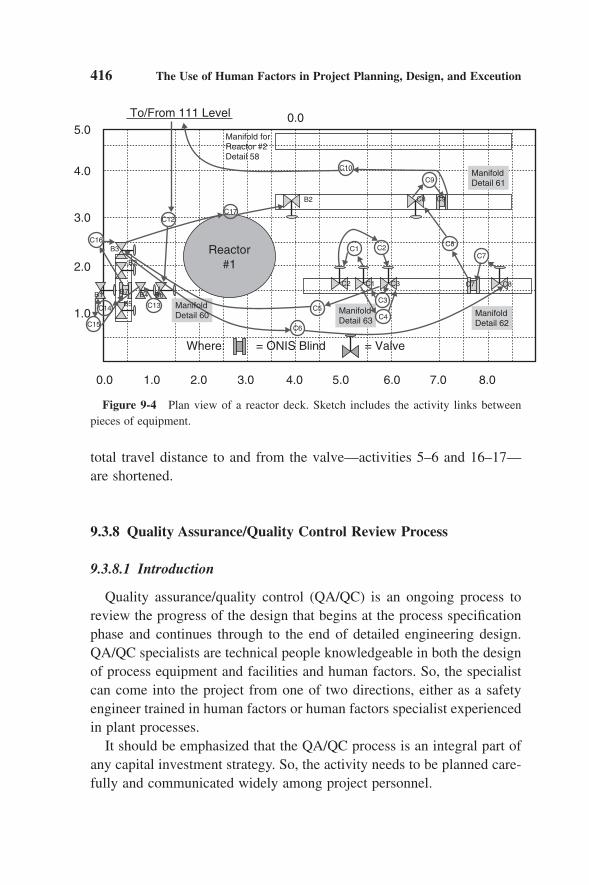
total travel distance to and from the valve—activities 5–6 and 16–17—are shortened.
9.3.8 Quality Assurance/Quality Control Review Process
9.3.8.1 Introduction
Quality assurance/quality control (QA/QC) is an ongoing process toreview the progress of the design that begins at the process specificationphase and continues through to the end of detailed engineering design.QA/QC specialists are technical people knowledgeable in both the designof process equipment and facilities and human factors. So, the specialistcan come into the project from one of two directions, either as a safetyengineer trained in human factors or human factors specialist experiencedin plant processes.
It should be emphasized that the QA/QC process is an integral part ofany capital investment strategy. So, the activity needs to be planned care-fully and communicated widely among project personnel.
416 The Use of Human Factors in Project Planning, Design, and Exceution
C13
C15
C16
C12C17
C10
B2
C1
C5
C6
C3
C4
C2
C2 C1 C3 C7 C8
C9
C8
C8 C9
C7
C14
B3
B1 B7
B5B4
B2
B6
Manifold forReactor #2Detail 58
ManifoldDetail 60 Manifold
Detail 63ManifoldDetail 62
ManifoldDetail 61
Where: = ONIS Blind = Valve
Reactor#1
4.0
3.0
2.0
1.0
1.0 2.0 3.0 4.0 5.0 6.0 7.0 8.00.0
5.00.0To/From 111 Level
Figure 9-4 Plan view of a reactor deck. Sketch includes the activity links betweenpieces of equipment.
Ch09qxd 11/21/03 09:19 PM Page 416

The responsibilities of the QA/QC, human factors specialist are to
1. Train the project team, plant personnel, and contractors, in humanfactors issues. After the training, each member of the team shouldbe aware of how the capabilities and limitations of operations andmaintenance personnel are affected by the design of the equipmentand facilities for which each is responsible.
2. Ensure that the issues identified on the HFTDB are resolved by theplant and contractor project staff.
3. Evaluate the impact of design changes on the capabilities and limi-tations of the plant operations and maintenance personnel.
4. Work closely with QA/QC specialists in other disciplines, especiallysafety, to ensure that human factors matters are adequately reviewed.Other specialists may be responsible for
Rotating machinery (pumps and compressors).Mechanical (including piping, valves, blinds).Structural (including stairs, ladders, platforms).Vessels (including reactors, exchangers, fired heaters).Instruments and electrical equipment.Off-site equipment (e.g., storage tanks).
The QA/QC process begins after the process design specification andis completed at the end of detailed engineering.
9.3.8.2 Conducting the QA/QC Process
QA/QC process is conducted by the application of a systematic processthat is explained in the following paragraphs.
Visits to the Contractor’s Offices
The initial visit of the HF specialist to the contractor’s office servesseveral highly important functions and is significant in establishing thehuman factors QA/QC control of the job. The first purpose of this initialvisit is to review the items on the HFTDB identified throughout theproject. Decisions are made on how these items affect design decisions.
The Use of Human Factors in Project Planning, Design, and Exceution 417
Ch09qxd 11/21/03 09:19 PM Page 417

In addition to the HF tracking items, areas that require early resolutionand review include
• Layout. The HF specialist should be involved in any plot planchanges that result from increased equipment sizes, structuralchanges affecting access, or overall process changes.
• The type of all emergency block valves (EBVs) and the frequency ofoperation of all valves to determine their access.
• Function, layout, labeling, and location requirements for all controlpanels and consoles.
• Labels and safety sign requirements for equipment.
• Access requirements for complex or skid-mounted equipment (e.g.,pump units, compressors, lube oil units, and furnace burners).
Finally, any special needs and requirements specific to the individualjob, where problems may be anticipated, should be discussed at this time.
Preparation of a QA/QC Checklist
The purpose of the human factors QA/QC checklist is to communicatethe scope of work of the HF specialist. While the human factors QA/QCchecklists should be as extensive as possible, the topics on the initialchecklists are identified in discussions with the project management team and the contractor during the initial visit to the contractor’s office.For example, the availability of a three-dimensional computer-aideddesign (3D CAD) model is an important factor in determining to whatextent preliminary and final drawings of the contractor should bereviewed.
Human factors QA/QC checklists vary with the project. Most check-lists are one to two pages long, listing the project documents requestedfor the review and the approximate timing of major topics to be reviewed.Appendix 9-3 contains a comprehensive master checklist covering mosthuman factors involvement (assuming a detailed model is available). Thechecklist helps improve communication between project engineers andHF specialists during the detailed engineering phase of a project.
418 The Use of Human Factors in Project Planning, Design, and Exceution
Ch09qxd 11/21/03 09:19 PM Page 418

HF Training for Contractor’s Staff
In many cases, the location of equipment, controls, and display panelsdetermines whether a facility is “designed for human use.” The projectpersonnel who most influence the location of equipment are the contractdesigners tasked with laying out the plant. The most effective way to con-vince contractors of the importance of HF to good design is to providethem with training that contains concrete examples of facilities with goodhuman factors features. Each designer requires human factors informationin his or her specialty, such as mechanical design, not in those of others.So, the QA/QC training should be optimized by presenting selectedmodules from the full project-training course in specific topics, such asmechanical design, instrument and electrical design, or process controlsystems design. The subjects of the training modules and their intendedaudiences are listed in the matrix in Table 9-6. Training costs money. So,to ensure that the training takes place, it must be agreed to ahead of timeand included in the services contract.
Human Factors Model Review
The main objective of the human factors model review is to confirmthat the critical-task and design issues identified on the human factorstracking database (Section 9.3.1) have been addressed during the engi-neering design. This tool provides a method to permit the project designteam to review, systematically, plastic models, 3D CAD models, or draw-ings for human factors and ergonomic issues; identify specific humanfactors problems in the detailed design; and suggest areas or designs thatneed improvement. This approach allows for review at different stages ofthe design development, but the review should provide feedback early inthe detailed engineering process to avoid costly late changes.
The model review process normally begins at about the 30% comple-tion stage of the engineering design. Most large equipment and majorfacilities have been laid out and most large piping and valves (>8cm, 3 in.) are in place.
The model should be capable of
• Providing accurate distances between equipment and vertical dis-tance between equipment and platforms or grade.
The Use of Human Factors in Project Planning, Design, and Exceution 419
Ch09qxd 11/21/03 09:19 PM Page 419

TABLE 9-6
Training Matrix for Key Plant Positions Recommended Modules by Position
Human
Human Factors Human Human Human Factors in Human Comments and
Intro to in Project Factors in Factors in Factors in Process Factors Human Estimate Time
Key Human Design and Mechanical Instrumentation Electrical Control Project Factors in Commitment
Positions Factors Implementation Design Design Design Design Tools Construction (hr)
Project development ✓
committeeProject coordinators/ ✓ ✓ ✓ ✓ ✓ ✓ ✓ ✓ Full course: about
engineers 14 hrProcess designers ✓ ✓ ✓ ✓ ✓ ✓ ✓
Process engineers ✓ ✓ ✓ ✓ ✓ ✓ ✓
Field engineers ✓ ✓ ✓ ✓ ✓ ✓ ✓ ✓
Contractor engineering ✓ ✓ ✓ ✓ ✓ ✓ ✓ ✓
staffContractor design and ✓ ✓ ✓ ✓ ✓ Lead specialist
construction leadspecialists:
• Mechanical ✓ ✓ ✓ ✓ ✓ Lead specialistcontractor design training: about 4 hrand constructionlead specialists
• Instrumentation ✓ ✓ ✓ ✓ Lead specialistcontractor design ✓ training: about 4 hrand constructionlead specialists
• Electrical ✓ ✓ ✓ Lead specialistcontractor design ✓ training: about 4 hrand constructionlead specialists
• Process controlsystems
Area project teams ✓ ✓ ✓ ✓ ✓ ✓
✓ ✓
Ch09qxd 11/21/03 09:19 PM Page 420

• Visually comparing vertical and horizontal reaches with the 5th per-centile user population (see Chapters 2 and 6).
• Visually comparing vertical and horizontal clearances with the 95thpercentile user population (see Chapters 2 and 6).
Two techniques can be used to evaluate the model. The first is to eval-uate the design against the results of the task analyses conducted prior tothe start of the engineering design. Critical-task analyses are described inSection 9.3.6. The second is to apply review checklists to evaluate themodel: one for maintainability and a second for operations.
The maintenance checklist (Appendix 9-4) can be used as each drawingsection is completed. This allows for easy and early review of the drawingdesign. The walkthrough or rounds checklist (Appendix 9-5) requires thatall stairs, ladders, and platforms be completed to simulate the movementsof an operator through the plant. The walkthrough simulates the move-ments and actions that an operator would actually perform in the field oncethe plant is in service. It should catch any deficiencies not previouslycaught in the maintenance reviews.
The design is then modified by the solutions generated at the 30%design review. The proposed solutions are re-reviewed at the 50% designstage. A final review, at about the 80% design completion stage, can beused to evaluate the design of local control panels and the placement ofsample points.
The following case study illustrates the benefits of an early modelreview. Figure 9-5 is a 3D CAD model of a unit designed to mix an additive with a blender containing existing product. In this design, theadditives are contained in cylinders. The cylinders are transported to thestructure in groups of four by a forklift and lifted to the top of the struc-ture using a cable winch. Referring to the numbers on the figure, the fol-lowing issues were discovered in the review:
1. The connection to the hoist is awkward and time consuming withthe potential for operator error.
2. The load is permitted to swing freely and turn on the cable as it islifted to the third floor.
The Use of Human Factors in Project Planning, Design, and Exceution 421
Ch09qxd 11/21/03 09:19 PM Page 421

3. At the top of the lift, the operator is expected to steady the loadwith one hand and operate the lift control with the other.
4. The operator must have two lift-control stations, one at level 1, the other at level 3. The question of control interlocks becomescomplicated.
The cylinders were then transported on a rail to a storage position (Figure9-6). The issues associated with this operation are illustrated by numberin Figure 9-6 and explained next:
5. At the top, operator is expected to work under a live load as he or she guides the four-pack on the monorail around to the storagearea.
6. The four-pack must clear the screw blender as it is guided to itsstaging position.
422 The Use of Human Factors in Project Planning, Design, and Exceution
1
2
3
4
Figure 9-5 Reactor structure showing paths to access stairs to upper deck.
Ch09qxd 11/21/03 09:19 PM Page 422

An articulating arm is used to carry the cylinders to the blender (Item 7,Figure 9-7), rotate them upside down, and mate them with the drum. Thearm returns the empty cylinders to storage. Referring to the numbers inFigure 9-7, the following issues are identified:
7. Each cylinder is grabbed, rotated upside down, and mated with aconnector on top of the blender. The operation requires precisemotor movements.
8. Once the cylinders are empty, they are returned to the pallet. Howthe cylinders in the rear of the pallet are accessed is not consideredin the design.
These notes illustrate the problems faced by the operator with thisdesign. As it turns out, the problems cannot be easily resolved and the
The Use of Human Factors in Project Planning, Design, and Exceution 423
5
6
Figure 9-6 Plan view of mixing deck showing transporting rail.
Ch09qxd 11/21/03 09:19 PM Page 423

concept is scrapped. A new concept, designed to blow additive from gradeto the mixing drum (Figure 9-8), replaces the original concept. Thenumbers on Figure 9-8 illustrate these considerations:
9. The additive now is delivered in a drum.
10. The additive is blown to a weigh pot.
11. The whole operation is controlled from a panel at grade.
The results of the model review are estimated to have saved the companyalmost $1 million in terms of redesign, new equipment, and business inter-ruptions—not to mention the safety of the operator.
424 The Use of Human Factors in Project Planning, Design, and Exceution
Figure 9-7 Perspective view of chemical mixing deck.
Ch09qxd 11/21/03 09:19 PM Page 424

Wrap-up Meeting
A final wrap-up meeting with the contractor should be planned near theconclusion of the human factors QA/QC effort. The purpose of thismeeting is to verify the status of the contractor’s compliance with cor-rections identified during previous QA/QC visits. The meeting should bescheduled after each human factors item has been reviewed. The finalreview is carried out primarily with the project engineer who had beencoordinating the safety QA/QC effort. It also includes those contractorrepresentatives involved in areas where significant problems had beenidentified.
9.3.9 Prestart-up Human Factors Review
The prestart-up human factors review is a plant walkthrough (surveil-lance) process conducted with a checklist. For capital projects, theprestart-up review is conducted at about 90% of plant construction
The Use of Human Factors in Project Planning, Design, and Exceution 425
9
10
11
Figure 9-8 Revised design of mixing facility of grade level.
Ch09qxd 11/21/03 09:19 PM Page 425

completion. The same review should also be conducted for all “change”work (base projects and maintenance). The surveillance team should becomposed of an HF specialist as well as operations, maintenance, safety,and engineering personnel. Ideally, the review covers all SHE aspects of theproject, including human factors. A good practice is to ensure that the teamincludes members who represent the 5th and 95th percentile statures of theuser population. The questions relating to visual performance of the equip-ment should be conducted at night, to ensure that sufficient lighting has beenprovided, and during the day, to ensure that the sun’s glare is not an issue.
An essential part of the prestart-up review is to check the status of allHF follow-up items from the beginning of the project. The HFTDB is keyto this activity. Follow-up activities are developed for those items that failthe review or require further investigation. The HF prestart-up checklistis located in Appendix 9-6.
9.3.10 HF Awareness for Construction Contractors and Company Personnel
During construction, the project should have two major human factorsobjectives: Build the project without injury to the contract or project workforce, and ensure that the facilities are built to be safe and efficient for theowner to operate and maintain. Objective 1 means paying attention to thesafety of the workers. Objective 2 means making sure that equipment isinstalled to minimize rework due to unsafe or inefficient implementation.
For capital projects, brief awareness sessions should be conducted bycontractor specialty (e.g., piping, electrical, instrumentation) up throughthe foreperson level. The sessions should be based on the awareness pack-ages developed for the teams participating in the QA/QC reviews. Forbase projects, the training could be conducted every 6 months to ensurenew field workers and forepersons are trained.
Demonstrations of the proper methods for field-run wiring, routingsmall bore piping, and the like are conducted using existing plant equip-ment, sketches, mock-ups, and so forth. Appendix 9-7 provides a summaryof recommendations to field workers that could be used in a trainingsession. Each recommendation should be illustrated with a photo to makethe training more meaningful and interesting.
426 The Use of Human Factors in Project Planning, Design, and Exceution
Ch09qxd 11/21/03 09:19 PM Page 426

HF awareness through training and mock-ups helps raise the awarenessof construction personnel, demonstrates how to field-run equipment, andinstructs the workers what to do if they encounter a potentially unsafe orinefficient design. The program minimizes the potential for rework tocorrect human factors issues.
9.3.11 Postproject Review
The first objective of the postproject review is to capture the “learning”gained, positive and negative, that helps improve the project executionprocess. By so doing, future projects are planned, designed, and executedmore efficiently and the quality of the finished product is continuallyimproved.
The format of the postproject review and the level of effort spent on it depend on the size of the project. Clearly, larger, more-complicated projects have more opportunity for mistakes than smaller ones. So, morereview effort is typically required for capital than for base projects.
For major projects, the process coordinator is best positioned to “own”the postproject review process. However, the learning gained should begathered during each project phase and the collection process should bemanaged by those responsible for the completion of each project phase(Figure 9-1). For base projects, the local project team would gather theitems learned.
To achieve the most benefit from the process, learning gained shouldbe captured at the end of each project phase, at the point where the projectis handed off to the next person responsible. Memories fade with time andproject notes are often lost or misfiled. The most complete information isobtained if gathered as soon as possible after each project phase is com-pleted. Finally, the owners of each project phase should come togetherwithin 6 months after the project is complete to share and discuss thelearning gained and document such learning in a final project report. Thissection recommends how to capture the learning gained on the humanfactors component of the project. The human factors learning process isbased on answering the questions in Table 9-7.
The final process in the postproject review is to “benchmark” per-formance against that achieved by other projects both within the site or
The Use of Human Factors in Project Planning, Design, and Exceution 427
Ch09qxd 11/21/03 09:19 PM Page 427

company or outside the company. Benchmarking consists of comparingthe answers to the questions posed in Table 9-7 to those obtained fromsimilar projects elsewhere. Most comparisons are based on qualitativeinformation, such as “by developing our operations procedures prior todetailed engineering, we were able to perform a more complete 3D CADreview than in previous projects.” However, other answers might be quan-titative. For example, from our experience, the cost of the human factors
428 The Use of Human Factors in Project Planning, Design, and Exceution
TABLE 9-7
Questions to Capture Human Factors Learning Gained from a Project
Question Response or Discussion
What HF issues were identified during each phase for the project and added to the HF issues tracking list?
Did we identify the right things?
Did we identify them at the right time?
Did we use the proper tools and processes?
Did we engage the right individuals in the process?
Did we follow up properly?
Can we identify the benefits of incorporating a human factors perspective in terms of
• Potential reduction of injuries or illnesses (to contractor
personnel during the construction of the facility? to
plant personnel during the operation of the facility?)
• Potential reduction in the cost to operate and maintain the
facility in terms of personnel, equipment, and losses
(production or equipment)
How much did the human factors effort cost in terms of
• People (time of staff, consultants)
• Equipment that had to be added solely as a result of human
factors improvements
• Schedule delays solely as a result of human factors changes
How can we improve the application of human factors approaches during each phase of the project?
Ch09qxd 11/21/03 09:19 PM Page 428

effort in large capital projects is typically in the range of 0.05% of thecost of the project. So, for a $100 million project, the typical cost for plantand contractor effort is $50,000. This cost varies between 0.03 and0.075%. The percentage cost typically increases as the value of the projectdecreases. The benchmarking process could compare the HF effortexpended in each project against historical data.
For base projects, the benchmarking responsibility rests with the localproject owner, who obtains data from the local project team. The respon-sibility for human factors benchmarking in major projects is typically withthe project coordinator (Figure 9-1) with the assistance of the project staff.
REVIEW QUESTIONS
1. Task procedures should be written (choose one)a. Prior to the planning stage of the project?b. As soon as possible after the QA/QC process has been
completed?c. Between construction completion and postproject review?d. Prior to the start of detailed engineering?
2. Base or local projects differ from capital projects in the followingways (True or False)a. Base projects do not require the use of a project model.b. Base projects are typically managed by site teams.c. HAZOPs are always conducted.
3. Which phrase does not belong in the following list?a. Human factors tracking database.b. NIOSH lifting assessment.c. Hazard and operability review.d. Critical-task analysis.
4. Answer yes or no: Human factors training is conducted as part ofthe QA/QC assessment.
5. Answer true or false: The purpose of the prestart-up human factorsreview is to capture the learning from the accomplishments and mistakes identified in the project.
The Use of Human Factors in Project Planning, Design, and Exceution 429
Ch09qxd 11/21/03 09:19 PM Page 429

6. Answer true or false: The purpose of benchmarking is to ensure thatthe results of the project are reported to senior management of thecompany?
7. Fill in the blanks: This chapter is about the use of human factors inproject ______________, ______________, and ______________.
8. Answer true or false: Human factors issues are not identified in theproject until the detailed engineering phase.
430 The Use of Human Factors in Project Planning, Design, and Exceution
APPENDIX 9-1
HAZOP Human Factors Screening Lists
ValvesCheck box if the statement is true.� The valve is used for maintenance or turnaround or is used so infrequently as to
have no human error or musculoskeletal significance.
The location and use of the valve does not have to be analyzed. The HF provisions are sufficient.
HF follow-up is required for this valve if any of the following boxes is checked.
� Valve is operated manually in an emergency, so the operator must be
able to get at it quickly and operate it easily and without mistake.
� Valve is operated sequentially and its position and operation must
be considered in relation to other valves.
� The incorrect operation of the valve exceeds safe operating envelope and noapparent mitigation strategy has been implemented into the design. In this event, atask analysis must be considered in case the valve manipulation is an integral part ofa task exceeding 7 steps or requires interaction with other operations.
� The valve is operated remotely from a field location, so the design of the controlpanel is important to consider.
Blinds and BlanksCheck box if the statement is true. HF follow-up is required for this blind if any of the following boxes is checked.
� Access to the blind is not defined or is difficult [too high, reach is excessive,obstructed, weight is �23 kg (51 lb)].
� The blind has no associated bleed and drain valves or no clearly defined safe drainlocation.
Ch09qxd 11/21/03 09:19 PM Page 430

� The blind is an unfamiliar design not used before in the plant (e.g., proprietaryblind).
� The blind is used in an extreme service (toxic, exposure criteria, pressure �50 barg,temperature �200�C).
Pumps and CompressorsCheck box if the statement is true. HF follow-up is required for this pump orcompressor if any of the following boxes is checked.
� Must be blown to a closed system before maintenance, and product or process, ishazardous.
� Local controls and displays are associated with start-up, shutdown, or surveillance.
� Start-up, shutdown, or abnormal operations require tasks with more than seven stepsand interaction with other operations.
� High noise levels are expected.
� Auxiliary systems are package units for which design standards may not fully apply.
Field Display PanelsCheck box if the statement is true. HF follow-up is required for this panel if any of thefollowing boxes is checked.
� Use of the panel requires a procedure with more than seven steps.
� Multiple panels that operate similar equipment are used on the unit (design isconsistent and layout provided).
� Panels are used under all light conditions (lighting sufficient and glare eliminated).
� Panels are used under emergency conditions (clarity of layout sufficient).
� Panels are used during normal surveillance (located in surveillance path).
Fire Fighting and Deluge SystemsCheck box if the statement is true. HF follow-up is required at the model or field review
for these systems if any of the following boxes is checked.
� Operator of the “fire monitor” does not have a clear line of sight to the target.
� Operator’s access to fire monitor or hydrant is obstructed.
� Local deluge activation box is not located on an escape route.
� Main deluge panels are not located at unit periphery.
� Main deluge panels contain controls for three or more geographical coverage areas.
Instrumentation SystemsCheck box if the statement is true. HF follow-up is required for these systems if any of the following boxes is checked.
The Use of Human Factors in Project Planning, Design, and Exceution 431
Ch09qxd 11/21/03 09:19 PM Page 431

HAZOP Human Factors Screening Lists Continued
� Instrument must be accessed frequently for calibration, clearing, rodding.
� Instrument is located in an area potentially hazardous to the operator, such as heat,elevation, exposure to process.
� Clearing or rodding requires more space than provided by design standards.
� Instrument is itself inherently dangerous (e.g., radioactive).
Sample PointsCheck box if the statement is true. HF follow-up is required for this sample point if any of the boxes is checked.
� The product being sampled is in a hazard class where defined exposure criteria mustbe observed.
� The sample point is located above grade.
� The sample system is not using a closed purge system.
� Access to the sample point does not consider the operator wearing PPE.
Reactors and DryersCheck box if the statement is true. HF follow-up is required for this equipment if any of the boxes is checked.
� Reactor must be entered for cleaning, repair, catalyst filling.
� Reactor catalyst is toxic, reactive, pyrophoric, and must be handled by personnel.
� Multiple reactors must be switched frequently.
Vessels: Towers, Drums, and ExchangersCheck box if the statement is true. HF follow-up is required if any of the boxes is checked.
� Vessel must be entered for cleaning or maintenance.
� Vessel contents are hazardous, reactive, pyrophoric, or decomposing and entryrequires wearing PPE or taking other precautions.
Furnaces and Fired HeatersCheck box if the statement is true. HF follow-up is required if any of the boxes is checked.
� Furnace is manually lighted.
� Furnace is automatically lighted from a remote location and no local panel isprovided.
� Inside of the fire box requires frequent visual monitoring.
� Furnace must be frequently decoked, switched, or visited.
432 The Use of Human Factors in Project Planning, Design, and Exceution
Ch09qxd 11/21/03 09:19 PM Page 432

The Use of Human Factors in Project Planning, Design, and Exceution 433
FiltersCheck box if the statement is true. HF follow-up is required if any of the following boxes is checked.
� Filter must be frequently cleaned, cleared, drained, or switched.
� Product being filtered is hazardous or PPE must be worn by operator.
� Weight of filter element or filter cover exceeds 23 kg (51 lb).
� Height of top of filter is above grade or floor of platform and length of filter elementexceeds shoulder height of the female user population.
Loading and Unloading FacilitiesCheck box if the statement is true. HF follow-up is required if any of the following boxes is checked.
� The product being loaded or unloaded is in a hazard class where defined exposurecriteria must be observed.
� The loading or unloading operation requires a task with more than five steps andinteraction with others (people, computer) during the operation.
� The weight of facilities (arm, hose, platforms, etc.) to be manipulated manuallyexceeds 23 kg (51 lb).
� Top loading or unloading is required.
Ch09qxd 11/21/03 09:19 PM Page 433

434 The Use of Human Factors in Project Planning, Design, and Exceution
APPENDIX 9-2
Assistance Using HAZOP Screening Lists (includes examples of poor design andpotential solutions)
Screening Question (Sample Points) Example Situation Potential Solution
The product sampled is in a Caustic sample point. Operator has hazard class where defined Sample valve and unobstructed exposure criteria must be outlet are not located access to safety observed close together. showers and
eyewash stations asper standards
The sample point is located Sample is hazardous Sample accessible above grade or open and must be from a platform
carried downstairs. If a harmful substance, two escape meansprovided
The sample system does not use Sample bomb in If closed purge, the a closed purge system closed purge system sample loop is long
enough to allowOpen system for operator access to
caustic samples the sample pointwithout obstruction
Strahman valves If not closed purge, then operator hasunobstructed accessto sampling station
Access to the sample point does Hazardous sample Unobstructed access not consider the operator without a closed to sample point is wearing PPE purge system assured if operator
is wearing PPE. Sample point should be at grade. Consider modifying to a closed loop samplesystem to eliminate need for PPE.
Ch09qxd 11/21/03 09:19 PM Page 434
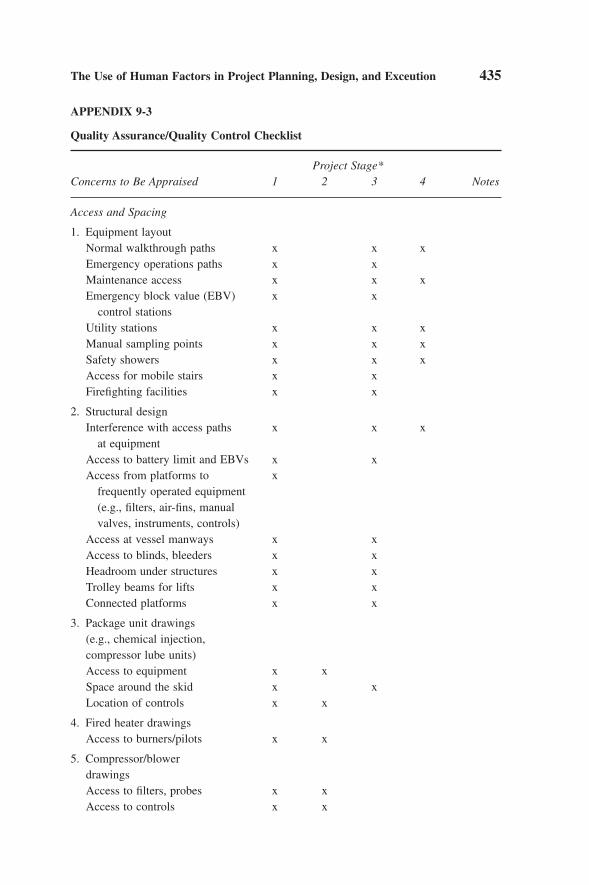
The Use of Human Factors in Project Planning, Design, and Exceution 435
APPENDIX 9-3
Quality Assurance/Quality Control Checklist
Project Stage*Concerns to Be Appraised 1 2 3 4 Notes
Access and Spacing
1. Equipment layoutNormal walkthrough paths x x xEmergency operations paths x xMaintenance access x x xEmergency block value (EBV) x x
control stationsUtility stations x x xManual sampling points x x xSafety showers x x xAccess for mobile stairs x xFirefighting facilities x x
2. Structural designInterference with access paths x x x
at equipmentAccess to battery limit and EBVs x xAccess from platforms to x
frequently operated equipment (e.g., filters, air-fins, manual valves, instruments, controls)
Access at vessel manways x xAccess to blinds, bleeders x xHeadroom under structures x xTrolley beams for lifts x xConnected platforms x x
3. Package unit drawings (e.g., chemical injection, compressor lube units)Access to equipment x xSpace around the skid x xLocation of controls x x
4. Fired heater drawingsAccess to burners/pilots x x
5. Compressor/blower drawingsAccess to filters, probes x xAccess to controls x x
Ch09qxd 11/21/03 09:19 PM Page 435

436 The Use of Human Factors in Project Planning, Design, and Exceution
Quality Assurance/Quality Control Checklist Continued
Project Stage*Concerns to Be Appraised 1 2 3 4 Notes
6. Piping designValve reach x x x xValve spacing x x x xValve position indication x xAccess to safety valves x xAccess to instruments x x x xManual sampling stations x x x
Control interface
1. Control panel layoutsAlarm layout/location x xControls layout/location x xType of emergency shutdown x x
(ESD) switchesDisplay convention x xConsistency of controls x xVisibility day/night x xLabels x x
2. Audible alarm dataAlarm variability (H2S, fire) xAlarm locations/audibility x
3. Control room (CR) console drawingsPriority 1 alarm layout/location xCommunication module xTV monitors xStorage space for manuals x
Electrical interface
1. Building layout, doors, ramps, x xbreaker lifts
2. Transformers x x
3. Switchgear x x
4. Motor control center x x
5. Battery storage x x
6. Labels/tagging x x
Ch09qxd 11/21/03 09:19 PM Page 436

Project Stage*Concerns to Be Appraised 1 2 3 4 Notes
Work Environment
1. Lighting layoutNight illumination x
2. Climate control designTemperature control xHumidity control x
Labels
1. Label system dataEquipment/piping xInstruments/controls xTagging requirements info xLabel size/visibility x
2. Color coding dataEmergency valves x x
*Time sequence at stage of execution:
1. Kickoff meeting/training session.
2. Vendor drawings (compressors, furnaces, control panels).
3. Contractors detailed drawings (plot plant, piping layouts).
4. Final Computer assisted drawing (CAD) model review.
The Use of Human Factors in Project Planning, Design, and Exceution 437
Ch09qxd 11/21/03 09:19 PM Page 437
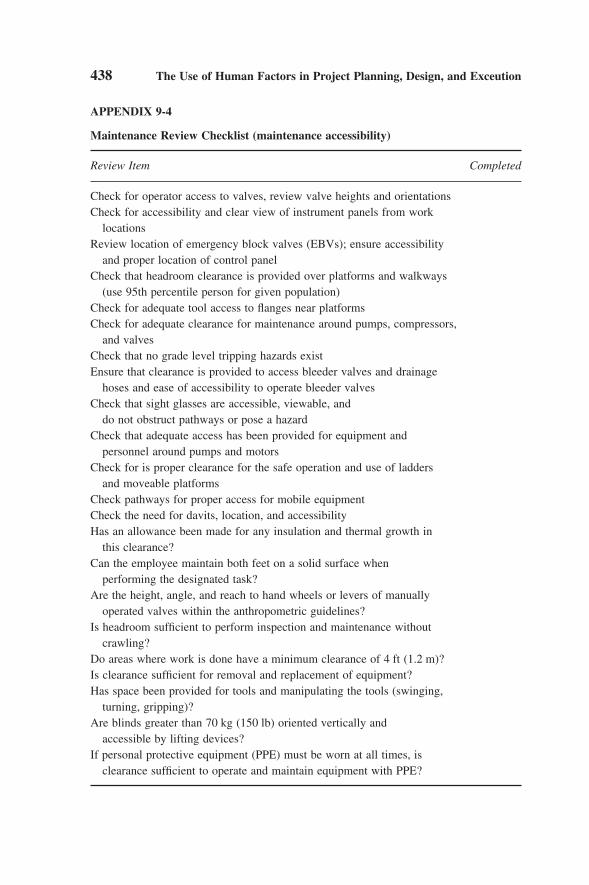
438 The Use of Human Factors in Project Planning, Design, and Exceution
APPENDIX 9-4
Maintenance Review Checklist (maintenance accessibility)
Review Item Completed
Check for operator access to valves, review valve heights and orientations Check for accessibility and clear view of instrument panels from work
locationsReview location of emergency block valves (EBVs); ensure accessibility
and proper location of control panelCheck that headroom clearance is provided over platforms and walkways
(use 95th percentile person for given population)Check for adequate tool access to flanges near platformsCheck for adequate clearance for maintenance around pumps, compressors,
and valvesCheck that no grade level tripping hazards existEnsure that clearance is provided to access bleeder valves and drainage
hoses and ease of accessibility to operate bleeder valvesCheck that sight glasses are accessible, viewable, and
do not obstruct pathways or pose a hazardCheck that adequate access has been provided for equipment and
personnel around pumps and motorsCheck for is proper clearance for the safe operation and use of ladders
and moveable platformsCheck pathways for proper access for mobile equipmentCheck the need for davits, location, and accessibilityHas an allowance been made for any insulation and thermal growth in
this clearance?Can the employee maintain both feet on a solid surface when
performing the designated task?Are the height, angle, and reach to hand wheels or levers of manually
operated valves within the anthropometric guidelines?Is headroom sufficient to perform inspection and maintenance without
crawling?Do areas where work is done have a minimum clearance of 4 ft (1.2 m)?Is clearance sufficient for removal and replacement of equipment?Has space been provided for tools and manipulating the tools (swinging,
turning, gripping)?Are blinds greater than 70 kg (150 lb) oriented vertically and
accessible by lifting devices?If personal protective equipment (PPE) must be worn at all times, is
clearance sufficient to operate and maintain equipment with PPE?
Ch09qxd 11/21/03 09:19 PM Page 438
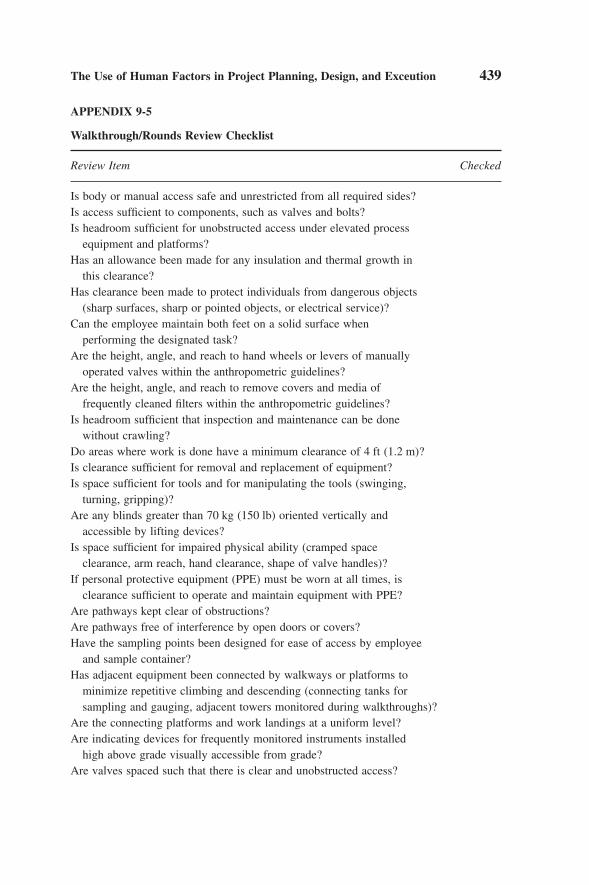
The Use of Human Factors in Project Planning, Design, and Exceution 439
APPENDIX 9-5
Walkthrough/Rounds Review Checklist
Review Item Checked
Is body or manual access safe and unrestricted from all required sides?Is access sufficient to components, such as valves and bolts?Is headroom sufficient for unobstructed access under elevated process
equipment and platforms?Has an allowance been made for any insulation and thermal growth in
this clearance?Has clearance been made to protect individuals from dangerous objects
(sharp surfaces, sharp or pointed objects, or electrical service)?Can the employee maintain both feet on a solid surface when
performing the designated task?Are the height, angle, and reach to hand wheels or levers of manually
operated valves within the anthropometric guidelines?Are the height, angle, and reach to remove covers and media of
frequently cleaned filters within the anthropometric guidelines?Is headroom sufficient that inspection and maintenance can be done
without crawling?Do areas where work is done have a minimum clearance of 4 ft (1.2 m)?Is clearance sufficient for removal and replacement of equipment?Is space sufficient for tools and for manipulating the tools (swinging,
turning, gripping)?Are any blinds greater than 70 kg (150 lb) oriented vertically and
accessible by lifting devices?Is space sufficient for impaired physical ability (cramped space
clearance, arm reach, hand clearance, shape of valve handles)?If personal protective equipment (PPE) must be worn at all times, is
clearance sufficient to operate and maintain equipment with PPE?Are pathways kept clear of obstructions?Are pathways free of interference by open doors or covers?Have the sampling points been designed for ease of access by employee
and sample container?Has adjacent equipment been connected by walkways or platforms to
minimize repetitive climbing and descending (connecting tanks for sampling and gauging, adjacent towers monitored during walkthroughs)?
Are the connecting platforms and work landings at a uniform level?Are indicating devices for frequently monitored instruments installed
high above grade visually accessible from grade?Are valves spaced such that there is clear and unobstructed access?
Ch09qxd 11/21/03 09:19 PM Page 439
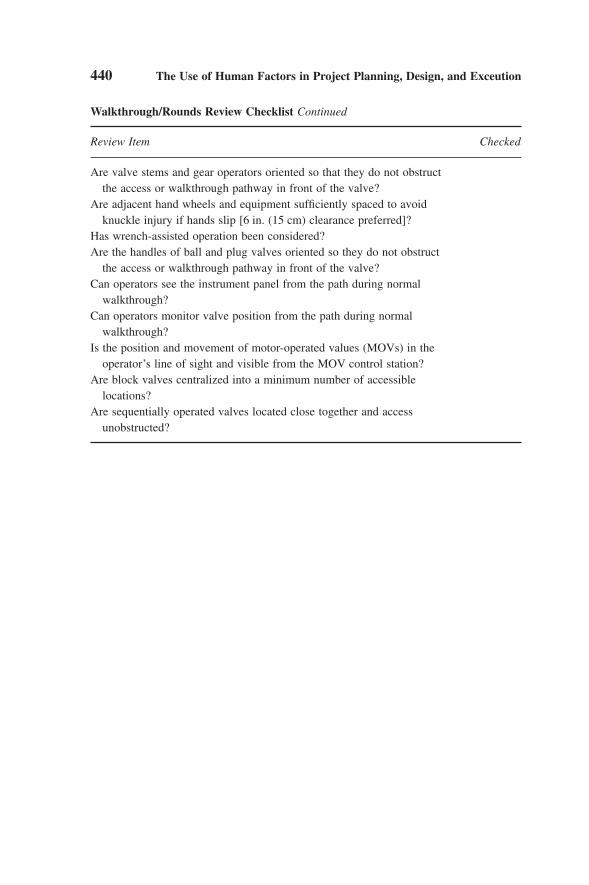
Walkthrough/Rounds Review Checklist Continued
Review Item Checked
Are valve stems and gear operators oriented so that they do not obstruct the access or walkthrough pathway in front of the valve?
Are adjacent hand wheels and equipment sufficiently spaced to avoid knuckle injury if hands slip [6 in. (15 cm) clearance preferred]?
Has wrench-assisted operation been considered?Are the handles of ball and plug valves oriented so they do not obstruct
the access or walkthrough pathway in front of the valve?Can operators see the instrument panel from the path during normal
walkthrough?Can operators monitor valve position from the path during normal
walkthrough?Is the position and movement of motor-operated values (MOVs) in the
operator’s line of sight and visible from the MOV control station?Are block valves centralized into a minimum number of accessible
locations?Are sequentially operated valves located close together and access
unobstructed?
440 The Use of Human Factors in Project Planning, Design, and Exceution
Ch09qxd 11/21/03 09:19 PM Page 440
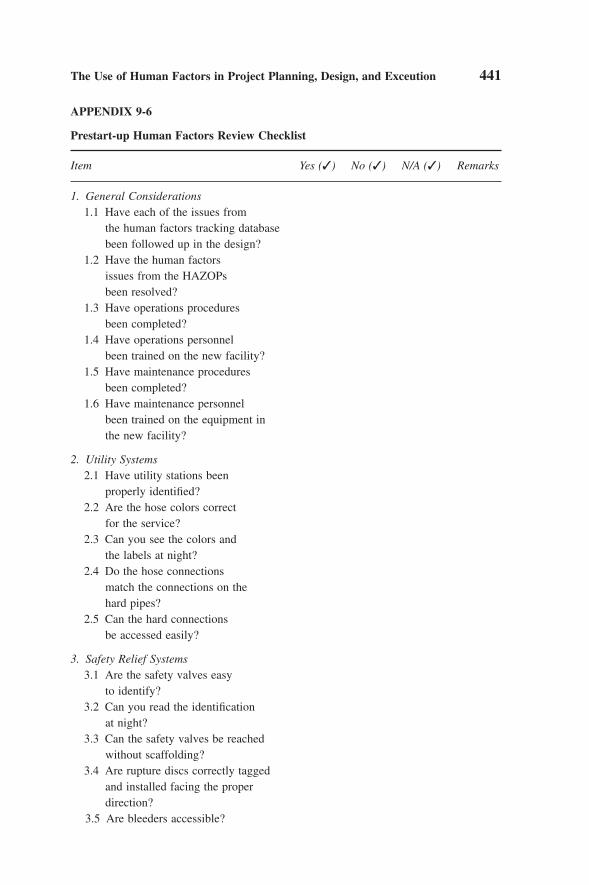
The Use of Human Factors in Project Planning, Design, and Exceution 441
APPENDIX 9-6
Prestart-up Human Factors Review Checklist
Item Yes (✓) No (✓) N/A (✓) Remarks
1. General Considerations1.1 Have each of the issues from
the human factors tracking databasebeen followed up in the design?
1.2 Have the human factors issues from the HAZOPs been resolved?
1.3 Have operations procedures been completed?
1.4 Have operations personnel been trained on the new facility?
1.5 Have maintenance procedures been completed?
1.6 Have maintenance personnel been trained on the equipment in the new facility?
2. Utility Systems2.1 Have utility stations been
properly identified?2.2 Are the hose colors correct
for the service?2.3 Can you see the colors and
the labels at night?2.4 Do the hose connections
match the connections on the hard pipes?
2.5 Can the hard connections be accessed easily?
3. Safety Relief Systems3.1 Are the safety valves easy
to identify?3.2 Can you read the identification
at night?3.3 Can the safety valves be reached
without scaffolding?3.4 Are rupture discs correctly tagged
and installed facing the proper direction?
3.5 Are bleeders accessible?
Ch09qxd 11/21/03 09:19 PM Page 441
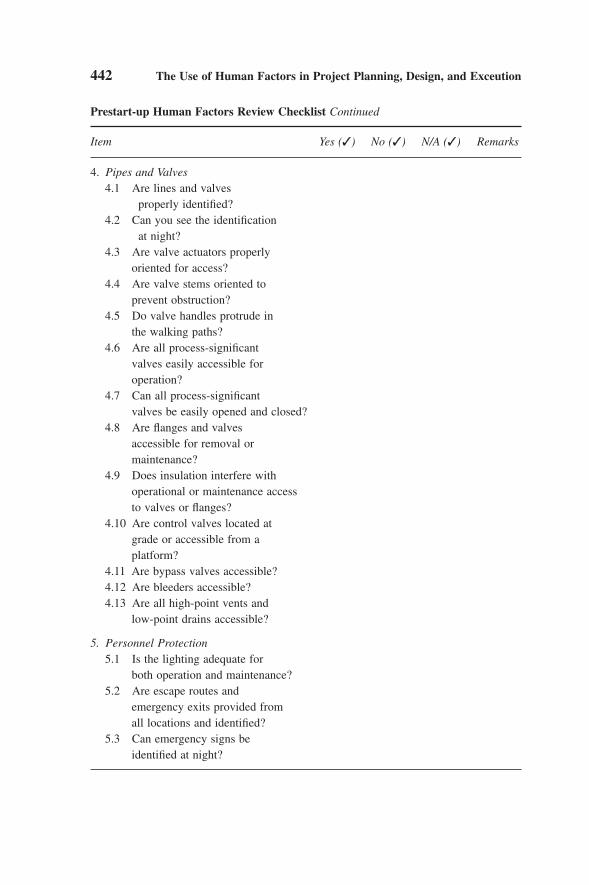
442 The Use of Human Factors in Project Planning, Design, and Exceution
Prestart-up Human Factors Review Checklist Continued
Item Yes (✓) No (✓) N/A (✓) Remarks
4. Pipes and Valves4.1 Are lines and valves
properly identified?4.2 Can you see the identification
at night?4.3 Are valve actuators properly
oriented for access?4.4 Are valve stems oriented to
prevent obstruction?4.5 Do valve handles protrude in
the walking paths?4.6 Are all process-significant
valves easily accessible for operation?
4.7 Can all process-significant valves be easily opened and closed?
4.8 Are flanges and valves accessible for removal or maintenance?
4.9 Does insulation interfere with operational or maintenance access to valves or flanges?
4.10 Are control valves located at grade or accessible from a platform?
4.11 Are bypass valves accessible?4.12 Are bleeders accessible?4.13 Are all high-point vents and
low-point drains accessible?
5. Personnel Protection5.1 Is the lighting adequate for
both operation and maintenance?5.2 Are escape routes and
emergency exits provided fromall locations and identified?
5.3 Can emergency signs be identified at night?
Ch09qxd 11/21/03 09:19 PM Page 442
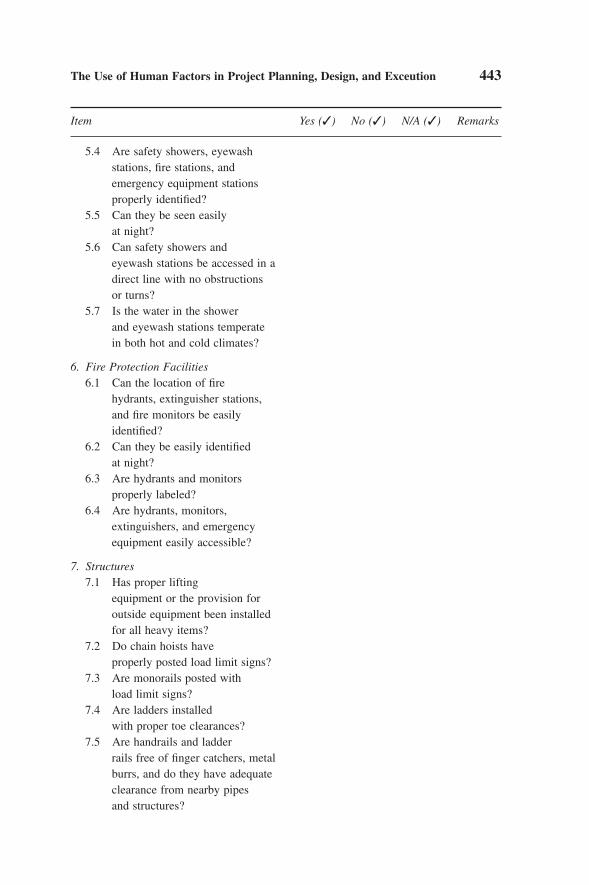
The Use of Human Factors in Project Planning, Design, and Exceution 443
Item Yes (✓) No (✓) N/A (✓) Remarks
5.4 Are safety showers, eyewash stations, fire stations, and emergency equipment stations properly identified?
5.5 Can they be seen easily at night?
5.6 Can safety showers and eyewash stations be accessed in a direct line with no obstructions or turns?
5.7 Is the water in the shower and eyewash stations temperate in both hot and cold climates?
6. Fire Protection Facilities6.1 Can the location of fire
hydrants, extinguisher stations, and fire monitors be easily identified?
6.2 Can they be easily identified at night?
6.3 Are hydrants and monitors properly labeled?
6.4 Are hydrants, monitors, extinguishers, and emergency equipment easily accessible?
7. Structures7.1 Has proper lifting
equipment or the provision for outside equipment been installed for all heavy items?
7.2 Do chain hoists have properly posted load limit signs?
7.3 Are monorails posted with load limit signs?
7.4 Are ladders installed with proper toe clearances?
7.5 Are handrails and ladder rails free of finger catchers, metal burrs, and do they have adequate clearance from nearby pipes and structures?
Ch09qxd 11/21/03 09:19 PM Page 443
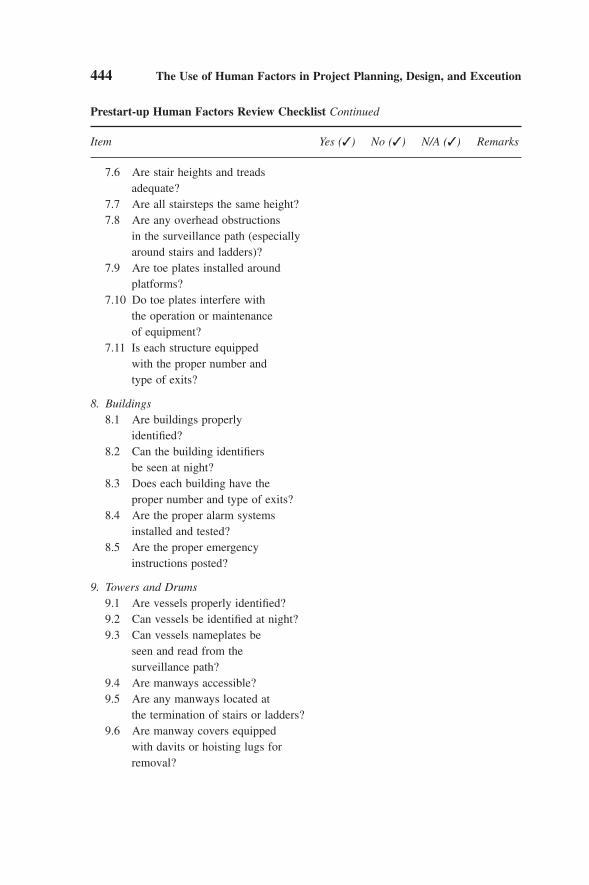
Prestart-up Human Factors Review Checklist Continued
Item Yes (✓) No (✓) N/A (✓) Remarks
7.6 Are stair heights and treads adequate?
7.7 Are all stairsteps the same height?7.8 Are any overhead obstructions
in the surveillance path (especially around stairs and ladders)?
7.9 Are toe plates installed around platforms?
7.10 Do toe plates interfere with the operation or maintenance of equipment?
7.11 Is each structure equipped with the proper number and type of exits?
8. Buildings8.1 Are buildings properly
identified?8.2 Can the building identifiers
be seen at night?8.3 Does each building have the
proper number and type of exits?8.4 Are the proper alarm systems
installed and tested?8.5 Are the proper emergency
instructions posted?
9. Towers and Drums9.1 Are vessels properly identified?9.2 Can vessels be identified at night?9.3 Can vessels nameplates be
seen and read from the surveillance path?
9.4 Are manways accessible?9.5 Are any manways located at
the termination of stairs or ladders?9.6 Are manway covers equipped
with davits or hoisting lugs for removal?
444 The Use of Human Factors in Project Planning, Design, and Exceution
Ch09qxd 11/21/03 09:19 PM Page 444
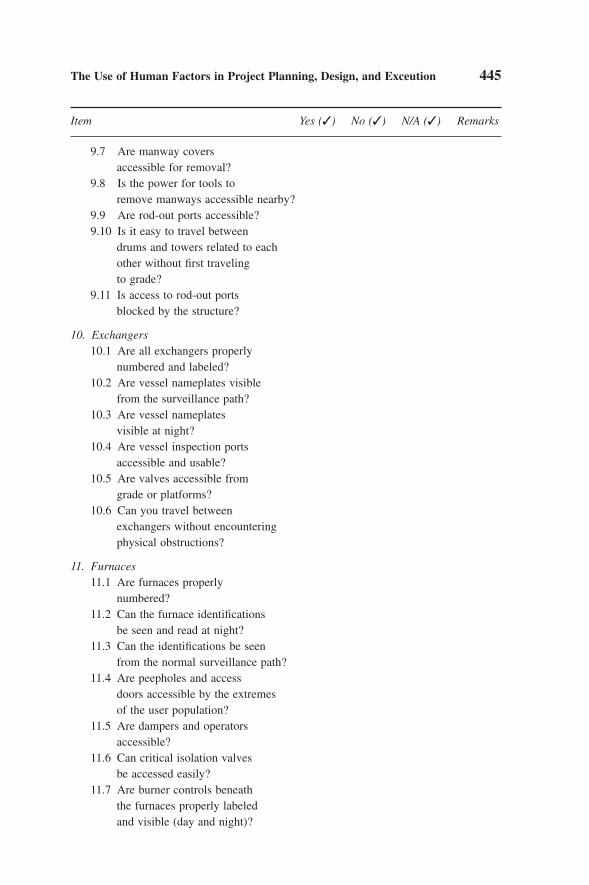
The Use of Human Factors in Project Planning, Design, and Exceution 445
Item Yes (✓) No (✓) N/A (✓) Remarks
9.7 Are manway covers accessible for removal?
9.8 Is the power for tools to remove manways accessible nearby?
9.9 Are rod-out ports accessible?9.10 Is it easy to travel between
drums and towers related to each other without first traveling to grade?
9.11 Is access to rod-out ports blocked by the structure?
10. Exchangers10.1 Are all exchangers properly
numbered and labeled?10.2 Are vessel nameplates visible
from the surveillance path?10.3 Are vessel nameplates
visible at night?10.4 Are vessel inspection ports
accessible and usable?10.5 Are valves accessible from
grade or platforms?10.6 Can you travel between
exchangers without encountering physical obstructions?
11. Furnaces11.1 Are furnaces properly
numbered?11.2 Can the furnace identifications
be seen and read at night?11.3 Can the identifications be seen
from the normal surveillance path?11.4 Are peepholes and access
doors accessible by the extremes of the user population?
11.5 Are dampers and operators accessible?
11.6 Can critical isolation valves be accessed easily?
11.7 Are burner controls beneath the furnaces properly labeled and visible (day and night)?
Ch09qxd 11/21/03 09:19 PM Page 445
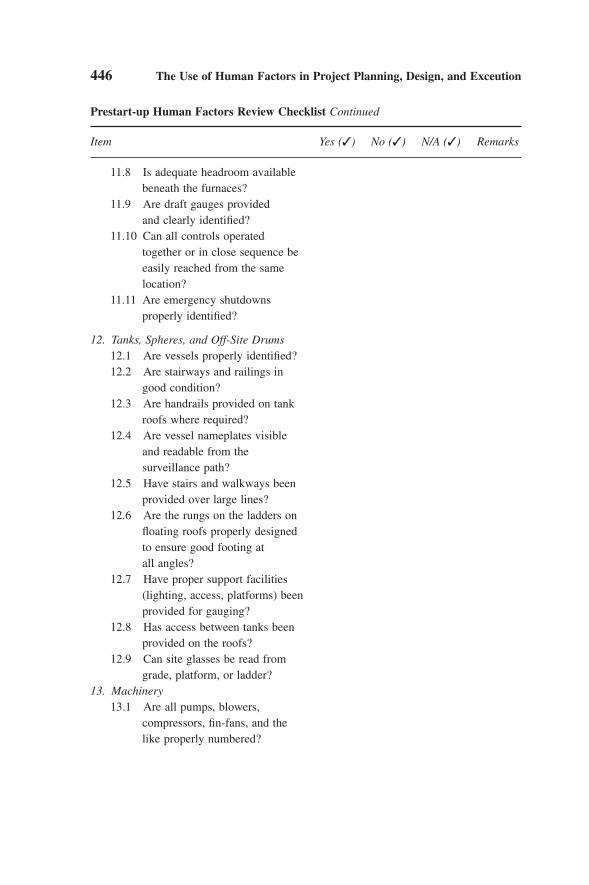
446 The Use of Human Factors in Project Planning, Design, and Exceution
Prestart-up Human Factors Review Checklist Continued
Item Yes (✓) No (✓) N/A (✓) Remarks
11.8 Is adequate headroom available beneath the furnaces?
11.9 Are draft gauges provided and clearly identified?
11.10 Can all controls operated together or in close sequence be easily reached from the same location?
11.11 Are emergency shutdowns properly identified?
12. Tanks, Spheres, and Off-Site Drums12.1 Are vessels properly identified?12.2 Are stairways and railings in
good condition?12.3 Are handrails provided on tank
roofs where required?12.4 Are vessel nameplates visible
and readable from the surveillance path?
12.5 Have stairs and walkways been provided over large lines?
12.6 Are the rungs on the ladders on floating roofs properly designed to ensure good footing at all angles?
12.7 Have proper support facilities (lighting, access, platforms) been provided for gauging?
12.8 Has access between tanks been provided on the roofs?
12.9 Can site glasses be read from grade, platform, or ladder?
13. Machinery13.1 Are all pumps, blowers,
compressors, fin-fans, and the like properly numbered?
Ch09qxd 11/21/03 09:19 PM Page 446
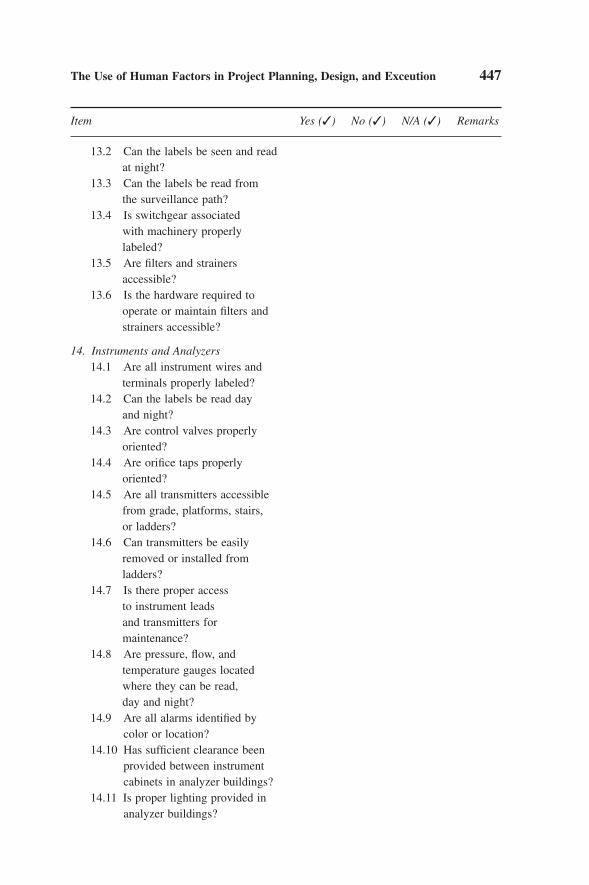
The Use of Human Factors in Project Planning, Design, and Exceution 447
Item Yes (✓) No (✓) N/A (✓) Remarks
13.2 Can the labels be seen and read at night?
13.3 Can the labels be read from the surveillance path?
13.4 Is switchgear associated with machinery properly labeled?
13.5 Are filters and strainers accessible?
13.6 Is the hardware required to operate or maintain filters and strainers accessible?
14. Instruments and Analyzers14.1 Are all instrument wires and
terminals properly labeled?14.2 Can the labels be read day
and night?14.3 Are control valves properly
oriented?14.4 Are orifice taps properly
oriented?14.5 Are all transmitters accessible
from grade, platforms, stairs, or ladders?
14.6 Can transmitters be easily removed or installed from ladders?
14.7 Is there proper access to instrument leads and transmitters for maintenance?
14.8 Are pressure, flow, and temperature gauges located where they can be read,day and night?
14.9 Are all alarms identified by color or location?
14.10 Has sufficient clearance beenprovided between instrument cabinets in analyzer buildings?
14.11 Is proper lighting provided in analyzer buildings?
Ch09qxd 11/21/03 09:19 PM Page 447

448 The Use of Human Factors in Project Planning, Design, and Exceution
Prestart-up Human Factors Review Checklist Continued
Item Yes (✓) No (✓) N/A (✓) Remarks
14.12 Are instruments located to be readable?
14.13 Is the hardware provided to open cabinets accessible by the extremes of the user population?
15. Electrical Equipment15.1 Are all breaker panels, starters,
motors, and MOVs properly labeled to identify the equipment served?
15.2 Are underground cables and duct backs properly labeled to identify the equipment served?
15.3 Is the lighting of the proper type?15.4 Has the lighting been placed in
the proper locations for operation and maintenance?
15.5 Is the emergency lighting properly designed and placed?
15.6 Are batteries accessible for maintenance?
15.7 Is building-mounted equipment (e.g., HVAC systems) accessible from grade?
15.8 Are platforms provided on the building exits and entrances to allow switchgear to be easily installed or removed?
15.9 Have hoists been provided for moving heavy equipment?
15.10 Have benches been provided for maintaining electrical equipment?
15.11 Is the access to electrical equipment safe?
Ch09qxd 11/21/03 09:19 PM Page 448

Item Yes (✓) No (✓) N/A (✓) Remarks
15.12 Are all motor start/stop stations and switches with on/off positions properly labeled?
16. Field Controls and Displays16.1 Do all displays that are
monitored during rounds face the surveillance path?
16.2 Are all displays visible at night?16.3 Are all displays visible and
readable in full sunlight?16.4 Does the display panel face the
equipment that it controls?16.5 Are panels that control two or
more pieces of identical equipment laid out in the same configuration as the equipment they control?
16.6 Is panel labeling readable?16.7 Is the relationship between the
label and the control or display ambiguous?
16.8 For pumps, compressors, and other machinery controlled in the field, can the displays required for start-up or shutdown be seen from the control position?
The Use of Human Factors in Project Planning, Design, and Exceution 449
Ch09qxd 11/21/03 09:19 PM Page 449
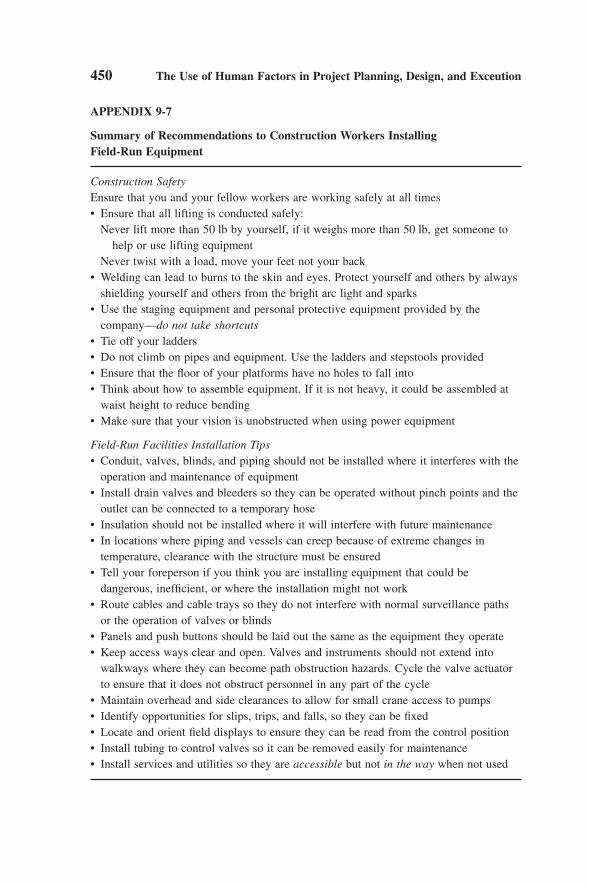
450 The Use of Human Factors in Project Planning, Design, and Exceution
APPENDIX 9-7
Summary of Recommendations to Construction Workers Installing Field-Run Equipment
Construction SafetyEnsure that you and your fellow workers are working safely at all times• Ensure that all lifting is conducted safely:
Never lift more than 50 lb by yourself, if it weighs more than 50 lb, get someone to help or use lifting equipment
Never twist with a load, move your feet not your back• Welding can lead to burns to the skin and eyes. Protect yourself and others by always
shielding yourself and others from the bright arc light and sparks• Use the staging equipment and personal protective equipment provided by the
company—do not take shortcuts• Tie off your ladders• Do not climb on pipes and equipment. Use the ladders and stepstools provided• Ensure that the floor of your platforms have no holes to fall into• Think about how to assemble equipment. If it is not heavy, it could be assembled at
waist height to reduce bending• Make sure that your vision is unobstructed when using power equipment
Field-Run Facilities Installation Tips• Conduit, valves, blinds, and piping should not be installed where it interferes with the
operation and maintenance of equipment• Install drain valves and bleeders so they can be operated without pinch points and the
outlet can be connected to a temporary hose• Insulation should not be installed where it will interfere with future maintenance• In locations where piping and vessels can creep because of extreme changes in
temperature, clearance with the structure must be ensured• Tell your foreperson if you think you are installing equipment that could be
dangerous, inefficient, or where the installation might not work• Route cables and cable trays so they do not interfere with normal surveillance paths
or the operation of valves or blinds• Panels and push buttons should be laid out the same as the equipment they operate• Keep access ways clear and open. Valves and instruments should not extend into
walkways where they can become path obstruction hazards. Cycle the valve actuatorto ensure that it does not obstruct personnel in any part of the cycle
• Maintain overhead and side clearances to allow for small crane access to pumps• Identify opportunities for slips, trips, and falls, so they can be fixed• Locate and orient field displays to ensure they can be read from the control position• Install tubing to control valves so it can be removed easily for maintenance• Install services and utilities so they are accessible but not in the way when not used
Ch09qxd 11/21/03 09:19 PM Page 450

REFERENCES
Attwood, D. A., and Fennell, D. J. (2001) “Cost-Effective Human Factors Techniques for Process Safety.” CCPS International Conference and Workshop, Toronto, ON,Canada.
Robertson, N. (1999) “Starting Right: Sable Offshore Energy Project’s HFE Program.”Proceedings, 1999 Offshore Technology Conference, Houston, TX.
The Use of Human Factors in Project Planning, Design, and Exceution 451
Ch09qxd 11/21/03 09:19 PM Page 451

Ch09qxd 11/21/03 09:19 PM Page 452

A
Acceleration (4.5) 142Access, physical (6.2.5) 220Access, valves (5.2.7) 166Accommodation of the eye (2.2.1.1) 31Activity analysis (6.3.1) 258ACUMEN (7.5.3) 324ACUMEN (1.2.6.4) 8Acute fatigue (7.2.1.3) 294Adaptive innovative process (1.2.6.4) 8Age (2.2.1.6) 37, 116, 130, 298Aging hearing loss (4.4.2.1) 138Air temperature (4.3.4) 128Air velocity (4.3.4) 129Aisles (6.2.5.1) 220Alarms, guidelines (5.7.1) 191Alarms, priority (5.7.1) 190Alarms, priority matrix (5.7.1) 191Alarms, types (5.5) 175Alertness (7.2.1.3) 292Anthropometry (2.3.2) 52Arm, support (6.2.6.5) 232Attention (2.2.3.1) 40Auditory sense (2.2.2) 38Awareness for contractors (9.3.10) 426Awkward posture (3.1) 67
B
Back belts (3.4) 87Back compression design limit (BCDL)
(3.2.2.3) 79Base projects (9.1) 394Base projects 397BBS, implementation (7.6.1.1) 326BBS, lessons learned (7.6.1) 325
BBS, manual handling observation (3.4) 87BBS, measure (7.6.1.4) 327BBS, observation (7.6.1.3) 326BBS, positive outcomes (7.6.1.5) 327BBS, recommended program elements (7.6.2.1)
328BBS, training (7.6.1.2) 326Behavior (1.3.9) 24Behavior-based safety (1.2.6.5) 8, 325Biological rhythm (7.2.1) 289Biomechanical model (3.2.2.3) 77Blood vessels constriction (4.3.3.2) 127Body size variability, age (2.3.2.1) 53Body size variability, Body position (2.3.2.1)
56Body size variability, Clothing (2.3.2.1) 56Body size variability, culture (2.3.2.1) 54Body size variability, gender (2.3.2.1) 53Body size variability, Historical trends (2.3.2.1)
56Body size variability, nationality (2.3.2.1) 54Body size variability, Occupation (2.3.2.1) 54Budget, human factors in projects (9.3.11) 429
C
Capabilities (6.2.4) 5, 215Capital projects (9.1) 10, 394Carpal Tunnel Syndrome (CTS) (3.1) 66Case study—BF3 spheres (9.3.6) 412Case study—preparing for reactor startup 413Chair, stool (6.2.6.4) 231Chronic fatigue (7.2.1.3) 294Circadian rhythm (7.2.1) 289Cognitive capabilities (2.2) 5, 30, 39Cognitive problem solving style (KAI) (7.5.1)
322
Index
453
INDEX.qxd 11/26/03 4:48 PM Page 453

Cold and cognitive tasks (4.3.2.1) 125Cold and health (4.3.3.2) 127Cold and performance (4.3.2) 124Cold and physical activities (4.3.2.2) 125Cold-conditions—guidelines (4.3.6.2) 132Color deficiency, color blindness (2.2.1.4) 34Color rendering index (4.2.1.4.1) 118Color temperature (4.2.1.4.1) 118Color vision (2.2.1.4) 33Comfort zone (4.3.4) 128Compression force (3.2.2.2) 78Computer aided design (9.3.8.2) 419Conduction deafness (4.4.2) 137Cones (2.2.1) 31Consequence—probability risk matrix (1.3.5) 19Contact stress (3.1) 67Contractor—base projects (9.2.2) 397Contrast (2.2.1.5) 36, 121Control panels (5.6) 177Control panels, improvements (5.6.3) 184Control panels, labeling (5.6.2) 181Control panels, layout (5.6.1) 177Control room—case study 266Control room—needs assessment 244Control room—survey 273Control room—training 426Controls (1.2.4) 6Controls, access (5.2.6) 165Controls, and related displays (5.4) 174Controls, design (5.2) 160Controls, ergonomic considerations (5.2) 159Controls, force to operate (5.2.1) 160Controls, labeling (5.2.3) 163Controls, preventing accidental operation
(5.2.6) 165Controls, selection (5.2.1) 161Controls, stereotypes (5.2.4) 164Controls, types (5.2.2) 161Core temperature (4.3) 121Corridors (6.2.5.1) 220Cost-benefit analysis (1.3.7) 20Critical risk factors (1.2.2.2) 6Critical task analysis (7.4.2.2) 318Critical task analysis, for projects (9.3.7) 410CTD, risk factors (3.1) 67Cumulative trauma (1.2.2.2) 6Cumulative Trauma Disorders (CTDs) (3.1) 66
D
Dark adaptation (2.2.1.3) 33, 120Design for adjustability (2.3.2.2) 57
454 Index
Design for average (2.3.2.2) 57Design for extreme (2.3.2.2) 57, 216Differences, 95th percentile (6.2.4.2) 217Differences, gender (6.2.4.1) 216Differences, nationality (6.2.4.1) 216Direction of movement (2.2.3.2) 42Direction of rotation (7.2.5.2.1) 301Disaster, ocean ranger (8.1) 340Disaster, piper alpha (8.6.1) 348Discomfort zone (4.3.4) 128Displays—visual (5.3) 6, 169Displays, and related controls (5.4) 174Displays, check reading (5.3.1) 171Displays, codes (5.7.1) 187Displays, design (5.7.1) 187Displays, developing (5.7.2) 195Displays, field surveillance (5.3.1) 173Displays, guidelines (5.7.1) 188Displays, process control (5.7) 185Displays, readability (5.3.1) 172Displays, task analysis (5.7.2) 199Displays, types (5.3.1) 170Divided attention (2.2.3.1) 41Drexler-Sibbet high performance team model
(7.5.2) 8, 323Dumbwaiter 227Dynamic strength, work (2.3.1) 49
E
Echoic memory (2.2.3.3) 43Education (7.2.6.6.1) 305Electrician (3.3.1) 82ElectroEncephalogram, EEG (7.2.1.1) 290Elevators—when to install 227Endurance (2.3.1.2) 51Energy expenditure prediction model (4.3.5)
130Engineering interface design (1.3.9) 24Environmental factors (1.2.3) 6Equipment design (1.2.4) 6Ergonomic legislation (1.1) 4Ergonomics—defined (1.1) 2Ergonomics program (3.5) 88Ergonomics program, basic principles (3.5)
88Ergonomics program, evaluation (3.5.4) 94Ergonomics program, gap assessment (3.5.4)
95Ergonomics program, planning (3.5.1) 89Ergonomics program, risk assessment (3.5.2)
91
INDEX.qxd 11/26/03 4:48 PM Page 454

Ergonomics program, roles and responsibilities(3.5.1) 89
Ergonomics program, training (3.5.1) 89Ergotropic phase (7.2.1) 289Error, system induced (8.1.6) 348Expectation (2.2.3.2) 41Exposure time (2.2.1.5) 36Exteroceptors (2.2) 30
F
Facilities Design (7.2.6.6.2) 305Farsightedness (2.2.1.1) 32, 117Fatigue (2.3.1.2) 51, 292Fatigue, physical (6.2.6.8) 233Field control panels (1.2.4) 6Field engineer (9.2) 396Field run equipment—recommendations
450Focused attention (2.2.3.1) 41Force gauge (3.2.1) 69Frequency—sound (4.4) 133Frequency—vibration (4.5) 142Front end loading (9.2) 396Functional anthropometry (2.3.2) 52Functional reach, controls (5.2.5) 165
G
GAP analysis (1.3.6) 20Gastrointestinal reflex (7.2.1.2) 292Gender (7.2.4.2) 298Glare (4.2.1.4.2) 114Glare disability (4.2.1.4.2) 119Glare discomfort (4.2.1.4.2) 119
H
Hand intensive repetitive tasks, risk factors(3.3.1) 81
Hand tools (3.3.1) 81Hand tools, grip (3.3.1) 82Hand tools, posture (3.3.1) 81Hand tools, trigger control (3.3.1) 82Hand tools, weight (3.3.1) 83Hazard and operability review (9.3.5) 404HAZOP (9.3.5) 404HAZOP—screening lists (9.3.5) 407Heat (4.3) 122Heat and cognitive tasks (4.3.1.1) 123Heat and health (4.3.3) 125Heat and performance (4.3.1) 122
Index 455
Heat and physical activities (4.3.1.2) 123Heat conditions—guidelines (4.3.6.1) 132Heat conduction (4.3) 122Heat convection (4.3) 122Heat cramps (4.3.3.1) 126Heat evaporation (4.3) 122Heat exhaustion (4.3.3.1) 126Heat radiation (4.3) 122Heat rash (4.3.3.1) 126Heat stroke (4.3.3.1) 126Human factors review—planning phase (9.3.2)
399Human error (8.1) 8, 340Human Factors—audience (1.1) 4Human Factors—defined (1.1) 2Human Factors—models (1.3) 10Human Factors, analysis tool (8.1.6) 349Human machine system (8.1) 340Human system interface (5.1) 158Human system interface (1.1) 3Hyperthermia (4.3.2) 124, 126Hypothermia (4.3.2) 124, 127
I
Iconic memory (2.2.3.3) 43Illuminance (4.2) 113Illumination (2.2.1.5) 36, 113Incident causation model (8.6.1) 349Individual differences (7.2.4.2) 298Individual susceptibility (7.2.4.2) 298Information processing (1.2.7) 8Insomnia (7.2.1.2) 290Intensity brightness (4.2) 113Intensity noise (4.4) 133Intensity vibration (4.5) 143Intervention strategies (1.3.9) 23Issue analysis (1.3.6) 20Issue identification (1.3.4) 15Issue prioritization 19, 23
J
Job analysis (1.2.6.3) 7Job factors (1.2.6) 7Job/task design (1.3.9) 24
K
Kirton (1.2.6.4) 8Knowledge-based (7.4.2.2) 321
INDEX.qxd 11/26/03 4:48 PM Page 455
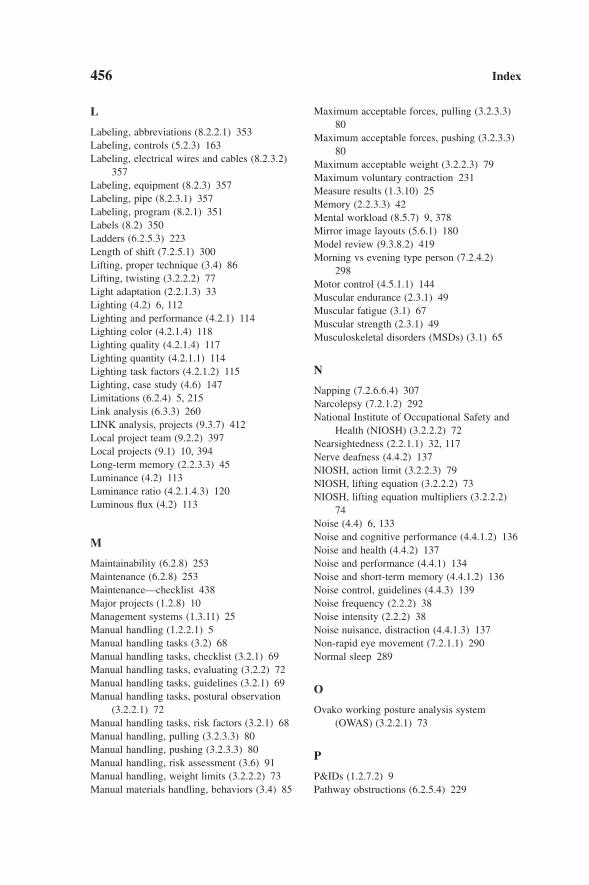
L
Labeling, abbreviations (8.2.2.1) 353Labeling, controls (5.2.3) 163Labeling, electrical wires and cables (8.2.3.2)
357Labeling, equipment (8.2.3) 357Labeling, pipe (8.2.3.1) 357Labeling, program (8.2.1) 351Labels (8.2) 350Ladders (6.2.5.3) 223Length of shift (7.2.5.1) 300Lifting, proper technique (3.4) 86Lifting, twisting (3.2.2.2) 77Light adaptation (2.2.1.3) 33Lighting (4.2) 6, 112Lighting and performance (4.2.1) 114Lighting color (4.2.1.4) 118Lighting quality (4.2.1.4) 117Lighting quantity (4.2.1.1) 114Lighting task factors (4.2.1.2) 115Lighting, case study (4.6) 147Limitations (6.2.4) 5, 215Link analysis (6.3.3) 260LINK analysis, projects (9.3.7) 412Local project team (9.2.2) 397Local projects (9.1) 10, 394Long-term memory (2.2.3.3) 45Luminance (4.2) 113Luminance ratio (4.2.1.4.3) 120Luminous flux (4.2) 113
M
Maintainability (6.2.8) 253Maintenance (6.2.8) 253Maintenance—checklist 438Major projects (1.2.8) 10Management systems (1.3.11) 25Manual handling (1.2.2.1) 5Manual handling tasks (3.2) 68Manual handling tasks, checklist (3.2.1) 69Manual handling tasks, evaluating (3.2.2) 72Manual handling tasks, guidelines (3.2.1) 69Manual handling tasks, postural observation
(3.2.2.1) 72Manual handling tasks, risk factors (3.2.1) 68Manual handling, pulling (3.2.3.3) 80Manual handling, pushing (3.2.3.3) 80Manual handling, risk assessment (3.6) 91Manual handling, weight limits (3.2.2.2) 73Manual materials handling, behaviors (3.4) 85
456 Index
Maximum acceptable forces, pulling (3.2.3.3)80
Maximum acceptable forces, pushing (3.2.3.3)80
Maximum acceptable weight (3.2.2.3) 79Maximum voluntary contraction 231Measure results (1.3.10) 25Memory (2.2.3.3) 42Mental workload (8.5.7) 9, 378Mirror image layouts (5.6.1) 180Model review (9.3.8.2) 419Morning vs evening type person (7.2.4.2)
298Motor control (4.5.1.1) 144Muscular endurance (2.3.1) 49Muscular fatigue (3.1) 67Muscular strength (2.3.1) 49Musculoskeletal disorders (MSDs) (3.1) 65
N
Napping (7.2.6.6.4) 307Narcolepsy (7.2.1.2) 292National Institute of Occupational Safety and
Health (NIOSH) (3.2.2.2) 72Nearsightedness (2.2.1.1) 32, 117Nerve deafness (4.4.2) 137NIOSH, action limit (3.2.2.3) 79NIOSH, lifting equation (3.2.2.2) 73NIOSH, lifting equation multipliers (3.2.2.2)
74Noise (4.4) 6, 133Noise and cognitive performance (4.4.1.2) 136Noise and health (4.4.2) 137Noise and performance (4.4.1) 134Noise and short-term memory (4.4.1.2) 136Noise control, guidelines (4.4.3) 139Noise frequency (2.2.2) 38Noise intensity (2.2.2) 38Noise nuisance, distraction (4.4.1.3) 137Non-rapid eye movement (7.2.1.1) 290Normal sleep 289
O
Ovako working posture analysis system(OWAS) (3.2.2.1) 73
P
P&IDs (1.2.7.2) 9Pathway obstructions (6.2.5.4) 229
INDEX.qxd 11/26/03 4:48 PM Page 456

Perception (2.2.3.2) 41Permanent threshold shift (4.4.2.2) 139Personal factors (1.2.1) 5Physical capabilities (2.3) 5, 48Physical factors (1.2.2) 5Platforms (6.2.5.3) 223Platforms, portable (6.2.5.3) 223Positioning work (6.2.6)Post project review (9.3.11) 427Post project review—learnings 428Postures, work (6.2.6.3) 231Powered lifts—when to install 227Pre start-up checklist (9.3.9) 425, 441Procedures (1.2.7.3) 9, 256, 361Procedures—project requirements (9.3.6)
409Procedures, developing (8.3.2) 363Procedures, evaluating (8.3.5) 366Procedures, format (8.3.3) 364 (8.6), 382Procedures, OSHA CFR 1910 (8.3) 361Procedures, when needed (8.3.1) 362Procedures, why not used (8.3.4) 365Process control (5.7) 185Process control displays (5.7) 185Process control interface (5.7) 186Process designer (9.2) 396Project coordinator (9.2) 396Project engineer (9.2) 396Project management (9.2) 396Project management—tools 398Proprioceptors (2.2) 30Pulling, proper technique (3.4) 86Pushing, proper technique (3.4) 86
Q
QA/QC process (9.3.8) 416QA/QC checklist 435Quality assurance/ quality control process
(9.3.8) 416
R
Ramps (6.2.5.3) 223Rapid entire body assessment (REBA) (3.2.2.1)
73Rapid eye movement (7.2.1.1) 290Rapid upper limb assessment (RULA) (3.3.2)
83Rate of flux (4.2) 113Raynaud’s disease (4.5.2) 146Reach (6.2.6.2) 230
Index 457
Recall (2.2.3.3) 45Recognition (2.2.3.3) 45Recommended weight limit (3.2.2.2) 74Relative humidity (4.3.4) 128Repetitive motion (3.1) 67Repetitive tasks (3.1) 66, 81Repetitive tasks, risk factors (3.3) 81Rest duration (4.3.5) 131Retina (2.2.1) 31Review questions—chapter 1 (1.4) 25Right first time (1.1) 3Rim pull force (5.2.7) 167Rods (2.2.1) 31Rotation pattern (7.2.5.2) 300Rule-based (7.4.2.2) 321
S
Safe lifting (3.2.1) 69Safety case (8.1.6) 350Safety, health and environmental review (9.3.3)
400Screening questions—planning phase (9.3.2)
399, 400, 401Screening list—HAZOPs 407, 430, 434Seating (6.2.7.4) 250Selection (1.3.9) 24Selective attention (2.2.3.1) 41Sensory capabilites (1.2.1) 5, 30Sensory memory (2.2.3.3) 43Sensory memory decay (2.2.3.3) 43Shift schedule (7.2.5) 299Shiftwork (7.2) 288Shiftwork and body clock (7.2.6.3) 303Shiftwork and diet (7.2.6.2) 303Shiftwork and health (7.2.3) 296Shiftwork and organizational strategies
(7.2.6.6) 305Shiftwork and performance (7.2.2) 295Shiftwork and personal and mental hygiene
(7.2.6.4) 304Shiftwork and personal life (7.2.4.3) 299Shiftwork and psychosocial life (7.2.4) 297Shiftwork and Sleep (7.2.6.1) 302Shiftwork coping strategies (7.2.6) 302Shivering (4.3.3.2) 127Short-term memory (2.2.3.3) 43Short-term memory decay (2.2.3.3) 44Short-term memory limited capacity (2.2.3.3)
44Short-term memory limited Distraction
(2.2.3.3) 44
INDEX.qxd 11/26/03 4:48 PM Page 457
Short-term memory short duration (2.2.3.3)44
Signs (8.2) 350Signs and labels (1.2.7.2) 8Signs, character height (8.2.2.4) 356Signs, characters (8.2.2.3) 355Signs, danger (8.2.3.7) 359Signs, equipment (8.2.3.4) 358Signs, hazard (8.2.3.7) 359Signs, informational (8.2.3.6) 359Signs, layout (8.2.2.3) 355Signs, message (8.2.2.1) 353Signs, placement (8.2.2.5) 355Signs, sample points (8.2.3.5) 359Size of object (2.2.1.5) 34Skilled-based (7.4.2.2) 321Sleep (7.2.1) 289Sleep apnea syndrome (7.2.1.2) 292Sleep disorder (7.2.1) 289Soft tissue injury (1.2.2.2) 6Sound (4.4) 133Sound pressure level (4.4) 134Spacing, between equipment (6.2.5.2) 222Speech and communication (4.4.1.1) 135Speed of rotation (7.2.5.2.2) 301Spine, twist (6.2.6.6) 232Stairs (6.2.5.3) 223Standards (1.3.1) 10Static loads (6.2.6.3) 231Static strength, work (2.3.1) 49Stength upper limit (SUL) (3.2.2.3) 79Stereotype (5.2.4) 164Strategy development (1.3.9) 23Strength and age (2.3.1.1) 50Strength and gender (2.3.1.1) 50Strength and occupation (2.3.1.1) 51Strength and physical training (2.3.1.1) 51Strength design limit (SDL) (3.2.2.3) 79Strength, case study (2.4) 57Stress (7.3) 7, 308Stress causes (7.3.1) 308Stress coping strategies (7.3.2) 310Stress negative (7.3) 308Stress positive (7.3) 308Structural anthropometry (2.3.2) 52Style guides (1.3.1) 12Sustained attention (2.2.3.1) 41Symbols (8.2.2.1) 354SYMLOG (7.5.4) 8, 324System failure (1.1) 2Systematic application (1.1) 3
458 Index
T
Target movement (2.2.1.5) 36Task analysis (6.3.2) 260, 310Task analysis—Case study (7.7) 331Task analysis process (7.4.1.4) 314Task analysis use (7.4.1.2) 312Team process (1.2.6.4) 7Team-based approach (7.5) 322Temperature (4.3) 6, 121Temperature and workload (4.3.5) 130Temporary threshold shift (4.4.2.2) 139Tools, specialized (6.2.6.9) 235Trackinig database (9.3.1) 398Training (8.4) 9, 24, 367, 401, 419Training—management (1.3.2) 14Training—project team (9.3.4) 401Training—site teams (1.3.3) 15Training requirements matrix (1.3.3) 15Training, developing (8.4.1) 368Training, evaluating (8.4.6) 372Training, task analysis (8.4.2) 369Transient adaptation (4.2.1.4.3) 120Trial and error (1.1) 3Trophotropic phase (7.2.1) 289
V
Valve, locations (5.2.7) 168Valves, access (5.2.7) 168Valves, clearance (5.2.7) 169Valves, ergonomic problems (5.2.7) 166Valves, force to operate (5.2.7) 167Valves, hand wheel operation (5.2.7) 168Vibration (4.5) 6, 142Vibration and health (4.5.2) 145Vibration and performance (4.5.1) 143Vibration and visual performance (4.5.1.2) 144Vibration control, guidelines (4.5.3) 146Vibration induced white fingers (4.5.2) 146Vigilance (7.2.1.3) 293, 372Vigilance, control room (8.5.2) 374Vigilance, decrement (8.5.6) 377Vigilance, mining operations (8.5.3) 376Vigilance, transportation (8.5.1) 374Vigliance, driving (8.5.4) 377Visibility (2.2.1.5) 34Visual acuity (2.2.1) 31, 34Visual adaptation (2.2.1.3) 33Visual field (2.2.1.2) 32Visual sense (2.2.1) 31
INDEX.qxd 11/26/03 4:48 PM Page 458

Visual sense—psychological (2.2.1) 31Visual sense—physiological (2.2.1) 31
W
Walkways (6.2.5.3) 223Walkthrough—checklist 439Wavelength (4.2) 112White fingers condition (4.5.2) 146Work schedule (7.2) 7, 288Working memory (2.2.3.3) 43Workload (4.3.5) 130, 378Workload, analysis (8.5.7) 378Workload, NASA TLX analysis method (8.5.7)
378
Index 459
Workload, operator tasks (8.5.7) 379Workplace design (1.2.5) 6Workspace (6.1) 214Workstation (6.1) 214, 262Workstation, adjustable height (6.2.6.4) 231,
243Workstation, layout (6.3.3) 260Workstations, design standards (6.2.7.3) 242Workstations, seated (6.2.7.1) 238Workstations, seated—standards 243Workstations, sit/stand (6.2.7.1) 240Workstations, sit/stand—standards 249Workstations, standing (6.2.7.1) 239Workstations, standing—standards 249Wrist posture (3.2.2.1) 81
INDEX.qxd 11/26/03 4:48 PM Page 459

INDEX.qxd 11/26/03 4:48 PM Page 460