epigenetically induced changes in nuclear textural patterns and gelatinase expression in human...
TRANSCRIPT
Epigenetically induced changes in nuclear textural patterns and gelatinaseexpression in human fibrosarcoma cellsM. Poplineau*, C. Doliwa*, M. Schnekenburger†, F. Antonicelli‡, M. Diederich†,§, A. Trussardi-R�egnier*and J. Dufer*
*Unit�e MEDyC, URCA-CNRS FRE 3481, SFR Cap-Sant�e, Facult�e de Pharmacie, Universit�e de Reims, Reims, France, †Laboratoire de BiologieMol�eculaire du Cancer, Hopital Kirchberg, Luxembourg, Luxembourg, ‡Laboratoire de Dermatologie, UFR M�edecine, Reims, France, and§College of Pharmacy, Seoul National University, Seoul, South Korea
Received 20 September 2012; revision accepted 1 December 2012
AbstractObjective: Chromatin texture patterns of tumourcell nuclei can serve as cancer biomarkers, either todefine diagnostic classifications or to obtain rele-vant prognostic information, in a large number ofhuman tumours. Epigenetic mechanisms, mainlyDNA methylation and histone post-translationalmodification, have been shown to influence chro-matin packing states, and therefore nuclear texture.The aim of this study was to analyse effects ofthese two mechanisms on chromatin texture, andalso on correlation with gelatinase expression, inhuman fibrosarcoma tumour cells.Materials and methods: We investigated effects ofDNA hypomethylating agent 5-aza-2′-deoxycyti-dine (5-azadC) and histone deacetylase inhibitortrichostatin A (TSA) on nuclear textural character-istics of human HT1080 fibrosarcoma cells, evalu-ated by image cytometry, and expression ofgelatinases MMP-2 and MMP-9, two metallopro-teinases implicated in cancer progression andmetastasis.Results: 5-azadC induced significant variation inchromatin higher order organization, particularlychromatin decondensation, associated with reduc-tion in global DNA methylation, concomitantlywith increase in MMP-9, and to a lesser extent,MMP-2 expression. TSA alone did not have anyeffect on HT1080 cells, but exhibited differentialactivity when added to cells treated with 5-azadC.
When treated with both drugs, nuclei had highertexture abnormalities. In this setting, reduction inMMP-9 expression was observed, whereas MMP-2expression remained unaffected.Conclusions: These data show that hypomethylat-ing drug 5-azadC and histone deacetylase inhibitorTSA were able to induce modulation of higherorder chromatin organization and gelatinase expres-sion in human HT1080 fibrosarcoma cells.
Introduction
Over the past decade, computerized microscopic imageanalysis has widely been used in pathology and cytol-ogy, either for identification of benign or malignanttumour cells, evaluation of subtle morphological cellchanges [which cannot be recognized by conventionalmicroscopy, that is, malignancy-associated changes(MACs)], or for detection of relevant tumour prognosticmarkers (1–4). Moreover, this technique has proven tobe efficient for investigation of chromatin remodellinginduced by various drugs and therapeutic agents (5–7).Chromatin remodelling appears, at least in part, to becontrolled by two key epigenetic mechanisms, DNAmethylation, and post-translational modifications of hi-stones, which both regulate accessibility of transcrip-tional machinery to DNA (8). These can result inmodifications of chromatin texture as evaluated byimage cytometry. For instance, DNA methylation levelhas been associated with chromatin reorganization,including changes in distribution of regions of hetero-chromatin (9–11) and histone acetylation, with inter-phase chromatin decondensation (12,13). Numerous datanow have strengthened the major role of these epige-netic mechanisms in regulation of expression of variousgenes, particularly in neoplastic diseases (14). Indeed,
Correspondence: J. Dufer, Unit�e MEDyC, URCA-CNRS FRE 3481,Facult�e de Pharmacie, Universit�e de Reims, 1 avenue du Mar�echalJuin, Reims 51096, France. Tel.: +33 326 918 015; Fax:+33 326 913 550; E-mail: [email protected]
© 2013 Blackwell Publishing Ltd 127
Cell Prolif., 2013, 46, 127–136 doi: 10.1111/cpr.12021
abnormal methylation profile of cytosine residues atgene promoters within CpG-rich regions, termed ‘CpGislands’, is frequently observed in tumours, and contrib-utes to the malignant phenotype by silencing tumoursuppressor genes (15–17). Post-translational modifica-tions of nucleosome core histones H3, H4, H2A andH2B consist of addition of different chemical groups ontheir N-terminal tails. One of the most characterizedmodifications is an acetylation/deacetylation processmediated by histone acetyl transferases (HATs) and his-tone deacetylases (HDACs) enzymes. These histone N-terminal tail modifications change binding affinitybetween DNA and histones, thereby modulating chroma-tin condensation. Thus, histone acetylation may induceactivation of gene transcription (18,19).
In cancer, matrix metalloproteinases (MMPs) areinvolved in formation of a microenvironment that con-tributes to tumour cell progression (20). Among theseMMPs, gelatinases (gelatinase A or MMP-2 and gelati-nase B or MMP-9) play a major role, mainly by control-ling activity of molecules that target specific receptorsthat regulate cell proliferation, migration, inflammationand angiogenesis (21). MMP-2 and -9 expressions arederegulated in a variety of malignancies, and increase intheir expression and activity are generally associatedwith poor prognosis (22,23). Such overexpression corre-lates with elevated invasive potential of tumour cells,indicating the crucial role of these MMPs in the meta-static process (20). MMP-2 and -9 activities are regu-lated by interleukins, growth factors and tumournecrosis factor-a at different levels, including gene tran-scription (20). Besides classical transcription factorssuch as AP-1, recent studies have demonstrated involve-ment of other transcriptional regulators, for example,MMP-2 has been described as a target for FoxO3 (24)and Runx2 (25), whereas MMP-9 can be regulated byReck (26) and SMYD3 (27). Epigenetic mechanismssuch as DNA methylation, histone acetylation and meth-ylation at the MMP promoter could also be implicatedin this regulation (28). Furthermore, there is evidence ofcrosstalk between DNA methylation and histone post-translational modifications. In this case, histone modifi-cations provide labile transcriptional repression, andDNA methylation results in highly stable gene silencing(29,30). It has been previously reported that hypomethy-lating agent 5-aza-2′-deoxycytidine (5-azadC) and his-tone deacetylase inhibitor (HDI) trichostatin A (TSA)can act in synergy to induce gene re-expression in leu-kaemic cells (31). Thus, in this study, we have analysedeffects of these drugs on higher order chromatin organi-zation, evaluated by image cytometry and on expressionof gelatinase genes in the invasive HT1080 fibrosarcomatumour cell line.
Material and methods
Cell culture and treatments
Highly invasive human fibrosarcoma HT1080 cells(ATCC, CCL-121) were grown at 37 °C in RMPI med-ium supplemented with 10% foetal calf serum (FCS),100 U/ml penicillin and 100 lg/ml streptomycin. Allcultures were maintained in a humidified atmosphere of95% air/5% CO2 at 37 °C. Cultures were subculturedtwice weekly. Exponentially expanding cell populationswere used in all experiments. Cell viability was assessedby trypan blue exclusion assay. Prior to experiments,cells were washed twice in PBS then incubated inserum-free medium for 24 h. Cells were treated/not trea-ted with up to 5 lM of 5-aza-2′-deoxycytidine (5-azadC,Sigma-Aldrich, Saint-Quentin Fallavier, France) and/or100 ng/ml of trichostatin A (TSA; Sigma-Aldrich) forindicated periods of time.
Image cytometry
Cells were cultured and treated with 5-azadC and/or TSAin LabTek chambered slides (Nunc, Roskilde, Denmark).Nuclear texture analysis was performed as reported (12).Briefly, cells were air-dried and fixed in alcohol-formalinmixture (95% ethanol, 3% formaldehyde in saline; 3:1)for 10 min. After hydrolysis with 5N HCl for 30 min,cells were stained using the Feulgen method with freshlyprepared Schiff’s reagent (pararosanilin chloride, CI42500, 0.5% in sulphite water) for 2 h in the dark at22 °C. Image cytometry was performed using an imageanalysis system (SAMBA 2005, Samba Technologies,Meylan, France) coupled to colour 3CCD camera (SonyCorp., Tokyo, Japan; 752 9 582 pixels) and a micro-scope (Axioscop; Karl Zeiss, Oberkochen, Germany).Measurements were made using plan-achromat 940objective. Effective pixel sampling space within the planeof the sample was 0.20 lm. For each nuclear image, tenparameters were computed: one densitometric feature,integrated optical density (IOD) and nine textural fea-tures. IOD is summation of all pixels in the image of thenucleus and quantitatively measures total intensity ofstaining by the DNA-binding dye. As DNA staining inthe Feulgen reaction is specific and stoichiometric, IODis directly related to total nuclear DNA content. Distribu-tion of nuclei according to IOD was plotted to providecell cycle distribution. Textural features observed byimage cytometry are closely related to location of a givencell in the cell cycle. Comparisons of textures shouldtherefore be performed on cells selected within a specificcycle phase. For this purpose, G0/G1 nuclei were isolatedon the basis of their IOD value, as previously reported
© 2013 Blackwell Publishing Ltd Cell Proliferation, 46, 127–136
128 M. Poplineau et al.

(12). A minimum of 200 G0/G1 nuclei were extracted foreach cell population. Nine texture parameters were com-puted from these nuclei. Four features were calculatedusing grey level co-occurrence matrix: local mean of greylevels (LM), energy (E), entropy (ENT) and inertia (I).Five parameters were calculated on the run-length matrix:short run-length emphasis (SRE), long run-length empha-sis (LRE), grey level distribution (GLD), run-length dis-tribution (RLD) and run-length percentage (RPC) (32). Ithas been previously reported that variations in theseparameters could be related to chromatin condensation,distribution or organization (32,33).
MMP-1, -2 and -9 gene expression analyses
After drug treatments, cells were washed twice in ice-coldPBS and total RNAs were isolated using NucleoSpinRNA II kit (Macherey Nagel, Hoerdt, France). For quan-titative RT-PCR, 1 lg of RNA was reverse transcribedusing M-MLV reverse transcriptase (Invitrogen, FisherScientific, Illkirch, France), and each cDNA sample wasanalysed by real-time PCR, using Platinum SYBRGreen qPCR SuperMix-UDG kit (Invitrogen) on theLightCycler system (Roche Diagnostics, Meylan,France). MMP-1, MMP-2 and MMP-9 transcripts wereamplified using primers described in Table 1. MMP-1was used as control gene, as we have shown previouslythat this gene expression is induced by 5-azadC (34).Relative quantification was performed by using house-keeping gene b2microglobulin as internal control.
Global DNA methylation analysis
Global DNA methylation level after treatment with 5-azadC was evaluated by methylation-sensitive restriction
assay (MSRA) as previously described (35). Briefly,0.5 lg of genomic DNA was incubated overnight at37 °C with 20 units of HpaII (methyl-sensitive) or MspI(methyl-insensitive) restriction enzymes (New EnglandBioLabs, Ipswich, UK). The next day, 10 units of eachenzyme were added for 2 more hours. DNA digestionlevel was verified by electrophoresis on 0.8% agarosegel. Electrophoretic images were analysed using ImageJsoftware (http://rsb.info.nih.gov/ij) (36).
Methylation-specific PCR
Methylation level of MMP-2 and MMP-9 promoters wasdetermined by methylation-specific PCR (MSP). Geno-mic DNA was isolated using QIAamp DNA Mini kit(Qiagen, Courtaboeuf, France). 0.5 lg of genomic DNAwas bisulphite-converted using EpiTect Bisulfite kit(Qiagen) according to the manufacturer’s instructions.Bisulphite-modified DNA samples were amplified byprimers specific for both methylated and unmethylatedsequences of the �224 to �51 region of the MMP-2promoter, or 3382–3488 region of the MMP-9 gene(Table 1). Primers were designed using Methyl PrimerExpress software (Life Technologies, Saint-Aubin,France). After primer set optimization using EpiTectPCR Control DNA kit (Qiagen), PCR was performed on2 ll of converted DNA using Hot-Start Taq polymerase(Qiagen). After amplification, PCR products were analy-sed on 12% polyacrylamide gel and revealed by ethidi-um bromide and UV light.
Statistical analysis
For image cytometry data, mean, standard deviation andrange values of nuclear parameters were calculated foreach cell population. Variability in parameter measure-ments in each cell population was analysed by one-wayanalysis of variance. Significance of differences betweenparameter values was estimated by Kolmogorov–Smir-nov test on cumulated frequencies (37).
To perform comparisons between multiple cellgroups, deviation index (z-score) was calculated, as pre-viously reported (12). For each parameter measured in agiven nucleus, differences in value to feature valueobserved in untreated control nuclei, were computed andstandardized by dividing them by corresponding stan-dard deviations in the control data sets (38). Averagenuclear abnormality index (NAI) was then calculated foreach cell line as arithmetic mean of absolute values ofdeviation indices observed for the 9 features per dataset. This NAI represents a data reduction technique thatpermits taking into account all z-scores that constitutenuclear textural signature (38). Significance of differ-
Table 1. PCR Primer sequences
Target Forward and reverse primer sequences
MMP-1 F: 5′-GAGCAAACACATCTGACCTACAGGA-3′R: 5′-TTGTCCCGATGATCTCCCCTGACA-3′
MMP-2 F: 5′-TCTTCCCCTTCACTTTCCTG-3′R: 5′-ACTTGCGGTCGTCATCGT-3′
MMP-9 F: 5′-TGACAGCGACAAGAAGTGG-3′R: 5′-GGCGAGGACCATAGAGGTG-3′
b2-microglobulin F: 5′-ATCTTCAAACCTCCATGATG-3′R: 5′-ACCCCCACTGAAAA AGATGA-3′
MSP MMP-2methylated
F: 5′-ATTGTTAGGATTTGCGGC-3′R: 5′-CTCGATACGTATAACCGCCT-3′
MSP MMP-2unmethylated
F: 5′-GGGATTGTTAGGATTTGTGGT-3′R: 5′-AACTCAATACATATAACCACCTC-3′
MSP MMP-9methylated
F: 5′-ATTAAGGTAGGCGTGGTTTC-3′R: 5′-AAACCTAAAACGTAAACGCC-3′
MSP MMP-9unmethylated
F: 5′-GGATTAAGGTAGGTGTGGTTTT-3′R: 5′-AAACCTAAAACATAAACACCAA-3′
© 2013 Blackwell Publishing Ltd Cell Proliferation, 46, 127–136
Nuclear texture and gelatinase expression 129
ences between index values was estimated using Stu-dent’s t-test.
Multivariate analysis was performed with the Sambasoftware. Two main kinds of multidimensional analyseswere used: supervised classification by discriminantanalysis and unsupervised classification (39). Linearstepwise discriminant analysis was based on use of theF-test to select variables. Its purpose was to select tex-tural features whose variations best characterize differentcell populations. This discriminant analysis could becompleted by canonical analysis, which derives canoni-cal variables (linear combinations of independent vari-ables). Significance of differences between canonicalvariable values computed in the various cell populationswas estimated by the Kolmogorov–Smirnov test oncumulated frequencies. Unsupervised multidimensionalpartitioning (cluster analysis) was applied to separatecell groups that differed in distribution of texture param-eters. This analysis successively looked for most hetero-geneously distributed feature, split the population intosubgroups, and fused non-significant subgroups. Theprocess was iterated for all parameters and does notrequire any a priori knowledge concerning different celltypes eventually to be found in the population. It pre-serves total objectivity about status of a given cell (40).
RT-PCR results were expressed as mean � SEM ofat least 3 independent experiments. Significance of dif-ferences observed was analysed using the Kruskal–Wal-lis test.
Results
Nuclear texture and DNA methylation changes inducedby 5-azadC
Nine textural features were computed on each nuclearimage. Values of these parameters in control cells andcells treated with 5 lM of 5-azadC for 72 h are shownin Table 2. 5-azadC-treated cells displayed significantvariations compared to control cells: less compact chro-matin (increase in E and reduction in LM, ENT and I),with increase in distance between isodensity points(reduction in SRE and increase in LRE), confirmingmore homogeneous distribution of chromatin withinnuclei (increase in GLD measuring uniformity of distri-bution of optical densities, reduction in RLD and RPC).For all computed parameters, distribution in 5-azadC-treated cells and in control cells was significantly different(P < 0.05). However, due to high sensitivity of texturefeatures, we analysed variability in their measurementsin three separate control and treated cell groups. Noneof the nine features displayed any significant variationwithin these groups (Table 3).
All textural parameters might be involved in defini-tion of nuclear phenotype. Features enabling optimalseparation between control and 5-azadC-treated cellswere then selected by performing linear discriminantanalysis. Most discriminant features, ranked accordingto their discriminant power, are listed in Table 4. Threefeatures (GLD, LM and LRE) were predominant for
Table 2. Values of textural features in HT1080 cells treated with5 lM 5-azadC for 72 h
Parameters Cell treatment
None (n = 320) 5-azadC 5 lM (n = 276)
LM 33.4 � 7.4 (12.3–61.0) 16.5 � 4.6 (7.7–33.2)E 5.0 � 0.7 (2.0–19.8) 12.2 � 4.2 (4.3–31.5)ENT 33.7 � 4.5 (18.7–42.5) 24.5 � 3.2 (14.2–34.1)I 31.7 � 9.0 (15.7–75.4) 20.6 � 2.8 (13.8–36.4)SRE 60.8 � 3.5 (47.7–76.3) 52.8 � 2.2 (47.3–60.5)LRE 6.0 � 1.9 (3.3–13.7) 9.3 � 1.7 (5.3–16.7)GLD 12.2 � 4.6 (6.9–34.5) 23.4 � 5.1 (11.5–46.3)RLD 36.0 � 5.9 (23.7–53.9) 28.1 � 2.1 (22.8–35.2)RPC 10.3 � 1.2 (7.1–13.3) 8.5 � 0.6 (6.7–10.4)
Textural features evaluated in G0/G1 cell nuclei. For each parameter,value expressed as mean � SD, and numbers in italics represent distri-bution range of each parameter in the population. For all parameters,distributions in control and treated cells are significantly different(P < 0.05, Kolmogorov–Smirnov test on cumulated frequencies). E,energy; ENT, entropy; GLD, grey-level distribution; I, inertia; LM,local mean; LRE, long run-length emphasis; RLD, run-length distribu-tion; RPC, run-length percentage; SRE, short run-length emphasis.
Table 3. Variability in measurements of nuclear texture parameters
Parameters Variability withincontrol groups from3 experiments
Variability withintreated groups from3 experiments
F value P F value P
LM 1.80 0.16 0.15 0.86E 1.37 0.25 0.23 0.79ENT 1.06 0.34 0.10 0.90I 1.07 0.34 0.18 0.83SRE 0.48 0.61 0.07 0.93LRE 1.17 0.31 0.61 0.54GLD 1.12 0.32 0.11 0.89RLD 0.80 0.45 0.03 0.97RPC 1.10 0.33 0.08 0.91
Nuclear texture parameters computed of G0/G1 nuclei from controlcells and cells treated for 72 h with 5 lM 5-azadC, from 3 separateexperiments. Values within control or treated groups were comparedby one-way analysis of variance. E, energy; ENT, entropy; GLD, grey-level distribution; I, inertia; LM, local mean; LRE, long run-lengthemphasis; RLD, run-length distribution; RPC, run-length percentage;SRE, short run-length emphasis.
© 2013 Blackwell Publishing Ltd Cell Proliferation, 46, 127–136
130 M. Poplineau et al.
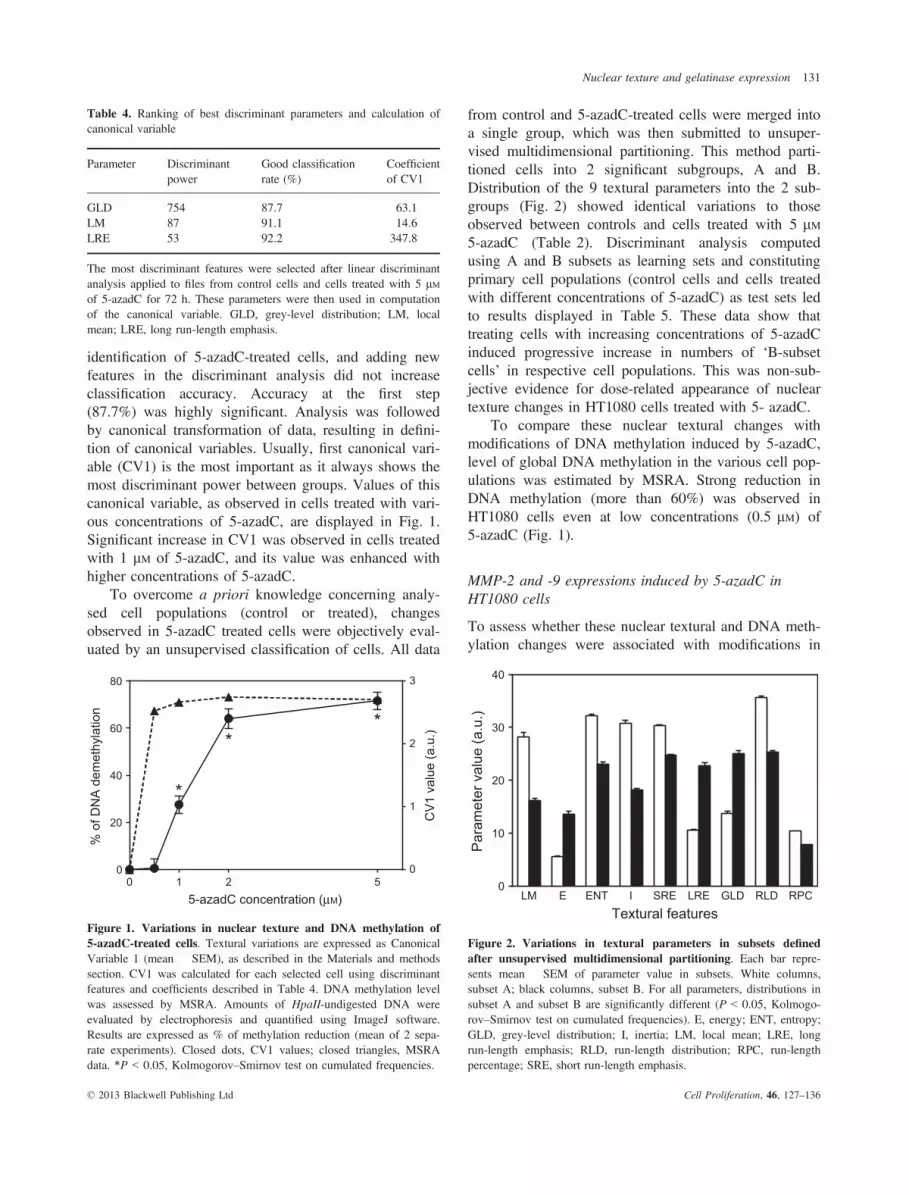
identification of 5-azadC-treated cells, and adding newfeatures in the discriminant analysis did not increaseclassification accuracy. Accuracy at the first step(87.7%) was highly significant. Analysis was followedby canonical transformation of data, resulting in defini-tion of canonical variables. Usually, first canonical vari-able (CV1) is the most important as it always shows themost discriminant power between groups. Values of thiscanonical variable, as observed in cells treated with vari-ous concentrations of 5-azadC, are displayed in Fig. 1.Significant increase in CV1 was observed in cells treatedwith 1 lM of 5-azadC, and its value was enhanced withhigher concentrations of 5-azadC.
To overcome a priori knowledge concerning analy-sed cell populations (control or treated), changesobserved in 5-azadC treated cells were objectively eval-uated by an unsupervised classification of cells. All data
from control and 5-azadC-treated cells were merged intoa single group, which was then submitted to unsuper-vised multidimensional partitioning. This method parti-tioned cells into 2 significant subgroups, A and B.Distribution of the 9 textural parameters into the 2 sub-groups (Fig. 2) showed identical variations to thoseobserved between controls and cells treated with 5 lM5-azadC (Table 2). Discriminant analysis computedusing A and B subsets as learning sets and constitutingprimary cell populations (control cells and cells treatedwith different concentrations of 5-azadC) as test sets ledto results displayed in Table 5. These data show thattreating cells with increasing concentrations of 5-azadCinduced progressive increase in numbers of ‘B-subsetcells’ in respective cell populations. This was non-sub-jective evidence for dose-related appearance of nucleartexture changes in HT1080 cells treated with 5- azadC.
To compare these nuclear textural changes withmodifications of DNA methylation induced by 5-azadC,level of global DNA methylation in the various cell pop-ulations was estimated by MSRA. Strong reduction inDNA methylation (more than 60%) was observed inHT1080 cells even at low concentrations (0.5 lM) of5-azadC (Fig. 1).
MMP-2 and -9 expressions induced by 5-azadC inHT1080 cells
To assess whether these nuclear textural and DNA meth-ylation changes were associated with modifications in
Table 4. Ranking of best discriminant parameters and calculation ofcanonical variable
Parameter Discriminantpower
Good classificationrate (%)
Coefficientof CV1
GLD 754 87.7 63.1LM 87 91.1 �14.6LRE 53 92.2 347.8
The most discriminant features were selected after linear discriminantanalysis applied to files from control cells and cells treated with 5 lMof 5-azadC for 72 h. These parameters were then used in computationof the canonical variable. GLD, grey-level distribution; LM, localmean; LRE, long run-length emphasis.
5-azadC concentration (µM)
% o
f DN
A d
emet
hyla
tion
CV
1 va
lue
(a.u
.)
0
20
40
60
80
0
1
2
3
5210
*
**
Figure 1. Variations in nuclear texture and DNA methylation of5-azadC-treated cells. Textural variations are expressed as CanonicalVariable 1 (mean � SEM), as described in the Materials and methodssection. CV1 was calculated for each selected cell using discriminantfeatures and coefficients described in Table 4. DNA methylation levelwas assessed by MSRA. Amounts of HpaII-undigested DNA wereevaluated by electrophoresis and quantified using ImageJ software.Results are expressed as % of methylation reduction (mean of 2 sepa-rate experiments). Closed dots, CV1 values; closed triangles, MSRAdata. *P < 0.05, Kolmogorov–Smirnov test on cumulated frequencies.
Textural features
Par
amet
er v
alue
(a.u
.)
LM E ENT I SRE LRE GLD RLD RPC0
10
20
30
40
Figure 2. Variations in textural parameters in subsets definedafter unsupervised multidimensional partitioning. Each bar repre-sents mean � SEM of parameter value in subsets. White columns,subset A; black columns, subset B. For all parameters, distributions insubset A and subset B are significantly different (P < 0.05, Kolmogo-rov–Smirnov test on cumulated frequencies). E, energy; ENT, entropy;GLD, grey-level distribution; I, inertia; LM, local mean; LRE, longrun-length emphasis; RLD, run-length distribution; RPC, run-lengthpercentage; SRE, short run-length emphasis.
© 2013 Blackwell Publishing Ltd Cell Proliferation, 46, 127–136
Nuclear texture and gelatinase expression 131
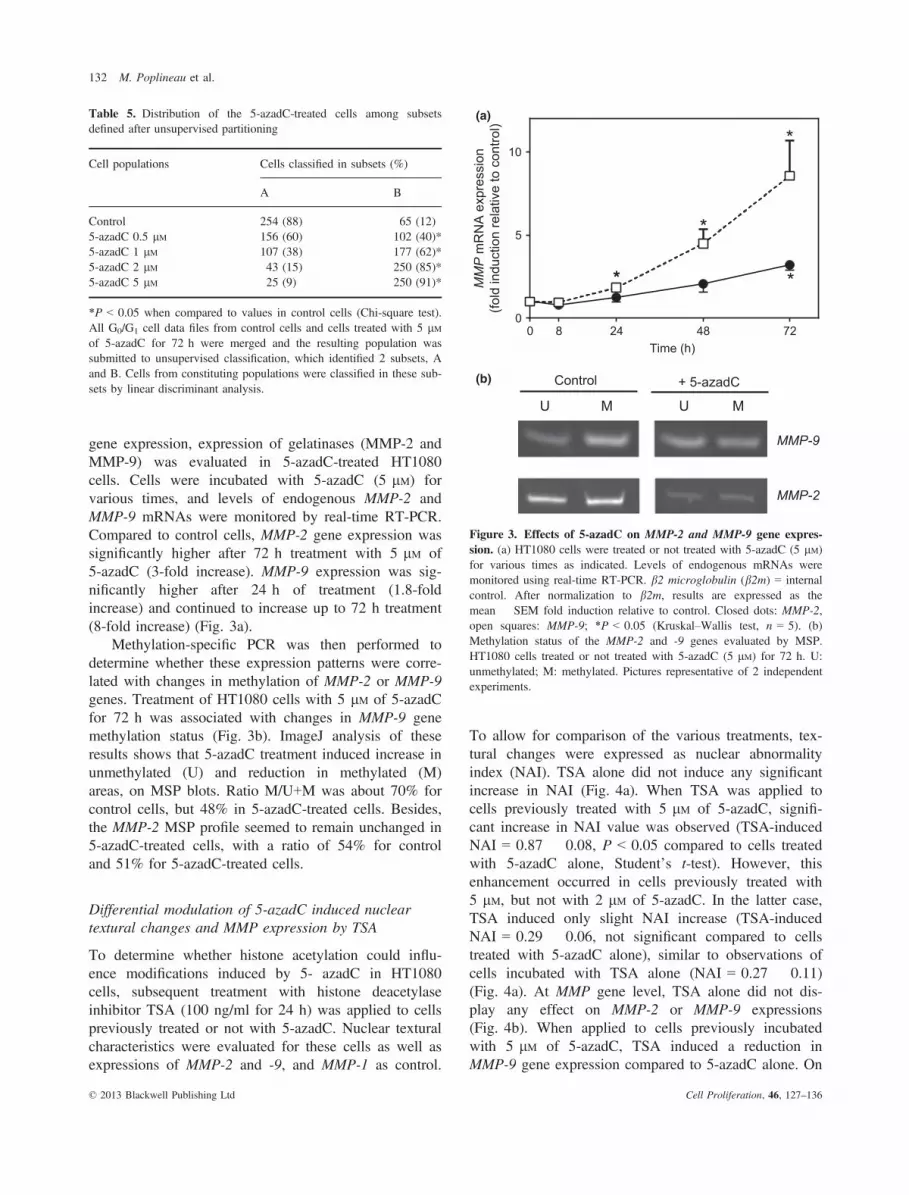
gene expression, expression of gelatinases (MMP-2 andMMP-9) was evaluated in 5-azadC-treated HT1080cells. Cells were incubated with 5-azadC (5 lM) forvarious times, and levels of endogenous MMP-2 andMMP-9 mRNAs were monitored by real-time RT-PCR.Compared to control cells, MMP-2 gene expression wassignificantly higher after 72 h treatment with 5 lM of5-azadC (3-fold increase). MMP-9 expression was sig-nificantly higher after 24 h of treatment (1.8-foldincrease) and continued to increase up to 72 h treatment(8-fold increase) (Fig. 3a).
Methylation-specific PCR was then performed todetermine whether these expression patterns were corre-lated with changes in methylation of MMP-2 or MMP-9genes. Treatment of HT1080 cells with 5 lM of 5-azadCfor 72 h was associated with changes in MMP-9 genemethylation status (Fig. 3b). ImageJ analysis of theseresults shows that 5-azadC treatment induced increase inunmethylated (U) and reduction in methylated (M)areas, on MSP blots. Ratio M/U+M was about 70% forcontrol cells, but 48% in 5-azadC-treated cells. Besides,the MMP-2 MSP profile seemed to remain unchanged in5-azadC-treated cells, with a ratio of 54% for controland 51% for 5-azadC-treated cells.
Differential modulation of 5-azadC induced nucleartextural changes and MMP expression by TSA
To determine whether histone acetylation could influ-ence modifications induced by 5- azadC in HT1080cells, subsequent treatment with histone deacetylaseinhibitor TSA (100 ng/ml for 24 h) was applied to cellspreviously treated or not with 5-azadC. Nuclear texturalcharacteristics were evaluated for these cells as well asexpressions of MMP-2 and -9, and MMP-1 as control.
To allow for comparison of the various treatments, tex-tural changes were expressed as nuclear abnormalityindex (NAI). TSA alone did not induce any significantincrease in NAI (Fig. 4a). When TSA was applied tocells previously treated with 5 lM of 5-azadC, signifi-cant increase in NAI value was observed (TSA-inducedNAI = 0.87 � 0.08, P < 0.05 compared to cells treatedwith 5-azadC alone, Student’s t-test). However, thisenhancement occurred in cells previously treated with5 lM, but not with 2 lM of 5-azadC. In the latter case,TSA induced only slight NAI increase (TSA-inducedNAI = 0.29 � 0.06, not significant compared to cellstreated with 5-azadC alone), similar to observations ofcells incubated with TSA alone (NAI = 0.27 � 0.11)(Fig. 4a). At MMP gene level, TSA alone did not dis-play any effect on MMP-2 or MMP-9 expressions(Fig. 4b). When applied to cells previously incubatedwith 5 lM of 5-azadC, TSA induced a reduction inMMP-9 gene expression compared to 5-azadC alone. On
Table 5. Distribution of the 5-azadC-treated cells among subsetsdefined after unsupervised partitioning
Cell populations Cells classified in subsets (%)
A B
Control 254 (88) 65 (12)5-azadC 0.5 lM 156 (60) 102 (40)*5-azadC 1 lM 107 (38) 177 (62)*5-azadC 2 lM 43 (15) 250 (85)*5-azadC 5 lM 25 (9) 250 (91)*
*P < 0.05 when compared to values in control cells (Chi-square test).All G0/G1 cell data files from control cells and cells treated with 5 lMof 5-azadC for 72 h were merged and the resulting population wassubmitted to unsupervised classification, which identified 2 subsets, Aand B. Cells from constituting populations were classified in these sub-sets by linear discriminant analysis.
Time (h)
MM
P m
RN
A e
xpre
ssio
n(fo
ld in
duct
ion
rela
tive
to c
ontro
l)
0
5
10
0 8 24 48 72
**
*
*
**
U M U M
MMP-9
MMP-2
Control + 5-azadC
(a)
(b)
Figure 3. Effects of 5-azadC on MMP-2 and MMP-9 gene expres-sion. (a) HT1080 cells were treated or not treated with 5-azadC (5 lM)for various times as indicated. Levels of endogenous mRNAs weremonitored using real-time RT-PCR. b2 microglobulin (b2m) = internalcontrol. After normalization to b2m, results are expressed as themean � SEM fold induction relative to control. Closed dots: MMP-2,open squares: MMP-9; *P < 0.05 (Kruskal–Wallis test, n = 5). (b)Methylation status of the MMP-2 and -9 genes evaluated by MSP.HT1080 cells treated or not treated with 5-azadC (5 lM) for 72 h. U:unmethylated; M: methylated. Pictures representative of 2 independentexperiments.
© 2013 Blackwell Publishing Ltd Cell Proliferation, 46, 127–136
132 M. Poplineau et al.
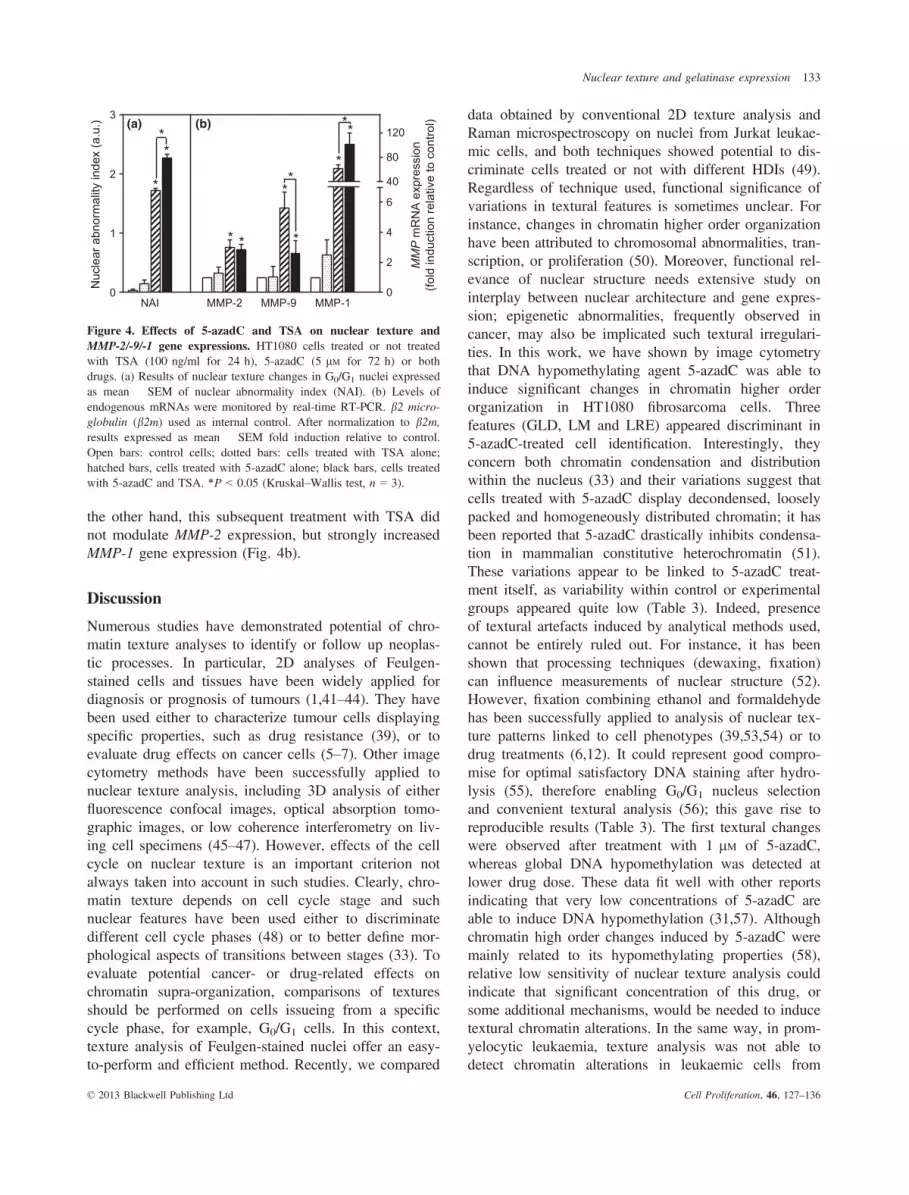
the other hand, this subsequent treatment with TSA didnot modulate MMP-2 expression, but strongly increasedMMP-1 gene expression (Fig. 4b).
Discussion
Numerous studies have demonstrated potential of chro-matin texture analyses to identify or follow up neoplas-tic processes. In particular, 2D analyses of Feulgen-stained cells and tissues have been widely applied fordiagnosis or prognosis of tumours (1,41–44). They havebeen used either to characterize tumour cells displayingspecific properties, such as drug resistance (39), or toevaluate drug effects on cancer cells (5–7). Other imagecytometry methods have been successfully applied tonuclear texture analysis, including 3D analysis of eitherfluorescence confocal images, optical absorption tomo-graphic images, or low coherence interferometry on liv-ing cell specimens (45–47). However, effects of the cellcycle on nuclear texture is an important criterion notalways taken into account in such studies. Clearly, chro-matin texture depends on cell cycle stage and suchnuclear features have been used either to discriminatedifferent cell cycle phases (48) or to better define mor-phological aspects of transitions between stages (33). Toevaluate potential cancer- or drug-related effects onchromatin supra-organization, comparisons of texturesshould be performed on cells issueing from a specificcycle phase, for example, G0/G1 cells. In this context,texture analysis of Feulgen-stained nuclei offer an easy-to-perform and efficient method. Recently, we compared
data obtained by conventional 2D texture analysis andRaman microspectroscopy on nuclei from Jurkat leukae-mic cells, and both techniques showed potential to dis-criminate cells treated or not with different HDIs (49).Regardless of technique used, functional significance ofvariations in textural features is sometimes unclear. Forinstance, changes in chromatin higher order organizationhave been attributed to chromosomal abnormalities, tran-scription, or proliferation (50). Moreover, functional rel-evance of nuclear structure needs extensive study oninterplay between nuclear architecture and gene expres-sion; epigenetic abnormalities, frequently observed incancer, may also be implicated such textural irregulari-ties. In this work, we have shown by image cytometrythat DNA hypomethylating agent 5-azadC was able toinduce significant changes in chromatin higher orderorganization in HT1080 fibrosarcoma cells. Threefeatures (GLD, LM and LRE) appeared discriminant in5-azadC-treated cell identification. Interestingly, theyconcern both chromatin condensation and distributionwithin the nucleus (33) and their variations suggest thatcells treated with 5-azadC display decondensed, looselypacked and homogeneously distributed chromatin; it hasbeen reported that 5-azadC drastically inhibits condensa-tion in mammalian constitutive heterochromatin (51).These variations appear to be linked to 5-azadC treat-ment itself, as variability within control or experimentalgroups appeared quite low (Table 3). Indeed, presenceof textural artefacts induced by analytical methods used,cannot be entirely ruled out. For instance, it has beenshown that processing techniques (dewaxing, fixation)can influence measurements of nuclear structure (52).However, fixation combining ethanol and formaldehydehas been successfully applied to analysis of nuclear tex-ture patterns linked to cell phenotypes (39,53,54) or todrug treatments (6,12). It could represent good compro-mise for optimal satisfactory DNA staining after hydro-lysis (55), therefore enabling G0/G1 nucleus selectionand convenient textural analysis (56); this gave rise toreproducible results (Table 3). The first textural changeswere observed after treatment with 1 lM of 5-azadC,whereas global DNA hypomethylation was detected atlower drug dose. These data fit well with other reportsindicating that very low concentrations of 5-azadC areable to induce DNA hypomethylation (31,57). Althoughchromatin high order changes induced by 5-azadC weremainly related to its hypomethylating properties (58),relative low sensitivity of nuclear texture analysis couldindicate that significant concentration of this drug, orsome additional mechanisms, would be needed to inducetextural chromatin alterations. In the same way, in prom-yelocytic leukaemia, texture analysis was not able todetect chromatin alterations in leukaemic cells from
Nuc
lear
abn
orm
ality
inde
x (a
.u.)
MM
P m
RN
A e
xpre
ssio
n(fo
ld in
duct
ion
rela
tive
to c
ontro
l)
NAI MMP-2 MMP-9 MMP-10
1
2
3
0
2
4
6
40
80
120
* * *
*
*
**
**
**
(a) (b)
Figure 4. Effects of 5-azadC and TSA on nuclear texture andMMP-2/-9/-1 gene expressions. HT1080 cells treated or not treatedwith TSA (100 ng/ml for 24 h), 5-azadC (5 lM for 72 h) or bothdrugs. (a) Results of nuclear texture changes in G0/G1 nuclei expressedas mean � SEM of nuclear abnormality index (NAI). (b) Levels ofendogenous mRNAs were monitored by real-time RT-PCR. b2 micro-globulin (b2m) used as internal control. After normalization to b2m,results expressed as mean � SEM fold induction relative to control.Open bars: control cells; dotted bars: cells treated with TSA alone;hatched bars, cells treated with 5-azadC alone; black bars, cells treatedwith 5-azadC and TSA. *P < 0.05 (Kruskal–Wallis test, n = 3).
© 2013 Blackwell Publishing Ltd Cell Proliferation, 46, 127–136
Nuclear texture and gelatinase expression 133

patients with methylation of specific genes (59). InHT1080 cells, treatment with TSA enhanced levels ofnuclear changes (evaluated by NAI) induced by 5-aza-dC. It has already been shown that panobinostat or TSAact in synergy with 5-azadC, and that combination ofboth drugs induces marked increase in histone acetyla-tion (31,60). However, adding TSA to 5-azadC-treatedHT1080 cells induced a significant effect on nuclear tex-ture, but only when cells were previously incubated withhigher concentration of 5-azadC. This suggests that tex-ture analysis can only detect TSA-induced changes inchromatin distribution patterns if cells have been suffi-ciently sensitized through hypomethylation by 5-azadC.However, it must be emphasized that these data apply toG0/G1 HT1080 cells only, as it has been reported thatextent of TSA-induced chromatin changes was both cellcycle- and cell line-dependent (61).
Significant changes in chromatin high order organi-zation, evaluated through nuclear texture, have alreadybeen reported as markers of tumour cell aggressivenessor metastatic potential (41,62). As gelatinases are impli-cated in tumour metastasis, we investigated their expres-sion in HT1080 fibrosarcoma cells treated with 5-azadCand/or TSA. Treatment with 5-azadC induced higherincrease in MMP-9 expression than in MMP-2 expres-sion. Similarly, we have previously observed that 5-aza-dC enhanced MMP-1 expression strongly in these cells(34). Induction of MMP-2 and MMP-9 genes by 5-aza-dC has already been reported in breast cancer (63), pan-creatic cells (64) and lymphomas (65). In our results,expression was associated with significant modulation ofDNA methylation of MMP-9 but not of MMP-2 genepromoter. Large CpG islands (4.65 kb) are present inthe MMP-9 gene-coding region, which correlates withthe key role of DNA methylation in regulation of itsexpression (28). CpG island size is more limited(1.5 kb) with MMP-2 gene expression, and knockout ofDNMT1 and DNMT3b in mice has been unable toinduce MMP-2 expression, while it was able to induceMMP-3 (66). This suggests some level of resistance ofMMP-2 to hypomethylating drugs, as resistance to drug-induced hypomethylation is mostly overcome inDNMT1; DNMT3B double knockout cells (67). On theother hand, TSA alone did not display any effect onthese gene expressions. Similar results have alreadybeen observed for MMP-1 or MMP-2 in HT1080 cells(34,68). Interestingly, further treatment with TSA associ-ated with 5-azadC induced different effects on MMPgene expression. TSA was inactive on MMP-2, while itreduced 5-azadC-induced expression of MMP-9. Thiswas different from already described enhancement ofMMP-1 expression induced by this combination of drugs(34). Variations observed for MMP-9 correlate with
previous data showing that TSA is able to reduce MMP-9 expression in gastric cancer (69), in thyroid cancercells (70) or in human endometrial stromal cells (71).Moreover, it has been shown that MCT1, a new HDI, isable to inhibit MMP-9 expression induced by 5-azadCin HL60 haematopoietic cells (72).
Our findings indicate that hypomethylating drug5-azadC and HDI TSA induced modulations in higherorder chromatin organization and in gelatinase expres-sion in human HT1080 fibrosarcoma cells. However,comparison of data originating from nuclear textureanalysis on the one hand, and gene expression analysisby RT-PCR on the other, must be performed cautiously.The first technique constitutes a cell-by-cell typemethod, whereas here RT-PCR was applied to RNApooled from large numbers of cells, without selectingthose in G0/G1. Thus, further analyses must comparetexture from isolated living cells with single-cell geneexpression profiling (73). Observed increase in gelati-nase expression could help dissect effects of DNA hy-pomethylating agents on tumour cell phenotype.Nevertheless, epigenetic events induce multiple generegulation and these results concern only MMP-2 and -9genes. These data must therefore be completed by analy-ses on a larger spectrum of cancer-related genes, andcomplementary approaches must be used to address thecomplex interplay between nuclear architecture andfunctions like gene expression.
Acknowledgements
MP is the recipient of a fellowship from the French‘Minist�ere de l’Enseignement Sup�erieur et de la Recher-che’. MS is supported by a Waxweiler grant for cancerprevention research from the Action Lions ‘Vaincre leCancer’. This work was supported by grants from theComit�e D�epartemental de l’Aube de la Ligue Nationalecontre le Cancer. The work performed at Laboratoire deBiologie Mol�eculaire et Cellulaire du Cancer was sup-ported by T�el�evie Luxembourg, the ‘Recherche Canceret Sang’ foundation and the ‘Recherches ScientifiquesLuxembourg’ association. We thank G.D. Sockalingumfor reviewing the manuscript.
References
1 Millot C, Dufer J (2000) Clinical applications of image cytometryto human tumour analysis. Histol. Histopathol. 15, 1185–1200.
2 Dey P (2010) Cancer nucleus: morphology and beyond. Diagn. Cy-topathol. 38, 382–390.
3 Fafin-Lefevre M, Morlais F, Guittet L, Clin B, Launoy G, Galateau-Sall�e F (2011) Nuclear morphology for the detection of alterationsin bronchial cells from lung cancer: an attempt to improve sensitiv-ity and specificity. Anal. Quant. Cytol. Histol. 33, 183–195.
© 2013 Blackwell Publishing Ltd Cell Proliferation, 46, 127–136
134 M. Poplineau et al.
4 Guillaud M, Le Riche JC, Dawe C, Korbelik J, Coldman A,Wistuba II et al. (2005) Nuclear morphometry as a biomarker forbronchial intraepithelial neoplasia: correlation with genetic damageand cancer development. Cytometry A 63, 34–40.
5 Mello MLS, Vidal BC, Russo IH, Lareef MH, Russo J (2007)DNA content and chromatin texture of human breast epithelialcells transformed with 17-beta-estradiol and the estrogen antago-nist ICI 182,780 as assessed by image analysis. Mutat. Res. 617,1–7.
6 Trussardi-Regnier A, Lavenus S, Gorisse M-C, Dufer J (2009) Tha-lidomide alters nuclear architecture without ABCB1 gene modula-tion in drug-resistant myeloma cells. Int. J. Oncol. 35, 641–647.
7 De Campos Vidal B, Russo J, Mello ML (1998) DNA content andchromatin texture of benzo[a]pyrene-transformed human breast epi-thelial cells as assessed by image analysis. Exp. Cell Res. 244, 77–82.
8 Vaissi�ere T, Sawan C, Herceg Z (2008) Epigenetic interplaybetween histone modifications and DNA methylation in genesilencing. Mutat. Res. 659, 40–48.
9 Mampumbu AR, Mello MLS (2006) DNA methylation in stinglessbees with low and high heterochromatin contents as assessed byrestriction enzyme digestion and image analysis. Cytometry A 69,986–991.
10 Gertych A, Wawrowsky KA, Lindsley E, Vishnevsky E, FarkasDL, Tajbakhsh J. (2009) Automated quantification of DNA deme-thylation effects in cells via 3D mapping of nuclear signatures andpopulation homogeneity assessment. Cytometry A 75, 569–583.
11 Gertych A, Farkas DL, Tajbakhsh J (2010) Measuring topology oflow-intensity DNA methylation sites for high-throughput assess-ment of epigenetic drug-induced effects in cancer cells. Exp. CellRes. 316, 3150–3160.
12 El-Khoury V, Gomez D, Liautaud-Roger F, Trussardi-R�egnier A,Dufer J (2004) Effects of the histone deacetylase inhibitor trichos-tatin A on nuclear texture and c-jun gene expression in drug-sensi-tive and drug-resistant human H69 lung carcinoma cells. CytometryA 62, 109–117.
13 T�oth KF, Knoch TA, Wachsmuth M, Frank-St€ohr M, St€ohr M,Bacher CP et al. (2004) Trichostatin A-induced histone acetylationcauses decondensation of interphase chromatin. J. Cell Sci. 117,4277–4287.
14 Sandoval J, Esteller M (2012) Cancer epigenomics: beyond genom-ics. Curr. Opin. Genet. Dev. 22, 50–55.
15 Florean C, Schnekenburger M, Grandjenette C, Dicato M, Diede-rich M (2011) Epigenomics of leukemia: from mechanisms to ther-apeutic applications. Epigenomics 3, 581–609.
16 Schnekenburger M, Diederich M (2012) Epigenetics offer newhorizons for colorectal cancer prevention. Curr. Colo. Cancer Rep.8, 66–81.
17 Seidel C, Florean C, Schnekenburger M, Dicato M, Diederich M(2012) Chromatin-modifying agents in anti-cancer therapy. Biochi-mie 94, 2264–2279.
18 Seidel C, Schnekenburger M, Dicato M, Diederich M (2012) His-tone deacetylase modulators provided by Mother Nature. GenesNutr. 7, 357–367.
19 Folmer F, Orlikova B, Schnekenbuger M, Dicato M, Diederich M(2010) Naturally occurring regulators of histone acetylation/deacet-ylation. Curr. Nutr. Food Sci. 6, 78–99.
20 Kessenbrock K, Plaks V, Werb Z (2010) Matrix metalloproteinas-es: regulators of the tumor microenvironment. Cell 141, 52–67.
21 Bauvois B (2012) New facets of matrix metalloproteinases MMP-2and MMP-9 as cell surface transducers: outside-in signaling andrelationship to tumor progression. Biochim. Biophys. Acta. 1825,29–36.
22 Kallakury BV, Karikehalli S, Haholu A, Sheehan CE, Azumi N,Ross JS (2001) Increased expression of matrix metalloproteinases 2and 9 and tissue inhibitors of metalloproteinases 1 and 2 correlatewith poor prognostic variables in renal cell carcinoma. Clin. Can-cer Res. 7, 3113–3119.
23 Kondratiev S, Gnepp DR, Yakirevich E, Sabo E, Annino DJ,Rebeiz E et al. (2008) Expression and prognostic role of MMP2,MMP9, MMP13, and MMP14 matrix metalloproteinases in sinona-sal and oral malignant melanomas. Hum. Pathol. 39, 337–343.
24 Diebold I, Petry A, Burger M, Hess J, G€orlach A (2011) NOX4mediates activation of FoxO3a and matrix metalloproteinase-2expression by urotensin-II. Mol. Biol. Cell 22, 4424–4434.
25 Niu D-F, Kondo T, Nakazawa T, Oishi N, Kawasaki T, Mochizuki Ket al. (2012) Transcription factor Runx2 is a regulator of epithelial-mesenchymal transition and invasion in thyroid carcinomas. Lab.Invest. 92, 1181–1190.
26 Takagi S, Simizu S, Osada H (2009) RECK negatively regulatesmatrix metalloproteinase-9 transcription. Cancer Res. 69, 1502–1508.
27 Cock-Rada AM, Medjkane S, Janski N, Yousfi N, Perichon M,Chaussepied M et al. (2012) SMYD3 promotes cancer invasion byepigenetic upregulation of the metalloproteinase MMP-9. CancerRes. 72, 810–820.
28 Chernov AV, Strongin AY (2011) Epigenetic regulation of matrixmetalloproteinases and their collagen substrates in cancer. Biomol.Concepts 2, 135–147.
29 Cedar H, Bergman Y (2009) Linking DNA methylation and his-tone modification: patterns and paradigms. Nat. Rev. Genet. 10,295–304.
30 Ikegami K, Ohgane J, Tanaka S, Yagi S, Shiota K (2009) Interplaybetween DNA methylation, histone modification and chromatinremodeling in stem cells and during development. Int. J. Dev. Biol.53, 203–214.
31 Cameron EE, Bachman KE, My€oh€anen S, Herman JG, Baylin SB(1999) Synergy of demethylation and histone deacetylase inhibitionin the re-expression of genes silenced in cancer. Nat. Genet. 21,103–107.
32 Doudkine A, Macaulay C, Poulin N, Palcic B (1995) Nuclear tex-ture measurements in image cytometry. Pathologica 87, 286–299.
33 Giroud F, Gauvain C, Seigneurin D, Von Hagen V (1988) Chro-matin texture changes related to proliferation and maturation in ery-throcytes. Cytometry 9, 339–348.
34 Poplineau M, Dufer J, Antonicelli F, Trussardi-Regnier A (2011)Epigenetic regulation of proMMP-1 expression in the HT1080human fibrosarcoma cell line. Int. J. Oncol. 38, 1713–1718.
35 Schnekenburger M, Grandjenette C, Ghelfi J, Karius T, Foliguet B,Dicato M et al. (2011) Sustained exposure to the DNA demethylat-ing agent, 2′-deoxy-5-azacytidine, leads to apoptotic cell death inchronic myeloid leukemia by promoting differentiation, senescence,and autophagy. Biochem. Pharmacol. 81, 364–378.
36 Schneider CA, Rasband WS, Eliceiri CW (2012) NIH Image toImageJ: 25 years of image analysis. Nat. Meth. 9, 671–675.
37 Young IT (1977) Proof without prejudice: use of the Kolmogorov-Smirnov test for the analysis of histograms from flow systems andother sources. J. Histochem. Cytochem. 25, 935–941.
38 Bartels PH, Da Silva VD, Montironi R, Hamilton PW, Thompson D,Vaught L et al. (1998) Chromatin texture signatures in nuclei fromprostate lesions. Anal. Quant. Cytol. Histol. 20, 407–416.
39 Dufer J, Millot-Broglio C, Oum’Hamed Z, Liautaud-Roger F, Joly P,Desplaces A et al. (1995) Nuclear DNA content and chromatin tex-ture in multidrug-resistant human leukemic cell lines. Int. J. Cancer60, 108–114.
40 Al-Nachawati H (1984) Segmentation multidimensionnelle. Stat.Anal. Donn�ees 9, 1–30.
© 2013 Blackwell Publishing Ltd Cell Proliferation, 46, 127–136
Nuclear texture and gelatinase expression 135
41 Nielsen B, Albregtsen F, Danielsen HE (2008) Statistical nucleartexture analysis in cancer research: a review of methods and appli-cations. Crit. Rev. Oncog. 14, 89–164.
42 Dunn JM, Hveem T, Pretorius M, Oukrif D, Nielsen B, Albregtsen Fet al. (2011) Comparison of nuclear texture analysis and imagecytometric DNA analysis for the assessment of dysplasia in Bar-rett’s oesophagus. Br. J. Cancer 105, 1218–1223.
43 Ferro DP, Falconi MA, Adam RL, Ortega MM, Lima CP, DeSouza CA et al. (2011) Fractal characteristics of May-Gr€unwald-Giemsa stained chromatin are independent prognostic factors forsurvival in multiple myeloma. PLoS ONE 6, e20706.
44 Bedin V, Adam RL, De S�a BC, Landman G, Metze K (2010) Frac-tal dimension of chromatin is an independent prognostic factor forsurvival in melanoma. BMC Cancer 10, 260.
45 Huisman A, Ploeger LS, Dullens HFJ, Poulin N, Grizzle WE, VanDiest PJ (2005) Development of 3D chromatin texture analysisusing confocal laser scanning microscopy. Cell. Oncol. 27, 335–345.
46 Wax A, Chalut KJ (2011) Nuclear morphology measurements withangle-resolved low coherence interferometry for application to cellbiology and early cancer detection. Anal. Cell Pathol. (Amst) 34,207–222.
47 Nandakumar V, Kelbauskas L, Johnson R, Meldrum D (2011)Quantitative characterization of preneoplastic progression using sin-gle-cell computed tomography and three-dimensional karyometry.Cytometry A 79, 25–34.
48 Colomb E, Dussert C, Martin PM (1991) Nuclear texture parame-ters as discriminant factors in cell cycle and drug sensitivity stud-ies. Cytometry 12, 15–25.
49 Poplineau M, Trussardi-R�egnier A, Happillon T, Dufer J, ManfaitM, Bernard P et al. (2011) Raman microspectroscopy detects epi-genetic modifications in living Jurkat leukemic cells. Epigenomics3, 785–794.
50 Fudenberg G, Getz G, Meyerson M, Mirny LA (2011) High orderchromatin architecture shapes the landscape of chromosomal altera-tions in cancer. Nat. Biotechnol. 29, 1109–1113.
51 Haaf T, Schmid M (2000) Experimental condensation inhibition inconstitutive and facultative heterochromatin of mammalian chromo-somes. Cytogenet. Cell Genet. 91, 113–123.
52 Kerr E, Kiyuna T, Boyle S, Saito A, Thomas JSJ, Bickmore WA(2010) Changes in chromatin structure during processing of wax-embedded tissue sections. Chromosome Res. 18, 677–688.
53 Berthe JV, Remmelink M, Werry J, Salmon I, Kiss R, Decaes-tecker C (2001) The contribution of image cytometry to the charac-terization of clinical subgroups of lipomas. Int. J. Oncol. 18, 1315–1321.
54 Pauwels O, Kiss R (1994) Computerized morphonuclear analysesof Feulgen-stained nuclei from 11 chemosensitive and from 11chemoresistant neoplastic cell lines. Anal. Cell. Pathol. 7, 235–250.
55 Kotelnikov VM, Litinskaya LL (1981) Comparative studies ofFeulgen hydrolysis for DNA. I. Influence of different fixatives andpolyethylene glycols. Histochemistry 71, 145–153.
56 Gaub J (1976) Feulgen-Naphthol Yellow S cytophotometry of livercells. The effect of formaldehyde induced shrinkage on nuclearNaphthol Yellow S binding. Histochemistry 49, 293–301.
57 Patties I, Jahns J, Hildebrandt G, Kortmann R-D, Glasow A (2009)Additive effects of 5-aza-2′-deoxycytidine and irradiation on clono-genic survival of human medulloblastoma cell lines. Strahlenther.Onkol. 185, 331–338.
58 Haaf T (1995) The effects of 5-azacytidine and 5-azadeoxycytidineon chromosome structure and function: implications for methyla-tion-associated cellular processes. Pharmacol. Ther. 65, 19–46.
59 De Mello MR, Albuquerque DM, Pereira-Cunha FG, Albanez KB,Pagnano KB, Costa FF et al. (2012) Molecular characteristics andchromatin texture features in acute promyelocytic leukemia. Diagn.Pathol. 7, 75.
60 Kalac M, Scotto L, Marchi E, Amengual J, Seshan VE, Bhagat Get al. (2011) HDAC inhibitors and decitabine are highly synergisticand associated with unique gene-expression and epigenetic profilesin models of DLBCL. Blood 118, 5506–5516.
61 Watson JA, McKenna DJ, Maxwell P, Diamond J, Arthur K,McKelvey-Martin VJ et al. (2010) Hyperacetylation in prostatecancer induces cell cycle aberrations, chromatin reorganization andaltered gene expression profiles. J. Cell Mol. Med. 14, 1668–1682.
62 Hannen EJ, Van der Laak JA, Manni JJ, Pahlplatz MM, FreihoferHP, Slootweg PJ et al. (1998) An image analysis study on nuclearmorphology in metastasized and non-metastasized squamous cellcarcinomas of the tongue. J. Pathol. 185, 175–183.
63 Chik F, Szyf M (2011) Effects of specific DNMT gene depletionon cancer cell transformation and breast cancer cell invasion;toward selective DNMT inhibitors. Carcinogenesis 32, 224–232.
64 Sato N, Maehara N, Su GH, Goggins M (2003) Effects of 5-aza-2′-deoxycytidine on matrix metalloproteinase expression and pan-creatic cancer cell invasiveness. J. Natl. Cancer Inst. 95, 327–330.
65 Chicoine E, Est�eve P-O, Robledo O, Van Themsche C, Potworow-ski EF, St-Pierre Y (2002) Evidence for the role of promoter meth-ylation in the regulation of MMP-9 gene expression. Biochem.Biophys. Res. Commun. 297, 765–772.
66 Couillard J, Demers M, Lavoie G, St-Pierre Y (2006) The role ofDNA hypomethylation in the control of stromelysin gene expres-sion. Biochem. Biophys. Res. Commun. 342, 1233–1239.
67 Hagemann S, Heil O, Lyko F, Brueckner B (2011) Azacytidineand decitabine induce gene-specific and non-random DNA deme-thylation in human cancer cell lines. PLoS ONE 6, e17388.
68 Ailenberg M, Silverman M (2003) Differential effects of trichosta-tin A on gelatinase A expression in 3T3 fibroblasts and HT-1080fibrosarcoma cells: implications for use of TSA in cancer therapy.Biochem. Biophys. Res. Commun. 302, 181–185.
69 Lee KH, Choi EY, Kim MK, Kim KO, Jang BI, Kim SW et al.(2010) Inhibition of histone deacetylase activity down-regulatesurokinase plasminogen activator and matrix metalloproteinase-9expression in gastric cancer. Mol. Cell. Biochem. 343, 163–171.
70 Mitmaker EJ, Griff NJ, Grogan RH, Sarkar R, Kebebew E, DuhQY et al. (2011) Modulation of matrix metalloproteinase activityin human thyroid cancer cell lines using demethylating agents andhistone deacetylase inhibitors. Surgery 149, 504–511.
71 Estella C, Herrer I, Atkinson SP, Qui~nonero A, Martinez S, PellicerA (2012) Inhibition of histone deacetylase activity in human endo-metrial stromal cells promotes extracellular matrix remodelling andlimits embryo invasion. PLoS ONE 7, e30508.
72 Liu HB, Voso MT, Gumiero D, Duong J, McKendrick JJ, DearAE (2009) The anti-leukemic effect of a novel histone deacetylaseinhibitor MCT-1 and 5-aza-cytidine involves augmentation ofNur77 and inhibition of MMP-9 expression. Int. J. Oncol. 34, 573–579.
73 Citri A, Pang ZP, S€udhof TC, Wernig M, Malenka RC (2012)Comprehensive qPCR profiling of gene expression in single neuro-nal cells. Nat. Protoc. 7, 118–127.
© 2013 Blackwell Publishing Ltd Cell Proliferation, 46, 127–136
136 M. Poplineau et al.