enzymatic conversion of cotton textiles - brage nmbu
TRANSCRIPT

Master’s Thesis 2018 60 ECTS
Facutly of Chemistry, Biotechnology and Food Science
Gustav Vaaje-Kolstad
Enzymatic Conversion of
Cotton Textiles
Anna Austad
Master’s degree in Chemistry
KBM


I
Acknowledgements
The present work was carried out at the Department of Chemistry, Biotechnology and Food Science at
the Norwegian University of Life Sciences with Dr. Gustav Vaaje-Kolstad, Dr. Lasse Fredriksen and
John-Kristian Jameson as my supervisors.
I would like to express my deep gratitude to Dr Gustav Vaaje-Kolstad for accepting the concept of my
master’s thesis and helping to evolve it into a complete study. I am also deeply thankful to dr. Vincent
Eijsink for giving me this opportunity. Dr. Lasse Fredriksen has been supporting me more than
anyone. By posing and answering my questions frequently, a true researcher’s guidance, which I
highly appreciate. My third supervisor, John-Kristian Jameson has shared his valuable knowledge with
me, which has been particularly helpful through difficult days in the laboratory. My gratitude must
also be expressed for experiencing the helpfulness and the impressive expertise on the field from Dr.
Piotr Chylenski.
My thankfulness also goes to the whole PEP-group for help, support and for the good time I have had
throughout the year.
Ås, May 15th 2018

II
Abstract
Cotton textiles are mass-produced worldwide, but little is done to recirculate this material that is rich in
cellulose. Indeed, cellulosic textiles represent a potential resource for the production of glucose, that
further can be converted into chemicals, biofuels, materials, food and food and feed purposes. In this
study, investigation of saccharification of denim fabric cellulose pretreated by ball milling showed that
reduction in particle size significantly increased the digestibility of the substrate with two commercially
available enzyme cocktails, Celluclast® and Cellic® CTec2, the latter containing lytic polysaccharide
monooxygenases (LPMOs). Samples of ball milled denim fabric with substrate concentrations of 20 %
(w/v dry matter content) resulted in 78 % of the cotton textile into glucose after 96 hours incubation
with 4 mg Cellic® CTec2 per g glucan. At 5 % substrate concentration, the respective conversion yields
for ball milled white (undyed) and blue (indigo dyed) denim were over 90 % after 24 hours. Activity
assays demonstrated that the fungal LPMO TaLPMO9A produced several oxidized oligosaccharides
from both denim fabrics studied when pretreated by ball milling. The applied pretreatment in this study
seemed to increase the availability for LPMOs. When ascorbic acid was added as an external electron
donor to reactions with Cellic® CTec2, no enhancement of cotton textiles hydrolysis was observed. By
performing assays with and without ascorbic acid and by comparison with Celluclast®, the LPMO
content of Cellic® CTec2 was assessed to not be of significant importance for the efficient degradation
of ball milled cotton textiles. In conclusion, the present work shows that cotton textiles can be efficiently
converted to glucose by simple mechanical pretreatment followed by enzymatic hydrolysis using
conditions applicable to commonly industrial processes.
Further research is needed to investigate the efficiency of the method in a biorefinery scale and to assess
the financial feasibility of the method developed in this master’s thesis.

III
Sammendrag
Bomullstekstiler er masseprodusert i hele verden, men lite gjøres for å resirkulere dette cellulose-rike
materialet. Cellulosebaserte tekstiler representerer en potensiell ressurs for produksjon av glukose, som
videre kan konverteres til kjemikalier, biodrivstoff, materialer samt mat- og fôr-relaterte produkter. I
denne studien viste undersøkelser av hydrolyse av cellulose fra dongeri-tekstil forbehandlet med
ballmølling at reduksjon av partikkelstørrelse i betydelig grad økte tilgjengeligheten av substratet for to
kommersielt tilgjengelige varianter enzym-cocktail, Celluclast® and Cellic® CTec2, hvorav sistnevnte
inneholder lytisk polysakkarid-monooksygenaser (LPMOer). Prøver av ballmøllet dongeri-tekstil med
substrat-konsentrasjon 20 % (vekt/volum tørrstoff) resulterte i at 78 % av bomullstekstilet ble konvertert
til glukose etter 96 timer inkubering med 4 mg Cellic® CTec2 per gram glukan. Ved 5 %
substratkonsentrasjon, ble utbytte for ballmøllet hvit (ufarget) og blå (indgio-farget) dongeri over 90 %
etter 24 timer. Aktivitet-analyse viste at den fungale LPMOen, TaLPMO9A produserte flere oksiderte
oligosakkarider fra begge dongeri-tekstilene dersom de var ballmøllet først. Den benyttede
forbehandlingen øker tilsynelatende tilgjengeligheten av substratene for LPMOer. Ved tilsetning av
askorbinsyre som elektrondonor til reaksjoner med Cellic® CTec2, ble ikke økning av hydrolyse av
bomullstekstiler observert. Ved reaksjoner med og uten askorbinsyre, samt sammenligning med
Celluclast®, ble LPMO-innholdet i Cellic® CTec2 vurdert til å ikke være av signifikant betydning for
effektiv nedbrytning av ballmøllet bomullstekstiler. Arbeidet som her blir presentert viser at
bomullstekstiler effektivt kan konverteres til glukose ved enkel mekanisk forbehandling etterfulgt av
enzymatisk hydrolyse under betingelser som er kompatible med vanlige industrielle prosesser.
Videre forskning er nødvendig for å undersøke effektiviteten av metoden på bioraffineri-skala samt
vurdere finansiell gjennomførbarhet av metoden som ble utviklet i denne masteroppgaven

IV
Abbreviations
DP Degree of polymerisation
BBD Ballmilled BD
BD Blue cotton from denim fabric
BG β-glucosidase
BWD Ballmilled WD
CBH Cellobiohydrolase
CBM Carbohydrate binding module
DF Dilution factor
DM Dry matter content
DPA Days post-anthesis
EG Endoglucanase
GH Glycoside hydrolase
Glc4gem(GlcDP-1) Oligosaccharide with a geminal diol functional group at C-4
Glc4K(GlcDP-1) Oligosaccharide with a ketoaldose functional groups at C-4
(GlcDP-1)Glc1A Oligosaccharide with an aldonic acid functional group at C-1
HPAEC High-performance anion exchange chromatography
HPLC High-performance liquid chromatography
hrs Hours
IEC Ion exclusion chromatography
IEX Ioon exchange chromatography
K Partition coefficient
LPMO Lytic polysaccharide monooxygenase
MALDI-TOF Matrix assisted laser desorption ionization - time of flight
NMMO N-methyl morpholine oxide
PAD Pulsed amperometric detection
PASC Phosphoric acid swollen cellulose
PES Polyethersulfone
SRS Sugar recovery standard
t time
tR Retention time
VR Retention volume
w/v Weight/volume
w/w Weight/weight
WD White cotton from denim fabric

V
Contents
Acknowledgements .................................................................................................................................. I
Abstract ................................................................................................................................................... II
Sammendrag ........................................................................................................................................... III
Abbreviations ......................................................................................................................................... IV
Contents ................................................................................................................................................... V
1. Introduction ..................................................................................................................................... 1
1.1. Biomass as an energy source ....................................................................................................... 1
1.2. Cotton .......................................................................................................................................... 1
1.2.1. Cotton fibres ............................................................................................................................ 2
1.2.2. Structure and properties of cellulose ....................................................................................... 3
1.3. Cotton textiles and denim ............................................................................................................ 5
1.3.1. Cleaning, combing and spinning ............................................................................................. 5
1.3.2. Scouring................................................................................................................................... 6
1.3.3. Mercerization ........................................................................................................................... 6
1.3.4. Dyeing and weaving ................................................................................................................ 7
1.4. Saccharification of cotton ............................................................................................................ 8
1.4.1. Cleavage of o-glycosidic bonds ............................................................................................... 8
1.4.2. Cellulose degrading enzymes .................................................................................................. 9
1.4.3. Pretreatment ........................................................................................................................... 13
1.4.3.1. Comminution ..................................................................................................................... 15
1.5. Substrate related factors that might impact the enzymatic conversion of cotton textiles .......... 16
1.5.1. Increased dry matter .............................................................................................................. 16
1.5.2. Indigo dyed textiles ............................................................................................................... 16
1.6. Quantification with high-performance liquid chromatography (HPLC) ................................... 17
1.7. Aim of study .............................................................................................................................. 17
2. Materials ........................................................................................................................................ 18
2.1. Chemicals .................................................................................................................................. 18
2.2. Substrates and enzymes ............................................................................................................. 18
2.3. Laboratory equipment, apparatus and materials ........................................................................ 19
3. Methods ......................................................................................................................................... 21
3.1. Buffers and dilutions ................................................................................................................. 21
3.2. Compositional analysis .............................................................................................................. 24
3.2.1. Dry matter content ................................................................................................................. 25
3.2.2. Quantification of glucan ........................................................................................................ 25

VI
3.3. Ball milling of denim substrates ................................................................................................ 26
3.4. Particle size distribution measurement ...................................................................................... 27
3.5. Bradford protein quantification ................................................................................................. 28
3.6. Enzymatic conversion of cotton textile to glucose .................................................................... 28
3.6.1. Experiments with Cellic® CTec2.......................................................................................... 29
3.6.1.1. Loading analysis ................................................................................................................ 29
3.6.1.2. Time course analysis with cotton substrates and Avicel ................................................... 30
3.6.1.3. Time course analysis at increased dry matter content ....................................................... 30
3.6.2. Loading analysis and time course analysis with Celluclast® ................................................ 31
3.6.3. Determining the enzymatic conversion yield by HPLC (IEC) .............................................. 32
3.7. Assays with LPMOs as the sole enzyme activity ...................................................................... 35
3.7.1. Reactions ............................................................................................................................... 35
3.7.2. Identification of oxidized products by mass spectrometry .................................................... 36
3.7.3. High performance anion exchange chromatography (HPAEC) ............................................ 37
4. Results ........................................................................................................................................... 40
4.1. Composition of substrates ......................................................................................................... 40
4.2. Particle size after ball milling .................................................................................................... 41
4.3. Enzyme loading experiments .................................................................................................... 42
4.4. Time course analysis with Celluclast® ..................................................................................... 44
4.5. Time course analysis with Cellic®CTec2 ................................................................................. 46
4.5.1. Comparing cotton from white denim before and after ball milling ....................................... 46
4.5.2. Time course analysis with variable dry matter concentrations .............................................. 47
4.5.3. Comparison of conversion with and without ascorbic acid ................................................... 48
4.5.4. Comparison of degradation of cotton from undyed and indigo dyed denim ......................... 49
4.6. TaLPMO9A reactions ............................................................................................................... 50
4.6.1. Detection of oxidized oligosaccharides ................................................................................. 50
4.6.2. Comparing quantities of oxidized dimer in substrates .......................................................... 55
5. Discussion ..................................................................................................................................... 56
5.1. Substrate composition ............................................................................................................... 56
5.2. Conversion of cotton textiles by commercial cocktails ............................................................. 58
5.2.1. Enzyme loading ..................................................................................................................... 58
5.2.2. Effect of pretreatment ............................................................................................................ 59
5.2.3. Effect of increased dry matter in reactions ............................................................................ 61
5.2.4. Comparison of blue and white denim fabric ......................................................................... 63
5.3. Effect of lytic polysaccharide monooxygenases on cotton substrates ....................................... 63
5.3.1. Effect of ascorbic acid in Cellic® CTec2 reactions .............................................................. 65

VII
5.4. Comparison of enzyme cocktails............................................................................................... 65
5.5. Feasibility and further research ................................................................................................. 66
6. Conclusion ..................................................................................................................................... 68
7. References ..................................................................................................................................... 70
Appendix ............................................................................................................................................... 75

1
1. Introduction
1.1. Biomass as an energy source
Cellulosic biomass is a potential resource for production of glucose that further can be used to produce
energy, chemicals and materials. As an important part of replacing fossil fuels with renewable
alternatives, there is a demand for renewable sources than can be processed into biofuels and chemicals,
and various sources of biomass with high amounts of cellulose have therefore been in focus for finding
methods of efficient sugar production. Biofuel production is commonly classified according to the
applied resource used. Biomass with high content of carbohydrates that demands none or little
pretreatment before the fermentation into ethanol define the first-generation biofuels. Most of the crops
that fit into this category are edible sugar- or starch-based plants. The second-generation biofuels are
produced from by-products and residues from agricultural and material industry and municipal waste.
Conversion of this type of biomass to sugars is usually performed in several steps, where pretreatment
increases the availability of the polymers of interest before enzymatic hydrolysis reactions degrade the
polymers into fermentable sugars.
The chemical composition of the relevant substrates varies depending on the source. Cellulose is the
most abundant of all organic polymers (Klemm et al. 2005). In most cases the main component of
biomass is a network of cellulose fibres in combination with hemicellulose and lignin. In order to
increase the availability and digestibility of cellulose from a biomass source, there has been major focus
on pretreatment of the material and on optimizing the enzymatic degradation. For various substrates,
methods are adjusted differently for achieving a high conversion. By using biomass for bioenergy and
biochemical production, biorefineries could ideally contribute to reducing fossil CO2 emissions,
securing the energy supply and consuming as small amounts of water, agricultural area and other
resources as possible (Cherubini 2010).
1.2. Cotton
Cotton textiles are mass-produced and highly consumed worldwide. In 2017, the global production of
cotton reached 29,3 million tonnes according to the National Cotton Council of America. Reports from
the US and Norway indicate that 64,5 % and 80 % of used textiles end up in landfills in the two countries,
respectively (EPA 2016; Urdahl 2011). Cotton textiles discarded from homes and retailers are in many
cases reused or reprocessed, usually by reselling or recycling into carpets, wipes, insulation and
upholstery filling for furniture. Some clothing companies substitute virgin cotton fibres in the spinning
or the weaving process of cotton textile manufacturing. These recycling methods consequently reduce
the fibre quality, being the strength and length of the fibres, and is not majorly in use. Alternatively, or

2
at a later point of time, the textiles are disposed to landfills. Biomass in landfills, involving cellulosic
textiles, contribute to the growth of different types of microorganisms that hydrolyse the biomass,
convert the products further and perform methanogenesis. The final products are described unified as
landfill gas and contains approximately 50 % methane and 45 % carbon dioxide (Themelis & Ulloa
2007). Several methods are applied for methane capture in landfills that allow methanogenesis, in order
to reduce the emission of this greenhouse gas and to utilize the potential of methane (e.g. for burning to
yield energy) rather than allowing the gas to be released in the atmosphere. Despite the efforts, reports
show low capture capacity in most landfills (Themelis & Ulloa 2007; Timoney 2010). Another solution
to the greenhouse gas emission issue is to avoid biomass deposit in landfills, applied by Norway
(Forurensningsloven 1981) among other countries, where incineration currently is the main alternative
(Schmidt 2016). Cotton production requires significant amounts of energy, water, chemicals and
agricultural area. Reuse of the textiles or recycling of the fibres, further described as recycling, is
assessed by several investigators to be ecologically and economically beneficial, while incineration of
cotton recovers only a small portion of the energy originally required for the production (Schmidt 2016).
Therefore, new ways of recycling cotton waste as a resource are needed.
1.2.1. Cotton fibres
The plant species that provide cotton belong to the
genus Gossypium, and the species G. hirsutum
represents the majority of cotton production
(Wakelyn et al. 2006). Cotton grows in several cell
wall layers that have different function and
chemical composition, shown in the schematic
illustration in Figure 1.2.1. The cuticle is the outer,
protective layer, containing waxes, pectins,
proteins, ions and non-cellulosic polysaccharides
(Gordon & Hsieh 2006). The earliest stage of
cellulose synthesis in cotton occurs in the primary
wall development, 13-17 days after blooming
(DPA) for G. hirsutum. The primary wall
synthesises nearly 20 % cellulose (Lee et al. 2015),
along with pectins, proteins, ions and non-cellulosic
polymers. The winding layer (18-22 DPA) is an
intermediate layer between the primary and secondary wall and contains approximately 20 %,
and at the final stage of the secondary wall synthesis (45 DPA), over 90 % of the dry weight is cellulose
(Haigler et al. 2012; Lee et al. 2015). At this stage the boll of the plant opens naturally (Figure 1.2) and
Figure 1.2.1. Cotton morphology. Cotton fibres
are growing as several cell wall layers
elongating around each seed. Cellulose content
is low during the early growth stage represented
by the primary wall and the winding layer and
increases rapidly when the secondary wall
layers develop and dries.

3
dries quickly to a water content of 3-5 % (Lee et
al. 2015), ready for dispersing the cotton plant
seeds. Botanically, cotton fibres are extensions of
the cotton seed epidermis (Haigler et al. 2012),
developed for secretion of metabolic compounds,
exchange of water and carbon dioxide with the
environment and protection (Beck 2010). The
fibres are harvested as open bolls, and several
processing steps are required in order to remove
seeds and cuticle. This process is described in
detail in section 1.3.
1.2.2. Structure and properties of cellulose
The biomass that remains in the fibres after processing is called lint and represents the fibrous material
that is used for textile production. Lint mainly contains the long cellulose fibres from the secondary wall
(Gordon & Hsieh 2006). The following sections will give an overview of the structure of cotton by
describing the current knowledge on the structure of cellulose, the strands’ superstructure in elementary
fibrils and the packing of the elementary fibrils into microfibrils.
Cellulose is composed of the hexose D-glucopyranose (anhydrous glucose) covalently linked by β-1,4-
glycosidic bonds. A glycosidic bond has an estimated half-life of nearly 5 million years when
uncatalyzed, given 25°C and pH=7-14 (Wolfenden et al. 1998). The numbering of the glucose carbon
atoms is assigned according to the IUPAC system, counting from the carbon of the chain with a
functional group, the ether group. Because every other glucose unit is rotated by 180°, cellobiose is the
repeating unit in cellulose, shown in Figure 1.2.2. On the C1-end of cellulose polymers, the anomeric
Figure 1.2.2.1:. Cellulose structure. Molecular structure of cellulose showing intra- and inter-molecular
hydrogen bonds (blue). Cellobiose (green) is a dimer of β-D-glucopyranose and is the repeating unit in
cellulose. (Albersheim et al. 2010; Baptista 2013; Pinkert et al. 2009)
Picture 1.2. Mature cotton boll. When the epidermal
fibres are fully developed, the white lint dries, and the
fibres protect the seed when naturally dispersed. Cotton
harvesting for textile productions occurs between drying
and seed dispersion.

4
hydroxyl constitutes a reducing end where closed keto-hexose and the open aldo-hexose are in
equilibrium. The other end of the polymer (C4) is non-reducing. As illustrated in Figure 1.2.2, hydrogen
bonds exist internally in the polymer chains, but also exist between chains, creating an intramolecular
linkage between individual cellulose strands.
When approximately 36 cellulose strands are
agglomerated, the resulting bundle is called
nanocellulose, or elementary fibrils, which are
further packed in microfibrils with a diameter of
5-50 nm and a length of several micrometres
(Sofla et al. 2016).
The network of hydrogen bonds is the structural
cause of crystallinity in cellulose fibres. Cellulose
crystallinity is a parameter for the orientation of the
strands, which determines the degree of order in the
packaging of strands in the fibres. Regions with
low ordered orientation of the strands are described as amorphous (Kljun et al. 2011). Crystalline
structures of native cellulose are classified as Iα and Iβ (allomorphs). Native cotton fibres are 88,0 - 96,5
% Iα -cellulose. (Gordon & Hsieh 2006) The coordination angles in Iα -cellulose (Figure 1.2.2.2A), result
in a shorter intra-chain hydrogen bond between the hydroxyl hydrogen on C2’ and the hydroxyl oxygen
on C6, relative to Iβ -cellulose, which is the dominant type in higher plants (Festucci-Buselli et al. 2007).
This results in denser packaging of the microfibrils. Furthermore, the allomorph Iα is less heat stable and
can be converted into Iβ by heating (J. Hardy & Sarko 1996). In cotton fibres, the degree of
polymerisation is 800 to 10 000 glucose units long (Klemm et al. 2005). The polymer length of the
cellulose strands in cotton textiles depends on the treatment of the fibres.
Furthermore, the cellulose crystal type (polymorph) can change by certain treatment methods. It is
known that native cellulose can undergo intermolecular hydrogen bond breakage causing changes the
crystal structure from type I into type II. The two processes that can cause this change are regeneration,
where the fibres are re-precipitated after solubilization in a solvent, and mercerization, where the fibres
are swelled by alkaline solutions (discussed further in section 1.3.3) (O'Sullivan 1997). Polymorph II is
known to be thermodynamically more stable than polymorph I because the strands are anti-parallel, i.e.
the reducing and non-reducing end point in alternate directions in the chain (Festucci-Buselli et al. 2007;
Kljun et al. 2011). The crystal structure is monoclinic as for type Iβ, while inter-chain hydrogen bonds
between hydroxy groups on C3 and C6 (Figure 1.2.2.1) are replaced by inter-chain hydrogen bonds
between the hydroxy groups on C2 and C6 in cellulose II (Festucci-Buselli et al. 2007). Amorphous
regions are generally not believed to occur in cellulose II (O'Sullivan 1997). The digestibility of
cellulose I and II by cellulases is introduced in section 1.4.3.
Figure 1.2.2.2: Schematic representation of
cellulose Iα (A) and Iβ (B). Native crystalline
cellulose (type I) has a triclinic (A) or
monoclinic (B) structure, resulting in
conformational differences (Koyama et al.
1997). Copyright (2006) The National Academy
of Sciences of the United States of America.

5
1.3. Cotton textiles and denim
The cotton textile industry requires certain standards regarding the lint fibre quality, and breeding of
cotton has improved the fibre strength and fibre length since the 1980’s (Smith & Cothren 1999). A
common and representative example of cotton fabrics is denim, for which a high quality of cotton fibres
is required. Since denim fabric represent the main substrate used in the present MSc project, a short
overview of the processing steps that have an impact on structure and composition of the cotton cellulose
will be described. A schematic flow chart illustrating the relevant processes is shown in Figure 1.3.
1.3.1. Cleaning, combing and spinning
Initially, the lint is cleaned and separated from the seeds in a process called ginning. The processes
involved are moisture adjustment, seed-fibre separation and removal of particulate impurities. The
remaining fibres are 95 % cellulose (Lewin & Pearce 1998). The next step is carding and combing,
which are techniques of physical combing of the fibres that ensures separation of the fibres, appropriate
fibre length and fibre orientation (Paul 2015). Further processing of the fibres into denim might vary
slightly, although the essential steps seem to be consistent among manufacturers. When the yarn is spun,
the twist, thickness, regularity and weight of the final thread is determined. There are several types of
Raw cotton
Ginning
→ fibres
Carding and combing
Winding and spinning
→ yarn
Weaving
→ fabric
Dyeing
NaOH, indigo,
reductant
Figure 1.3. Flow chart of denim processing steps that influence cellulosic composition, structure and
superstructure. The manufacturing of denim from raw cotton involves many steps, where details and order of
processes vary. This schematic flow chart’s purpose is to give an overview of processes cotton fibres
generally go through in denim production that cause compositional and/or structural changes.
Scouring
NaOH (4% at 90-100°C)
detergents, wetting agents
Mercerizing
NaOH, 4-16%

6
spinning methods used for denim manufacturing, and properties that might vary according to the
spinning are volume and absorption capacity of the resulting threads, among others. Denim threads are
winded, to finally yield a length between 97 to 180 cm (Clariant 2012) and spun to yarn. The final twist
in spun yarn influences the elasticity and the resistance of the yarn. When determining the twist of the
yarn, it is first divided into warp and weft, which have different roles in weaving of the fabric. Warp are
threads that establish the frame of the fabric during the weaving, and they need to be resistant because
of high tension during the process. Weft yarn are threads interlaced crosswise to the warp, filling the
space between the established frame of the warp. In denim fabric, yarn with high strength might be of
interest for some garments, while high elasticity is the priority for others. If most fibres of the yarn have
the same orientation, adsorption capacity decreases, as well as denser packing of the fibres (Clariant
2012).
1.3.2. Scouring
In denim production, scouring is carried out before bleaching and dyeing of the yarn (warp and weft).
For removal of waxes and other unwanted compounds from the yarn, the scouring process is traditionally
applied and still predominant, although recently developed enzymatic scouring methods exist. Alkaline
treatment containing approximately 1 M (4 % w/w) sodium hydroxide at 90-100°C result in
saponification that solubilize lipids from the cuticle and primary wall (Chakraborty & Ledwani 2017).
Also wetting agents and detergents are applied to solubilize and emulsify other impurities. The threads
are rinsed well, and in most cases bleached with hydrogen peroxide or sodium hypochlorite which
destroys natural colour compounds.
1.3.3. Mercerization
Mercerization is a process used for obtaining higher colour quality of dyed textiles and improving the
appearance of the fibres. An aqueous solution of sodium hydroxide is used to swell the cellulose fibres
at cold temperatures. The native crystal structure is first dissolved to amorphous cellulose by
intermediate derivation to cellulose xanthate without inter-chain hydrogen bonding, whereas upon the
removal of the swelling agent the cellulose adapts the structure of cellulose II (O'Sullivan 1997).
Information about the amount of fibres undergoing this crystallinity change is not available, yet it is
known to vary according to yarn differences. Different quality of the yarn makes it necessary to adjust
the alkalinity concentration, although the concentration should generally give a liquid density of 6-22°
Bè (Clariant 2012), which corresponds to 4 - 16 % (w/w) NaOH (Oxychem 2018). The yarn is in contact
with the alkali for 30 to 60 seconds (Clariant 2012). Afterwards, the threads go through thorough rinsing
for removing all alkali.

7
1.3.4. Dyeing and weaving
For dyed denim, the yarns are arranged in groups of rope-formation or flat sheets for dyeing. Either
thiourea dioxide, (NH)(NH2)CSO2H (s), or sodium hydrosulphite, NaSO2SO2Na(s), is applied as
reductant in the dye vat where the yarn rope or sheet are coloured. Dilute sodium hydroxide is present
in the vat in order to increase the pH of the vat enough to allow reduction to occur. After the fibres have
absorbed the dye, oxidation of the fabric is conducted in order to ensure permanent colour. This is
commonly done by allowing the fibres air access for a sufficient amount of time (Clariant 2012).
Sizing agents are utilised in the weaving of denim fabrics. The objectives are protecting the yarn from
friction, increasing resistance to traction, separate the warp from agglomerating, increase tensile strength
and prevent dust cluster formation. Chemicals applied as sizing agents are completely removed from the
fabric after the weaving process.
Figure 1.3.4.2. Denim fabric. Warp (blue) and weft (white) are yarn spun from cotton, pretreated
with and without dyeing, respectively, and woven to denim fabric (Clariant 2012).

8
1.4. Saccharification of cotton
1.4.1. Cleavage of o-glycosidic bonds
Several strategies can be used to degrade cellulose into
cello-oligomers and glucose. Cleavage of glyosidic
bonds by acid hydrolysis involves nucleophilic
substitution and the addition of H2O to the
glucopyranose units on the anomeric side of the
cleavage (Figure 1.4.1.1). Firstly, a water molecule is
protonated by the acid to form a hydronium ion (H+),
which protonates the oxygen in the glycosidic bond
(Lelekakis et al. 2014). The deprotonated hydronium
attacks the anomeric carbon in a nucleophilic
substitution, and the hydroxyl on the C4 created in the
first step is the leaving group (Bochkov et al. 2016).
This causes the cleavage of the C-O-bond and leaves
both products hydrated. The net consumption in the
reaction is one water molecule, while the hydronium
concentration remains unchanged. Temperature and pH
play major roles in the reaction kinetics. At high
temperatures and a sufficiently low pH, all glycosidic
bonds will be cleaved (Sluiter 2012).
Cellulose can also be degraded enzymatically through the action of cellulolytic enzymes such as
cellulases and LPMOs. Cellulases are astoundingly efficient catalysts, able to increase the rate of
glycosidic bond hydrolysis by a factor up to 1017 (Wolfenden et al. 1998). The chemistry of cellulases,
also referred to as glycoside hydrolases (GH), involves two main mechanisms (Figure 1.4.1.2). The
principle of the reaction is in any case the acid catalysis. When the reaction is catalysed by a cellulase,
the protonation of the oxygen is provided by an acidic residue. In one of the mechanisms, both the
protonation of the oxygen and nucleophilic attack on the anomeric carbon are initiated by acidic residues
from the cellulase. A substrate-enzyme intermediate is formed with the nucleophilic residue. A water
molecule is activated by the deprotonated catalytic acid residue and attacks the anomeric carbon which
causes the cleavage of the substrate-enzyme bond. In the other mechanism, two catalytic residues act as
acid and base, respectively. The base residue activates a water molecule which does the nucleophilic
attack on the anomeric carbon, and the acid residue protonates the non-reducing end. The two
mechanisms give retention or inversion of the anomeric configuration, resulting in a remained equatorial
or an inverted axial hydroxyl group, respectively (Davies & Henrissat 1995; Payne et al. 2015).
Figure 1.4.1.1: The mechanism of acid hydrolysis
of cellulose. Degradation of cellulose by acid is
initiated by protonation of the oxygen in the
glycosidic bond. The formation of a protonated
intermediate is followed by a nucleophilic attack by
H2O on the anomeric carbon. Cellulase hydrolysis
proceeds through the same reaction principles.

9
1.4.2. Cellulose degrading enzymes
Cellulose is estimated to be the most abundant polymer on Earth (Klemm et al. 2005) and is known to
be a feedstock for a variety of microorganisms. Cellulolytic microorganisms exist within the domains
of fungi, bacteria and protozoa found in ecosystems such as the sea, fresh water sediments, soil, compost
as well as the digestive tracts of ruminants and termites (Cragg et al. 2015). For efficient cellulase
production, fungi are preferred, as they are more versatile and inherit better penetration ability, allthough
one fungus does not generally produce all the cellulases necessary for effective biomass hydrolysis.
(Srivastava et al. 2018)
One of the most important fungi for enzymes applied for cellulose degradation is Trichoderma reesei,
well known for secreting large amounts of cellulolytic enzymes (Ivanova et al. 2017). The capacity of
T. reseei (recently re-classified to Hypocrea jecorina) to degrade cellulose was firstly discovered by
the U.S. Army during the second world war, degrading cotton fabric of their troops’ tents. (Reese 1976).
With the wild strain called QM6a as a starting point, strains have been developed progressively by
modern genetic engineering.
Figure 1.4.1.2. The mechanism of Cellulases. Both mechanisms are initiated by deprotonation of an acidic
residue (top). In the inverting GH mechanism (A), a catalytic residues act as a base (bottom), which
activates a water molecule that does the nucleophilic attack on the anomeric carbon, before the acid
residue protonates the non-reducing end(Payne et al. 2015). The retaining GH mechanism (B) form a
substrate-enzyme intermediate with the nucleophilic residue (bottom). A water molecule is activated by
the deprotonated catalytic acid residue and attacks the anomeric carbon which causes the cleavage of the
substrate-enzyme bond. The figure is obtained from Payne et al. (2015).

10
For an efficient enzymatic degradation of cellulose, three classes of cellulases are commonly used.
Figure 1.4.2.1 shows an overview of synergistic cellulases acting on cellulosic biomass. Endo-1,4- β-
glucanases (EG) catalyse the hydrolysis of glycosidic bonds at random internal positions along the
cellulose chain. Amorphous parts of the fibres might be cleaved into shorter polymers and later be
further depolymerized into cellobiose and glucose. For cleaving off the terminal glucopyranose units,
the relevant enzymes are exo-1,4- β-glucanases, which also are known as cellobiohydrolases (CBH)
since their dominant product is cellobiose. Figure 1.4.2.1 illustrates CBHs acting on non-reducing
(CBH2) and reducing ends (CBH1). The reaction catalysed by EGs and CBHs is show in Equation
1.4.2.1
The main product from endo- and exo-cleavage is cellobiose, released from reducing and non-reducing
ends of the polymers. A glucose-producing family of enzymes, namely the β-glucosidases (BG),
catalyse the hydrolysis of cellobiose to glucose, as well as cleaving off glucopyranose units at the non-
reducing ends of oligosaccharides. The reaction catalysed by BGs is shown in Equation 1.4.2.2 and
Figure 1.4.2.1 illustrates how BGs cleave cellobiose provided by other enzymes functioning as synergy
partners.
Equation 1.4.2.1.
(𝐶5𝐻10𝑂5)𝑛 + 𝐻2𝑂 → (𝐶5𝐻10𝑂5)𝑛−2 + 𝐶12𝐻22𝑂11
Equation 1.4.2.2.
𝐶12𝐻22𝑂11 + 𝐻2𝑂 → 2𝐶6𝐻12𝑂6
Most known cellulases consist of one catalytic domain and one carbohydrate-binding module (CBM),
although there are examples on efficient cellulases without the CBM (Várnai et al. 2014). The CBM is
non-catalytic and binds either amorphous or crystalline cellulose, illustrated in Figure 1.4.2.1 as
domains on CBH.

11
A recent addition to the group of enzymes depolymerizing cellulose is the family known as the lytic
polysaccharide monooxygenases, LPMOs (Phillips et al. 2011; Quinlan et al. 2011; Vaaje-Kolstad et al.
2010). Certain LPMOs were previously classified in the family of glycoside hydrolases and are
illustrated in Figure 1.4.2.1 as GH61. The redox-active enzymes catalyse oxidative cleavage of
glycosidic bonds and are believed to primarily act on crystalline areas of the substrate (Forsberg et al.
2018; Villares et al. 2017). While cellulases have been commercially available for over 30 years, and
are utilized in the industry for producing paper, textiles, food and detergents among other, intense
research for new utilisation is still ongoing within many sectors. Optimising methods for degradation of
biomass from different sources is subject to investigation by commercial actors as well as stakeholders
working for more ecological friendly energy production (Kuhad et al. 2011).
Since the discovery of LPMOs in 2010 (Vaaje-Kolstad et al. 2010), new knowledge about the enzyme
class and about individual LPMOs continuously lead to increased understanding of mechanism and
Figure 1.4.2.1. An overview of the classic model of enzymatic cellulose degradation. Conversion of a
crystalline microfibril of cellulose into glucose by glycosidic hydrolases and LPMOs (here entitled
according to their previous family, GH61) synergistically degrading at the location of their respective
specificity. Figure obtained from Horn et al. (2012).

12
effect in their appliance. Their flat substrate-binding surface allows them to interact with the likewise
flat surface of the crystalline polysaccharides where they use an oxidative mechanism (the net reaction
is showed in Figure 1.4.2.2) dependent on copper ions, an electron donor and dissolved dioxygen as a
co-substrate (Horn et al. 2012). When used in laboratory experiments the electron supply for LPMO is
commonly provided by addition of ascorbic acid to LPMO reactions, which donates electrons from the
hydroxyl groups on the 3,4-dihydroxyfuranone in order to reduce the copper ion and thereby allow
activation of dioxygen. Intriguingly, recent studies suggest that H2O2 is the preferred co-substrate of
LPMOs (Bissaro et al. 2017). Furthermore, details on the radical-involving mechanisms and
intermediates formed by the catalyst are not fully understood, and several pathways are suggested
(Chylenski 2017).
While products from a cleavage catalysed by cellulases remain mono-, oligo- or poly-saccharides with
one hydroxyl or carbonyl at the anomeric C1 and a hydroxyl on C4, the products from oxidative cleavage
have other functional groups (Figure 1.4.2.3). If C1 is oxidized, lactones and aldonic acids are produced
and exist in an equilibrium. Likewise, oxidation at C4 gives keto aldoses and geminal diols in an
equilibrium. For the C1-oxidized products, the equilibrium if shifted to the right at a neutral pH, while
the C4-oxidized products will both be present in considerable amounts. (Chylenski et al. 2017b; Villares
et al. 2017). Lactones are not discussed further in this study.
Figure 1.4.2.2: Scheme for the enzymatic reaction catalysed by LPMOs. The figure shows the net reaction of C1-
oxidation of cellulose and reduction of molecular oxygen cleaves a glycosidic bond. Molecular oxygen and water
provides an oxygen each to the anomeric carbon. Several detailed mechanism pathways have been suggested,
differencing in enzyme-substrate-intermediates, radical formation and preferred co-substrate. Mechanism obtained
from Horn et al. 2012.
13
The recalcitrance and crystallinity of most cellulose-containing biomass is a major challenge for
degradation. LPMO activity has been shown to contribute positively in digestion reactions where high
degree of crystallinity causes low digestion by cellulases (Chylenski et al. 2017b; Forsberg et al. 2011).
Several commercial enzyme cocktails produced for conversion of polymeric biomass into
monosaccharides therefore contain one or several LPMOs. It has been estimated that Cellic® CTec2, a
commercially available cellulolytic enzyme cocktail (Novozymes Inc.) contains approximately 15 %
LPMOs (Müller et al. 2015). Costs is another challenge commonly agreed to be an important threshold
for applying biomass degradation in production of energy and chemicals. (Obeng et al. 2017)
1.4.3. Pretreatment
The use of various pretreatment methods has been shown to significantly enhance the enzymatic
degradation of cellulose. Lignocellulosic biomass is plant biomass rich in cellulose, non-cellulosic
β(1,4)-linked polysaccharides of D-xylose, D-mannose and D-glucose (hemicellulose) and lignin.
Lignin are heterogeneous polymers of cross-linked phenyl-propane, with a three-dimensional polymer
structure different from the cross-linked fibre structure of hemicellulose form and the sheet-like fibre
structure cellulose form. Commonly used pretreatment methods for lignocellulose include dilute acid,
ammonia fibre explosion (Mathew et al. 2016), steam explosion (Rana et al. 2012) and sulphite pulping
(Chylenski 2017). The most important role of pretreatment of lignocellulose in the process of enzymatic
depolymerization is reducing recalcitrance of the biomass by removing the barriers of hemicellulose and
lignin in addition to reducing the crystallinity of the cellulose.
The degree of crystallinity is of major importance for the ability of cellulases to initiate digestion of
cellulosic biomass. Biomass containing crystalline cellulose in absence of hemicellulose and lignin is
known to give an initial rate of the enzymatic hydrolysis closely associated with the crystallinity index.
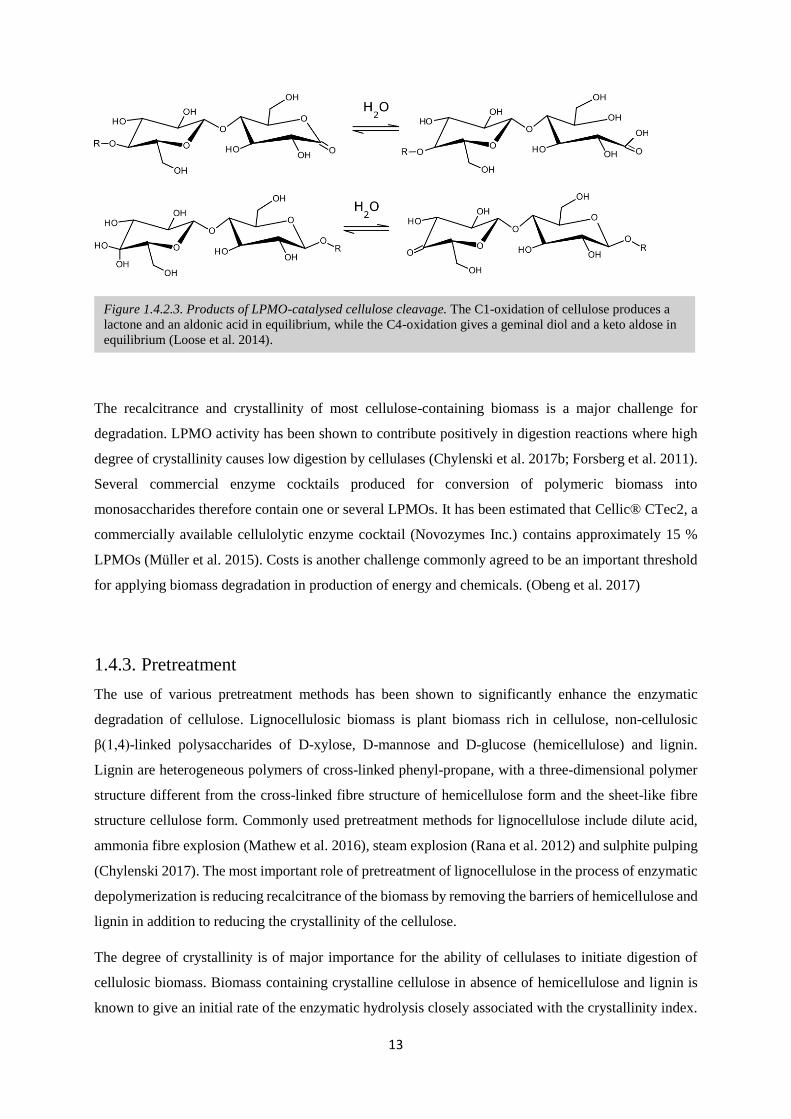
Figure 1.4.2.3. Products of LPMO-catalysed cellulose cleavage. The C1-oxidation of cellulose produces a
lactone and an aldonic acid in equilibrium, while the C4-oxidation gives a geminal diol and a keto aldose in
equilibrium (Loose et al. 2014).

14
The tight packing of cellulose strands in crystalline cellulose physically blocks the cellulase resulting in
availability only to the surface (Sun et al. 2016). Amorphous cellulose, however, is less densely packed,
increasing the access for cellulases. Research on enzymatic conversion of cotton textiles has mainly
relied upon chemical pretreatment for decreasing the crystallinity. Solvent systems that dissolve
crystalline cellulose into amorphous cellulose without derivatisation or degradation are N,N-
dimethylacetamide in lithium chloride (DMAc/LiCl), trifluoroacetic acid in methylene chloride (TFA
in DCM), calcium thiocyanate in water, N-methyl morpholine oxide (NMMO) in water and ammonium
thiocyanate (Lewin & Pearce 2007). While DMAc/LiCl and TFA/DCM are known to be toxic, NMMO
is not. Certain ionic liquids efficiently dissolve cellulose. Ionic liquids are organic salts with melting
points around room temperature, and some of them contain strong hydrogen-bond acceptors monovalent
anions. For extraction, absorption, degradation and synthesis they are regarded as environmental
friendly solvent because of low volatility compared to alternatively applied organic solvents. However,
potential contamination of soils, sediments, surface and ground water is a concern many researchers
currently investigate and that remains unclear (Amde et al. 2015).
The most industrially applied cellulose solvent is NMMO, which can disrupt the hydrogen bonds
between and within the cellulose polymers, by the high electron density from a strongly polar tertiary
amino oxide group (Kanga 2016). Cellulose fibres for production of lyocell, a textile of regenerated
cellulose extracted from wood, are spun from aqueous solutions of NMMO. The past decades, research
has revealed that also chemical recycling of cellulosic textiles can be done with the use of NMMO. From
dissolved pulp new threads are spun and textiles without decreased quality can be created (Negulescu
1998). The method of dissolving crystalline cellulose into amorphous cellulose has also been applied
for pre-treatment prior to saccharification.
The mercerization process used for denim production, changes the crystal structure in a different way
than the discussed solvents (for details, see section 1.2.2 and 1.3.3), and this change is reported to
enhance enzymatic digestion (Kljun et al. 2011; Peciulyte et al. 2015). Severe challenges of using NaOH
as pretreatment method, however, are the costs of recycling or neutralizing alkaline chemical waste and
the corrosion it causes on the equipment (Hasanzadeh et al. 2018).
An acid assessed to be non-hazardous as well as efficient for swelling cotton cellulose is phosphoric
acid. It has been demonstrated that enzymatic digestibility is enhanced by swelling the fibres in
concentrated phosphoric acid (Jeihanipour & Taherzadeh 2009) as well as fibre swelling in 83 % w/w
phosphoric acid (Zhang, J. et al. 2010). The swelling occurs by a two-step process, initiated by the acid
and the cellulose hydroxyl groups reaction by esterification, forming cellulose-phosphate. The following
step is a competitive interaction between hydrogen bonds between water and cellulose, and inter-chain
hydrogen bonds within cellulose. Acid catalysed hydrolysis of glycosidic bonds will occur at elevated
temperature, and as a pretreatment method the dissolution temperature is kept under 50°C (Zhang et al.

15
2009). The economic feasibility of using phosphoric acid depends on whether the acid is recovered and
reused.
1.4.3.1. Comminution
Published research on enzymatic
saccharification of cotton textiles with
mechanical pretreatment does not show
yields equal to those of chemical
pretreatment. At the other hand, the number
of attempts on this field is relatively limited.
Among mechanical pretreatment,
comminution is an important principle.
Comminution is a reduction of average
particle size in a solid material. Dry ball
milling, wet ball milling, vibratory ball
milling and compression milling are different
applied comminution techniques. Planetary
ball milling is a type of ball milling (wet and
dry), which is based on the principle of
superimposed rotational movements. Because the rotation of the grinding chamber has an opposite
direction relative to the rotation of the platform on which it stands (supporting disc), the speed of the
balls differs from the speed of the chamber, making the balls achieve high dynamic energy. This
provides colloidal grinding and high centrifugal forces resulting in high pulverization energy
(Aliofkhazraei 2015; Li 2016). Planetary ball milling is applied under wet and dry conditions, depending
on the substrate and the objective of the milling.
Ball milling is widely used for mechanical metal alloying and production of various nano-particles
(Hotta et al. 2007). Cellulose has attained attention as a potential nanocomposite material, for
applications in e.g. technology and filtration, and one way to produce cellulose fibres of nano level
particle size is ball milling. Ball milling of crystalline cellulose has been observed to produce nanofibrils
with simple operation and relatively low costs (Sofla et al. 2016; Zhang, L. Y. et al. 2010). Ball milling
has been applied with successful conversion yields as replacement for chemical pretreatment of
enzymatic degradation of crystalline chitin (Nakagawa et al. 2011) and conversion of cellulose from
steam-treated lignocellulose (Suckling et al. 2017)
The current use of chemicals contributes to biorefineries costs in degradation of lignocellulose. While
mechanical pretreatment is a potential replacement for chemical pretreatment in lignocellulose
Figure 1.4.3. Schematic illustration of grinding action in a
planetary ball mill. Grinding in a planetary ball mill occurs at
high dynamic energies due to the superimposed rotational
movements of the chamber and the supporting disc. Obtained
from (Zhang et al. 2008).

16
degradation, it is reviewed to be a too energy demanding technique that may be cost efficient only if
combined with other pretreatment methods (Barakat et al. 2013). However, cotton does not contain
lignin or significant amounts of hemicellulose, and the energy consumption per conversion yield might
be lower than for lignocellulose.
1.5. Substrate related factors that might impact the enzymatic conversion of
cotton textiles
1.5.1. Increased dry matter
Increasing the dry matter content in enzymatic hydrolysis is a bottleneck for biorefineries producing
ethanol from lignocellulosic biomass. The exact reasons for inhibition of enzymatic hydrolysis at high
substrate loadings depends mostly on the substrate. Lately, it was reported that the inhibition of glucose
and cellobiose appears to be the main cause for lignin- and hemicellulose-free substrates (Kristensen et
al. 2009). Mixing of the reactions might in some reactions be hindered from high dry matter content
(Georgieva et al. 2008), although it is thought to be a less important limiting factor than the inhibition
by reaction products (Jørgensen et al. 2007), especially cellobiose, inhibiting catalysation from CBH
and EG (Kristensen et al. 2009; Tolan, Jeffrey S. 2002). The rate of enzymatic conversion in viscous
solutions are known to be limited mainly by the mass transfer rate, i.e. the mobility and diffusion rate
of the enzymes in the reaction solution (Battista et al. 2018).
1.5.2. Indigo dyed textiles
Campos and co-workers have previously shown interactions
between the dye indigo and cellulase enzymes and
demonstrated affinity between the molecules (Campos et al.
2000). They found differences in affinity according to the
number of acidic residues in the cellulases, promoting
affinity to indigo. The indigo molecule has two secondary
amine groups, weakly alkaline. This affinity might influence
enzymatic digestion. Denim fabric production has variations
that might give differences in the effect of ball milling and
the digestibility of enzymes in saccharification. For instance, denim that is going to be coloured need to
have a sufficient adsorption capacity, enhanced by mercerization. This process is usually not applied on
white denim.
Figure 1.6. The structure of an indigo
molecule. The two secondary amine groups
make indigo a base that might interact with
acidic amino acids in a cellulase.

17
1.6. Quantification with high-performance liquid chromatography (HPLC)
The principle of chromatography is based on separation of analytes between an immobile (stationary)
and a mobile phase. The mobile phase in HPLC is liquid, while the stationary phase is in the majority
of appliances solid. The mixture of analytes is introduced into the mobile phase, which carries them
through the system at a given flow. As the mobile phase passes through the stationary phase, the analytes
partition between the two phases. Different interaction with the resin beds in the stationary phase result
in different migration rates through the system. The difference in this interaction is usually defined as
retention volume (VR) of an analyte, which directly correlate to the retention time (tR), i.e. the time of
analyte detection upon emerging from the stationary phase. The following equation describes how the
total volume of mobile phase (VR) depends on the dead space of the system the flow runs through, the
volume of mobile phase per time (flow) while the analyte is held immobile, the volume of the stationary
phase (VS) and the partition coefficient (K): 𝑉𝑅 = 𝑉𝑀 + 𝐾𝑉𝑆 (Miller 2005). The partition coefficient (K),
being the distribution of the analyte between stationary and mobile phase, is the parameter effectively
separating the analytes. In ion exclusion chromatography (IEC), K generally depends on the pKa of the
analytes (often applied for organic acid separation), although it cannot be considered as an isolated
principle in separation. Other principles considered to contribute to separation in IEC are: hydrophobic
adsorption on the resin network, the effect of functional group screening in the analysed sample, normal
phase retention, van der Waals, polar interactions of the sample compound with the support as well as
size exclusion (Głód 1997).
1.7. Aim of study
Efficient saccharification of cotton cellulose with low ecological footprints was the overall aim of this
study. A white denim fabric was used as the main substrate, and the enzymatic digestibility was
investigated before and after ball milling, at different enzyme loadings and applying different
commercial cellulase cocktails with and without LPMOs. LPMO activity was then investigated by two
approaches: assays with conversion by an LPMO-rich enzyme cocktail in presence and absence of
ascorbic acid, and reactions with LPMOs as the sole enzyme activity. Comparative experiments to assess
whether the digestibility of indigo dyed denim, a majorly produced cotton textile, differ from the undyed
textile were carried out. Finally, the optimised method was tried at increased dry matter concentrations.

18
2. Materials
2.1. Chemicals
Chemical Supplier
Acetic acid 99.8 % VWR
Ascorbic acid (C6H8O6) Sigma Aldrich
Cellobiose (C12H22O11) (Glc2) Megazyme
Cellohexaose (C36H62O31) (Glc6) Megazyme
Cellopentaose (C30H52O26) (Glc5) Megazyme
Cellotetraose (C24H42O21) (Glc4) Megazyme
Cellotriose (C18H32O16) (Glc3) Megazyme
Glucose (C6H12O6) (Glc) AnalaR NORMAPUR
Sodium acetate, anhydrous (CH3COONa) Sigma Aldrich
Sodium hydroxide (NaOH) solution, 50% FLUKA Honeywell
Sulfuric acid 95-98% FLUKA Honeywell
Tris Base, ULTROL® Grade (C4H11NO3) Sigma Aldrich
2.2. Substrates and enzymes
Substrate Abbreviation Supplier
Avicel® PH-101 Avicel Sigma Aldrich
Cotton from blue denim fabric, Soft washed
denim 10oz
BD Stoff og stil
Cotton from white used denim jeans WD Second hand shop
Phosphoric acid swollen cellulose PASC Produced from Avicel® PH-101
Table 2.1. Chemicals used throughout this study are presented along with the relevant supplier.
Table 2.2.1. Substrates used throughout this study are presented along with the relevant supplier.

19
Enzyme and enzyme cocktails Supplier
Cellic® CTec2 Novozymes, Denmark
Celluclast® Novozymes, Denmark
TaLPMO9A 80 µM Produced in the laboratory by Dr. Dejan Petrovic
2.3. Laboratory equipment, apparatus and materials
Apparatus, equipment and instruments Supplier
Autoclave 120°C CertoClav
Automated pipettes Thermo Scientific
Beaker VWR
Büchner flask Pyrex
Centrifuge Tubes Cellstar® 15 mL and 50 mL Greiner
Centrifuge Eppendorf
Crucibles, porcelain
Cuvettes Eppendorf
Desiccator Duran
Drying cabinet 106 °C Memmert
Eppendorf 2,0 mL Axygen Scientific
Filter crucibles, 15 mL ROBU-GLAS filters porosity 4 Pyrex
Filter plates, 0,45 µm Durapore® Thermo scientific
Filtropur membrane, 0.2 μm Polyethersulfone (PES) VWR
Filtropur membrane, 0.45 μm PES VWR
Filtropur syringe filtration, 0.45 μm PES Sarstedt
Funnel with 2 rubber conical gaskets
Freezer, -20°C Bosch
Glass stir rods
Heat block Grant
HPAEC system, TM ICS-3000 Dionex TM
CarboPac PA1 2 × 250 mm analytical column
Table 2.2.2. Enzymes and cocktails used throughout this study are presented along with the relevant
supplier.
Table 2.3. Apparatus, equipment and instruments used throughout this study are presented along
with the relevant supplier.

20
CarboPac PA1 2 × 50 mm guard column
HPLC system, Dionex TM
HPLC analytical column, Rezex RFQ Fast Acid H+ (8%) 7.8×50 mm Phenomenex
HPLC analytical column, Rezex RFQ Fast Acid H+ (8%) 7.8×100 mm Phenomenex
HPLC vials VWR
Liquid dispenser 50 mL Brand
MALDI-TOF Daltonics, Germany
Milli-Q® Direct Water Merck Millipore
Magnet, Teflon Stirring Bar SP Science ware
Magnetic Stirrer, RCT Basic IKA
Measuring cylinger VWR
Muffle furnace 575 °C
PCR Tubes, 0.2 mL Axygen
pH-meter SI400 Sentron
Pipette Refill Tips Thermo Scientific and VWR
Plates, multiscreen®HTS with 96 wells Thermo scientific
Pressure tubes 50 mL with sealing (tubes resistant to 120°C) Kimax
Refrigerator, 4°C Bosch
Retsch PM100 ball mill Retsch
Retsch yttrium stabilized oxide chamber of nominal volume 500
mL
Retsch
Retch ceramic balls with mass 0,40 ± 0,01 g Retsch
Scale with 0.1 mg accuracy Sartorius, Germany
Scissors with sharp blades Fiskars
Sonics Vibra-CellTM Ultrasonic Processor Sonics & Materials, Inc.
Spectrophotometer, MultiscanTM FC Microplate Photometer Thermo Scientific
Syringe Filtration Unit Sarstedt
Target plate MTP 384 ground steel Daltonics, Germany
ThermomixerTM C Eppendorf
Vacuum pump VWR
Volumetric flask 1.0 L Duran
Volumetric flask, 2.0 L Duran
Vortex, MS2 Minishaker IKA
Water bath, 30 °C Julabo

21
3. Methods
3.1. Buffers and dilutions
Diluted sulphuric acid (72% w/w)
Materials and chemicals: 96% (w/w) H2SO4 (l)
dH2O
Graduated cylinder
Utilizing a graduated cylinder, 133 ml H2SO4 (96 % w/w) was diluted in 82 ml dH2O. The dilution was
slowly conducted, and the solution was allowed to cool in room temperature.
Sodium acetate buffer, pH 5.0
Materials and chemicals: NaCH3COO (s)
dH2O
CH3COOH (l)
Volumetric flask 1.0 L
0.45 PES membrane
Apparatus: Vacuum pump
Scale (accuracy 0.1 g)
Hydrolysis experiments with enzyme cocktails were carried out with a 50 mM sodium acetate buffer
with pH 5.0. A stock solution of 0.1 M buffer was prepared by dissolving 136.1 g sodium acetate in
dH2O and adjusting the pH to 5.0 with approximately 50 mL of acetic acid (100 % w/w). The buffer
volume was adjusted with dH2O in a volumetric flask to a final volume of 1,0 L. The buffer was filtrated
under sterile conditions using a 0.45 µm PES membrane vacuum filtration system and stored at room
temperature. It was subsequently diluted to 50 mM and stored at 4°C.
Tris-HCl buffer, pH 8.0
Materials and chemicals: C4H11NO3 (s)
dH2O
HCl (l)

22
Volumetric flask 1.0 L
Apparatus: Autoclave
Scale (accuracy 0.1 g)
The Tris-HCl buffer utilized for the experiment with TaLPMO9A was prepared by dissolving 121.1 g
of Tris base (C4H11NO3) in 800 mL dH2O. Hydrochloric acid (HCl) was used to adjust the pH to 8.0,
before the final volume was adjusted by dH2O to 1.0 L in a volumetric flask. The buffer was autoclaved
for 20 minutes at 121°C and stored at room temperature. The buffer was subsequently adjusted to pH
6.5 and diluted to 70 mM. The dilution was stored at 4°C.
Ascorbic acid
Materials and chemicals: C6H8O6 (s)
dH2O
Volumetric flask 1.0 L
Apparatus: Autoclave
Scale (accuracy 0.1 mg)
The 100 mM ascorbic acid stock for enzymatic hydrolysis experiments was made by dissolving 1.8 mg
ascorbic acid in dH2O in a volumetric flask to a final volume of 100 mL. Aliquots were stored in 0.2
mL in PCR tubes at -20°C.
Eluent of 5 mM sulphuric acid
Materials and chemicals: 96% (w/w) H2SO4 (l)
dH2O
Graduated cylinder
Volumetric flask, 2.0 L
The eluent utilized as mobile phase in ion exclusion chromatography was prepared shortly within
chromatography. Firstly, 372 µL acid was pipetted into a beaker containing dH2O. Secondly, the content
of the beaker was poured into a volumetric flask. Thirdly, the flask was filled with dH2O to 2.0 L.

23
Eluent of 1 M NaCH3COO in 0.1 M NaOH
Materials and chemicals: NaOH (l)
NaCH3COO (s)
dH2O
Scale (accuracy 0.1 g)
Volumetric flask, 1.0 L
0.2 µm PES membrane
ICS eluent bottle
Apparatus: Vacuum pump
Ultrasonic Processor
Pump with N2 flow (g) (included in the HPLC system)
For ion exchange chromatography, the eluents utilized were freshly prepared. 82.0 g NaCH3COO was
dissolved in dH2O, adjusting the volume to 1.0 L in a volumetric flask and filtrating it through a 0.2 µm
PES membrane. The buffer was degassed for 20 minutes and the air in the headspace was exchanged
with N2 before 5.2 mL NaOH was pipetted into the bottle. The bottle was closed well and carefully
shaken to mix the buffer.
Eluent of 0.1 M NaOH
Materials and chemicals: NaOH (l)
dH2O
Volumetric flask, 2.0 L
ICS eluent bottle
Apparatus: Ultrasonic Processor
Pump with N2 flow (g)
In a volumetric flask, 2.0 L of dH2O was filled directly after filtration by MilliQ®. The bottle was
covered loosely with a lid and degassed for 20 minutes and the air in the headspace was exchanged with
N2 before 10.4 mL NaOH was pipetted into the bottle. The bottle was closed well and carefully shaken
to mix the buffer.

24
Eluent of dH2O
Materials: dH2O
ICS eluent bottle
Apparatus: Ultrasonic Processor
Pump with N2 flow (g)
2 L of dH2O was filled into the eluent bottle directly after filtration by MilliQ®. The bottle was covered
loosely with a lid and degassed for 20 minutes and the air in the headspace was exchanged with N2.
3.2. Compositional analysis
Avicel PH 101, scissor cut white denim fabric (WD), scissor cut blue denim fabric (BD), ball milled
WD (BWD) and ball milled BD (BBD) where characterized by a compositional analysis. A protocol
developed at the U.S Department of Energy was used to accurately quantify water, ash and cellulose
(Sluiter, Hames et al., 2008). As cotton is lignin- and hemicellulose-free, the procedure was adapted for
quantification of cellulose, oligo- and polysaccharides referred to as glucan. Glucan was quantified for
Avicel, WD and BD, not for ball milled substrates.
Materials and chemicals: 72% (w/w) H2SO4 (l)
dH2O
Pressure tubes (glass tubes solid enough for autoclaving when tightly
sealed, 50 mL)
Glass stir rods
Glass filter crucibles 15 mL
Büchner flask and a funnel fitting the filters
Apparatus: Scale (accuracy 0.1 mg)
Water bath 30 °C
Autoclave 120 °C
Liquid dispenser (>50mL)
Vacuum pump
Dry oven of 106 °C
Desiccator
Muffle furnace (575 °C)

25
3.2.1. Dry matter content
Triplicates of samples of approximately 300 mg dry matter were weighed into pre-weighed (after
incineration) and tared porcelain crucibles for dry mass and ash determination. All samples were dried
for 24 hours at 106°C and cooled in a desiccator for 20 minutes before the dry mass was registered. Dry
matter content was calculated according to Formula 3.2.2.1. The same samples were then incinerated
for 24 hours at 575°C, allowed to cool in a desiccator for 1 hour, and the remaining mass was determined.
Ash content was calculated according to Formula 3.2.2.2. Dry mass and ash quantification were both
carried out by monitoring 1 hour further drying/incineration to assure complete processes. The dry
matter content was used for calculations in glucan quantification and the set-up of enzymatic hydrolysis
experiments.
Formula 3.2.1.1:
𝐷𝑀 =𝑑𝑚𝑏𝑠 − 𝑑𝑚𝑏
𝑚𝑠∙ 100%
dm : registered mass after drying s : sample
m : registered mass before drying b : beaker
Formula 3.2.1.2:
𝐴𝑠ℎ =𝑖𝑚𝑏𝑠 − 𝑖𝑚𝑏
𝑚𝑠∙ 100%
im : registered mass after incineration b : crucible
m : registered mass before drying and incineration
3.2.2. Quantification of glucan
In the first step, the samples were incubated at 30 °C for 1 hour with 72 % (w/w) sulfuric acid to break
the hydrogen bonds and solubilize the crystalline structure of cellulose. In the second step, the acid was
diluted to 4 % (w/v) by addition of dH2O followed by temperature increase to 120 °C. Glucan that is
already cleaved in the first step are depolymerized to monosaccharides. Further degradation of glucose
into hydroxy-methyl-furfural (C6H6O3) might occur in reactions with acidic conditions and high
temperature over time. Sugar recovery standards (SRS) were utilized to account for the possible loss of
glucose. Products of acid hydrolysis were diluted 1:5 and subsequently separated by ion exclusion
chromatography.
For cellulose quantification, about 150 mg sample was weighed into pressure tubes. The mass was
accurately registered by using a scale with 0,1 mg precision. 72 % (w/w) H2SO4 aliquots of 1,5 mL were
added to each pressure tube, yielding a concentration of 3.97 % (w/w). Glass stir rods were used to mix
the sample and sulphuric acid solutions thoroughly. A water bath set to 30°C was used for 60 minutes

26
incubation. During incubation in the water bath the samples were stirred every 5 minutes with glass rods
to ensure acid distribution onto all sample particles. A liquid dispenser was then used to add 42 mL
dH2O to the samples, diluting the acid concentration to 4 % (w/w). In order to prepare SRS, a 30 g/L
stock solution of high purity D-glucose was diluted to 3 g/L. 10 mL of the solution was pipetted into
three pressure tubes and added 174 µL H2SO4. The pressure tubes containing the cellulose samples and
SRS’s were tightly sealed and autoclaved at 121°C for 60 minutes. All pressure tubes were allowed to
cool in room temperature before they were vortexed for 10 seconds and filtered through glass filter
crucibles set up with a funnel and Büchner flask underneath, air tightened on both sides by rubber conical
gaskets and connected to a vacuum pump. Centrifuge tubes were used to catch the filtrate. Glucose was
separated by ion exclusion chromatography with the analytical column Rezex RFQ Fast Acid (8%) (see
section 3.6.3 for detailed description of this protocol) and quantified from undiluted samples using
calibration standards within the range of 0,3-30,0 g/L. Calculations were made applying Formula 3.2.2.
Formula 3.2.2:
𝐺𝑙𝑢𝑐𝑎𝑛 𝑐𝑜𝑛𝑡𝑒𝑛𝑡(% 𝑜𝑓 𝑡𝑜𝑡𝑎𝑙 𝑠𝑜𝑙𝑖𝑑𝑠) =[𝐺𝑙𝑐𝐻𝑃𝐿𝐶](𝑔/𝐿 ) ∙ 𝐷𝐹 ∙ 𝑉𝑠(𝐿) ∙ 𝑀𝑚𝑎𝑛.𝐺𝑙𝑐
𝑀𝑚𝐺𝑙𝑐
𝑅 ∙ 𝑇𝑆∙ 100
Vs : Volume sample [Glc HPLC] : anhydrous glucose quantified by HPLC
𝑇𝑜𝑡𝑎𝑙 𝑠𝑜𝑙𝑖𝑑𝑠 = 𝑇𝑆 =𝑚𝑠(𝑔)∙𝐷𝑀(%)
100 𝑅 =
[𝑔𝑙𝑐𝑟𝑒𝑐𝑜𝑣𝑒𝑟𝑒𝑑](𝑔/𝐿)
[𝑔𝑙𝑐𝑑𝑖𝑙𝑢𝑡𝑒𝑑](𝑔/𝐿)
3.3. Ball milling of denim substrates
Materials: Sharp scissors
Sieving equipment, mesh size 0.8 mm
White and blue denim fabric
Apparatus: Retsch PM100 ball mill
500 mL chamber and ceramic balls
Scissors and a Retsch PM100 ball mill were used to
pre-treat cotton from white and blue denim fabric prior
to enzymatic hydrolysis. The substrates WD and BD
were cut to 25-50 mm pieces by scissors before ball
milling. A Retsch PM100 was used, with an yttrium
stabilized oxide chamber of nominal volume 500 mL.
The chamber was filled with 5,0 g sample and 342 g
ceramic balls. The milling was carried out by 10
minutes effective intervals at 350 rpm and 15 minutes
Picture 3.3: Denim powder. Photography of
substrate BWD (upper left) and BBD (lower
right) used in hydrolysis experiments.

27
break intervals. The breaks were important for avoiding elevated temperature due to high dynamic
energy in a closed system. The duration of efficient milling was 1 hour and 10 minutes (total duration
of 2h 40 min) for WD. BD needed a longer milling time in order to obtain a similar powdering to WD
and was therefore ball milled for 1 hour and 50 minutes (total duration 4 h 20 min). The substrates were
milled in 5 batches, thereafter cooled and sifted through a 0,8 mm sift. The particles passing through the
sieve were mixed well and stored in centrifuge tubes at 4°C. Very small fractions of particles were
remaining in the sieve.
3.4. Particle size distribution measurement
Materials: Ball milled white denim and ball milled blue denim
Apparatus: Malvern Mastersizer 3000
Ball milled denim samples were analysed by Malvern Mastersizer 3000 in order to determine the mean
particle size. A particle refractive index of 1,58 was used, as axial refractive indices of different cotton
types are measured to be 1,575 to 1,580 by Meredith (1946). Three table spoons of sample,
(approximately 10 g) were inserted into the instrument, which distributes the sample gradually into two
lasers of red and blue colour. A sensor across the chamber registers the signals. The feeding of sample
is repeated until the measurements fits into a statistical model with a low weighted residual.
The size of a particle is given as the volume of a sphere. The equivalent sphere theory is applied for
measuring particles of various shapes by Malvern Mastersizer 3000 and its software. A sphere has mean
diameter given by ∑ 𝑑2
𝑛 , where n is the number of particles. The weight of a sphere is given by the
formula 4
3𝜋𝑟3. 𝑝 which can be combined with the mean diameter formula to give a formula we can use
for determining the mean diameter on the basis of weight, by the formula ∑ 𝑑3
𝑛. Moment Means are
introduced to the formula to release it from the dependency on the number of particles in the calculations.
Surface area moment mean (mathematically written D[3,2]) and volume moment mean (D[4,3]), are the
moment means used for particle size measurement in this experiment, and they are calculated by
𝐷[3,2] =∑ 𝑑3
∑ 𝑑2 and 𝐷[4,3] =∑ 𝑑4
∑ 𝑑3 . These two formulas describe around which central point of the
frequency the surface area (for D[3,2]) and the volume (for D[4,3]) distributions rotate. In order to use
a mean value to explain possible differences in digestibility of the cotton substrates, both D[3,2] and
D[4,3] give valuable information, as they describe the distribution of surface and of volume or mass.
The surface area moment mean can further be used for comparing specific surface area of the materials,
although the density is required in those calculations.

28
3.5. Bradford protein quantification
Materials and chemicals: Plastic cuvettes
Celluclast® (Novozymes Inc.)
dH2O
Coomassie Brilliant Blue reagent
Bovine serum albumin (BSA)
Apparatus: Spectrophotometer
One of the enzyme cocktails used for cellulose hydrolysis (see section 3.6.2, the cocktail Celluclast®
from Novozymes Inc.) had an unknown protein concentration. The Bradford Method, a colorimetric
protein assay was used to measure the protein concentration in Celluclast®. All proteins in the cocktail
are assumed to be active enzymes. The principle of the assay is light absorbance of Coomassie Brilliant
Blue in acidic solutions, and the change of absorbance maximum from 465 to 595 nm when it binds to
protein (Bradford 1976). Only basic amino acids bind to the reagent compound; hence the method only
measures the content of proteins that inherit alkaline residues. The calibration curve was pre-calibrated
with bovine serum albumin (BSA) calibration standards diluted in dH2O. The sample was analysed in
triplicate.
Celluclast® was diluted 1:10 000 in dH2O by mixing 10 µL Celluclast® with 790 µL dH2O, before
adding 200 µL of the Coomassie Brilliant Blue reagent. Samples were’ vortexed for 3 seconds. After 5
minutes static incubation at ambient room temperature, the sample was pipetted into a plastic cuvette
and analysed by measuring absorption spectrophotometrically at 595 nm. The concentration of the
protein in the sample was estimated based on a standard curve ranging from 0.25 µg/mL to 10 µg/mL.
3.6. Enzymatic conversion of cotton textile to glucose
Conversion of cellulose from cotton textile was investigated by using the enzyme cocktails Cellic®
CTec2 with a protein concentration of 83 g/L and Celluclast® with a protein concentration 40 g/L.
Cotton samples investigated were scissor cut white denim fabric (WD), scissor cut blue denim fabric
(BD), ball milled WD (BWD) and ball milled BD (BBD). As a reference substrate, the laboratory
standard Avicel was analysed along with the denim substrates. Avicel is described by the producer as
micro crystalline particles of approximately 50 µm particle size, chemically produced from cotton
linters. In order to avoid unaccounted changes in substrate concentration, calibration standards went

29
through the same dilution steps as samples in enzymatic hydrolysis experiments and are throughout
chapter 3.5 treated as the samples. According to the substrates’ respective total solids contents, an ideal
mass corresponding to 25 mg total solids in the reactions was aimed for to obtain 5 % DM and the
deviations in weighing were calculated for each tube as a correction factor. A buffer volume adjusted to
total solids of each replicate was added. The reactions total volume in a tube containing 25,0 mg total
solids was 0,50 mL. Sample volume was included in total volume, where 1 mg was calculated as 1 μL.
The addition of enzyme solution was adjusted for each sample using the correction factor from
deviations in weighing.
3.6.1. Experiments with Cellic® CTec2
Apparatus: Thermomixer with 2.0 mL thermoblock
Scale (accuracy 0.1 mg)
Vortex shaker
Heat block (100°C)
Centrifuge
Vacuum pump
Materials. Textile substrates (WD, BWD, BBD)
Avicel
50 mM Sodium acetate buffer, pH 5.0
100 mM ascorbic acid
Cellic® CTec2 (Novozymes Inc.)
Eppendorf tubes 2.0 mL
Ice
Filter plates 0,45 µm membrane
3.6.1.1. Loading analysis
The loading 2 mg, 4 mg, 8 mg, 12 mg, 16 mg and 20 mg enzyme per g cellulose were analysed for
BWD. Cellic® CTec2 was diluted in buffer to 1,8 g/L and mixed well before and regularly during
preparation of samples. This enzyme solution represented the stock solution used further in this
experiment. Approximately 27 mg BWD was weighed into 2 mL eppendorf tubes. The correction factor
from deviations in weighing was used to determine appropriate volumes of enzyme and buffer for each
sample. A buffer volume adjusted to give a final concentration of 50 g/L total solids of each replicate
was added. Aliquots of 10 μL ascorbic acid stock was added to all samples, which gave a final

30
concentration of 2 mM. The samples were pre-heated to 50 °C in a thermomixer. The respective volumes
of the enzyme stock solution were added, where 25 µL multiplied with the correction factor represented
2 mg enzyme per g glucan, giving an enzyme concentration of 0.09 g/L. Likewise, 50, 100, 150, 200,
250 µL gave 4, 8, 12, 16 and 20 mg enzyme loading and an enzyme concentration range up to 0.9 g/L.
(All details are given in Table S-1 in the Appendix) The samples were mixed by 5 seconds vortexing.
All samples were incubated at 50 °C and 1000 rpm shaking for 48 hours. The reactions were stopped by
heating the samples to 100 °C for 15 minutes on a heat block. The samples were cooled on ice for 2
minutes, vortexed for 5 seconds, centrifuged at 4 000 rpm for 30 seconds and filtered through a 0,2 μm
filter plate before the products were analysed by HPLC (see section 3.6.3 for details). Sample set-up is
showed with details in Table S-1.
3.6.1.2. Time course analysis with cotton substrates and Avicel
Triplicates of Avicel, WD and BWD were used in a time course hydrolysis experiment with the enzyme
loading seen to achieve the most efficient conversion in the loading analysis. Section 5.3.1 explains how
loadings were selected. Reactions were set up and incubated with similar conditions to the loading
analysis. Duration of hydrolysis was 4 hours, 24 hours, 48 hours and 96 hours. BBD and BWD were
later used in an identical experiment.
Approximately 27 mg BWD, 25.6 mg WD, 26.0 mg BBD and 25.8 mg Avicel was weighed into 2 mL
eppendorf tubes to obtain 25 mg total solids. Adjusted buffer volumes were added, and ascorbic acid
stock to a final concentration of 2 mM. The samples were pre-heated to 50 °C in a thermomixer. The
respective volumes of the enzyme stock solution were added, 100 µL multiplied with the correction
factor represented 4 mg enzyme per g glucan, giving an enzyme concentration of 0.18 g/L. (All details
are given in Appendix S-3.). In order to use the same enzyme dilution for all samples, dry matter contents
of reactions were 4,93 % for Avicel and 5,00 % for textile samples, a difference that is considered in
calculations of conversion yield. The samples were incubated at 50 °C and 1000 rpm shaking for 48
hours. The reactions were stopped at 100 °C and filtrated before the products were analysed by HPLC
(see section 3.6.3 for details). Sample set-up is showed with details in Table S-2.
3.6.1.3. Time course analysis at increased dry matter content
In order to investigate whether or not the conversion of ball milled cotton increased or decreased
significantly with higher dry matter content of reactions, an experiment with increased dry matter
content of BWD was carried out with Cellic® CTec2. The analysis was carried out by increasing the
substrate concentration to 100 g/L and 200 g/L dry matter, by weighing in BWD masses corresponding
to 50 mg and 100 mg total solids, respectively. To maintain the enzyme loading, the volumes of the
31
enzyme stock solution was increased by the same factor as the dry matter. Sodium acetate buffer was
added to a final volume of approximately 0.5 mL, adjusted with the correction factor from weighing
deviations. The time course analysis’ duration was 96 hours. The reactions were stopped at 100 °C and
filtrated before the products were analysed by HPLC (see section 3.6.3 for details). Sample set-up is
showed with details in Table S-3.
3.6.2. Loading analysis and time course analysis with Celluclast®
Materials and chemicals. Textile substrates (WD, BWD)
Avicel
50 mM sodium acetate buffer, pH 5.0
Celluclast® (Novozymes Inc.)
Eppendorf tubes 2.0 mL
Ice
Filter plates 0,45 µm membrane
Apparatus: Thermomixer with 2.0 mL thermoblock
Scale (accuracy 0.1 mg)
Vortex shaker
Heat block (100°C)
Centrifuge
Vacuum pump
Loading of Celluclast® on BWD was investigated at 2 mg, 4 mg, 8 mg, 12 mg, 16 mg and 20 mg enzyme
per g glucan. Celluclast® was diluted in buffer to 1,8 g/L and vortexed for 10 seconds. Samples were
prepared with 5 % dry matter in reactions and incubated at 50°C for 48 hours (for details, see 3.6.1.1.
and S-4)
Celluclast® was used in a time course hydrolysis experiment with the enzyme loading seen to achieve
the most efficient conversion in the loading analysis. Section 5.3.1 explains how loadings were selected.
Reactions with WD, BWD and Avicel were set up and incubated with similar conditions to the loading
analysis. Duration of hydrolysis was 4 hours, 24 hours, 48 hours and 96 hours. Celluclast® was diluted
in buffer to 0.91 g/L and vortexed for 10 seconds. Approximately 27 mg BWD, 25.6 mg WD and 25.8
mg Avicel was weighed into 2 mL eppendorf tubes and adjusted buffer volumes were added. The
samples were pre-heated to 50 °C in a thermomixer. The respective volumes of the enzyme stock
solution were added, 200 µL multiplied with the correction factor represented 4 mg enzyme per g glucan,
giving an enzyme concentration of 0.37 g/L. The samples were incubated at 50 °C and 1000 rpm shaking

32
for 48 hours. The reactions were stopped at 100 °C and filtrated before the products were analysed by
HPLC (see section 3.6.3 for details). Sample set-up is showed with details in Table S-5.
3.6.3. Determining the enzymatic conversion yield by HPLC (IEC)
Materials: HPLC vials
dH2O
Glass test tubes
Eluent of 5 mM H2SO4
Apparatus: Dionex HPLC system (Thermo Fisher Scientific, USA)
Rezex RFQ Fast Acid (8%) analytical column with dimensions
(1) 7.8×50 mm internal diameter
(2) 7.8×100 mm internal diameter
Chromeleon 7.0 software
Vortex shaker
Analysis of the reaction products and quantification of glucose from the majority of cellulose
degradation assays was performed using ion exclusion chromatography (IEC) (some reactions were
analysed using IEX; see section 3.7.3 for details). Calibration standards and samples were diluted 50
times in test tubes by mixing 20 μl with 980 μl of water. The dilutions were vortexed for 10 seconds and
stored in HPLC-vials until products were analysed by IEC. All samples from experiments with Cellic®
CTec2 and Celluclast® were immediately diluted and transferred into HPLC vials after filtration. The
analysis was conducted within 24 hours stored at 4°C, or at a later time point, then stored at -20°C. An
injection volume of 8 µL of samples and calibration standards was inserted to the system by the
autosampler.
Products were separated by Rezex RFQ Fast Acid (8%) analytical columns (1) and (2) with 5 mM
sulphuric acid at 1) 1.0 ml/min flow rate and 85°C column temperature or 2) 0.6 ml/min flow rate and
65 °C column temperature. Column (2) was used in all experiments including Avicel, because products
of this substrate included xylose, having approximately the same retention volume to glucose when
applying the shorter column. The stationary phase of Rezex RFQ is composed of polymers containing
the functional groups sulfonated polystyrene divinylbenzene (Phenomenex 2017). The sphere around
the sulphate groups is negatively charged, repelling species with negative charges while allowing neutral
species and partially charged species (Transgenomic 2007). This causes the separation of compounds
according to their pKa (Tanaka & Haddad 2000). Glucose and cellobiose are weak polyprotic acids with
several pKa values. The hydroxyl with the lowest proton affinity is on the anomeric carbon, with pKa ~
12 (Brown 1994). Cellobiose has a slightly less proton attaining anomeric carbon, slightly lowering the

33
pKa. However. all hydroxyl groups of cellobiose and glucose were protonated in 5 mM sulphuric acid
(pH 2), and they passed through the column with retention times 1.6 and 2 minutes, respectively. The
different retention volumes (Vr) of glucose and cellobiose is thought to be caused by the size exclusion
principle which is known to be an additional occurring principle in IEC (Głód 1997). The space
surrounding the resin beds of the stationary phase is neither interacting with, repelling or excluding
glucose, while cellobiose is excluded to to a larger size. Chromatograms from separation of glucose and
cellobiose calibration standards (a) and from a sample (b) are shown in Figure 3.6.3
Concentrations of glucose and cellobiose were calculated based on a calibration curve made from 4
concentrations of D-(+)-glucose and D-(+)-cellobiose (weighed in and diluted identically to the samples,
containing sodium-acetate buffer and 2 mM ascorbic acid). The peak area integrals for peaks
representing cellobiose and glucose were converted to concentration using the formula shown in
Equation 3.6.3.1. The substrate conversion yield was then calculated according to Equation 3.6.3.2. The
cellobiose content and glucose content of the enzymatic cocktail was subtracted from the amounts in the
samples after conversion, in order to avoid over-estimation of products due to the sugar content in the
cocktail (only for Cellic® CTec2).
Equation 3.6.3.1:
[𝑠𝑢𝑔𝑎𝑟](𝑔/𝐿) = (𝑐𝑎𝑙𝑖𝑏𝑟𝑎𝑡𝑖𝑜𝑛 𝑠𝑡𝑎𝑛𝑑𝑎𝑟𝑑 𝑠𝑖𝑔𝑛𝑎𝑙 (𝜇𝑅𝐼𝑈 ∙ min)
𝑐𝑜𝑛𝑐𝑒𝑛𝑡𝑟𝑎𝑡𝑖𝑜𝑛 𝑜𝑓 𝑐𝑎𝑙𝑖𝑏𝑟𝑎𝑡𝑖𝑜𝑛 𝑠𝑡𝑎𝑛𝑑𝑎𝑟𝑑 (𝑔/𝐿)∙ 𝑠𝑎𝑚𝑝𝑙𝑒 𝑠𝑖𝑔𝑛𝑎𝑙 (𝜇𝑅𝐼𝑈 ∙ 𝑚𝑖𝑛)) ∙ 𝑑𝑖𝑙𝑢𝑡𝑖𝑜𝑛 𝑓𝑎𝑐𝑡𝑜𝑟
Equation 3.6.3.1
𝑐𝑜𝑛𝑣𝑒𝑟𝑠𝑖𝑜𝑛 (%) =
[𝑔𝑙𝑐](𝑔/𝐿) + (𝑀𝑚𝐺𝑙𝑐2
𝑀𝑚𝑎𝑛ℎ.𝐺𝑙𝑐2) ∙ [𝑔𝑙𝑐2](𝑔/𝐿)
𝑀𝑚𝐺𝑙𝑐𝑀𝑚𝑎𝑛ℎ.𝐺𝑙𝑐
∙𝑔𝑙𝑢𝑐𝑎𝑛 𝑐𝑜𝑛𝑡𝑒𝑛𝑡 (%)∙𝑑𝑟𝑦 𝑚𝑎𝑡𝑡𝑒𝑟 𝑐𝑜𝑛𝑡𝑒𝑛𝑡 (𝑔/𝐿)∙ 100
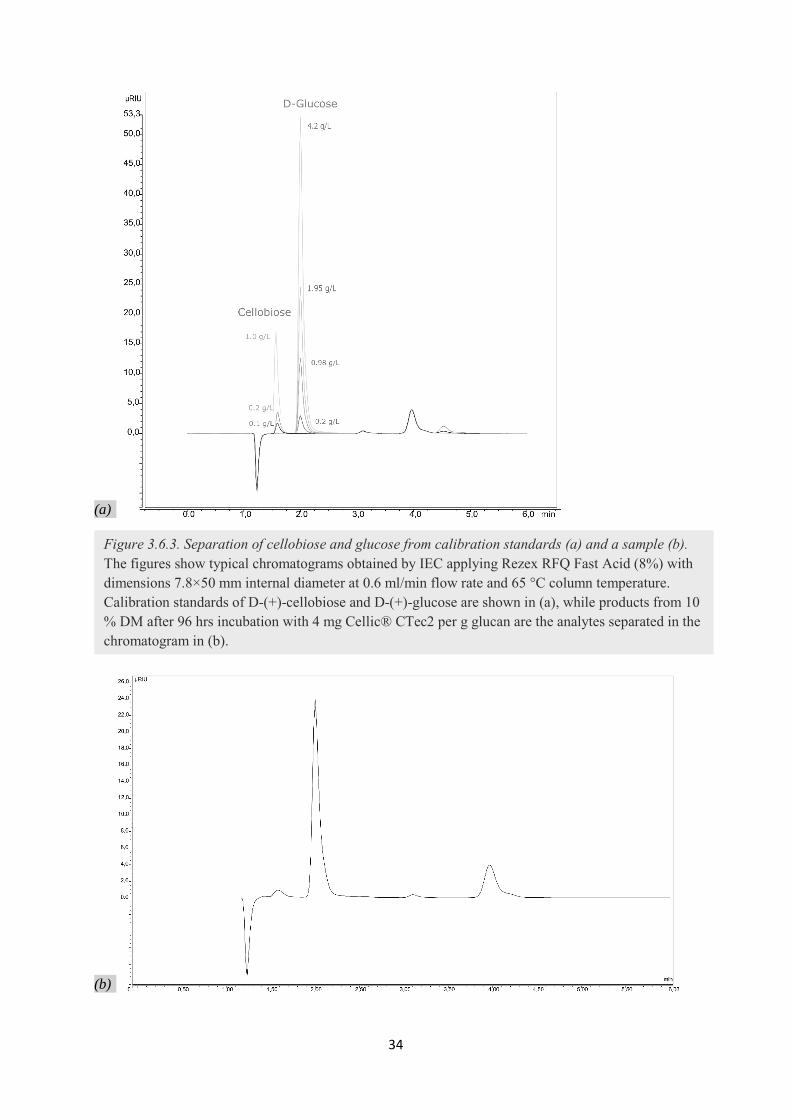
34
(a)
(b)

35
3.7. Assays with LPMOs as the sole enzyme activity
3.7.1. Reactions
Materials and chemicals. Textile substrates (WD, BWD, BD, BWD)
Avicel
H3PO4-swollen cellulose PASC
70 mM Tris-HCl buffer, pH 6.5
100 mM ascorbic acid
TaLPMO9A
Eppendorf tubes 2.0 mL
Ice
Apparatus: Thermomixer with 2.0 mL thermoblock
Scale (accuracy 0.1 mg)
Vortex shaker
Heat block (100°C)
Centrifuge
In order to investigate the role of lytic polysaccharide monooxygenases in enzymatic degradation of
cotton substrates, reactions were set up with TaLPMO9 to react alone without cellulases. This is an
LPMO from the fungus Thermoascus aurantiacus that acts on crystalline cellulose. The cotton samples
investigated were WD, BWD, BD and BBD. As reference substrates, Avicel® PH-101 and 12 % PASC
were analysed along with the samples. Freezer stored stock solution of 100 mM ascorbic acid was used
and a 1M Tris-HCl buffer with pH=6.5 was diluted to 70 mM. The 80 mM TaLPMO9A solution was
diluted in buffer to 10 µM.
Duplicates and controls of cotton substrates and reference substrates were weighed into 2 mL eppendorf
tubes. The mass weighed in was adjusted according to the substrate’s moisture content to achieve 2.5
mg total solids in the reaction, which is a concentration of 10 g/L or 1 % dry matter. A volume
responding to total solids of each replicate was added, giving total volumes around 250 µL. Substrate
volume was included in total volume. The final concentration of BisTris was approximately 50 mM.
Aliquots of 2,5 μL ascorbic acid was added to all samples for a final concentration of approximately 1
mM. TaLPMO9A was added to final concentration of 1 µM and the samples were incubated at 45 °C
and 1000 rpm shaking for 16 hours. The reactions were stopped by heating the samples to 100 °C for
15 minutes on a heat block. They were cooled on ice for 2 minutes, centrifuged at 4 000 rpm for ½
minute and filtered through 0.2 μm filter plates. Sample set-up is showed with details in Table S-6.

36
3.7.2. Identification of oxidized products by mass spectrometry
Materials and chemicals: (Hair) dryer
2,5-dihydroxybenzoic acid matrix
Ground steel target plate with frame (Daltonics, Germany)
Standard mixture containing glc, glc2, glc3, glc4 and glc5
Apparatus: UltrafleXtreme MALDI-TOF (Daltonics, Germany)
Flex control software
Flex analysis software
Mass spectrometry with matrix assisted laser desorption ionization and time-of-flight detection
(MALDI-TOF) was used for the identification of oxidized products from the reactions described in
chapter 3.7.1. MALDI-TOF is commonly used for detection of large, involatile molecules like
oligosaccharides. Time-of flight mass analysers detect the ions and sorts their mass by their arrival. The
matrix is composed of an acidic compound easily ionized by the laser and capable of protonating the
sample dissolved in the matrix. That way, the sample obtains a monovalent charge. The ions way to the
detector depend on their size and weight, where the small ones travel faster. Time-of flight mass
analysers detect the ions and sorts their mass by their arrival. Mass per charge ratio is calculated by time
and length of the ions’ travel as well as the kinetic energy.
Samples were transferred directly from filtrate to a target plate, where they were diluted 3 times in 2,5-
dihydroxybenzoic acid matrix and dried by warm air for 2 minutes. The target plate was inserted into
an UltrafleXtreme mass spectrometer from Daltonics GmbH equipped with a Nitrogen 337-nm laser
beam. A standard containing native cello oligosaccharides was used for calibration. The applied
intensity of the laser was 60 %. The software used for collecting spectra was FlexControl, and the spectra
were analysed in Flexanalysis software.
From long cellulose fibres and shorter oligosaccharides, the oxidative cleavage catalysed by
TaLPMO9A is observed to involve oxidation of carbon number 1 and 4 around the glycosidic bonds
(Petrović unpublished). Oxidized monomers, disaccharides and native cellooligosaccharides associated
with such reactions are searched for in this analysis.

37
3.7.3. High performance anion exchange chromatography (HPAEC)
Materials and chemicals: Eluent A: 0.1 M NaOH
Eluent B: 1 M NaCH3COO in 0.1 M NaOH
Eluent C: dH2O
Standard mixture containing glc, glc2, glc3, glc4 and glc5
HPLC vials
Apparatus: Dionex ICS3000 system (Thermo Fisher Scientific, USA)
CarboPac PA1 2 × 250 mm analytical column
CarboPac PA1 2 × 50 mm guard column
Chromeleon 7.0 software
HPAEC was used to analyse product profiles and quantify gluconic acid from reactions with LPMOs
and cotton textile substrates. A comparative analysis of oxidized products in WD, BWD, BD and BBD
was conducted, by separating native oligosaccharides and oxidized oligosaccharides and comparing the
abundance of their occurrence in the LPMO treated substrates.
All samples from section 3.7.1 were analysed on the Dionex ICS 3000 system (Dionex, Sunnyvale, CA,
USA) with high performance anion exchange chromatography and pulsed amperometric detection
(HPAEC-PAD). The separation was performed by a CarboPac PA1 2 × 250 mm analytical column with
a CarboPac PA1 2 × 50 mm guard column. The eluents were prepared, and the instrument method was
set up to perform a gradient elution profilie at a flow rate of 0.25 mL/min. Initial conditions were set to
100% of eluent A, followed by a linear gradient of eluent B which 10 min after sample injection reached
10% and 30 % 35 min after injection. This was followed by a 5-min exponential gradient to 100% eluent
B, after which the column was reconditioned by running the initial conditions for 9 min. The stationary
phase is composed of 10-μm diameter polystyrene/divinylbenzene substrate agglomerated with 350-nm
Dionex MicroBead quaternary amine functionalized latex (Rohrer 2013). Quaternary ammonium is a
permanently positively charged functional group that interact with oligosaccharides, as all hydroxy
groups are deprotonated in 1 M NaOH (pH~13). By increasing the concentration of CH3COO - in the
mobile phase, negative ions are provided to the positively charged resin beds and because of the higher
affinity between the amino groups and the acetate ions, the oligosaccharides are forced out of the beds.
The longer the polymerization of the sugars, the more acetate is needed to displace the deprotonated
sugars. This causes an elution of sugars in an order with positive correlation between time and size.
(Rohrer 2013; Westereng et al. 2013).
LPMOs cleave sugars into a native sugar and an oxidized sugar, for instance an oxidized dimer (Figure
3.7.3). In principle, the native sugars have lower Vr than the oxidized products and will elute first,

38
although there is an overlap of the retention time of native pentamer and cellobionic acid (GlcGlc1A).
The explanation for the larger Vr of oxidized oligosaccharides than native oligosaccharides is not fully
understood. Neither is the explanation for the difference in Vr for C1 and C4 oxidized products.
However, indications of additional oxidations for geminal diols have been demonstrated, occurring at
the non-reducing monosaccharide during high alkaline conditions in the analytical step (Westereng et
al. 2016). Double oxidation and associated depolymerization and tautomerization was not indicated in
C1 oxidized sugars. The additional oxidation causes a tautomerization of the geminal diol into a double
oxidized linear monosaccharide cleaved off from the geminal diol produced in the LPMO reactions. The
change of size and shape might cause larger Vr for C4 oxidized products, by a size allowance/exclusion
principle (Westereng 2018). Further, the depolymerization of a geminal diol (Glc4GemGlcn) implies
that the oligosaccharide cleaved off by decomposition during the analytical step (Glcn) is eluted
separately as a native oligosaccharide.
Identification of native cello oligosaccharides was done by analysing a calibration standard consisting
of cellobiose, cellotriose, cellotetraose and cellopentaose. In order to identify LPMO activity, a
calibration standard of the C4-oxidized dimer (Glc4gemGlc/Glc4KGlc) was used at concentrations 0,12
g/L and 0,03 g/L. The oxidized standard was generated with NcLPMO9C from cellopentaose by dr.
Piotr Chylenski. Substrates of LPMO reactions may be cellulose with different degree of polymerisation.
In order to quantify a compound by chromatography, accurate calibration standards are required. To
compare the quantities of oxidized products in the substrates, one might look at C1- and C4-oxidized
sugars of various length. However, the standards are of limited quantity because they are not
commercially available and challenging to produce due to poor stability. Due to the limitation of
available calibration standards, the only oxidized standards utilized is the oxidized dimer, assumed to
be representative.
The content of oxidized dimer was not quantified. Information about accurate quantities of the oxidized
dimer lacks significance for the analysis, as there was done no attempt to degrade oxidized products the
Figure 3.7.3. Oxidative cleavage. The figure shows the reaction scheme of C-4 oxidative cleavage of
cellulose into oxidized cellobiose and a native oligosaccharide, based on information and illustrations
from Loose and co-workers and O’Dell and co-workers (Loose et al. 2014; O'Dell et al. 2012)

39
content of oxidized dimer in the reactions are not comparable. Moreover, the applied analytical method
is acknowledged for quantification of C4 oxidized sugars due to complexity caused by decomposition.
The intensity of the peaks for the C-4-oxidized dimer in the respective substrates were compared, hence
the study was comparative.

40
4. Results
4.1. Composition of substrates
Compositional analysis of solid substrates used for enzymatic hydrolysis is important in order to enable
precise calculations of hydrolysis yields. In this study, the compositional analysis was performed in
three steps. Firstly, determination of the total solids (dry matter) was carried out, and the dry matter
content was further used for the calculations of the second and third steps. Second, the dried samples
were combusted, and the inorganic material left after incineration (ash) was weighed. The ash content
was calculated as a fraction of total sample weight and as a fraction of total solids in the sample. Third,
quantification of cellulose by acid hydrolysis and chromatography was used to estimate cellulose as
fractions of total weight and total solid weight. The gap in the mass balance that cannot be accounted
for from the ash and cellulose estimations is named “others”.
In table 4.1, the content of ash, cellulose and unidentified compounds are shown as fractions of total
sample weight. The main component of the denim substrates is cellulose, representing 89 ± 2.4 % and
88 ± 1.5 % of the total sample weight for WD and BD, respectively. The water content in white denim
fabric (WD) more than doubles after ball milling (i.e. increasing from 2,6 % to 7 %), whereas blue denim
fabric (BD), only sees a marginal increase in hydration after this treatment (increasing from 4.0 to 4.6%).
The unidentified compounds of the white cotton are 6 % and 1 % for WD and BWD, respectively,
showing a significant difference after ball milling. For the blue cotton, 7 % of the total mass is
unidentified.
Figure 4.1 illustrates the content of water, ash, cellulose and unidentified compounds shown as fractions
of dry matter weight. The glucan content of the dry matter is 91.7 % in WD and 96.1 % in BWD. For
BBD, glucan makes up 88.7 % of the dry matter. The unidentified compounds of the substrates are 6%,
1%, 7 % and 4 % of the dry matter content for BWD, WD, BBD and Avicel. The respective fractions of
ash are 0,53 % for BWD and WD %, 0,59 % for BBD and not determined for Avicel.
(% of total sample weight)
Material Pretreatment Glucan Ash Total solids Water Others
White cotton from
denim
Scissor cut 89 ± 2,4 0,52 ± 0,05 97,4 ± 0,2 2,6 ± 0,2 6
Ball milled - - 93 ± 2 7 ± 2 1
Blue cotton from
denim
Scissor cut 88 ± 1,5 0,57 ± 0,04 96,0 ± 0,1 4,0 ± 0,1 7
Ball milled - - 95,4 ± 0,2 4,6 ± 0,2 7
Avicel PH-101 None 92,5 0,49 - 96,8 0,3 3,1 0,3 -
Table 4.1. Compositional data for textile substrates, calculated as percentage of total sample weight. The
laboratory standard Avicel was analysed for cellulose and dry matter along with the samples, while ash
content was not determined. Contents of ash and glucan are assumed to be consistent before and after milling
and is therefore only determined for un-milled samples.

41
4.2. Particle size after ball milling
Ball milled samples were measured by Mastersizer 3000 in order to determine the particle size
distribution. The refractive index of cotton depends on the location of the fibre where the refraction
occurs. The axial index was utilized in this analysis, while the longitudinal index (1,52) was applied for
controlling whether the results deviated. Particle size and surface area give valuable information about
the availability of a substrate and might explain differences in digestibility of two ball milled samples.
The surface area moment mean and the volume/mass moment mean for blue cotton substrate and white
cotton substrate are shown in Table 4.2, whereas the particle size distribution is illustrated in Figure 4.2.
0 %
20 %
40 %
60 %
80 %
100 %
WD BWD BBD Avicel
Co
mp
osi
tio
n (
% o
f to
tal so
lid
s)
Substrate
Glucan Ash Unknown
Figure 4.1. Compositional data for textile substrates calculated as percentage of
total solids. Acid hydrolysis, drying and incineration were applied for
determination of cellulose, total solids and ash, respectively, here shown as
percentage of TS of substrates. The glucan content per TS after ball milling is
not determined separately, only calculated as percentage of the new TS. Standard
deviations are taken from calculated % as a fraction of total sample weight.

42
Ball milled cotton (µm)
Moment mean white denim blue denim
D[3;2] 19,7 14,5
D[4;2] 160 164
4.3. Enzyme loading experiments
The primary aim of the hydrolysis experiments was to convert cellulose to glucose as efficiently as
possible. One major factor of costs and efficiency is the enzyme loading, i.e. how much enzyme cocktail
that is used in the textile conversion process. In order to find the optimal enzyme load for converting the
substrate to soluble sugars after 48 hours (a common incubation time used by the industry), enzyme
loading experiments were performed. The commercially available enzyme cocktail Cellic® CTec2 was
used to convert samples of 5 % dry matter content for 48 hours, and the products were analysed by
HPLC for separation and quantification of cellobiose and glucose. Calibration curves were made from
a range of 4 sugar concentrations for glucose and cellobiose, respectively (for details, see tables S-1 and
S-2 in the Appendix). Concentrations of soluble sugars obtained in the experiments were determined by
HPLC and calculated using Equation 3.6.3.1. The conversion yield obtained was calculated using the
formula presented in Equation 3.6.3.2 (section 3.6.3)
For ball milled white denim, conversion to glucose and cellobiose was 67 ± 1 % when the loading was
2 mg, while it increased to 88 ± 1.4 % when the loading was 4 mg and 93 0.7 % when 8 mg (Figure
4.3.1). When increasing the enzyme loading further, conversion of the substrate to glucose and
cellobiose reached 98 ± 1.2 % conversion for 12 mg and 16 mg loading, and 97 ± 0.8 % for 20 mg.
Table 4.2. Moment mean values determined for ball milled substrates. Information about particle size
distribution is given by surface area moment mean and volume moment mean.
Figure 4.2. Particle size distribution of ball milled white and blue cotton. An overview of the
size classes for which ball milled samples were determined.

43
An enzyme loading analysis was also done with the Celluclast® enzyme cocktail, using the same
conditions as with Cellic® Ctec2, in order to compare the response curves of the cocktails. (Figure
4.3.2.)
0
20
40
60
80
100
0 2 4 6 8 10 12 14 16 18 20
Conver
sion (
%)
Enzyme loadnig (mg protein/g substrate)
Glucose
Cellobiose
Figure 4.3.1. Loading analysis. Enzymatic conversion of ball milled white cotton substrate for 48 hours
with 5 % dry matter content and 2 mM ascorbic acid. Various loadings of Cellic® CTec2 were applied
and products were analysed by HPLC.
0
20
40
60
80
100
0 4 8 12 16 20
Conver
sion (
%)
Enzyme loading (mg protein/g substrate)
Glucose Cellobiose
Figure 4.3.2. Loading analysis. Enzymatic conversion of ball milled white cotton substrate for 48
hours with 5 % dry matter content and 2 mM ascorbic acid. Various loadings of Celluclast were
applied and products were analysed by HPLC.

44
In the Celluclast® enzyme loading analysis, an
enzyme loading of 4 mg per g cellulose converted 44 ±
2 % of the cellulose into glucose, while 61 ± 2 % was
converted when using 8 mg loading. The conversion
into glucose was 71 ± 2 % when increasing to 12 mg
loading and does not seem to increase further for
higher loadings. In regards of total conversion
(cellobiose and glucose), the conversion was 76 ± 4 %
at 4 mg enzyme loading, 89 ± 3 % at 8 mg, and 96 ±
2 % when increasing to 12 mg. For 16 mg and 20 mg
loading, the total conversion approximately reaches
100 %, standard deviations are 6 % and 14 %,
respectively. The triplicates representing 16 mg
loading had a even dispersion with 86 %, 91 % and 99 %. The triplicate of 20 mg loading contained two
replicates calculated to yields of 92 % and 99 % and one replicate calculated to 66 %.
Celluclast® shows different loading-response development glucose production and for total conversion,
and the decision of what enzyme loading to use in time course experiments (see sections 4.4 and 4.5)
was based on the latter. The conversion yields of Celluclast enzyme loading assays are shown in Table
4.3. An enzyme loading of 8 mg was chosen for further use in analyses with Celluclast®, this is
discussed further in Chapter 5.2.1.
4.4. Time course analysis with Celluclast®
Time course experiments were set up to assess ideal duration for efficient conversion of the textiles. The
conversion over time was investigated by time course analysis with Celluclast® at pH 5.0 with 5 % dry
matter content with 8 mg enzyme loading. White cotton substrate with and without ball milling were
analysed, as well Avicel as a control substrate.
As Figure 4.4 illustrates, conversion of all three substrates increase over time. The ball milled white
cotton shows a total conversion of 67 ± 1,1 % after 24 hours, and at 96 hours degradation the conversion
was 88 ± 2.3% (Table 4.4 a). For glucose production, the steepest part of the curve in Figure 4.4.1 is
between 24 and 48 hours. At the same time, cellobiose has a decrease. Conversion of the substrate into
glucose reaches its maximum at 75 ± 2,4 % after 96 hours (Table 4.4.b). The laboratory standard, Avicel,
has a maximal total conversion at 53 ± 3,4 % after 96 hours.
Celluclast
loading
(mg/g)
Conversion (%) into sugars
Total Glucose Cellobiose
2 60 2 28 1 31 1
4 76 4 44 2 32 2
8 89 3 61 2 28 1
12 96 2 71 2 25 0
16 92 6 71 5 21 2
20 86 14 69 10 17 5
Table 4.3. Enzymatic conversion of ball milled
white cotton substrate for 48 hours with 5 % dry
matter content and 2 mM ascorbic acid. Various
loadings of Celluclast were applied and products
were analysed by HPLC.

45
The ball milled white cotton substrate shows the highest conversion for all time points in the analysis,
in average 1.9-fold higher than Avicel. The scissor cut white cotton substrate, has a lower conversion at
all time points, 19-fold lower than the ball milled substrate. Controls without enzyme and blind samples
without substrate contained no detectable sugars. After 0 hours the conversion of the samples is assumed
to be 0 % as for the controls
0
10
20
30
40
50
60
70
80
90
100
0 24 48 72 96
Co
nver
sio
n (
%)
Time (hrs)
Ball milled white cotton
Avicel® PH 101
Scissor cut white cotton
Ball milled white cotton
Scissor cut white cotton
Avicel® PH 101
Conversion (%) into cellobiose
Figure 4.4: Conversion of cotton textiles and Avicel by Cellluclast. Conversion of WD,
BWD and Avicel into glucose and cellobiose by 8 mg Cellucllast per g glucan , measured
by HPLC. Reaction pH 5.0 and 5 % dry matter content.
Total conversion (%)
Time (hrs) 4 24 48 96
Ball milled textile (BWD) 38.6 ± 0.4 67 ± 1.1 82.4 ± 0.7 88 ± 2.3
Avicel® PH 101 20.4 ± 0.3 35.3 ± 0.4 43 ± 4.3 53 ± 3.4
Scissor cut textile (WD) 1.9 ± 0.1 3.6 ± 0.2 4.7 ± 0.6 5.7 ± 0.8
Table 4.4: Total conversion (a) conversion into glucose (b) of cotton substrates and Avicel by Celluclast
with enzyme loading was 8 mg protein per g substrate, pH 5.0 and 5 % dry matter content.
Quantification of glucose and cellobiose was obtained by HPLC. The ratio between conversion of the
three substrates are presented.
a)
Conversion (%) into glucose

46
4.5. Time course analysis with Cellic®CTec2
Several time course experiments were carried out using Cellic® CTec2, known to be an efficient
enzyme cocktail for converting cellulose into glucose, shown for Avicel and various types of pre-
treated cellulosic biomass.
4.5.1. Comparing cotton from white denim before and after ball milling
Cellic® CTec2 was used in an analysis under similar conditions as Celluclast®, at pH 5.0 with 5 % dry
matter content. However, the enzyme loading was 4 mg and 2 mM ascorbic acid was present. BWD,
WD and Avicel were analysed. Figure 4.5.1 shows the conversion during the time course, and Table
4.5.1 present the conversion yields with standard deviations.
After 24 hours, the ball milled white denim showed a conversion of 92 ± 5.2 %, and the conversion after
48 hours displayed similar conversion with 92 ± 4.7 % (Figure 4.5.1). At 96 hours degradation, the
Conversion (%) into glucose
Time (hrs) 4 24 48 96
Ball milled textile (BWD) 14.2 ± 0.1 41.8 ± 0.5 61.6 ± 0.6 75 ± 2.4
Avicel® PH 101 9.9 ± 0.1 27.2 ± 0.3 37 ± 3.7 47 ± 3.1
Scissor cut textile (WD) 1.8 ± 0.1 3.6 ± 0.2 4.6 ± 0.5 5.7 ± 0.8
b)
0
20
40
60
80
100
0 24 48 72 96
Co
nver
sion (
%)
Time (hrs)
Ball milled white
cotton
Avicel® PH 101
Scissor cut white
cotton
Ball milled white
cotton
Avicel® PH 101
Scissor cut white
cotton
Figure 4.5.1: Conversion of cotton substrates and Avicel into glucose and cellobiose by Cellic® CTec2.
WD, BWD and Avicel were converted by 4 mg enzyme per g glucan measured by HPLC. Ascorbic acid
concentration was 2 mM, pH 5.0 and 5 % dry matter content.
Conversion into cellobiose:
Conversion into glucose:

47
reaction products show slightly higher conversion and seems to reach a theoretical maximum, showing
102 ± 2.4 %. The steepest part of the curve is clearly observed between 4 and 24 hours. Conversion
after 4 hours seems to produce less than half of theoretical possible yield, with 39 ± 1.7 % conversion.
Avicel had a maximal conversion at 93 ± 2.8 % after 96 hours. With 27.7 ± 0.7 %, 74 ± 3.9 % and 83 ±
2.4 % after 4, 24 and 48 hours, respectively, a similar trend in conversion over time between Avicel and
BWD was observed, although higher at all time points for BWD.
All analysed samples in this experiment contain less than 2.5 g/L cellobiose, which is 5 % of the dry
matter content. Blind samples without enzyme contained no detectable sugars. Blind samples without
substrate contained 0.1 g/L cellobiose and 1 g/L glucose, which was subtracted in calculations.
Total conversion (%)
Time (hrs) 4 24 48 96
Ball milled white cotton 39 ± 1.7 92 ± 5.2 92 ± 4.7 102 ± 2.4
Avicel® PH 101 27.7 ± 0.7 74 ± 3.9 83 ± 2.4 93 ± 2.8
Scissor cut white cotton 3.0 ± 0.5 4.0 ± 0.5 5.4 ± 0.8 4.4 ± 0.9
4.5.2. Time course analysis with variable dry matter concentrations
An experiment with increased dry matter of BWD over 96 hours was carried out to investigate the
capacity of Cellic® CTec2 to convert the substrate at increased substrate concentrations. The experiment
was set up as for 4.5.1, except for concentration of substrate and enzyme. The enzyme loading used was
consistently 4 mg per g glucan. The results from the substrate conversion is shown in Figure 4.5.2.
Conversion after 4, 24, 48 and 96 hours when the dry matter content was 10 % was 49 ± 1.6 %, 92 ± 3.1
%, 85 ± 1.3 % and 95 ± 5.2 %, respectively. At 20 % dry matter, the conversion was 43 ± 1.3 %, 78 ±
2.1 %, 78 ± 1.8 % and 87 ± 1.3 %.
Table 4.5.1: Conversion of cotton substrates and Avicel by Cellic® CTec2 with enzyme loading
4 mg protein per g cellulose, pH 5.0 and 5 % dry matter content. Quantification of sugars was
obtained by HPLC.

48
4.5.3. Comparison of conversion with and without ascorbic acid
LPMOs have been shown to increase the efficiency of crystalline biomass to soluble sugars (Chylenski
et al. 2017b; Johansen 2016; Villares et al. 2017). Since LPMOs depend on an external electron donor,
the presence and absence of ascorbic acid (AscA) was investigated by analysing the conversion of WD,
BWD and Avicel into glucose during 96 hours with and without 0.2 mM AscA Figure 4.5.3.
In the absence of AscA, BWD was converted with 41 ± 2.1 % after 4 hours, whereas the conversion
without AscA was 37 ± 1 %, whereas 41 ± 2.1 % was converted in the presence of AscA after the same
time. The slightly higher conversion in the presence of AscA was observed only after 4 hours, while
later time points showed slightly higher conversion in the absence of AscA. Overall, the conversion did
not significantly differ for BWD.
After 4 hours the conversion of BWD was 3.1 ± 0.3 % and 3.5 ± 0.1 % in the presence and absence of
AscA, respectively. After 24, 48 and 96 hours, the conversion did not show any difference.
For Avicel, the conversion yields in the presence of AscA were 21.2 ± 0.7 %, 60.7 ± 0.6 %, 61 ± 8.6 %
and 87.3 ± 0.5 %, after 4, 24, 48 and 96 hours, respectively. In absence of AscA, the conversion was
similar after 4 hours, showing 20.1 ± 0.6 %, while at all other time points it was significantly lower.
After 24, 48 and 96 hours, the conversion was 46 ± 3.0 %, 58 ± 2.5 % and 79 ± 2.1 %.
0
20
40
60
80
100
0 24 48 72 96
Co
nver
sio
n (
%)
into
glu
cose
an
d c
ello
bio
se
Time (hrs)
5 %
10 %
20 %
Figure 4.5.2. Conversion of BWD into glucose and cellobiose by 4 mg/g Cellic® CTec2, 2 mM
ascorbic acid, pH 5.0 and varying dry matter content.

49
4.5.4. Comparison of degradation of cotton from undyed and indigo dyed denim
The content of the indigo dye stuff (described in section 1.5.2) and the part of denim production process
called mercerization (1.3.3) are variables that might affect enzymatic conversion of denim fabrics. An
experiment for comparing ball milled white denim and ball milled blue denim was carried out to
investigate the conversion efficiency under the same conditions.
Enzymatic conversion of BBD was also investigated at 5 % DM with 4 mg Cellic® CTec2 per g glucan.
Conversion of BBD into glucose (Figure 4.5.4) was 47 ± 2.3 % after 4 hours, 97.8 ± 0.5 % after 24 hours
and 102 ± 2.8 after 48 hours. In the same experiment, BWD was converted with 39.7 ± 0.6 %, 80.0 ±
0.2 % and 90 ± 3.2 %.
0
10
20
30
40
50
60
70
80
90
100
0 24 48 72 96
Co
nver
sio
n (
%)
into
glu
cose
Time (hrs)
BWD + AscA
BWD - AscA
Avicel + AscA
Avicel - AscA
WD + AscA
WD - AscA
Figure 4.5.3 Conversion of cotton substrates and Avicel by Cellic® CTec2, with and without ascorbic
acid (2 mM). Glucose is measured by HPLC. Enzyme loading was 4 mg protein per g glucan, pH 5.0
and 5 % dry matter content.

50
4.6. TaLPMO9A reactions
As already noted, addition of LPMOs to cellulose hydrolysis reactions has been shown to increase the
conversion rate of the reaction. It was therefore of interest to investigate whether the cotton textile
substrates were good substrates for LPMOs. In order to achieve such an analysis, the purified,
recombinant LPMO, TaLPMO9A from the fungus Thermoascus auraantiacus was used in reactions
with cotton textile substrates. All denim substrates (WD, BWD, BD and BBD), Avicel and phosphoric
acid-swollen cellulose (PASC) were incubated with TaLPMO9A and ascorbic acid as electron donor.
4.6.1. Detection of oxidized oligosaccharides
Reaction products were analysed by MALDI-TOF. For the white denim substrate that was not ball
milled, no peaks associated with oxidized cello-oligosaccharides were identified. Assigned mass values
in the spectra are presented with the associated compounds in Table 4.6.1.
0
10
20
30
40
50
60
70
80
90
100
0 24 48
Co
nver
sio
n (
%)
into
glu
cose
Time (hrs)
BBD
BWD
Figure 4.5.4. Conversion of BWD and BBD into glucose by Cellic® CTec2, measured by
HPLC. Enzyme loading was 4 mg protein per g substrate, ascorbic acid concentration 2
mM, pH 5.0 and 5 % dry matter content.

51
The ball milled substrate showed several m/z signals that might represent oxidized cello-
oligosaccharides were observed (Figure 4.6.2). Due to the large background noise caused by the
MALDI-TOF matrix in the low m/z region (up to m/z~ 400), products with an expected mass higher
than 900 (i.e. DP higher than 6) were analysed. The mass spectrum resulting from LPMO activity on
BWD (Figure 4.6.1), BBD (Figure 4.6.2), BD (Figure 4.6.4), Avicel (Figure 4.6.5) and PASC (Appendix
S-7) contained peaks of mass per charge that correspond to the adducts of certain oxidized
oligosaccharides, which structures are shown in Table 4.6.1.a. Spectra of substrate WD contained no
such peaks (Figure 4.6.3). Lithium adducts are not included in the assessment, as Lithium is assumed
not to be present in the reactions. The mass of a C1 oxidized lactone is equal to the mass of the C4
oxidized ketoaldose of the same DP, and geminal diols are equal to the aldonic acids of the same DP.
Lactones and geminal diols are not assigned, as the equilibrium lies towards the aldonic acid and keto
aldose sides of the reactions (pH~6.5).
Figure 4.6.1.1:. MALDI-TOF analysis of oxidized products in BWD. The figure shows mass spectrum of ball
milled white cotton treated with TaLPMO9A in pH=6,5, 45°C at 1 000 rpm for 20 hours.

52
Figure 4.6.1.2: MALDI-TOF analysis of oxidized products in BBD. The figure shows mass spectrum of BBD
treated with TaLPMO9A in pH=6,5, 45°C at 1 000 rpm for 20 hours.
Figure 4.6.1.3: MALDI-TOF analysis of oxidized products in WD. The figure shows mass spectrum of white denim
fabric treated with TaLPMO9A in pH=6,5, 45°C at 1 000 rpm for 20 hours.

53
Figure 4.6.1.4: MALDI-TOF analysis of oxidized products in BD. The figure shows mass spectrum of blue denim
fabric treated with TaLPMO9A in pH=6,5, 45°C at 1 000 rpm for 20 hours.
Figure 4.6.1.5. MALDI-TOF analysis of oxidized products in Avicel. The figure shows mass spectrum of Avicel treated
with TaLPMO9A in pH=6,5, 45°C at 1 000 rpm for 20 hours.

54
DP m/z Structure Referred to as
6 1011.8
[Glc4KGlc5+Na]+
6 1027.9 [Glc4KGlc5+K]+
6 1029.8
[Glc5Glc1A+Na]+
6 1045.9 [Glc5Glc1A+K]+
6 1052.8 [Glc5Glc1A-
H+2Na]
7 1173.9
[Glc4KGlc6+Na]+
7 1190.0 [Glc4KGlc6+K]+
7 1191.9
[Glc6Glc1A+Na]+
7 1208.1 [Glc6Glc1A+K]+
7 1214.9 [Glc6Glc1A-
H+2Na]
8 1336
[Glc4KGlc7+Na]+
8 1352.2 [Glc4KGlc7+K]+
DP m/z Structure Referred to as
6 1013.8 [Glc6 + Na]+
6 1029.9 [Glc6 + K]+
7 1176
[Glc7 + Na]+
7 1192 [Glc7+K]+
8 1338
[Glc8 + Na]+
8 1354.2 [Glc8+K]+
Table 4.6.1.a Structure of oxidized cello-oligosaccharides indicated by mass spectra to be present in
reactions where cotton substrates were incubated with TaLPMO9A in pH=6,5, 45°C at 1 000 rpm.
b. Structure of native cello-oligosaccharides indicated by mass spectra to be present in reactions where
cotton substrates were incubated with TaLPMO9A in pH=6,5, 45°C at 1 000 rpm. Because 𝑚(𝐾+) =𝑚(𝑂2−) + 𝑚(𝑁𝑎+) = 39 𝑔/𝑚𝑜𝑙, the mass of any aldonic acid-sodium adduct equals the mass of the
corresponding potassium-native adduct (e.g. m/z=1192).

55
4.6.2. Comparing quantities of oxidized dimer in substrates
HPAEC-PAD was used to separate native cello-oligosaccharides and oxidized sugars in the reactions
containing textile cotton substrates and TaLPMO9A. Figure 4.6.2 shows the separation of soluble
oligosaccharides coming from reactions with in BWD, WD, BBD, BD, PASC, Avicel, compared to a
standard of oxidized cellobiose (i.e. the geminal diol with DP 2 at pH 13 in this analysis) and native
oligomers of DP 2-5. The ketoaldose from the standard was eluted after 25 minutes. The peaks
corresponding to native oligomers and peaks that most likely correspond to oxidized products of higher
DP were significantly more intense for PASC than the few peaks separated for textile substrates.
Figure 4.6.2 a. Analysing for oxidized dimer by IEC. HPAEC-PAD chromatograms of BWD, BBD,
WD, BD, Avicel and PASC treated with TaLPMO9A in the presence of ascorbic acid, at pH=6,5,
45°C and 1 000 rpm for 20 hours.
Figure 4.6.2 b. The peaks corresponding to oxidized oligosaccharides in samples with TaLPMO9A
and controls.

56
5. Discussion
The objective of this study was to investigate the hydrolysis efficiency of cotton textiles pretreated by
ball milling. The substrates were initially characterized by a compositional analysis determining
cellulose, ash and water content. The hydrolysis yields of two commercial enzyme cocktails were
investigated, including several experiments to optimize the method for obtaining high conversion with
low input (costs and chemicals) by decreased enzyme loading and increased dry matter. In order to avoid
interfering factors present in the cotton textile, the experiments were initially done with a white cotton
fabric from a denim garment of pure cotton. Later, we wanted to investigate whether cotton from denim
coloured by indigo showed similar conversion yield, due to indications of affinity between indigo and
cellulases in the literature and differences in the production of denim fabrics. Finally, reactions with
LPMO as the sole enzyme activity were conducted and analysed qualitatively to observe whether
significant LPMO activity occurs in the degradation of the textiles. The main aim of the present MSc
project was to develop an efficient method for enzymatic conversion of cotton cellulose to glucose.
5.1. Substrate composition
In order to assess accuracy of this study, the laboratory standard Avicel was included in the
compositional analysis for glucan quantification as well as the enzymatic hydrolysis. Avicel is assumes
to consist of pure cellulose (Gupta & Lee 2009; Jeihanipour & Taherzadeh 2009) or nearly pure cellulose
(Yang et al. 2006) in the literature. More specifically, the glucan content Avicel PH-101 has been
determined to 92.2 %, with 2.1% xylan, 0.9 % % lignin and 0.1 % mannan, as percentage of total solids
(Chylenski et al. 2017b). In this study, the glucan content of Avicel PH-101 was determined to 92.5 ±
0,5 % of total solids (Figure 4.1). Lignin and hemicellulose content was not determined because the
cotton textiles are assumed to not contain lignin nor hemicellulose. The glucan content given as
percentage of total sample weight was determined to be 96,8 % in Avicel PH-101 (Peciulyte et al. 2017).
Similarly, 95.6 ± 0.5 % was the fraction of total sample weight in this analysis (Table 4.1). The accuracy
of glucan content determination might be influenced by errors in practical weighing, pipetting of
samples or the quantification by HPLC (e.g. the dilution of calibration standards). Additionally, the
batch differences are unnkown. The determination of total solid contents of the substrates also has an
impact on the glucan content when the calculations of glucan content (Equation 3.2.2) are based given
as percentage of total solids. The accuracy of the glucan quantification in this analysis is assumed to be
sufficient based on the high siilarity of the determined values with values found in the literature.
The compositional analysis included white denim fabric (WD), ball milled WD (BWD), blue denim
fabric (BD) and ballmilled BD (BBD). The glucan content (fraction of total solids) of WD and BWD
were determined to 91 ± 2.4 % and 96 %, respectively. The determination was carried out with WD and

57
calculated separately according to the different total solid contents. The content of total solids in the
substrates were 97,4 ± 0,2 % and 93 ± 2 % for BWD and WD, respectively. Likewise, the glucan content
was 88 ± 0,1 % and 88,7 for BD and BBD, and the total solid contents 96.0 ± 0.1 % and 95.4 ± 0.2 %,
respectively. The glucan content and the total solid content of each substrate is used to set up enzymatic
conversion experiments and to calculate the conversion yields. First, the total solids content was used to
ensure the right dry matter content (DM) in reactions (for details, see Appendix S1- S7). The DM is
further used in the calculations of conversion yield (Equation 3.6.3.2), where the glucan content is also
a variable in the formula. From the glucan quantification, the standard deviations give an uncertainty on
the second numeral digit for both textile substrates. The standard deviations give a rather small effect
on the further calculations for all except BWD. The high standard deviations in total solid content after
ball milling were most likely due to irregular absorbance of water. The accuracy of enzymatic
conversion yields might be more reduced for BWD than the other substrates due to higher uncertainty
in total solid content. The uncertainty of glucan and water contents in the textile and the variation in
enzymatic conversion yield within a triplicate was assumed to account for the same range of dispersion.
However, the accuracy of conversion yields might be affected from the dispersion, because the total
solid and glucan content determined in the compositional analysis are used to set up and to calculate
yields for the enzymatic hydrolysis experiments. The standard deviation for cellulose content in Avicel
is 0,5 %, which indicated that the higher standard deviations in the cotton substrates are not due to
analysis method, but rather due to irregularities in the material. The accuracy of the analysis can be
assessed by comparison with the literature. However, it is likely that denim fabrics vary in composition
due to differences in production and in the source of the raw cotton. The cellulose content of blue denim
fabric has previously been estimated to be 93 ± 1 % (of total solids) by a determination protocol with
small differences to the protocol applied in this work (Jeihanipour & Taherzadeh 2009; Ruiz & Ehrman
1996; Sluiter 2012). The cellulose content obtained by Jeihanipour and Taherzadeh is higher than what
was determined for blue denim fabric in this study (89 ± 1.5 %). Whether the difference is caused by
differences in the textile composition or analytical errors is unknown, it might also be a combination.
The ash content of the substrates is not known to have any impact on the enzymatic hydrolysis. In the
present study, ash content was determined to study the differences of the cotton substrates, and in order
to determine the mass balance. Other, unidentified compounds, account for 6 -7 % of total sample weight
in both substrates.

58
5.2. Conversion of cotton textiles by commercial cocktails
5.2.1. Enzyme loading
Ball milled white cotton was converted into glucose and cellobiose by Cellic CTec2 and Celluclast®
at 5 % DM for 48 hours, using 2 mg, 4 mg, 8 mg, 12 mg, 16 mg and 20 mg protein per g glucan in
substrate. A low loading of enzyme is beneficial in industrial appliance, since the enzyme component
usually represent the highest expense in industrial conversion of cellulosic biomass (Barakat et al. 2013).
Conversion over 80 % are often considered as industrially acceptable minimum yields, e.g by the
National Renewable Energy Laboratory, NREL (Chylenski 2017).
Celluclast® converted BWD into glucose and cellobiose, resulting in approximately equal amounts of
the two products at 2 mg enzyme loading (Table 4.3). At loadings higher than 4 mg, the trend observed
was a decrease of the dimer and an increase of the monomer, likely to be caused by enzymatic cleavage
of cellobiose into glucose by β-glucosidase activity. This indicated a low content of β-glucosidases
(BGs) in Celluclast®, which has previously been shown in several studies (Cannella et al. 2012;
Peciulyte et al. 2015; Rodrigues et al. 2015). Moreover, Rodrigues and colleagues also demonstrated
that the BGs of Celluclast® are less stable under the given reaction conditions than the BGs in Cellic®
CTec2. Higher loadings of the cocktail necessarily provide more BGs, which seemed to cause the
decreasing and almost linear trend of cellobiose concentration. Total conversion increased from 60% to
89% for the lowest loadings. Likewise, conversion into glucose increased from 28% to 61%. The glucose
concentration and the total conversion increased until 12 mg loading that gave 96 ± 2 % total conversion.
Higher loadings did not show significant increase in conversion, neither what regards total conversion
nor glucose production, as shown in Figure 4.3.2. When degrading BWD with 20 mg enzyme loading,
relatively large standard deviations were observed (the total conversion yield was calculated to be 86 ±
14%, see Table 4.3). One of the replicates (66%) had a calculated yield significantly lower than the two
other replicates of the same triplicate, and lower than the calculated average values representing lower
enzyme loadings. Assessing the lower replicate yield as an outlier would give an average yield of 96 ±3
% (instead of 86 ± 14%) for 20 mg enzyme loading, which corresponds well to the assumption that a
maximal conversion yield indicated at 12 mg loading does not decrease by increasing the loading.
However, the two remaining replicates alone are believed to not represent the dispersion and all three
replicates are kept.
In order to select an enzyme loading value for time course hydrolysis experiments with Celluclast®, 8
mg loading was selected, for two reasons. Firstly, because the industrially preferred 80 % conversion
yield was reached using this loading (Figure 4.3.2), considering both glucose and cellobiose. Secondly,
it was interesting to investigate whether 61 ± 2 % glucose yield would increase up to 80 % with time
under a consistent enzyme loading. Further investigation of lower Celluclast loadings with additional
BGs might be of interest for further research.

59
In the experiment determining the optimal enzyme loading of Cellic CTec2 for BWD, 4 mg Cellic
CTec2 per g glucan resulted in satisfactory yields (i.e. over 80 % conversion, more specifically 88 2
% (Figure 4.3.1). Moreover, the incline of the conversion curve had a decrease between 4 and 8 mg
loading, clearly illustrated by the fact that increasing the loading by double give approximately 5 %
higher conversion, while increasing by the same factor from 2 to 4 mg gave 32 % higher conversion.
For these two reasons, 4 mg Cellic CTec2 per g glucan was selected for further hydrolysis experiments.
A trend similar to the dose-response curve in Figure 4.3.1 has been seen in degradation of pretreated
Norway spruce and sugarcane bagasse, where analysis at 5 % DM for 48 hours has been investigated by
2 mg, 4 mg, 6 mg, 8 mg, 10 mg, 16 mg and 20 mg Cellic® CTec3 per g glucan (Chylenski et al. 2017a).
When increasing from 2 mg to 4 mg loading, the conversion of substrate into glucose was doubled for
spruce and increased with almost 50 % for sugarcane bagasse. The incline of the loading curve decreased
at the higher loadings in the degradation of pretreated lignocellulosic biomass with Cellic® CTec3,
which is claimed by the producer to have a 1.5 times performance in conversion of hemicellulose and
cellulose to fermentable sugars (Novozymes). The pretreatment utilized for Norway spruce and
sugarcane bagasse
5.2.2. Effect of pretreatment
The reactions with 5% DM and 8 mg/g loading of Celluclast® resulted in significantly higher conversion
of BWD than WD (Figure 4.4). Total conversion of BWD substrate was 19-fold higher than for WD,
calculated as an average of the ratio for each time point (Table 4.4 a). At the time point where total
BWD conversion normally exceeds 80 % (after 48 hours), the yield of BWD conversion was 17- fold
higher than the conversion of WD. Glucose production was also more efficient for the ball milled
substrate, although the ratios are smaller (Table 4.4 b). At most, the ratio of WD:BWD was 1:13, which
was observed after 48 and 96 hours hydrolysis. Cellic® CTec2 gave on average 21-fold higher
conversion for the cotton when it was ball milled (Figure 4.5 and Table 4.5). After 24 hours 80 %
conversion is exceeded. At this time point, the ratio is 1:25. Ball milling of this denim fabric (WD)
unambiguously increases the saccharification by both enzyme cocktails under the given conditions.
In 1974, waste cotton among other residues were digested by Trichoderma viride (Mandels et al. 1974)
with the aim to convert cellulosic waste into glucose and to use cellulosic waste as medium to produce
cellulases. For the cotton samples, the conversion yield ranged from 2-92 %. The most efficient
pretreatment for enhanced enzyme susceptibility was ball milling. Fibrous cotton waste was converted
without and with ball milling as pretreatment, where the cotton had a conversion yield 5-fold higher
after milling (55 % compared to 10 %). Despite lack of information of the cotton type and structure as

60
well as information about the ball mill type, the trend is clearly in accordance with the results presented
in this work. Avicel was converted under the same conditions, with a conversion yield of 33 %.
Jeihanipour & Taherzadeh converted cotton from blue jeans at 3% DM with 20 FPU Cellulases and 30
IU BGs per g cellulose for 48 hours (Jeihanipour & Taherzadeh 2009). They found that pre-treatment
was necessary to achieve a conversion into glucose higher than 23,6 %. Avicel was converted 39 % into
glucose at the same time point and under the same conditions. They describe the cotton samples as
“shredded and ground to small size”, and the cellulose content was determined to be 93 ± 1 % before
pretreatment. In order to increase the conversion, they pretreated the cotton with phosphoric acid and
sodium hydroxide at 0°C, 23°C and 100°C for 3 hours, which increased the conversion up to 99 %
(based on the cellulose content after pretreatment). The solvent NMMO was later applied as
pretreatment for blended (50/50) cotton and polyester fibres, where the cellulose was converted up to
95,8 % after 48 hours by the same enzymes and loading at 5% DM (Jeihanipour, A. et al. 2010). The
textile substrate was cut to small pieces of approximately 9 cm2 prior to pretreatment. Enzyme activity
studies were not a part of investigating enzymatic conversion of WD and BWD in the present study, and
the activity of the applied enzyme cocktails is unknown. However, based on other batches of the same
cocktails, information about enzyme activity might be used as rough estimates. 4 mg/g glucan of Cellic®
CTec2 corresponds to a cellulase (EG and CBH) activity of 3 FPU per g glucan and a BG content of 68
U per g glucan (Cannella et al. 2012). A loading of 8 mg/g glucan Celluclast® is likewise estimated to
4 FPU per g glucan and a 1 U of BG per g glucan. The loading of enzymes appears to have been
significantly higher in the experiments of Jeihanipour & Taherzadeh than for experiments with the two
cocktails used in the present study.
Cellic® CTec2 has also been used to degrade cotton gin dust and cotton gin waste (Fockink et al. 2015).
The dust and waste removed from cotton at this initial step of textile production contains recalcitrant
lignin and hemicellulose, which might hamper efficient hydrolysis. Alkaline pretreatment was used to
reduce the lignin content in the biomass and increase the glucan content. The hydrolysis was carried out
with the pretreated substrates containing 89 % (CGD) and 81 % (CGW) glucan and an enzyme loading
of 85 mg per g DM. After 96 hours, the conversion of the substrates was 54 % at the most. This was the
CGD with the most severe pretreatment (4 % NaOH at 120 °C) at 15 % DM, which decreased lignin
and hemicellulose the most. The enzyme loading was 76 mg per g cellulose for the CGD, which is a
tenfold higher than the loading applied on cotton textiles in this thesis. CGD contains short fibres
recovered from filter screens during the ginning process, and might be or varying particle size. The
difference in enzyme loading needed to convert CGD and BWD may be a consequence of differences
in available surface area (i.e. particle size). It is possible that a reduction in particle size would result in
lower required Cellic® CTec2 loading per glucan concentration. It is also possible that further
decreasing or even removing the content of lignin and hemicellulose could have the same effect, possibly

61
conducted by more severe alkaline pretreatment or by utilizing hemicellulases and enzymes degrading
lignin.
In the present study, ball milling of the white cotton substrate resulted in a powder measured to have a
size distribution with sauter mean diameter of 12,5 µm (see Table 4.2). Sofla and co-workers extracted
cellulose from lignocellulosic biomass by chemical and mechanical treatment, resulting in nanocrystals
and nanofibrils, respectively (Sofla et al. 2016). The mechanical treatment was carried out under wet
conditions in a shaker mill, which is a vibratory ball mill. The frequency of impact between balls and
sample is higher for the shaker mill, while the speed of the balls is higher for the planetary mill.
(Aliofkhazraei 2015; Li 2016). In the comparative analysis of Sofla et al., they extracted cellulose from
lignocellulosic biomass (sugarcane bagasse) by chemical and mechanical treatment, resulting in
cellulose nanocrystals (CNC) and nanofibrils (CNF), respectively. The size of CNC was 160-400 nm in
length and 20-30 nm in diameter, while CNF had length about 2000 nm and diameter of 50 nm. Sofla
et al. also measured the crystallinity by X-ray powder diffraction and compared with lignocellulose and
extracted cellulose and found that the crystallinity was not reduced after ball milling by comparing CNF
and purified cellulose. If this is the case for cotton milled in a planetary ball mill, the increased enzymatic
digestibility of the substrates is not due to change in crystallinity. Sofla and colleagues along with other
researchers, saw that crystallinity of CNC increases due to chemical remove of amorphous cellulose.
This might explain why the ball milled cotton was more efficiently degraded than microcrystalline
cellulose Avicel in the time course experiments in the present study, although the mill differs and the
treatment of Avicel is not available. Other studies have shown a reduction in crystallinity of cellulose
after ball milling (Barakat et al. 2013).
It is apparent that ball milling of cellulosic substrates results in a reduction in particle size and a
concomitant increase in productive binding sites for cellulolytic enzymes (Nakagawa et al. 2011;
Suckling et al. 2017).
Considering the large effect of ball milling on the conversion yields obtained in this study, and assuming
cellulase loading in this study and in the literature is comparable, the results presented in the present
MSc thesis indicate that planetary ball milling is a pretreatment capable of increasing enzymatic
digestibility of cotton textiles as much as the discussed solvents (phosphoric acid, sodium hydroxide
and NMMO).
5.2.3. Effect of increased dry matter in reactions
Increasing the dry matter content in enzymatic hydrolysis is beneficial in industrial process because it
reduces the costly downstream process of water removal and more substrate can be converted per
volume and per time. On the other hand, products and other compounds have been seen to inhibit

62
enzymatic hydrolysis at high substrate loadings and mixing of the reactions might in some reactions be
hindered from increased viscosity.
An experiment with BWD of various dry matter contents was set up to compare the conversion yield.
Without increasing the enzyme loading, the conversion of cellulose from BWD was investigated and
compared at 5 %, 10% and 20% DM. Figure 4.5.2 shows the conversion of BWD into glucose and
cellobiose after 4, 24, 48 and 96 hours. The difference between the conversion yield of reactions at
different dry matter content is small compared to the difference of substrate concentration. After 96
hours, a 4-fold increment of the substrate concentration gives a conversion yield without significant
decrease.
Several experiments have been successful in finding a pretreatment compatible with increasing the dry
matter of enzymatic hydrolysis reactions. Rana and colleagues (Rana et al. 2012) investigated the
digestibility of loblolly pine pre-treated by wet oxidation and steam explosion by Cellic® CTec2. One
of the main objectives in that study was obtaining high yields of glucose with increased dry matter
content in reactions. The glucan content of the pretreated substrate was 50 % of the total solids. Rana
and colleagues achieved the highest conversion yield seen for loblolly pine, with 96 % conversion at 25
% dry matter in reactions, when applying Cellic® CTec2 at a loading of 60 mg per g cellulose, which
is 15-fold higher than the loading that gives equal conversion of the textile substrates in this study.
However, 25 % DM in reactions of ball milled cotton textiles is not investigated. Assuming assessments
regarding pretreatment are correct, these results suggest that the loading of Cellic® CTec2 needed to
convert high substrate concentrations of cotton textiles is significantly lower than for pine, when optimal
pretreatment is applied.
When Fockink and colleagues degraded cotton gin dust with dilute alkali pretreatment, they compared
dry matter contents of 5 % (pretreated with 2 % NaOH) and 15 % (pretreated with 4 % NaOH) in
reactions, with a loading of 85 mg Cellic® CTec2 per g dry matter (Fockink et al. 2015). For the two
dry matter contents, the conversion yield was 49 % and 54 %, respectively. It is difficult to say whether
product concentration mattered significantly as inhibiting factors or whether lignin and hemicellulose
were the main cause of limiting the conversion. However, their results indicate higher conversion at 15
% DM than at 5 % DM, indicating that inhibition from high substrate concentrations was not an issue.
Experiments with high dry matter content in conversion of cotton textiles have seemingly not been
published.
It is not known in which degree conversion per time changes in further increasing DM (over 20 %) when
converting ball milled cotton textiles. The viscosity in reaction solution might increase and reduce the
mass transfer rate of the cellulases. However, it is likely that if DM and enzyme loading are increased,
the conversion might remain higher than 80 % until a certain point. It would be interesting to investigate

63
this further. Additionally, a financial analysis should be carried out to assess the costs of increased
loading and the potential cost reduction of high substrate concentration.
5.2.4. Comparison of blue and white denim fabric
Blue denim makes up a major part of textiles produced, hence a large part of landfilled and/or incinerated
textiles are composed of this material. Affinity between indigo and cellulases has been indicated
(Campos et al. 2000), but the literature lacks information on whether indigo has impact on hydrolysis of
textiles by cellulases. Another difference between blue and white denim, is that coloured denim
undergoes mercerization, which changes the crystallinity of the cellulose (from type I to type II, see
section 1.2.2 for more information). The crystallinity type and index are not known for the substrates in
this study. However, it is likely that a white denim fabric contains more cellulose type I while blue
fabrics consist of more cellulose type II because of mercerization which is a key step for dye absorption
during the production. For these reasons, it was of interest to investigate whether processing and
hydrolysis differed when comparing blue denim and white denim. The experimental strategy to
investigate this was comparing conversion yield of 5 % DM of BWD and BBD with 4 mg loading of
Cellic® CTec2 per g glucan. The results from this experiment are illustrated by Figure 4.5.4. Conversion
yields of BBD after 4, 24 and 48 were significantly higher than the conversion yields of BWD under the
same conditions at the same time points. This is an indication that the presence of indigo had no
inhibiting effect on the hydrolysis reactions.
The results shown in Figure 4.5.4 further indicate that indigo coloured denim fabrics are more digestible
than white denim fabrics. It should be noted that the particle size distribution was different for BBD and
WD (Figure 4.2). The surface area moment mean was lower for BBD than for BWD, which might be
the explanation for increased accessibility for enzymes. The volume/mass moment mean, however, was
slightly higher for BBD than for BWD. This is most likely due to different densities of the substrates,
which is unknown. If the higher digestibility is partly due to the supramolecular structure of the cellulose
is not known, but mercerization of cotton yarn has previously been shown to enhance accessibility for
cellulases (Gisela & Zeronian 1994). Cellulase mechanisms and the correlation between cellulase
hydrolysis and supramolecular structure of cellulosic materials are not fully understood (Peciulyte et al.
2015). Further experiments for investigating the significance of the modified crystal structure from
mercerization in enzymatic conversion of ball milled cotton textiles might measure the crystallinity,
whereas one technique is in fact based on protein binding methodology where cellulose-directed
carbohydrate-binding modules are used to indicate degree of cellulose crystallinity (Kljun et al. 2011).
Another strategy could be to investigate digestibility of cotton textiles before and after mercerization.
5.3. Effect of lytic polysaccharide monooxygenases on cotton substrates
Activity assays followed by mass spectrometry demonstrated that TaLPMO9A produced several
compounds corresponding to m/z values of oxidized oligosaccharides from BWD (Figure 4.6.1.1) and

64
Avicel (Figure 4.6.1.5). The dominant peak signals observed indicated ketoaldoses of cellohexaose
(Glc5Glc4K), celloheptaose (Glc6Glc4K) and cellooctaose (Glc7Glc4K) as well as the native forms of
these (Glc6-Glc8). There were also clear indices on presence of aldonic acid of the same oligosaccharides
(Glc5Glc1A, Glc6Glc1A and Glc7Glc1A). Because the sodium adduct of any aldonic acid of an
oligosaccharide has equal mass values to the potassium adduct of the native oligosaccharide (Table
4.6.1), only the potassium adducts are assessed as clear indications of oxidized products. Another
indication of LPMO activity for BWD and Avicel, is that the signals detected for native oligosaccharides
in potassium- and sodium adducts were not detected in substrate controls without enzyme. The spectra
of BWD and Avicel were similar, i.e. the same m/z values were detected with relatively similar
intensities. Although this is not a quantitative analysis, the similarity of the spectra of BWD and Avicel
indicates a similar LPMO effect on the two substrates. Avicel has previously demonstrated to be a
compatible substrate for LPMOs (Chylenski et al. 2017b).
Detected peak signals in BBD (Figure 4.6.1.2) associated with oxidized oligosaccharides were fewer
with less intensity. Ketoaldoses of cellohexaose, celloheptaose and cellooctaose and the native forms of
these were detected, while aldonic acids were not detected. The C1-oxidizing activity of TaLPMO9A
has previously been observed to be lower than the C4-oxidizing activity (Petrović unpublished). The
reason why the activity on C1 seems to be absent for BBD is unknown. For BD (Figure 4.6.1.4),
however, an aldonic acid of celloheptaose, as well as the ketoaldose of cellooctaose were observed. For
WD (Figure 4.6.1.3), one signal peak associated with native and oxidized oligosaccharides was detected
(ketoaldose of cellooctaose) with weak intensity in only one replicate. There is no indication that this
was a product arising from LPMO activity. Oxidized oligosaccharides were expected to be produced
from phosphoric acid swollen Avicel (PASC), as previously shown by Petrović and co-workers. Signals
corresponding to oxidized and native peaks were clear in spectra from PASC, including aldonic acids
and ketoaldoses (see Appendix S9). The acid swelling treatment is changing the cellulose
microstructure, by halving the DP, severely decreasing the crystallinity and increasing the surface area
per volume (SSA) (Andersen et al. 2008).
From the separation of dimeric ketoaldose from all textile samples, Avicel and PASC, the only signals
that were sufficiently higher than the noise (S/N seemingly higher than standard deviation), were for
PASC, Avicel, BWD and BBD Figure 4.6.2). The reactions were not hydrolysed by cellulases in order
to enhance production of dimers for neither substrates. Nevertheless, all replicates showed significantly
higher peaks for PASC (Appendix S9) than all other substrates, included Avicel, for which peaks of
approximately the same intensity as BWD and BBD were separated.
It is apparent that TaLPMO9A had an effect on BWD, BBD and BD, while activity on WD is not clearly
indicated in this study. It is known that ball milling decreases DP (Sofla et al. 2016) and increases SSA
(Peng et al. 2013). Crystallinity has been seen to change and to remain unchanged, depending on type

65
of material and analysis method. Higher LPMO activity on PASC than Avicel might have the same
explanation as the observed higher activity on milled denim fabric than un-milled denim fabric. Overall,
the results (from Section 4.6) suggest that substrate availability, in BWD, BBD, Avicel and PASC
enhanced by small particle size and associated high specific surface area, enhances LPMO activity.
5.3.1. Effect of ascorbic acid in Cellic® CTec2 reactions
An experiment with 4 mg loading of Cellic® CTec2 and 5 % DM was set up with WD, BWD and Avicel
in the presence and absence of ascorbic acid. The aim of the experiment was to investigate whether the
hydrolysis of the textile was enhanced by addition of ascorbic acid, which has importance for
understanding the significance of LPMOs present in the cocktail for the specific substrates.
When comparing the results obtained from reactions with and without ascorbic acid, the ball milled
cotton substrate displays slightly higher conversion without ascorbic acid at 24 hours, while the
conversion does not differ significantly at the other time points (Figure 4.5.3). The scissor cut cotton
does not show different conversion in reactions with and without ascorbic acid. Avicel shows a higher
conversion when ascorbic acid is applied, which is in agreement with previous studies (Chylenski 2017).
There are two possible explanations for why the presence of ascorbic acid makes a difference for Avicel
saccharification and not for the cotton substrates. Firstly, it is possible that the denim fabric for unknown
reasons is not a compatible substrate for the LPMOs in the cocktail, and therefore do not need any
reducing agent, while Avicel does. Secondly, the substrate might contain a reductant, being any product
capable of providing the reaction with molecular oxygen or hydrogen peroxide.
5.4. Comparison of enzyme cocktails
Ballmilled cotton from white denim fabric was converted 80 % of theoretical yield of glucose with
Cellic® CTec2 when applying minimum 4 mg enzyme per substrate over 24 hours, under the given
conditions. Celluclast® converted the same substrate with 80 % when the loading was 8 mg and
hydrolysis went on for 96 hours. Even though an increase of enzyme loading seems to approach 80 %
conversion, the results indicate that time is the crucial requirement for this combination of enzyme
cocktail and substrate.
Enzymatic activity of the two cocktails was measured by Canella and colleagues, and it appeared that
that the BG content in Celluclast® was 1,0 U and 68 U, respectively (Cannella et al. 2012). According
to what they found, BG are barely present in low doses of Celluclast®. The activity (FPU/g) of EGs and
CBHs in Celluclast® was approximately 65 % of the activity in Cellic® CTec2. The results of Canella
and co-workers might not be valid for the cocktail batch used in this thesis, although used as a rough

66
estimate, they correspond well to the main difference when comparing textile conversion yields by the
two cocktails. A low BG content in a cellulase cocktail increase the content of cellobiose relative to
glucose in the reactions, which is thought to inhibit hydrolysis significantly (Kristensen et al. 2009;
Tolan, J. S. 2002)
Another difference in the composition of the two cocktails, is the ability of oxidative cleavage in Cellic®
CTec2. Cannella et al. reported a decrease in BG activity from C1-oxidized sugars due to slow rate of
the cleavage of cellobionic acid, giving slower production of glucose. The substrate analysed was
pretreated wheat straw, and they saw an overall synergistic effect of the LPMO content in Cellic®
CTec2, despite the inhibition. For the ball milled cotton, Cellic® CTec2 gives equal conversion with
and without ascorbic acid, indicating that the LPMO activity is small or absent. Reactions from the
experiment were not analysed for gluconic acid and cellobionic acid, but the inhibiting effect is not
likely to occur/be a significant obstacle for efficient conversion.
5.5. Feasibility and further research
This study has focused on denim fabrics as a representative cotton textile for conversion to glucose by
ball milling and enzymatic hydrolysis. Several aspects regarding feasibility and financial viability are
not discussed here. One important limitation to highlight is the potential difference between laboratory
scale and industrial scale. The ball mill used throughout this study has a nominal volume of 500 mL,
which is strictly limited to utilization in laboratory scale. Investigation of cotton textile milling in larger
ball mills would be necessary research for assessing the feasibility of the method. What regards
conversion of 10 % or 20 % dry matter, the use of a thermomixer was a sufficient stirring method in the
lab, while upscaling might lead to difficulties or high costs for mixing the reactions well when the
viscosity increases. The representability of denim for all cotton textiles might be inaccurate. In order to
apply the method industrially, it would be necessary to investigate ball milling and digestibility by the
enzyme cocktails for several types of cellulosic textiles, as well as textiles of blended fibres, which often
contains non-degradable polymers (Hasanzadeh et al. 2018). Indications that ball milling of cotton
textiles increase accessibility for LPMOs potentially means that less intensive or shorter time of milling
combined with LPMO rich enzyme cocktails might be an alternative to the suggested method, which
remains to be investigated.
A major obstacle for viability of enzymatic conversion of lignocellulosic biomass is the costs of the
enzymes (Merino & Cherry 2007). Cellulase cocktails of higher cost-efficiency might be developed as
a consequence of intensive research on the field. Since the enzymes in a cocktail work collectively in
the cellulose conversion, improved enzyme composition for an optimal synergy is a key to increase
efficiency and lowering costs. Producing substrate-specific cocktails might also be beneficial, for
instance an LPMO-free cocktail might be a cheaper and equally efficient alternative for cotton textile

67
conversion. Optimal synergy in a cocktail might reduce the need for pre-treatment of cotton textiles
before enzymatic conversion. Recycling the cellulases has been discussed as a strategy to reduce the
costs (Gomes et al. 2018). Recycling of Celluclast® was studied by Gomes and co-workers and assessed
to be efficient during 4 rounds of hydrolysis of 22 % DM of paper sludge in reactions, when 50 % of
the utilized enzyme cocktail was fresh and 50 % was recycled. Cellic® CTec2 was significantly more
difficult to recycle, which was previously showed by Rodrigues and co-workers (Rodrigues et al. 2015).
Figure 5.4 illustrated possible pathways of pathways to produce biofuels, power and heat from biomass.
As illustrated in the Figure, denim fabric degradation has also been investigated as a substrate in biogas
production, which is a method of biomass conversion also based on digestion of biomass by hydrolysis,
followed by further conversion (acidogenesis, acetogenesis and methanogenesis) into methane. The
products are valuable as biofuels and generation of power, while the solid residues make a good
alternative to conventional agricultural fertilizers.
Figure 5.4. Schematic view of value-added production from first and second generation fuels. Utilization of
cotton textiles from the industry and from municipal by-products might be produced into power and heat by
several pathways. The method studied in this thesis belongs to the category marked green. Figure source:
Food and Agricultural Organization of the United (FAO 2004).

68
The initial step in biogas production from cotton textiles is reducing the cellulose crystallinity by
pretreatment. Alkaline treatment of cellulose is known to enhance digestibility of crystalline cellulose
by a change in the crystal structure. Sodium carbonate may be used for avoiding the corrosive effects of
strong alkali (Hasanzadeh et al. 2018). NMMO has been assessed as a good alternative to the other
solvents because of high potential for recycling of the solvent and none indicated corrosive or hazardous
effects. Sodium bicarbonate pretreated denim fabric and NMMO pretreated denim fabric have been
converted to biogas with high yields (Hasanzadeh et al. 2018; Jeihanipour, Azam et al. 2010). It would
be interesting to investigate whether biogas production is enhanced by ball milling. Certain pretreatment
chemicals leave residues that inhibit glucose fermentation. Comminution is not assumed to introduce
any inhibition issue for fermentation.
The role of textile waste as a source for second generation biofuels may be compatible with several
pathways, although the method described in this study focuses on glucose production, which main usage
is fermentation into ethanol, which might be converted into liquid fuels.
6. Conclusion
The aim of this study was converting cellulosic fibres from cotton to glucose without chemical
pretreatment. Investigation of saccharification of cotton substrate pretreated by planetary ball milling
showed that reduction in particle size significantly increased the digestibility of the substrate with two
commercially available enzyme cocktails.
The surplus of cotton textiles is currently landfilled and incinerated in most countries, although the
energy recycling of incineration is shown to be small. Reported methods for conversion of cotton involve
chemical pretreatment for reducing the crystallinity in order to allow enzymes to access and catalyse
cellulose depolymerization. Methods applying solely mechanical pretreatment prior to efficient
conversion (over 80 % of theoretical yield) of cotton cellulose have apparently not been reported. For
lignocellulosic biomass degradation in general, ball milling has been reviewed to be a too energy
demanding pretreatment technique and cost-efficient only if combined with other pretreatment methods,
even though ball milling of crystalline cellulose has been observed to produce nanofibrils with simple
operation and relatively low costs. In this study, ball milled denim fabric of substrate concentrations up
to 10 % (w/v dry matter content) resulted in 90 % conversion into glucose after by 24 hours incubation
with 4 mg Cellic® CTec2 per g glucan. At 5 % DM the respective conversion yields for ball milled
white and blue (indigo dyed) denim were 90 % and 100 % of theoretical maximal conversion.
Activity assays demonstrated that TaLPMO9A produced several oxidized oligosaccharides from both
denim fabrics studied when pretreated by ball milling. In substrates without pretreatment, however,
small amounts of oxidized oligosaccharides were detected in blue denim and none in white (undyed)

69
denim. This indicates that the applied pretreatment in this study increased the availability for LPMOs
and for cellulases. Ascorbic acid did not enhance hydrolysis by Cellic® CTec2 for cotton substrates. By
assays with and without ascorbic acid and by comparison with Celluclast®, the LPMO content of
Cellic® CTec2 was assessed to not be of significant importance for the efficient degradation.

70
7. References
Albersheim, P., Darvill, A., Roberts, K., Sederoff, R. & Staehelin, A. (2010). Plant Cell Walls: Taylor
& Francis Group.
Aliofkhazraei, M. (2015). Handbook of Mechanical Nanostructuring. Weinheim, Germany: Wiley-
VCH.
Amde, M., Liu, J.-F. & Pang, L. (2015). Environmental Application, Fate, Effects, and Concerns of
Ionic Liquids: A Review. Environmental Science & Technology, 49 (21): 12611-12627.
Andersen, N., Johansen, K. S., Michelsen, M., Stenby, E. H., Krogh, K. B. R. M. & Olsson, L. (2008).
Hydrolysis of cellulose using mono-component enzymes shows synergy during hydrolysis of
phosphoric acid swollen cellulose (PASC), but competition on Avicel. Enzyme Microb Tech,
42.
Baptista, A. F., I.; Borges, J. (2013). Cellulose-Based Bioelectronic Devices. In Ven, T. v. d. &
Godbout, L. (eds) Cellulose - Medical, Pharmaceutical and Electronic Applications, p. Ch.
04. Rijeka: InTech.
Barakat, A., de Vries, H. & Rouau, X. (2013). Dry fractionation process as an important step in
current and future lignocellulose biorefineries: A review. Bioresource Technology, 134: 362-
373.
Battista, F., Gomez Almendros, M., Rousset, R., Boivineau, S. & Bouillon, P.-A. (2018). Enzymatic
hydrolysis at high dry matter content: The influence of the substrates’ physical properties and
of loading strategies on mixing and energetic consumption. Bioresource Technology, 250:
191-196.
Beck, C. B. (2010). An Introduction to Plant Structure and Development: Plant Anatomy for the
Twenty-First Century: Cambridge University Press.
Bissaro, B., Rohr, A. K., Muller, G., Chylenski, P., Skaugen, M., Forsberg, Z., Horn, S. J., Vaaje-
Kolstad, G. & Eijsink, V. G. H. (2017). Oxidative cleavage of polysaccharides by monocopper
enzymes depends on H2O2. Nat Chem Biol, 13 (10): 1123-1128.
Bochkov, A. F., Zaikov, G. E. & Schuerch, C. (2016). Chemistry of the O-Glycosidic Bond:
Formation and Cleavage: Elsevier Science.
Bradford, M. M. (1976). A rapid and sensitive method for the quantitation of microgram quantities of
protein utilizing the principle of protein-dye binding. Anal Biochem, 72: 248-54.
Brown, P. R. (1994). Advances in Chromatography: Taylor & Francis.
Campos, R., Cavaco-Paulo, A., Andreaus, J. & Gubitz, G. (2000). Indigo-Cellulase Interactions, vol.
70. 532-536 pp.
Cannella, D., Hsieh, C. C., Felby, C. & Jørgensen, H. (2012). Production and effect of aldonic acids
during enzymatic hydrolysis of lignocellulose at high dry matter content. Biotechnol Biofuels,
5.
Chakraborty, T. & Ledwani, L. (2017). Research Methodology in Chemical Sciences: Experimental
and Theoretical Approach: Apple Academic Press.
Cherubini, F. (2010). The biorefinery concept: Using biomass instead of oil for producing energy and
chemicals. Energy Conversion and Management, 51 (7): 1412-1421.
Chylenski, P. (2017). Development of strategies for enzymatic degradation of lignocellulosic biomass.
Norwegian University of Life Sciences, Faculty of Chemistry, Biotechnology and Food
Science, Philosophiae Doctor (PhD) Thesis.
Chylenski, P., Forsberg, Z., Stahlberg, J., Varnai, A., Lersch, M., Bengtsson, O., Saebo, S., Horn, S. J.
& Eijsink, V. G. H. (2017a). Development of minimal enzyme cocktails for hydrolysis of
sulfite-pulped lignocellulosic biomass. J Biotechnol, 246: 16-23.
Chylenski, P., Petrović, D. M., Müller, G., Dahlström, M., Bengtsson, O., Lersch, M., Siika-Aho, M.,
Horn, S. J. & Eijsink, V. G. H. (2017b). Enzymatic degradation of sulfite-pulped softwoods
and the role of LPMOs. Biotechnol Biofuels, 10: 177.
Clariant. (2012). From Cotton to Fashion. Ltd, C. I. (ed.): Clariant International Ltd. p. 106.
Cragg, S. M., Beckham, G. T., Bruce, N. C., Bugg, T. D. H., Distel, D. L., Dupree, P., Etxabe, A. G.,
Goodell, B. S., Jellison, J., McGeehan, J. E., et al. (2015). Lignocellulose degradation
mechanisms across the Tree of Life. Current Opinion in Chemical Biology, 29: 108-119.

71
Davies, G. & Henrissat, B. (1995). Structures and mechanisms of glycosyl hydrolases. Structure, 3
(9): 853-859.
FAO, F. a. A. O. o. t. U. N. (2004). UBET - Unified bioenergy terminology: Food and Agricultural
Organization of the United Nations, Forestry department.
Festucci-Buselli, R. A., Otoni, W. C. & Joshi, C. P. (2007). Structure, organization, and functions of
cellulose synthase complexes in higher plants. Brazilian Journal of Plant Physiology, 19: 1-
13.
Fockink, D. H., Maceno, M. A. & Ramos, L. P. (2015). Production of cellulosic ethanol from cotton
processing residues after pretreatment with dilute sodium hydroxide and enzymatic hydrolysis.
Bioresour Technol, 187: 91-6.
Forsberg, Z., Vaaje-Kolstad, G., Westereng, B., Bunaes, A. C., Stenstrøm, Y., MacKenzie, A., Sørlie,
M., Horn, S. J. & Eijsink, V. G. H. (2011). Cleavage of cellulose by a CBM33 protein. Protein
Sci, 20.
Forsberg, Z., Bissaro, B., Gullesen, J., Dalhus, B., Vaaje-Kolstad, G. & Eijsink, V. G. H. (2018).
Structural determinants of bacterial lytic polysaccharide monooxygenase functionality. J Biol
Chem, 293 (4): 1397-1412.
Forurensningsloven. (1981). Forskrift om gjenvinning og behandling av avfall (avfallsforskriften)
§ 9-4. Forbud mot deponering av visse avfallstyper. Available at: https://lovdata.no/SF/forskrift/2004-
06-01-930/§9-4.
Georgieva, T. I., Hou, X. R., Hilstrom, T. & Ahring, B. K. (2008). Enzymatic hydrolysis and ethanol
fermentation of high dry matter wet-exploded wheat straw at low enzyme loading. Appl
Biochem Biotechnol, 148.
Gisela, B.-D. & Zeronian, S. H. (1994). Enzymatic and acid hydrolysis of cotton cellulose after slack
and tension mercerization, vol. 26. 17-24 pp.
Gomes, D., Gama, M. & Domingues, L. (2018). Determinants on an efficient cellulase recycling
process for the production of bioethanol from recycled paper sludge under high solid loadings.
Biotechnology for Biofuels, 11: 111.
Gordon, S. & Hsieh, Y. L. (2006). Cotton: Science and Technology: Elsevier Science.
Gupta, R. & Lee, Y. Y. (2009). Mechanism of Cellulase Reaction on Pure Cellulosic Substrates, vol.
102. 1570-81 pp.
Głód, B. (1997). Ion Exclusion Chromatography: Parameters Influencing Retention. 22: 1237-48.
Haigler, C. H., Betancur, L., Stiff, M. R. & Tuttle, J. R. (2012). Cotton fiber: a powerful single-cell
model for cell wall and cellulose research. Frontiers in plant science, 3: 104.
Hasanzadeh, E., Mirmohamadsadeghi, S. & Karimi, K. (2018). Enhancing energy production from
waste textile by hydrolysis of synthetic parts. Fuel, 218: 41-48.
Horn, S., Vaaje-Kolstad, G., Westereng, B. & Eijsink, V. G. (2012). Novel enzymes for the
degradation of cellulose. Biotechnol Biofuels, 5.
Hotta, H., Abe, M., Kuji, T. & Uchida, H. (2007). Synthesis of Ti–Fe alloys by mechanical alloying.
Journal of Alloys and Compounds, 439 (1): 221-226.
Ivanova, C., Ramoni, J., Aouam, T., Frischmann, A., Seiboth, B., Baker, S. E., Le Crom, S., Lemoine,
S., Margeot, A. & Bidard, F. (2017). Genome sequencing and transcriptome analysis of
Trichoderma reesei QM9978 strain reveals a distal chromosome translocation to be
responsible for loss of vib1 expression and loss of cellulase induction. Biotechnol Biofuels, 10:
209.
J. Hardy, B. & Sarko, A. (1996). Molecular dynamics simulations and diffraction-based analysis of
the native cellulose fibre: Structural modelling of the I-α and I-β phases and their
interconversion, vol. 37. 1833-1839 pp.
Jeihanipour, A. & Taherzadeh, M. J. (2009). Ethanol production from cotton-based waste textiles.
Bioresour Technol, 100 (2): 1007-10.
Jeihanipour, A., Karimi, K., Niklasson, C. & Taherzadeh, M. J. (2010). A novel process for ethanol or
biogas production from cellulose in blended-fibers waste textiles. Waste Manag, 30 (12):
2504-9.

72
Jeihanipour, A., Karimi, K. & Taherzadeh, M. J. (2010). Enhancement of ethanol and biogas
production from high‐crystalline cellulose by different modes of NMO pretreatment.
Biotechnology and Bioengineering, 105 (3): 469-476.
Johansen, K. S. (2016). Discovery and industrial applications of lytic polysaccharide mono-
oxygenases. Biochem Soc Trans, 44 (1): 143-9.
Jørgensen, H., Vibe-Pedersen, J., Larsen, J. & Felby, C. (2007). Liquefaction of lignocellulose at high
solids concentrations. Biotechnol Bioeng, 96.
Kanga, X. K., S.; Wanga, L.; Wua M.; Huanga, Y. (2016). Dissociation of intra/inter-molecular
hydrogen bonds of cellulose molecules in the dissolution process: a mini review.
Klemm, D., Heublein, B., Fink, H. P. & Bohn, A. (2005). Cellulose: fascinating biopolymer and
sustainable raw material. Angew Chem Int Ed Engl, 44 (22): 3358-93.
Kljun, A., Benians, T. A., Goubet, F., Meulewaeter, F., Knox, J. P. & Blackburn, R. S. (2011).
Comparative analysis of crystallinity changes in cellulose I polymers using ATR-FTIR, X-ray
diffraction, and carbohydrate-binding module probes. Biomacromolecules, 12 (11): 4121-6.
Koyama, M., Helbert, W., Imai, T., Sugiyama, J. & Henrissat, B. (1997). Parallel-up structure
evidences the molecular directionality during biosynthesis of bacterial cellulose. Proceedings
of the National Academy of Sciences, 94 (17): 9091-9095.
Kristensen, J. B., Felby, C. & Jørgensen, H. (2009). Yield-determining factors in high-solids
enzymatic hydrolysis of lignocellulose. Biotechnology for Biofuels, 2 (1): 11.
Kuhad, R. C., Gupta, R. & Singh, A. (2011). Microbial cellulases and their industrial applications.
Enzyme Res, 2011: 280696.
Lee, C., Kafle, K., D.W, B., Park, Y. B., R.E, G., C.H, H. & S.H, K. (2015). Comprehensive analysis
of cellulose content, crystallinity, and lateral packing in Gossypium hirsutum and Gossypium
barbadense cotton fibers using sum frequency generation, infrared and Raman spectroscopy,
and X-ray diffraction, vol. 22.
Lelekakis, N., Wijaya, J., Martin, D. & Susa, D. (2014). The effect of acid accumulation in power-
transformer oil on the aging rate of paper insulation. 30: 19-26.
Lewin, M. & Pearce, E. M. (1998). Handbook of Fiber Chemistry, Second Edition, Revised and
Expanded: Taylor & Francis.
Lewin, M. & Pearce, E. M. (2007). Handbook of Fiber Chemistry, Third Edition. 3rd ed.
INTERNATIONAL FIBER SCIENCE AND TECHNOLOGY SERIES: Taylor & Francis.
Li, Q. (2016). Nanomaterials For Sustainable Energy. Switzerland: Springer Nature.
Loose, J. S., Forsberg, Z., Fraaije, M. W., Eijsink, V. G. & Vaaje-Kolstad, G. (2014). A rapid
quantitative activity assay shows that the Vibrio cholerae colonization factor GbpA is an
active lytic polysaccharide monooxygenase. FEBS Lett, 588 (18): 3435-40.
Mandels, M., Hontz, L. & Nystrom, J. (1974). Enzymatic Hydrolysis of Waste Celllulose.
Biotechnology and Bioengineering, XVI: 23.
Mathew, A. K., Parameshwaran, B., Sukumaran, R. K. & Pandey, A. (2016). An evaluation of dilute
acid and ammonia fiber explosion pretreatment for cellulosic ethanol production. Bioresource
Technology, 199: 13-20.
Merino, S. T. & Cherry, J. (2007). Progress and challenges in enzyme development for biomass
utilization. In Biofuels. Springer Berlin: Springer Berlin/Heidelberg;.
Miller, J. M. (2005). Chromatography: Concepts and Contrasts: Wiley.
Müller, G., Várnai, A. & Johansen, K. S. (2015). Harnessing the potential of LPMO-containing
cellulase cocktails poses new demands on processing conditions. Biotechnol Biofuels, 8.
Nakagawa, Y. S., Oyama, Y., Kon, N., Nikaido, M., Tanno, K., Kogawa, J., Inomata, S., Masui, A.,
Yamamura, A., Kawaguchi, M., et al. (2011). Development of innovative technologies to
decrease the environmental burdens associated with using chitin as a biomass resource:
Mechanochemical grinding and enzymatic degradation. Carbohydrate Polymers, 83 (4): 1843-
1849.
Negulescu, I. I. K., H.; Collier, B.J.; Collier, J. R.; Pendse, A. (1998). Recycling cotton from cotton
polyester fabrics. Textile Chemist and Colorist: 4.
Novozymes. Cellic CTec3 FAQ. Available at: http://www.shinshu-
u.ac.jp/faculty/engineering/chair/chem010/manual/Ctec3.pdf.

73
O'Dell, W. B., Baker, D. C. & McLain, S. E. (2012). Structural evidence for inter-residue hydrogen
bonding observed for cellobiose in aqueous solution. PLoS One, 7 (10): e45311.
O'Sullivan, A. C. (1997). Cellulose: the structure slowly unravels. Cellulose, 4 (3): 173-207.
Obeng, E. M., Adam, S. N. N., Budiman, C., Ongkudon, C. M., Maas, R. & Jose, J. (2017).
Lignocellulases: a review of emerging and developing enzymes, systems, and practices.
Bioresources and Bioprocessing, 4 (1): 16.
Oxychem. (2018). Caustic Soda Handbook. (Oxychem), O. C. C. (ed.). Dallas, USA.
Paul, R. (2015). Denim: Manufacture, Finishing and Applications: Elsevier Science.
Payne, C. M., Knott, B. C., Mayes, H. B., Hansson, H., Himmel, M. E., Sandgren, M., Ståhlberg, J. &
Beckham, G. T. (2015). Fungal Cellulases. Chemical Reviews, 115 (3): 1308-1448.
Peciulyte, A., Karlström, K., Larsson, P. T. & Olsson, L. (2015). Impact of the supramolecular
structure of cellulose on the efficiency of enzymatic hydrolysis. Biotechnology for Biofuels, 8
(1): 56.
Peciulyte, A., Pisano, M., de Vries, R. P. & Olsson, L. (2017). Hydrolytic potential of five fungal
supernatants to enhance a commercial enzyme cocktail. Biotechnology Letters, 39 (9): 1403-
1411.
Peng, H., Li, H., Luo, H. & Xu, J. (2013). A novel combined pretreatment of ball milling and
microwave irradiation for enhancing enzymatic hydrolysis of microcrystalline cellulose.
Bioresource Technology, 130: 81-87.
Petrović, D. B., B.; Chylenski, P.; Skaugen, M.; Sørlie, M.; Aschmann, F. L.; Courtade, G.; Vàrnai,
A., Eijsink, V.G.H. (unpublished). Methylation of the N-terminal histidine protects a lytic
polysaccharide monooxygenase from auto-oxidative inactivation. 18.
Phenomenex, I. (2017). Rezex HPLC Columns Tips for Care and Use. Available at:
https://az621941.vo.msecnd.net/documents/a5e9b9b8-8a48-4bc8-b17b-e2a1e46648f8.pdf.
Phillips, C. M., Beeson, W. T., Cate, J. H. & Marletta, M. A. (2011). Cellobiose dehydrogenase and a
copper-dependent polysaccharide monooxygenase potentiate cellulose degradation by
Neurospora crassa. ACS Chem Biol, 6.
Pinkert, A., Marsh, K. N., Pang, S. & Staiger, M. P. (2009). Ionic Liquids and Their Interaction with
Cellulose. Chemical Reviews, 109 (12): 6712-6728.
Quinlan, R. J., Sweeney, M. D., Lo Leggio, L., Otten, H., Poulsen, J.-C. N., Johansen, K. S., Krogh,
K. B. R. M., Jørgensen, C. I., Tovborg, M., Anthonsen, A., et al. (2011). Insights into the
Oxidative Degradation of Cellulose by a Copper Metalloenzyme That Exploits Biomass
Components. Proc Natl Acad Sci USA, 108.
Rana, D., Rana, V. & Ahring, B. K. (2012). Producing high sugar concentrations from loblolly pine
using wet explosion pretreatment. Bioresour Technol, 121: 61-7.
Reese, E. T. (1976). History of the cellulase program at the U.S. army Natick Development Center.
Biotechnol Bioeng Symp (6): 9-20.
Rodrigues, A. C., Haven, M. O., Lindedam, J., Felby, C. & Gama, M. (2015). Celluclast and Cellic(R)
CTec2: Saccharification/fermentation of wheat straw, solid-liquid partition and potential of
enzyme recycling by alkaline washing. Enzyme Microb Technol, 79-80: 70-7.
Rohrer, J. (2013). Analysis of Carbohydrates by High-Performance nion-Exchange hromatography
with Pulsed Amperometric Detection (HPAE-PAD). Technical Note, 20: 12.
Ruiz, R. & Ehrman, T. (1996). Determination of carbohydrates in biomass by high performance liquid
chromatography. Laboratory Analytical Procedure No. 002, National Renewable Research
Laboratory.
Schmidt, A. (2016). Gaining Benefits from Discarded Textiles: LCA of Different Treatment Pathways:
Nordisk Ministerråd.
Sluiter, A. (2012). Determination of Structural Carbohydrates and Lignin in Biomass: Laboratory
Analytical Procedure (LAP). (Version 08-03-2012).
Smith, C. W. & Cothren, J. T. (1999). Cotton: Origin, History, Technology, and Production: Wiley.
Sofla, M. R. K., Brown, R. J., Tsuzuki, T. & Rainey, T. J. (2016). A comparison of cellulose
nanocrystals and cellulose nanofibres extracted from bagasse using acid and ball milling
methods. Advances in Natural Sciences: Nanoscience and Nanotechnology, 7 (3).
Srivastava, N., Srivastava, M., Mishra, P. K., Gupta, V. K., Molina, G., Rodriguez-Couto, S.,
Manikanta, A. & Ramteke, P. W. (2018). Applications of fungal cellulases in biofuel

74
production: Advances and limitations. Renewable and Sustainable Energy Reviews, 82: 2379-
2386.
Suckling, I. D., Jack, M. W., Lloyd, J. A., Murton, K. D., Newman, R. H., Stuthridge, T. R., Torr, K.
M. & Vaidya, A. A. (2017). A mild thermomechanical process for the enzymatic conversion
of radiata pine into fermentable sugars and lignin. Biotechnology for Biofuels, 10: 61.
Sun, S., Sun, S., Cao, X. & Sun, R. (2016). The role of pretreatment in improving the enzymatic
hydrolysis of lignocellulosic materials. Bioresource Technology, 199: 49-58.
Tanaka, K. & Haddad, P. R. (2000). Ion Exclusion Chromatography: Liquid Chromatography.
Academic Press.
Themelis, N. J. & Ulloa, P. A. (2007). Methane generation in landfills. Renewable Energy, 32 (7):
1243-1257.
Timoney, F. (2010). Estimates of Methane Recovery in Landfill Gas Flaring and Utilization. In (EPA),
E. P. A. I. (ed.). Climate Change Research Programme (CCRP) 2007-2013 Report Series No.
3. Wexford, Ireland: EPA.
Tolan, J. S. (2002). Iogen's process for producing ethanol from cellulosic biomass. Clean Technol
Environ Policy, 3.
Tolan, J. S. (2002). Iogen's process for producing ethanol from cellulosic biomass. Clean Technologies
and Environmental Policy, 3 (4): 339-345.
Transgenomic, I. (2007). Chromatography Application Notes — Organic Acids Analysis HPLC
Columns Document No. 612025-00
04/2007. Available at: https://vercopak.com.tw/document/09-
7Transgenomic%20Application%20Notes%20on%20Organic%20Acid%20Analysis.pdf.
Vaaje-Kolstad, G., Westereng, B., Horn, S. J., Liu, Z., Zhai, H., Sorlie, M. & Eijsink, V. G. (2010). An
oxidative enzyme boosting the enzymatic conversion of recalcitrant polysaccharides. Science,
330 (6001): 219-22.
Villares, A., Moreau, C., Bennati-Granier, C., Garajova, S., Foucat, L., Falourd, X., Saake, B., Berrin,
J. G. & Cathala, B. (2017). Lytic polysaccharide monooxygenases disrupt the cellulose fibers
structure. Sci Rep, 7: 40262.
Várnai, A., Mäkelä, M. R., Djajadi, D. T., Rahikainen, J., Hatakka, A. & Viikari, L. (2014). Chapter
Four - Carbohydrate-Binding Modules of Fungal Cellulases: Occurrence in Nature, Function,
and Relevance in Industrial Biomass Conversion. In Sariaslani, S. & Gadd, G. M. (eds) vol. 88
Advances in Applied Microbiology, pp. 103-165: Academic Press.
Wakelyn, P. J., Bertoniere, N. R., French, A. D., Thibodeaux, D. P., Triplett, B. A., Rousselle, M. A.,
Goynes, W. R., Edwards, J. V., Hunter, L. & McAlister, D. D. (2006). Cotton Fiber Chemistry
and Technology: CRC Press.
Westereng, B., Agger, J. W., Horn, S. J., Vaaje-Kolstad, G., Aachmann, F. L., Stenstrom, Y. H. &
Eijsink, V. G. (2013). Efficient separation of oxidized cello-oligosaccharides generated by
cellulose degrading lytic polysaccharide monooxygenases. J Chromatogr A, 1271 (1): 144-52.
Westereng, B., Arntzen, M. O., Aachmann, F. L., Varnai, A., Eijsink, V. G. & Agger, J. W. (2016).
Simultaneous analysis of C1 and C4 oxidized oligosaccharides, the products of lytic
polysaccharide monooxygenases acting on cellulose. J Chromatogr A, 1445: 46-54.
Westereng, B. (2018). Conversation with Senior Researcher Bjørge Westereng. NMBU.
Wolfenden, R., Lu, X. & Young, G. (1998). Spontaneous Hydrolysis of Glycosides. American
Chemical Society, 120 (27): 6814-6815.
Yang, B., Willies, D. & Wyman, C. (2006). Changes in enzymatic hydrolysis rate of Avicel cellulose
with conversion, vol. 94. 1122-8 pp.
Zhang, G., Schlarb, A. K., Tria, S. & Elkedim, O. (2008). Tensile and tribological behaviors of
PEEK/nano-SiO2 composites compounded using a ball milling technique. Composites Science
and Technology, 68 (15): 3073-3080.
Zhang, J., Zhang, J., Lin, L., Chen, T., Zhang, J., Liu, S., Li, Z. & Ouyang, P. (2009). Dissolution of
microcrystalline cellulose in phosphoric acid--molecular changes and kinetics. Molecules, 14
(12): 5027-41.

75
Zhang, J., Zhang, B., Zhang, J., Lin, L., Liu, S. & Ouyang, P. (2010). Effect of phosphoric acid
pretreatment on enzymatic hydrolysis of microcrystalline cellulose. Biotechnology Advances,
28 (5): 613-619.
Zhang, L. Y., Tsuzuki, T. & Wang, X. G. (2010). Preparation and Characterization on Cellulose
Nanofiber Film. 654-656: 1760-1763.
Appendix

Contents
Methods
Table S-1: Loading experiment with Cellic® CTec2
Table S-2: Time course experiments with Cellic® CTec2
Table S-3: Time course experiment with Cellic® CTec2 at various dry matter contents
Table S-4: Loading experiment with Celluclast®
Table S-5: Time course experiment with Celluclast®
Table S-6: Reactions with TaLPMO9A
Results
Figure S-7: MS spectrum of PASC
Methods
Equations for S1, S2, S3, S4, S5, S6 and S7:
1 Calculated as follows: 𝑠𝑢𝑏𝑠𝑡𝑟𝑎𝑡[𝑚𝑔]
5,0 ∙ 1
𝐷𝑀(%)
∙𝑔𝑙𝑢𝑐𝑎𝑛 𝑐𝑜𝑛𝑡𝑒𝑛𝑡 𝑓𝑟𝑎𝑐𝑡𝑖𝑜𝑛
0,9115= 𝐹𝑎𝑐𝑡𝑜𝑟
2 Calculated as follows:
500 µL ∙ 𝐹𝑎𝑐𝑡𝑜𝑟 = 𝑇𝑜𝑡𝑎𝑙 𝑣𝑜𝑙𝑢𝑚𝑒 [𝜇𝐿]
3 Calculated as follows:
𝑉𝐸 [𝜇𝐿] ∙ 𝐹𝑎𝑐𝑡𝑜𝑟 = 𝑣𝑜𝑙𝑢𝑚𝑒 𝑜𝑓 𝑒𝑛𝑧𝑦𝑚𝑒 𝑑𝑖𝑙𝑢𝑡𝑖𝑜𝑛 𝑎𝑑𝑑𝑒𝑑 [𝜇𝐿]
where 𝑉𝐸 is the volume that would be added to a sample with Factor=1
4 Calculated as follows:
𝑉𝑡 − 𝑉(𝐴𝑠𝑐𝐴) [𝜇𝐿] − 𝑉(𝑒𝑛𝑧𝑦𝑚𝑒) [𝜇𝐿] − V(𝑠𝑢𝑏𝑠𝑡𝑟𝑎𝑡𝑒) [𝑚𝑔] = V(𝑏𝑢𝑓𝑓𝑒𝑟)[𝜇𝐿]

S-1
Table S-1: Loading experiment with Cellic® CTec2
Experimental Control calculations
Sample Substrate [mg]
3CTec2 0,9115 g/L [µL]
450 mM SoAcpH5
buffer [µL]
AscA (100 mM) [µL]
2VT [µL] 1factor substrate
[g]
enzyme/ glucan [g/g]]
enzyme/ volume
[g/L] DM
AscA [mM]
Std 1
Glc1 48
hrs
2,5 0 488 10 500 0,000 0,5 %
Std 2 5,2 0 485 10 500 0,000 1,0 %
Std 3 25 0 465 10 500 0,000 5,0 %
Std 4 50,5 0 440 10 500 0,000 10,1 %
BWD 1
4 mg 48 hrs
26,8 50 410 10 496 0,99 0,023 0,0040 0,182 5,0 % 2,0
BWD 2 27 50 413 10 500 1,00 0,023 0,0040 0,182 5,0 % 2,0
BWD 3 27,5 51 420 10 509 1,02 0,023 0,0040 0,182 5,0 % 2,0
BWD 4
8 mg 48
hrs
28 104 376 10 518 1,04 0,024 0,0080 0,365 5,0 % 1,9
BWD 5 26,9 100 361 10 498 1,00 0,023 0,0080 0,365 5,0 % 2,0
BWD 6 26,5 98 356 10 490 0,98 0,022 0,0080 0,365 5,0 % 2,0
BWD 7
12 mg 48 hrs
26,1 145 302 10 483 0,97 0,022 0,0120 0,547 5,0 % 2,1
BWD 8 27,6 153 320 10 511 1,02 0,023 0,0120 0,547 5,0 % 2,0
BWD 9 27,5 153 319 10 509 1,02 0,023 0,0120 0,547 5,0 % 2,0
BWD 10
16 mg
48 hrs
27,5 204 268 10 509 1,02 0,023 0,0160 0,729 5,0 % 2,0
BWD 11 26,6 197 259 10 492 0,98 0,022 0,0160 0,729 5,0 % 2,0
BWD 12 26,4 195 257 10 489 0,98 0,022 0,0160 0,729 5,0 % 2,0
BWD 13
20 mg 48 hrs
27,7 256 219 10 513 1,03 0,023 0,0200 0,912 5,0 % 2,0
BWD 14 26,3 243 207 10 487 0,97 0,022 0,0200 0,912 5,0 % 2,1
BWD 15 26,9 249 212 10 498 1,00 0,023 0,0200 0,912 5,0 % 2,0
BWD 16
2 mg 48
hrs
26,4 24 428 10 489 0,98 0,022 0,00200 0,091 5,0 % 2,0
BWD 17 27 25 438 10 500 1,00 0,023 0,00200 0,091 5,0 % 2,0
BWD 18 27,2 25 441 10 503 1,01 0,023 0,00200 0,091 5,0 % 2,0
BWD 0 0 32,3 0 555 10 598 1,20 0,027 0,00000 0,000 5,0 % 1,7
E 0 0 100 390 10 500 0,00 0,0 0,0 0,365 0,0 % 2,0
Table S-1: details from the setup of the enzyme loading experiment with Cellic CTec2.

S-2
Table S-2: Time course experiments with Cellic® CTec2
Experimental Control calculations
Sample Substr
ate [mg]
3CTec2 0,9115 g/L [µL]
450 mM SoAcpH5
buffer [µL]
AscA (100 mM) [µL]
2VT [µL] 1factor substrate
[g]
enzyme/ glucan [g/g]]
enzyme/ volume
[g/L]
DM
Std 1
Glc 24 hrs
1,5 0 489 10 500 0,000 0,000 0,000 0,3 %
Std 2 5 0 485 10 500 0,000 0,000 0,000 1,0 %
Std 3 27,1 0 463 10 500 0,000 0,000 0,000 5,4 %
Std 4 49,6 0 440 10 500 0,000 0,000 0,000 9,9 %
Std 5 Glc 96 hrs 4,9 0 485 10 500 0,000 0,000 0,000 1,0 %
Std 6
Glc2 24 hrs
1,7 0 488 10 500 0,000 0,000 0,000 0,3 %
Std 7 5,2 0 485 10 500 0,000 0,000 0,000 1 %
Std 8 25,1 0 465 10 500 0,000 0,000 0,000 5 %
Std 9 51,4 0 439 10 500 0,000 0,000 0,000 10 %
BWD 1
BWD 4 hrs
26,3 97 353 10,0 486,7 0,97 0,022 0,00400 0,182 5,00 %
BWD 2 27,8 103 374 10,0 514,4 1,03 0,023 0,00400 0,182 5,00 %
BWD 3 30,3 112 408 10,0 560,7 1,12 0,026 0,00400 0,182 5,00 %
BWD 4
BWD 24 hrs
28,9 107 389 10,0 534,8 1,07 0,024 0,00400 0,182 5,00 %
BWD 5 25,5 94 342 10,0 471,9 0,94 0,022 0,00400 0,182 5,00 %
BWD 6 28,2 104 379 10,0 521,8 1,04 0,024 0,00400 0,182 5,00 %
BWD 7
BWD 48 hrs
27,1 100 364 10,0 501,5 1,00 0,023 0,00400 0,182 5,00 %
BWD 8 27,5 102 370 10,0 508,9 1,02 0,023 0,00400 0,182 5,00 %
BWD 9 26,9 100 361 10,0 497,8 1,00 0,023 0,00400 0,182 5,00 %
BWD 10
BWD 96 hrs
26,4 98 354 10,0 488,5 0,98 0,022 0,00400 0,182 5,13 %
BWD 11 27,4 101 368 10,0 507,0 1,01 0,023 0,00400 0,182 5,00 %
BWD 12 27,4 101 368 10,0 507,0 1,01 0,023 0,00400 0,182 5,00 %
BWD 0 BWD control 27 0 463 10,0 499,6 1,0 0,023 0,00000 0,000 5,00 %
1
Avicel 4 hrs
26,3 103 377 10,0 516,7 1,03 0,024 0,00400 0,182 4,93 %
2 27,9 110 401 10,0 548,2 1,10 0,025 0,00400 0,182 4,93 %
3 26,3 103 377 10,0 516,7 1,03 0,024 0,00400 0,182 4,93 %
4
Avicel 24 hrs
25,8 101 370 10,0 506,9 1,01 0,023 0,00400 0,182 4,93 %
5 26 102 373 10,0 510,8 1,02 0,023 0,00400 0,182 4,93 %
6 25,7 101 368 10,0 504,9 1,01 0,023 0,00400 0,182 4,93 %
7
Avicel 48 hrs
25,9 102 371 10,0 508,9 1,02 0,023 0,00400 0,182 4,93 %
8 26,2 103 376 10,0 514,8 1,03 0,023 0,00400 0,182 4,93 %
9 25,7 101 368 10,0 504,9 1,01 0,023 0,00400 0,182 4,93 %
10
Avicel 96 hrs
26 102 373 10,0 510,8 1,02 0,023 0,00400 0,182 4,93 %
11 25,4 100 364 10,0 499,0 1,00 0,023 0,00400 0,182 4,93 %
12 25,9 102 371 10,0 508,9 1,02 0,023 0,00400 0,182 4,93 %
13 Avicel control 26 102 373 10,0 510,8 1,0 0,023 0,00400 0,182 4,93 %
WD 1
WD 4 hrs
26,8 104 381 10,0 521,9 1,04 0,024 0,00400 0,182 5,00 %
WD 2 25,3 99 359 10,0 492,7 0,99 0,022 0,00400 0,182 5,00 %
WD 3 27,3 106 388 10,0 531,7 1,06 0,024 0,00400 0,182 5,00 %
WD 4
WD 24 hrs
28 109 398 10,0 545,3 1,09 0,025 0,00400 0,182 5,00 %
WD 5 25,1 98 356 10,0 488,8 0,98 0,022 0,00400 0,182 5,00 %
WD 6 27,2 106 387 10,0 529,7 1,06 0,024 0,00400 0,182 5,00 %
WD 7
WD 48 hrs
24,9 97 353 10,0 484,9 0,97 0,022 0,00400 0,182 5,00 %
WD 8 25,7 100 365 10,0 500,5 1,00 0,023 0,00400 0,182 5,00 %
WD 9 27,5 107 391 10,0 535,6 1,07 0,024 0,00400 0,182 5,00 %
WD 10
WD 96 hrs
24,5 95 347 10,0 477,1 0,95 0,022 0,00400 0,182 5,00 %
WD 11 26,1 102 371 10,0 508,3 1,02 0,023 0,00400 0,182 5,00 %
WD 12 27,1 106 385 10,0 527,8 1,06 0,024 0,00400 0,182 5,00 %
WD 13 WD control 24,1 94 341 10,0 469,4 0,9 0,021 0,00400 0,182 5,00 %
E Enzyme 0 100 390 10,0
500,0 E2 Enzyme 0 100 390 10,0 500,0
Table S-2 a: details from the setup of time course experiment with Cellic CTec2 at 4 mg loading and 5 % DM.

S-2
Sample Substrate [mg]
3CTec2 0,9115 g/L [µL]
450 mM SoAcpH5
buffer [µL]
AscA (100 mM) [µL]
2VT [µL]
1factor substrate
[g]
enzyme/ glucan [g/g]]
enzyme/ volume
[g/L] DM
BWD 1
BWD 4 hrs
26,9 100 361 10 498 1,00 0,023 0,00400 0,182 5,00 %
BWD 2 27,2 101 365 10 503 1,01 0,023 0,00400 0,182 5,00 %
BWD 3 27 100 363 10 500 1,00 0,023 0,00400 0,182 5,00 %
BWD 4
BWD 24 hrs
28,1 104 378 10 520 1,04 0,024 0,00400 0,182 5,00 %
BWD 5 27,6 102 371 10 511 1,02 0,023 0,00400 0,182 5,00 %
BWD 6 27,7 103 372 10 513 1,03 0,023 0,00400 0,182 5,00 %
BWD 7 BWD 48
hrs
27,6 102 371 10 511 1,02 0,023 0,00400 0,182 5,00 %
BWD 8 27,3 101 367 10 505 1,01 0,023 0,00400 0,182 5,00 %
BWD 9 27,3 101 367 10 505 1,01 0,023 0,00400 0,182 5,00 %
BWD 0 BWD
control 30,3 0 520 10 561 1,12 0,026 0,00000 0,000 5,00 %
BBD 1
BBD 4 hrs
26,4 98 355 10 490 0,98 0,022 0,00400 0,182 5,18 %
BBD 2 26,1 97 351 10 484 0,97 0,022 0,00400 0,182 5,18 %
BBD 3 25,9 96 349 10 481 0,96 0,022 0,00400 0,182 5,18 %
BBD 4
BBD 24 hrs
25,9 96 349 10 481 0,96 0,022 0,00400 0,182 5,18 %
BBD 5 26 96 350 10 482 0,96 0,022 0,00400 0,182 5,18 %
BBD 6 25,6 95 344 10 475 0,95 0,022 0,00400 0,182 5,18 %
BBD 7
BBD 48 hrs
25,7 95 346 10 477 0,95 0,022 0,00400 0,182 5,18 %
BBD 8 25,6 95 344 10 475 0,95 0,022 0,00400 0,182 5,18 %
BBD 9 26,7 99 360 10 495 0,99 0,023 0,00400 0,182 5,18 %
BBD 0 BBD
control 27,2 0 467 10 505 1,01 0,023 0,00000 0,000 5,18 %
Table S-2 b: details from the setup of time course experiment with Cellic CTec2 at 4 mg loading and 5 % DM
for BBD and BWD.

S-3
Table S-3: Time course experiment with Cellic® CTec2 at various dry matter
contents
Sample Substrate [mg]
3CTec2 1.823 g/L
[µL]
450 mM SoAcpH5
buffer [µL]
AscA (100 mM) [µL]
2VT [µL]
1factor
substrate [g]
enzyme/ glucan [g/g]]
enzyme/ volume
[g/L] DM
Std 1
Glc 24 hrs
6 0 484 10 500 0,000 1,20 %
Std 2 25,5 0 465 10 500 0,000 5,10 %
Std 3 48,9 0 441 10 500 0,000 9,78 %
Std 4 104 0 386 10 500 0,000 20,80 %
E1 Control 100 390 10 500
E2 Control 200 290 10 500
1 BWD10 4
hrs
53 98 329 10 490 0,98 0,045 0,00400 0,3646 10,00 %
2 54,5 101 339 10 504 1,01 0,046 0,00400 0,3646 10,00 %
3 53,8 100 334 10 498 1,00 0,045 0,00400 0,3646 10,00 %
4
BWD10 24 hrs
52,6 97 327 10 487 0,97 0,044 0,00400 0,3646 10,00 %
5 52,8 98 328 10 489 0,98 0,045 0,00400 0,3646 10,00 %
6 53 98 329 10 490 0,98 0,045 0,00400 0,3646 10,00 %
7 BWD10 48
hrs
54,4 101 338 10 503 1,01 0,046 0,00400 0,3646 10,00 %
8 53,5 99 332 10 495 0,99 0,045 0,00400 0,3646 10,00 %
9 53,5 99 332 10 495 0,99 0,045 0,00400 0,3646 10,00 %
10
BWD10 96 hrs
53,5 99 332 10 495 0,99 0,045 0,00400 0,3646 10,00 %
11 54,7 101 340 10 506 1,01 0,046 0,00400 0,3646 10,00 %
12 54,5 101 339 10 504 1,01 0,046 0,00400 0,3646 10,00 %
control BWD10 48
hrs 54,3 0 438 10 502 1,0 0,046 0,00000 0,0000 10,00 %
CTec2 0,9115 g/L
14 BWD20 4
hrs
117,1 217 198 10 542 1,08 0,099 0,00400 0,7292 20,00 %
15 103,4 191 174 10 478 0,96 0,087 0,00400 0,7292 20,00 %
16 108,7 201 183 10 503 1,01 0,092 0,00400 0,7292 20,00 %
17
BWD20 4 hrs
106,1 196 178 10 491 0,98 0,089 0,00400 0,7292 20,00 %
18 109,2 202 184 10 505 1,01 0,092 0,00400 0,7292 20,00 %
19 112,8 209 190 10 522 1,04 0,095 0,00400 0,7292 20,00 %
20 BWD20 4
hrs
110,7 205 187 10 512 1,02 0,093 0,00400 0,7292 20,00 %
21 112 207 189 10 518 1,04 0,094 0,00400 0,7292 20,00 %
22 109,5 203 184 10 507 1,01 0,092 0,00400 0,7292 20,00 %
23
BWD20 4 hrs
106,5 197 179 10 493 0,99 0,090 0,00400 0,7292 20,00 %
24 107,3 199 181 10 496 0,99 0,090 0,00400 0,7292 20,00 %
25 110,7 205 187 10 512 1,02 0,093 0,00400 0,7292 20,00 %
control BWD20 48
hrs 110,7 0 391 10 512 1,0 0,093 0,00000 0,0000 20,00 %
27 BWD5 24hrs 26,9 50 411 10 498 1,00 0,023 0,00400 0,1823 5,00 %
28 BWD10-8mg-24
hrs 55,2 204 241 10 511 1,02 0,047 0,00800 0,7292 10,00 %
Table S-3: details from the setup of time course experiment with Cellic CTec2 at various DM.

S-4
Table S-4: Loading experiment with Celluclast®
Sample Substrate [mg]
3Celluclast 1.823 g/L
[µL]
450 mM SoAcpH5
buffer [µL]
2VT [µL] 1factor substrate
[g]
enzyme/ glucan [g/g]]
enzyme/ volume [g/L]
DM
Std 1
Glc 24 hrs
4,6 0 495 500 0,000 0,9 %
Std 2 28,7 0 471 500 0,000 5,7 %
Std 3 50,1 0 450 500 0,000 10,0 %
Std 4 99,9 0 400 500 0,000 20,0 %
Std 5
Glc2 24 hrs
3 0 497 500 0,000 0,3 %
Std 6 5,4 0 495 500 0,000 1 %
Std 7 25,9 0 474 500 0,000 5 %
Std 8 51,5 0 449 500 0,000 10 %
BWD 1 2 mg
48 hrs
27,1 25 449 501 1,00 0,023 0,00200 0,091 5,00 %
BWD 2 27,9 26 463 516 1,03 0,024 0,00200 0,091 5,00 %
BWD 3 26,5 25 439 490 0,98 0,022 0,00200 0,091 5,00 %
BWD 4
4 mg 48 hrs
26,4 49 413 489 0,98 0,022 0,00400 0,182 5,00 %
BWD 5 26,4 49 413 489 0,98 0,022 0,00400 0,182 5,00 %
BWD 6 27,3 51 427 505 1,01 0,023 0,00400 0,182 5,00 %
BWD 7 8 mg
48 hrs
28,3 105 391 524 1,05 0,024 0,00800 0,365 5,00 %
BWD 8 26,3 97 363 487 0,97 0,022 0,00800 0,365 5,00 %
BWD 9 26,4 98 364 489 0,98 0,022 0,00800 0,365 5,00 %
BWD 10
12 mg 48 hrs
26,2 145 313 485 0,97 0,022 0,01200 0,547 5,00 %
BWD 11 27 150 323 500 1,00 0,023 0,01200 0,547 5,00 %
BWD 12 28,3 157 338 524 1,05 0,024 0,01200 0,547 5,00 %
BWD 13 16 mg 48 hrs
26,7 198 270 494 0,99 0,023 0,01600 0,729 5,00 %
BWD 14 27,7 205 280 513 1,03 0,023 0,01600 0,729 5,00 %
BWD 15 26,3 195 266 487 0,97 0,022 0,01600 0,729 5,00 %
BWD 16
20 mg 48 hrs
26,2 242 216 485 0,97 0,022 0,02000 0,912 5,13 %
BWD 17 26,7 247 220 494 0,99 0,023 0,02000 0,912 5,13 %
BWD 18 26,5 245 219 490 0,98 0,022 0,02000 0,912 5,13 %
BWD 0 0 27,7 0 485 513 1,03 0,023 5,00 %
E 0 0 100 400 500 0
Table S-4: details from the setup of loading experiment with Celluclast

S-5
Table S-5: Time course experiment with Celluclast®
Sample Substrate [mg]
3Celluclast 0.91 g/L
[µL]
450 mM SoAcpH5
buffer [µL]
2VT [µL] 1factor substrate
[g]
enzyme/ glucan [g/g]]
enzyme/ volume
[g/L] DM
Std 1
Glc 24 hrs
2,9 0 497 500 0,000 0,6 %
Std 2 8,2 0 492 500 0,000 1,6 %
Std 3 26,3 0 474 500 0,000 5,3 %
Std 4 49,9 0 450 500 0,000 10,0 %
Std 5 99,8 0 400 500 0,000 20,0 %
Std 6
Glc2 24 hrs
3 0 497 500 0,000 0,6 %
Std 7 5,4 0 495 500 0,000 1,1 %
Std 8 25,9 0 474 500 0,000 5,2 %
Std 9 51,5 0 449 500 0,000 10,3 %
Std 10 99,8 0 400 500 0,000 20,0 %
BWD 1 BWD 4
hrs
26,5 196 268 490 0,98 0,022 0,0080 0,365 5,00 %
BWD 2 27 200 273 500 1,00 0,023 0,0080 0,365 5,00 %
BWD 3 26,8 198 271 496 0,99 0,023 0,0080 0,365 5,00 %
BWD 4 BWD 24 hrs
27,5 204 278 509 1,02 0,023 0,0080 0,365 5,00 %
BWD 5 26,7 198 270 494 0,99 0,023 0,0080 0,365 5,00 %
BWD 6 27,3 202 276 505 1,01 0,023 0,0080 0,365 5,00 %
BWD 7 BWD 48 hrs
29,8 221 301 551 1,10 0,025 0,0080 0,365 5,00 %
BWD 8 26,4 195 267 489 0,98 0,022 0,0080 0,365 5,00 %
BWD 9 26,3 195 266 487 0,97 0,022 0,0080 0,365 5,00 %
BWD 10
BWD 96 hrs
26,8 198 271 496 0,99 0,023 0,0080 0,365 5,00 %
BWD 11 27,7 205 280 513 1,03 0,023 0,0080 0,365 5,00 %
BWD 12 26,4 195 267 489 0,98 0,022 0,0080 0,365 5,00 %
BWD 0 BWD
control 30,5 0 534 564 1,1 0,026 0,0000 0,000 5,00 %
1 Avicel 4 hrs
25,4 200 274 499 1,00 0,023 0,0080 0,365 4,93 %
2 25,9 204 279 509 1,02 0,023 0,0080 0,365 4,93 %
3 24,2 190 261 475 0,95 0,022 0,0080 0,365 4,93 %
4 Avicel 24 hrs
24,9 196 269 489 0,98 0,022 0,0080 0,365 4,93 %
5 25,1 197 271 493 0,99 0,022 0,0080 0,365 4,93 %
6 24,9 196 269 489 0,98 0,022 0,0080 0,365 4,93 %
7 Avicel 48 hrs
27,4 215 296 538 1,08 0,025 0,0080 0,365 4,93 %
8 28,8 226 311 566 1,13 0,026 0,0080 0,365 4,93 %
9 25,8 203 278 507 1,01 0,023 0,0080 0,365 4,93 %
10 Avicel 96 hrs
25,4 200 274 499 1,00 0,023 0,0080 0,365 4,93 %
11 25,1 197 271 493 0,99 0,022 0,0080 0,365 4,93 %
12 25,6 201 276 503 1,01 0,023 0,0080 0,365 4,93 %
13 Avicel
control 27,1 0 505 532 1,1 0,024 0,0000 0,000 4,93 %
WD 1 WD 4
hrs
26,7 208 285 520 1,04 0,024 0,0080 0,365 5,00 %
WD 2 26 203 278 506 1,01 0,023 0,0080 0,365 5,00 %
WD 3 27,6 215 295 538 1,08 0,024 0,0080 0,365 5,00 %
WD 4 WD 24
hrs
26,2 204 280 510 1,02 0,023 0,0080 0,365 5,00 %
WD 5 27,9 217 298 543 1,09 0,025 0,0080 0,365 5,00 %
WD 6 26,5 206 283 516 1,03 0,024 0,0080 0,365 5,00 %
WD 7 WD 48
hrs
25,9 202 277 504 1,01 0,023 0,0080 0,365 5,00 %
WD 8 27,6 215 295 538 1,08 0,024 0,0080 0,365 5,00 %
WD 9 29,2 227 312 569 1,14 0,026 0,0080 0,365 5,00 %
WD 10 WD 96
hrs
31,5 245 337 613 1,23 0,028 0,0080 0,365 5,00 %
WD 11 30,8 240 329 600 1,20 0,027 0,0080 0,365 5,00 %
WD 12 28,7 224 307 559 1,12 0,025 0,0080 0,365 5,00 %
WD 13 WD
control 25,2 0 466 491 1,0 0,022 0,0000 0,000 5,00 %
Table S-5: details from the setup of time course experiment with Celluclast.

S-6
Table S-6: Reactions with TaLPMO9A
Nr. Sample
Substrate
[mg]
3TaLPMO9A 10 µM
[µL]
4Buffer (70 mM TrisHCl-6,5) [µL]
AscA (100 mM) [µL]
2VT [µL] 1Factor substrat
[g]
enzym/glucan [g per
g]
enzym/volum [g/L]
DM [%]
AscA [mM]
Tris-HCl [mM]
1 BWD
1,8 17 146 2,5 166,5 0,67 0,0015 0,0001 0,0000010 1,000 1,5 61,193
2 1,6 15 129 2,5 148,0 0,59 0,0013 0,0001 0,0000010 1,000 1,7 61,1
3 BWD
control 1,7 0 153 2,5 157,3 0,6 0,0014 0,0000 0,0000000 1,000 1,6 68,1
4 Avicel
1,9 19 164 2,5 186,6 0,75 0,0017 0,0001 0,0000010 1,052 1,3 61,3
5 2,1 21 181 2,5 206,3 0,83 0,0019 0,0001 0,0000010 1,052 1,2 61,4
6 Avicel
control 1,7 0 163 2,5 167,0 0,7 0,0015 0,0000 0,0000000 1,052 1,5 68,2
7 BBD
2,1 19 171 2,5 194,8 0,78 0,0018 0,0001 0,0000010 1,122 1,3 61,3
8 2,2 20 179 2,5 204,1 0,82 0,0019 0,0001 0,0000010 1,122 1,2 61,4
9 BBD
control 2,1 0 190 2,5 194,8 0,8 0,0019 0,0000 0,0000000 1,122 1,3 68,3
10 WD
1,5 15 127 2,5 146,1 0,58 0,0013 0,0001 0,0000010 1,055 1,7 61,1
11 2,1 20 179 2,5 204,5 0,82 0,0019 0,0001 0,0000010 1,055 1,2 61,4
12 WD
control 3,6 0 344 2,5 350,6 1,40 0,0032 0,0000 0,0000000 1,055 0,7 68,8
13 BD
1,5 14 121 2,5 139,2 0,56 0,0013 0,0001 0,0000010 1,122 1,8 61,0
14 2,1 19 171 2,5 194,8 0,78 0,0018 0,0001 0,0000010 1,122 1,3 61,3
15 BD
control 2,7 0 245 2,5 250,5 1,00 0,0023 0,0000 0,0000000 1,122 1,0 68,5
16 Pasc5
2,5 25 205 2,5 253,7 1,01 0,0023 0,0001 0,0000010 0,985 1,0 56,6
17 2,5 25 205 2,5 253,7 1,01 0,0023 0,0001 0,0000010 0,985 1,0 56,6
18 Pasc
control5 2,5 0 230 2,5 253,7 1,01 0,0023 0,0000 0,0000000 0,985 1,0 63,6
Equations for S-6:
1 Calculated as follows: 𝑠𝑢𝑏𝑠𝑡𝑟𝑎𝑡(𝑚𝑔)
2,5 ∙ 1
𝐷𝑀(%)
= 𝐹𝑎𝑐𝑡𝑜𝑟
2 Calculated as follows: 250 µL ∙ 𝐹𝑎𝑐𝑡𝑜𝑟 = 𝑇𝑜𝑡𝑎𝑙 𝑣𝑜𝑙𝑢𝑚𝑒 (µL)
3 Calculated as follows: 25 µL ∙ 𝐹𝑎𝑐𝑡𝑜𝑟 = 𝑒𝑛𝑧𝑦𝑚𝑒 𝑣𝑜𝑙𝑢𝑚𝑒 (µL)
4 Calculated as follows: 𝑉𝑡 − 𝐴𝑠𝑐𝐴(µL) − 𝑒𝑛𝑧𝑦𝑚𝑒 (µL) − 𝑠𝑢𝑏𝑠𝑡𝑟𝑎𝑡𝑒 (mg) = 𝑏𝑢𝑓𝑓𝑒𝑟(µL)
5PASC was pipetted from a 12 % solution. 20.8 mL was used, because 20.8 𝑚𝐿 ∙ 0.12 = 2.5 𝑚𝑔
Table S-6: details from the setup of LPMO analysis with TaLPMO9A

S-7
Results
Figure S-7: MS spectrum of PASC
Figure S-7: MALDI-TOF analysis of oxidized products in PASC. The figure shows mass spectrum of BBD treated
with TaLPMO9A in pH=6,5, 45°C at 1 000 rpm for 20 hours.
