environmental footprint of coffee in colombia
TRANSCRIPT
Industria Colombiana de Café
ENVIRONMENTALFOOTPRINT OF COFFEEIN COLOMBIAGUIDANCE DOCUMENT


Version 1.0
Prepared by:
QuantisSimon Gmünder
Centro Nacional Para la Producción Más LimpiaCarlos Toro
Corporación Colombiana de Investigación Agropecuaria AGROSAVIAJuan Mauricio Rojas Acosta
Federación Nacional de Cafeteros de Colombia Centro Nacional de Investigaciones de Café CenicaféNelson Rodriguez Valencia
Contributing authors
Centro Nacional Para la Producción Más LimpiaCNPMLGloria Restrepo
QuantisJuanita BarreraSebastien Humbert Embassy of Switzerland in ColombiaSwiss Agency for Development and Cooperation (SDC)Global Programme WaterDiana Rojas OrjuelaMaly Puerto López
Federación Nacional de Cafeteros de Colombia Centro Nacional de Investigaciones de CaféCenicafé.Álvaro Gaitan B. PhD.
CADISNydia Suppen
Corporación Colombiana de Investigación Agropecuaria AGROSAVIAFelipe López-Hernández
Photos provided by:
Federación Nacional de Cafeteros de Colombia Centro Nacional de Investigaciones de Café Cenicafé y proyecto GIA - Manos al Agua.
The information contained in this document is the result of the technical work of CNPMLTA, Quantis International, Colombia National Coffee Federation, Cenicafe, and partner companies. The contents and opinions do not reflect the official position of the Swiss Embassy in Colombia - Humanitarian Aid and Development (SDC), nor of ANDI. Additionally, this publication is not for commercial use. Printed by: Gráficas Pajon
ABBREVIATIONSAF AGB BGBB2BB2CCASCFCFFCTUeCTUhDMDPCDQREFEIEoLEPDFUFNCGAPGHGGRGRIGWPHHSCILCDIPCC IPM ISO JRC LCA LCI LCIA LUC OEF QWDB NAMA NMVOC PCR PEF PEFCR SMAT SOC TeR TiR TS UNEP UUID WFLDB
Allocation factorAbove-ground biomassBelow-ground biomassBusiness to businessBusiness to consumerCoffee agroforestry systemCharacterization factorCircular footprint formulaComparative toxic unit for ecosystemsComparative toxic unit for humansDead matterDried parchment coffeeData quality ratingEnvironmental footprintEnvironmental impactEnd-of-lifeEnvironmental product declarationFunctional unitNational Coffee Growers Federation of ColombiaGood Agricultural PracticeGreenhouse gasGeographical representativenessGlobal Reporting InitiativeGlobal warming potentialHydraulic hopper and screw conveyorsInternational Reference Life Cycle Data SystemIntergovernmental Panel on Climate ChangeIntegrated pest managementInternational Organization for StandardizationJoint Research CentreLife cycle assessmentLife cycle inventoryLife cycle impact assessmentLand use changeOrganisation Environmental FootprintQuantis Water DatabaseNationally Appropriate Mitigation ActionNon-methane volatile compoundsProduct Category RulesProduct Environmental FootprintProduct Environmental Footprint Category RulesSeptic tankSoil organic matterTechnological representativenessTime representativenessTechnical secretariatUnited Nations Environment ProgrammeUniversally unique identifier World Food LCA Database
TABLE OF CONTENTS
INTRODUCTION.............................................................................................................................................................1. BACKGROUND..........................................................................................................................................................2. OBJETIVES OF THIS GUIDE......................................................................................................................................3. WHO IS THIS GUIDE FOR?.....................................................................................................................................2. SETTING THE GOAL AND SCOPE OF THE EF STUDY........................................................................................2.1 DEFINING THE GOAL OF THE STUDY................................................................................................................2.2 SPECIFICATION OF THE COFFEE PRODUCT.....................................................................................................2.3 DEFINING THE FUNCTIONAL UNIT...................................................................................................................2.4 SYSTEM BOUNDARIES - LIFE CYCLE STAGES AND PROCESSES UNIT......................................................2.5 GEOGRAPHICAL AND TEMPORAL BOUNDARIESAND PROCESSES UNIT..............................................2.6 CUT-OFF RULES.....................................................................................................................................................2.7 DEALING WITH MULTI-OUTPUT PROCESSES — ALLOCATION RULES.....................................................2.8 SELECTION OF THE ENVIRONMENTAL IMPACT CATEGORIES....................................................................2.9 CLIMATE CHANGE MODELING...........................................................................................................................2.10 WARTER MODELING..........................................................................................................................................3. COLLECTING DATA..................................................................................................................................................3.1 INTRODUCTION....................................................................................................................................................3.2 DATA COLLECTION REQUIREMENTS ...............................................................................................................3.2.1 Green coffee cultivation, post-harvest production, and manufacturing..............................................3.2.2 Packaging.............................................................................................................................................................3.2.3 Use.........................................................................................................................................................................3.2.4 End-of-life.............................................................................................................................................................3.3 DATA SOURCES .....................................................................................................................................................3.3.1 Primary data — sampling................................................................................................................................3.3.1 Secundary data .................................................................................................................................................3.4 COFFEE CULTIVATION..........................................................................................................................................3.4.1 Introduction......................................................................................................................................................... 3.4.2 Coffee varieties...................................................................................................................................................3.4.3 Classification of cultivation systems...............................................................................................................3.4.4 Germination and nursery.................................................................................................................................3.4.5 Fiel preparation..................................................................................................................................................3.4.6 Crop growth........................................................................................................................................................3.4.7 Productivity and yield.........................................................................................................................................3.4.8 Fertilizer application..........................................................................................................................................3.4.9 Pesticide application and weed management............................................................................................3.4.10 Irrigation............................................................................................................................................................3,4.11 Machine Use.....................................................................................................................................................3.4.12 Transport...........................................................................................................................................................3.4.13 Pesticide emissions.........................................................................................................................................3.4.14 Nitrogen-related emissions from fertilizer application...........................................................................3.4.15 Phosphorus and phosphate ........................................................................................................................3.4.16 CO2 emissions from urea and lime applicationemissions to water..................................................3.4.17 Heavy metal emissions...................................................................................................................................3.4.19 Biogenic carbon uptakeemissions to water.............................................................................................3.4.20 Carbon stock of land use and transformation........................................................................................3.4.21 Land occupation and transformation........................................................................................................3.4.22 Harvesting........................................................................................................................................................3.4.23 Renovation.......................................................................................................................................................
8810101111111212141415161717191920212121212121222323232327272829293132333334343636363636393941
TABLE OF CONTENTS
3.5 POST-HARVEST PROCESSING ..........................................................................................................................3.5.1 Introduction.......................................................................................................................................................3.5.2 Mass balance.....................................................................................................................................................3.5.3 Water balance....................................................................................................................................................3.5.4 Energy demand..................................................................................................................................................3.5.5 Transport.............................................................................................................................................................3.5.6 Wastewater treatment and pollution..........................................................................................................3.5.7 Pulp treatment and related emissions.......................................................................................................3.6 COFFEE THRESHING........................................................................................................................................... 3.6.1 Introduction.......................................................................................................................................................3.6.2 Mass balance of coffee threshing.................................................................................................................3.6.3 Water balance....................................................................................................................................................3.6.4 Energy requirements.......................................................................................................................................3.6.5 Transport............................................................................................................................................................3.6.6 Water emissions................................................................................................................................................3.7 MANUFACTURING................................................................................................................................................3.7.1 Roasted and ground coffee............................................................................................................................3.7.2 Instant coffee.....................................................................................................................................................3.7.3 Default data for manufacturing......................................................................................................................3.8 PACKAGING...........................................................................................................................................................3.8.1 Post-harvest packaging...................................................................................................................................3.8.2 Packaging downstream....................................................................................................................................3.9 DISTRIBUTION.......................................................................................................................................................3.10 USE......................................................................................................................................................................... 3.10.1 Types of coffee................................................................................................................................................3.10-2 Coffee machine and kettle production, use, and maintenance.......................................................... 3.10.3 Cup and other dishware production and washing................................................................................3.10.4 Other ingredients...........................................................................................................................................3.11 END-OF-LIFE.........................................................................................................................................................4. IMPACT ASSESSMENT AND INTERPRETATION..................................................................................................4.1 GENERAL CONCEPT OF IMPACT ASSESSMENT.............................................................................................4.2 GENERAL CONCEPT INTERPRETATION........................................................................................................... 4.3 IDENTIFICATION OF ENVIRONMENTAL HOTSPOTS.....................................................................................4.4 IDENTIFICATION OF THE RELEVANT ENVIRONMENTAL ISSUES...............................................................4.5 BENCHMARKING..................................................................................................................................................4.6 DATA QUALITY AND UNCERTAINTY..................................................................................................................4.7 LIMITATIONS OF AN ENVIRONMENTAL FOOTPRINT STUDY....................................................................5. REPORTING AND COMMUNICATION.................................................................................................................5.1 REPORTING............................................................................................................................................................5.2 VERIFICATION AND VALIDATION...................................................................................................................... 5.3 COMMUNICATION...............................................................................................................................................6. ADDED VALUE AND CHALLENGES OF COLOMBIAN COMPANIES IN EVALUATING THE ENVIRONMENTAL FOOTPRINT...................................................................................7. IMPLEMENTATION OF ACTIONS.........................................................................................................................8. CONCLUSIONS AND RECOMMENDATIONS.....................................................................................................9. REFERENCES............................................................................................................................................................10. ANNEX ....................................................................................................................................................................10.1 TERMS AND DEFINITIONS................................................................................................................................10.2 PHOSPHATE EMISSIONS.................................................................................................................................. 10.3 HEAVY METAL EMISSIONS...............................................................................................................................
4141434344444448484849494949495050515153535353555556565757585860656566686869696969
7073798084848687
8
INTRODUCTION
Coffee has been grown in Colombia since the beginning of the 18th century and commercially cultivated since the 1850s. Arabica coffee cultivated in Colombia is of significant socioeconomic importance, representing 4% of current gross domestic product (GDP). More than 550,000 families cultivate coffee in Colombia, typically in mixed agricultural systems that combine coffee cultivation with cattle farming and plantain or maize cultivation, along with other farming activities. About 96% of coffee farms are classified as smallholders, cultivating five or less hectares of land (SICA, 2017). The total coffee cultivation area in Colombia covers 877.144 ha in 600 municipalities across 22 departments (Federación Nacional de Cafeteros de Colombia, 2018).
Adequate resource management is fundamental to any long-term socially responsible, environmentally friendly agricultural activity. The National Federation of Coffee Growers of Colombia (FNC) established an environmental strategy that envisions balancing economic progress, producer quality of life, and environmental resources. This environmental management strategy is mainly focused on i) adaptation and mitigation of climate change and climate risks and ii) efficient environmental resource management.
Coffee has been grown in Colombia since the beginning Besides the need for environmentally-friendly management practices from a coffee producer’s perspective, policy and business demands for data that supports environmental declarations in agricultural production are also growing.
Other initiatives and studies related to sustainable coffee production have also emerged over the last several years. Quantitative and life cycle-based assessments of the coffee supply chain have proven to be effective means to measure, monitor, minimize, and communicate coffee production’s potential environmental footprint.
1. BACKGROUND
PACKAGING(INCL. COFFEE DISPOSAL)
9
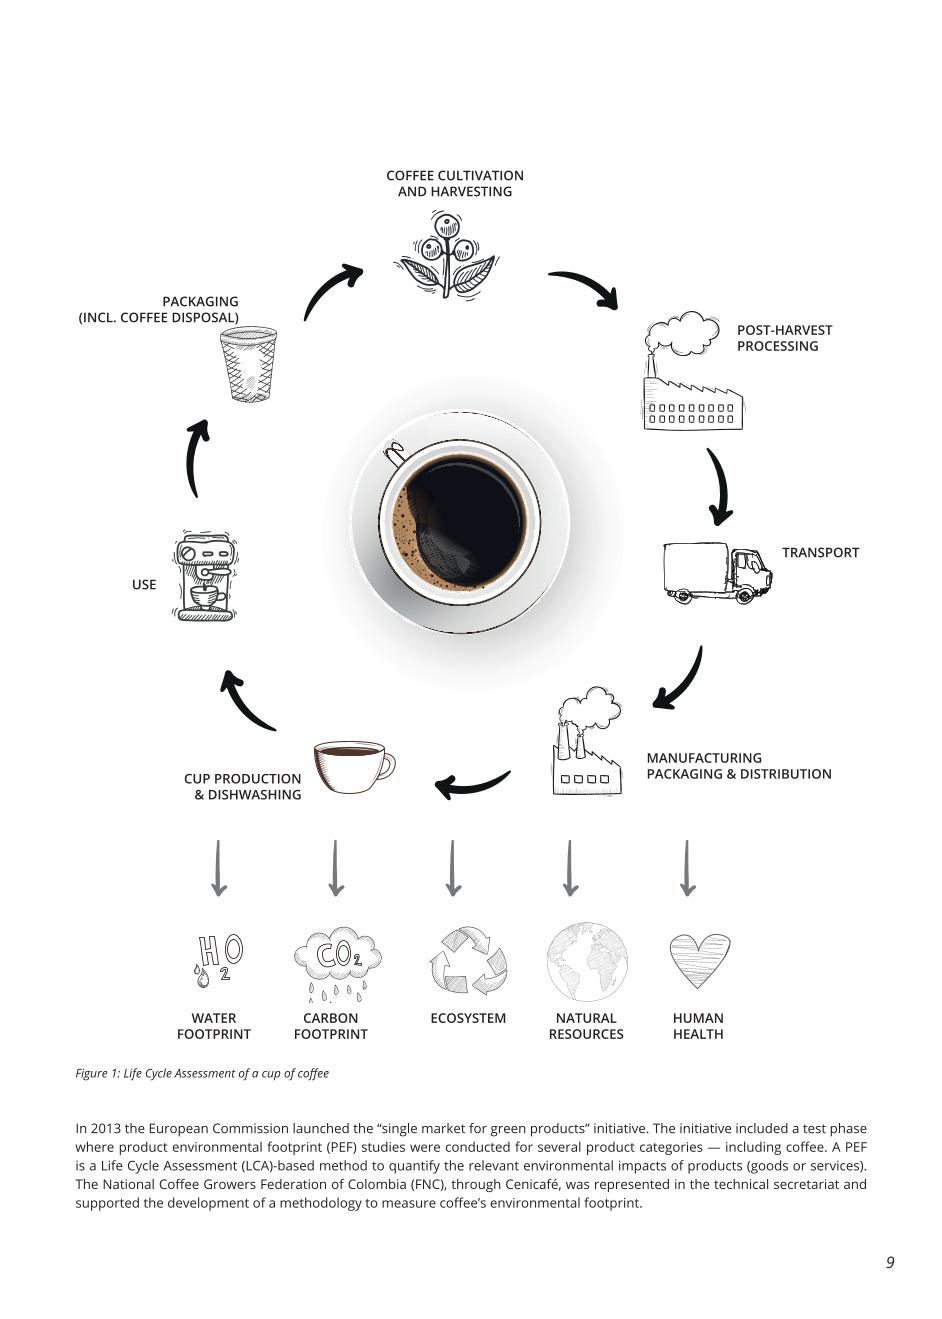
In 2013 the European Commission launched the “single market for green products” initiative. The initiative included a test phase where product environmental footprint (PEF) studies were conducted for several product categories — including coffee. A PEF is a Life Cycle Assessment (LCA)-based method to quantify the relevant environmental impacts of products (goods or services). The National Coffee Growers Federation of Colombia (FNC), through Cenicafé, was represented in the technical secretariat and supported the development of a methodology to measure coffee’s environmental footprint.
COFFEE CULTIVATION AND HARVESTING
POST-HARVESTPROCESSING
TRANSPORT
MANUFACTURINGPACKAGING & DISTRIBUTIONCUP PRODUCTION
& DISHWASHING
USE
PACKAGING(INCL. COFFEE DISPOSAL)
WATERFOOTPRINT
Figure 1: Life Cycle Assessment of a cup of coffee
CARBONFOOTPRINT
ECOSYSTEM NATURALRESOURCES
HUMANHEALTH
10
Between 2016 and 2020, the Swiss Agency for Development and Cooperation (SDC) - Global Programme Water, the National Business Association of Colombia - ANDI , the National Federation of Coffee Growers of Colombia - FNC, Cenicafe, Buencafe Liofilizado de Colombia, COLCAFÉ, Procafecol (Juan Valdez Stores), Almacafé, Quantis and the National Cleaner Production Center (CNPML); decided to move forward with applying PEF principles to selected Colombian coffee value chains. Thus, through the El Agua nos Une_SuizAgua initiative, SDC and the mentioned partners joined forces to develop the present Guide for the Evaluation of the Environmental Footprint of Coffee in Colombia. Data from 16 coffee farms, three coffee processing sites, and the largest coffee threshing facilities was gathered. However, calculating an environmental footprint is not straightforward since current local, national, regional, and global initiatives and studies differ significantly in terms of their goals and scopes, proposed methodologies, and data used to calculate the environmental footprint of coffee.
This guide establishes how to calculate a PEF-compliant environmental footprint for coffee in Colombia. This guide:
• Provides technical information about the methodology, default data, and indicators to calculate.
• Focuses on coffee cultivation and processing; other life cycle stages are only briefly described.
• Provides an overview of best practices related to coffee farming and post-harvest processing that can reduce the environmental footprint.
• Does not provide information about benchmarking and communication.
This technical guide is targeted toward experts in calculating environmental footprint results of coffee based on LCA concepts.
This technical guide is targeted toward experts in calculating environmental footprint results of coffee based on LCA concepts.
The guide is aligned with the draft PEFCR for coffee and, as much as possible, with other initiatives and standards such as the Water Footprint Network approach as implemented in GIA, the French PCR for green coffee (Syndicat Français du Café́, 2013), the carbon PCR on green coffee (Environdec, 2013), the Moka coffee and espresso PCR (Environdec, 2018, 2019), the World Food Life Cycle Database (Quantis, 2016), and ecoinvent v3 guidelines (Weidema et al., 2013).
Even though Colombia is the main focus of this guide, the methodology described for calculating coffee’s environmental footprint is potentially applicable to other countries in Latin America, and can contribute to standardizing environmental footprint calculations amongst all coffee-producing countries.
In that sense, in order to increase the consistency, comparability and quality of these environmental footprint studies; SDC, FNC, Quantis, and CNPML developed this guide to establish one consistent method for calculating the environmental footprint of coffee in Colombia that could also be useful for other Latin American countries. Furthermore, this guide is also meant to contribute to the development of a coffee PEF and to strengthening the regional and global efforts of ECLAC.
On both a national and local level, this guide and the pilot studies contribute to strengthening sustainable production and consumption decisions and actions by providing science-based information to rural coffee families, to companies such as Colcafé and Buencafé, as well as to other stakeholders in the coffee sector and to consumers.
2. OBJETIVES OF THIS GUIDE
3. WHO IS THIS GUIDE FOR?
1 The main reference of this guide is the PEFCR v6.3, which is based on several international standard such as ISO 14040/44. Consequently, terminology and methodology as used in PEF are followed.
11
It is key to clearly define the reason for carrying out a study (intended application) and to whom study results will be reported (intended audience) since this further determines the study’s course (e.g., level of detail, set of environmental footprints calculated, verification, etc.). Typical objectives include:
Internal decision making: identifying environmental hotspots supports environmental performance improvements and tracking, eco-design of products, and meaningful environmental management and corporate sustainability strategies.
Product categories considered in this guide include the following coffee life cycle stages:
• Green coffee delivered to port of origin (FOB) (CPA code A01.27.11 for “Coffee beans, not roasted” corresponding to UN CPC 01610 — “Coffee, green”)
• Bulk roasted and ground coffee at retail (CPA code 10.83.11 for “Coffee, decaffeinated or roasted”)
External communication (e.g., business to business (B2B), business to consumer (B2C)): sustainability reporting, raising investment capital, and marketing innovative products and
services2.
2. SETTING THE GOAL AND SCOPE OF THE EF STUDY
2.1 DEFINING THE GOAL OF THE STUDY
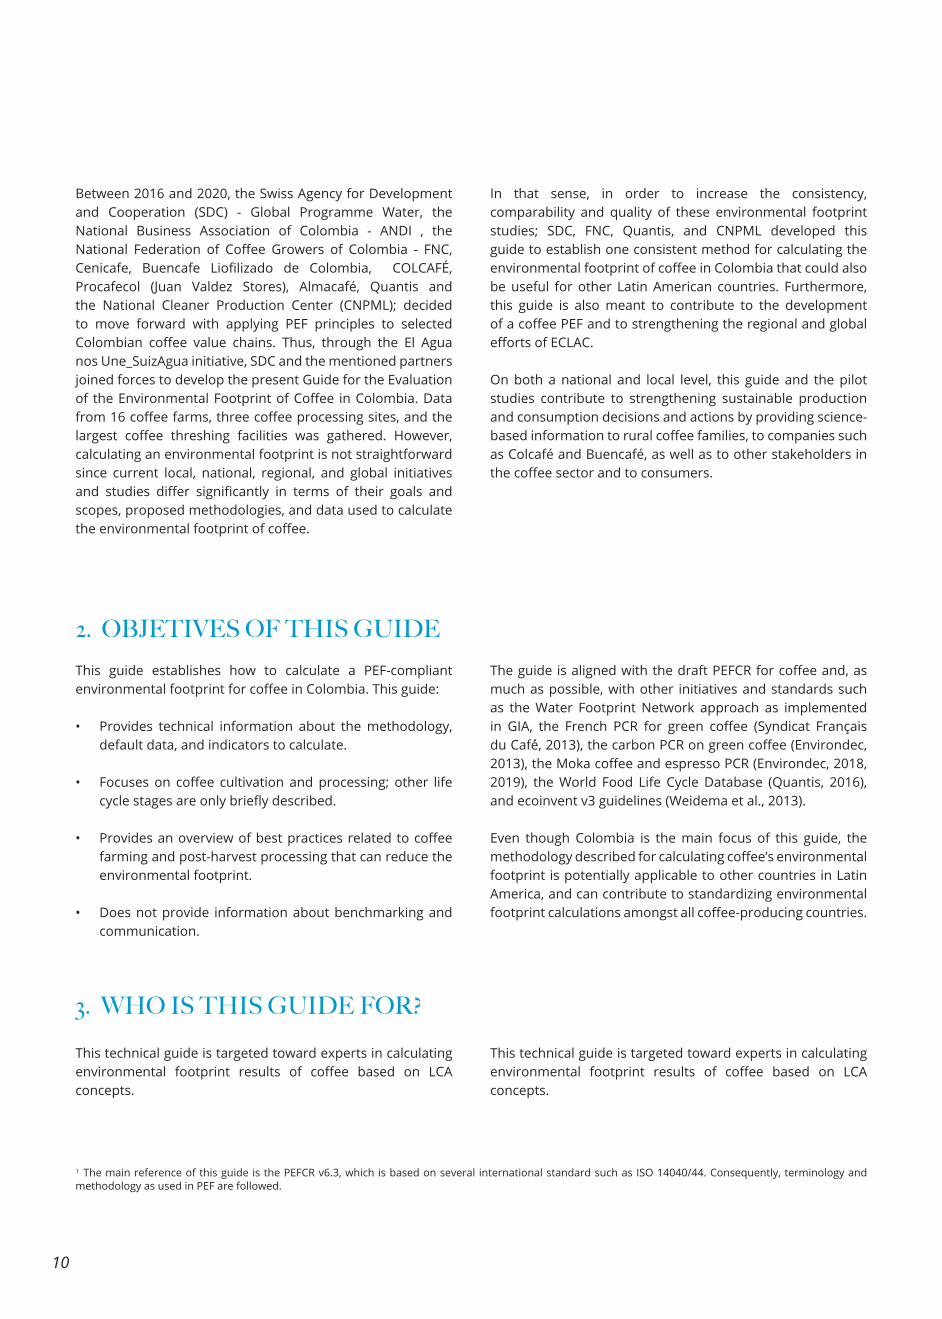
Incorporating life cycle thinking and sustainability management practices will improve image and brand value. An environmental footprint study of products, services, or an entire company allows for the identification of environmental hotspots along the value chain, and can be used to monitor progress and benchmark systems that fulfil the same function.
y1 y2 y3 y4
TIME OPTION A OPTION B
HOT-SPOT ANALYSIS MONITORING BENCHMARKING
Figure 2: Knowledge derived from environmental footprint assessment
2.2 SPECIFICATION OF THE COFFEE PRODUCTIf the entire life cycle of coffee (from cradle to grave) is assessed, use stage is modeled according to the draft PEFCR for coffee-based beverages, defined as follows:
• Coffee-based beverage: sold in any market and intended for end-consumers. Coffee-based beverages may include other ingredients such as sugar, cream, milk, and/or cocoa powder.
In any case, the scope of the analysis must be clearly stated.
2 Note that this guide focuses on EF calculation methodology and data, not on benchmarking and communication vehicles.
12
2.3 DEFINING THE FUNCTIONAL UNIT
The functional unit needs to be carefully defined, especially when results will be used for comparison or comparative assessment of products, processes, or services. Comparing functions (not products) is a key concept in environmental footprint studies. Suggested functional units for coffee are:
The default functional unit for green coffee is one kilogram. Unit conversion is typically required from “quintal,” the unit used by several Latin American countries to record coffee production (corresponding to 50 kg), to jute bags of 60 kilos of “arroba” (12.5 kg of coffee).The cup of coffee described in this guide is consumed at home. If consumed in a coffee shop, express store, or elsewhere, the footprint associated with the establishment should also be considered.
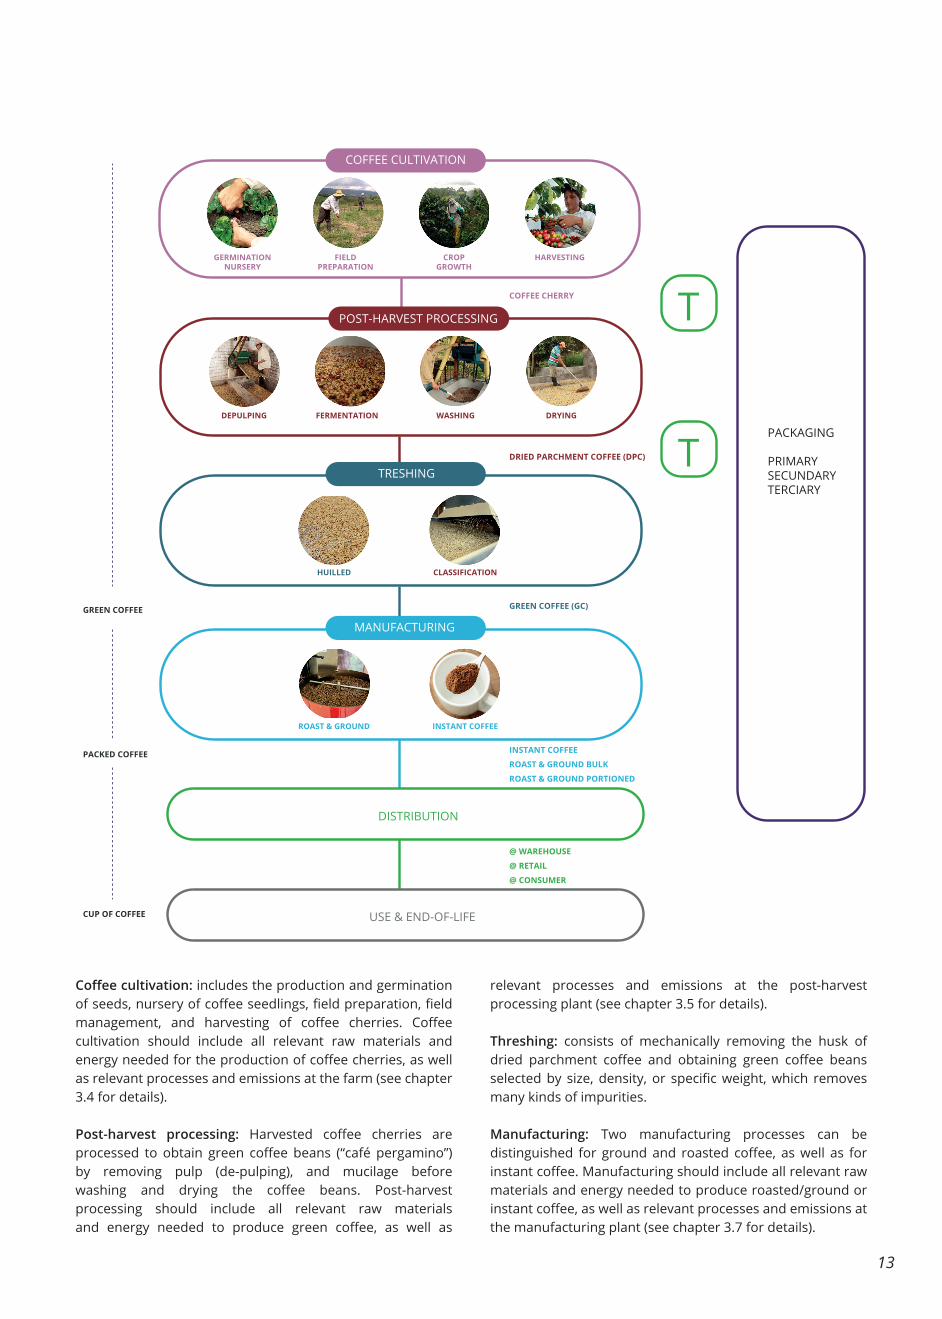
System boundaries should include all life cycle stages required to produce green coffee, roasted and ground coffee, or a coffee beverage (depending on the goal and scope of a study). Main life cycle stages are presented in Figure 3 and further described in the following sections.
Table 1: Key aspects to determine the unit of analysis (based on the draft PEFCR for coffee)
PRODUCT ASPECT GREEN COFFEE BEANS PACKED COFFEEAT RETAIL CUP OF COFFEE AT HOME
What? Function provided Green coffee beans Instant coffeeRoasted and ground coffee in bulkRoasted and ground sin-gle-serve coffee (capsules and pods)
Coffee-based beverage
How much? Magnitude of the function
One kilogram Dependent on product Typical serving size associated with specific technology (e.g., espresso machine, filter coffee, or instant coffee)
How long? Duration of the product provided
Once Once Once
How well? Expected level of quality
11.5% moisture when delivered to port of origin (FOB — free on board) or the roaster’s warehou-se; CIF (cost, insurance, and freight) if processed domestically
Typical serving characteristics (e.g. temperature) associated with technology
2.4 SYSTEM BOUNDARIES - LIFE CYCLE STAGES AND PROCESSES UNIT
13
2.4 SYSTEM BOUNDARIES - LIFE CYCLE STAGES AND PROCESSES UNIT
Coffee cultivation: includes the production and germination of seeds, nursery of coffee seedlings, field preparation, field management, and harvesting of coffee cherries. Coffee cultivation should include all relevant raw materials and energy needed for the production of coffee cherries, as well as relevant processes and emissions at the farm (see chapter 3.4 for details).
Post-harvest processing: Harvested coffee cherries are processed to obtain green coffee beans (“café pergamino”) by removing pulp (de-pulping), and mucilage before washing and drying the coffee beans. Post-harvest processing should include all relevant raw materials and energy needed to produce green coffee, as well as
relevant processes and emissions at the post-harvest processing plant (see chapter 3.5 for details).
Threshing: consists of mechanically removing the husk of dried parchment coffee and obtaining green coffee beans selected by size, density, or specific weight, which removes many kinds of impurities.
Manufacturing: Two manufacturing processes can be distinguished for ground and roasted coffee, as well as for instant coffee. Manufacturing should include all relevant raw materials and energy needed to produce roasted/ground or instant coffee, as well as relevant processes and emissions at the manufacturing plant (see chapter 3.7 for details).
COFFEE CULTIVATION
GERMINATIONNURSERY
FIELDPREPARATION
CROPGROWTH
HARVESTING
POST-HARVEST PROCESSING
DEPULPING FERMENTATION WASHING DRYING
HUILLED CLASSIFICATION
TRESHING
ROAST & GROUND INSTANT COFFEE
MANUFACTURING
COFFEE CHERRY
DRIED PARCHMENT COFFEE (DPC)
GREEN COFFEE
PACKED COFFEE
CUP OF COFFEE
GREEN COFFEE (GC)
INSTANT COFFEE
ROAST & GROUND BULK
ROAST & GROUND PORTIONED
@ WAREHOUSE
@ RETAIL
@ CONSUMER
DISTRIBUTION
USE & END-OF-LIFE
T
TPACKAGING
PRIMARYSECUNDARYTERCIARY
14
Packaging: According to the coffee PEFCR, three levels of packaging should be considered — primary, secondary, and tertiary.
• Primary packaging (at least in this guide) represents packaging that typically cannot be separated from the coffee until time of consumption (e.g., packaging in direct contact with the product, the lid, airtight laminated pockets used to protect capsules, and any labels attached to them).
• Secondary packaging is typically purchased by the consumer and can be separated from primary packaging before consumption (such as sleeves and boxes) without causing conservation problems.
• Tertiary packaging is used to ease distribution, and does not normally reach the consumer (e.g., pallets, packaging film, cardboard trays).
Packaging sourcing and manufacturing steps should be considered for each packaging material individually. It should include mining and extraction of resources, packaging processing, and transportation between the extraction and manufacturing sites.
Distribution: Distribution to consumers can also be part of the core activities, as some companies have direct control over this. Transport and distribution to consumers should take into account different potential shopping habits (transport by car, foot, bike, or public transport; home vs. office delivery). Transportation to the harbor, storage, loading onto a vessel, and transportation to consumers should be considered. These processes include vehicles used at distribution centers (e.g, forklifts), parking, lighting, and cleaning (including salt in the winter), fences, green area management, customer services such as bathrooms, coffee place within the retailer or at distribution centers, and waste collection infrastructure (at retailer).
Use stage: This stage should take into account coffee machine supply chains (incl. kettles), cups, washing, and beverage consumption. Different technologies include espresso machines, Moka pots, filter coffee, and instant coffee, among others.
Coffee machine return services, machine repairs, and replacement parts should be excluded from an analysis. These are mostly accounted for through the average lifetimes of machines, even if the impacts of repair centers and their logistics are quite different from the production and distribution of a new machine. Further, the ambient
storage place at home should also be excluded from an analysis.
If other ingredients (e.g., milk or sugar) are used, the production and supply, sourcing, and manufacturing steps should be considered for each ingredient. This includes farming activities, processing, and transportation from farms to consumers.
End-of-life stage: should consider collection at point of use (e.g., production and maintenance of the container, compost bag, etc.), waste transport from homes to collection and treatment centers, and waste treatment (incineration, landfilling, and recycling) of packaging, as well as the end-of-life of coffee grounds, coffee machines (incl. kettle), and cups.Waste collection place infrastructure (for end-of-life) should be excluded from an analysis.
Other processes to include (wherever they occur):
• Capital inputs manufacture (for equipment such as irrigation pumps).
• Employee transport to and from places of work.• Manufacturing of machinery sheds and other buildings.• Any other processes indirectly related to coffee production
(e.g., a company’s administrative functions). Any exclusions should be duly justified.
Data for core processes should be representative of actual production processes, as well as the site/region where a process takes place. The time boundary applied to calculations is an average of the three most recent consecutive years of coffee cultivation (European Commission, 2018).
Data for elementary flows to and from a product system contributing to a minimum of 99% of the environmental footprint should be included for all impact categories (see chapter 2.8). This does not include processes that are explicitly outside the system boundary as described in Section 2.4.
2.5 GEOGRAPHICAL AND TEMPORAL BOUNDARIESAND PROCESSES UNIT
2.6 CUT-OFF RULES
15
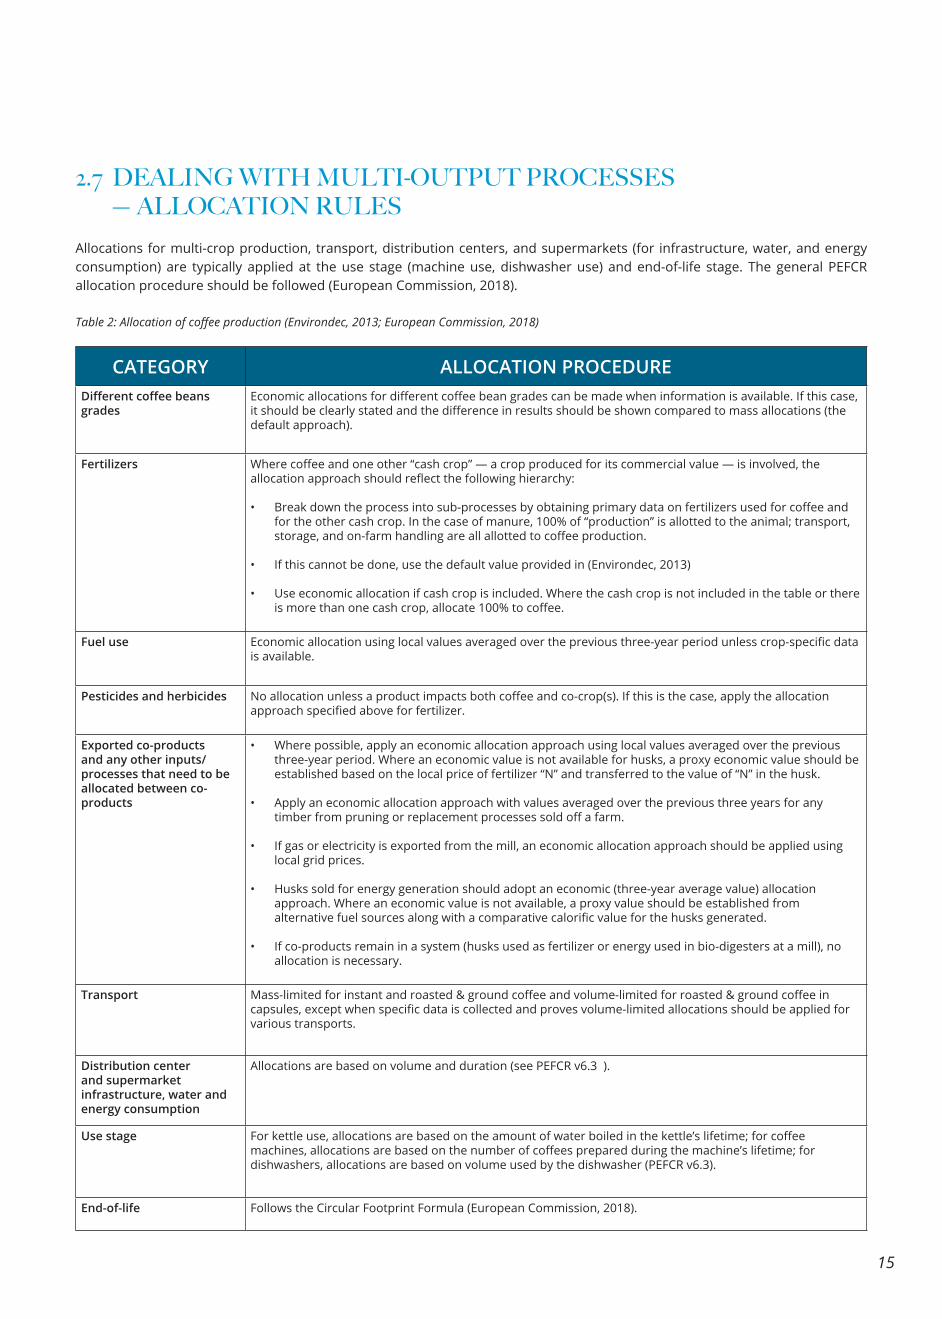
2.7 DEALING WITH MULTI-OUTPUT PROCESSES — ALLOCATION RULESAllocations for multi-crop production, transport, distribution centers, and supermarkets (for infrastructure, water, and energy consumption) are typically applied at the use stage (machine use, dishwasher use) and end-of-life stage. The general PEFCR allocation procedure should be followed (European Commission, 2018).
Table 2: Allocation of coffee production (Environdec, 2013; European Commission, 2018)
CATEGORY ALLOCATION PROCEDUREDifferent coffee beans grades
Economic allocations for different coffee bean grades can be made when information is available. If this case, it should be clearly stated and the difference in results should be shown compared to mass allocations (the default approach).
Fertilizers Where coffee and one other “cash crop” — a crop produced for its commercial value — is involved, the allocation approach should reflect the following hierarchy:
• Break down the process into sub-processes by obtaining primary data on fertilizers used for coffee and for the other cash crop. In the case of manure, 100% of “production” is allotted to the animal; transport, storage, and on-farm handling are all allotted to coffee production.
• If this cannot be done, use the default value provided in (Environdec, 2013)
• Use economic allocation if cash crop is included. Where the cash crop is not included in the table or there is more than one cash crop, allocate 100% to coffee.
Fuel use Economic allocation using local values averaged over the previous three-year period unless crop-specific data is available.
Pesticides and herbicides No allocation unless a product impacts both coffee and co-crop(s). If this is the case, apply the allocation approach specified above for fertilizer.
Exported co-products and any other inputs/ processes that need to be allocated between co-products
• Where possible, apply an economic allocation approach using local values averaged over the previous three-year period. Where an economic value is not available for husks, a proxy economic value should be established based on the local price of fertilizer “N” and transferred to the value of “N” in the husk.
• Apply an economic allocation approach with values averaged over the previous three years for any timber from pruning or replacement processes sold off a farm.
• If gas or electricity is exported from the mill, an economic allocation approach should be applied using local grid prices.
• Husks sold for energy generation should adopt an economic (three-year average value) allocation approach. Where an economic value is not available, a proxy value should be established from alternative fuel sources along with a comparative calorific value for the husks generated.
• If co-products remain in a system (husks used as fertilizer or energy used in bio-digesters at a mill), no allocation is necessary.
Transport Mass-limited for instant and roasted & ground coffee and volume-limited for roasted & ground coffee in capsules, except when specific data is collected and proves volume-limited allocations should be applied for various transports.
Distribution center and supermarket infrastructure, water and energy consumption
Allocations are based on volume and duration (see PEFCR v6.3 ).
Use stage For kettle use, allocations are based on the amount of water boiled in the kettle’s lifetime; for coffee machines, allocations are based on the number of coffees prepared during the machine’s lifetime; for dishwashers, allocations are based on volume used by the dishwasher (PEFCR v6.3).
End-of-life Follows the Circular Footprint Formula (European Commission, 2018).
16
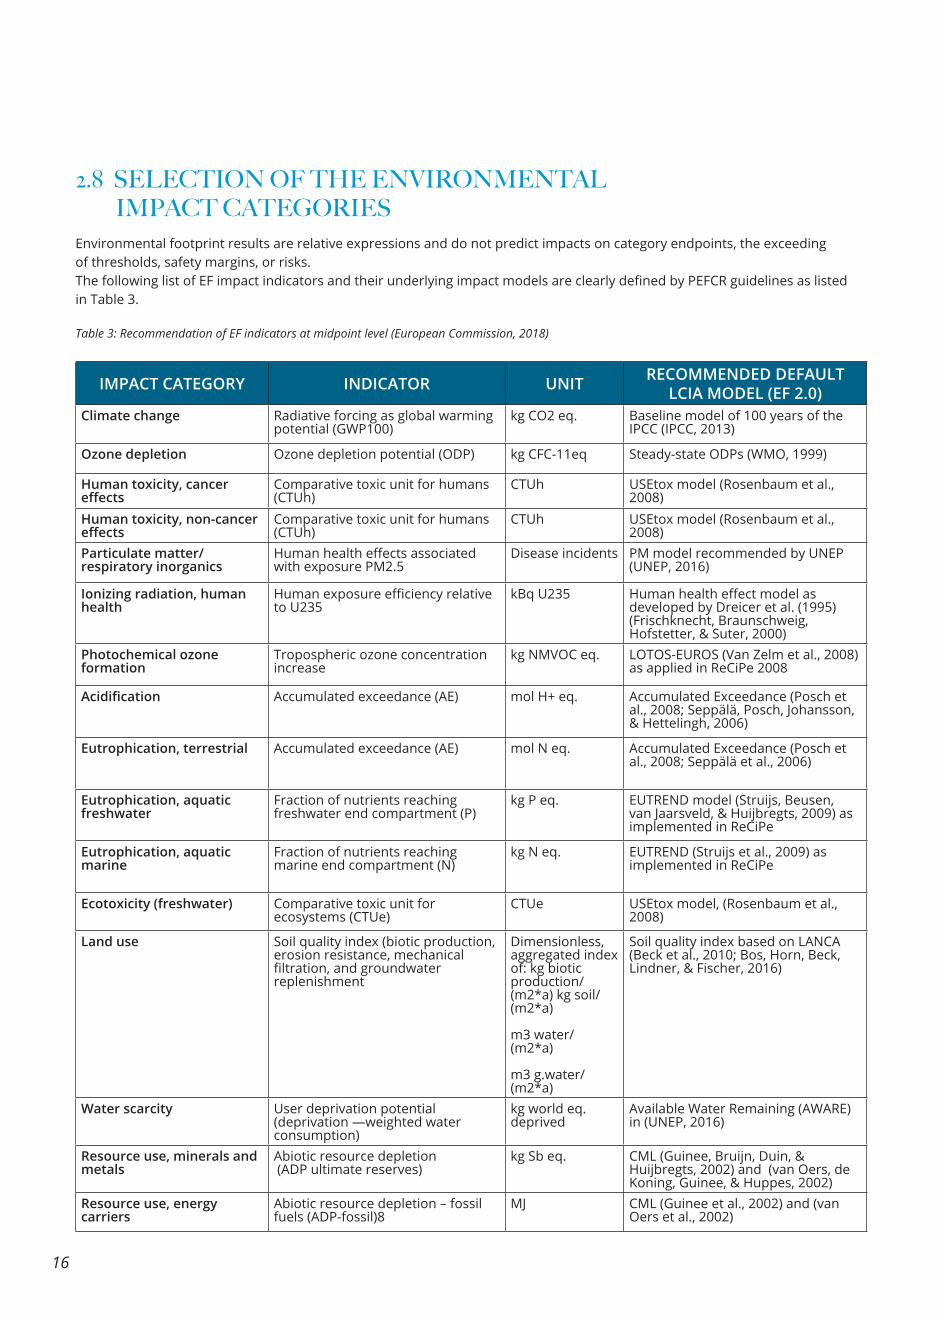
2.8 SELECTION OF THE ENVIRONMENTAL IMPACT CATEGORIESEnvironmental footprint results are relative expressions and do not predict impacts on category endpoints, the exceeding of thresholds, safety margins, or risks. The following list of EF impact indicators and their underlying impact models are clearly defined by PEFCR guidelines as listed in Table 3.
Table 3: Recommendation of EF indicators at midpoint level (European Commission, 2018)
IMPACT CATEGORY INDICATOR UNIT RECOMMENDED DEFAULT LCIA MODEL (EF 2.0)
Climate change Radiative forcing as global warming potential (GWP100)
kg CO2 eq. Baseline model of 100 years of the IPCC (IPCC, 2013)
Ozone depletion Ozone depletion potential (ODP) kg CFC-11eq Steady-state ODPs (WMO, 1999)
Human toxicity, cancer effects
Comparative toxic unit for humans (CTUh)
CTUh USEtox model (Rosenbaum et al., 2008)
Human toxicity, non-cancer effects
Comparative toxic unit for humans (CTUh)
CTUh USEtox model (Rosenbaum et al., 2008)
Particulate matter/respiratory inorganics
Human health effects associated with exposure PM2.5
Disease incidents PM model recommended by UNEP (UNEP, 2016)
Ionizing radiation, human health
Human exposure efficiency relative to U235
kBq U235 Human health effect model as developed by Dreicer et al. (1995)(Frischknecht, Braunschweig, Hofstetter, & Suter, 2000)
Photochemical ozone formation
Tropospheric ozone concentration increase
kg NMVOC eq. LOTOS-EUROS (Van Zelm et al., 2008)as applied in ReCiPe 2008
Acidification Accumulated exceedance (AE) mol H+ eq. Accumulated Exceedance (Posch et al., 2008; Seppälä, Posch, Johansson, & Hettelingh, 2006)
Eutrophication, terrestrial Accumulated exceedance (AE) mol N eq. Accumulated Exceedance (Posch et al., 2008; Seppälä et al., 2006)
Eutrophication, aquatic freshwater
Fraction of nutrients reaching freshwater end compartment (P)
kg P eq. EUTREND model (Struijs, Beusen, van Jaarsveld, & Huijbregts, 2009) as implemented in ReCiPe
Eutrophication, aquatic marine
Fraction of nutrients reaching marine end compartment (N)
kg N eq. EUTREND (Struijs et al., 2009) as implemented in ReCiPe
Ecotoxicity (freshwater) Comparative toxic unit for ecosystems (CTUe)
CTUe USEtox model, (Rosenbaum et al., 2008)
Land use Soil quality index (biotic production, erosion resistance, mechanical filtration, and groundwater replenishment
Dimensionless, aggregated index of: kg biotic production/ (m2*a) kg soil/ (m2*a)
m3 water/ (m2*a)
m3 g.water/ (m2*a)
Soil quality index based on LANCA (Beck et al., 2010; Bos, Horn, Beck, Lindner, & Fischer, 2016)
Water scarcity User deprivation potential (deprivation —weighted water consumption)
kg world eq. deprived
Available Water Remaining (AWARE) in (UNEP, 2016)
Resource use, minerals and metals
Abiotic resource depletion (ADP ultimate reserves)
kg Sb eq. CML (Guinee, Bruijn, Duin, & Huijbregts, 2002) and (van Oers, de Koning, Guinee, & Huppes, 2002)
Resource use, energy carriers
Abiotic resource depletion – fossil fuels (ADP-fossil)8
MJ CML (Guinee et al., 2002) and (van Oers et al., 2002)
17
Other standards and initiatives might require a different set of indicators —
• PEF versions: Impact categories and models are under development. This guide uses the v2.0 characterization, normalization, and weighting factors as used in the PEF pilot phase. EF v3.0 is currently under development, with significant changes especially to the toxicity indicators expected: https://eplca.jrc.ec.europa.eu/LCDN/developerEF.xhtml.
• PCR of mocha and espresso coffee require the reporting of environmental impacts for Type III environmental declaration (an environmental declaration providing quantified environmental data using predetermined parameters and, where relevant, additional environmental information (ISO, 2006c)). The indicator list includes (Environdec, 2018, 2019):
° Impact indicators (e.g., global warming potential, acidification potential, eutrophication potential, formation of tropospheric ozone, abiotic depletion potential fossil and elements, water scarcity potential)
° Resource use (e.g., primary energy resources — renewable and non-renewable, secondary material, secondary fuels — non-renewable and renewable, net use of fresh water),
° Waste production and flows ° Other environmental information (e.g., certification)
• Carbon footprint studies: The global warming potential indicator as defined by IPCC is typically the same for all studies (Bhatia et al., 2018; BSI, 2011, 2012; ISO, 2013; Penny, Fisher, & Collins, 2012).
• WFN: blue, green, and grey water footprints as defined by the WFN (WFN, 2019). These footprints are inventory indicators (water quantities rather than impact indicators) and, consequently, are different from the ISO 14046 (ISO, 2017b) and PEF indicators.
Depending on a study’s goal and scope, only a subset of the information described in the next chapter may be considered. For example, if a study’s goal is to measure the water scarcity footprint, then information related to water quality or carbon footprint is not needed — so air, water, and soil emissions do not need to be collected.
A list of normalization and weighting factors are available in Annex A of the PEFCR v6.3 for use in identifying the most relevant environmental footprint impact categories (see chapter 4.4).
According to PEFCR v6.3, carbon emissions should be separated into three different categories:
• Fossil carbon accounts for all carbon emissions originating from the oxidation and/or reduction of fossil fuels. This impact category also includes emissions from peat and the calcination/carbonation of limestone.
• Biogenic carbon: A simplified approach should be used where only flows that influence climate change impact results (namely biogenic methane emissions) are modeled. For cradle-to-grave assessments of final products with a lifetime beyond 100 years, a carbon credit should be modeled. For intermediate products (cradle-to-gate), a final product’s lifetime is unknown. Therefore, no carbon credits should be modeled at this point in the life cycle. Biogenic carbon content at factory gate (physical content and allocated content) should always be reported as “additional technical information.”
• Land use change is a sub-category that accounts for carbon uptakes and emissions (CO2, CO, and CH4) originating from carbon stock changes caused by land use change and land use. All carbon emissions and removals should be modeled following the PAS 2050:2011 (BSI, 2011) modeling guidelines and the PAS2050-1:2012 (BSI, 2012) supplementary document for horticultural products.
2.9 CLIMATE CHANGE MODELING
2.10 WARTER MODELING
According to PEFCR v6.3, carbon emissions should be Suggested inventory indicators for all water footprint studies include water withdrawal, water consumption, and water release.
Water withdrawal includes the sum of all volumes of water used in the life cycle of a product, with the exception of water used in turbines (for hydropower production). In-stream water use is not considered as water withdrawal, and if the Quantis Water Database (QWDB) is used, the water balance should be checked for processes with high amounts of turbined water (e.g., hydropower). Off-stream use is considered as water withdrawn, which includes water that evaporates, is consumed, or released again downstream. Drinking water, irrigation water, and water for and in industrialized processes (including cooling water) is all taken into account. Freshwater and seawater are both considered (and should be excluded or reported separately).
18
Water consumption is often used to describe water removed from, but not returned to, the same drainage basin. Water consumption is the result of evaporation, transpiration, integration into a product, or release into a different drainage basin or the sea. Change in evaporation caused by land use change is typically considered water consumption (e.g., reservoir for hydropower). However, dams also often regulate water flows and can help reduce water stress in dry periods. Consequently, evaporation as the result of land use change should only be accounted for if these temporal aspects are also considered (see example in ISO 14073). Otherwise, we suggest not considering evaporation from dams in a water scarcity assessment. The same might also apply to artificial reservoirs regulating water availability for companies. The net green water change related to land use change should not be considered in a water footprint assessment, as this could lead to misinterpretation (e.g., cutting of primary forests leads to a reduction of the green water footprint). Water consumption is not always measured and monitored by companies, but can be extrapolated indirectly based on water withdrawal and release.
Water release is water that is returned either directly to the environment or to a wastewater treatment system, typically in a different quality than water withdrawn.
Depending on the scope of a study, additional information concerning temporal and geographic aspects, as well as water quality, also need to be considered. See the following standards and guides (Gmünder et al., 2018; ISO, 2014, 2017b, 2017a) for more details on water footprinting.
4 In-stream water use includes, for example, hydropower, navigation, fishing, or recreational activities that take place within a stream channel.
5 The QWDB is based on ecoinvent v2.2 data. Water balance is computed for each unit process. More information under:
https://quantis-intl.com/wp-content/uploads/2017/02/wdb_technicalreport_2012-03-19_quantis-1.pdf
6 The water withdrawal can be calculated as „water released (exlc. water turbined)” + “water consumed”
19
3. COLLECTING DATA3.1 INTRODUCTION
Other standards and initiatives might require a different set Actual data collection and system modeling are done in the life cycle inventory (LCI) phase. Both are done in line with the goals defined in and requirements derived during the scope phase. LCI results are then used as inputs in the subsequent EF impact assessment phase. LCI results also provide feedback regarding the scope, as initial scope settings often need adjusting.
Typically, the LCI phase — including data collection, acquisition, and modeling — requires the most effort and highest number of resources of an LCA.
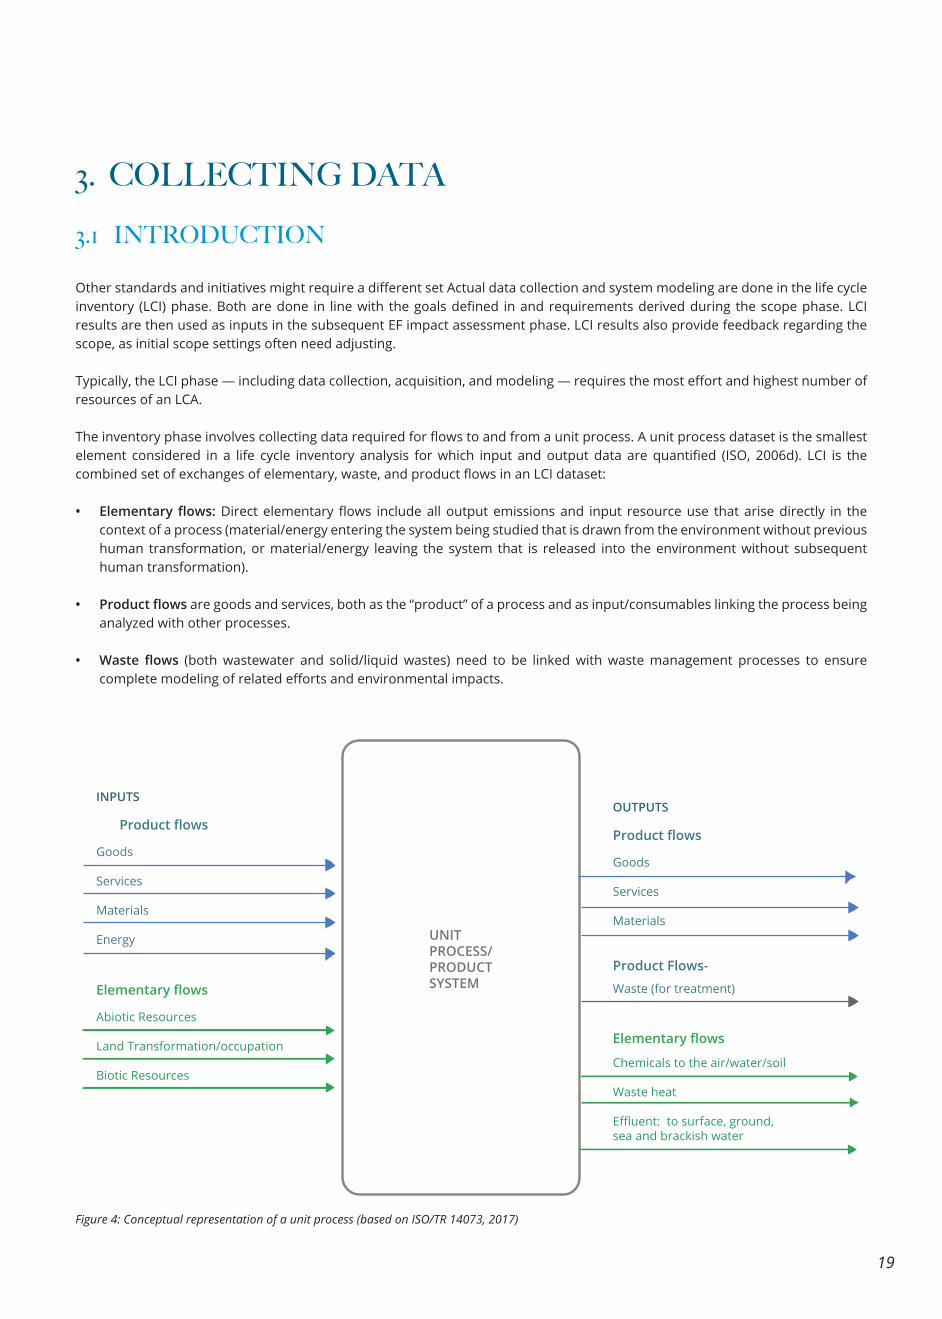
The inventory phase involves collecting data required for flows to and from a unit process. A unit process dataset is the smallest element considered in a life cycle inventory analysis for which input and output data are quantified (ISO, 2006d). LCI is the combined set of exchanges of elementary, waste, and product flows in an LCI dataset:
• Elementary flows: Direct elementary flows include all output emissions and input resource use that arise directly in the context of a process (material/energy entering the system being studied that is drawn from the environment without previous human transformation, or material/energy leaving the system that is released into the environment without subsequent human transformation).
• Product flows are goods and services, both as the “product” of a process and as input/consumables linking the process being analyzed with other processes.
• Waste flows (both wastewater and solid/liquid wastes) need to be linked with waste management processes to ensure complete modeling of related efforts and environmental impacts.
INPUTS
Product flows
Goods
Services
Materials
Energy
Elementary flows
Abiotic Resources
Land Transformation/occupation
Biotic Resources
Elementary flows
Chemicals to the air/water/soil
Waste heat
Effluent: to surface, ground,sea and brackish water
OUTPUTS
Product flows
Product Flows-
Goods
Services
Materials
Waste (for treatment)
UNITPROCESS/PRODUCTSYSTEM
Figure 4: Conceptual representation of a unit process (based on ISO/TR 14073, 2017)
20
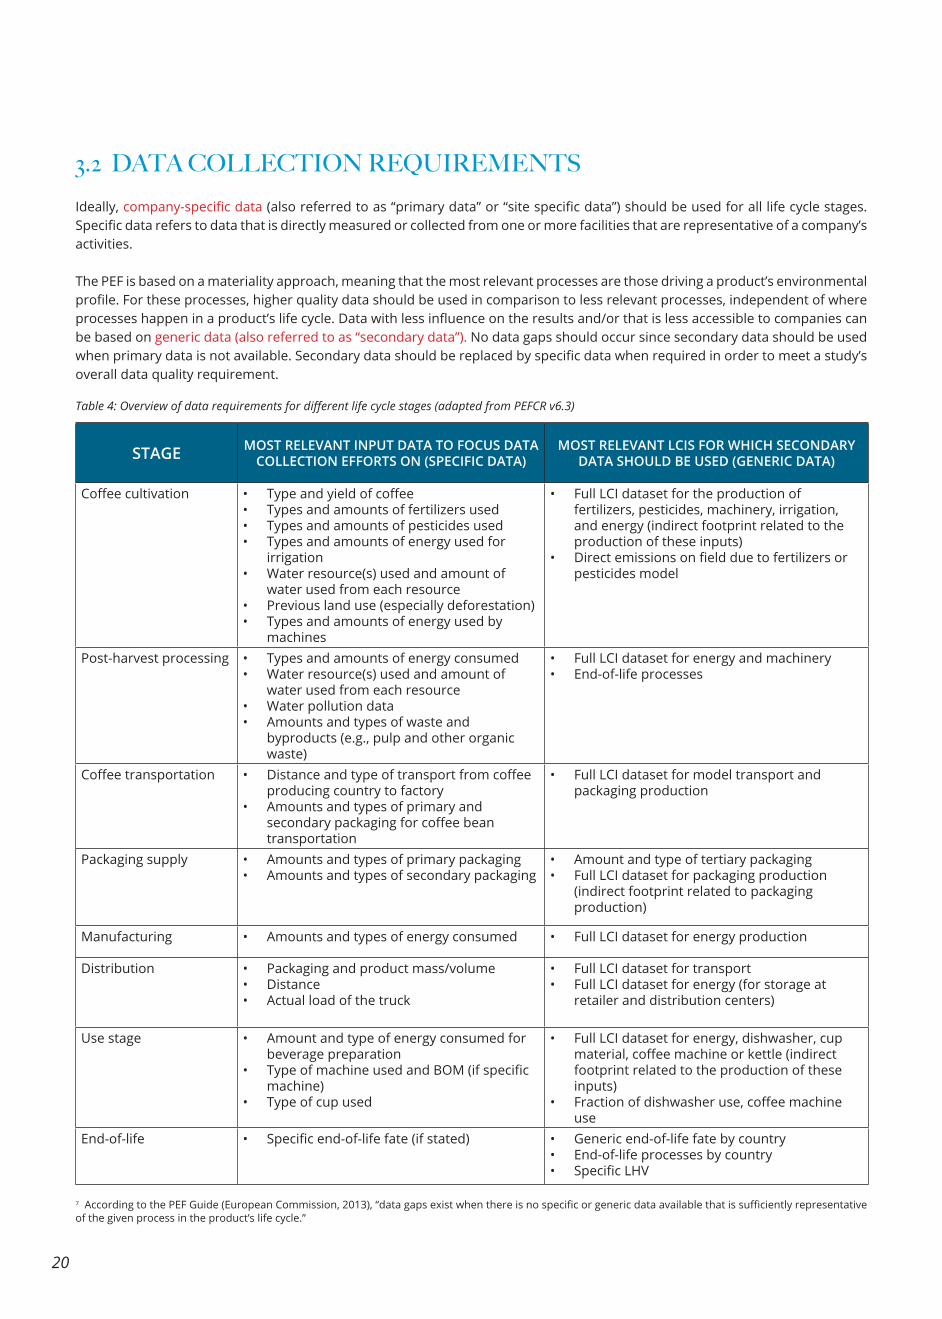
3.2 DATA COLLECTION REQUIREMENTSIdeally, company-specific data (also referred to as “primary data” or “site specific data”) should be used for all life cycle stages. Specific data refers to data that is directly measured or collected from one or more facilities that are representative of a company’s activities.
The PEF is based on a materiality approach, meaning that the most relevant processes are those driving a product’s environmental profile. For these processes, higher quality data should be used in comparison to less relevant processes, independent of where processes happen in a product’s life cycle. Data with less influence on the results and/or that is less accessible to companies can be based on generic data (also referred to as “secondary data”). No data gaps should occur since secondary data should be used when primary data is not available. Secondary data should be replaced by specific data when required in order to meet a study’s overall data quality requirement.
STAGE MOST RELEVANT INPUT DATA TO FOCUS DATA COLLECTION EFFORTS ON (SPECIFIC DATA)
MOST RELEVANT LCIS FOR WHICH SECONDARY DATA SHOULD BE USED (GENERIC DATA)
Coffee cultivation • Type and yield of coffee • Types and amounts of fertilizers used• Types and amounts of pesticides used• Types and amounts of energy used for
irrigation• Water resource(s) used and amount of
water used from each resource• Previous land use (especially deforestation)• Types and amounts of energy used by
machines
• Full LCI dataset for the production of fertilizers, pesticides, machinery, irrigation, and energy (indirect footprint related to the production of these inputs)
• Direct emissions on field due to fertilizers or pesticides model
Post-harvest processing • Types and amounts of energy consumed • Water resource(s) used and amount of
water used from each resource• Water pollution data • Amounts and types of waste and
byproducts (e.g., pulp and other organic waste)
• Full LCI dataset for energy and machinery• End-of-life processes
Coffee transportation • Distance and type of transport from coffee producing country to factory
• Amounts and types of primary and secondary packaging for coffee bean transportation
• Full LCI dataset for model transport and packaging production
Packaging supply • Amounts and types of primary packaging • Amounts and types of secondary packaging
• Amount and type of tertiary packaging • Full LCI dataset for packaging production
(indirect footprint related to packaging production)
Manufacturing • Amounts and types of energy consumed • Full LCI dataset for energy production
Distribution • Packaging and product mass/volume • Distance• Actual load of the truck
• Full LCI dataset for transport • Full LCI dataset for energy (for storage at
retailer and distribution centers)
Use stage • Amount and type of energy consumed for beverage preparation
• Type of machine used and BOM (if specific machine)
• Type of cup used
• Full LCI dataset for energy, dishwasher, cup material, coffee machine or kettle (indirect footprint related to the production of these inputs)
• Fraction of dishwasher use, coffee machine use
End-of-life • Specific end-of-life fate (if stated) • Generic end-of-life fate by country • End-of-life processes by country • Specific LHV
Table 4: Overview of data requirements for different life cycle stages (adapted from PEFCR v6.3)
7 According to the PEF Guide (European Commission, 2013), “data gaps exist when there is no specific or generic data available that is sufficiently representative of the given process in the product’s life cycle.”
21
3.2.1 Green coffee cultivation, post-harvest production, and manufacturing
3.2.2 Packaging
The green coffee PEFCR provides the following data requirements: When the scope of the analysis is green coffee cultivation or packed coffee, primary/site-specific data should be collected for coffee cultivation, processing, and transportation. Specific requirements are described in the following sections.
For coffee cultivation, specific crop type and country/region or climate-specific data for yield, water, land use, land use change, fertilizer (artificial and organic) amount (N, P amount), and pesticide amount (per active ingredient) per hectare per year should be used.
For perennial plants (including entire plants and edible portions of perennial plants), a steady state situation (i.e., where all development stages are proportionally represented in the time period studied) should be assumed using a three-year period to estimate inputs and outputs.
Where different stages in a cultivation cycle are known to be disproportional, a correction should be made by adjusting the allotted crop areas to different development stages in proportion to the crop areas expected in a theoretical steady state. Corrections should be justified and recorded. The life cycle inventory of perennial plants and crops should not be undertaken until a production system actually yields outputs. Data for the past three years should be averaged. “Non-productive years” and very big or very low values should be treated correctly (values should be excluded or still accounted for depending on the type of data).
When the scope is a coffee beverage, generic data can be used for green coffee cultivation as published in the draft PEFCR of coffee due to the difficulty of collecting this data (Quantis, 2016).
Coffee machine production and use can be a relevant process as shown by the PEF coffee screening study results. Therefore, specific data should be used for coffee machine production and use when a machine’s brand is specified in a study (Quantis, 2016). A list of specific coffee machine production and use data to collect can be found in section 3.10.
When a brand is not specified, semi-specific data may be used. Note that some coffee machines include a cup in the machine itself. In this case, specific cup type data should be used.
If the company has specific dedicated capsule collection and treatment systems, end-of-life should be modeled using specific data (Quantis, 2016). The end-of-life model should follow the requirements described in section 3.11
Primary data should be representative of actual production processes and the site/region where processes take place. Primary data can be obtained using three different sampling approaches ((Environdec, 2013).
Complete sampling: In some cases, it may be practical or advisable to sample all sites that produce a certain product. These cases will likely arise when there are a small number of sites or when sites are highly variable, e.g., when produce is sourced across multiple geographies.
8 The underlying assumption in the cradle-to-gate life cycle inventory assessment of horticultural products is that cultivation inputs and outputs are in a “steady state,” which means that all development stages of perennial crops (with different input and output quantities) should be proportionally represented in the cultivation time period studied. The advantage of this approach is that inputs and outputs from a relatively short period can be used to calculate the cradle-to-gate life cycle inventory of a perennial crop product. Horticultural perennial crops can have a lifespan of 30 years or more (e.g., in case of fruit and nut trees).
When a brand of coffee is specified in a study, specific data should be used for primary and secondary packaging (Quantis, 2016). A list of specific packaging data to collect can be found in section 3.8.When the brand is not specified, semi-specific data may be used.
3.2.3 Use
3.2.4 End-of-life
3.3.1 Primary data — sampling
3.3 DATA SOURCES
This guide uses different data sources to provide default values that, ideally, reflect average Colombian coffee production.
22
Random sampling: In cases where there are many sites that are likely to be very similar in nature, random sampling may be appropriate to obtain an average dataset.
Stratified sampling: In situations where there are a large number of farms to sample that vary significantly, a random sample may miss important aspects of this variation. In these cases, a stratified approach to sampling should be favored.If complete sampling is not feasible, a stratified sample will achieve greater precision than a simple random sample provided that sub-populations (strata) have been chosen so that items from the same sub-population have characteristics (at least with regards to those being studied) that are as similar as possible. For PEFCR, a stratified sample should be used.
This guide uses field data from 16 coffee farms located in Colombia’s north, center, and south coffee regions: Antioquia (8), Caldas (3), Cauca (1), Cesar (1), Tolima (1), Qundio (1), and Risaralda (1). The farming areas range from two to 200 ha, and are located at altitudes between 1150m and 1950 m. Twelve farms use shading or semi-shading cultivation systems, while six farms are sun-exposed. Seven of the coffee farms are experimental sites from CENICAFE. The sample size obviously does not allow for the establishment of national average values.
Primary data for coffee processing is provided (complete sampling) in subsequent chapters.
This study uses different secondary data sources, including:National statistics from FNC publications include official statistics and best practices. These publications describe coffee cultivation, processing, and manufacturing in Colombia. The FNC has conducted research on coffee production, harvesting methods, wet mill processes, quality, and by-product management. Their research is used in this guide (Arcila Pulgarín, Farfan, Moreno, Salazar, & Hincapie, 2007; Federación Nacional de Cafeteros de Colombia, 2018; S. Sadeghian & Jaramillo Robledo, 2017).
NAMA Colombia, which presents statistics related to coffee production in Colombia, a description of all phases of coffee production, and GHG quantification (Lavola et al., 2019).Environmental footprint standards and databases such as the PEFCR, ecoinvent, and WFLDB, used to retrieve scientific modeling principles, methods, and approaches for quantifying the environmental impacts associated with all processing phases.
Background LCI database: Specialized databases are commonly used to calculate indirect environmental footprints. Some databases are available for free and others at a certain cost. The main LCI databases are ecoinvent, Gabi, and the PEF/OEF database, among others.Other literature values and expert estimates
3.3.2 Secondary data
23
3.4 COFFEE CULTIVATION
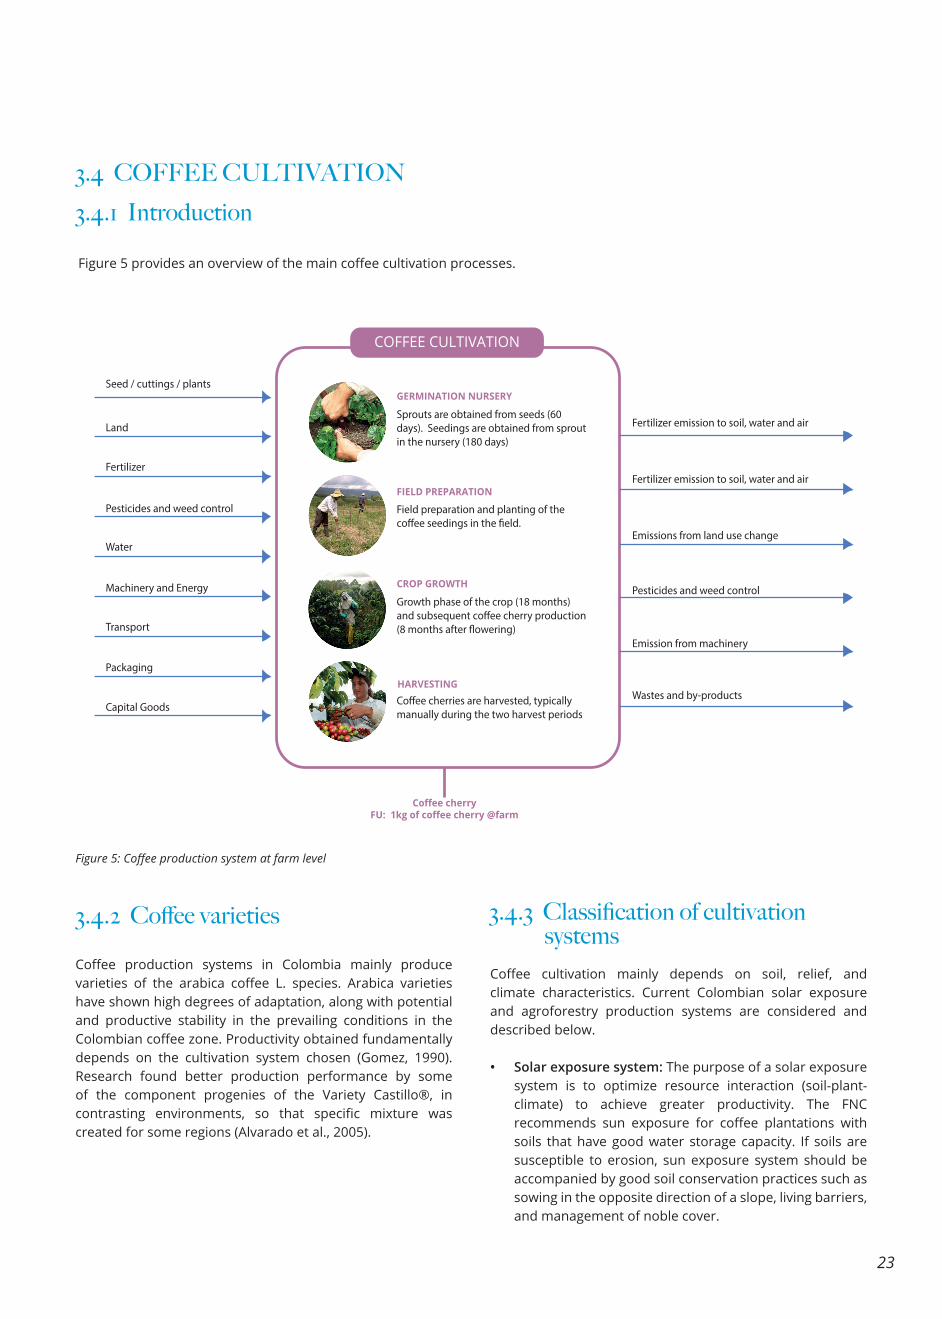
Figure 5 provides an overview of the main coffee cultivation processes.
3.4.1 Introduction
COFFEE CULTIVATION
GERMINATION NURSERY
Sprouts are obtained from seeds (60 days). Seedings are obtained from sprout in the nursery (180 days)
FIELD PREPARATION
Field preparation and planting of the co�ee seedings in the �eld.
CROP GROWTH
Growth phase of the crop (18 months) and subsequent co�ee cherry production (8 months after �owering)
HARVESTINGCo�ee cherries are harvested, typically manually during the two harvest periods
Fertilizer emission to soil, water and air
Seed / cuttings / plants
Land
Fertilizer
Pesticides and weed control
Water
Machinery and Energy
Transport
Packaging
Capital Goods
Fertilizer emission to soil, water and air
Emissions from land use change
Pesticides and weed control
Emission from machinery
Wastes and by-products
Coffee cherryFU: 1kg of coffee cherry @farm
Figure 5: Coffee production system at farm level
3.4.2 Coffee varieties
Coffee production systems in Colombia mainly produce varieties of the arabica coffee L. species. Arabica varieties have shown high degrees of adaptation, along with potential and productive stability in the prevailing conditions in the Colombian coffee zone. Productivity obtained fundamentally depends on the cultivation system chosen (Gomez, 1990). Research found better production performance by some of the component progenies of the Variety Castillo®, in contrasting environments, so that specific mixture was created for some regions (Alvarado et al., 2005).
3.4.3 Classification of cultivation systemsCoffee cultivation mainly depends on soil, relief, and climate characteristics. Current Colombian solar exposure and agroforestry production systems are considered and described below.
• Solar exposure system: The purpose of a solar exposure system is to optimize resource interaction (soil-plant-climate) to achieve greater productivity. The FNC recommends sun exposure for coffee plantations with soils that have good water storage capacity. If soils are susceptible to erosion, sun exposure system should be accompanied by good soil conservation practices such as sowing in the opposite direction of a slope, living barriers, and management of noble cover.
24
• Agroforestry systems: In Colombia, coffee crops are planted under full sun exposure, but it is common to see established plantations with various types and amounts of tree cover (FNC- Federación Nacional de cafeteros, 1997).
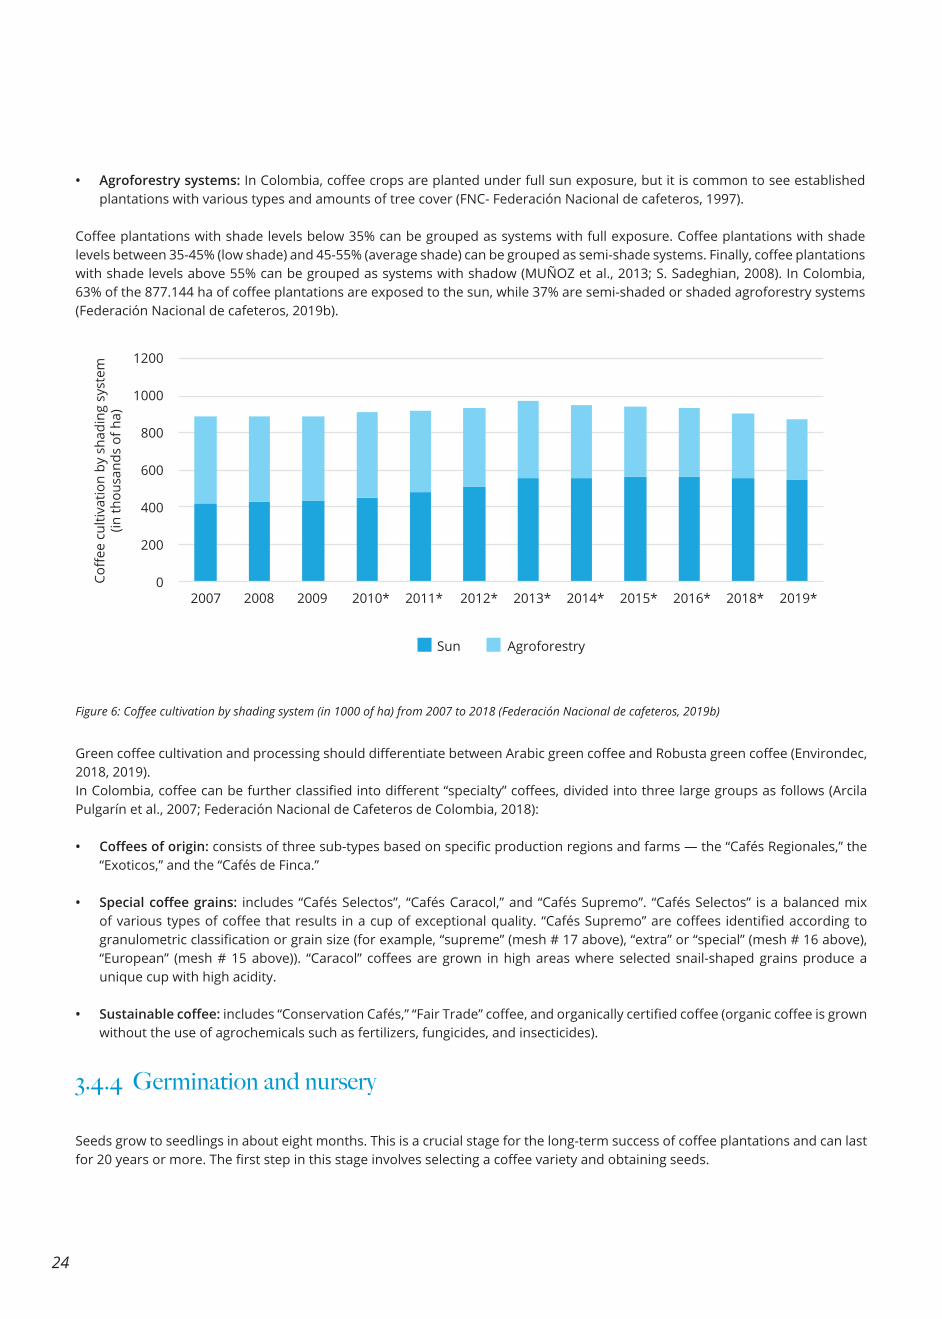
Coffee plantations with shade levels below 35% can be grouped as systems with full exposure. Coffee plantations with shade levels between 35-45% (low shade) and 45-55% (average shade) can be grouped as semi-shade systems. Finally, coffee plantations with shade levels above 55% can be grouped as systems with shadow (MUÑOZ et al., 2013; S. Sadeghian, 2008). In Colombia, 63% of the 877.144 ha of coffee plantations are exposed to the sun, while 37% are semi-shaded or shaded agroforestry systems (Federación Nacional de cafeteros, 2019b).
Green coffee cultivation and processing should differentiate between Arabic green coffee and Robusta green coffee (Environdec, 2018, 2019). In Colombia, coffee can be further classified into different “specialty” coffees, divided into three large groups as follows (Arcila Pulgarín et al., 2007; Federación Nacional de Cafeteros de Colombia, 2018):
• Coffees of origin: consists of three sub-types based on specific production regions and farms — the “Cafés Regionales,” the “Exoticos,” and the “Cafés de Finca.”
• Special coffee grains: includes “Cafés Selectos”, “Cafés Caracol,” and “Cafés Supremo”. “Cafés Selectos” is a balanced mix of various types of coffee that results in a cup of exceptional quality. “Cafés Supremo” are coffees identified according to granulometric classification or grain size (for example, “supreme” (mesh # 17 above), “extra” or “special” (mesh # 16 above), “European” (mesh # 15 above)). “Caracol” coffees are grown in high areas where selected snail-shaped grains produce a unique cup with high acidity.
• Sustainable coffee: includes “Conservation Cafés,” “Fair Trade” coffee, and organically certified coffee (organic coffee is grown without the use of agrochemicals such as fertilizers, fungicides, and insecticides).
Figure 6: Coffee cultivation by shading system (in 1000 of ha) from 2007 to 2018 (Federación Nacional de cafeteros, 2019b)
3.4.4 Germination and nursery
Seeds grow to seedlings in about eight months. This is a crucial stage for the long-term success of coffee plantations and can last for 20 years or more. The first step in this stage involves selecting a coffee variety and obtaining seeds.
20070
200
400
600
800
1000
1200
2008 2009 2010* 2011* 2012* 2013* 2014* 2015* 2016* 2018* 2019*
Sun Agroforestry
25
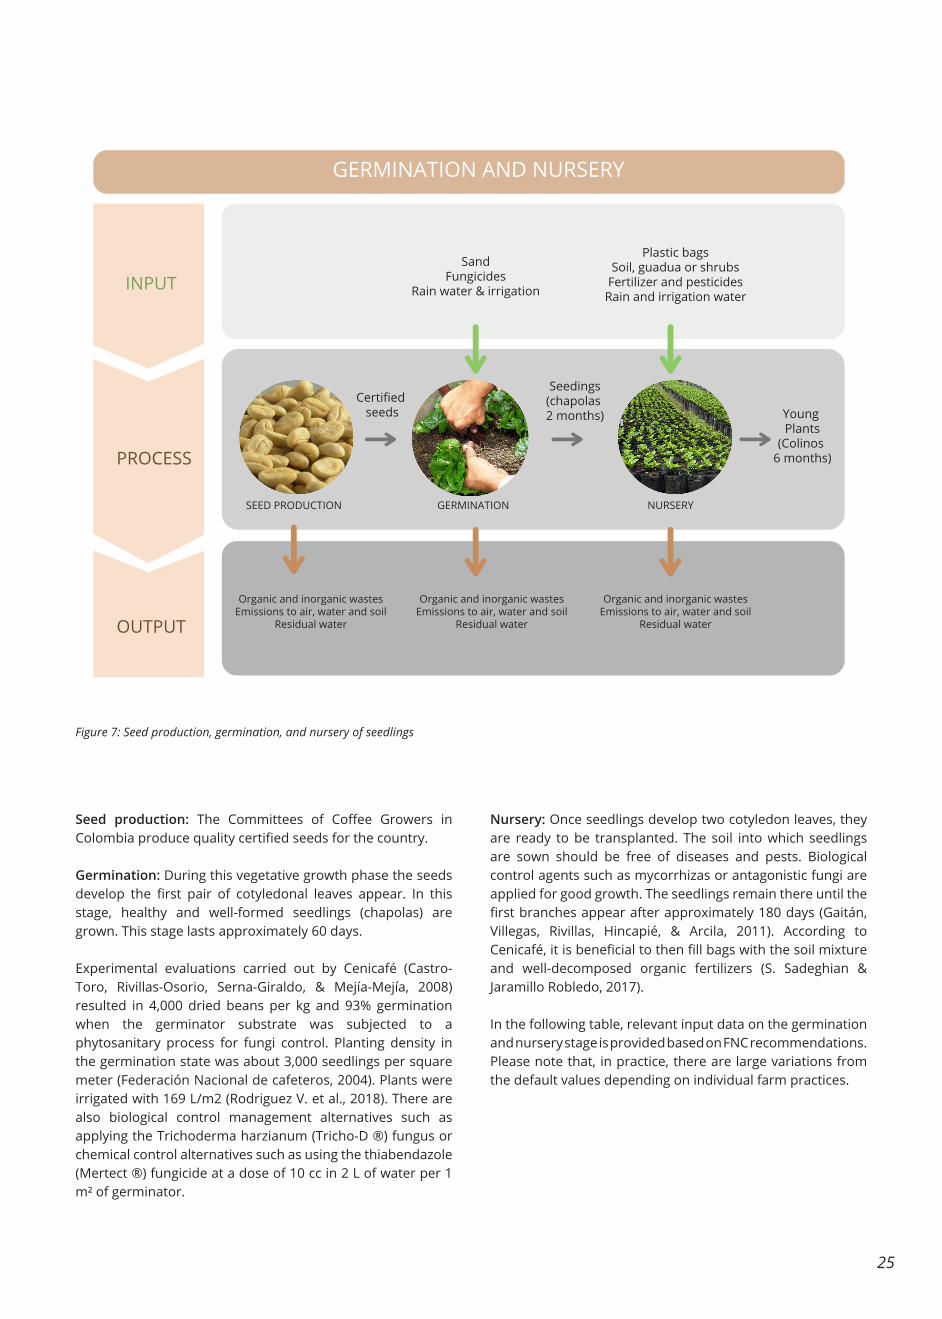
Figure 7: Seed production, germination, and nursery of seedlings
Seed production: The Committees of Coffee Growers in Colombia produce quality certified seeds for the country.
Germination: During this vegetative growth phase the seeds develop the first pair of cotyledonal leaves appear. In this stage, healthy and well-formed seedlings (chapolas) are grown. This stage lasts approximately 60 days.
Experimental evaluations carried out by Cenicafé (Castro-Toro, Rivillas-Osorio, Serna-Giraldo, & Mejía-Mejía, 2008) resulted in 4,000 dried beans per kg and 93% germination when the germinator substrate was subjected to a phytosanitary process for fungi control. Planting density in the germination state was about 3,000 seedlings per square meter (Federación Nacional de cafeteros, 2004). Plants were irrigated with 169 L/m2 (Rodriguez V. et al., 2018). There are also biological control management alternatives such as applying the Trichoderma harzianum (Tricho-D ®) fungus or chemical control alternatives such as using the thiabendazole (Mertect ®) fungicide at a dose of 10 cc in 2 L of water per 1 m² of germinator.
Nursery: Once seedlings develop two cotyledon leaves, they are ready to be transplanted. The soil into which seedlings are sown should be free of diseases and pests. Biological control agents such as mycorrhizas or antagonistic fungi are applied for good growth. The seedlings remain there until the first branches appear after approximately 180 days (Gaitán, Villegas, Rivillas, Hincapié, & Arcila, 2011). According to Cenicafé, it is beneficial to then fill bags with the soil mixture and well-decomposed organic fertilizers (S. Sadeghian & Jaramillo Robledo, 2017).
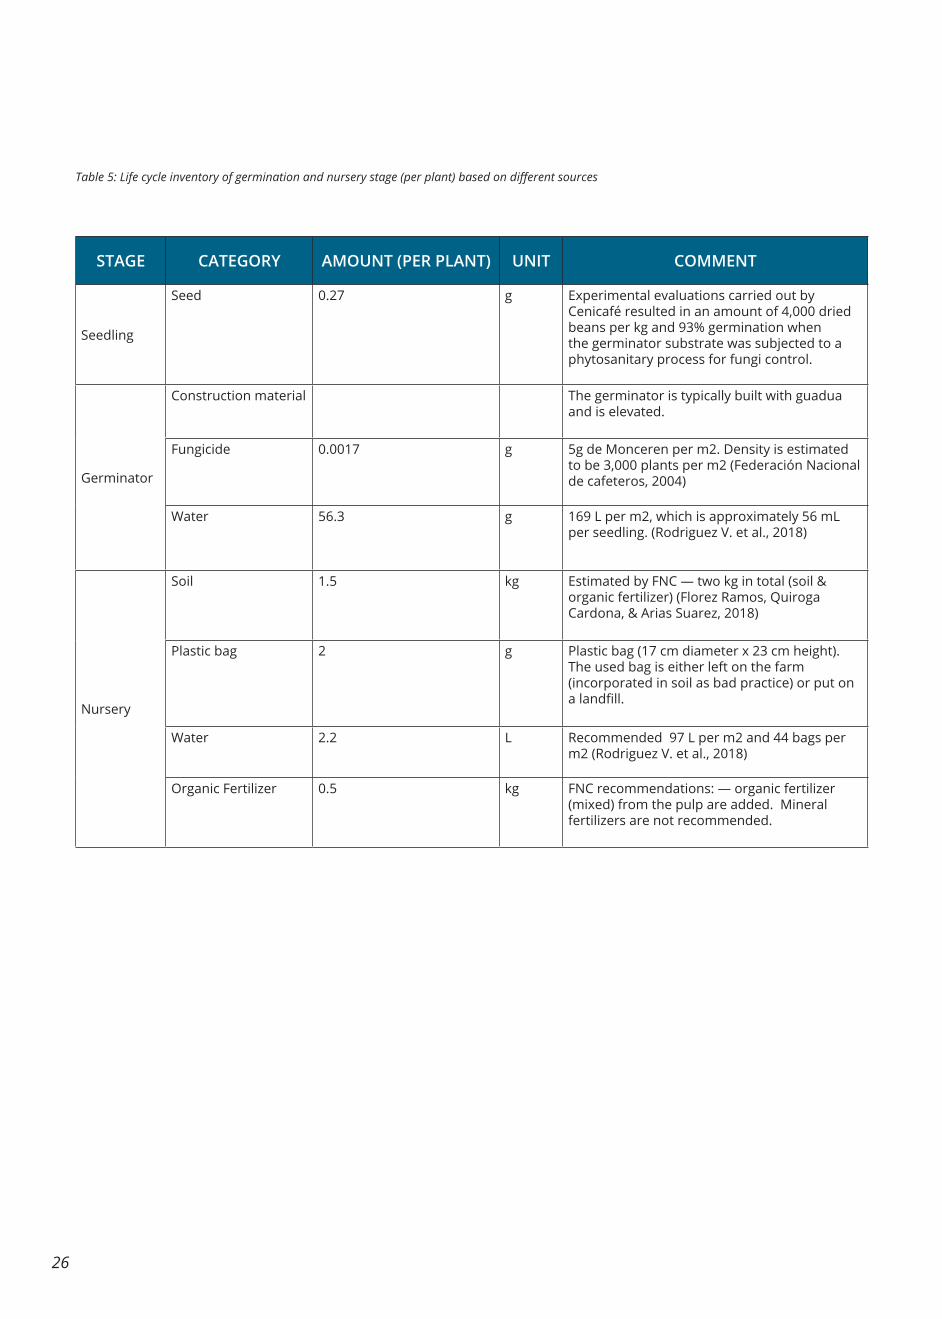
In the following table, relevant input data on the germination and nursery stage is provided based on FNC recommendations. Please note that, in practice, there are large variations from the default values depending on individual farm practices.
GERMINATION AND NURSERY
INPUT
PROCESS
OUTPUT
SandFungicides
Rain water & irrigation
Organic and inorganic wastesEmissions to air, water and soil
Residual water
Organic and inorganic wastesEmissions to air, water and soil
Residual water
Organic and inorganic wastesEmissions to air, water and soil
Residual water
Plastic bagsSoil, guadua or shrubs
Fertilizer and pesticidesRain and irrigation water
Certified seeds
Seedings(chapolas 2 months) Young
Plants(Colinos
6 months)
SEED PRODUCTION GERMINATION NURSERY
26
STAGE CATEGORY AMOUNT (PER PLANT) UNIT COMMENT
Seedling
Seed 0.27 g Experimental evaluations carried out by Cenicafé resulted in an amount of 4,000 dried beans per kg and 93% germination when the germinator substrate was subjected to a phytosanitary process for fungi control.
Germinator
Construction material The germinator is typically built with guadua and is elevated.
Fungicide 0.0017 g 5g de Monceren per m2. Density is estimated to be 3,000 plants per m2 (Federación Nacional de cafeteros, 2004)
Water 56.3 g 169 L per m2, which is approximately 56 mL per seedling. (Rodriguez V. et al., 2018)
Nursery
Soil 1.5 kg Estimated by FNC — two kg in total (soil & organic fertilizer) (Florez Ramos, Quiroga Cardona, & Arias Suarez, 2018)
Plastic bag 2 g Plastic bag (17 cm diameter x 23 cm height). The used bag is either left on the farm (incorporated in soil as bad practice) or put on a landfill.
Water 2.2 L Recommended 97 L per m2 and 44 bags per m2 (Rodriguez V. et al., 2018)
Organic Fertilizer 0.5 kg FNC recommendations: — organic fertilizer (mixed) from the pulp are added. Mineral fertilizers are not recommended.
Table 5: Life cycle inventory of germination and nursery stage (per plant) based on different sources
27
STAGE CATEGORY AMOUNT (PER PLANT) UNIT COMMENT
Seedling
Seed 0.27 g Experimental evaluations carried out by Cenicafé resulted in an amount of 4,000 dried beans per kg and 93% germination when the germinator substrate was subjected to a phytosanitary process for fungi control.
Germinator
Construction material The germinator is typically built with guadua and is elevated.
Fungicide 0.0017 g 5g de Monceren per m2. Density is estimated to be 3,000 plants per m2 (Federación Nacional de cafeteros, 2004)
Water 56.3 g 169 L per m2, which is approximately 56 mL per seedling. (Rodriguez V. et al., 2018)
Nursery
Soil 1.5 kg Estimated by FNC — two kg in total (soil & organic fertilizer) (Florez Ramos, Quiroga Cardona, & Arias Suarez, 2018)
Plastic bag 2 g Plastic bag (17 cm diameter x 23 cm height). The used bag is either left on the farm (incorporated in soil as bad practice) or put on a landfill.
Water 2.2 L Recommended 97 L per m2 and 44 bags per m2 (Rodriguez V. et al., 2018)
Organic Fertilizer 0.5 kg FNC recommendations: — organic fertilizer (mixed) from the pulp are added. Mineral fertilizers are not recommended.
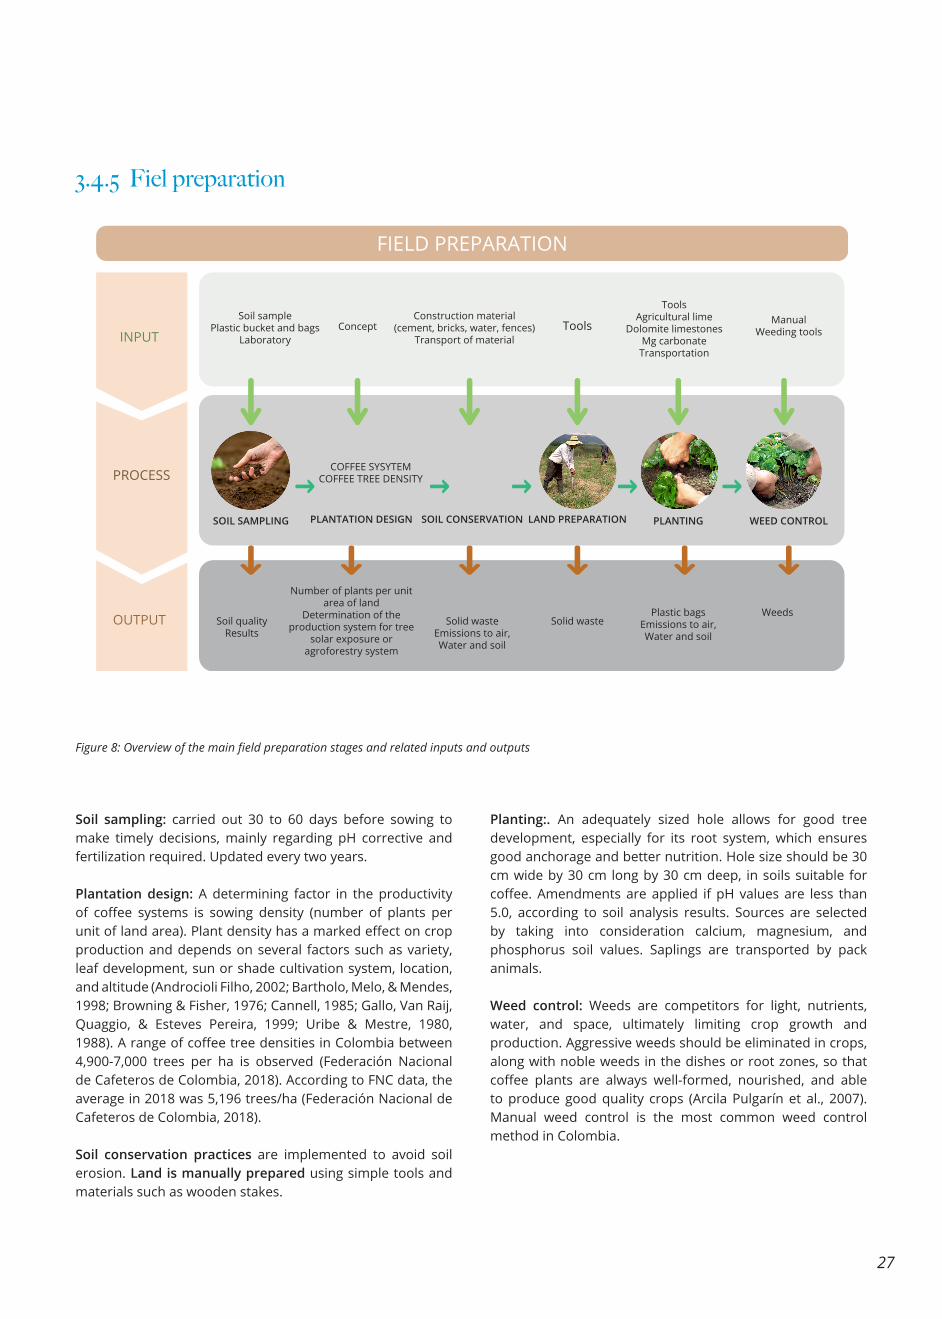
3.4.5 Fiel preparation
Figure 8: Overview of the main field preparation stages and related inputs and outputs
Soil sampling: carried out 30 to 60 days before sowing to make timely decisions, mainly regarding pH corrective and fertilization required. Updated every two years.
Plantation design: A determining factor in the productivity of coffee systems is sowing density (number of plants per unit of land area). Plant density has a marked effect on crop production and depends on several factors such as variety, leaf development, sun or shade cultivation system, location, and altitude (Androcioli Filho, 2002; Bartholo, Melo, & Mendes, 1998; Browning & Fisher, 1976; Cannell, 1985; Gallo, Van Raij, Quaggio, & Esteves Pereira, 1999; Uribe & Mestre, 1980, 1988). A range of coffee tree densities in Colombia between 4,900-7,000 trees per ha is observed (Federación Nacional de Cafeteros de Colombia, 2018). According to FNC data, the average in 2018 was 5,196 trees/ha (Federación Nacional de Cafeteros de Colombia, 2018).
Soil conservation practices are implemented to avoid soil erosion. Land is manually prepared using simple tools and materials such as wooden stakes.
Planting:. An adequately sized hole allows for good tree development, especially for its root system, which ensures good anchorage and better nutrition. Hole size should be 30 cm wide by 30 cm long by 30 cm deep, in soils suitable for coffee. Amendments are applied if pH values are less than 5.0, according to soil analysis results. Sources are selected by taking into consideration calcium, magnesium, and phosphorus soil values. Saplings are transported by pack animals.
Weed control: Weeds are competitors for light, nutrients, water, and space, ultimately limiting crop growth and production. Aggressive weeds should be eliminated in crops, along with noble weeds in the dishes or root zones, so that coffee plants are always well-formed, nourished, and able to produce good quality crops (Arcila Pulgarín et al., 2007). Manual weed control is the most common weed control method in Colombia.
FIELD PREPARATION
INPUT
PROCESS
OUTPUT
Soil samplePlastic bucket and bags
Laboratory
SOIL SAMPLING
COFFEE SYSYTEMCOFFEE TREE DENSITY
PLANTATION DESIGN SOIL CONSERVATION LAND PREPARATION PLANTING WEED CONTROL
ConceptConstruction material
(cement, bricks, water, fences)Transport of material
Tools
ToolsAgricultural lime
Dolomite limestonesMg carbonateTransportation
ManualWeeding tools
Soil qualityResults
Number of plants per unit area of land
Determination of the production system for tree
solar exposure or agroforestry system
Solid wasteEmissions to air,Water and soil
Solid wastePlastic bags
Emissions to air,Water and soil
Weeds
28
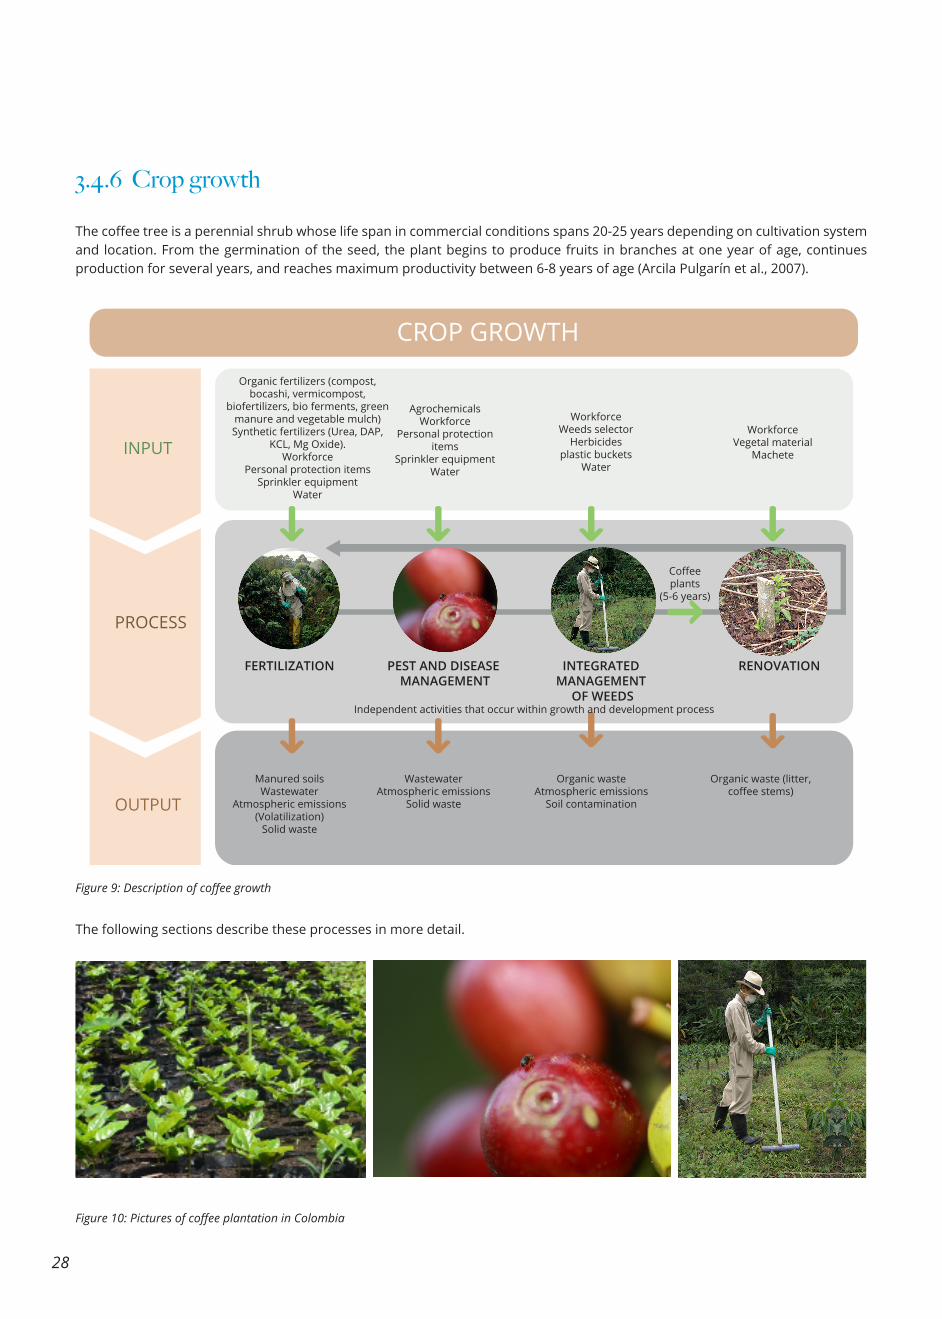
3.4.6 Crop growth
The coffee tree is a perennial shrub whose life span in commercial conditions spans 20-25 years depending on cultivation system and location. From the germination of the seed, the plant begins to produce fruits in branches at one year of age, continues production for several years, and reaches maximum productivity between 6-8 years of age (Arcila Pulgarín et al., 2007).
The following sections describe these processes in more detail.
Figure 9: Description of coffee growth
Figure 10: Pictures of coffee plantation in Colombia
INPUT
PROCESS
OUTPUT
Organic fertilizers (compost, bocashi, vermicompost,
biofertilizers, bio ferments, green manure and vegetable mulch)Synthetic fertilizers (Urea, DAP,
KCL, Mg Oxide).Workforce
Personal protection itemsSprinkler equipment
Water
AgrochemicalsWorkforce
Personal protection items
Sprinkler equipmentWater
WorkforceWeeds selector
Herbicidesplastic buckets
Water
Coffee plants
(5-6 years)
WorkforceVegetal material
Machete
Manured soilsWastewater
Atmospheric emissions (Volatilization)
Solid waste
WastewaterAtmospheric emissions
Solid waste
Organic wasteAtmospheric emissions
Soil contamination
Organic waste (litter, coffee stems)
CROP GROWTH
FERTILIZATION PEST AND DISEASE MANAGEMENT
INTEGRATED MANAGEMENT
OF WEEDS
RENOVATION
Independent activities that occur within growth and development process
29
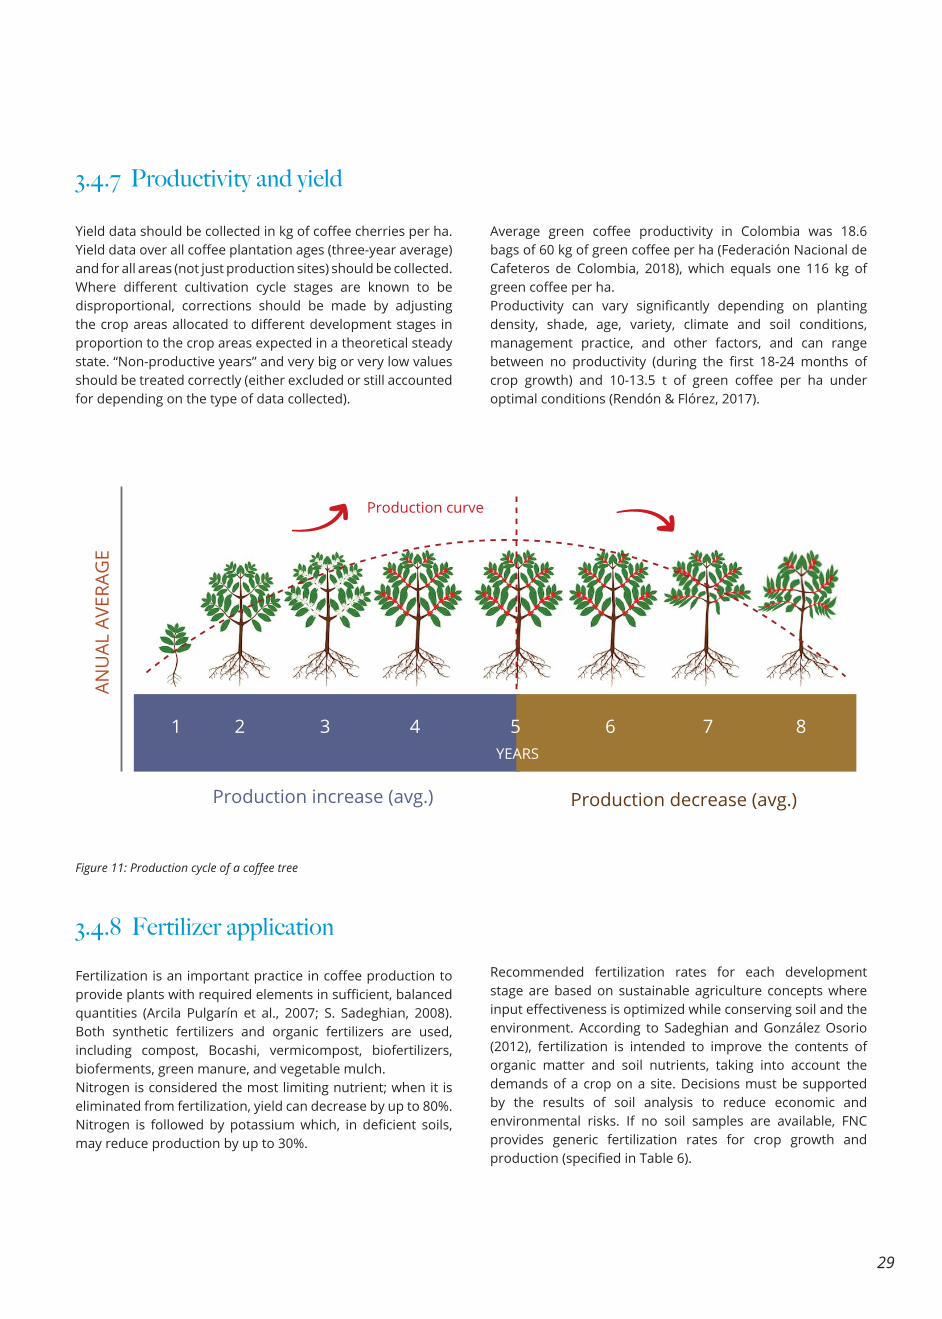
3.4.7 Productivity and yield
3.4.8 Fertilizer application
Yield data should be collected in kg of coffee cherries per ha. Yield data over all coffee plantation ages (three-year average) and for all areas (not just production sites) should be collected. Where different cultivation cycle stages are known to be disproportional, corrections should be made by adjusting the crop areas allocated to different development stages in proportion to the crop areas expected in a theoretical steady state. “Non-productive years” and very big or very low values should be treated correctly (either excluded or still accounted for depending on the type of data collected).
Fertilization is an important practice in coffee production to provide plants with required elements in sufficient, balanced quantities (Arcila Pulgarín et al., 2007; S. Sadeghian, 2008). Both synthetic fertilizers and organic fertilizers are used, including compost, Bocashi, vermicompost, biofertilizers, bioferments, green manure, and vegetable mulch.Nitrogen is considered the most limiting nutrient; when it is eliminated from fertilization, yield can decrease by up to 80%. Nitrogen is followed by potassium which, in deficient soils, may reduce production by up to 30%.
Average green coffee productivity in Colombia was 18.6 bags of 60 kg of green coffee per ha (Federación Nacional de Cafeteros de Colombia, 2018), which equals one 116 kg of green coffee per ha.Productivity can vary significantly depending on planting density, shade, age, variety, climate and soil conditions, management practice, and other factors, and can range between no productivity (during the first 18-24 months of crop growth) and 10-13.5 t of green coffee per ha under optimal conditions (Rendón & Flórez, 2017).
Recommended fertilization rates for each development stage are based on sustainable agriculture concepts where input effectiveness is optimized while conserving soil and the environment. According to Sadeghian and González Osorio (2012), fertilization is intended to improve the contents of organic matter and soil nutrients, taking into account the demands of a crop on a site. Decisions must be supported by the results of soil analysis to reduce economic and environmental risks. If no soil samples are available, FNC provides generic fertilization rates for crop growth and production (specified in Table 6).
Figure 11: Production cycle of a coffee tree
1 2 3 4 5 6 7 8
ANU
AL A
VERA
GE
Production increase (avg.) Production decrease (avg.)
YEARS
Production curve
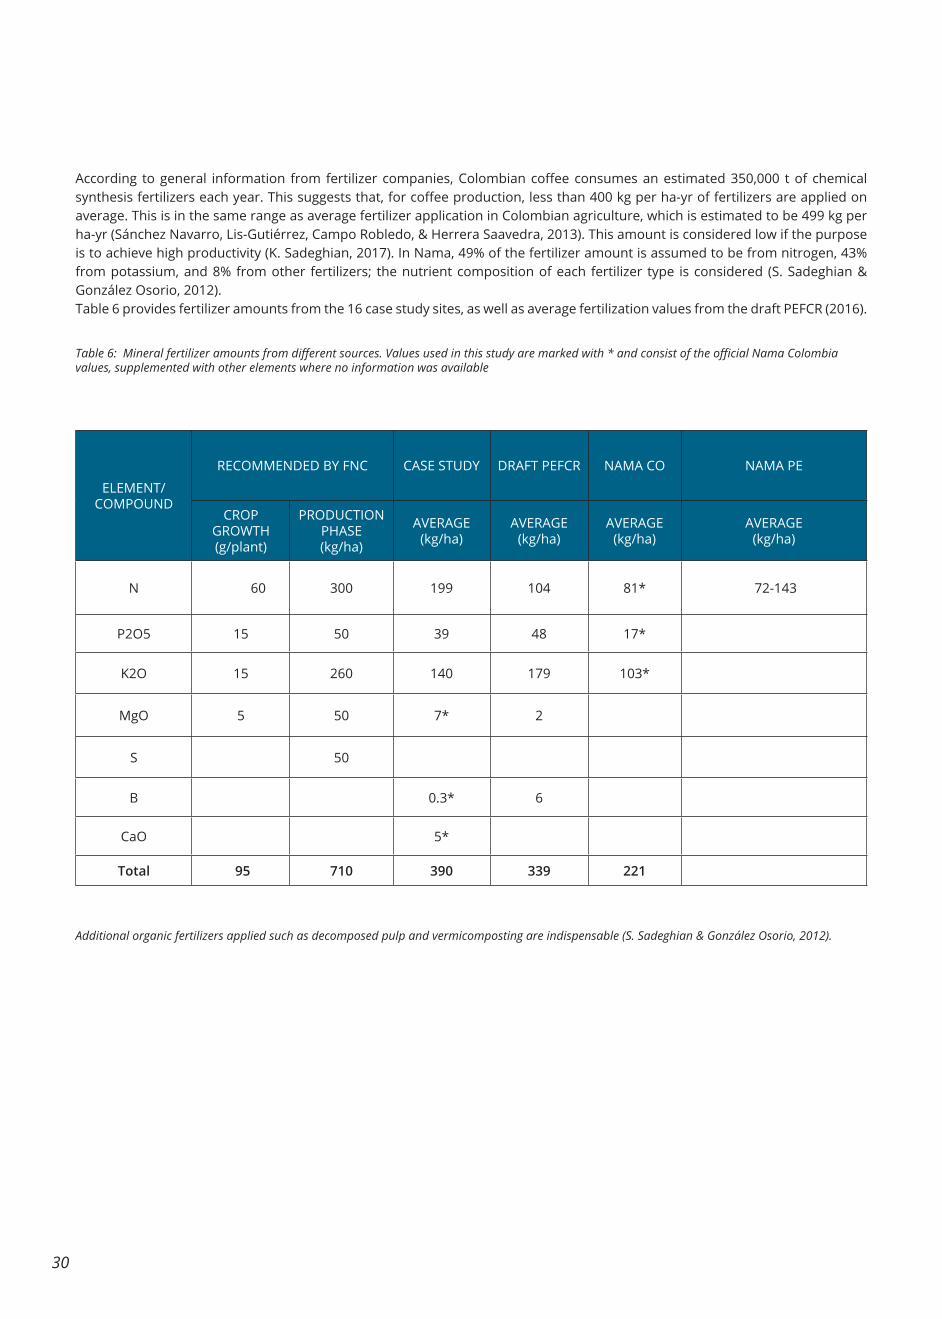
30
According to general information from fertilizer companies, Colombian coffee consumes an estimated 350,000 t of chemical synthesis fertilizers each year. This suggests that, for coffee production, less than 400 kg per ha-yr of fertilizers are applied on average. This is in the same range as average fertilizer application in Colombian agriculture, which is estimated to be 499 kg per ha-yr (Sánchez Navarro, Lis-Gutiérrez, Campo Robledo, & Herrera Saavedra, 2013). This amount is considered low if the purpose is to achieve high productivity (K. Sadeghian, 2017). In Nama, 49% of the fertilizer amount is assumed to be from nitrogen, 43% from potassium, and 8% from other fertilizers; the nutrient composition of each fertilizer type is considered (S. Sadeghian & González Osorio, 2012).Table 6 provides fertilizer amounts from the 16 case study sites, as well as average fertilization values from the draft PEFCR (2016).
Additional organic fertilizers applied such as decomposed pulp and vermicomposting are indispensable (S. Sadeghian & González Osorio, 2012).
ELEMENT/ COMPOUND
RECOMMENDED BY FNC CASE STUDY DRAFT PEFCR NAMA CO NAMA PE
CROP GROWTH (g/plant)
PRODUCTION PHASE (kg/ha)
AVERAGE (kg/ha)
AVERAGE (kg/ha)
AVERAGE (kg/ha)
AVERAGE (kg/ha)
N 60 300 199 104 81* 72-143
P2O5 15 50 39 48 17*
K2O 15 260 140 179 103*
MgO 5 50 7* 2
S 50
B 0.3* 6
CaO 5*
Total 95 710 390 339 221
Table 6: Mineral fertilizer amounts from different sources. Values used in this study are marked with * and consist of the official Nama Colombia values, supplemented with other elements where no information was available
31
A common mistake in calculating the EF of agricultural products is that the amount of P is used instead of P2O5 or K instead of K2O. In this case, use the molecular weight to convert the amount applied.
Main mineral fertilizers used are N, K2O and P2O5, but include Ca, Mg, and other fertilizers applied to provide microelements in a study.
Include organic fertilizers (e.g., manure or compost) in addition to mineral fertilizers, including any organic materials applied to the field (e.g., crop or processing residues). Even though their production might have an insignificant environmental footprint, it might be relevant to the emissions model.
Another common mistake is directly linking the total amount of fertilizer with inventory data. However, inventory data is typically not provided as per kg of fertilizer, but as per kg of nutrient. For example, urea typically has a 46% N content; if 100 kg of urea is used per hectare, the environmental footprint of fertilizer production is calculated as 46 kg times the data from the “urea, as N, at regional storehouse” process.
Some fertilizers are applied in specific mixes (e.g. 15-5-5) but LCI databases do not provide environmental footprint values for each specific mix. However, a value can be created by adding each nutrient’s LCI together.
Tips & tricks: Fertilizer input data
3.4.9 Pesticide application and weed management
Integrated pest management (IPM) is a series of control measures aimed at reducing pest populations that affect a crop without causing economic damage, still allowing for crop production and competitive marketing (NCA, 1968, Andrews and Quezada, 1989, Dent, 1999). IPM can be achieved by providing adequate nutrition, weeding on time, or through biological and chemical controls. A list of chemical substances applied in the sampled coffee farms is provided in Table 7.
In traditional weeding, farmers completely strip the soil using manual tools such as hoes or machetes and, for about the last 20 years, also apply herbicides (also contained in Table 7).
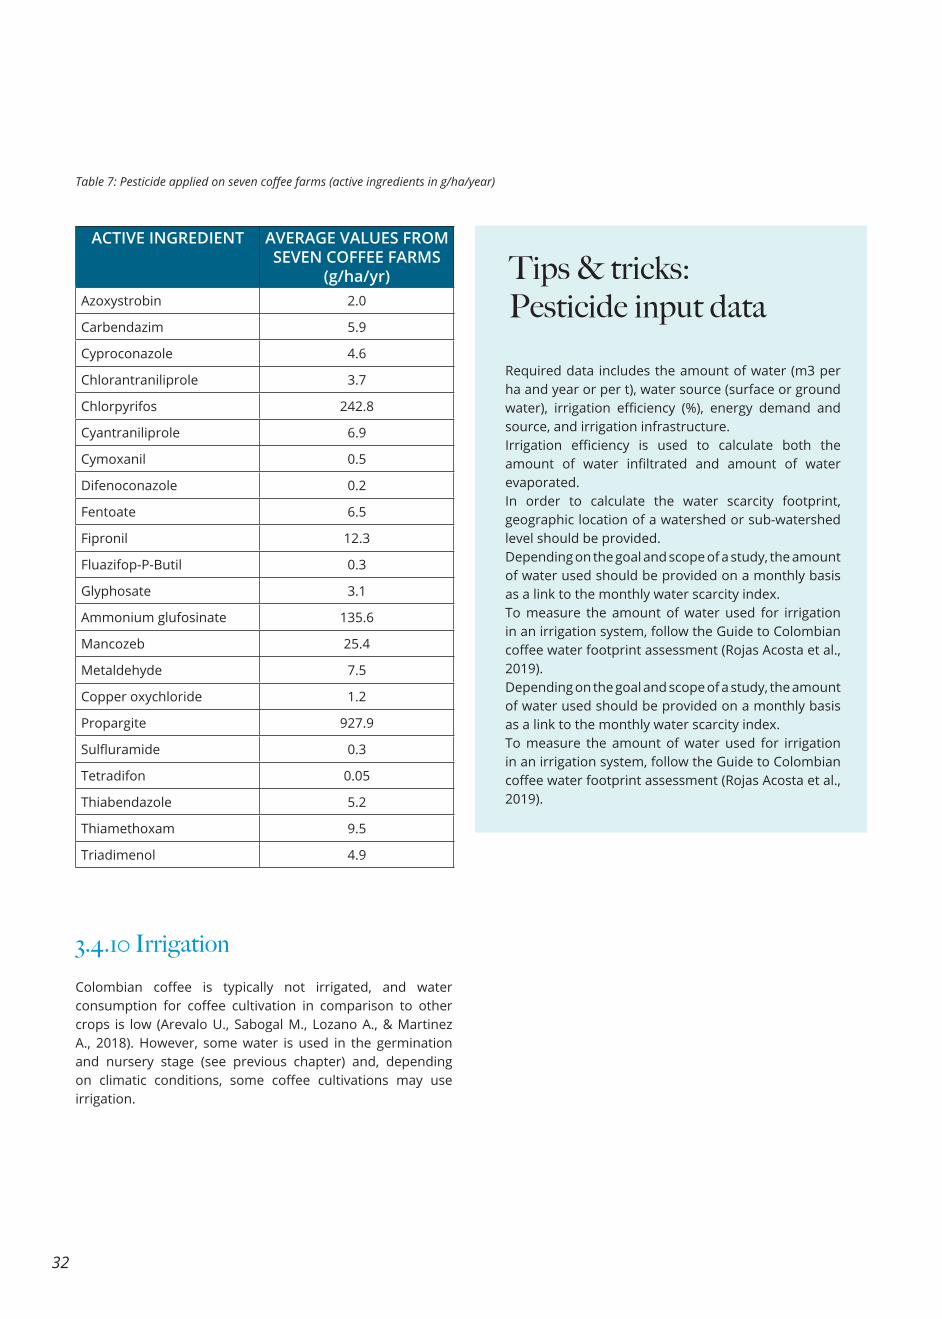
32
Table 7: Pesticide applied on seven coffee farms (active ingredients in g/ha/year)
ACTIVE INGREDIENT AVERAGE VALUES FROM SEVEN COFFEE FARMS
(g/ha/yr)Azoxystrobin 2.0
Carbendazim 5.9
Cyproconazole 4.6
Chlorantraniliprole 3.7
Chlorpyrifos 242.8
Cyantraniliprole 6.9
Cymoxanil 0.5
Difenoconazole 0.2
Fentoate 6.5
Fipronil 12.3
Fluazifop-P-Butil 0.3
Glyphosate 3.1
Ammonium glufosinate 135.6
Mancozeb 25.4
Metaldehyde 7.5
Copper oxychloride 1.2
Propargite 927.9
Sulfluramide 0.3
Tetradifon 0.05
Thiabendazole 5.2
Thiamethoxam 9.5
Triadimenol 4.9
Required data includes the amount of water (m3 per ha and year or per t), water source (surface or ground water), irrigation efficiency (%), energy demand and source, and irrigation infrastructure.Irrigation efficiency is used to calculate both the amount of water infiltrated and amount of water evaporated.In order to calculate the water scarcity footprint, geographic location of a watershed or sub-watershed level should be provided.Depending on the goal and scope of a study, the amount of water used should be provided on a monthly basis as a link to the monthly water scarcity index.To measure the amount of water used for irrigation in an irrigation system, follow the Guide to Colombian coffee water footprint assessment (Rojas Acosta et al., 2019).Depending on the goal and scope of a study, the amount of water used should be provided on a monthly basis as a link to the monthly water scarcity index.To measure the amount of water used for irrigation in an irrigation system, follow the Guide to Colombian coffee water footprint assessment (Rojas Acosta et al., 2019).
Tips & tricks: Pesticide input data
3.4.10 IrrigationColombian coffee is typically not irrigated, and water consumption for coffee cultivation in comparison to other crops is low (Arevalo U., Sabogal M., Lozano A., & Martinez A., 2018). However, some water is used in the germination and nursery stage (see previous chapter) and, depending on climatic conditions, some coffee cultivations may use irrigation.
33
Required data includes the amount of water (m3 per ha and year or per t), water source (surface or ground water), irrigation efficiency (%), energy demand and source, and irrigation infrastructure.
Irrigation efficiency is used to calculate both the amount of water infiltrated and amount of water evaporated.In order to calculate the water scarcity footprint, geographic location of a watershed or sub-watershed level should be provided.
Depending on the goal and scope of a study, the amount of water used should be provided on a monthly basis as a link to the monthly water scarcity index.
To measure the amount of water used for irrigation in an irrigation system, follow the Guide to Colombian coffee water footprint assessment (Rojas Acosta et al., 2019).
Tips & tricks: Irrigation data
3.4.11 Machine Use 3.4.12 TransportMost coffee plantations in Colombia are found on hilly highlands and, given their steep slopes, most work is done manually. Machinery might be used to remove vegetation and/or for fumigation, renovation, and some transportation.
• Removing vegetation: includes the use of motorized back equipment and mowers. One study indicates that, on average, 6.4 days per year are spent weeding per hectare. This translates to about 25 L of gasoline and one L of oil (Suarez R & Carvajal M, 2018).
• Fumigation: includes the use of motorized back equipment and semi-stationary equipment. One study indicates that, on average, 7.2 days per year are spent weeding per hectare. This translates to about 28 L of gasoline and one L of oil (Suarez R & Carvajal M, 2018).
Renovation: includes cutting trees using a chainsaw. Data is typically collected as the amount of diesel consumed. The “diesel, burned in building machines” ecoivnent dataset can be used as a proxy. This dataset includes the production and combustion of diesel, as well as capital goods.
Transport may occur on a coffee farm or to supply a coffee farm with required inputs.
On-farm transportation’s environmental footprint is typically calculated based on the amount of diesel and gasoline consumed (see the previous chapter).
Environmental footprint data for farm input transport services are typically derived from LCI background databases (generic data). EF values are typically expressed in metric t-km with average load factors that include the average share of empty return trips.
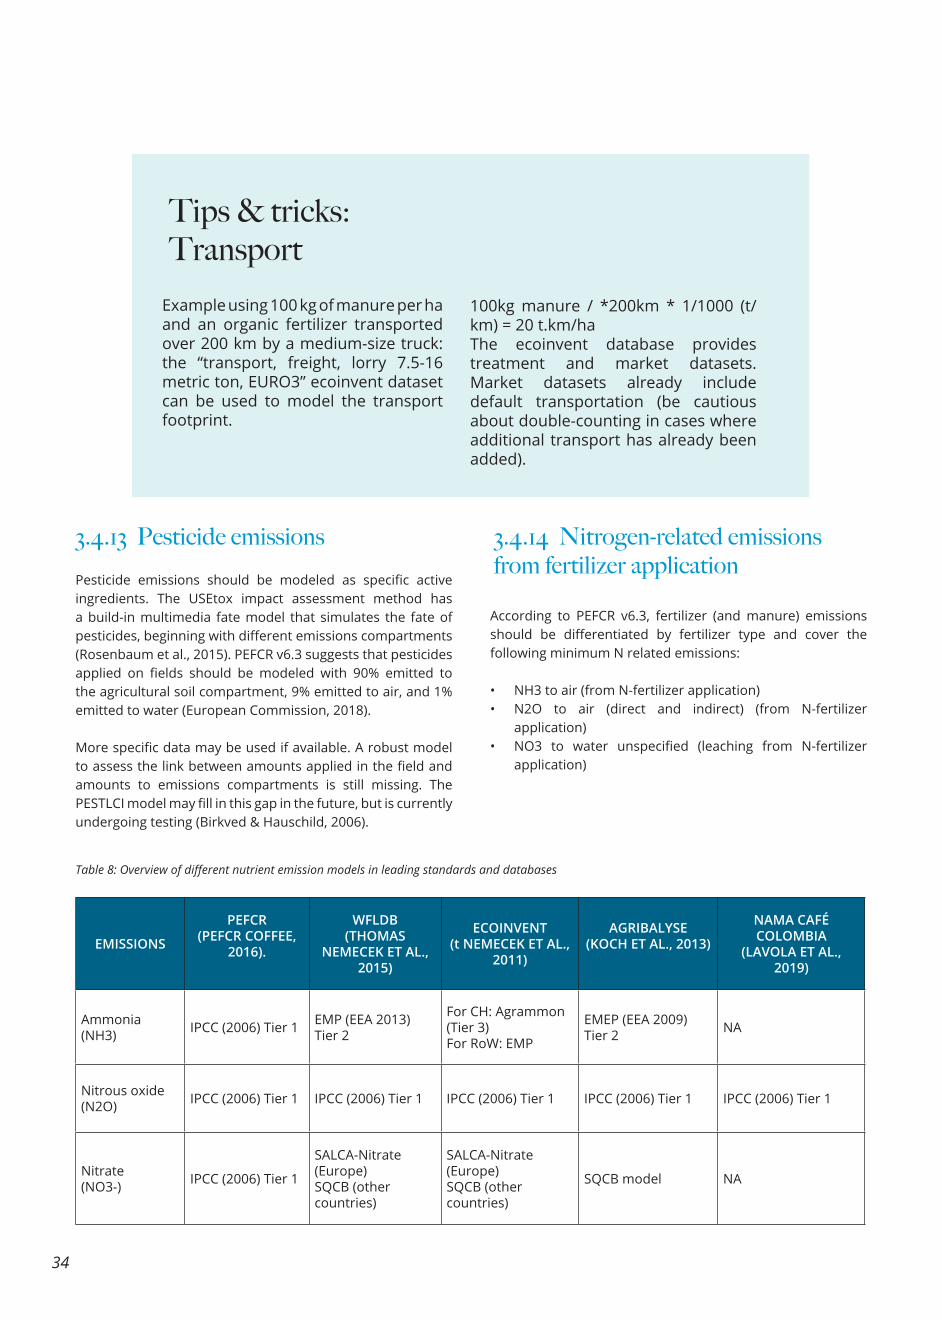
34
Example using 100 kg of manure per ha and an organic fertilizer transported over 200 km by a medium-size truck: the “transport, freight, lorry 7.5-16 metric ton, EURO3” ecoinvent dataset can be used to model the transport footprint.
100kg manure / *200km * 1/1000 (t/km) = 20 t.km/haThe ecoinvent database provides treatment and market datasets. Market datasets already include default transportation (be cautious about double-counting in cases where additional transport has already been added).
Tips & tricks: Transport
3.4.13 Pesticide emissions 3.4.14 Nitrogen-related emissions from fertilizer application
Pesticide emissions should be modeled as specific active ingredients. The USEtox impact assessment method has a build-in multimedia fate model that simulates the fate of pesticides, beginning with different emissions compartments (Rosenbaum et al., 2015). PEFCR v6.3 suggests that pesticides applied on fields should be modeled with 90% emitted to the agricultural soil compartment, 9% emitted to air, and 1% emitted to water (European Commission, 2018).
More specific data may be used if available. A robust model to assess the link between amounts applied in the field and amounts to emissions compartments is still missing. The PESTLCI model may fill in this gap in the future, but is currently undergoing testing (Birkved & Hauschild, 2006).
According to PEFCR v6.3, fertilizer (and manure) emissions should be differentiated by fertilizer type and cover the following minimum N related emissions:
• NH3 to air (from N-fertilizer application)• N2O to air (direct and indirect) (from N-fertilizer
application)• NO3 to water unspecified (leaching from N-fertilizer
application)
EMISSIONS
PEFCR(PEFCR COFFEE,
2016).
WFLDB(THOMAS
NEMECEK ET AL., 2015)
ECOINVENT(t NEMECEK ET AL.,
2011)
AGRIBALYSE(KOCH ET AL., 2013)
NAMA CAFÉ COLOMBIA
(LAVOLA ET AL., 2019)
Ammonia (NH3) IPCC (2006) Tier 1 EMP (EEA 2013)
Tier 2
For CH: Agrammon (Tier 3)For RoW: EMP
EMEP (EEA 2009)Tier 2 NA
Nitrous oxide (N2O) IPCC (2006) Tier 1 IPCC (2006) Tier 1 IPCC (2006) Tier 1 IPCC (2006) Tier 1 IPCC (2006) Tier 1
Nitrate (NO3-) IPCC (2006) Tier 1
SALCA-Nitrate(Europe)SQCB (other countries)
SALCA-Nitrate(Europe)SQCB (other countries)
SQCB model NA
Table 8: Overview of different nutrient emission models in leading standards and databases
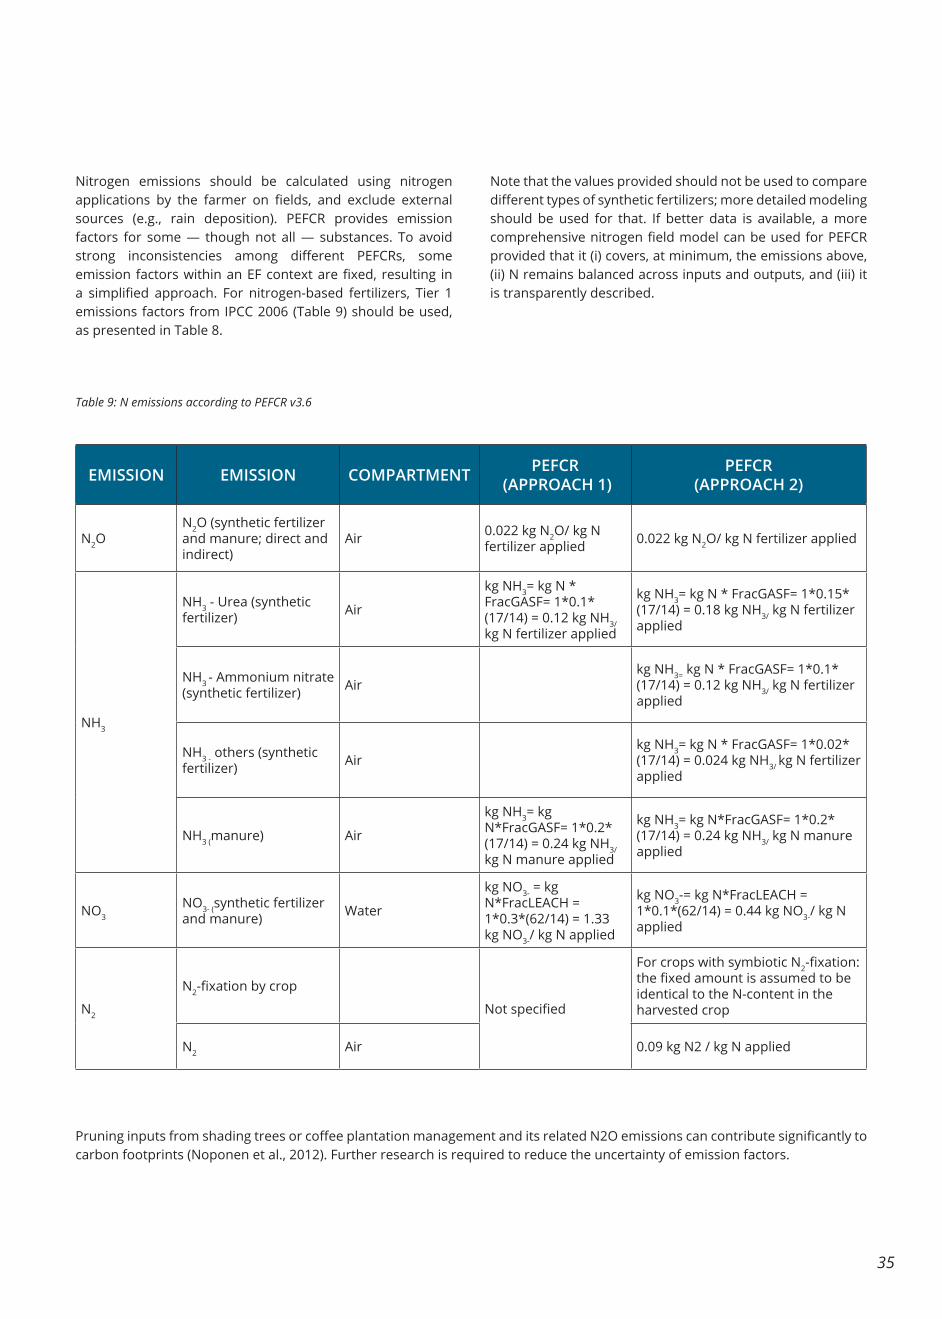
35
EMISSIONS
PEFCR(PEFCR COFFEE,
2016).
WFLDB(THOMAS
NEMECEK ET AL., 2015)
ECOINVENT(t NEMECEK ET AL.,
2011)
AGRIBALYSE(KOCH ET AL., 2013)
NAMA CAFÉ COLOMBIA
(LAVOLA ET AL., 2019)
Ammonia (NH3) IPCC (2006) Tier 1 EMP (EEA 2013)
Tier 2
For CH: Agrammon (Tier 3)For RoW: EMP
EMEP (EEA 2009)Tier 2 NA
Nitrous oxide (N2O) IPCC (2006) Tier 1 IPCC (2006) Tier 1 IPCC (2006) Tier 1 IPCC (2006) Tier 1 IPCC (2006) Tier 1
Nitrate (NO3-) IPCC (2006) Tier 1
SALCA-Nitrate(Europe)SQCB (other countries)
SALCA-Nitrate(Europe)SQCB (other countries)
SQCB model NA
Nitrogen emissions should be calculated using nitrogen applications by the farmer on fields, and exclude external sources (e.g., rain deposition). PEFCR provides emission factors for some — though not all — substances. To avoid strong inconsistencies among different PEFCRs, some emission factors within an EF context are fixed, resulting in a simplified approach. For nitrogen-based fertilizers, Tier 1 emissions factors from IPCC 2006 (Table 9) should be used, as presented in Table 8.
Note that the values provided should not be used to compare different types of synthetic fertilizers; more detailed modeling should be used for that. If better data is available, a more comprehensive nitrogen field model can be used for PEFCR provided that it (i) covers, at minimum, the emissions above, (ii) N remains balanced across inputs and outputs, and (iii) it is transparently described.
EMISSION EMISSION COMPARTMENT PEFCR (APPROACH 1)
PEFCR (APPROACH 2)
N2ON2O (synthetic fertilizer and manure; direct and indirect)
Air 0.022 kg N2O/ kg N fertilizer applied 0.022 kg N2O/ kg N fertilizer applied
NH3
NH3 - Urea (synthetic fertilizer) Air
kg NH3= kg N * FracGASF= 1*0.1* (17/14) = 0.12 kg NH3/ kg N fertilizer applied
kg NH3= kg N * FracGASF= 1*0.15* (17/14) = 0.18 kg NH3/ kg N fertilizer applied
NH3 - Ammonium nitrate (synthetic fertilizer) Air
kg NH3= kg N * FracGASF= 1*0.1* (17/14) = 0.12 kg NH3/ kg N fertilizer applied
NH3 - others (synthetic fertilizer) Air
kg NH3= kg N * FracGASF= 1*0.02* (17/14) = 0.024 kg NH3/ kg N fertilizer applied
NH3 (manure) Air
kg NH3= kg N*FracGASF= 1*0.2* (17/14) = 0.24 kg NH3/ kg N manure applied
kg NH3= kg N*FracGASF= 1*0.2* (17/14) = 0.24 kg NH3/ kg N manure applied
NO3NO3- (synthetic fertilizer and manure) Water
kg NO3- = kg N*FracLEACH = 1*0.3*(62/14) = 1.33 kg NO3-/ kg N applied
kg NO3-= kg N*FracLEACH = 1*0.1*(62/14) = 0.44 kg NO3-/ kg N applied
N2
N2-fixation by crop
Not specified
For crops with symbiotic N2-fixation: the fixed amount is assumed to be identical to the N-content in the harvested crop
N2 Air 0.09 kg N2 / kg N applied
Pruning inputs from shading trees or coffee plantation management and its related N2O emissions can contribute significantly to carbon footprints (Noponen et al., 2012). Further research is required to reduce the uncertainty of emission factors.
Table 9: N emissions according to PEFCR v3.6
36
3.4.15 Phosphorus and phosphate
3.4.19 Biogenic carbon uptake
3.4.18 Peat soils
3.4.20 Carbon stock of land use and transformation
3.4.16 CO2 emissions from urea and lime application
According to PEFCR 6.3, fertilizer (and manure) emissions should be differentiated by fertilizer type and cover the following minimum P-related emissions:
• PO4, to water unspecified or freshwater (leaching and run-off of soluble phosphate from P-fertilizer application)
• P, to water unspecified or freshwater (soil particles containing phosphorous, from P-fertilizer application).
Since no P-related emissions model is suggested in PEFCR, we have provided details from the emissions model used in ecoinvent (T Nemecek et al., 2011) and WFLDB (Thomas Nemecek et al., 2015), which is based on the SALC model developed by Pashun (see annex 10.1).
According to PEFCR v6.3, a simplified approach to biogenic carbon emissions and uptake should be used for food and beverage LCAs. This means that only biogenic methane should be included in an environmental footprint study, while any other biogenic emissions from or to the atmosphere should be not be considered. This also means that carbon contained in the coffee cherry (and corresponding CO2 uptake and future emissions) should not be considered in an inventory. This may differ if other guidelines or standards are followed.
According to PEFCR v6.3, drained peat soils should include carbon dioxide emissions based on a model that relates drainage levels to annual carbon oxidation. Coffee in Colombia is typically not grown on peat soils.
Here, we account for biogenic carbon (CO2, CO, and CH4) exchanges from changing land use (LUC) following the PAS 2050-1 standard. An assessment should include all direct land use change within the last 20 years, which can be calculated using the following steps:
After the application of urea and lime, fossil CO2 is released into the air. Emissions can be calculated based on values from (De Klein et al., 2006) as shown in Table 10.
For the calculation consider the N content of urea (typically 46%) and not the total weight of urea.
EMISSION COMPARTMENT VALUE TO BE APPLIED
From urea Air 1.57 kg CO2/kg Urea‐N
From limestone
Air 12/100 * 44/12 = 0.44 kg CO2/kg limestone
From dolomite
Air 12/92.2 * 44/12 = 0.48 kg CO2/kg dolomite
Table 10: CO2 emissions factor from IPCC (2006)
3.4.17 Heavy metal emissions
According to PEFCR v6.3, heavy metal emissions from field inputs should be modeled as emissions to soil and/or leaching or erosion to water. The inventory to water should specify the oxidation state of a metal (e.g., Cr+3, Cr+ 6).No heavy metal model is provided by PEF so we suggest using heavy metal emissions as calculated by SALCA‐heavy metal (Freiermuth, 2006). Inputs into farmlands and outputs to surface water and groundwater are calculated on the basis of heavy metal inputs from seeds, fertilizers, plant protection products, and depositions from the air. Crop residues left on fields are not considered since they do not leave the system.
Average heavy metal contents for arable land, pastures, meadows, and horticultural crops are used to calculate the amounts of heavy metals exported by soil erosion.Three types of emissions are considered:
• Leaching of heavy metals to the groundwater (always positive values)
• Emissions of heavy metals into surface waters through erosion of soil particles (always positive values)
• Emissions of heavy metals to agricultural soil (positive or negative values according to the results of the balance)
See annex 10.3 for detailed calculations.Part of the heavy metal assimilated during their cultivation and are released at a later stage of the life cycle. According to PEFCR v6.3, these can either be neglected (if an inventory does not account for final heavy metal emissions and therefore, should not account for heavy metal uptake by crops) or included (the inventory does account for final emissions (release) of heavy metals into the environment and therefore, should also account for heavy metal uptake by crops).
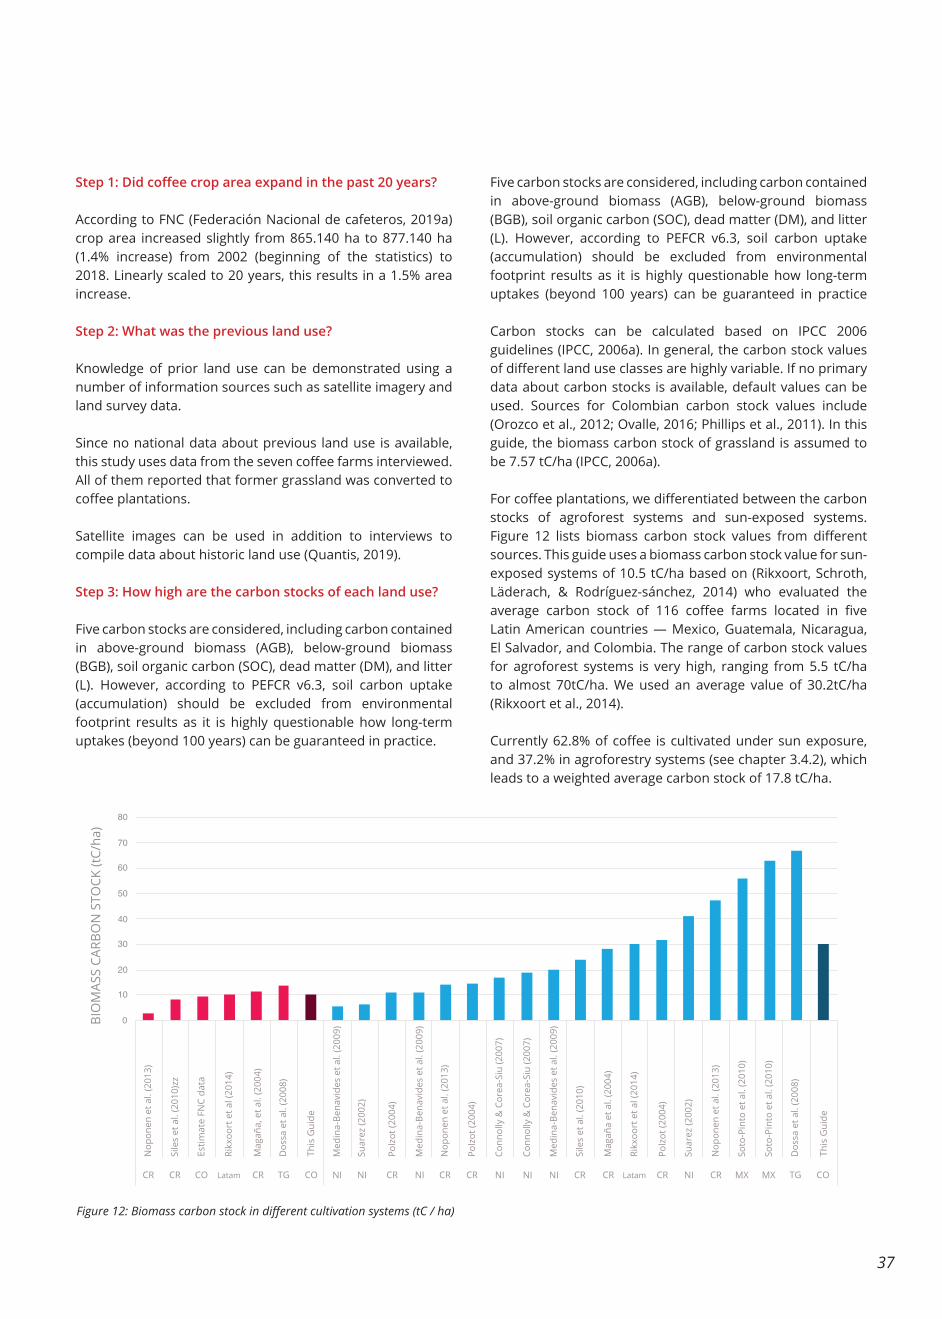
37
Figure 12: Biomass carbon stock in different cultivation systems (tC / ha)
Step 1: Did coffee crop area expand in the past 20 years?
According to FNC (Federación Nacional de cafeteros, 2019a) crop area increased slightly from 865.140 ha to 877.140 ha (1.4% increase) from 2002 (beginning of the statistics) to 2018. Linearly scaled to 20 years, this results in a 1.5% area increase.
Step 2: What was the previous land use?
Knowledge of prior land use can be demonstrated using a number of information sources such as satellite imagery and land survey data.
Since no national data about previous land use is available, this study uses data from the seven coffee farms interviewed. All of them reported that former grassland was converted to coffee plantations.
Satellite images can be used in addition to interviews to compile data about historic land use (Quantis, 2019).
Step 3: How high are the carbon stocks of each land use?
Five carbon stocks are considered, including carbon contained in above-ground biomass (AGB), below-ground biomass (BGB), soil organic carbon (SOC), dead matter (DM), and litter (L). However, according to PEFCR v6.3, soil carbon uptake (accumulation) should be excluded from environmental footprint results as it is highly questionable how long-term uptakes (beyond 100 years) can be guaranteed in practice.
0
10
20
30
40
50
60
70
80
Full sun (coffee trees) Shading system (coffee trees + shading vegetation)
Five carbon stocks are considered, including carbon contained in above-ground biomass (AGB), below-ground biomass (BGB), soil organic carbon (SOC), dead matter (DM), and litter (L). However, according to PEFCR v6.3, soil carbon uptake (accumulation) should be excluded from environmental footprint results as it is highly questionable how long-term uptakes (beyond 100 years) can be guaranteed in practice
Carbon stocks can be calculated based on IPCC 2006 guidelines (IPCC, 2006a). In general, the carbon stock values of different land use classes are highly variable. If no primary data about carbon stocks is available, default values can be used. Sources for Colombian carbon stock values include (Orozco et al., 2012; Ovalle, 2016; Phillips et al., 2011). In this guide, the biomass carbon stock of grassland is assumed to be 7.57 tC/ha (IPCC, 2006a).
For coffee plantations, we differentiated between the carbon stocks of agroforest systems and sun-exposed systems. Figure 12 lists biomass carbon stock values from different sources. This guide uses a biomass carbon stock value for sun-exposed systems of 10.5 tC/ha based on (Rikxoort, Schroth, Läderach, & Rodríguez-sánchez, 2014) who evaluated the average carbon stock of 116 coffee farms located in five Latin American countries — Mexico, Guatemala, Nicaragua, El Salvador, and Colombia. The range of carbon stock values for agroforest systems is very high, ranging from 5.5 tC/ha to almost 70tC/ha. We used an average value of 30.2tC/ha (Rikxoort et al., 2014).
Currently 62.8% of coffee is cultivated under sun exposure, and 37.2% in agroforestry systems (see chapter 3.4.2), which leads to a weighted average carbon stock of 17.8 tC/ha.
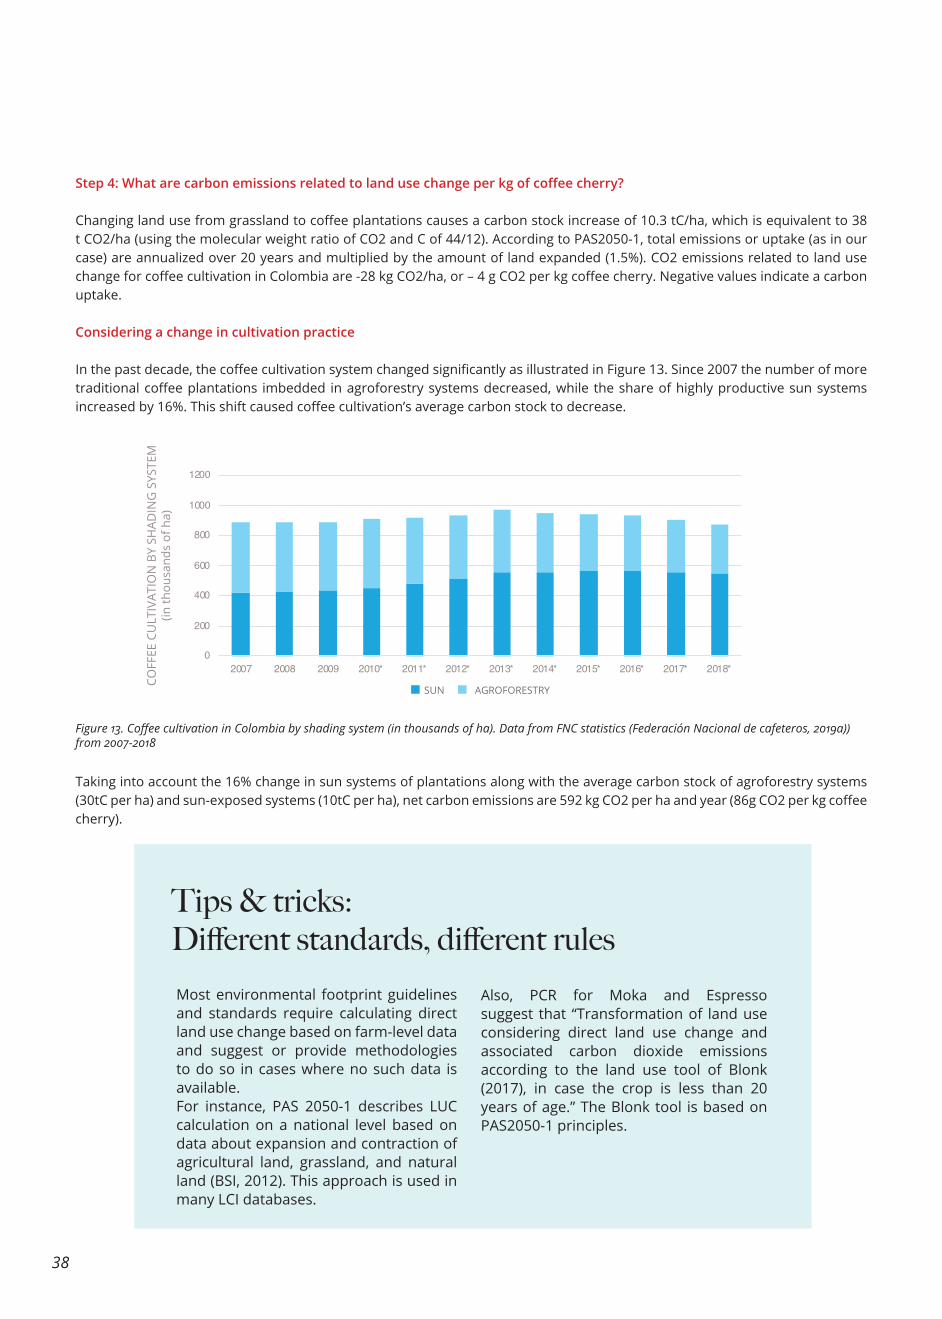
38
Step 4: What are carbon emissions related to land use change per kg of coffee cherry?
Changing land use from grassland to coffee plantations causes a carbon stock increase of 10.3 tC/ha, which is equivalent to 38 t CO2/ha (using the molecular weight ratio of CO2 and C of 44/12). According to PAS2050-1, total emissions or uptake (as in our case) are annualized over 20 years and multiplied by the amount of land expanded (1.5%). CO2 emissions related to land use change for coffee cultivation in Colombia are -28 kg CO2/ha, or – 4 g CO2 per kg coffee cherry. Negative values indicate a carbon uptake.
Considering a change in cultivation practice
In the past decade, the coffee cultivation system changed significantly as illustrated in Figure 13. Since 2007 the number of more traditional coffee plantations imbedded in agroforestry systems decreased, while the share of highly productive sun systems increased by 16%. This shift caused coffee cultivation’s average carbon stock to decrease.
Taking into account the 16% change in sun systems of plantations along with the average carbon stock of agroforestry systems (30tC per ha) and sun-exposed systems (10tC per ha), net carbon emissions are 592 kg CO2 per ha and year (86g CO2 per kg coffee cherry).
Figure 13. Coffee cultivation in Colombia by shading system (in thousands of ha). Data from FNC statistics (Federación Nacional de cafeteros, 2019a)) from 2007-2018
Most environmental footprint guidelines and standards require calculating direct land use change based on farm-level data and suggest or provide methodologies to do so in cases where no such data is available. For instance, PAS 2050-1 describes LUC calculation on a national level based on data about expansion and contraction of agricultural land, grassland, and natural land (BSI, 2012). This approach is used in many LCI databases.
Also, PCR for Moka and Espresso suggest that “Transformation of land use considering direct land use change and associated carbon dioxide emissions according to the land use tool of Blonk (2017), in case the crop is less than 20 years of age.” The Blonk tool is based on PAS2050-1 principles.
Tips & tricks: Different standards, different rules
0
200
400
600
800
1000
1200
2007 2008 2009 2010* 2011* 2012* 2013* 2014* 2015* 2016* 2017* 2018*
SUN AGROFORESTRY
39
3.4.21 Land occupation and transformation
3.4.22 Harvesting
Land transformation causes changes in ecosystem quality and affects GHG balance (see the previous chapter). Land occupation also delays recovery. Changes in ecosystem quality are modeled using land occupation and transformation elementary flows. The following flows are typically used:
• Land occupation is typically measured in square meters x years (m2.a), land use type i, and region k.
• Land transformation is typically expressed as square meters (m2), initial land use type i, final land use type j, and region k.
In order to perform an analysis of land use impacts on biodiversity and ecosystem services, it is important to use a comprehensive classification of all existing land uses and resulting land covers. A comprehensive list of land use types can be found in (Koellner et al., 2012).
In general it takes seven to eight months for coffee fruit to ripen (Arcila Pulgarín et al., 2007).In Colombia, there are two greater periods for harvesting: from April to June, and from September to December. The greater harvest period is identified as the “main harvest,” and the period with the lower volume as the “mitaca” or “naughty harvest” (FNC, Coffee Primer No. 19, 2004).
Generally speaking, there are two flowering and harvest cycles to consider with regards to Colombia:
• First flowering period: November 1–April 30• Harvest: July 1–December 31.• Second flowering period: May 1–October 31.• Harvest: January 1–June 30.
Tips & tricks: Land occupation and land Coffee uses the land type “Permanent crops, non-irrigated, intensive” based on the CORINE land cover classification as used in ecoinvent for data related to land occupation and for final land use type for land transformation.
Occupied land is calculated based on crop yield. This guide uses a yield of 6,889 kg coffee cherries/ha/year, which results in 1.45 m2.a /kg of coffee cherry.
All land transformations over the past 20 years (or crop cycle) are accounted for. The same values for land transformation used
in the previous section are also used here (1.5% expansion of grassland). This translates to 0.015 ha/ha of coffee cultivation. Land transformation is annualized over a period of 20 years, meaning the 0.015 ha/ha is divided by the yield from 20 years and hectares are converted to m2, which leads to a land transformation of 1.10E-03m2 from “grassland” to “permanent crops, non-irrigated, intensive” (per ecoinvent).
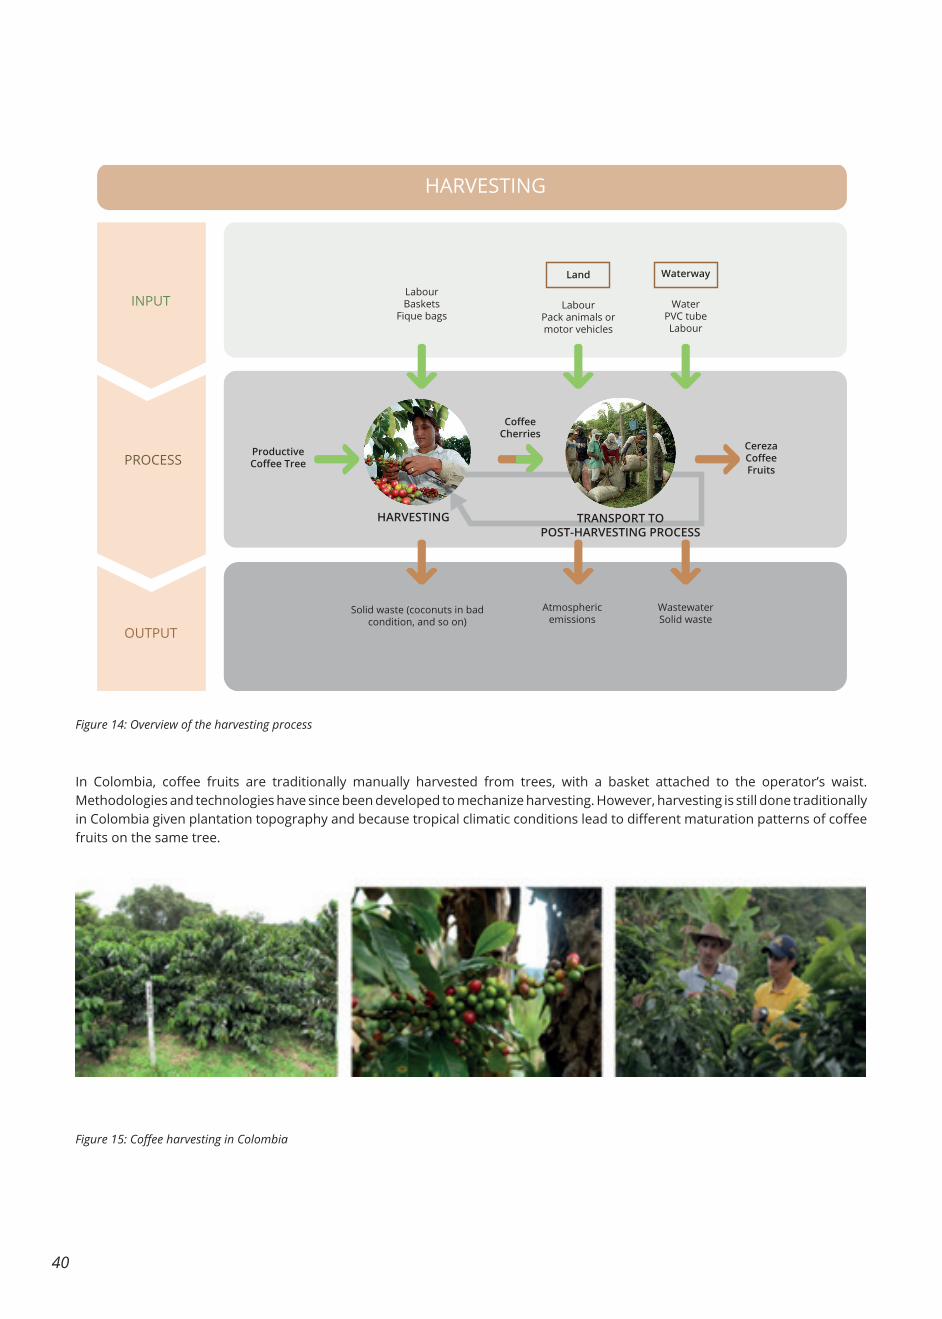
40
HARVESTING
INPUT
PROCESS
OUTPUT
Labour Baskets
Fique bags
Solid waste (coconuts in bad condition, and so on)
Atmospheric emissions
WastewaterSolid waste
Productive Coffee Tree
Coffee Cherries
LabourPack animals or motor vehicles
WaterPVC tubeLabour
WaterwayLand
Cereza Coffee Fruits
HARVESTING TRANSPORT TO POST-HARVESTING PROCESS
Figure 14: Overview of the harvesting process
Figure 15: Coffee harvesting in Colombia
In Colombia, coffee fruits are traditionally manually harvested from trees, with a basket attached to the operator’s waist. Methodologies and technologies have since been developed to mechanize harvesting. However, harvesting is still done traditionally in Colombia given plantation topography and because tropical climatic conditions lead to different maturation patterns of coffee fruits on the same tree.
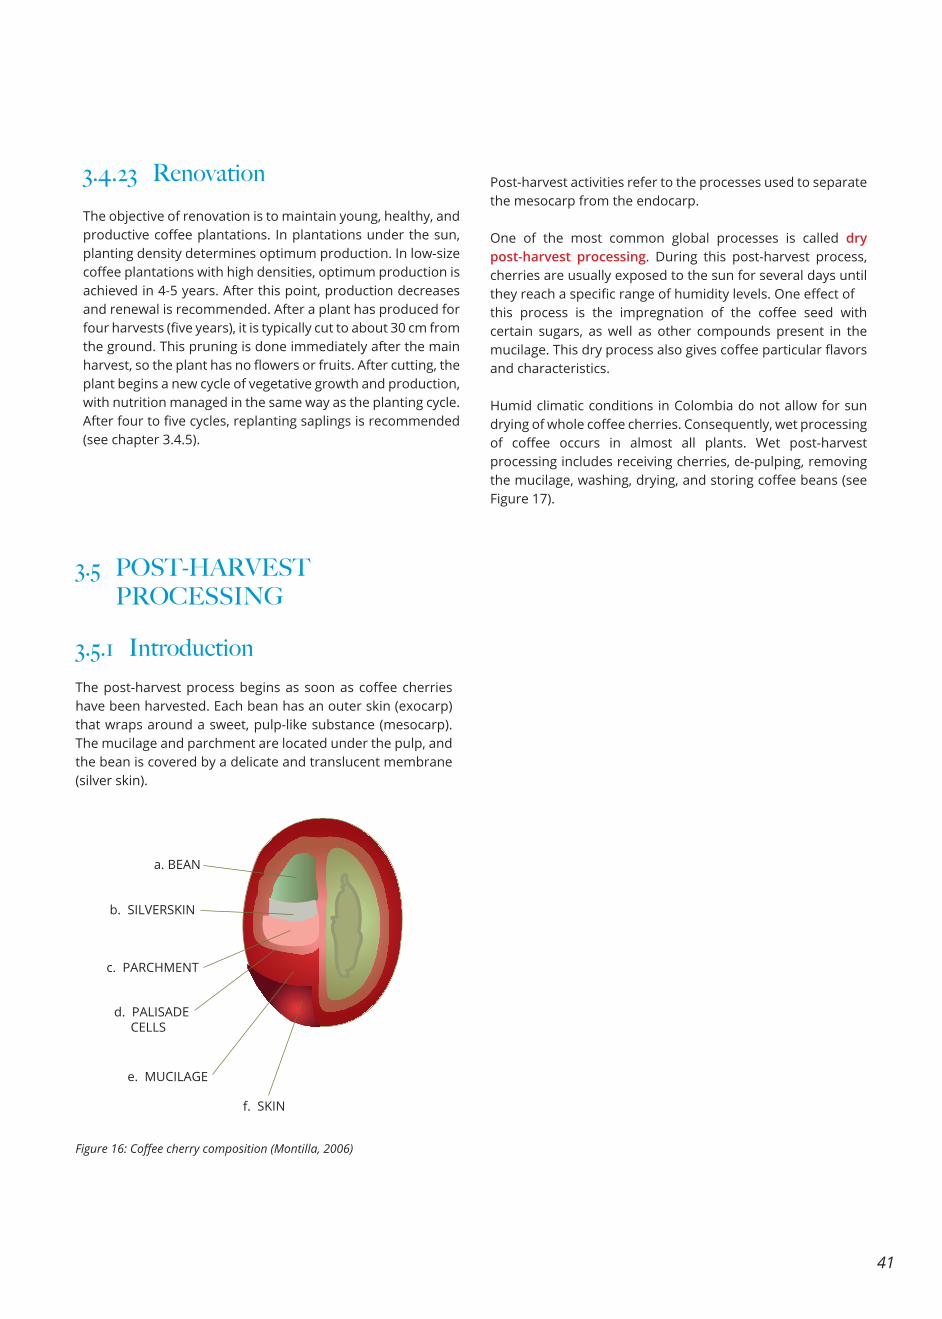
41
3.4.23 Renovation
3.5.1 Introduction
3.5 POST-HARVEST PROCESSING
The objective of renovation is to maintain young, healthy, and productive coffee plantations. In plantations under the sun, planting density determines optimum production. In low-size coffee plantations with high densities, optimum production is achieved in 4-5 years. After this point, production decreases and renewal is recommended. After a plant has produced for four harvests (five years), it is typically cut to about 30 cm from the ground. This pruning is done immediately after the main harvest, so the plant has no flowers or fruits. After cutting, the plant begins a new cycle of vegetative growth and production, with nutrition managed in the same way as the planting cycle. After four to five cycles, replanting saplings is recommended (see chapter 3.4.5).
The post-harvest process begins as soon as coffee cherries have been harvested. Each bean has an outer skin (exocarp) that wraps around a sweet, pulp-like substance (mesocarp). The mucilage and parchment are located under the pulp, and the bean is covered by a delicate and translucent membrane (silver skin).
a. BEAN
b. SILVERSKIN
c. PARCHMENT
d. PALISADE CELLS
e. MUCILAGE
f. SKIN
Figure 16: Coffee cherry composition (Montilla, 2006)
Post-harvest activities refer to the processes used to separate the mesocarp from the endocarp.
One of the most common global processes is called dry post-harvest processing. During this post-harvest process, cherries are usually exposed to the sun for several days until they reach a specific range of humidity levels. One effect of this process is the impregnation of the coffee seed with certain sugars, as well as other compounds present in the mucilage. This dry process also gives coffee particular flavors and characteristics.
Humid climatic conditions in Colombia do not allow for sun drying of whole coffee cherries. Consequently, wet processing of coffee occurs in almost all plants. Wet post-harvest processing includes receiving cherries, de-pulping, removing the mucilage, washing, drying, and storing coffee beans (see Figure 17).
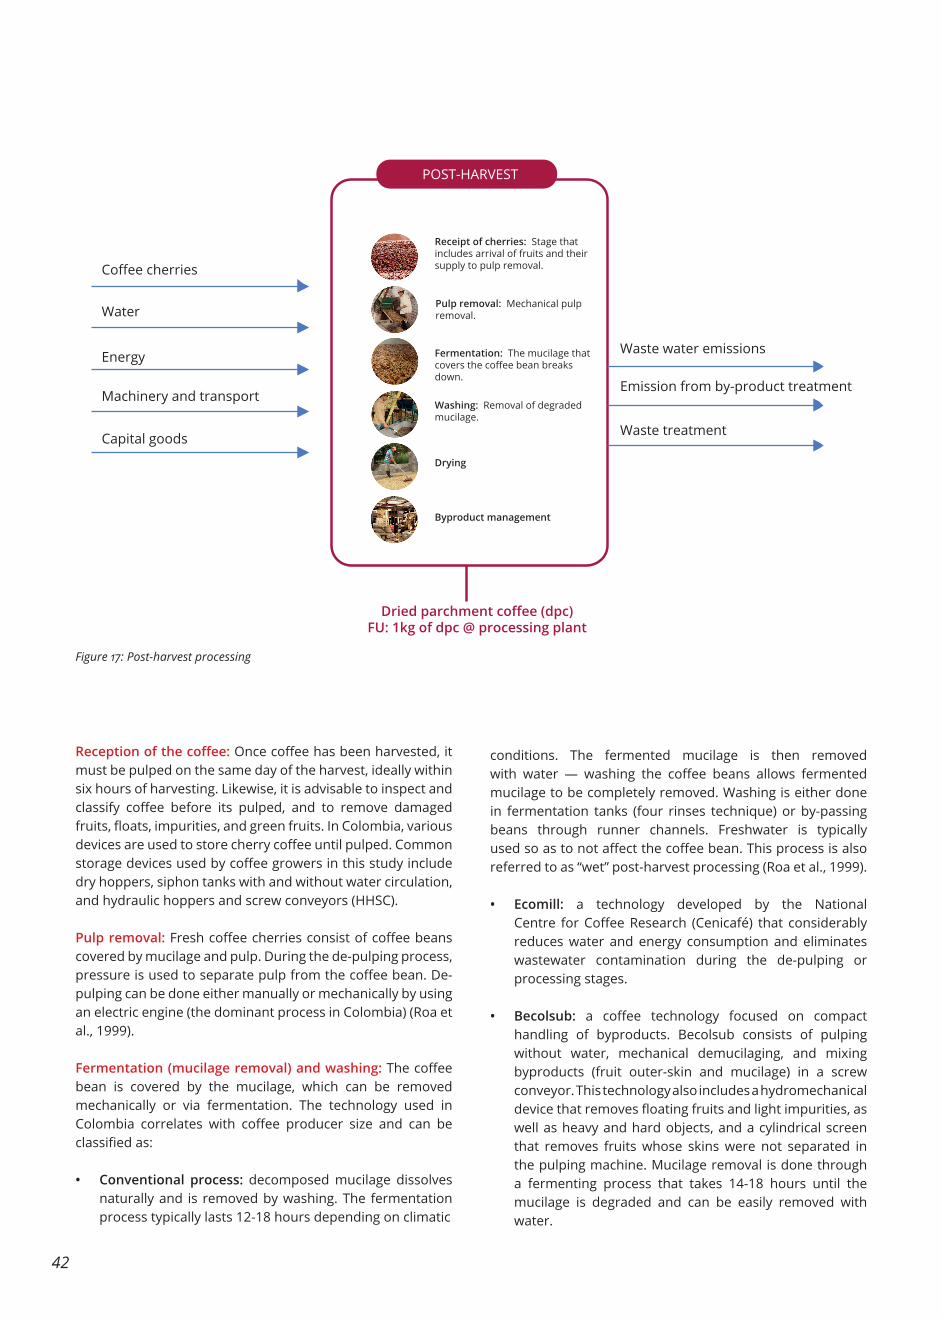
42
Receipt of cherries: Stage that includes arrival of fruits and their supply to pulp removal.
Pulp removal: Mechanical pulp removal.
Fermentation: The mucilage that covers the coffee bean breaks down.
Washing: Removal of degraded mucilage.
Drying
Byproduct management
POST-HARVEST
Waste water emissions
Coffee cherries
Dried parchment coffee (dpc)FU: 1kg of dpc @ processing plant
Water
Energy
Machinery and transport
Capital goods
Emission from by-product treatment
Waste treatment
Reception of the coffee: Once coffee has been harvested, it must be pulped on the same day of the harvest, ideally within six hours of harvesting. Likewise, it is advisable to inspect and classify coffee before its pulped, and to remove damaged fruits, floats, impurities, and green fruits. In Colombia, various devices are used to store cherry coffee until pulped. Common storage devices used by coffee growers in this study include dry hoppers, siphon tanks with and without water circulation, and hydraulic hoppers and screw conveyors (HHSC).
Pulp removal: Fresh coffee cherries consist of coffee beans covered by mucilage and pulp. During the de-pulping process, pressure is used to separate pulp from the coffee bean. De-pulping can be done either manually or mechanically by using an electric engine (the dominant process in Colombia) (Roa et al., 1999).
Fermentation (mucilage removal) and washing: The coffee bean is covered by the mucilage, which can be removed mechanically or via fermentation. The technology used in Colombia correlates with coffee producer size and can be classified as:
• Conventional process: decomposed mucilage dissolves naturally and is removed by washing. The fermentation process typically lasts 12-18 hours depending on climatic
conditions. The fermented mucilage is then removed with water — washing the coffee beans allows fermented mucilage to be completely removed. Washing is either done in fermentation tanks (four rinses technique) or by-passing beans through runner channels. Freshwater is typically used so as to not affect the coffee bean. This process is also referred to as “wet” post-harvest processing (Roa et al., 1999).
• Ecomill: a technology developed by the National Centre for Coffee Research (Cenicafé) that considerably reduces water and energy consumption and eliminates wastewater contamination during the de-pulping or processing stages.
• Becolsub: a coffee technology focused on compact handling of byproducts. Becolsub consists of pulping without water, mechanical demucilaging, and mixing byproducts (fruit outer-skin and mucilage) in a screw conveyor. This technology also includes a hydromechanical device that removes floating fruits and light impurities, as well as heavy and hard objects, and a cylindrical screen that removes fruits whose skins were not separated in the pulping machine. Mucilage removal is done through a fermenting process that takes 14-18 hours until the mucilage is degraded and can be easily removed with water.
Figure 17: Post-harvest processing
43
• Mechanical removal: consists of three machines for pulp removal, mucilage removal, and an infinite screw press (Deslim). This process is also referred to as “dry” post-harvest processing.
Drying. Drying is the stage that aims to reduce the humidity of the grain ( to 11-12%). Drying can be done naturally using the sun (e.g., on cement patios, drying cars, elbas, canopies, or parabolic dryers) or by using mechanical system (e.g., silos, guardiolas).
Storage. Green coffee products on farms are stored in clean, dry, ventilated, cool spaces (with moderate temperatures) free from contamination by chemical products, fertilizers, concentrates, or fuels, and are protected from insects, rodents, and other animals. Bags are placed on wooden pallets away from the walls.
Dry parchment coffee of good quality with a humidity of 10-12%, is stored for up to six months in environments with temperatures below 20° C and relative humidity of 65-70%. As time, temperature, and relative humidity in the storage environment increases, quality deteriorates more rapidly (Door, 2003).
zCoffee processing produces large amounts of by-products such as coffee pulp and husks. By-products can be used for fertilizer, livestock feed, compost, and fuel (Adams & Ghaly, 2007a).
The main water source for wet processing is typically surface water from a nearby river or body of water body that directly enters the wet mill through a pipeline.Direct volume measurement is recommended using a flow meter, or volume can be estimated using the inlet and process time.
If efforts to directly measure water used during the wet processing phase fail, recommended values to use instead are listed in Table 12. The table outlines the different wet processing stages and water volume withdrawn per kilogram of dry parchment coffee processed (Rojas Acosta et al., 2019).
3.5.2 Mass balance
9 11.5% moisture content was defined as a reference in the draft PEFCR of coffee. This is important to note if, for example, green coffee at different moisture contents are compared.
Table 11: Mass balance in dry and wet mass of coffee processing based on average data from FNC
MASS BALANCE AMOUNT UNIT HUMIDITY
Total input (dry) 290.1 g 0.0%
Coffee cherry (wet) 1,000.0 g 71.0%
Coffee cherry (dry) 290.1 g 0.0%
Total output (dry) 290.1 g 0.0%
Pulp (wet) 436.0 g 78.6%
Pulp (dry) 93.5 g 0.0%
Mucilage (wet) 149.0 g 89.5%
Mucilage (dry) 15.7 g 0.0%
Dried parchment coffee
204.0 g 11.3%
Dried parchment coffee (dry)
180.9 g 0.0%
3.5.3 Water balance
STAGE PRACTICEWATER
WITHDRAWAL (l water/kg dpc)
Receipt
Dry hopper 0
Hydraulic hopper and screw conveyor
0.025
Siphon tank without recirculation
4.7
Siphon tank with recirculation
2
Submersible pump 2
Pulp remo-val
With water 5
Without water 0
Pulp transport
With water 5
Without water 0
Pulped coffee transport
With water 5
Without water 0
Mechanical washer (Ecomill) 0.3-0.5
Other washers 2.2-2.7
Mucilage remover (Deslim) 0.7-1.0
Other mucilage removers 1.5-3.3
Four rinses technique in tank 4.0-5.0
Submersible pump 6.5-9.0
Semi-submerged canal 6.5-8.0
TOTAL Estimated national average 15.3
Table 12: Water use of coffee processing (Rodriguez V. & Quintero Y., 2015; Rojas Acosta et al., 2019)
44
A national average value of 15.3 liters of water withdrawn per kg dpc is estimated by approximating a technology share of 35% ecological wet processing and 65% conventional technology (Federación Nacional de cafeteros, 2018) with the corresponding water demand profile (see Table 12). These figures are estimates and can be used if no primary data is available.
Wastewater discharged once water has been used is the main output. The overall assumption is that 22% of wastewater is released to a water body (untreated) and 78% is released to soil — with 15% assumed to evaporate and 85% presumably returned to the watershed (infiltrated to GW or direct release to SW)(Calderón C & Rodríguez V, 2018).
Activities related to coffee processing (day laborer transport, onsite transport, etc.) mainly use vehicles powered by fossil fuels. Depending on the distances and geography of a region, animals can also be used to transport coffee and by-products. The average distance from farm to post-processing plant of the farms in this study located in Anioquia and Caldas is 16 km. However, distances in the northern region can be much larger. This guide assumes an average distance of 30 km in a truck (running on diesel) of up to 12 t (conservative estimate).
Directly measuring the main pollutants contained in wastewater, including COD, BOD5, NO3, PO4, TSS, NH3, and others, is recommended.
If analyzing water quality is not feasible, the wet processing reference values listed in Table 14 can be used for different pollutants generated depending on treatment practice (Rojas Acosta et al., 2019).
An electricity demand of 0.17 kWh per kg dpc is based on field questionnaires.
Heated silos are commonly used for drying coffee, powered by the burning of coal, wood, cisco, or other fossil fuels. Mechanical coffee drying is done in chambers where hot air is introduced at a maximum of 50°C, then driven by a fan that passes through the coffee mass. Air can be heated with stoves and burners that use (among other materials) diesel, coal, and electric power. Drying usually takes 25-30 hours. There is also different drying equipment such as static dryers that do not have pre-drying chambers, “Cenicafé” silo-dryers, and double-deck dryers.
Table 13 shows fuel consumption during coffee drying when silos are operating at maximum load capacity.
In Colombia, most small-scale coffee producers dry coffee using the sun, while large producers use cisco and coal (along with other fuels) in addition to the sun. The amount of cisco required (4.4 kg) to dry one arroba of dried green coffee and its calorific power 17.936 kJ/kg yield a very similar efficiency to that of coal and firewood (32%).
Table 13 lists fuels used for mechanical coffee drying (Adapted from Cartilla Cafetera N° 21, 2004, FNC).
3.5.4 Energy demand
FUEL AMOUNT OF FUEL CONSUMED(per kg of dried green coffee)
Cisco 0.35 kilograms
Coal 0.24 kilograms
Diesel 0.06 gallons
Propane gas 0.1 kilograms
3.5.5 Transport
3.5.6 Wastewater treatment and pollution
10 One arroba = 12.5 kg
45
Table 14: Wet processing reference values for different pollutants generated depending on treatment practice (Rojas Acosta et al., 2019)
STAGE PRACTICE kg COD/t dpc kg N/t dcp kg PO4/t dpc kg TSS/t dcp
Receipt
Dry hopper 0zzz 0 0 0
Hydraulic hopper and screw conve-yor 0.07 0 0 0.01
Siphon tank without recirculation 11 0.22 0.01 2
Siphon tank with recirculation 5 0.1 0 1
Pulp removalWith water 87 1.74 0.07 14
Without water 0 0 0 0
Pulp transportWith water 87 1.74 0.07 14
Without water 0 0 0 0
Pulp storageWithout roof 87 1.74 0.07 14
With roof 0 0 0 0
Pulp decompositionWithout roof 87 1.74 0.07 14
With roof 0 0 0 0
Collection and treatment of pulp
No 69 1.38 0.05 11
Yes 0 0 0 0
Wet coffee processing effluent treatment
Without wastewater treatment 152 2.91 0.1 17
Treatment with <20% efficiency(physical sedimentation or biochemical hydrolysis treatments)
121 2.42 0.08 14
Treatment with >20% and ≤50% efficiency (physical sedimentation + filtration treatments; for example, addition of mucilage to pulp)
91 1.84 0.06 10
Treatment with >50% and ≤80% efficiency (physical sedimentation + filtration with hydrolysis treatments; for example, application of Ecomill effluents to pulp)
45 0.85 0.03 5
Treatment with >80% and ≤99% efficiency (chemical treatments with aluminum salts, biological treatments with biodigesters, or SMTA)
15 0.27 0.01 2
Complete water treatment without generation of effluent (reuse of treated effluent)
0 0 0 0
TOTAL Colombia - estimated national average 375.4 7.4 0.3 53.1
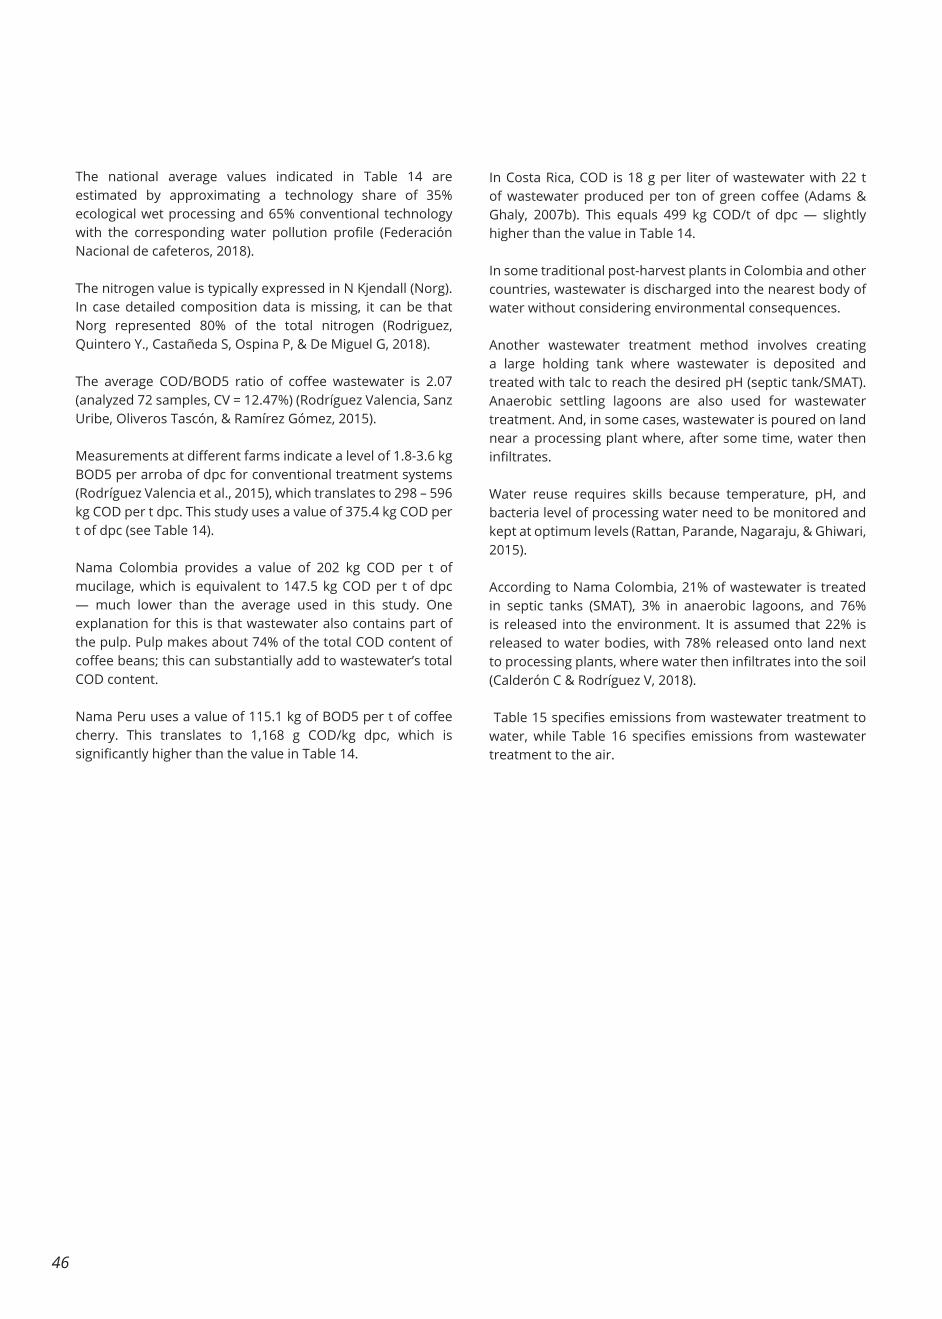
46
The national average values indicated in Table 14 are estimated by approximating a technology share of 35% ecological wet processing and 65% conventional technology with the corresponding water pollution profile (Federación Nacional de cafeteros, 2018).
The nitrogen value is typically expressed in N Kjendall (Norg). In case detailed composition data is missing, it can be that Norg represented 80% of the total nitrogen (Rodriguez, Quintero Y., Castañeda S, Ospina P, & De Miguel G, 2018).
The average COD/BOD5 ratio of coffee wastewater is 2.07 (analyzed 72 samples, CV = 12.47%) (Rodríguez Valencia, Sanz Uribe, Oliveros Tascón, & Ramírez Gómez, 2015).
Measurements at different farms indicate a level of 1.8-3.6 kg BOD5 per arroba of dpc for conventional treatment systems (Rodríguez Valencia et al., 2015), which translates to 298 – 596 kg COD per t dpc. This study uses a value of 375.4 kg COD per t of dpc (see Table 14).
Nama Colombia provides a value of 202 kg COD per t of mucilage, which is equivalent to 147.5 kg COD per t of dpc — much lower than the average used in this study. One explanation for this is that wastewater also contains part of the pulp. Pulp makes about 74% of the total COD content of coffee beans; this can substantially add to wastewater’s total COD content.
Nama Peru uses a value of 115.1 kg of BOD5 per t of coffee cherry. This translates to 1,168 g COD/kg dpc, which is significantly higher than the value in Table 14.
In Costa Rica, COD is 18 g per liter of wastewater with 22 t of wastewater produced per ton of green coffee (Adams & Ghaly, 2007b). This equals 499 kg COD/t of dpc — slightly higher than the value in Table 14.
In some traditional post-harvest plants in Colombia and other countries, wastewater is discharged into the nearest body of water without considering environmental consequences.
Another wastewater treatment method involves creating a large holding tank where wastewater is deposited and treated with talc to reach the desired pH (septic tank/SMAT). Anaerobic settling lagoons are also used for wastewater treatment. And, in some cases, wastewater is poured on land near a processing plant where, after some time, water then infiltrates.
Water reuse requires skills because temperature, pH, and bacteria level of processing water need to be monitored and kept at optimum levels (Rattan, Parande, Nagaraju, & Ghiwari, 2015).
According to Nama Colombia, 21% of wastewater is treated in septic tanks (SMAT), 3% in anaerobic lagoons, and 76% is released into the environment. It is assumed that 22% is released to water bodies, with 78% released onto land next to processing plants, where water then infiltrates into the soil (Calderón C & Rodríguez V, 2018).
Table 15 specifies emissions from wastewater treatment to water, while Table 16 specifies emissions from wastewater treatment to the air.
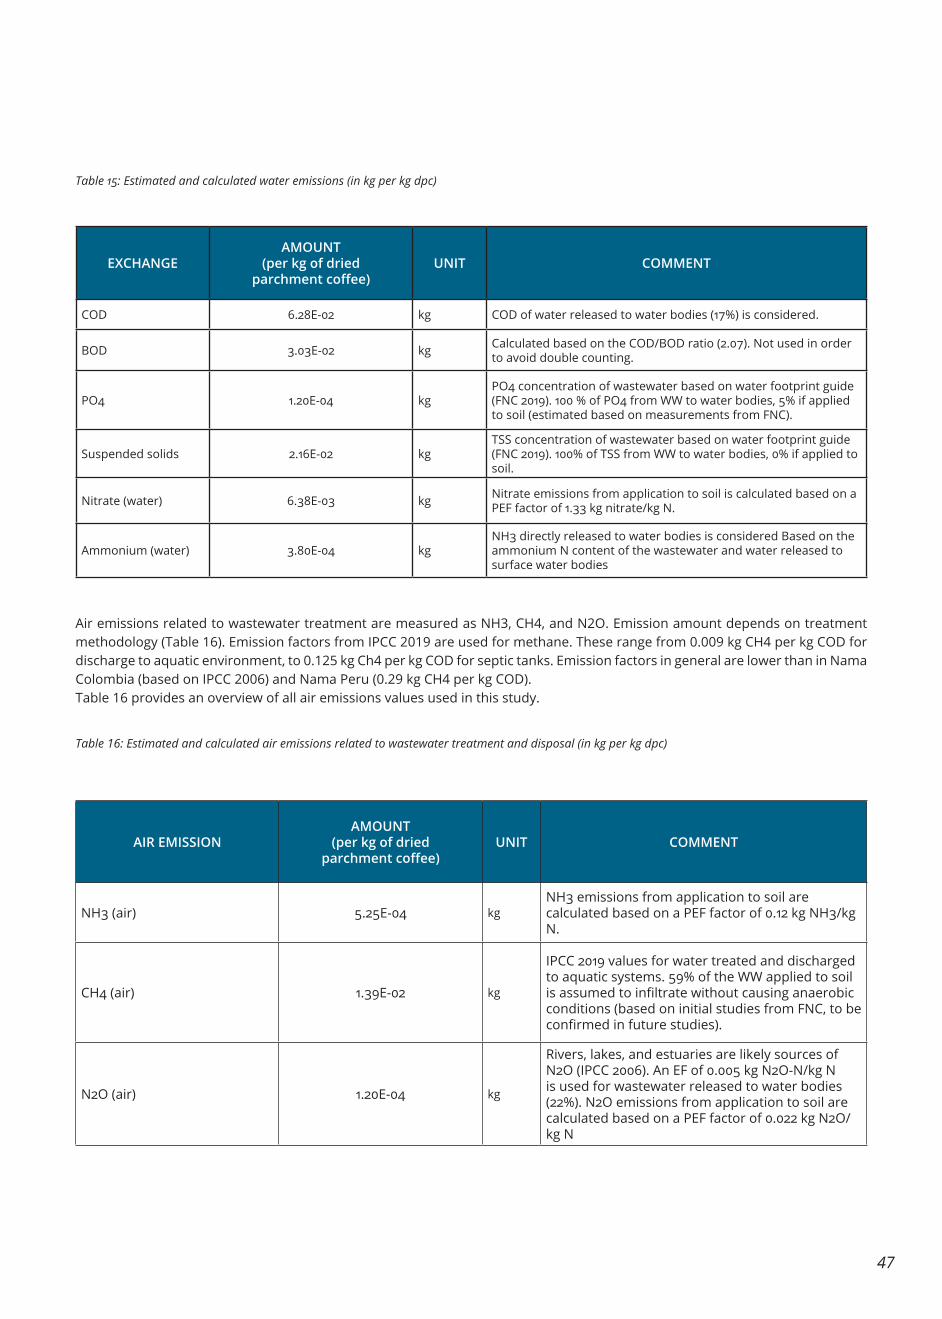
47
Table 15: Estimated and calculated water emissions (in kg per kg dpc)
EXCHANGEAMOUNT
(per kg of dried parchment coffee)
UNIT COMMENT
COD 6.28E-02 kg COD of water released to water bodies (17%) is considered.
BOD 3.03E-02 kg Calculated based on the COD/BOD ratio (2.07). Not used in order to avoid double counting.
PO4 1.20E-04 kgPO4 concentration of wastewater based on water footprint guide (FNC 2019). 100 % of PO4 from WW to water bodies, 5% if applied to soil (estimated based on measurements from FNC).
Suspended solids 2.16E-02 kgTSS concentration of wastewater based on water footprint guide (FNC 2019). 100% of TSS from WW to water bodies, 0% if applied to soil.
Nitrate (water) 6.38E-03 kg Nitrate emissions from application to soil is calculated based on a PEF factor of 1.33 kg nitrate/kg N.
Ammonium (water) 3.80E-04 kgNH3 directly released to water bodies is considered Based on the ammonium N content of the wastewater and water released to surface water bodies
Table 16: Estimated and calculated air emissions related to wastewater treatment and disposal (in kg per kg dpc)
Air emissions related to wastewater treatment are measured as NH3, CH4, and N2O. Emission amount depends on treatment methodology (Table 16). Emission factors from IPCC 2019 are used for methane. These range from 0.009 kg CH4 per kg COD for discharge to aquatic environment, to 0.125 kg Ch4 per kg COD for septic tanks. Emission factors in general are lower than in Nama Colombia (based on IPCC 2006) and Nama Peru (0.29 kg CH4 per kg COD).Table 16 provides an overview of all air emissions values used in this study.
AIR EMISSIONAMOUNT
(per kg of dried parchment coffee)
UNIT COMMENT
NH3 (air) 5.25E-04 kgNH3 emissions from application to soil are calculated based on a PEF factor of 0.12 kg NH3/kg N.
CH4 (air) 1.39E-02 kg
IPCC 2019 values for water treated and discharged to aquatic systems. 59% of the WW applied to soil is assumed to infiltrate without causing anaerobic conditions (based on initial studies from FNC, to be confirmed in future studies).
N2O (air) 1.20E-04 kg
Rivers, lakes, and estuaries are likely sources of N2O (IPCC 2006). An EF of 0.005 kg N2O-N/kg N is used for wastewater released to water bodies (22%). N2O emissions from application to soil are calculated based on a PEF factor of 0.022 kg N2O/kg N
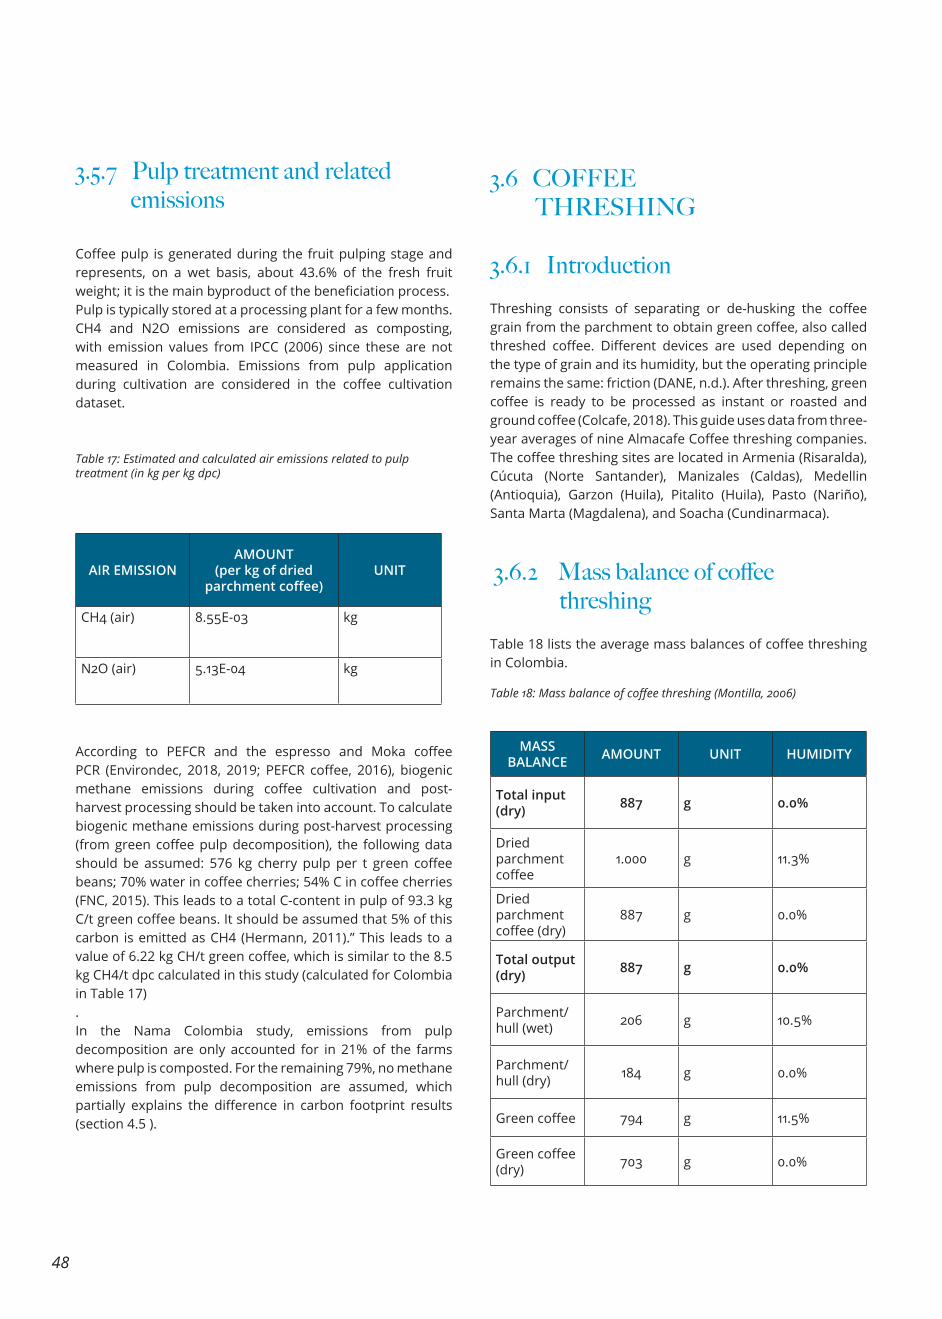
48
Coffee pulp is generated during the fruit pulping stage and represents, on a wet basis, about 43.6% of the fresh fruit weight; it is the main byproduct of the beneficiation process.Pulp is typically stored at a processing plant for a few months. CH4 and N2O emissions are considered as composting, with emission values from IPCC (2006) since these are not measured in Colombia. Emissions from pulp application during cultivation are considered in the coffee cultivation dataset.
Threshing consists of separating or de-husking the coffee grain from the parchment to obtain green coffee, also called threshed coffee. Different devices are used depending on the type of grain and its humidity, but the operating principle remains the same: friction (DANE, n.d.). After threshing, green coffee is ready to be processed as instant or roasted and ground coffee (Colcafe, 2018). This guide uses data from three-year averages of nine Almacafe Coffee threshing companies. The coffee threshing sites are located in Armenia (Risaralda), Cúcuta (Norte Santander), Manizales (Caldas), Medellin (Antioquia), Garzon (Huila), Pitalito (Huila), Pasto (Nariño), Santa Marta (Magdalena), and Soacha (Cundinarmaca).
Table 18 lists the average mass balances of coffee threshing in Colombia.
According to PEFCR and the espresso and Moka coffee PCR (Environdec, 2018, 2019; PEFCR coffee, 2016), biogenic methane emissions during coffee cultivation and post-harvest processing should be taken into account. To calculate biogenic methane emissions during post-harvest processing (from green coffee pulp decomposition), the following data should be assumed: 576 kg cherry pulp per t green coffee beans; 70% water in coffee cherries; 54% C in coffee cherries (FNC, 2015). This leads to a total C-content in pulp of 93.3 kg C/t green coffee beans. It should be assumed that 5% of this carbon is emitted as CH4 (Hermann, 2011).” This leads to a value of 6.22 kg CH/t green coffee, which is similar to the 8.5 kg CH4/t dpc calculated in this study (calculated for Colombia in Table 17). In the Nama Colombia study, emissions from pulp decomposition are only accounted for in 21% of the farms where pulp is composted. For the remaining 79%, no methane emissions from pulp decomposition are assumed, which partially explains the difference in carbon footprint results (section 4.5 ).
3.5.7 Pulp treatment and related emissions
3.6.1 Introduction
3.6.2 Mass balance of coffee threshing
3.6 COFFEE THRESHING
Table 17: Estimated and calculated air emissions related to pulp treatment (in kg per kg dpc)
Table 18: Mass balance of coffee threshing (Montilla, 2006)
AIR EMISSIONAMOUNT
(per kg of dried parchment coffee)
UNIT
CH4 (air) 8.55E-03 kg
N2O (air) 5.13E-04 kg
MASS BALANCE AMOUNT UNIT HUMIDITY
Total input (dry) 887 g 0.0%
Dried parchment coffee
1.000 g 11.3%
Dried parchment coffee (dry)
887 g 0.0%
Total output (dry) 887 g 0.0%
Parchment/hull (wet) 206 g 10.5%
Parchment/hull (dry) 184 g 0.0%
Green coffee 794 g 11.5%
Green coffee (dry) 703 g 0.0%
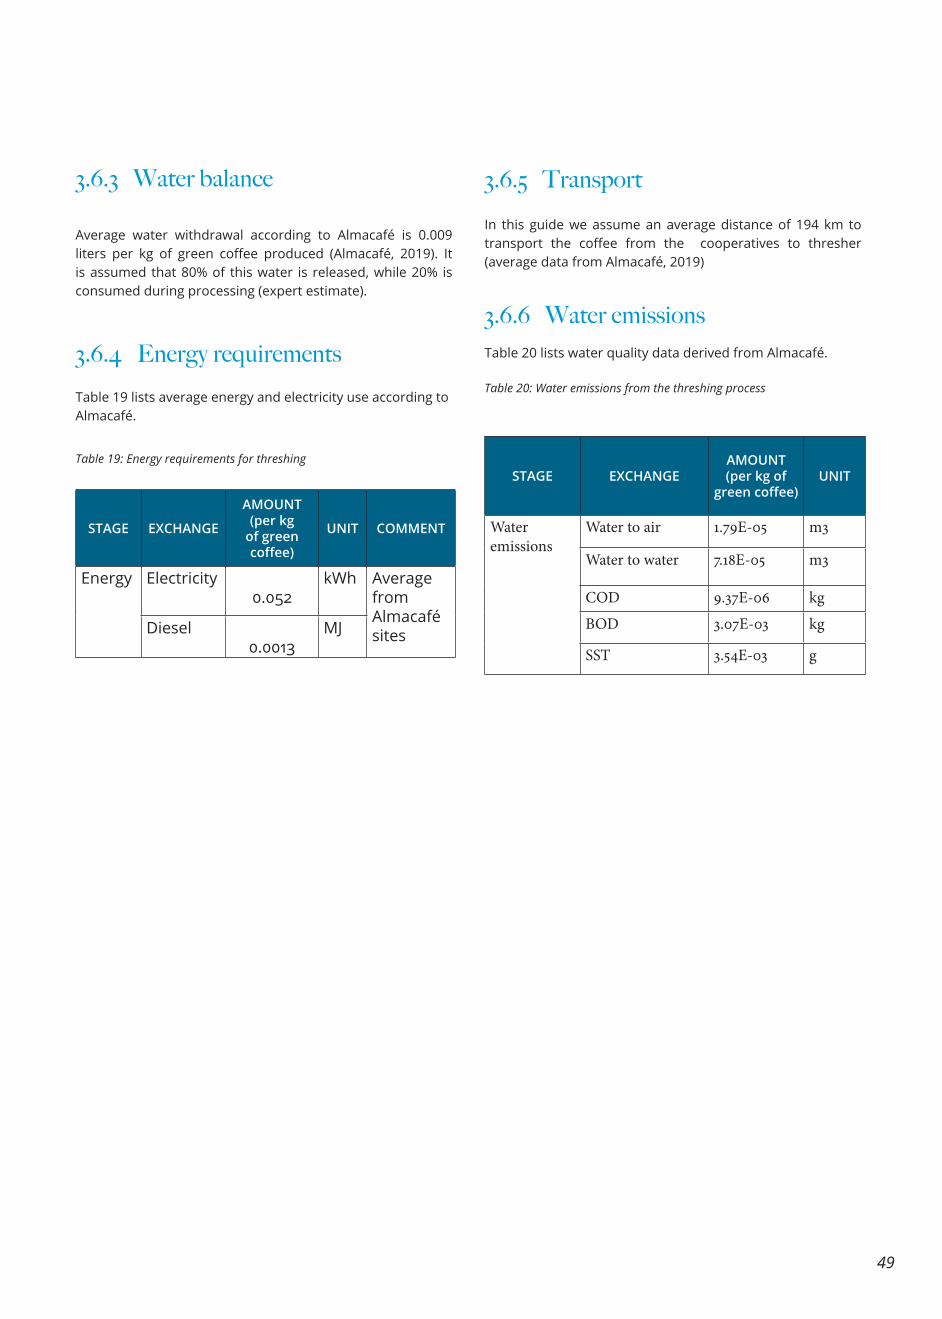
49
Average water withdrawal according to Almacafé is 0.009 liters per kg of green coffee produced (Almacafé, 2019). It is assumed that 80% of this water is released, while 20% is consumed during processing (expert estimate).
Table 19 lists average energy and electricity use according to Almacafé.
3.6.3 Water balance
3.6.4 Energy requirements
3.6.5 Transport
3.6.6 Water emissions
Table 19: Energy requirements for threshing
STAGE EXCHANGE
AMOUNT (per kg
of green coffee)
UNIT COMMENT
Energy Electricity 0.052
kWh Average from Almacafé sitesDiesel
0.0013MJ
In this guide we assume an average distance of 194 km to transport the coffee from the cooperatives to thresher (average data from Almacafé, 2019)
Table 20 lists water quality data derived from Almacafé.
Table 20: Water emissions from the threshing process
STAGE EXCHANGEAMOUNT (per kg of
green coffee)UNIT
Water emissions
Water to air 1.79E-05 m3
Water to water 7.18E-05 m3
COD 9.37E-06 kg
BOD 3.07E-03 kg
SST 3.54E-03 g
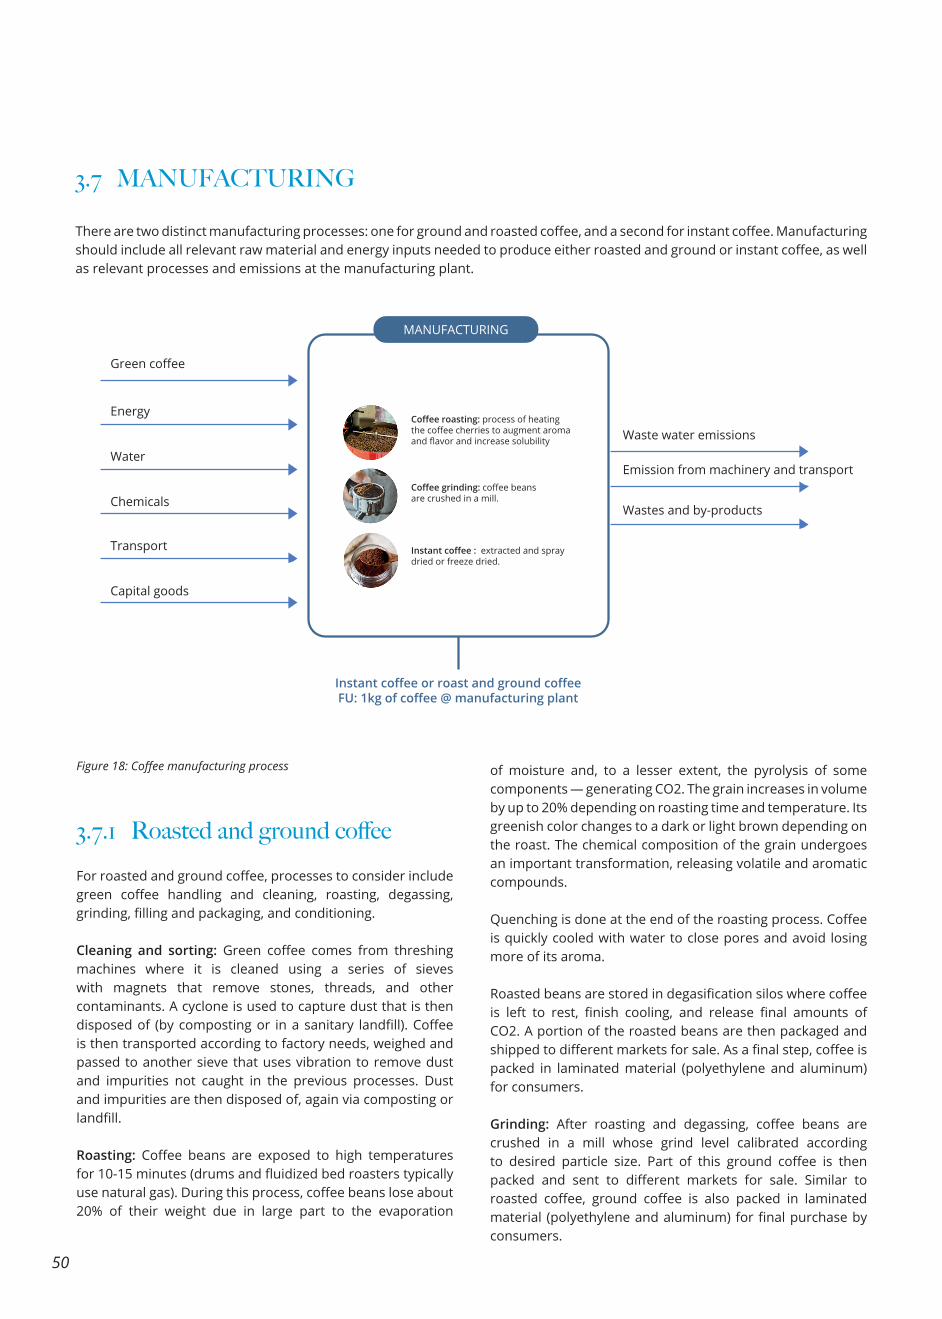
50
3.7 MANUFACTURING
MANUFACTURING
Coffee roasting: process of heating the coffee cherries to augment aroma and flavor and increase solubility
Coffee grinding: coffee beans are crushed in a mill.
Instant coffee : extracted and spray dried or freeze dried.
Green coffee
Energy
Water
Chemicals
Transport
Capital goods
Waste water emissions
Emission from machinery and transport
Wastes and by-products
Instant coffee or roast and ground coffeeFU: 1kg of coffee @ manufacturing plant
Figure 18: Coffee manufacturing process
3.7.1 Roasted and ground coffeeFor roasted and ground coffee, processes to consider include green coffee handling and cleaning, roasting, degassing, grinding, filling and packaging, and conditioning.
Cleaning and sorting: Green coffee comes from threshing machines where it is cleaned using a series of sieves with magnets that remove stones, threads, and other contaminants. A cyclone is used to capture dust that is then disposed of (by composting or in a sanitary landfill). Coffee is then transported according to factory needs, weighed and passed to another sieve that uses vibration to remove dust and impurities not caught in the previous processes. Dust and impurities are then disposed of, again via composting or landfill.
Roasting: Coffee beans are exposed to high temperatures for 10-15 minutes (drums and fluidized bed roasters typically use natural gas). During this process, coffee beans lose about 20% of their weight due in large part to the evaporation
of moisture and, to a lesser extent, the pyrolysis of some components — generating CO2. The grain increases in volume by up to 20% depending on roasting time and temperature. Its greenish color changes to a dark or light brown depending on the roast. The chemical composition of the grain undergoes an important transformation, releasing volatile and aromatic compounds.
Quenching is done at the end of the roasting process. Coffee is quickly cooled with water to close pores and avoid losing more of its aroma.
Roasted beans are stored in degasification silos where coffee is left to rest, finish cooling, and release final amounts of CO2. A portion of the roasted beans are then packaged and shipped to different markets for sale. As a final step, coffee is packed in laminated material (polyethylene and aluminum) for consumers.
Grinding: After roasting and degassing, coffee beans are crushed in a mill whose grind level calibrated according to desired particle size. Part of this ground coffee is then packed and sent to different markets for sale. Similar to roasted coffee, ground coffee is also packed in laminated material (polyethylene and aluminum) for final purchase by consumers.
There are two distinct manufacturing processes: one for ground and roasted coffee, and a second for instant coffee. Manufacturing should include all relevant raw material and energy inputs needed to produce either roasted and ground or instant coffee, as well as relevant processes and emissions at the manufacturing plant.
51
Table 21 provides default data for instant coffee (freeze dried and spray-dried) as well as roasted and ground coffee production from different sources.landfill.
3.7.2 Instant coffee
For instant coffee, processes to take into account include green coffee handling and cleaning, roasting and grinding, extraction, filling and packing, and conditioning. During instant coffee production, coffee grounds are produced as waste from the production process: coffee grounds are burned and used to generate heat that is then directly re-used in the manufacturing process. As they are wastes, impacts associated with instant coffee production should not be considered in an analysis, but burning-related emissions should be included.
Extraction: relies on controlled vapor pressure between 10-12 bars a temperature of 185º C, time, and flow in order to allow ground coffee to come into contact with hot water. In this process, coffee grounds are obtained as a byproduct and are subjected to pressing and drying processes for use as boiler fuel.
Spray-dried and freeze-dried instant coffee: There are two processes to produce soluble coffee:
• Freeze dried: Concentrated coffee extract follows a new process called “foaming,” in which air is incorporated under pressure. Then, using cooled strips, the foamed extract is continuously introduced to a cold room chilled to sub-zero temperatures. Refrigeration equipment are used for the freezing of the foamed extract, using ammonia as a refrigerant. The solidified extract is granulated and classified. During lyophilisation, water is removed from the frozen and granulated extract by physical means.
3.7.3 Default data for manufacturing
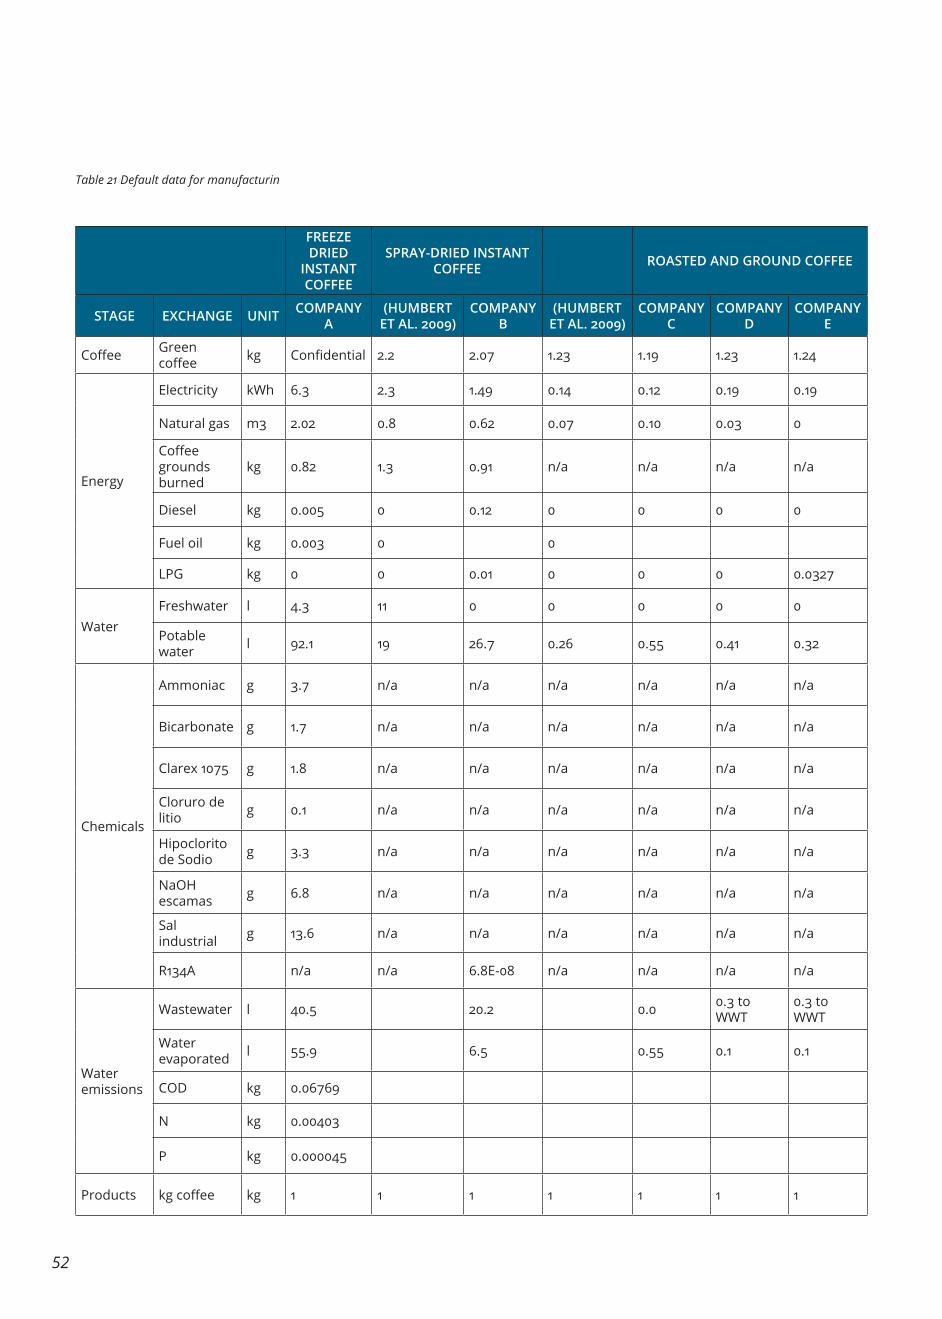
52
FREEZE DRIED
INSTANT COFFEE
SPRAY-DRIED INSTANT COFFEE ROASTED AND GROUND COFFEE
STAGE EXCHANGE UNIT COMPANY A
(HUMBERT ET AL. 2009)
COMPANY B
(HUMBERT ET AL. 2009)
COMPANY C
COMPANY D
COMPANY E
Coffee Green coffee kg Confidential 2.2 2.07 1.23 1.19 1.23 1.24
Energy
Electricity kWh 6.3 2.3 1.49 0.14 0.12 0.19 0.19
Natural gas m3 2.02 0.8 0.62 0.07 0.10 0.03 0
Coffee grounds burned
kg 0.82 1.3 0.91 n/a n/a n/a n/a
Diesel kg 0.005 0 0.12 0 0 0 0
Fuel oil kg 0.003 0 0
LPG kg 0 0 0.01 0 0 0 0.0327
WaterFreshwater l 4.3 11 0 0 0 0 0
Potable water l 92.1 19 26.7 0.26 0.55 0.41 0.32
Chemicals
Ammoniac g 3.7 n/a n/a n/a n/a n/a n/a
Bicarbonate g 1.7 n/a n/a n/a n/a n/a n/a
Clarex 1075 g 1.8 n/a n/a n/a n/a n/a n/a
Cloruro de litio g 0.1 n/a n/a n/a n/a n/a n/a
Hipoclorito de Sodio g 3.3 n/a n/a n/a n/a n/a n/a
NaOH escamas g 6.8 n/a n/a n/a n/a n/a n/a
Sal industrial g 13.6 n/a n/a n/a n/a n/a n/a
R134A n/a n/a 6.8E-08 n/a n/a n/a n/a
Water emissions
Wastewater l 40.5 20.2 0.0 0.3 to WWT
0.3 to WWT
Water evaporated l 55.9 6.5 0.55 0.1 0.1
COD kg 0.06769
N kg 0.00403
P kg 0.000045
Products kg coffee kg 1 1 1 1 1 1 1
Table 21 Default data for manufacturin
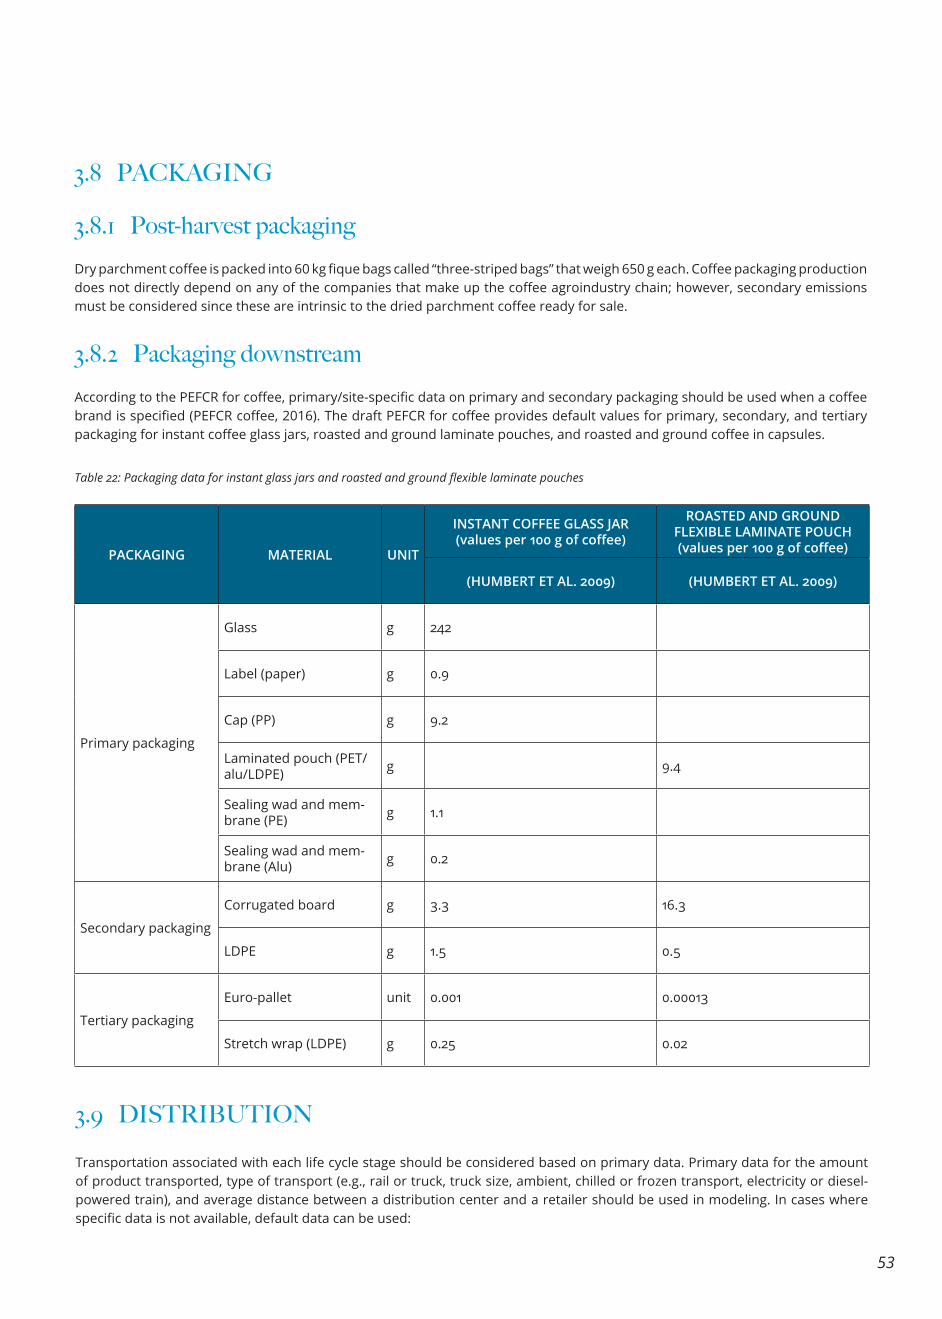
53
3.8 PACKAGING
Dry parchment coffee is packed into 60 kg fique bags called “three-striped bags” that weigh 650 g each. Coffee packaging production does not directly depend on any of the companies that make up the coffee agroindustry chain; however, secondary emissions must be considered since these are intrinsic to the dried parchment coffee ready for sale.
According to the PEFCR for coffee, primary/site-specific data on primary and secondary packaging should be used when a coffee brand is specified (PEFCR coffee, 2016). The draft PEFCR for coffee provides default values for primary, secondary, and tertiary packaging for instant coffee glass jars, roasted and ground laminate pouches, and roasted and ground coffee in capsules.
Transportation associated with each life cycle stage should be considered based on primary data. Primary data for the amount of product transported, type of transport (e.g., rail or truck, truck size, ambient, chilled or frozen transport, electricity or diesel-powered train), and average distance between a distribution center and a retailer should be used in modeling. In cases where specific data is not available, default data can be used:
3.8.1 Post-harvest packaging
3.8.2 Packaging downstream
Table 22: Packaging data for instant glass jars and roasted and ground flexible laminate pouches
PACKAGING MATERIAL UNIT
INSTANT COFFEE GLASS JAR(values per 100 g of coffee)
ROASTED AND GROUND FLEXIBLE LAMINATE POUCH (values per 100 g of coffee)
(HUMBERT ET AL. 2009) (HUMBERT ET AL. 2009)
Primary packaging
Glass g 242
Label (paper) g 0.9
Cap (PP) g 9.2
Laminated pouch (PET/alu/LDPE) g 9.4
Sealing wad and mem-brane (PE) g 1.1
Sealing wad and mem-brane (Alu) g 0.2
Secondary packaging
Corrugated board g 3.3 16.3
LDPE g 1.5 0.5
Tertiary packaging
Euro-pallet unit 0.001 0.00013
Stretch wrap (LDPE) g 0.25 0.02
3.9 DISTRIBUTION
54
• Green coffee transport in Colombia: transportation from farm to post-processing facility (chapter 3.5.5), from post-processing to threshing (chapter 3.6.5), and to manufacturing sites in Colombia (chapter 3.7.3)
• Green coffee transport for export to producer (based on draft coffee PEFCR recommendations): 1,500 km by truck from farm to shipping port; 12,600 km by ship from shipping port to producer and 1,500 km by truck (Quantis, 2016)
• Producer to point of sale based on draft coffee PEFCR recommendations: 2,000 km by >32 t truck (Quantis, 2016)
• Point of sale to consumer based on draft coffee PEFCR recommendations: 4 km by car and consumer transport (typically passenger car) is per km. In a PEF context, the EF of the consumer transport is based on volume and for passenger car the maximum volume considered is 0.2 m3 (around one-third of a .6 m3 trunk).
Transport from one distribution center to another (if applicable) should be included based on primary data for the number of transported products, distance between the distribution centers, and transport mode used (Quantis, 2016). The PCR of espresso also provides default transportation data:
° Transport from manufacturing plant to distribution center: 1,000 km by lorry (>32 t)
° ° Transport from distribution center to sales point: 50 km
by lorry (16-32 t) ° ° Transport from point of sale to home: 1 km by gasoline-
powered car, attributing 1% of the grocery shopping to coffee package (multiple coffee beverages can be prepared using one package of coffee)
3.10 USE3.10.1 Types of coffee
Coffee types can be classified by size and preparation. According to the draft PEFCR for coffee, sizes are classified as small (40 mL), long (120 mL), and large (240 mL) coffee.
The amount of coffee used per cup and waste rate depend on the preparation. For example, a small black coffee can be made with a capsule machine, espresso machine that uses ground coffee, or a Moka pot. A long white coffee, as another example, can be made with instant or filter coffee.
Companies should use specific data for coffee products sold on the market (e.g., capsules). Table 23 provides default values that can be used in cases where a company does not have precise information on consumer behavior.
55
Table 23: Amount of coffee and water per serving, pre-waste rate, and waste rate to make a coffee-based beverage based on the draft coffee PEFCR (Quantis, 2016) and the Moka and Espresso PCR.
COFFEE TYPE
SMALL BLACK COFFEE (40ml)
SMALL BLACK COFFEE (40ml)
LARGE BLACK COFFEE (240ml) WASTE RATES
COFFEE (g)
WATER (ml)
COFFEE (g)
WATER (ml)
COFFEE (g)
WATER (ml)
Instant coffee Self-portioned (PEFCR) - - 2 120 4 240
Double the amount of water needed is boiled (Humbert et al., 2009). 5% of product is lost throughout the supply chain, before consumption.
Roasted and ground coffee
Filter coffee (PEFCR) - - 7 120 14 240 Draft coffee PEFCR: 15% of
losses for the consumer at home (Keurig, 2009), 33% (Humbert et al., 2009) for all other cases (e.g., catering).5% of product is lost throughout the supply chain, before consumption.Moka PCR and Espresso PCR: Ground coffee loss during coffee distribution and coffee preparation is assumed to be 0%.
Moka coffee (PEFCR) 5.5 40 - - - -
Moka coffee (PCR Moka) 14-19 35-50
French press coffee (PEFCR) - - 7 120 14 240
Fully automatic machine coffee (PEFCR)
9 40 - - - -
0% of losses for the consumer at home (because one cup of coffee at a time is prepared). 5% of product is lost throughout the supply chain, before consumption.
Espresso machine (PCR espresso)
5-10 13-50
Espresso PCR: water consumption is assumed to be the amount of processed water in coffee beverages (e.g., 40 mL plus an add’l 50% to account for residual water (e.g., 40 + 20 = 60 mL)3.
Turkish coffee (PEFCR) 6 40 - - - -
15% of losses for the consumer at home (Keurig, 2009), 33% (Humbert et al., 2009) for all other cases (e.g., catering).5% of product is lost throughout the supply chain, before consumption.
Capsule coffee
Pre-portioned roasted and ground coffee (PEFCR)
5.3 40 - - - -
0% of losses for the consumer at home (because one cup of coffee at a time is prepared). 5% of product is lost throughout the supply chain, before consumption.
Waste should be included in coffee preparation. Since waste is dependent on consumer behavior and is therefore difficult to quantify, the draft coffee PEF provides default parameters (see Table 23) that can be used unless specific data is available.
56
3.10.2 Coffee machine and kettle production, use, and maintenance
3.10.3 Cup and other dishware production and washingproduction, use, and maintenance
According to the draft coffee PEFCR, coffee machines should be modeled using primary data if the brand of a machine is specified in a study. If a brand is not specified, coffee machines should be modeled using semi-specific data as provided in Table 24.
Table 24: Electricity demand (in Wh per cup as described in the previous chapter) of different coffee preparation methods based on the draft coffee PEFCR (Quantis, 2016)
COFFEE TYPESMALL LONG LARGE COMMENT
Wh/ CUP Wh/CUP Wh/CUP
Instant coffee Self-portioned (PEFCR) 15 Values from PEFCR
Roasted and ground coffee
Filter coffee (PEFCR) 33 Values from PEFCR
Fully automatic machine coffee (PEFCR)
26 Values from PEFCR
Espresso machine 33.3
800 watts to produce four cups of coffee in 10
minutes. Values from EnergyUseCalculator.com
(2019)
Pre-portioned roasted & ground coffee in capsules (PEFCR)
25 74 Values from PEFCR
According to the PCR of espresso, electricity should be determined according to standard EN 60661:2014-05, “Methods for measuring the performance of electric household coffee makers” (CENELEC, 2014).
Default data for kettle, drip filter, coffee capsule machines, and full-automatic machine production and maintenance are available in the draft coffee PEFCR. This data should be used unless the brand of the machine is specified in a study (in which case, primary data should be used). Energy to assemble the different parts of a coffee machine can be considered negligible and should be excluded.
Colombia, it can be assumed that all cups used at home are hand-washed.
The following default values should be used for washing done by hand unless specific information is available: 0.5 L water at 40°C and 0.2 g of detergent for one cup. Water is heated through a natural gas boiler with an average efficiency rate equal to 80%. Impacts associated with dishwasher production, delivery, use, and end-of-life should be included if applicable; default data is available in the draft coffee PEFCR and PEFCR v6.3. Cup production should be included; draft parameters for different cups are provided in the draft coffee PEFCR.
According to PEFCR for cup, saucer, and spoon washing, it should be assumed that cups and other dishware are washed 50% of the time in a dishwasher, and 50% by hand. In
57
3.10.4 Other ingredients
Coffee comes in many forms, and additional ingredients such as sugar or milk should be included if used. According to PEFCR, all ingredients should be modeled over their full life cycle using consistent modeling rules like the ones established for green coffee and the rest of the coffee-based beverage life cycle. The draft coffee PEFCR provides the following default values:
• Sugar: 5 g/cup• Milk: 12 mL/cup for cold milk and 60 mL/cup for hot milk • Powdered milk: 2 g/cup• Cream: 12 g/cup• Cocoa powder: 0.5 g/cup
More details on ingredient production, packaging, and distribution are provided in the draft coffee PEFCR (Quantis, 2016).
The end-of-life stage includes the treatment of coffee grounds, machines, and all dishware, including their packaging, occurring downstream. The “Circular Footprint Formula” (CFF) should be used to deal with multi-functionality in recycling, re-use, and energy recovery situations. The formula considers the burden and benefits of recycling materials, energy recovery, and final disposal. PEFCR v6.3 explains the formula in detail.
3.11 END-OF-LIFE
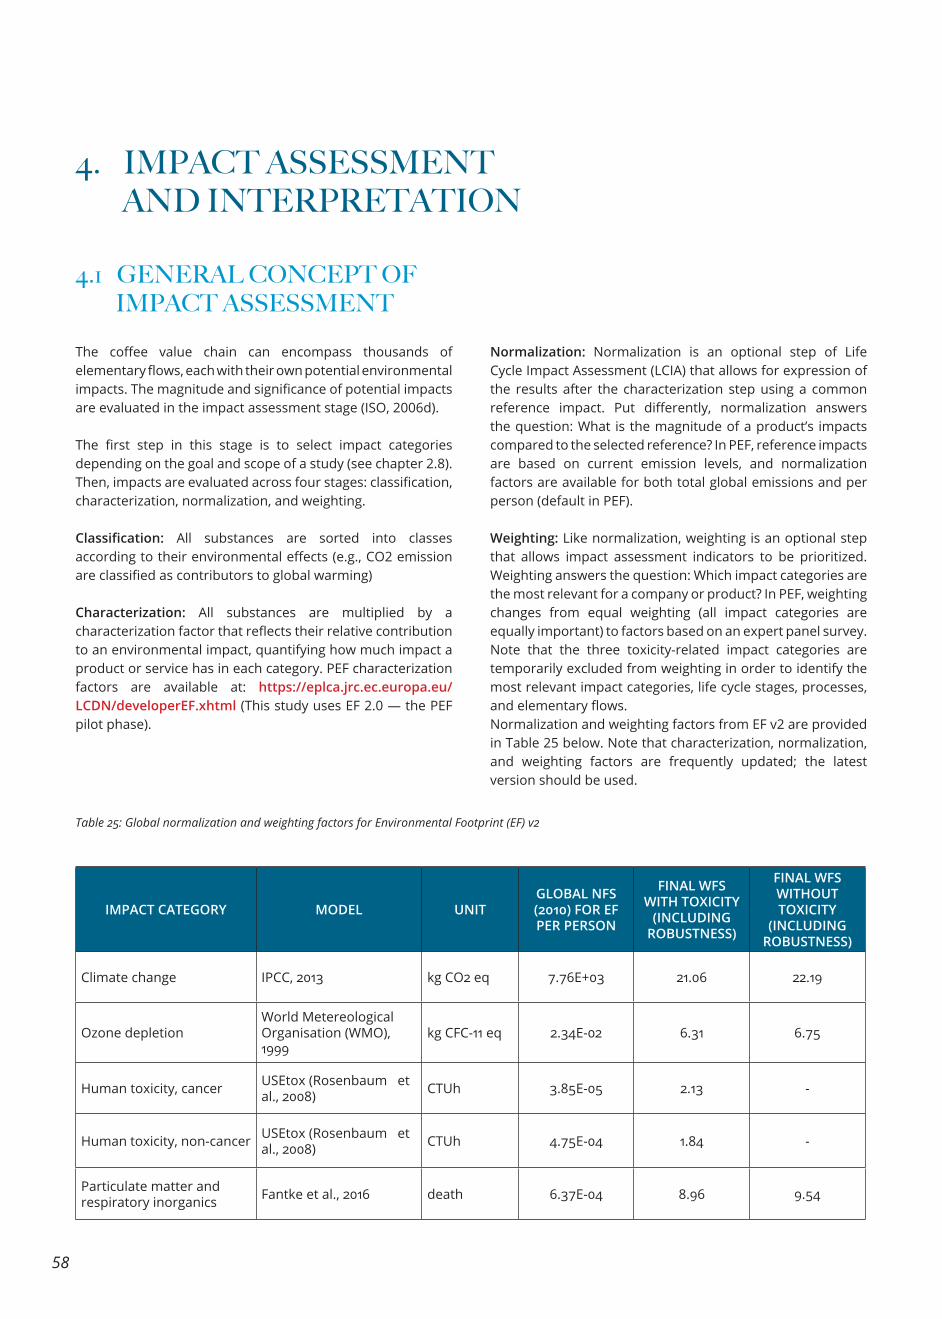
58
4. IMPACT ASSESSMENT AND INTERPRETATION
4.1 GENERAL CONCEPT OF IMPACT ASSESSMENT
The coffee value chain can encompass thousands of elementary flows, each with their own potential environmental impacts. The magnitude and significance of potential impacts are evaluated in the impact assessment stage (ISO, 2006d).
The first step in this stage is to select impact categories depending on the goal and scope of a study (see chapter 2.8). Then, impacts are evaluated across four stages: classification, characterization, normalization, and weighting.
Classification: All substances are sorted into classes according to their environmental effects (e.g., CO2 emission are classified as contributors to global warming)
Characterization: All substances are multiplied by a characterization factor that reflects their relative contribution to an environmental impact, quantifying how much impact a product or service has in each category. PEF characterization factors are available at: https://eplca.jrc.ec.europa.eu/LCDN/developerEF.xhtml (This study uses EF 2.0 — the PEF pilot phase).
Normalization: Normalization is an optional step of Life Cycle Impact Assessment (LCIA) that allows for expression of the results after the characterization step using a common reference impact. Put differently, normalization answers the question: What is the magnitude of a product’s impacts compared to the selected reference? In PEF, reference impacts are based on current emission levels, and normalization factors are available for both total global emissions and per person (default in PEF).
Weighting: Like normalization, weighting is an optional step that allows impact assessment indicators to be prioritized. Weighting answers the question: Which impact categories are the most relevant for a company or product? In PEF, weighting changes from equal weighting (all impact categories are equally important) to factors based on an expert panel survey. Note that the three toxicity-related impact categories are temporarily excluded from weighting in order to identify the most relevant impact categories, life cycle stages, processes, and elementary flows.Normalization and weighting factors from EF v2 are provided in Table 25 below. Note that characterization, normalization, and weighting factors are frequently updated; the latest version should be used.
Table 25: Global normalization and weighting factors for Environmental Footprint (EF) v2
IMPACT CATEGORY MODEL UNITGLOBAL NFS (2010) FOR EF PER PERSON
FINAL WFS WITH TOXICITY
(INCLUDING ROBUSTNESS)
FINAL WFS WITHOUT TOXICITY
(INCLUDING ROBUSTNESS)
Climate change IPCC, 2013 kg CO2 eq 7.76E+03 21.06 22.19
Ozone depletionWorld Metereological Organisation (WMO), 1999
kg CFC-11 eq 2.34E-02 6.31 6.75
Human toxicity, cancer USEtox (Rosenbaum et al., 2008) CTUh 3.85E-05 2.13 -
Human toxicity, non-cancer USEtox (Rosenbaum et al., 2008) CTUh 4.75E-04 1.84 -
Particulate matter and respiratory inorganics Fantke et al., 2016 death 6.37E-04 8.96 9.54
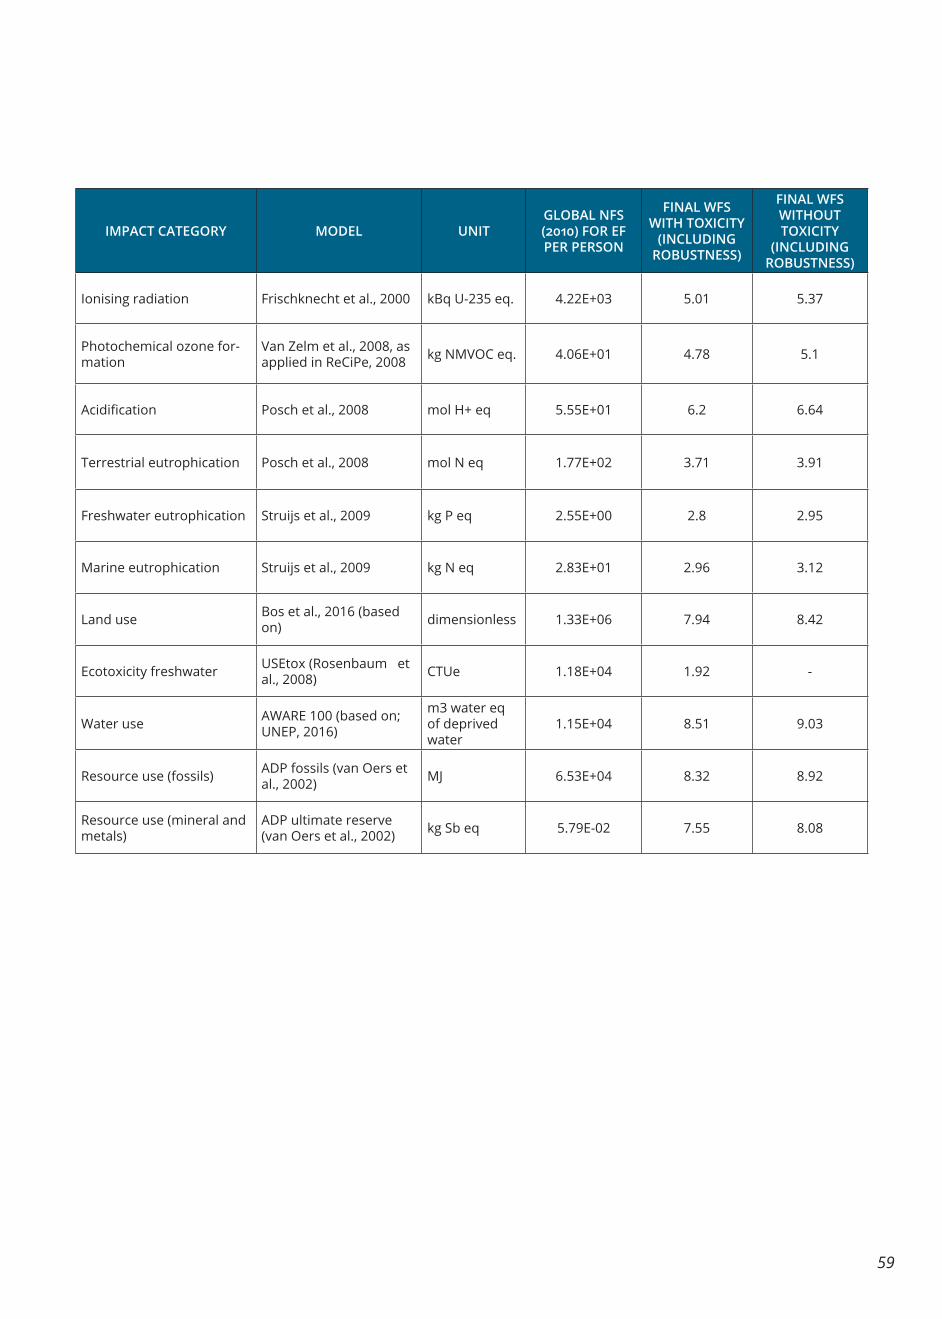
59
IMPACT CATEGORY MODEL UNITGLOBAL NFS (2010) FOR EF PER PERSON
FINAL WFS WITH TOXICITY
(INCLUDING ROBUSTNESS)
FINAL WFS WITHOUT TOXICITY
(INCLUDING ROBUSTNESS)
Ionising radiation Frischknecht et al., 2000 kBq U-235 eq. 4.22E+03 5.01 5.37
Photochemical ozone for-mation
Van Zelm et al., 2008, as applied in ReCiPe, 2008 kg NMVOC eq. 4.06E+01 4.78 5.1
Acidification Posch et al., 2008 mol H+ eq 5.55E+01 6.2 6.64
Terrestrial eutrophication Posch et al., 2008 mol N eq 1.77E+02 3.71 3.91
Freshwater eutrophication Struijs et al., 2009 kg P eq 2.55E+00 2.8 2.95
Marine eutrophication Struijs et al., 2009 kg N eq 2.83E+01 2.96 3.12
Land use Bos et al., 2016 (based on) dimensionless 1.33E+06 7.94 8.42
Ecotoxicity freshwater USEtox (Rosenbaum et al., 2008) CTUe 1.18E+04 1.92 -
Water use AWARE 100 (based on; UNEP, 2016)
m3 water eq of deprived water
1.15E+04 8.51 9.03
Resource use (fossils) ADP fossils (van Oers et al., 2002) MJ 6.53E+04 8.32 8.92
Resource use (mineral and metals)
ADP ultimate reserve (van Oers et al., 2002) kg Sb eq 5.79E-02 7.55 8.08
60
Calculating impact results is typically done using LCA software.
SimaPro: SimaPro, edited by PRé Sustainability, is one of the main LCA software solutions on the market. It is adapted to ecoinvent data format and most other LCI databases; the most commonly used and scientifically supported LCIA methodologies are implemented. It provides a high level of flexibility and transparency, enabling refined modeling and complete interpretation. This tool offers a graphic representation of the life cycle of the process or product 71analysed using Sankey diagrams, which allows a user to visualize the contribution of each process to the total impact. SimaPro also allows for comparisons between product and processes. Results can be easily exported to Excel.
• Tips and tricks (videos): https://www.pre-sustainability.com/simapro-tips-tricks
• Tutorial: https://www.pre-sustainability.com/simapro-tutorial
• Tutorial in Spanish: http://simapro.mx/ACVeti.html
• FAQ: https://www.pre-sustainability.com/faq
GaBi: Is edited by thinkstep/Sphera and is widely used by industries. It is based on the large — but mostly aggregated — GaBi LCI database. This means that instead of being able to see contributions in terms of each unit process, all flows are rolled up into elementary flow categories, which doesn’t provide insight into contributing processes.
• Tutorial: https://www.gabi-software.com/support/gabi-learning-center/gabi-learning-center/
• FAQ: https://www.gabi-software.com/support/gabi-faq/
OpenLCA: This free, open-source software is coordinated by GreenDelta (http://www.openlca.org/). It offers some flexibility in usage and is compatible with most data formats and LCI databases. Its main weaknesses are the lack of user support from GreenDelta, and regular announcements of new features that are not actually mature enough to be used. However, the software allows for visualization of the whole life cycle of the process, information exchanges between Ecospold or ILCD, and easy ways to export results to Excel.
• Tips and tricks (videos): https://www.youtube.com/channel/UCGiahq1YZWK4pRXDVXuIi6w/videos
• Tutorial: http://www.openlca.org/learning/
• FAQ: https://nexus.openlca.org/faqs
Tips & tricks: LCA software
4.2 GENERAL CONCEPT INTERPRETATIONIn the interpretation phase, environmental footprint results are explained and/or translated. Interpretation typically includes the following aspects, described further in the following sections of this chapter:
• Hotspot analysis: identification of the highest-contributing process stages, processes, and flows for a given environmental footprint category
• Identification of relevant impact categories
• Benchmarking: in cases where the environmental performance of products and services that 72analyse the same functions are compared (e.g., different coffee farms producing coffee cherries) or if absolute results are compared to a well-known reference for communication purposes (e.g., carbon footprint of a cup of coffee is like driving x km with a passenger car).
• Data quality and uncertainty: considers completeness, sensitivity, and consistency checks
• Conclusions, limitations, and recommendations
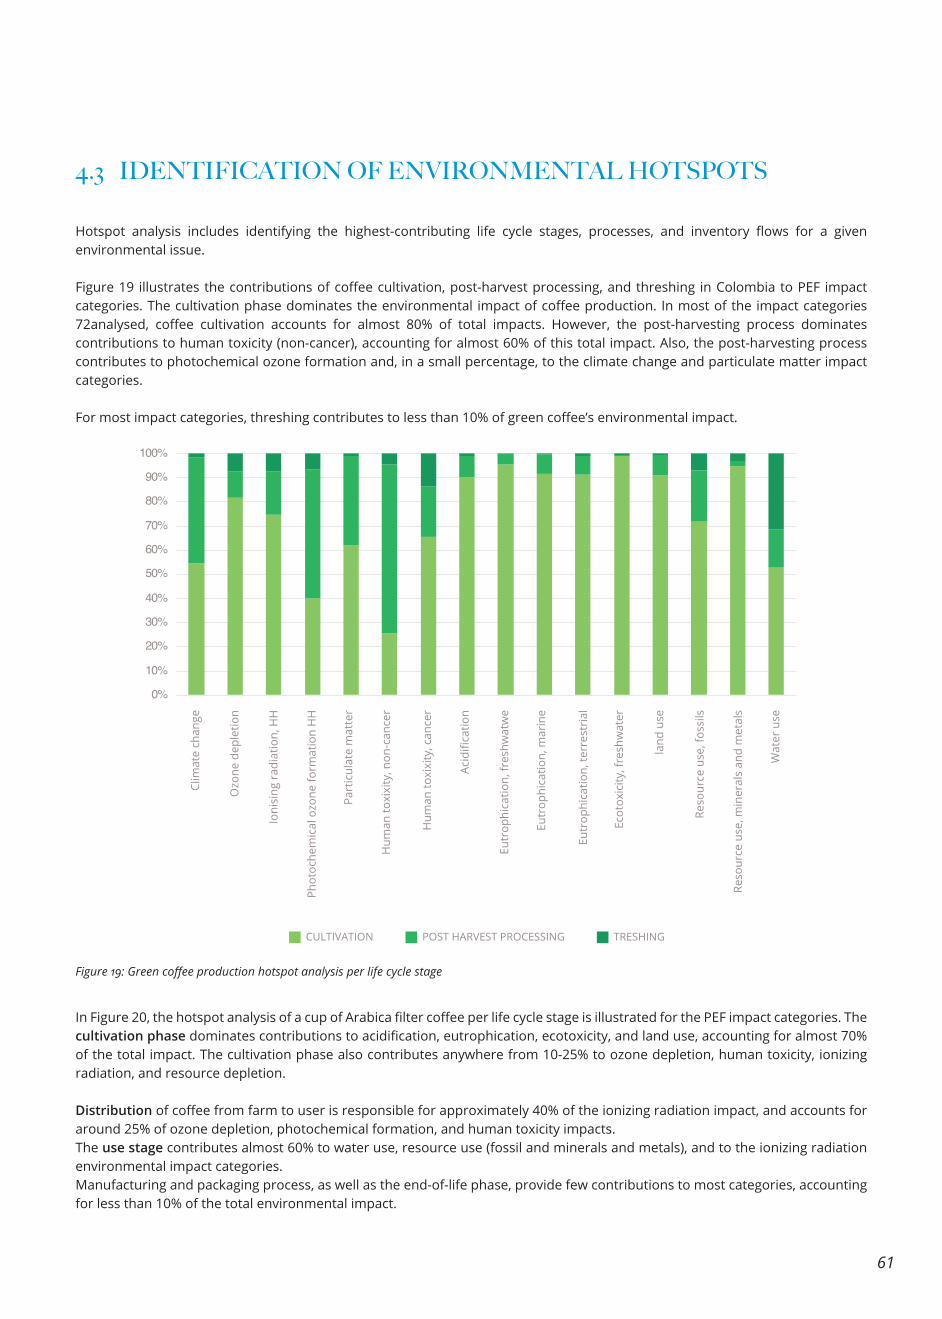
61
4.3 IDENTIFICATION OF ENVIRONMENTAL HOTSPOTS
Hotspot analysis includes identifying the highest-contributing life cycle stages, processes, and inventory flows for a given environmental issue.
Figure 19 illustrates the contributions of coffee cultivation, post-harvest processing, and threshing in Colombia to PEF impact categories. The cultivation phase dominates the environmental impact of coffee production. In most of the impact categories 72analysed, coffee cultivation accounts for almost 80% of total impacts. However, the post-harvesting process dominates contributions to human toxicity (non-cancer), accounting for almost 60% of this total impact. Also, the post-harvesting process contributes to photochemical ozone formation and, in a small percentage, to the climate change and particulate matter impact categories.
For most impact categories, threshing contributes to less than 10% of green coffee’s environmental impact.
In Figure 20, the hotspot analysis of a cup of Arabica filter coffee per life cycle stage is illustrated for the PEF impact categories. The cultivation phase dominates contributions to acidification, eutrophication, ecotoxicity, and land use, accounting for almost 70% of the total impact. The cultivation phase also contributes anywhere from 10-25% to ozone depletion, human toxicity, ionizing radiation, and resource depletion.
Distribution of coffee from farm to user is responsible for approximately 40% of the ionizing radiation impact, and accounts for around 25% of ozone depletion, photochemical formation, and human toxicity impacts.The use stage contributes almost 60% to water use, resource use (fossil and minerals and metals), and to the ionizing radiation environmental impact categories. Manufacturing and packaging process, as well as the end-of-life phase, provide few contributions to most categories, accounting for less than 10% of the total environmental impact.
0%
10%
20%
30%
40%
50%
60%
70%
80%
90%
100%
Clim
ate
chan
ge
Ozo
ne d
eple
tion
Ioni
sing
rad
iatio
n, H
H
Phot
oche
mic
al o
zone
form
atio
n H
H
Part
icul
ate
mat
ter
Hum
an to
xixi
ty, n
on-c
ance
r
Hum
an to
xixi
ty, c
ance
r
Acidificatio
n
Eutr
ophi
catio
n, fr
eshw
atw
e
Eutr
ophi
catio
n, m
arin
e
Eutr
ophi
catio
n, te
rres
tria
l
Ecot
oxic
ity, f
resh
wat
er
land
use
Reso
urce
use
, fos
sils
Reso
urce
use
, min
eral
s an
d m
etal
s
Wat
er u
se
CULTIVATION POST HARVEST PROCESSING TRESHING
Figure 19: Green coffee production hotspot analysis per life cycle stage
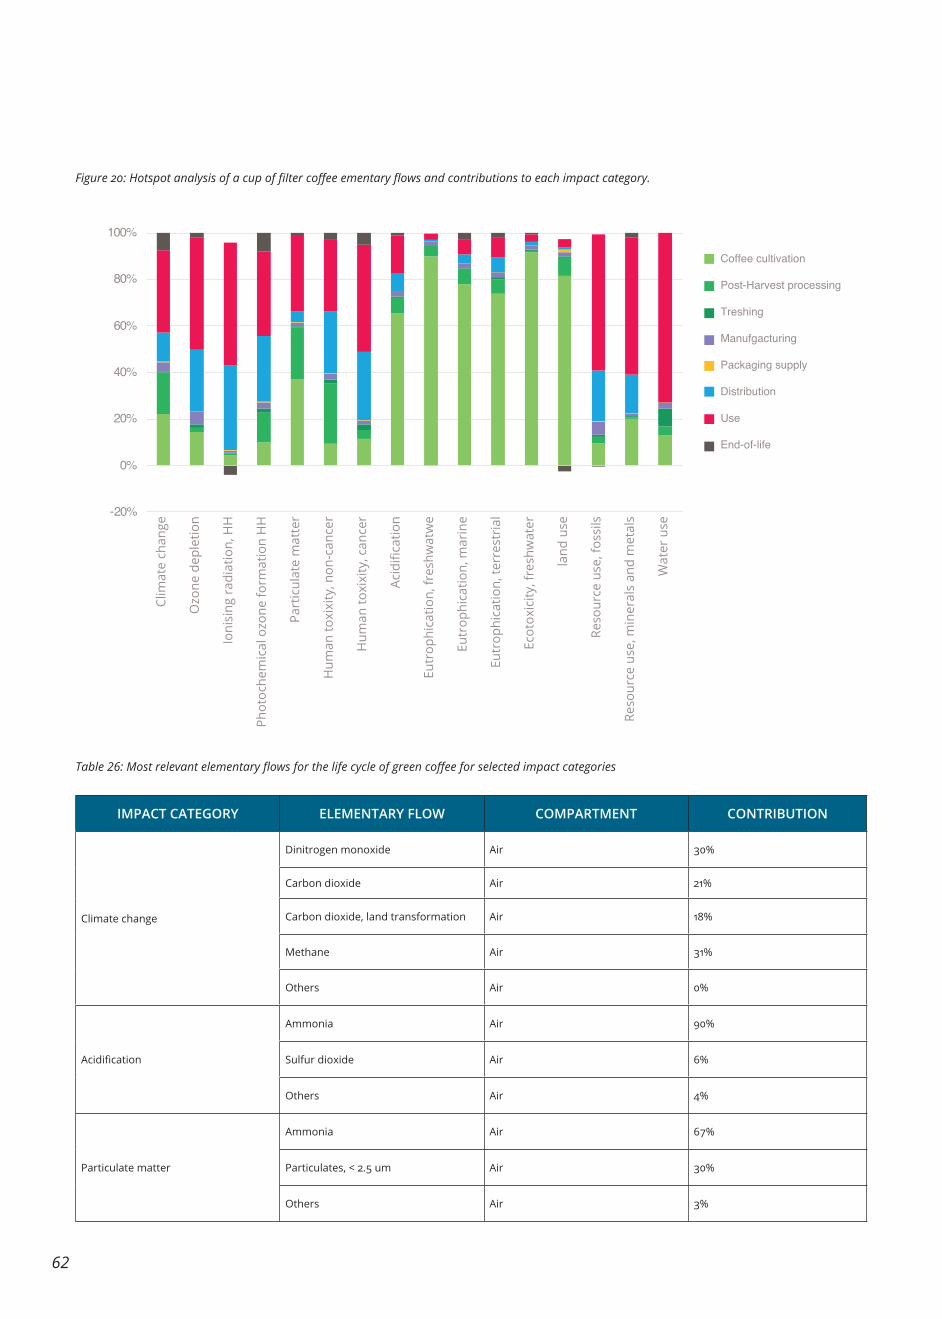
62
-20%
0%
20%
40%
60%
80%
100%
Clim
ate
chan
ge
Ozo
ne d
eple
tion
Ioni
sing
rad
iatio
n, H
H
Phot
oche
mic
al o
zone
form
atio
n H
H
Part
icul
ate
mat
ter
Hum
an to
xixi
ty, n
on-c
ance
r
Hum
an to
xixi
ty, c
ance
r
Acidificatio
n
Eutr
ophi
catio
n, fr
eshw
atw
e
Eutr
ophi
catio
n, m
arin
e
Eutr
ophi
catio
n, te
rres
tria
l
Ecot
oxic
ity, f
resh
wat
er
land
use
Reso
urce
use
, fos
sils
Reso
urce
use
, min
eral
s an
d m
etal
s
Wat
er u
se
Coffee cultivation
Post-Harvest processing
Treshing
Manufgacturing
Packaging supply
Distribution
Use
End-of-life
Figure 20: Hotspot analysis of a cup of filter coffee ementary flows and contributions to each impact category.
IMPACT CATEGORY ELEMENTARY FLOW COMPARTMENT CONTRIBUTION
Climate change
Dinitrogen monoxide Air 30%
Carbon dioxide Air 21%
Carbon dioxide, land transformation Air 18%
Methane Air 31%
Others Air 0%
Acidification
Ammonia Air 90%
Sulfur dioxide Air 6%
Others Air 4%
Particulate matter
Ammonia Air 67%
Particulates, < 2.5 um Air 30%
Others Air 3%
Table 26: Most relevant elementary flows for the life cycle of green coffee for selected impact categories
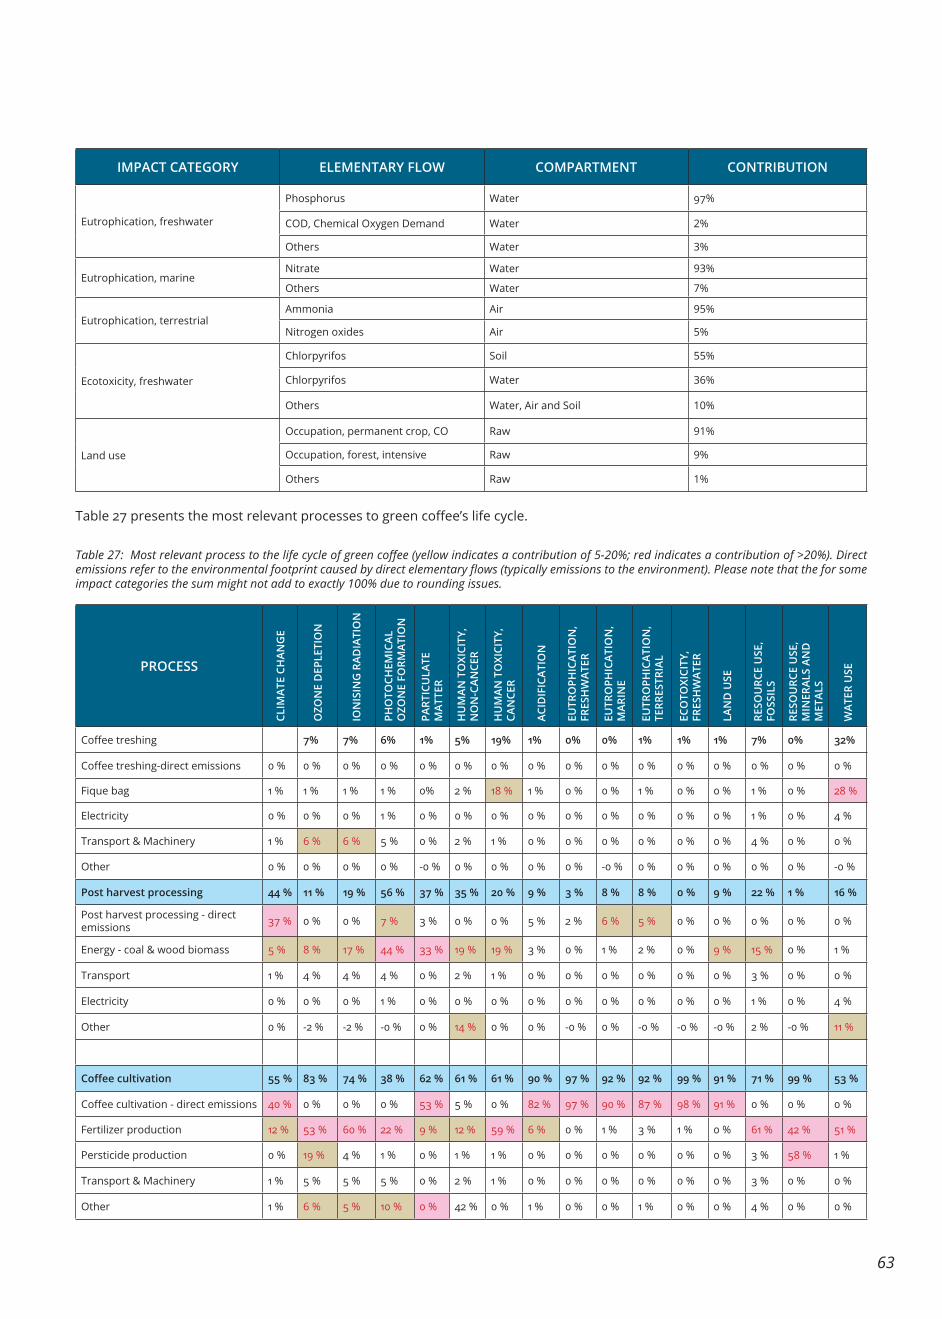
63
IMPACT CATEGORY ELEMENTARY FLOW COMPARTMENT CONTRIBUTION
Eutrophication, freshwater
Phosphorus Water 97%
COD, Chemical Oxygen Demand Water 2%
Others Water 3%
Eutrophication, marineNitrate Water 93%
Others Water 7%
Eutrophication, terrestrialAmmonia Air 95%
Nitrogen oxides Air 5%
Ecotoxicity, freshwater
Chlorpyrifos Soil 55%
Chlorpyrifos Water 36%
Others Water, Air and Soil 10%
Land use
Occupation, permanent crop, CO Raw 91%
Occupation, forest, intensive Raw 9%
Others Raw 1%
Table 27 presents the most relevant processes to green coffee’s life cycle.
PROCESS
CLIM
ATE
CHAN
GE
OZO
NE
DEP
LETI
ON
ION
ISIN
G R
ADIA
TIO
N
PHO
TOCH
EMIC
AL
OZO
NE
FORM
ATIO
N
PART
ICU
LATE
M
ATTE
R
HU
MAN
TO
XICI
TY,
NO
N-C
ANCE
R
HU
MAN
TO
XICI
TY,
CAN
CER
ACID
IFIC
ATIO
N
EUTR
OPH
ICAT
ION
, FR
ESH
WAT
ER
EUTR
OPH
ICAT
ION
, M
ARIN
E
EUTR
OPH
ICAT
ION
, TE
RRES
TRIA
L
ECO
TOXI
CITY
, FR
ESH
WAT
ER
LAN
D U
SE
RESO
URC
E U
SE,
FOSS
ILS
RESO
URC
E U
SE,
MIN
ERAL
S AN
D
MET
ALS
WAT
ER U
SE
Coffee treshing 7% 7% 6% 1% 5% 19% 1% 0% 0% 1% 1% 1% 7% 0% 32%
Coffee treshing-direct emissions 0 % 0 % 0 % 0 % 0 % 0 % 0 % 0 % 0 % 0 % 0 % 0 % 0 % 0 % 0 % 0 %
Fique bag 1 % 1 % 1 % 1 % 0% 2 % 18 % 1 % 0 % 0 % 1 % 0 % 0 % 1 % 0 % 28 %
Electricity 0 % 0 % 0 % 1 % 0 % 0 % 0 % 0 % 0 % 0 % 0 % 0 % 0 % 1 % 0 % 4 %
Transport & Machinery 1 % 6 % 6 % 5 % 0 % 2 % 1 % 0 % 0 % 0 % 0 % 0 % 0 % 4 % 0 % 0 %
Other 0 % 0 % 0 % 0 % -0 % 0 % 0 % 0 % 0 % -0 % 0 % 0 % 0 % 0 % 0 % -0 %
Post harvest processing 44 % 11 % 19 % 56 % 37 % 35 % 20 % 9 % 3 % 8 % 8 % 0 % 9 % 22 % 1 % 16 %
Post harvest processing - direct emissions 37 % 0 % 0 % 7 % 3 % 0 % 0 % 5 % 2 % 6 % 5 % 0 % 0 % 0 % 0 % 0 %
Energy - coal & wood biomass 5 % 8 % 17 % 44 % 33 % 19 % 19 % 3 % 0 % 1 % 2 % 0 % 9 % 15 % 0 % 1 %
Transport 1 % 4 % 4 % 4 % 0 % 2 % 1 % 0 % 0 % 0 % 0 % 0 % 0 % 3 % 0 % 0 %
Electricity 0 % 0 % 0 % 1 % 0 % 0 % 0 % 0 % 0 % 0 % 0 % 0 % 0 % 1 % 0 % 4 %
Other 0 % -2 % -2 % -0 % 0 % 14 % 0 % 0 % -0 % 0 % -0 % -0 % -0 % 2 % -0 % 11 %
Coffee cultivation 55 % 83 % 74 % 38 % 62 % 61 % 61 % 90 % 97 % 92 % 92 % 99 % 91 % 71 % 99 % 53 %
Coffee cultivation - direct emissions 40 % 0 % 0 % 0 % 53 % 5 % 0 % 82 % 97 % 90 % 87 % 98 % 91 % 0 % 0 % 0 %
Fertilizer production 12 % 53 % 60 % 22 % 9 % 12 % 59 % 6 % 0 % 1 % 3 % 1 % 0 % 61 % 42 % 51 %
Persticide production 0 % 19 % 4 % 1 % 0 % 1 % 1 % 0 % 0 % 0 % 0 % 0 % 0 % 3 % 58 % 1 %
Transport & Machinery 1 % 5 % 5 % 5 % 0 % 2 % 1 % 0 % 0 % 0 % 0 % 0 % 0 % 3 % 0 % 0 %
Other 1 % 6 % 5 % 10 % 0 % 42 % 0 % 1 % 0 % 0 % 1 % 0 % 0 % 4 % 0 % 0 %
Table 27: Most relevant process to the life cycle of green coffee (yellow indicates a contribution of 5-20%; red indicates a contribution of >20%). Direct emissions refer to the environmental footprint caused by direct elementary flows (typically emissions to the environment). Please note that the for some impact categories the sum might not add to exactly 100% due to rounding issues.
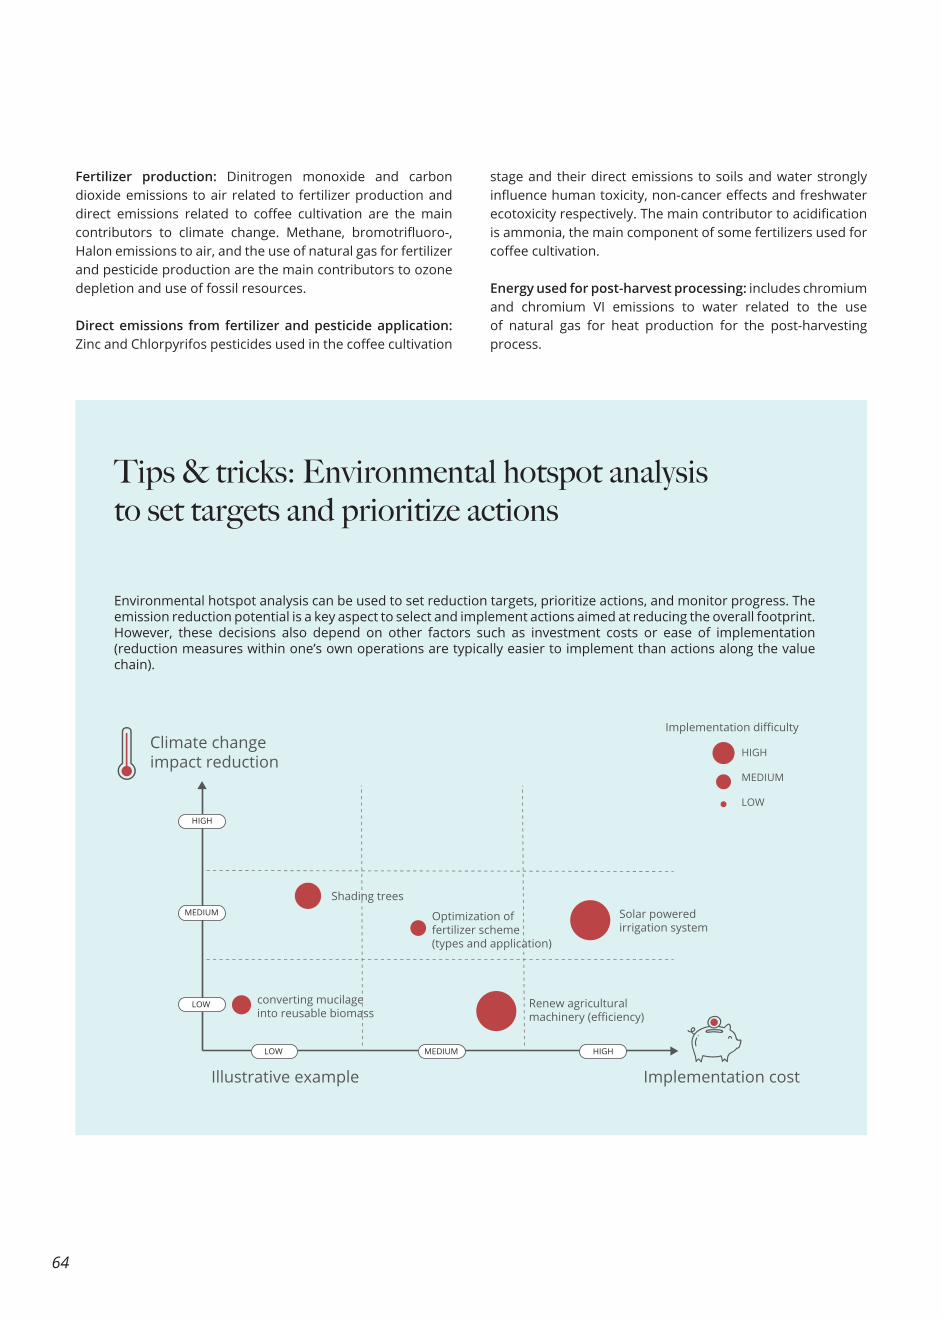
64
Fertilizer production: Dinitrogen monoxide and carbon dioxide emissions to air related to fertilizer production and direct emissions related to coffee cultivation are the main contributors to climate change. Methane, bromotrifluoro-, Halon emissions to air, and the use of natural gas for fertilizer and pesticide production are the main contributors to ozone depletion and use of fossil resources.
Direct emissions from fertilizer and pesticide application: Zinc and Chlorpyrifos pesticides used in the coffee cultivation
stage and their direct emissions to soils and water strongly influence human toxicity, non-cancer effects and freshwater ecotoxicity respectively. The main contributor to acidification is ammonia, the main component of some fertilizers used for coffee cultivation.
Energy used for post-harvest processing: includes chromium and chromium VI emissions to water related to the use of natural gas for heat production for the post-harvesting process.
Environmental hotspot analysis can be used to set reduction targets, prioritize actions, and monitor progress. The emission reduction potential is a key aspect to select and implement actions aimed at reducing the overall footprint. However, these decisions also depend on other factors such as investment costs or ease of implementation (reduction measures within one’s own operations are typically easier to implement than actions along the value chain).
Tips & tricks: Environmental hotspot analysis to set targets and prioritize actions
Climate changeimpact reduction
Implementation costIllustrative example
HIGH
HIGH
LOW
LOW
MEDIUM
MEDIUM
HIGH
MEDIUM
LOW
Solar poweredirrigation system
Optimization offertilizer scheme(types and application)
Renew agriculturalmachinery (efficiency)
converting mucilageinto reusable biomass
Shading trees
Implementation difficulty
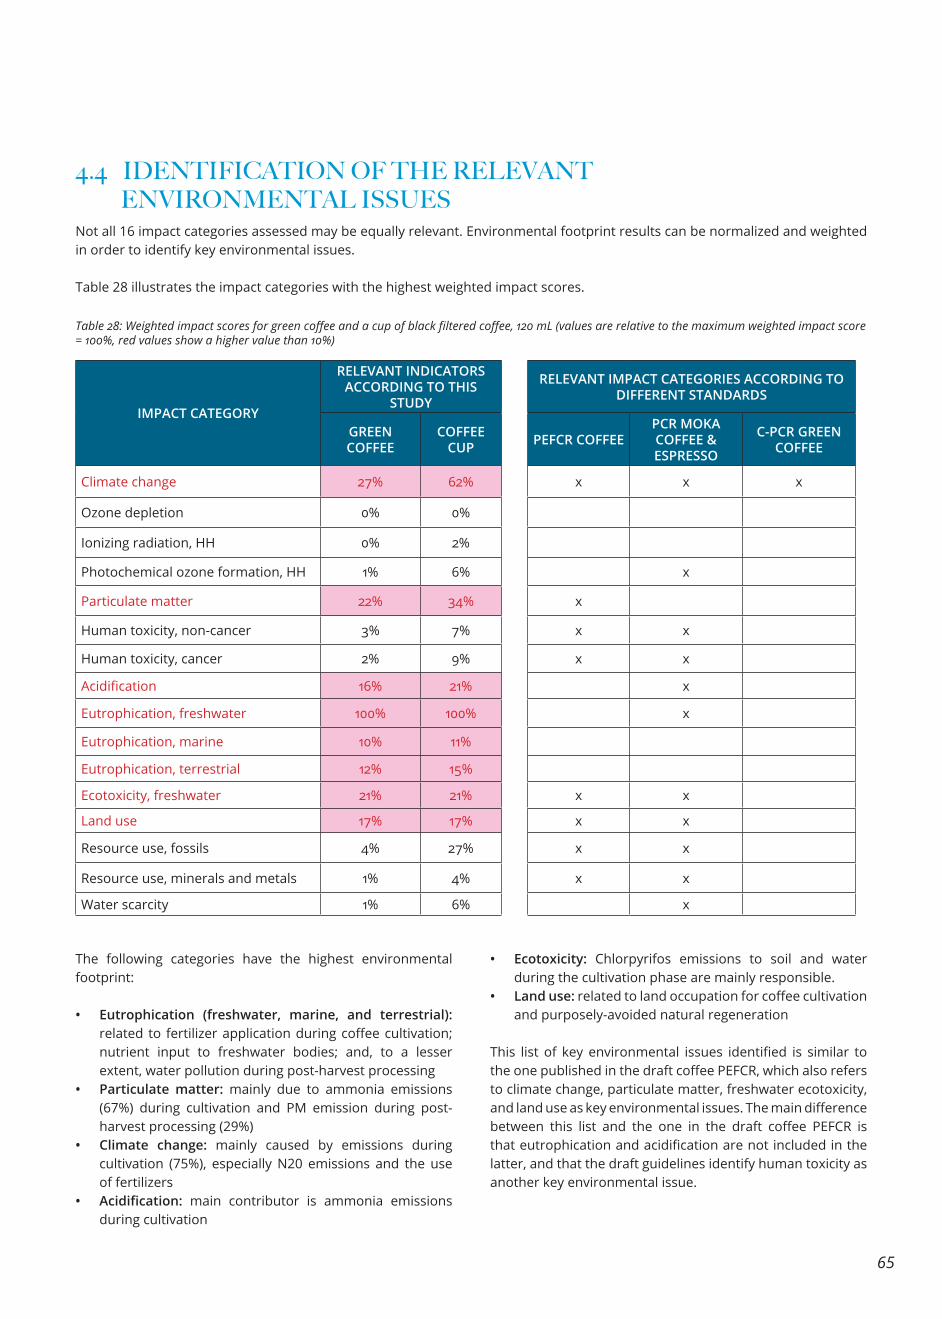
65
The following categories have the highest environmental footprint:
• Eutrophication (freshwater, marine, and terrestrial): related to fertilizer application during coffee cultivation; nutrient input to freshwater bodies; and, to a lesser extent, water pollution during post-harvest processing
• Particulate matter: mainly due to ammonia emissions (67%) during cultivation and PM emission during post-harvest processing (29%)
• Climate change: mainly caused by emissions during cultivation (75%), especially N20 emissions and the use of fertilizers
• Acidification: main contributor is ammonia emissions during cultivation
• Ecotoxicity: Chlorpyrifos emissions to soil and water during the cultivation phase are mainly responsible.
• Land use: related to land occupation for coffee cultivation and purposely-avoided natural regeneration
This list of key environmental issues identified is similar to the one published in the draft coffee PEFCR, which also refers to climate change, particulate matter, freshwater ecotoxicity, and land use as key environmental issues. The main difference between this list and the one in the draft coffee PEFCR is that eutrophication and acidification are not included in the latter, and that the draft guidelines identify human toxicity as another key environmental issue.
4.4 IDENTIFICATION OF THE RELEVANT ENVIRONMENTAL ISSUESNot all 16 impact categories assessed may be equally relevant. Environmental footprint results can be normalized and weighted in order to identify key environmental issues.
Table 28 illustrates the impact categories with the highest weighted impact scores.
IMPACT CATEGORY
RELEVANT INDICATORS ACCORDING TO THIS
STUDY
RELEVANT IMPACT CATEGORIES ACCORDING TO DIFFERENT STANDARDS
GREEN COFFEE
COFFEE CUP PEFCR COFFEE
PCR MOKA COFFEE & ESPRESSO
C-PCR GREEN COFFEE
Climate change 27% 62% x x x
Ozone depletion 0% 0%
Ionizing radiation, HH 0% 2%
Photochemical ozone formation, HH 1% 6% x
Particulate matter 22% 34% x
Human toxicity, non-cancer 3% 7% x x
Human toxicity, cancer 2% 9% x x
Acidification 16% 21% x
Eutrophication, freshwater 100% 100% x
Eutrophication, marine 10% 11%
Eutrophication, terrestrial 12% 15%
Ecotoxicity, freshwater 21% 21% x x
Land use 17% 17% x x
Resource use, fossils 4% 27% x x
Resource use, minerals and metals 1% 4% x x
Water scarcity 1% 6% x
Table 28: Weighted impact scores for green coffee and a cup of black filtered coffee, 120 mL (values are relative to the maximum weighted impact score = 100%, red values show a higher value than 10%)
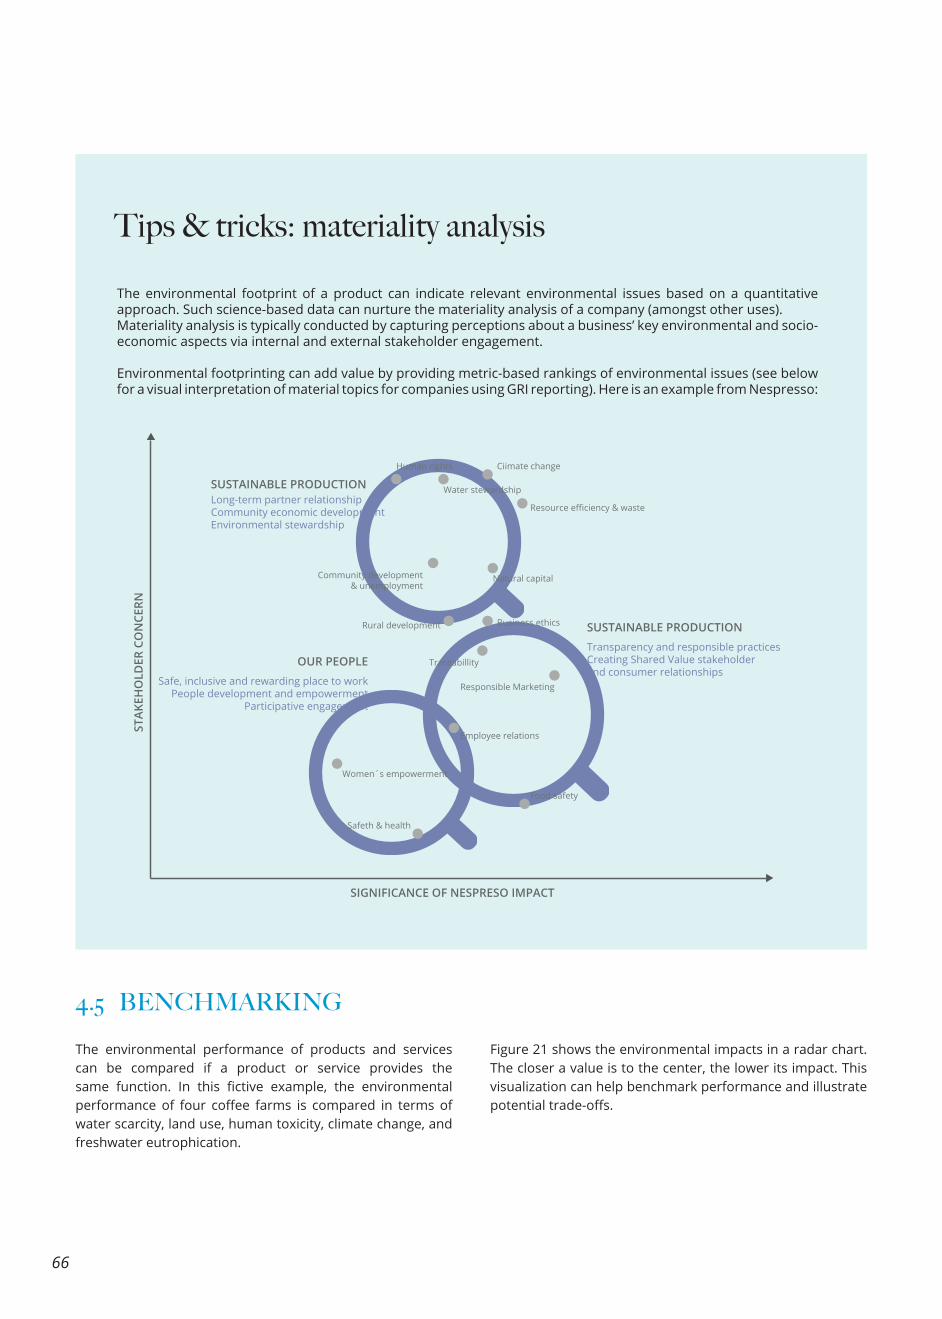
66
SUSTAINABLE PRODUCTION
SUSTAINABLE PRODUCTION
Long-term partner relationshipCommunity economic developmentEnvironmental stewardship
Human rights
Water stewardship
Business ethicsRural development
Employee relations
Responsible Marketing
Food safety
Traceabillity
Community development& unemployment
Natural capital
Resource efficiency & waste
Ciimate change
Transparency and responsible practicesCreating Shared Value stakeholderand consumer relationships
OUR PEOPLE
SIGNIFICANCE OF NESPRESO IMPACT
STAK
EHO
LDER
CO
NCE
RN
Safe, inclusive and rewarding place to workPeople development and empowerment
Participative engagement
Women´s empowerment
Safeth & health
The environmental footprint of a product can indicate relevant environmental issues based on a quantitative approach. Such science-based data can nurture the materiality analysis of a company (amongst other uses). Materiality analysis is typically conducted by capturing perceptions about a business’ key environmental and socio-economic aspects via internal and external stakeholder engagement.
Environmental footprinting can add value by providing metric-based rankings of environmental issues (see below for a visual interpretation of material topics for companies using GRI reporting). Here is an example from Nespresso:
Tips & tricks: materiality analysis
4.5 BENCHMARKING
The environmental performance of products and services can be compared if a product or service provides the same function. In this fictive example, the environmental performance of four coffee farms is compared in terms of water scarcity, land use, human toxicity, climate change, and freshwater eutrophication.
Figure 21 shows the environmental impacts in a radar chart. The closer a value is to the center, the lower its impact. This visualization can help benchmark performance and illustrate potential trade-offs.
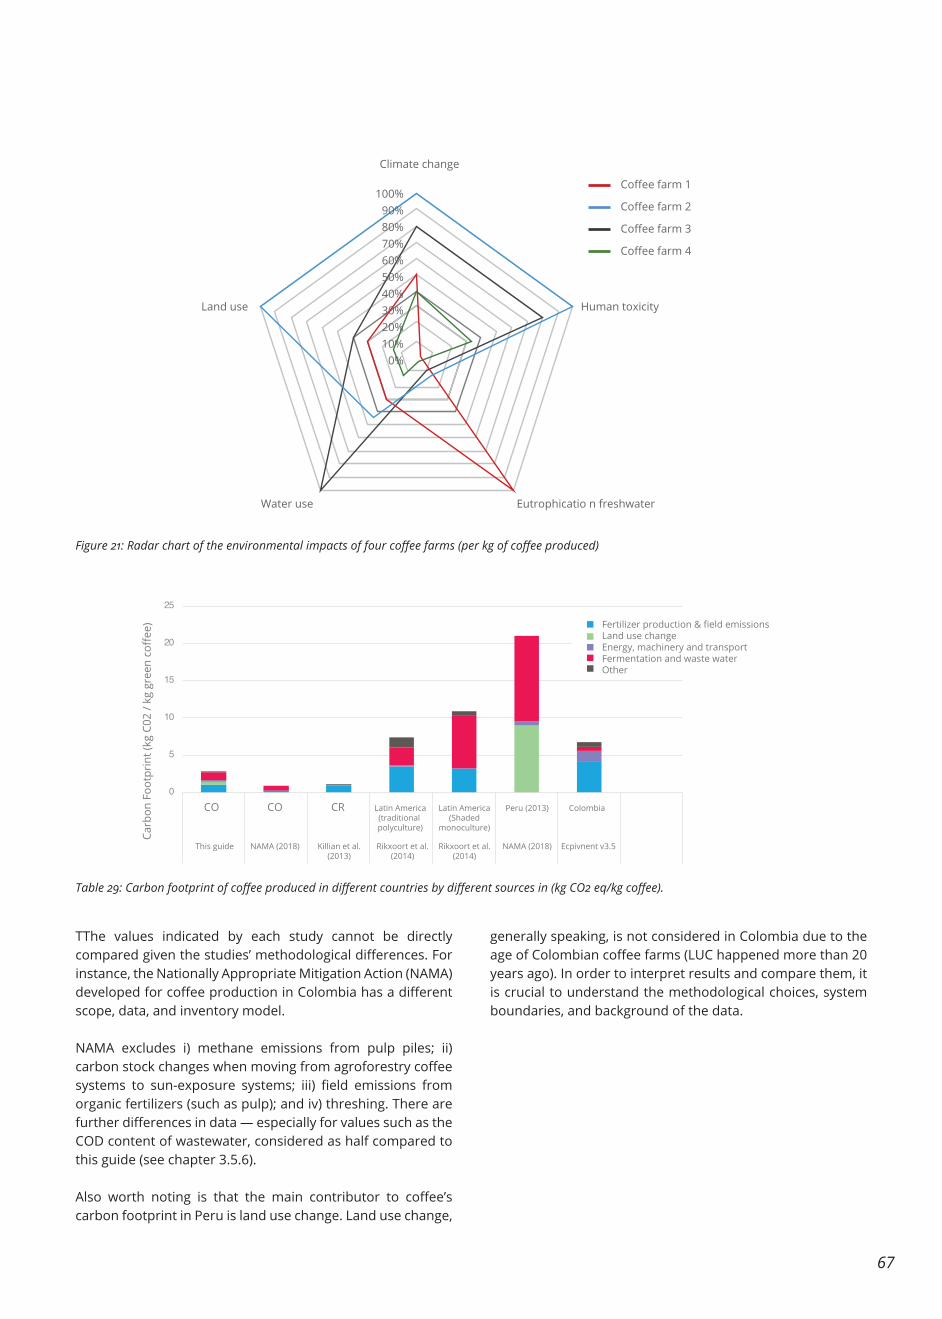
67
TThe values indicated by each study cannot be directly compared given the studies’ methodological differences. For instance, the Nationally Appropriate Mitigation Action (NAMA) developed for coffee production in Colombia has a different scope, data, and inventory model.
NAMA excludes i) methane emissions from pulp piles; ii) carbon stock changes when moving from agroforestry coffee systems to sun-exposure systems; iii) field emissions from organic fertilizers (such as pulp); and iv) threshing. There are further differences in data — especially for values such as the COD content of wastewater, considered as half compared to this guide (see chapter 3.5.6).
Also worth noting is that the main contributor to coffee’s carbon footprint in Peru is land use change. Land use change,
generally speaking, is not considered in Colombia due to the age of Colombian coffee farms (LUC happened more than 20 years ago). In order to interpret results and compare them, it is crucial to understand the methodological choices, system boundaries, and background of the data.
100%90%80%70%60%50%40%30%20%10%
0%
Climate change
Land use
Water use
Human toxicity
Coffee farm 1
Eutrophicatio n freshwater
Coffee farm 2
Coffee farm 3
Coffee farm 4
Figure 21: Radar chart of the environmental impacts of four coffee farms (per kg of coffee produced)
Table 29: Carbon footprint of coffee produced in different countries by different sources in (kg CO2 eq/kg coffee).
0
5
10
15
20
25
Carb
on F
ootp
rint
(kg
C02
/ kg
gree
n co
ffee
)
CO CO CR Latin America(traditional polyculture)
Latin America(Shaded
monoculture)
Peru (2013) Colombia
This guide NAMA (2018) Killian et al.(2013)
Rikxoort et al.(2014)
Rikxoort et al.(2014)
NAMA (2018) Ecpivnent v3.5
Fertilizer production & field emissionsLand use changeEnergy, machinery and transportFermentation and waste waterOther
68
4.6. DATA QUALITY AND UNCERTAINTY
4.7 LIMITATIONS OF AN ENVIRONMENTAL FOOTPRINT STUDY
Low-quality data causes high uncertainty in terms of results. In PEFCR, a semi-quantitative approach is used to evaluate the quality of company-specific data and secondary datasets, using a “materiality”-based approach to focus on data quality where it really matters.
First, the most relevant impact categories, life cycle stages, processes, and elementary flows are identified (see sections 4.3 and 4.4). In accordance with PEFCR v6.3, the most relevant processes and direct elementary flows that account for at least 80% of the total environmental impact are selected.
As the most relevant processes drive the environmental profile of a product, these should be assessed using higher quality data compared to less relevant processes, independent of where processes happen in the life cycle of a product.
• Typically, a data quality assessment relies on five formal criteria:
• Reliability (R) — how well a value is measured versus estimated/guessed
• Completeness (C) — how completely all parameters/factors are taken into account
• Temporal representativeness (TiR) —accuracy of timing
• Geographical representativeness (GR) — accuracy of localization
• Technological representativeness (TeR) — accuracy of techno
Data quality principles are further described in PEFCR.
When interpreting results, the following common limitations should be considered:
Scope: Conclusions should be considered applicable only within the scope of a study — meaning a study’s temporal and geographic scope, as well as its system boundaries and modeling principles, must be kept in mind.
Inventory data: Assessment of environmental footprint results in the life cycle usually requires a large set of data and model assumptions. These assumptions must be considered when interpreting results. Uncertainties related to inventory data can be assessed based on the materiality analysis described in chapter 4.6, via assessment of the uncertainty of the results (e.g. through a Monte-Carlo simulation), and by interpreting different scenario calculations or through sensitivity analysis.
Environmental footprint results: Note that, rather than direct measurements of real impacts, LCA estimates relative, potential impacts. Environmental footprint results are relative expressions and do not predict impacts on category endpoints, the exceeding of thresholds, safety margins, or risks. This disclaimer must be put in any PEF assessment report. Further it must be considered that not all environmental aspects are currently considered in LCA studies (e.g., marine plastic pollution, salination impacts) and new metrics, methods, and data are emerging to cover these limitations.
Overall sustainability: Although the environmental footprinting methodology is adequate to assess a key aspect of environmental sustainability, the method does not evaluate any socio-economic impacts generated. In order to obtain a complete view of sustainability, results should be interpreted together with other assessments.
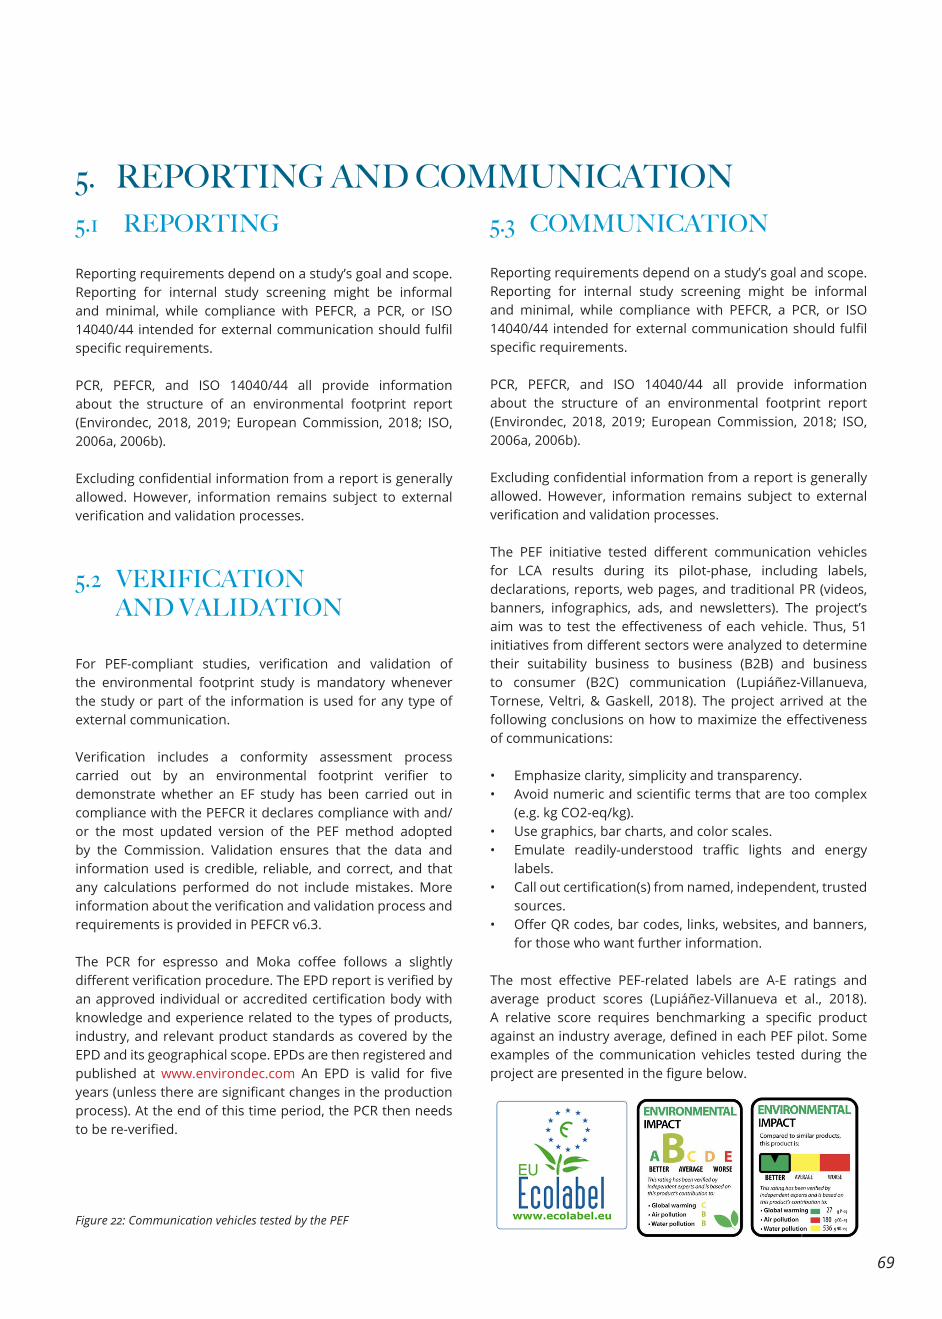
69
5. REPORTING AND COMMUNICATION5.1 REPORTING 5.3 COMMUNICATION
5.2 VERIFICATION AND VALIDATION
Reporting requirements depend on a study’s goal and scope. Reporting for internal study screening might be informal and minimal, while compliance with PEFCR, a PCR, or ISO 14040/44 intended for external communication should fulfil specific requirements.
PCR, PEFCR, and ISO 14040/44 all provide information about the structure of an environmental footprint report (Environdec, 2018, 2019; European Commission, 2018; ISO, 2006a, 2006b).
Excluding confidential information from a report is generally allowed. However, information remains subject to external verification and validation processes.
The PEF initiative tested different communication vehicles for LCA results during its pilot-phase, including labels, declarations, reports, web pages, and traditional PR (videos, banners, infographics, ads, and newsletters). The project’s aim was to test the effectiveness of each vehicle. Thus, 51 initiatives from different sectors were analyzed to determine their suitability business to business (B2B) and business to consumer (B2C) communication (Lupiáñez-Villanueva, Tornese, Veltri, & Gaskell, 2018). The project arrived at the following conclusions on how to maximize the effectiveness of communications:
• Emphasize clarity, simplicity and transparency. • Avoid numeric and scientific terms that are too complex
(e.g. kg CO2-eq/kg). • Use graphics, bar charts, and color scales. • Emulate readily-understood traffic lights and energy
labels. • Call out certification(s) from named, independent, trusted
sources. • Offer QR codes, bar codes, links, websites, and banners,
for those who want further information.
The most effective PEF-related labels are A-E ratings and average product scores (Lupiáñez-Villanueva et al., 2018). A relative score requires benchmarking a specific product against an industry average, defined in each PEF pilot. Some examples of the communication vehicles tested during the project are presented in the figure below.
For PEF-compliant studies, verification and validation of the environmental footprint study is mandatory whenever the study or part of the information is used for any type of external communication.
Verification includes a conformity assessment process carried out by an environmental footprint verifier to demonstrate whether an EF study has been carried out in compliance with the PEFCR it declares compliance with and/or the most updated version of the PEF method adopted by the Commission. Validation ensures that the data and information used is credible, reliable, and correct, and that any calculations performed do not include mistakes. More information about the verification and validation process and requirements is provided in PEFCR v6.3.
The PCR for espresso and Moka coffee follows a slightly different verification procedure. The EPD report is verified by an approved individual or accredited certification body with knowledge and experience related to the types of products, industry, and relevant product standards as covered by the EPD and its geographical scope. EPDs are then registered and published at www.environdec.com An EPD is valid for five years (unless there are significant changes in the production process). At the end of this time period, the PCR then needs to be re-verified.
Figure 22: Communication vehicles tested by the PEF
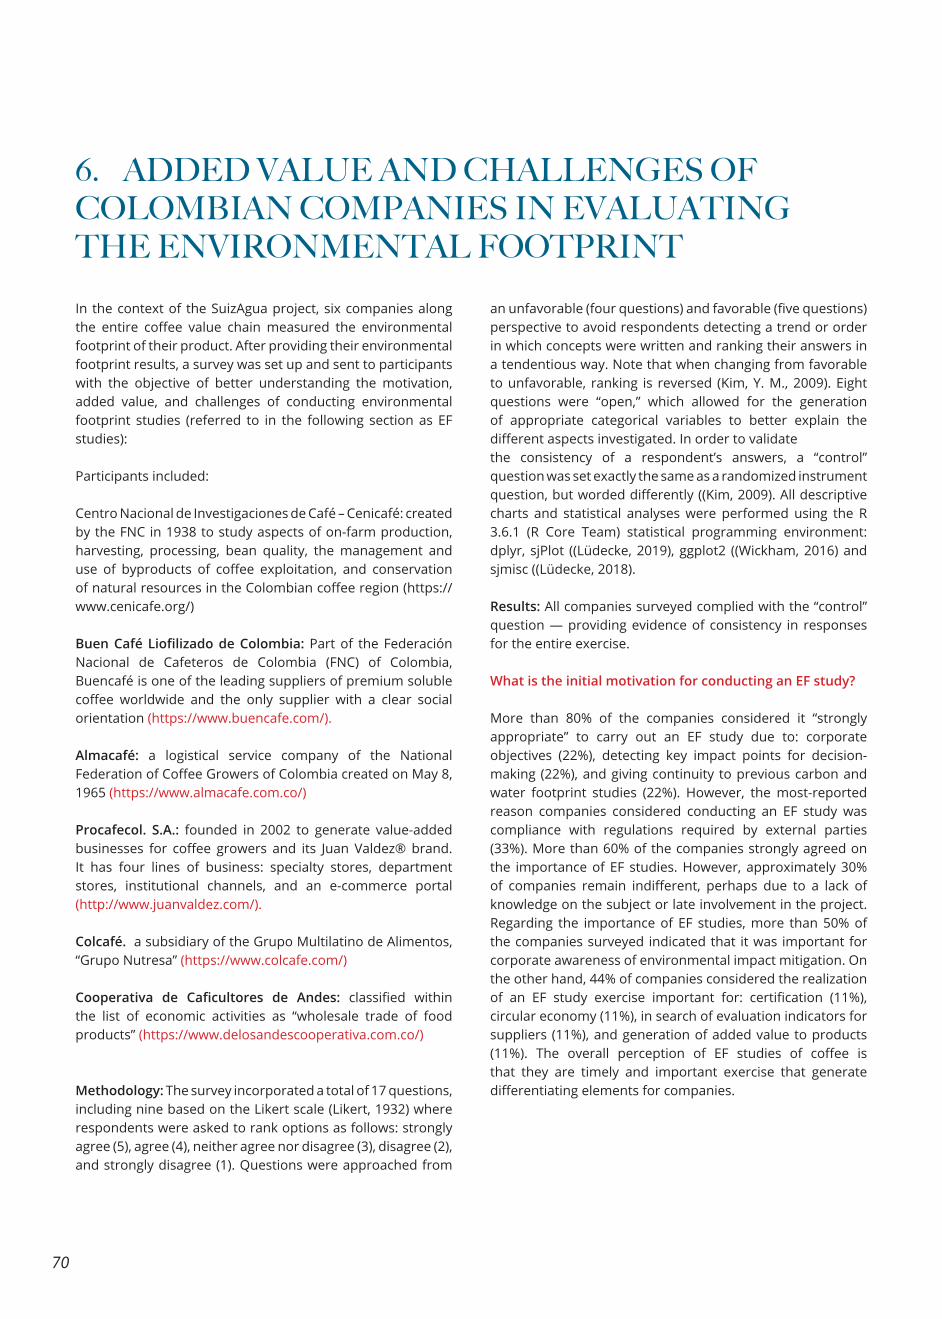
70
6. ADDED VALUE AND CHALLENGES OF COLOMBIAN COMPANIES IN EVALUATING THE ENVIRONMENTAL FOOTPRINTIn the context of the SuizAgua project, six companies along the entire coffee value chain measured the environmental footprint of their product. After providing their environmental footprint results, a survey was set up and sent to participants with the objective of better understanding the motivation, added value, and challenges of conducting environmental footprint studies (referred to in the following section as EF studies):
Participants included:
Centro Nacional de Investigaciones de Café – Cenicafé: created by the FNC in 1938 to study aspects of on-farm production, harvesting, processing, bean quality, the management and use of byproducts of coffee exploitation, and conservation of natural resources in the Colombian coffee region (https://www.cenicafe.org/)
Buen Café Liofilizado de Colombia: Part of the Federación Nacional de Cafeteros de Colombia (FNC) of Colombia, Buencafé is one of the leading suppliers of premium soluble coffee worldwide and the only supplier with a clear social orientation (https://www.buencafe.com/).
Almacafé: a logistical service company of the National Federation of Coffee Growers of Colombia created on May 8, 1965 (https://www.almacafe.com.co/)
Procafecol. S.A.: founded in 2002 to generate value-added businesses for coffee growers and its Juan Valdez® brand. It has four lines of business: specialty stores, department stores, institutional channels, and an e-commerce portal (http://www.juanvaldez.com/).
Colcafé. a subsidiary of the Grupo Multilatino de Alimentos, “Grupo Nutresa” (https://www.colcafe.com/)
Cooperativa de Caficultores de Andes: classified within the list of economic activities as “wholesale trade of food products” (https://www.delosandescooperativa.com.co/)
Methodology: The survey incorporated a total of 17 questions, including nine based on the Likert scale (Likert, 1932) where respondents were asked to rank options as follows: strongly agree (5), agree (4), neither agree nor disagree (3), disagree (2), and strongly disagree (1). Questions were approached from
an unfavorable (four questions) and favorable (five questions) perspective to avoid respondents detecting a trend or order in which concepts were written and ranking their answers in a tendentious way. Note that when changing from favorable to unfavorable, ranking is reversed (Kim, Y. M., 2009). Eight questions were “open,” which allowed for the generation of appropriate categorical variables to better explain the different aspects investigated. In order to validatethe consistency of a respondent’s answers, a “control” question was set exactly the same as a randomized instrument question, but worded differently ((Kim, 2009). All descriptive charts and statistical analyses were performed using the R 3.6.1 (R Core Team) statistical programming environment: dplyr, sjPlot ((Lüdecke, 2019), ggplot2 ((Wickham, 2016) and sjmisc ((Lüdecke, 2018).
Results: All companies surveyed complied with the “control” question — providing evidence of consistency in responses for the entire exercise.
What is the initial motivation for conducting an EF study? More than 80% of the companies considered it “strongly appropriate” to carry out an EF study due to: corporate objectives (22%), detecting key impact points for decision-making (22%), and giving continuity to previous carbon and water footprint studies (22%). However, the most-reported reason companies considered conducting an EF study was compliance with regulations required by external parties (33%). More than 60% of the companies strongly agreed on the importance of EF studies. However, approximately 30% of companies remain indifferent, perhaps due to a lack of knowledge on the subject or late involvement in the project. Regarding the importance of EF studies, more than 50% of the companies surveyed indicated that it was important for corporate awareness of environmental impact mitigation. On the other hand, 44% of companies considered the realization of an EF study exercise important for: certification (11%), circular economy (11%), in search of evaluation indicators for suppliers (11%), and generation of added value to products (11%). The overall perception of EF studies of coffee is that they are timely and important exercise that generate differentiating elements for companies.
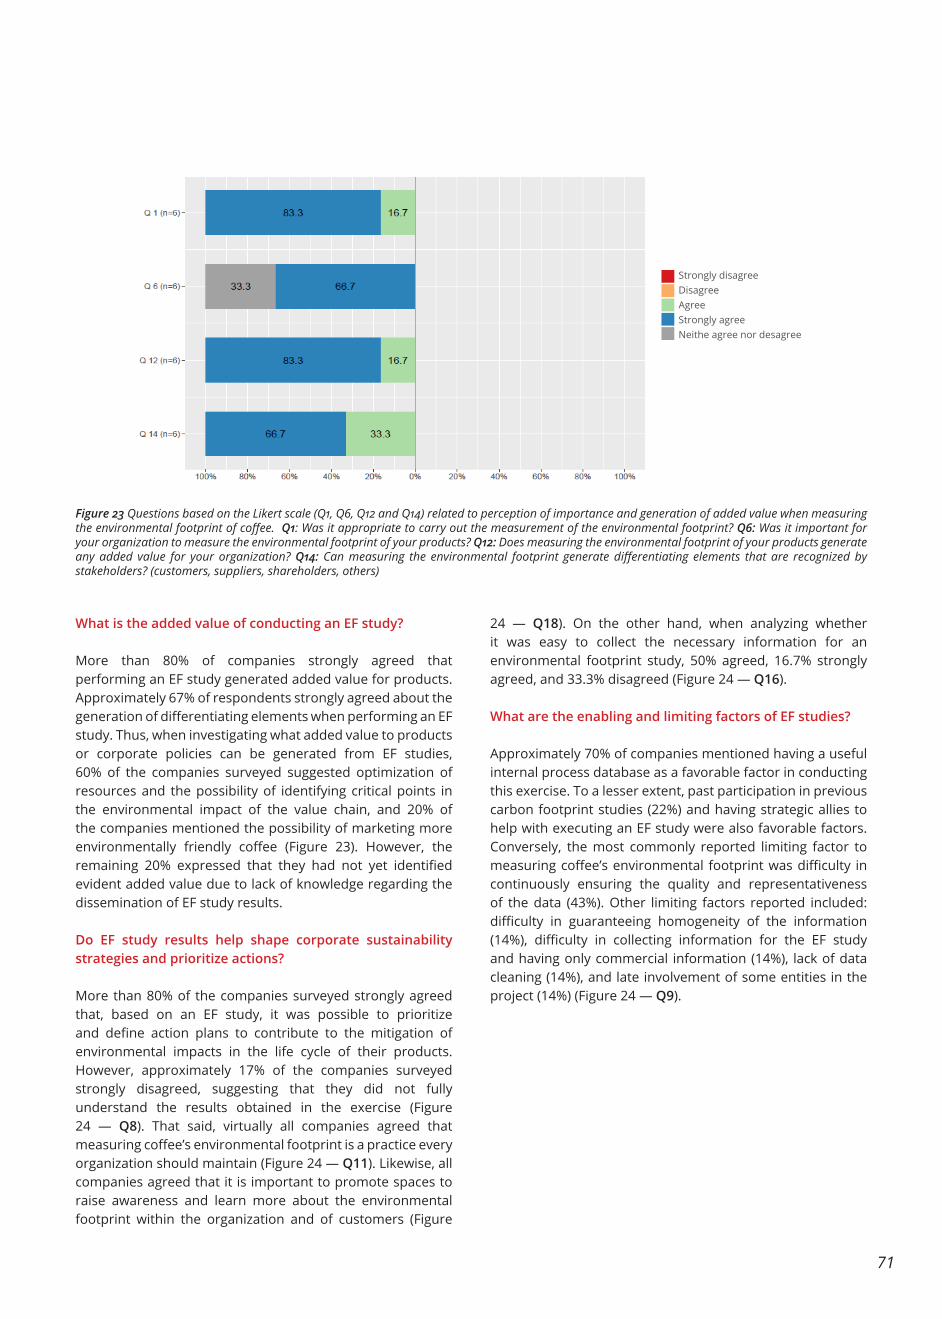
71
Figure 23 Questions based on the Likert scale (Q1, Q6, Q12 and Q14) related to perception of importance and generation of added value when measuring the environmental footprint of coffee. Q1: Was it appropriate to carry out the measurement of the environmental footprint? Q6: Was it important for your organization to measure the environmental footprint of your products? Q12: Does measuring the environmental footprint of your products generate any added value for your organization? Q14: Can measuring the environmental footprint generate differentiating elements that are recognized by stakeholders? (customers, suppliers, shareholders, others)
What is the added value of conducting an EF study?
More than 80% of companies strongly agreed that performing an EF study generated added value for products. Approximately 67% of respondents strongly agreed about the generation of differentiating elements when performing an EF study. Thus, when investigating what added value to products or corporate policies can be generated from EF studies, 60% of the companies surveyed suggested optimization of resources and the possibility of identifying critical points in the environmental impact of the value chain, and 20% of the companies mentioned the possibility of marketing more environmentally friendly coffee (Figure 23). However, the remaining 20% expressed that they had not yet identified evident added value due to lack of knowledge regarding the dissemination of EF study results.
Do EF study results help shape corporate sustainability strategies and prioritize actions?
More than 80% of the companies surveyed strongly agreed that, based on an EF study, it was possible to prioritize and define action plans to contribute to the mitigation of environmental impacts in the life cycle of their products. However, approximately 17% of the companies surveyed strongly disagreed, suggesting that they did not fully understand the results obtained in the exercise (Figure 24 — Q8). That said, virtually all companies agreed that measuring coffee’s environmental footprint is a practice every organization should maintain (Figure 24 — Q11). Likewise, all companies agreed that it is important to promote spaces to raise awareness and learn more about the environmental footprint within the organization and of customers (Figure
24 — Q18). On the other hand, when analyzing whether it was easy to collect the necessary information for an environmental footprint study, 50% agreed, 16.7% strongly agreed, and 33.3% disagreed (Figure 24 — Q16).
What are the enabling and limiting factors of EF studies?
Approximately 70% of companies mentioned having a useful internal process database as a favorable factor in conducting this exercise. To a lesser extent, past participation in previous carbon footprint studies (22%) and having strategic allies to help with executing an EF study were also favorable factors. Conversely, the most commonly reported limiting factor to measuring coffee’s environmental footprint was difficulty in continuously ensuring the quality and representativeness of the data (43%). Other limiting factors reported included: difficulty in guaranteeing homogeneity of the information (14%), difficulty in collecting information for the EF study and having only commercial information (14%), lack of data cleaning (14%), and late involvement of some entities in the project (14%) (Figure 24 — Q9).
Strongly disagreeDisagreeAgreeStrongly agreeNeithe agree nor desagree
72
Figure 24 Questions based on the Likert scale (Q8, Q11, Q16 and Q18) related to the perception of the measurement of the environmental footprint of coffee in corporate decision making and strategic direction Q8: Is it possible, based on the results of the environmental footprint measurement, to prioritize and define action plans to contribute to the mitigation of environmental impacts in the life cycle of your products? Q11: Do you consider that measuring the environmental footprint should be a practice that your organization should maintain? Q16: Was it easy to collect the information needed for measuring the environmental footprint? Q18: Do you consider it important to promote spaces to raise awareness and learn more about the environmental footprint within the organization and to customers?
What is the way forward?
The companies that participated in the EF studies were asked what next steps would be in the short-term for their organizations. More than 60% mentioned continuing to feed databases, and 38% considered it a priority to detect impact indicators. Likewise, more than 40% of companies surveyed said that, in the medium term, they would consider taking first steps toward corrective management of processes associated with production systems. Other proposed medium-term strategies included: consolidating environmental programs for efficient water and energy use (14%), detecting impact indicators (14%), and identifying linkages for projects associated with the value chain (14%). Finally, 14% stated that they could not think of any medium-term action steps due to the lack of dissemination of the results.
Strongly disagreeDisagreeAgreeStrongly agreeNeithe agree nor desagree
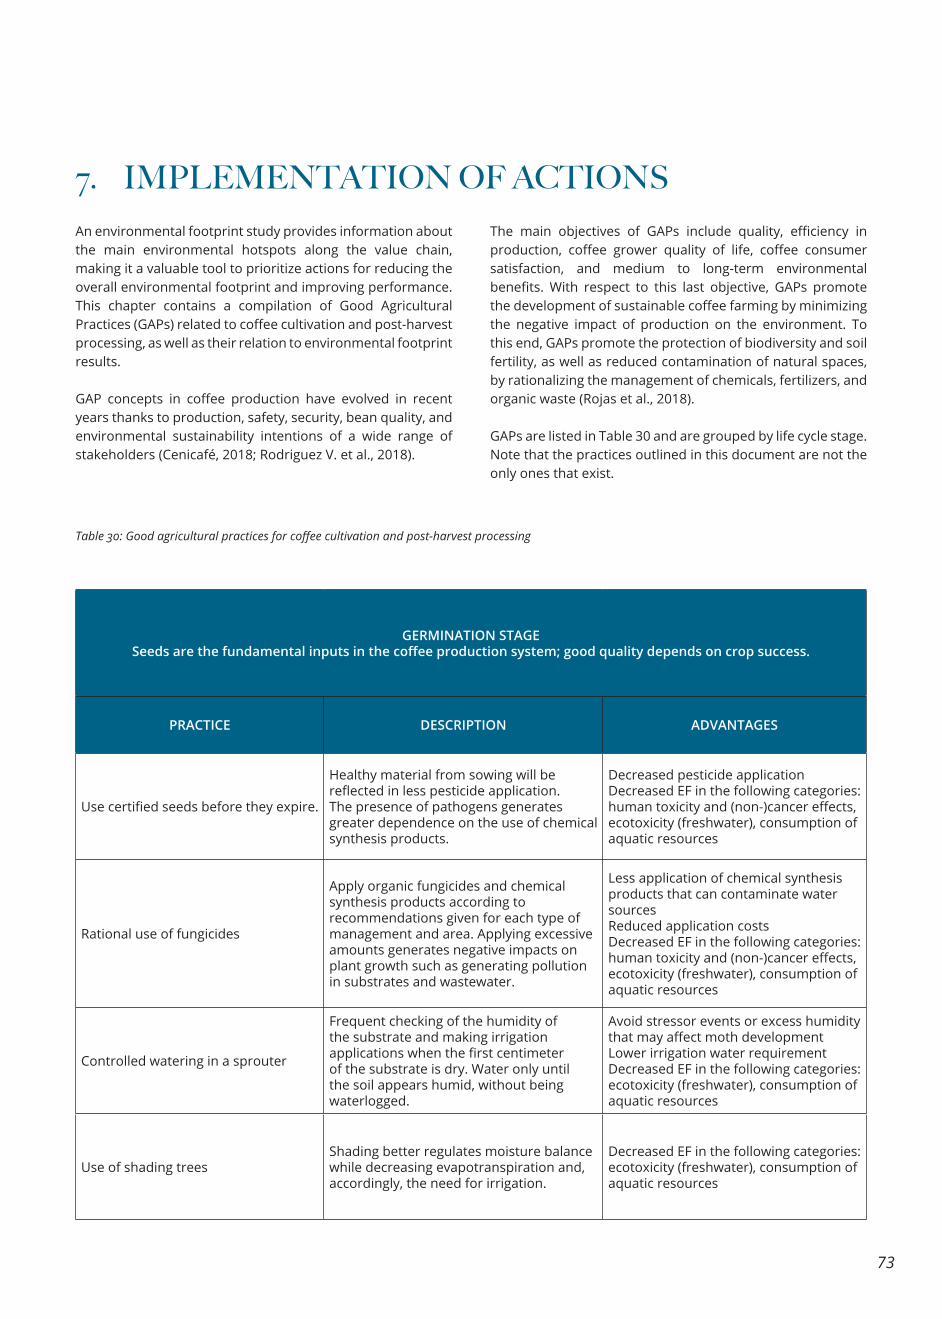
73
An environmental footprint study provides information about the main environmental hotspots along the value chain, making it a valuable tool to prioritize actions for reducing the overall environmental footprint and improving performance. This chapter contains a compilation of Good Agricultural Practices (GAPs) related to coffee cultivation and post-harvest processing, as well as their relation to environmental footprint results.
GAP concepts in coffee production have evolved in recent years thanks to production, safety, security, bean quality, and environmental sustainability intentions of a wide range of stakeholders (Cenicafé, 2018; Rodriguez V. et al., 2018).
The main objectives of GAPs include quality, efficiency in production, coffee grower quality of life, coffee consumer satisfaction, and medium to long-term environmental benefits. With respect to this last objective, GAPs promote the development of sustainable coffee farming by minimizing the negative impact of production on the environment. To this end, GAPs promote the protection of biodiversity and soil fertility, as well as reduced contamination of natural spaces, by rationalizing the management of chemicals, fertilizers, and organic waste (Rojas et al., 2018).
GAPs are listed in Table 30 and are grouped by life cycle stage. Note that the practices outlined in this document are not the only ones that exist.
7. IMPLEMENTATION OF ACTIONS
Table 30: Good agricultural practices for coffee cultivation and post-harvest processing
GERMINATION STAGESeeds are the fundamental inputs in the coffee production system; good quality depends on crop success.
PRACTICE DESCRIPTION ADVANTAGES
Use certified seeds before they expire.
Healthy material from sowing will be reflected in less pesticide application.The presence of pathogens generates greater dependence on the use of chemical synthesis products.
Decreased pesticide application Decreased EF in the following categories: human toxicity and (non-)cancer effects, ecotoxicity (freshwater), consumption of aquatic resources
Rational use of fungicides
Apply organic fungicides and chemical synthesis products according to recommendations given for each type of management and area. Applying excessive amounts generates negative impacts on plant growth such as generating pollution in substrates and wastewater.
Less application of chemical synthesis products that can contaminate water sourcesReduced application costsDecreased EF in the following categories: human toxicity and (non-)cancer effects, ecotoxicity (freshwater), consumption of aquatic resources
Controlled watering in a sprouter
Frequent checking of the humidity of the substrate and making irrigation applications when the first centimeter of the substrate is dry. Water only until the soil appears humid, without being waterlogged.
Avoid stressor events or excess humidity that may affect moth developmentLower irrigation water requirementDecreased EF in the following categories: ecotoxicity (freshwater), consumption of aquatic resources
Use of shading treesShading better regulates moisture balance while decreasing evapotranspiration and, accordingly, the need for irrigation.
Decreased EF in the following categories: ecotoxicity (freshwater), consumption of aquatic resources
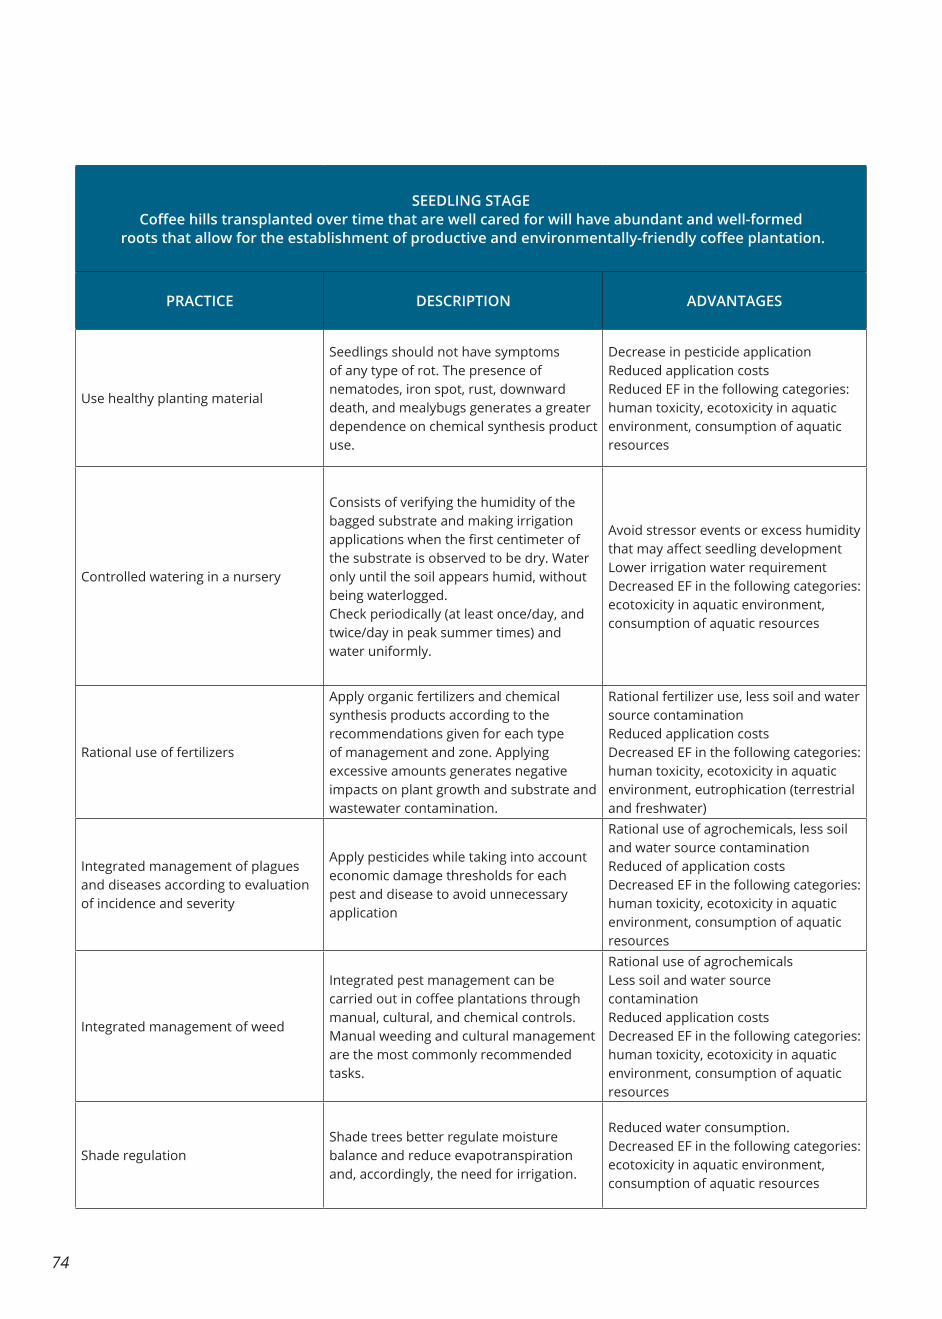
74
SEEDLING STAGECoffee hills transplanted over time that are well cared for will have abundant and well-formed
roots that allow for the establishment of productive and environmentally-friendly coffee plantation.
PRACTICE DESCRIPTION ADVANTAGES
Use healthy planting material
Seedlings should not have symptoms of any type of rot. The presence of nematodes, iron spot, rust, downward death, and mealybugs generates a greater dependence on chemical synthesis product use.
Decrease in pesticide application Reduced application costsReduced EF in the following categories: human toxicity, ecotoxicity in aquatic environment, consumption of aquatic resources
Controlled watering in a nursery
Consists of verifying the humidity of the bagged substrate and making irrigation applications when the first centimeter of the substrate is observed to be dry. Water only until the soil appears humid, without being waterlogged. Check periodically (at least once/day, and twice/day in peak summer times) and water uniformly.
Avoid stressor events or excess humidity that may affect seedling development Lower irrigation water requirement Decreased EF in the following categories: ecotoxicity in aquatic environment, consumption of aquatic resources
Rational use of fertilizers
Apply organic fertilizers and chemical synthesis products according to the recommendations given for each type of management and zone. Applying excessive amounts generates negative impacts on plant growth and substrate and wastewater contamination.
Rational fertilizer use, less soil and water source contamination Reduced application costsDecreased EF in the following categories: human toxicity, ecotoxicity in aquatic environment, eutrophication (terrestrial and freshwater)
Integrated management of plagues and diseases according to evaluation of incidence and severity
Apply pesticides while taking into account economic damage thresholds for each pest and disease to avoid unnecessary application
Rational use of agrochemicals, less soil and water source contamination Reduced of application costs Decreased EF in the following categories: human toxicity, ecotoxicity in aquatic environment, consumption of aquatic resources
Integrated management of weed
Integrated pest management can be carried out in coffee plantations through manual, cultural, and chemical controls. Manual weeding and cultural management are the most commonly recommended tasks.
Rational use of agrochemicals Less soil and water source contamination Reduced application costs Decreased EF in the following categories: human toxicity, ecotoxicity in aquatic environment, consumption of aquatic resources
Shade regulationShade trees better regulate moisture balance and reduce evapotranspiration and, accordingly, the need for irrigation.
Reduced water consumption.Decreased EF in the following categories: ecotoxicity in aquatic environment, consumption of aquatic resources
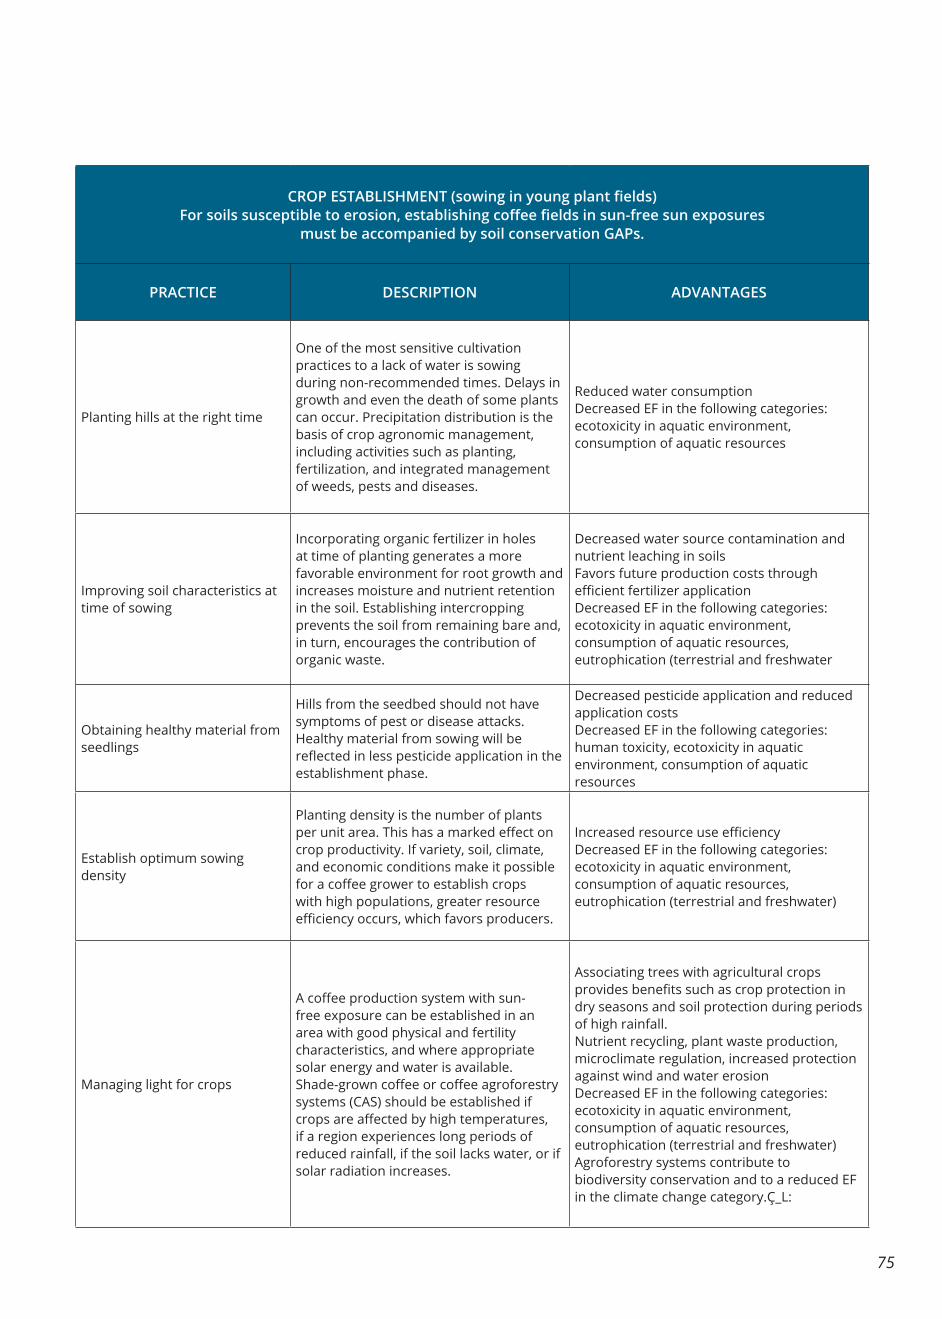
75
CROP ESTABLISHMENT (sowing in young plant fields)For soils susceptible to erosion, establishing coffee fields in sun-free sun exposures
must be accompanied by soil conservation GAPs.
PRACTICE DESCRIPTION ADVANTAGES
Planting hills at the right time
One of the most sensitive cultivation practices to a lack of water is sowing during non-recommended times. Delays in growth and even the death of some plants can occur. Precipitation distribution is the basis of crop agronomic management, including activities such as planting, fertilization, and integrated management of weeds, pests and diseases.
Reduced water consumptionDecreased EF in the following categories: ecotoxicity in aquatic environment, consumption of aquatic resources
Improving soil characteristics at time of sowing
Incorporating organic fertilizer in holes at time of planting generates a more favorable environment for root growth and increases moisture and nutrient retention in the soil. Establishing intercropping prevents the soil from remaining bare and, in turn, encourages the contribution of organic waste.
Decreased water source contamination and nutrient leaching in soilsFavors future production costs through efficient fertilizer application Decreased EF in the following categories: ecotoxicity in aquatic environment, consumption of aquatic resources, eutrophication (terrestrial and freshwater
Obtaining healthy material from seedlings
Hills from the seedbed should not have symptoms of pest or disease attacks. Healthy material from sowing will be reflected in less pesticide application in the establishment phase.
Decreased pesticide application and reduced application costsDecreased EF in the following categories: human toxicity, ecotoxicity in aquatic environment, consumption of aquatic resources
Establish optimum sowing density
Planting density is the number of plants per unit area. This has a marked effect on crop productivity. If variety, soil, climate, and economic conditions make it possible for a coffee grower to establish crops with high populations, greater resource efficiency occurs, which favors producers.
Increased resource use efficiencyDecreased EF in the following categories: ecotoxicity in aquatic environment, consumption of aquatic resources, eutrophication (terrestrial and freshwater)
Managing light for crops
A coffee production system with sun-free exposure can be established in an area with good physical and fertility characteristics, and where appropriate solar energy and water is available. Shade-grown coffee or coffee agroforestry systems (CAS) should be established if crops are affected by high temperatures, if a region experiences long periods of reduced rainfall, if the soil lacks water, or if solar radiation increases.
Associating trees with agricultural crops provides benefits such as crop protection in dry seasons and soil protection during periods of high rainfall. Nutrient recycling, plant waste production, microclimate regulation, increased protection against wind and water erosionDecreased EF in the following categories: ecotoxicity in aquatic environment, consumption of aquatic resources, eutrophication (terrestrial and freshwater)Agroforestry systems contribute to biodiversity conservation and to a reduced EF in the climate change category.Ç_L:
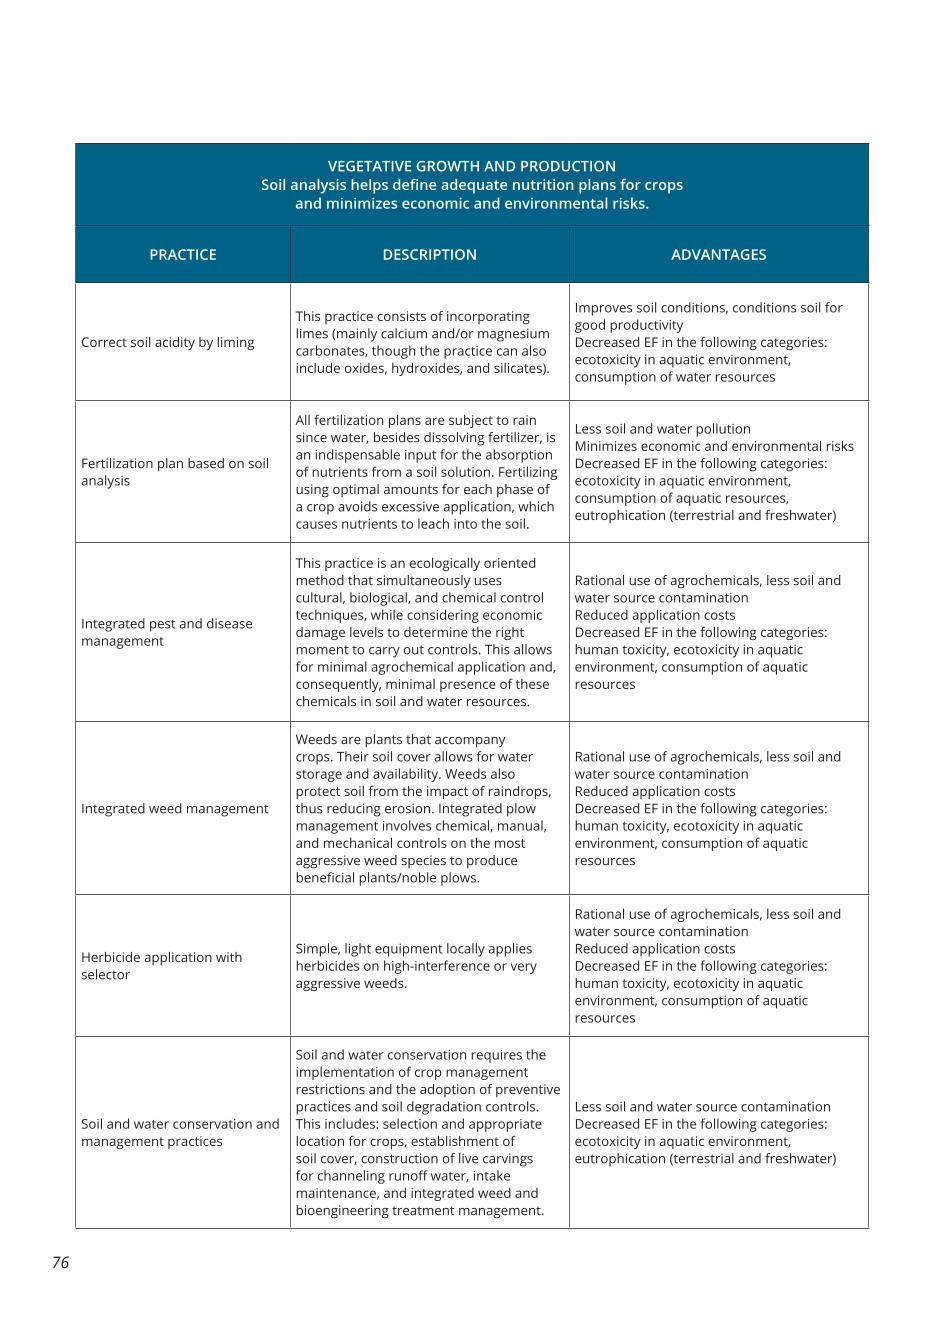
76
VEGETATIVE GROWTH AND PRODUCTIONSoil analysis helps define adequate nutrition plans for crops
and minimizes economic and environmental risks.
PRACTICE DESCRIPTION ADVANTAGES
Correct soil acidity by liming
This practice consists of incorporating limes (mainly calcium and/or magnesium carbonates, though the practice can also include oxides, hydroxides, and silicates).
Improves soil conditions, conditions soil for good productivityDecreased EF in the following categories: ecotoxicity in aquatic environment, consumption of water resources
Fertilization plan based on soil analysis
All fertilization plans are subject to rain since water, besides dissolving fertilizer, is an indispensable input for the absorption of nutrients from a soil solution. Fertilizing using optimal amounts for each phase of a crop avoids excessive application, which causes nutrients to leach into the soil.
Less soil and water pollutionMinimizes economic and environmental risks Decreased EF in the following categories: ecotoxicity in aquatic environment, consumption of aquatic resources, eutrophication (terrestrial and freshwater)
Integrated pest and disease management
This practice is an ecologically oriented method that simultaneously uses cultural, biological, and chemical control techniques, while considering economic damage levels to determine the right moment to carry out controls. This allows for minimal agrochemical application and, consequently, minimal presence of these chemicals in soil and water resources.
Rational use of agrochemicals, less soil and water source contaminationReduced application costsDecreased EF in the following categories: human toxicity, ecotoxicity in aquatic environment, consumption of aquatic resources
Integrated weed management
Weeds are plants that accompany crops. Their soil cover allows for water storage and availability. Weeds also protect soil from the impact of raindrops, thus reducing erosion. Integrated plow management involves chemical, manual, and mechanical controls on the most aggressive weed species to produce beneficial plants/noble plows.
Rational use of agrochemicals, less soil and water source contamination Reduced application costsDecreased EF in the following categories: human toxicity, ecotoxicity in aquatic environment, consumption of aquatic resources
Herbicide application with selector
Simple, light equipment locally applies herbicides on high-interference or very aggressive weeds.
Rational use of agrochemicals, less soil and water source contamination Reduced application costsDecreased EF in the following categories: human toxicity, ecotoxicity in aquatic environment, consumption of aquatic resources
Soil and water conservation and management practices
Soil and water conservation requires the implementation of crop management restrictions and the adoption of preventive practices and soil degradation controls. This includes: selection and appropriate location for crops, establishment of soil cover, construction of live carvings for channeling runoff water, intake maintenance, and integrated weed and bioengineering treatment management.
Less soil and water source contaminationDecreased EF in the following categories: ecotoxicity in aquatic environment, eutrophication (terrestrial and freshwater)
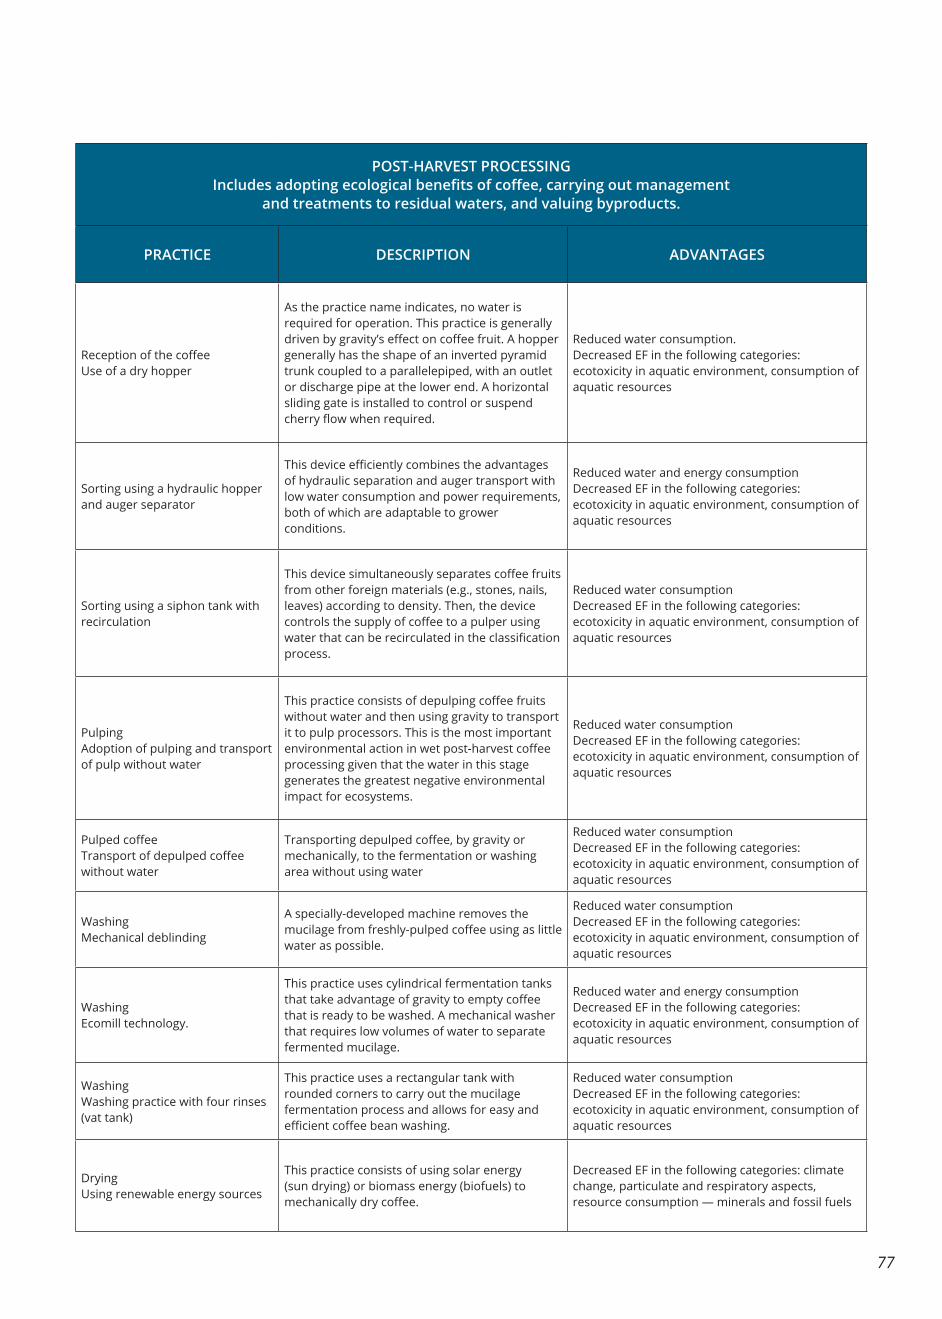
77
POST-HARVEST PROCESSINGIncludes adopting ecological benefits of coffee, carrying out management
and treatments to residual waters, and valuing byproducts.
PRACTICE DESCRIPTION ADVANTAGES
Reception of the coffeeUse of a dry hopper
As the practice name indicates, no water is required for operation. This practice is generally driven by gravity’s effect on coffee fruit. A hopper generally has the shape of an inverted pyramid trunk coupled to a parallelepiped, with an outlet or discharge pipe at the lower end. A horizontal sliding gate is installed to control or suspend cherry flow when required.
Reduced water consumption.Decreased EF in the following categories: ecotoxicity in aquatic environment, consumption of aquatic resources
Sorting using a hydraulic hopper and auger separator
This device efficiently combines the advantages of hydraulic separation and auger transport with low water consumption and power requirements, both of which are adaptable to grower conditions.
Reduced water and energy consumption Decreased EF in the following categories: ecotoxicity in aquatic environment, consumption of aquatic resources
Sorting using a siphon tank with recirculation
This device simultaneously separates coffee fruits from other foreign materials (e.g., stones, nails, leaves) according to density. Then, the device controls the supply of coffee to a pulper using water that can be recirculated in the classification process.
Reduced water consumptionDecreased EF in the following categories: ecotoxicity in aquatic environment, consumption of aquatic resources
PulpingAdoption of pulping and transport of pulp without water
This practice consists of depulping coffee fruits without water and then using gravity to transport it to pulp processors. This is the most important environmental action in wet post-harvest coffee processing given that the water in this stage generates the greatest negative environmental impact for ecosystems.
Reduced water consumptionDecreased EF in the following categories: ecotoxicity in aquatic environment, consumption of aquatic resources
Pulped coffeeTransport of depulped coffee without water
Transporting depulped coffee, by gravity or mechanically, to the fermentation or washing area without using water
Reduced water consumptionDecreased EF in the following categories: ecotoxicity in aquatic environment, consumption of aquatic resources
WashingMechanical deblinding
A specially-developed machine removes the mucilage from freshly-pulped coffee using as little water as possible.
Reduced water consumption Decreased EF in the following categories: ecotoxicity in aquatic environment, consumption of aquatic resources
WashingEcomill technology.
This practice uses cylindrical fermentation tanks that take advantage of gravity to empty coffee that is ready to be washed. A mechanical washer that requires low volumes of water to separate fermented mucilage.
Reduced water and energy consumptionDecreased EF in the following categories: ecotoxicity in aquatic environment, consumption of aquatic resources
WashingWashing practice with four rinses (vat tank)
This practice uses a rectangular tank with rounded corners to carry out the mucilage fermentation process and allows for easy and efficient coffee bean washing.
Reduced water consumption Decreased EF in the following categories: ecotoxicity in aquatic environment, consumption of aquatic resources
DryingUsing renewable energy sources
This practice consists of using solar energy (sun drying) or biomass energy (biofuels) to mechanically dry coffee.
Decreased EF in the following categories: climate change, particulate and respiratory aspects, resource consumption — minerals and fossil fuels
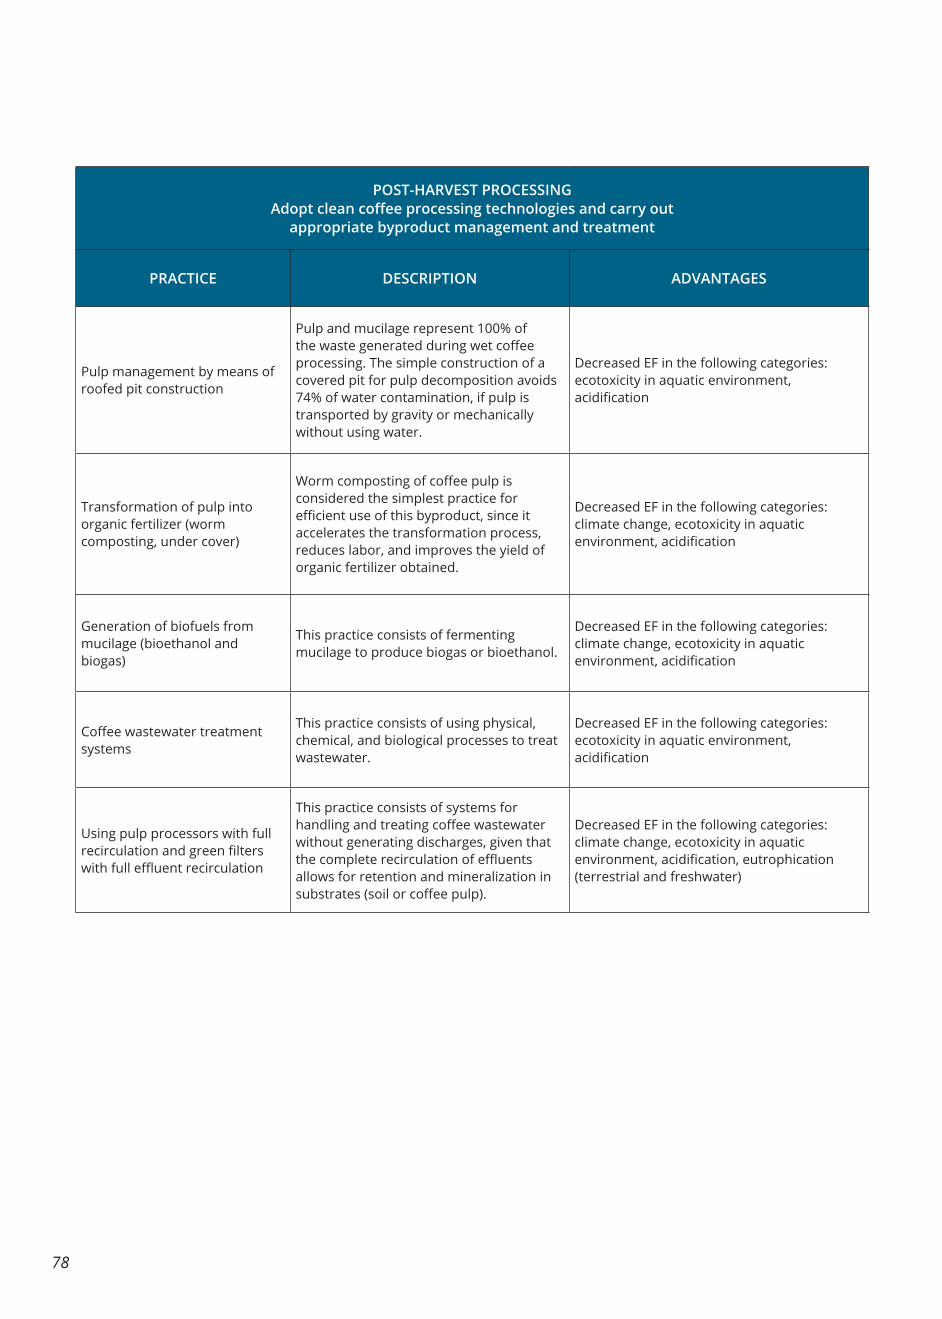
78
POST-HARVEST PROCESSINGAdopt clean coffee processing technologies and carry out
appropriate byproduct management and treatment
PRACTICE DESCRIPTION ADVANTAGES
Pulp management by means of roofed pit construction
Pulp and mucilage represent 100% of the waste generated during wet coffee processing. The simple construction of a covered pit for pulp decomposition avoids 74% of water contamination, if pulp is transported by gravity or mechanically without using water.
Decreased EF in the following categories: ecotoxicity in aquatic environment, acidification
Transformation of pulp into organic fertilizer (worm composting, under cover)
Worm composting of coffee pulp is considered the simplest practice for efficient use of this byproduct, since it accelerates the transformation process, reduces labor, and improves the yield of organic fertilizer obtained.
Decreased EF in the following categories: climate change, ecotoxicity in aquatic environment, acidification
Generation of biofuels from mucilage (bioethanol and biogas)
This practice consists of fermenting mucilage to produce biogas or bioethanol.
Decreased EF in the following categories: climate change, ecotoxicity in aquatic environment, acidification
Coffee wastewater treatment systems
This practice consists of using physical, chemical, and biological processes to treat wastewater.
Decreased EF in the following categories: ecotoxicity in aquatic environment, acidification
Using pulp processors with full recirculation and green filters with full effluent recirculation
This practice consists of systems for handling and treating coffee wastewater without generating discharges, given that the complete recirculation of effluents allows for retention and mineralization in substrates (soil or coffee pulp).
Decreased EF in the following categories: climate change, ecotoxicity in aquatic environment, acidification, eutrophication (terrestrial and freshwater)
79
Environmental footprint studies provide science-based information about key environmental hotspots and the performance of product systems, which can be used to make informed decisions. Decisions from the engage productive sectors, value chain and stakeholders as well as from consumers that are more responsible. The knowledge gained can be used to focus on implementing meaningful actions that target hotspots and to prepare the Colombian coffee market for national and international environmental footprint disclosure and information requests.
This guide practically supports LCA practitioners performing environmental footprint studies of the Colombian coffee value chain by providing guidance on methodologies and default data. This is a significant step toward mainstreaming and standardizing the concept of environmental footprinting. Recommendations to advance the robustness of environmental footprint results, catalyze their use, and take meaningful footprint reduction actions include:
Improving data quality: There are still significant data gaps on how coffee is produced in Colombia. Methodologies will also be further developed. Consequently, this guide should be updated in future, and data limitations should be taken into account when interpreting environmental footprint results for “average” Colombian coffee. Based on the environmental footprint results, the most sensitive parameters in green coffee production are the amount and type of fertilizer, as well as productivity and waste treatment during post-harvesting processing. Further down the value chain, another key parameter is conversion efficiency (the less green coffee used per cup, the lower the impact) and coffee’s use stage (preparation technology and cup washing). Data gathering should primarily focus on these sensitive parameters.
Standardizing green coffee environmental footprint studies: A lack of methodological guidance on how to calculate the environmental footprint of green coffee was one main reason for establishing this guide. In order to provide consistent B2C or B2B consumer information about green coffee’s environmental performance, a globally-recognized footprint calculation standard for green coffee would ideally be established (rather than national or regional standards). Such a global standard would account for local differences in production systems and environments where relevant. This guide can contribute to the establishment of such a global standard.
Providing tools to streamline environmental footprint studies: The extent of this guide underlines that assessing the environmental footprint of coffee from scratch requires a significant amount of resources. Tools that contain databases, automate calculations, and visualize results facilitate the possibility that non-LCA experts can also evaluateenvironmental performance of their own production systems in a cost and time-efficient way.
From knowledge to action: Once environmental hotspots are identified, the next step is implementation. The GIA provides a good overview of best practices for coffee cultivation and post-harvest processing (Rodriguez V. et al., 2018); these are also summarized in chapter 7.
8. CONCLUSIONS AND RECOMMENDATIONS
80
9. REFERENCESBSI. (2012). PAS 2050-1:2012 Assessment of life cycle greenhouse gas emissions from horticultural products, 46.Calderón C, R., & Rodríguez V, N. (2018). Modelo integral de manejo de microcuencas cafeteras en Colombia, Experiencia “Manos al Agua.” Chinchiná.
Cannell, G. R. (1985). Physiology of the Coffee Crop (pp. 108–134). https://doi.org/10.1007/978-1-4615-6657-1_5
Castro-Toro, A. M., Rivillas-Osorio, C. A., Serna-Giraldo, C. A., & Mejía-Mejía, C. G. (2008). Avances técnicos 368 Cenicafé.
Germinadores de café. Construcción, manejo de Rhizoctonia solani y costos. Avances Técnicos Cenicafé, 1–12.
Cenicafé. (2018). Guía más agronomía más productividad. Chinchiná.2018. 111 p.Colcafe. (2018). De la trilla a la taza- Apasionados por el Café.
DANE. (n.d.). Clasificación Industrial Internacional Uniforme de todas las actividades económicas Revisión 3.1 Adaptada para Colombia.
De Klein, C., Novoa, R., Ogle, S., Smith, K., Rochette, P., Wirth, C., … Williams, S. (2006). IPCC evaluate
De Klein, C., Novoa, R., Ogle, S., Smith, K., Rochette, P., Wirth, C., … Williams, S. (2006). IPCC Guidelines for National Greenhouse Gas Inventories. Volume 4: Agriculture, Forestry and Other Land Use. Chapter 11: N2O Emissions from Managed Soils, and CO2 Emissions from Lime and Urea Application. Intergovernmental Panel on Climate Change (IPCC), 11.1-11.54.
Dreicer, M., Tort, V., & Manen, P. (1995). ExternE, Externalities of Energy. Nuclear, Centr d’étude Sur l’Evaluation de La Protection Dans Le Domaine Nucléaire (CEPN), 5.
EnergyUseCalculator.com. (2019). Electricity usage of a Coffee Maker.
Environdec. (2013). PCR on green coffee.
Environdec. (2018). PCR Espresso Coffee Drinks.
Environdec. (2019). PCR Moka coffee.
European Commission. (2013). ANNEX II : PRODUCT ENVIRONMENTAL FOOTPRINT (PEF) GUIDE. Brussels.
European Commission. (2018). PEFCR Guidance document, Guidance for the development of Product Environmental Footprint Category Rules (PEFCRs), version 6.3.
Adams, M. a., & Ghaly, A. E. (2007a). Determining barriers to sustainability within the Costa Rican coffee industry. Sustainable Development, 15(4), 229–241. https://doi.org/10.1002/sd.314
Adams, M., & Ghaly, A. E. (2007b). Maximizing sustainability of the Costa Rican coffee industry, 15, 1716–1729. https://doi.org/10.1016/j.jclepro.2006.08.013
Alvarado, G., Elías Posada-Suárez, H., Alfonso Cortina-Guerrero, H., Duque-Orrego, H., Vicente Baldión-Rincón, J., & Guzmán-Martínez, O. (2005). La VARIEDAD CASTILLO NARANJAL para las regiones cafeteras de Caldas, Quindío, Risaralda y Valle.
Androcioli Filho, A. (2002). CAFÉ ADENSADO: Espaçamentos e cuidados no manejo da lavoura, 30.
Arcila Pulgarín, J., Farfan, F., Moreno, A., Salazar, L. F., & Hincapie, E. (2007). Sistemas de producción de café en Colombia. Chinchiná.
Arevalo U., D., Sabogal M., J., Lozano A., J. G., & Martinez A., J. S. (2018). Una mirada a la agricultura de Colombia desde su huella hídrica.
Bartholo, G. F., Melo, B., & Mendes, A. N. G. (1998). Evolução na adoção de espaçamentos na cultura do Café. Informe Agropecuário, 19(193), 61 – 70.
Beck, T., Bos, U., Wittstock, B., Baitz, M., Fischer, M., & Sedlbauer, K. (2010). LANCA Land Use Indicator Value Calculation in Life Cycle Assessment – Method Report. Fraunhofer Institute for Building Physics.
Bhatia, P., Cummins, C., Brown, A., Rich, D., Draucker, L., & Lahd, H. (2018). Corporate Value Chain (Scope 3) Accounting and Reporting Standard. Retrieved from http://ghgprotocol.org/sites/default/files/standards/Corporate-Value-Chain-Accounting-Reporing-Standard_041613_2.pdf
Birkved, M., & Hauschild, M. Z. (2006). PestLCI — A model for estimating field emissions of pesticides in agricultural LCA, 8, 433–451. https://doi.org/10.1016/j.ecolmodel.2006.05.035
Bos, U., Horn, R., Beck, T., Lindner, J. P., & Fischer, M. (2016). LANCA® - Characterisation Factors for Life Cycle Impact Assessment, Version 2.0. Stuttgart.
Browning, G., & Fisher, N. (1976). High density coffee: Yield results for the cycle from systematic plant spacing designs.
BSI. (2011). PAS 2050:2011 Specification for the assessment of the life cycle greenhouse gas emissions of goods and services. London, UK.
81
IPCC. (2006a). Grassland. IPCC (Vol. 4). https://doi.org/10.1111/j.1749-6632.2009.05320.x
IPCC. (2006b). IPCC Guidelines for National Greenhouse Gas Inventories.
IPCC. (2013). Adoption and acceptance of the “2013 supplement to the 2006 guidelines: Wetlands” (Vol. 2). Geneva, Switzerland.
ISO. (2006a). 14040 - Environmental management - Life cycle assessment - Principles and Framewoork. International Standard Organisation.
ISO. (2006b). 14044 - Environmental management - Life cycle assessment - Requirements and guidelines. International Standard Organisation.
ISO. (2006c). ISO 14025:2006(E) Environmental labels and declarations - Type III environmental declarations- Principles and procedures. Geneva, CH: International Organization for Standardization.
ISO. (2006d). ISO 14040:2006(E) Environmental management — Life cycle assessment — Principles and framework. Geneva, Switzerland: International Organization for Standardization.ISO. (2013). ISO TS/14067 : Greenhouse gases -- Carbon footprint of products -- Requirements and guidelines for quantification and communication.
ISO. (2014). ISO 14046:2014 (E) Environmental management. Water footprint - principles, requirements and guidelines. Environmental Standards Catalogue. Geneva, Switzerland.
ISO. (2017a). ISO/TR 14073:2017(E) Environmental management — Water footprint — Illustrative examples on how to apply.
ISO 14046. Geneva, CH: International Organization for Standardizatizon.
ISO. (2017b). ISO 14046 - Environmental management - Water footprint practical guide.Kim, Y. M. (2009). Validation of psychometric research instruments: The case of information science. Journal of the American Society for Information Science and Technology, 60(6), 1178–1191.
Koch, P., Salou, T., Colomb, V., Payen, S., Perret, S., Tailleur, A., & Willmann, S. (2013). AGRIBALYSE ® : METHODOLOGY Version 1.1, (March).
Koellner, T., de Baan, L., Beck, T., Brandao, M., Civit, B., Goedkoop, M., … Wittstock, B. (2012). Principles for life cycle inventories of land use on a global scale. The International Journal of Life Cycle Assessment, 1–13. https://doi.org/10.1007/s11367-012-0392-0
Federación Nacional de cafeteros. (2004). Germinadores y Almácigos de café. Cartilla cafetera 4.
Federación Nacional de cafeteros. (2018). Prensa al día. Boletín electrónico 267.
Federación Nacional de cafeteros. (2019a). Estadísticas Históricas.
Federación Nacional de cafeteros. (2019b). Estadísticas Históricas | Cultivos de Café en Colombia.
Federación Nacional de Cafeteros de Colombia. (2018). Informe del gerente. 86 CONGRESO NACIONAL DE CAFETEROS. Bogotá D.C.
Florez Ramos, C., Quiroga Cardona, J., & Arias Suarez, J. C. (2018). Guía más agronomía, más productividad. Chinchiná.
FNC- Federación Nacional de cafeteros. (1997). Sistema de Información Cafetera. Encuesta Nacional Cafetera SICA.Estadísticas Cafeteras. Informe Final. Bogota D.C.
Freiermuth, R. (2006). Modell zur Berechnung der Schwermetall- flüsse in der Landwirtschaftlichen Ökobilanz Inhaltsverzeichnis. Agroscope FAL Zürich-Reckenholz, (April), 28.
Frischknecht, R., Braunschweig, A., Hofstetter, P., & Suter, P. (2000). Human health damages due to ionising radiation in life cycle impact assessment. Environmental Impact Assessment Review, 20(2), 159–189. https://doi.org/10.1016/S0195-9255(99)00042-6
Gaitán, Á., Villegas, C., Rivillas, C., Hincapié, É., & Arcila, J. (2011). ALMÁCIGOS DE CAFÉ: Calidad fitosanitaria, manejo y siembra en el campo. Programa de Investigación Cientifica Fondo Nacional Del Café, 8.
Gallo, P. B., Van Raij, B., Quaggio, J. A., & Esteves Pereira, L. C. (1999). RESPOSTA DE CAFEZAIS ADENSADOS À ADUBAÇÃO NPK, 58(2), 109–124.
Gmünder, S., Humbert, S., Bayart, J.-B., Torro, C., Puerto, M., Martinez, A., … Conza, A. (2018). WATER FOOTPRINT INDICATORS FOR THE “EL AGUA NOS UNE” INITIATIVE.
Gomez, A. (1990). Manejo integrado de malezas en el cultivo del café y la erosión de los suelos. In CENTRO NACIONAL DE INVESTIGACIONES DE CAFÉ - Cenicafé. (pp. 5–22). Chinchiná.
Guinee, J., Bruijn, H. de, Duin, R. van, & Huijbregts, M. A. J. (2002). Handbook on Life Cycle Assessment. Eco-Efficiency in Industry and Science (Vol. 7). https://doi.org/10.1007/0-306-48055-7
82
and Reporting Standard Sector Guidance for Pharmace. London, UK: Environmental Resources Management Limited.
Phillips, J. F., Duque, A. J., Cabrera, K. R., Yepes, A. P., Navarrete, D. A., Garcia, M. C., … M, V. D. (2011). Estimación de las reservas potenciales de carbono almacenadas en la biomasa aérea en bosques naturales de Colombia. Bogota D.C.
Posch, M., Seppälä, J., Hettelingh, J. P., Johansson, M., Margni, M., & Jolliet, O. (2008). The role of atmospheric dispersion models and ecosystem sensitivity in the determination of characterisation factors for acidifying and eutrophying emissions in LCIA. International Journal of Life Cycle Assessment, 13(6), 477–486. https://doi.org/10.1007/s11367-008-0025-9
Quantis. (2016). Product Environmental Footprint Category Rules (PEFCRs): Coffee, 238.
Quantis. (2019). Accounting for natural climate solutions: Guidance for measuring GHG emissions from land, forests, and soils across the supply chain.
Rattan, S., Parande, A. K., Nagaraju, V., & Ghiwari, G. K. (2015). A comprehensive review on utilization of wastewater from coffee processing. Environmental Science and Pollution Research, 22(9), 6461–6472. https://doi.org/10.1007/s11356-015-4079-5
Rendón, J., & Flórez, L. (2017). Criterios para el establecimiento de cultivos de café en Colombia. Avances Tecnicos Cenicafé, 475(January), 8.
Rikxoort, H. Van, Schroth, G., Läderach, P., & Rodríguez-sánchez, B. (2014). Carbon footprints and carbon stocks reveal climate-friendly coffee production, 887–897. https://doi.org/10.1007/s13593-014-0223-8
Roa, G., Oliveros, C. E., Álvarez, J., Ramirez, C. ., Sanz, J. R., Davila, M. T., … Rodriguez, N. (1999). El beneficio ecologico del cafe. Chinchiná.
Rodriguez, N., Quintero Y., L. V, Castañeda S, A., Ospina P, C., & De Miguel G, A. (2018). Informe final de los ensayos sobre evaluación de filtros verdes para el tratamiento de las aguas residuales del café. Proyecto GIA. 2017- 2018.
Rodriguez V., N., & Quintero Y., L. V. (2015). Índice de manejo del agua en el proceso de beneficio húmedo del café.
Rodriguez V., N., Quintero Y., L. V, Castañeda S, A., Trejos P, F., Ospina P, C., Menza F, H., … Romero S, M. (2018). Informe de la determinación experimental de la huella hídrica del café de Colombia.
Rodríguez Valencia, N., Sanz Uribe, J. R., Oliveros Tascón, C. E., & Ramírez Gómez, C. A. (2015). Beneficio del café en Colombia. Prácticas y estrategias para el ahorro, uso eficiente del agua y el
Lavola, Olarte, D., Duque-Orrego, H., Gaitan, A., Rojas Acosta, J. M., Sadeghian, S., … Valencia, I. D. (2019). Nama café de colombia
Likert, R. (1932). A technique for the measurement of attitudes. Archives of psychology.
Lüdecke, D. (2018). sjmisc: Data and Variable Transformation Functions. Journal of Open Source Software, 3(26), 754.
Lüdecke, D. (2019). SjPlot: Data Visualization for Statistics in Social Science.
Lupiáñez-Villanueva, F., Tornese, P., Veltri, G. A., & Gaskell, G. (2018). Assessment of different communication vehicles for providing Environmental Footprint information.
Montilla, J. P. (2006). Caracterización de algunas propiedades físicas y factores de conversión del cafe. Universidad de Caldas.
MUÑOZ, O., URUEÑA, M., SAMPER, L. ., SALDIAS, C. ., BUITRAGO, M., GAST, … SANCHEZ A., P.M.; MEDINA R., R. . (2013). Manual del cafetero colombiano : Investigación y tecnología para la sostenibilidad de la caficultura. Chinchiná.
Nemecek, T, Gaillard, G., Freiermuth, R., Antón, A., Wilfart-Monziols, A., & Hermansen, J. (2011). ecoinvent V3.0 Good practice for life cycle inventories in agriculture (plant and animal production). Zurich and Dübendorf.
Nemecek, Thomas, Bengoa, X., Lansche, J., Mouron, P., Riedener, E., Rossi, V., & Humbert, S. (2015). World Food LCA Database Methodological Guidelines for the Life Cycle Inventory of Agricultural Products. Lausanne and Zurich, Switzerland.
Noponen, M. R. A., Edwards-jones, G., Haggar, J. P., Soto, G., Attarzadeh, N., & Healey, J. R. (2012). Greenhouse gas emissions in coffee grown with differing input levels under conventional and organic management. “Agriculture, Ecosystems and Environment,” 151, 6–15. https://doi.org/10.1016/j.agee.2012.01.019
Orozco, G. V., Mercedes, C., Espinosa, O., Carlos, J., Salazar, S., Fabián, C., & Pantoja, L. (2012). Carbon storage in agroforestry arrangements associated with coffee ( Coffea arabica ) in the south of Colombia, 213–221.
Ovalle, O. (2016). Almacenamiento de carbono en sistemas agroforestales con cafe en costa rica, 24.PEFCR coffee. (2016). Product Environmental Footprint Category Rules (PEFCRs): Coffee, 238.
Penny, T., Fisher, K., & Collins, M. (2012). GHG Protocol Product Life Cycle Accounting and Reporting Standard Sector Guidance for Pharmaceutical and Medical Device Products Pilot Testing Draft August 2012 GHG Protocol Product Life Cycle Accounting
83
UNEP. (2016). Global Guidance for Life Cycle Impact Assessment Indicators: Volume 1.
Uribe, H., & Mestre, M. (1980). Efecto de la gallinaza como abono en almacigos de cafe. In: Centrol Nacional de Investigaciones de Cafe-Cenicafe. Chinchina. Colombia. Informe Anual de Labores de la Seccion de cafe. Chinchiná.
Uribe, H., & Mestre, M. (1988). Efecto de la distancia de siemnray del numero de plantas por hoyo sobre la produccion de cafe coffea arabica L. var. Caturra.
Van Oers, L., de Koning, A., Guinee, J., & Huppes, G. (2002). Abiotic Resource Depletion in LCA. Amsterdam.
Van Zelm, R., Huijbregts, M. A. J., Den Hollander, H. A., Van Jaarsveld, H. A., Sauter, F. J., Struijs, J., … Van de Meent, D. (2008). European characterization factors for human health damage of PM10 and ozone in life cycle impact assessment. Atmospheric Environment, 42, 441–453.
Weidema, B. P., Bauer, C., Hischier, R., Mutel, C., Nemecek, T., Reinhard, J., … Weidema B P, Bauer C, Hischier R, Mutel C, Nemecek T, Reinhard J, Vadenbo C O, W. G. (2013). Overview and methodology - Data quality guideline for the ecoinvent database version 3. Ecoinvent report 1(v3) (Vol. 3). St. Gallen.
WFN. (2019). Water footprint network.
Wickham, H. (2016). ggplot2: Elegant Graphics for Data Analysis. Springer-Verlag New York.
Scientific Assessment of Ozone Depletion: 1998. Global Ozone Research and Monitoring Project - Report No. 44, ISBN 92-807-1722-7. Geneva.
control de la contaminación hídrica en el proceso de beneficio húmedo del café. Beneficio Del Café En Colombia.
Rojas Acosta, J. M., Rodríguez Valencia, N., Sánchez Romero, M. A., García, Á. de M., Montes, M. A., & Quintero Yepes, L. V. (2019). Guide to Colombian Coffee Water Footprint Assessment.
Rosenbaum, R. K., Anton, A., Bengoa, X., Bjørn, A., Brain, R., Bulle, C., … Wallman, M. (2015). The Glasgow consensus on the delineation between pesticide emission inventory and impact assessment for LCA. International Journal of Life Cycle Assessment, 20(6), 765–776. https://doi.org/10.1007/s11367-015-0871-1
Rosenbaum, R. K., Bachmann, T. M., Jolliet, O., Juraske, R., Koehler, A., & Hauschild, M. Z. (2008). USEtox — the UNEP-SETAC toxicity model : recommended characterisation factors for human toxicity and freshwater ecotoxicity in life cycle impact assessment, 532–546. https://doi.org/10.1007/s11367-008-0038-4
Sadeghian, K. (2017). Síntomas visuales de deficiencias nutricionales en café, (Tabla 1).
Sadeghian, S. (2008). Fertilizad del suelo y nutricion del cafe en Colombia.
Sadeghian, S., & González Osorio, H. (2012). Alternativas generales de fertilización para cafetales en la etapa de producción, AVANCES TÉ, 8.
Sadeghian, S., & Jaramillo Robledo, A. (2017). Nutrición de los cafetales en Colombia. Programa de Investigación Cientifica Fondo Nacional Del Café, (6).
Sánchez Navarro, D., Lis-Gutiérrez, J. P., Campo Robledo, J., & Herrera Saavedra, J. P. (2013). Estudios Económicos Sectoriales.
Seppälä, J., Posch, M., Johansson, M., & Hettelingh, J.-P. (2006). Country-dependent Characterisation Factors for Acidification and Terrestrial Eutrophication Based on Accumulated Exceedance as an Impact Category Indicator (14 pp). The International Journal of Life Cycle Assessment, 11(6), 403–416. https://doi.org/10.1065/lca2005.06.215
Struijs, J., Beusen, A., van Jaarsveld, H., & Huijbregts, M. A. J. (2009). Aquatic Eutrophication. Chapter 6 in: 4138 Goedkoop, M., Heijungs, R., Huijbregts, M.A.J., De Schryver, A., Struijs, J., Van Zelm, R. (2009). ReCiPe 2008 4139 A life cycle impact assessment method which comprises harmonised category indicators at the midp.
Suarez R, R., & Carvajal M, F. (2018). Impacto económico en las fincas cafeteras de Colombia. Modelo de medición.Gestión Inteligente del Agua. Chinchiná.
84
10. ANNEXDirect elementary flows (also named elementary flows) – All output emissions and input resource use that arise directly in the context of a process. Examples are emissions from a chemical process, or fugitive emissions from a boiler directly onsite. See Figure 2.
Environmental Footprint study – Term used to identify the totality of actions needed to calculate the EF results. It includes the modelisation, the data collection, and the analysis of the results.
Elementary flow - Material or energy entering the system being studied that has been drawn from the environment without previous human transformation, or material or energy leaving the system being studied that is released into the environment without subsequent human transformation.Environmental aspect – Element of an organization’s activities or products or services that interacts or can interact with the environment (ISO 14001:2015)
External Communication – Communication to any interested party other than the commissioner or the practitioner of the study.
Input flows – Product, material or energy flow that enters a unit process. Products and materials include raw materials, intermediate products and co-products (ISO 14040:2006).Intermediate product - An intermediate product is a product that requires further processing before it is saleable to the final consumer.
Life Cycle Inventory (LCI) - The combined set of exchanges of elementary, waste and product flows in a LCI dataset.
Life Cycle Inventory (LCI) dataset - A document or file with life cycle information of a specified product or other reference (e.g., site, process), covering descriptive metadata and quantitative life cycle inventory. A LCI dataset could be a unit process dataset, partially aggregated or an aggregated dataset. Output flows – Product, material or energy flow that leaves a unit process. Products and materials include raw materials, intermediate products, co-products and releases (ISO 14040:2006).
PEF Profile – The quantified results of a PEF study. It includes the quantification of the impacts for the various impact categories and the additional environmental information considered necessary to be reported.
Primary data - This term refers to data from specific processes within the supply-chain of the company applying the PEFCR. Such data may take the form of activity data, or
The main terms and definitions used in this guide are based on PEFCR v6.3 (European Commission, 2018) and if defined below, please refer to the most updated version of the Product Environmental Footprint (PEF) Guide, ISO 14025:2006, ISO 14040-44:2006, and the ENVIFOOD Protocol.
Activity data - This term refers to information which is associated with processes while modelling Life Cycle Inventories (LCI). In the PEF Guide it is also called “non-elementary flows”. The aggregated LCI results of the process chains that represent the activities of a process are each multiplied by the corresponding activity data and then combined to derive the environmental footprint associated with that process (See Figure 1). Examples of activity data include quantity of kilowatt-hours of electricity used, quantity of fuel used, output of a process (e.g. waste), number of hours equipment is operated, distance travelled, floor area of a building, etc. In the context of PEF the amounts of ingredients from the bill of material (BOM) shall always be considered as activity data.
Benchmark – A standard or point of reference against which any comparison can be made. In the context of PEF, the term ‘benchmark’ refers to the average environmental performance of the representative product sold in the EU market. A benchmark may eventually be used, if appropriate, in the context of communicating environmental performance of a product belonging to the same category.
Business to Business (B2B) – Describes transactions between businesses, such as between a manufacturer and a wholesaler, or between a wholesaler and a retailer.
Business to Consumers (B2C) – Describes transactions between business and consumers, such as between retailers and consumers. According to ISO 14025:2006, a consumer is defined as “an individual member of the general public purchasing or using goods, property or services for private purposes”.
Company-specific data – It refers to directly measured or collected data from one or multiple facilities (site-specific data) that are representative for the activities of the company. It is synonymous to “primary data”. To determine the level of representativeness a sampling procedure can be applied.
Comparative assertion – An environmental claim regarding the superiority or equivalence of one product versus a competing product that performs the same function (adapted from ISO 14025:2006).
10.1 TERMS AND DEFINITIONS
85
foreground elementary flows (life cycle inventory). Primary data are site-specific, company-specific (if multiple sites for the same product) or supply-chain-specific. Primary data may be obtained through meter readings, purchase records, utility bills, engineering models, direct monitoring, material/product balances, stoichiometry, or other methods for obtaining data from specific processes in the value chain of the company applying the PEFCR. In this Guidance, primary data is synonym of “company-specific data” or “supply-chain specific data”.
Product category – Group of products (or services) that can fulfil equivalent functions (ISO 14025:2006).
Product Category Rules (PCR) – Set of specific rules, requirements and guidelines for developing Type III environmental declarations for one or more product categories (ISO 14025:2006).
Product Environmental Footprint Category Rules (PEFCRs) – Product category-specific, life-cycle-based rules that complement general methodological guidance for PEF studies by providing further specification at the level of a specific product category. PEFCRs help to shift the focus of the PEF study towards those aspects and parameters that matter the most, and hence contribute to increased relevance, reproducibility and consistency of the results by reducing costs versus a study based on the comprehensive requirements of the PEF guide.
Refurbishment – It is the process of restoring components to a functional and/or satisfactory state to the original specification (providing the same function), using methods such as resurfacing, repainting, etc. Refurbished products may have been tested and verified to function properly.
Representative sample – A representative sample with respect to one or more variables is a sample in which the distribution of these variables is exactly the same (or similar) as in the population from which the sample is a subset
Sample – A sample is a subset containing the characteristics of a larger population. Samples are used in statistical testing when population sizes are too large for the test to include all possible members or observations. A sample should represent the whole population and not reflect bias toward a specific attribute.
Secondary data - It refers to data not from specific process within the supply-chain of the company applying the PEFCR. This refers to data that is not directly collected, measured, or estimated by the company, but sourced from a third-party life-cycle-inventory database or other sources. Secondary data includes industry-average data (e.g., from published production data, government statistics, and industry associations), literature studies, engineering studies and
patents, and can also be based on financial data, and contain proxy data, and other generic data. Primary data that go through a horizontal aggregation step are considered as secondary data.
Site-specific data – It refers to directly measured or collected data from one facility (production site). It is synonymous to “primary data”.
Supply-chain – It refers to all of the upstream and downstream activities associated with the operations of the company applying the PEFCR, including the use of sold products by consumers and the end-of-life treatment of sold products after consumer use.
Supply-chain specific – It refers to a specific aspect of the specific supply-chain of a company. For example, the recycled content value of an aluminum can be produced by a specific company.
Type III environmental declaration – An environmental declaration providing quantified environmental data using predetermined parameters and, where relevant, additional environmental information (ISO 14025:2006). The predetermined parameters are based on the ISO 14040 series of standards, which is made up of ISO 14040 and ISO 14044.
Unit process dataset - Smallest element considered in the life cycle inventory analysis for which input and output data are quantified (ISO 14040:2006). In LCA practice, both physically not further separable processes (such as unit operations in production plants, then called “unit process single operation”) and also whole production sites are covered under “unit process”, then called “unit process, black box” (ILCD Handbook).
Verification report – Documentation of the verification process and findings, including detailed comments from the Verifier(s), as well as the corresponding responses. This document is mandatory, but it can be confidential. However, it shall be signed, electronically or physically, by the verifier or in case of a verification panel, by the lead verifier.
86
The P emission model according to the WFLDB guide: “The impact assessment model for freshwater eutrophication should start (i) when P leaves the agricultural field (run off) or (ii) from manure or fertilizer application on agricultural field. Within LCI modelling, the agricultural field (soil) is often seen as belonging to the technosphere and thus included in the LCI model. This aligned with approach (i) where the impact assessment model starts after run-off, i.e. when P leaves the agricultural field. Therefore, within the EF context, the LCI should be modelled as the amount of P emitted to water after run-off and the emission compartment ‘water’ shall be used. When this amount is not available, the LCI may be modelled as the amount of P applied on the agricultural field (through manure or fertilizers) and the emission compartment ‘soil’ shall be used. In this case, the run-off from soil to water is part of the impact assessment method and included in the CF for soil.
Three different paths of phosphorus emissions to water are distinguished:
• Leaching of soluble phosphate (PO4) to ground water (inventoried as “phosphate, to ground water” as in ecoinvent),
• Run-off of soluble phosphate to surface water (inventoried as “phosphate, to surface water”),
• Water erosion of soil particles containing phosphorus (inventoried as “phosphorus, to surface water”).
Phosphate leaching to the ground water can be estimated as an average leaching, corrected by P-fertilization:
Pgw quantity of P leached to ground water [kg/(ha*a)]Pgwl average quantity of P leached to ground water for a land use category [kg/(ha*a)], which is: 0.07 kg P/(ha*a) for arable land 0.06 kg P/(ha*a) for permanent pastures and meadows.Fgw correction factor for fertilization by slurry [dimensionless]Fgw 1+0.2/80 * P2O5slP2O5sl quantity of P2O5 contained in the slurry or liquid sewage sludge [kg/ha].
Phosphate run-off to surface water can be calculated similarly to leaching to ground water:
Pro = quantity of P lost through run-off to rivers [kg/(ha*a)]Prol = average quantity of P lost through run-off for a land use category [kg/(ha*a)], which is:
• 0.175 kg P/(ha*a) for arable land• 0.25 kg P/(ha*a) for intensive permanent pastures and meadows • 0.15 kg P/(ha*a) for extensive permanent pastures and meadows
Fro = correction factor for fertilization with P [dimensionless], calculated as:Fro = 1 + 0.2/80 * P2O5min + 0.7/80 * P2O5sl + 0.4/80 * P2O5manP2O5min = quantity of P2O5 contained in mineral fertilizer [kg/ha]P2O5sl = quantity of P2O5 contained in slurry or liquid sewage sludge [kg/ha]P2O5man = quantity of P2O5 contained in solid manure [kg/ha] Phosphorous emissions through soil erosion to surface water can be calculated as follows:
Per = quantity of P emitted through erosion to rivers [kg P/(ha*a)]Ser = quantity of soil eroded [kg/(ha*a)]Pcs = P content in the top soil [kg P/kg soil]. The Average value is 0.00095 kg/kgFr = enrichment factor for P (-). The average value is 1.86. This factor takes account of the fact that the eroded soil particles contain more P than the average soil.Ferw = fraction of the eroded soil that reaches the river [dimensionless]. The average value is 0.2.”
10.2 PHOSPHATE EMISSIONS
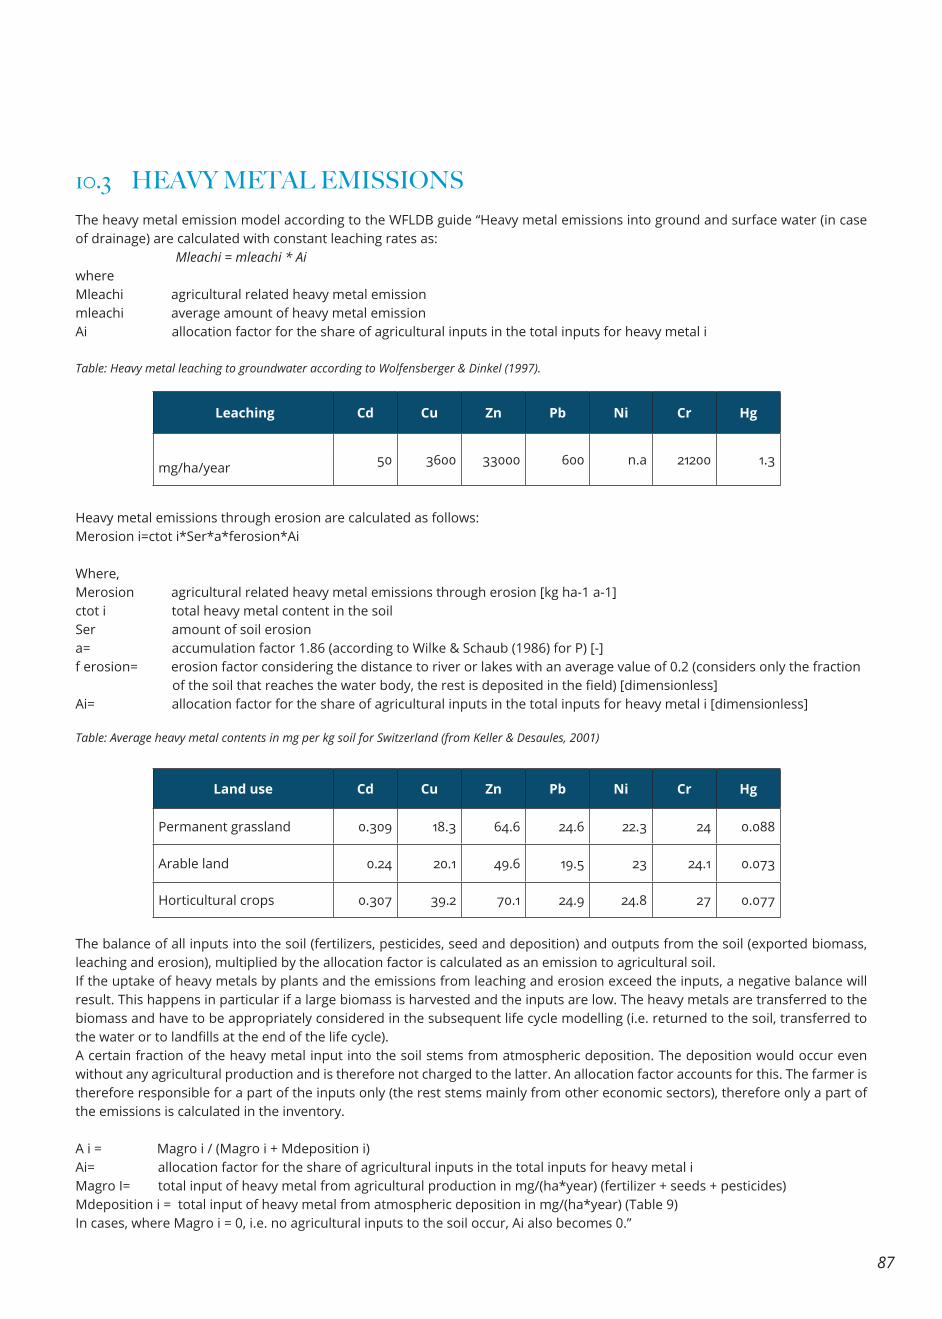
87
The heavy metal emission model according to the WFLDB guide “Heavy metal emissions into ground and surface water (in case of drainage) are calculated with constant leaching rates as: Mleachi = mleachi * AiwhereMleachi agricultural related heavy metal emissionmleachi average amount of heavy metal emission Ai allocation factor for the share of agricultural inputs in the total inputs for heavy metal i
Heavy metal emissions through erosion are calculated as follows:Merosion i=ctot i*Ser*a*ferosion*Ai
Where,Merosion agricultural related heavy metal emissions through erosion [kg ha-1 a-1]ctot i total heavy metal content in the soilSer amount of soil erosiona= accumulation factor 1.86 (according to Wilke & Schaub (1986) for P) [-]f erosion= erosion factor considering the distance to river or lakes with an average value of 0.2 (considers only the fraction of the soil that reaches the water body, the rest is deposited in the field) [dimensionless]Ai= allocation factor for the share of agricultural inputs in the total inputs for heavy metal i [dimensionless]
10.3 HEAVY METAL EMISSIONS
Table: Heavy metal leaching to groundwater according to Wolfensberger & Dinkel (1997).
Table: Average heavy metal contents in mg per kg soil for Switzerland (from Keller & Desaules, 2001)
Leaching Cd Cu Zn Pb Ni Cr Hg
mg/ha/year 50 3600 33000 600 n.a 21200 1.3
Land use Cd Cu Zn Pb Ni Cr Hg
Permanent grassland 0.309 18.3 64.6 24.6 22.3 24 0.088
Arable land 0.24 20.1 49.6 19.5 23 24.1 0.073
Horticultural crops 0.307 39.2 70.1 24.9 24.8 27 0.077
The balance of all inputs into the soil (fertilizers, pesticides, seed and deposition) and outputs from the soil (exported biomass, leaching and erosion), multiplied by the allocation factor is calculated as an emission to agricultural soil. If the uptake of heavy metals by plants and the emissions from leaching and erosion exceed the inputs, a negative balance will result. This happens in particular if a large biomass is harvested and the inputs are low. The heavy metals are transferred to the biomass and have to be appropriately considered in the subsequent life cycle modelling (i.e. returned to the soil, transferred to the water or to landfills at the end of the life cycle).A certain fraction of the heavy metal input into the soil stems from atmospheric deposition. The deposition would occur even without any agricultural production and is therefore not charged to the latter. An allocation factor accounts for this. The farmer is therefore responsible for a part of the inputs only (the rest stems mainly from other economic sectors), therefore only a part of the emissions is calculated in the inventory.
A i = Magro i / (Magro i + Mdeposition i)Ai= allocation factor for the share of agricultural inputs in the total inputs for heavy metal iMagro I= total input of heavy metal from agricultural production in mg/(ha*year) (fertilizer + seeds + pesticides)Mdeposition i = total input of heavy metal from atmospheric deposition in mg/(ha*year) (Table 9)In cases, where Magro i = 0, i.e. no agricultural inputs to the soil occur, Ai also becomes 0.”