ensemble clustering for biological datasets
TRANSCRIPT
Chapter 0
Ensemble Clustering for Biological Datasets
Harun Pirim and Sadi Evren Seker
Additional information is available at the end of the chapter
http://dx.doi.org/10.5772/49956
1. Introduction
Recent technologies and tools generated excessive data in bioinformatics domain. Forexample, microarrays measure expression levels of ten thousands of genes simultaneouslyin a single chip. Measurements involve relative expression values of each gene through animage processing task.
Biological data requires both low and high level analysis to reveal significant informationthat will shed light into biological facts such as disease prediction, annotation of a genefunction and guide new experiments. In that sense, researchers are seeking for the effect ofa treatment or time course change befalling. For example, they may design a microarrayexperiment treating a biological organism with a chemical substance and observe geneexpression values comparing with expression value before treatment. This treatment orchange make researchers focus on groups of genes, other biological molecules that havesignificant relationships with each other under similar conditions. For instance, gene classlabels are usually unknown, since there is a little information available about the data.Hence, data analysis using an unsupervised learning technique is required. Clusteringis an unsupervised learning technique used in diverse domains including bioinformatics.Clustering assigns objects into the same cluster, based on a cluster definition. A clusterdefinition or criterion is the similarity between the objects. The idea is that one needs to findthe most important cliques among many from the data. Therefore, clustering is widely usedto obtain biologically meaningful partitions. However, there is no best clustering approach forthe problem on hand and clustering algorithms are biased towards certain criteria. In otherwords, a particular clustering approach has its own objective and assumptions about the data.
Diversity of clustering algorithms can benefit from merging partitions generated individually.Ensemble clustering provides a framework to merge individual partitions from differentclustering algorithms. Ensemble clustering may generate more accurate clusters thanindividual clustering approaches. Here, an ensemble clustering framework is implementedas described in [10] to aggregate results from K-means, hiearchical clustering and C-meansalgorithms. We employ C-means instead of spectral clustering in [10]. We also use different
©2012 Pirim and Seker, licensee InTech. This is an open access chapter distributed under the terms of theCreative Commons Attribution License (http://creativecommons.org/licenses/by/3.0), which permitsunrestricted use, distribution, and reproduction in any medium, provided the original work is properlycited.
Chapter 13
2 Will-be-set-by-IN-TECH
data sets. Two different biological datasets are used for each algorithm. A comparison ofthe results is presented. In order to evaluate the performance of the ensemble clusteringapproach, one internal and one external cluster validation indices are used. Silhouette (S)[31] is the internal validation index and C-rand [23] is the external one. The chapter reviewssome clustering algorithms, ensemble clustering methods, includes implementation, andconclusion sections.
2. Clustering algorithms
Clustering biological data is very important for identification of co-expressed genes, whichfacilitates functional annotation and the elucidation of biological pathways. Accuratepredictions can serve as a guide for targeting further experiments and generating additionalhypotheses. Furthermore, accurate predictions can facilitate identification of disease markersand targets for drug design [4]; clustering can also be used to determine whether certainpatterns exist near viral integration sites[16].
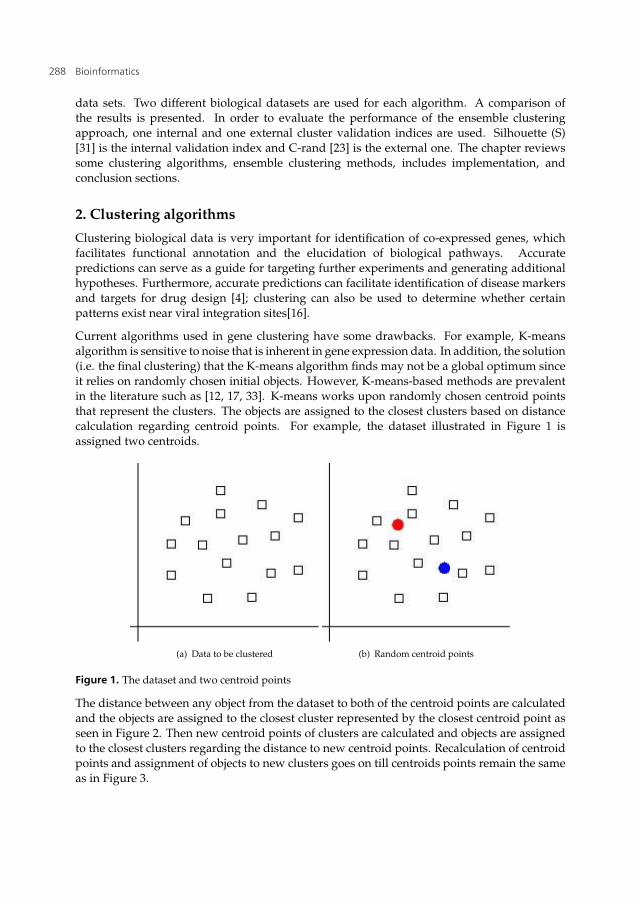
Current algorithms used in gene clustering have some drawbacks. For example, K-meansalgorithm is sensitive to noise that is inherent in gene expression data. In addition, the solution(i.e. the final clustering) that the K-means algorithm finds may not be a global optimum sinceit relies on randomly chosen initial objects. However, K-means-based methods are prevalentin the literature such as [12, 17, 33]. K-means works upon randomly chosen centroid pointsthat represent the clusters. The objects are assigned to the closest clusters based on distancecalculation regarding centroid points. For example, the dataset illustrated in Figure 1 isassigned two centroids.
(a) Data to be clustered (b) Random centroid points
Figure 1. The dataset and two centroid points
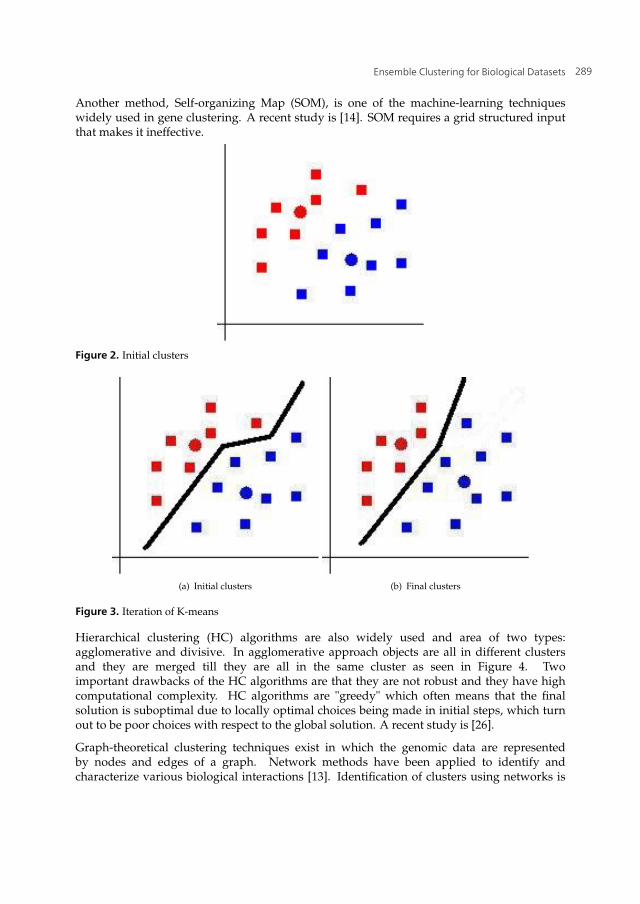
The distance between any object from the dataset to both of the centroid points are calculatedand the objects are assigned to the closest cluster represented by the closest centroid point asseen in Figure 2. Then new centroid points of clusters are calculated and objects are assignedto the closest clusters regarding the distance to new centroid points. Recalculation of centroidpoints and assignment of objects to new clusters goes on till centroids points remain the sameas in Figure 3.
288 Bioinformatics
Ensemble Clustering for Biological Datasets 3
Another method, Self-organizing Map (SOM), is one of the machine-learning techniqueswidely used in gene clustering. A recent study is [14]. SOM requires a grid structured inputthat makes it ineffective.
Figure 2. Initial clusters
(a) Initial clusters (b) Final clusters
Figure 3. Iteration of K-means
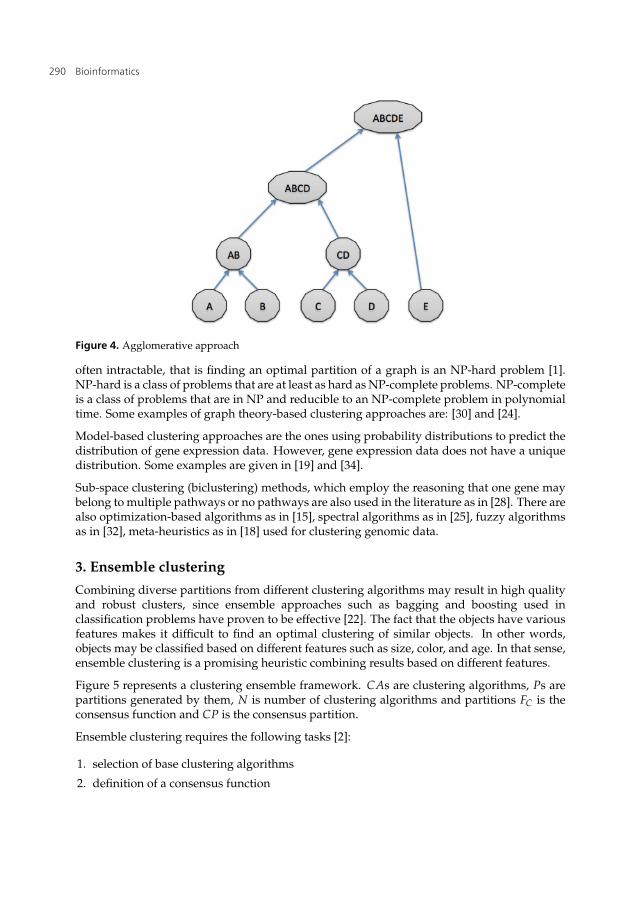
Hierarchical clustering (HC) algorithms are also widely used and area of two types:agglomerative and divisive. In agglomerative approach objects are all in different clustersand they are merged till they are all in the same cluster as seen in Figure 4. Twoimportant drawbacks of the HC algorithms are that they are not robust and they have highcomputational complexity. HC algorithms are "greedy" which often means that the finalsolution is suboptimal due to locally optimal choices being made in initial steps, which turnout to be poor choices with respect to the global solution. A recent study is [26].
Graph-theoretical clustering techniques exist in which the genomic data are representedby nodes and edges of a graph. Network methods have been applied to identify andcharacterize various biological interactions [13]. Identification of clusters using networks is
289Ensemble Clustering for Biological Datasets
4 Will-be-set-by-IN-TECH
Figure 4. Agglomerative approach
often intractable, that is finding an optimal partition of a graph is an NP-hard problem [1].NP-hard is a class of problems that are at least as hard as NP-complete problems. NP-completeis a class of problems that are in NP and reducible to an NP-complete problem in polynomialtime. Some examples of graph theory-based clustering approaches are: [30] and [24].
Model-based clustering approaches are the ones using probability distributions to predict thedistribution of gene expression data. However, gene expression data does not have a uniquedistribution. Some examples are given in [19] and [34].
Sub-space clustering (biclustering) methods, which employ the reasoning that one gene maybelong to multiple pathways or no pathways are also used in the literature as in [28]. There arealso optimization-based algorithms as in [15], spectral algorithms as in [25], fuzzy algorithmsas in [32], meta-heuristics as in [18] used for clustering genomic data.
3. Ensemble clusteringCombining diverse partitions from different clustering algorithms may result in high qualityand robust clusters, since ensemble approaches such as bagging and boosting used inclassification problems have proven to be effective [22]. The fact that the objects have variousfeatures makes it difficult to find an optimal clustering of similar objects. In other words,objects may be classified based on different features such as size, color, and age. In that sense,ensemble clustering is a promising heuristic combining results based on different features.
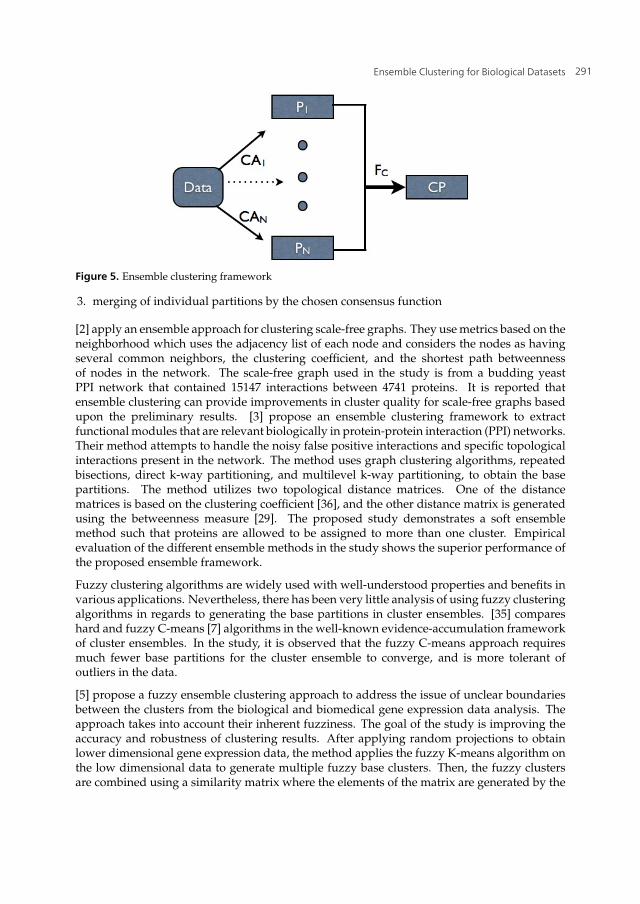
Figure 5 represents a clustering ensemble framework. CAs are clustering algorithms, Ps arepartitions generated by them, N is number of clustering algorithms and partitions FC is theconsensus function and CP is the consensus partition.
Ensemble clustering requires the following tasks [2]:
1. selection of base clustering algorithms
2. definition of a consensus function
290 Bioinformatics
Ensemble Clustering for Biological Datasets 5
Figure 5. Ensemble clustering framework
3. merging of individual partitions by the chosen consensus function
[2] apply an ensemble approach for clustering scale-free graphs. They use metrics based on theneighborhood which uses the adjacency list of each node and considers the nodes as havingseveral common neighbors, the clustering coefficient, and the shortest path betweennessof nodes in the network. The scale-free graph used in the study is from a budding yeastPPI network that contained 15147 interactions between 4741 proteins. It is reported thatensemble clustering can provide improvements in cluster quality for scale-free graphs basedupon the preliminary results. [3] propose an ensemble clustering framework to extractfunctional modules that are relevant biologically in protein-protein interaction (PPI) networks.Their method attempts to handle the noisy false positive interactions and specific topologicalinteractions present in the network. The method uses graph clustering algorithms, repeatedbisections, direct k-way partitioning, and multilevel k-way partitioning, to obtain the basepartitions. The method utilizes two topological distance matrices. One of the distancematrices is based on the clustering coefficient [36], and the other distance matrix is generatedusing the betweenness measure [29]. The proposed study demonstrates a soft ensemblemethod such that proteins are allowed to be assigned to more than one cluster. Empiricalevaluation of the different ensemble methods in the study shows the superior performance ofthe proposed ensemble framework.
Fuzzy clustering algorithms are widely used with well-understood properties and benefits invarious applications. Nevertheless, there has been very little analysis of using fuzzy clusteringalgorithms in regards to generating the base partitions in cluster ensembles. [35] compareshard and fuzzy C-means [7] algorithms in the well-known evidence-accumulation frameworkof cluster ensembles. In the study, it is observed that the fuzzy C-means approach requiresmuch fewer base partitions for the cluster ensemble to converge, and is more tolerant ofoutliers in the data.
[5] propose a fuzzy ensemble clustering approach to address the issue of unclear boundariesbetween the clusters from the biological and biomedical gene expression data analysis. Theapproach takes into account their inherent fuzziness. The goal of the study is improving theaccuracy and robustness of clustering results. After applying random projections to obtainlower dimensional gene expression data, the method applies the fuzzy K-means algorithm onthe low dimensional data to generate multiple fuzzy base clusters. Then, the fuzzy clustersare combined using a similarity matrix where the elements of the matrix are generated by the
291Ensemble Clustering for Biological Datasets
6 Will-be-set-by-IN-TECH
fuzzy t-norms algorithm, and finally, the fuzzy K-means algorithm is applied to the rows ofthe similarity matrix to obtain the consensus clustering. It is demonstrated that the proposedensemble approach is competitive with the other ensemble methods.
High throughput data may be generated by microarray experiments. If the dataset is verylarge, it is possible to generate an ensemble of clustering solutions, or partition the data sothat clustering may be performed on tractable-sized disjoint subsets [20]. The data can thenbe distributed at different sites, for which a distributed clustering solution with a final mergingof partitions is a natural fit. [20] introduce two new approaches to combining partitionsrepresented by sets of cluster centers. It is stated that these approaches provide a finalpartition of data that is comparable to the best existing approaches and that the approachescan be 100,000 times faster while using much less memory. The new algorithms are comparedwith the best existing cluster ensemble approaches that cluster all of the data at once, anda clustering algorithm designed for very large datasets. Fuzzy and hard K-means basedclustering algorithms are used for the comparison. It is demonstrated that the centroid-basedensemble merging algorithms presented in the study generated partitions which are as goodas the best label vector method, or the method of clustering all the data at once. The proposedalgorithms are also more efficient in terms of speed.
[11] propose evidence accumulation clustering based on dual rooted prim tree cuts (EAC-DC).The proposed algorithm computes the co-association matrix based on a forward algorithmthat repeatedly adds edges to Prim’s minimum spanning tree (MST) to identify clusters untila satisfying criterion is met. A consensus cluster is then generated from the co-associationmatrix using spectral partitioning. Here, a MST is a fully connected sub-graph with no cyclesand a dual-rooted tree is obtained by finding the union of two sub-trees. They test theirapproach using the Iris dataset [8], the Wisconsin breast cancer dataset [27] (both obtainedfrom [9]) and synthetic datasets, and presented a comparison of their results with otherexisting ensemble clustering methods.
[22] use a cluster ensemble in gene expression analysis. In the proposed ensemble framework,the partitions generated by each individual clustering algorithm are converted into a distancematrix. The distance matrices are then combined to construct a weighted graph. A graphpartitioning approach is then used to generate the final set of clusters. It is reported that theensemble approach yields better results than the best individual approach on both syntheticand yeast gene expression datasets.
[10] merge multiple partitions using evidence accumulation. Each partition generated by aclustering algorithm is used as a new piece of knowledge, to help uncover the relationshipsbetween objects. For this chapter, we adopt their ensemble approach. The core ideabehind the ensemble approach here is constructing the co-association matrix by employinga voting mechanism for the partitions generated using individual clustering algorithms. Aco-association matrix C is constructed based upon the formulation below, where nij is thenumber of times the object pair (i, j) is assigned to the same cluster among the N differentpartitions:
C(i, j) =nij
NAfter constructing the co-association matrix, [10] use single linkage hierarchical clustering toobtain the new cluster tree (dendrogram) and then use a cut-off value corresponding to themaximum life time (difference between merge points where branching starts) on the tree.
292 Bioinformatics
Ensemble Clustering for Biological Datasets 7
They also employ the same ensemble framework using K-means partitions with differentparameters. They test their algorithms on ten different datasets, comparing the results withother ensemble clustering methods. They report that their ensemble approach can identifythe clusters with arbitrary shapes and sizes, and perform better than the other combinationmethods.
4. Implementation
We employ the ensemble approach described in [10]. Different set of base clusteringalgorithms are chosen and implemented on protein and lymphoma datasets.
Protein dataset consists of 698 objects (corresponding to protein folds) with 125 attributes.The protein dataset contains 698 proteins from 125 samples. The real clusters correspond tothe four classes of protein−folds: α, β, α/β and α+β protein classes. DLBCL−B is 2−channelcustom cDNA microarray dataset. This is a B cell lymphoma dataset with predefined threesubtypes [21].
The ensemble clustering algorithm uses an array of vectors data structure for each of the file,in order to use the dynamic memory allocation and starts with initializing the file content inthe vectors. The algorithm also processes the vectors and generates two temporary matriceswith the dimension of maximum vector length. The ensemble clustering algorithm steps areas follows:
Algorithm 1 Ensemble Clustering AlgorithmRequire: partitionsEnsure: distance matrix
for i = 0 to max(V[n]) dofor j = 0 to max(V[n]) do
for k = 0 to n doif V[k].elementAt(i) = V[k].elementAt(j)) then
C[i][j] = C[i][j] + 1/nend ifD[i][j] = 1− C[i][j]
end forend for
end for
Here, n is the number of files, V[n] are the vectors holding the content of each file. max(V[n])is the length of the longest vector, C[i][j] is the co-association matrix and D[i][j] is the distancematrix. The algorithm iterates through the two dimensional matrix via i and j loop variablesinside a nested loop at lines 1 and 2 and for each member of the matrix, all the vectors areprocessed inside the loop via k loop variable at line 3. The condition of equality for theselected vector with the selected loop variables i and j, causes an increase on the co-associationmatrix elements at lines 4 and 5. Finally the distance matrix is calculated at line 7. Afterobtaining the distance matrix, hierarchial clustering with complete linkage is used to generatethe dengrogram. The dendrogram is cut at a certain level to obtain consensus partition.
293Ensemble Clustering for Biological Datasets
8 Will-be-set-by-IN-TECH
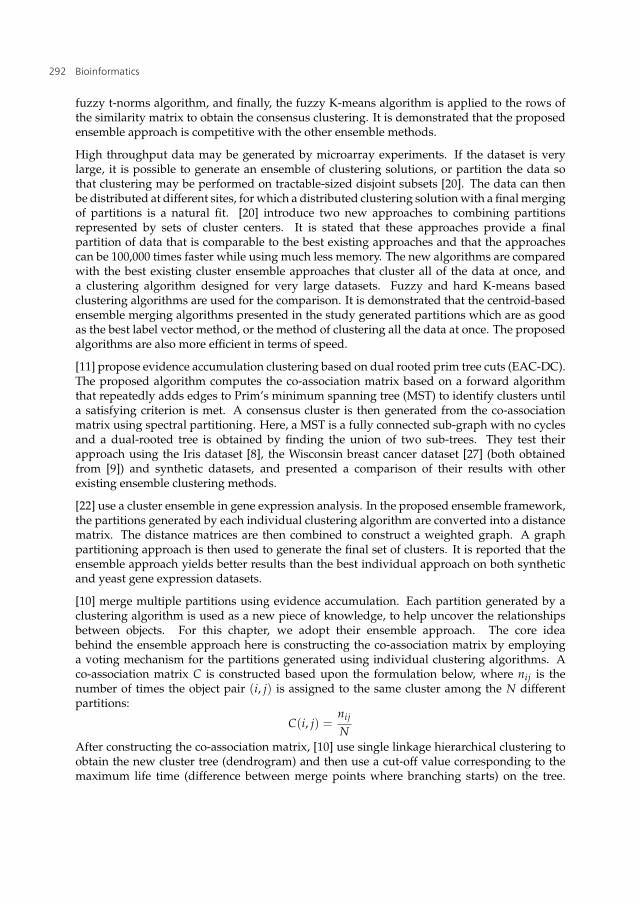
Ensemble approach is coded as a java application which is available upon request.The software allows addition of many partitions to generate the distance matrix of thecorresponding ensemble. Files including the partitions can be added by clicking on the "AddFile" button as seen in Figure 6. Distance matrix of the ensemble is generated by "Calculate"button.
Figure 6. File input interface
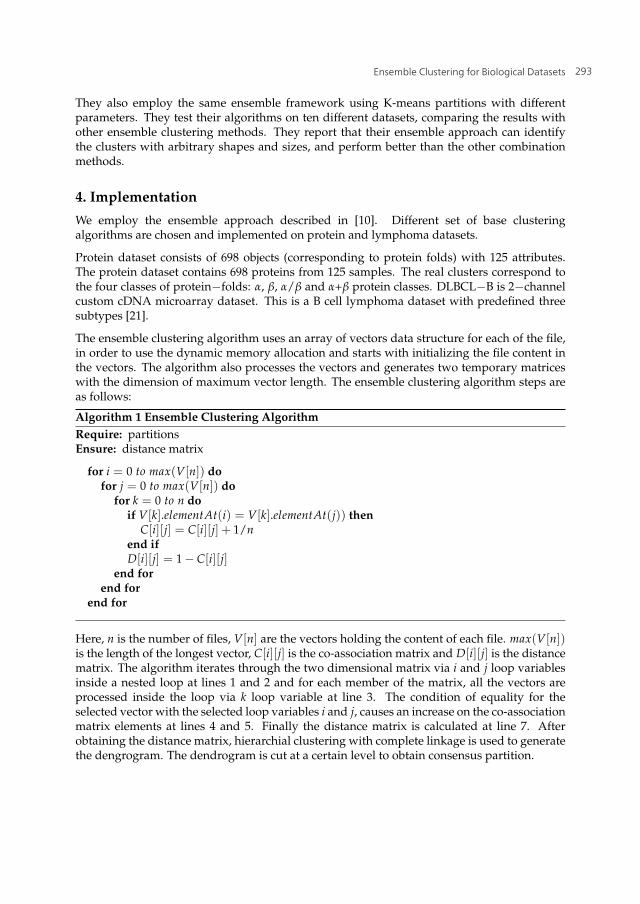
The output is displayed on a separate screen as demonstrated on Figure 7. The output withcsv format can be written into a file by clicking on the "Output CSV" button.
Figure 7. Example clusters
Considering two different partitions of a dataset with six objects which are (1, 1, 2, 1, 3, 3) and(2, 2, 2, 1, 3, 3), the algorithm’s output is the distance matrix:
⎛⎜⎜⎜⎜⎜⎜⎝
0 0 0.5 0.5 1 10 0 0.5 0.5 1 1
0.5 0.5 0 1 1 10.5 0.5 1 0 1 11 1 1 1 0 01 1 1 1 0 0
⎞⎟⎟⎟⎟⎟⎟⎠
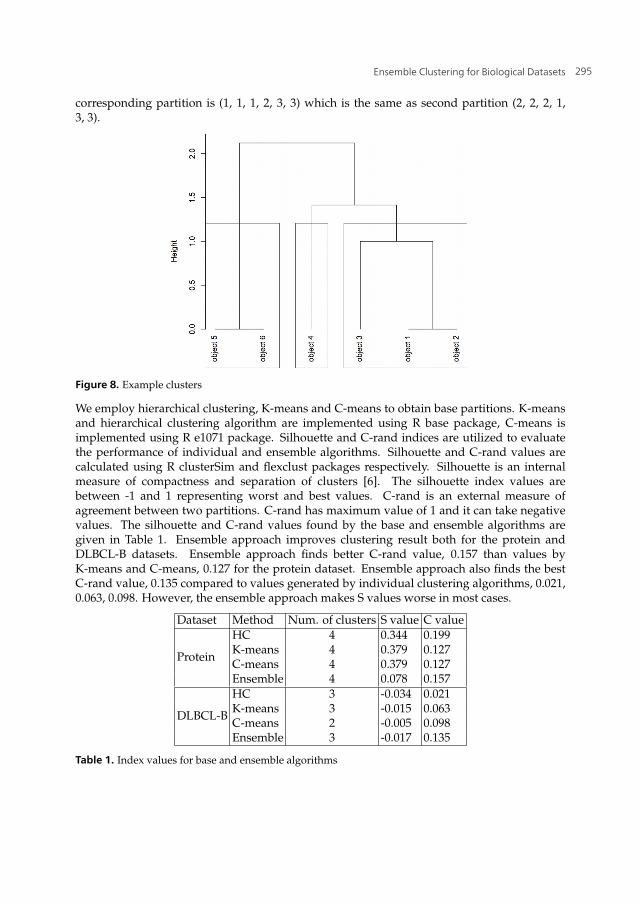
The distance matrix is used in hierarchical clustering with complete linkage and the followingdendrogram is generated. The dendrogram is cut at a level to give three clusters. The
294 Bioinformatics
Ensemble Clustering for Biological Datasets 9
corresponding partition is (1, 1, 1, 2, 3, 3) which is the same as second partition (2, 2, 2, 1,3, 3).
Figure 8. Example clusters
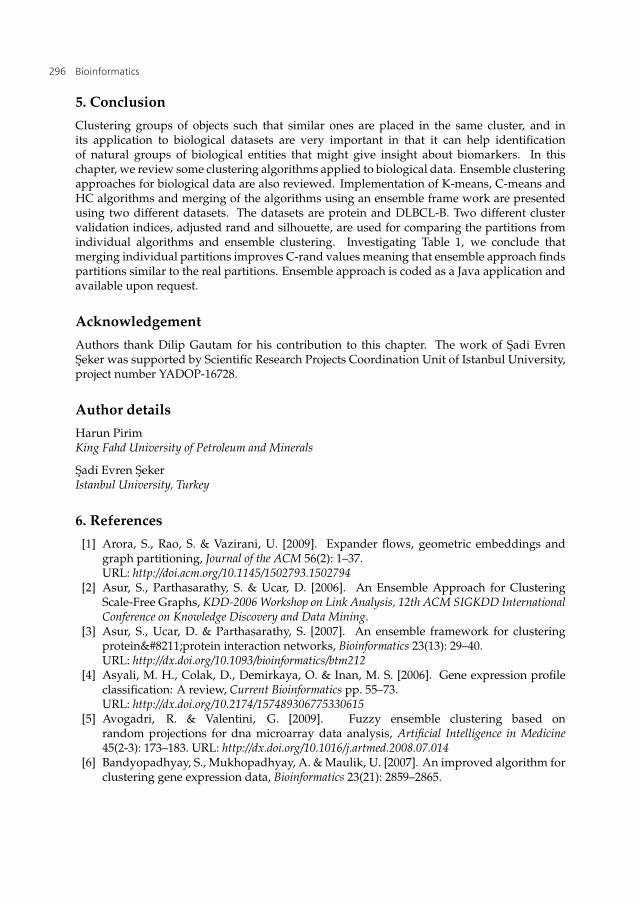
We employ hierarchical clustering, K-means and C-means to obtain base partitions. K-meansand hierarchical clustering algorithm are implemented using R base package, C-means isimplemented using R e1071 package. Silhouette and C-rand indices are utilized to evaluatethe performance of individual and ensemble algorithms. Silhouette and C-rand values arecalculated using R clusterSim and flexclust packages respectively. Silhouette is an internalmeasure of compactness and separation of clusters [6]. The silhouette index values arebetween -1 and 1 representing worst and best values. C-rand is an external measure ofagreement between two partitions. C-rand has maximum value of 1 and it can take negativevalues. The silhouette and C-rand values found by the base and ensemble algorithms aregiven in Table 1. Ensemble approach improves clustering result both for the protein andDLBCL-B datasets. Ensemble approach finds better C-rand value, 0.157 than values byK-means and C-means, 0.127 for the protein dataset. Ensemble approach also finds the bestC-rand value, 0.135 compared to values generated by individual clustering algorithms, 0.021,0.063, 0.098. However, the ensemble approach makes S values worse in most cases.
Dataset Method Num. of clusters S value C value
Protein
HC 4 0.344 0.199K-means 4 0.379 0.127C-means 4 0.379 0.127Ensemble 4 0.078 0.157
DLBCL-B
HC 3 -0.034 0.021K-means 3 -0.015 0.063C-means 2 -0.005 0.098Ensemble 3 -0.017 0.135
Table 1. Index values for base and ensemble algorithms
295Ensemble Clustering for Biological Datasets
10 Will-be-set-by-IN-TECH
5. Conclusion
Clustering groups of objects such that similar ones are placed in the same cluster, and inits application to biological datasets are very important in that it can help identificationof natural groups of biological entities that might give insight about biomarkers. In thischapter, we review some clustering algorithms applied to biological data. Ensemble clusteringapproaches for biological data are also reviewed. Implementation of K-means, C-means andHC algorithms and merging of the algorithms using an ensemble frame work are presentedusing two different datasets. The datasets are protein and DLBCL-B. Two different clustervalidation indices, adjusted rand and silhouette, are used for comparing the partitions fromindividual algorithms and ensemble clustering. Investigating Table 1, we conclude thatmerging individual partitions improves C-rand values meaning that ensemble approach findspartitions similar to the real partitions. Ensemble approach is coded as a Java application andavailable upon request.
Acknowledgement
Authors thank Dilip Gautam for his contribution to this chapter. The work of Sadi EvrenSeker was supported by Scientific Research Projects Coordination Unit of Istanbul University,project number YADOP-16728.
Author details
Harun PirimKing Fahd University of Petroleum and Minerals
Sadi Evren SekerIstanbul University, Turkey
6. References
[1] Arora, S., Rao, S. & Vazirani, U. [2009]. Expander flows, geometric embeddings andgraph partitioning, Journal of the ACM 56(2): 1–37.URL: http://doi.acm.org/10.1145/1502793.1502794
[2] Asur, S., Parthasarathy, S. & Ucar, D. [2006]. An Ensemble Approach for ClusteringScale-Free Graphs, KDD-2006 Workshop on Link Analysis, 12th ACM SIGKDD InternationalConference on Knowledge Discovery and Data Mining.
[3] Asur, S., Ucar, D. & Parthasarathy, S. [2007]. An ensemble framework for clusteringprotein–protein interaction networks, Bioinformatics 23(13): 29–40.URL: http://dx.doi.org/10.1093/bioinformatics/btm212
[4] Asyali, M. H., Colak, D., Demirkaya, O. & Inan, M. S. [2006]. Gene expression profileclassification: A review, Current Bioinformatics pp. 55–73.URL: http://dx.doi.org/10.2174/157489306775330615
[5] Avogadri, R. & Valentini, G. [2009]. Fuzzy ensemble clustering based onrandom projections for dna microarray data analysis, Artificial Intelligence in Medicine45(2-3): 173–183. URL: http://dx.doi.org/10.1016/j.artmed.2008.07.014
[6] Bandyopadhyay, S., Mukhopadhyay, A. & Maulik, U. [2007]. An improved algorithm forclustering gene expression data, Bioinformatics 23(21): 2859–2865.
296 Bioinformatics
Ensemble Clustering for Biological Datasets 11
[7] Bezdek, J. C. [1981]. Pattern Recognition with Fuzzy Objective Function Algorithms, KluwerAcademic Publishers, Norwell, MA, USA.
[8] Fisher, R. A. [1936]. The use of multiple measurements in taxonomic problems, AnnalsEugen. 7: 179–188.
[9] Frank, A. & Asuncion, A. [2010]. UCI machine learning repository.URL: http://archive.ics.uci.edu/ml
[10] Fred, A. L. N. & Jain, A. K. [2005]. Combining multiple clusterings using evidenceaccumulation, IEEE Transaction on Pattern Analysis and Machine Intelligence 27: 835–850.
[11] Galluccio, L., Michel, J.J., O., Comon, P., Hero, A. O. & Kliger, M. [2009]. Combiningmultiple partitions created with a graph-based construction for data clustering,Proceedings of IEEE International Workshop on Machine Learning for Signal Processing,Grenoble, France, pp. –.
[12] Geraci, F., Leoncini, M., Montangero, M., Pellegrini, M. & Renda, M. E. [2009]. K-boost: ascalable algorithm for high-quality clustering of microarray gene expression data, Journalof Computational Biology 16(6): 859–873.
[13] Ghazalpour, A., Doss, S., Zhang, B., Wang, S., Plaisier, C., Castellanos, R., Brozell, A.,Schadt, E. E., Drake, T. A., Lusis, A. J. & Horvath, S. [2006]. Integrating genetic andnetwork analysis to characterize genes related to mouse weight, PLoS Genetics 2(8).URL: http://dx.plos.org/10.1371
[14] Ghouila, A., Yahia, S. B., Malouche, D., Jmel, H., Laouini, D., Guerfali, F. Z. & Abdelhak,S. [2009]. Application of multi-som clustering approach to macrophage gene expressionanalysis, Infection, Genetics and Evolution 9(3): 328–336.
[15] Glover, F. W. & Kochenberger, G. [2006]. New optimization models for data mining,International Journal of Information Technology and Decision Making 5(4): 605–609.
[16] Gumus, E., Kursun, O., Sertbas, A. & Ustek, D. [2012]. Application ofcanonical correlation analysis for identifying viral integration preferences, Bioinformatics28(5): 651–655.
[17] Gungor, Z. & Unler, A. [2008]. K-harmonic means data clustering with tabu-searchmethod, Applied Mathematical Modelling 32(6): 1115–1125.
[18] He, Y. & Hui, S. C. [2009]. Exploring ant-based algorithms for gene expression dataanalysis, Artificial Intelligence in Medicine 47(2): 105–119.
[19] Heath, J. W., Fu, M. C. & Jank, W. [2009]. New global optimization algorithms formodel-based clustering, Computational Statistics and Data Analysis 53(12): 3999–4017.
[20] Hore, P., Hall, L. O. & Goldgof, D. B. [2009]. A scalable framework for cluster ensembles,Pattern Recognition 42(5): 676–688.URL: http://dx.doi.org/10.1016/j.patcog.2008.09.027
[21] Hoshida, Y., Brunet, J. P., Tamayo, P., Golub, T. R. & Mesirov, J. P. [2007]. Subclassmapping: Identifying common subtypes in independent disease data sets, PLoS ONE2(11): 1195.URL: http://dx.plos.org/10.1371
[22] Hu, X. & Yoo, I. [2004]. Cluster ensemble and its applications in gene expression analysis,Proc. 2nd conference on Asia-Pacific bioinformatics (APBC’04), Australian Computer Society,Inc., Darlinghurst, Australia, Australia, pp. 297–302.
[23] Hubert, L. & Arabie, P. [1985]. Comparing partitions, Journal of Classification 2: 193–218.10.1007/BF01908075. URL: http://dx.doi.org/10.1007/BF01908075
[24] Huttenhower, C., Flamholz, A. I., Landis, J. N., Sahi, S., Myers, C. L., Olszewski, K. L.,Hibbs, M. A., Siemers, N. O., Troyanskaya, O. G. & Coller, H. A. [2007]. Nearest neighbor
297Ensemble Clustering for Biological Datasets

12 Will-be-set-by-IN-TECH
networks: clustering expression data based on gene neighborhoods, BMC Bioinformatics8(250): 1–13.
[25] Kim, J. & Choi, S. [2006]. Semidefinite spectral clustering, Pattern Recognition39: 2025–2035.
[26] Langfelder, P., Zhang, B. & Horvath, S. [2008]. Defining clusters from a hierarchicalcluster tree: the dynamic tree cut package for r, Bioinformatics Applications Note24(5): 719–720.
[27] Mangasarian, O. L. & Wolberg, W. H. [1990]. Cancer diagnosis via linear programming,23(5): 1–18.
[28] Mitra, S., Das, R., Banka, H. & Mukhopadhyay, S. [2009]. Gene interaction - anevolutionary biclustering approach, Information Fusion 10: 242–249.
[29] Newman, M. E. J. & Girvan, M. [2004]. Finding and evaluating community structure innetworks, Physical Review E 69(026113): 1–15.
[30] Phan, V., George, E. O., Tran, Q. T. & Goodwin, S. [2009]. Analyzing microarray datawith transitive directed acyclic graphs, Journal of Bioinformatics and Computational Biology7(1): 135–156.
[31] Rousseeuw, P. [1987]. Silhouettes: A graphical aid to the interpretation and validation ofcluster analysis, Journal of Computational and Applied Mathematics 20(1): 53–65.URL: http://dx.doi.org/10.1016/0377-0427(87)90125-7
[32] Saha, S. & Bandyopadhyay, S. [2009]. A new point symmetry based fuzzygenetic clustering technique for automatic evolution of clusters, Information Sciences179(19): 3230–3246.
[33] Tseng, G. C. [2007]. Penalized and weighted k-means for clustering with scatteredobjects and prior information in high-throughput biological data, Bioinformatics23(17): 2247–2255.
[34] Wang, S. & Zhu, J. [2008]. Variable selection for model-based high-dimensional clusteringand its application to microarray data, Biometrics 64(2): 440–448.
[35] Wang, T. [2009]. Comparing hard and fuzzy c-means for evidence-accumulationclustering, Proceedings of the 18th international conference on Fuzzy Systems, FUZZ-IEEE’09,IEEE Press, Piscataway, NJ, USA, pp. 468–473.URL: http://dl.acm.org/citation.cfm?id=1717561.1717643
[36] Watts, D. J. & Strogatz, S. H. [1998]. Collective dynamics of ’small-world’ networks,Nature 393(6684): 440–442.URL: http://dx.doi.org/10.1038/30918
298 Bioinformatics