energy transfer in spectrally inhomogeneous light-harvesting pigment-protein complexes of purple...
TRANSCRIPT

Biophysical Journal Volume 69 December 1995 2211-2225
Energy Transfer in Spectrally Inhomogeneous Light-HarvestingPigment-Protein Complexes of Purple Bacteria
S. Hess,* E. Akesson,A R.J. Cogdell,5 T. Pullerits,* and V. Sundstr6m**Department of Chemical Physics, Lund University, S-221 00 Lund, Sweden; *Department of Physical Chemistry, Ume& University, S-90187 UmeA, Sweden; and §Division of Biochemistry and Molecular Biology, Glasgow University, Glasgow G12 8QQ, UK
ABSTRACT Energy transfer within the peripheral light-harvesting antenna of the purple bacteria Rhodobacter sphaeroidesand Rhodopseudomonas palustris was studied by one- and two-color pump-probe absorption spectroscopy with -1 00-fstunable pulses at room temperature and at 77 K. The energy transfer from B800 to B850 occurs with a time constant of 0.7+ 0.05 ps at room temperature and 1.8 ± 0.2 ps at 77 K and is similar in both species. Anisotropy measurements suggesta limited but fast B800 <-> B800 transfer time ( 0.3 ps). This is analyzed as incoherent hopping of the excitation in a system
of spectrally inhomogeneous antenna pigment-protein complexes, by a master equation approach. The simulations showthat the measured B800 dynamics is well described as energy transfer with a characteristic average nearest-neighborpairwise transfer time of 0.35 ps among -10 Bchl molecules in a circular arrangement, in good agreement with the recenthigh-resolution structure of LH2. The possible presence of fast intramolecular relaxation processes within the Bchl a moleculewas investigated by measurement of time-resolved difference absorption spectra and kinetics of Bchl a in solution and inlow-temperature glasses. From these measurements it is concluded that fast transients observed at room temperature aredue mainly to solvation processes, whereas at 77 K predominantly slower (>10-ps) relaxation occurs.
INTRODUCTION
We report the time-resolved study of two purple bacteria,Rhodobacter (Rb.) sphaeroides and Rhodopseudomonas(Rps.) palustris. These photosynthetic bacteria hold twolight-harvesting antenna systems, a peripheral antenna(LH2) and a core antenna (LH1), which surround the reac-tion center. The LH2 antenna has absorption maxima at 800and 850 nm (usually designated B800 and B850), and theabsorption band of the LH1 antenna has a maximum at 875nm. Several biochemical, spectroscopic, and electron mi-croscopy studies have given insight into the polypeptideorganization in vivo (Kramer et al., 1984a,b; Hunter et al.,1988; Braun and Scherz, 1991; Visschers et al., 1991;Boonstra et al., 1993). Most spectral properties could beexplained with an (af3)2 unit holding two Bchl 800, fourBchl 850, and three carotenoid molecules. The differentabsorption bands of these pigment-protein complexes orig-inate from interactions between Bchl molecules and thedistinctive protein surrounding of the pigment molecules.Very recently the three-dimensional structure of a LH2complex from Rps. acidophila was solved to high resolution(McDermott et al., 1995), showing a ninefold circular sym-metry of af3 pairs. It will be interesting to analyze in thefuture the detailed role of this highly symmetric unit in theenergy transfer of the LH2 antenna.
Energy transfer in photosynthetic purple bacteria hasbeen extensively investigated by picosecond (Borisov et al.,
Received for publication 25 April 1995 and in final form 21 July 1995.Address reprint requests to Dr. Villy Sundstrom, Department ofChemical Physics, University of Lund, P.O. Box 124, S-22100Lund, Sweden. Tel.: 46-46-222-4690; Fax: 46-46-222-4848; E-mail:[email protected].© 1995 by the Biophysical Society0006-3495/95/12/2211/15 $2.00
1985; Sundstrom et al., 1986; Bergstrom et al., 1986; VanGrondelle et al., 1987; Bergstrom et al., 1988; Freiberget al., 1989; Shimada et al., 1989; Timpmann et al., 1991;Sundstrom and van Grondelle, 1992; Zhang et al., 1992;Visscher et al., 1993) and more recently by femtosecond(Hess et al., 1993; Chachisvilis et al., 1994) time-resolvedspectroscopy. In particular, B800 to B850 energy transfer inthe light-harvesting antenna of Rb. sphaeroides has beenthoroughly studied (Shreve et al., 1991; Hess et al., 1994).With picosecond pulses it was concluded that the
B800-*850 energy transfer in Rb. sphaeroides occurs on apicosecond time scale and is temperature dependent; atroom temperature it occurs with a characteristic time con-stant of - 1 ps, and it becomes somewhat slower (-2 ps)at 77 K (Sundstrom et al., 1986; Freiberg et al., 1989;Bergstrom et al., 1986; van Grondelle et al., 1987). Shreveet al. (1991) measured the rise time of the B850 bleachingafter excitation of B800 in a LH2 complex of Rb. sphae-roides, but, because of the relatively high excitation densityused in their experiment, the rise-time kinetics were dis-torted by singlet-singlet annihilation within the B850 an-tenna, and they were able to obtain only an estimate of theB800->B850 transfer time as >0.4 ps. Combining thisresult with the 0.7-ps decay time that they measured for theB800 excited state, these authors concluded that the energytransfer from B800 to B850 occurs with a 0.7-ps timeconstant at room temperature. In the measurements byShreve et al. (1991) the rise time of the B850 excited statewas probed at only one wavelength. However, in probingthis rise time following B800 excitation it is also necessaryto consider the internal dynamics of B850 to obtain acomplete picture of the B800--B850 transfer. This can bedone by probing the B850 dynamics over a wide range ofwavelengths. More recent time-resolved measurements with
2211

Volume 69 December 1995
-100-fs resolution gave values of the B800 excited-state(B800*) decay time of 0.6 ± 0.1 ps at room temperature and2.4 ± 0.4 ps at 77 K (Sundstrom and van Grondelle, 1992;Hess et al., 1993). Hole-burning experiments at -4Kyielded B800* lifetimes similar to those obtained fromtime-resolved experiments at 77 K; hole widths correspond-ing to 2.3-2.5 ps were reported by Van der Laan et al.(1990, 1993), Reddy et al. (1991), and de Caro et al. (1994).The extent of B800 <-> B800 energy transfer has been
much more difficult to resolve because of the short excited-state lifetime of B800. Picosecond measurements at 77 Ksuggested only little B800 <-+ B800 energy transfer (vanGrondelle et al., 1987), whereas steady-state fluorescencepolarization measurements with Qx excitation at 4 K indi-cated extensive depolarization of the B800 excited state(Kramer et al., 1984a). Measurements at room temperaturewith -100-fs resolution showed that depolarization withinB800 occurs with a time constant of 0.8-1.5 ps (Hess et al.,1993). In these measurements a very fast -0.3-ps decaywas also observed in the isotropic kinetics, which appearedto have no counterpart in the anisotropy decay. It wastherefore suggested that this fast phase could correspond tovibrational relaxation or energy transfer between close-to-parallel B800 molecules, whereas additional B800 <-* B800transfer occurs with the slower time constant 0.8-1.5 ps.The nonexponential B800 excited-state decay kinetics (Hesset al., 1993) and wavelength-dependent hole widths in thehole-burning experiments (de Caro et al., 1994) make theunambiguous assignment of the B800 excited-state decaytimes to B800->B850 energy transfer difficult. The addi-tional faster decay component could, e.g., be due to aheterogeneous B800-i-B850 and/or B800 <-> B800 energytransfer from a spectrally inhomogeneous B800 or to other(non-energy-transfer-related) relaxation processes, e.g., vi-brational relaxation, within B800. In addition, the funda-mental difficulties in fitting of multiexponential decaycurves (James and Ware, 1985) make it problematic toextract unambiguous lifetimes out of complex experimentaldata.To obtain a clear assignment of the energy-transfer pro-
cesses within LH2 from this kind of time-resolved experi-ment it is therefore necessary to measure the kinetics over awide spectral range and at sufficiently low excitation energyto avoid singlet-singlet (van Grondelle, 1985) and singlet-triplet (Valkunas et al., 1991) annihilation. With the inten-tion of unequivocally determining the pathways of energytransfer within the LH2 complex and the characteristic timeconstants for each process, we have performed femtosecondtransient absorption measurements probing the dynamics inboth the B800 and the B850 absorption bands, followingexcitation of B800 at room temperature and at 77 K. Mea-surements were also performed on Bchl a in solution and inlow-temperature glasses to examine the possible influenceof solvation dynamics and vibrational relaxation on themeasured kinetics. The present experiments combined withcomputer simulations of the energy equilibration within
process, the energy equilibration within B800, and the con-
sequences of spectral inhomogeneity for the energy-transferdynamics.
This paper is structured as follows: The experimentalprocedures are outlined, and then we describe and discussthe results of measurements on Bchl a in solution and inlow-temperature glasses. The energy transfer from B800 toB850 is thoroughly examined in one- and two-color exper-iments. We describe various experimental results pertinentto the dynamics within B800 and perform the computersimulations of the same process. We conclude with a dis-cussion of the results.
MATERIALS AND METHODS
Both one- and two-color femtosecond pump-probe measurements were
performed in four different experimental arrangements. One set of mea-
surements was based on the low-energy nanojoule and high-repetition-ratetunable infrared pulses from a mode-locked Ti:sapphire laser, and anothermeasurement setup used the visible amplified microjoule 1-kHz pulsesfrom a dye laser system.
Low-energy transient absorption withsub-100-fs resolution
To gain further knowledge concerning the energy transfer and relaxationprocess within B800 we measured the B800 kinetics in two slightlydifferent absorption pump-probe experiments, using either spectrally inte-grated or dispersed detection of the probe. For both measurements an
argon-ion laser delivering 11 W of power was used to pump a self-mode-locked Ti:sapphire laser with tunability in the spectral region 720-850 nm.
With this system -80-fs pulses at a 82-MHz repetition rate and 1-W outputpower were generated. To reduce accumulation of long-lived photoprod-ucts and heating of the sample, the pulse repetition rate was decreased to800 kHz with an acousto-optic pulse selector; and to avoid damage to theBragg cell in the pulse selector the pulses were first stretched to -300 fs.After the pulse selector the pulses were recompressed with a home-builtcompressor, which consists of a pair of SF-10 dispersion prisms. Theresulting pulses had an -I00-fs autocorrelation with a spectral bandwidthof -10 nm, corresponding to an -70-fs Gaussian transform-limited pulse.The spectrum was displayed by a grating polychromator connected to a
CCD camera, and the pulse width was measured by the second-harmonic-generation autocorrelation technique.
For the integrated pump-probe measurements the laser beam was splitinto two parts by a 90/10 beam splitter, and the more intense beam was
used to excite the sample while the weaker beam was used as an analyzinglight. The excitation and analyzing beams were focused to a common spotof -50-,lm diameter; the probe beam had a slightly smaller size. Amaximum pulse energy of 0.8 nJ was used, corresponding to a photondensity of -1 X 10¹⁴ photons cm-2 pulse-'. Experiments were alsoperformed at tenfold-lower excitation energy, with no noticeable differ-ences in measured kinetics. To record the kinetics, a step-motor-drivendelay line controlled by a PC changes the analyzing pulse's path length.The probe beam intensity was detected by a photodiode and a lock-inamplifier, and as a preliminary characterization the resulting kinetic traceswere analyzed in terms of a sum of exponentials by a least-squares fittingprocedure including deconvolution with the measured pulse autocorrela-tion function. A schematic representation of this experimental setup isshown in Fig. 1. As is described below, a more detailed analysis of themeasured kinetics was performed by use of a master equation descriptionof the energy transfer in a spectrally inhomogeneous antenna.
To enhance the spectral resolution, two-color measurements were alsoperformed in a dispersed arrangement. For this purpose we used the same
B800 allow us to characterize the B800->B850 transfer
2212 Biophysical Journal
experimental setup as in the integrated one-color measurements, but a

Inhomogeneous B800
phoodiode I------t
monochromator
FIGURE 1 Schematic diagram of lasers and optics for a one-color time-resolved absorption experimental setup for the magic angle and anisotropyexperiments at room temperature and 77 K.
monochromator with a I-nm detection bandwidth was placed after thesample. Inasmuch as the spectral filtering is performed after the sample thiswill not influence the temporal resolution of the experiments, but care hasto be exercised with spectral oscillations that may arise in the wings of thepulse spectrum (Chachisvilis et al., 1995a) because of the free inductiondecay of the polarization induced by the probe pulses.
Femtosecond two-colorpump-probe experiments
Two different types of two-color pump-probe arrangement were used: an
amplified dye laser and a Ti:sapphire laser pumped optical parametricoscillator (OPO).
Amplified femtosecond dye laser system
This transient absorption spectrometer has been described elsewhere(Aberg et al., 1994), so only a brief account will be given here. Weexamined the dynamics of Bchl a in solution by measuring both thespectral evolution and the transient absorption kinetics at selected wave-
lengths. For both types of measurement we used a single-jet dye lasersynchronously pumped by the compressed and frequency-doubled pulsesfrom a cw Nd:YAG laser (82 MHz, 3 ps, 532 nm, 1.1 W). With an
appropriate dye and optics combination this dye laser delivers 250-350-fstunable pulses in the range 570-700 nm. For the present measurements,R6G was used as the gain medium and the tuning element was a one-platebirefringent filter. This yielded 300-fs pulses (FWHM) at 590 nm with an
average power of 250 mW at 82 MHz. The duration of the dye laser pulseswas further reduced to 75 fs (75 mW) by a fiber-prism compressor. Thesepulses were then amplified 10,000-fold in a two-stage dye amplifierpumped longitudinally by a regenerative YAG amplifier working at 1 kHz.Kiton Red in methanol was used as the gain medium in both stages of theamplifier. The amplifier output was -20 ,LJ/pulse at 590 nm with 200-fspulses. The pulses from the amplifier were divided by a 50/50 beam splitterinto two parts, one for excitation of the sample and the other generating a
white-light continuum to serve as tunable analyzing light from 350 to 900nm. The continuum light was divided by a 50/50 beam splitter to give an
analyzing beam probing the transmission changes of the sample and a
reference beam to allow for compensation of intensity fluctuations in theprobe light. All three beams, excitation, analyzing, and reference, were
focused into the sample with a lens of 100-mm focal length. Only theexcitation and analyzing beams were overlapped in space inside the sam-
ple, with the excitation beam -25% larger than the analyzing beam. Amonochromator after the sample selected the analyzing (and reference)wavelength, and the excitation beam was blocked. Two photodiodes afterthe monochromator monitored the analyzing and reference light beams. Achopper was placed in the excitation light so the signal recorded was
log(/Iref)w.o ex- lOg(I/Iref)wex.- In this way each analyzing pulse was
individually detected and normalized. The excitation pulse energy was also
measured, and only data obtained with pulses within a preset intensityrange were accepted.
Transient absorption kinetics at a particular probe wavelength weremeasured by stepping the optical delay line in the excitation beam path, fora fixed setting of the probe monochromator. In measuring time-resolveddifference absorption (AA) spectra care has to be taken to avoid errors fromthe wavelength chirp that are due to group-velocity dispersion in thecontinuum. This gives a wavelength dependence of time 0 when differentparts of the continuum arrive at the sample at different times. To correct forthe effect, the delay in the excitation beam was moved according to a presetcalibration while a spectrum was recorded. The calibration of the disper-sion was made by measuring time 0 in different dye solutions and two-photon absorption in diphenyl hexatriene at different wavelengths. Theresult was fitted to an analytical expression that was used to move the delayline. The accuracy of zero time is estimated to be within 100 fs over thespectral range used in the present measurements, and the time resolution ofthe kinetic measurements (analyzed by least-squares fitting a sum ofexponentials convoluted with the apparatus response function) is approx-imately 200 fs.
Ti:sapphire optical parametric oscillatorfemtosecond system
To examine directly the transfer of excitation energy from B800 to B850in Rb. sphaeroides free from exciton annihilation, low-energy femtosecondTi:sapphire pulses were used. The excitation and independently tunableprobe pulses were generated with a synchronously pumped OPO. Whenthis OPO was pumped by the 82-MHz pulse train of the Ti: sapphire laser,it generated two new output wavelengths, the signal ( 300 mW) and theslightly less powerful idler (- 200 mW). The total wavelength coverage ofthe OPO is from 1.1 to 2.6 p.m, and with -80-fs pump pulses cross-correlation pulses with the pump of -100 and - 130 fs were measured forthe signal and the idler pulses, respectively. The good synchronizationamong the pump, signal, and idler pulses with this system permits themeasurement of femtosecond pump-probe absorption kinetics.
To measure the direct energy transfer from B800 to B850 we excited thesample at -807 nm by using the residual pump light reflected from thefront surface of the LBO crystal in the OPO (see Fig. 2). Probe pulsestunable over the range 830- 875 nm were generated by frequency doublingthe idler pulses in a BBO crystal. The 1-mm path length of the crystalcaused a broadening of the apparatus response function to - 190 fs.
FIGURE 2 Experimental arrangement used for direct observation of theB800--B850 energy transfer in the LH2 antenna complex of Rb.spha-eroides WT at room temperature, based on a femtosecond OPO pumped bya mode-locked Ti:sapphire laser.
Hess et al. 2213

Volume 69 December 1995
Sample treatment
The energy-transfer properties were measured in intact chromatophores ofRb. sphaeroides and Rps. palustris LL at room temperature and at 77 K.Preparation of the chromatophores was described in detail previously(Sundstrom et al., 1986; Bergstrom et al., 1986). Briefly, the chromato-phores were prepared from cells by sonication and diluted in 50-mM TRISbuffer solution at pH 8.0 to yield a solution of the desired optical density,-0.6. Room-temperature measurements were performed with the samplein a spinning cell, and for the 77-K measurements a liquid-nitrogen cryostat(Oxford Instruments Ltd., Oxford, UK) was used, with the sample in astationary 1-mm cell. To obtain a glass of good optical quality we mixedthe membrane suspensions with glycerol (70% glycerol and 30% prepara-tion). The excited-state dynamics of Bchl a were measured in alcoholsolutions; for these measurements a 1-mm flow cell was used at roomtemperature to reduce photodegradation of the sample, and the measure-ments at 77 K were performed in a 1-mm stationary cell cooled by anOxford Instruments liquid-nitrogen cryostat. Spectroscopic-grade solventswere used in all measurements.
Bchl a IN SOLUTION AND INLOW-TEMPERATURE GLASSES
Earlier studies of energy transfer in B800 revealed a fastsubpicosecond decay component of the B800 excited state(-300 fs at room temperature) that appeared to have nocorresponding lifetime in the anisotropy decays (Hess et al.,1993). It was suggested that this fast component could bedue to some internal relaxation within Bchl a, such asvibrational relaxation and cooling instead of energy transferwithin B800. From time-resolved measurements of dyemolecules it is known that processes such as solvation(Maroncelli et al., 1989), vibrational relaxation (Elsaesserand Kaiser, 1991), and conformational changes and dissi-pation of excess vibrational energy (Aberg et al., 1994) maygive rise to subpicosecond and picosecond transients intime-resolved fluorescence and ground-state absorptionmeasurements. In this study we are interested in determin-ing whether such fast relaxation processes exist in the Bchla molecule and whether they could obscure the results fromstudies of energy transfer in purple bacteria. To discriminatethe intramolecular relaxation processes from those associ-ated with energy transfer we performed measurements onBchl a in solution, in the absence of energy transfer.
In this study the Qx band was excited with 590-nm -200fs pulses and difference absorption kinetics and spectrawere measured in the wavelength region of the Qy absorp-tion and fluorescence bands of Bchl a. From the kineticmeasurements we can see that there exist relaxation pro-cesses that are far faster than the decay of the excited stateon a nanosecond time scale. In Fig. 3, three kinetic traces ofBchl a in methanol at different analyzing wavelengths arepresented. At the blue side of the Qy absorption maximum(740 nm) we can see an initial bleach that is rapidly relaxingto a constant level. This relaxation is best characterized bytwo lifetimes, -1 and -10 ps. If the analyzing wavelengthis shifted toward the red within the Qy band, the amplitudesof the fast decays are reduced, and kinetics with rise timessimilar to the decay times at the shorter wavelengths are
0 10 2
Time (ps)
FIGURE 3 Two-color transient absorption measurements of Bchl a inmethanol at room temperature. The experiments were performed by excit-ing at 590 nm and probing at 740, 760, and 800 nm. The kinetics werefitted to a sum of three exponentials, giving T1 = 1.1 ps (A1 = -1.35), T2= 8.1 ps (A2 = -1.52), and T3 2 100 ps (A3 =-5.0) at 740 nm; T, =1.2 ps (A1 = 0.2), T2 = 17.2 ps (A2 = 0.9), and T3 100 ps (A3 = -1.20)at 760 nm; and T1 = 1.6 ps (Al = 0.2), T2 = 18.1 ps (A2 = 0.5), and T32 100 ps (A3 = -1.23) at 800 nm.
the ground-state absorption maximum (kinetic traces at 760and 800 nm of Fig. 3).The origin of the kinetics becomes clearer from the
transient absorption difference spectra of Fig. 4. A spectral
750
Wavelength (nm)
FIGURE 4 Transient absorption spectra of Bchl a in a methanol/acetonesolution at room temperature after excitation at 590 nm.observed at probe wavelengths longer than approximately
2214 Biophysical Journal

Inhomogeneous B800
evolution occurs on a femt(implying a narrowing and ameasured transient spectruground-state bleaching (-(-780 nm), and excited-staserved spectral shifts andquently be a measure of rela,excited and the ground ele(excited molecule is known tfluorescence (stimulated ersorption spectra, whereas v
expected to produce mainlyand Kaiser, 1991; Savikhinspectral shifts owing to the v
in Bchl a (Reddy et al., 199bleached band is plotted versred shift on two time scal-10-20 ps (A = 36%), is (
anol/acetone mixture. For Etions are similar, but the fastfactor of 2 slower (1.3 ps),;of the slower component (AOne usually measures p
various dye molecules. Theof the polar solvent and ideamolecule. Solvation dynamihacterized by nonexponentialtimes, T1 1 ps and T2for butanol the correspondin
12900
E 12800 -
C)su
r.S
S 12700 -
126000 20
FIGURE 5 Time dependence of
bleached band of Bchl a in two dif
butanol, at room temperature. The
exponentials, resulting the following65 ± 5%) and T2 = 10-20 ps (A2mixture and T, = -1.3 + 0.3 ps ((A2 = 55 + 5%) for butanol.
)second-picosecond time scale, T2 100 ps (Castner et al., 1987; Weaver et al., 1990). Thisred shift of the spectrum. The suggests that the -1- and 10-20-ps relaxation processesim is a compound result of observed in our measurements of Bchl a in solution at room770 nm), stimulated emission temperature may originate from spectral changes that areLte absorption (<725 nm). Ob- related to the solvation of the Bchl a excited state.kinetic transients will conse- In our experiments we excite the Qx electronic transitionxation processes within both the of Bchl a with 590-nm laser light. This produces a largectronic states. Solvation of the excess vibrational energy when the molecule relaxes to theto produce spectral shifts of the Qy state. The vibrational relaxation following the Qx -Qymission) and excited-state ab- transition and cooling of the resulting nonequilibrium vi-ibrational relaxation/cooling is brational distribution may give rise to spectral shifts on timea spectral narrowing (Elsaesser scales of subpicoseconds to tens of picoseconds (Elsaesserand Struve, 1994) and fewer and Kaiser, 1991). In an attempt to distinguish between
weak electron-phonon coupling solvation and vibrational relaxation/cooling we measured)1). When the maximum of the the picosecond dynamics of Bchl a in a frozen solvent,sus time, (Fig. 5), a fast spectral ethanol at 77 K. In principle, our kinetic measurements[es, -0.7 ps (A = 64%) and should also contain a kinetic component corresponding toobserved for Bchl a in a meth- the S2 -_ S1 internal conversion process. This relaxation is3chl a in butanol the observa- fast, and from recent measurements of bacterial reactiont component is approximately a centers (Du et al, 1992; Jia et al., 1995) it appears likely thatand there is a higher amplitude it is characterized by an - 150-fs time constant. Considering= 57%). the present time resolution of -200 fs and the already
olar solvation times by using complex kinetics that result from solvation and vibrationalsolvation time is characteristic relaxation/cooling, we did not attempt to resolve this relax-illy is independent of the probe ation process separately in our measured kinetics; it iscs in alcohols is generally char- included in the fast 0.5-1-ps component that we observe. Atkinetics; for methanol two life- 77 K ethanol forms a glass, so the contribution of solvent10 ps, have been obtained, and relaxation to the spectral changes is minimized on theg lifetimes are T1 20 ps and picosecond time scale. Bchl a is sensitive to light and tends
to photodegrade, as mentioned earlier. Therefore, in thelow-temperature measurements care was taken to use as lowlight intensities as possible, and the sample was translatedperpendicular to the beam while the measurement wasmade. We performed measurements with different excita-
ia in solution tion energies by placing neutral-density filters in the path ofK the excitation beam. Because of the photosensitivity of the
sample it was not possible to measure the spectral evolutiondirectly, as measurements of transient spectra require very
-.Methanol-Acetone stable absorption spectra (i.e., no slow changes resultingButanol from degradation) over quite a long measuring time. From
the room-temperature measurements we know that the ef-fect of the spectral change is most pronounced on the blueside of the bleaching maximum, so if spectral shifts ornarrowing is present at 77 K we expect it to be most easily
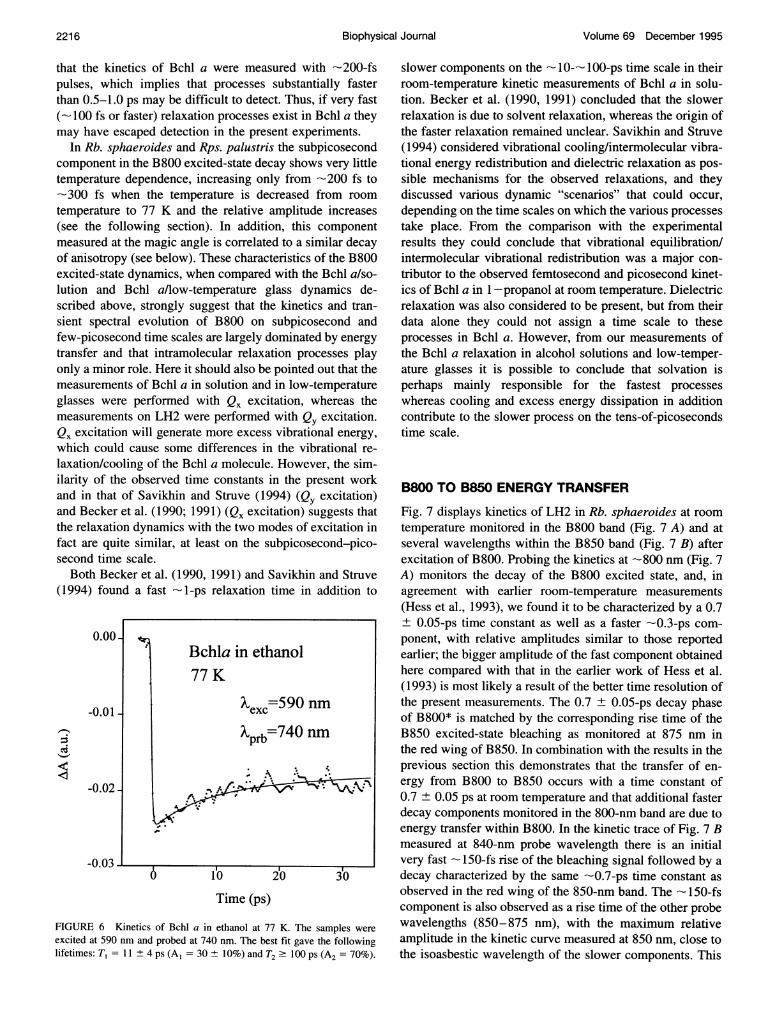
.___ _ revealed in a kinetic measurement near 740-750 nm. Ascan be seen from the kinetics in Fig. 6, there is somerelatively slow relaxation with a 10 ± 3-ps time constant inthis wavelength region. These results suggest that there exist
40 60 80 100 vibrational relaxation and cooling processes on a time scaleTime (ps) similar to that of the slower parts of the solvation dynamics,
i.e., -10 ps. But the faster -1 ps component observed atthe position of the maximum of the room temperature appears now to be absent. Relaxationfferent solvents, methanol/acetone and processes on a time scale of -10 ps observed by spectraldecays were fitted by a sum of two hole burning at a very low temperature (Avarmaa andlifetimes: T, = -0.7 ± 0.3 ps (A, -a 35 5%) for the methanos(Al/acet = Rebane, 1985) were interpreted in a similar way. We notice
'A = 45 + 5%) and T = 10-20 p that these processes are considerably slower than the ener-gy-transfer processes of interest here. It has to be mentioned
IT BchI 300
0.
Hess et al. 2215
Volume 69 December 1995
that the kinetics of Bchl a were measured with -200-fspulses, which implies that processes substantially fasterthan 0.5-1.0 ps may be difficult to detect. Thus, if very fast(-100 fs or faster) relaxation processes exist in Bchl a theymay have escaped detection in the present experiments.
In Rb. sphaeroides and Rps. palustris the subpicosecondcomponent in the B800 excited-state decay shows very littletemperature dependence, increasing only from -200 fs to-300 fs when the temperature is decreased from roomtemperature to 77 K and the relative amplitude increases(see the following section). In addition, this componentmeasured at the magic angle is correlated to a similar decayof anisotropy (see below). These characteristics of the B800excited-state dynamics, when compared with the Bchl a/so-lution and Bchl a/low-temperature glass dynamics de-scribed above, strongly suggest that the kinetics and tran-sient spectral evolution of B800 on subpicosecond andfew-picosecond time scales are largely dominated by energytransfer and that intramolecular relaxation processes playonly a minor role. Here it should also be pointed out that themeasurements of Bchl a in solution and in low-temperatureglasses were performed with Qx excitation, whereas themeasurements on LH2 were performed with Qy excitation.Qx excitation will generate more excess vibrational energy,which could cause some differences in the vibrational re-laxation/cooling of the Bchl a molecule. However, the sim-ilarity of the observed time constants in the present workand in that of Savikhin and Struve (1994) (Qy excitation)and Becker et al. (1990; 1991) (Qx excitation) suggests thatthe relaxation dynamics with the two modes of excitation infact are quite similar, at least on the subpicosecond-pico-second time scale.
Both Becker et al. (1990, 1991) and Savikhin and Struve(1994) found a fast -1-ps relaxation time in addition to
Time (ps)
FIGURE 6 Kinetics of Bchl a in ethanol at 77 K. The samples were
excited at 590 nm and probed at 740 nm. The best fit gave the followinglifetimes: T, = 11 + 4 ps (A, = 30 + 10%) and T2 ' 100 ps (A2 = 70%).
slower components on the -10--- 100-ps time scale in theirroom-temperature kinetic measurements of Bchl a in solu-tion. Becker et al. (1990, 1991) concluded that the slowerrelaxation is due to solvent relaxation, whereas the origin ofthe faster relaxation remained unclear. Savikhin and Struve(1994) considered vibrational cooling/intermolecular vibra-tional energy redistribution and dielectric relaxation as pos-sible mechanisms for the observed relaxations, and theydiscussed various dynamic "scenarios" that could occur,depending on the time scales on which the various processestake place. From the comparison with the experimentalresults they could conclude that vibrational equilibration/intermolecular vibrational redistribution was a major con-tributor to the observed femtosecond and picosecond kinet-ics of Bchl a in 1-propanol at room temperature. Dielectricrelaxation was also considered to be present, but from theirdata alone they could not assign a time scale to theseprocesses in Bchl a. However, from our measurements ofthe Bchl a relaxation in alcohol solutions and low-temper-ature glasses it is possible to conclude that solvation isperhaps mainly responsible for the fastest processeswhereas cooling and excess energy dissipation in additioncontribute to the slower process on the tens-of-picosecondstime scale.
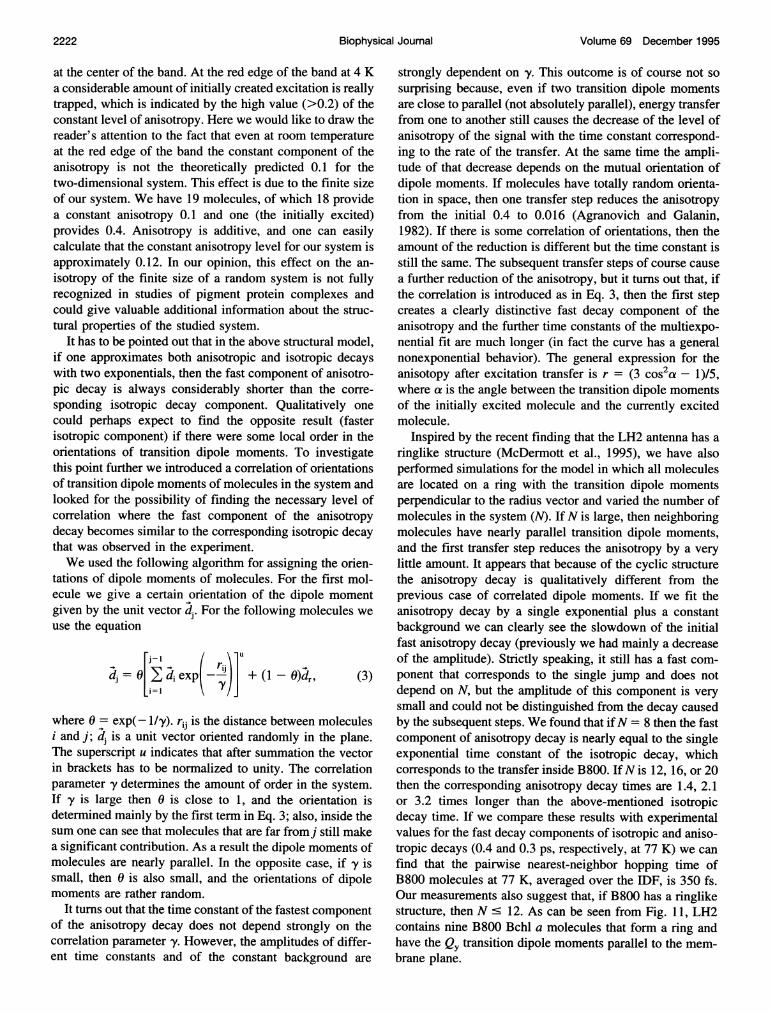
B800 TO B850 ENERGY TRANSFER
Fig. 7 displays kinetics of LH2 in Rb. sphaeroides at roomtemperature monitored in the B800 band (Fig. 7 A) and atseveral wavelengths within the B850 band (Fig. 7 B) afterexcitation of B800. Probing the kinetics at -800 nm (Fig. 7A) monitors the decay of the B800 excited state, and, inagreement with earlier room-temperature measurements(Hess et al., 1993), we found it to be characterized by a 0.7+ 0.05-ps time constant as well as a faster -0.3-ps com-ponent, with relative amplitudes similar to those reportedearlier; the bigger amplitude of the fast component obtainedhere compared with that in the earlier work of Hess et al.(1993) is most likely a result of the better time resolution ofthe present measurements. The 0.7 + 0.05-ps decay phaseof B800* is matched by the corresponding rise time of theB850 excited-state bleaching as monitored at 875 nm inthe red wing of B850. In combination with the results in theprevious section this demonstrates that the transfer of en-ergy from B800 to B850 occurs with a time constant of0.7 ± 0.05 ps at room temperature and that additional fasterdecay components monitored in the 800-nm band are due toenergy transfer within B800. In the kinetic trace of Fig. 7 Bmeasured at 840-nm probe wavelength there is an initialvery fast - 150-fs rise of the bleaching signal followed by adecay characterized by the same -0.7-ps time constant asobserved in the red wing of the 850-nm band. The - 150-fscomponent is also observed as a rise time of the other probewavelengths (850-875 nm), with the maximum relativeamplitude in the kinetic curve measured at 850 nm, close tothe isoasbestic wavelength of the slower components. This
2216 Biophysical Journal

Inhomogeneous B800
A0.6.
0.4-
0.2-
0.0-
B
o
-1 0 1 2
Time (ps)
3 4
Time (ps)
FIGURE 7 A. Magic angle integrated one-color absorption recovery ofRb. sphaeroides WT, measured at 800 nm at room temperature. The solidcurve represents the three-exponential fit with the following lifetimes andamplitudes: T, = 200 50 fs (Al = 1.0), T2 = 0.7 + 0.05 ps (A2 = 0.6),and T3 : 30 ps (A3 =-0.1). B. Transient absorption kinetics of LH2 Rb.sphaeroides WT excited into the B800 band and probed at differentwavelengths within the B850 band at room temperature. The solid curves
are the best fits with the following lifetimes at different wavelengths: at840 nm, T, = 150 fs (Al = -0.3) and T2 0.70 ps (A2 = 1.41); at 850nm, T, = 130 fs (A, = -0.3) and T2 = 0.65 ps (A2 = -0.28); at855 nm, T, = 130 fs (A, = -0.3) and T2 = 0.64 ps (A2 = -0.35);at 865 nm, T, 150 fs (A, =-0.3) and T2 = 0.66 ps (A2 = -0.51); andat 875 nm, T, = 170 fs (A, = -0.3) and T2 = 0.69 ps (A2 = -0.58).
behavior is a result of very fast 100-200-fs energy equili-bration within B850 and could be due either to a Forstertype of incoherent energy transfer among spectrally non-
equivalent (spectral inhomogeneity) B850 molecules or to
relaxation in the strongly coupled B850 pigments. At themoment it is not clear which of these descriptions is morerelevant to B850. This effect is analyzed more thoroughly ina subsequent paper (Hess et al., in press).
At 77 K we monitored the B800->B850 energy transferin Rb. sphaeroides and Rps. palustris by probing the decayof the B800 excited state with spectrally integrated probingat different wavelengths within the B800 band. Magic anglekinetics of Rb. sphaeroides at three different wavelengths,790, 800, and 810 nm, are shown in Fig. 8A. Lifetimes andamplitudes obtained from both Rb. sphaeroides and Rps.palustris are collected in Table 1. The decay of the bleach-ing is, as at room temperature (see Fig. 7 A), clearlynonexponential at all wavelengths but is slower than atroom temperature. The relaxation time corresponding toB800->B850 energy transfer has increased from -0.7to -1.8 ps, whereas the faster subpicosecond lifetime hasbecome only slightly longer, increased from 0.3 to -0.4 ps.The negative induced absorption signal is characterized bya much slower decay time constant, >30 ps, which fromprevious picosecond studies (Zhang et al., 1992) is knownto represent the energy equilibration between the differentantenna systems (LH2 and LH1) and quenching by theclosed reaction centers.
In a complementary set of measurements of the B800*lifetime at 77 K we used a monochromator after thesample to select a narrow spectral region of the signal.Although spectrally broadband excitation is used also inthese experiments, the narrow detection bandwidth re-sults in better spectral resolution of the dynamics. The77-K results of the B800 excited-state decay probed withintegrated and dispersed probe light in the 800-nm bandare summarized in Tables 1 and 2, respectively. As canbe seen, both detection methods yield very similar life-times and wavelength variation of the amplitudes, Ai.These results show that the energy transfer from B800 toB850 at 77 K is similar in Rb. sphaeroides and Rps.palustris (--1.8 ± 0.2 ps), which is reasonable in view ofthe expected structural similarity of the two complexes(Van Mourik et al., 1992). The lengthening of the transfertime from -0.7 ps at room temperature to -1.8 ps at 77K is a result of decreased spectral overlap at low tem-perature and has been discussed previously (Bergstromet al., 1988). The time constant for B800-*B850 energytransfer at 77 K (1.8 ± 0.2 ps) found here is somewhatshorter than the 2.4 ps reported previously (Hess et al.,1994). The main reason for this difference lies in thebasic difficulties of fitting multiexponential decay curves(James and Ware, 1985). The present data cover severalwavelengths, including both one- and two-color measure-ments. In that way various decay components could bebetter resolved. Comparison of the present results andhole-burning results obtained at -4 K shows that theB800-*B850 transfer time slows down somewhat morebelow 77 K, which is in agreement with recent simula-tions of the energy-transfer process (Hess et al., 1994).The simulation results verified and substantiated a pre-
Rb. sphaeroidesroom temperature
X=800 nm
Hess et al. 2217

Volume 69 December 1995
vious suggestion by Reddy et al. (1991) that, at lowtemperature, overlap between the B800 fluorescence anda vibrational feature of B850 is essential in accountingfor the observed energy-transfer rate.
A
Rb. sphaeroides77K
790 nm
0
R00 nm
B0.4-
0.3-
0
° 0.2-.
0.1 -
u.u , I I
0 1 2
Time (ps)
Rb. sphaeroides77 K
1Time (ps)
2
FIGURE 8 A. Magic angle absorption recovery kinetics of the B800band of Rb. sphaeroides, measured at three different wavelengths (790,800, and 810 nm) at 77K. The corresponding lifetimes and amplitudes are
presented in Table 1. B. Anisotropy decay obtained from parallel andperpendicular kinetics of Rb. sphaeroides at 77K at two wavelengths (790and 800 nm). The solid curves represent the best fits with the followingparameters: at 790 nm, T, = 0.3 ± 0.1 ps (A, = 0.12), T2 = 5 ± 1.5 ps
(A2 = 0.08), r(oo) = 0.2; at 800 nm, T, = 0.3 + 0.1 ps (A, = 0.2), T2 =
1.5 .5 ps (A2 = 0.1), r(oo) = 0.1.
TABLE 1 B800* lifetimes at various wavelengths within theB800 absorption band for Rb. sphaeroides and Rps. palustrisat 77 K
A (nm) T, (ps) A1 T2 (ps) A2 T3 (ps) A3Rb. sphaeroides*
790 0.33 1 1.67 0.60 >30 -0.25800 0.46 1 1.80 0.62 >30 -0.31810 0.60 1 1.90 0.64 >30 -0.48
Rps. palustrist790 0.24 1 1.65 0.73 >30 -0.28800 0.32 1 1.76 0.82 >30 -0.39810 0.44 1 1.98 0.86 >30 -0.50
The results were obtained with integrate absorption pump-probe detectiontechnique.*The standard errors are 15% for TI, 10% for T2, and 20% for T3.tThe variations of the lifetimes are 20%, 10%, and 30% for T,, T2, and T3,respectively.
RELAXATION DYNAMICS WITHIN B800
Having established above that energy transfer from B800 toB850 occurs with a time constant of -0.7 ps at roomtemperature and - 1.8 ps at 77 K, we now proceed with thedynamics related to processes within B800. The relaxationin B800 may be either intramolecular (vibronic relaxation,e.g.) or intermolecular (excitation transfer). First we notethat the absence of subpicosecond processes in the excited-state decay of Bchl a in solution at 77 K suggests that the-0.5-ps decay component observed in Rb. sphaeroides andRps. palustris at 77 K originates mainly from energy trans-fer within B800. As molecules in B800 are not identical(different orientation of transition dipole moments, spectralinhomogeneity), the energy transfer can be monitored intwo different ways. Excitation transfer between moleculesof different energy (spectral equilibration) is resolved inisotropic measurements, and the energy transfer betweendifferently oriented chromophores can be monitored bytime-resolved anisotropy (Sundstrom et al., 1986) measure-ments. The relationship between these two observablesyields complementary information about the dynamics andcan be used to deduce information about the degree of orderin the system. In the next section we show how a masterequation model is used to simulate these processes.
Earlier picosecond measurements at 77 K within theB800 band of Rb. sphaeroides (Van Grondelle et al., 1987)indicated that the anisotropy of the B800 excited stateremained quite high throughout its lifetime, suggesting onlylimited energy transfer or energy transfer between close-to-parallel B800 transition dipoles. However, with picosecondresolution it was not possible to resolve any details of thetime dependence of the B800 anisotropy. More recent mea-surements with - 100 fs-pulses on Rb. sphaeroides and Rps.palustris (Hess et al., 1993) revealed that at room temper-ature there is a 0.8-1.5-ps decay of the B800 anisotropy.The fact that the anisotropy decay is slower than the isotro-pic B800 excited-state decay explains the difficulties inresolution of this decay in earlier experiments with lowertime resolution.
2218 Biophysical Journal

Inhomogeneous B800
The results of the present measurements of Rb. spha-eroides at 77 K are illustrated by the polarized kinetics andcalculated anisotropy decays of Figs. 8 A and B, respec-
tively. Qualitatively similar results are obtained for bothspecies at all studied wavelengths within the B800 band.The anisotropy starts very close to the theoretical maximumvalue of 0.4 and decays with a time constant of 0.3 ps to a
lower value r(oo) = -0.15-0.30. Besides the fast compo-
nent there is also a slower ( i1-ps) decay. The value of thelong-time anisotropy r(oo) is wavelength dependent; in thecenter of the absorption band at -800 nm it assumes a
relatively low value (r(oo) = -0.1), whereas in the bluewing of the B800 absorption band it is considerably higher,r(oo) = 0.2-0.25. This suggests that there is more efficientexcitation transfer among the B800 pigment molecules ab-sorbing at the center of the absorption band than among
with those absorbing in the wings of the spectrum. In thefollowing section we show that this behavior is a result ofthe inhomogeneous spectral broadening of B800 and rela-tively narrow homogeneous spectral width at low tempera-ture, which result in trapping of excitations in both wings ofthe inhomogeneous distribution function (IDF).To obtain the anisotropy decay from the measured traces
with parallel and perpendicular probe polarizations, it isnecessary to subtract the negative signal contribution fromthe B850 excited-state absorption. This was done by simu-lating the rise of this signal with the rate of B800->B850energy transfer as obtained from the magic angle measure-
ments of the B800* decay (Tables 1 and 2) (Hess et al.,1993) and assuming that the B850 signal is depolarized afterthe B800->B850 transfer. This appears as a reasonableapproximation considering the pigment organization ofLH2(McDermott et al., 1995) and the fact that B850 depolar-ization (measured with direct B850 excitation (Chachisviliset al. 1995b) is much faster (.200 fs) than the B800excited-state decay. The amplitude of the isotropic 150-fscomponent assigned to energy equilibration within B850 isin addition very low at these wavelengths, far away from theisosbestic wavelength of B850 bleaching.We saw above that the isotropic decay of the B800
excited state (Tables 1 and 2; Fig. 8 A) is characterized byan -0.4-ps time constant at 77 K (-0.3 ps at room tem-perature) in addition to the 1.8 ± 0.2-ps time forB800--B850 transfer (-0.7 ps at room temperature). Thesimilar anisotropy and magic angle decay times along withthe fact that the B800 spectrum is largely characterized byinhomogeneous broadening strongly suggest that the-0.4-ps isotropic decay time is a result of energy transferwithin B800 rather than of, e.g., vibrational relaxation/cooling.As can be seen from Fig. 8 A, we measured the isotropic
decay of B800 in the red wing of the absorption band at-810 nm. To measure the anisotropy decay accurately atthe same wavelength turned out to be more difficult, and wecould not obtain a reliable decay with quality comparablewith that obtained at 790 and 800 nm. The reason for thisproblem is that at this wavelength there is very low absorp-
tion from B800 and the amplitude of B850 excited-stateabsorption is higher. This results in a very fast change ofsign of the parallel and perpendicular signals. We havedeveloped a way to correct our data for the negative signalthat is due to the excited-state absorption (Hess et al., 1993),but it can result in quite a big error if the excited-stateabsorption is too intense. Furthermore, at this wavelengththe B850 is already directly excited to some extent, whichmakes the correction even more problematic. From theexperimental data in this part of the spectrum we cantherefore conclude only that the anisotropy is relatively highat all times (.0.2), but no reliable value of an initial decayphase can be ascertained. However, despite all these prob-lems, what we see is qualitatively in agreement with simu-lations (see the following section).
SIMULATIONS
Master equation and spectral overlap
We describe excitation transfer in B800 as incoherent hop-ping in a two-dimensional spectrally inhomogeneous an-
tenna lattice. Adopting the model of Pullerits and Freiberg(1992), we write down the Pauli master equation, whichdescribes the kinetics of this process, in matrix form as
P(t) = R * P(0). (1)
The rate matrix R contains information about the pairwisetransfer rates and the loss channels. Here the dominatingloss channel is the transfer B800->B850. Correspondingbacktransfer at 77 K as well as other possible loss channels(spontaneous emission, internal conversion, intersystemcrossing) may be considered insignificant in our case.The Green function approach to the solution of the master
equation gives us relatively simple formulas to calculateboth isotropic and polarized experimental signals if thenecessary spectral (inhomogeneous distribution, homoge-neous spectra) and orientational (orientation of the transi-tion dipole moments of the molecules) information of thesystem is provided. The formalism and derivations can befound in Pullerits and Freiberg (1992) and Pullerits et al.(1994c), and we will not repeat them here.
According to the Forster theory (Forster, 1965), the in-coherent excitation transfer rate is proportional to the over-lap integral of the emission spectrum of the donorfD(v) and
TABLE 2 B800* lifetimes for Rb. sphaeroides obtained withthe dispersed absorption pump-probe detection techniqueand measured at 77 K
A (nm) T1 (ps) A1 T2 (ps) A2 T3 (ps) A3
790 0.33 1 2.0 0.4 >30 -0.6800 0.36 1 1.86 0.6 >30 -0.4810 0.39 1 1.63 0.7 >30 -0.2
The given values are averages of five independent measurements with astandard deviation of -20%.
Hess et al. 2219

Volume 69 December 1995
the absorption spectrum of the acceptor EA(v): Absorption
ket CK' fD(v)EA(v) d-v, (2)
where C does not depend on the energy (strictly speaking Cis not independent of v, but we ignore this weak dependencein our qualitative calculations) and K2 is the factor thatdepends on the mutual orientation of the two transitiondipole moments. Because of the short excited-state lifetimeof B800 the fluorescence spectrum fD(v) is not very accu-rately measurable. Furthermore, it would not be correct touse directly measured spectra because of the inhomoge-neous broadening; in Eq. 2 the homogeneous spectra mustbe used. Therefore we have carried out spectral simulationsof the B800 band of the B800-850 complex, using themodel developed by Pullerits et aL(l 994b). This model usesthe linear harmonic Franck-Condon approximation and per-mits the calculation of the spectrum of the electronic tran-sition that is coupled to vibronic modes and lattice phonons.We have made use of the vibronic frequencies and relativetransition intensities of Bchl a reported by Renge et al.(1987). This work does not give values for the Franck-Condon factors, and we have varied these parameters withinreasonable limits to get the fit to experimental spectra. Tocompare the model spectra with experiment, the calculatedhomogeneous spectra were convoluted with the IDF. Thewidth of the IDF of B800 is taken to be 170 cm-' (Reddyet al., 1991). The experimental and calculated absorptionspectra of the B800 band at 150 K and at room temperatureare given in the upper panel of Fig. 9. In the calculations ofthe overlap integral we have assumed that the homogeneousabsorption and fluorescence spectra are mirror symmetricwith respect to the 0-0 transition frequency.
It has been discussed by Kenkre (1982) that sharp peaksin the homogeneous spectra correspond to slow decay ofmemory functions in the generalized master equation de-scription and thus indicate the presence of coherent transfer.This is not surprising because in general the same mecha-nism broadens zero-phonon lines (ZPLs) and randomizesphase of excitations. At 0 K it is quite obvious that theoverlap of donor fluorescence with the ZPL of the acceptorabsorption does not correspond to incoherent Forster trans-fer because one of the main assumptions of the Forstertheory is not satisfied in that case: there is no fast relaxationfrom the initially created acceptor state because from thezero-phonon level there is nowhere to relax at low temper-ature. Thus we have left the ZPL of the acceptor spectrumout of the spectral overlap calculation. Fig. 9 shows thedependence of the spectral overlap on the energy differencebetween donor and acceptor at 4, 77, and 300 K. IDF is alsopresented in both panels. The curves of the spectral overlapgive the relative transfer rate from the molecule with ZPL atenergy vo + AE to the molecule with the ZPL at the centerof the IDF (vo). At 4 K the spectral overlap has a structurecorresponding to the vibronic bands of the homogeneousspectra. The structure disappears at higher temperature. At
Wavelength (nm)
-50 0 K
0
CLco
A Energy (cm 1)
FIGURE 9 Dependence of the calculated Forster spectral overlap on theenergy gap between the excitation donor and acceptor at three differenttemperatures. The overlap of the donor fluorescence with the ZPL of theacceptor is left out of the calculation (see text). Homogeneous absorptionand fluorescence spectra are assumed to be mirror symmetric with respectto the ZPL position. The electronic transition is coupled to the proteinphonons of mean frequency 20 cm- , S = 0.4, and to an intramolecularvibrational mode of 165 cm-', S = 0.1. The upper panel shows a com-parison of experimental and calculated absorption spectra of B800 at twotemperatures. For comparison the inhomogeneous distribution function(IDF) of 170 cm-' is also presented in both panels.
77 K and lower the overlap is relatively narrow comparedwith the IDF, and it can be seen that the transfer rate fromthe bluest side of IDF to the center of IDF is relativelysmall.
Model calculations
As a first example we have performed calculations for atwo-dimensional hexagonal system of 19 molecules. Thetransition dipole moments of the molecules are random inthe plane, and the energies of the 0-0 electronic transitionsare distributed according to the Gaussian IDF of 170 cm-'half-width. In the calculations we also take into account thespectral width of the excitation pulse of 150 cm-. We havecalculated the kinetics of the isotropic and anisotropicpump-probe signals at three different wavelengths, 790,800, and 810 nm, which correspond to the blue edge, thecenter, and the red edge of the absorption band, respec-tively. In Fig. 10 we present the calculated distributions ofthe decay constants of isotropic kinetics of B800 at these
2220 Biophysical Journal

Inhomogeneous B800
0.2
0
Isotropic
Anisotropy
.A.I II 0:
A*Cl~~~~ ~~~~~ '7 V
.,,
0.2 [
0
0.2
0
0
- AL
A 00
~~~~~~......--.......
A
A
.I
21
Tau (ps)
FIGURE 10 Summary of the results of simulations of e:inside B800 (part of the decay that corresponds to the traomitted). We have used a hexagonal two-dimensional an
with transition dipole moments randomly oriented in thegeneous broadening and the spectral width of the laser pulaccount. The lines correspond to distributions of isotr(constants at different recording wavelengths and tempelcorrespond to the biexponential fits of the calculated an
The leftmost symbols at 3 ps give the corresponding canisotropy, r(oo).
three wavelengths at three different temperaturvisualize better the dynamics inside of the sp(
mogeneous B800 band, we have omitted frordecay component corresponding to the quenchWe cannot directly simulate the distributionsdecay components, but we have fitted calculattdecay curves with the sum of two exponentia
- 300 K stant background. These results are also presented in Fig. 10-77 K (symbols). The rightmost symbols at 3 ps give the level of.4 K the constant background of the anisotropy decays.A 300 K First we take a closer look at the isotropic decays. At theo 77 K blue side at all temperatures one can see fast decay compo-O 4 K nents (300 fs), which are due to the transfer from initially
excited high-energy molecules to other molecules that havelower excited-state energy; the 4-K kinetics is the fastest. At77 K the overall amplitude of the components that is due tothe dynamics inside of the IDF is almost the same as at 4 K(in both cases the overall kinetics have an approximately20% lifetime component, which corresponds to the transfer
790 nm from B800 to B850), but the lifetime distribution is situatedtoward much longer times. At 300 K the shape of thelifetime distribution resembles the one at 4 K very much,but the amplitude of the distribution is much smaller (morethan 40% of the overall decay amplitude is due to thetransfer to B850). At the center of the band the transfer takes
Q place among nearly isoenergetic molecules, and thereforethe fast components have very little amplitude and the decayis quite similar at different temperatures. At the red side ofthe band the kinetics at different temperatures have quali-
800 nm tatively different behavior. At 4 K only a rising componentis present, which corresponds to the accumulation of theexcitation to the reddest pigments, which give a strongbleaching signal. At 77 K the kinetics at the red edge are
O almost indistinguishable from the kinetics at the center of0 the band. At 300 K a remarkable effect appears: because of
the uphill energy transfer one can see an apparent fast decay03 A\ component that makes kinetics at the red edge faster than
O the corresponding kinetics at the center of the band becauseat 800 nm initially the full IDF is almost homogeneously
810 nm excited whereas at 810 nm the excitations are created onlyat the reddest pigments.
In the anisotropy decay at all wavelengths we see a veryfast component of 200 fs, which corresponds to the first
3 jump away from the initially excited molecule. The timeconstant of this fast component is almost independent oftemperature and wavelength. At the same time the ampli-tude varies considerably with different cases. The amplitude
xcitation transfer is largest at the center of the band, particularly at 77 and 4msfer to B850 is K (note that the isotropic decay had negligible amplitude ofray of molecules the fast component at this spectral region). At these tem-plane. Inhomo-Ise are taken into peratures the homogeneous spectra are so narrow that atopic decay time both edges of the band it is much less probable that aratures. Symbols molecule there has a neighbor with good spectral overlap.iisotropy decays. This implies not only that the uphill energy transfer isonstant level of slowed down but that the excitation can also be "trapped" at
the blue side of the band because almost all neighbors haveso much lower energy that the spectral overlap is relatively
res (lines). To small (see Fig. 9). At the center of the band the escapeectrally inho- probability is much higher, because there it is much moren Fig. 10 the likely that the initially excited molecule has a neighbor withLing by B850. a good spectral overlap. This effect is a direct analog to theof anisotropy well-known concept of Anderson localization. In our caseed anisotropy the localization at the blue edge of the band is not reallyl[s and a con- perfect; the transfer away from there is simply slower than
U1)
0~E-
-
| l
Hess et al. 2221
3
Volume 69 December 1995
at the center of the band. At the red edge of the band at 4 Ka considerable amount of initially created excitation is reallytrapped, which is indicated by the high value (>0.2) of theconstant level of anisotropy. Here we would like to draw thereader's attention to the fact that even at room temperatureat the red edge of the band the constant component of theanisotropy is not the theoretically predicted 0.1 for thetwo-dimensional system. This effect is due to the finite sizeof our system. We have 19 molecules, of which 18 providea constant anisotropy 0.1 and one (the initially excited)provides 0.4. Anisotropy is additive, and one can easilycalculate that the constant anisotropy level for our system isapproximately 0.12. In our opinion, this effect on the an-isotropy of the finite size of a random system is not fullyrecognized in studies of pigment protein complexes andcould give valuable additional information about the struc-tural properties of the studied system.
It has to be pointed out that in the above structural model,if one approximates both anisotropic and isotropic decayswith two exponentials, then the fast component of anisotro-pic decay is always considerably shorter than the corre-sponding isotropic decay component. Qualitatively onecould perhaps expect to find the opposite result (fasterisotropic component) if there were some local order in theorientations of transition dipole moments. To investigatethis point further we introduced a correlation of orientationsof transition dipole moments of molecules in the system andlooked for the possibility of finding the necessary level ofcorrelation where the fast component of the anisotropydecay becomes similar to the corresponding isotropic decaythat was observed in the experiment.We used the following algorithm for assigning the orien-
tations of dipole moments of molecules. For the first mol-ecule we give a certain orientation of the dipole momentgiven by the unit vector dj. For the following molecules weuse the equation
dj= [0E di exp(t )] + (1- O)dr, (3)
where 0 = exp(-1/'y). rij is the distance between moleculesi and j; dj is a unit vector oriented randomly in the plane.The superscript u indicates that after summation the vectorin brackets has to be normalized to unity. The correlationparameter y determines the amount of order in the system.If y is large then 0 is close to 1, and the orientation isdetermined mainly by the first term in Eq. 3; also, inside thesum one can see that molecules that are far fromj still makea significant contribution. As a result the dipole moments ofmolecules are nearly parallel. In the opposite case, if y issmall, then 0 is also small, and the orientations of dipolemoments are rather random.
It turns out that the time constant of the fastest componentof the anisotropy decay does not depend strongly on thecorrelation parameter y. However, the amplitudes of differ-ent time constants and of the constant background are
strongly dependent on y. This outcome is of course not sosurprising because, even if two transition dipole momentsare close to parallel (not absolutely parallel), energy transferfrom one to another still causes the decrease of the level ofanisotropy of the signal with the time constant correspond-ing to the rate of the transfer. At the same time the ampli-tude of that decrease depends on the mutual orientation ofdipole moments. If molecules have totally random orienta-tion in space, then one transfer step reduces the anisotropyfrom the initial 0.4 to 0.016 (Agranovich and Galanin,1982). If there is some correlation of orientations, then theamount of the reduction is different but the time constant isstill the same. The subsequent transfer steps of course causea further reduction of the anisotropy, but it turns out that, ifthe correlation is introduced as in Eq. 3, then the first stepcreates a clearly distinctive fast decay component of theanisotropy and the further time constants of the multiexpo-nential fit are much longer (in fact the curve has a generalnonexponential behavior). The general expression for theanisotopy after excitation transfer is r = (3 cos2a - 1)15,where a is the angle between the transition dipole momentsof the initially excited molecule and the currently excitedmolecule.
Inspired by the recent finding that the LH2 antenna has aringlike structure (McDermott et al., 1995), we have alsoperformed simulations for the model in which all moleculesare located on a ring with the transition dipole momentsperpendicular to the radius vector and varied the number ofmolecules in the system (N). If N is large, then neighboringmolecules have nearly parallel transition dipole moments,and the first transfer step reduces the anisotropy by a verylittle amount. It appears that because of the cyclic structurethe anisotropy decay is qualitatively different from theprevious case of correlated dipole moments. If we fit theanisotropy decay by a single exponential plus a constantbackground we can clearly see the slowdown of the initialfast anisotropy decay (previously we had mainly a decreaseof the amplitude). Strictly speaking, it still has a fast com-ponent that corresponds to the single jump and does notdepend on N, but the amplitude of this component is verysmall and could not be distinguished from the decay causedby the subsequent steps. We found that ifN = 8 then the fastcomponent of anisotropy decay is nearly equal to the singleexponential time constant of the isotropic decay, whichcorresponds to the transfer inside B800. IfN is 12, 16, or 20then the corresponding anisotropy decay times are 1.4, 2.1or 3.2 times longer than the above-mentioned isotropicdecay time. If we compare these results with experimentalvalues for the fast decay components of isotropic and aniso-tropic decays (0.4 and 0.3 ps, respectively, at 77 K) we canfind that the pairwise nearest-neighbor hopping time ofB800 molecules at 77 K, averaged over the IDF, is 350 fs.Our measurements also suggest that, if B800 has a ringlikestructure, then N ' 12. As can be seen from Fig. 11, LH2contains nine B800 Bchl a molecules that form a ring andhave the Qy transition dipole moments parallel to the mem-
2222 Biophysical Journal
brane plane.

Inhomogeneous B800
FIGURE 11 Arrangement of the Bchl a molecules of B800. Pigmentstogether with (3-helixes form an outer ring of the B800-850 complex,whereas a-helixes are in the inner ring.
DISCUSSION
Our interpretations of the experimental data are based on theForster incoherent excitation transfer theory. Alternatively,exciton relaxation has been applied for describing the ultra-fast transfer processes in purple bacteria (Pullerits et al.,1994a; Novoderezhkin and Razjivin, 1994). We point outthat for the B800 band all spectroscopic evidence (CD, holeburning) indicates the prevailing monomeric character ofthat spectral band. Besides, the structural data show that thecenter-to-center distance between nearest-neighbour B800Bchl molecules (21 A) and from these to molecules thatbelong to B850 (18 A) is much larger than the center-to-center distance between B850 molecules (-9 A). Thereforewe are justified in treating B800<->B800 and B800--B850transfer as Forster hopping, whereas for the transfer insideB850 excitonic effects have to be considered seriously.The pairwise transfer time within B800 seems to be faster
than the corresponding transfer from B800 to B850 (at 77 K,0.35 and 1.8 ps, respectively) in spite of the fact that thedistance between B800 molecules is greater than the dis-tance from B800 to B850. This is most likely due to the
different spectral overlaps. Between B800 molecules theoverlap of donor spectra with phonon wings of acceptors isquite good at 77 K, whereas in the case of B800->B850transfer the major part of the overlap is coming from the165-cm-1 vibrational mode, which is not very stronglycoupled to the electronic transition (Reddy et al., 1991).Consequently the overlap is much smaller for that transfer.
There is much recent evidence that vibrational relaxationand dephasing in antenna complexes of the purple bacteriaare not completed on the few-hundred-femtosecond timescale (Chachisvilis et al., 1994, 1995b). This means that theB800->B800 transfer occurs from a vibrationally hot state(Tehver and Hizhnyakov, 1976). In that case transfer fromeach optically prepared vibrational level of the donor has tobe considered independently, and the resulting kineticsmight be multiexponential. However, this is not likely tochange our conclusion about the slowdown of the B800->B800 transfer at the blue wing of the absorption band.Vibrational relaxation can be formally included in Eq. 2through the time-dependent fluorescence spectrumfD(v). Atthe initial stage, before the relaxation, emission is resonantto the absorbed light, whereas during the vibrational relax-ation it thermalizes tofD(v). In the case of excitation to theblue wing of the absorption band, emission shifts from blueto red. This means that the localization phenomenon at theblue side of the absorption band, which our simulationspredict and experiment supports, is even stronger if the hotexcitation transfer is properly considered.
Current work and a number of other studies show thatthere are subpicosecond to picosecond relaxations in largemolecules in solution, related to several different processes:solvation, vibrational relaxation, cooling. At low tempera-ture in glass, a substantial part of these motions, which arerelated to solvation, freezes out, and the relaxations slowdown. Whether this is also the case in proteins is notpossible to say definitely, because there are very few data onsolvation processes and their temperature dependence inproteins. Experiments with Bchl a in a protein matrix are inprogress to resolve these problems. If other dynamic pro-cesses such as vibrational relaxation and electronic dephas-ing are also present, they are expected to be quite fast. Thepresent measurements show that there are no such relax-ations of substantial amplitude in Bchl a in the low-temper-ature glasses. It appears reasonably safe to assume that theseintramolecular processes would be present to a similar ex-tent and have approximately the same temporal behavior inglasses and proteins at low temperatures. For our results wetherefore presume that the contribution of non-energy-trans-fer-related relaxation processes to the measured kinetics issmall enough not to influence appreciably our main conclu-sions regarding nearest-neighbor excitation hopping time inB800, excitation localization in the wings of the B800 band,and correlation of B800 anisotropy decay with the LH2structure. Moreover, all these conclusions are to a largeextent based on the anisotropy data, which are expected tobe affected very little by intramolecular processes such asvibrational relaxation. Electronic dephasing in an excitonic
Hess et al. 2223

2224 Biophysical Journal Volume 69 December 1995
system could actually lead to fast anisotropy decay compo-nents (Knox and Gulen, 1993). However, in that case onewould also expect the initial anisotropy to be above theconventional 0.4, which was not observed in the currentmeasurements. Besides, as we already pointed out, B800has a basically monomeric character.The concept of homogeneous and inhomogeneous broad-
ening originates on the basic level from the possibility ofseparating the time scales of different dynamic processes inthe system. At low temperatures when the dynamic fluctu-ations of the environment of a chromophore are frozen out,the IDF can be seen as truly static. At higher temperatureswhen the conformational changes in the glass/protein willbecome faster (spectral diffusion), the picture of the staticIDF might not be true any more. We do not have a goodphysical model to describe that kind of dynamic spectralinhomogeneity, and, as the reference time here is rathershort, the excited-state lifetime of 1-2 ps, we consider theIDF to be temperature independent.
B800<->B800 transfer was also observed in the recentfluorescence line-narrowing and hole-burning study at 1.2K by de Caro et al. (1994). They suggested a time constantof -900 fs for that process, which is considerably longerthan what our direct time-domain experiments yield at 77 K.The difference might be due to the different temperature butalso to the complicated decay profile. The fastest compo-nents with small amplitudes are not so easy to extract fromthe frequency-domain experiments.The value of -1.8 ps for the B800->B850 transfer time
at 77 K is also shorter than what hole-burning experimentssuggest at liquid-helium temperatures (Van der Laan et al.,1990; Reddy et al., 1991). This difference is most likely dueto the change in the spectral overlap with temperature (Hesset al., 1994). The spectra are narrower and the spectraloverlap consequently smaller at lower temperatures. How-ever, the reduction of the energy-transfer rate below 77 K isrelatively small; a much bigger decrease occurs betweenroom temperature and 77 K, where the time constantchanges from 0.7 to 1.8 ps.The data presented here reveal a new feature of excitation
transfer in spectrally inhomogeneous antenna systems: thelocalization of excitation at the blue edge of the spectrum atlow temperature. This "localization" is not so perfect as it isat the red edge, where excitation gets practically trapped.But still the excitation transfer is slowed down significantly.Our results are in a good agreement with available spectraldata and the basic features apparent from the structure of theLH2 complex. It will be interesting to investigate the detailsof pigment interactions and energy transfer within the com-plex when the atomic coordinates become available.
This research was financially supported by the Swedish Natural ScienceResearch Council and EEC Research grant SCI*- CT92-0796. RJC ac-knowledges financial support from the BBSRC.
REFERENCES
Aberg, U., E. Akesson, J. L. Alvarez, I. Fedchenia, and V. Sundstr6m.1994. Femtosecond spectral evolution monitoring the bond-twistingevent in barrierless isomerization. Chem. Phys. 183:269-288.
Avarmaa, R. A., and K. K. Rebane. 1985. High resolution optical spectraof chlorophyll molecules. Spectrochim. Acta Part A. 41:1365-1380.
Agranovich, V. M., and M. D. Galanin. 1982. Electronic Excitation EnergyTransfer in Condensed Matter. North-Holland, Amsterdam.
Becker, M., V. Nagarajan, D. Middendorf, M. A. Shield, and W. W.Parson. 1990. Excited state properties of bacteriochlorophyll a and ofbacterial photosynthetic reaction centers as revealed by picosecondabsorption studies. In Current Research in Photosynthesis. Vol. 1. M.Baltcheffsky, editor. Kluwer Academic Publishers, Dordrecht, TheNetherlands. 101-104.
Becker, M., V. Nagarajan, and W. W. Parson. 1991. Properties of theexcited-singlet states of bacteriochlorophyll a and bacteriopheophytin ain polar solvents. J. Am. Chem. Soc. 113:6840-6848.
Bergstrom, H., V. Sundstrom, R. van Grondelle, E. Akesson, and T.Gillbro. 1986. Energy transfer within the isolated light-harvestingB800-850 pigment protein complex of Rhodobacter sphaeroides. Bio-chim. Biophys. Acta. 852:279-287.
Bergstrom, H., V. Sundstrom, R. van Grondelle, T. Gillbro, and R. Cog-dell. 1988. Energy transfer dynamics of isolated B800-850 pigment-protein complexes of Rodobacter sphaeroides and Rhodospseudomonasacidophila. Biochim. Biophys. Acta. 936:90-98.
Boonstra, A. F., R. W. Visschers, F. Calkoen, R. van Grondelle, E. F. J.Bruggen, and E. J. Boekema. 1993. Structural characterization of theB800-B850 and B875 light-harvesting antenne complexes fromRhodobacter sphaeroides by electron microscopy. Biochim. Biophys.Acta. 1142:181-188.
Borisov, A. Yu., A. M. Freiberg. V. I. Godik, K. K. Rebane, and K. E.Timpmann. 1985. Kinetics of picosecond bacteriochlorophyll lumines-cence in vivo as a function of the reaction center state. Biochim. Biophys.Acta. 807:221-229.
Braun, P., and A. Scherz. 1991. Polypeptides and bacteriochlrophyll orga-nization in the light-harvesting complex of Rhodobacter sphaeroidesR.26-1. Biochemistry. 30:5177-5184.
Castner, E. W., Jr. M. Maroncelli, and G. R. Fleming. 1987. Subpicosecondresolution studies of solvation dynamics in polar aprotic and alcoholsolvents. J. Chem. Phys. 86:1090-1097.
Chachisvilis, M., T. Pullerits, M. R. Jones, C. N. Hunter, and V. Sund-strom. 1994. Vibrational dynamics in the light-harvesting complexes ofthe photosynthetic bacterium Rhodobacter sphaeroides. Chem. Phys.Lett. 224:345-351.
Chachisvilis, M., H. Fidder, and V. Sundstrom. 1995a. Electronic coher-ence in pseudo two-colour pump-probe spectroscopy. Chem. Phys. Lett.234:141-150.
Chachisvilis, M., H. Fidder, T. Pullerits, and V. Sundstrom. 1995b. Co-herent nuclear motions in light-harvesting pigments and dye molecules,probed by ultrafast spectroscopy. J. Raman Spectrosc. 26:513-522.
De Caro, C., R. W. Vischers, R. van Grondelle, and S. Volker. 1994. Inter-and intraband energy transfer in LH2-antenna complex of purple bacte-ria. A fluorescence line-narrowing and hole-burning study. J. Phys.Chem. 98:10584-10590.
Du, M., S. J. Rosenthal, X. Xie, T. J. DiMagno, M. Schmidt, D. K. Hanson,M. Schiffer, J. R. Norris, and G. R. Fleming. 1982. Femtosecondspontaneous-emission studies of reaction centers from photosyntheticbacteria. Proc. Natl. Acad. Sci. USA. 89:8517-8521.
Elsaesser, T., and W. Kaiser. 1991. Vibrational and vibronic relaxation oflarge polyatomic molecules in liquids. Annu. Rev. Phys. Chem. 42:83-107.
Forster, Th. 1965. Delocalized excitation and excitation transfer. In Mod-ern Quantum Chemistry. Vol. III. 0. Sinanoglu, editor. Academic Press,Inc., New York. 93-137.
Freiberg, A., V. I. Godik, T. Pullerits, and K. Timpmann. 1989. Picoseconddynamics of direct excitation transfer in spectrally heterogeneous light-harvesting antenna of purple bacteria. Biochim. Biophys. Acta. 973:93-104.
Hess, S., F. Feldshtein, A. Babin, I. Nurgeleev, T. Pullerits, and V.Sundstrom. 1993. Femtosecond energy transfer within the LH2 periph-

Hess et al. Inhomogeneous B800 2225
eral antenna of the photosynthetic purple bacteria Rhodobacter spha-eroides and Rhodopseudomonas palustris LL. Chem. Phys. Lett. 216:247-257.
Hess, S., K. J. Visscher, T. Pullerits, V. Sundstrom, G. J. S. Fowler, and C.N. Hunter. 1994. Enhanced rates of subpicosecond energy transfer inblue-shifted light-harvesting LH2 mutants of Rhodobacter sphaeroides.Biochemistry. 33:8300-8305.
Hess, S., M. Chachisvalis, K. Timpmann, M.R. Jones, C.N. Hunter and V.Sunstrom. 1995. Temporally and spectrally resolved subpicosecond en-ergy transfer within LH2 and from LH2 to LH1 in photosynthetic purplebacteria. Proc. Natl. Acad. Sci. USA. In press.
Hunter, C. N., J. D. Pennoyer, J. N. Sturgis, D. Farrely, and R. A.Niederman. 1988. Oligomerization states and associations of light-harvesting pigment-protein complexes of Rhodobacter sphaeroides asanalyzed by lithium dodecyl sulfate-polyacrylamide gel electrophoresis.Biochemistry. 27:3459-3467.
James, D. R., and W. R. Ware. 1985. A fallacy in the interpretation offluorescence decay parameters. Chem. Phys. Lett. 120:455-459.
Jia, Y., D. M. Jonas, T. Joo, Y. Nagasawa, M. J. Lang, and G. R. Fleming.1995. Observation of ultrafast energy transfer from the accesory bacte-riochlorophylls to the special pair in photosynthetic reaction centers. J.Phys. Chem. 99:6263-6266.
Kenkre, V. M. 1982. The master equation approach: coherence, energytransfer, annihilation, and relaxation. In Exciton Dynamics in MolecularCrystals. Springer-Verlag, Berlin. 1-109.
Knox, R. S., and D. Gulen. 1993. Theory of polarized fluorescence frommolecular pairs: Forster transfer at large electronic coupling. Photo-chem. Photobiol. 57:40-43.
Kramer, H. J. M., R. van Grondelle, C. N. Hunter, W. H. J. Westerhuis, andJ. Amesz. 1984a. Pigment organization of the B800-850 antenna com-plex of Rhodopseudomonas sphaeroides. Biochim. Biophys. Acta. 765:156-165.
Kramer, H. J. M., J. D. Pennoyer, R. van Grondelle, W. H. S. Westerhuis,R. A. Niederman, and J. Amesz. 1984b. Low-temperature optical prop-erties and pigment organization of the B875 light-harvesting bacterio-chlorophyll-protein complex of purple photosynthetic bacteria. Biochim.Biophys. Acta. 767:335-344.
Maroncelli, M. J., J. Maclnnis, and G. R. Fleming. 1989. Polar solventsdynamics and electron transfer reactions. Science. 243:1674-1681.
McDermott, G., S. M. Prince, A. A. Freer, A. M. Hawthornthwaite-Lawless, M. Z. Papiz, R. J. Cogdell, and N. W. Isaacs. 1995. Crystelstructure of an integral membrane light-harvesting complex from pho-tosynthetic bacteria. Nature (London). 374:517-521.
Novoderezhkin, V. I., and A. P. Razjivin. 1994. Exciton states of theantenna and energy trapping by the reaction center. Photosynth. Res.43:9-15.
Pullerits, T., and A. Freiberg. 1992. Kinetic model of primary energytransfer and trapping in photosythetic membranes. Biophys. J. 63:879-896.
Pullerits, T., M. Chachisvalis, C. N. Jones, C. N. Hunter, and V. Sund-strom. 1994a. Exciton dynamics in the light-harvesting complexes ofRhodobacter sphaeroides. Chem. Phys. Lett. 224:355-365.
Pullerits, T., F. van Mourik, R. Monshouwer, R. W. Visschers, and R. vanGrondelle. 1994b. Electron-phonon coupling in the B820 subunit formof LH1 studied by temperature dependence of optical spectra. J. Lumin.58:168-171.
Pullerits, T., K. V. Vissher, S. Hess, V. Sundstrom, A. Frieberg, K.Timpmann, and R. van Grondelle. 1994c. Energy transfer in the inho-mogeneously broadened core antenna of purple bacteria: a simultaneousfit of low-intensity picosecond abssorption and fluorescence kinetics.Biophys. J. 66:236-248.
Reddy, N. R. S., G. J. Small, M. Siebert, and R. Picorel. 1991. Energytransfer dynamics in the B800-850 antenna complex of Rhodobactersphaeroides: a hole-burning study. Chem. Phys. Lett 181:391-399.
Renge, I., K. Mauring, and R. Avarmaa. 1987. Site-selection opticalspectra of bacteriochlorophyll and bacteriopheophytin in frozen solu-tions. J. Lumin. 37:207-214.
Shimada, K., M. Mimuro, N. Tamai, and I. Yamazaki. 1989. Excitationenergy transfer in Rhodobacter sphaeroides, analysed by the time-resolved fluorescence spectroscopy. Biochim. Biophys. Acta. 975:72-79.
Shreve, A. P., J. K. Trautman, H. A. Frank, T. G. Owens, and A. C.Albrecht. 1991. Femtosecond energy transfer processes in theB800-850 light-harvesting complex of Rhodobacter sphaeroides 2.4.1.Biochim. Biophys. Acta. 1051:280-288.
Savikhin, S., and W. S. Struve. 1994. Femtosecond pumpe-probe spectros-copy of bacteriochlorophyll a monomers in solution. Biophys. J. 67:2002-2007.
Sundstrom, V., R. van Grondelle, H. Bergstrom, E. Akesson, and T.Gillbro. 1986. Excitation energy transport in the bacteriochlorophyllantenna systems of Rhodospirillum rubrum and Rhodobacter spha-eroides, studied by low-intensity picosecond absorption spectroscopy.Biochim. Biophys. Acta. 851:431-446.
Sundstrom, V., and R. van Grondelle. 1992. Ultrafast dynamics of excita-tion energy transfer in Bchl a- and Bchl b-containing photosyntheticbacteria. J. Photochem. Photobiol. 15:141-150.
Sundstrom, V., and R. van Grondelle. 1995. Kinetics of excitation transferand trapping in purple bacteria. In Anoxygenic Photosynthetis Bacteria.R. E. Blankenship, M. T. Madiga, and C. E. Baner, editors. KluwerAcademic Publishers, Dordrecht, Boston, London. 349-372.
Tehver, I. Y., and V. V. Hizhnyakov. 1976. Radiationless transfer ofelectronic excitation during vibrational relaxation. Sov. Phys. JETP.42:305-310.
Timpmann, K., A. Frieberg, and V. I. Godik. 1991. Picosecond kinetics oflight excitations in photosynthetic purple bacteria in the temperaturerange of 300-4 K. Chem. Phys. Lett. 182:617-622.
Valkunas, L., V. Liuolia, and A. Freiberg. 1991. Picosecond processes inchromatophores at various light intensities. Photosynth. Res. 27:83-95.
Van der Laan, H., Th. Schmidt, K. J. Visscher, R. van Grondelle, and S.Volker. 1990. Energy transfer in the B800-850 light-harvesting antennacomplex of Rhodobacter sphaeroides: a study by spectral hole-burning.Chem. Phys Lett. 170:231-238.
Van der Laan, H., C. de Caro, Th. Schmidt, R. W. Visschers, R. vanGrondelle, G. J. S. Fowler, C. N. Hunter, and S. Volker. 1993. Excited-state dynamics of mutated antenna complexes of purple bacteria studiedby hole-burning. Chem. Phys. Lett. 212:569-581.
Van Grondelle, R. 1985. Excitation energy transfer, trapping and annihi-lation in photosynthetic systems. Biochem. Biophys. Acta. 811:147-195.
Van Grondelle, R., H. Bergstrom, V. Sundstrom, and T. Gillbro. 1987.Energy transfer within the bacteriochlorofyll antenna of purple bacteriaat 77 K, studied by picosecond absorption recovery. Biochim. Biophys.Acta. 894:313-326.
Van Mourik, F., A. M. Hawthornthwaite, C. Vonk, M. B. Evans, R. J.Cogdell, V. Sundstrom, and R. van Grondelle. 1992. Spectroscopiccharacterization of the low light B800-850 light-harvesting complex ofRodopseudomonas palustris strain 2.1.6. Biochim. Biophys. Acta. 1140:85-93.
Visscher, K. J., V. Gulbinas, R. Cogdell, R. van Grondelle, and V.Sundstrom. 1993. Ultrafast energy transfer within the light-harvestingantenna of photosynthetic purple bacteria. In Ultrafast Phenomena. Vol.VIII of Springer Series in Chemical Physics. J.-L. Martin, A. Migus, C.A. Mowren, A. H. Zewail, editors. 55:559-561.
Visschers, R. W., M. C. Chang, F. van Mourik, P. S. Parkes-Loach, B. A.Heller, P. A. Loach, and R. van Grondelle. 1991. Fluorescence polar-ization and low-temperature absorption spectroscopy of a subunit formof light-harvesting complex I from purple photosynthetic bacteria. Bio-chemistry. 30:5734-5742.
Weaver, J. M., G. E. MacManis, W. Jarzeba, and P. F. Barbara. 1990.Importancy of the fast solvent relaxation components to electrontransfer rates: comparisons between barrier-crossing frequencies andsubpicosecond time-resolved solvation dynamics. J. Phys. Chem.94:1715-1719.
Zhang, F. G., R. van Grondelle, and V. Sundstrom. 1992. Pathways ofenergy flow through the light-harvesting antenna of the photosyntheticpurple bacterium Rhodobacter sphaeroides. Biophys. J. 61:911-920.