energy level effects on deformation mechanism in microscale laser
TRANSCRIPT
Journal of Manufacturing ProcessesVol. 9/No. 1
2007
1
Journal of Manufacturing ProcessesVol. 9/No. 1
2007
Energy-Level Effects on the DeformationMechanism in Microscale Laser Peen Forming
Youneng Wang, Yajun Fan, Sinisa Vukelic, and Y. Lawrence Yao, Dept. of Mechanical Engineering,Columbia University, New York, New York, USA
AbstractLaser microscale peen forming has recently received more
and more attention as a viable laser processing technology asit not only imparts desirable residual stress for improvement offatigue life of the material, but can also precisely control partdeformation. In the present study, the effect of energy level onthe deformation mechanism in laser microscale peen formingwas investigated by both numerical and experimental meth-ods. Deformation curvatures and residual stress distributionsof both sides of the specimen, characterized by X-raymicrodiffraction, were compared with the results obtained fromFEM simulation. The forming mechanism for convex and con-cave bending was explained in terms of the resulting pres-sure, compressive stress distribution, and plastic strain.Differences in residual stress distribution patterns were alsoinvestigated as a function of the forming mechanism.
Keywords: Laser Microscale Peen Forming, X-RayMicrodiffraction, Forming Mechanism
IntroductionLaser forming, usually indicating laser thermal
forming, is a flexible rapid prototyping and low-vol-ume manufacturing process that uses laser-inducedthermal distortion to shape sheet metal parts withouttooling or external forces. Laser forming is well un-derstood both from theoretical and experimental in-vestigations (Vollertsen 1994; Li and Yao 2001).Compared with conventional forming technologies,laser forming has advantages including design flex-ibility, production of complex shapes, forming ofthick plates, and possibility of rapid prototyping. Onedifficulty, however, is maintaining desirable mate-rial properties of metallic parts. This is due to ther-mal effects that result in undesirable microstructurechanges, including recrystallization and phase trans-formation even without the presence of melting in-
This paper is an expanded version of a paper published in the Trans-actions of NAMRI/SME, Vol. 34, 2006.
volved (Fan et al. 2005). Also, laser thermal form-ing may melt or burn the surface and even result insmall cracks on the surface.
Laser peen forming (LPF, also known as lasershock forming), developed from laser shock peen-ing technology (Clauer and Holbrook 1981; Chen,Yao, and Kysar 2004), is a purely mechanical form-ing method achieved through the use of laser en-ergy to modify a target curvature. It has theadvantages of laser thermal forming, such asnoncontact, tool-less, and high efficiency and preci-sion. Also, its nonthermal nature makes it possibleto maintain material properties or even improve themby inducing compressive stress over the target sur-face. This is desirable in industry as it is importantfor shaped metal parts to resist cracks due to corro-sion and fatigue. In addition, such a compressivestress will generate a strain of the top layer of metaland produce a curvature (Hackel and Harris 2002;Hackel, Halpin, and Harris 2003). Hackel et al. dem-onstrated that the part can be precisely contouredover its large area by systematically applying im-pulses inducing local stresses and showed that anenhanced curvature can be achieved if a part ispreloaded in a local area by a stress that is near tobut below the yielding limit. Meanwhile, Zhou,Zhang, and Cai (2002, 2003) showed the potentialof laser peen forming for becoming a flexible manu-facturing process with desirable properties as wellas the potential for rapid prototyping. They providedinsight on deformation mechanisms, mechanical re-sponse, and failure behavior for materials under thisprocess. Ji et al. (2004) studied effects of some in-fluence factors, such as the change of laser energyand laser beam diameter, with experimental and nu-merical methods. Despite the recent advances, theprocess has still not been fully characterized due toits complex underlying mechanisms for deformation.
Journal of Manufacturing ProcessesVol. 9/No. 12007
2
In the last 10 years, miniaturization technologieshave required new techniques varying from conven-tional ones like machining to manufacture more com-plex miniaturized devices, such as using amicroforming process (Geiger et al. 2001; Cao et al.2004). Laser microforming as a new technology hasbeen successfully employed in a number of high-pre-cision industrial applications, such as lasermicrobending of magnetic disk-drive components andadjustment of contact springs of miniature relays andreed-contacts, etc. (Otsu, Wada, and Osakada 2001;Esser, Schmidt, and Dirscherl 2003). It can be seenthat the applications described above all encountercyclic loadings. These serve as the driving force forthe investigation of microscale laser peen forming asa potential method of microforming due to the inher-ent advantages of laser shock peening (LSP). Therecurrently exists a great deal of work (Zhang and Yao2002; Chen, Yao, and Kysar 2004) demonstrating thatµLSP produces local compressive stress near the sur-face, thus improving fatigue life of the target. There-fore, it is possible to employ microscale laser peenforming (µLPF) to manufacture complex miniaturizeddevices as well as improve fatigue life.
This paper studies microscale laser peen formingusing both numerical and experimental methods. Theeffects of laser energies and thickness on the defor-mation mechanism were investigated experimentally,and experimental data obtained were then used to vali-date the corresponding simulation model. The samplecurvatures before and after laser microscale peen form-ing were measured using a profilometer to find thenet bending effect. Also, both residual stress distribu-tions on the top and bottom surfaces were measuredusing X-ray microdiffraction. In addition, phenom-ena about concave and convex bending that result indifferent patterns of residual stress distribution alongthe sample’s surface were explored. The numericalsimulation verified from the experimental results canbe used to predict the deformation and further under-stand the forming mechanism. Hence, the presentedwork lays some foundation for understanding the pro-cess of microscale laser peen forming.
Process of Microscale Peen Formingand Experiment ConditionsPrinciples of Microscale Laser Peen Forming
When a metallic target is irradiated by an intense(>1 GW/cm2) laser pulse, the surface layer instanta-
neously vaporizes into a hot and high-pressure (1~10GPa) plasma. This pressure may be employed to pre-cisely shape structural components at a microscaleresolution in µLPF. Like µLSP, LPF applies a short,intense laser pulse using a micron-sized beam to treatthe metallic target surface, and compressive stress isthen imparted on the treated surface with micron-level spatial resolution without introducing any ther-mal effects. For µLSP, the target is placed on a rigidsubstrate to prevent any movement of the bottomsurface. Thus, the resulting compressive residualstress is maximized on the surface and plastic strainis mainly imparted on the top surface. However, thebottom of the target is not restricted for µLPF withtwo ends clamped by two metal sheets. Typically,the target is much thinner than that of µLSP. Hence,plastic strain may be induced in both sides, and theresulting compressive stress on the treated surfacewill cause that surface to expand, and thus plasti-cally curve the metal. The curved shape may be con-vex or concave depending on process parameters.In addition, the surfaces of both sides may be left ina compressive state of stress, which is highly desir-able for fatigue and corrosion resistance.
Physical ExplanationµLPF is a purely mechanical process, which im-
parts compressive stress through a compressive shockwave on the surface of the metal to deform the target.When the laser pulse ablates the coating, the materialarea beneath the ablating coating undergoes local plas-tic deformation, which can result in either concave orconvex curvature. It can be imagined that the speci-men under loading will bend downward first underthe downward loading if thickness is thin enough.This downward trend continues during relaxing untilother sources overcome this downward inertia. Inaddition, the stress distribution in the lateral directionis tensile on the bottom side to balance the top’s com-pressive stress, so that this downward bending rein-forces plastic deformation on the bottom side becauseit stretches the bottom. After the inertia disappears,reverse bending follow. This phenomenon may bedetermined by three sources: the downward loading(inertia after the loading), bending moment, and in-duced compressive stress. These sources function to-gether to determine the bending. During the loading,the pressure resulting from the laser ablation is thedominant source, which consequently induces theother two sources. Because the loading direction is
Journal of Manufacturing ProcessesVol. 9/No. 1
2007
3
downward and the sample is free on the bottom side,the bend is downward in the loading stage. Mean-while, the induced compressive stress on the top sur-face elongates the top layer, which leads the strip tobend upward. In addition, the bending angle resultsin an opposite bending moment and exerts bulging tothe specimen, too.
During unloading, the downward inertia makesthe specimen bend downward continuously until theother two sources exceed the effect of the down-ward inertia. Then, the forming direction of the speci-men is reversed when the compressive stress becomesdominant. Thus, the phenomenon that the concaveor convex final shape occurs is dependent on theeffects of these three sources.
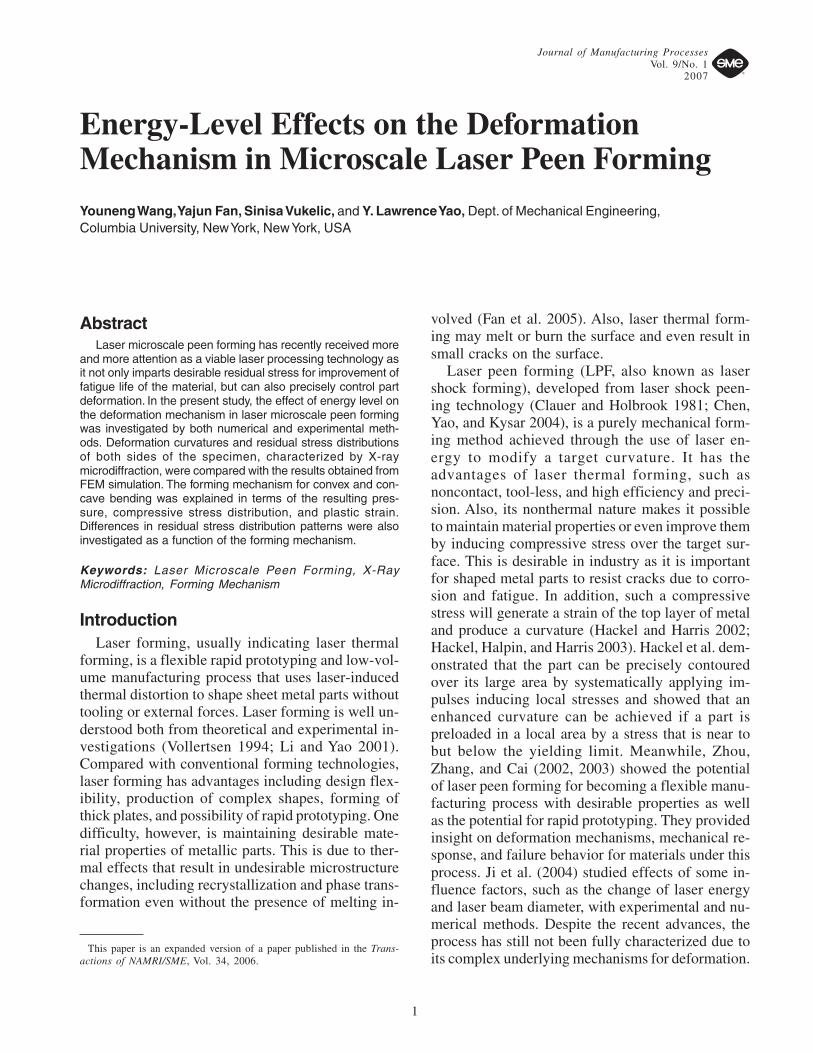
Experiment Conditions and Sample PreparationA frequency-tripled Q-switched Nd:YAG laser
(�=355 nm) in TEM00 mode was used in µLPF, andthe parameters of pulse duration, wavelength, andbeam diameter are shown in Figure 1. A line of µLSPshocks was created on the sample surface with a 25µm spacing. Pulse energies, 202 µJ and 280 µJ, cor-responding to laser intensities of 3.57 and 4.95 GW/cm2, respectively, were applied. A thin layer of highvacuum grease (about 10 microns thick) was spreadevenly on the sample surface, and a 16 µm thickpolycrystalline aluminum foil, chosen for its rela-tively low threshold of vaporization, was tightlypressed onto the grease. The sample was placed in ashallow container filled with distilled water around1 mm above the sample’s top surface. The induceddeformation is due to shock pressure and not due tothermal effects because only the coating is vapor-ized during the process.
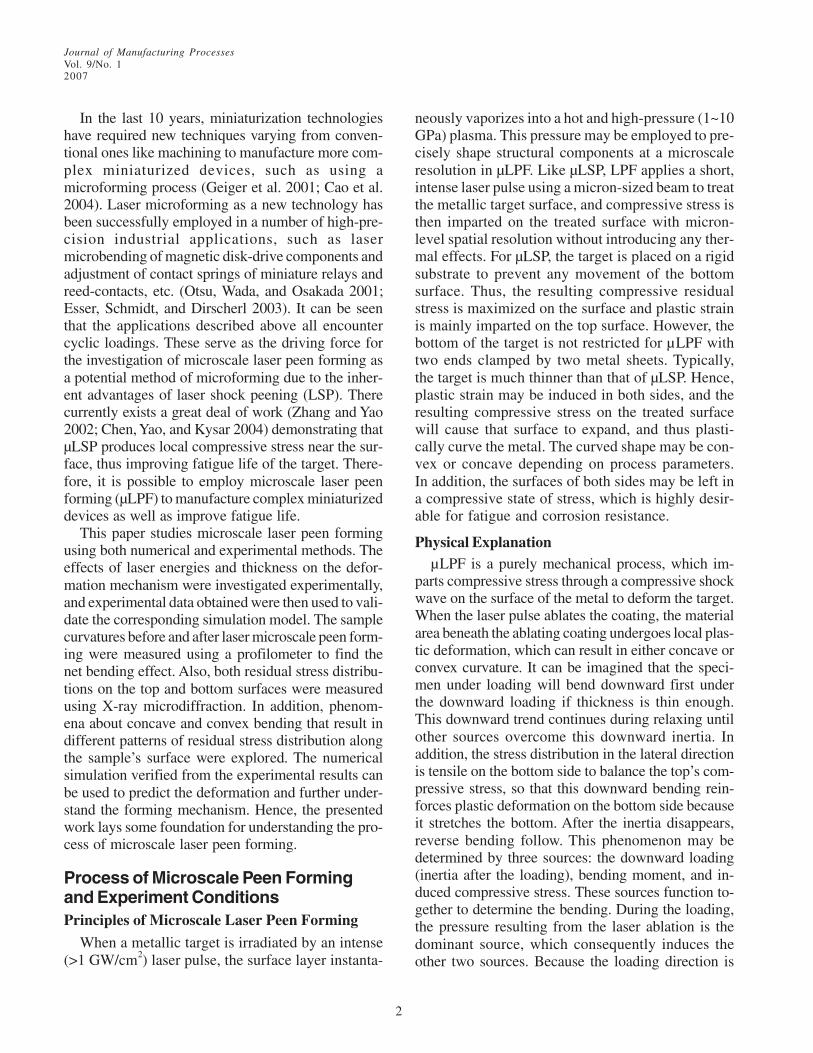
To investigate the thickness effect under the samelaser energy, the samples of copper foils with 100µm and 200 µm thickness have been chosen. Due totheir strong (001) texture, as shown in Figure 2, theycan be treated as a single crystal in microdiffractionmeasurements (Chen, Yao, and Kysar 2004). Thesamples were heat treated to release stress with thetemperature of 150°C and duration of one hour. Af-ter heat treatment, the texture was measured againby using the conventional X-ray and was found thatthe stress relief process has almost no effect on tex-ture. The samples were cut to the dimension of 20mm × 3 mm using a wire EDM and mounted to hold-ers as shown in Figure 1, ensuring the specimens areas flat as possible. Before the shocking process, pre-
bending was measured by using a Mitutoyo SJ-201Pprofilometer as shown in Figure 3, and the sampleswith a pre-bending less than 8 µm were chosen fortreatment so as to minimize the pre-bending effects.
Post Peen Forming MaterialCharacterization
In this section, the samples after µLPF have beenanalyzed in terms of global deformation profile andresidual stress distribution because these are the mostimportant issues in the area of laser peen forming.
Global Deformation Measurement UsingProfilometer
After LPF, the samples’ profiles were measuredusing Surftest SJ-201P of Mitutoyo. The measuring
Figure 1Sample Geometry and Laser Shock Forming Condition (width of
sample is 3 mm and screws are used to hold the two washers)
Figure 2Texture of Annealed 100 µm Copper Sample by
Conventional X-Ray
Journal of Manufacturing ProcessesVol. 9/No. 12007
4
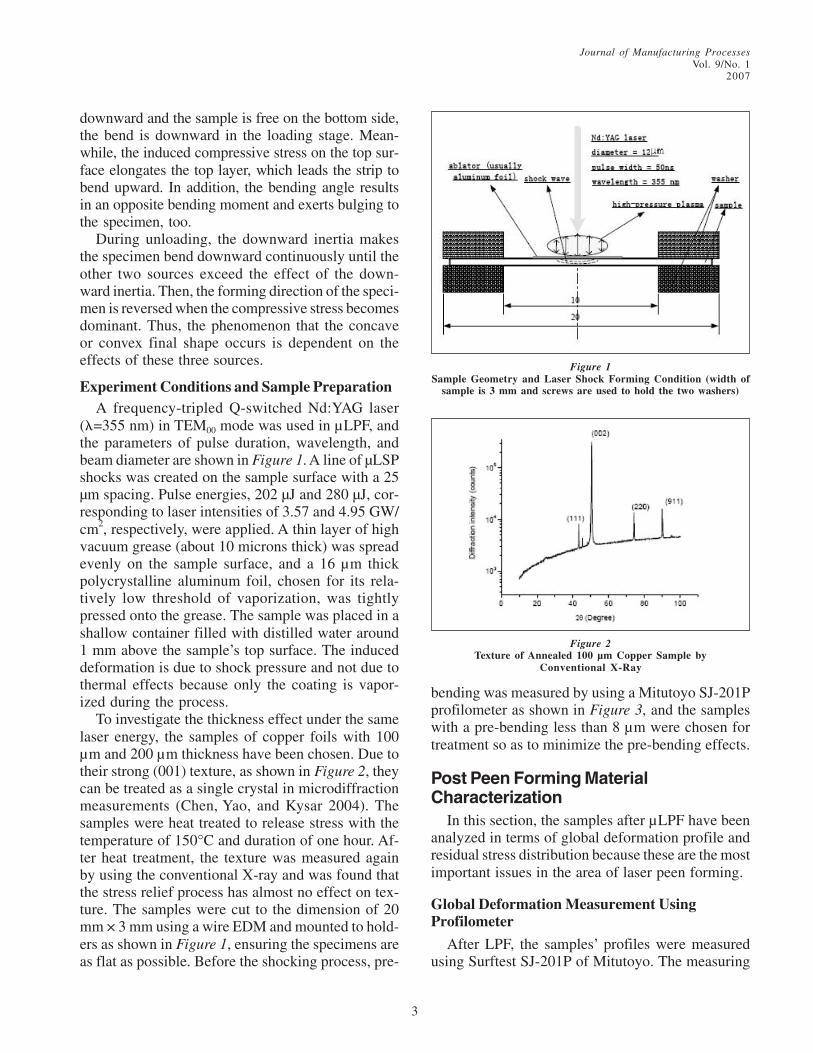
range is 350 µm with a resolution of 0.4 µm. Themeasuring force is 4 mN, which assures the detectorhas no bending effect on the samples while measur-ing. During the measurement, only the bottom sidewas measured due to the coating on the top surface.The measured results were shown in Figure 3. It canbe seen that the bend is downward 8 µm for the 100µm sample with laser intensity 3.57 GW/cm2; that is,a concave surface was left on curving. For the 100µm sample with laser intensity 4.95 GW/cm2, the bendwas upward 10 µm; that is, a convex surface was lefton curving. Also, from Figure 3, it can be calculatedthat the bending angle is about 0.11° and 0.14° forthese two energy levels, respectively. Thus, µLPF iscapable of producing plastic deformation atmicroscale resolution.
Residual Stress Distribution by X-RayMicrodiffraction
X-ray beam from synchrotron radiation sources(from beamline X20A at National Synchrotron LightSource at Brookhaven National Lab) was used in thisstudy as the extreme intensities allow a short sam-pling time, and further, the X-ray can be focused by atapered glass capillary to spot sizes as small as 3 µm.The spot size can be larger than 3 µm because the X-ray beam is divergent. The average grain size of thesamples is about 8 µm from both scanning electronmicroscopy (SEM) and electron backscatter diffrac-tion (EBSD) measurements. In the paper, the X-rayspot size around 15 µm on the sample surface, cover-
ing at least two grains,was used to collect dif-fraction at each measur-ing point. Completedetails of the X-raymicrodiffraction experi-ment and the correspond-ing evaluation method ofsubprofile analysis can befound in Chen, Yao, andKysar (2004). Becausethe copper samples usedhad a very strong texturein the (001) orientation,the (002) reflections werechosen for the X-ray dif-fraction measurement be-cause the diffraction
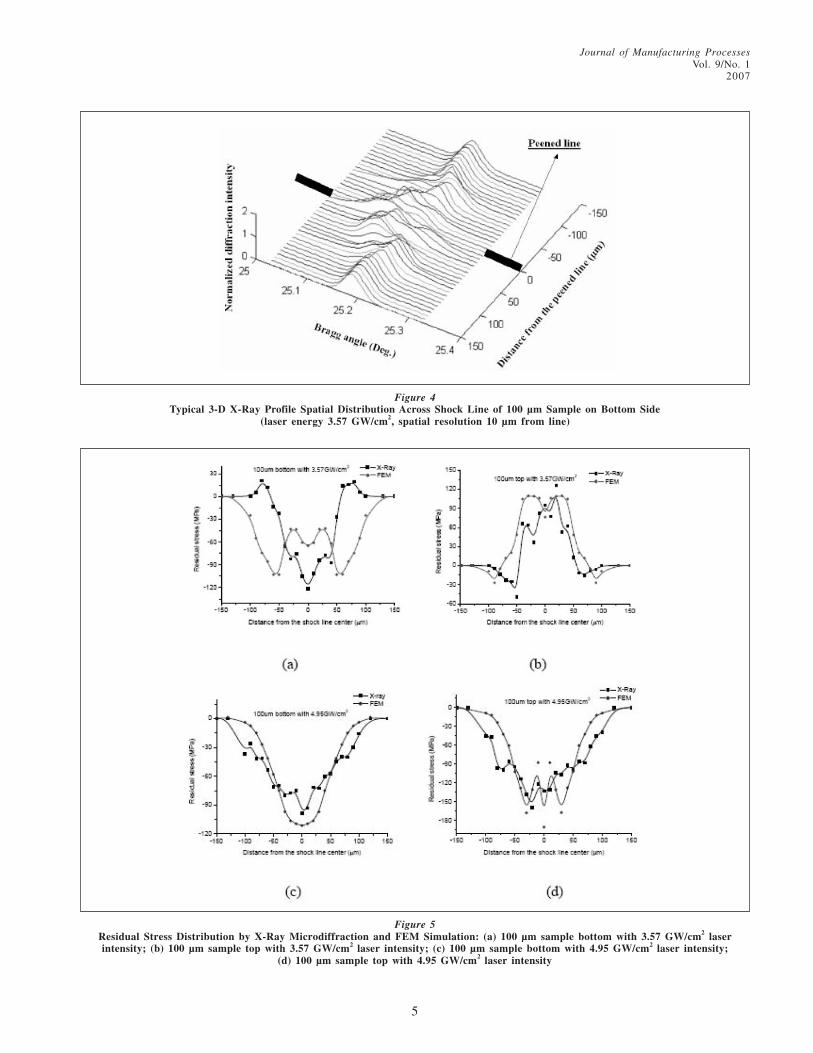
structure factor for (001) is zero and the reflectionsare absent (Cullity 1978). To spatially resolve the re-sidual stress induced by µLPF, measurements weremade on both top and bottom surfaces across thepeened line. The spacing between adjacent measure-ment points is 10 µm, and the corresponding X-raydiffraction profile at each position is recorded andrepeated for each scan line. Figure 4 shows the typi-cal diffraction profiles corresponding to the 100 µmsample under laser energy of 3.57 GW/cm2. It can beseen that the profiles close to the peened line centerare broadening and the peaks are shifted. As a result,the broadening and shift of the profile can be inter-preted in terms of the residual stress state.
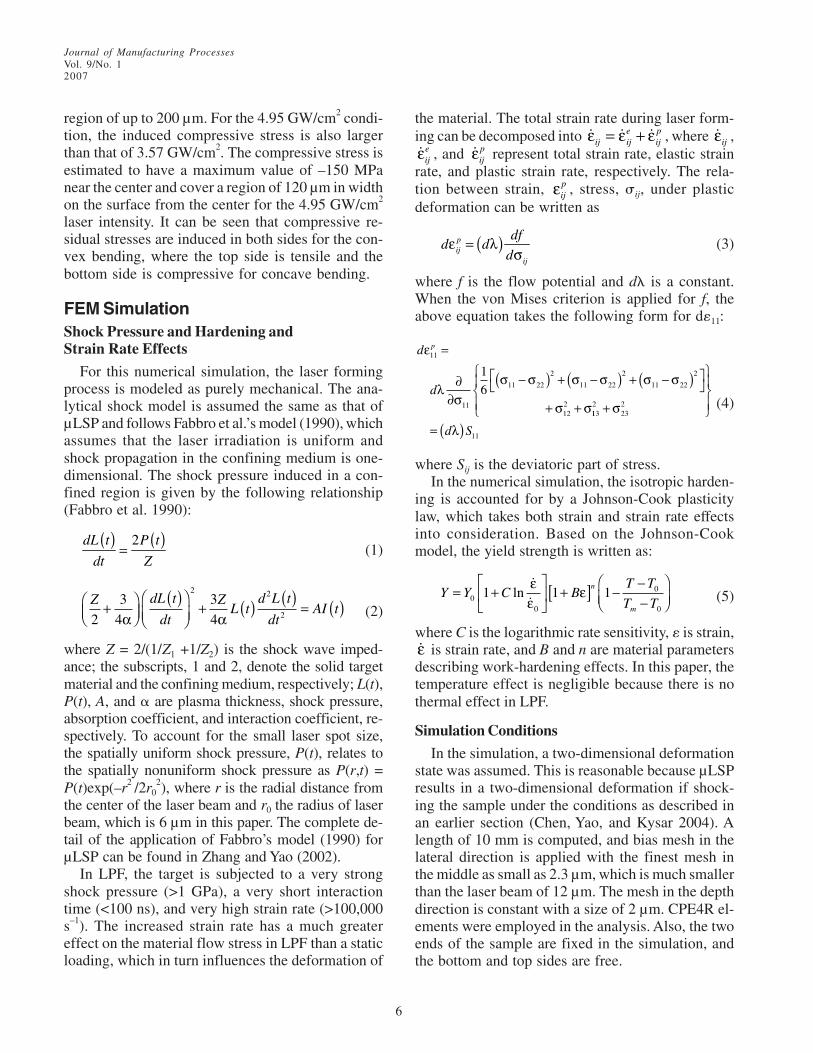
After obtaining the X-ray diffraction profiles atdifferent positions in the peened region, the lateralresidual stress on the sample surface can be estimatedusing the subprofile method of Chen, Yao, and Kysar(2004). The spatial distribution across the peenedregion was plotted as in Figure 5. For the 100 µmsample under 3.57 GW/cm2 laser intensity, a com-pressive residual stress is generated near the centerof the peened region and bordered by a region oftensile stress on the bottom side. For the top surface,there is a tensile residual stress near the center and isbordered by a region of compressive stresses. Forthe 100 µm sample under 4.95 GW/cm2, a compres-sive residual stress is generated on the bottom side,and there is a tensile residual stress on the top sur-face. Although the laser spot size is only 12 µm, thehigh shock pressure in µLPF can generate signifi-cant compressive residual stresses over a much larger
Figure 3Curvature Measurement on Bottom Side Before and After Peen Forming: (a) 100 µm sample with
3.57 GW/cm2 laser intensity; (b) 100 µm sample with 4.95 GW/cm2 laser intensity
Journal of Manufacturing ProcessesVol. 9/No. 1
2007
5
Figure 4Typical 3-D X-Ray Profile Spatial Distribution Across Shock Line of 100 µm Sample on Bottom Side
(laser energy 3.57 GW/cm2, spatial resolution 10 µm from line)
Figure 5Residual Stress Distribution by X-Ray Microdiffraction and FEM Simulation: (a) 100 µm sample bottom with 3.57 GW/cm2 laserintensity; (b) 100 µm sample top with 3.57 GW/cm2 laser intensity; (c) 100 µm sample bottom with 4.95 GW/cm2 laser intensity;
(d) 100 µm sample top with 4.95 GW/cm2 laser intensity
Journal of Manufacturing ProcessesVol. 9/No. 12007
6
region of up to 200 µm. For the 4.95 GW/cm2 condi-tion, the induced compressive stress is also largerthan that of 3.57 GW/cm2. The compressive stress isestimated to have a maximum value of –150 MPanear the center and cover a region of 120 µm in widthon the surface from the center for the 4.95 GW/cm2
laser intensity. It can be seen that compressive re-sidual stresses are induced in both sides for the con-vex bending, where the top side is tensile and thebottom side is compressive for concave bending.
FEM SimulationShock Pressure and Hardening andStrain Rate Effects
For this numerical simulation, the laser formingprocess is modeled as purely mechanical. The ana-lytical shock model is assumed the same as that ofµLSP and follows Fabbro et al.’s model (1990), whichassumes that the laser irradiation is uniform andshock propagation in the confining medium is one-dimensional. The shock pressure induced in a con-fined region is given by the following relationship(Fabbro et al. 1990):
( ) ( )=
2dL t P t
dt Z(1)
Z dL t
dt
ZL t
d L t
dtAI t
2
3
4
3
4
2 2
2+⎛⎝⎜
⎞⎠⎟
( )⎛⎝⎜
⎞⎠⎟
+ ( ) ( )= ( )
α α (2)
where Z = 2/(1/Z1 +1/Z2) is the shock wave imped-ance; the subscripts, 1 and 2, denote the solid targetmaterial and the confining medium, respectively; L(t),P(t), A, and � are plasma thickness, shock pressure,absorption coefficient, and interaction coefficient, re-spectively. To account for the small laser spot size,the spatially uniform shock pressure, P(t), relates tothe spatially nonuniform shock pressure as P(r,t) =P(t)exp(–r2
/2r02), where r is the radial distance from
the center of the laser beam and r0 the radius of laserbeam, which is 6 µm in this paper. The complete de-tail of the application of Fabbro’s model (1990) forµLSP can be found in Zhang and Yao (2002).
In LPF, the target is subjected to a very strongshock pressure (>1 GPa), a very short interactiontime (<100 ns), and very high strain rate (>100,000s–1). The increased strain rate has a much greatereffect on the material flow stress in LPF than a staticloading, which in turn influences the deformation of
the material. The total strain rate during laser form-ing can be decomposed into ε = ε + ε& & &e p
ij ij ij , where ε& ij ,ε& e
ij , and ε& pij represent total strain rate, elastic strain
rate, and plastic strain rate, respectively. The rela-tion between strain, εp
ij , stress, �ij, under plasticdeformation can be written as
( )ε = λσ
pij
ij
dfd d
d(3)
where f is the flow potential and d� is a constant.When the von Mises criterion is applied for f, theabove equation takes the following form for d�11:
d
d
pε
λσ
σ σ σ σ σ σ
σ σ
11
11
11 22
2
11 22
2
11 22
2
122
1
6
=
∂∂
−( ) + −( ) + −( )⎡⎣
⎤⎦
+ + 1132
232
11
+
⎧⎨⎪
⎩⎪
⎫⎬⎪
⎭⎪
= ( )σ
λd S
(4)
where Sij is the deviatoric part of stress.In the numerical simulation, the isotropic harden-
ing is accounted for by a Johnson-Cook plasticitylaw, which takes both strain and strain rate effectsinto consideration. Based on the Johnson-Cookmodel, the yield strength is written as:
Y Y C BT T
T Tn
m
= +⎡
⎣⎢
⎤
⎦⎥ +[ ] −
−−
⎛⎝⎜
⎞⎠⎟0
0
0
0
1 1 1lnεε
ε (5)
where C is the logarithmic rate sensitivity, � is strain,ε& is strain rate, and B and n are material parametersdescribing work-hardening effects. In this paper, thetemperature effect is negligible because there is nothermal effect in LPF.
Simulation Conditions
In the simulation, a two-dimensional deformationstate was assumed. This is reasonable because µLSPresults in a two-dimensional deformation if shock-ing the sample under the conditions as described inan earlier section (Chen, Yao, and Kysar 2004). Alength of 10 mm is computed, and bias mesh in thelateral direction is applied with the finest mesh inthe middle as small as 2.3 µm, which is much smallerthan the laser beam of 12 µm. The mesh in the depthdirection is constant with a size of 2 µm. CPE4R el-ements were employed in the analysis. Also, the twoends of the sample are fixed in the simulation, andthe bottom and top sides are free.
Journal of Manufacturing ProcessesVol. 9/No. 1
2007
7
The finite element solvers ABAQUS/Explicit andABAQUS/Standard were combined to perform thesimulation. These two solvers accomplish differentcalculations during this simulation. The simulation isdivided into two steps: (1) a high dynamic laser shockloading with the explicit version and (2) static un-loading corresponding to the relaxation process withthe implicit version. After the ABAQUS/Explicit analy-sis finishes, the information including the stress, strain,and displacement was exported to the ABAQUS/Stan-dard analysis. The ABAQUS/Explicit module is a non-linear, explicit, time-integration finite element codethat is especially well suited for solving high-speed,short-duration, highly dynamic events that requiremany small time step increments to obtain a high-
resolution solution. One important issue about themodeling is the balance between a short time for dy-namic shock-solid interaction (2~3 times of the laserpulse duration) and a much longer relaxation time(up to 1 second) to reach a stabilized mechanical state.
Simulation Model Validation
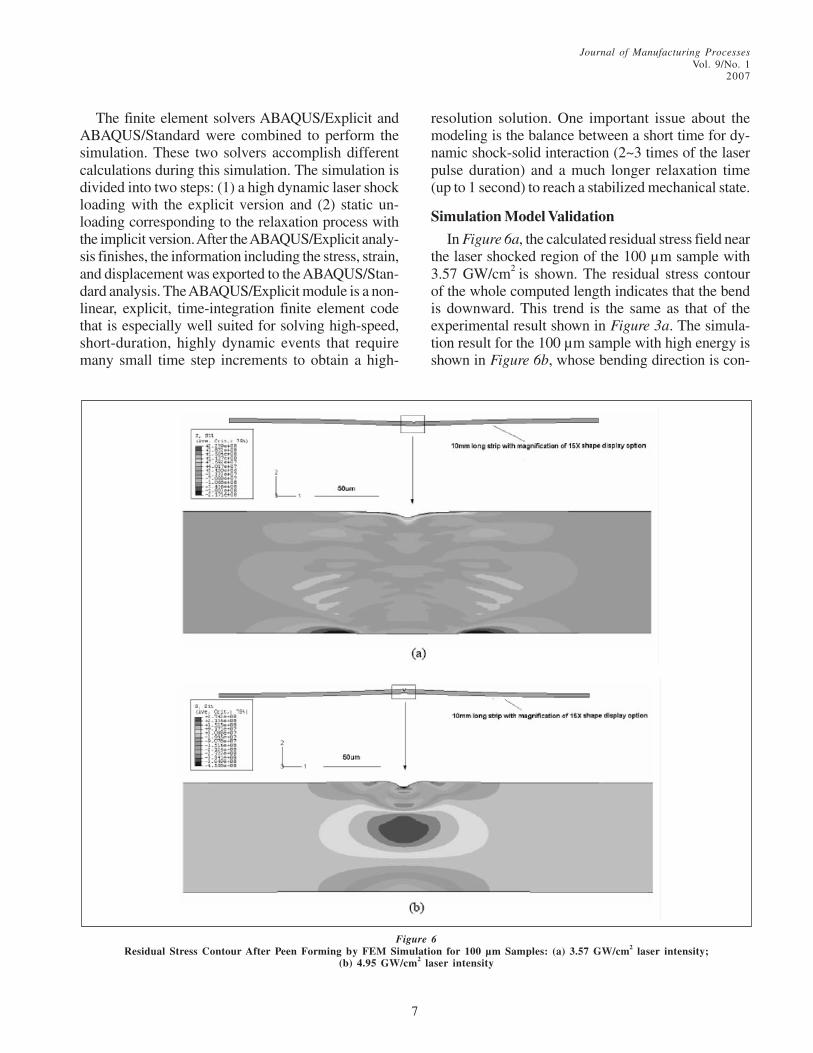
In Figure 6a, the calculated residual stress field nearthe laser shocked region of the 100 µm sample with3.57 GW/cm2
is shown. The residual stress contourof the whole computed length indicates that the bendis downward. This trend is the same as that of theexperimental result shown in Figure 3a. The simula-tion result for the 100 µm sample with high energy isshown in Figure 6b, whose bending direction is con-
Figure 6Residual Stress Contour After Peen Forming by FEM Simulation for 100 µm Samples: (a) 3.57 GW/cm2 laser intensity;
(b) 4.95 GW/cm2 laser intensity
Journal of Manufacturing ProcessesVol. 9/No. 12007
8
sistent with the experiment result from the profilometer(Figure 3b). For the residual stress distribution, it isfound from Figure 6 that the simulation model givesalmost the same patterns as the experiment results;that is, the top side is mainly tensile stress, while thebottom side is compressive for the 3.57 GW/cm2 case,and both sides are compressive for the 4.95 GW/cm2
case. To compare the simulation results of residualstress with the experimental results, the correspond-ing residual stress of the simulation at each point wasobtained by averaging over the effective penetrationdepth of X-ray microdiffraction. If it is chosen thatsurface layer contributes 95 percent of total diffractedintensity, the X-ray penetration depth for copper speci-men can be calculated as:
× θ=
μ0sin
2xK
x (6)
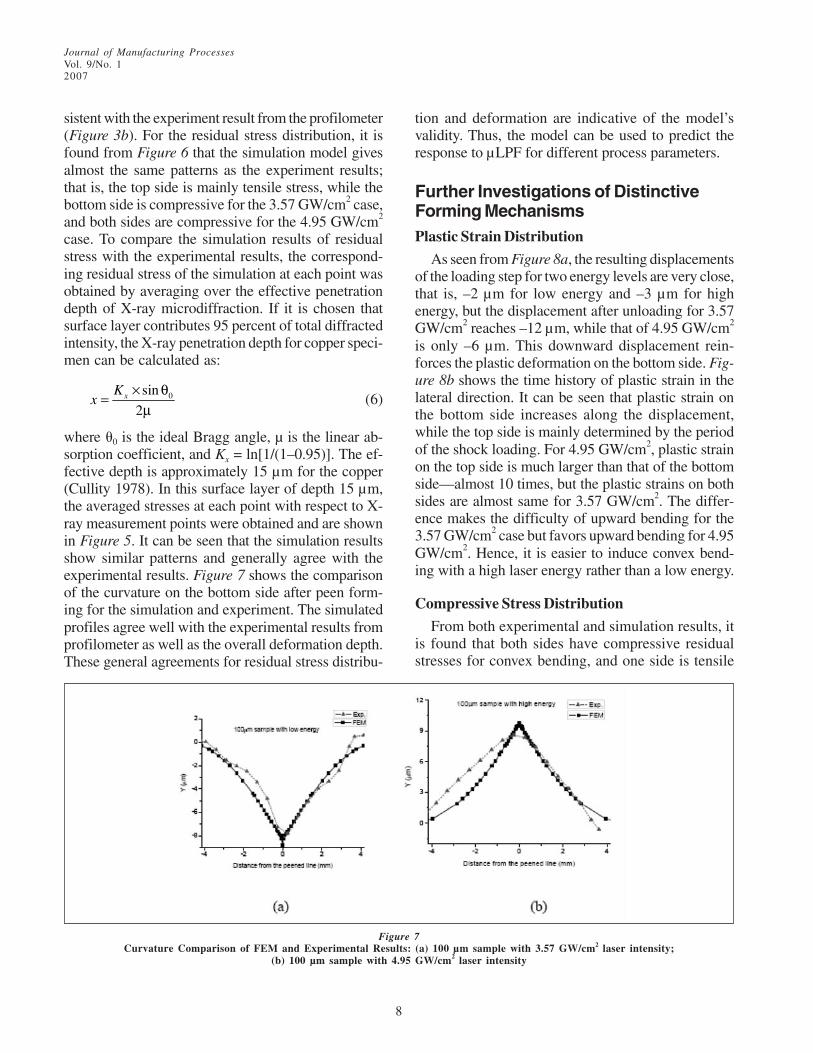
where �0 is the ideal Bragg angle, µ is the linear ab-sorption coefficient, and Kx = ln[1/(1–0.95)]. The ef-fective depth is approximately 15 µm for the copper(Cullity 1978). In this surface layer of depth 15 µm,the averaged stresses at each point with respect to X-ray measurement points were obtained and are shownin Figure 5. It can be seen that the simulation resultsshow similar patterns and generally agree with theexperimental results. Figure 7 shows the comparisonof the curvature on the bottom side after peen form-ing for the simulation and experiment. The simulatedprofiles agree well with the experimental results fromprofilometer as well as the overall deformation depth.These general agreements for residual stress distribu-
tion and deformation are indicative of the model’svalidity. Thus, the model can be used to predict theresponse to µLPF for different process parameters.
Further Investigations of DistinctiveForming MechanismsPlastic Strain Distribution
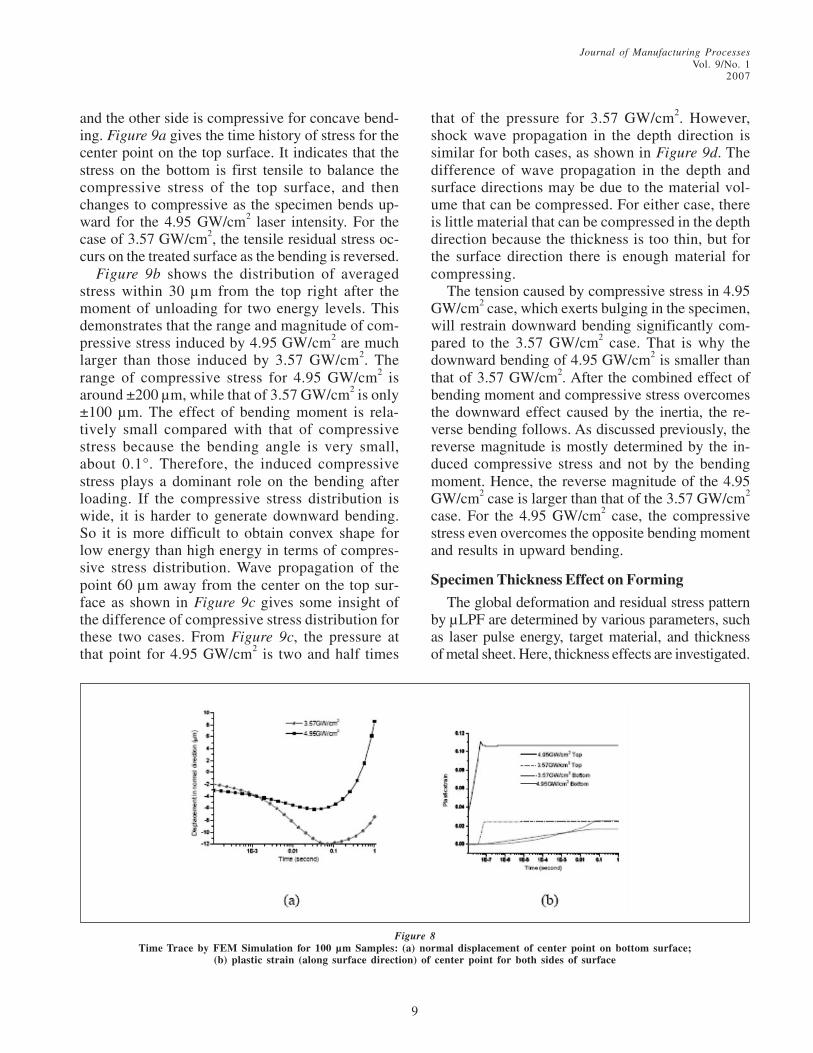
As seen from Figure 8a, the resulting displacementsof the loading step for two energy levels are very close,that is, –2 µm for low energy and –3 µm for highenergy, but the displacement after unloading for 3.57GW/cm2 reaches –12 µm, while that of 4.95 GW/cm2
is only –6 µm. This downward displacement rein-forces the plastic deformation on the bottom side. Fig-ure 8b shows the time history of plastic strain in thelateral direction. It can be seen that plastic strain onthe bottom side increases along the displacement,while the top side is mainly determined by the periodof the shock loading. For 4.95 GW/cm2, plastic strainon the top side is much larger than that of the bottomside—almost 10 times, but the plastic strains on bothsides are almost same for 3.57 GW/cm2. The differ-ence makes the difficulty of upward bending for the3.57 GW/cm2 case but favors upward bending for 4.95GW/cm2. Hence, it is easier to induce convex bend-ing with a high laser energy rather than a low energy.
Compressive Stress Distribution
From both experimental and simulation results, itis found that both sides have compressive residualstresses for convex bending, and one side is tensile
Figure 7Curvature Comparison of FEM and Experimental Results: (a) 100 µm sample with 3.57 GW/cm2 laser intensity;
(b) 100 µm sample with 4.95 GW/cm2 laser intensity
Journal of Manufacturing ProcessesVol. 9/No. 1
2007
9
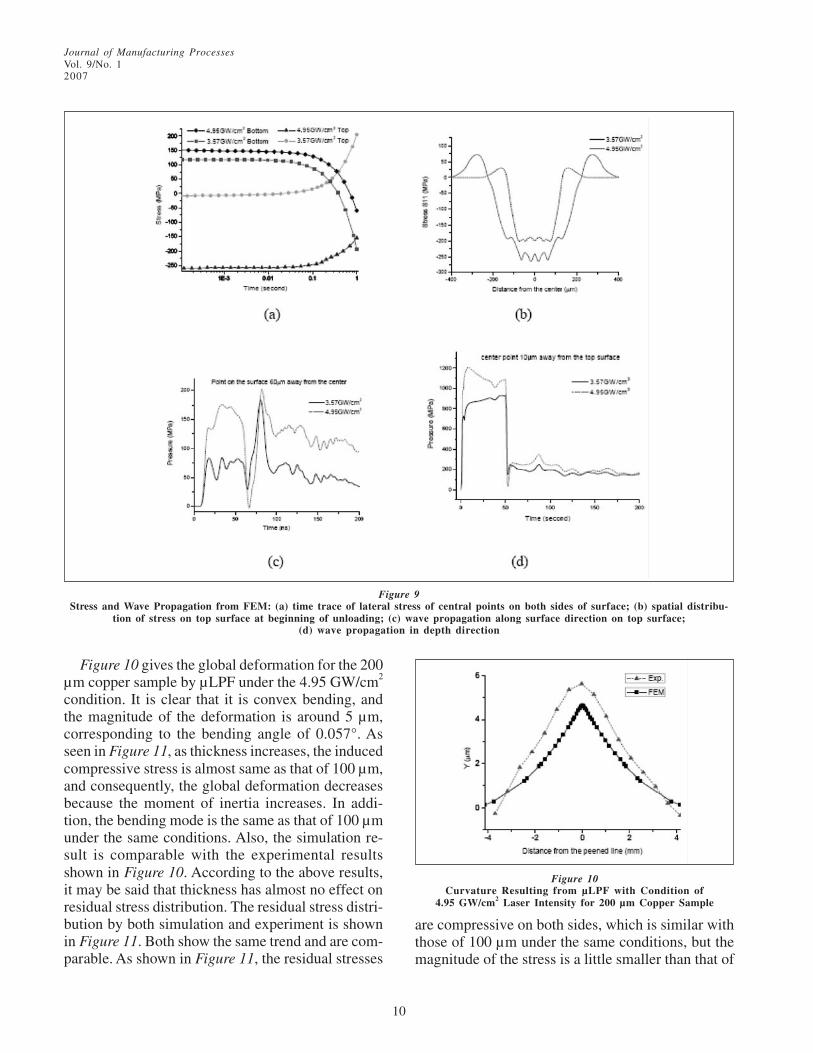
and the other side is compressive for concave bend-ing. Figure 9a gives the time history of stress for thecenter point on the top surface. It indicates that thestress on the bottom is first tensile to balance thecompressive stress of the top surface, and thenchanges to compressive as the specimen bends up-ward for the 4.95 GW/cm2 laser intensity. For thecase of 3.57 GW/cm2, the tensile residual stress oc-curs on the treated surface as the bending is reversed.
Figure 9b shows the distribution of averagedstress within 30 µm from the top right after themoment of unloading for two energy levels. Thisdemonstrates that the range and magnitude of com-pressive stress induced by 4.95 GW/cm2 are muchlarger than those induced by 3.57 GW/cm2. Therange of compressive stress for 4.95 GW/cm2 isaround ±200 µm, while that of 3.57 GW/cm2 is only±100 µm. The effect of bending moment is rela-tively small compared with that of compressivestress because the bending angle is very small,about 0.1°. Therefore, the induced compressivestress plays a dominant role on the bending afterloading. If the compressive stress distribution iswide, it is harder to generate downward bending.So it is more difficult to obtain convex shape forlow energy than high energy in terms of compres-sive stress distribution. Wave propagation of thepoint 60 µm away from the center on the top sur-face as shown in Figure 9c gives some insight ofthe difference of compressive stress distribution forthese two cases. From Figure 9c, the pressure atthat point for 4.95 GW/cm2 is two and half times
that of the pressure for 3.57 GW/cm2. However,shock wave propagation in the depth direction issimilar for both cases, as shown in Figure 9d. Thedifference of wave propagation in the depth andsurface directions may be due to the material vol-ume that can be compressed. For either case, thereis little material that can be compressed in the depthdirection because the thickness is too thin, but forthe surface direction there is enough material forcompressing.
The tension caused by compressive stress in 4.95GW/cm2 case, which exerts bulging in the specimen,will restrain downward bending significantly com-pared to the 3.57 GW/cm2 case. That is why thedownward bending of 4.95 GW/cm2 is smaller thanthat of 3.57 GW/cm2. After the combined effect ofbending moment and compressive stress overcomesthe downward effect caused by the inertia, the re-verse bending follows. As discussed previously, thereverse magnitude is mostly determined by the in-duced compressive stress and not by the bendingmoment. Hence, the reverse magnitude of the 4.95GW/cm2 case is larger than that of the 3.57 GW/cm2
case. For the 4.95 GW/cm2 case, the compressivestress even overcomes the opposite bending momentand results in upward bending.
Specimen Thickness Effect on Forming
The global deformation and residual stress patternby µLPF are determined by various parameters, suchas laser pulse energy, target material, and thicknessof metal sheet. Here, thickness effects are investigated.
Figure 8Time Trace by FEM Simulation for 100 µm Samples: (a) normal displacement of center point on bottom surface;
(b) plastic strain (along surface direction) of center point for both sides of surface
Journal of Manufacturing ProcessesVol. 9/No. 12007
10
Figure 10 gives the global deformation for the 200µm copper sample by µLPF under the 4.95 GW/cm2
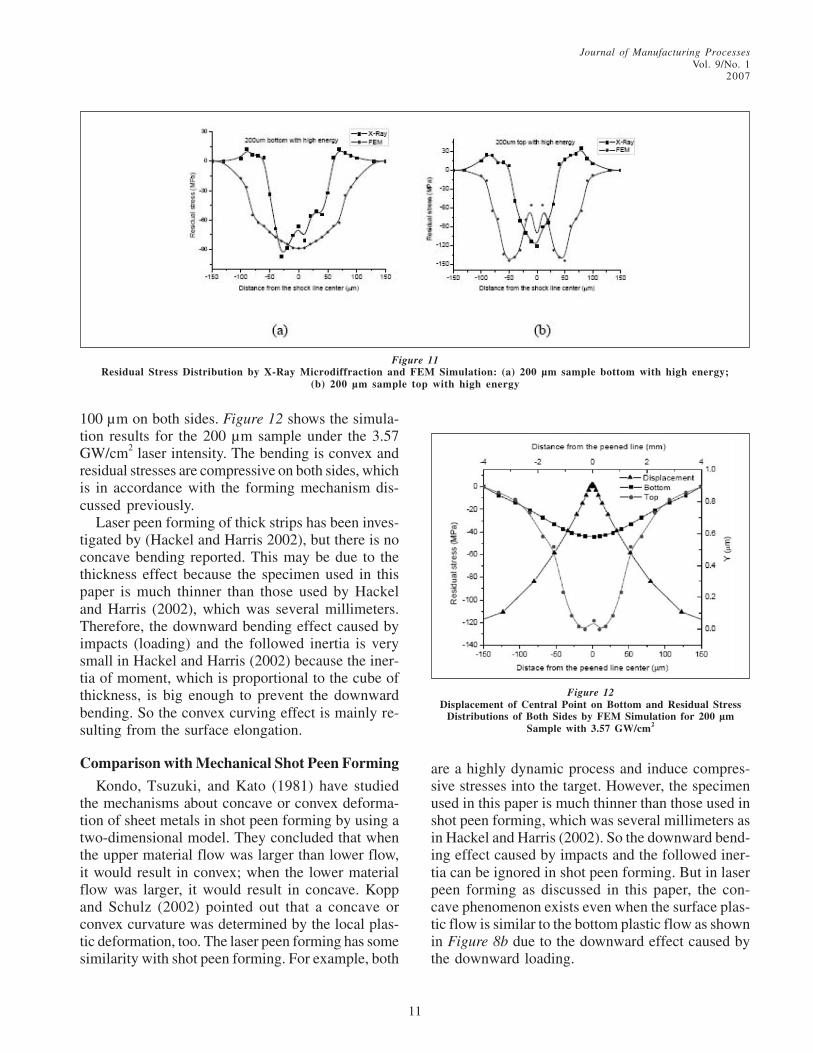
condition. It is clear that it is convex bending, andthe magnitude of the deformation is around 5 µm,corresponding to the bending angle of 0.057°. Asseen in Figure 11, as thickness increases, the inducedcompressive stress is almost same as that of 100 µm,and consequently, the global deformation decreasesbecause the moment of inertia increases. In addi-tion, the bending mode is the same as that of 100 µmunder the same conditions. Also, the simulation re-sult is comparable with the experimental resultsshown in Figure 10. According to the above results,it may be said that thickness has almost no effect onresidual stress distribution. The residual stress distri-bution by both simulation and experiment is shownin Figure 11. Both show the same trend and are com-parable. As shown in Figure 11, the residual stresses
are compressive on both sides, which is similar withthose of 100 µm under the same conditions, but themagnitude of the stress is a little smaller than that of
Figure 9Stress and Wave Propagation from FEM: (a) time trace of lateral stress of central points on both sides of surface; (b) spatial distribu-
tion of stress on top surface at beginning of unloading; (c) wave propagation along surface direction on top surface;(d) wave propagation in depth direction
Figure 10Curvature Resulting from µLPF with Condition of
4.95 GW/cm2 Laser Intensity for 200 µm Copper Sample
Journal of Manufacturing ProcessesVol. 9/No. 1
2007
11
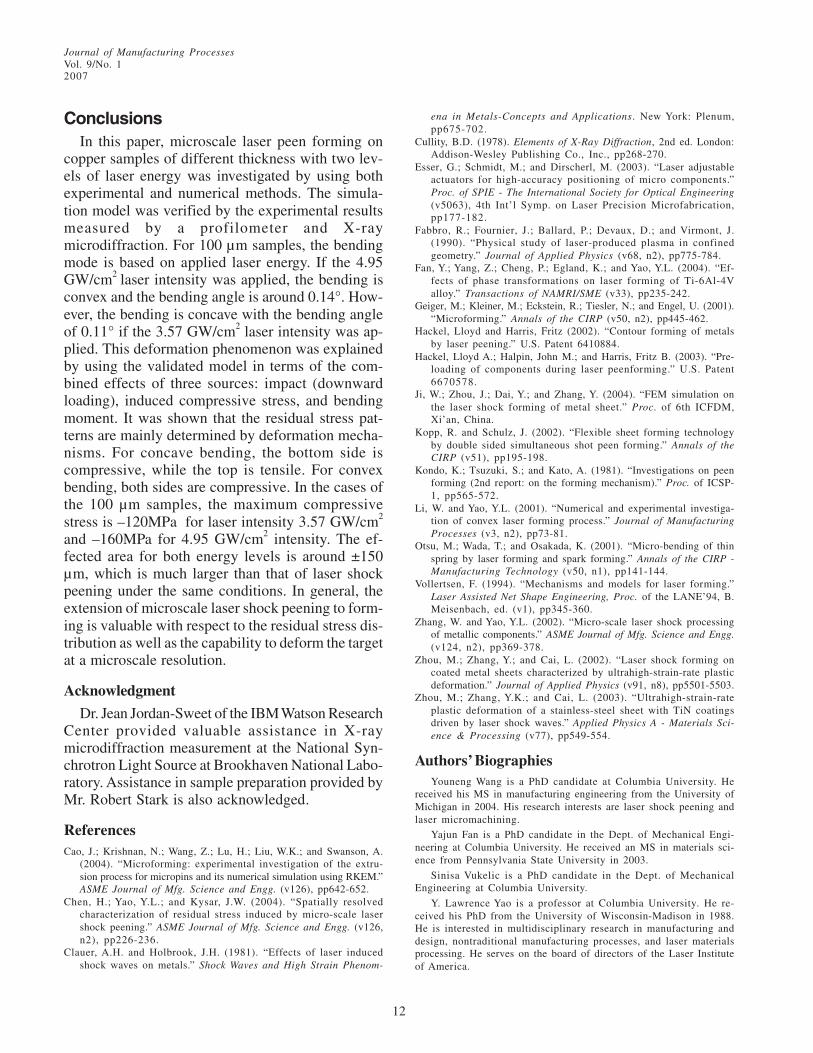
100 µm on both sides. Figure 12 shows the simula-tion results for the 200 µm sample under the 3.57GW/cm2 laser intensity. The bending is convex andresidual stresses are compressive on both sides, whichis in accordance with the forming mechanism dis-cussed previously.
Laser peen forming of thick strips has been inves-tigated by (Hackel and Harris 2002), but there is noconcave bending reported. This may be due to thethickness effect because the specimen used in thispaper is much thinner than those used by Hackeland Harris (2002), which was several millimeters.Therefore, the downward bending effect caused byimpacts (loading) and the followed inertia is verysmall in Hackel and Harris (2002) because the iner-tia of moment, which is proportional to the cube ofthickness, is big enough to prevent the downwardbending. So the convex curving effect is mainly re-sulting from the surface elongation.
Comparison with Mechanical Shot Peen Forming
Kondo, Tsuzuki, and Kato (1981) have studiedthe mechanisms about concave or convex deforma-tion of sheet metals in shot peen forming by using atwo-dimensional model. They concluded that whenthe upper material flow was larger than lower flow,it would result in convex; when the lower materialflow was larger, it would result in concave. Koppand Schulz (2002) pointed out that a concave orconvex curvature was determined by the local plas-tic deformation, too. The laser peen forming has somesimilarity with shot peen forming. For example, both
are a highly dynamic process and induce compres-sive stresses into the target. However, the specimenused in this paper is much thinner than those used inshot peen forming, which was several millimeters asin Hackel and Harris (2002). So the downward bend-ing effect caused by impacts and the followed iner-tia can be ignored in shot peen forming. But in laserpeen forming as discussed in this paper, the con-cave phenomenon exists even when the surface plas-tic flow is similar to the bottom plastic flow as shownin Figure 8b due to the downward effect caused bythe downward loading.
Figure 11Residual Stress Distribution by X-Ray Microdiffraction and FEM Simulation: (a) 200 µm sample bottom with high energy;
(b) 200 µm sample top with high energy
Figure 12Displacement of Central Point on Bottom and Residual Stress
Distributions of Both Sides by FEM Simulation for 200 µmSample with 3.57 GW/cm2
Journal of Manufacturing ProcessesVol. 9/No. 12007
12
ConclusionsIn this paper, microscale laser peen forming on
copper samples of different thickness with two lev-els of laser energy was investigated by using bothexperimental and numerical methods. The simula-tion model was verified by the experimental resultsmeasured by a profilometer and X-raymicrodiffraction. For 100 µm samples, the bendingmode is based on applied laser energy. If the 4.95GW/cm2
laser intensity was applied, the bending isconvex and the bending angle is around 0.14°. How-ever, the bending is concave with the bending angleof 0.11° if the 3.57 GW/cm2 laser intensity was ap-plied. This deformation phenomenon was explainedby using the validated model in terms of the com-bined effects of three sources: impact (downwardloading), induced compressive stress, and bendingmoment. It was shown that the residual stress pat-terns are mainly determined by deformation mecha-nisms. For concave bending, the bottom side iscompressive, while the top is tensile. For convexbending, both sides are compressive. In the cases ofthe 100 µm samples, the maximum compressivestress is –120MPa for laser intensity 3.57 GW/cm2
and –160MPa for 4.95 GW/cm2 intensity. The ef-fected area for both energy levels is around ±150µm, which is much larger than that of laser shockpeening under the same conditions. In general, theextension of microscale laser shock peening to form-ing is valuable with respect to the residual stress dis-tribution as well as the capability to deform the targetat a microscale resolution.
Acknowledgment
Dr. Jean Jordan-Sweet of the IBM Watson ResearchCenter provided valuable assistance in X-raymicrodiffraction measurement at the National Syn-chrotron Light Source at Brookhaven National Labo-ratory. Assistance in sample preparation provided byMr. Robert Stark is also acknowledged.
ReferencesCao, J.; Krishnan, N.; Wang, Z.; Lu, H.; Liu, W.K.; and Swanson, A.
(2004). “Microforming: experimental investigation of the extru-sion process for micropins and its numerical simulation using RKEM.”ASME Journal of Mfg. Science and Engg. (v126), pp642-652.
Chen, H.; Yao, Y.L.; and Kysar, J.W. (2004). “Spatially resolvedcharacterization of residual stress induced by micro-scale lasershock peening.” ASME Journal of Mfg. Science and Engg. (v126,n2), pp226-236.
Clauer, A.H. and Holbrook, J.H. (1981). “Effects of laser inducedshock waves on metals.” Shock Waves and High Strain Phenom-
ena in Metals-Concepts and Applications. New York: Plenum,pp675-702.
Cullity, B.D. (1978). Elements of X-Ray Diffraction, 2nd ed. London:Addison-Wesley Publishing Co., Inc., pp268-270.
Esser, G.; Schmidt, M.; and Dirscherl, M. (2003). “Laser adjustableactuators for high-accuracy positioning of micro components.”Proc. of SPIE - The International Society for Optical Engineering(v5063), 4th Int’l Symp. on Laser Precision Microfabrication,pp177-182.
Fabbro, R.; Fournier, J.; Ballard, P.; Devaux, D.; and Virmont, J.(1990). “Physical study of laser-produced plasma in confinedgeometry.” Journal of Applied Physics (v68, n2), pp775-784.
Fan, Y.; Yang, Z.; Cheng, P.; Egland, K.; and Yao, Y.L. (2004). “Ef-fects of phase transformations on laser forming of Ti-6Al-4Valloy.” Transactions of NAMRI/SME (v33), pp235-242.
Geiger, M.; Kleiner, M.; Eckstein, R.; Tiesler, N.; and Engel, U. (2001).“Microforming.” Annals of the CIRP (v50, n2), pp445-462.
Hackel, Lloyd and Harris, Fritz (2002). “Contour forming of metalsby laser peening.” U.S. Patent 6410884.
Hackel, Lloyd A.; Halpin, John M.; and Harris, Fritz B. (2003). “Pre-loading of components during laser peenforming.” U.S. Patent6670578.
Ji, W.; Zhou, J.; Dai, Y.; and Zhang, Y. (2004). “FEM simulation onthe laser shock forming of metal sheet.” Proc. of 6th ICFDM,Xi’an, China.
Kopp, R. and Schulz, J. (2002). “Flexible sheet forming technologyby double sided simultaneous shot peen forming.” Annals of theCIRP (v51), pp195-198.
Kondo, K.; Tsuzuki, S.; and Kato, A. (1981). “Investigations on peenforming (2nd report: on the forming mechanism).” Proc. of ICSP-1, pp565-572.
Li, W. and Yao, Y.L. (2001). “Numerical and experimental investiga-tion of convex laser forming process.” Journal of ManufacturingProcesses (v3, n2), pp73-81.
Otsu, M.; Wada, T.; and Osakada, K. (2001). “Micro-bending of thinspring by laser forming and spark forming.” Annals of the CIRP -Manufacturing Technology (v50, n1), pp141-144.
Vollertsen, F. (1994). “Mechanisms and models for laser forming.”Laser Assisted Net Shape Engineering, Proc. of the LANE’94, B.Meisenbach, ed. (v1), pp345-360.
Zhang, W. and Yao, Y.L. (2002). “Micro-scale laser shock processingof metallic components.” ASME Journal of Mfg. Science and Engg.(v124, n2), pp369-378.
Zhou, M.; Zhang, Y.; and Cai, L. (2002). “Laser shock forming oncoated metal sheets characterized by ultrahigh-strain-rate plasticdeformation.” Journal of Applied Physics (v91, n8), pp5501-5503.
Zhou, M.; Zhang, Y.K.; and Cai, L. (2003). “Ultrahigh-strain-rateplastic deformation of a stainless-steel sheet with TiN coatingsdriven by laser shock waves.” Applied Physics A - Materials Sci-ence & Processing (v77), pp549-554.
Authors’ BiographiesYouneng Wang is a PhD candidate at Columbia University. He
received his MS in manufacturing engineering from the University ofMichigan in 2004. His research interests are laser shock peening andlaser micromachining.
Yajun Fan is a PhD candidate in the Dept. of Mechanical Engi-neering at Columbia University. He received an MS in materials sci-ence from Pennsylvania State University in 2003.
Sinisa Vukelic is a PhD candidate in the Dept. of MechanicalEngineering at Columbia University.
Y. Lawrence Yao is a professor at Columbia University. He re-ceived his PhD from the University of Wisconsin-Madison in 1988.He is interested in multidisciplinary research in manufacturing anddesign, nontraditional manufacturing processes, and laser materialsprocessing. He serves on the board of directors of the Laser Instituteof America.