end-user guide for sap ibp, add-in for microsoft excel
TRANSCRIPT

PUBLIC
Product Management, SAP
August, 2021
SAP Integrated Business Planning, add-in for Microsoft ExcelFeature Overview and End-User Guide Based on the Excel Add-In Version 2108.2.0
2PUBLIC© 2021 SAP SE or an SAP affiliate company. All rights reserved. ǀ
The SAP Integrated Business Planning, add-in for Microsoft Excel (short: Excel add-in) is one of the
key access points to key figures and master data that is stored in the SAP IBP backend. It is one of
the main user interfaces for the end users of SAP Integrated Business Planning (SAP IBP).
The following slides aim to provide an overview of the key features and concepts of the Excel add-
in and are intended for end users. The presentation can be used, for example, for end user training
during an implementation project.
Please note that the screenshots and examples are based on test sample planning views and a test
data set. The planning view templates and planning views can look different in your case due to
custom formatting, branding, and additional VBA code that you have embedded.
About this document

3PUBLIC© 2021 SAP SE or an SAP affiliate company. All rights reserved. ǀ
• Time-based disaggregation of partially editable child nodes (page 125 - 129)
• Simulations with inventory profiles (page 140)
What’s New in 2108.2.0

4PUBLIC© 2021 SAP SE or an SAP affiliate company. All rights reserved. ǀ
1) Introduction
2) How to log on to SAP Integrated Business Planning via the Excel add-in
3) How to create planning views
4) How to save data
5) How to work with planning views
6) Application jobs in the Excel add-in
7) Master data maintenance
8) Alert key figures and alert dashboard
9) S&OP task management
10) Navigation to the Web UI
11) User settings and more in the About area
12) How to log off from the Excel add-in and troubleshooting a disabled Excel add-in
Agenda
Introduction

6PUBLIC© 2021 SAP SE or an SAP affiliate company. All rights reserved. ǀ
Planning in Microsoft Excel for professional planners
• Real-time access to your SAP IBP system and data, directly in Microsoft Excel
• Create custom planning views easily
• Visualize, analyze, and adapt your master data and time series data
• Run planning operators in simulation mode for ad-hoc what-if analysis and create your own scenarios
• Use local key figures to quickly use your custom Excel formulas on SAP IBP data
• Use own VBA coding to further finetune planning views and planner interaction
7PUBLIC© 2021 SAP SE or an SAP affiliate company. All rights reserved. ǀ
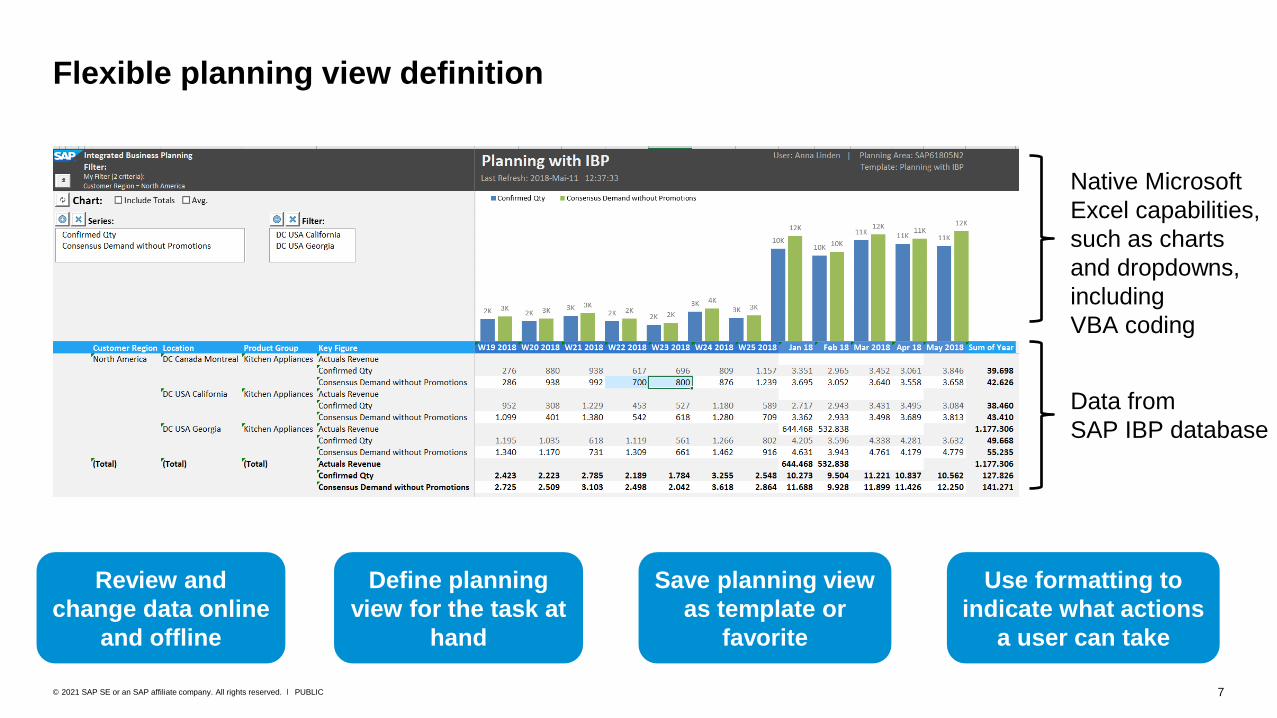
Flexible planning view definition
Native Microsoft
Excel capabilities,
such as charts
and dropdowns,
including
VBA coding
Data from
SAP IBP database
Review and
change data online
and offline
Save planning view
as template or
favorite
Use formatting to
indicate what actions
a user can take
Define planning
view for the task at
hand
8PUBLIC© 2021 SAP SE or an SAP affiliate company. All rights reserved. ǀ
• The Excel add-in does not run in the SAP Cloud (which SAP Integrated Business Planning does), but needs to be installed on the PCs of the individual users, or needs to be made available to the users in a Citrix environment at the customer. The customer is responsible for upgrading the add-in versions for the individual users.
• With every SAP IBP release, a new Excel add-in version is also released, but it is not mandatory to use the newest add-in version, even though it is best practice.
• New features, such as planning notes or fixing of key figures, are only available as of the respective Excel add-in version.
• The current Excel add-in versions are upward compatible and downward compatible. This means that they can be used with lower and higher releases of SAP IBP. However, some functionality might not be available if you use an older Excel add-in version with a newer SAP IBP backend system. The lowest possible version that can be used is the 1808.2.0 version of the Excel add-in.
• For more information, see SAP Note 2394311 (Version information for the IBP Excel add-in) at https://launchpad.support.sap.com/#/notes/2394311.
• SAP IBP and the SAP IBP, add-in for Microsoft Excel are released with certain known restrictions in functionality. For more information, see the Release Restriction Note (SAP Note 3017652) at https://launchpad.support.sap.com/#/notes/3017652.
Some key facts about the Excel add-in

9PUBLIC© 2021 SAP SE or an SAP affiliate company. All rights reserved. ǀ
• User must have the Excel add-in installed (or have access to it via Citrix).
• User’s PC must be connected to the Internet.
• User must have a user in the SAP IBP system.
• User must have at least basic authorization to view data in the Excel add-in.
• SAP IBP backend system must be up and running.
• Planning area must be active.
Prerequisites for working with the Excel add-in
10PUBLIC© 2021 SAP SE or an SAP affiliate company. All rights reserved. ǀ
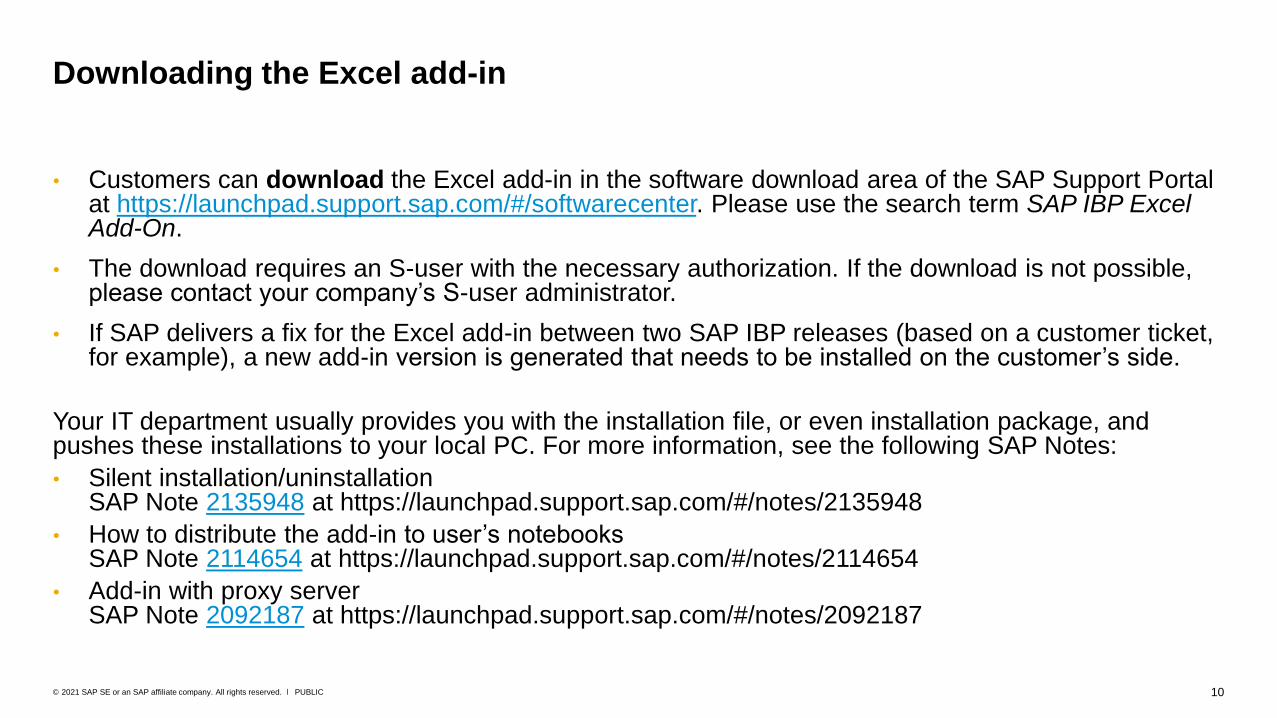
• Customers can download the Excel add-in in the software download area of the SAP Support Portal at https://launchpad.support.sap.com/#/softwarecenter. Please use the search term SAP IBP Excel Add-On.
• The download requires an S-user with the necessary authorization. If the download is not possible, please contact your company’s S-user administrator.
• If SAP delivers a fix for the Excel add-in between two SAP IBP releases (based on a customer ticket, for example), a new add-in version is generated that needs to be installed on the customer’s side.
Your IT department usually provides you with the installation file, or even installation package, and pushes these installations to your local PC. For more information, see the following SAP Notes:
• Silent installation/uninstallationSAP Note 2135948 at https://launchpad.support.sap.com/#/notes/2135948
• How to distribute the add-in to user’s notebooksSAP Note 2114654 at https://launchpad.support.sap.com/#/notes/2114654
• Add-in with proxy serverSAP Note 2092187 at https://launchpad.support.sap.com/#/notes/2092187
Downloading the Excel add-in

11PUBLIC© 2021 SAP SE or an SAP affiliate company. All rights reserved. ǀ
• The Excel add-in can run on a MacBook. The prerequisite is that a virtual machine (VM) is set-
up and that a Windows and Office environment is installed on the VM. Then you can install the
Excel add-in on that VM as usual.
• The Excel add-in can be installed on Microsoft Surface devices.
• You cannot install the Excel add-in on a smartphone or tablet.
Excel add-in on a MacBook and mobile devices
How to Log on to SAP IBP Using the
Excel Add-In
13PUBLIC© 2021 SAP SE or an SAP affiliate company. All rights reserved. ǀ
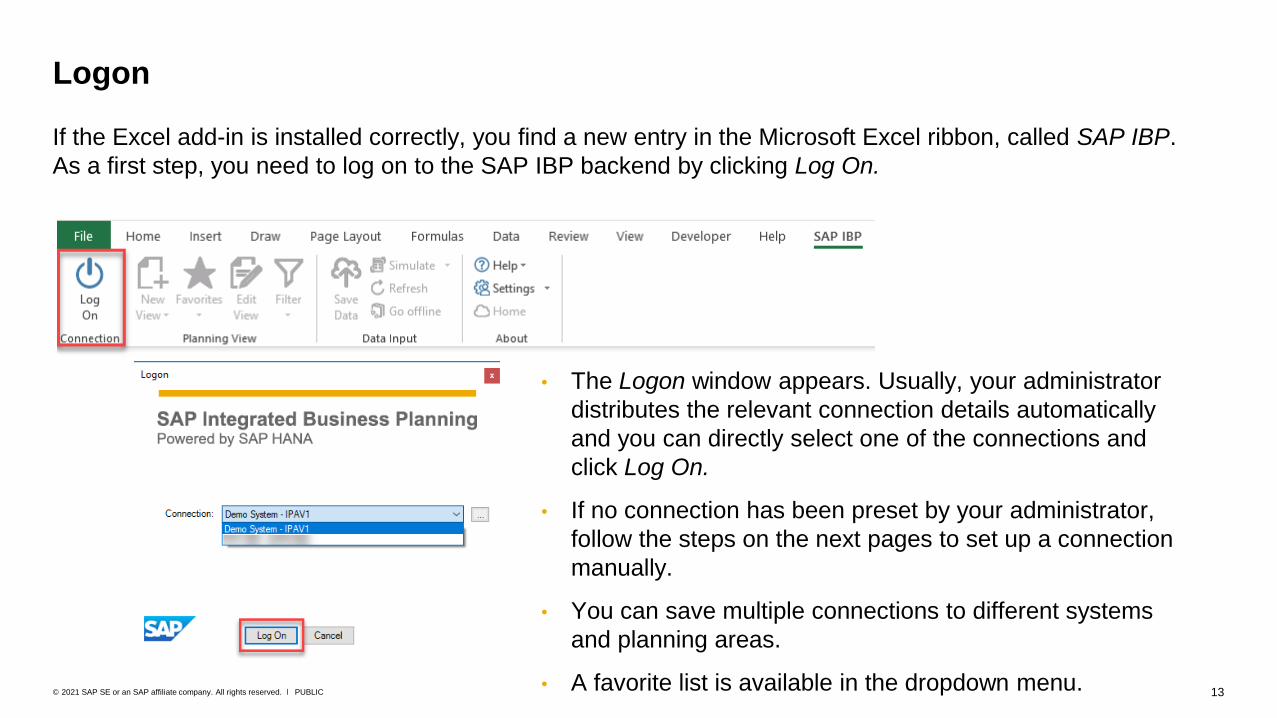
Logon
• The Logon window appears. Usually, your administrator
distributes the relevant connection details automatically
and you can directly select one of the connections and
click Log On.
• If no connection has been preset by your administrator,
follow the steps on the next pages to set up a connection
manually.
• You can save multiple connections to different systems
and planning areas.
• A favorite list is available in the dropdown menu.
If the Excel add-in is installed correctly, you find a new entry in the Microsoft Excel ribbon, called SAP IBP.
As a first step, you need to log on to the SAP IBP backend by clicking Log On.

14PUBLIC© 2021 SAP SE or an SAP affiliate company. All rights reserved. ǀ
Step 1: Navigate to the Connection Manager
To set up a new
connection,
click
Then click Create.
Setting up a connection (1)
Connection Manager:
15PUBLIC© 2021 SAP SE or an SAP affiliate company. All rights reserved. ǀ
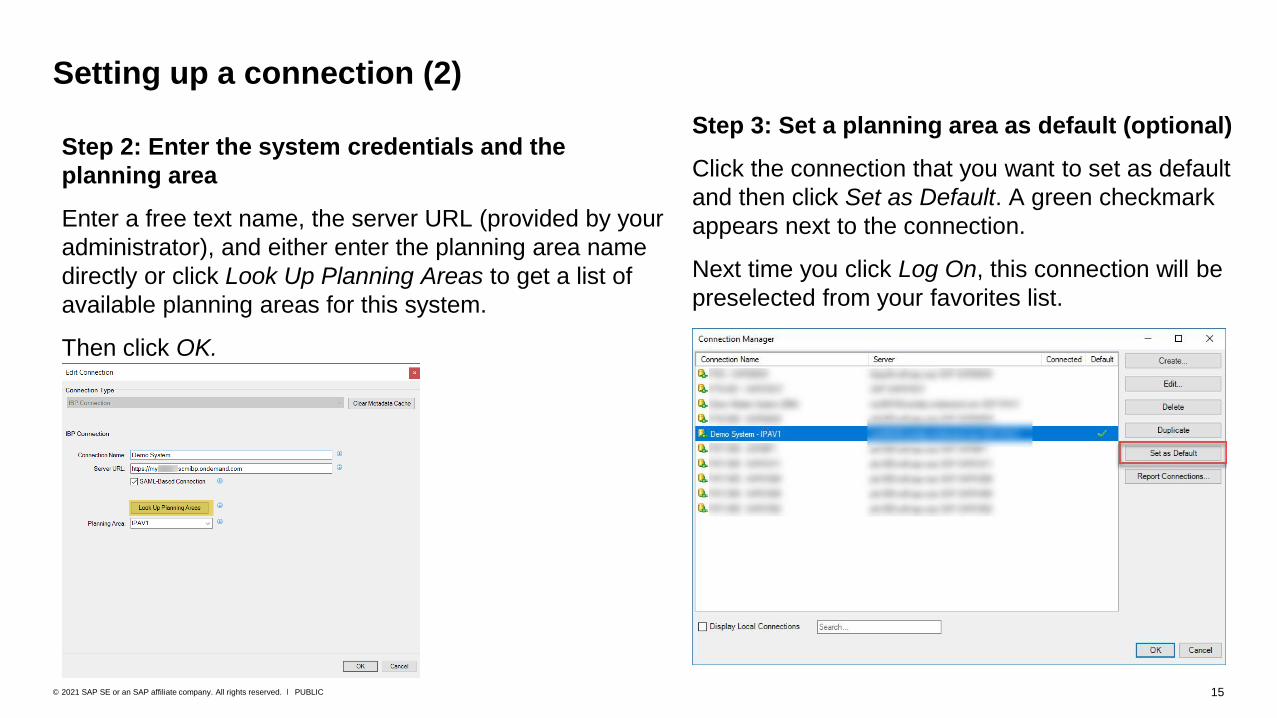
Setting up a connection (2)
Step 2: Enter the system credentials and the
planning area
Enter a free text name, the server URL (provided by your
administrator), and either enter the planning area name
directly or click Look Up Planning Areas to get a list of
available planning areas for this system.
Then click OK.
Step 3: Set a planning area as default (optional)
Click the connection that you want to set as default
and then click Set as Default. A green checkmark
appears next to the connection.
Next time you click Log On, this connection will be
preselected from your favorites list.
16PUBLIC© 2021 SAP SE or an SAP affiliate company. All rights reserved. ǀ
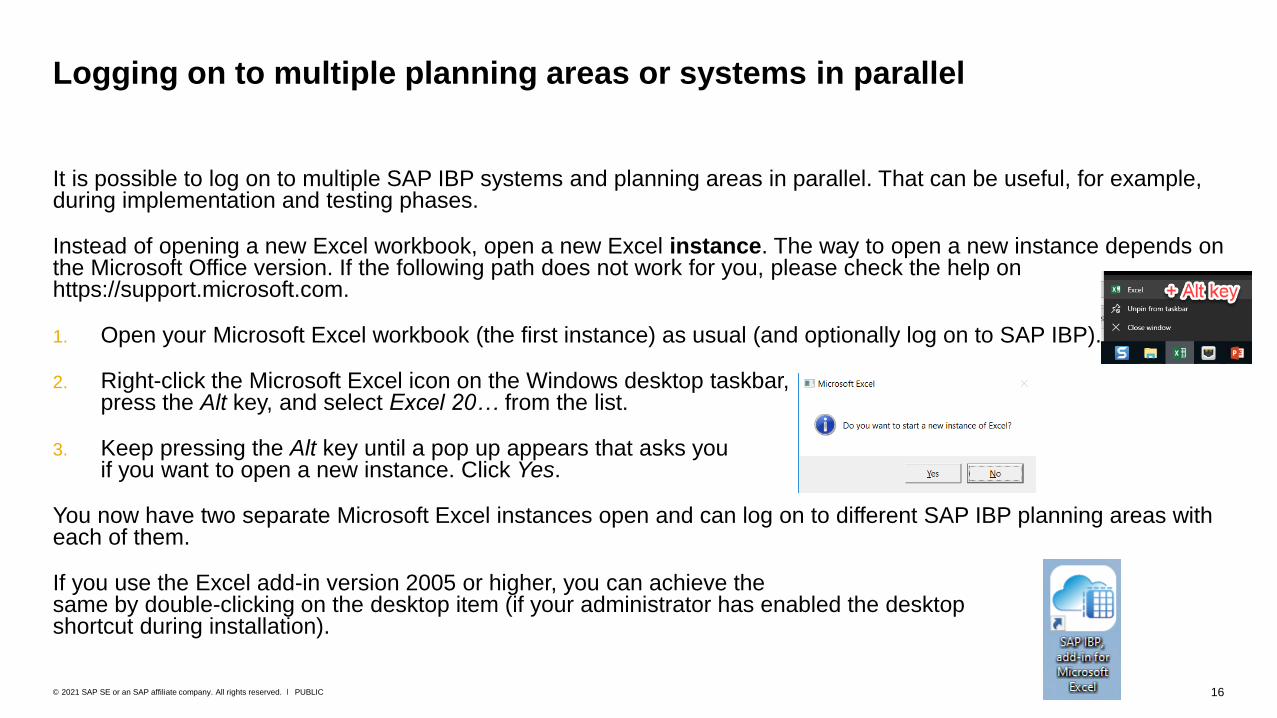
It is possible to log on to multiple SAP IBP systems and planning areas in parallel. That can be useful, for example, during implementation and testing phases.
Instead of opening a new Excel workbook, open a new Excel instance. The way to open a new instance depends on the Microsoft Office version. If the following path does not work for you, please check the help on https://support.microsoft.com.
1. Open your Microsoft Excel workbook (the first instance) as usual (and optionally log on to SAP IBP).
2. Right-click the Microsoft Excel icon on the Windows desktop taskbar, press the Alt key, and select Excel 20… from the list.
3. Keep pressing the Alt key until a pop up appears that asks you if you want to open a new instance. Click Yes.
You now have two separate Microsoft Excel instances open and can log on to different SAP IBP planning areas with each of them.
If you use the Excel add-in version 2005 or higher, you can achieve the same by double-clicking on the desktop item (if your administrator has enabled the desktop shortcut during installation).
Logging on to multiple planning areas or systems in parallel
17PUBLIC© 2021 SAP SE or an SAP affiliate company. All rights reserved. ǀ
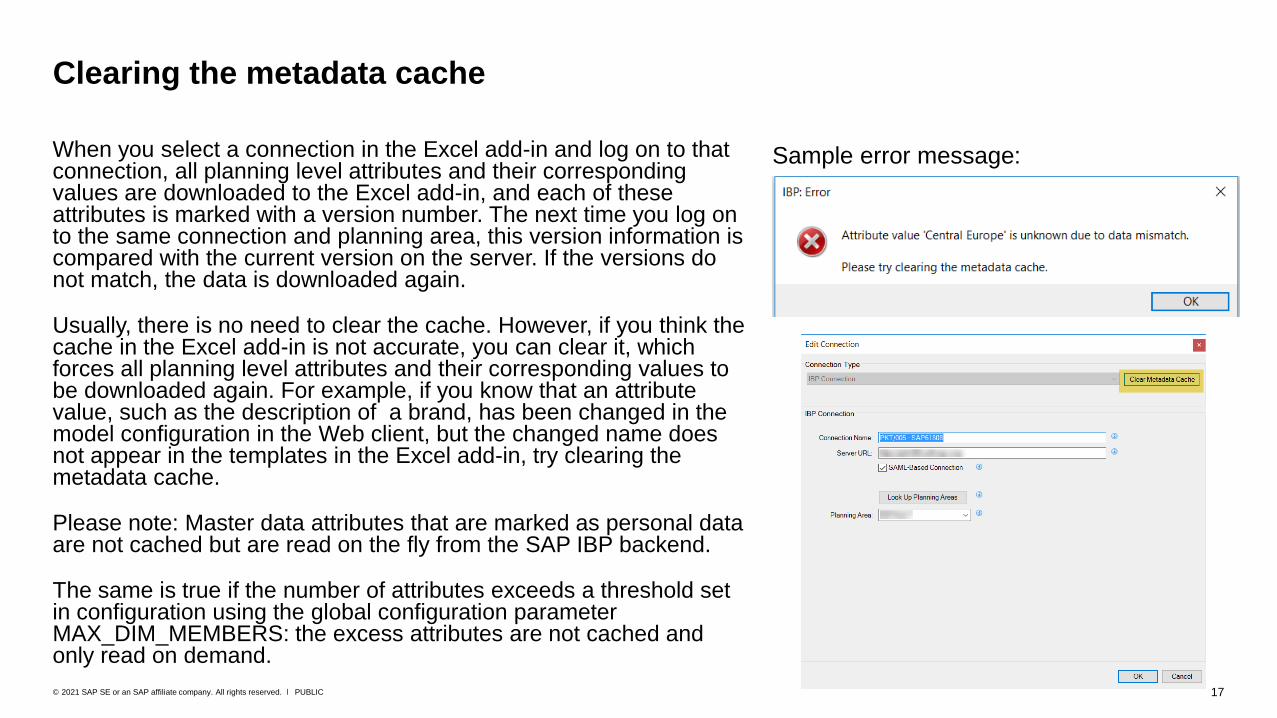
When you select a connection in the Excel add-in and log on to that connection, all planning level attributes and their corresponding values are downloaded to the Excel add-in, and each of these attributes is marked with a version number. The next time you log on to the same connection and planning area, this version information is compared with the current version on the server. If the versions do not match, the data is downloaded again.
Usually, there is no need to clear the cache. However, if you think the cache in the Excel add-in is not accurate, you can clear it, which forces all planning level attributes and their corresponding values to be downloaded again. For example, if you know that an attribute value, such as the description of a brand, has been changed in the model configuration in the Web client, but the changed name does not appear in the templates in the Excel add-in, try clearing the metadata cache.
Please note: Master data attributes that are marked as personal data are not cached but are read on the fly from the SAP IBP backend.
The same is true if the number of attributes exceeds a threshold set in configuration using the global configuration parameter MAX_DIM_MEMBERS: the excess attributes are not cached and only read on demand.
Clearing the metadata cache
Sample error message:
How to Create Planning Views
19PUBLIC© 2021 SAP SE or an SAP affiliate company. All rights reserved. ǀ
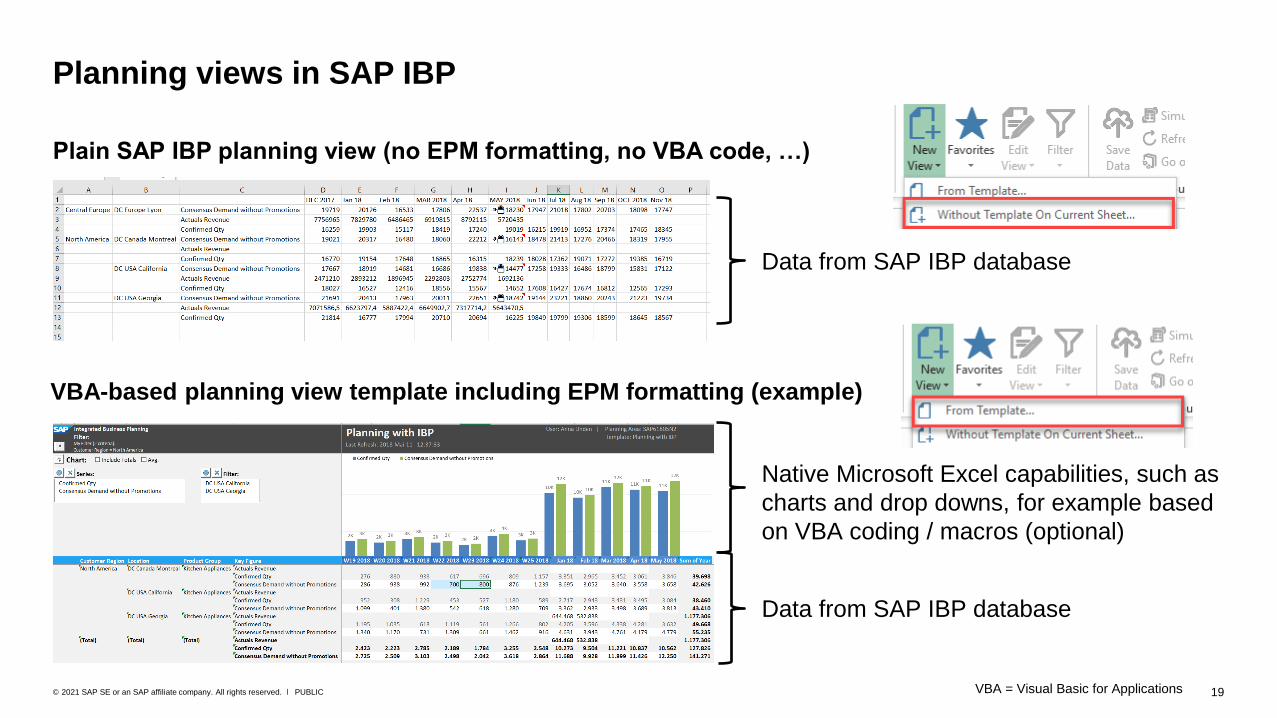
VBA-based planning view template including EPM formatting (example)
Planning views in SAP IBP
Plain SAP IBP planning view (no EPM formatting, no VBA code, …)
Native Microsoft Excel capabilities, such as
charts and drop downs, for example based
on VBA coding / macros (optional)
Data from SAP IBP database
Data from SAP IBP database
VBA = Visual Basic for Applications

Basic Settings

21PUBLIC© 2021 SAP SE or an SAP affiliate company. All rights reserved. ǀ
To open a predefined planning view (template or favorite) or create a planning view from scratch, click New View in the SAP IBP ribbon. Then choose one of the following:
• From Template
• Without Template on Current Sheet, if you want to create a plain planning view from scratch.
This option will be explained in the following slides.
Creating a new planning view (1)
22PUBLIC© 2021 SAP SE or an SAP affiliate company. All rights reserved. ǀ
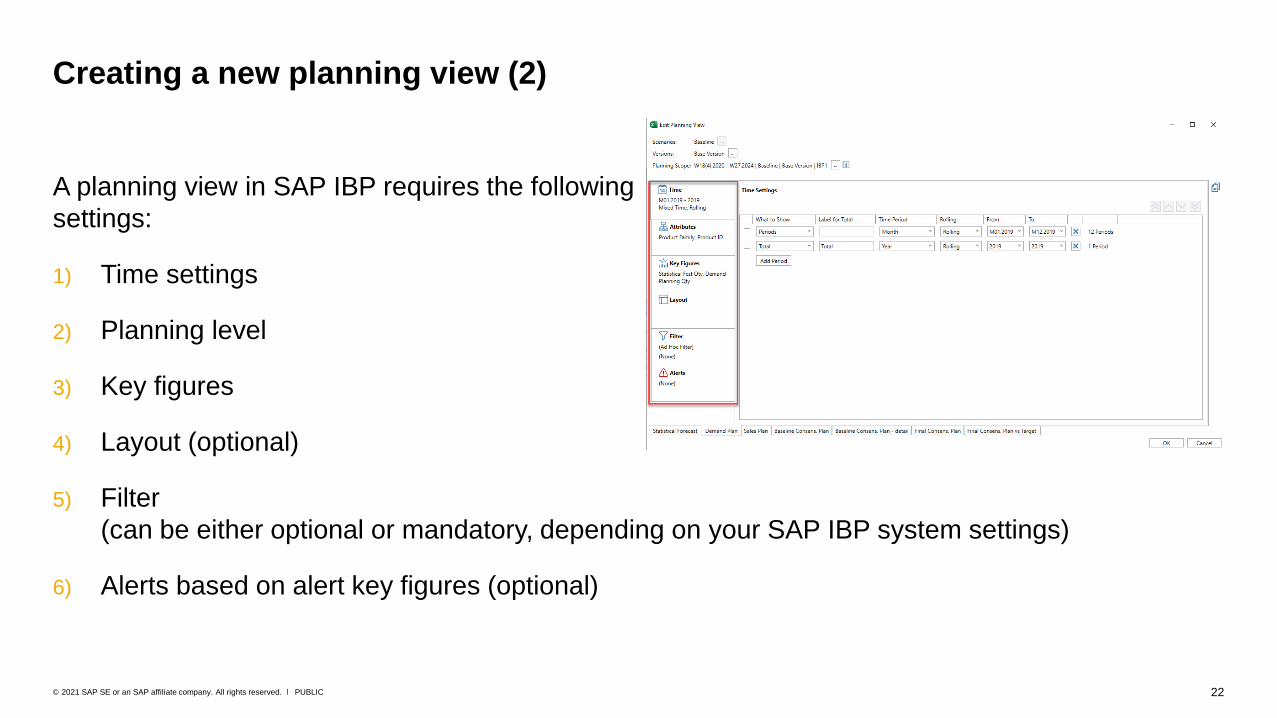
A planning view in SAP IBP requires the following
settings:
1) Time settings
2) Planning level
3) Key figures
4) Layout (optional)
5) Filter
(can be either optional or mandatory, depending on your SAP IBP system settings)
6) Alerts based on alert key figures (optional)
Creating a new planning view (2)
23PUBLIC© 2021 SAP SE or an SAP affiliate company. All rights reserved. ǀ
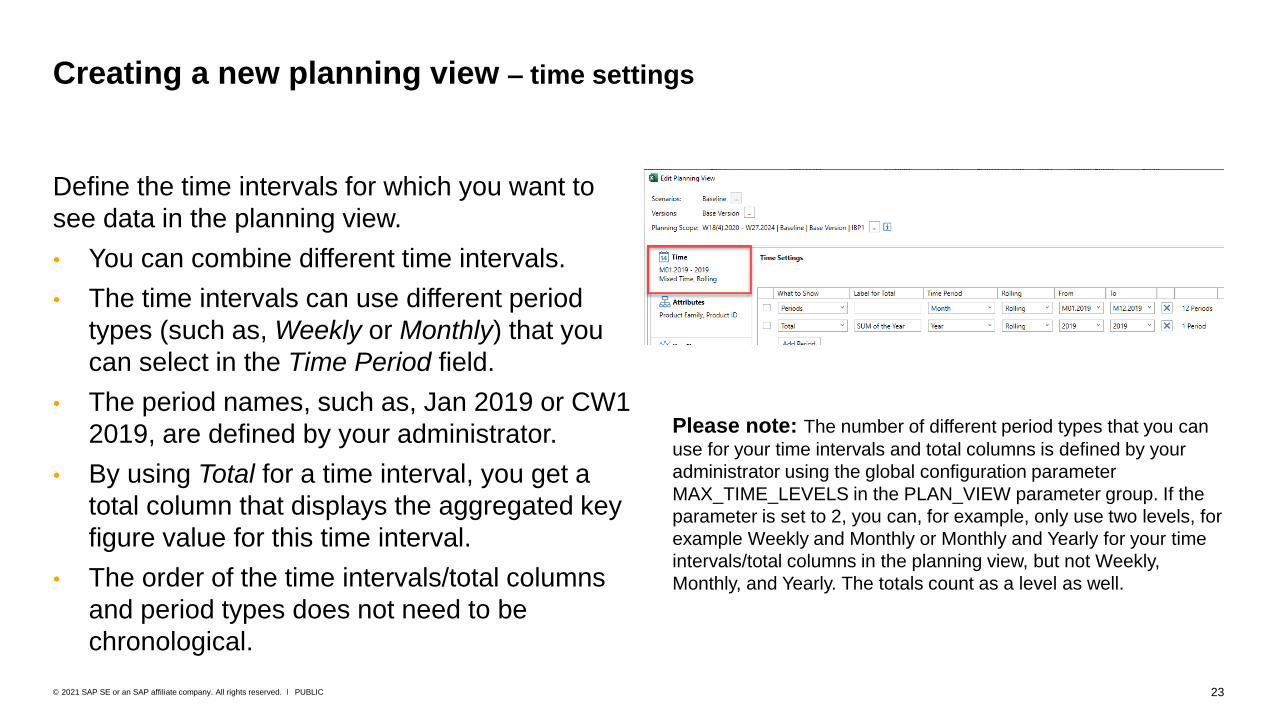
Define the time intervals for which you want to
see data in the planning view.
• You can combine different time intervals.
• The time intervals can use different period
types (such as, Weekly or Monthly) that you
can select in the Time Period field.
• The period names, such as, Jan 2019 or CW1
2019, are defined by your administrator.
• By using Total for a time interval, you get a
total column that displays the aggregated key
figure value for this time interval.
• The order of the time intervals/total columns
and period types does not need to be
chronological.
Creating a new planning view – time settings
Please note: The number of different period types that you can
use for your time intervals and total columns is defined by your
administrator using the global configuration parameter
MAX_TIME_LEVELS in the PLAN_VIEW parameter group. If the
parameter is set to 2, you can, for example, only use two levels, for
example Weekly and Monthly or Monthly and Yearly for your time
intervals/total columns in the planning view, but not Weekly,
Monthly, and Yearly. The totals count as a level as well.

24PUBLIC© 2021 SAP SE or an SAP affiliate company. All rights reserved. ǀ
Data in SAP IBP is stored at the base level of the respective key figure. The base level defines the type of periods in which the data is stored, for example, weeks or days. When displaying the data, it is automatically aggregated up to the requested time period. Example: if key figure data is stored in days and your planning view displays months, then the days are aggregated to months.
How the data is aggregatedis defined in the key figure configuration. Example: Sum for quantity-based key figures, Avg (average) for prices
Your administrator can also define a more complex aggregation and disaggregation logic, dependent on the individual use case.
On-the-fly aggregation of data across time periods
Dis
aggre
gation
Aggre
gation
25PUBLIC© 2021 SAP SE or an SAP affiliate company. All rights reserved. ǀ
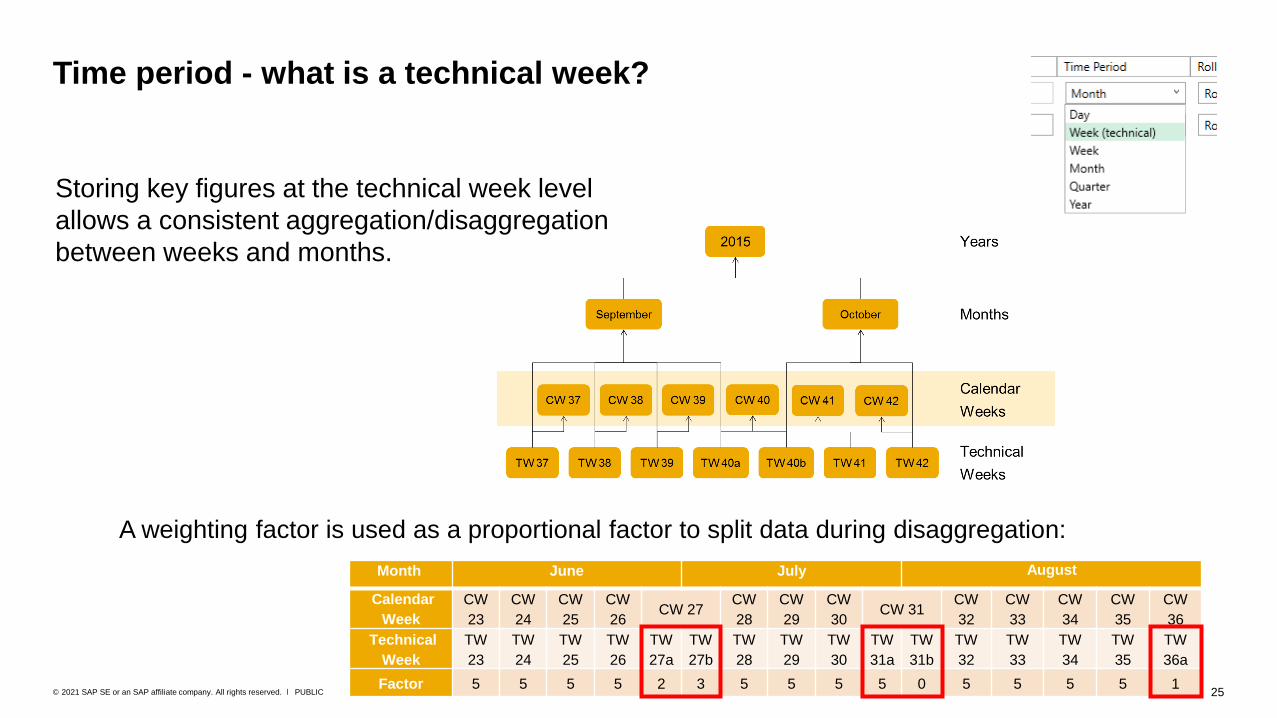
Storing key figures at the technical week level
allows a consistent aggregation/disaggregation
between weeks and months.
Time period - what is a technical week?
A weighting factor is used as a proportional factor to split data during disaggregation:
Month June July August
Calendar
Week
CW
23
CW
24
CW
25
CW
26CW 27
CW
28
CW
29
CW
30CW 31
CW
32
CW
33
CW
34
CW
35
CW
36
Technical
Week
TW
23
TW
24
TW
25
TW
26
TW
27a
TW
27b
TW
28
TW
29
TW
30
TW
31a
TW
31b
TW
32
TW
33
TW
34
TW
35
TW
36a
Factor 5 5 5 5 2 3 5 5 5 5 0 5 5 5 5 1
26PUBLIC© 2021 SAP SE or an SAP affiliate company. All rights reserved. ǀ
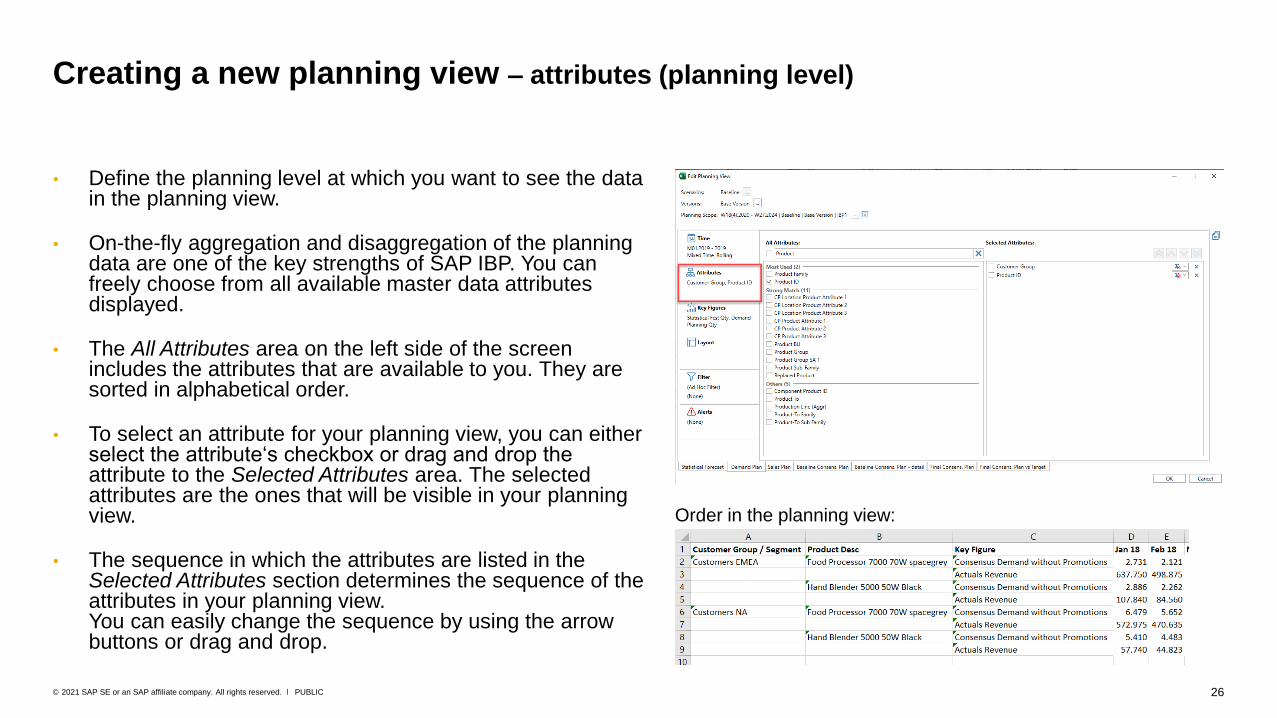
• Define the planning level at which you want to see the data in the planning view.
• On-the-fly aggregation and disaggregation of the planning data are one of the key strengths of SAP IBP. You can freely choose from all available master data attributes displayed.
• The All Attributes area on the left side of the screen includes the attributes that are available to you. They are sorted in alphabetical order.
• To select an attribute for your planning view, you can either select the attribute‘s checkbox or drag and drop the attribute to the Selected Attributes area. The selected attributes are the ones that will be visible in your planning view.
• The sequence in which the attributes are listed in the Selected Attributes section determines the sequence of the attributes in your planning view.You can easily change the sequence by using the arrow buttons or drag and drop.
Creating a new planning view – attributes (planning level)
Order in the planning view:

27PUBLIC© 2021 SAP SE or an SAP affiliate company. All rights reserved. ǀ
On-the-fly aggregation of data across planning levels
Data in SAP IBP is stored at the base planning level of the respective key figure, for example, the product ID or a combination of multiple attributes. The data in the database is stored in these attribute combinations. If key figures are calculated based on other key figures, the aggregation works similarly.
When the data is displayed, it is automatically aggregated up to the requested planning level.
Example: If key figure data is stored at the product ID level and the user displays the data at the brand level, then the data stored for the product IDs is aggregated to the respective brands.
Example: LOC | PROD | CUST | WEEKLY
LOC = location ID
PROD = product ID
CUST = customer ID
Product Family A
Brand A Brand B
Product A1 Product A2 Product B1 Product B2
Example for Product Planning Levels
Region A
Country A Country B
LocationA1 LocationA2 LocationB1 LocationB2
Example for Location Planning Levels

28PUBLIC© 2021 SAP SE or an SAP affiliate company. All rights reserved. ǀ
• Define the key figures for which you want to see data in the planning view
• You can freely choose the currency or unit of measure (UoM) in which you want to see the data. Note: Currency and UoM conversion factors must have been loaded by the administrator beforehand.
• You need to select a conversion factor for key figures for which a conversion has been defined by the administrator.
• The sequence in which the selected key figures are listed defines the sequence of the key figures in your planning view. You can easily change the sequence by using the arrow buttons or drag and drop.
• You can also specify whether you want to show planning notes in the planning view.
Creating a new planning view – key figures

29PUBLIC© 2021 SAP SE or an SAP affiliate company. All rights reserved. ǀ
The tooltip shows you all information on how
a key figure is defined. This can help decide if
for example, fixing or planning notes are
allowed, and in which horizon the key figure
is editable.
To make the tooltip appear, hover over a key
figure's name for about two seconds.
With the pin button in the upper right corner,
you can keep the tooltip on the screen and
move it around.
Creating a new planning view – tooltip for key figures
30PUBLIC© 2021 SAP SE or an SAP affiliate company. All rights reserved. ǀ
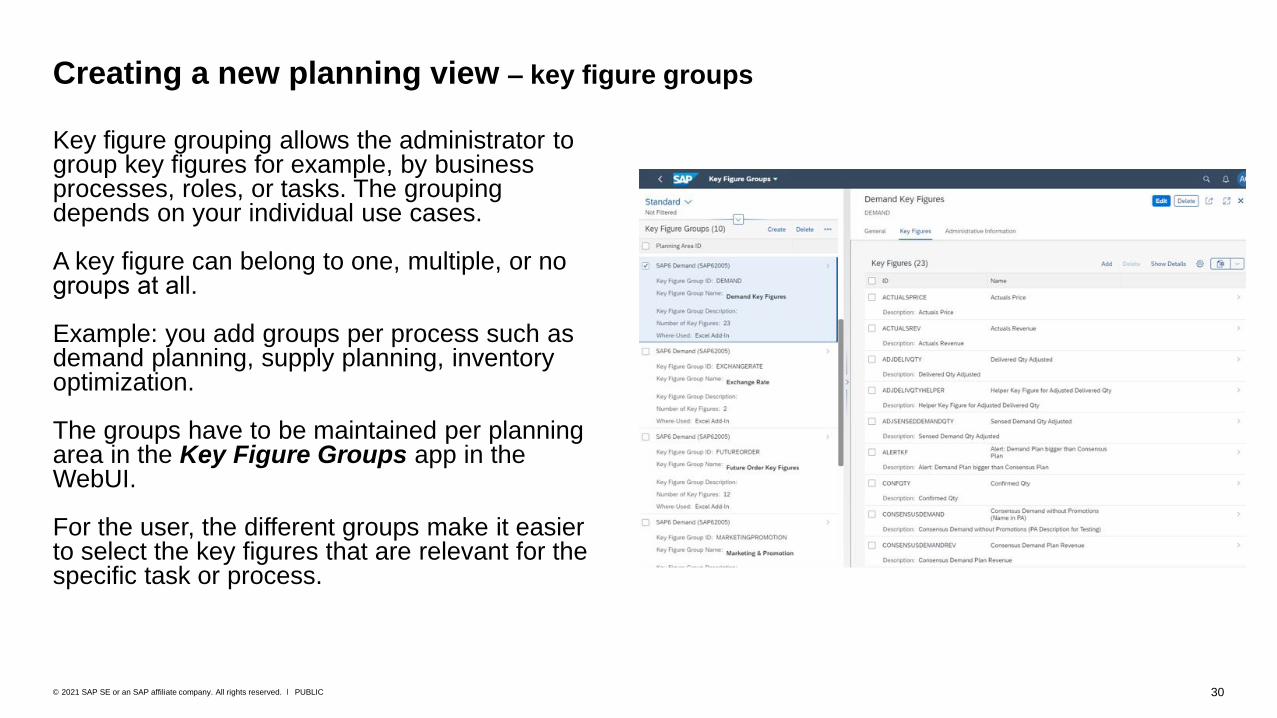
Key figure grouping allows the administrator to group key figures for example, by business processes, roles, or tasks. The grouping depends on your individual use cases.
A key figure can belong to one, multiple, or no groups at all.
Example: you add groups per process such as demand planning, supply planning, inventory optimization.
The groups have to be maintained per planning area in the Key Figure Groups app in the WebUI.
For the user, the different groups make it easier to select the key figures that are relevant for the specific task or process.
Creating a new planning view – key figure groups

31PUBLIC© 2021 SAP SE or an SAP affiliate company. All rights reserved. ǀ
You can see the key figure groups in the Edit Planning View or New View window on the Key Figures tab.
Creating a new planning view – key figure groups
In the beginning, the Key Figure
Groups section is collapsed. Click the arrow to open
the details.
The system remembers whether the key figure group
side panel was collapsed or expanded the last time
you used it and sets it accordingly the next time you
open the dialog.
On the details screen, you can select individual groups or
multiple groups. The key figures that are visible to you are
reacting to that selection so that you will only see the key figures
that are part of the groups that you had selected.
Also, when opening a template or favorite, relevant groups are
preselected if you have already added key figures to your
selection that belong to a group.
32PUBLIC© 2021 SAP SE or an SAP affiliate company. All rights reserved. ǀ
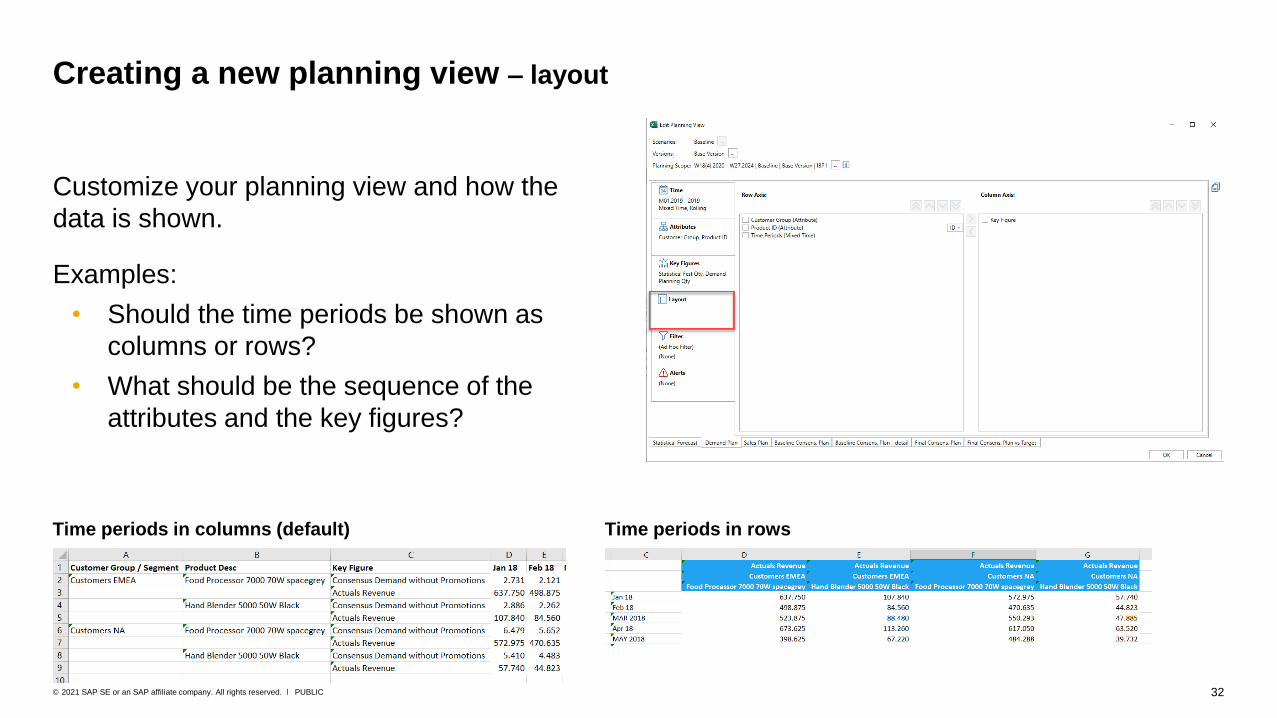
Customize your planning view and how the
data is shown.
Examples:
• Should the time periods be shown as
columns or rows?
• What should be the sequence of the
attributes and the key figures?
Creating a new planning view – layout
Time periods in columns (default) Time periods in rows
33PUBLIC© 2021 SAP SE or an SAP affiliate company. All rights reserved. ǀ
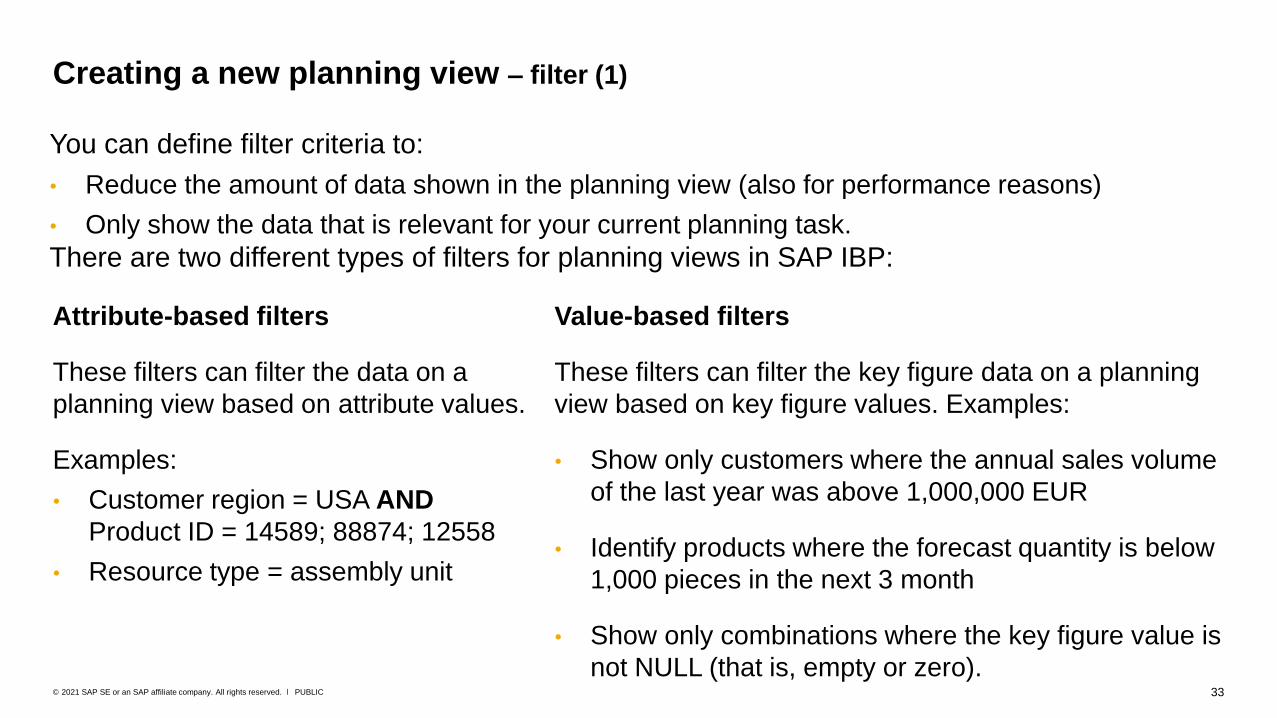
Value-based filters
These filters can filter the key figure data on a planning
view based on key figure values. Examples:
• Show only customers where the annual sales volume
of the last year was above 1,000,000 EUR
• Identify products where the forecast quantity is below
1,000 pieces in the next 3 month
• Show only combinations where the key figure value is
not NULL (that is, empty or zero).
Attribute-based filters
These filters can filter the data on a
planning view based on attribute values.
Examples:
• Customer region = USA AND
Product ID = 14589; 88874; 12558
• Resource type = assembly unit
Creating a new planning view – filter (1)
You can define filter criteria to:
• Reduce the amount of data shown in the planning view (also for performance reasons)
• Only show the data that is relevant for your current planning task.
There are two different types of filters for planning views in SAP IBP:
34PUBLIC© 2021 SAP SE or an SAP affiliate company. All rights reserved. ǀ
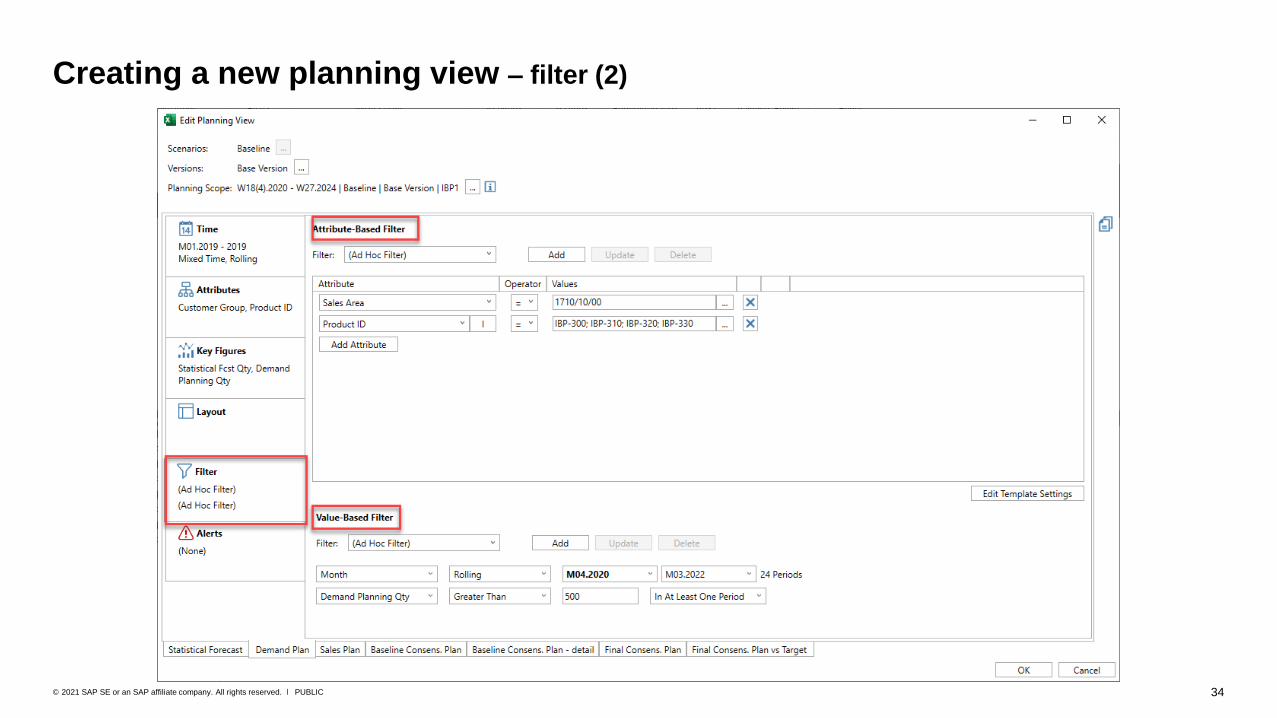
Creating a new planning view – filter (2)
35PUBLIC© 2021 SAP SE or an SAP affiliate company. All rights reserved. ǀ
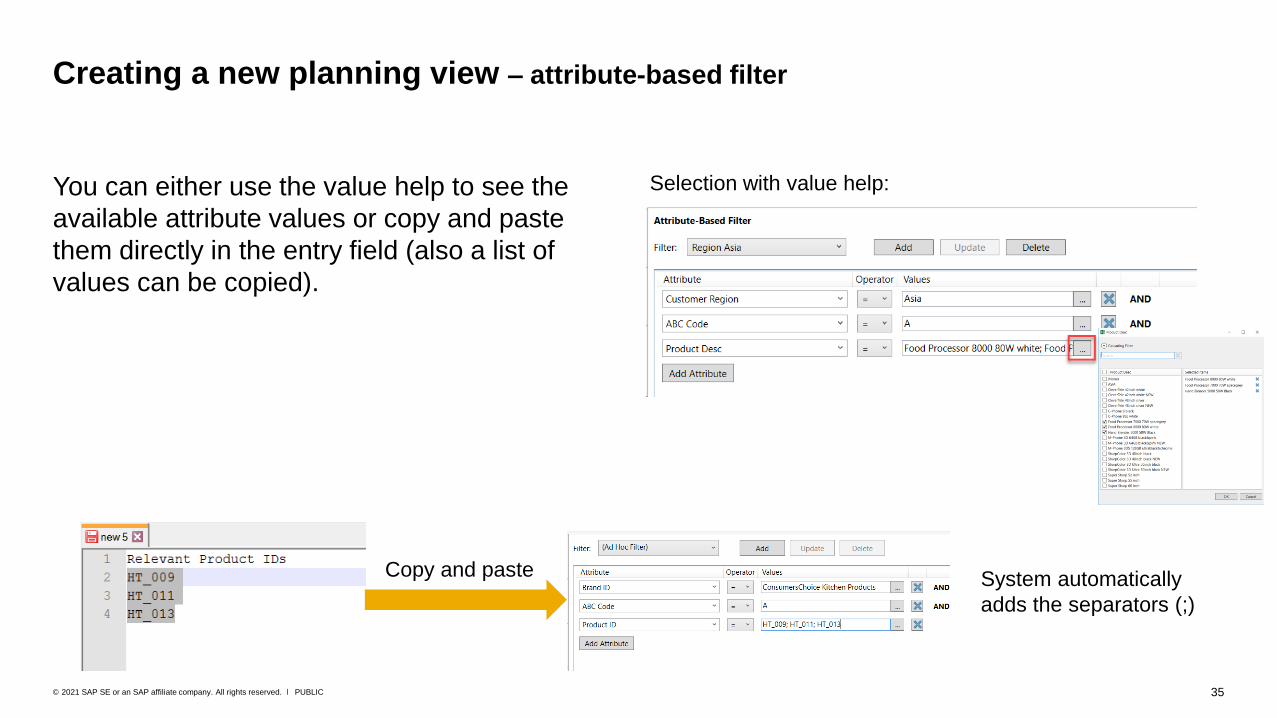
You can either use the value help to see the
available attribute values or copy and paste
them directly in the entry field (also a list of
values can be copied).
Creating a new planning view – attribute-based filter
Copy and paste System automatically
adds the separators (;)
Selection with value help:
36PUBLIC© 2021 SAP SE or an SAP affiliate company. All rights reserved. ǀ
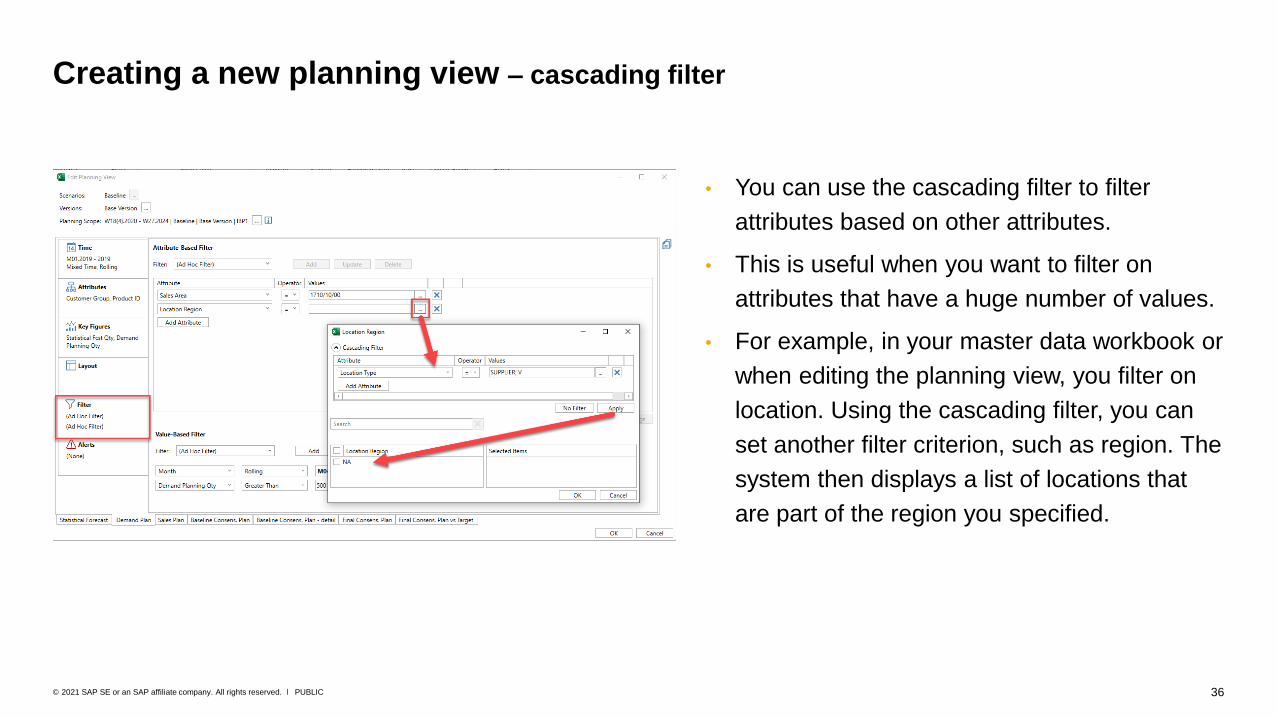
• You can use the cascading filter to filter
attributes based on other attributes.
• This is useful when you want to filter on
attributes that have a huge number of values.
• For example, in your master data workbook or
when editing the planning view, you filter on
location. Using the cascading filter, you can
set another filter criterion, such as region. The
system then displays a list of locations that
are part of the region you specified.
Creating a new planning view – cascading filter
37PUBLIC© 2021 SAP SE or an SAP affiliate company. All rights reserved. ǀ
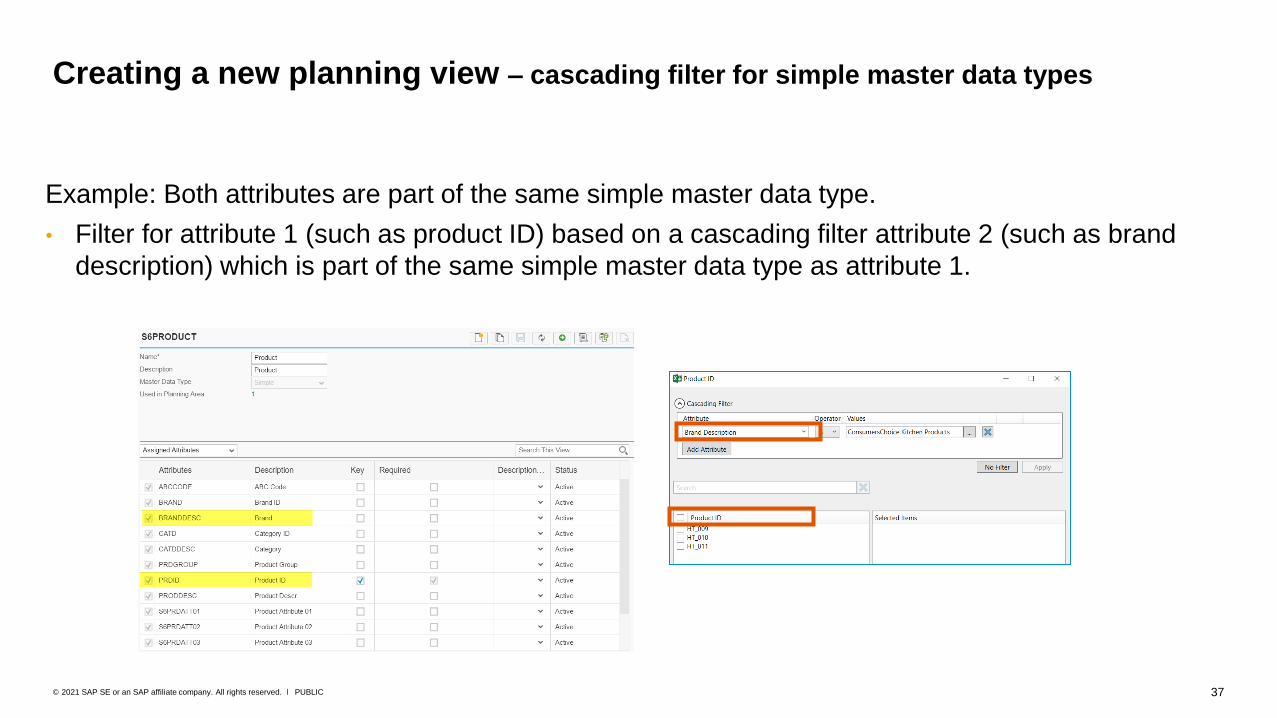
Creating a new planning view – cascading filter for simple master data types
Example: Both attributes are part of the same simple master data type.
• Filter for attribute 1 (such as product ID) based on a cascading filter attribute 2 (such as brand
description) which is part of the same simple master data type as attribute 1.
38PUBLIC© 2021 SAP SE or an SAP affiliate company. All rights reserved. ǀ
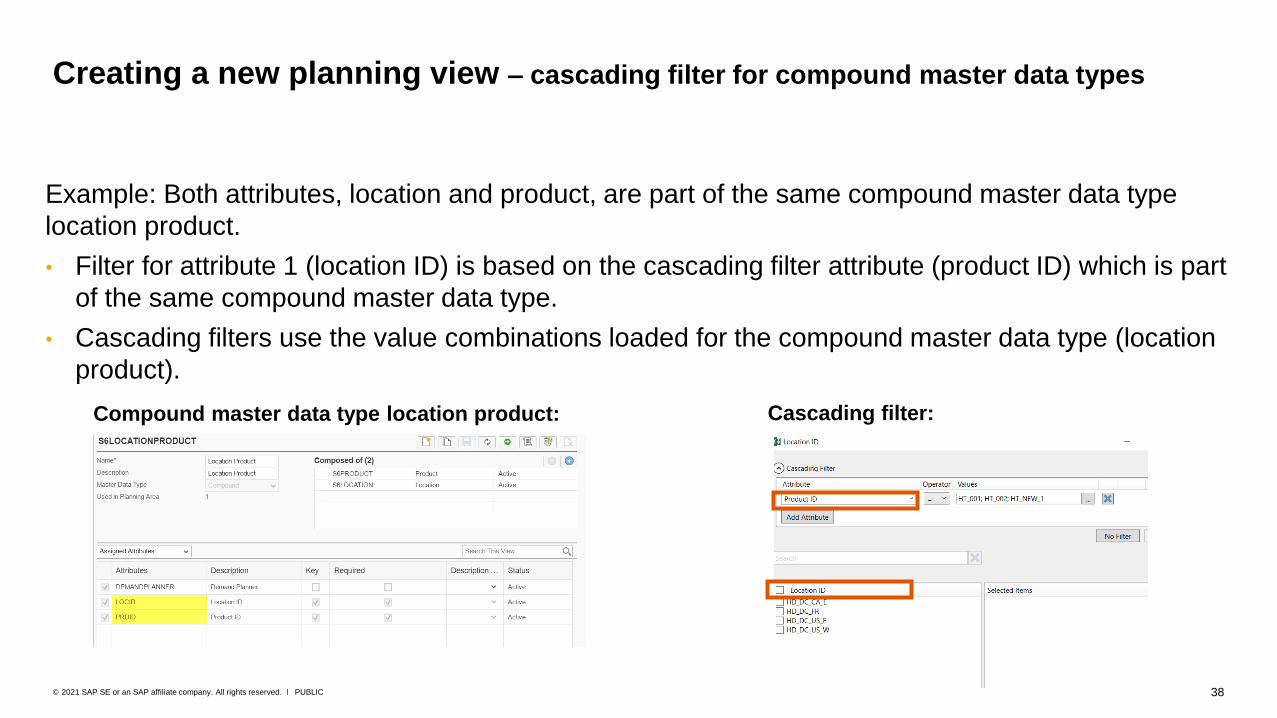
Example: Both attributes, location and product, are part of the same compound master data type
location product.
• Filter for attribute 1 (location ID) is based on the cascading filter attribute (product ID) which is part
of the same compound master data type.
• Cascading filters use the value combinations loaded for the compound master data type (location
product).
Compound master data type location product: Cascading filter:
Creating a new planning view – cascading filter for compound master data types
39PUBLIC© 2021 SAP SE or an SAP affiliate company. All rights reserved. ǀ
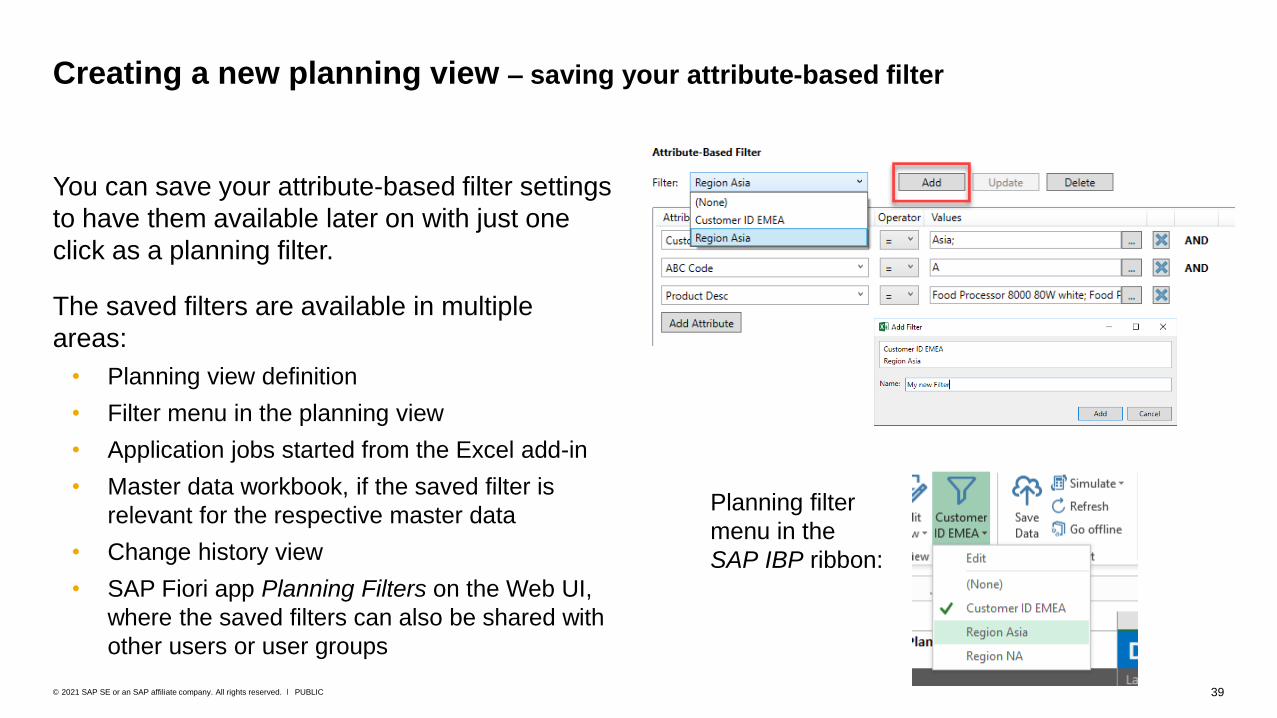
You can save your attribute-based filter settings
to have them available later on with just one
click as a planning filter.
The saved filters are available in multiple
areas:
• Planning view definition
• Filter menu in the planning view
• Application jobs started from the Excel add-in
• Master data workbook, if the saved filter is
relevant for the respective master data
• Change history view
• SAP Fiori app Planning Filters on the Web UI,
where the saved filters can also be shared with
other users or user groups
Creating a new planning view – saving your attribute-based filter
Planning filter
menu in the
SAP IBP ribbon:

40PUBLIC© 2021 SAP SE or an SAP affiliate company. All rights reserved. ǀ
To update a previously saved filter, select the filter
from the dropdown, change the filter conditions,
and choose Update.
To delete a filter, select the filter from the
dropdown and choose Delete.
Note that you can only delete filters that are not
used. For more information, see the next slide.
Updating and deleting attribute-based planning filters

41PUBLIC© 2021 SAP SE or an SAP affiliate company. All rights reserved. ǀ
You cannot delete a filter if it is still used, for example, by the following applications:
• Application jobs
• Application job templates
• Planning view favorites
• Master data workbook favorites
• Planning view templates
• Planning views in the Web-Based Planning app
• Alert definitions
• Analytics
• Dashboards
To see the applications that use the filter,
use the Planning Filters app. See next
slide.
Usage check for attribute-based filters
42PUBLIC© 2021 SAP SE or an SAP affiliate company. All rights reserved. ǀ
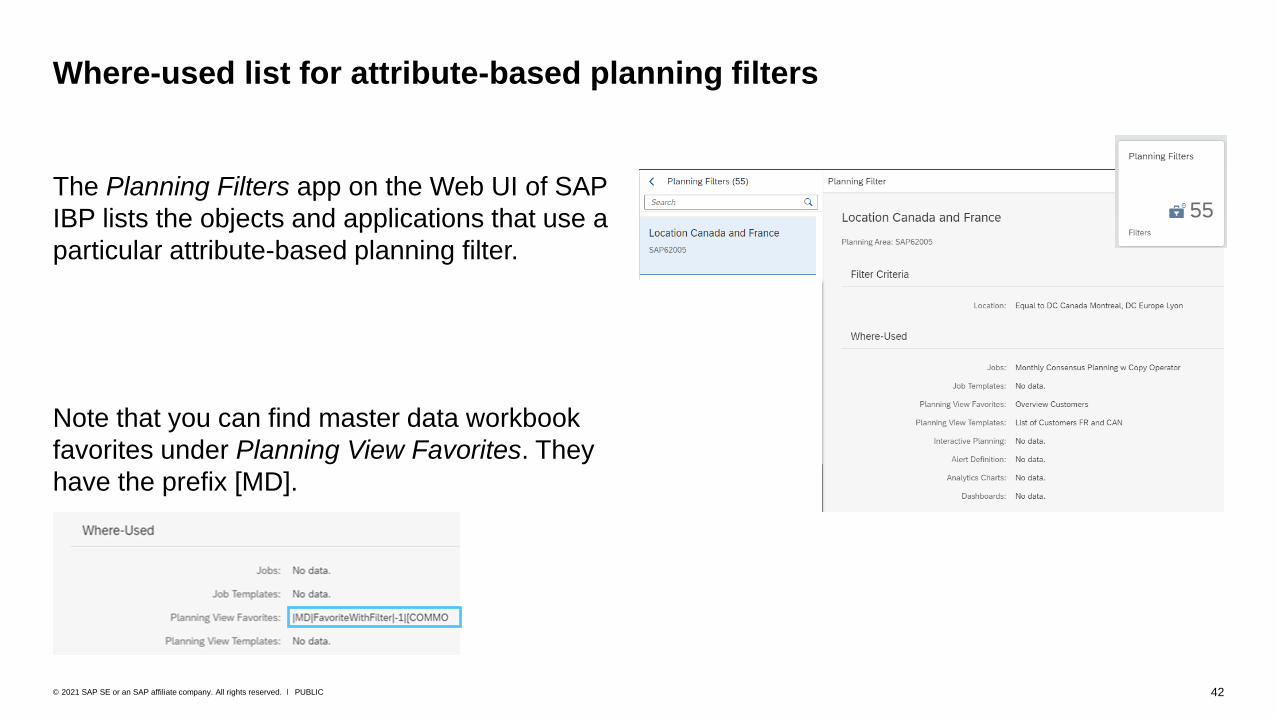
The Planning Filters app on the Web UI of SAP
IBP lists the objects and applications that use a
particular attribute-based planning filter.
Note that you can find master data workbook
favorites under Planning View Favorites. They
have the prefix [MD].
Where-used list for attribute-based planning filters

43PUBLIC© 2021 SAP SE or an SAP affiliate company. All rights reserved. ǀ
It can happen that attribute values are no longer available, for example, if they have been deleted
from the system.
Example:
• When you defined the filter, you included the products A, B, and C. Later on, the product C was
removed from the system, but is still included in the filter. This means that the filter now
contains an invalid value.
• It can even happen that none of the products defined in the filter exist any longer when you use
the filter in a planning view or for an application job at a later point in time. All the values in the
filter are now invalid.
Invalid values in attribute-based filters (1)

44PUBLIC© 2021 SAP SE or an SAP affiliate company. All rights reserved. ǀ
What happens if an attribute-based filter contains invalid
values?
• If all values are missing in a filter, you get a warning
when you try to use the filter in the planning view
settings or in the application job settings. See the
screenshots on the right.
• The planning view only displays data for the valid
values.
• An application job runs successfully – even if all
values in the filter are invalid - but you only get results
for the valid values. If there are no valid values, the
application log says No data found.
Invalid values in attribute-based filters (2)
Warning in the planning view settings
Warning in the application job settings
45PUBLIC© 2021 SAP SE or an SAP affiliate company. All rights reserved. ǀ
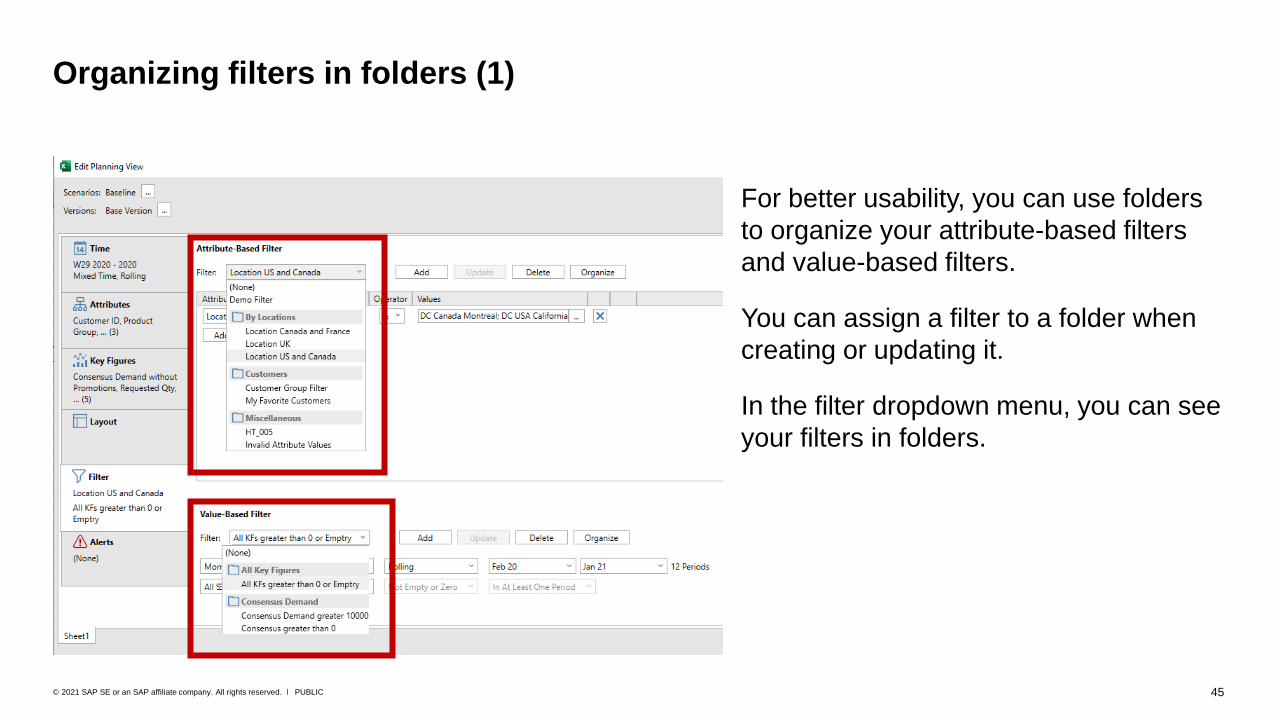
For better usability, you can use folders
to organize your attribute-based filters
and value-based filters.
You can assign a filter to a folder when
creating or updating it.
In the filter dropdown menu, you can see
your filters in folders.
Organizing filters in folders (1)

46PUBLIC© 2021 SAP SE or an SAP affiliate company. All rights reserved. ǀ
When adding (or updating) a filter, you can
assign the filter to an existing folder or create a
new folder to which the filter should be
assigned.
Organizing filters in folders (2)

47PUBLIC© 2021 SAP SE or an SAP affiliate company. All rights reserved. ǀ
To reorganize your folders and the
assignment of filters to folders, choose
Organize.
Then you can do the following:
• Drag and drop a filter to a different folder
• Create a new folder and drag and drop
filters to this new folder
(Note that folders that do not contain any
filters are deleted automatically. )
• Rename filters and their folders (more
about this later)
• Share attribute-based filters with other
users (more about this later)
Organizing filters in folders (3)
48PUBLIC© 2021 SAP SE or an SAP affiliate company. All rights reserved. ǀ
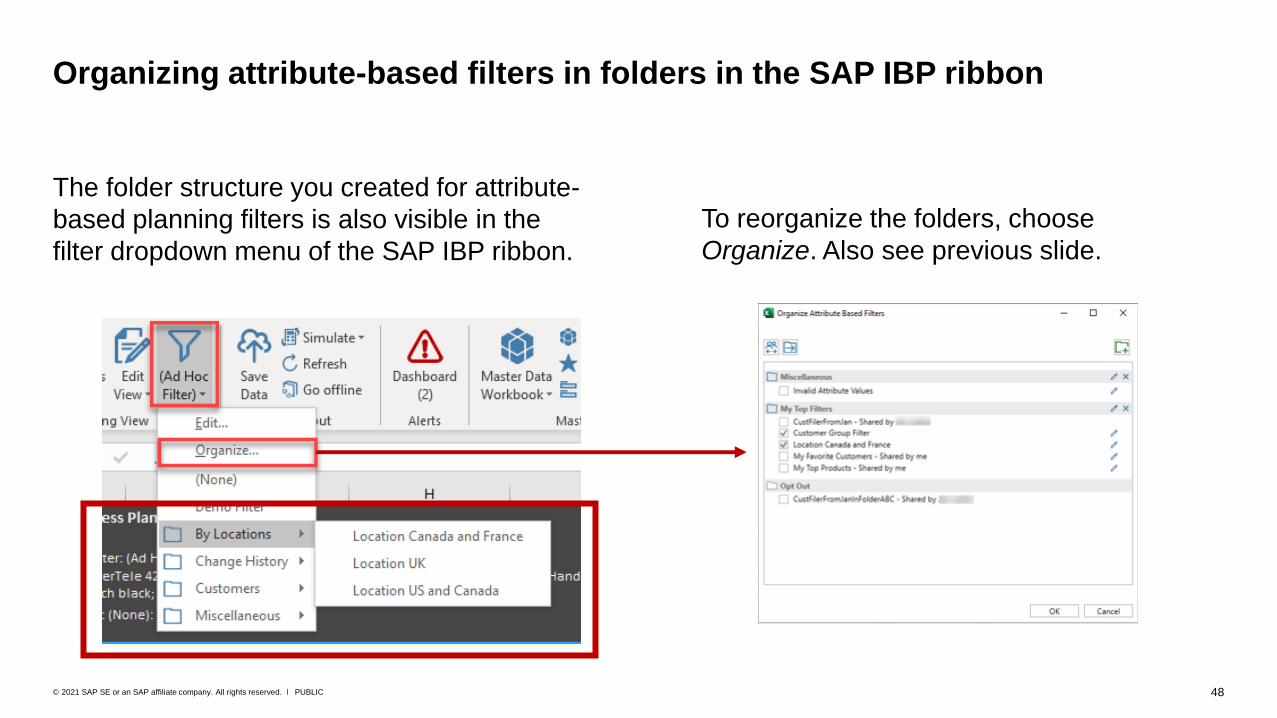
The folder structure you created for attribute-
based planning filters is also visible in the
filter dropdown menu of the SAP IBP ribbon.
Organizing attribute-based filters in folders in the SAP IBP ribbon
To reorganize the folders, choose
Organize. Also see previous slide.
49PUBLIC© 2021 SAP SE or an SAP affiliate company. All rights reserved. ǀ
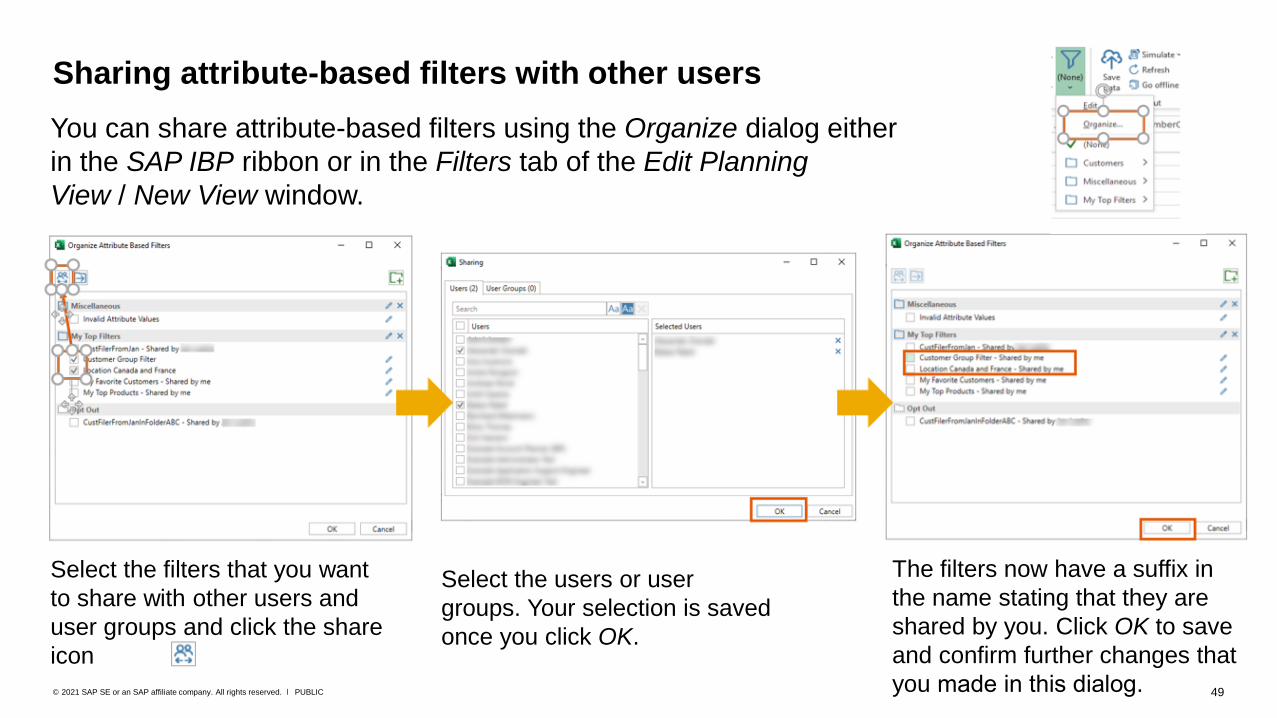
Sharing attribute-based filters with other users
You can share attribute-based filters using the Organize dialog either
in the SAP IBP ribbon or in the Filters tab of the Edit Planning
View / New View window.
Select the filters that you want
to share with other users and
user groups and click the share
icon
Select the users or user
groups. Your selection is saved
once you click OK.
The filters now have a suffix in
the name stating that they are
shared by you. Click OK to save
and confirm further changes that
you made in this dialog.
50PUBLIC© 2021 SAP SE or an SAP affiliate company. All rights reserved. ǀ
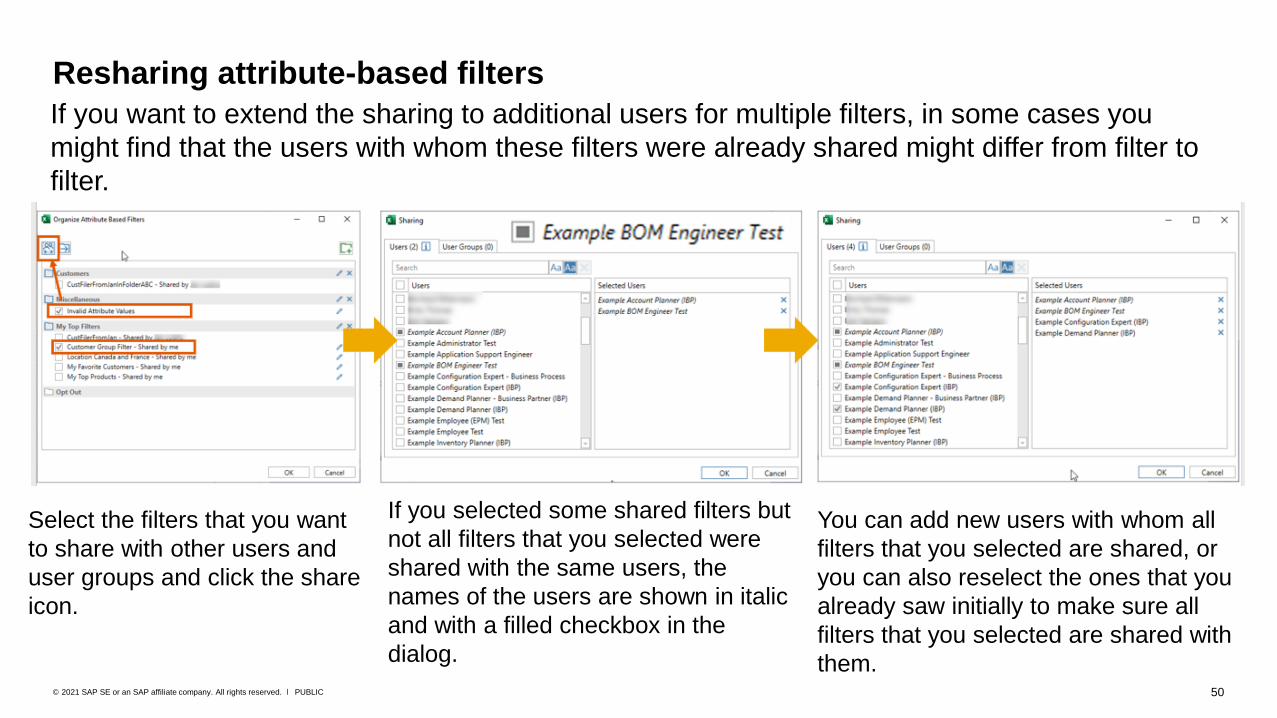
Resharing attribute-based filters
If you want to extend the sharing to additional users for multiple filters, in some cases you
might find that the users with whom these filters were already shared might differ from filter to
filter.
Select the filters that you want
to share with other users and
user groups and click the share
icon.
If you selected some shared filters but
not all filters that you selected were
shared with the same users, the
names of the users are shown in italic
and with a filled checkbox in the
dialog.
You can add new users with whom all
filters that you selected are shared, or
you can also reselect the ones that you
already saw initially to make sure all
filters that you selected are shared with
them.

51PUBLIC© 2021 SAP SE or an SAP affiliate company. All rights reserved. ǀ
Sharing of attribute-based filters – opting-out of shared filters
You can opt out of attribute-based filters
that were shared with you by other users.
Filters that you have opted out
of don’t appear in your attribute-based
filters list any longer.
To opt out, drag and drop these filters to
the Opt Out folder.
To get the filters back, drag and drop the
filter back to the other area.
You can also use the Move button to opt
out of one or multiple shared filters.
52PUBLIC© 2021 SAP SE or an SAP affiliate company. All rights reserved. ǀ
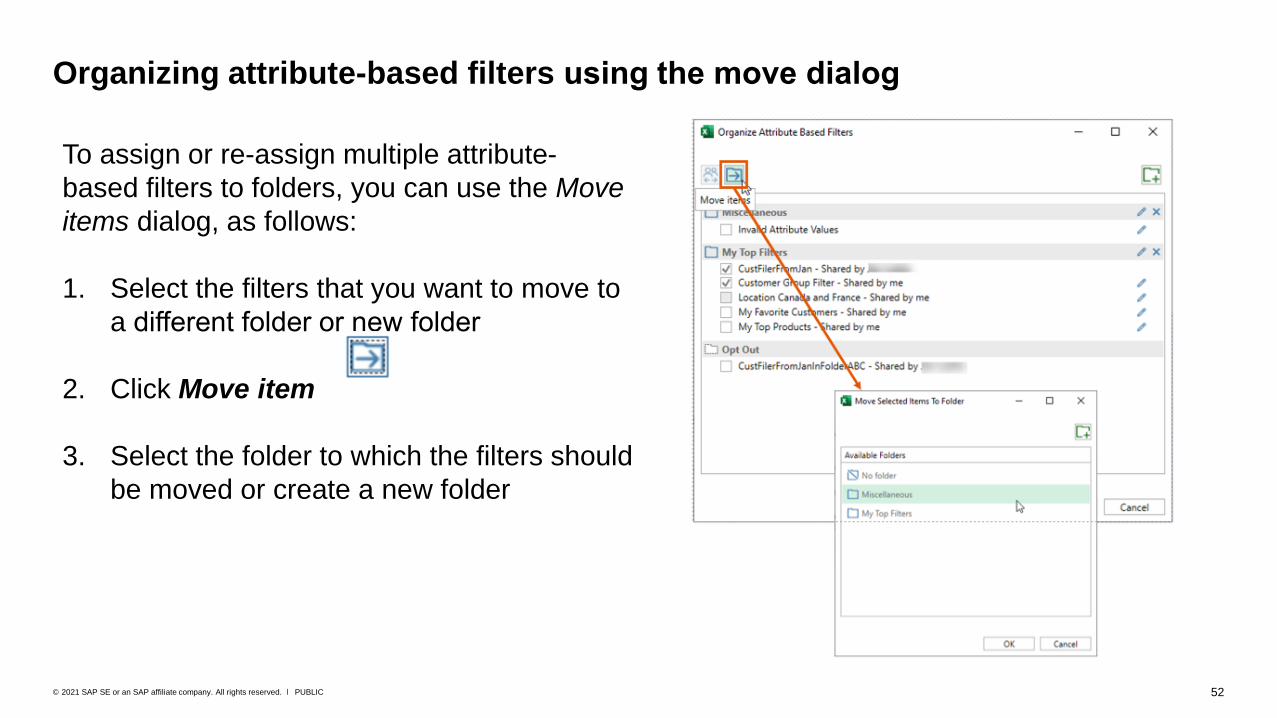
Organizing attribute-based filters using the move dialog
To assign or re-assign multiple attribute-
based filters to folders, you can use the Move
items dialog, as follows:
1. Select the filters that you want to move to
a different folder or new folder
2. Click Move item
3. Select the folder to which the filters should
be moved or create a new folder

53PUBLIC© 2021 SAP SE or an SAP affiliate company. All rights reserved. ǀ
Renaming attribute-based filters and their folders (1)
You can rename attribute-based planning filters and the respective folders via the Organize menu.
SAP IBP ribbon
You find the Organize dialog in
the dropdown menu for attribute-
based filters.
New Planning View / Edit Planning View
window
For attribute-based planning filters, the Organize
dialog can be found in the New Planning View /
Edit Planning View window on the Filters tab.
54PUBLIC© 2021 SAP SE or an SAP affiliate company. All rights reserved. ǀ
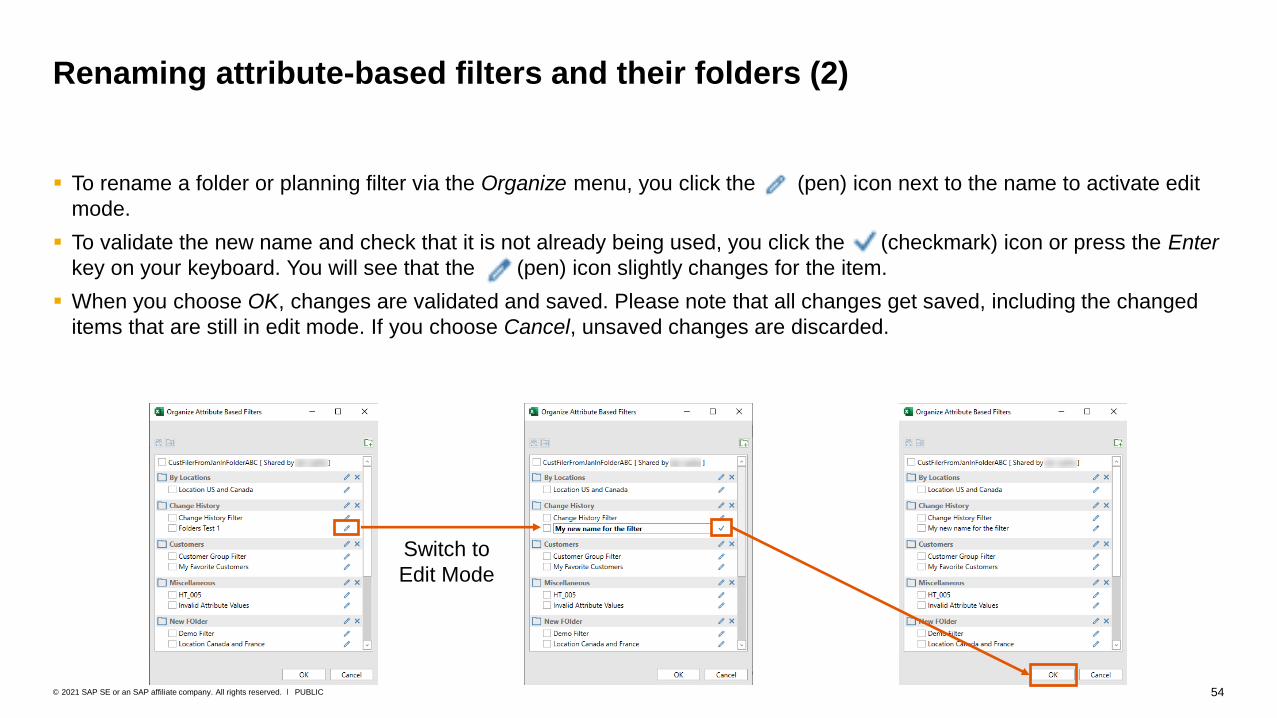
▪ To rename a folder or planning filter via the Organize menu, you click the (pen) icon next to the name to activate edit
mode.
▪ To validate the new name and check that it is not already being used, you click the (checkmark) icon or press the Enter
key on your keyboard. You will see that the (pen) icon slightly changes for the item.
▪ When you choose OK, changes are validated and saved. Please note that all changes get saved, including the changed
items that are still in edit mode. If you choose Cancel, unsaved changes are discarded.
Renaming attribute-based filters and their folders (2)
Switch to
Edit Mode
55PUBLIC© 2021 SAP SE or an SAP affiliate company. All rights reserved. ǀ
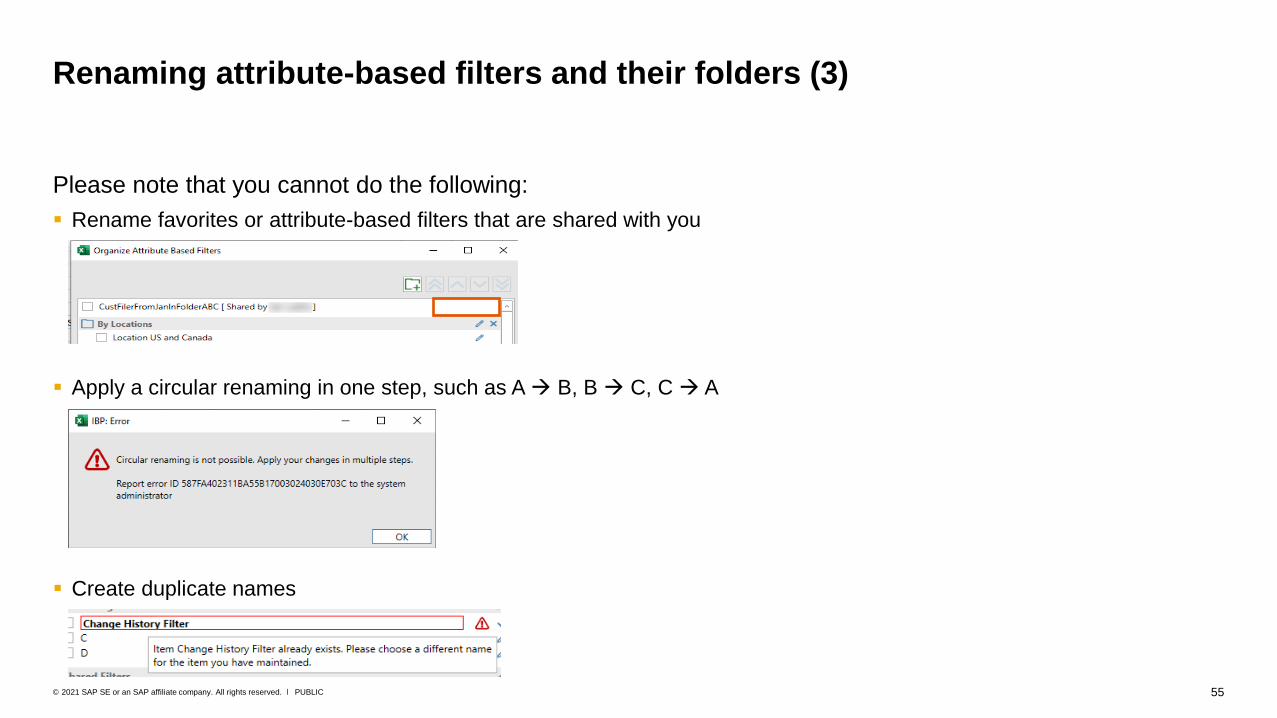
Renaming attribute-based filters and their folders (3)
Please note that you cannot do the following:
▪ Rename favorites or attribute-based filters that are shared with you
▪ Apply a circular renaming in one step, such as A → B, B → C, C → A
▪ Create duplicate names
56PUBLIC© 2021 SAP SE or an SAP affiliate company. All rights reserved. ǀ
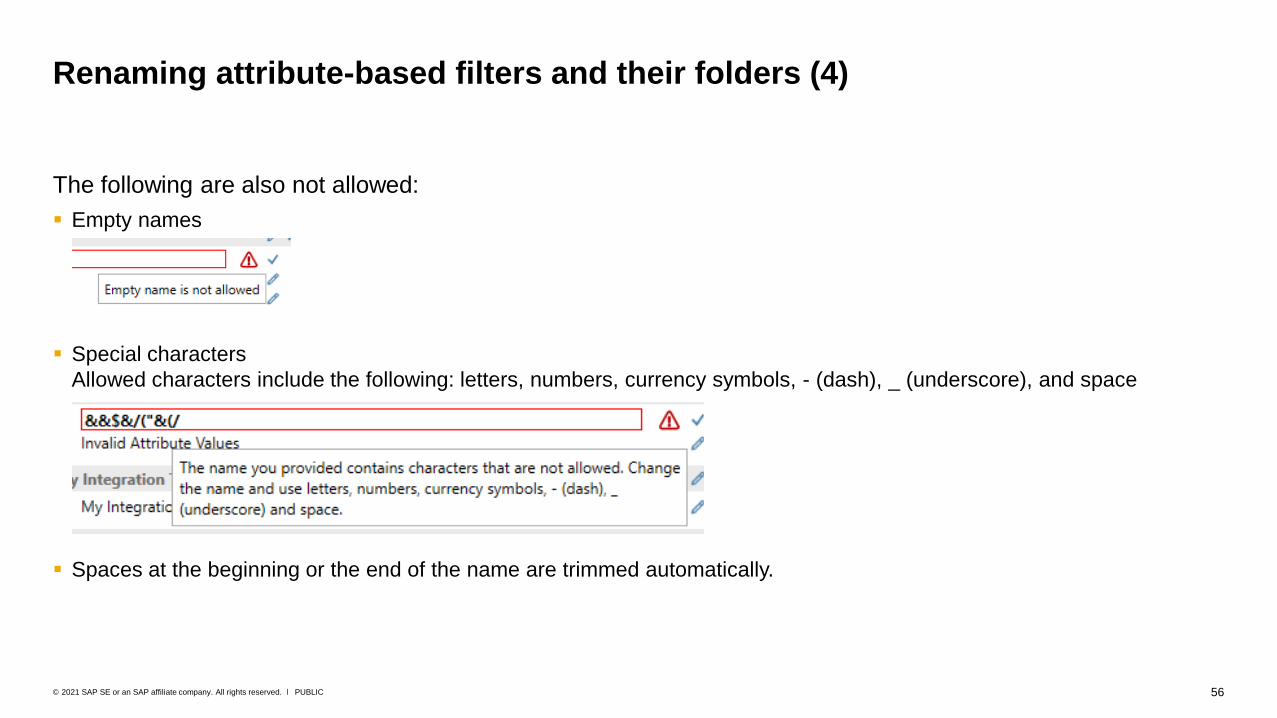
Renaming attribute-based filters and their folders (4)
The following are also not allowed:
▪ Empty names
▪ Special characters
Allowed characters include the following: letters, numbers, currency symbols, - (dash), _ (underscore), and space
▪ Spaces at the beginning or the end of the name are trimmed automatically.
57PUBLIC© 2021 SAP SE or an SAP affiliate company. All rights reserved. ǀ
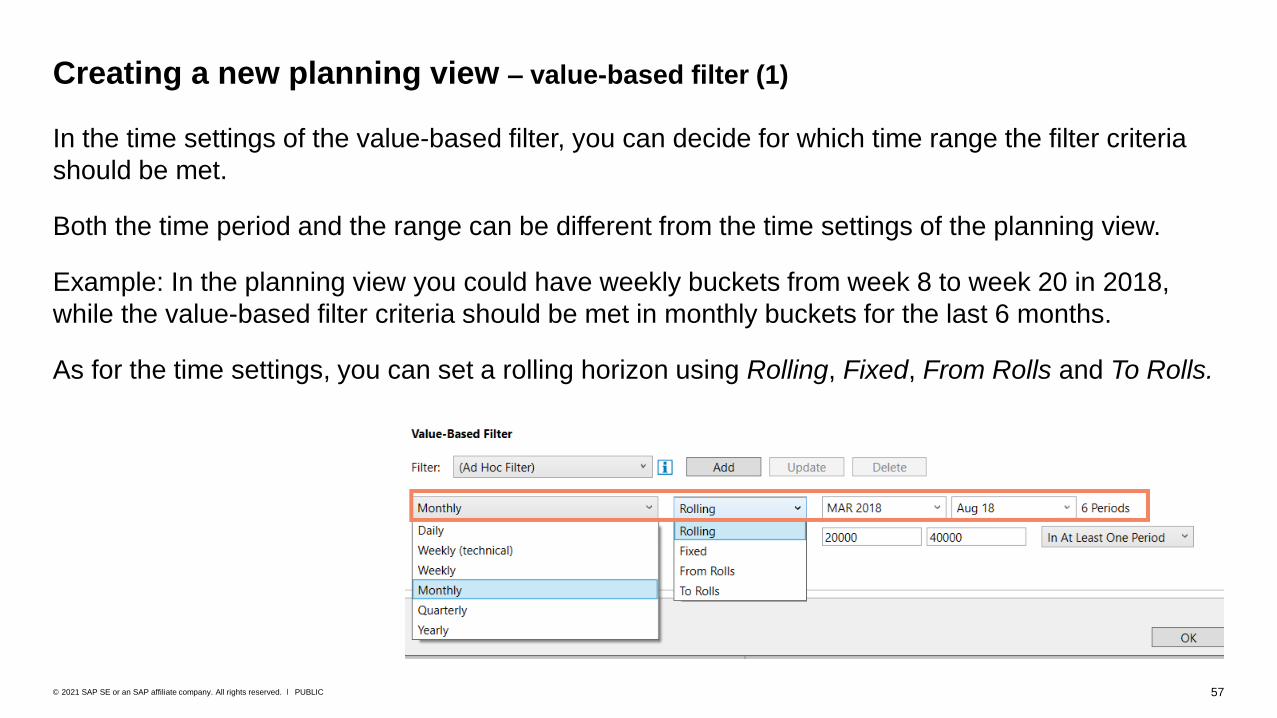
In the time settings of the value-based filter, you can decide for which time range the filter criteria
should be met.
Both the time period and the range can be different from the time settings of the planning view.
Example: In the planning view you could have weekly buckets from week 8 to week 20 in 2018,
while the value-based filter criteria should be met in monthly buckets for the last 6 months.
As for the time settings, you can set a rolling horizon using Rolling, Fixed, From Rolls and To Rolls.
Creating a new planning view – value-based filter (1)

58PUBLIC© 2021 SAP SE or an SAP affiliate company. All rights reserved. ǀ
As a next step, you decide for which key figure the filter should be applied. You can only choose key figures that are part of your planning view (including alert key figures).
You then decide on the operator type. The following operator types are available:
• Equal To
• Not Equal To
• Greater Than
• Less Than
• Between
• Not Empty
• Not Empty or Zero
• Is Empty
• Is Empty or Zero
After that, you need to set the threshold values according to your needs and decide where the filter criteria should be met: in at least one period (for example, month) of the selected time range (March –August 2018 in the example), in all periods, or in the total column for this time range.
Creating a new planning view – value-based filter (2)

59PUBLIC© 2021 SAP SE or an SAP affiliate company. All rights reserved. ǀ
To remove any planning combinations where all key figure values are empty, or zero within the
defined time horizon, you set the value-based filter in the planning view to All Selected Key Figures.
This setting automatically switches the operators next to it, to Not Empty or Zero and In At Least
one Period.
Creating a new planning view – value-based filter (3)
60PUBLIC© 2021 SAP SE or an SAP affiliate company. All rights reserved. ǀ
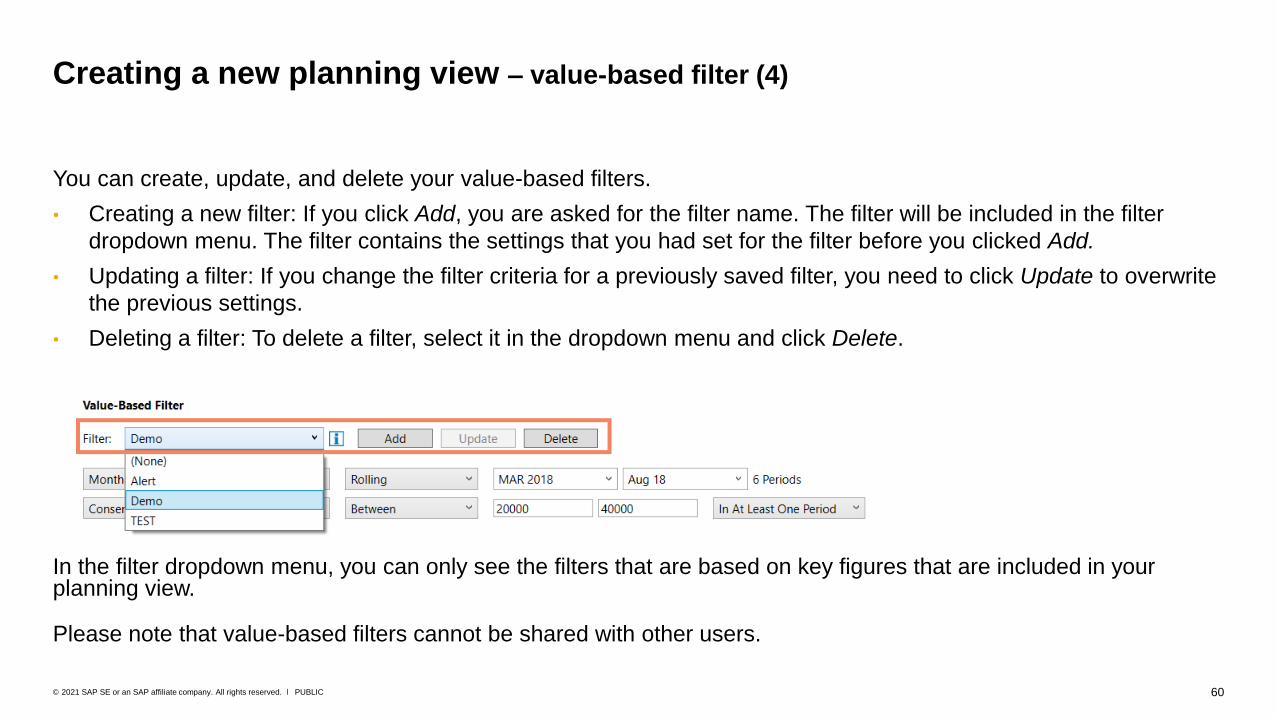
You can create, update, and delete your value-based filters.
• Creating a new filter: If you click Add, you are asked for the filter name. The filter will be included in the filter
dropdown menu. The filter contains the settings that you had set for the filter before you clicked Add.
• Updating a filter: If you change the filter criteria for a previously saved filter, you need to click Update to overwrite
the previous settings.
• Deleting a filter: To delete a filter, select it in the dropdown menu and click Delete.
In the filter dropdown menu, you can only see the filters that are based on key figures that are included in your planning view.
Please note that value-based filters cannot be shared with other users.
Creating a new planning view – value-based filter (4)

61PUBLIC© 2021 SAP SE or an SAP affiliate company. All rights reserved. ǀ
If you want to remove the value-based filter criteria from your planning view, you simply need to
switch to (None) in the filter dropdown menu. This will remove the value-based filter from your
planning view.
Creating a new planning view – value-based filter (5)
62PUBLIC© 2021 SAP SE or an SAP affiliate company. All rights reserved. ǀ
• A value-based filters cannot be shared with other users and is not visible to other users under
the name you had given it.
• Value-based filters are saved within templates, favorites and offline workbooks.
• When you share a template or a favorite with other users, they see the filter criteria only as an
Ad-Hoc Filter (that is, with a different neutral name).
• For value-based filters, there are no Template Admin options, such as Don’t copy, Copy as
suggestion or Copy as mandatory (which you have for the attribute-based filters).
Creating a new planning view – value-based filter (6)
63PUBLIC© 2021 SAP SE or an SAP affiliate company. All rights reserved. ǀ
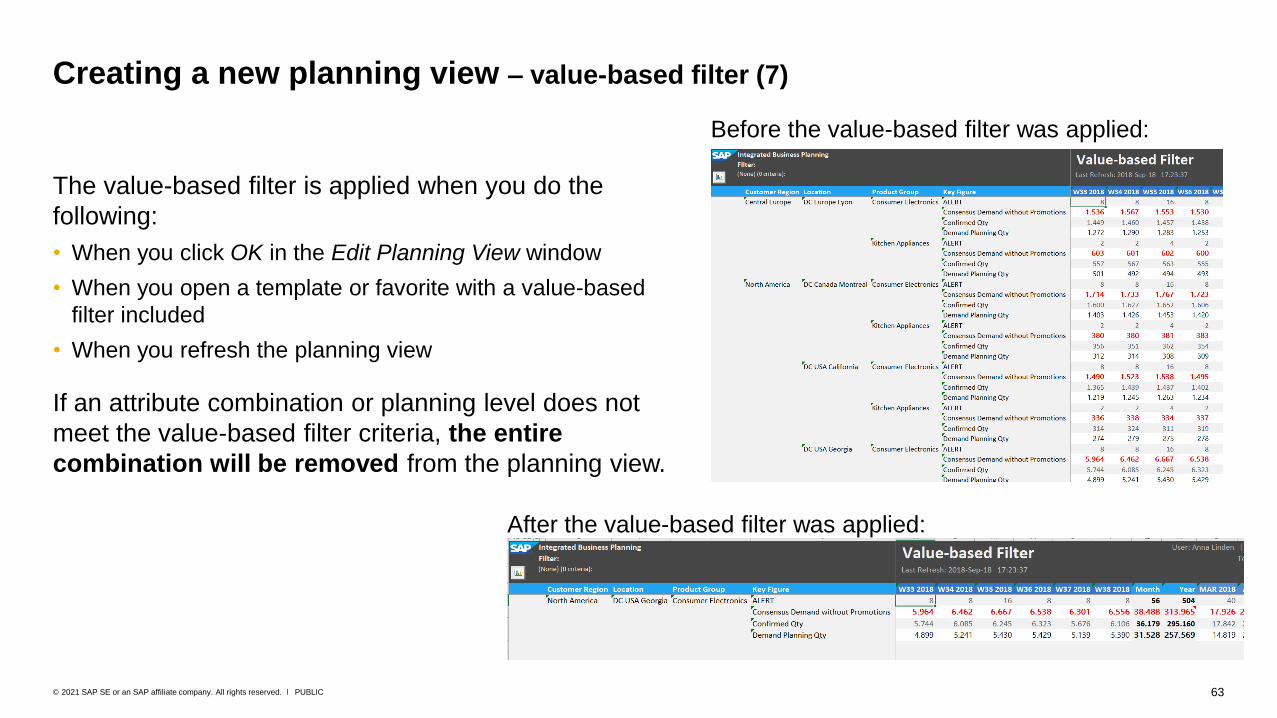
The value-based filter is applied when you do the
following:
• When you click OK in the Edit Planning View window
• When you open a template or favorite with a value-based
filter included
• When you refresh the planning view
If an attribute combination or planning level does not
meet the value-based filter criteria, the entire
combination will be removed from the planning view.
Creating a new planning view – value-based filter (7)
After the value-based filter was applied:
Before the value-based filter was applied:
64PUBLIC© 2021 SAP SE or an SAP affiliate company. All rights reserved. ǀ
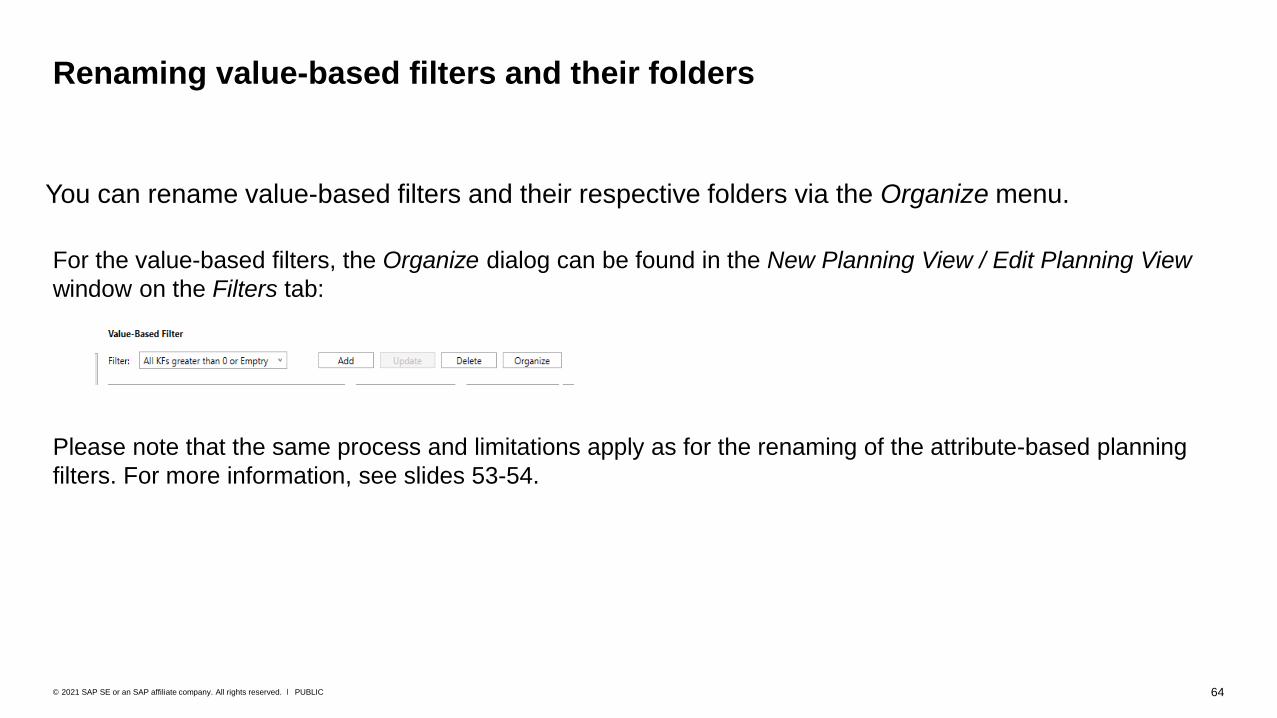
Renaming value-based filters and their folders
You can rename value-based filters and their respective folders via the Organize menu.
For the value-based filters, the Organize dialog can be found in the New Planning View / Edit Planning View
window on the Filters tab:
Please note that the same process and limitations apply as for the renaming of the attribute-based planning
filters. For more information, see slides 53-54.

65PUBLIC© 2021 SAP SE or an SAP affiliate company. All rights reserved. ǀ
You have now created a planning view without a template.
It is a plain planning view (no EPM formatting, no VBA code, …).
We strongly recommend that you use the SAP IBP formatting sheet to apply formatting to increase the usability of the planning views.
Please note that it is mandatory to use the SAP IBP formatting sheet if you want to use the following:
• Alerts in the planning view
• Fixing-enabled key figures
Creating a planning view – result
66PUBLIC© 2021 SAP SE or an SAP affiliate company. All rights reserved. ǀ
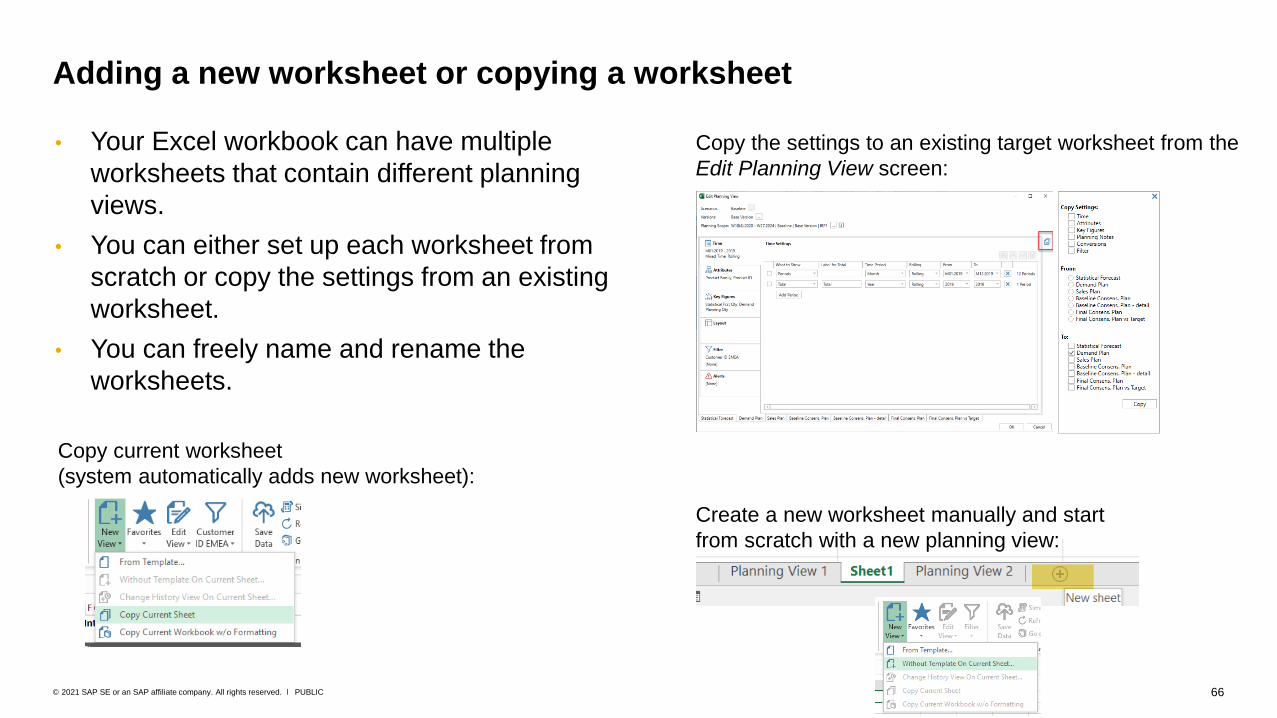
Adding a new worksheet or copying a worksheet
• Your Excel workbook can have multiple
worksheets that contain different planning
views.
• You can either set up each worksheet from
scratch or copy the settings from an existing
worksheet.
• You can freely name and rename the
worksheets.
Copy the settings to an existing target worksheet from the
Edit Planning View screen:
Copy current worksheet
(system automatically adds new worksheet):
Create a new worksheet manually and start
from scratch with a new planning view:
67PUBLIC© 2021 SAP SE or an SAP affiliate company. All rights reserved. ǀ
You can have multiple Excel workbooks open with multiple worksheets containing planning views.
The maximum number of workbooks that can be opened is defined by your system administrator
using the global configuration parameter PV_COUNT_MAX in the PLAN_VIEW parameter group.
Limiting the number of open workbooks makes sense for the following reasons:
• Reduce the PC’s memory utilization, which grows with the number of open workbooks and
transactions. The user should still be able to work in parallel with other applications.
• Reduce the SAP IBP backend load
Multiple workbooks
68PUBLIC© 2021 SAP SE or an SAP affiliate company. All rights reserved. ǀ
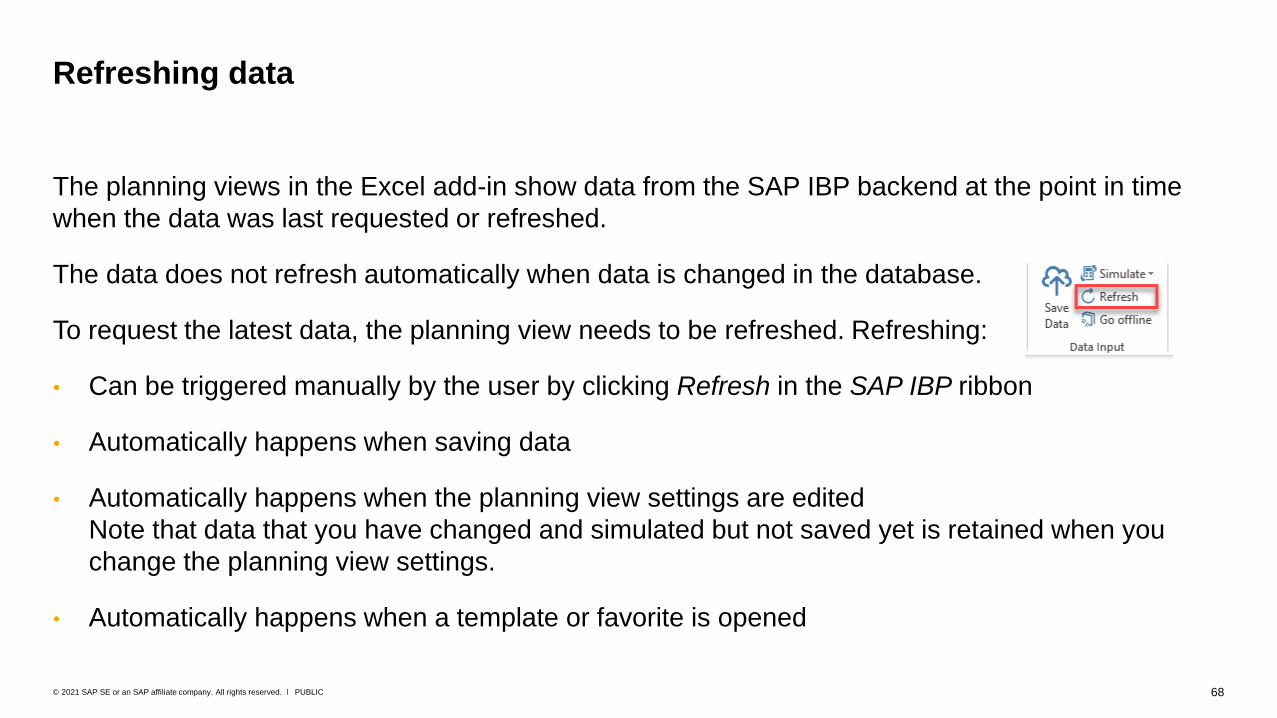
The planning views in the Excel add-in show data from the SAP IBP backend at the point in time
when the data was last requested or refreshed.
The data does not refresh automatically when data is changed in the database.
To request the latest data, the planning view needs to be refreshed. Refreshing:
• Can be triggered manually by the user by clicking Refresh in the SAP IBP ribbon
• Automatically happens when saving data
• Automatically happens when the planning view settings are edited
Note that data that you have changed and simulated but not saved yet is retained when you
change the planning view settings.
• Automatically happens when a template or favorite is opened
Refreshing data
Advanced Settings
Time-Based Totals and Flexible Time Axis
70PUBLIC© 2021 SAP SE or an SAP affiliate company. All rights reserved. ǀ
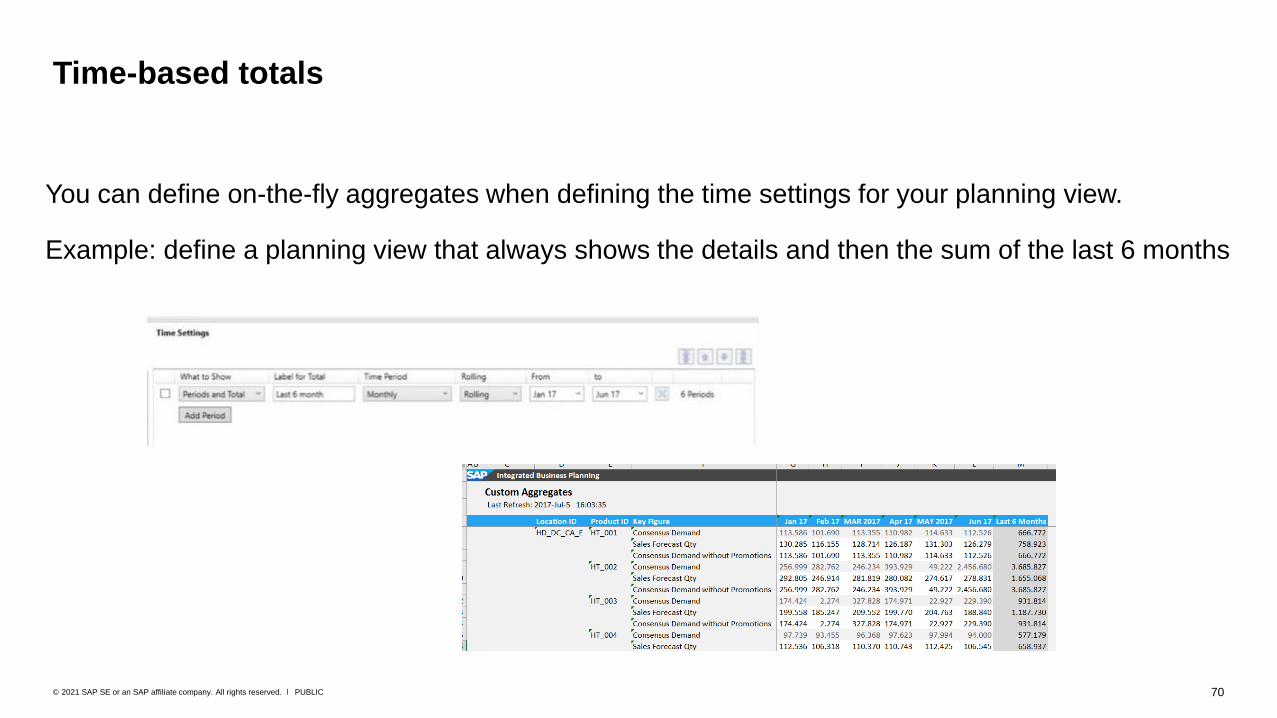
Time-based totals
You can define on-the-fly aggregates when defining the time settings for your planning view.
Example: define a planning view that always shows the details and then the sum of the last 6 months

71PUBLIC© 2021 SAP SE or an SAP affiliate company. All rights reserved. ǀ
Advanced time settings (1)
You can define how the data is displayed, as periods, summed up to a total, or both.
Custom labels for total columns, such as, Year to Date or Rest of Year:
Note that a certain time period must not be included in different time intervals that use the same
period type. Example: You cannot define two time intervals with monthly periods that both include the month January 2019, such as
October 2018 to January 2019 and January 2019 to March 2019. It needs to be, for example, October 2018 to
December 2018 and January 2019 to March 2019.
However, the same time range (January 2019) can be included in different time intervals that use
different period types, such as Monthly (month January 2019) and Weekly (week 1/2019 to 4/2019).

72PUBLIC© 2021 SAP SE or an SAP affiliate company. All rights reserved. ǀ
Advanced time settings (2)
You can also define whether the start and end of a time interval, that is, the first and the last period of
the time interval, are fixed or rolling. The following are your options:
• Rolling: Both the start and end period are rolling.
Example: The current month is January. For the time interval to be displayed, you have selected
January 2019 to March 2019 with monthly periods. When the current month changes to February
2019 as time is passing, also the time interval displayed rolls by a month and now shows data from
February 2019 to April 2019.
• Fixed: Both start and end period are fixed.
• From Rolls: Start period is rolling, end period fixed.
• To Rolls: Start period is fixed, end period is rolling.
73PUBLIC© 2021 SAP SE or an SAP affiliate company. All rights reserved. ǀ
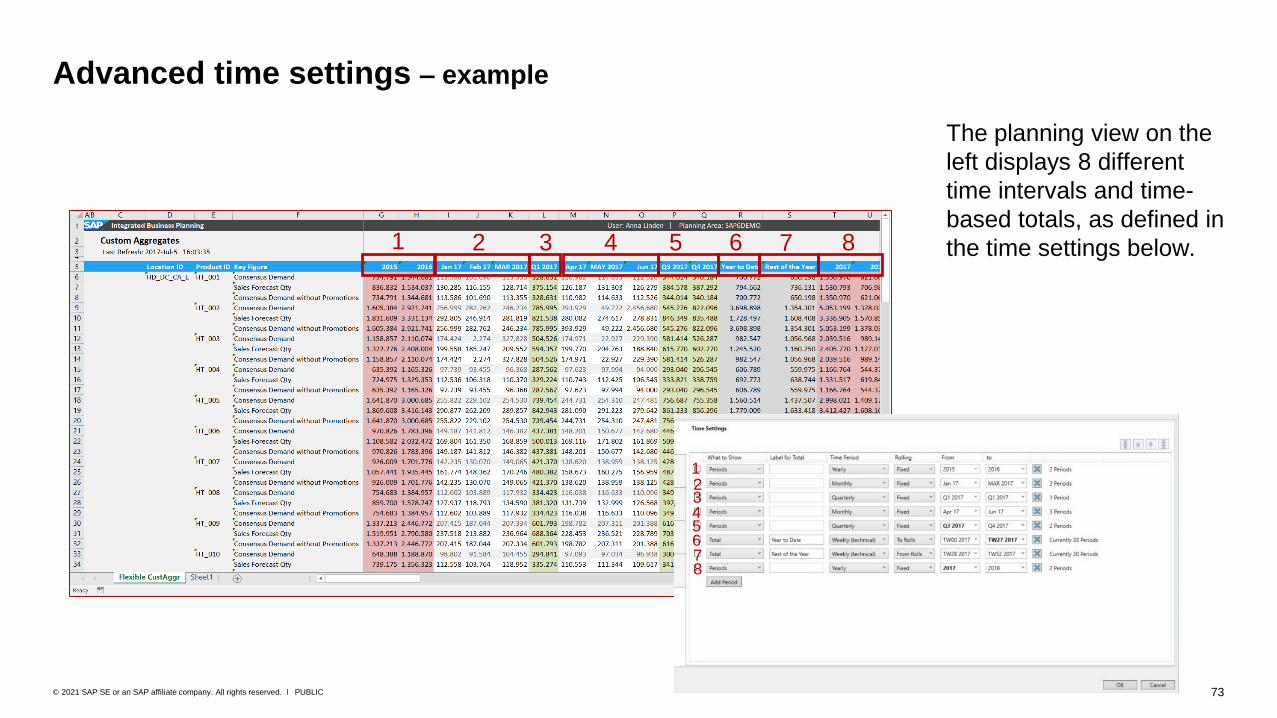
Advanced time settings – example
1 2 5 6 7 8
123456
3 4
78
The planning view on the
left displays 8 different
time intervals and time-
based totals, as defined in
the time settings below.
74PUBLIC© 2021 SAP SE or an SAP affiliate company. All rights reserved. ǀ
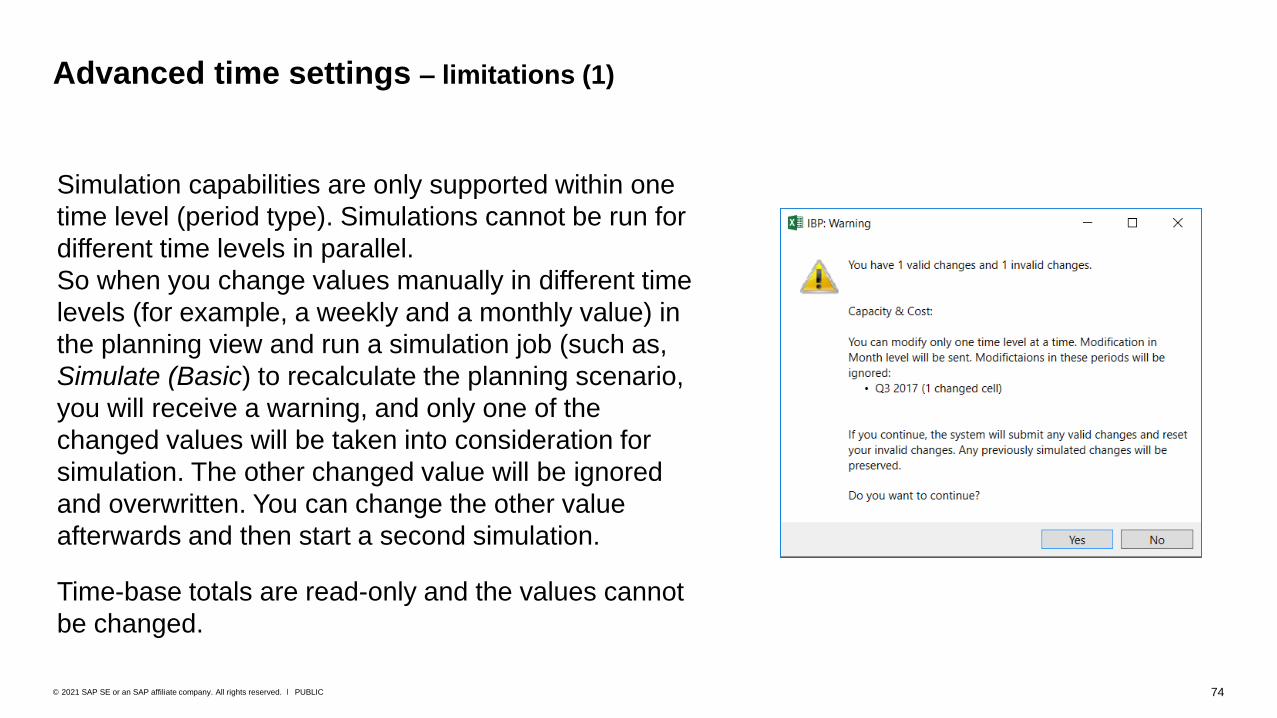
Advanced time settings – limitations (1)
Simulation capabilities are only supported within one
time level (period type). Simulations cannot be run for
different time levels in parallel.
So when you change values manually in different time
levels (for example, a weekly and a monthly value) in
the planning view and run a simulation job (such as,
Simulate (Basic) to recalculate the planning scenario,
you will receive a warning, and only one of the
changed values will be taken into consideration for
simulation. The other changed value will be ignored
and overwritten. You can change the other value
afterwards and then start a second simulation.
Time-base totals are read-only and the values cannot
be changed.
75PUBLIC© 2021 SAP SE or an SAP affiliate company. All rights reserved. ǀ
The determination of the value of the time-based total does not work for key figures which are
based on an L-code implementation or on a complex configuration and which have an aggregation
mode other than Sum, Max, Min, or Avg.
An example of a complex configuration is the determination of the key figure value for the last
period in a time period (for example, the last month of a quarter or the last month of a year), as
described in SAP Note 2286684.
Advanced time settings – limitations (2)

Advanced Settings
Attribute-Based Totals & Subtotals
77PUBLIC© 2021 SAP SE or an SAP affiliate company. All rights reserved. ǀ
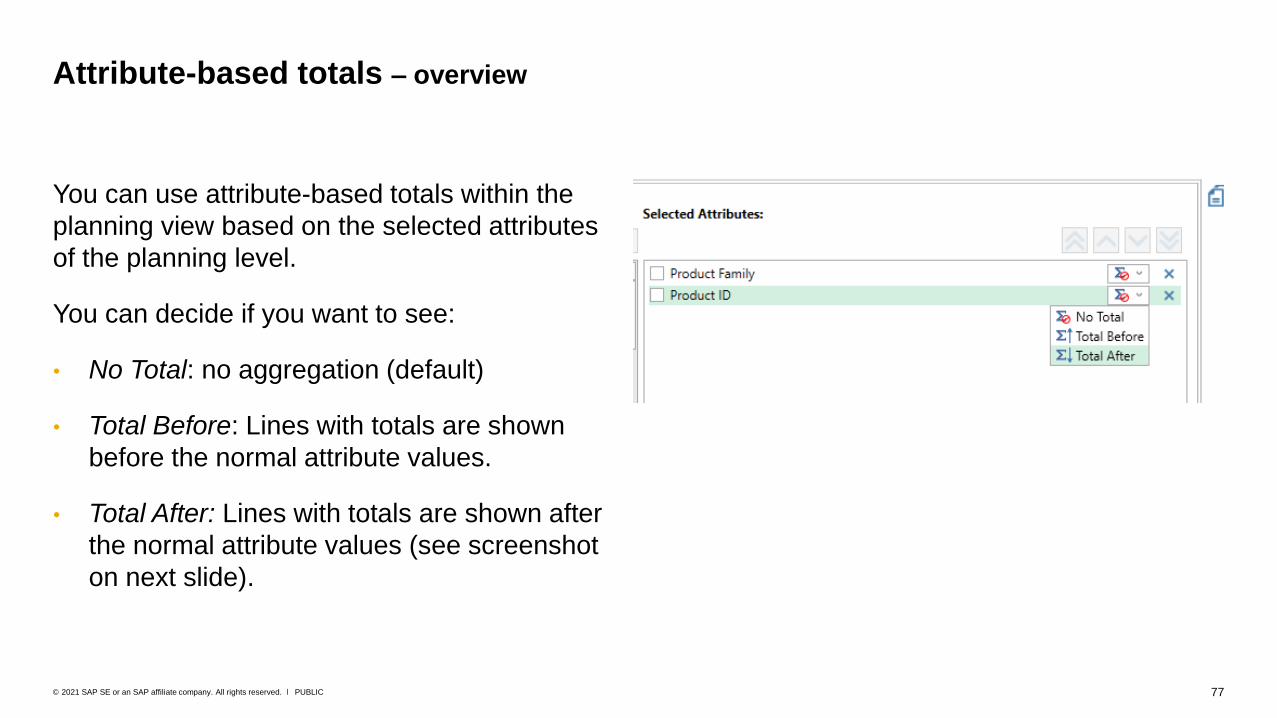
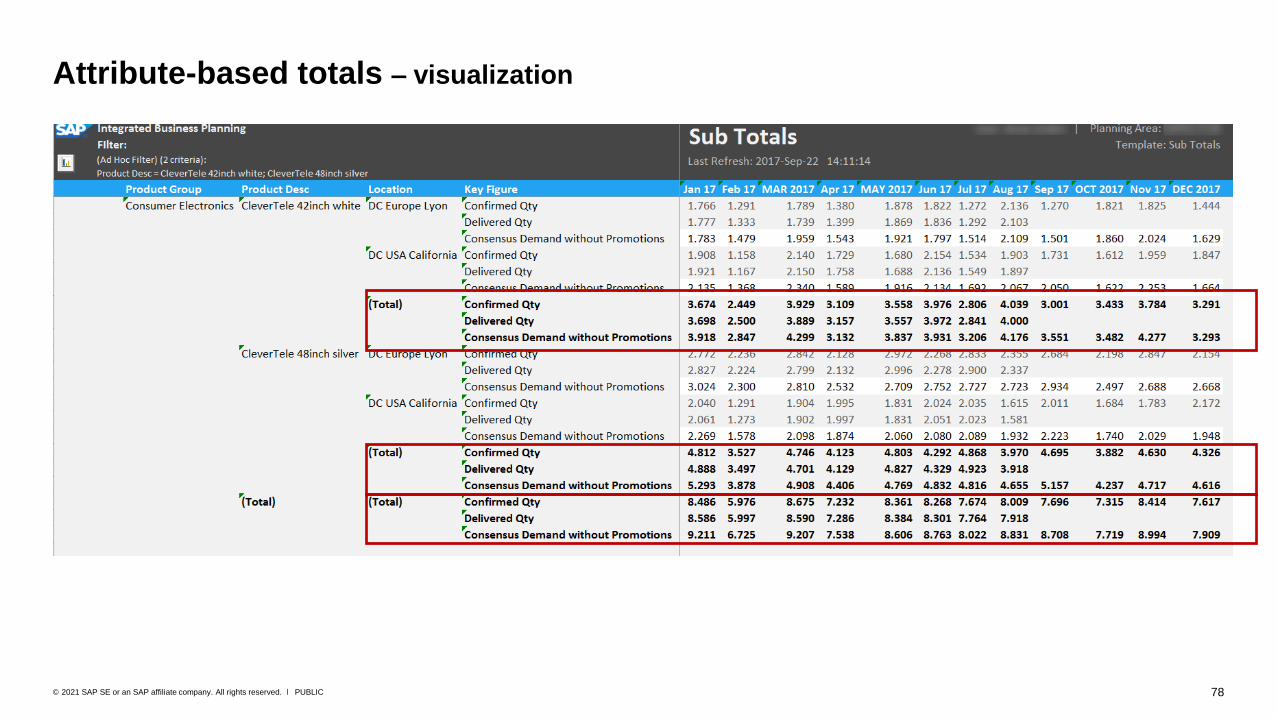
Attribute-based totals – overview
You can use attribute-based totals within the
planning view based on the selected attributes
of the planning level.
You can decide if you want to see:
• No Total: no aggregation (default)
• Total Before: Lines with totals are shown
before the normal attribute values.
• Total After: Lines with totals are shown after
the normal attribute values (see screenshot
on next slide).
78PUBLIC© 2021 SAP SE or an SAP affiliate company. All rights reserved. ǀ
Attribute-based totals – visualization
79PUBLIC© 2021 SAP SE or an SAP affiliate company. All rights reserved. ǀ
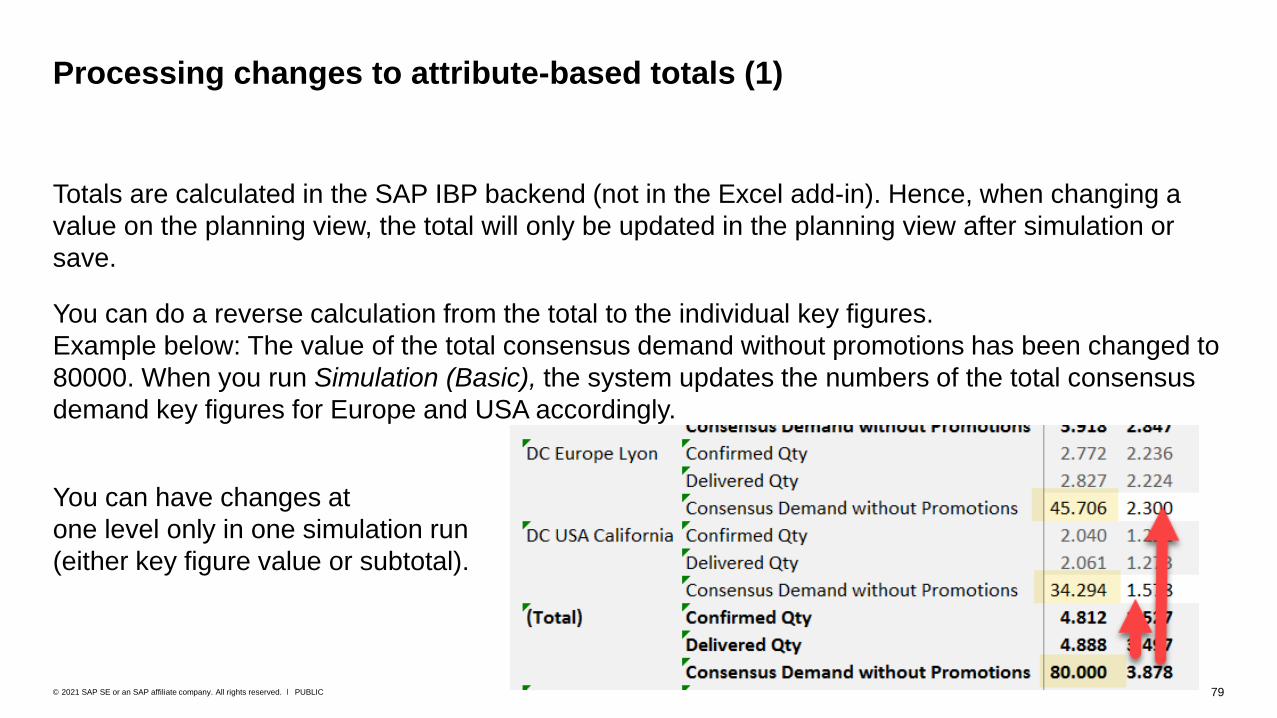
Processing changes to attribute-based totals (1)
Totals are calculated in the SAP IBP backend (not in the Excel add-in). Hence, when changing a
value on the planning view, the total will only be updated in the planning view after simulation or
save.
You can do a reverse calculation from the total to the individual key figures.
Example below: The value of the total consensus demand without promotions has been changed to
80000. When you run Simulation (Basic), the system updates the numbers of the total consensus
demand key figures for Europe and USA accordingly.
You can have changes at
one level only in one simulation run
(either key figure value or subtotal).
80PUBLIC© 2021 SAP SE or an SAP affiliate company. All rights reserved. ǀ
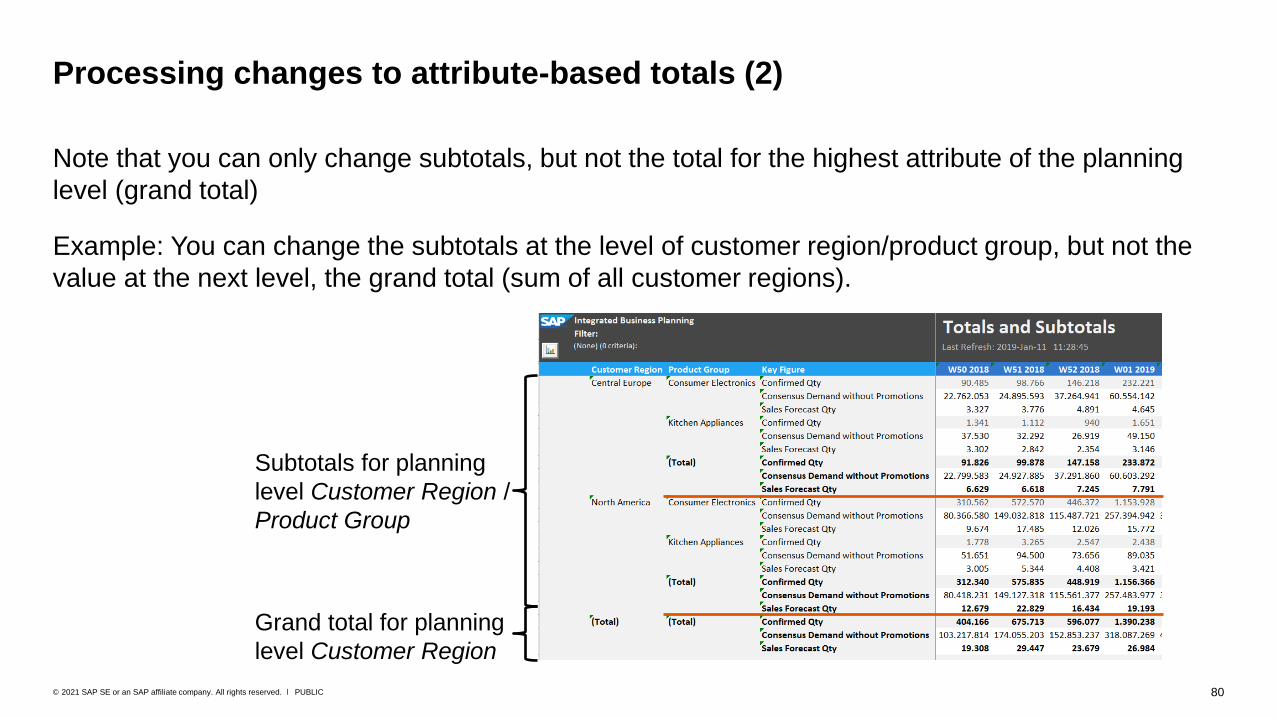
Note that you can only change subtotals, but not the total for the highest attribute of the planning
level (grand total)
Example: You can change the subtotals at the level of customer region/product group, but not the
value at the next level, the grand total (sum of all customer regions).
Processing changes to attribute-based totals (2)
Subtotals for planning
level Customer Region /
Product Group
Grand total for planning
level Customer Region

Advanced Settings
Sorting attribute values

82PUBLIC© 2021 SAP SE or an SAP affiliate company. All rights reserved. ǀ
Sorting attribute values helps you to structure your data in an efficient way for your daily work and
keep an overview of the most important aspects.
Besides sorting the attribute values in ascending or descending order, you can define
custom sorting rules. For example, if you want to have your top three customers always at the top
of the list, you can pin these three customers to the top of your planning view and move less
important customers to the bottom.
Sorting attribute values – introduction

83PUBLIC© 2021 SAP SE or an SAP affiliate company. All rights reserved. ǀ
In the Excel add-in, sorting is based on
ASCII (decimal) character code.
For more information, see
https://en.wikipedia.org/wiki/ASCII.
Sorting logic in the Excel add-in
84PUBLIC© 2021 SAP SE or an SAP affiliate company. All rights reserved. ǀ
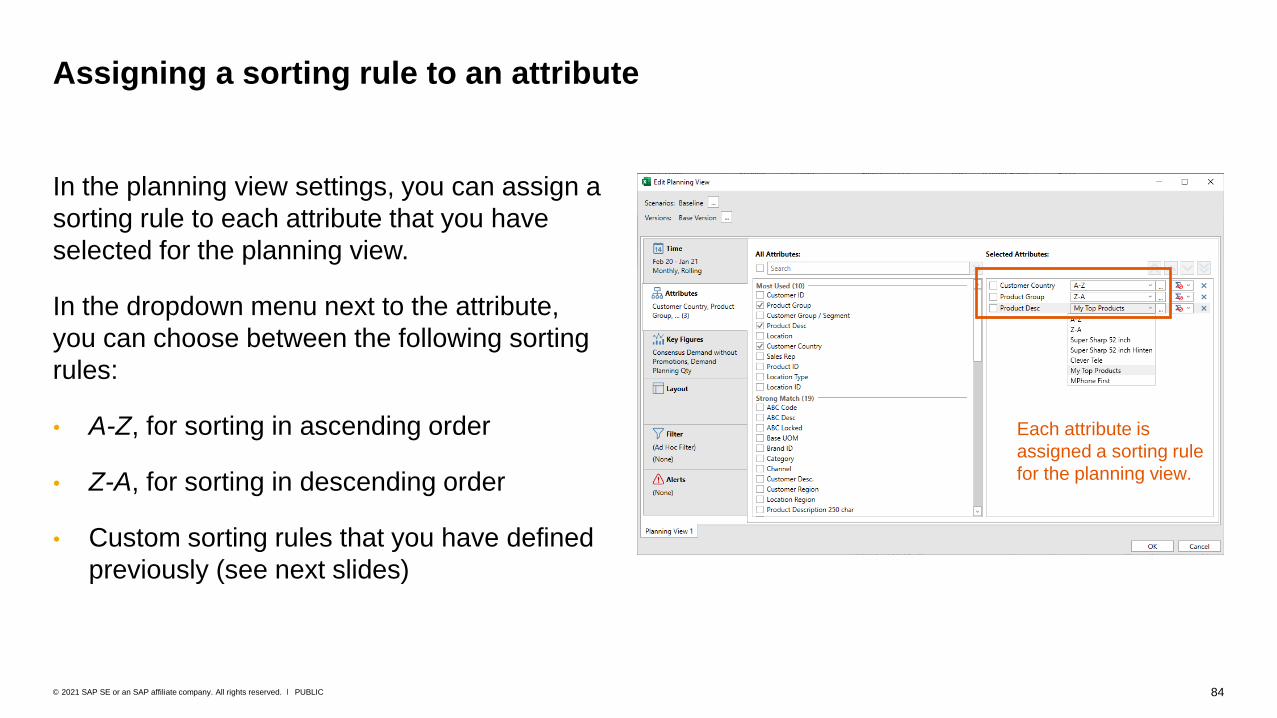
In the planning view settings, you can assign a
sorting rule to each attribute that you have
selected for the planning view.
In the dropdown menu next to the attribute,
you can choose between the following sorting
rules:
• A-Z, for sorting in ascending order
• Z-A, for sorting in descending order
• Custom sorting rules that you have defined
previously (see next slides)
Assigning a sorting rule to an attribute
Each attribute is
assigned a sorting rule
for the planning view.

85PUBLIC© 2021 SAP SE or an SAP affiliate company. All rights reserved. ǀ
1. Click the ellipsis button (…) next to the sorting
dropdown of the attribute.
2. On the right side of the Manage Sorting Rules
window, set up the sorting sequence for the
attribute values.
Example in the screenshot
The Selected Items section shows a list of attribute values.
This list is the sorting rule for the Product Desc attribute. With
this rule, the planning view will list monitors and phones in the
planning view in the following order:
1. CleverTele 42inch white
2. M-Phone 3D 640GB black&pink NEW
3. Others, that is, all other products visible on the left side of
the window in ascending order (A-Z) - except for,
4. CleverTele 48inch silver, which comes at the bottom
Defining a sorting rule for an attribute
86PUBLIC© 2021 SAP SE or an SAP affiliate company. All rights reserved. ǀ
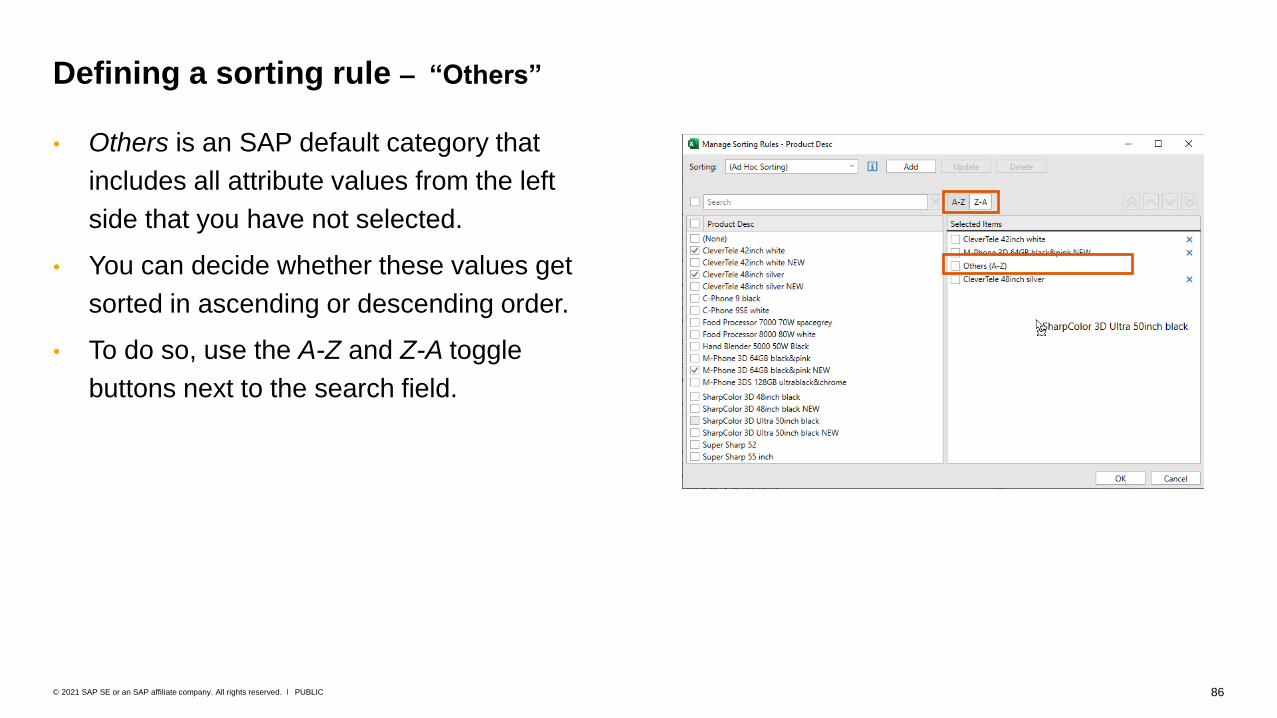
• Others is an SAP default category that
includes all attribute values from the left
side that you have not selected.
• You can decide whether these values get
sorted in ascending or descending order.
• To do so, use the A-Z and Z-A toggle
buttons next to the search field.
Defining a sorting rule – “Others”
87PUBLIC© 2021 SAP SE or an SAP affiliate company. All rights reserved. ǀ
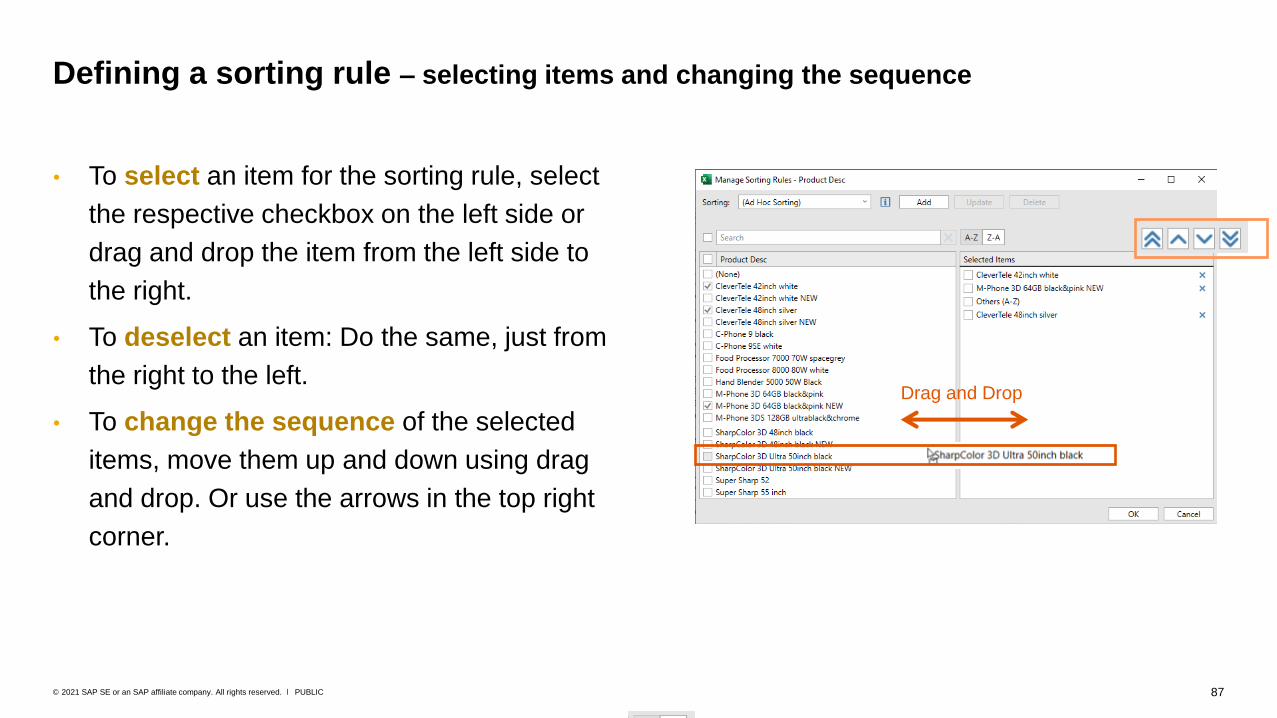
• To select an item for the sorting rule, select
the respective checkbox on the left side or
drag and drop the item from the left side to
the right.
• To deselect an item: Do the same, just from
the right to the left.
• To change the sequence of the selected
items, move them up and down using drag
and drop. Or use the arrows in the top right
corner.
Defining a sorting rule – selecting items and changing the sequence
Drag and Drop
88PUBLIC© 2021 SAP SE or an SAP affiliate company. All rights reserved. ǀ
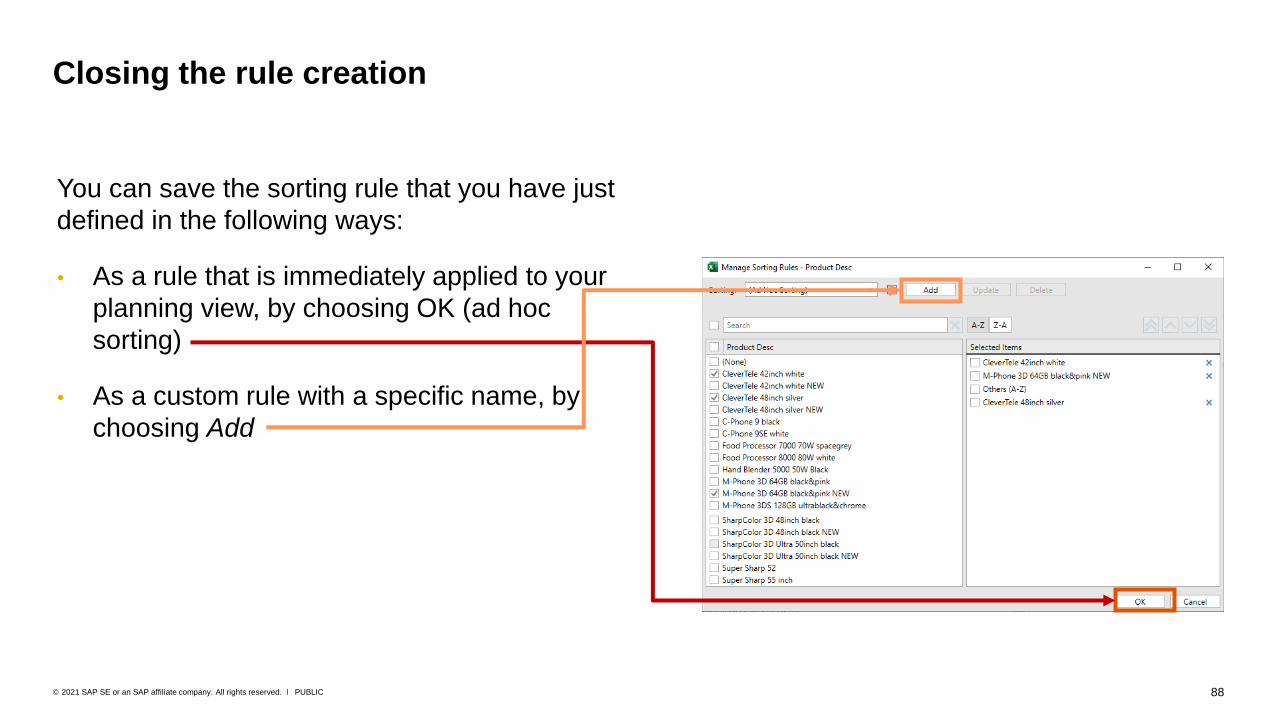
You can save the sorting rule that you have just
defined in the following ways:
• As a rule that is immediately applied to your
planning view, by choosing OK (ad hoc
sorting)
• As a custom rule with a specific name, by
choosing Add
Closing the rule creation

89PUBLIC© 2021 SAP SE or an SAP affiliate company. All rights reserved. ǀ
Saving a custom sorting rule
Your sorting rule is now available
in the sorting dropdowns.
1. Choose Add.
2. Enter the rule name.
3. Choose Add again.

90PUBLIC© 2021 SAP SE or an SAP affiliate company. All rights reserved. ǀ
In the Manage Sorting Rules window, you can
also update or delete a sorting rule.
Please note that you cannot delete sorting rules
that are still being used by favorites and
templates. If you try to do so, you will get an
error message with the name of the favorite or
template in which the sorting rule is used.
Updating and deleting a custom sorting rule

91PUBLIC© 2021 SAP SE or an SAP affiliate company. All rights reserved. ǀ
The sorting rules are applied to each attribute from left to right.
Example in the screenshot
1. The customer countries are sorted in ascending order, using the standard sorting rule A-Z.
2. Within each customer country, the product groups are sorted in descending order using the standard sorting rule Z-A.
3. For each value combination of customer country and product group, the products are sorted using the custom sorting rule XYZ.
Sorting for attribute combinations
1 2 3
Custom sorting
rule XYZ
Custom sorting
rule XYZ
Custom sorting
rule XYZ
Custom sorting
rule XYZSorting
rule A-Z
Sorting
rule Z-A
Sorting
rule Z-A

92PUBLIC© 2021 SAP SE or an SAP affiliate company. All rights reserved. ǀ
In the planning view, you can also change the
sorting rule for an attribute using the context
menu, as follows:
1. Right-click an attribute value.
2. Choose Sorting.
3. Select the sorting rule you want to apply:• A-Z for ascending
• Z-A for descending
• A custom sorting rule saved previously
Changing the sorting rule in the planning view

93PUBLIC© 2021 SAP SE or an SAP affiliate company. All rights reserved. ǀ
The sorting rules for attributes are saved with a planning view template or a favorite. So, next time
you open the template or favorite, your choice of sorting rules is preset for the selected attributes.
If you share a favorite, the sorting rules are shared with the other users as well. Saved sorting rules,
however, will appear as (Ad Hoc Sorting) rules for other users. The same applies if you open a
template that was created by another user.
Sorting rules in planning view templates and shared favorites
How you see your favorite: How your colleagues see it:
Please note: Planning view templates and planning view
favorites are explained in detail later on. This slide only
covers how these objects handle sorting rules.

94PUBLIC© 2021 SAP SE or an SAP affiliate company. All rights reserved. ǀ
Besides attribute-based sorting, you can still use classic member sorting in the report editor.
If you want to use both, please note that attribute-based sorting is applied by the SAP IBP backend,
while member sorting is applied by the Excel user interface. Therefore, member sorting overrules
attribute-based sorting, if there are conflicting sorting settings.
Attribute-based sorting and member sorting
To set up member sorting, choose
Advanced→ Report Editor.
On the Layout tab, select an attribute
and then Sort or group members by
properties.
Please note: Local members are covered in greater detail
later on. This slide is just about sorting aspects.

Advanced Settings
Attribute Value “(None)”, Strong and
Light Matches
96PUBLIC© 2021 SAP SE or an SAP affiliate company. All rights reserved. ǀ
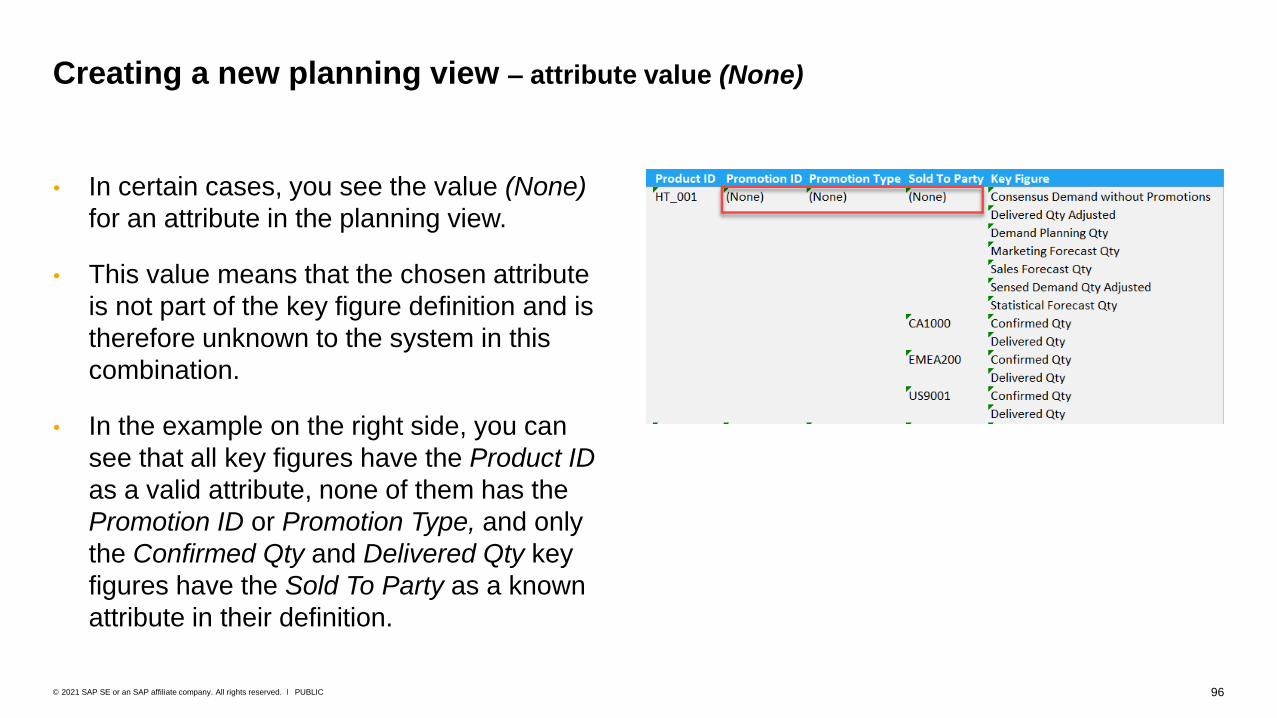
• In certain cases, you see the value (None)
for an attribute in the planning view.
• This value means that the chosen attribute
is not part of the key figure definition and is
therefore unknown to the system in this
combination.
• In the example on the right side, you can
see that all key figures have the Product ID
as a valid attribute, none of them has the
Promotion ID or Promotion Type, and only
the Confirmed Qty and Delivered Qty key
figures have the Sold To Party as a known
attribute in their definition.
Creating a new planning view – attribute value (None)

97PUBLIC© 2021 SAP SE or an SAP affiliate company. All rights reserved. ǀ
Creating a new planning view – attribute value (None)
Using Strong Match groups and Light Match groups
The Strong Match and Light Match groups can be used to help find attribute and key figure combinations that
hold data and represent meaningful information within the planning area. Based on your selection in the Time,
Attribute or Key Figure tabs, the Strong Match and Light Match groups are automatically updated.
Example
You select Month as the time period and the attributes Product
Group and Promotion ID. Moving to the Key Figures tab, you
can see the key figures listed in the Strong Match group,
where the base planning level is a complete match to the
attributes and time dimension selected.
In this example, the Promotion ID is only part of a few base
planning levels, so data for it can only be visualized for 3 key
figures in the Strong Match group.
The ones that have a partial coverage are listed under the
Light Match group and the remaining items, that don’t match
at all are listed at the bottom.

98PUBLIC© 2021 SAP SE or an SAP affiliate company. All rights reserved. ǀ
The Strong Match group for attributes or key figures shows you which items (attributes, time periods, key
figures) would lead to a full coverage on the planning view, without showing any empty or (None) labeled
elements. This means that all selected attributes are part of the key figure calculation and the other way
around.
Please note, that empty or (None) labeled elements can still appear in case the attribute value itself is empty,
but the appearance is unlikely within this group.
Items listed in the Strong Match group will not show up in any other group.
Creating a new planning view – attribute value (None)
Strong Match group
99PUBLIC© 2021 SAP SE or an SAP affiliate company. All rights reserved. ǀ
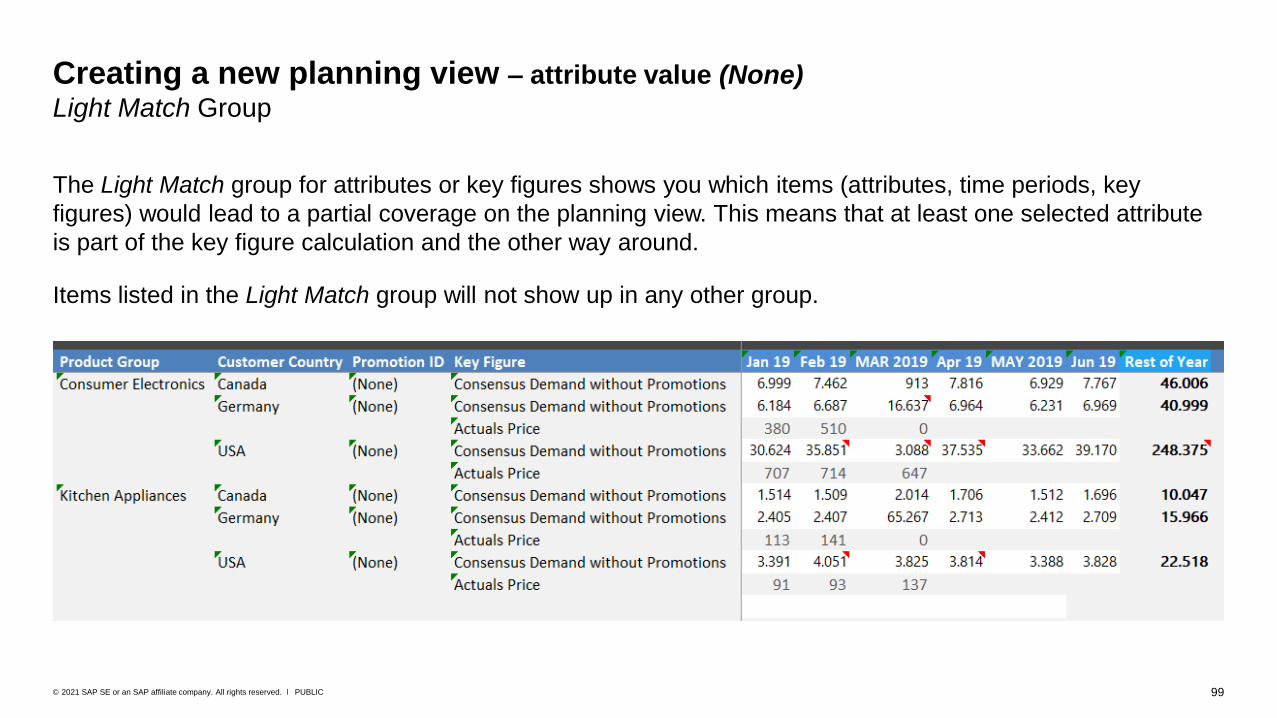
The Light Match group for attributes or key figures shows you which items (attributes, time periods, key
figures) would lead to a partial coverage on the planning view. This means that at least one selected attribute
is part of the key figure calculation and the other way around.
Items listed in the Light Match group will not show up in any other group.
Creating a new planning view – attribute value (None)
Light Match Group

Saving Planning Views as
Templates and Favorites
101PUBLIC© 2021 SAP SE or an SAP affiliate company. All rights reserved. ǀ
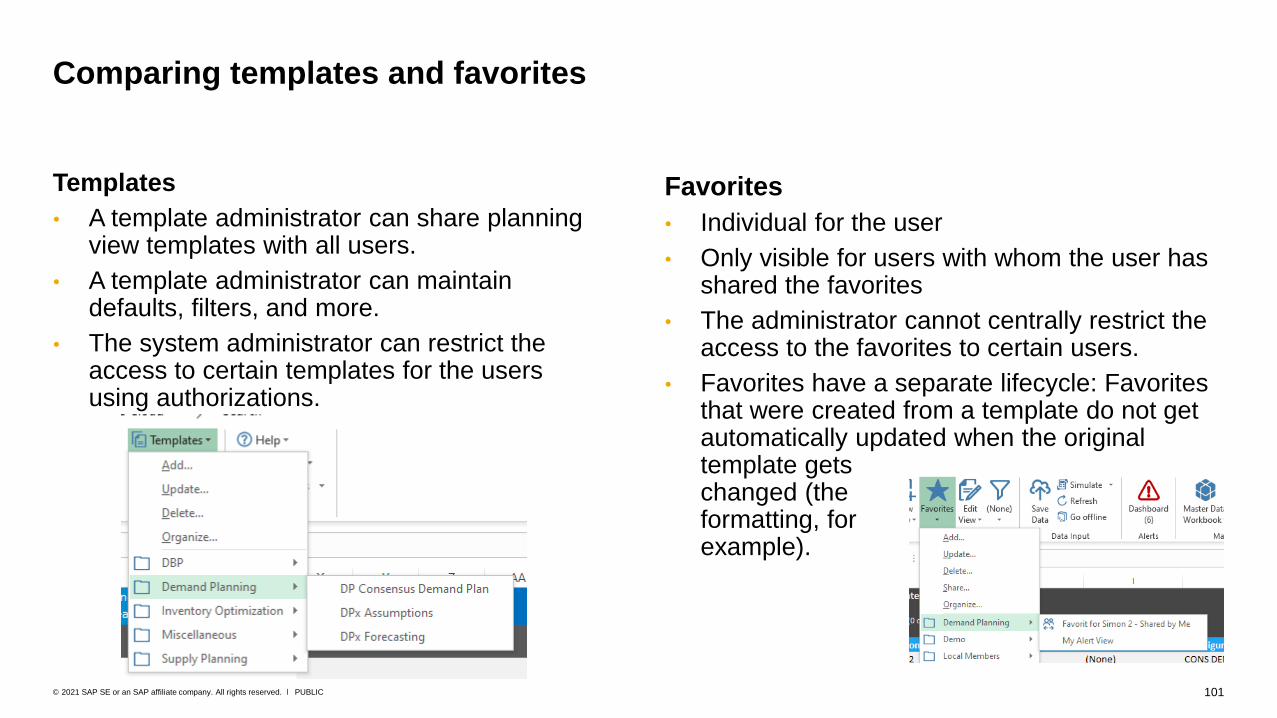
Templates
• A template administrator can share planning view templates with all users.
• A template administrator can maintain defaults, filters, and more.
• The system administrator can restrict the access to certain templates for the users using authorizations.
Comparing templates and favorites
Favorites
• Individual for the user
• Only visible for users with whom the user has shared the favorites
• The administrator cannot centrally restrict the access to the favorites to certain users.
• Favorites have a separate lifecycle: Favorites that were created from a template do not getautomatically updated when the original template gets changed (the formatting, for example).
102PUBLIC© 2021 SAP SE or an SAP affiliate company. All rights reserved. ǀ
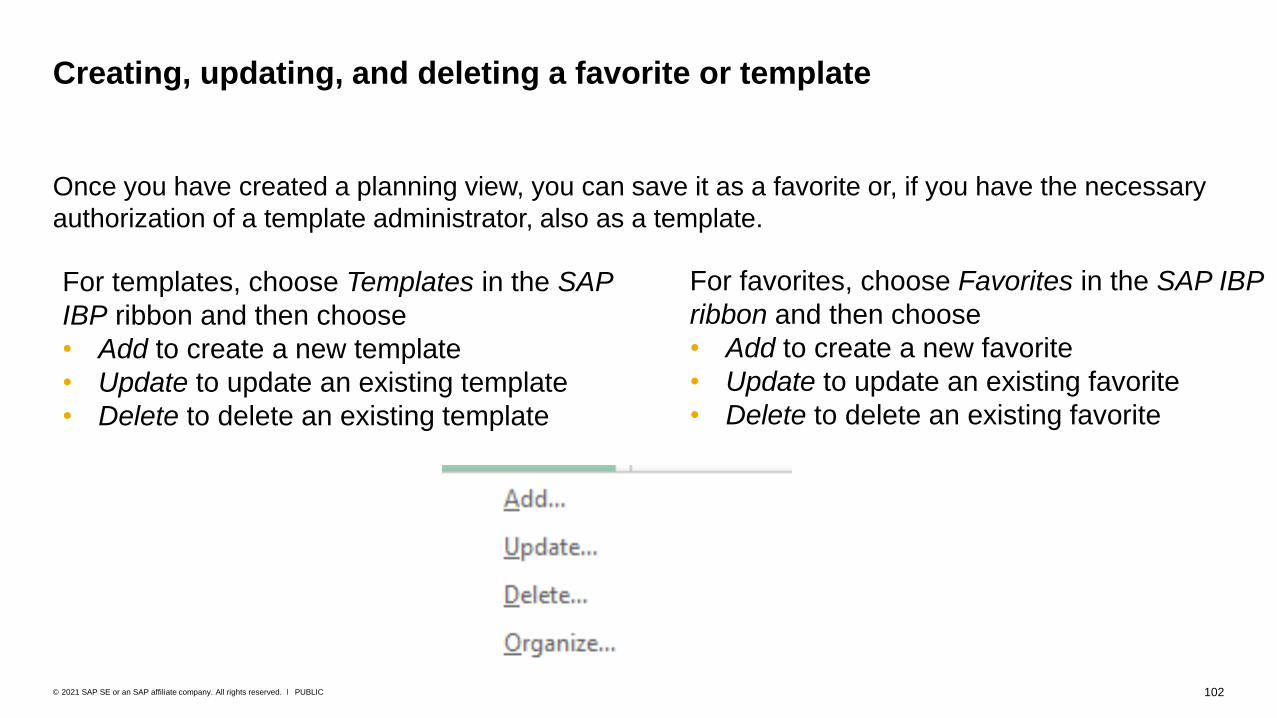
Once you have created a planning view, you can save it as a favorite or, if you have the necessary
authorization of a template administrator, also as a template.
Creating, updating, and deleting a favorite or template
For templates, choose Templates in the SAP
IBP ribbon and then choose
• Add to create a new template
• Update to update an existing template
• Delete to delete an existing template
For favorites, choose Favorites in the SAP IBP
ribbon and then choose
• Add to create a new favorite
• Update to update an existing favorite
• Delete to delete an existing favorite

103PUBLIC© 2021 SAP SE or an SAP affiliate company. All rights reserved. ǀ
Once a planning view is saved as a template, it can be opened as follows:
Accessing templates
When you create a new planning view from a
template, you can select the template to open.
The settings can then also be adjusted directly.
From the Templates dropdown
menu in the Excel add-in ribbon
(usually visible for template
administrators only)
104PUBLIC© 2021 SAP SE or an SAP affiliate company. All rights reserved. ǀ
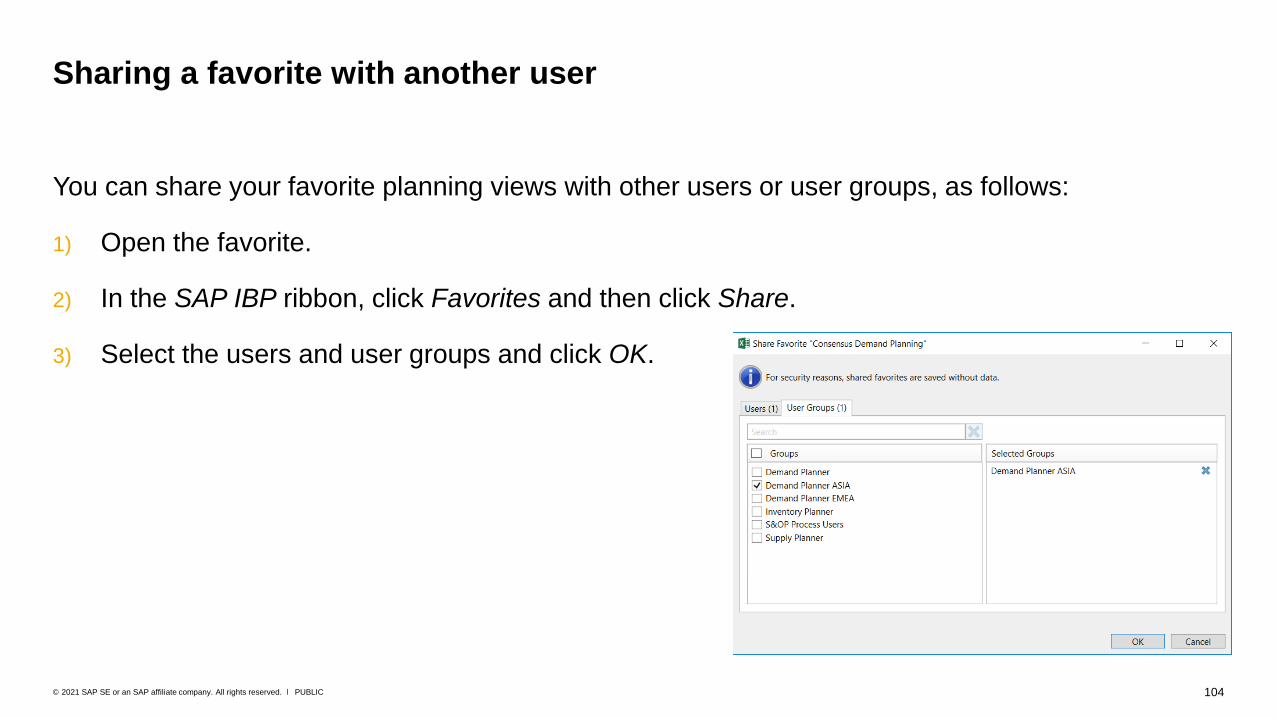
You can share your favorite planning views with other users or user groups, as follows:
1) Open the favorite.
2) In the SAP IBP ribbon, click Favorites and then click Share.
3) Select the users and user groups and click OK.
Sharing a favorite with another user
105PUBLIC© 2021 SAP SE or an SAP affiliate company. All rights reserved. ǀ
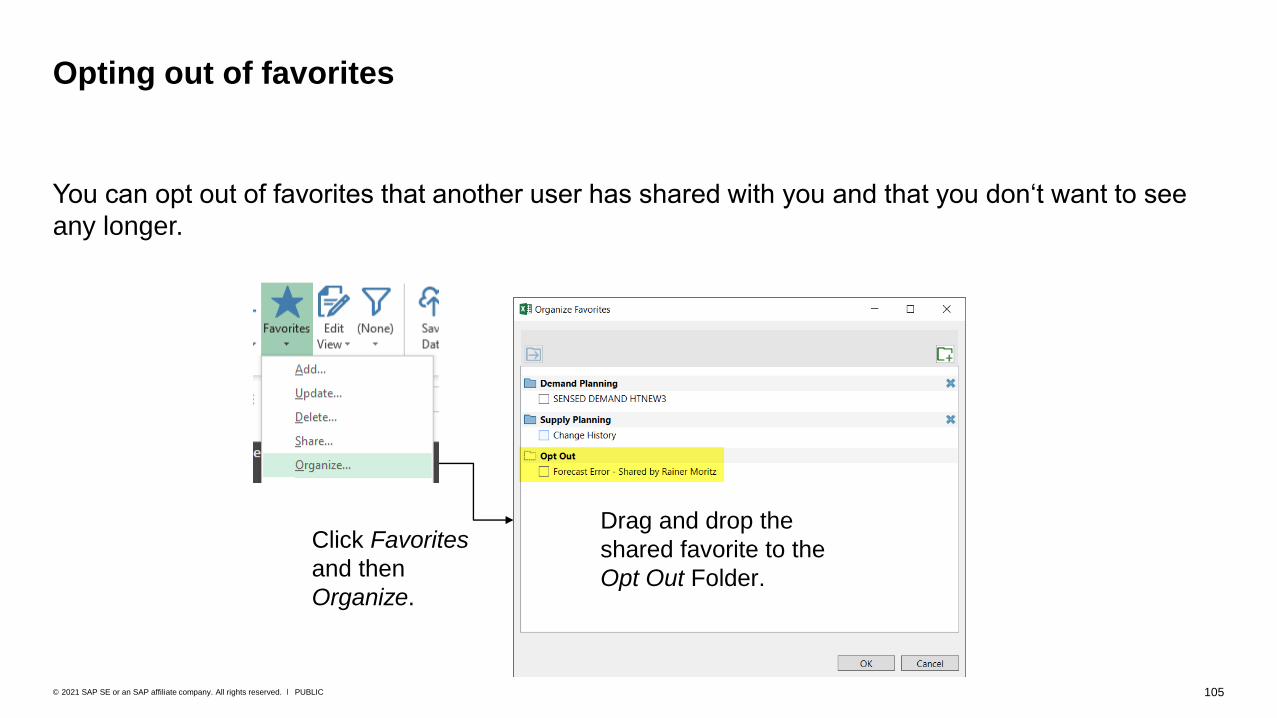
Opting out of favorites
You can opt out of favorites that another user has shared with you and that you don‘t want to see
any longer.
Click Favorites
and then
Organize.
Drag and drop the
shared favorite to the
Opt Out Folder.
106PUBLIC© 2021 SAP SE or an SAP affiliate company. All rights reserved. ǀ
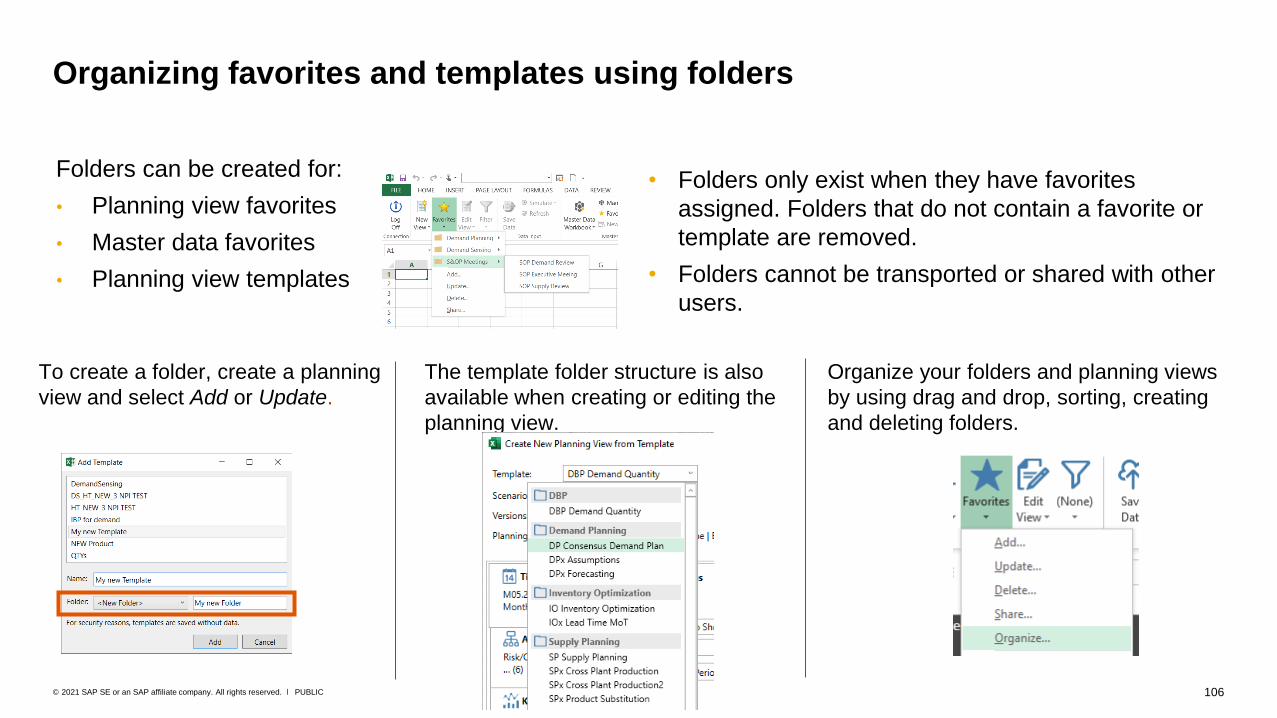
Organizing favorites and templates using folders
Folders can be created for:
• Planning view favorites
• Master data favorites
• Planning view templates
The template folder structure is also
available when creating or editing the
planning view.
To create a folder, create a planning
view and select Add or Update.
Organize your folders and planning views
by using drag and drop, sorting, creating
and deleting folders.
• Folders only exist when they have favorites
assigned. Folders that do not contain a favorite or
template are removed.
• Folders cannot be transported or shared with other
users.

107PUBLIC© 2021 SAP SE or an SAP affiliate company. All rights reserved. ǀ
Renaming favorites and templates
In the Organize menu, you can rename planning view favorites, master data favorites, planning view
templates, and the respective folders.
The Organize menu is included in the following groups of the SAP IBP ribbon:
Favorites in the
Planning View
group
Templates in the
Template Admin
group
Favorites in the
Master Data
group
Please note that the same process and
limitations apply as for the renaming of
the attribute-based planning filters.

SAP IBP Formatting Sheet

109PUBLIC© 2021 SAP SE or an SAP affiliate company. All rights reserved. ǀ
SAP IBP Formatting Sheet
You can use the formatting sheet to define a specific format (font, color, size, and so on) for the
data area in the planning view as well as for the header. The formatting settings can be applied to
templates by an administrator, or to individual planning views by planners, provided they have the
necessary authorizations.
The SAP IBP Formatting Sheet consists of the following sections:
• Default Formatting: in this section, you can determine the basic formatting that you want to
apply to your planning view.
• Member/Property Formatting: in this section, you can define additional rules to fine-tune the
formatting dependent of key figure characteristics such as editability or certain conditions.
• Row and Column Banding: in this section, you can define the format for every second row or
every second column to better distinguish between the different rows or columns.
For a detailed description of the different sections, and how to apply formatting to your planning
views using the SAP IBP Formatting sheet, see the application help on the SAP Help Portal at
https://help.sap.com/ibp, under SAP IBP Formatting Sheet.
110PUBLIC© 2021 SAP SE or an SAP affiliate company. All rights reserved. ǀ
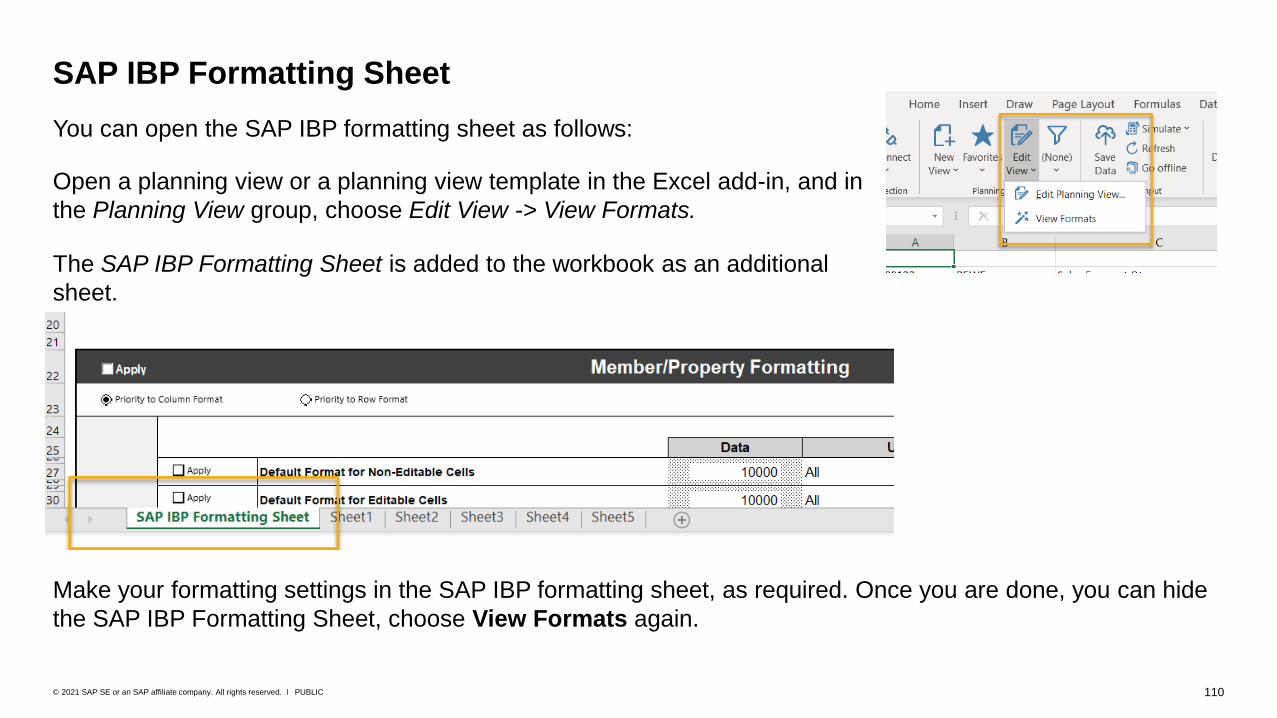
SAP IBP Formatting Sheet
You can open the SAP IBP formatting sheet as follows:
Open a planning view or a planning view template in the Excel add-in, and in
the Planning View group, choose Edit View -> View Formats.
The SAP IBP Formatting Sheet is added to the workbook as an additional
sheet.
Make your formatting settings in the SAP IBP formatting sheet, as required. Once you are done, you can hide
the SAP IBP Formatting Sheet, choose View Formats again.
111PUBLIC© 2021 SAP SE or an SAP affiliate company. All rights reserved. ǀ
SAP IBP Formatting Sheet Enhancements
Starting with the 2105.2.0 version of the SAP IBP, add-in for Microsoft Excel, your
existing formatting sheets are migrated to a new format on the fly when you open a favorite or
template that contains a formatting sheet that was created with lower versions of the Excel add-in.
Your planning views are not affected by this migration and the formatting that you are used to
is contained.
During the migration, certain settings that were irrelevant for the usage with SAP IBP are
removed, certain rules are merged, and labels are changed. The changes result in a formatting sheet
that is easier to use, and requires fewer formatting rules to be set up to visualize that a value in a cell
is editable, for example.

112PUBLIC© 2021 SAP SE or an SAP affiliate company. All rights reserved. ǀ
SAP IBP Formatting Sheet Enhancements
113PUBLIC© 2021 SAP SE or an SAP affiliate company. All rights reserved. ǀ
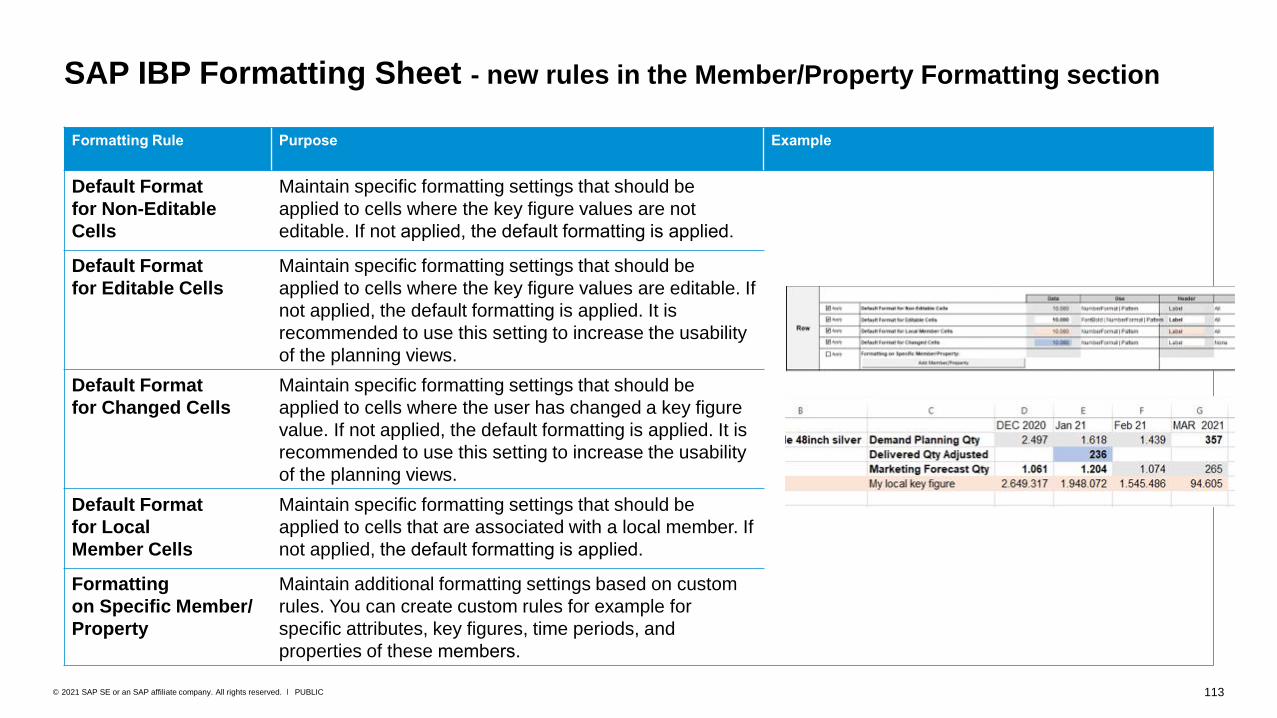
SAP IBP Formatting Sheet - new rules in the Member/Property Formatting section
Formatting Rule Purpose Example
Default Format
for Non-Editable
Cells
Maintain specific formatting settings that should be
applied to cells where the key figure values are not
editable. If not applied, the default formatting is applied.
Default Format
for Editable Cells
Maintain specific formatting settings that should be
applied to cells where the key figure values are editable. If
not applied, the default formatting is applied. It is
recommended to use this setting to increase the usability
of the planning views.
Default Format
for Changed Cells
Maintain specific formatting settings that should be
applied to cells where the user has changed a key figure
value. If not applied, the default formatting is applied. It is
recommended to use this setting to increase the usability
of the planning views.
Default Format
for Local
Member Cells
Maintain specific formatting settings that should be
applied to cells that are associated with a local member. If
not applied, the default formatting is applied.
Formatting
on Specific Member/
Property
Maintain additional formatting settings based on custom
rules. You can create custom rules for example for
specific attributes, key figures, time periods, and
properties of these members.

Visualization of Key Figure Editability
115PUBLIC© 2021 SAP SE or an SAP affiliate company. All rights reserved. ǀ
Key Figure Editability Horizon
The editability horizon is the time defined for key figures in which business users can edit the key figure data.
The system considers editability horizons when users make manual changes in key figure values, it is
disregarded when the changes are done by system processes, for example, when a forecast run changes key
figure values.
Editability horizons are considered in the following areas:
• Excel add-in
• (Editability horizons can be visualized in the Excel add-in, using the formatting rules for editable key figures.
For more information, see the application help on the SAP Help Portal at https://help.sap.com/ibp,
under Formatting Rules to Visualize Key Figure Editability.)
• Web-Based Planning app
• Driver-Based Planning app
116PUBLIC© 2021 SAP SE or an SAP affiliate company. All rights reserved. ǀ
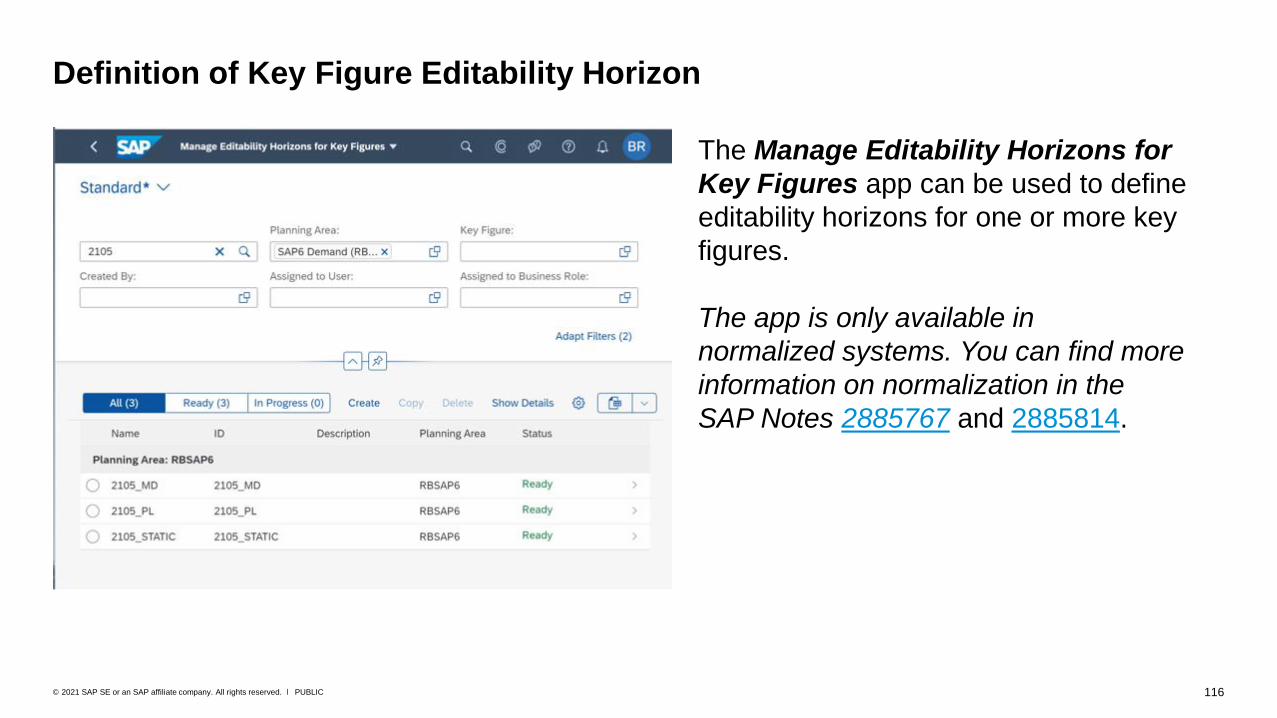
Definition of Key Figure Editability Horizon
The Manage Editability Horizons for
Key Figures app can be used to define
editability horizons for one or more key
figures.
The app is only available in
normalized systems. You can find more
information on normalization in the
SAP Notes 2885767 and 2885814.
117PUBLIC© 2021 SAP SE or an SAP affiliate company. All rights reserved. ǀ
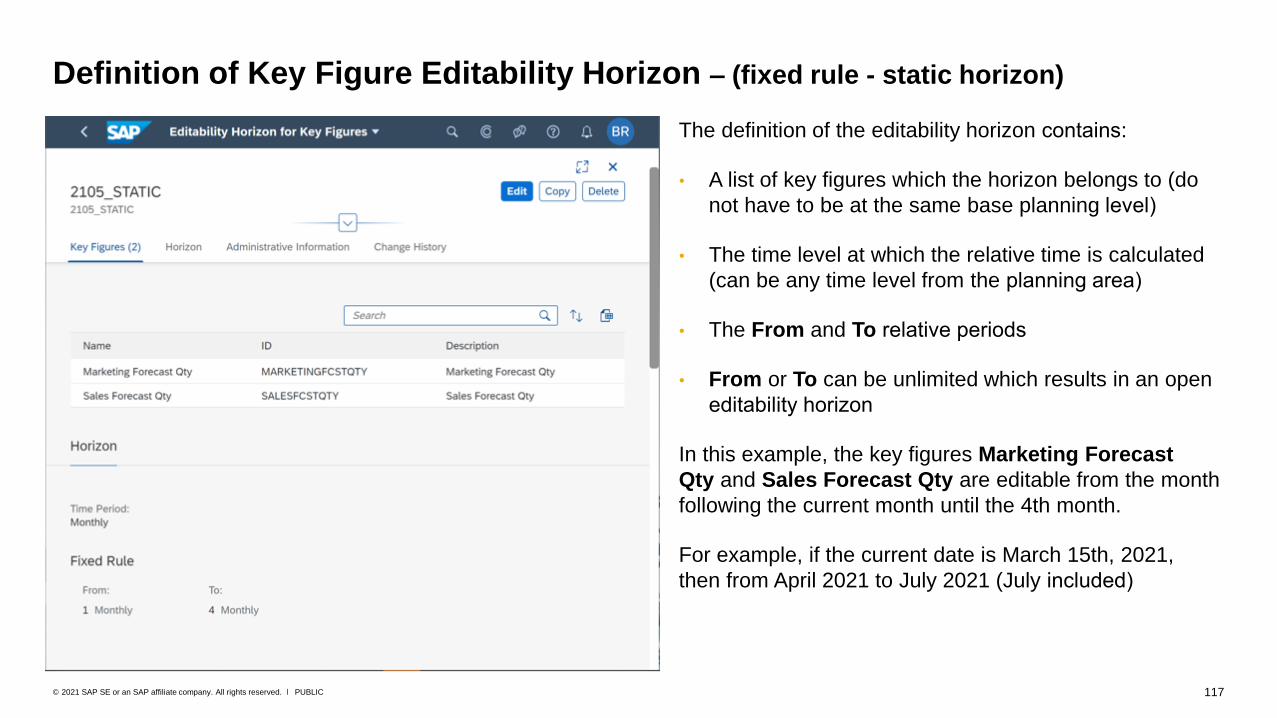
Definition of Key Figure Editability Horizon – (fixed rule - static horizon)
The definition of the editability horizon contains:
• A list of key figures which the horizon belongs to (do
not have to be at the same base planning level)
• The time level at which the relative time is calculated
(can be any time level from the planning area)
• The From and To relative periods
• From or To can be unlimited which results in an open
editability horizon
In this example, the key figures Marketing Forecast
Qty and Sales Forecast Qty are editable from the month
following the current month until the 4th month.
For example, if the current date is March 15th, 2021,
then from April 2021 to July 2021 (July included)
118PUBLIC© 2021 SAP SE or an SAP affiliate company. All rights reserved. ǀ
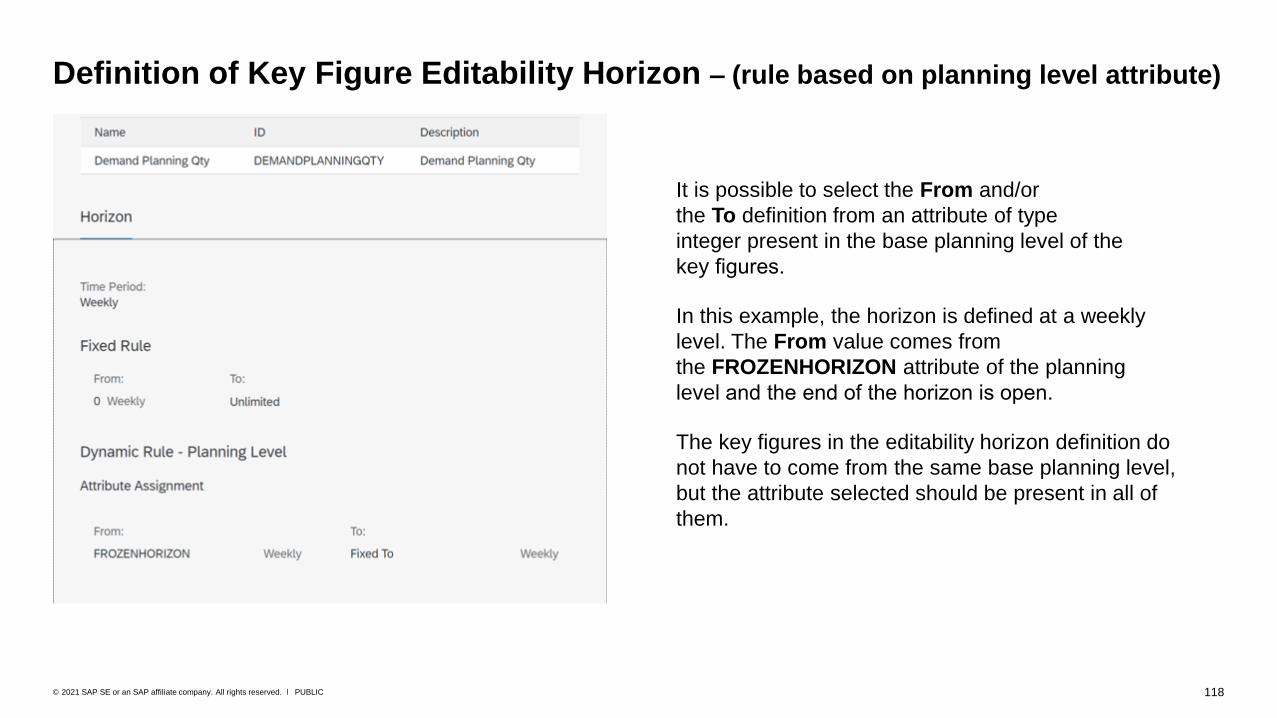
Definition of Key Figure Editability Horizon – (rule based on planning level attribute)
It is possible to select the From and/or
the To definition from an attribute of type
integer present in the base planning level of the
key figures.
In this example, the horizon is defined at a weekly
level. The From value comes from
the FROZENHORIZON attribute of the planning
level and the end of the horizon is open.
The key figures in the editability horizon definition do
not have to come from the same base planning level,
but the attribute selected should be present in all of
them.
119PUBLIC© 2021 SAP SE or an SAP affiliate company. All rights reserved. ǀ
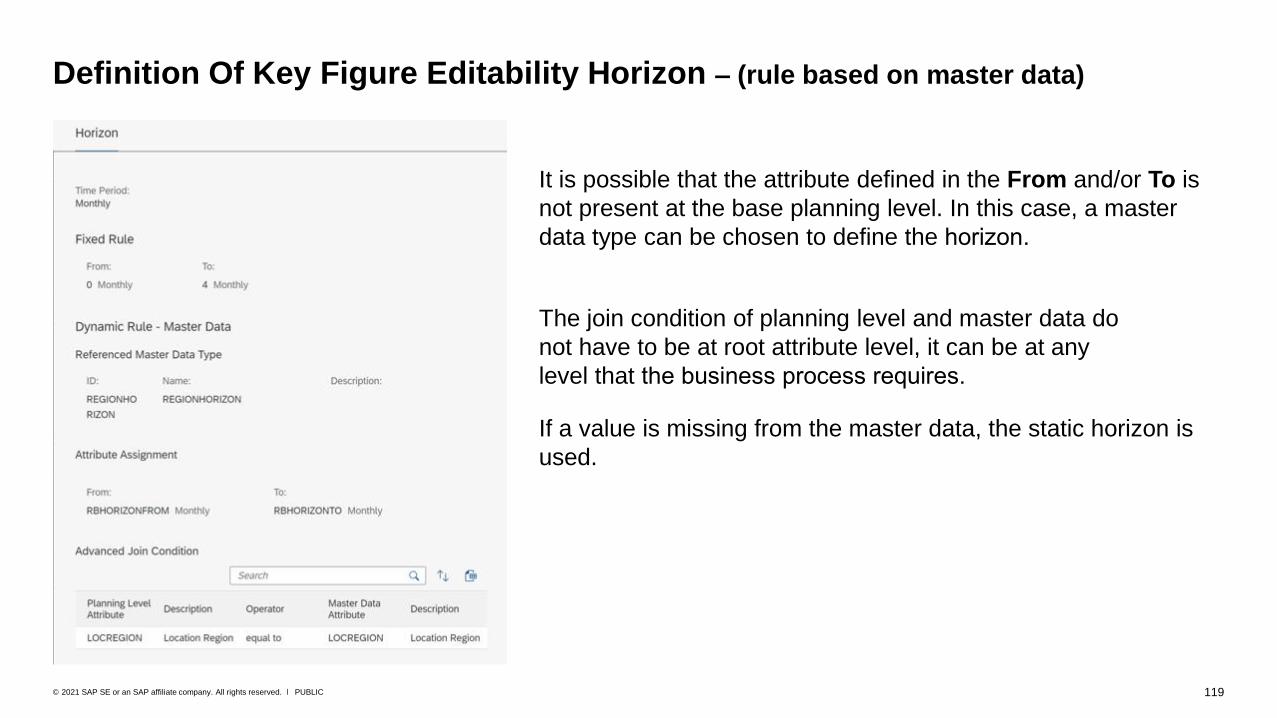
Definition Of Key Figure Editability Horizon – (rule based on master data)
It is possible that the attribute defined in the From and/or To is
not present at the base planning level. In this case, a master
data type can be chosen to define the horizon.
The join condition of planning level and master data do
not have to be at root attribute level, it can be at any
level that the business process requires.
If a value is missing from the master data, the static horizon is
used.

120PUBLIC© 2021 SAP SE or an SAP affiliate company. All rights reserved. ǀ
Definition of Key Figure Editability Horizon – (create master data)
The master data type doesn't have to be part of a
planning area. There is no need to change and
activate a planning area, you can just create a
master data type for the purposes of the editability
horizon.
In this example, if the Region is
for example, North America, the horizon
defined in the static section will be used.
121PUBLIC© 2021 SAP SE or an SAP affiliate company. All rights reserved. ǀ
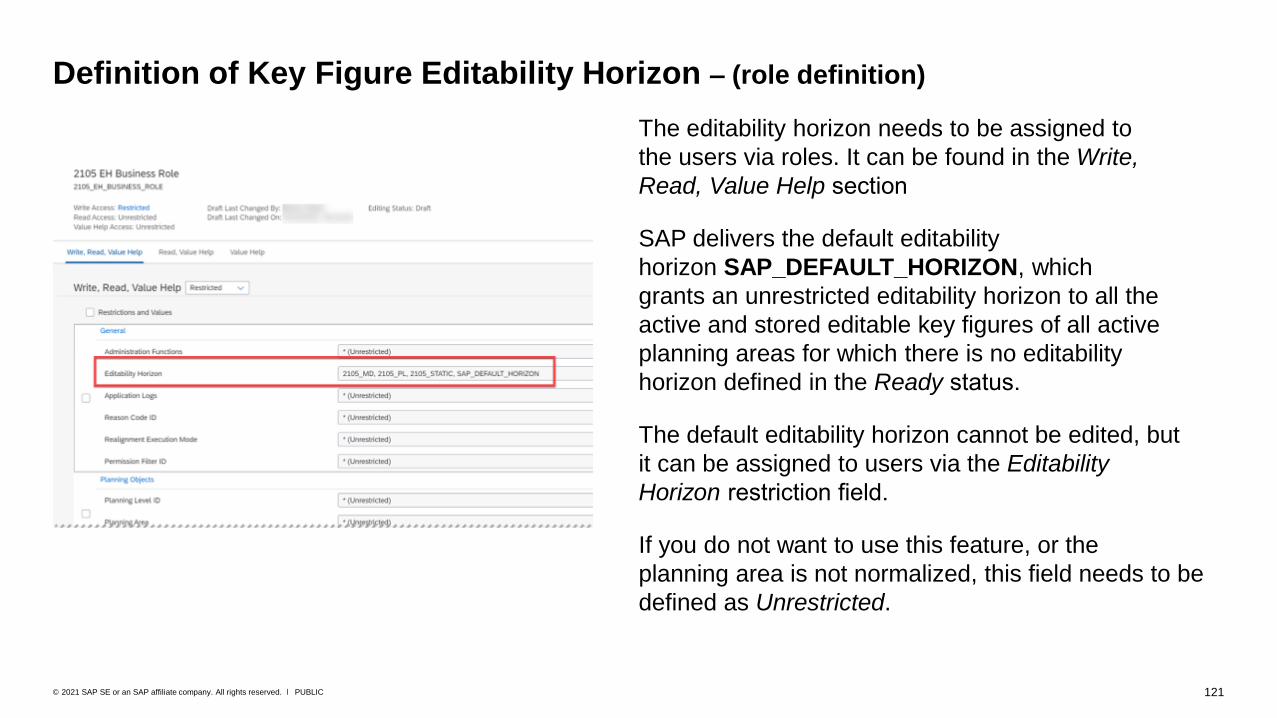
Definition of Key Figure Editability Horizon – (role definition)
The editability horizon needs to be assigned to
the users via roles. It can be found in the Write,
Read, Value Help section
SAP delivers the default editability
horizon SAP_DEFAULT_HORIZON, which
grants an unrestricted editability horizon to all the
active and stored editable key figures of all active
planning areas for which there is no editability
horizon defined in the Ready status.
The default editability horizon cannot be edited, but
it can be assigned to users via the Editability
Horizon restriction field.
If you do not want to use this feature, or the
planning area is not normalized, this field needs to be
defined as Unrestricted.
122PUBLIC© 2021 SAP SE or an SAP affiliate company. All rights reserved. ǀ
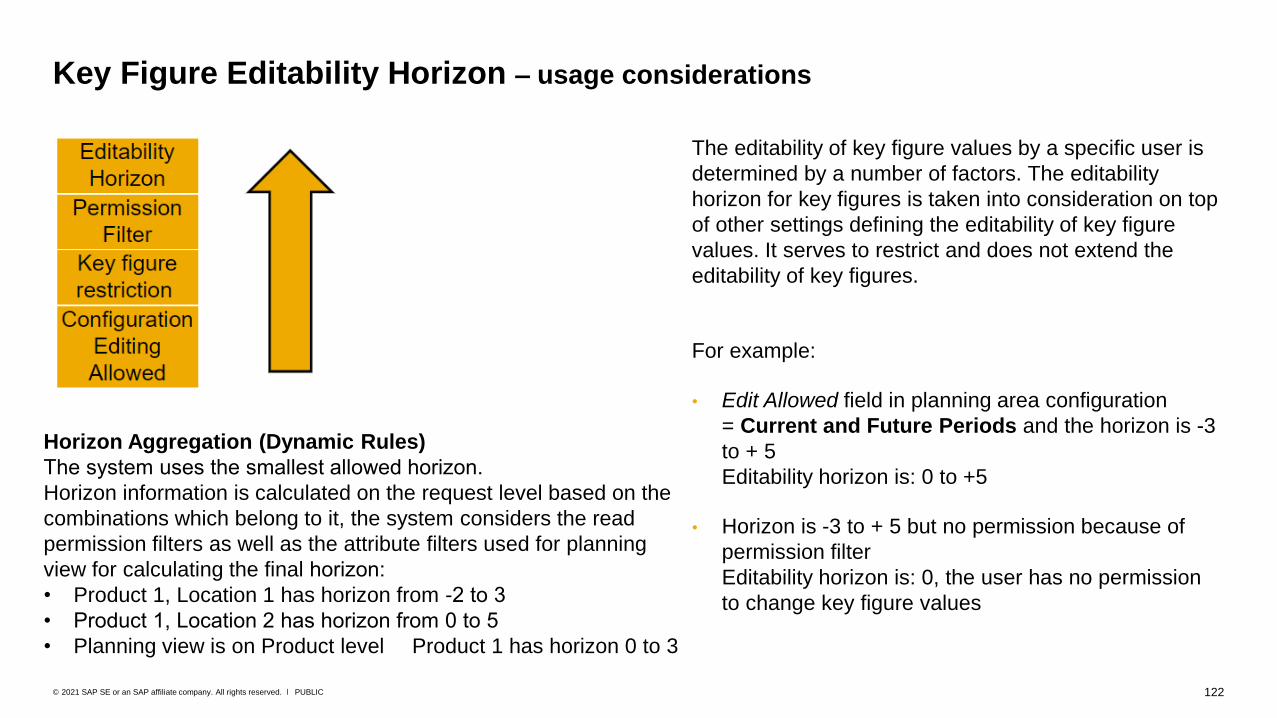
Key Figure Editability Horizon – usage considerations
The editability of key figure values by a specific user is
determined by a number of factors. The editability
horizon for key figures is taken into consideration on top
of other settings defining the editability of key figure
values. It serves to restrict and does not extend the
editability of key figures.
For example:
• Edit Allowed field in planning area configuration
= Current and Future Periods and the horizon is -3
to + 5
Editability horizon is: 0 to +5
• Horizon is -3 to + 5 but no permission because of
permission filter
Editability horizon is: 0, the user has no permission
to change key figure values
Horizon Aggregation (Dynamic Rules)
The system uses the smallest allowed horizon.
Horizon information is calculated on the request level based on the
combinations which belong to it, the system considers the read
permission filters as well as the attribute filters used for planning
view for calculating the final horizon:
• Product 1, Location 1 has horizon from -2 to 3
• Product 1, Location 2 has horizon from 0 to 5
• Planning view is on Product level Product 1 has horizon 0 to 3

123PUBLIC© 2021 SAP SE or an SAP affiliate company. All rights reserved. ǀ
Formatting rules to visualize the Key Figure Editability Horizon
The key figure editability feature is accompanied by
enhanced formatting rules to support the visualization of flexible
key figure editability horizons.
Use the Default Format for Editable Cells to define a format for
cells that are editable by the user, for example, indicated by a
white background.
You can use the Default Format for Non-Editable Cells to define a
format for cells that are not editable and where you wish that the
formatting is different from your overall template background, for
example, indicated by a grey background
These new rules also work with the existing key figure settings for
editability (for example, Editable in the Current and Future)
It is recommended to use these two new formatting rules for data
formatting either in the row or the column area due to performance
impact. The header formatting is not impacted by this.
The new key figure editability settings configured in the Manage
Editability Horizons for Key Figures app are only visualized
correctly when you use the Default Format for Editable Cells rule.

124PUBLIC© 2021 SAP SE or an SAP affiliate company. All rights reserved. ǀ
Formatting rules – example planning view
Time-Based Disaggregation of Partially
Editable Child Nodes
126PUBLIC© 2021 SAP SE or an SAP affiliate company. All rights reserved. ǀ
Time-Based Disaggregation of Partially Editable Child Nodes– How does it work?
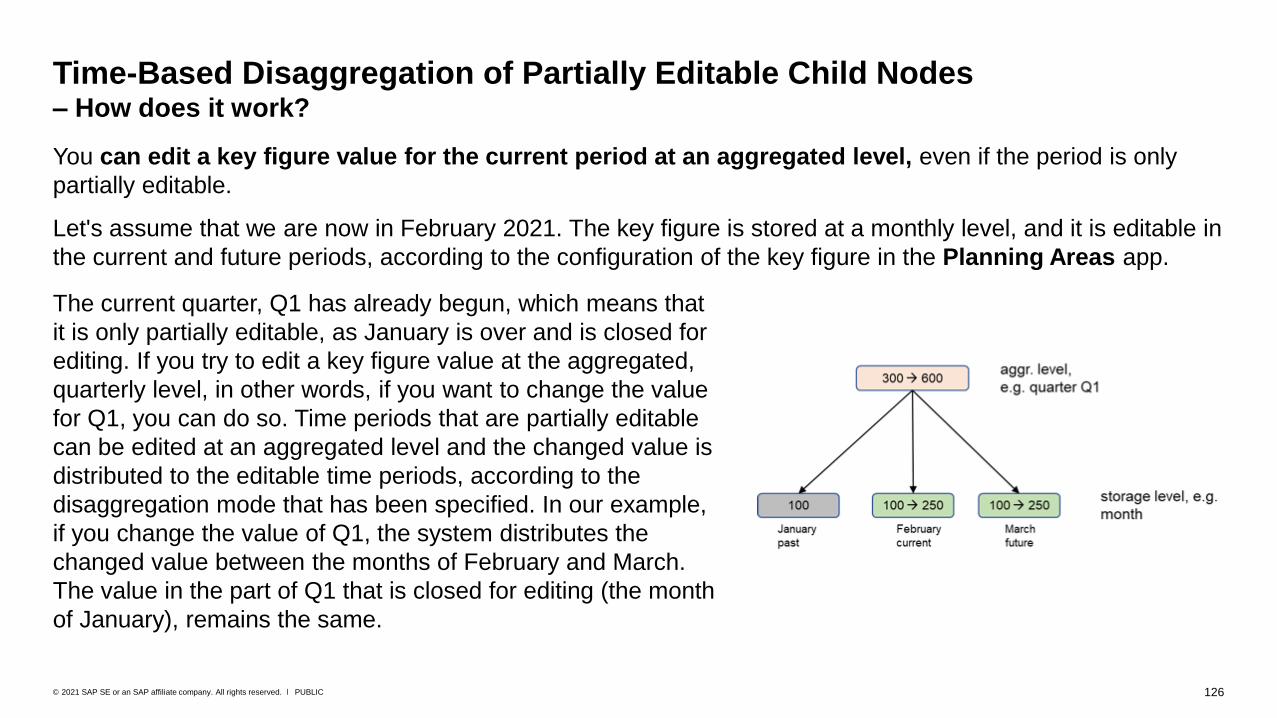
The current quarter, Q1 has already begun, which means that
it is only partially editable, as January is over and is closed for
editing. If you try to edit a key figure value at the aggregated,
quarterly level, in other words, if you want to change the value
for Q1, you can do so. Time periods that are partially editable
can be edited at an aggregated level and the changed value is
distributed to the editable time periods, according to the
disaggregation mode that has been specified. In our example,
if you change the value of Q1, the system distributes the
changed value between the months of February and March.
The value in the part of Q1 that is closed for editing (the month
of January), remains the same.
You can edit a key figure value for the current period at an aggregated level, even if the period is only
partially editable.
Let's assume that we are now in February 2021. The key figure is stored at a monthly level, and it is editable in
the current and future periods, according to the configuration of the key figure in the Planning Areas app.
127PUBLIC© 2021 SAP SE or an SAP affiliate company. All rights reserved. ǀ
Time-Based Disaggregation of Partially Editable Child Nodes– Changes that aren’t allowed
The system rejects following types of changes:
• Changes that would lead to negative values of the editable child nodes at the storage level.
In the previous example, if you change the value of Q1 to 50, the result would be - 75 for
February and March, respectively, which is not allowed.
• Changes of values to empty values, if there are values in the noneditable periods.
• Changes to values if all of the child periods in the editable area are fixed.
128PUBLIC© 2021 SAP SE or an SAP affiliate company. All rights reserved. ǀ
Time-Based Disaggregation of Partially Editable Child Nodes– Considerations
Things to remember:
• The system considers manual changes that you make to partially editable key figure values in
the SAP IBP, add-in for Microsoft Excel. It is not possible to edit such values in the Web-Based
Planning app, or in the Planner Workspaces app.
• Changes to partially editable child nodes made by system processes, for example forecasting
runs (simulation or background) are not supported.
• You can’t fix or unfix values of cells that are in partially editable periods.
• The ADVSIM operator does not consider partially editable child nodes.
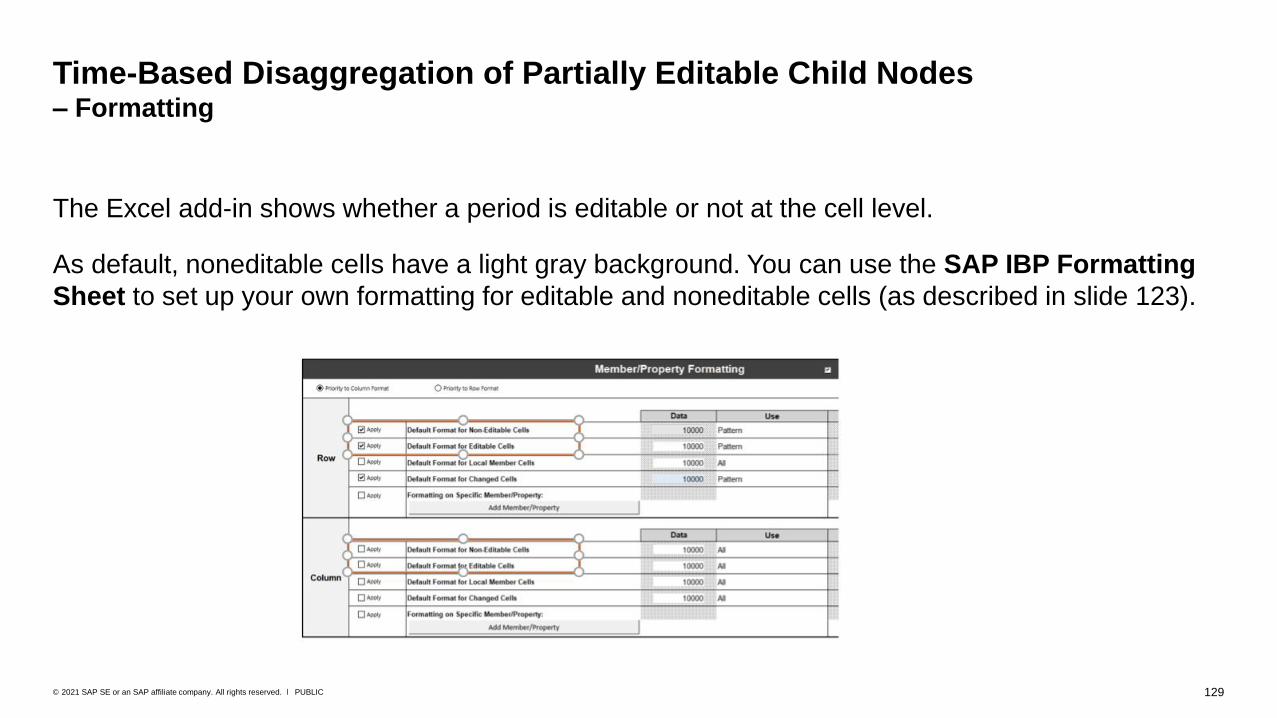
129PUBLIC© 2021 SAP SE or an SAP affiliate company. All rights reserved. ǀ
Time-Based Disaggregation of Partially Editable Child Nodes– Formatting
The Excel add-in shows whether a period is editable or not at the cell level.
As default, noneditable cells have a light gray background. You can use the SAP IBP Formatting
Sheet to set up your own formatting for editable and noneditable cells (as described in slide 123).
How to Work with Planning Views

Editing Planning Views
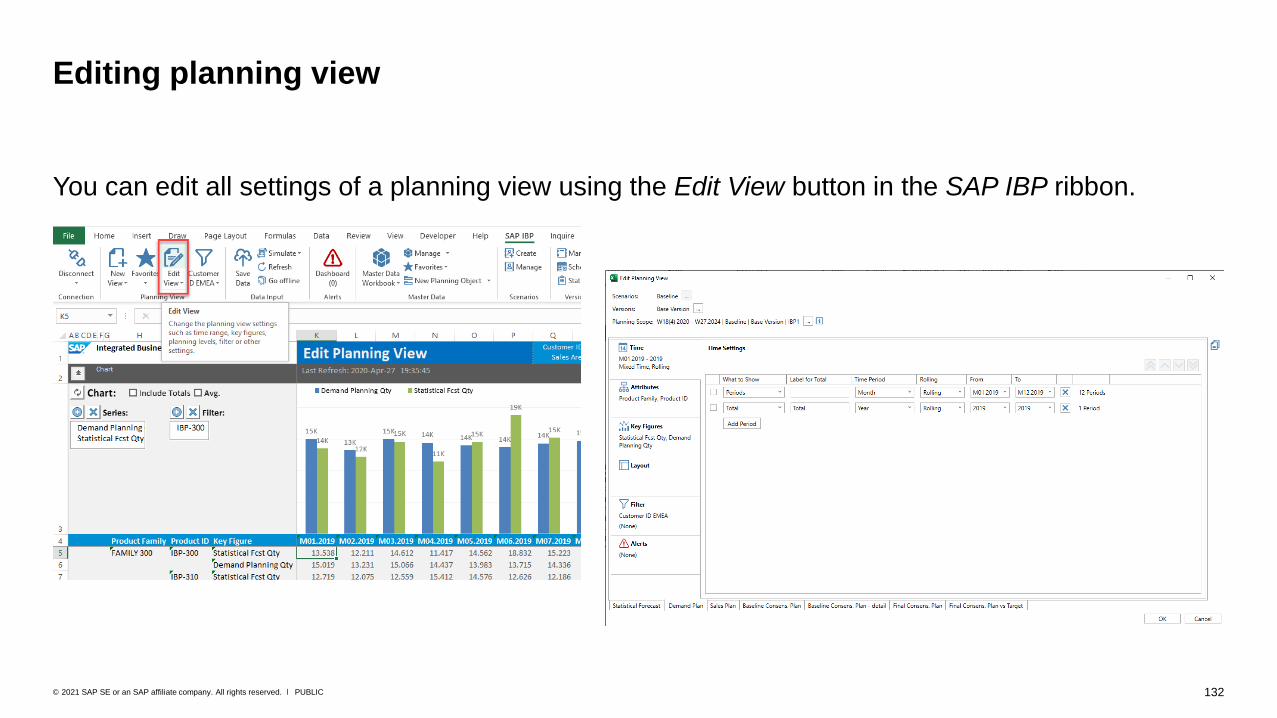
132PUBLIC© 2021 SAP SE or an SAP affiliate company. All rights reserved. ǀ
You can edit all settings of a planning view using the Edit View button in the SAP IBP ribbon.
Editing planning view
Simulation Mode / Interactive Planning

134PUBLIC© 2021 SAP SE or an SAP affiliate company. All rights reserved. ǀ
The Excel add-in offers powerful simulation capabilities that you can use to run what-if simulations
on the fly. During simulations, you can change data in the planning view, simulate what effect your
changes would have on other key figures, and even run planning operators such as statistical
forecasting in simulation mode to analyze the potential results - without changing the actual
planning data in the base planning version.
The simulated data is only visible to you and doesn’t have any impact on the data that is stored in
the SAP IBP backend. This means that other users are not affected by your simulations.
However, if you come to the conclusion that your changes are valid, you can save the simulation so
that it becomes the actual planning.
Interactive planning – simulating the effect of data changes

135PUBLIC© 2021 SAP SE or an SAP affiliate company. All rights reserved. ǀ
• A simulation recalculates the planning view, only considering the changes that you have made in the planning view.
• If you have changed a key figure value, you can simulate the effects of the change on the dependent key figures using Simulate (Basic). You can save the changes either as the new baseline plan to the SAP IBP database, visible to all users, or save it as your private scenario. To discard your changes, you simply need to refresh the planning view.
• If you have multiple planning views in one workbook, a simulation in one planning view is automatically propagated to the other planning views in the same workbook. The same applies if you refresh the data in one planning view to discard all changes; this discards the changes in all planning views of the workbook.
• To see the impact of your changes on the plan, you can also run a planning operator, such as, supply planning, inventory optimization, and statistical forecasting, in simulation mode. Starting an operator in simulation mode means that the system automatically starts Simulate (Basic) first in order to update dependent key figures based on your changes before starting the operator itself.
• Note that there is no undo button for simulations. If you have run multiple simulations, you cannot undo the last one, but need to refresh completely, thus losing all previous simulation results.
About simulations
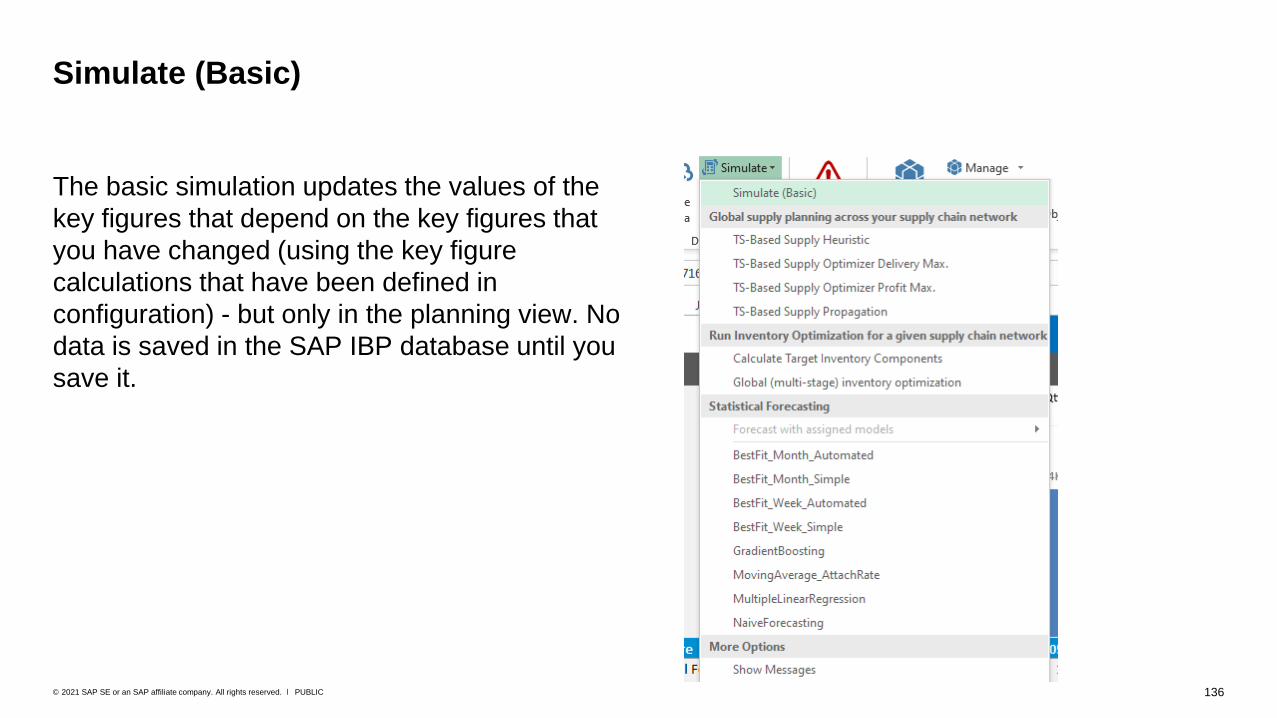
136PUBLIC© 2021 SAP SE or an SAP affiliate company. All rights reserved. ǀ
The basic simulation updates the values of the
key figures that depend on the key figures that
you have changed (using the key figure
calculations that have been defined in
configuration) - but only in the planning view. No
data is saved in the SAP IBP database until you
save it.
Simulate (Basic)
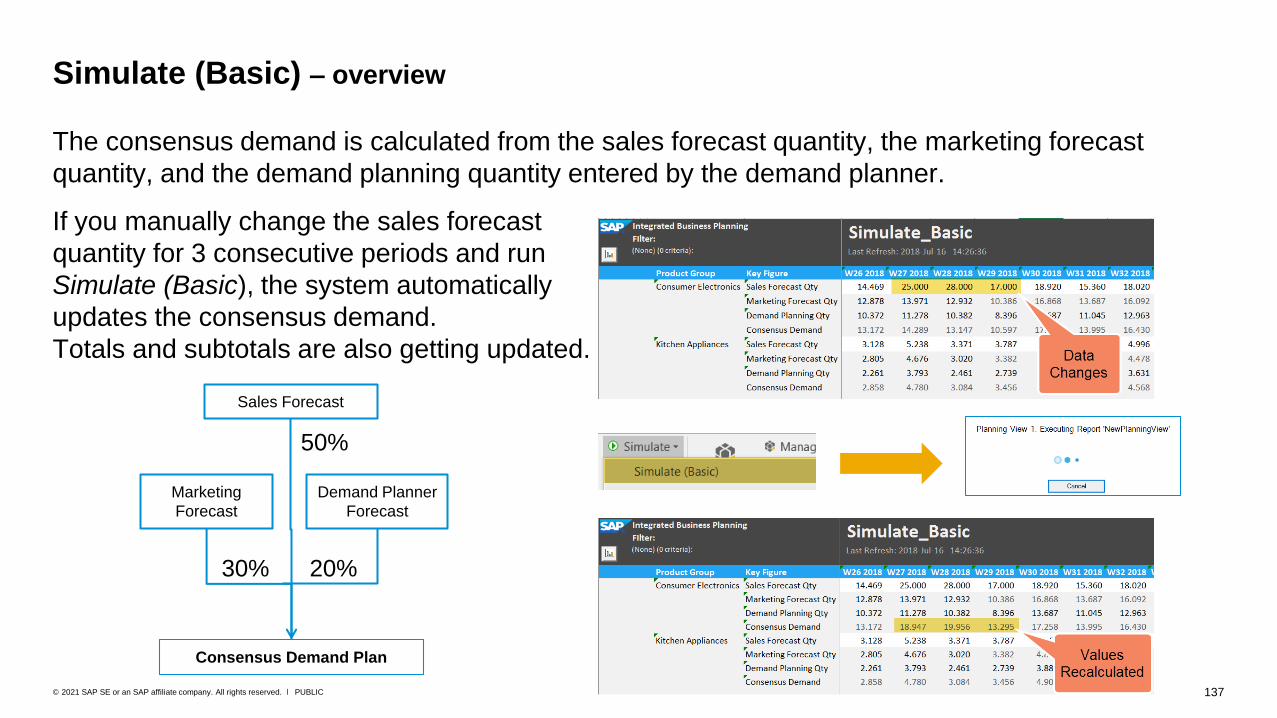
137PUBLIC© 2021 SAP SE or an SAP affiliate company. All rights reserved. ǀ
The consensus demand is calculated from the sales forecast quantity, the marketing forecast
quantity, and the demand planning quantity entered by the demand planner.
If you manually change the sales forecast
quantity for 3 consecutive periods and run
Simulate (Basic), the system automatically
updates the consensus demand.
Totals and subtotals are also getting updated.
Simulate (Basic) – overview
Sales Forecast
Marketing
Forecast
Consensus Demand Plan
Demand Planner
Forecast
20%30%
50%
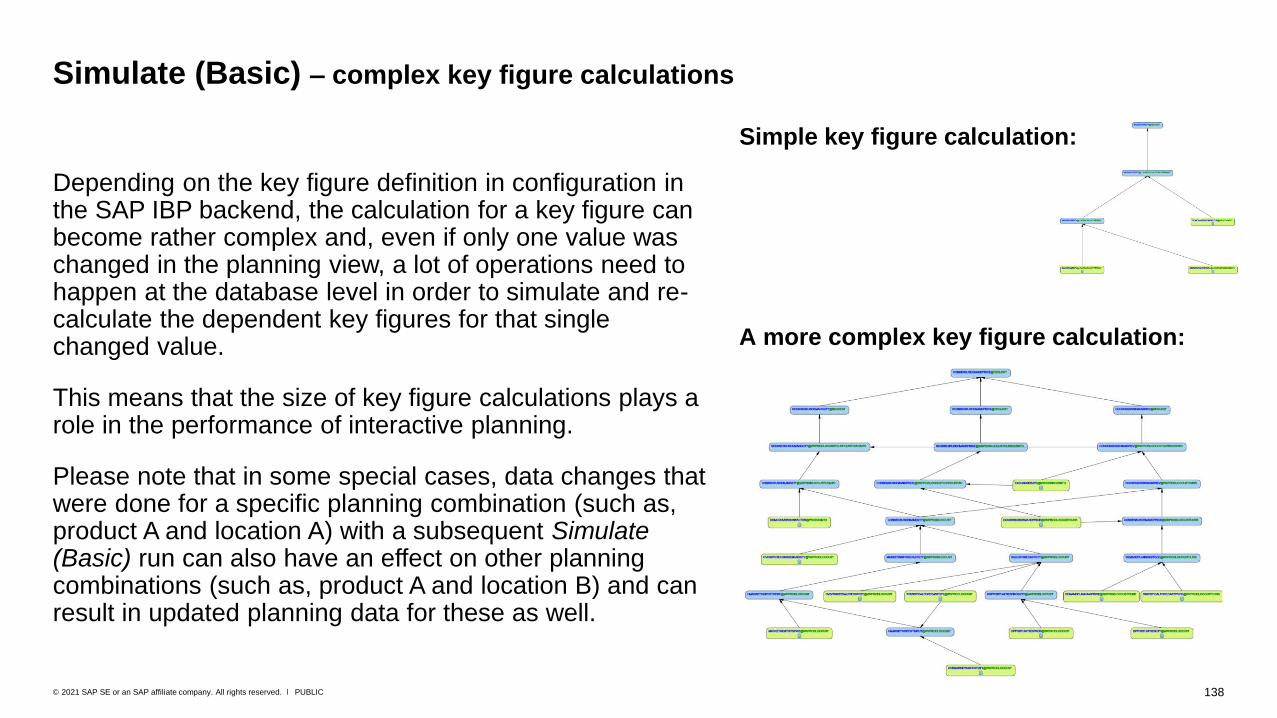
138PUBLIC© 2021 SAP SE or an SAP affiliate company. All rights reserved. ǀ
Depending on the key figure definition in configuration in the SAP IBP backend, the calculation for a key figure can become rather complex and, even if only one value was changed in the planning view, a lot of operations need to happen at the database level in order to simulate and re-calculate the dependent key figures for that single changed value.
This means that the size of key figure calculations plays a role in the performance of interactive planning.
Please note that in some special cases, data changes that were done for a specific planning combination (such as, product A and location A) with a subsequent Simulate (Basic) run can also have an effect on other planning combinations (such as, product A and location B) and can result in updated planning data for these as well.
Simulate (Basic) – complex key figure calculations
Simple key figure calculation:
A more complex key figure calculation:
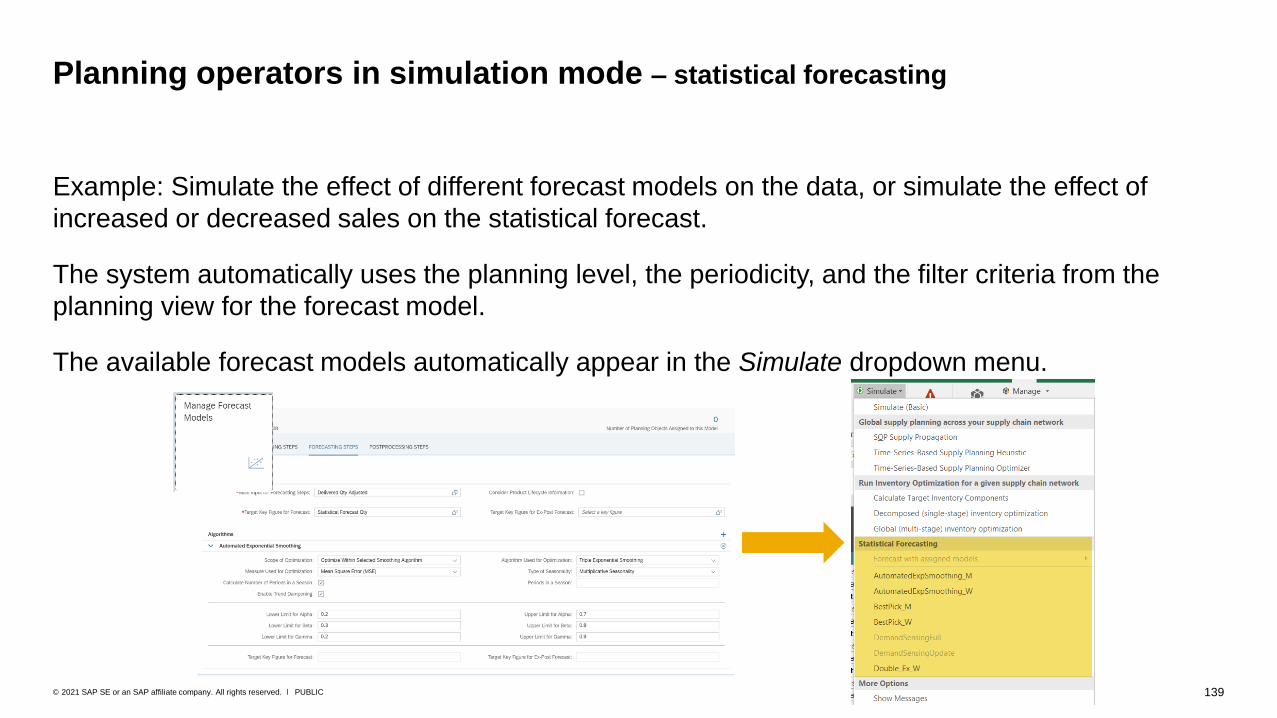
139PUBLIC© 2021 SAP SE or an SAP affiliate company. All rights reserved. ǀ
Example: Simulate the effect of different forecast models on the data, or simulate the effect of
increased or decreased sales on the statistical forecast.
The system automatically uses the planning level, the periodicity, and the filter criteria from the
planning view for the forecast model.
The available forecast models automatically appear in the Simulate dropdown menu.
Planning operators in simulation mode – statistical forecasting

140PUBLIC© 2021 SAP SE or an SAP affiliate company. All rights reserved. ǀ
Planning operators in simulation mode – inventory optimization profiles
Whether an operator is available in the simulation menu, depends on the configuration of the operator, which
is is done by your administrator: The Interactive Mode checkbox must be selected in the operator profile and
the planning operator must be assigned to the planning area.
If a planning scope is defined for your planning area, the system uses the planning scope that was set in the
Edit Planning View header automatically for the operator simulation.
Starting with the 2108.2.0 version of the SAP IBP, add-in for Microsoft Excel you can run the
Inventory Planning (Advanced) profiles in simulation mode.
Example: Simulate the effect of changed input factors, run multi-stage optimization to calculate target inventory
components.

141PUBLIC© 2021 SAP SE or an SAP affiliate company. All rights reserved. ǀ
Planning operators in simulation mode – supply operators
Whether an operator is available in the simulation menu in the planning, depends on the
configuration of the operator that is done by your administrator. (The Interactive Mode checkbox
must be selected in the operator profile and the planning operator must be assigned to the planning
area.)
If a planning scope is defined for your planning area, the system uses the planning scope that was
set in the Edit Planning View header automatically for the operator simulation.
Example: Simulate the effect of changed input factors such as new capacity constraints on the
supply plan.
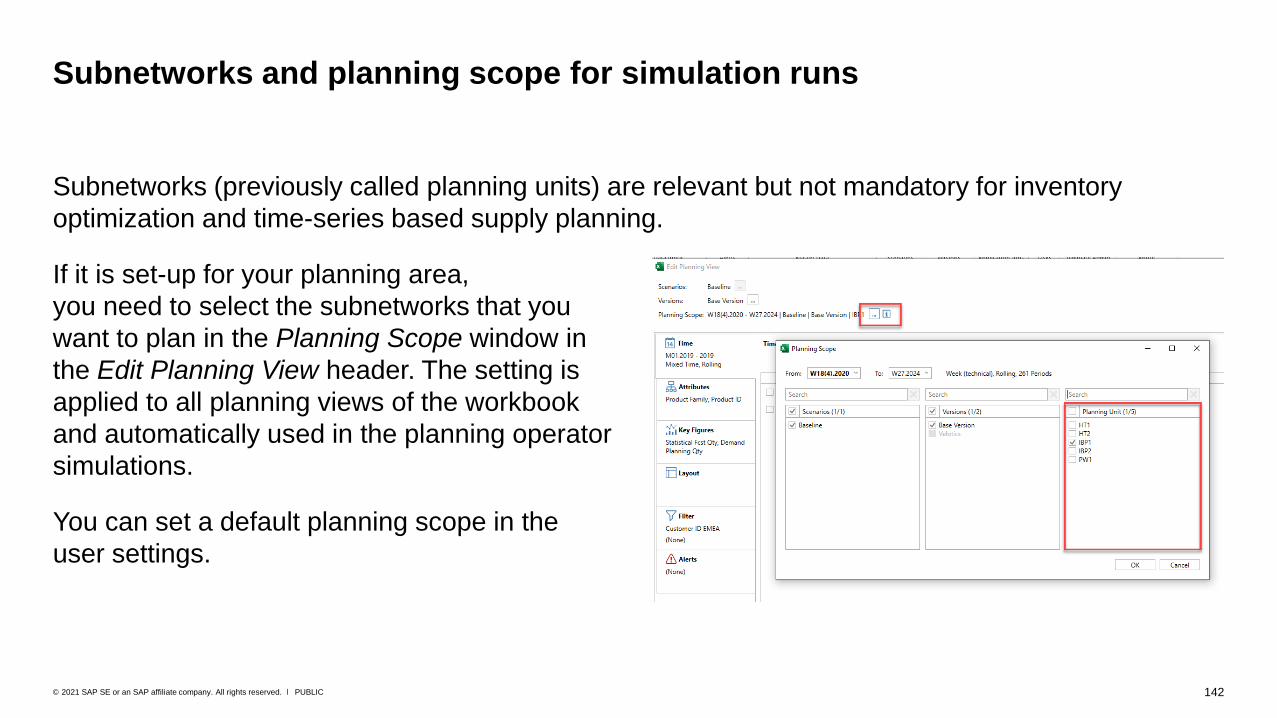
142PUBLIC© 2021 SAP SE or an SAP affiliate company. All rights reserved. ǀ
Subnetworks (previously called planning units) are relevant but not mandatory for inventory
optimization and time-series based supply planning.
If it is set-up for your planning area,
you need to select the subnetworks that you
want to plan in the Planning Scope window in
the Edit Planning View header. The setting is
applied to all planning views of the workbook
and automatically used in the planning operator
simulations.
You can set a default planning scope in the
user settings.
Subnetworks and planning scope for simulation runs
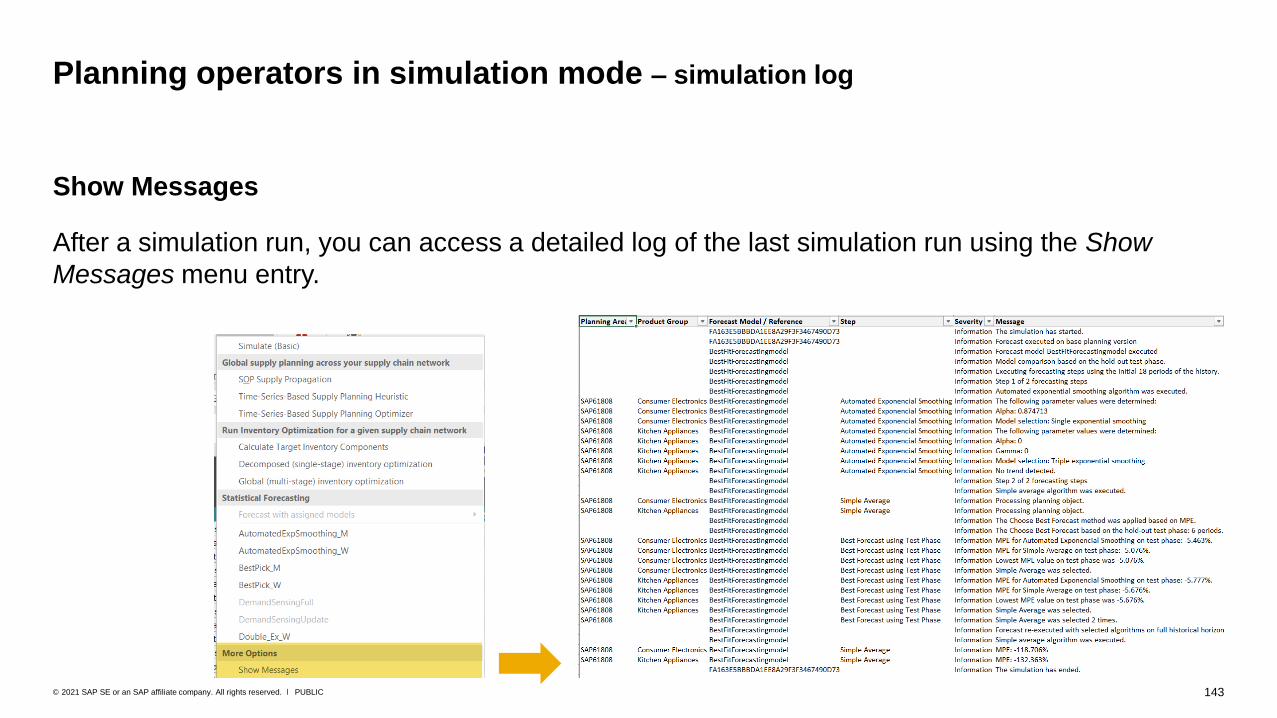
143PUBLIC© 2021 SAP SE or an SAP affiliate company. All rights reserved. ǀ
Show Messages
After a simulation run, you can access a detailed log of the last simulation run using the Show
Messages menu entry.
Planning operators in simulation mode – simulation log
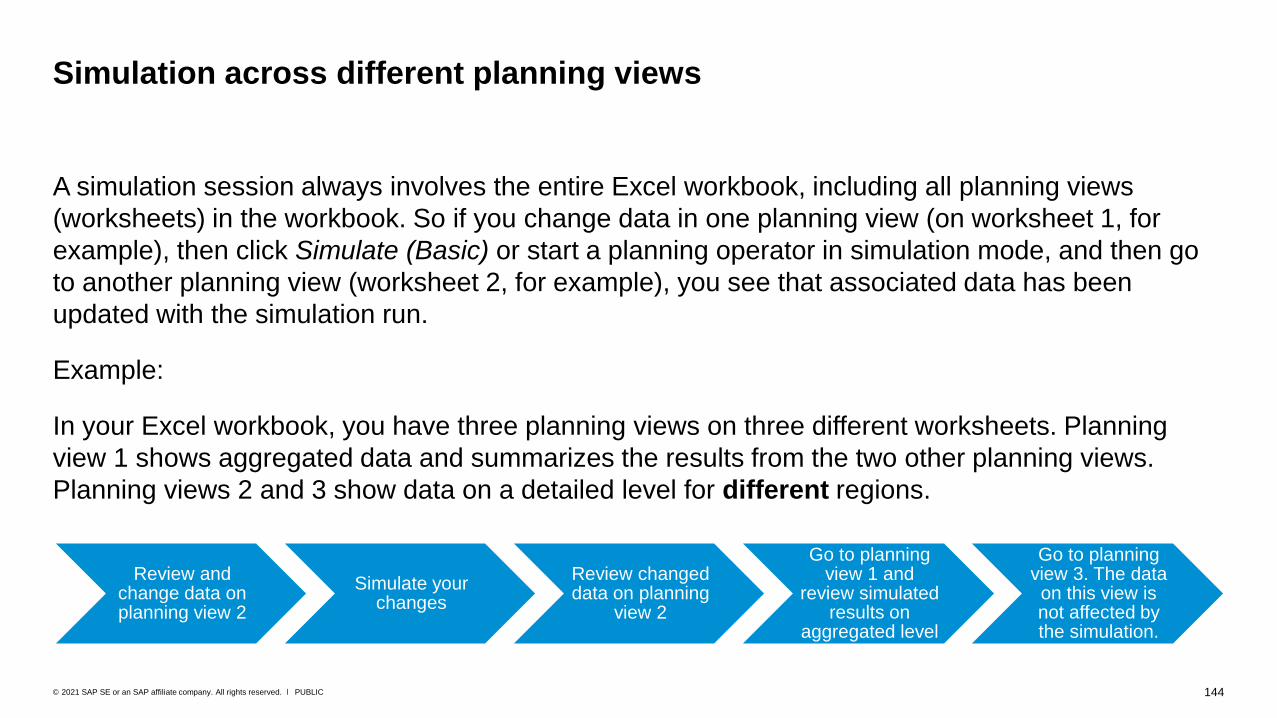
144PUBLIC© 2021 SAP SE or an SAP affiliate company. All rights reserved. ǀ
A simulation session always involves the entire Excel workbook, including all planning views
(worksheets) in the workbook. So if you change data in one planning view (on worksheet 1, for
example), then click Simulate (Basic) or start a planning operator in simulation mode, and then go
to another planning view (worksheet 2, for example), you see that associated data has been
updated with the simulation run.
Example:
In your Excel workbook, you have three planning views on three different worksheets. Planning
view 1 shows aggregated data and summarizes the results from the two other planning views.
Planning views 2 and 3 show data on a detailed level for different regions.
Simulation across different planning views
Review and change data on planning view 2
Simulate your changes
Review changed data on planning
view 2
Go to planning view 1 and
review simulated results on
aggregated level
Go to planning view 3. The data on this view is not affected by the simulation.
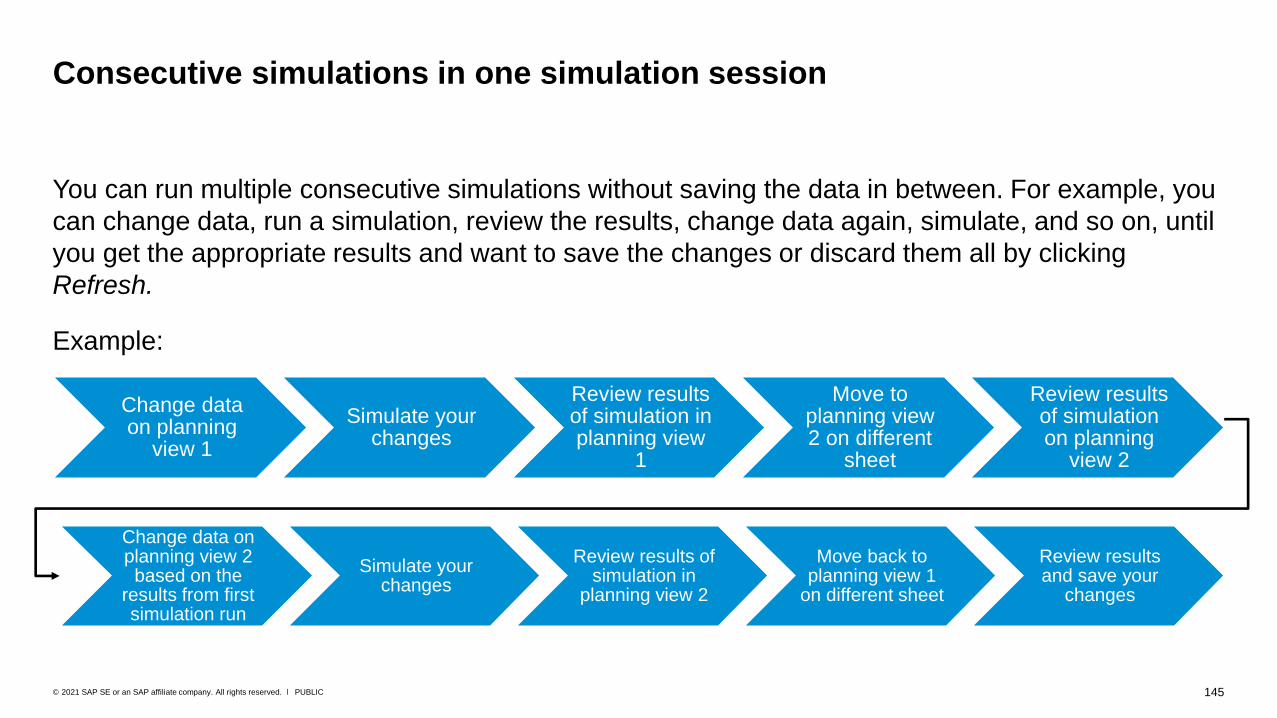
145PUBLIC© 2021 SAP SE or an SAP affiliate company. All rights reserved. ǀ
You can run multiple consecutive simulations without saving the data in between. For example, you
can change data, run a simulation, review the results, change data again, simulate, and so on, until
you get the appropriate results and want to save the changes or discard them all by clicking
Refresh.
Example:
Consecutive simulations in one simulation session
Change data on planning
view 1
Simulate your changes
Review results of simulation in planning view
1
Move to planning view 2 on different
sheet
Review results of simulation on planning
view 2
Change data on planning view 2 based on the
results from first simulation run
Simulate your changes
Review results of simulation in
planning view 2
Move back to planning view 1
on different sheet
Review results and save your
changes
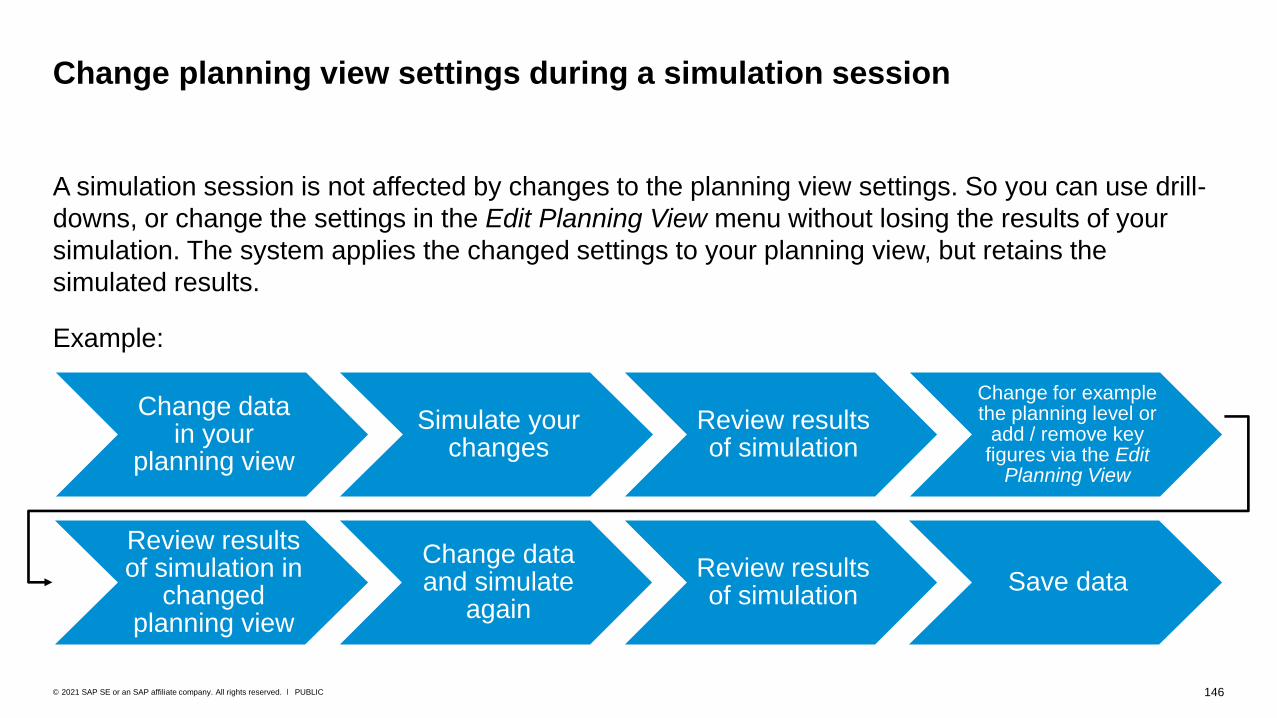
146PUBLIC© 2021 SAP SE or an SAP affiliate company. All rights reserved. ǀ
A simulation session is not affected by changes to the planning view settings. So you can use drill-
downs, or change the settings in the Edit Planning View menu without losing the results of your
simulation. The system applies the changed settings to your planning view, but retains the
simulated results.
Example:
Change planning view settings during a simulation session
Change data in your
planning view
Simulate your changes
Review results of simulation
Change for example the planning level or
add / remove key figures via the Edit
Planning View
Review results of simulation in
changed planning view
Change data and simulate
again
Review results of simulation
Save data

Versions

148PUBLIC© 2021 SAP SE or an SAP affiliate company. All rights reserved. ǀ
About versions
• Versions are used to create “alternative realities” of the global company plan.
• The base version represents the base plan (operational plan) that is used within the company as the go-to plan.
• Additional versions can help determine what the best path forward is, without interfering with the base version.
• Versions are valid for and used by the whole company, or by departments of a company, and are visible to all end users who have the
necessary authorizations.
• Versions are created centrally in the SAP IBP model configuration and are an optional, but common part of an SAP IBP implementation.
• A version consists of a set of key figures that represent the particular plan. Different versions can have different key figure values. For
example, the sales forecast might be 100 in an upside version, only 50 in a downside version, and in the end, 70 in the base version.
• A version always consists of a sub-set of the available key figures that are included in the base version. They cannot include additional key
figures.
• Some key figures within a version are marked as version-specific and some as pure baseline key figures. Baseline key figures will always
show the data stored in the base version, while data in version-specific key figures can differ from version to version.
• A version can consist of version-specific master data (optional).
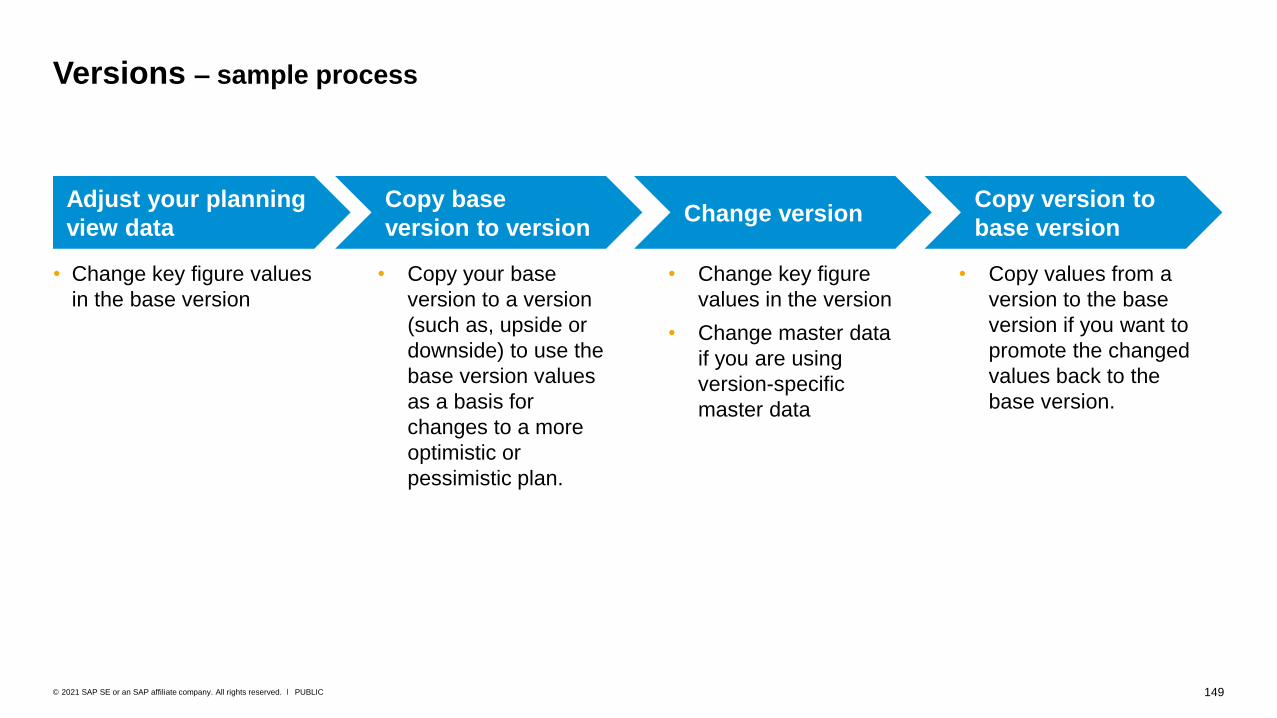
149PUBLIC© 2021 SAP SE or an SAP affiliate company. All rights reserved. ǀ
Adjust your planning
view data
Copy base
version to versionChange version
• Copy your base
version to a version
(such as, upside or
downside) to use the
base version values
as a basis for
changes to a more
optimistic or
pessimistic plan.
• Change key figure
values in the version
• Change master data
if you are using
version-specific
master data
Copy version to
base version
• Copy values from a
version to the base
version if you want to
promote the changed
values back to the
base version.
Versions – sample process
• Change key figure values
in the base version

150PUBLIC© 2021 SAP SE or an SAP affiliate company. All rights reserved. ǀ
Comparing versions
• In the planning view definition, select the versions you want to see in the planning view.
• The default is the Base Version.
• The version selection is valid for all sheets in the workbook.
In the planning view, a new column is added, called Version.
You can compare the different versions, change values, and
more.
Please note that this column is not visible when you have only
selected the base version in the planning view definition.
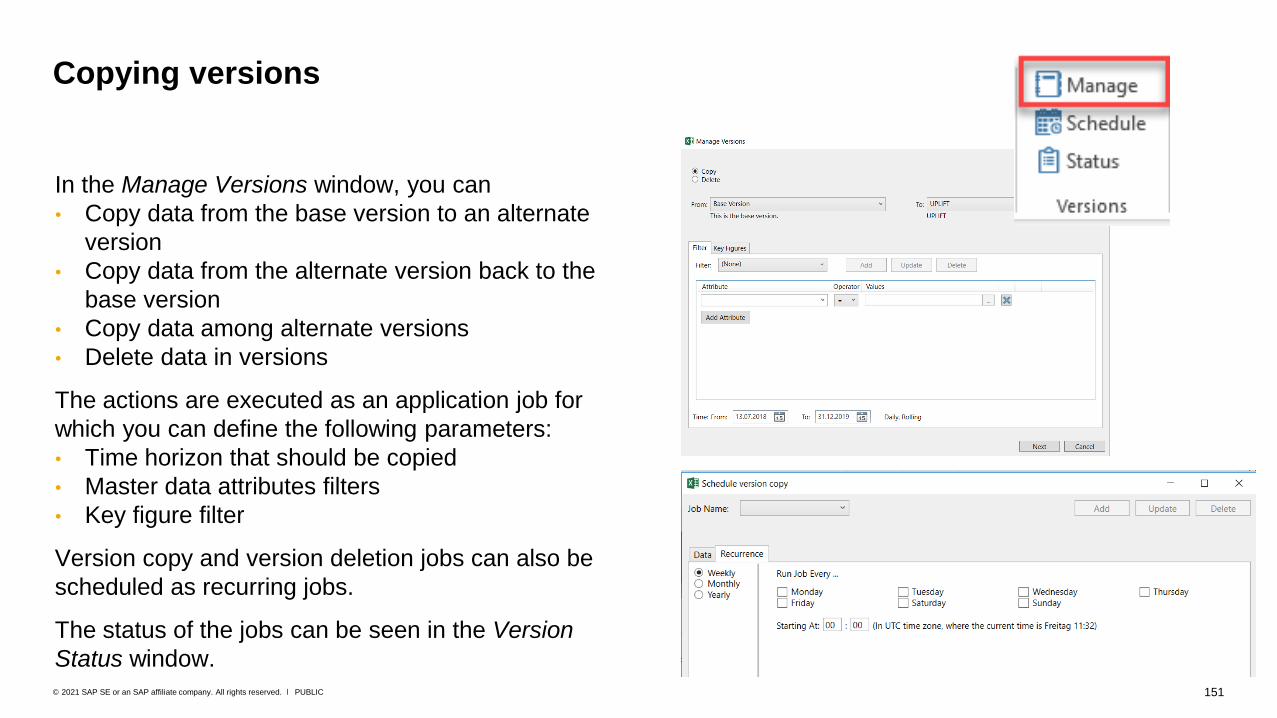
151PUBLIC© 2021 SAP SE or an SAP affiliate company. All rights reserved. ǀ
Copying versions
In the Manage Versions window, you can
• Copy data from the base version to an alternate
version
• Copy data from the alternate version back to the
base version
• Copy data among alternate versions
• Delete data in versions
The actions are executed as an application job for
which you can define the following parameters:
• Time horizon that should be copied
• Master data attributes filters
• Key figure filter
Version copy and version deletion jobs can also be
scheduled as recurring jobs.
The status of the jobs can be seen in the Version
Status window.

Scenarios
153PUBLIC© 2021 SAP SE or an SAP affiliate company. All rights reserved. ǀ
About scenarios
• Planners can create scenarios themselves directly in the Excel add-in.
• A scenario is a user-specific “alternative reality” of a plan.
• A planner can use scenarios to determine what the best path forward is, without interfering with the
current planning (for example, the company’s base version).
• Scenarios can help the planner to answer what-if questions quickly.
• A planner can make the scenario visible to other users by sharing the scenario with them.
• A scenario is a subset of the data in a planning area, referring to one or multiple versions.
• Multiple users can create different scenarios for the same planning area.
• The baseline scenario (briefly “baseline”) includes the original data set based on which a particular
scenario was created.
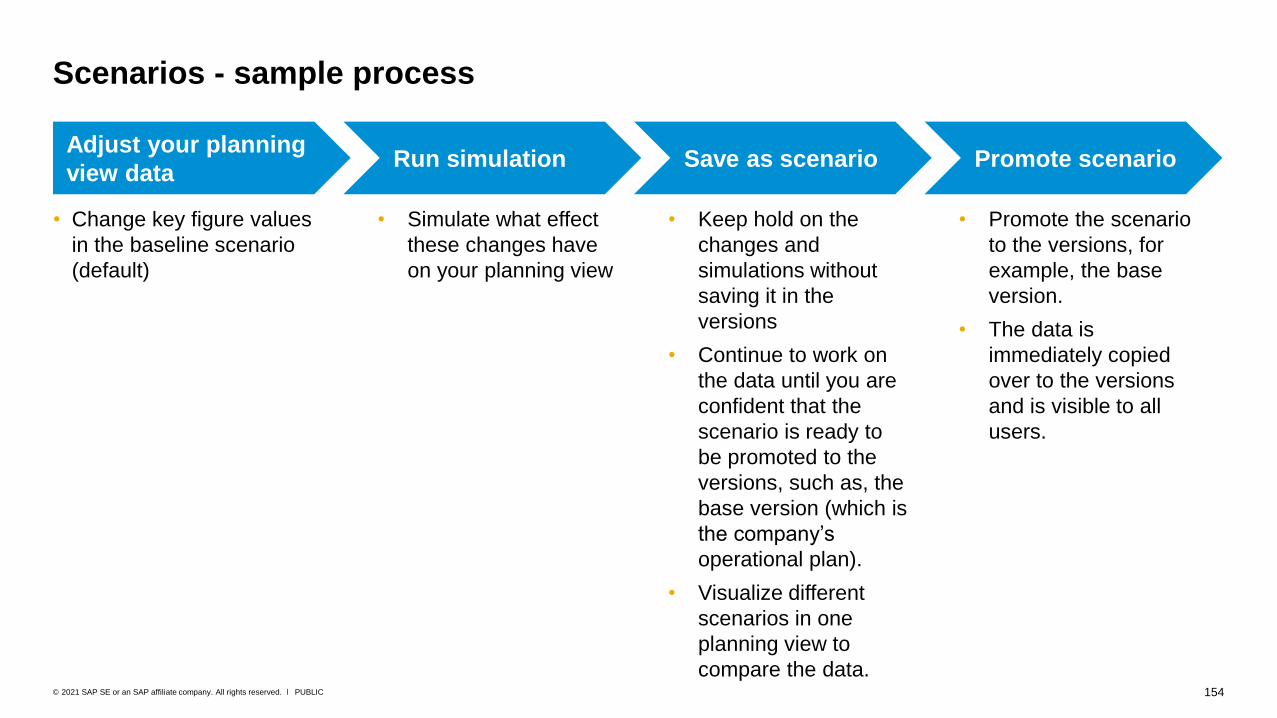
154PUBLIC© 2021 SAP SE or an SAP affiliate company. All rights reserved. ǀ
Adjust your planning
view dataRun simulation Save as scenario
• Simulate what effect
these changes have
on your planning view
• Keep hold on the
changes and
simulations without
saving it in the
versions
• Continue to work on
the data until you are
confident that the
scenario is ready to
be promoted to the
versions, such as, the
base version (which is
the company’s
operational plan).
• Visualize different
scenarios in one
planning view to
compare the data.
Promote scenario
• Promote the scenario
to the versions, for
example, the base
version.
• The data is
immediately copied
over to the versions
and is visible to all
users.
Scenarios - sample process
• Change key figure values
in the baseline scenario
(default)
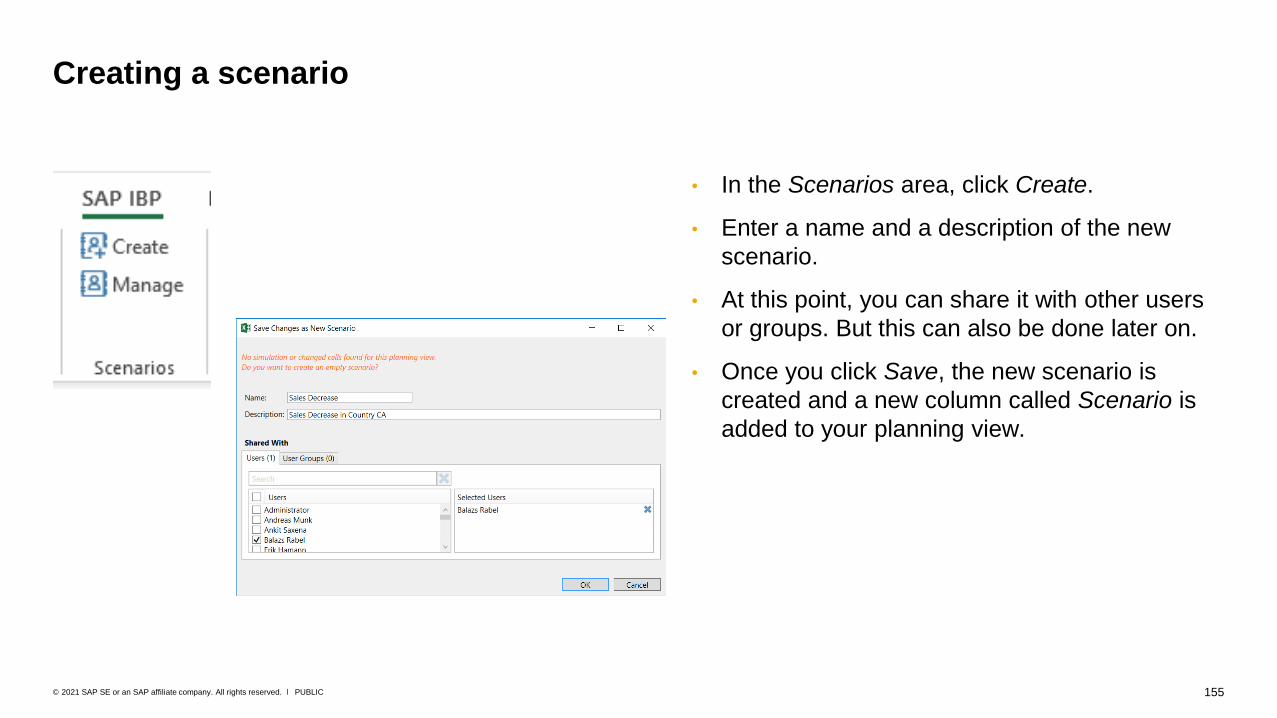
155PUBLIC© 2021 SAP SE or an SAP affiliate company. All rights reserved. ǀ
Creating a scenario
• In the Scenarios area, click Create.
• Enter a name and a description of the new
scenario.
• At this point, you can share it with other users
or groups. But this can also be done later on.
• Once you click Save, the new scenario is
created and a new column called Scenario is
added to your planning view.

156PUBLIC© 2021 SAP SE or an SAP affiliate company. All rights reserved. ǀ
Creating an empty scenario and resetting a scenario
If you have not made any changes yet to your planning view in the baseline scenario, you
can create an empty scenario which is defaulted to the baseline values.
Any change in baseline values will also be changed in the scenario, up to the point when you
start changing values in the scenario, which then decouples it from the baseline.
You can manually reset the scenario to the baseline in the Manage Scenarios window.

157PUBLIC© 2021 SAP SE or an SAP affiliate company. All rights reserved. ǀ
You can create a new scenario after you have made changes to your data in the planning view. Please note the following:
• You will need to simulate your changes using the Simulate (Basic) first, before creating a new scenario if your planning view
contains more than one time level.
• The new scenario will automatically contain all your data changes if all changes were valid. In that case, it is not necessary to
first simulate these changes using the Simulate (Basic).
• Invalid data changes cannot be detected in all cases by the Microsoft Excel front end as the data validation happens in most
cases when sending the data changes to the SAP IBP backend during a simulation with Simulate (Basic) or when saving the
changes. Invalid changes can occur, for example, if you changed data for a key figure or attribute value without having editing
authorization, or in cases where the fixing of a key figure value would lead to negative values during disaggregation.
When creating a scenario based on a planning view that contains valid and invalid changes, the following behavior applies:
• If the invalid changes can be detected on the frontend, you are informed about the invalid changes before the new scenario is created. All
changes are discarded when the scenario is created.
• If the invalid changes cannot be detected by the frontend, you are not informed about the invalid changes before the new scenario is
created. All changes are discarded when the scenario is created.
Therefore, it is recommended that you first use Simulate (Basic) before creating a new scenario based on changed values.
Creating a scenario including unsaved data changes
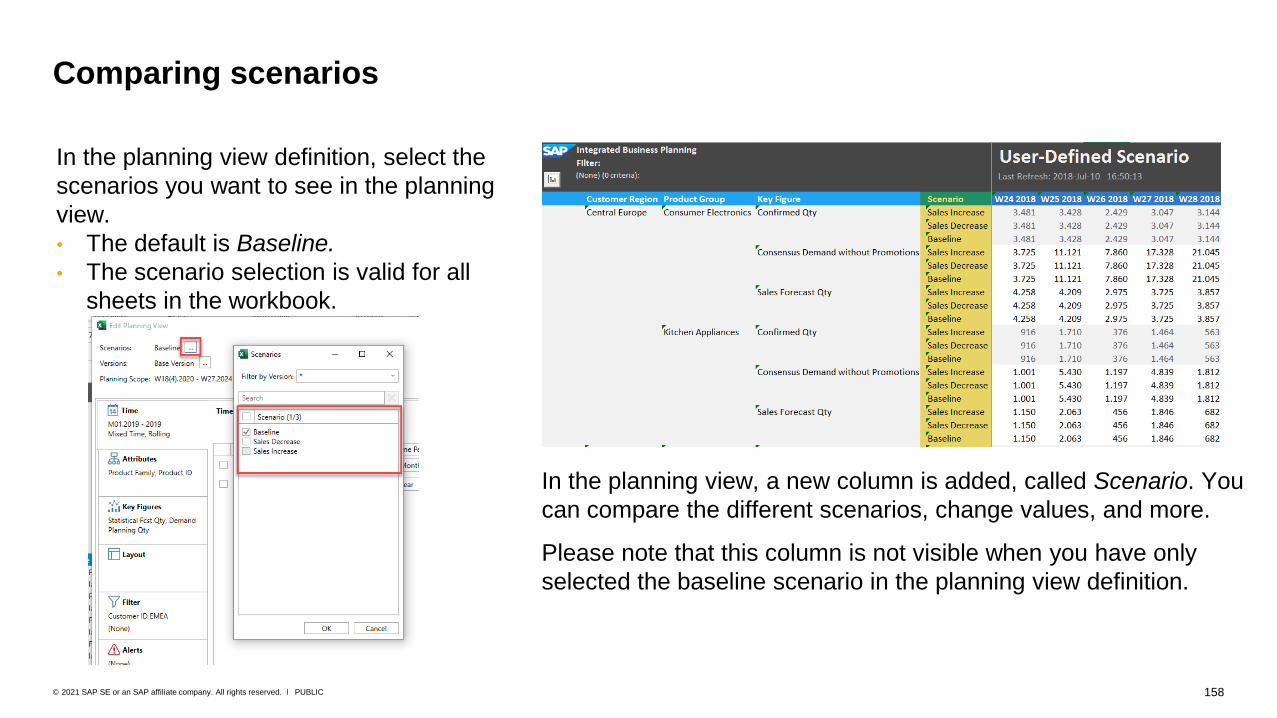
158PUBLIC© 2021 SAP SE or an SAP affiliate company. All rights reserved. ǀ
Comparing scenarios
In the planning view definition, select the
scenarios you want to see in the planning
view.
• The default is Baseline.
• The scenario selection is valid for all
sheets in the workbook.
In the planning view, a new column is added, called Scenario. You
can compare the different scenarios, change values, and more.
Please note that this column is not visible when you have only
selected the baseline scenario in the planning view definition.
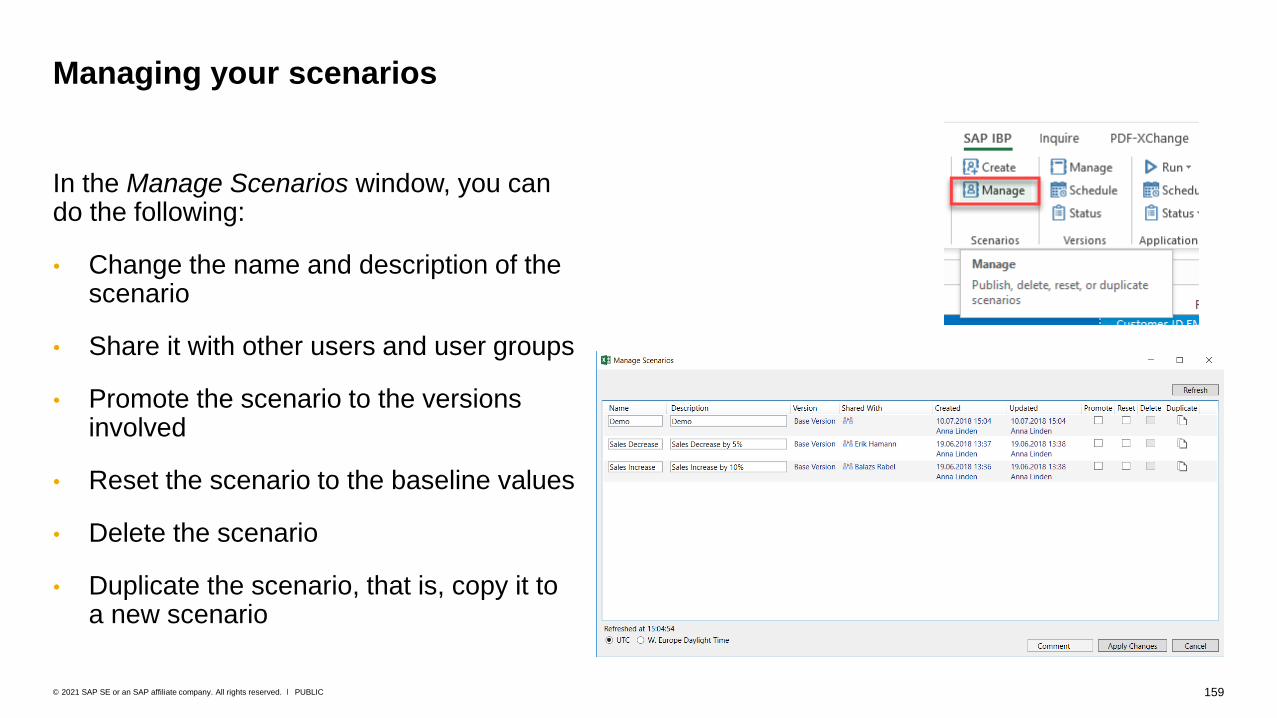
159PUBLIC© 2021 SAP SE or an SAP affiliate company. All rights reserved. ǀ
In the Manage Scenarios window, you can do the following:
• Change the name and description of the scenario
• Share it with other users and user groups
• Promote the scenario to the versions involved
• Reset the scenario to the baseline values
• Delete the scenario
• Duplicate the scenario, that is, copy it to a new scenario
Managing your scenarios

160PUBLIC© 2021 SAP SE or an SAP affiliate company. All rights reserved. ǀ
You can share your scenarios with other users or user groups. In the Manage Scenarios window,
click on the icon and add the respective users or user groups.
Please be aware that these users then have full authorization to change, delete, and promote the
scenario.
The users can furthermore not opt out on the scenario as they can’t change their assignment
themselves. Only the user who has created the scenario has the rights to remove users again.
Sharing a scenario with other users
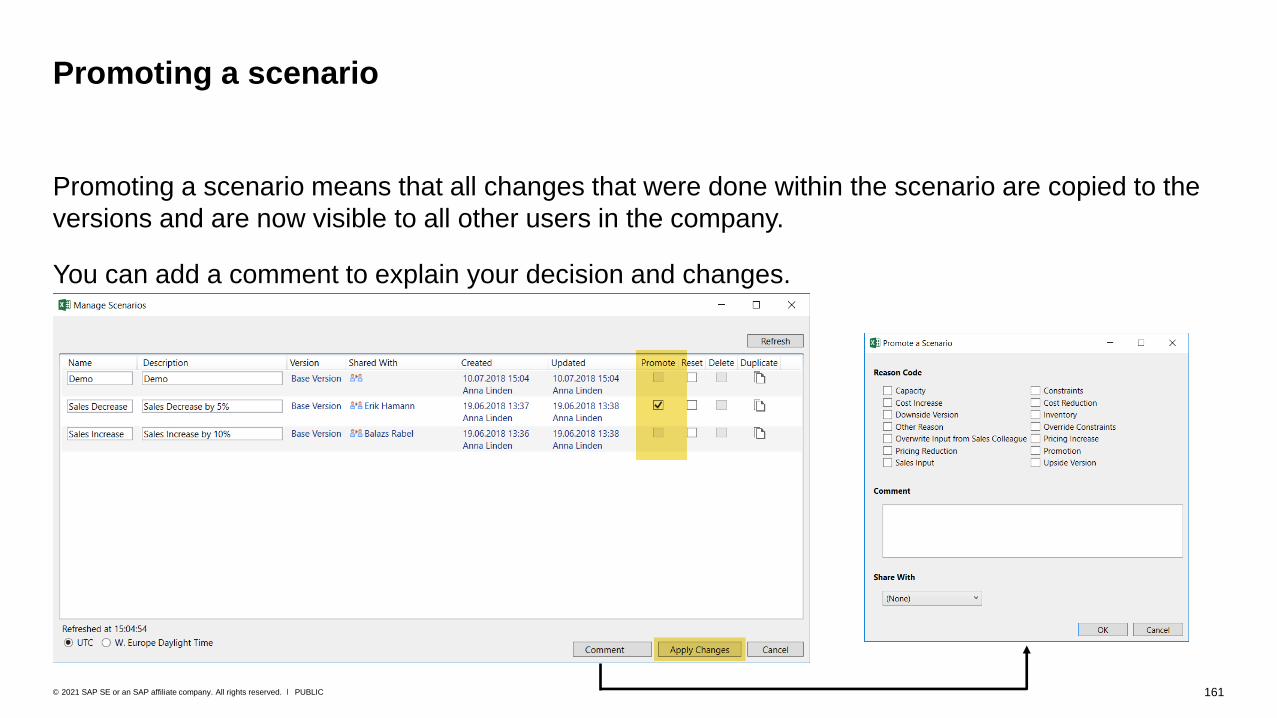
161PUBLIC© 2021 SAP SE or an SAP affiliate company. All rights reserved. ǀ
Promoting a scenario means that all changes that were done within the scenario are copied to the
versions and are now visible to all other users in the company.
You can add a comment to explain your decision and changes.
Promoting a scenario

162PUBLIC© 2021 SAP SE or an SAP affiliate company. All rights reserved. ǀ
Explaining “A scenario is a subset of the data in the versions.”
The planning view shows the data that is
stored as the base version in the SAP IBP
database. In this case, the planning view is
the baseline scenario.
When creating a scenario, an additional
layer is added in the SAP IBP database
where only the values that are different
from the baseline scenario are stored
(highlighted in red in the screenshot). This
data is only visible to the users associated
with the scenario, that is, the user who has
created the scenario and anyone they
shared the scenario with.
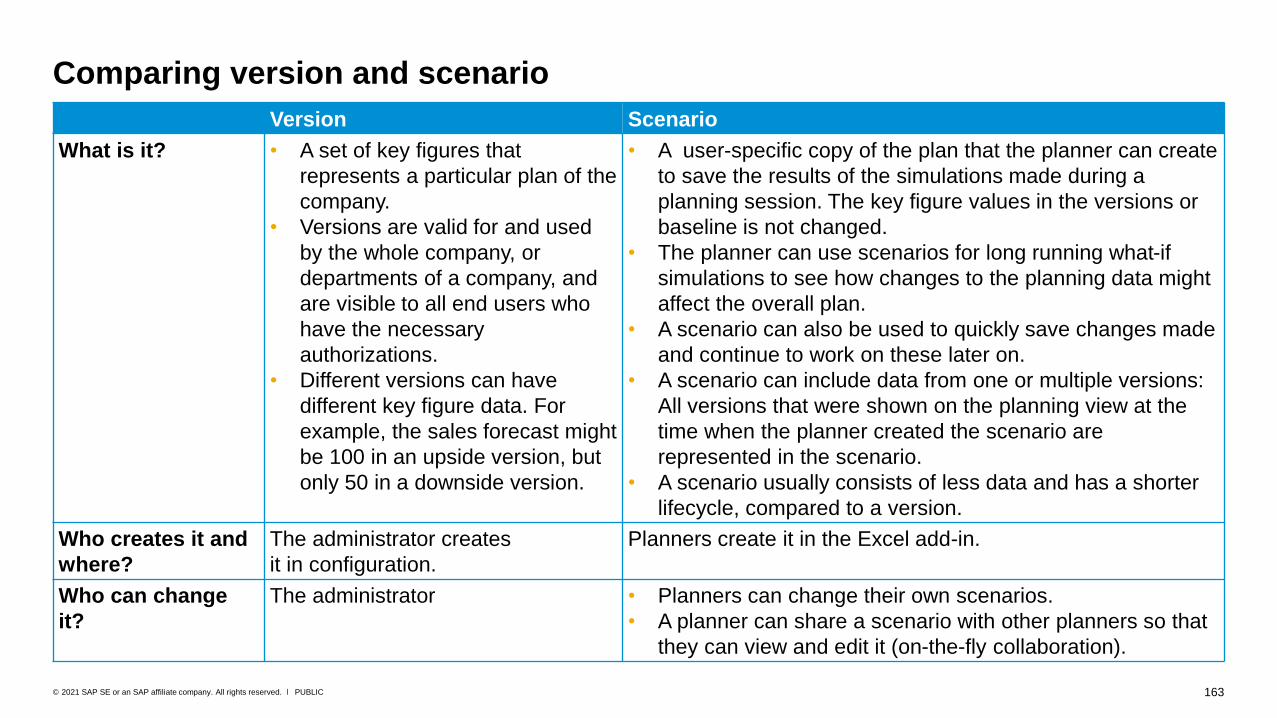
163PUBLIC© 2021 SAP SE or an SAP affiliate company. All rights reserved. ǀ
Comparing version and scenario
Version Scenario
What is it? • A set of key figures that
represents a particular plan of the
company.
• Versions are valid for and used
by the whole company, or
departments of a company, and
are visible to all end users who
have the necessary
authorizations.
• Different versions can have
different key figure data. For
example, the sales forecast might
be 100 in an upside version, but
only 50 in a downside version.
• A user-specific copy of the plan that the planner can create
to save the results of the simulations made during a
planning session. The key figure values in the versions or
baseline is not changed.
• The planner can use scenarios for long running what-if
simulations to see how changes to the planning data might
affect the overall plan.
• A scenario can also be used to quickly save changes made
and continue to work on these later on.
• A scenario can include data from one or multiple versions:
All versions that were shown on the planning view at the
time when the planner created the scenario are
represented in the scenario.
• A scenario usually consists of less data and has a shorter
lifecycle, compared to a version.
Who creates it and
where?
The administrator creates
it in configuration.
Planners create it in the Excel add-in.
Who can change
it?
The administrator • Planners can change their own scenarios.
• A planner can share a scenario with other planners so that
they can view and edit it (on-the-fly collaboration).

Ad-Hoc Drill down

165PUBLIC© 2021 SAP SE or an SAP affiliate company. All rights reserved. ǀ
When working directly in the planning view, you can use the drill down capabilities to add additional
attributes and quickly drill down to a certain planning combination.
Ad-hoc drill down – overview (1)
Right-click a cell
within the data
range in the
planning view and
choose
Drill Down → By
Attribute…
Choose from
the list of
additionally
available
master data
attributes for
further drill
down
Drill Down:
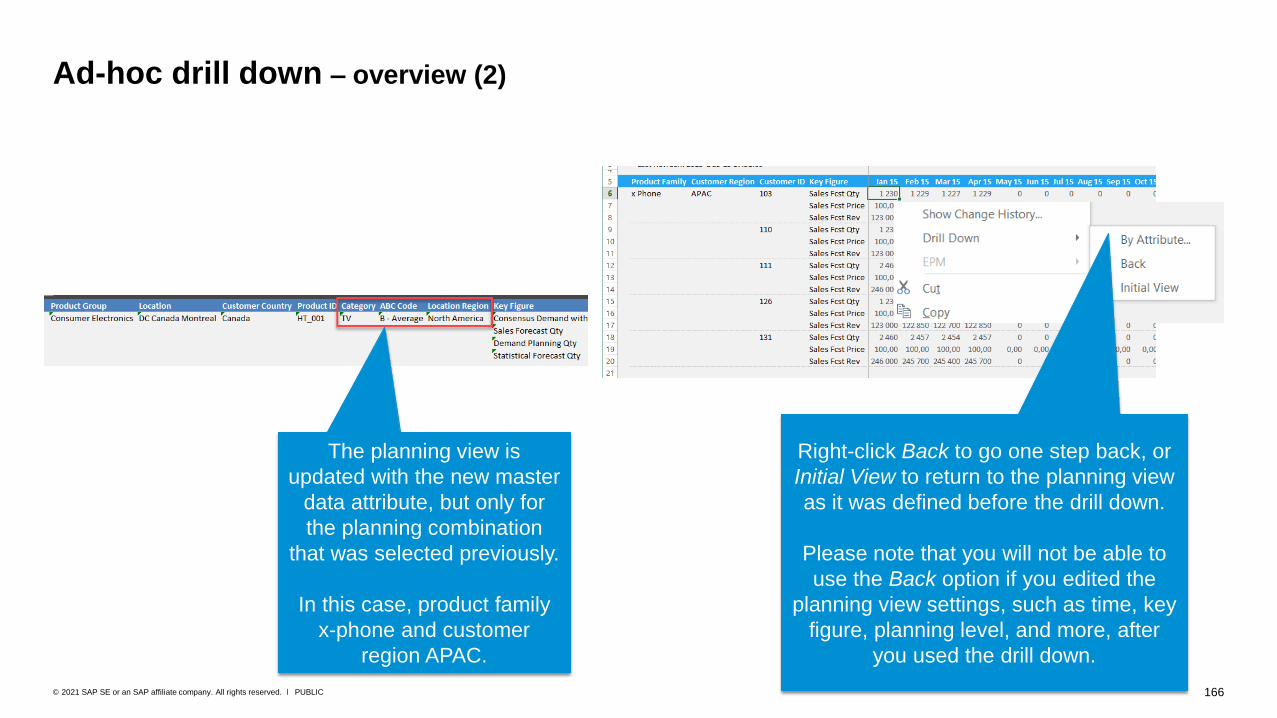
166PUBLIC© 2021 SAP SE or an SAP affiliate company. All rights reserved. ǀ
Ad-hoc drill down – overview (2)
The planning view is
updated with the new master
data attribute, but only for
the planning combination
that was selected previously.
In this case, product family
x-phone and customer
region APAC.
Right-click Back to go one step back, or
Initial View to return to the planning view
as it was defined before the drill down.
Please note that you will not be able to
use the Back option if you edited the
planning view settings, such as time, key
figure, planning level, and more, after
you used the drill down.

167PUBLIC© 2021 SAP SE or an SAP affiliate company. All rights reserved. ǀ
As mentioned before, you can change your planning view settings or use the drill down within a
simulation session. Within a drill down, you are basically changing and lowering the planning level
of the planning view by adding attributes. Data changes can be simulated in every level and
reviewed in any other level.
Example:
Ad-hoc drill down and simulation capabilities
Change data in your planning view
Simulate your changes
Review results of simulation. You
see an unexpected data peak in one
area.
Drill down to check where the peak is originating from.
Simulation results are disaggregated automatically
Change data for that peak on lower
level, simulate again and review
results
Use Back to go back to the original
planning view before the drill
down.
Review simulation results on
aggregated level.
Save or discard* data
*You can discard the changes by clicking Refresh. The simulation run ends with the refresh.

Quick Edit View &
Quick Filter

169PUBLIC© 2021 SAP SE or an SAP affiliate company. All rights reserved. ǀ
Right-click an attribute value or
a cell within the time header in
the planning view and choose
Quick Edit Planning View and
select, for example, Add
Planning Level Before.
Quick edit
When working in the planning view, you can also easily add and delete planning levels, and shift
them around.

170PUBLIC© 2021 SAP SE or an SAP affiliate company. All rights reserved. ǀ
Quick filter
You can set a quick filter on an attribute.
The filter comes up with the filter criteria that was defined in the previous step, for example,
customer ID. When you select a specific ID, the data in the planning view is automatically filtered
accordingly.

Fixing Key Figure Values
172PUBLIC© 2021 SAP SE or an SAP affiliate company. All rights reserved. ǀ
Protect (lock) key figure values for certain periods on a detailed or aggregated level against
unintentional changes by automated processes or by disaggregation after the user has
simulated/saved changed data.
Reasons could be, for example, a special agreement with customers on a planned event.
Business goal

173PUBLIC© 2021 SAP SE or an SAP affiliate company. All rights reserved. ǀ
Fixing of cell values
200
500 ➔ 800
100 100100 100 100
200
500 ➔ 800
100 100100 ➔ 200 100 ➔ 200 100 ➔ 200
◑◑Value change

174PUBLIC© 2021 SAP SE or an SAP affiliate company. All rights reserved. ǀ
A planner wants to fix a key figure value for a certain period, including all its child values.
Fixing of cell values – subhierarchies (1)
Fix
Aggregated level,
such as, product group
200
500
100 100100 100 100
Base planning level, such as products
200
500
100 100100 100 100
Fixed
Fixed Fixed
Partially fixed
◑
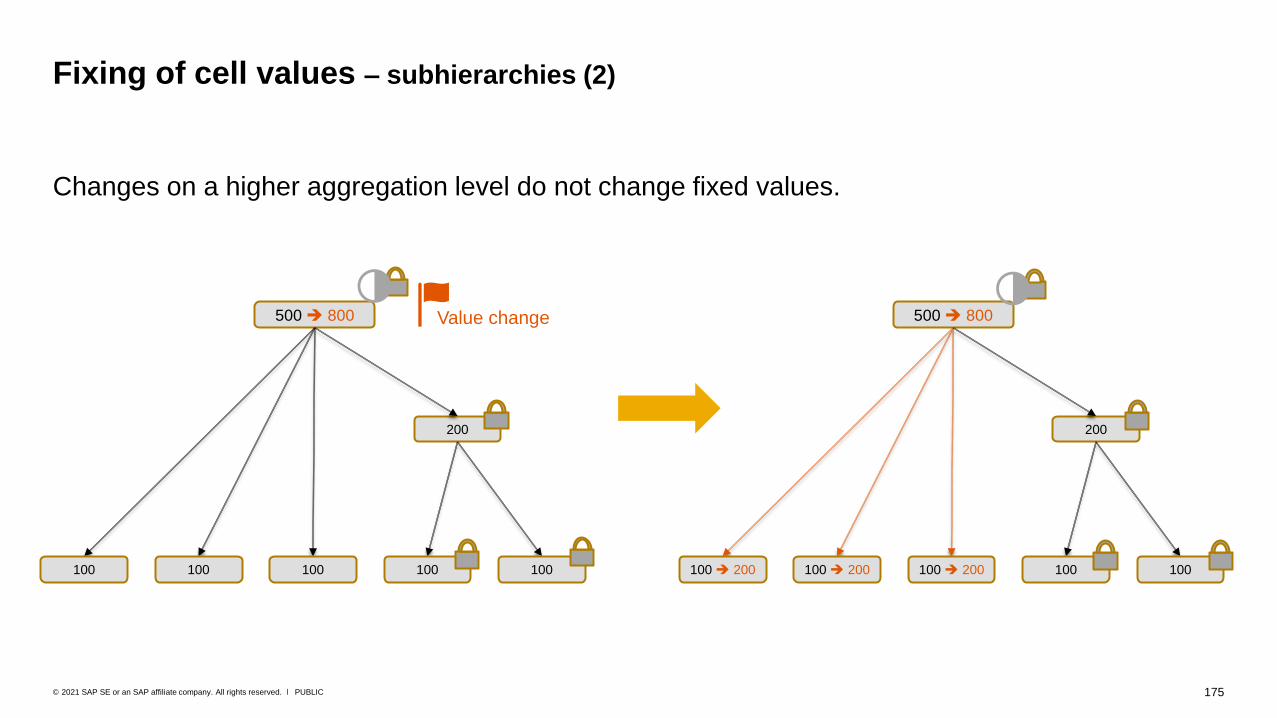
175PUBLIC© 2021 SAP SE or an SAP affiliate company. All rights reserved. ǀ
Changes on a higher aggregation level do not change fixed values.
Fixing of cell values – subhierarchies (2)
200
500 ➔ 800
100 100100 100 100
200
500 ➔ 800
100 100100 ➔ 200 100 ➔ 200 100 ➔ 200
◑◑Value change
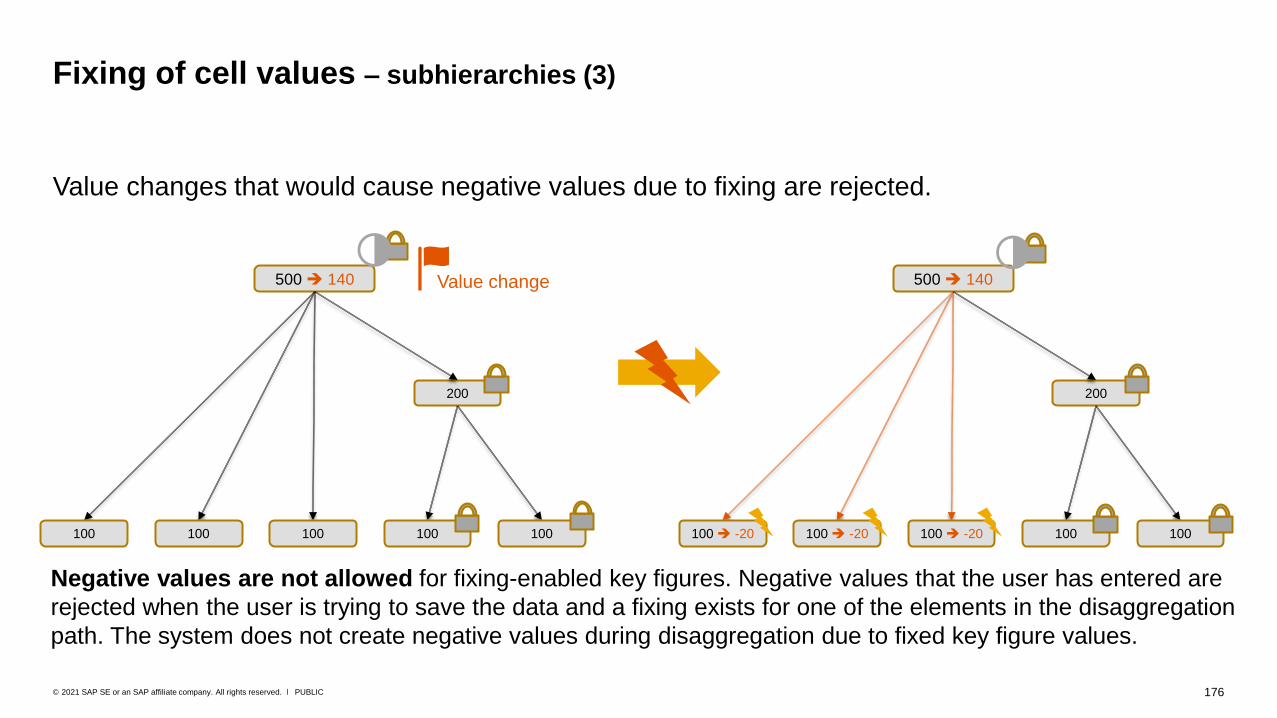
176PUBLIC© 2021 SAP SE or an SAP affiliate company. All rights reserved. ǀ
Value changes that would cause negative values due to fixing are rejected.
Fixing of cell values – subhierarchies (3)
200
500 ➔ 140
100 100100 100 100
◑Value change
200
500 ➔ 140
100 100100 ➔ -20 100 ➔ -20 100 ➔ -20
◑
Negative values are not allowed for fixing-enabled key figures. Negative values that the user has entered are
rejected when the user is trying to save the data and a fixing exists for one of the elements in the disaggregation
path. The system does not create negative values during disaggregation due to fixed key figure values.
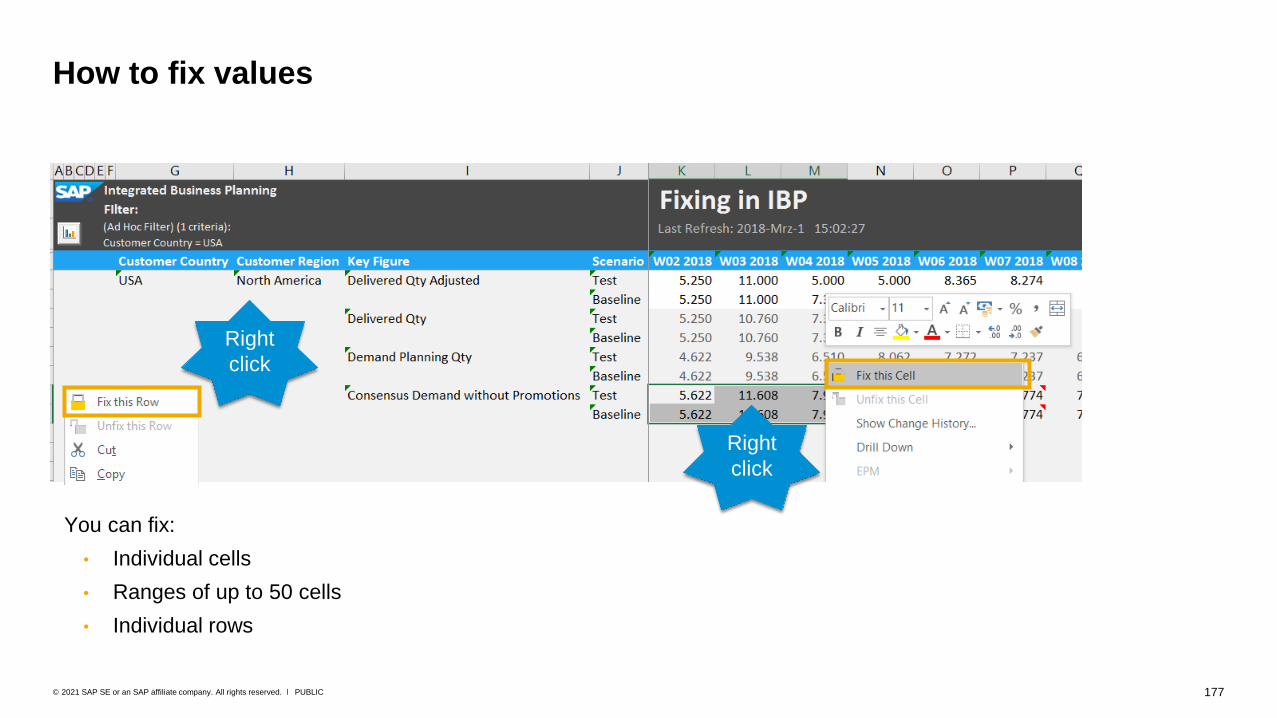
177PUBLIC© 2021 SAP SE or an SAP affiliate company. All rights reserved. ǀ
How to fix values
You can fix:
• Individual cells
• Ranges of up to 50 cells
• Individual rows
Right
click
Right
click
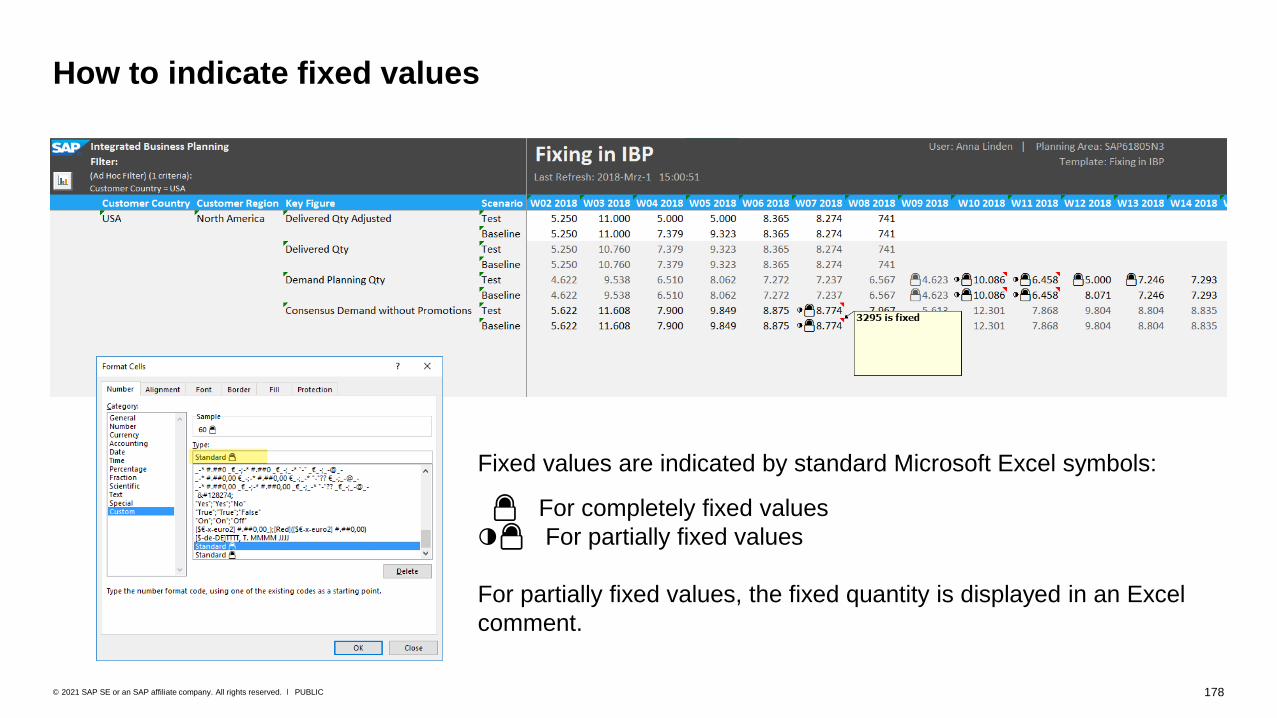
178PUBLIC© 2021 SAP SE or an SAP affiliate company. All rights reserved. ǀ
How to indicate fixed values
Fixed values are indicated by standard Microsoft Excel symbols:
🔒 For completely fixed values
◑🔓 For partially fixed values
For partially fixed values, the fixed quantity is displayed in an Excel
comment.

179PUBLIC© 2021 SAP SE or an SAP affiliate company. All rights reserved. ǀ
How to unfix values manually
Right
click
Right
click
You can unfix:
• Individual cells
• Ranges of up to 50 cells
• Individual rows

180PUBLIC© 2021 SAP SE or an SAP affiliate company. All rights reserved. ǀ
• Fixing is only possible for key figures that can be edited manually.
• Fixing must be activated per key figure in configuration by the administrator or configuration expert.
• Fixing can only be activated for up to 20 key figures.
• Note that fixing a larger number of cells (all editable key figures in a certain horizon, for example) can have an impact on the
performance.
• You can only fix or unfix a key figure value completely. It is not possible to manually fix or unfix a partial quantity of a key figure
value. Partially fixed values can only be created by the system during aggregation.
• Only single or multiple key figure values can be fixed, not all values of a planning object. For example, you cannot fix all key
figure values for a certain product ID.
• Negative values are not allowed for fixing-enabled key figures. You cannot enter and save a negative value for a fixing-enabled
key figure. The system does not create negative values during disaggregation due to fixed key figure values.
• Empty cells/cells without values (also called NULL values) cannot be fixed.
About fixing

181PUBLIC© 2021 SAP SE or an SAP affiliate company. All rights reserved. ǀ
If you change a completely fixed cell manually and then simulate or save the data, this change is
rejected and a warning message is displayed. Example:
Error handling for invalid changes (1)
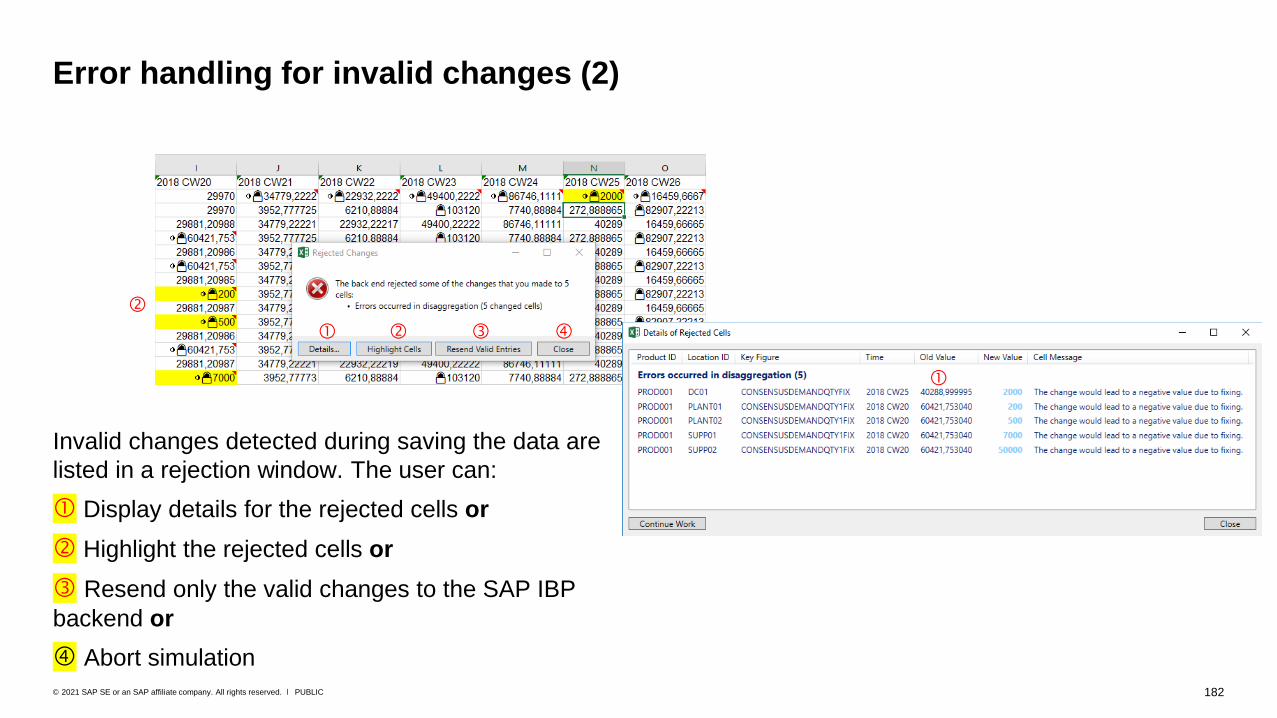
182PUBLIC© 2021 SAP SE or an SAP affiliate company. All rights reserved. ǀ
Error handling for invalid changes (2)
Invalid changes detected during saving the data are
listed in a rejection window. The user can:
Display details for the rejected cells or
Highlight the rejected cells or
Resend only the valid changes to the SAP IBP
backend or
Abort simulation
183PUBLIC© 2021 SAP SE or an SAP affiliate company. All rights reserved. ǀ
For some planning operators that do copy key figure values, the fixing behavior is configurable. As
a system administrator or configuration expert, you need to make the following decisions,
depending on the business process:
• What should happen to a target key figure value after the source value has been copied when the source
key figure value is fixed? Should the target value also be fixed or not?
• How to handle a fixed target key figure value? Should it be protected against changes by the copy
process? Or should it be unfixed so that it can be overwritten with the value from the source?
Regardless: If a source value cannot be copied to the target value because the target value is fixed, a warning
needs to be added to the log.
Configuring the Copy & Disaggregate Key Figures operator
• By default, if a target value is fixed, it is not changed. If the target value is not fixed, it is overwritten with the
source value. However the target is not fixed if the source valued is fixed.
• To also fix the target value when the source value is fixed, use the parameter COPY_KF_FIXING.
• To unfix the target value before the source value can be copied, use the parameter COPY_KF_FIXING.
Configuration considerations for administrators
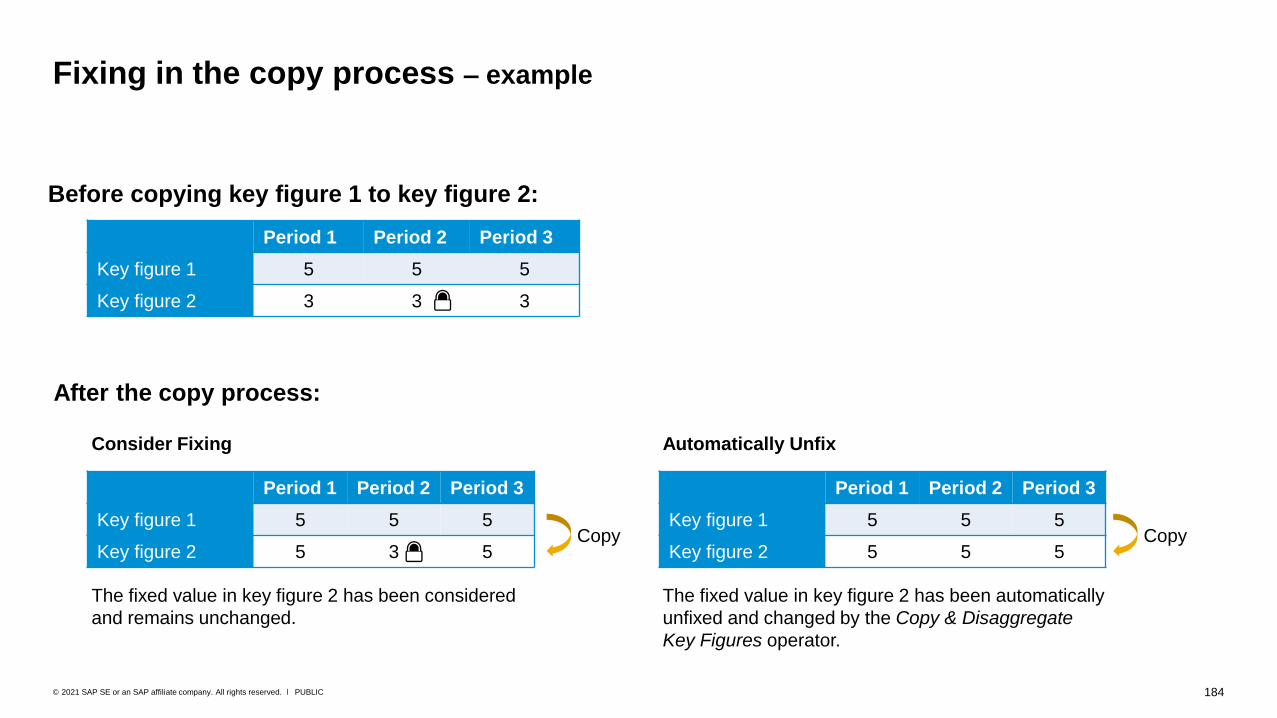
184PUBLIC© 2021 SAP SE or an SAP affiliate company. All rights reserved. ǀ
Fixing in the copy process – example
Period 1 Period 2 Period 3
Key figure 1 5 5 5
Key figure 2 3 3 3🔒
Period 1 Period 2 Period 3
Key figure 1 5 5 5
Key figure 2 5 3 5Copy
🔒
Before copying key figure 1 to key figure 2:
After the copy process:
Period 1 Period 2 Period 3
Key figure 1 5 5 5
Key figure 2 5 5 5Copy
Consider Fixing
The fixed value in key figure 2 has been considered
and remains unchanged.
Automatically Unfix
The fixed value in key figure 2 has been automatically
unfixed and changed by the Copy & Disaggregate
Key Figures operator.

185PUBLIC© 2021 SAP SE or an SAP affiliate company. All rights reserved. ǀ
Fixing in SAP IBP operators
ProcessConsider
fixed valuesFix Unfix
Interactive disaggregation (including versions and scenarios)
Yes (Default) Yes Yes
Forecast simulation Yes (Default) No No
Batch forecast run Yes (Default) No No
Copy & Disaggregate Key Figures operator
Yes (Default) Yes Yes
Copy operator No No Yes
Copy Version Operator No No Yes
Data integration No No Yes
Mass unfixing No No Yes
Inventory optimization No No Yes
Response management No No Yes
Lag-based snapshot No No Yes
Consider fixed (target) key
figure values by default
Unfix fixed (target) key
figure values by default
Copy scenarios: Fixing information is copied when promoting or duplicating scenarios.

Planning Notes
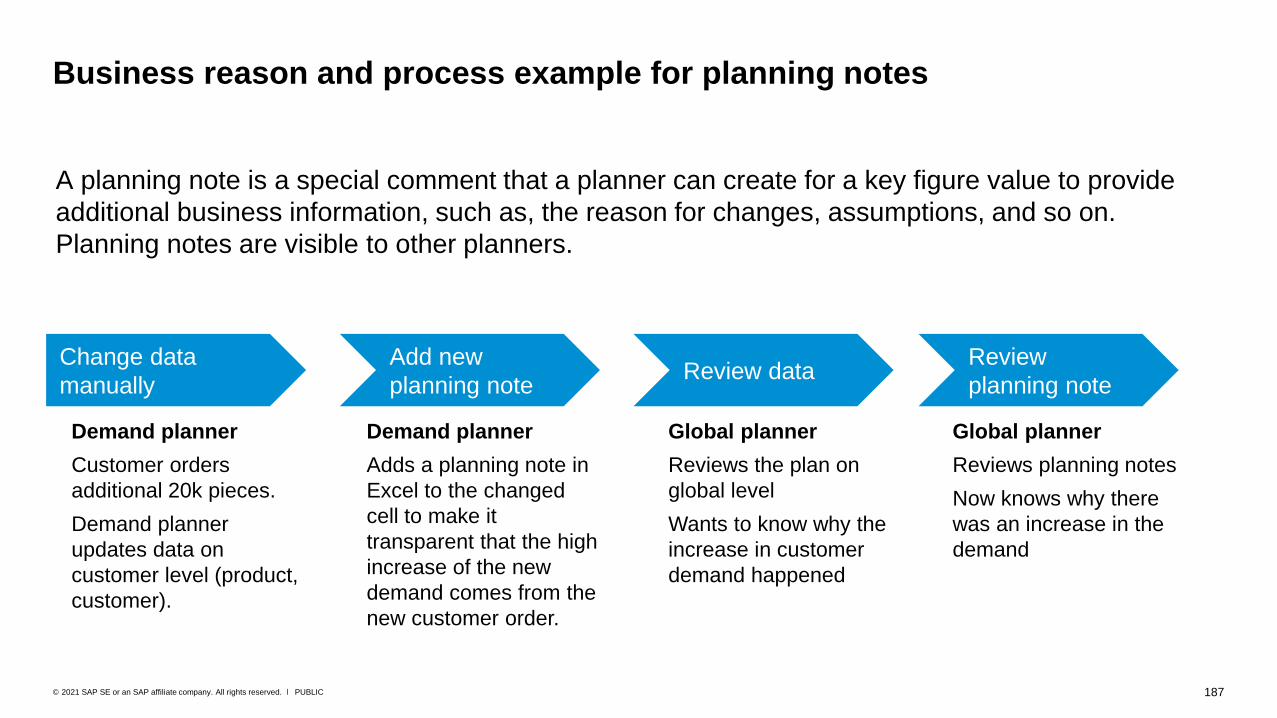
187PUBLIC© 2021 SAP SE or an SAP affiliate company. All rights reserved. ǀ
Business reason and process example for planning notes
Change data
manually
Demand planner
Adds a planning note in
Excel to the changed
cell to make it
transparent that the high
increase of the new
demand comes from the
new customer order.
Add new
planning noteReview data
Review
planning note
Demand planner
Customer orders
additional 20k pieces.
Demand planner
updates data on
customer level (product,
customer).
Global planner
Reviews the plan on
global level
Wants to know why the
increase in customer
demand happened
Global planner
Reviews planning notes
Now knows why there
was an increase in the
demand
A planning note is a special comment that a planner can create for a key figure value to provide
additional business information, such as, the reason for changes, assumptions, and so on.
Planning notes are visible to other planners.
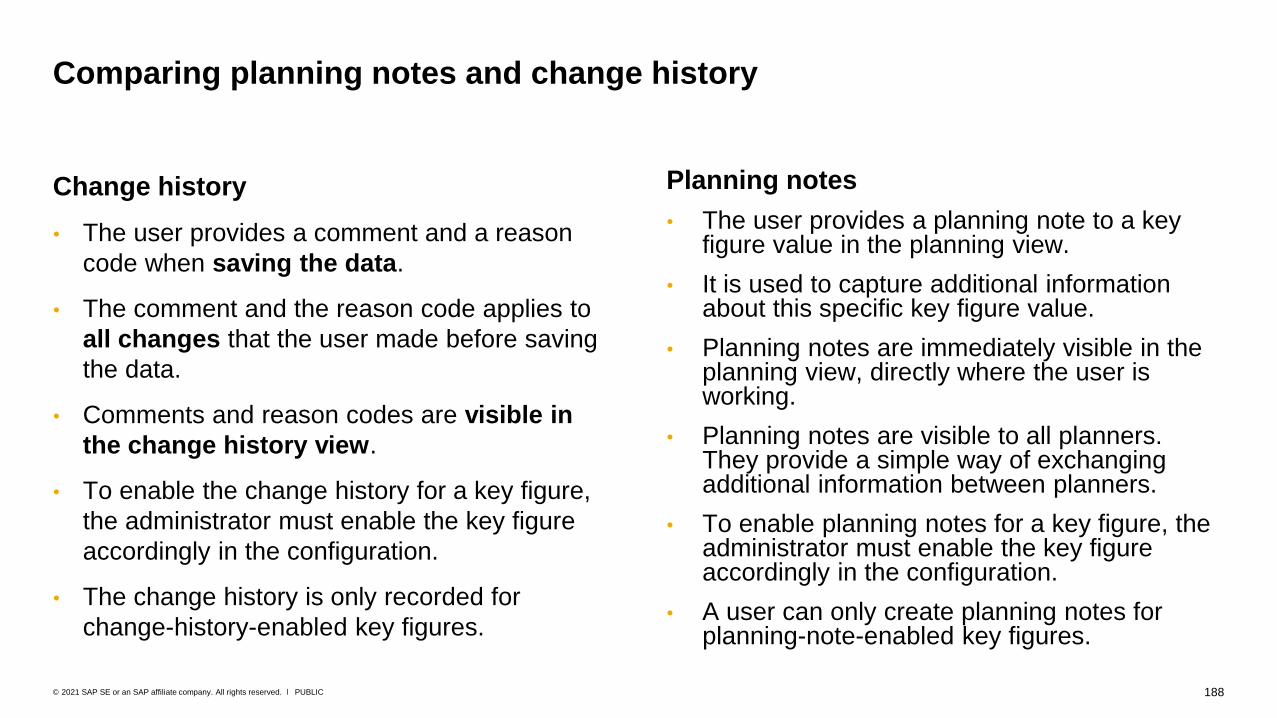
188PUBLIC© 2021 SAP SE or an SAP affiliate company. All rights reserved. ǀ
Change history
• The user provides a comment and a reason
code when saving the data.
• The comment and the reason code applies to
all changes that the user made before saving
the data.
• Comments and reason codes are visible in
the change history view.
• To enable the change history for a key figure,
the administrator must enable the key figure
accordingly in the configuration.
• The change history is only recorded for
change-history-enabled key figures.
Planning notes
• The user provides a planning note to a key figure value in the planning view.
• It is used to capture additional information about this specific key figure value.
• Planning notes are immediately visible in the planning view, directly where the user is working.
• Planning notes are visible to all planners. They provide a simple way of exchanging additional information between planners.
• To enable planning notes for a key figure, the administrator must enable the key figure accordingly in the configuration.
• A user can only create planning notes for planning-note-enabled key figures.
Comparing planning notes and change history
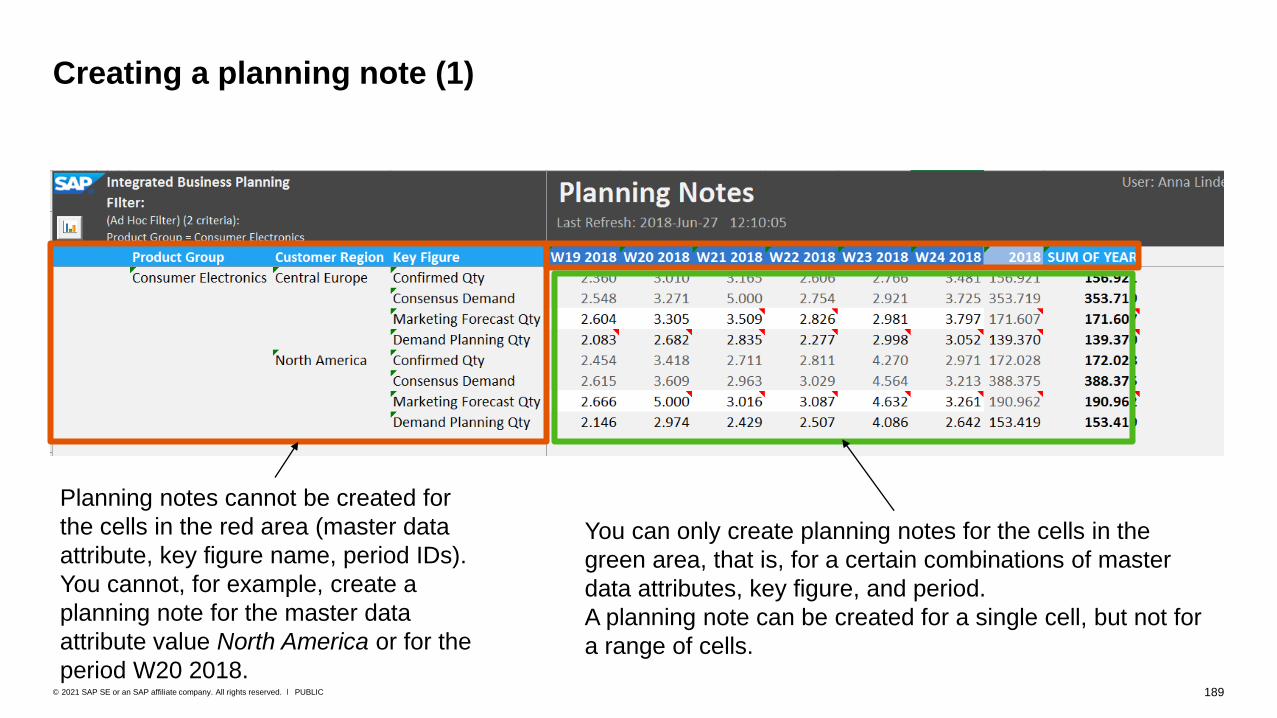
189PUBLIC© 2021 SAP SE or an SAP affiliate company. All rights reserved. ǀ
Creating a planning note (1)
Planning notes cannot be created for
the cells in the red area (master data
attribute, key figure name, period IDs).
You cannot, for example, create a
planning note for the master data
attribute value North America or for the
period W20 2018.
You can only create planning notes for the cells in the
green area, that is, for a certain combinations of master
data attributes, key figure, and period.
A planning note can be created for a single cell, but not for
a range of cells.
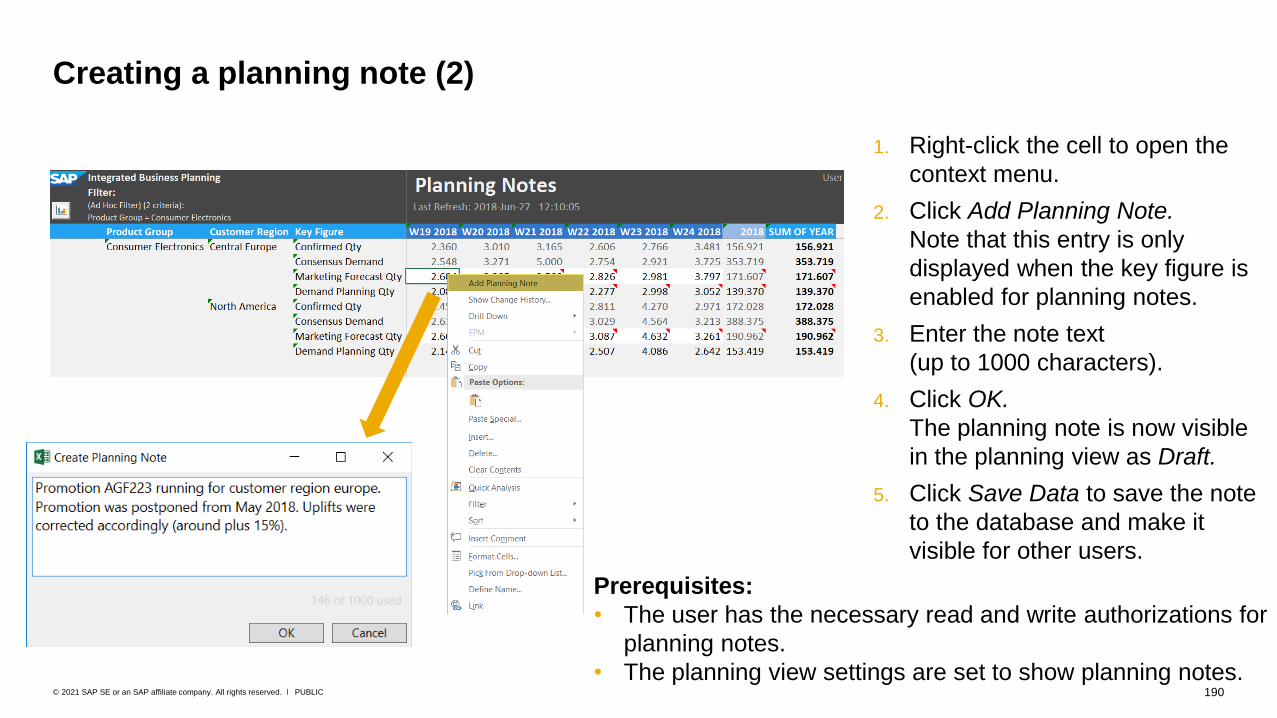
190PUBLIC© 2021 SAP SE or an SAP affiliate company. All rights reserved. ǀ
Creating a planning note (2)
1. Right-click the cell to open the
context menu.
2. Click Add Planning Note.
Note that this entry is only
displayed when the key figure is
enabled for planning notes.
3. Enter the note text
(up to 1000 characters).
4. Click OK.
The planning note is now visible
in the planning view as Draft.
5. Click Save Data to save the note
to the database and make it
visible for other users.
Prerequisites:
• The user has the necessary read and write authorizations for
planning notes.
• The planning view settings are set to show planning notes.
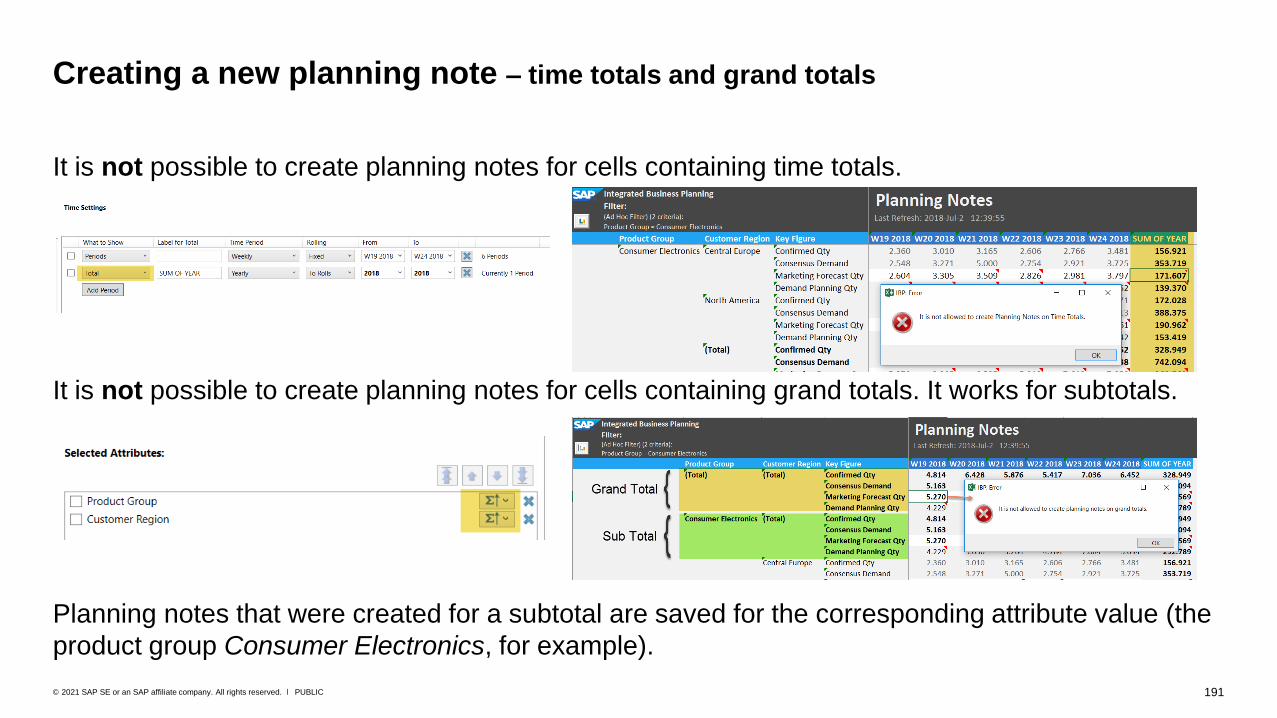
191PUBLIC© 2021 SAP SE or an SAP affiliate company. All rights reserved. ǀ
It is not possible to create planning notes for cells containing time totals.
It is not possible to create planning notes for cells containing grand totals. It works for subtotals.
Planning notes that were created for a subtotal are saved for the corresponding attribute value (the
product group Consumer Electronics, for example).
Creating a new planning note – time totals and grand totals
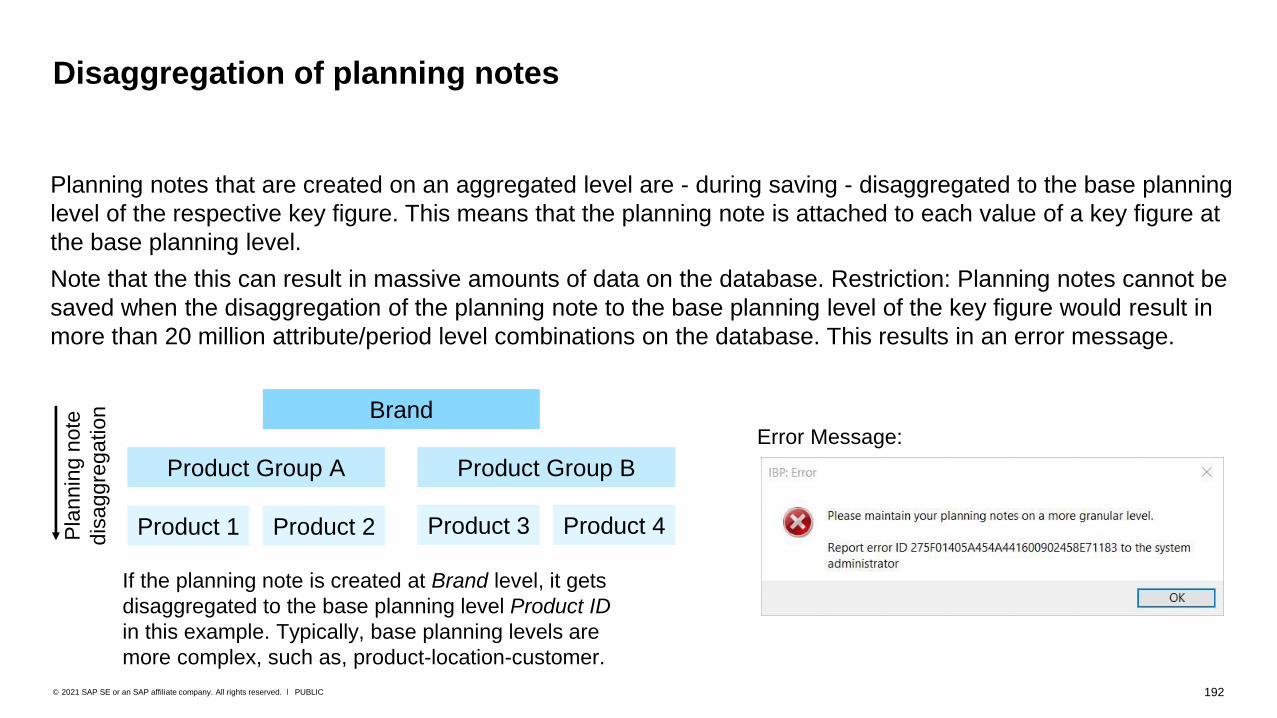
192PUBLIC© 2021 SAP SE or an SAP affiliate company. All rights reserved. ǀ
Planning notes that are created on an aggregated level are - during saving - disaggregated to the base planning
level of the respective key figure. This means that the planning note is attached to each value of a key figure at
the base planning level.
Note that the this can result in massive amounts of data on the database. Restriction: Planning notes cannot be
saved when the disaggregation of the planning note to the base planning level of the key figure would result in
more than 20 million attribute/period level combinations on the database. This results in an error message.
Disaggregation of planning notes
Brand
Product Group A Product Group B
Product 1 Product 2 Product 3 Product 4
If the planning note is created at Brand level, it gets
disaggregated to the base planning level Product ID
in this example. Typically, base planning levels are
more complex, such as, product-location-customer.
Pla
nnin
g n
ote
dis
aggre
gation
Error Message:
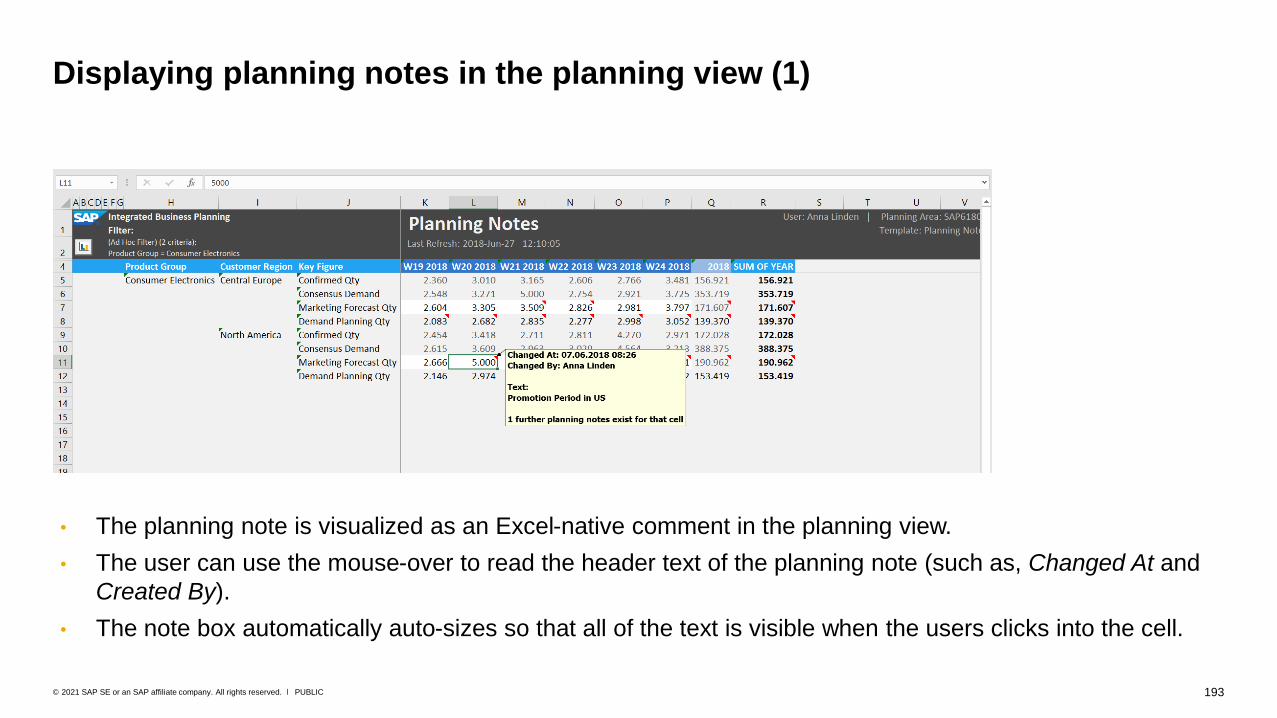
193PUBLIC© 2021 SAP SE or an SAP affiliate company. All rights reserved. ǀ
Displaying planning notes in the planning view (1)
• The planning note is visualized as an Excel-native comment in the planning view.
• The user can use the mouse-over to read the header text of the planning note (such as, Changed At and
Created By).
• The note box automatically auto-sizes so that all of the text is visible when the users clicks into the cell.

194PUBLIC© 2021 SAP SE or an SAP affiliate company. All rights reserved. ǀ
Displaying planning notes in the planning view (2)
To see planning notes in the planning view, the user
needs to set the display options accordingly in the
planning view definition:
Edit Planning View → Key Figures → Display
Planning Notes
Options:
• Don’t Show: Do not show planning notes.
• Show from This Planning Level Only: Show
only planning notes that were created on the
planning level of the planning view.
• Show from All Levels: Show planning notes from
all levels of aggregation and disaggregation.
Please be cautious: This setting can have quite a
performance impact while loading the data when
many planning notes exist in the system!

195PUBLIC© 2021 SAP SE or an SAP affiliate company. All rights reserved. ǀ
Displaying planning notes in the planning view – example
PRODUCT ID PRODUCT GROUP LOCATION ID REGION CUSTOMER ID CUSTOMER
GROUP
PRD_1 PRDGRP_1 LOC_1 REGION_1 CUST_1 CUSTGRP_1
PRD_2 PRDGRP_1 LOC_2 REGION_2 CUST_2 CUSTGRP_2
Possible attribute combinations for a key figure with planning notes:
Planning note 1
PRD_1
LOC_1
CUST_1
PRD_2
REGION_2
PRDGRP_1
CUST_1
The planning level of the planning view is product ID and region. Which planning notes are visible in the
planning view depends on the selected option:
• Don’t Show: No planning notes are visible.
• Show from this Planning Level Only: Planning note 2 is shown.
• Show from All Levels: All planning notes are shown.
Planning note 2 Planning note 3
Planning notes have been created for the
key figure at different levels.

196PUBLIC© 2021 SAP SE or an SAP affiliate company. All rights reserved. ǀ
Multiple planning notes in a cell
If multiple planning notes exist for one cell, only the
most recent planning note is shown,
plus the information
<number> further planning notes exist for that cell.
To display the
additional planning
notes (and to edit or
delete a note),
right click on the cell,
then click Show
Planning Notes.In the details view, further information about the planning
notes can be seen and the planning notes can be edited
or deleted.

197PUBLIC© 2021 SAP SE or an SAP affiliate company. All rights reserved. ǀ
Planning note details: view, edit, delete, use filters
Status of the
planning note
Planning note text
Date and Time
of last change
User who last
changed the
planning note
Click to edit the
planning noteClick to delete the
planning note
Planning level and attribute values for which the
planning notes were created
Planning view filter and
visibility filter that was
active when the user
created the planning note
Draft
Saved
Edited
Deleted
Note: If you edit or delete a planning note,
you still need to save these changes
afterwards!

198PUBLIC© 2021 SAP SE or an SAP affiliate company. All rights reserved. ǀ
Planning notes use the Microsoft Excel comment features to visualize the planning notes in the
planning view, as follows:
Comparing planning notes and Microsoft Excel comments
Context menu: Review tab in Microsoft Excel menu: • Editing and deleting planning notes using Microsoft
Excel comment features (in the Review tab) is not
supported and results in a warning message when
saving the data in the planning view. These changes are
not saved in the SAP IBP database and will be lost after
a refresh of the planning view.
• You can use the user setting Perform Planning Note
Validation to disable this check and no warning
message will be shown.
• Creating a Microsoft Excel native comment in an SAP
IBP planning view also leads to a warning message.
Such a comment is also not saved in the SAP IBP
database and will be lost after a refresh of the planning
view.
• Other Microsoft Excel comment features in the Review
tab, such as Previous, Next, Show/Hide Comments,
Show All Comments can be used.
SAP IBP warning message:

199PUBLIC© 2021 SAP SE or an SAP affiliate company. All rights reserved. ǀ
You can copy a cell or a range of cells that contain planning notes and paste it to another cell or
range. The planning notes are now also shown in the target cell/range. This is the standard
Microsoft Excel behavior for copying comments. But the copied comments are not recognized as
SAP IBP planning notes and subsequently not saved in the SAP IBP database.
Copying cells with planning notes – example
Copy
Copy cell:
Microsoft Excel comment on target cell is not recognized as
SAP IBP planning note and will not be stored in the backend.
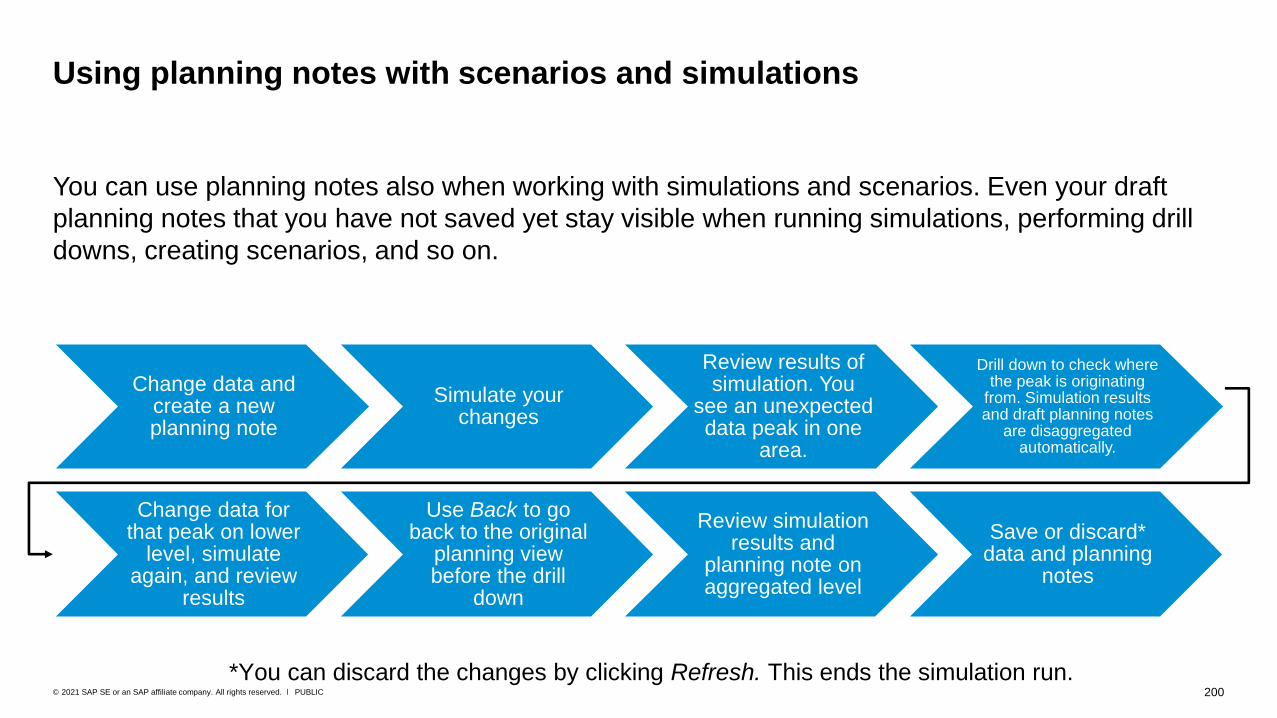
200PUBLIC© 2021 SAP SE or an SAP affiliate company. All rights reserved. ǀ
You can use planning notes also when working with simulations and scenarios. Even your draft
planning notes that you have not saved yet stay visible when running simulations, performing drill
downs, creating scenarios, and so on.
Using planning notes with scenarios and simulations
Change data and create a new planning note
Simulate your changes
Review results of simulation. You
see an unexpected data peak in one
area.
Drill down to check where the peak is originating
from. Simulation results and draft planning notes
are disaggregated automatically.
Change data for that peak on lower
level, simulate again, and review
results
Use Back to go back to the original
planning view before the drill
down
Review simulation results and
planning note on aggregated level
Save or discard* data and planning
notes
*You can discard the changes by clicking Refresh. This ends the simulation run.

201PUBLIC© 2021 SAP SE or an SAP affiliate company. All rights reserved. ǀ
Mass deletion of planning notes (application job)
• Old or obsolete planning notes that are no
longer needed can be removed using an
application job run by the administrator (job
template Delete Planning Notes).
• The application job can be planned as a
recurring job.
• Application job parameters:
− Planning Area
− Version
− Keyfigure
− User
− Attributes of Planning Note Level
− Notes Created Before
− Periods Ending Before
− Rolling
202PUBLIC© 2021 SAP SE or an SAP affiliate company. All rights reserved. ǀ
You can use planning operators, such as, Version Copy, Copy, and Copy & Disaggregate Key
Figures, to copy data from a source to a target version, key figure, or planning area.
Note that the operators Copy and Copy & Disaggregate Key Figures don’t copy planning notes.
Copying planning notes with planning operators

Adding Own Key Figures
(Local Members)
204PUBLIC© 2021 SAP SE or an SAP affiliate company. All rights reserved. ǀ
• Users can quickly add their own MS Excel calculations and formulas on top of data from SAP
IBP.
• No need to contact the local IT to get another key figure defined.
• Calculation is kept consistent when changing the planning view definition.
• Data is not saved on the database, but calculated locally when you open the planning view.
Therefore, please be aware that applying Excel formulas and calculations in SAP IBP planning
views can have an impact on the performance.
• Local formulas are calculated by the Microsoft Excel frontend and not by the SAP IBP backend.
A vast amount of calculations (because the formulas are complex or the planning view is large)
can have an impact on performance. You should check case by case whether a local key figure
really makes sense or whether it is better to use standard functionality (such as, totals and
subtotals) or calculated key figures in the in the SAP IBP backend.
Local formulas and calculations on top of SAP IBP data
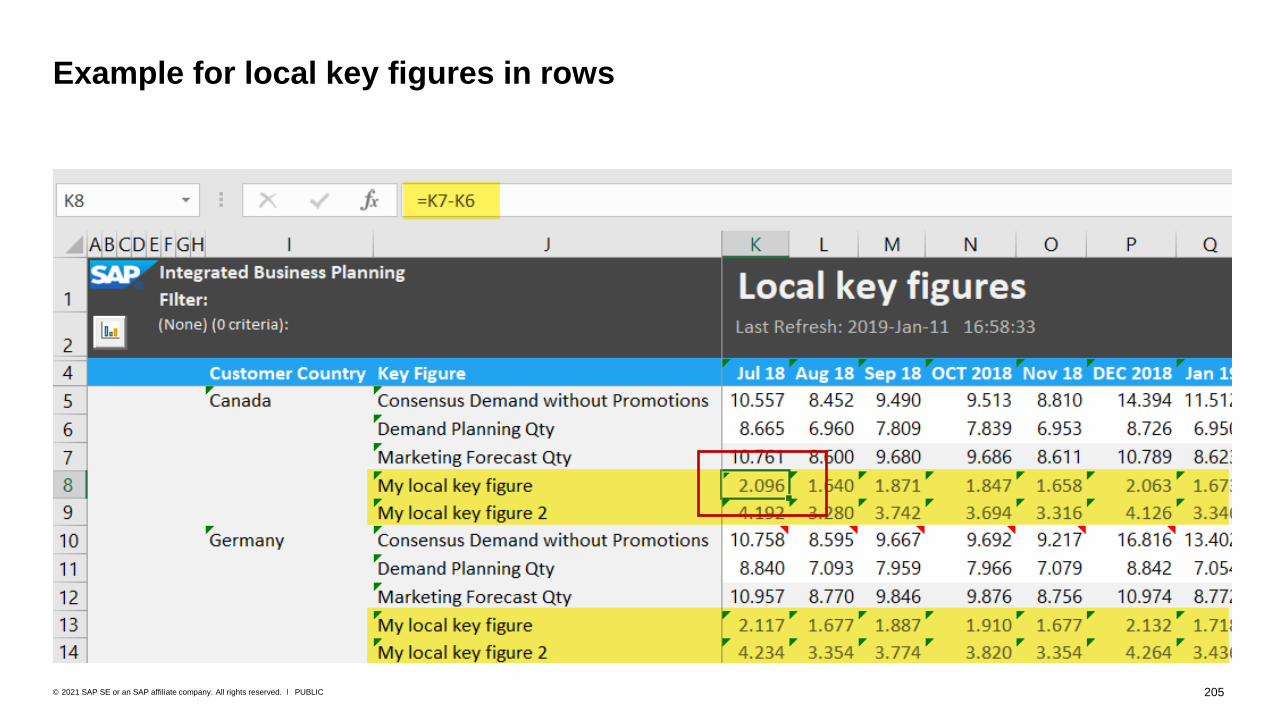
205PUBLIC© 2021 SAP SE or an SAP affiliate company. All rights reserved. ǀ
Example for local key figures in rows
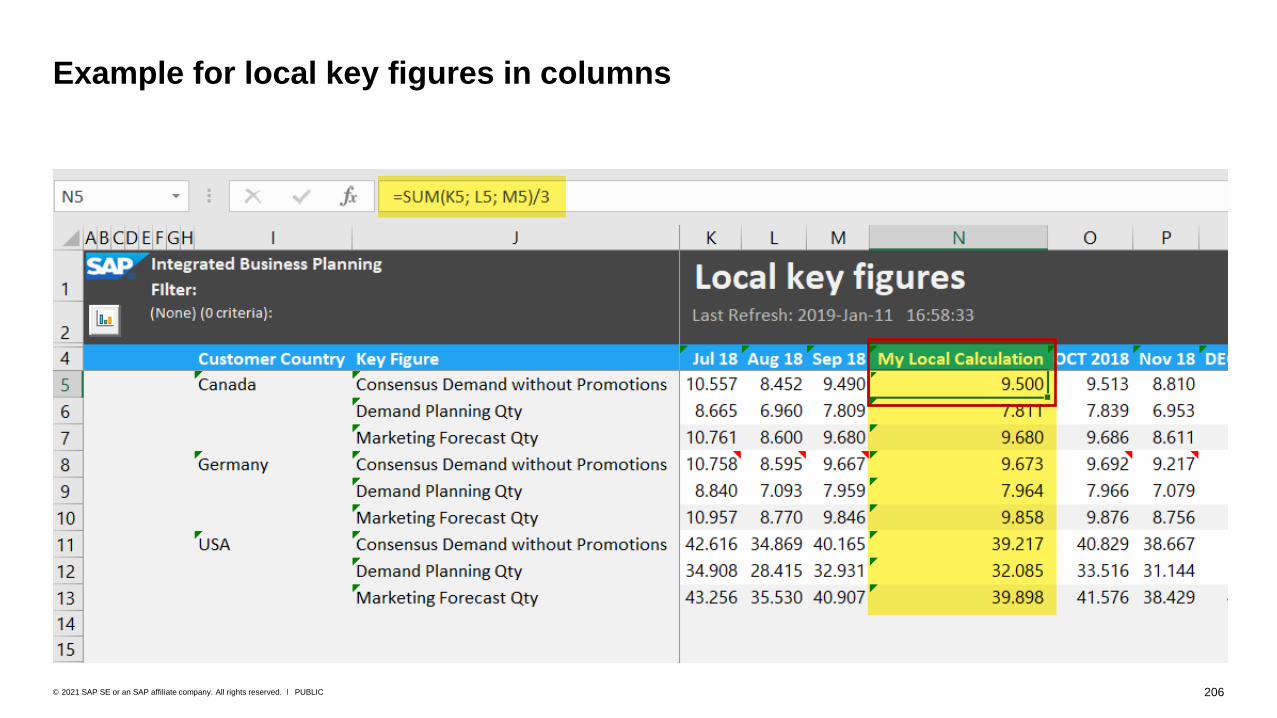
206PUBLIC© 2021 SAP SE or an SAP affiliate company. All rights reserved. ǀ
Example for local key figures in columns

207PUBLIC© 2021 SAP SE or an SAP affiliate company. All rights reserved. ǀ
To make the SAP IBP system recognize your
local calculations in the planning view, select
the Activate Local Member Recognition
checkbox in the Options menu.
Prerequisites for creating a local key figure
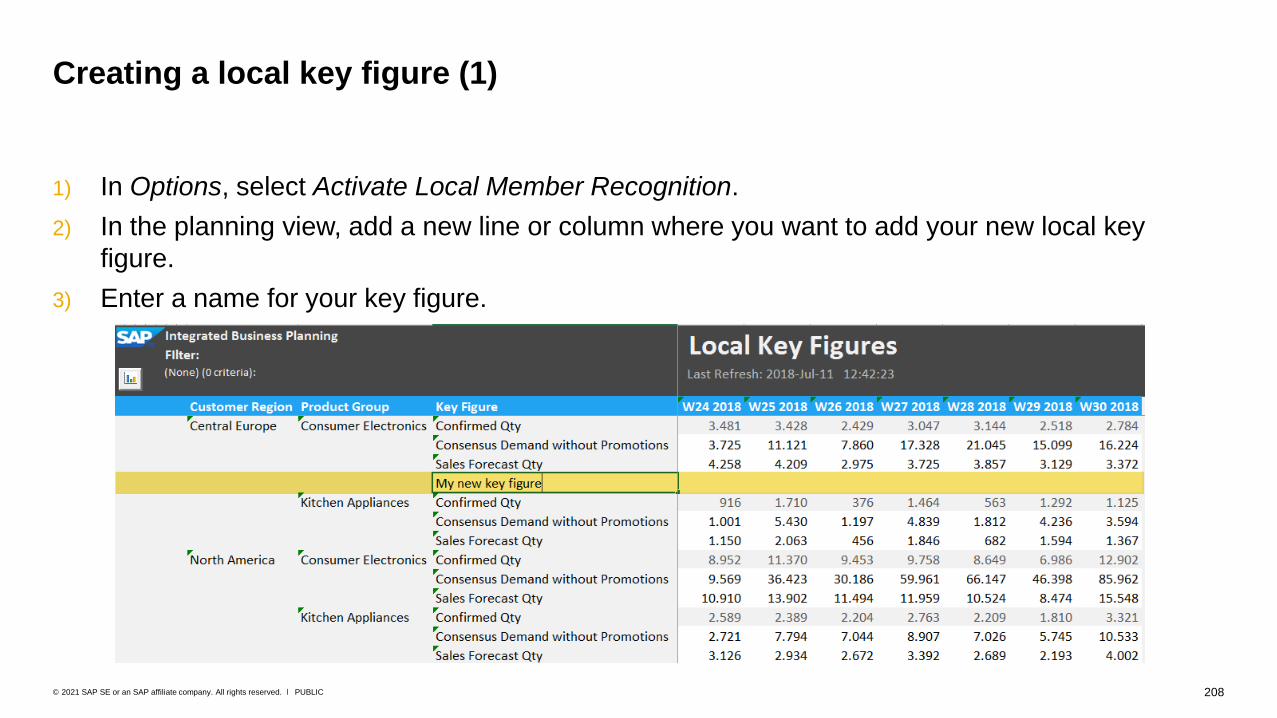
208PUBLIC© 2021 SAP SE or an SAP affiliate company. All rights reserved. ǀ
1) In Options, select Activate Local Member Recognition.
2) In the planning view, add a new line or column where you want to add your new local key
figure.
3) Enter a name for your key figure.
Creating a local key figure (1)
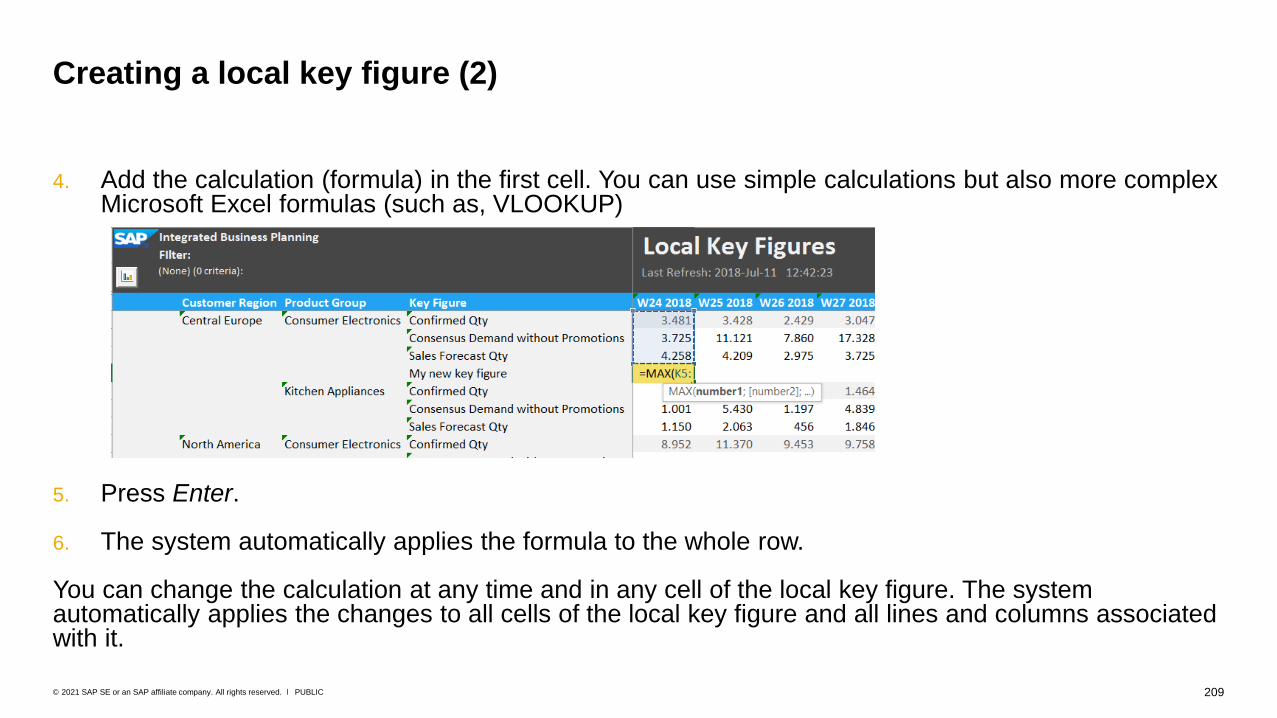
209PUBLIC© 2021 SAP SE or an SAP affiliate company. All rights reserved. ǀ
4. Add the calculation (formula) in the first cell. You can use simple calculations but also more complex Microsoft Excel formulas (such as, VLOOKUP)
5. Press Enter.
6. The system automatically applies the formula to the whole row.
You can change the calculation at any time and in any cell of the local key figure. The system automatically applies the changes to all cells of the local key figure and all lines and columns associated with it.
Creating a local key figure (2)
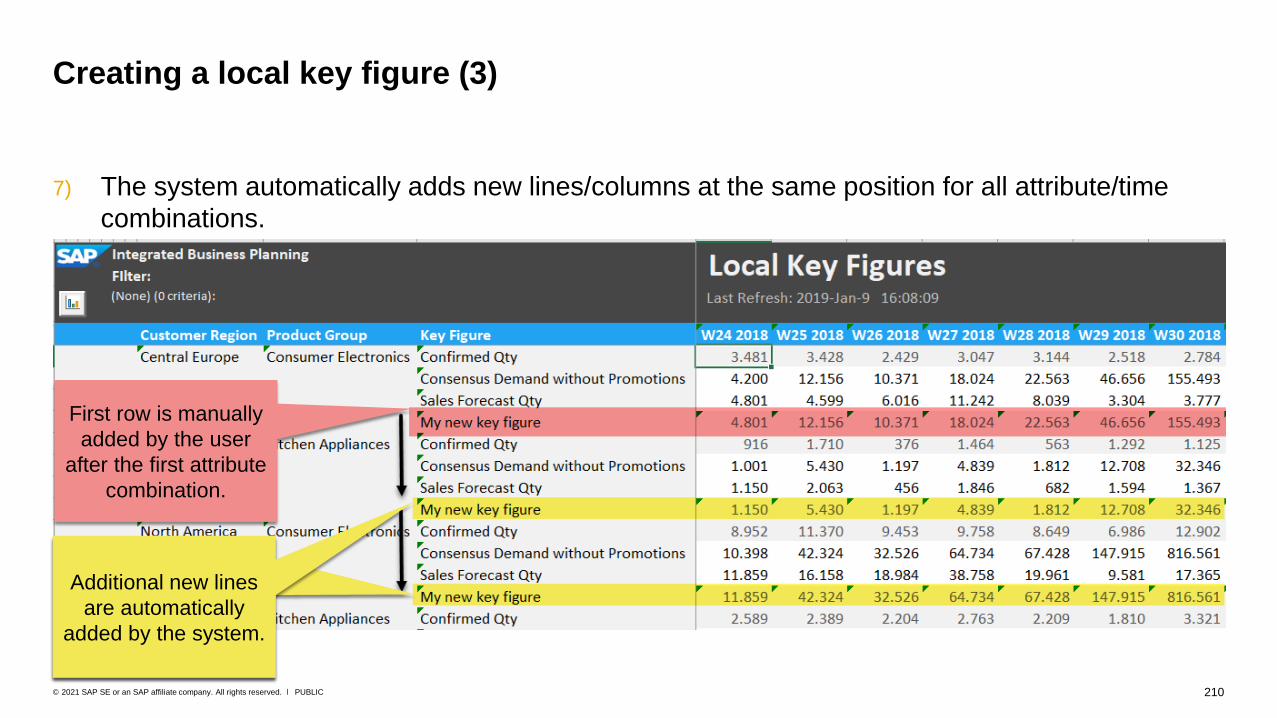
210PUBLIC© 2021 SAP SE or an SAP affiliate company. All rights reserved. ǀ
7) The system automatically adds new lines/columns at the same position for all attribute/time
combinations.
Creating a local key figure (3)
First row is manually
added by the user
after the first attribute
combination.
Additional new lines
are automatically
added by the system.
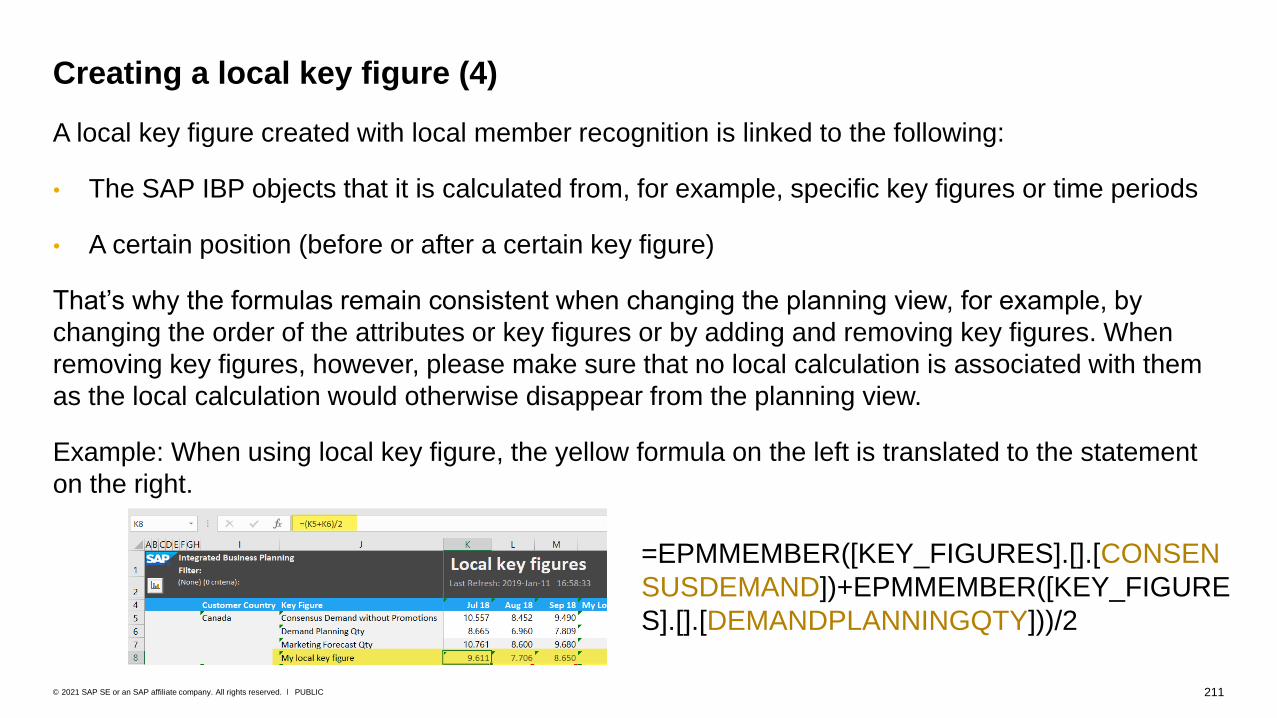
211PUBLIC© 2021 SAP SE or an SAP affiliate company. All rights reserved. ǀ
A local key figure created with local member recognition is linked to the following:
• The SAP IBP objects that it is calculated from, for example, specific key figures or time periods
• A certain position (before or after a certain key figure)
That’s why the formulas remain consistent when changing the planning view, for example, by
changing the order of the attributes or key figures or by adding and removing key figures. When
removing key figures, however, please make sure that no local calculation is associated with them
as the local calculation would otherwise disappear from the planning view.
Example: When using local key figure, the yellow formula on the left is translated to the statement
on the right.
Creating a local key figure (4)
=EPMMEMBER([KEY_FIGURES].[].[CONSEN
SUSDEMAND])+EPMMEMBER([KEY_FIGURE
S].[].[DEMANDPLANNINGQTY]))/2
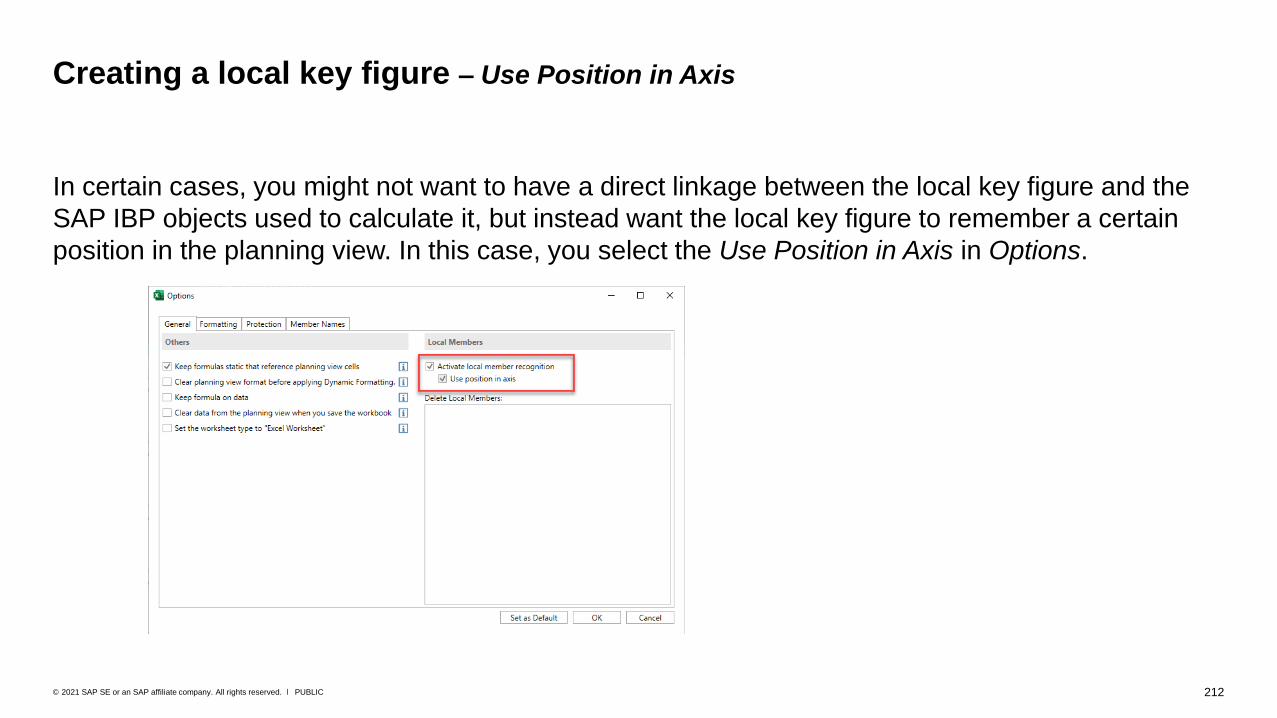
212PUBLIC© 2021 SAP SE or an SAP affiliate company. All rights reserved. ǀ
In certain cases, you might not want to have a direct linkage between the local key figure and the
SAP IBP objects used to calculate it, but instead want the local key figure to remember a certain
position in the planning view. In this case, you select the Use Position in Axis in Options.
Creating a local key figure – Use Position in Axis

213PUBLIC© 2021 SAP SE or an SAP affiliate company. All rights reserved. ǀ
The Position in Axis setting is useful, for example, when you use a local key figure that sums up the
next 3 months. The time periods are set to Rolling.
In January 2019, the planning view and the local key figure calculation look like this:
Using Use Position in Axis – example (1)
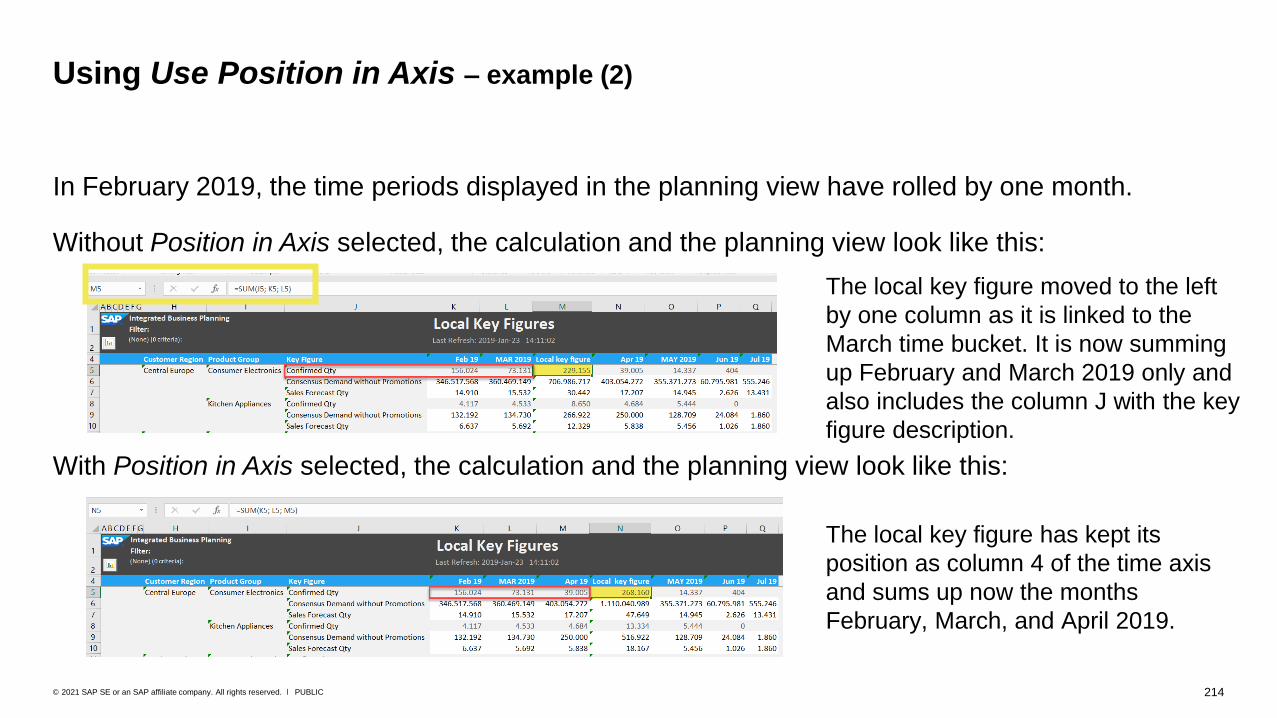
214PUBLIC© 2021 SAP SE or an SAP affiliate company. All rights reserved. ǀ
In February 2019, the time periods displayed in the planning view have rolled by one month.
Without Position in Axis selected, the calculation and the planning view look like this:
With Position in Axis selected, the calculation and the planning view look like this:
Using Use Position in Axis – example (2)
The local key figure has kept its
position as column 4 of the time axis
and sums up now the months
February, March, and April 2019.
The local key figure moved to the left
by one column as it is linked to the
March time bucket. It is now summing
up February and March 2019 only and
also includes the column J with the key
figure description.
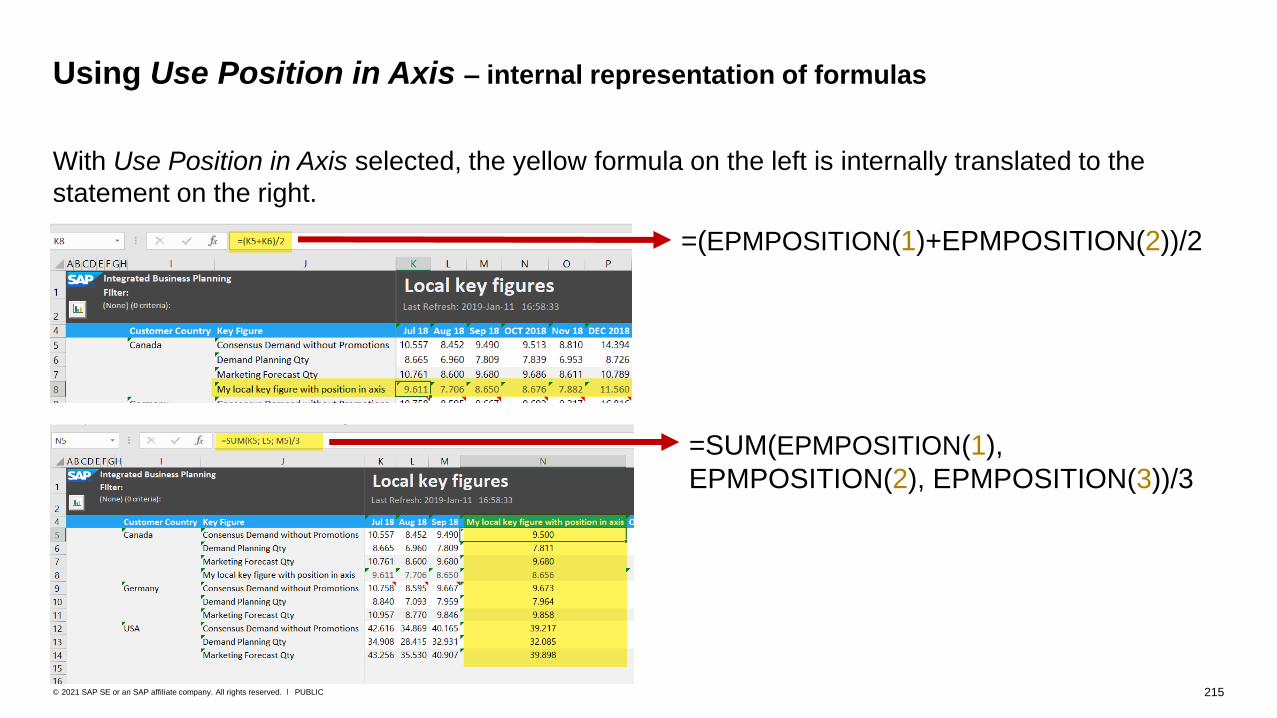
215PUBLIC© 2021 SAP SE or an SAP affiliate company. All rights reserved. ǀ
With Use Position in Axis selected, the yellow formula on the left is internally translated to the
statement on the right.
Using Use Position in Axis – internal representation of formulas
=(EPMPOSITION(1)+EPMPOSITION(2))/2
=SUM(EPMPOSITION(1),
EPMPOSITION(2), EPMPOSITION(3))/3

216PUBLIC© 2021 SAP SE or an SAP affiliate company. All rights reserved. ǀ
If you use your own local key figures, you can still change the planning view definition. You can, for
example, change the sequence of the key figures or add or remove attributes. The calculations for
the local key figures (formulas) are automatically kept consistent by the system.
You can usually change, add, or delete time levels, attributes, and key figures as long as the
formula calculation is kept consistent.
Example: After you have changed the sequence of the key figures, the formula for the local key
figure My local key figure still refers to the same input key figures – provided the Position in Axis
checkbox is not selected.
Local key figures – changing settings for the planning view
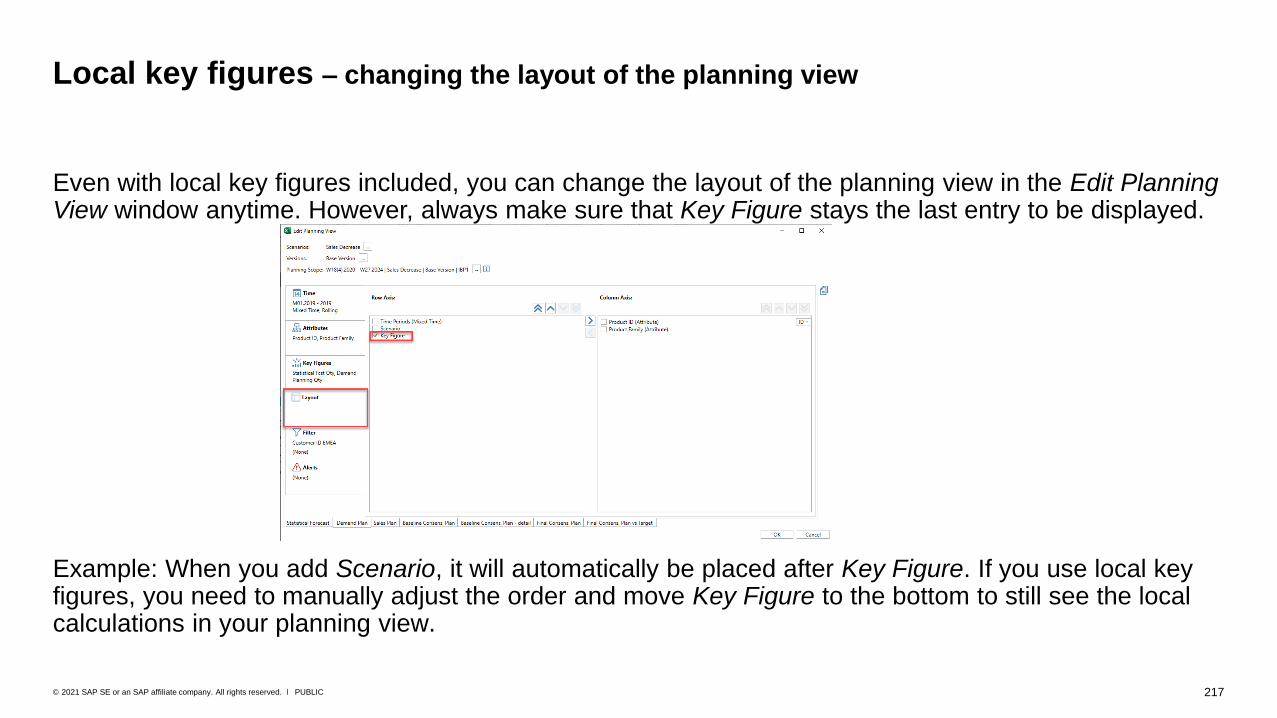
217PUBLIC© 2021 SAP SE or an SAP affiliate company. All rights reserved. ǀ
Even with local key figures included, you can change the layout of the planning view in the Edit Planning View window anytime. However, always make sure that Key Figure stays the last entry to be displayed.
Example: When you add Scenario, it will automatically be placed after Key Figure. If you use local key figures, you need to manually adjust the order and move Key Figure to the bottom to still see the local calculations in your planning view.
Local key figures – changing the layout of the planning view
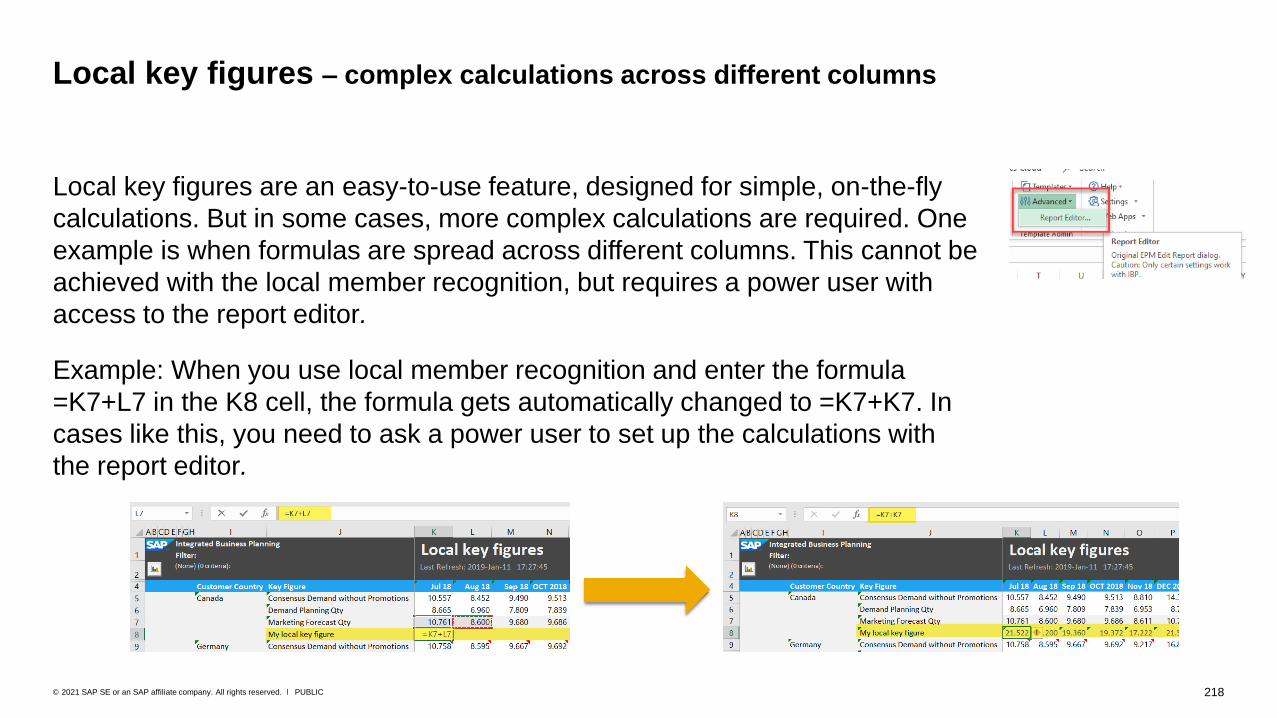
218PUBLIC© 2021 SAP SE or an SAP affiliate company. All rights reserved. ǀ
Local key figures are an easy-to-use feature, designed for simple, on-the-fly
calculations. But in some cases, more complex calculations are required. One
example is when formulas are spread across different columns. This cannot be
achieved with the local member recognition, but requires a power user with
access to the report editor.
Example: When you use local member recognition and enter the formula
=K7+L7 in the K8 cell, the formula gets automatically changed to =K7+K7. In
cases like this, you need to ask a power user to set up the calculations with
the report editor.
Local key figures – complex calculations across different columns
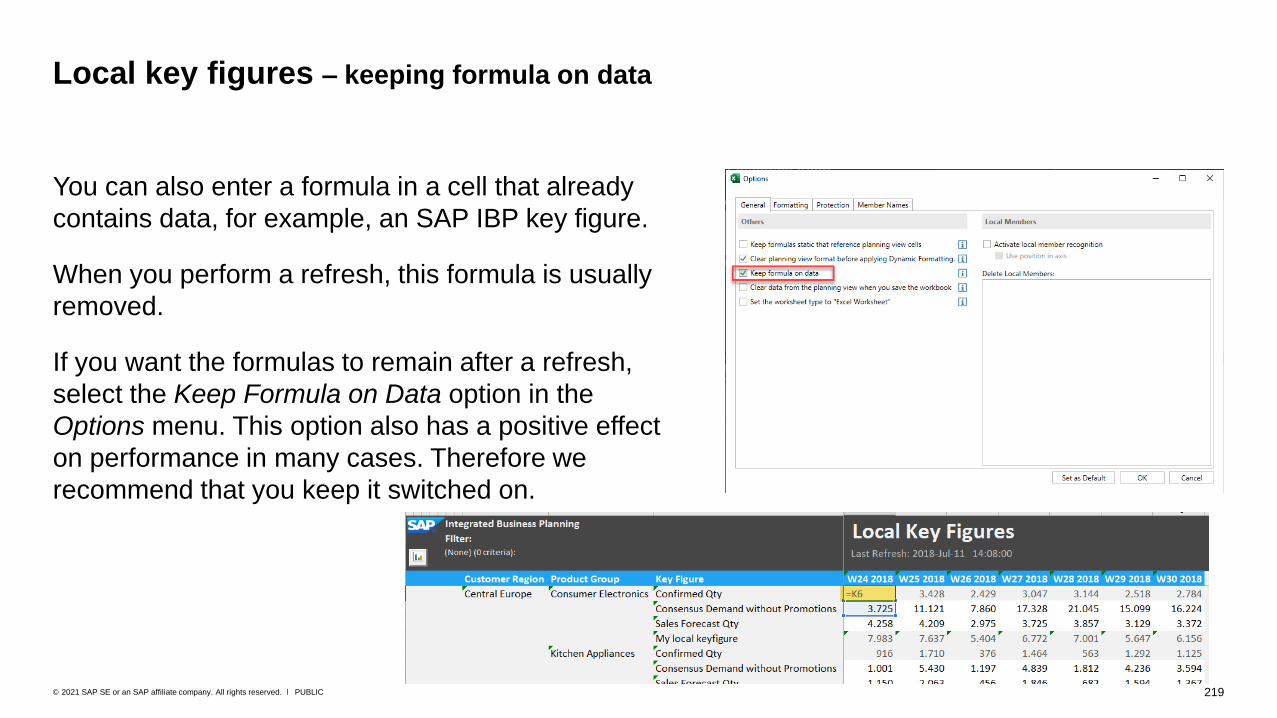
219PUBLIC© 2021 SAP SE or an SAP affiliate company. All rights reserved. ǀ
You can also enter a formula in a cell that already
contains data, for example, an SAP IBP key figure.
When you perform a refresh, this formula is usually
removed.
If you want the formulas to remain after a refresh,
select the Keep Formula on Data option in the
Options menu. This option also has a positive effect
on performance in many cases. Therefore we
recommend that you keep it switched on.
Local key figures – keeping formula on data
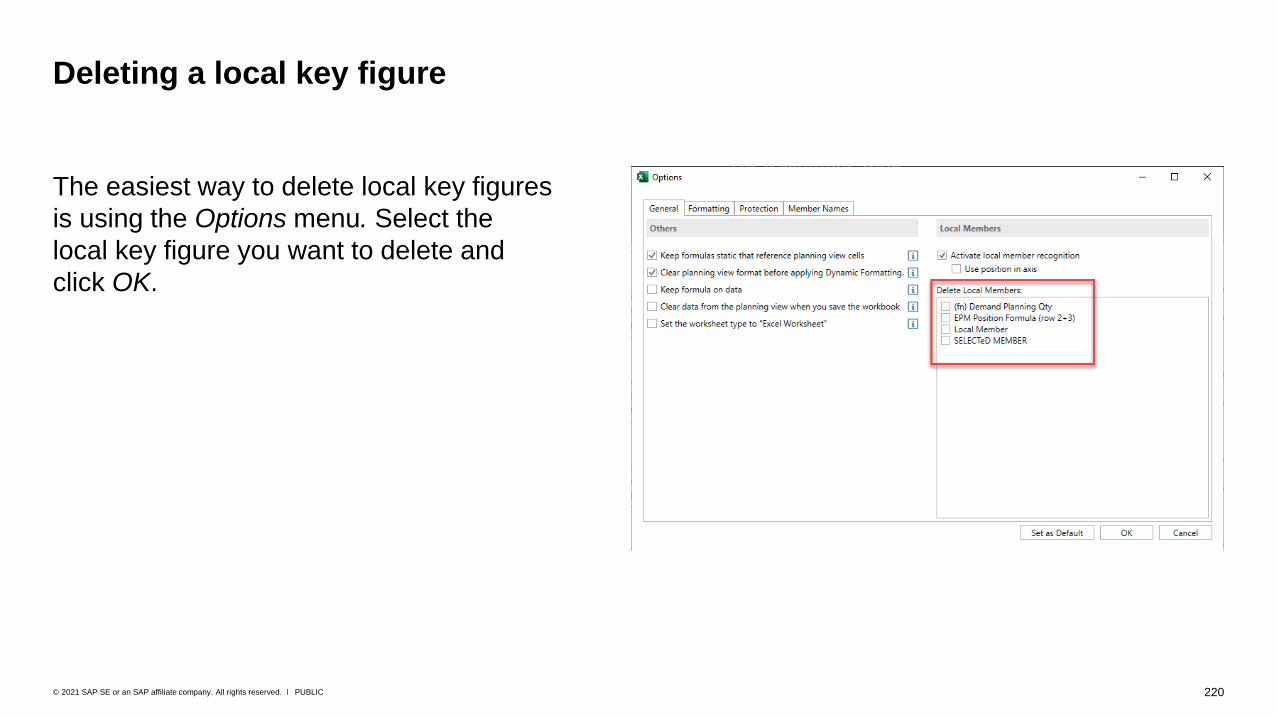
220PUBLIC© 2021 SAP SE or an SAP affiliate company. All rights reserved. ǀ
The easiest way to delete local key figures
is using the Options menu. Select the
local key figure you want to delete and
click OK.
Deleting a local key figure
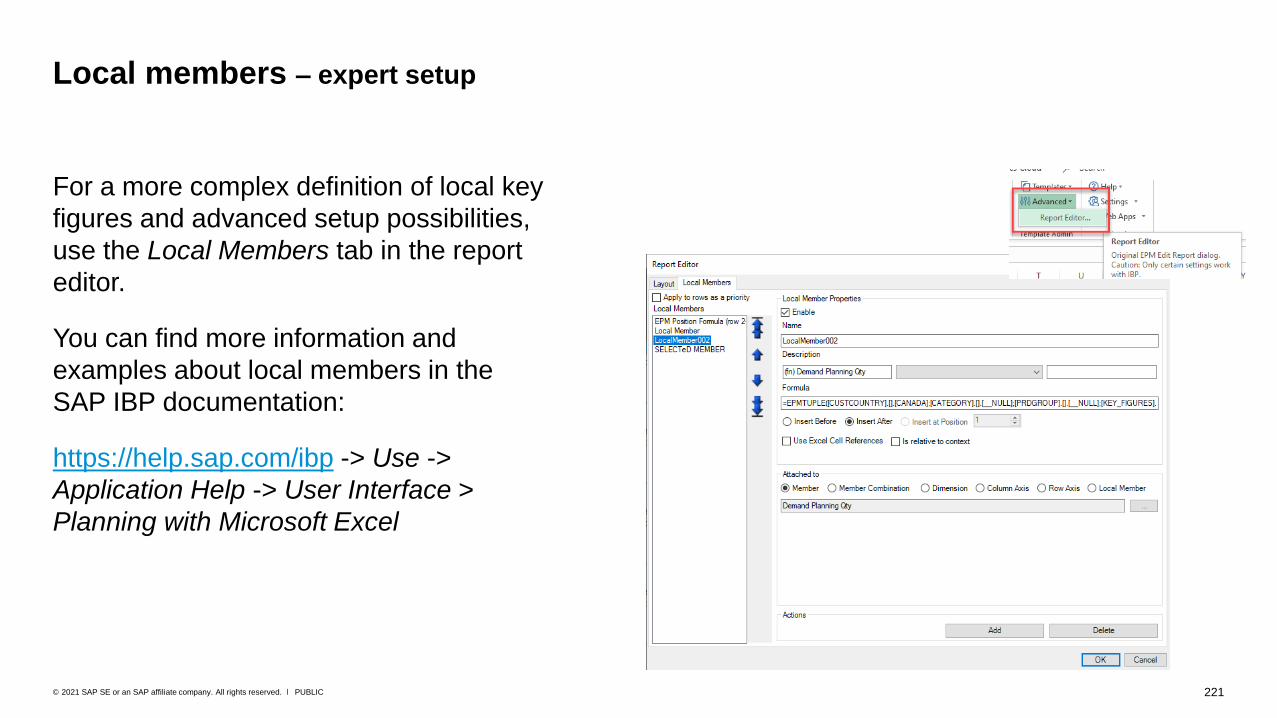
221PUBLIC© 2021 SAP SE or an SAP affiliate company. All rights reserved. ǀ
For a more complex definition of local key
figures and advanced setup possibilities,
use the Local Members tab in the report
editor.
You can find more information and
examples about local members in the
SAP IBP documentation:
https://help.sap.com/ibp -> Use ->
Application Help -> User Interface >
Planning with Microsoft Excel
Local members – expert setup
How to Save Key Figure Data in a
Planning View

223PUBLIC© 2021 SAP SE or an SAP affiliate company. All rights reserved. ǀ
You can change and save key figure values in the planning view.
The changes are saved to the database and directly visible to all other users in SAP IBP.
Introduction
Change key figure data
Click Save Data
System checks your
permissions
Data is saved on the
database
Planning view is refreshed
with the latest data
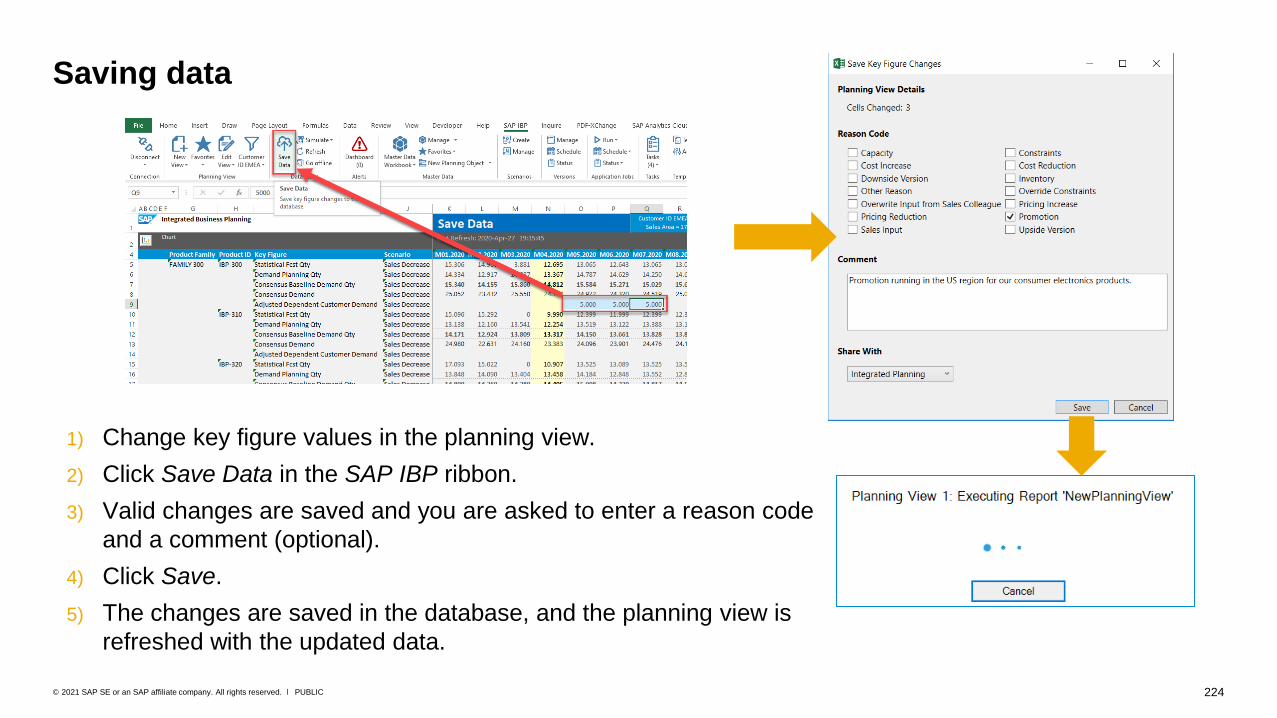
224PUBLIC© 2021 SAP SE or an SAP affiliate company. All rights reserved. ǀ
Saving data
1) Change key figure values in the planning view.
2) Click Save Data in the SAP IBP ribbon.
3) Valid changes are saved and you are asked to enter a reason code
and a comment (optional).
4) Click Save.
5) The changes are saved in the database, and the planning view is
refreshed with the updated data.
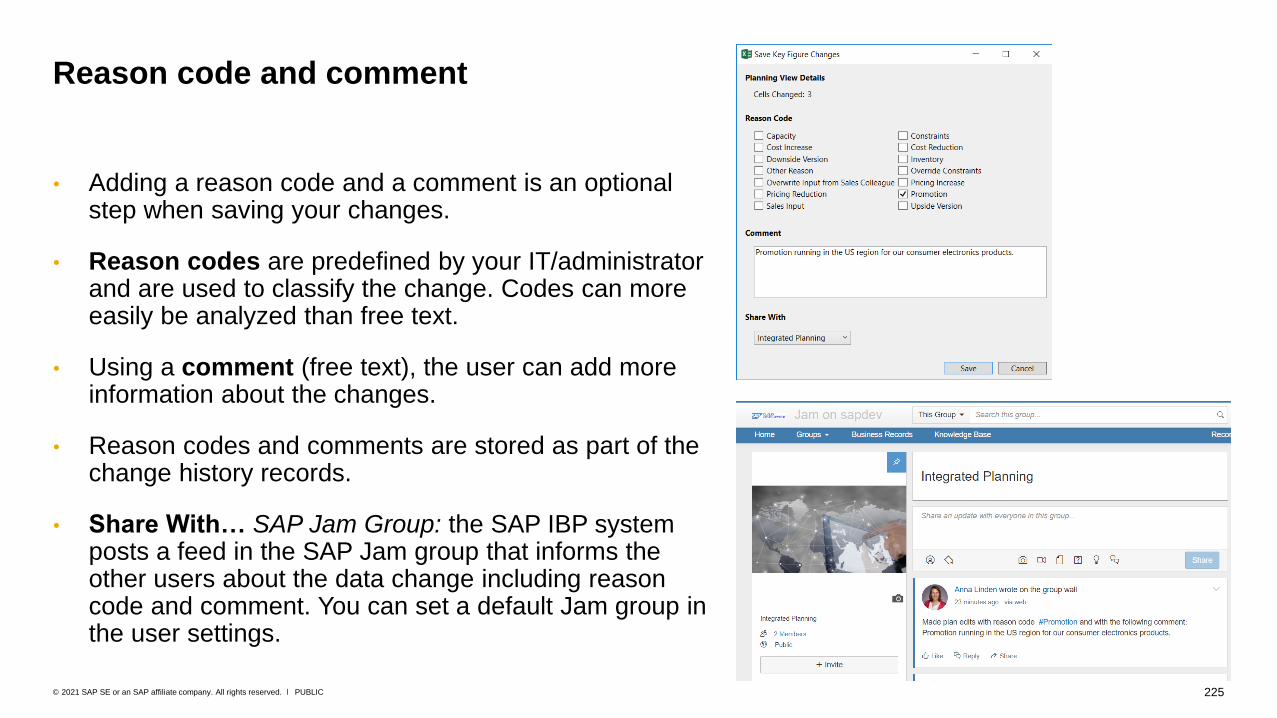
225PUBLIC© 2021 SAP SE or an SAP affiliate company. All rights reserved. ǀ
• Adding a reason code and a comment is an optional step when saving your changes.
• Reason codes are predefined by your IT/administrator and are used to classify the change. Codes can more easily be analyzed than free text.
• Using a comment (free text), the user can add more information about the changes.
• Reason codes and comments are stored as part of the change history records.
• Share With… SAP Jam Group: the SAP IBP system posts a feed in the SAP Jam group that informs the other users about the data change including reason code and comment. You can set a default Jam group in the user settings.
Reason code and comment
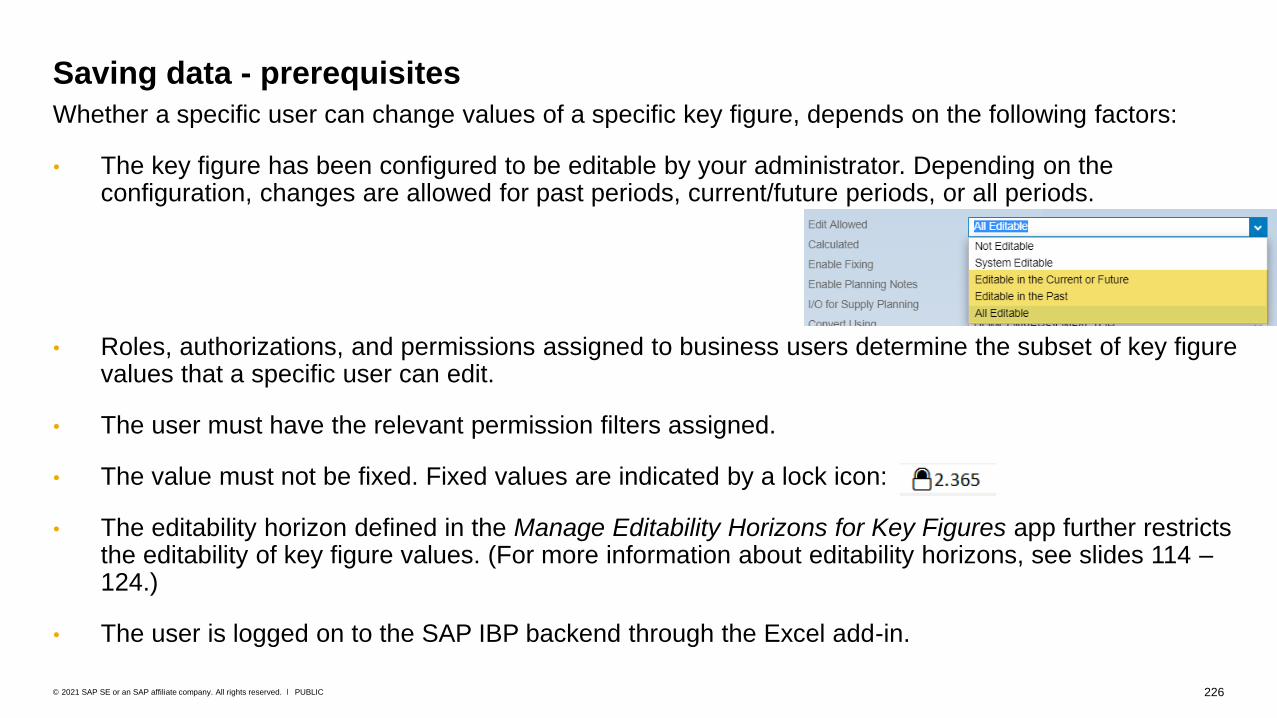
226PUBLIC© 2021 SAP SE or an SAP affiliate company. All rights reserved. ǀ
Whether a specific user can change values of a specific key figure, depends on the following factors:
• The key figure has been configured to be editable by your administrator. Depending on the configuration, changes are allowed for past periods, current/future periods, or all periods.
• Roles, authorizations, and permissions assigned to business users determine the subset of key figure values that a specific user can edit.
• The user must have the relevant permission filters assigned.
• The value must not be fixed. Fixed values are indicated by a lock icon:
• The editability horizon defined in the Manage Editability Horizons for Key Figures app further restricts the editability of key figure values. (For more information about editability horizons, see slides 114 –124.)
• The user is logged on to the SAP IBP backend through the Excel add-in.
Saving data - prerequisites
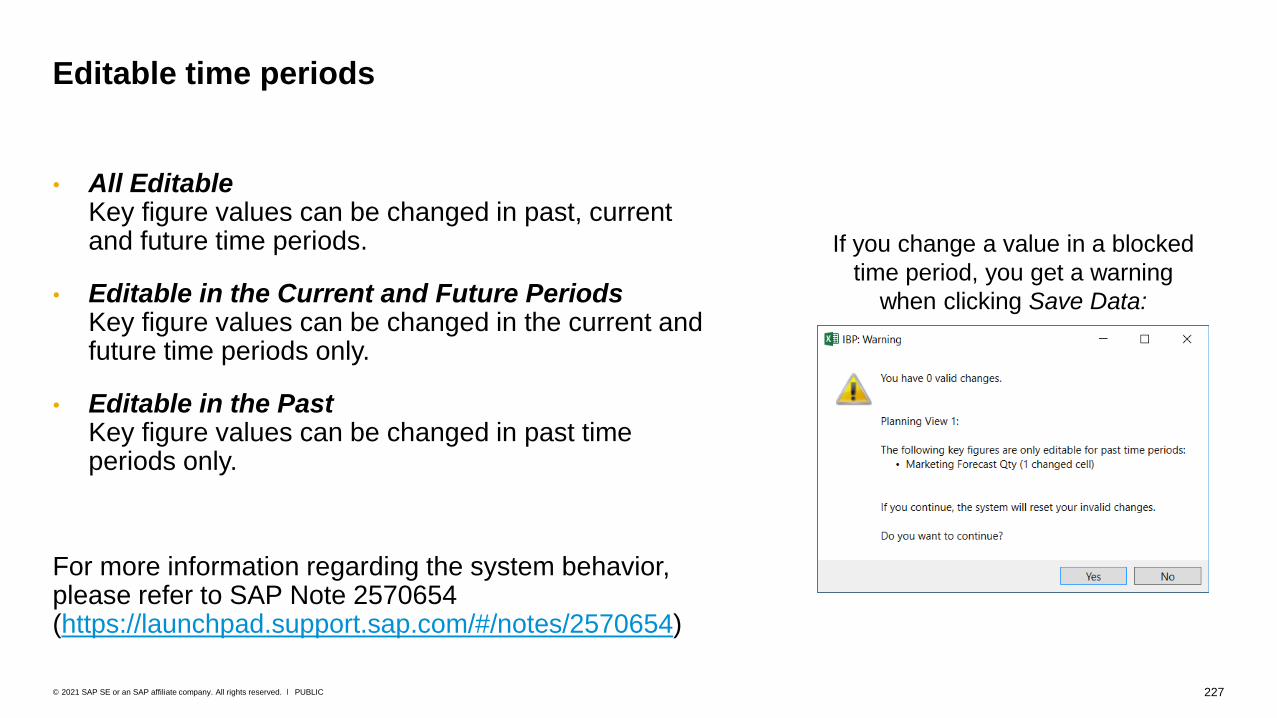
227PUBLIC© 2021 SAP SE or an SAP affiliate company. All rights reserved. ǀ
• All EditableKey figure values can be changed in past, current and future time periods.
• Editable in the Current and Future PeriodsKey figure values can be changed in the current and future time periods only.
• Editable in the PastKey figure values can be changed in past time periods only.
For more information regarding the system behavior, please refer to SAP Note 2570654(https://launchpad.support.sap.com/#/notes/2570654)
Editable time periods
If you change a value in a blocked
time period, you get a warning
when clicking Save Data:
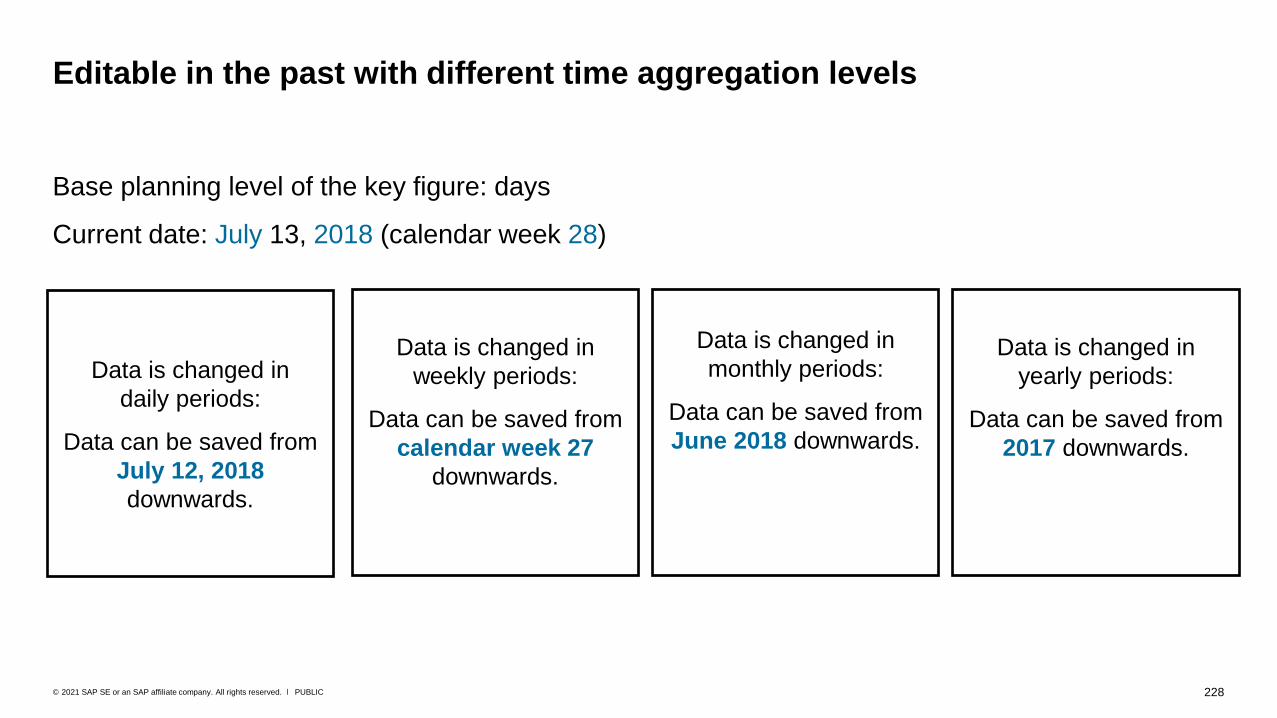
228PUBLIC© 2021 SAP SE or an SAP affiliate company. All rights reserved. ǀ
Editable in the past with different time aggregation levels
Data is changed in
weekly periods:
Data can be saved from
calendar week 27
downwards.
Data is changed in
monthly periods:
Data can be saved from
June 2018 downwards.
Base planning level of the key figure: days
Current date: July 13, 2018 (calendar week 28)
Data is changed in
yearly periods:
Data can be saved from
2017 downwards.
Data is changed in
daily periods:
Data can be saved from
July 12, 2018
downwards.
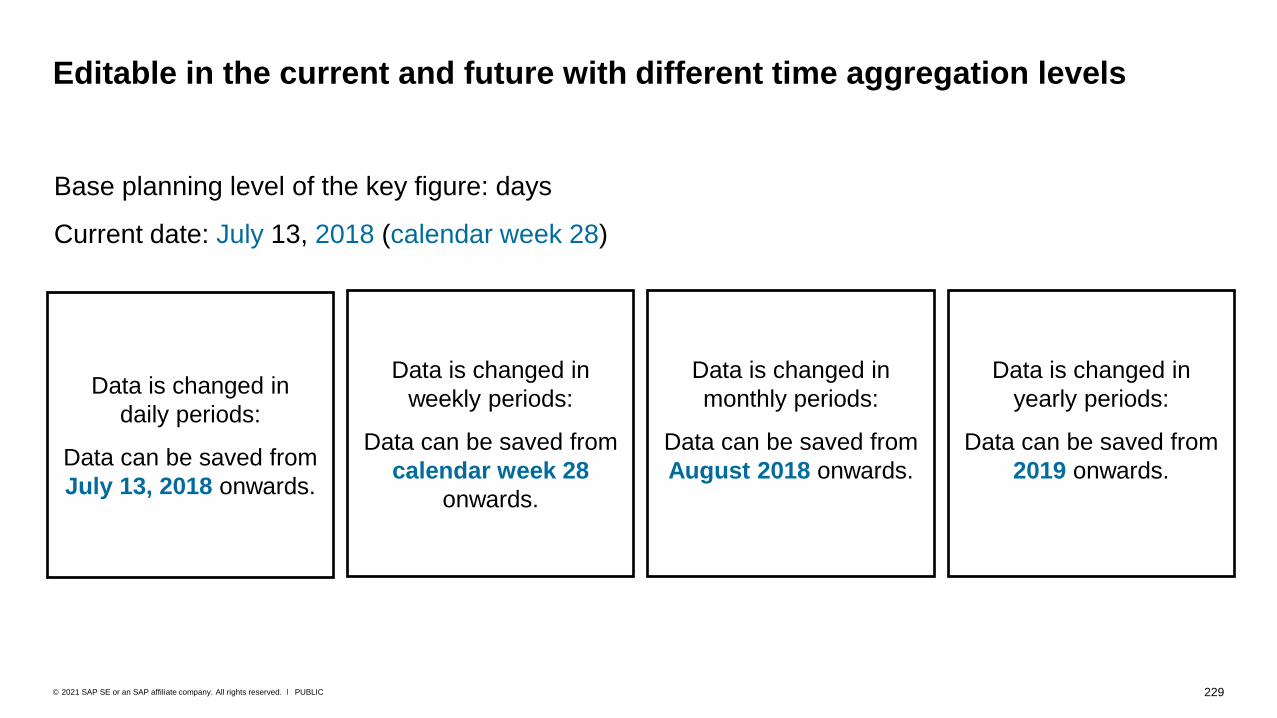
229PUBLIC© 2021 SAP SE or an SAP affiliate company. All rights reserved. ǀ
Editable in the current and future with different time aggregation levels
Data is changed in
weekly periods:
Data can be saved from
calendar week 28
onwards.
Data is changed in
monthly periods:
Data can be saved from
August 2018 onwards.
Base planning level of the key figure: days
Current date: July 13, 2018 (calendar week 28)
Data is changed in
yearly periods:
Data can be saved from
2019 onwards.
Data is changed in
daily periods:
Data can be saved from
July 13, 2018 onwards.

230PUBLIC© 2021 SAP SE or an SAP affiliate company. All rights reserved. ǀ
Invalid changes
If a change is invalid, for example, because the key figure is not editable in a period or the value is
fixed, the user gets a notification when clicking Save Data. Examples:
When you click Yes, the valid changes are saved to the database and the invalid changes are
discarded.

231PUBLIC© 2021 SAP SE or an SAP affiliate company. All rights reserved. ǀ
• The data a user is working on is not locked. Other users can work on the same data in parallel.
• The last update made to a value is the one that is stored on the database.
Example:
→ The changes from user A will overwrite the changes from user B.
“Last one wins” principle
User B saves data at a detailed level (product in this
product group, weekly periods) at 08:10:00.User A saves data at an aggregated level
(product group, monthly periods) at 08:10:02.
am

232PUBLIC© 2021 SAP SE or an SAP affiliate company. All rights reserved. ǀ
When saving data for an aggregated time period, such as months, quarters, or years, the data is
automatically disaggregated down to the base level of the respective key figure (such as days) and
stored in these lowest periods.
Example: Data is saved for the time period year 2015. The base level of the key figure is technical
weeks.
If the disaggregation rule Equal Distribution is set for the key figure, the data is equally distributed
across the technical weeks.
Time disaggregation
Dis
aggre
gation
Ag
gre
gatio
n
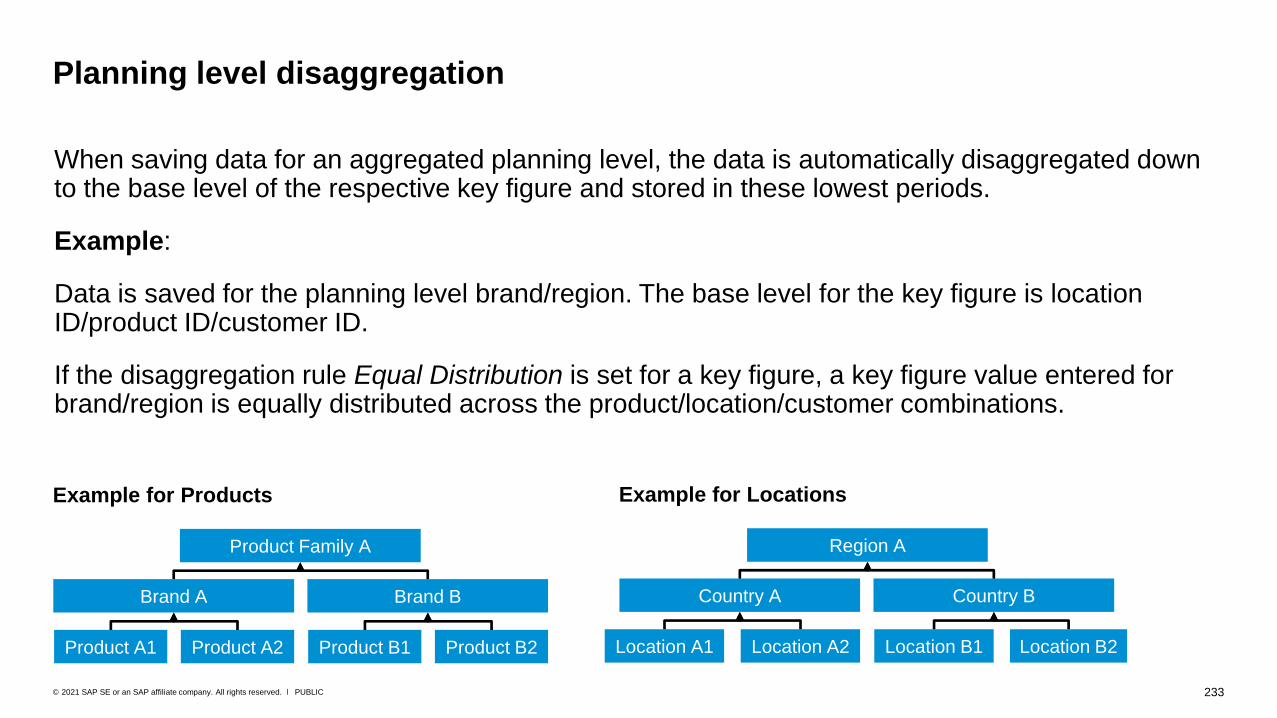
233PUBLIC© 2021 SAP SE or an SAP affiliate company. All rights reserved. ǀ
When saving data for an aggregated planning level, the data is automatically disaggregated down to the base level of the respective key figure and stored in these lowest periods.
Example:
Data is saved for the planning level brand/region. The base level for the key figure is location ID/product ID/customer ID.
If the disaggregation rule Equal Distribution is set for a key figure, a key figure value entered for brand/region is equally distributed across the product/location/customer combinations.
Planning level disaggregation
Product Family A
Brand A Brand B
Product A1 Product A2 Product B1 Product B2
Example for Products
Region A
Country A Country B
Location A1 Location A2 Location B1 Location B2
Example for Locations
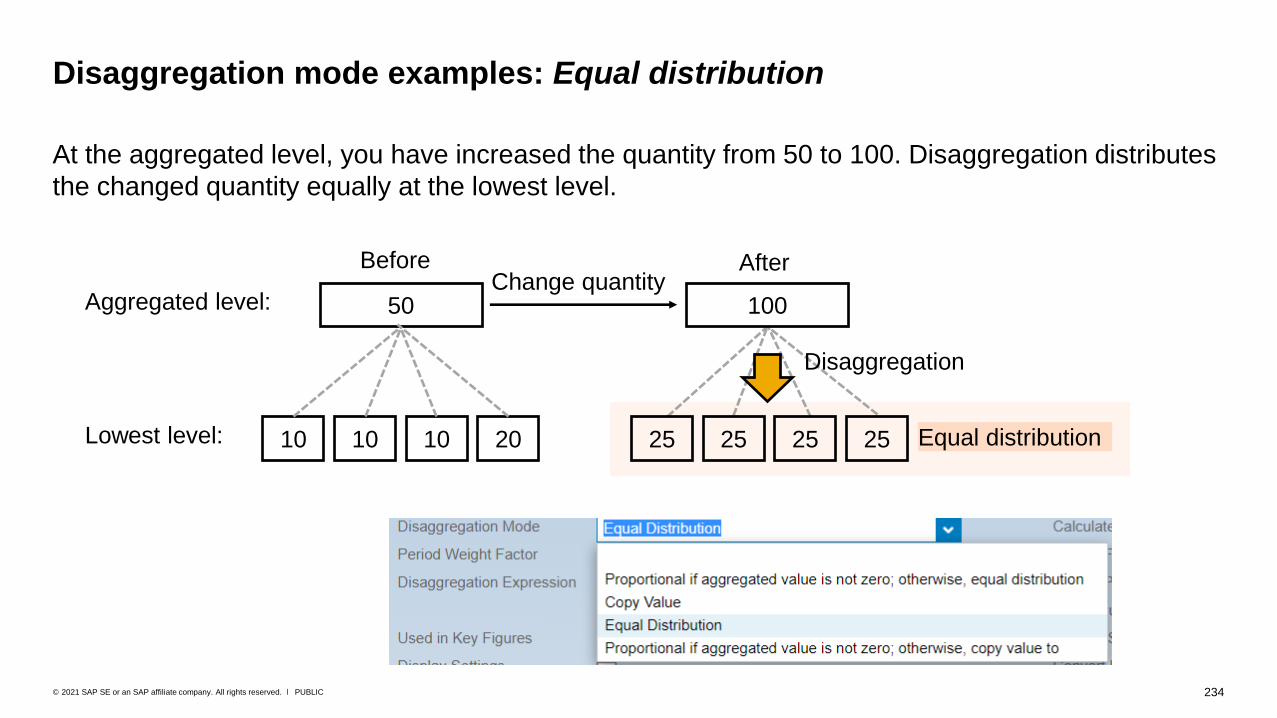
234PUBLIC© 2021 SAP SE or an SAP affiliate company. All rights reserved. ǀ
Disaggregation mode examples: Equal distribution
50Aggregated level: 100
10Lowest level: 10 10 20 25 25 25 25
Change quantity
Disaggregation
At the aggregated level, you have increased the quantity from 50 to 100. Disaggregation distributes
the changed quantity equally at the lowest level.
Before After
Equal distribution

235PUBLIC© 2021 SAP SE or an SAP affiliate company. All rights reserved. ǀ
Disaggregation mode examples: Proportional if aggregated value is not zero;
otherwise, equal distribution (1)
50Aggregated level: 100
10Lowest level: 10 10 20 20 20 20 40
Change quantity
Disaggregation
At the aggregated level, you have increased the quantity from 50 to 100. Since the initial
aggregated value was greater than 0 (50), disaggregation distributes the changed quantity
proportionally to the initial lowest-level values.
Before After
Proportional distribution
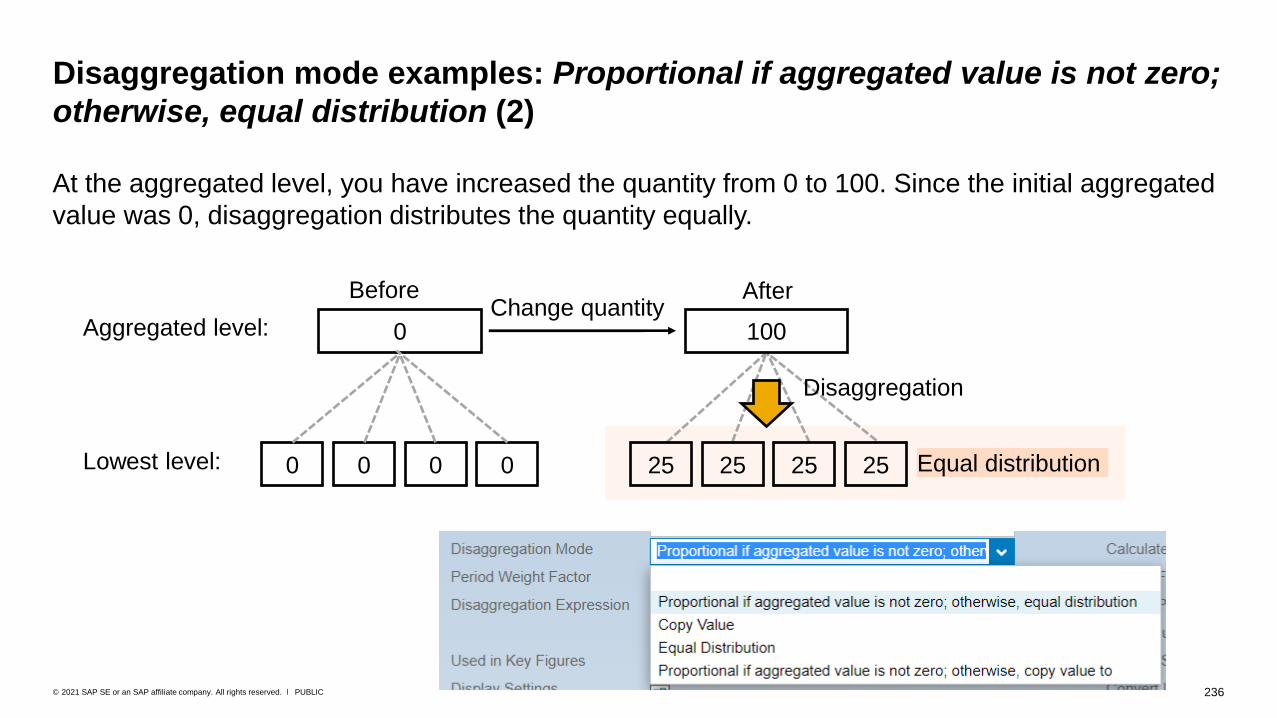
236PUBLIC© 2021 SAP SE or an SAP affiliate company. All rights reserved. ǀ
Disaggregation mode examples: Proportional if aggregated value is not zero;
otherwise, equal distribution (2)
0Aggregated level: 100
0Lowest level: 0 0 0 25 25 25 25
Change quantity
Disaggregation
At the aggregated level, you have increased the quantity from 0 to 100. Since the initial aggregated
value was 0, disaggregation distributes the quantity equally.
Before After
Equal distribution
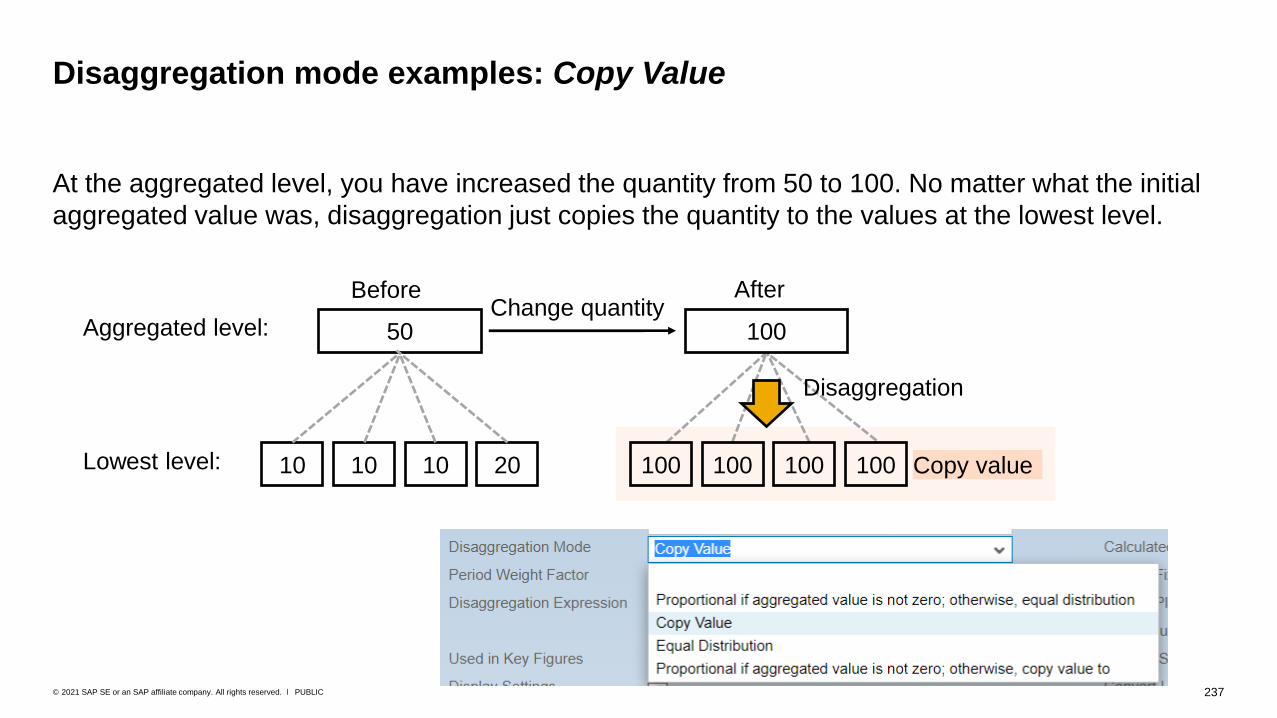
237PUBLIC© 2021 SAP SE or an SAP affiliate company. All rights reserved. ǀ
At the aggregated level, you have increased the quantity from 50 to 100. No matter what the initial
aggregated value was, disaggregation just copies the quantity to the values at the lowest level.
Disaggregation mode examples: Copy Value
50Aggregated level: 100
10Lowest level: 10 10 20
Change quantity
Disaggregation
Before After
Copy value100 100 100 100

238PUBLIC© 2021 SAP SE or an SAP affiliate company. All rights reserved. ǀ
At the aggregated level, you have increased the quantity from 50 to 100. Since the initial aggregated value was greater than 0 (50), disaggregation distributes the changed quantity proportionally to the initial lowest-level values.
Disaggregation mode examples: Proportional if aggregated value is not zero;
otherwise copy value to (1)
50Aggregated level: 100
10Lowest level: 10 10 20
Change quantity
Disaggregation
Before After
Proportional distribution20 20 20 40
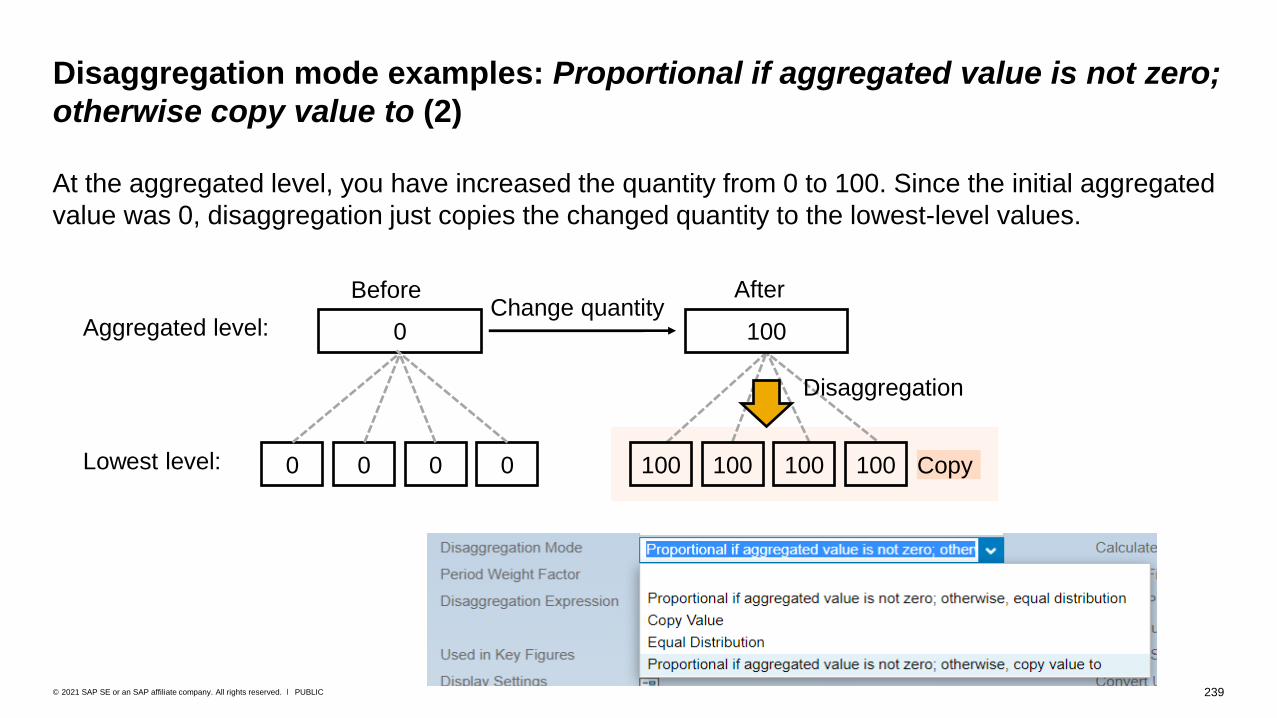
239PUBLIC© 2021 SAP SE or an SAP affiliate company. All rights reserved. ǀ
At the aggregated level, you have increased the quantity from 0 to 100. Since the initial aggregated
value was 0, disaggregation just copies the changed quantity to the lowest-level values.
Disaggregation mode examples: Proportional if aggregated value is not zero;
otherwise copy value to (2)
0Aggregated level: 100
0Lowest level: 0 0 0
Change quantity
Disaggregation
Before After
100 100 100 100 Copy

Read and Write Permissions and
Rejection of Changes
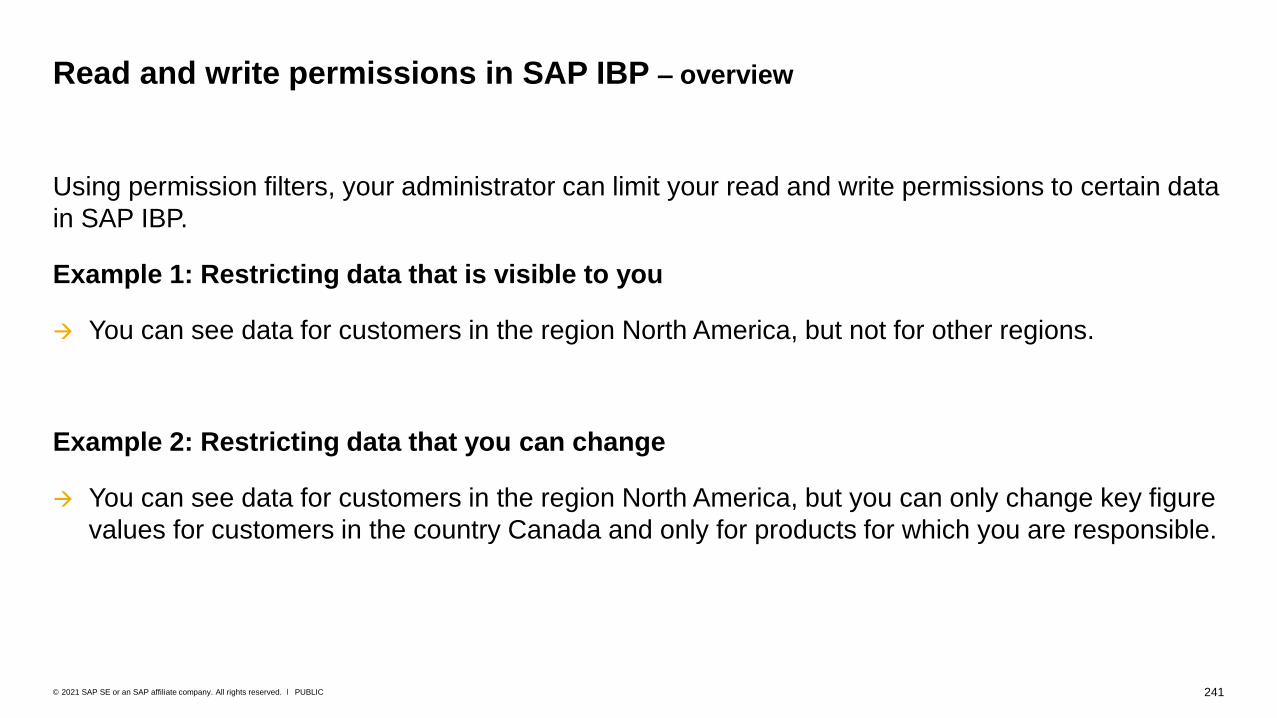
241PUBLIC© 2021 SAP SE or an SAP affiliate company. All rights reserved. ǀ
Using permission filters, your administrator can limit your read and write permissions to certain data
in SAP IBP.
Example 1: Restricting data that is visible to you
→ You can see data for customers in the region North America, but not for other regions.
Example 2: Restricting data that you can change
→ You can see data for customers in the region North America, but you can only change key figure
values for customers in the country Canada and only for products for which you are responsible.
Read and write permissions in SAP IBP – overview
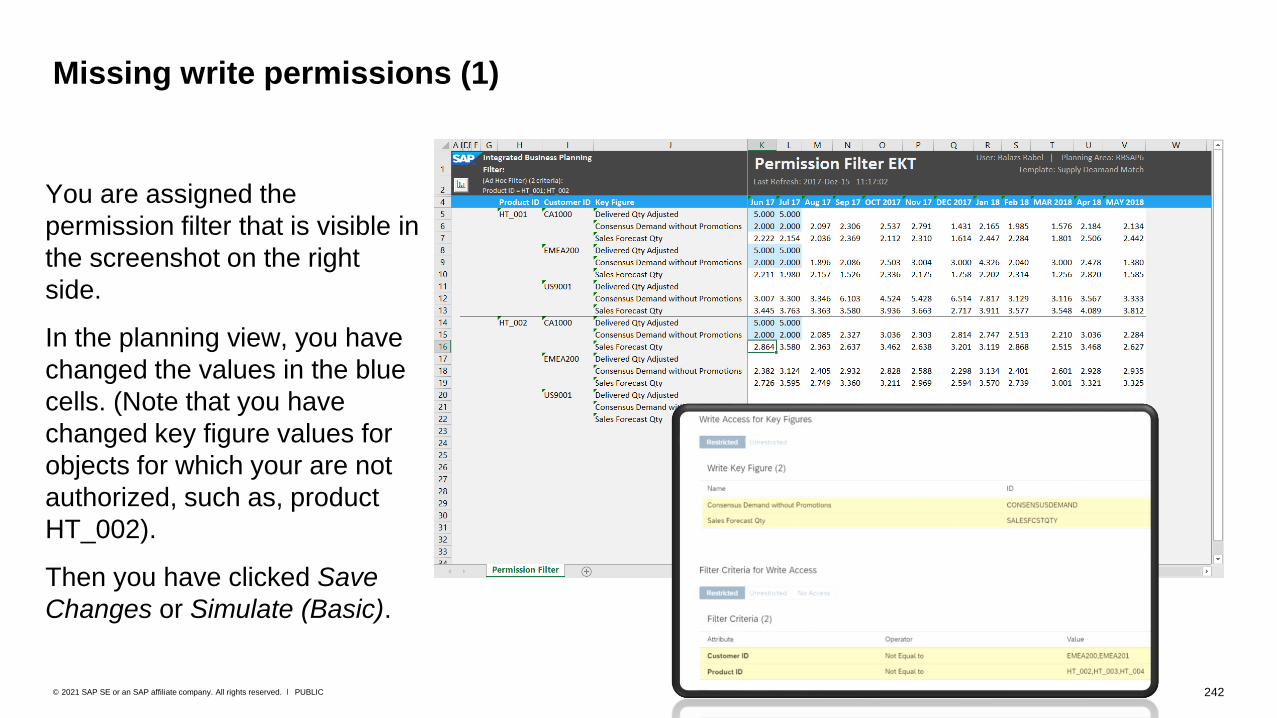
242PUBLIC© 2021 SAP SE or an SAP affiliate company. All rights reserved. ǀ
Missing write permissions (1)
You are assigned the
permission filter that is visible in
the screenshot on the right
side.
In the planning view, you have
changed the values in the blue
cells. (Note that you have
changed key figure values for
objects for which your are not
authorized, such as, product
HT_002).
Then you have clicked Save
Changes or Simulate (Basic).
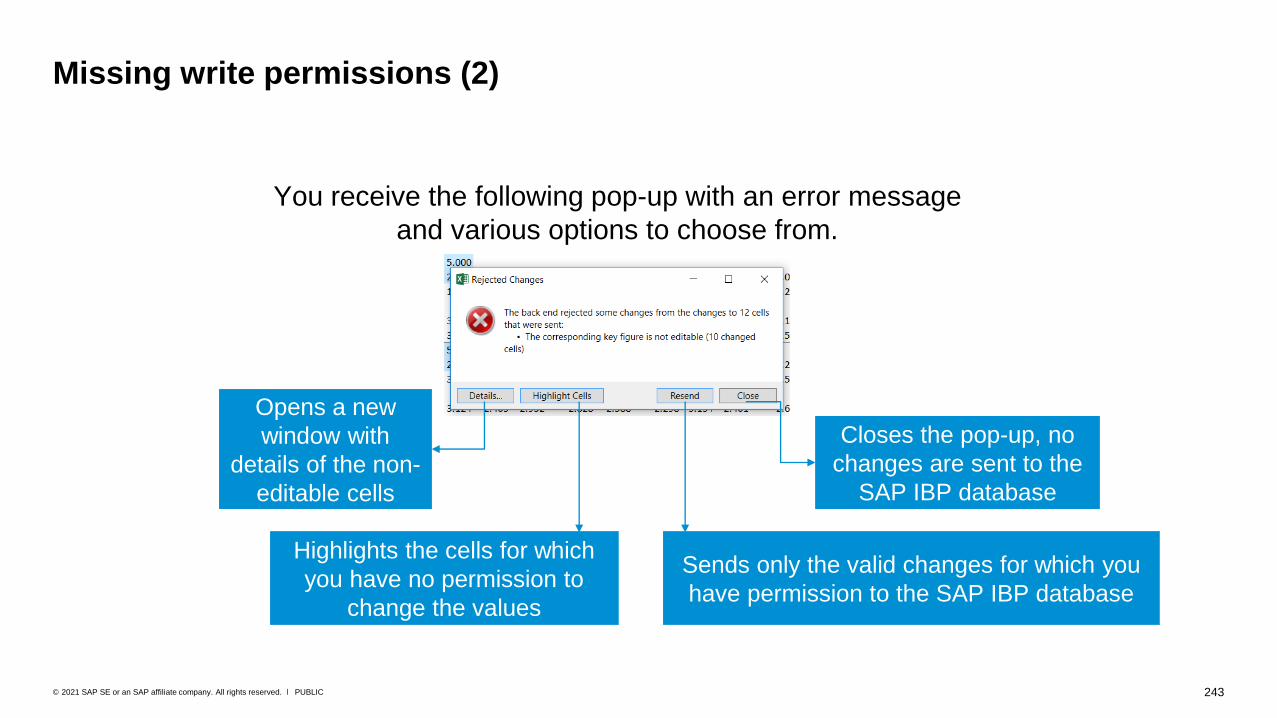
243PUBLIC© 2021 SAP SE or an SAP affiliate company. All rights reserved. ǀ
Missing write permissions (2)
You receive the following pop-up with an error message
and various options to choose from.
Closes the pop-up, no
changes are sent to the
SAP IBP database
Sends only the valid changes for which you
have permission to the SAP IBP database
Highlights the cells for which
you have no permission to
change the values
Opens a new
window with
details of the non-
editable cells
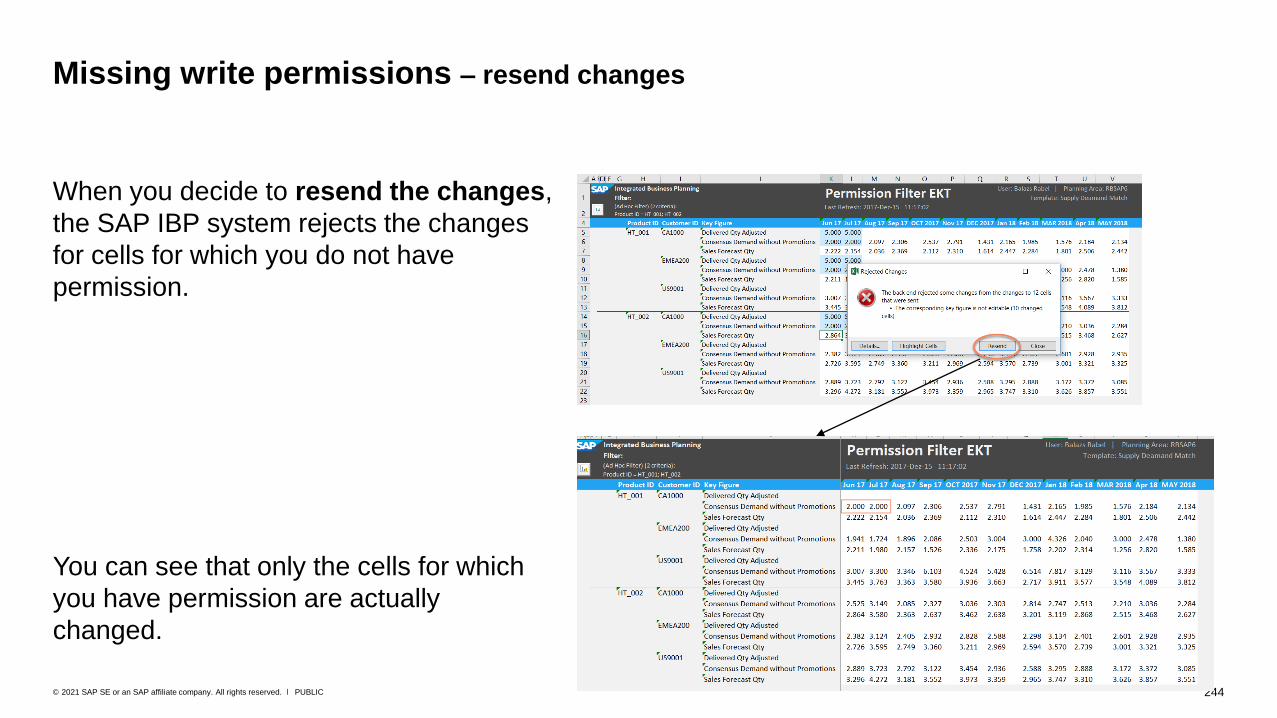
244PUBLIC© 2021 SAP SE or an SAP affiliate company. All rights reserved. ǀ
Missing write permissions – resend changes
When you decide to resend the changes,
the SAP IBP system rejects the changes
for cells for which you do not have
permission.
You can see that only the cells for which
you have permission are actually
changed.
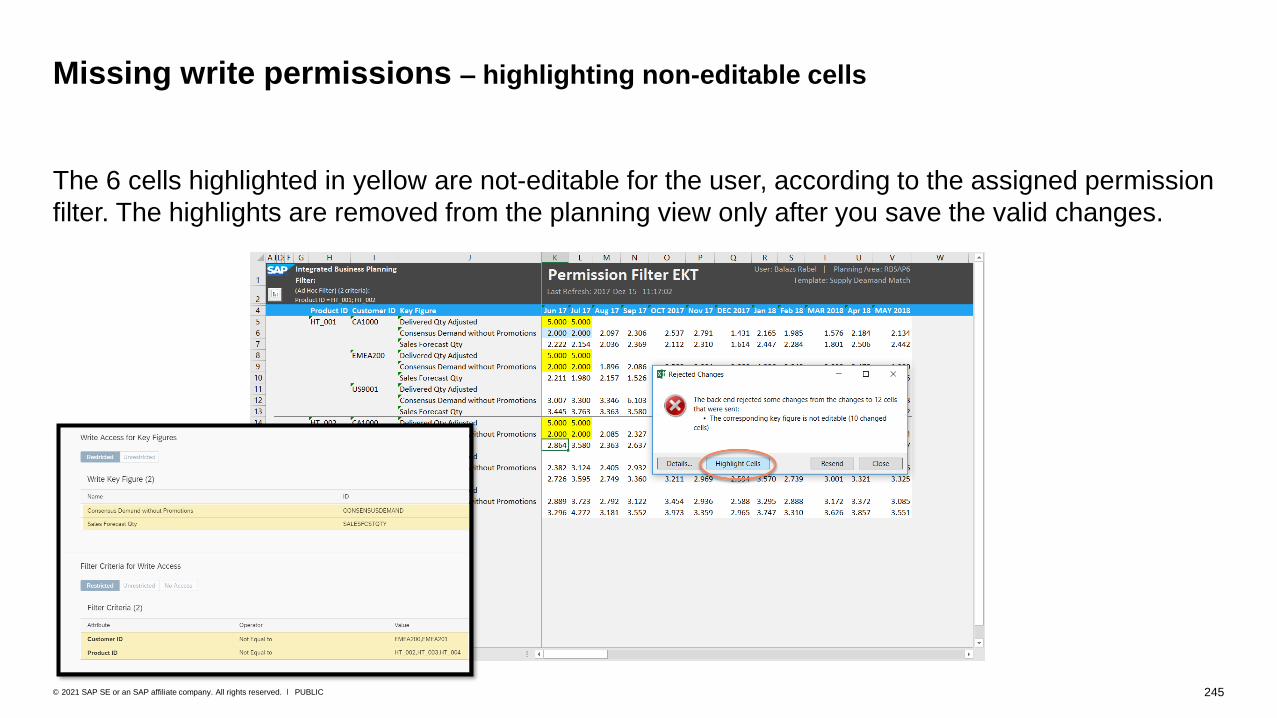
245PUBLIC© 2021 SAP SE or an SAP affiliate company. All rights reserved. ǀ
Missing write permissions – highlighting non-editable cells
The 6 cells highlighted in yellow are not-editable for the user, according to the assigned permission
filter. The highlights are removed from the planning view only after you save the valid changes.
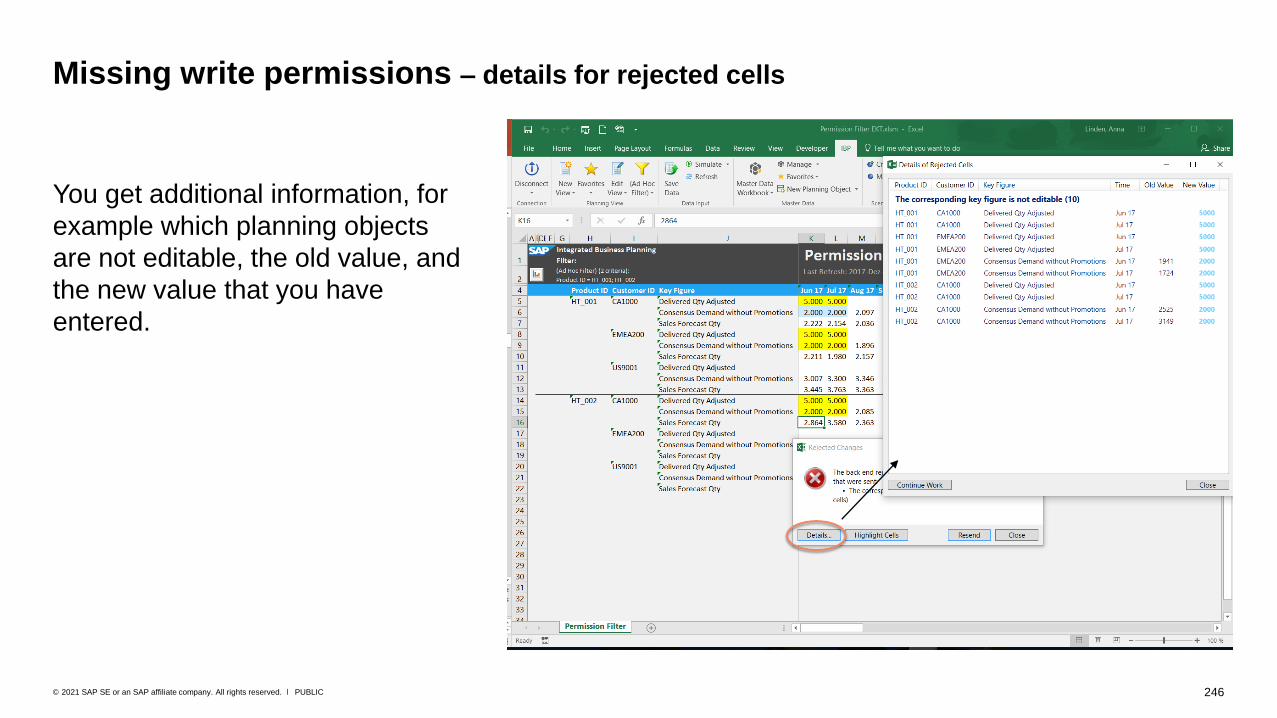
246PUBLIC© 2021 SAP SE or an SAP affiliate company. All rights reserved. ǀ
Missing write permissions – details for rejected cells
You get additional information, for
example which planning objects
are not editable, the old value, and
the new value that you have
entered.
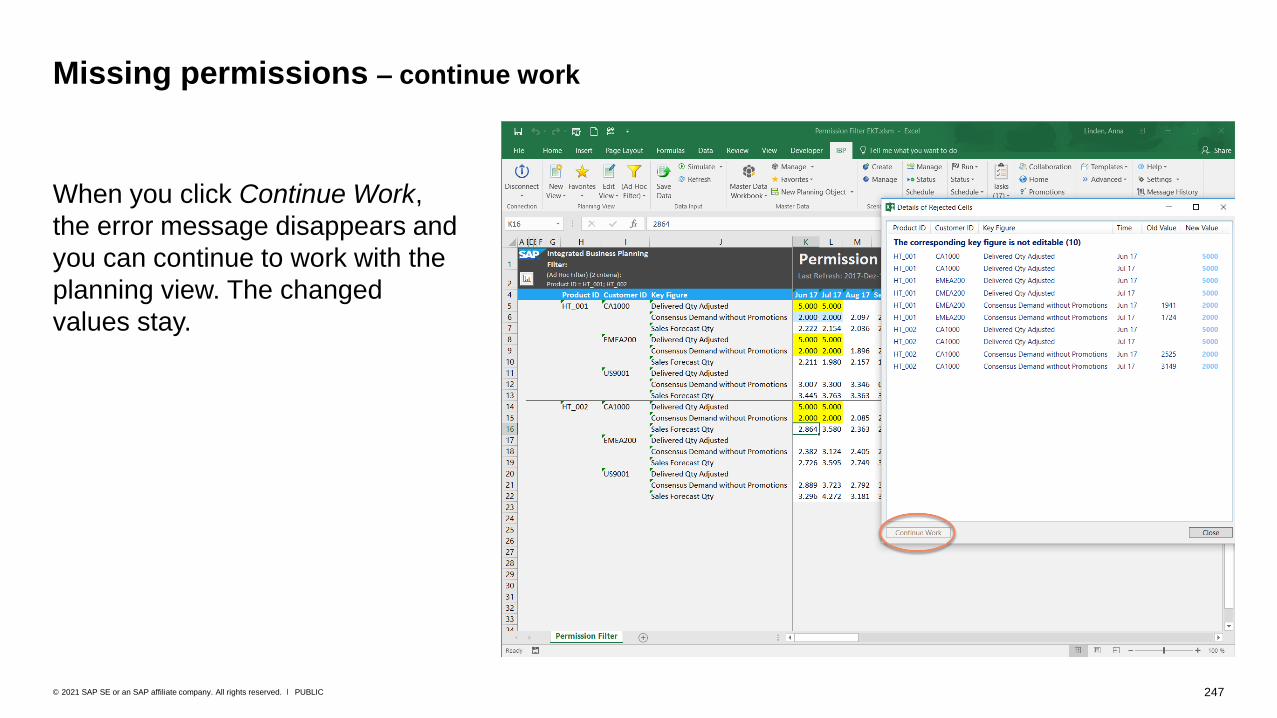
247PUBLIC© 2021 SAP SE or an SAP affiliate company. All rights reserved. ǀ
Missing permissions – continue work
When you click Continue Work,
the error message disappears and
you can continue to work with the
planning view. The changed
values stay.
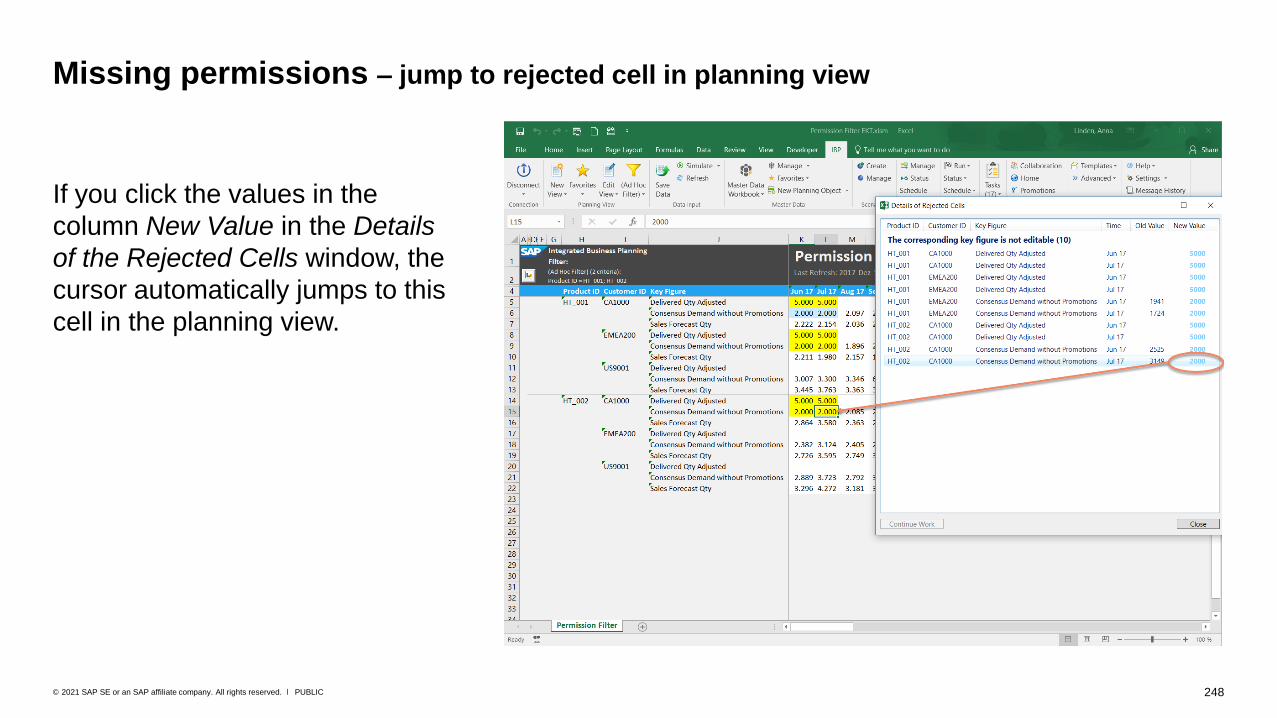
248PUBLIC© 2021 SAP SE or an SAP affiliate company. All rights reserved. ǀ
Missing permissions – jump to rejected cell in planning view
If you click the values in the
column New Value in the Details
of the Rejected Cells window, the
cursor automatically jumps to this
cell in the planning view.

Change History Views

250PUBLIC© 2021 SAP SE or an SAP affiliate company. All rights reserved. ǀ
Change history view – overview
You can review and analyze changes to the key figure data directly in the Excel add-in. The change
history view displays changes according to your selection. For example, it shows changes made in
a certain time period, by a specific user, or with a specific reason code.
Change History app
on the Web UI
Change history view in the
Excel add-in
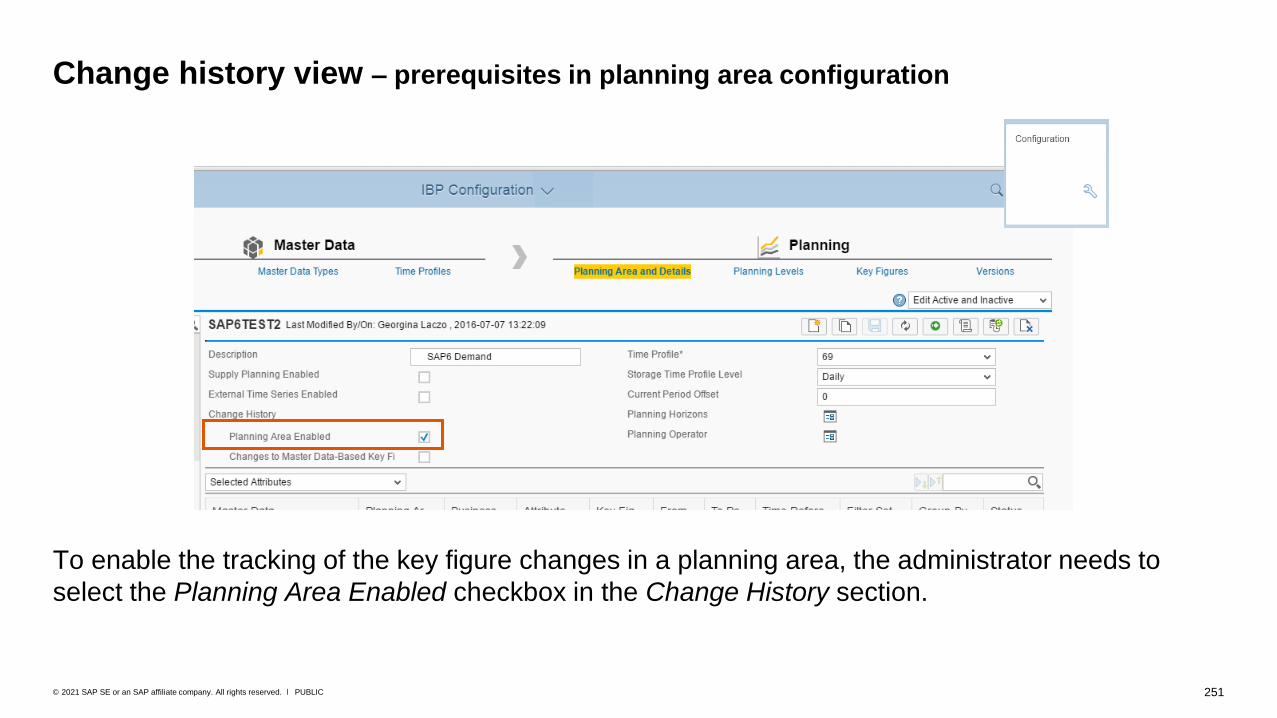
251PUBLIC© 2021 SAP SE or an SAP affiliate company. All rights reserved. ǀ
Change history view – prerequisites in planning area configuration
To enable the tracking of the key figure changes in a planning area, the administrator needs to
select the Planning Area Enabled checkbox in the Change History section.
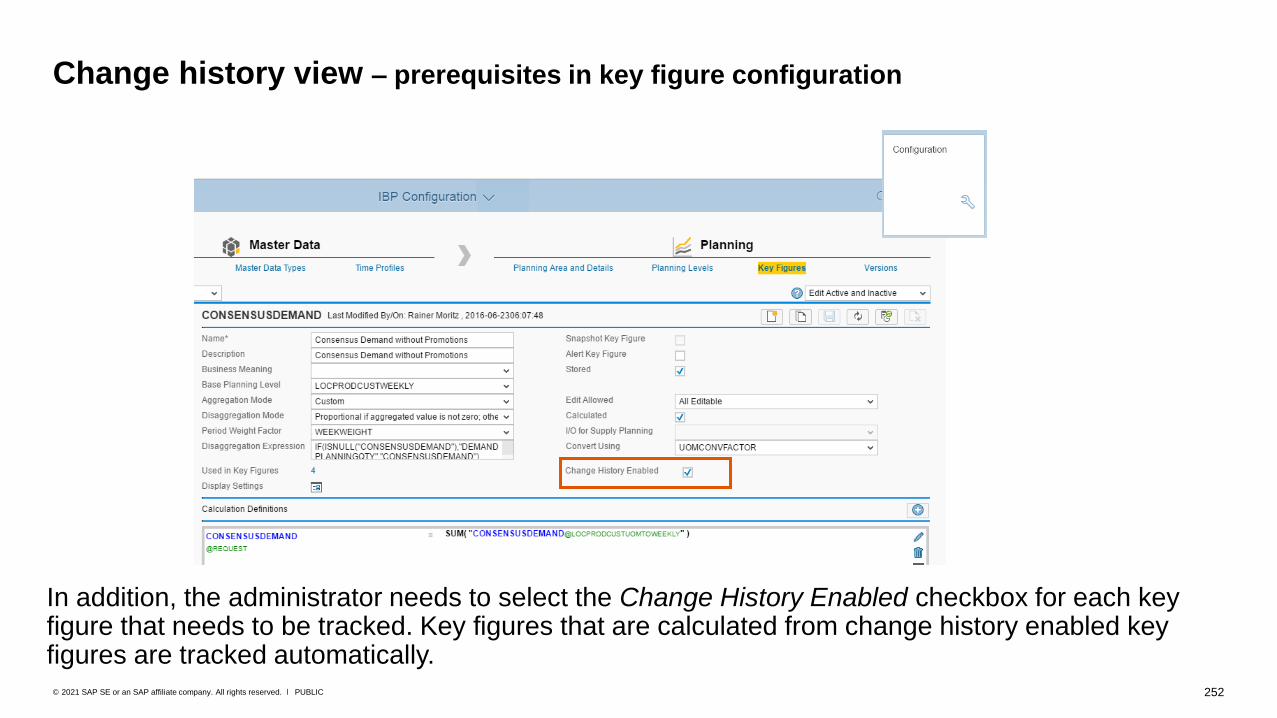
252PUBLIC© 2021 SAP SE or an SAP affiliate company. All rights reserved. ǀ
Change history view – prerequisites in key figure configuration
In addition, the administrator needs to select the Change History Enabled checkbox for each key figure that needs to be tracked. Key figures that are calculated from change history enabled key figures are tracked automatically.

253PUBLIC© 2021 SAP SE or an SAP affiliate company. All rights reserved. ǀ
Change history view – example
Key Figure Stored Calculated Change-history
enabled
Change history
visible in
Excel?
KF1 X X Yes Yes
KF2 X No No
KF3 X
(KF3 = KF1 * KF2)
No Yes
Key figure changes are tracked for KF3
because it is calculated from the change-history-
enabled key figure KF1.
Please be careful. The administrator needs to keep the performance aspects in mind. An
“accidental” mass tracking of key figures that are calculated from a change history enabled key
figure can have a negative impact on performance.

254PUBLIC© 2021 SAP SE or an SAP affiliate company. All rights reserved. ǀ
Change history view – settings
To define the change history view
from scratch in the Excel add-in,
open a blank worksheet and select
New View → Change History View on
Current Sheet.
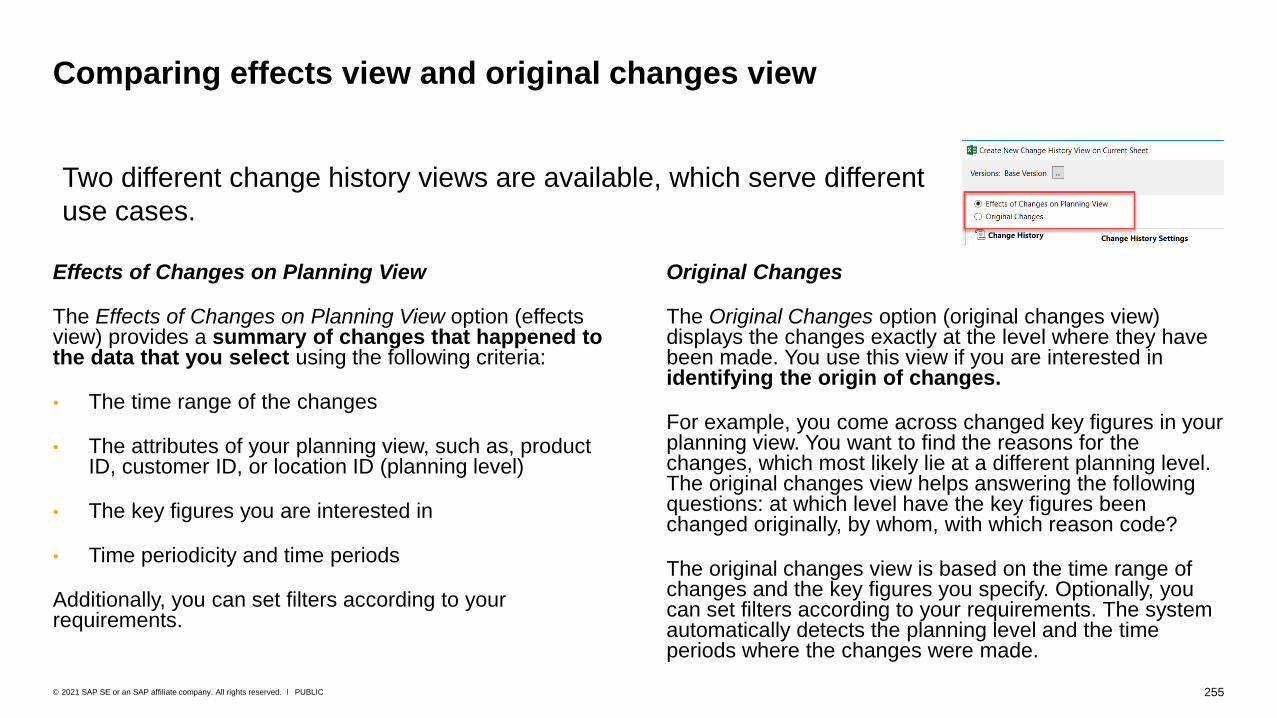
255PUBLIC© 2021 SAP SE or an SAP affiliate company. All rights reserved. ǀ
Original Changes
The Original Changes option (original changes view) displays the changes exactly at the level where they have been made. You use this view if you are interested in identifying the origin of changes.
For example, you come across changed key figures in your planning view. You want to find the reasons for the changes, which most likely lie at a different planning level. The original changes view helps answering the following questions: at which level have the key figures been changed originally, by whom, with which reason code?
The original changes view is based on the time range of changes and the key figures you specify. Optionally, you can set filters according to your requirements. The system automatically detects the planning level and the time periods where the changes were made.
Effects of Changes on Planning View
The Effects of Changes on Planning View option (effects view) provides a summary of changes that happened to the data that you select using the following criteria:
• The time range of the changes
• The attributes of your planning view, such as, product ID, customer ID, or location ID (planning level)
• The key figures you are interested in
• Time periodicity and time periods
Additionally, you can set filters according to your requirements.
Comparing effects view and original changes view
Two different change history views are available, which serve different
use cases.

256PUBLIC© 2021 SAP SE or an SAP affiliate company. All rights reserved. ǀ
Effects view – settings (1)
On the Change History tab, you can
determine the changes to be displayed as
follows:
• Changes that happened in a certain time
interval
• Changes identified by a certain change ID
(A change ID is a technical ID,
automatically created by the system, that
points to a specific change or set of
changes*. A change ID can include
multiple changed values: if a user changes
multiple values and clicks Save, one
change ID is assigned.)
In addition, you can define which values
should be shown, for example, only the value
before the change or the difference between
old and new value.
1
3
1
2
3
2
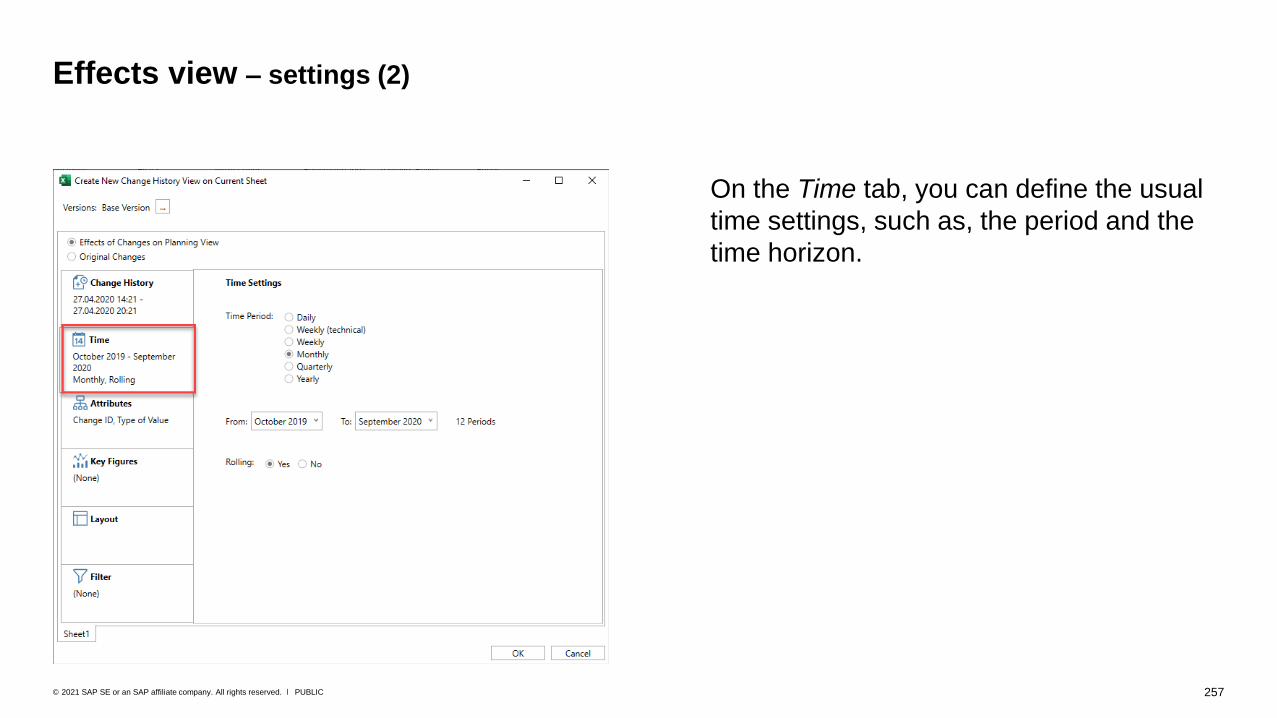
257PUBLIC© 2021 SAP SE or an SAP affiliate company. All rights reserved. ǀ
Effects view – settings (2)
On the Time tab, you can define the usual
time settings, such as, the period and the
time horizon.

258PUBLIC© 2021 SAP SE or an SAP affiliate company. All rights reserved. ǀ
Effects view – settings (3)
On the Planning Level tab, two attributes are
already preselected for a change history
view:
• Change ID
• Type of Value:
You need to add at least one additional
attribute to further structure the data within
the planning view, such as, the product
name.
The change ID is not mandatory and can be
deselected.
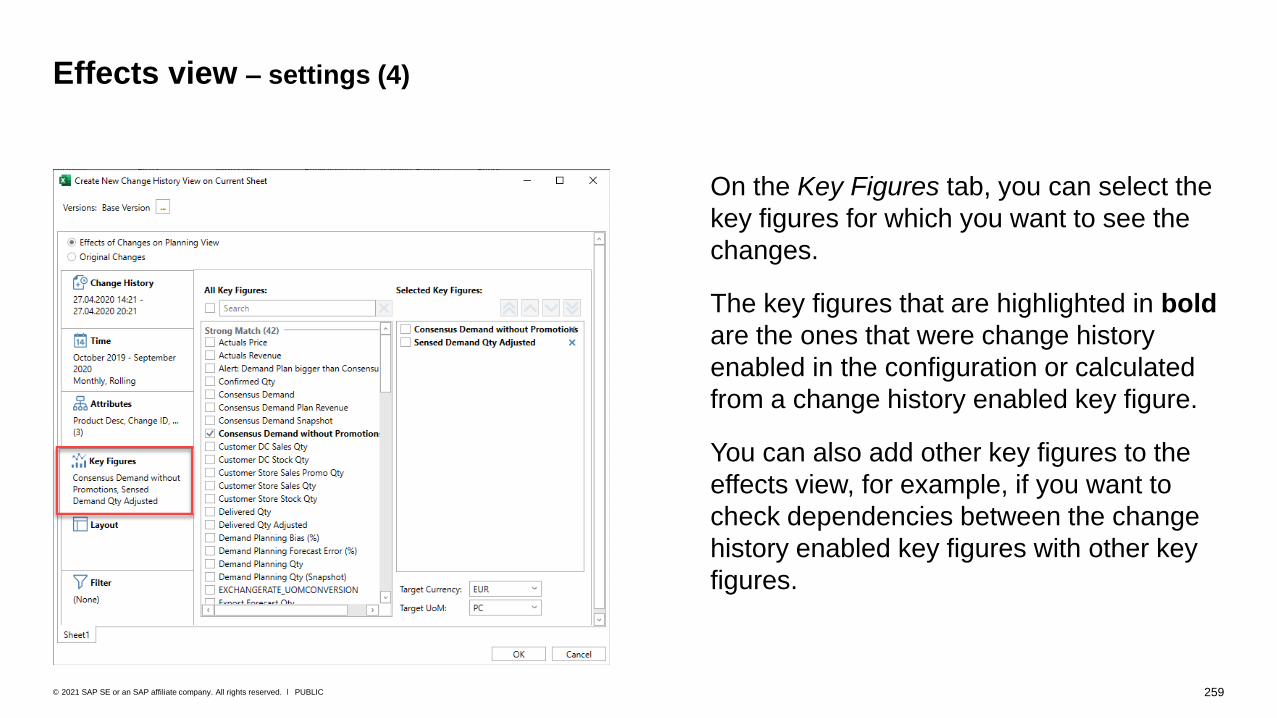
259PUBLIC© 2021 SAP SE or an SAP affiliate company. All rights reserved. ǀ
Effects view – settings (4)
On the Key Figures tab, you can select the
key figures for which you want to see the
changes.
The key figures that are highlighted in bold
are the ones that were change history
enabled in the configuration or calculated
from a change history enabled key figure.
You can also add other key figures to the
effects view, for example, if you want to
check dependencies between the change
history enabled key figures with other key
figures.
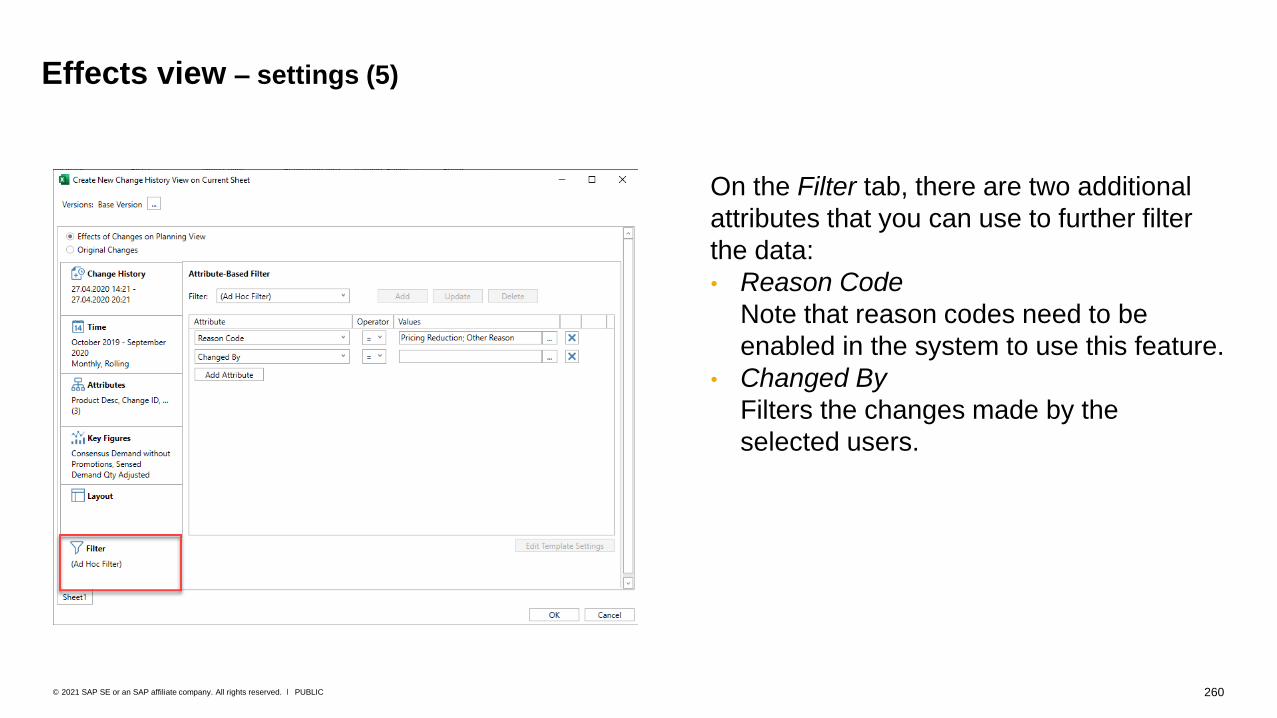
260PUBLIC© 2021 SAP SE or an SAP affiliate company. All rights reserved. ǀ
Effects view – settings (5)
On the Filter tab, there are two additional
attributes that you can use to further filter
the data:
• Reason Code
Note that reason codes need to be
enabled in the system to use this feature.
• Changed By
Filters the changes made by the
selected users.

261PUBLIC© 2021 SAP SE or an SAP affiliate company. All rights reserved. ǀ
Effects view – results visualization (1)

262PUBLIC© 2021 SAP SE or an SAP affiliate company. All rights reserved. ǀ
Effects view – results visualization (2)
The effects view includes a header and the results comparison:
• Header: shows the change IDs for which reason codes or comments are available. In addition,
the respective change date and time, user, reason code, and comment are listed.
• Results Comparison: lists the detailed change history of the data, grouped by your selected
attributes, the change ID, the type of the value (dependent on your settings), and the key figures.
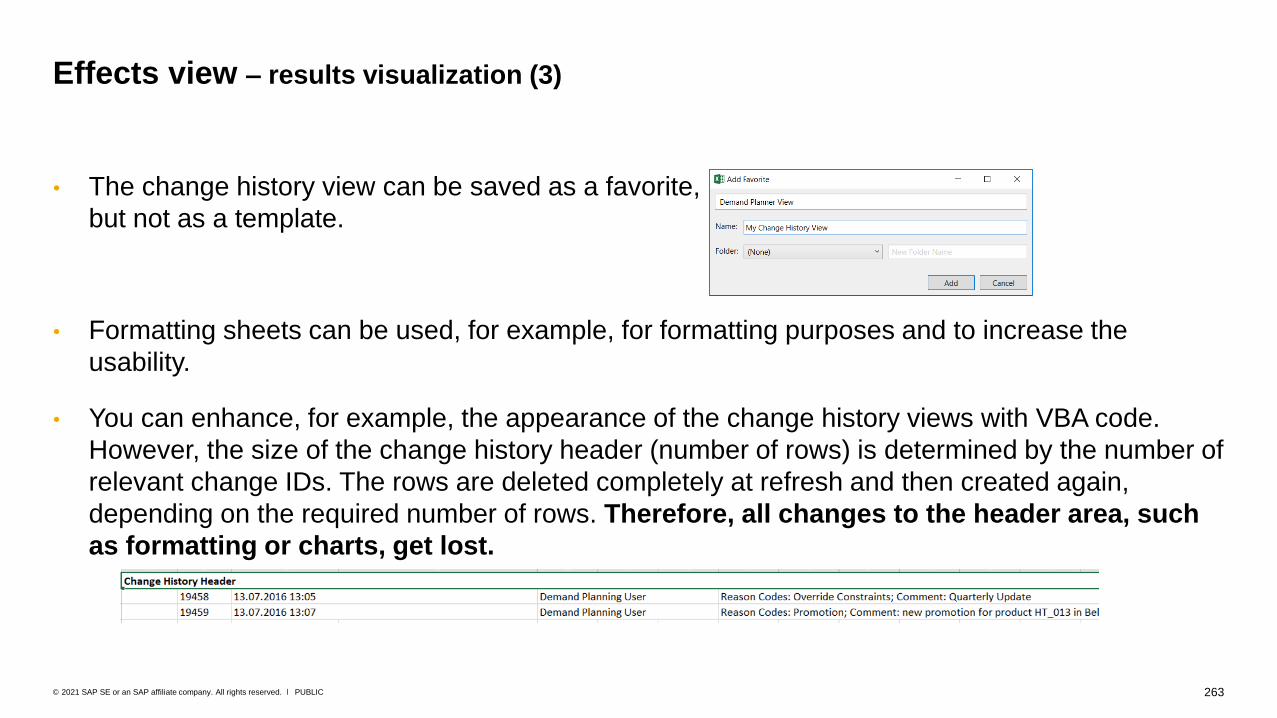
263PUBLIC© 2021 SAP SE or an SAP affiliate company. All rights reserved. ǀ
• The change history view can be saved as a favorite,
but not as a template.
• Formatting sheets can be used, for example, for formatting purposes and to increase the
usability.
• You can enhance, for example, the appearance of the change history views with VBA code.
However, the size of the change history header (number of rows) is determined by the number of
relevant change IDs. The rows are deleted completely at refresh and then created again,
depending on the required number of rows. Therefore, all changes to the header area, such
as formatting or charts, get lost.
Effects view – results visualization (3)
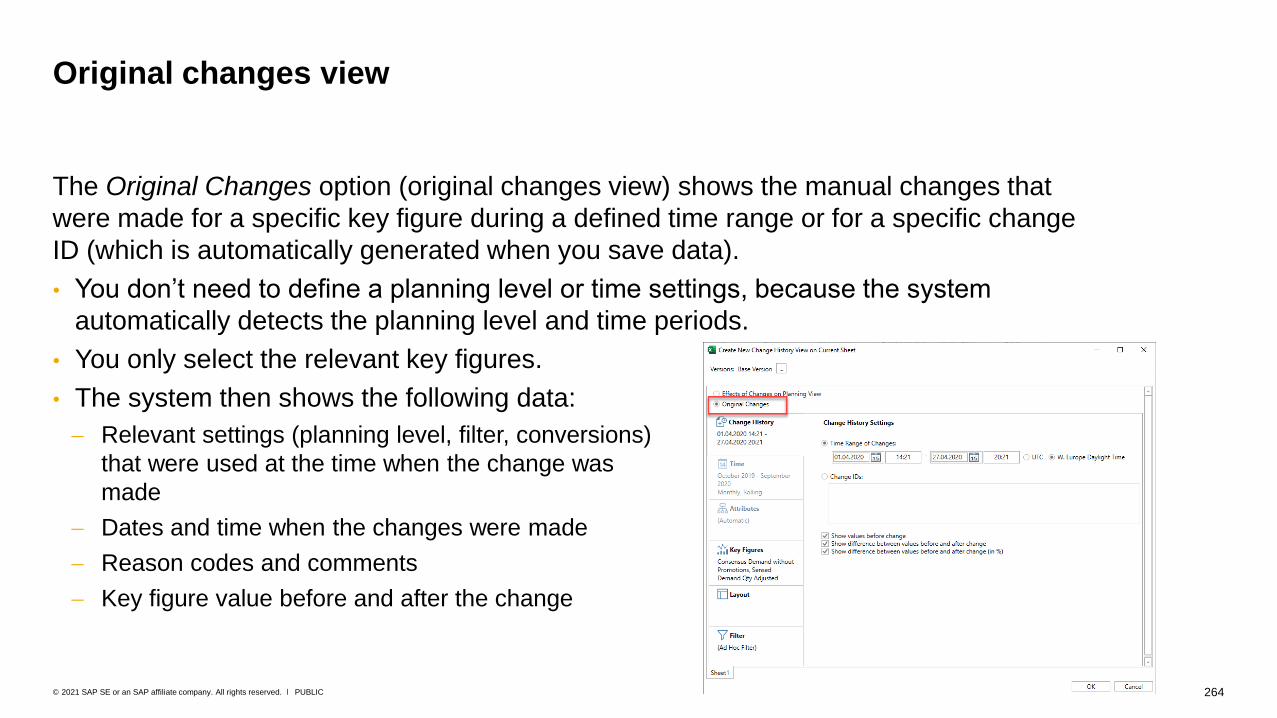
264PUBLIC© 2021 SAP SE or an SAP affiliate company. All rights reserved. ǀ
Original changes view
The Original Changes option (original changes view) shows the manual changes that
were made for a specific key figure during a defined time range or for a specific change
ID (which is automatically generated when you save data).
• You don’t need to define a planning level or time settings, because the system
automatically detects the planning level and time periods.
• You only select the relevant key figures.
• The system then shows the following data:
− Relevant settings (planning level, filter, conversions)
that were used at the time when the change was
made
− Dates and time when the changes were made
− Reason codes and comments
− Key figure value before and after the change

265PUBLIC© 2021 SAP SE or an SAP affiliate company. All rights reserved. ǀ
Original changes view – changes at a single planning level
Before saving, a user changes multiple key figure values at the same planning level. When saving, the
changes get assigned one change ID.
Example: User ABC changed values for two brands These changes get captured with the same change
ID 140685/1. That the changes happened at the same planning level is indicated by “/1”.

266PUBLIC© 2021 SAP SE or an SAP affiliate company. All rights reserved. ǀ
Original changes view – changes at multiple planning levels
Before saving, the user changes key figure values at different planning levels. When the planning view
is saved, the changes made at different planning levels get assigned different change IDs, one for each
planning level. Example:
• First the user ABC changes values at the level of Brand ID, Customer Desc., and Location Region,
and then uses Simulate (Basic).
• Then the user ABC changes the planning level (by adding Product ID) and changes data at this
planning level, before clicking Save.
The changes get assigned the change IDs 140690/1 and 140690/2. “/1” and “/2” indicate the two
different planning levels.
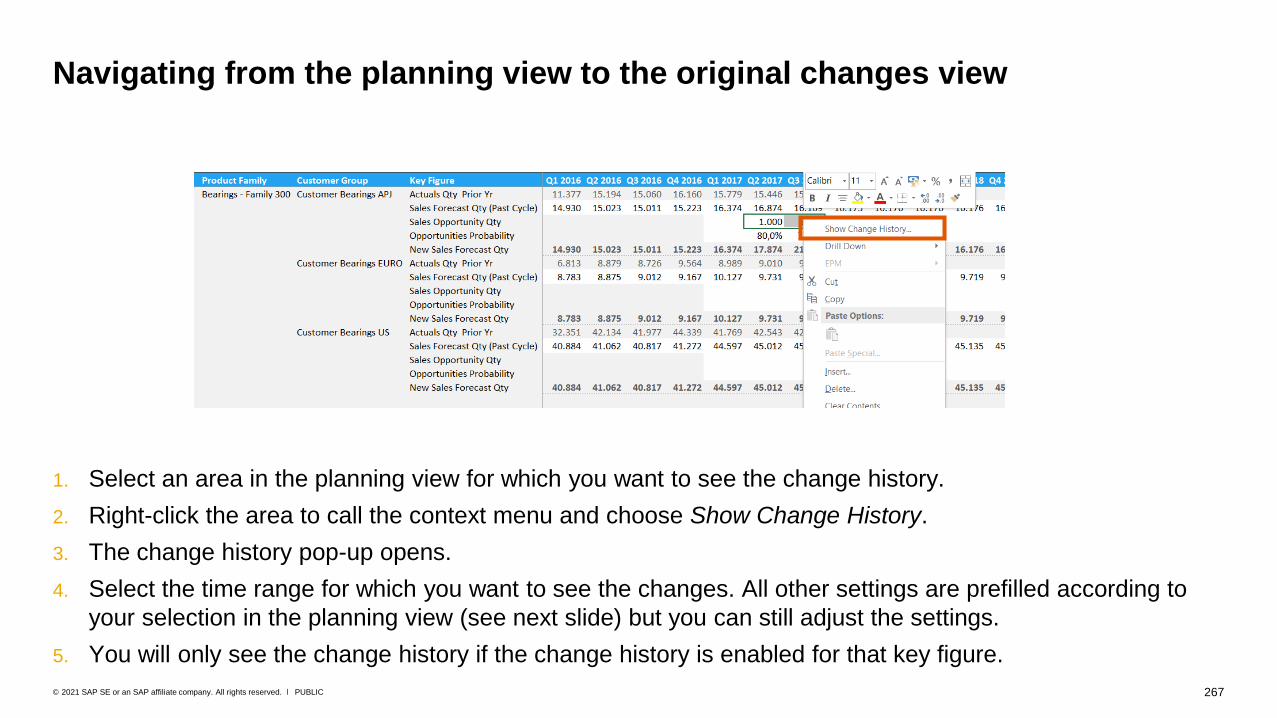
267PUBLIC© 2021 SAP SE or an SAP affiliate company. All rights reserved. ǀ
Navigating from the planning view to the original changes view
1. Select an area in the planning view for which you want to see the change history.
2. Right-click the area to call the context menu and choose Show Change History.
3. The change history pop-up opens.
4. Select the time range for which you want to see the changes. All other settings are prefilled according to
your selection in the planning view (see next slide) but you can still adjust the settings.
5. You will only see the change history if the change history is enabled for that key figure.

268PUBLIC© 2021 SAP SE or an SAP affiliate company. All rights reserved. ǀ
In some cases, you see more attribute combinations in the change history view than what you selected in the planning view.
Example: You select a range of cells that includes the following location products:
• Product PROD_001 at location LOC_001
• Product PROD_002 at location LOC_002.
The filter criteria for the change history get automatically prefilled with the following data:
• Product = PROD_001; PROD_002
• Location = LOC_001; LOC_002
With these filter criteria, the change history displays all location product combinations forPROD_001, PROD_002, LOC_001, and LOC_002.
Navigating from the planning view to the original changes view – filter
settings
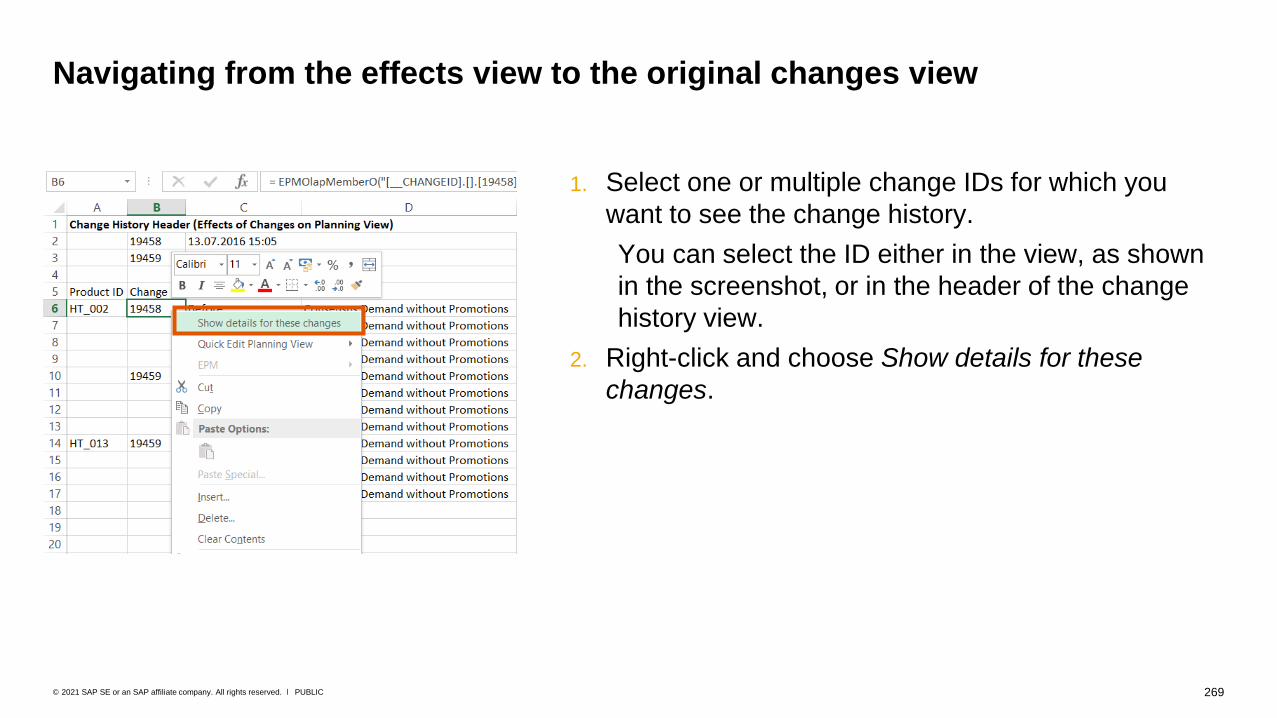
269PUBLIC© 2021 SAP SE or an SAP affiliate company. All rights reserved. ǀ
Navigating from the effects view to the original changes view
1. Select one or multiple change IDs for which you
want to see the change history.
You can select the ID either in the view, as shown
in the screenshot, or in the header of the change
history view.
2. Right-click and choose Show details for these
changes.

Working Offline with Planning Views
271PUBLIC© 2021 SAP SE or an SAP affiliate company. All rights reserved. ǀ
You can work offline with the SAP IBP planning views, and later save your data changes to the SAP
IBP database.
To do so, you can simply save the Microsoft Excel workbook to your local PC or share drive and
edit the key figure values. When you are done, you can open the workbook, logon to SAP IBP, and
save the data to the SAP IBP database.
Advantages
• You don‘t have to be online to edit data.
• You can send the offline file to your customers or suppliers so that they can review and update
the information.
Working offline with SAP IBP planning views – overview
272PUBLIC© 2021 SAP SE or an SAP affiliate company. All rights reserved. ǀ
• You are working with the local data. As long as you are working offline, you cannot get the latest data from the SAP IBP database. (Refresh is only available online).
• The same is true as for working online: if a colleague is changing the same data in the SAP IBP backend while you are working on it offline, you will not be informed about the changes they make. When you log on again and save the changes you made while working offline, you might overwrite the data entered by your colleague (last one wins).
• You must not change the master data attributes (such as names) in the offline version, as the SAP IBP system checks against these when saving and would not recognize them anymore.
• If the master data attributes you are using in your planning view are changed in the SAP IBP backend while you are working offline (for example, a product is renamed and you have the attribute product name with that product as part of your planning view), the system rejects all of your changes when you try to save.
• It is not recommended to perform mass changes to the planning view and save these at once, due to performance reasons.
• You cannot fix values or create planning notes while you are working offline. However, draft planning notes and fixing indicators that you have created but not saved before you logged off are not lost and you can save them later on when logged on again.
Working offline with SAP IBP planning views – details
Sharing Planning Views with Non-SAP-
IBP Users
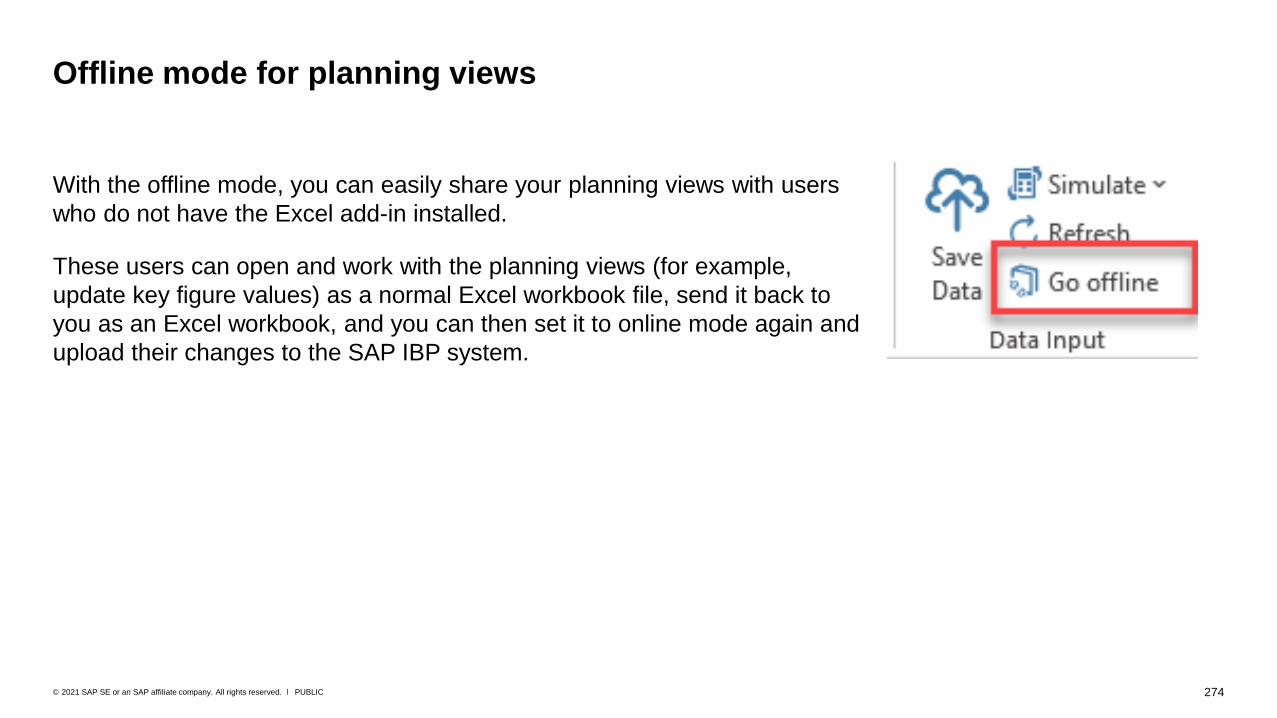
274PUBLIC© 2021 SAP SE or an SAP affiliate company. All rights reserved. ǀ
With the offline mode, you can easily share your planning views with users
who do not have the Excel add-in installed.
These users can open and work with the planning views (for example,
update key figure values) as a normal Excel workbook file, send it back to
you as an Excel workbook, and you can then set it to online mode again and
upload their changes to the SAP IBP system.
Offline mode for planning views
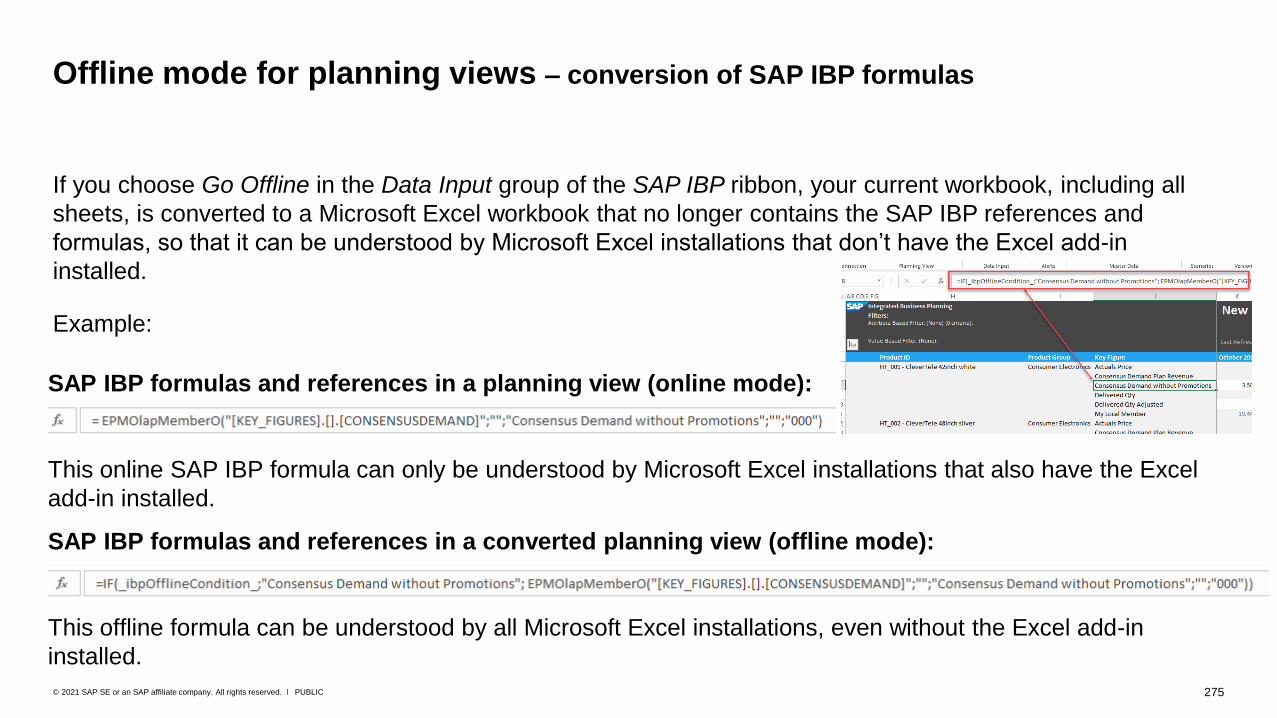
275PUBLIC© 2021 SAP SE or an SAP affiliate company. All rights reserved. ǀ
If you choose Go Offline in the Data Input group of the SAP IBP ribbon, your current workbook, including all
sheets, is converted to a Microsoft Excel workbook that no longer contains the SAP IBP references and
formulas, so that it can be understood by Microsoft Excel installations that don’t have the Excel add-in
installed.
Example:
Offline mode for planning views – conversion of SAP IBP formulas
SAP IBP formulas and references in a planning view (online mode):
This online SAP IBP formula can only be understood by Microsoft Excel installations that also have the Excel
add-in installed.
SAP IBP formulas and references in a converted planning view (offline mode):
This offline formula can be understood by all Microsoft Excel installations, even without the Excel add-in
installed.
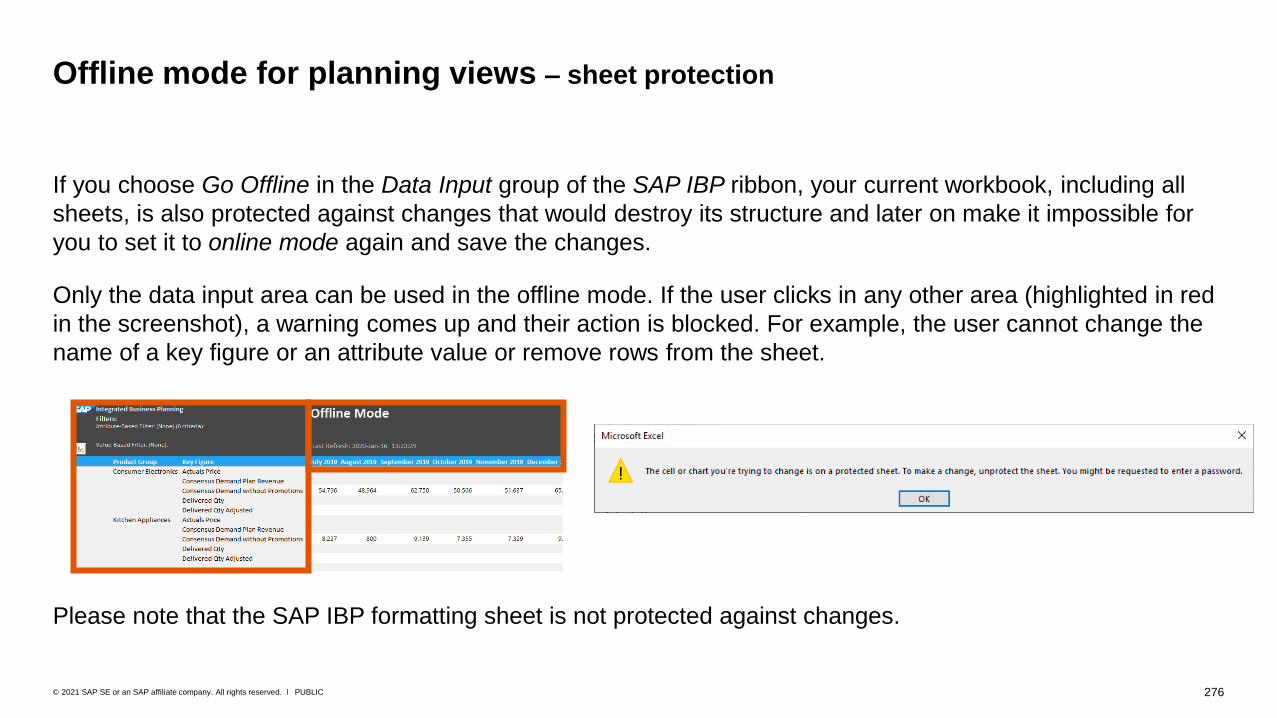
276PUBLIC© 2021 SAP SE or an SAP affiliate company. All rights reserved. ǀ
If you choose Go Offline in the Data Input group of the SAP IBP ribbon, your current workbook, including all
sheets, is also protected against changes that would destroy its structure and later on make it impossible for
you to set it to online mode again and save the changes.
Only the data input area can be used in the offline mode. If the user clicks in any other area (highlighted in red
in the screenshot), a warning comes up and their action is blocked. For example, the user cannot change the
name of a key figure or an attribute value or remove rows from the sheet.
Please note that the SAP IBP formatting sheet is not protected against changes.
Offline mode for planning views – sheet protection
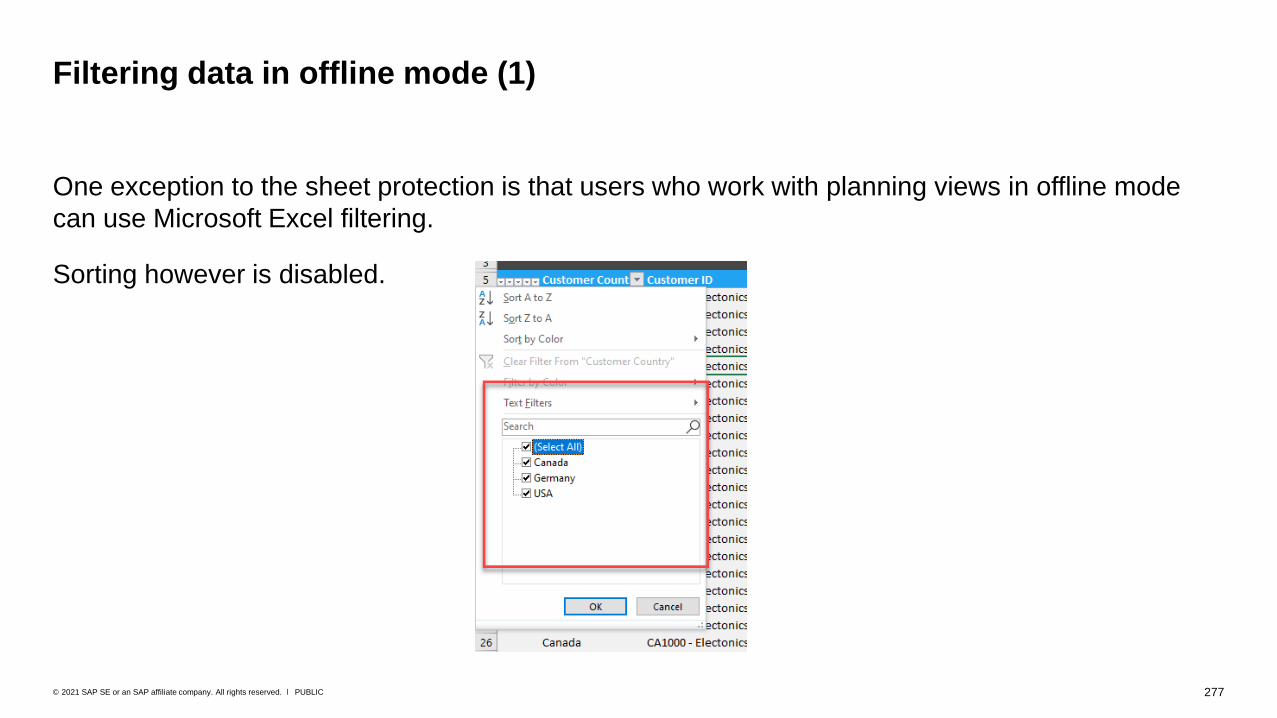
277PUBLIC© 2021 SAP SE or an SAP affiliate company. All rights reserved. ǀ
One exception to the sheet protection is that users who work with planning views in offline mode
can use Microsoft Excel filtering.
Sorting however is disabled.
Filtering data in offline mode (1)
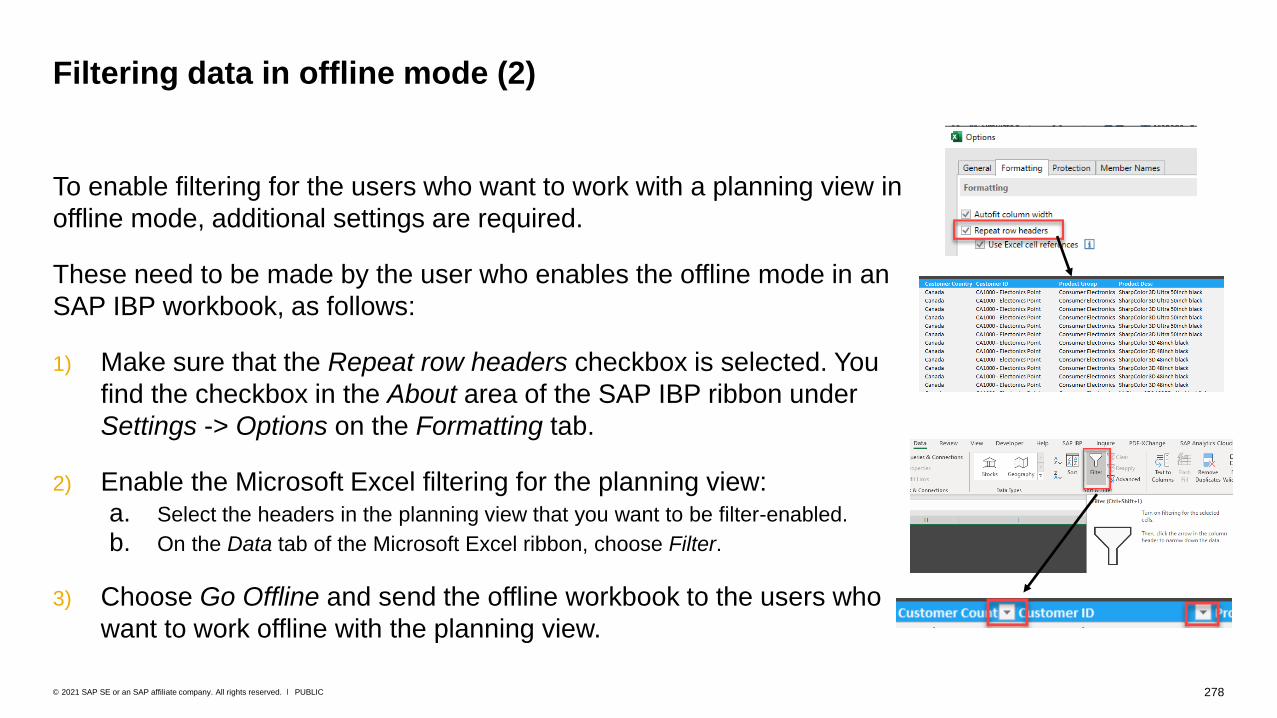
278PUBLIC© 2021 SAP SE or an SAP affiliate company. All rights reserved. ǀ
To enable filtering for the users who want to work with a planning view in
offline mode, additional settings are required.
These need to be made by the user who enables the offline mode in an
SAP IBP workbook, as follows:
1) Make sure that the Repeat row headers checkbox is selected. You
find the checkbox in the About area of the SAP IBP ribbon under
Settings -> Options on the Formatting tab.
2) Enable the Microsoft Excel filtering for the planning view: a. Select the headers in the planning view that you want to be filter-enabled.
b. On the Data tab of the Microsoft Excel ribbon, choose Filter.
3) Choose Go Offline and send the offline workbook to the users who
want to work offline with the planning view.
Filtering data in offline mode (2)
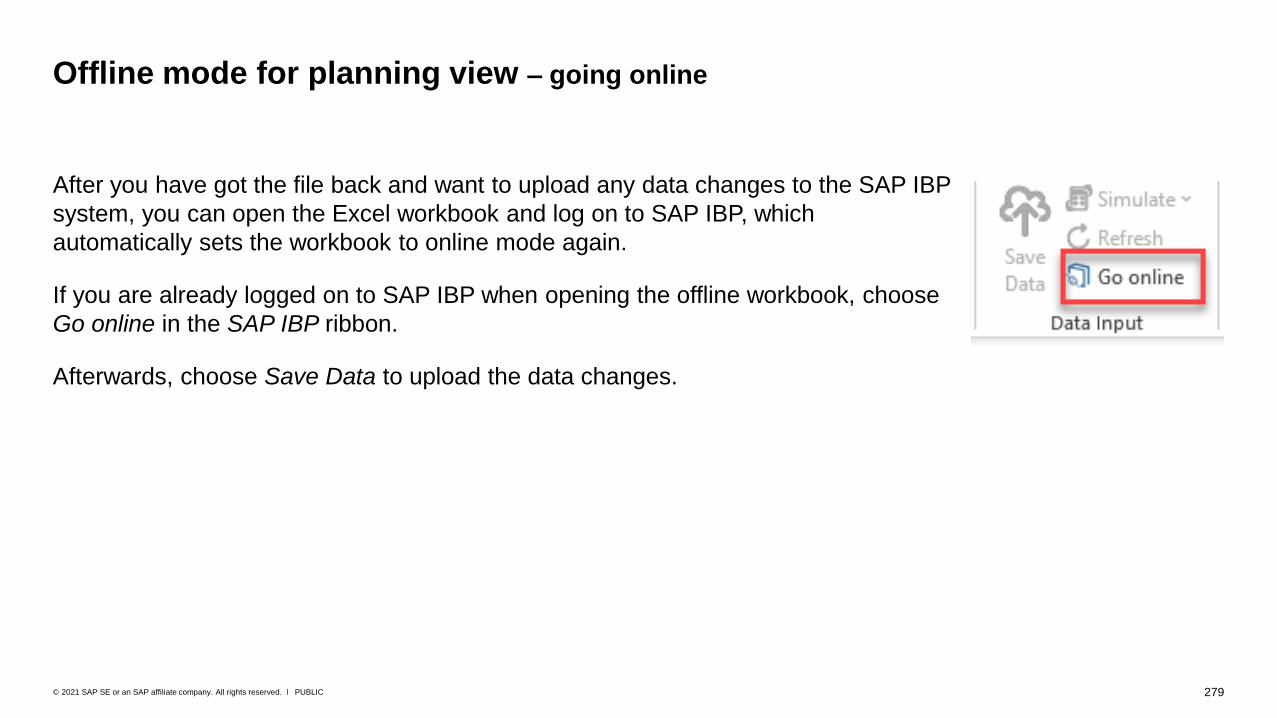
279PUBLIC© 2021 SAP SE or an SAP affiliate company. All rights reserved. ǀ
After you have got the file back and want to upload any data changes to the SAP IBP
system, you can open the Excel workbook and log on to SAP IBP, which
automatically sets the workbook to online mode again.
If you are already logged on to SAP IBP when opening the offline workbook, choose
Go online in the SAP IBP ribbon.
Afterwards, choose Save Data to upload the data changes.
Offline mode for planning view – going online

280PUBLIC© 2021 SAP SE or an SAP affiliate company. All rights reserved. ǀ
Only sheets with worksheet type SAP IBP will be set to offline mode when you use the Go Offline
feature on the SAP IBP ribbon.
If you are using Microsoft Excel workbooks that contain a mixture of SAP IBP and EPM worksheet
types, and want the EPM sheets to be set to offline mode as well, you also have to choose Offline
Mode on the EPM ribbon. Otherwise these sheets would stay online.
The same behavior applies when you want the workbook to go online again.
Offline mode for planning views
Using the offline mode in mixed workbooks with SAP IBP and EPM sheet types
Application Jobs

282PUBLIC© 2021 SAP SE or an SAP affiliate company. All rights reserved. ǀ
Planning algorithms and other tasks can be run as background jobs in SAP IBP.
Usually, these background jobs are scheduled by a central team (administrators or configuration experts), but there are also uses cases where planners can rerun or schedule them manually in the Excel add-in. Example: Demand planning is done every month. At the beginning of the month, the statistical forecasting jobs are run automatically. After that, the sales and marketing colleagues add their information to the forecast.
Background jobs can perform different planning tasks. Some are used more for housekeeping purposes. Examples:
• Copy and disaggregate key figures
• Inventory optimization
• Statistical forecasting
• Forecast error calculation
• Time-series-based supply planning (using the heuristic or the optimizer)
• ABC/XYZ segmentation
• Deployment run or confirmation run in order-based planning
• Realignment of planning data
• Taking snapshots
• Purging key figure data
Application jobs in SAP IBP
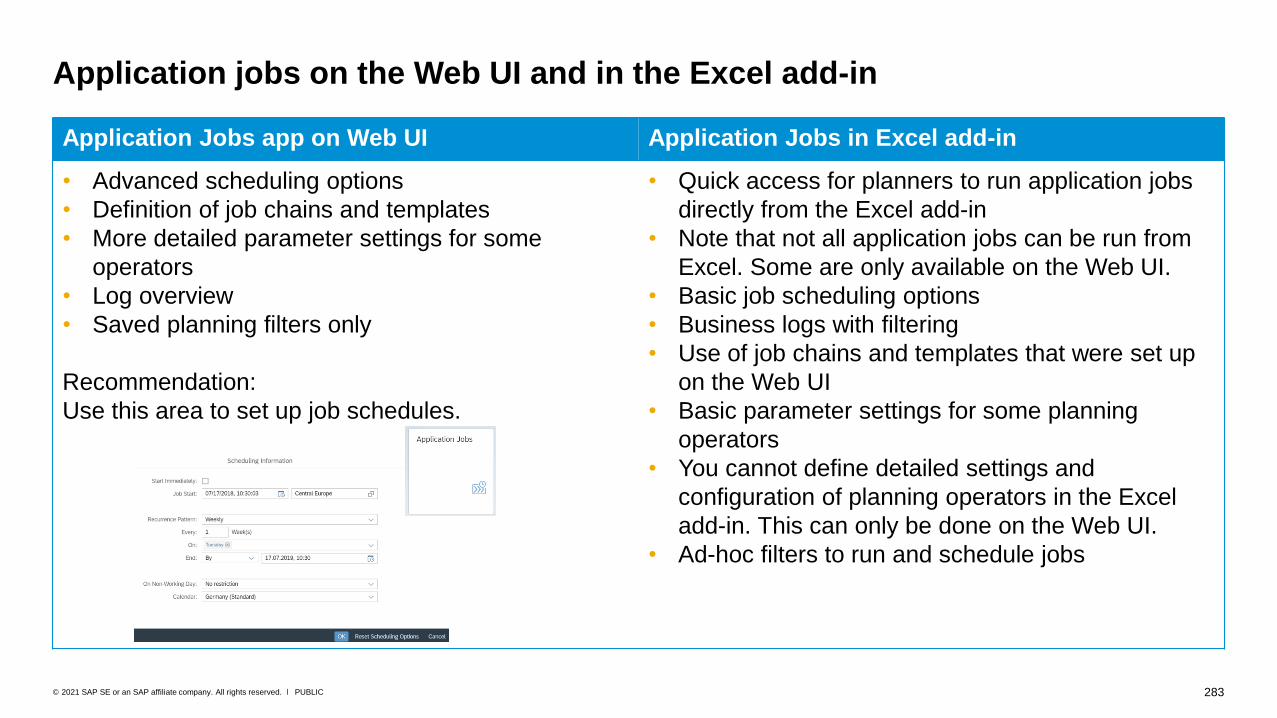
283PUBLIC© 2021 SAP SE or an SAP affiliate company. All rights reserved. ǀ
Application Jobs app on Web UI Application Jobs in Excel add-in
• Advanced scheduling options
• Definition of job chains and templates
• More detailed parameter settings for some
operators
• Log overview
• Saved planning filters only
Recommendation:
Use this area to set up job schedules.
• Quick access for planners to run application jobs
directly from the Excel add-in
• Note that not all application jobs can be run from
Excel. Some are only available on the Web UI.
• Basic job scheduling options
• Business logs with filtering
• Use of job chains and templates that were set up
on the Web UI
• Basic parameter settings for some planning
operators
• You cannot define detailed settings and
configuration of planning operators in the Excel
add-in. This can only be done on the Web UI.
• Ad-hoc filters to run and schedule jobs
Application jobs on the Web UI and in the Excel add-in
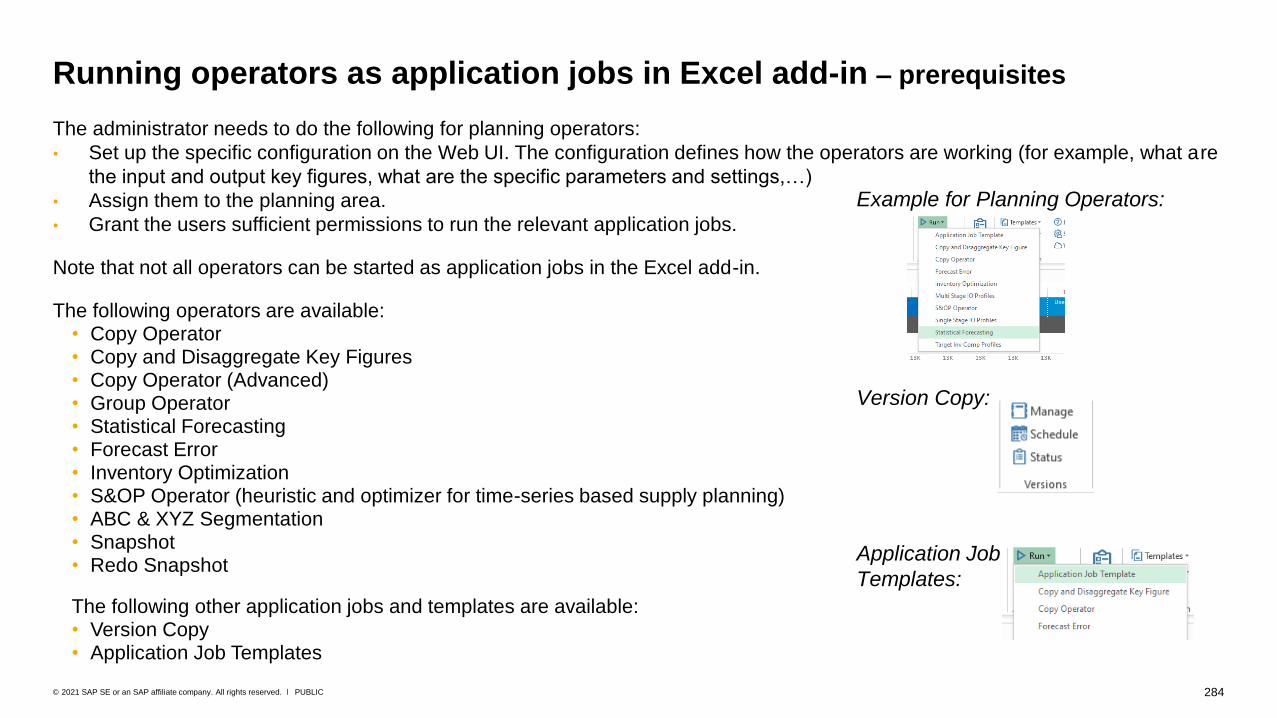
284PUBLIC© 2021 SAP SE or an SAP affiliate company. All rights reserved. ǀ
The administrator needs to do the following for planning operators:
• Set up the specific configuration on the Web UI. The configuration defines how the operators are working (for example, what are
the input and output key figures, what are the specific parameters and settings,…)
• Assign them to the planning area.
• Grant the users sufficient permissions to run the relevant application jobs.
Note that not all operators can be started as application jobs in the Excel add-in.
The following operators are available: • Copy Operator • Copy and Disaggregate Key Figures• Copy Operator (Advanced)• Group Operator• Statistical Forecasting• Forecast Error• Inventory Optimization• S&OP Operator (heuristic and optimizer for time-series based supply planning)• ABC & XYZ Segmentation• Snapshot • Redo Snapshot
The following other application jobs and templates are available:• Version Copy• Application Job Templates
Running operators as application jobs in Excel add-in – prerequisites
Example for Planning Operators:
Version Copy:
Application Job
Templates:

285PUBLIC© 2021 SAP SE or an SAP affiliate company. All rights reserved. ǀ
Your administrator can also define application job templates in the SAP IBP backend and make
them available in the Excel add-in. These templates can consist of different steps and operators
(job chains, for example) and can also contain operators that you can normally not start directly
from the Excel add-in, such as, operators for order-based planning, data integration via CPI-DS,
and more.
However, you cannot freely define any settings (such as, scenarios or horizons) for these templates
but have to reuse the settings that the administrator made when setting up the template.
Running application job templates in the Excel add-in
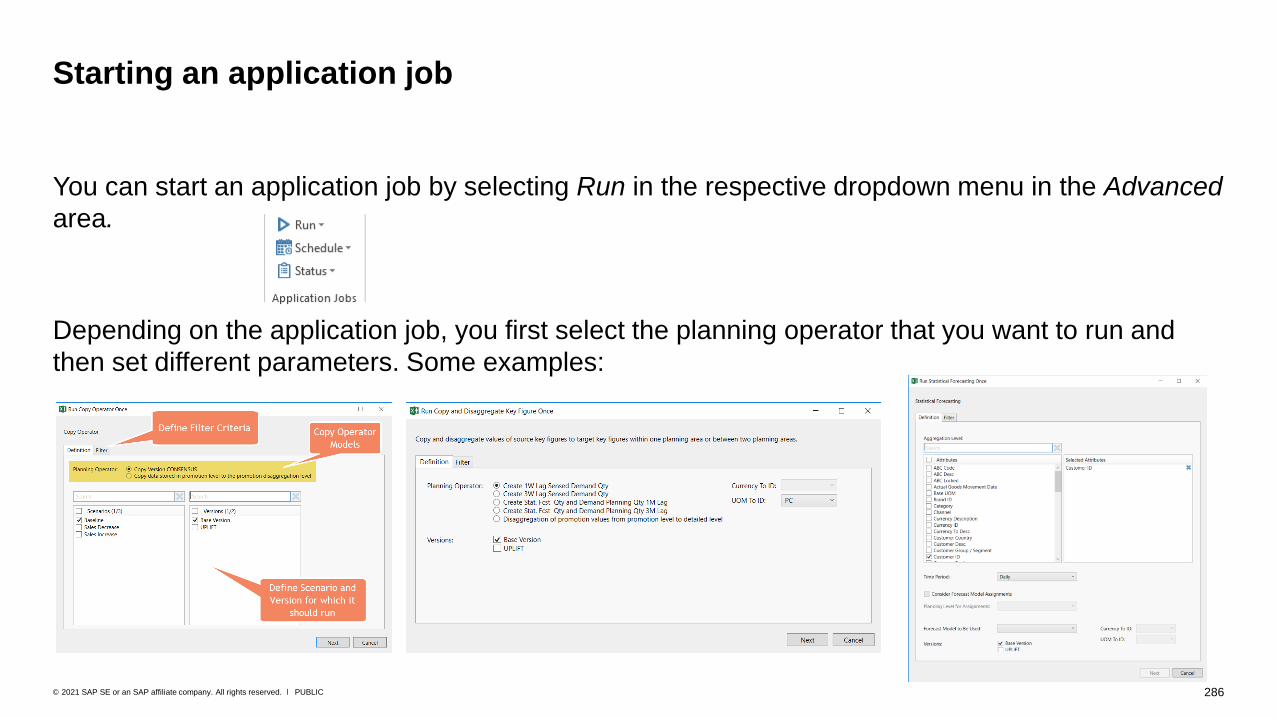
286PUBLIC© 2021 SAP SE or an SAP affiliate company. All rights reserved. ǀ
You can start an application job by selecting Run in the respective dropdown menu in the Advanced
area.
Depending on the application job, you first select the planning operator that you want to run and
then set different parameters. Some examples:
Starting an application job

287PUBLIC© 2021 SAP SE or an SAP affiliate company. All rights reserved. ǀ
A subnetwork (previously also called planning unit) is a subsection of the overall supply chain
network for which a planner is responsible or that the planner wants to plan in a separate planning
run (for example, all location products in a particular region or all location products in a particular
product group).
Similar to the master data model for the entire supply chain network, a subnetwork consists of
nodes (that is, location products) and arcs (which are used to model the transport links between the
location products). You define the subnetwork to which a location product belongs in the location
product master data. You can define subnetworks for product groups or regions, or for any other
property of locations, products, or location products.
When you start a planning session, you select one or more subnetworks that are to be taken into
account by the planning algorithm. This defines the set of location products that are to be planned.
Subnetworks are relevant (but not mandatory) for inventory optimization and time-series based
supply planning operators.
Subnetwork – overview
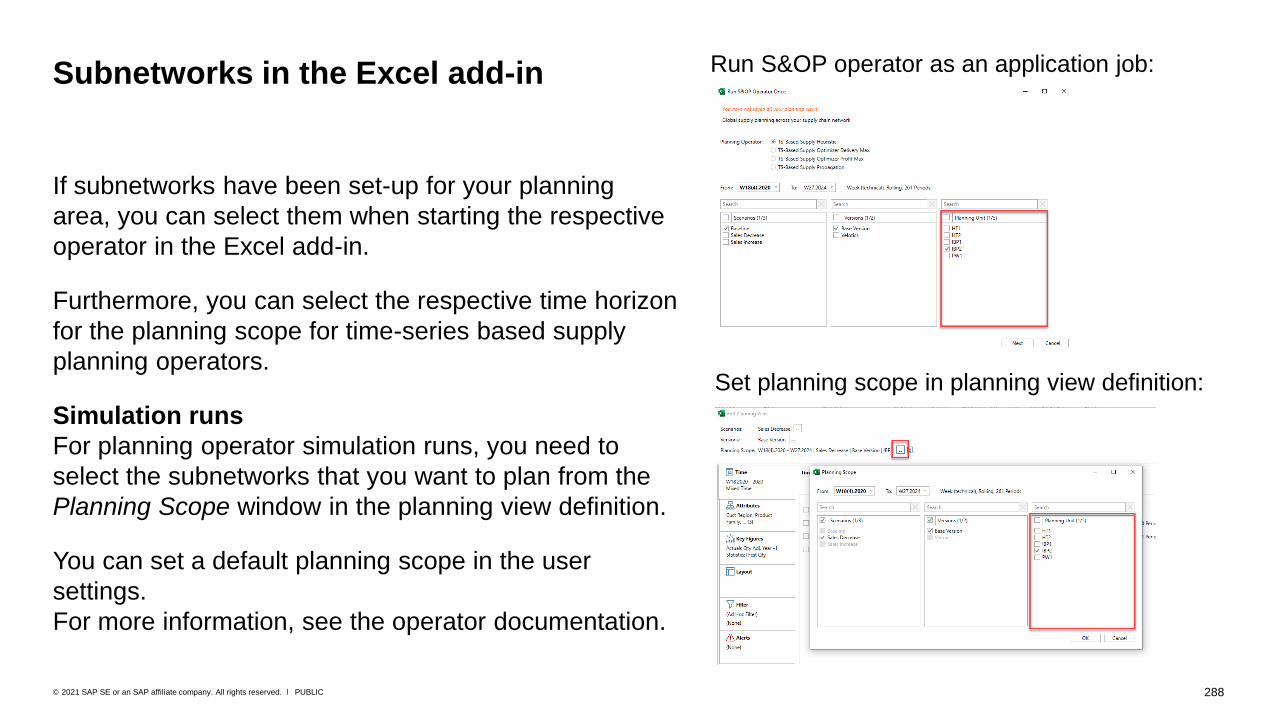
288PUBLIC© 2021 SAP SE or an SAP affiliate company. All rights reserved. ǀ
If subnetworks have been set-up for your planning
area, you can select them when starting the respective
operator in the Excel add-in.
Furthermore, you can select the respective time horizon
for the planning scope for time-series based supply
planning operators.
Simulation runs
For planning operator simulation runs, you need to
select the subnetworks that you want to plan from the
Planning Scope window in the planning view definition.
You can set a default planning scope in the user
settings.
For more information, see the operator documentation.
Subnetworks in the Excel add-in Run S&OP operator as an application job:
Set planning scope in planning view definition:
289PUBLIC© 2021 SAP SE or an SAP affiliate company. All rights reserved. ǀ
After you have changed key figure values in the planning view, you can start planning operators in
simulation mode to see the impact of your changes on the plan, without interfering with the
productive data. Note that some planning operators, such as, the operator for multi-stage
inventory optimization or the optimizer for time-series-based supply planning replan the entire
network.
Such a huge planning scope run in simulation mode can result in a long runtime.
To avoid this, you can run the application jobs in a scenario instead. With that, you still do not
interfere with the productive data, but the application job is running in the background and does not
hinder you from working.
Running simulations for long-running operators as application jobs in a
scenario – overview
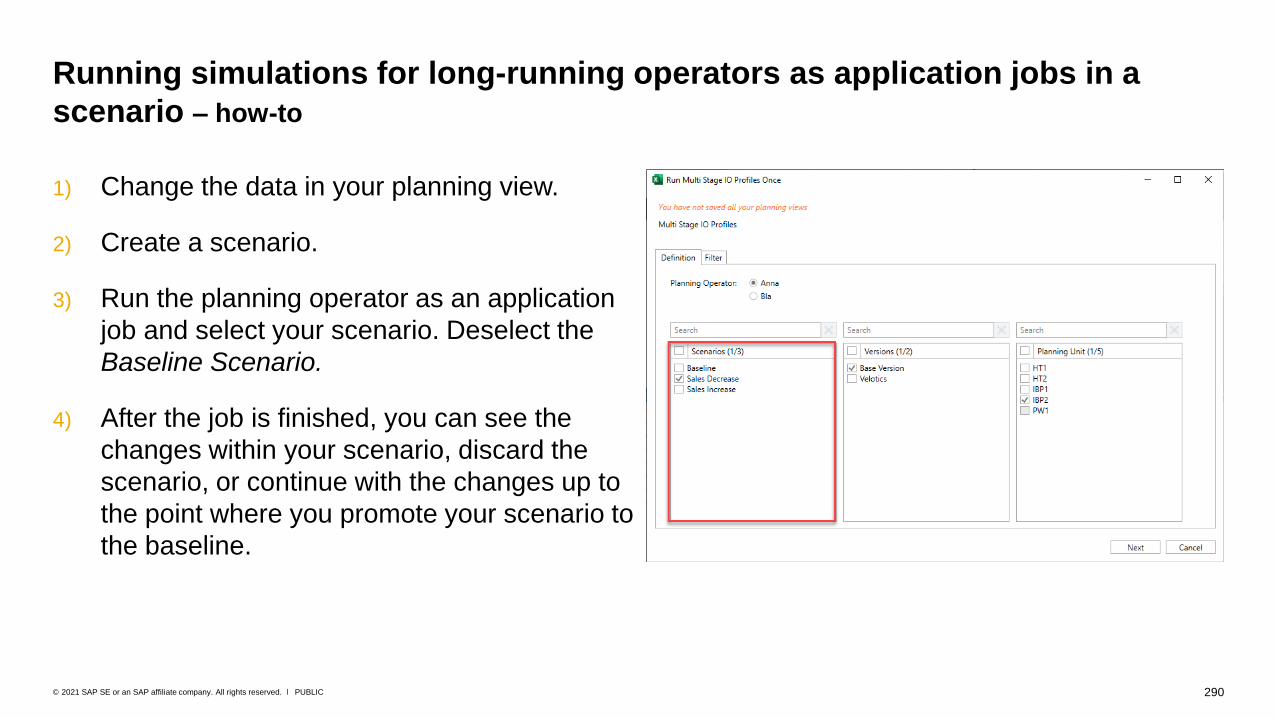
290PUBLIC© 2021 SAP SE or an SAP affiliate company. All rights reserved. ǀ
1) Change the data in your planning view.
2) Create a scenario.
3) Run the planning operator as an application
job and select your scenario. Deselect the
Baseline Scenario.
4) After the job is finished, you can see the
changes within your scenario, discard the
scenario, or continue with the changes up to
the point where you promote your scenario to
the baseline.
Running simulations for long-running operators as application jobs in a
scenario – how-to
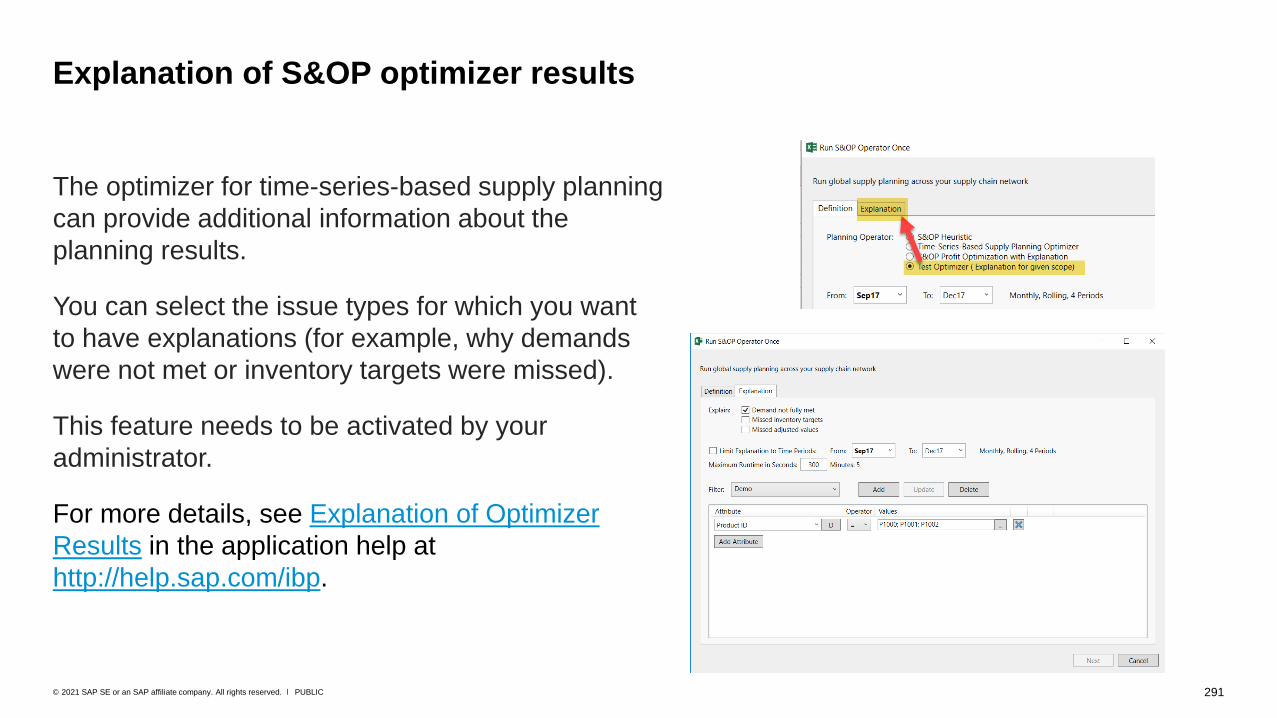
291PUBLIC© 2021 SAP SE or an SAP affiliate company. All rights reserved. ǀ
The optimizer for time-series-based supply planning
can provide additional information about the
planning results.
You can select the issue types for which you want
to have explanations (for example, why demands
were not met or inventory targets were missed).
This feature needs to be activated by your
administrator.
For more details, see Explanation of Optimizer
Results in the application help at
http://help.sap.com/ibp.
Explanation of S&OP optimizer results

292PUBLIC© 2021 SAP SE or an SAP affiliate company. All rights reserved. ǀ
You can set filter criteria for most planning operators. It is highly recommended that you use this
function to limit the amount of data that is copied, purged, or planned.
Filter criteria
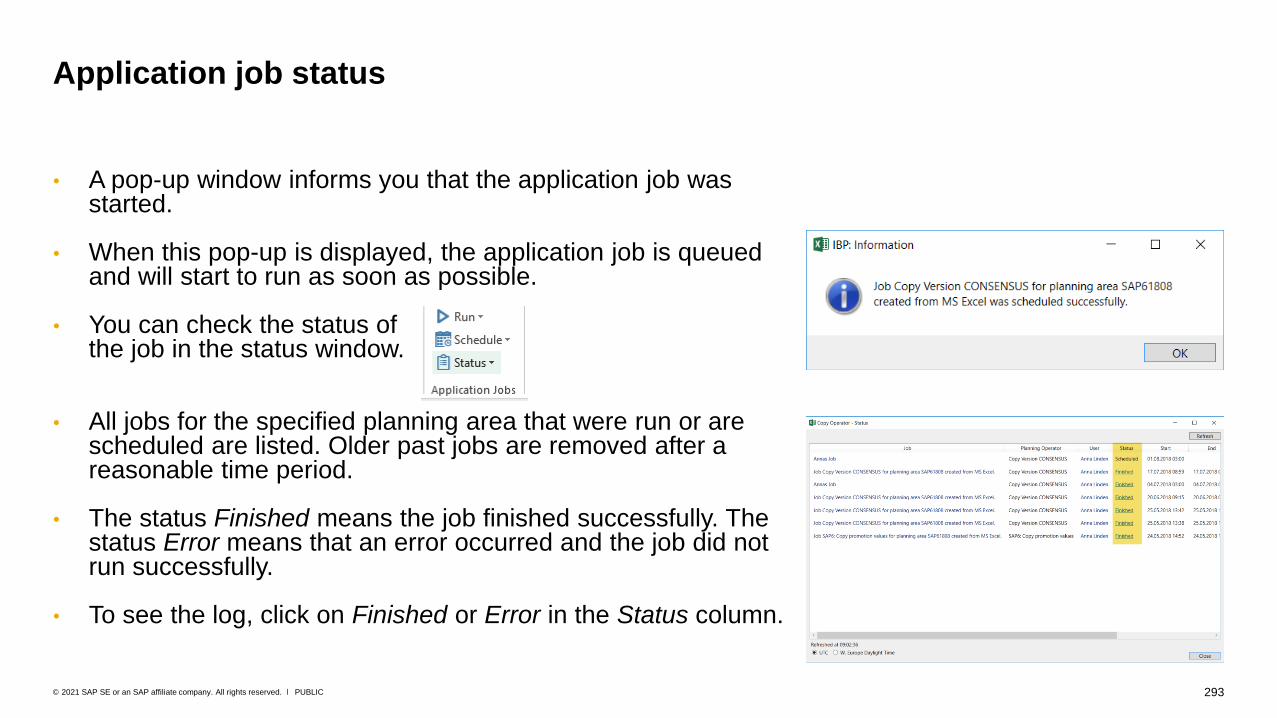
293PUBLIC© 2021 SAP SE or an SAP affiliate company. All rights reserved. ǀ
• A pop-up window informs you that the application job was started.
• When this pop-up is displayed, the application job is queued and will start to run as soon as possible.
• You can check the status of the job in the status window.
• All jobs for the specified planning area that were run or are scheduled are listed. Older past jobs are removed after a reasonable time period.
• The status Finished means the job finished successfully. The status Error means that an error occurred and the job did not run successfully.
• To see the log, click on Finished or Error in the Status column.
Application job status
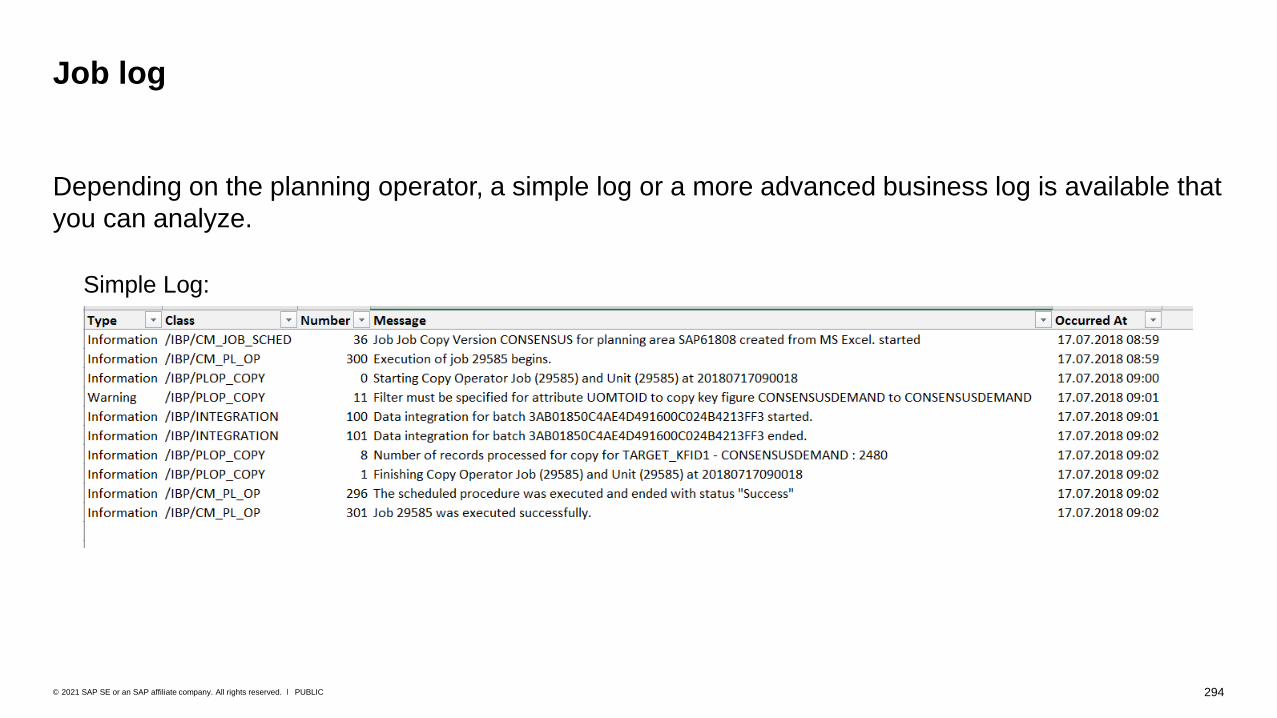
294PUBLIC© 2021 SAP SE or an SAP affiliate company. All rights reserved. ǀ
Depending on the planning operator, a simple log or a more advanced business log is available that
you can analyze.
Job log
Simple Log:

295PUBLIC© 2021 SAP SE or an SAP affiliate company. All rights reserved. ǀ
Business logging provides more detailed logs on the planning object level, such as, location product. These logs are created when running S&OP operators (operators for time-series-based supply planning) or the operators for statistical forecasting.
The new logging structure also allows you to filter for specific planning objects or information within the job logs.
For example, you can prefilter the log by attributes (see next slides).
And later on, in the log itself, further filters for the attributes are available:
• Severity of the message
• Message text
• Date and time
• Forecast model and step (statistical forecasting only)
• Planning period (S&OP operator only)
Business logging
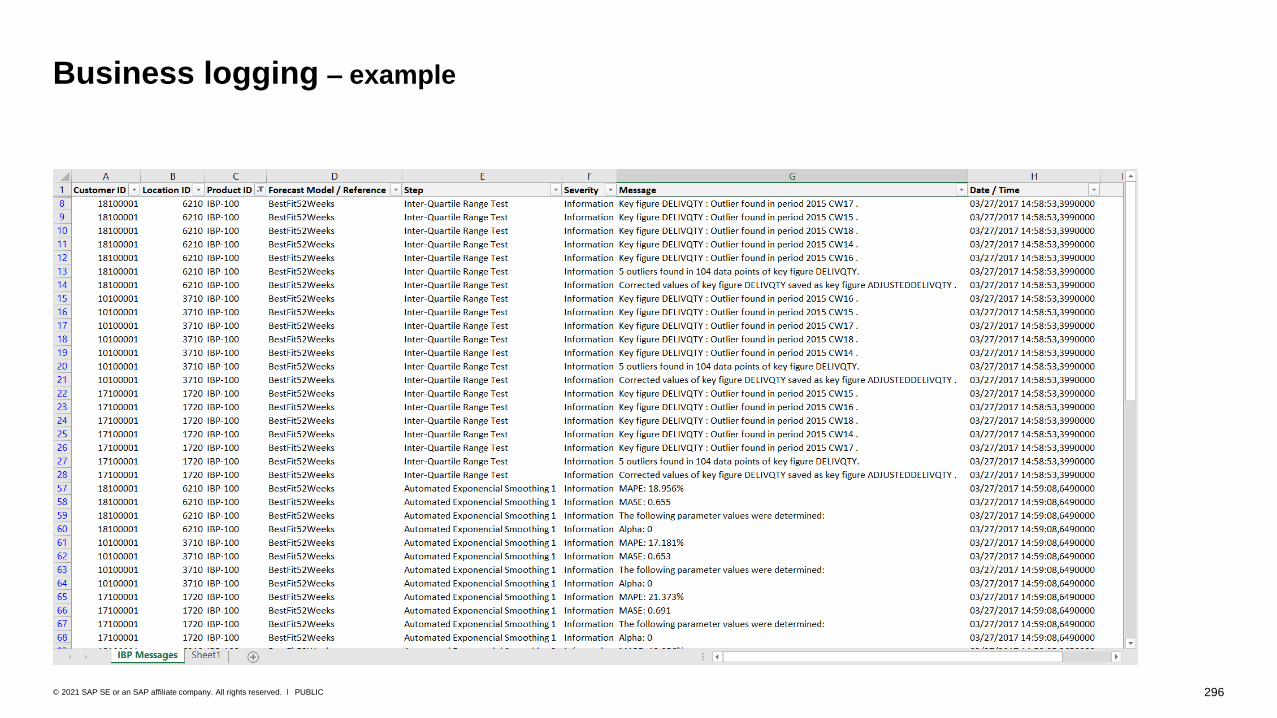
296PUBLIC© 2021 SAP SE or an SAP affiliate company. All rights reserved. ǀ
Business logging – example
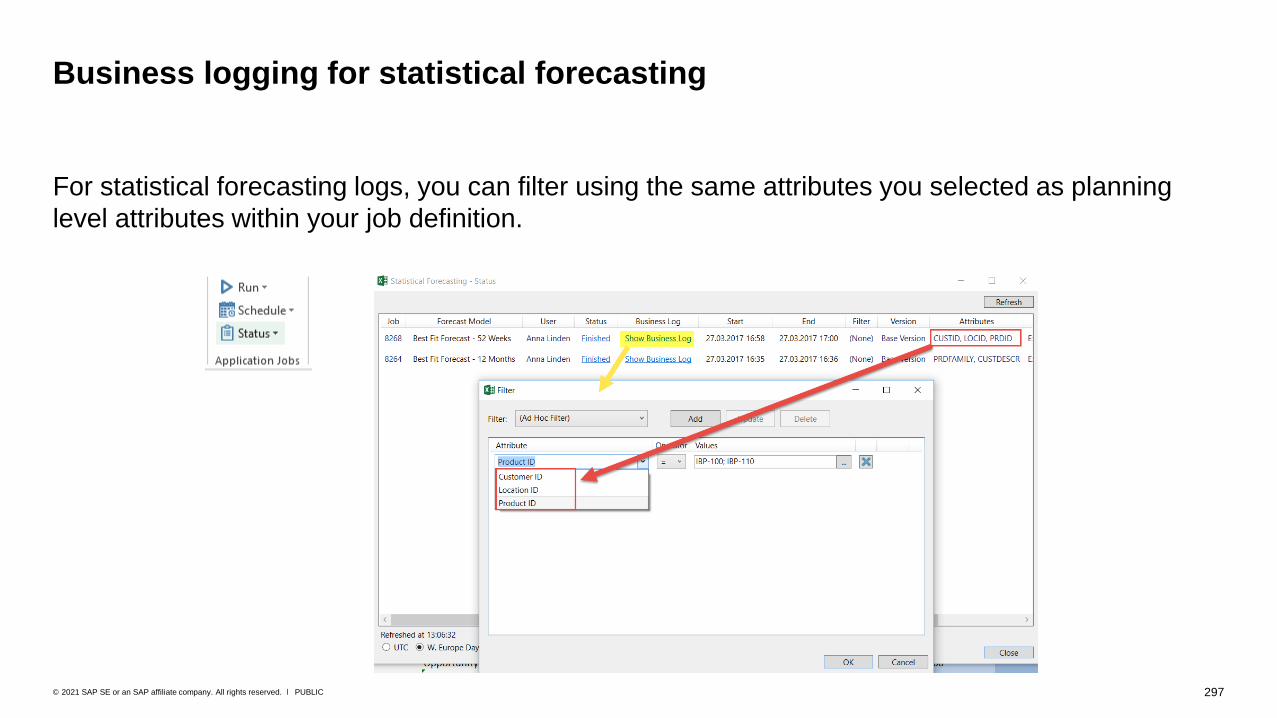
297PUBLIC© 2021 SAP SE or an SAP affiliate company. All rights reserved. ǀ
For statistical forecasting logs, you can filter using the same attributes you selected as planning
level attributes within your job definition.
Business logging for statistical forecasting

298PUBLIC© 2021 SAP SE or an SAP affiliate company. All rights reserved. ǀ
For logs for S&OP operators (operators for time-series based supply planning), you can filter by the
default attributes that are used within the S&OP operator jobs.
Business logging for S&OP operators
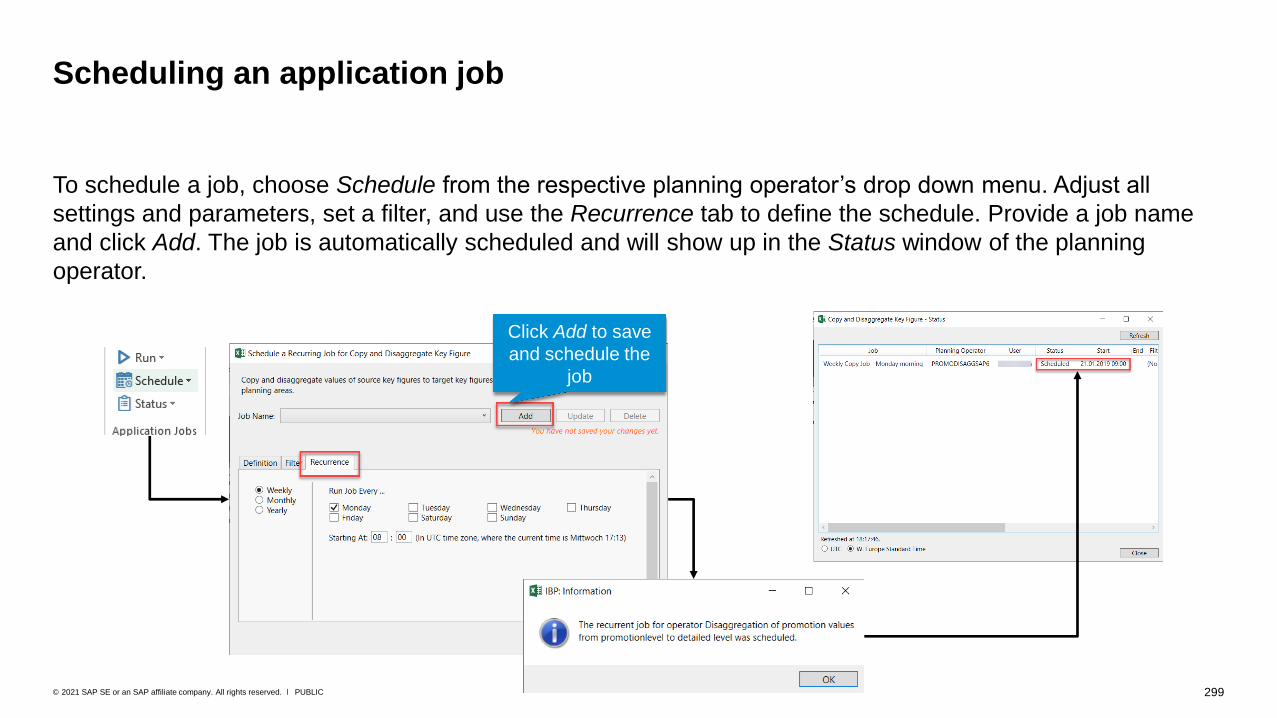
299PUBLIC© 2021 SAP SE or an SAP affiliate company. All rights reserved. ǀ
To schedule a job, choose Schedule from the respective planning operator’s drop down menu. Adjust all
settings and parameters, set a filter, and use the Recurrence tab to define the schedule. Provide a job name
and click Add. The job is automatically scheduled and will show up in the Status window of the planning
operator.
Scheduling an application job
Click Add to save
and schedule the
job

Master Data Maintenance
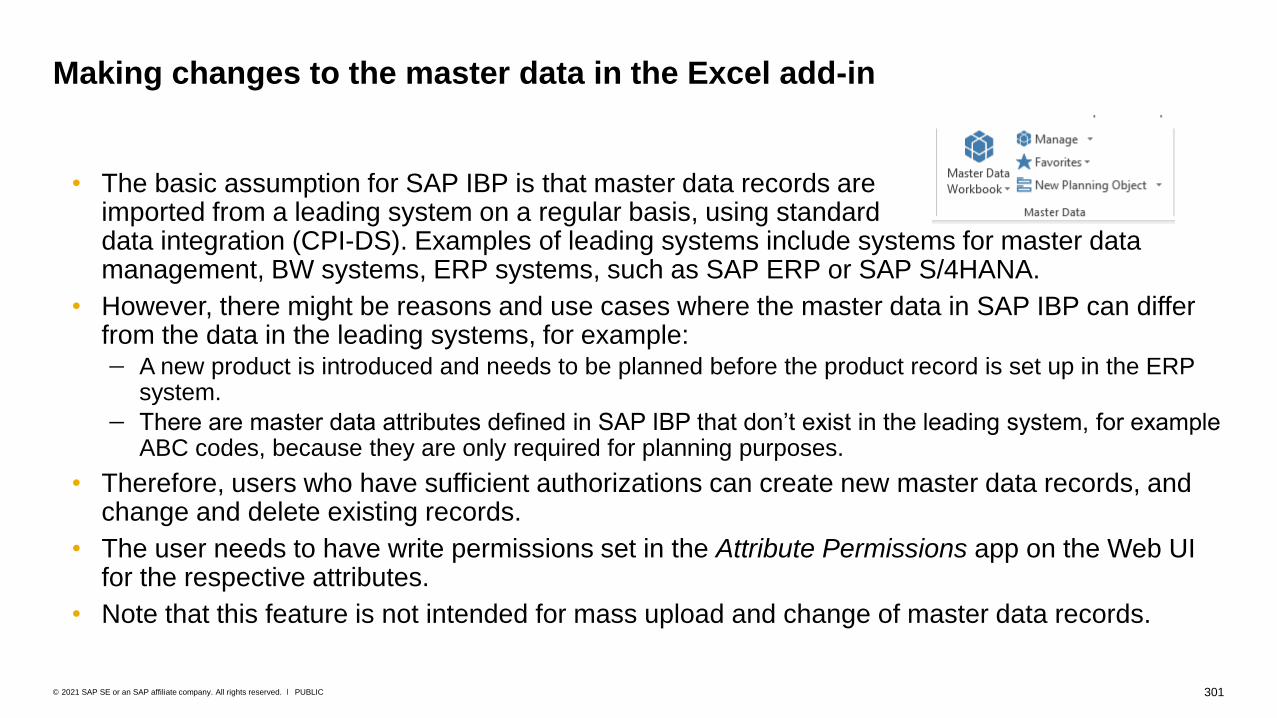
301PUBLIC© 2021 SAP SE or an SAP affiliate company. All rights reserved. ǀ
• The basic assumption for SAP IBP is that master data records are imported from a leading system on a regular basis, using standard data integration (CPI-DS). Examples of leading systems include systems for master data management, BW systems, ERP systems, such as SAP ERP or SAP S/4HANA.
• However, there might be reasons and use cases where the master data in SAP IBP can differ from the data in the leading systems, for example: − A new product is introduced and needs to be planned before the product record is set up in the ERP
system.
− There are master data attributes defined in SAP IBP that don’t exist in the leading system, for example ABC codes, because they are only required for planning purposes.
• Therefore, users who have sufficient authorizations can create new master data records, and change and delete existing records.
• The user needs to have write permissions set in the Attribute Permissions app on the Web UI for the respective attributes.
• Note that this feature is not intended for mass upload and change of master data records.
Making changes to the master data in the Excel add-in

Single Master Data Maintenance

303PUBLIC© 2021 SAP SE or an SAP affiliate company. All rights reserved. ǀ
• You can access a single master data record, such as, a product, including all of its master data attributes.
• You can view , copy , and edit the master data attributes for a single master data record.
• You can delete the whole master data record.
• You can create a new master data record and the
associated attributes.
Managing single master data records

304PUBLIC© 2021 SAP SE or an SAP affiliate company. All rights reserved. ǀ
Example: You don’t have write access for the attribute Customer ID
If Customer ID is a key field and you select the master data type Customer, the Create New
Record, Copy Record, and Delete Record buttons aren't shown. You can still edit all attributes
related to that master data type for existing master data records.
Example: Attribute permissions (write access) in the single master data view
(1)

305PUBLIC© 2021 SAP SE or an SAP affiliate company. All rights reserved. ǀ
Example: You don’t have write access for the attribute Product Group
The attribute Product Group is not a key field in the master data type Product, so you can use the
View, Add, Edit, Copy, and Delete buttons in the Product master data records.
You can't edit the attribute Product Group in this case. That is the reason why the font color in this
field is grey.
Example: Attribute permissions (write access) in the single master data view
(2)

Master Data Workbook
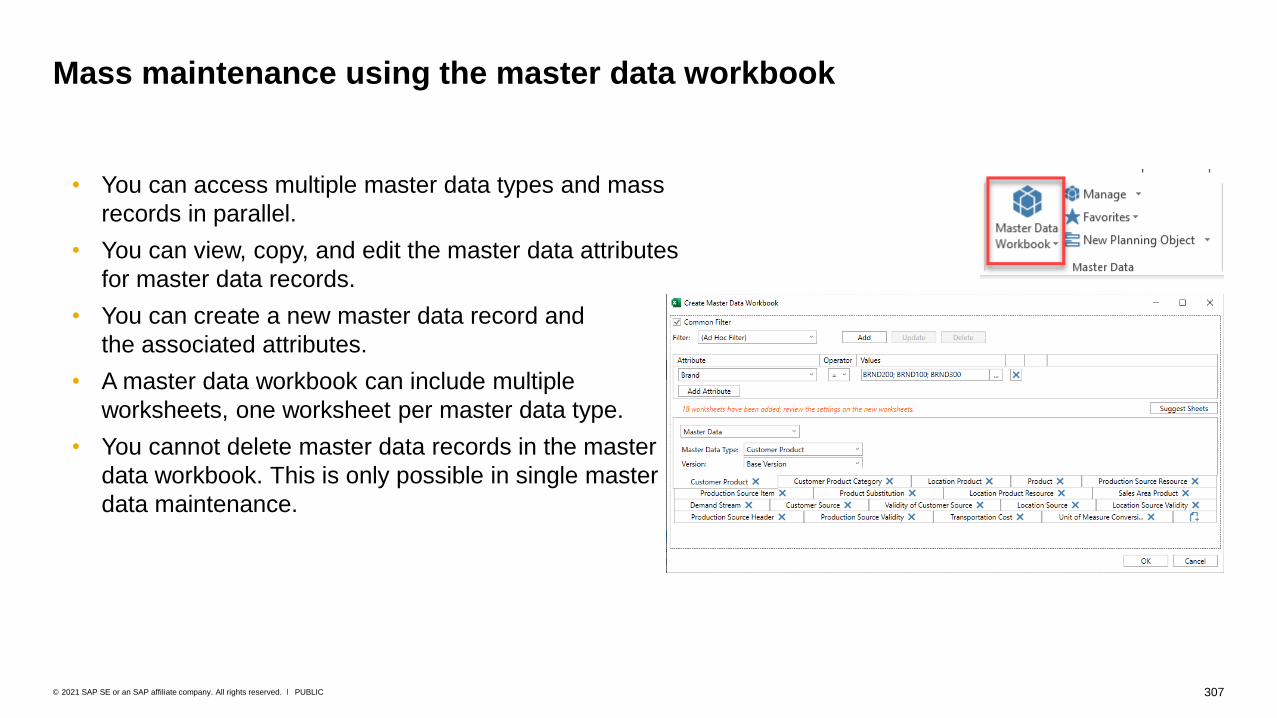
307PUBLIC© 2021 SAP SE or an SAP affiliate company. All rights reserved. ǀ
• You can access multiple master data types and mass
records in parallel.
• You can view, copy, and edit the master data attributes
for master data records.
• You can create a new master data record and
the associated attributes.
• A master data workbook can include multiple
worksheets, one worksheet per master data type.
• You cannot delete master data records in the master
data workbook. This is only possible in single master
data maintenance.
Mass maintenance using the master data workbook
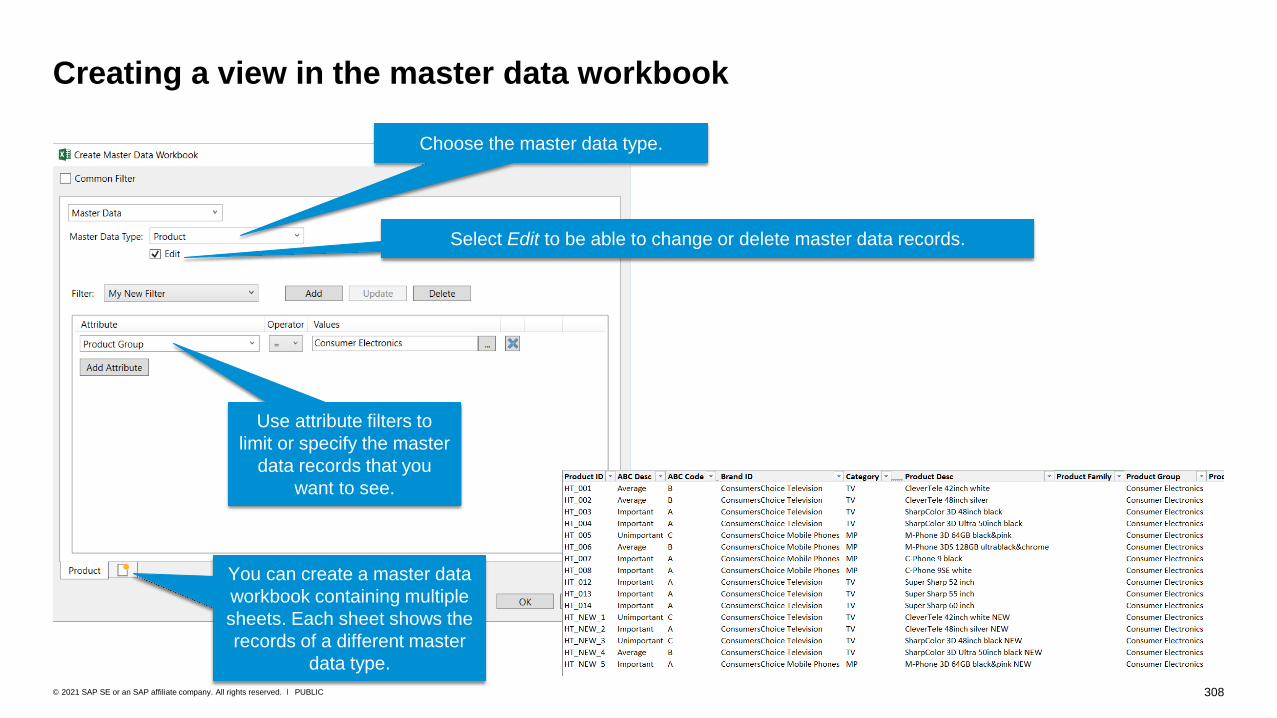
308PUBLIC© 2021 SAP SE or an SAP affiliate company. All rights reserved. ǀ
Creating a view in the master data workbook
Choose the master data type.
Select Edit to be able to change or delete master data records.
Use attribute filters to
limit or specify the master
data records that you
want to see.
You can create a master data
workbook containing multiple
sheets. Each sheet shows the
records of a different master
data type.

309PUBLIC© 2021 SAP SE or an SAP affiliate company. All rights reserved. ǀ
When creating a master data workbook, you can define a common filter. The filter is used for all
worksheets that you create.
You can also let the system suggest worksheets that fit this filter: For each master data type that
contains the attributes specified in the filter, the system suggests one worksheet.
Using a common filter and suggesting worksheets
Example
You have defined a common filter that is filtering
for certain product IDs. The system suggests all
master data types where the product ID is an
attribute.
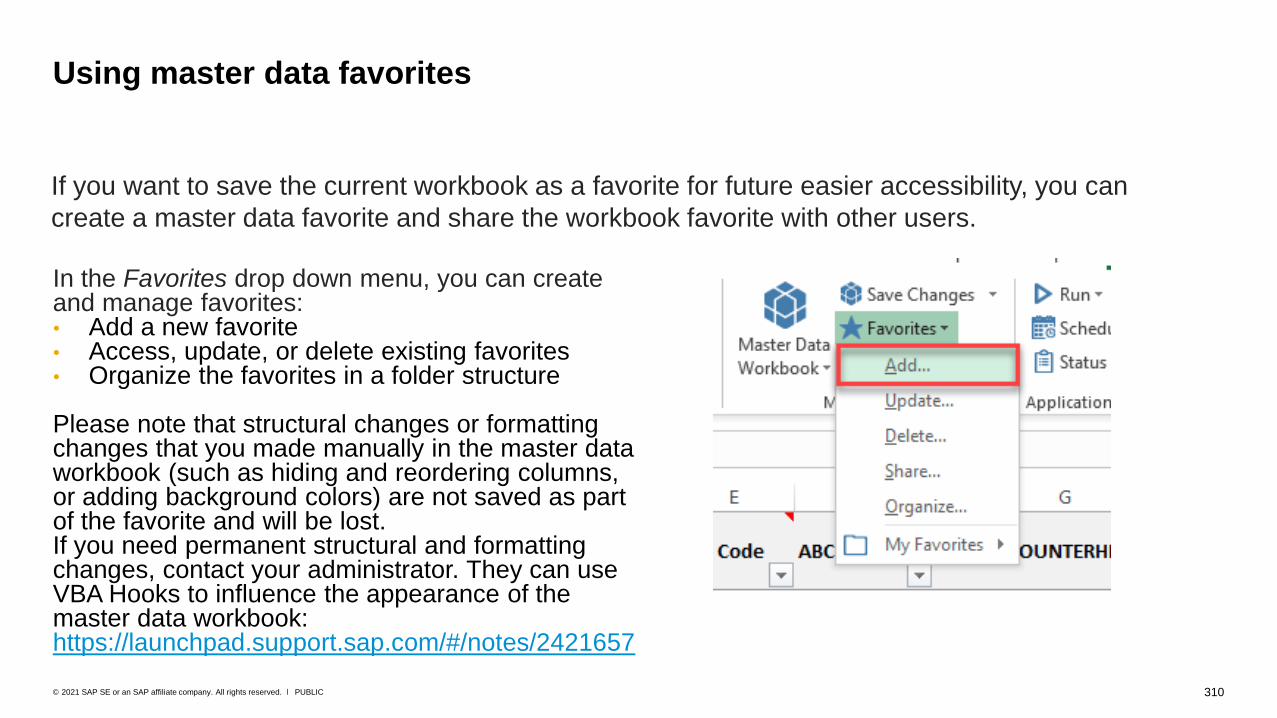
310PUBLIC© 2021 SAP SE or an SAP affiliate company. All rights reserved. ǀ
In the Favorites drop down menu, you can create and manage favorites:• Add a new favorite• Access, update, or delete existing favorites• Organize the favorites in a folder structure
Please note that structural changes or formatting changes that you made manually in the master data workbook (such as hiding and reordering columns, or adding background colors) are not saved as part of the favorite and will be lost.If you need permanent structural and formatting changes, contact your administrator. They can use VBA Hooks to influence the appearance of the master data workbook:https://launchpad.support.sap.com/#/notes/2421657
Using master data favorites
If you want to save the current workbook as a favorite for future easier accessibility, you can
create a master data favorite and share the workbook favorite with other users.

311PUBLIC© 2021 SAP SE or an SAP affiliate company. All rights reserved. ǀ
You can edit the master data workbook at any time.
Editing the master data workbook
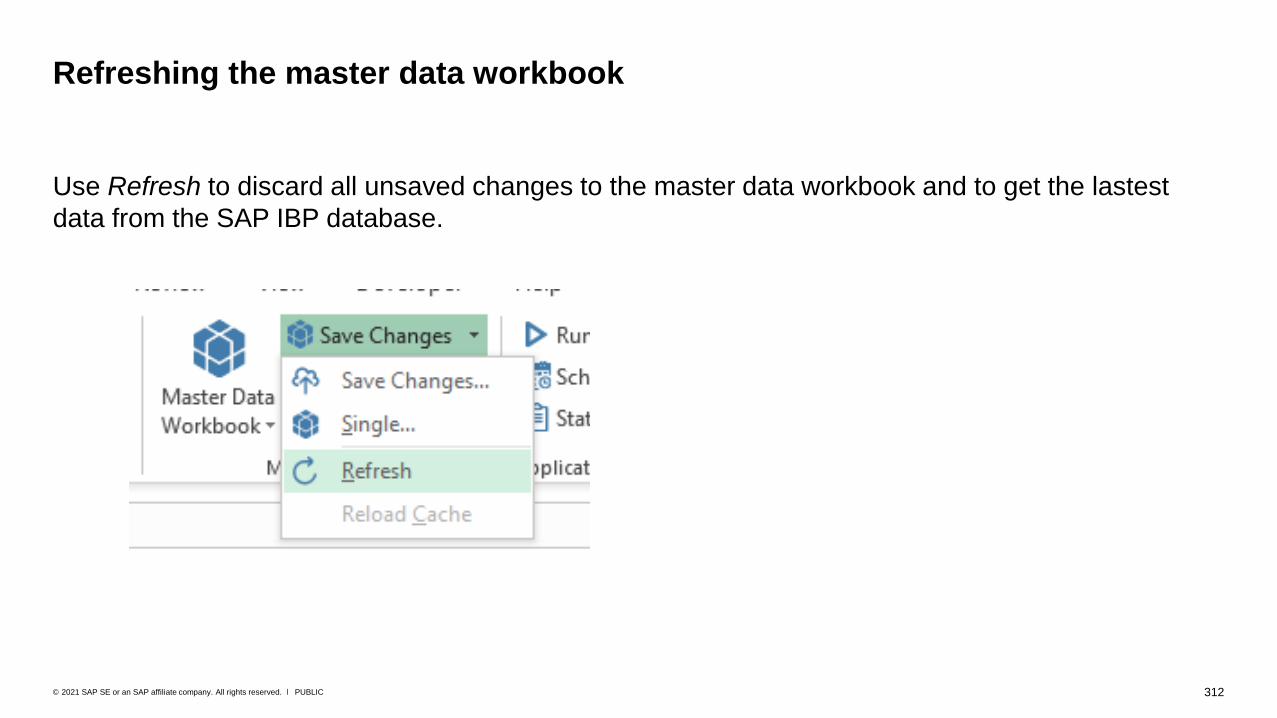
312PUBLIC© 2021 SAP SE or an SAP affiliate company. All rights reserved. ǀ
Use Refresh to discard all unsaved changes to the master data workbook and to get the lastest
data from the SAP IBP database.
Refreshing the master data workbook
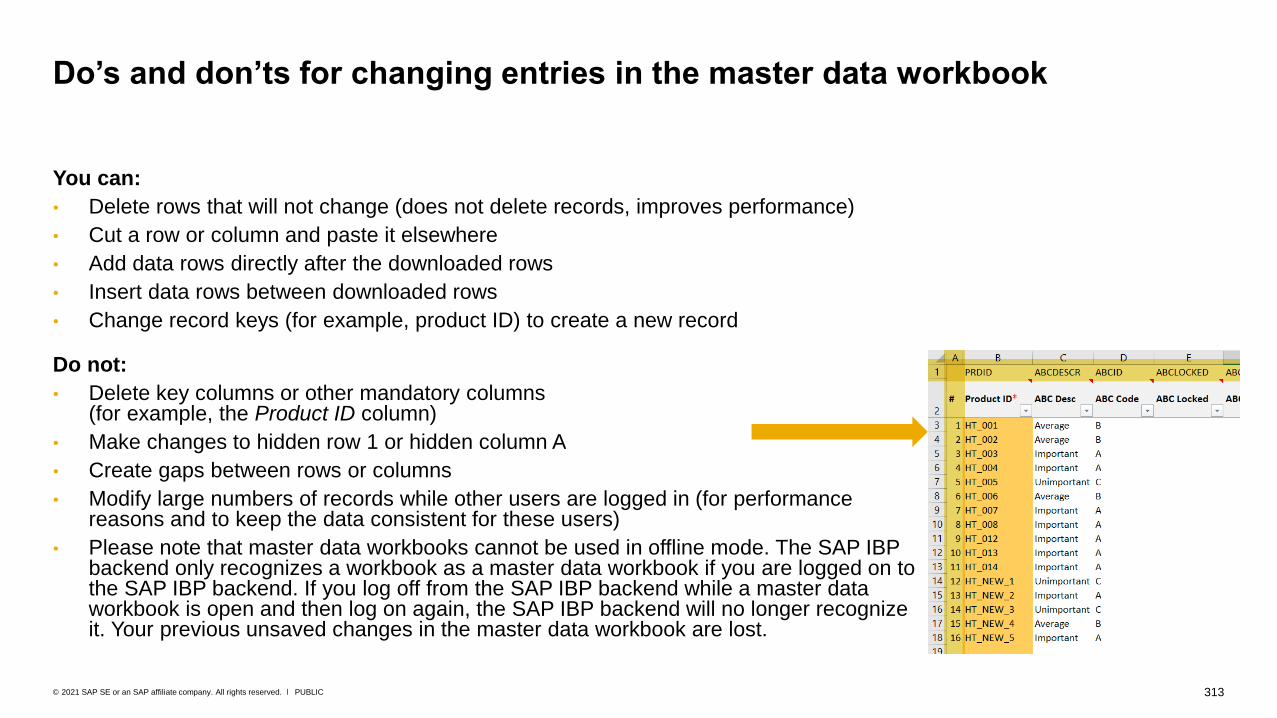
313PUBLIC© 2021 SAP SE or an SAP affiliate company. All rights reserved. ǀ
You can:
• Delete rows that will not change (does not delete records, improves performance)
• Cut a row or column and paste it elsewhere
• Add data rows directly after the downloaded rows
• Insert data rows between downloaded rows
• Change record keys (for example, product ID) to create a new record
Do not:
• Delete key columns or other mandatory columns (for example, the Product ID column)
• Make changes to hidden row 1 or hidden column A
• Create gaps between rows or columns
• Modify large numbers of records while other users are logged in (for performance reasons and to keep the data consistent for these users)
• Please note that master data workbooks cannot be used in offline mode. The SAP IBP backend only recognizes a workbook as a master data workbook if you are logged on to the SAP IBP backend. If you log off from the SAP IBP backend while a master data workbook is open and then log on again, the SAP IBP backend will no longer recognize it. Your previous unsaved changes in the master data workbook are lost.
Do’s and don’ts for changing entries in the master data workbook
314PUBLIC© 2021 SAP SE or an SAP affiliate company. All rights reserved. ǀ
The new product PRODNEW is introduced and all relevant master data needs to be created for the product. PRODNEW is very similar to the already existing product PRODOLD.
You can achieve this as follows:
1. Open the master data workbook.
2. Select Common Filter and define the filter Product = PRODOLD.
3. Click Suggest Sheets, delete the worksheets you do not need, select the Edit checkbox on all worksheets and click OK.
4. Worksheets are created for all master data types that contain the product as a key or attribute. They get filled with the existing master data of product PRODOLD.
5. Go through the worksheets and replace PRODOLD with PRODNEW using the Find and Replace Excel feature. Make manual changes as needed in order to define all master data information for the new product.
6. Save the changes.
7. Master data is created for the new product.
Example: creating new master data records for a new product
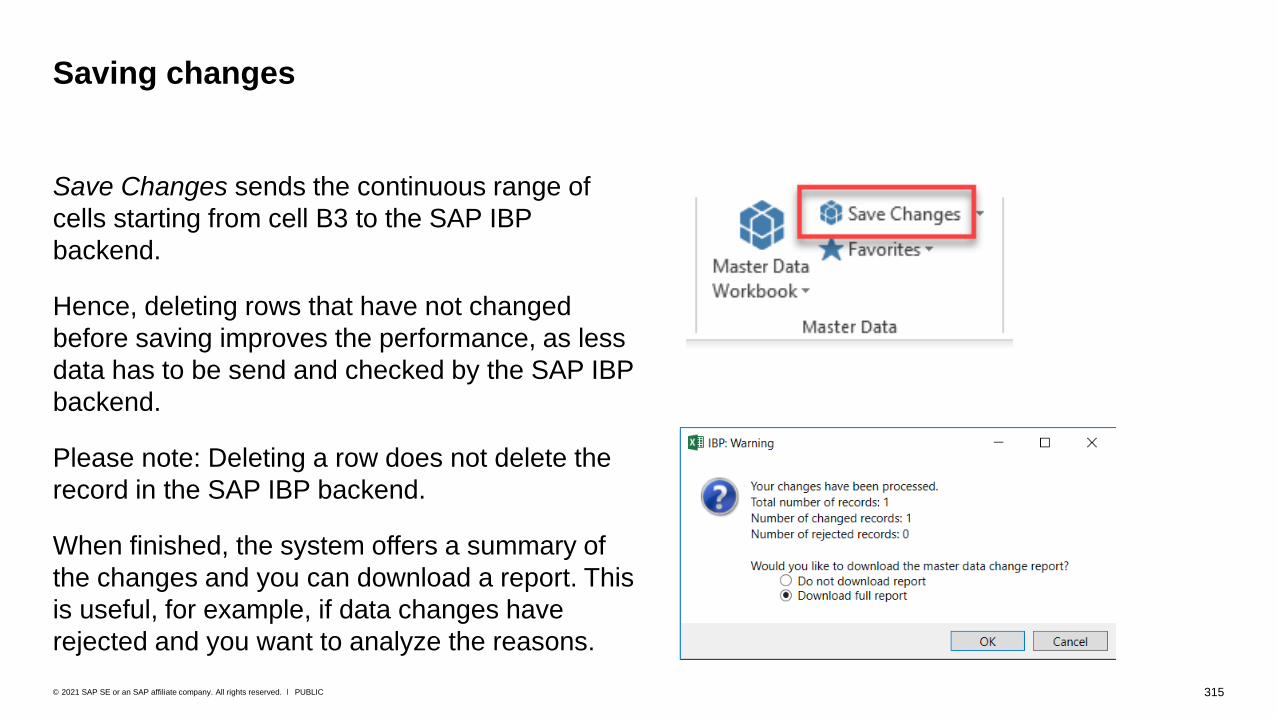
315PUBLIC© 2021 SAP SE or an SAP affiliate company. All rights reserved. ǀ
Saving changes
Save Changes sends the continuous range of
cells starting from cell B3 to the SAP IBP
backend.
Hence, deleting rows that have not changed
before saving improves the performance, as less
data has to be send and checked by the SAP IBP
backend.
Please note: Deleting a row does not delete the
record in the SAP IBP backend.
When finished, the system offers a summary of
the changes and you can download a report. This
is useful, for example, if data changes have
rejected and you want to analyze the reasons.

316PUBLIC© 2021 SAP SE or an SAP affiliate company. All rights reserved. ǀ
Example: You don’t have write access for the attribute Customer ID which is a key field.
You can select the master data type Customer and select Edit:
In the workbook itself, the Customer ID values are marked with a grey background to indicate that
they are not editable.
Because the Customer ID is a key field, you get an error message upon saving when you try to
create, copy or delete a master data record.
Example: attribute permissions (write access) in the master data workbook
(1)
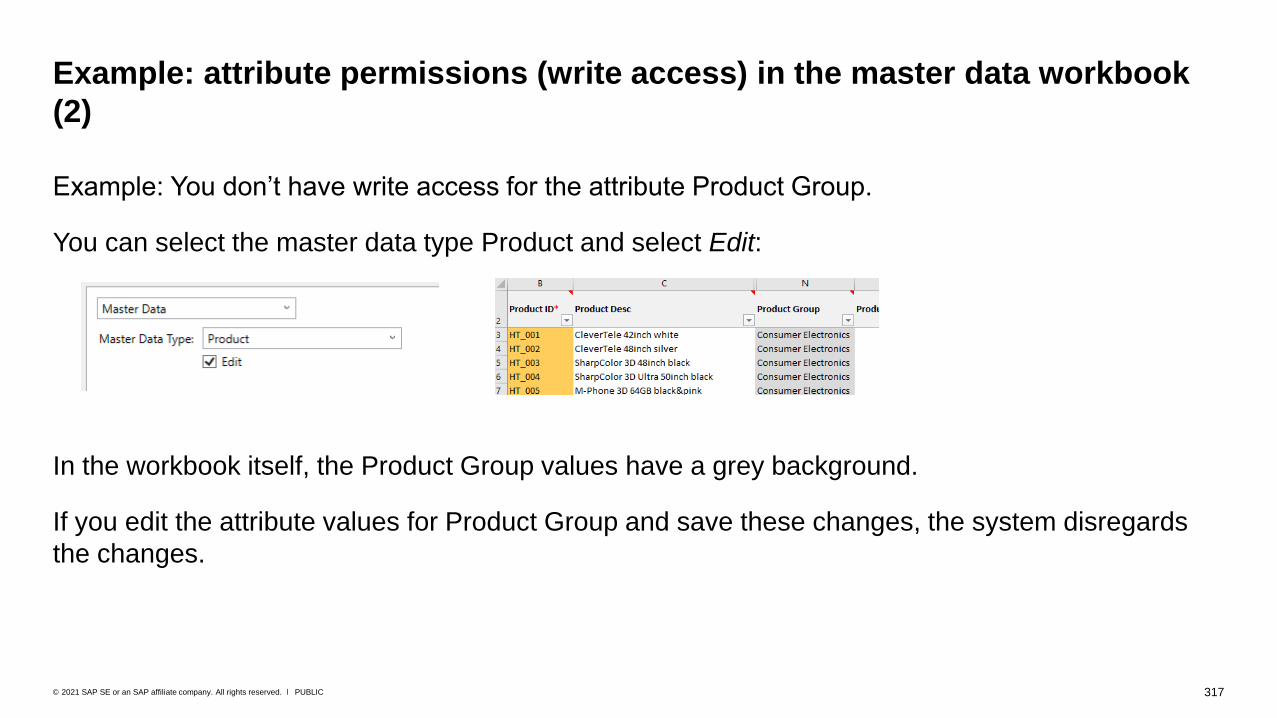
317PUBLIC© 2021 SAP SE or an SAP affiliate company. All rights reserved. ǀ
Example: You don’t have write access for the attribute Product Group.
You can select the master data type Product and select Edit:
In the workbook itself, the Product Group values have a grey background.
If you edit the attribute values for Product Group and save these changes, the system disregards
the changes.
Example: attribute permissions (write access) in the master data workbook
(2)

318PUBLIC© 2021 SAP SE or an SAP affiliate company. All rights reserved. ǀ
The appearance of the master data worksheets can be changed by using custom VBA code. This is
usually implemented centrally by an administrator or IT department.
Examples:
- Change the sorting of the columns from the default (alphabetical) to a custom order
- Hide columns by default
- Change formatting, like background color or font color for certain attributes
- Apply custom functions such as VLOOKUP
- Apply a value help for certain attributes,
such as A, B, or C for the ABC Code
More information: https://launchpad.support.sap.com/#/notes/2421657
Formatting sheets in the master data book using VBA hooks

Planning Object Maintenance

320PUBLIC© 2021 SAP SE or an SAP affiliate company. All rights reserved. ǀ
Planning objects in SAP IBP
▪ Planning in SAP IBP is based on planning objects.
▪ A planning object is a single entity for which you can perform planning. It is identified by a combination of
master data attribute values.
Example: The location product with the master data attribute values PRODUCT_A and LOCATION_B is
represented by a planning object.
Note: A planning object is comparable to a characteristic value combination in SAP APO.
▪ Before an attribute value combination can be planned in SAP IBP or displayed in the Excel add-in, a
planning object needs to be generated in SAP IBP (such as PRODUCT_A -LOCATION_B). Without a
planning object, there can be no planning for this combination.
▪ There is an additional condition for being able to plan a planning object: It needs to be assigned a time
dimension (a time series, basically).
▪ Planning objects are generated in SAP IBP as follows:
▪ Planning objects are automatically generated – including the time dimension - when transactional data is uploaded during data
integration (for example, from SAP ERP), or when key figure values are uploaded as a CSV file using the Data Integration Jobs app.
▪ If only a master data record is uploaded to SAP IBP or created in the Excel add-in, no planning object is generated. You need to
trigger the generation of the planning object (including the time dimension) explicitly. The next slides explain how to do this in the
Excel add-in.
▪ For more information, see SAP Note 2798109 (https://launchpad.support.sap.com/#/notes/2798109).
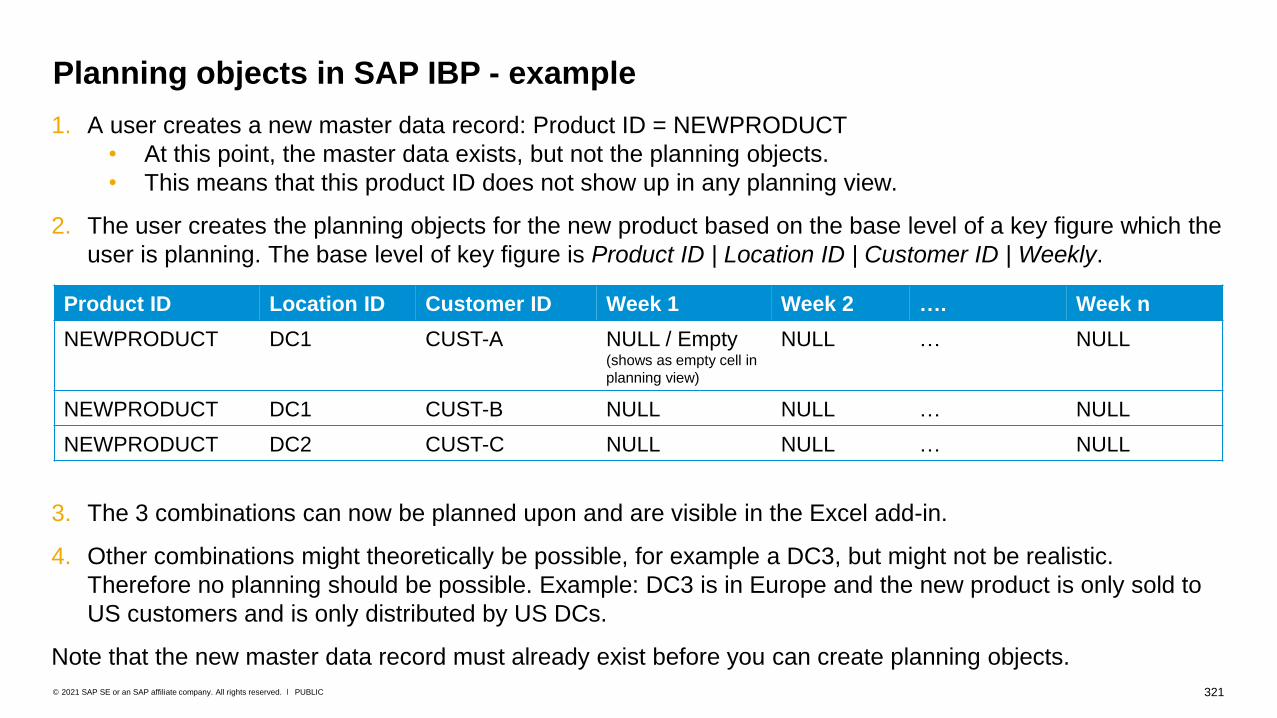
321PUBLIC© 2021 SAP SE or an SAP affiliate company. All rights reserved. ǀ
Planning objects in SAP IBP - example
1. A user creates a new master data record: Product ID = NEWPRODUCT
• At this point, the master data exists, but not the planning objects.
• This means that this product ID does not show up in any planning view.
2. The user creates the planning objects for the new product based on the base level of a key figure which the
user is planning. The base level of key figure is Product ID | Location ID | Customer ID | Weekly.
3. The 3 combinations can now be planned upon and are visible in the Excel add-in.
4. Other combinations might theoretically be possible, for example a DC3, but might not be realistic.
Therefore no planning should be possible. Example: DC3 is in Europe and the new product is only sold to
US customers and is only distributed by US DCs.
Note that the new master data record must already exist before you can create planning objects.
Product ID Location ID Customer ID Week 1 Week 2 …. Week n
NEWPRODUCT DC1 CUST-A NULL / Empty(shows as empty cell in
planning view)
NULL … NULL
NEWPRODUCT DC1 CUST-B NULL NULL … NULL
NEWPRODUCT DC2 CUST-C NULL NULL … NULL
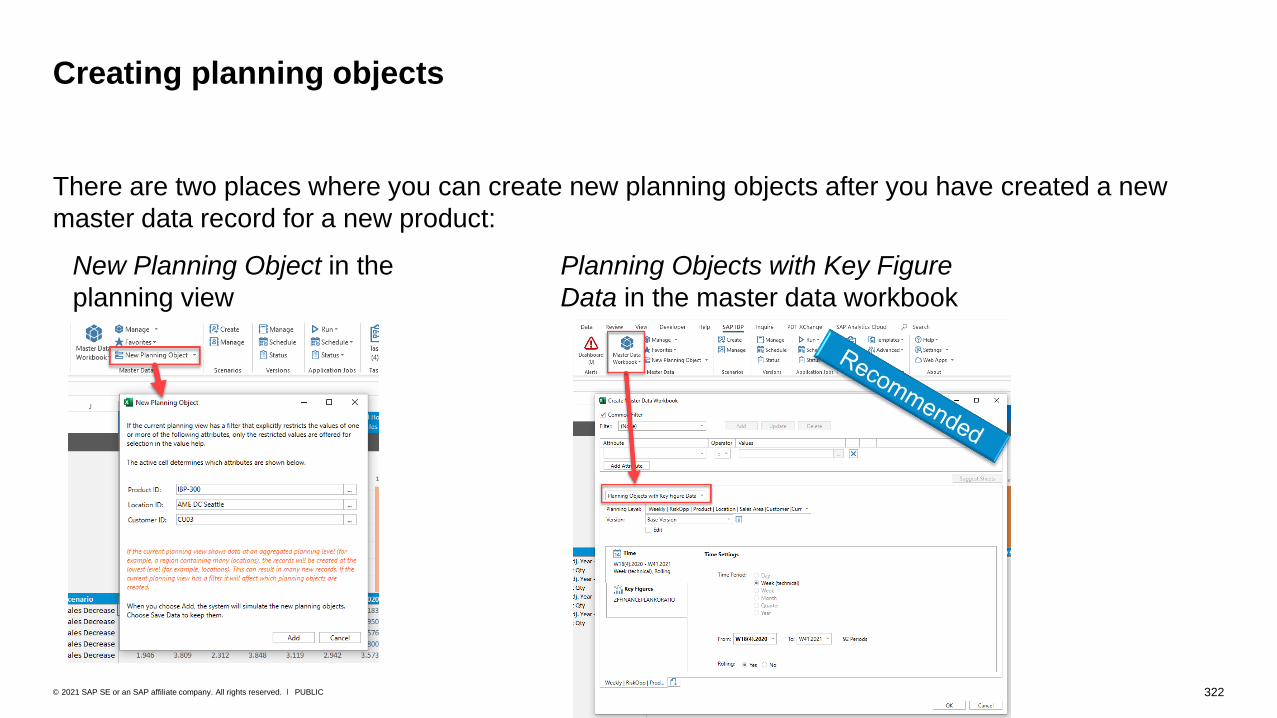
322PUBLIC© 2021 SAP SE or an SAP affiliate company. All rights reserved. ǀ
Creating planning objects
There are two places where you can create new planning objects after you have created a new
master data record for a new product:
Planning Objects with Key Figure
Data in the master data workbook
New Planning Object in the
planning view
323PUBLIC© 2021 SAP SE or an SAP affiliate company. All rights reserved. ǀ
You can add new planning objects to a planning view. Note: Even if the planning view shows data
at an aggregated planning level (for example, a region containing many locations), the records are
created at the lowest level (for example, locations).
You create planning objects, for example, to do the following:
• Introduce a new product based on the planning objects of an existing product, directly in the
Excel add-in without having to use data integration functions (such as, CPI-DS or the Data
Integration app on the Web UI
• Simulate selling a product in a new region or bringing a new plant online
Please note: This function does not replace the data integration functions that are normally used in
SAP IBP (such as, CPI-DS). We recommend that you use it to create and edit smaller numbers of
planning objects and only from a low disaggregation level (such as, product ID).
Creating planning objects in the planning view – overview

324PUBLIC© 2021 SAP SE or an SAP affiliate company. All rights reserved. ǀ
Creating planning objects in the planning view (1)
1) Open a planning view that has the key figures and is in the planning level for which you want to create new
planning objects.
2) Click New Planning Object.
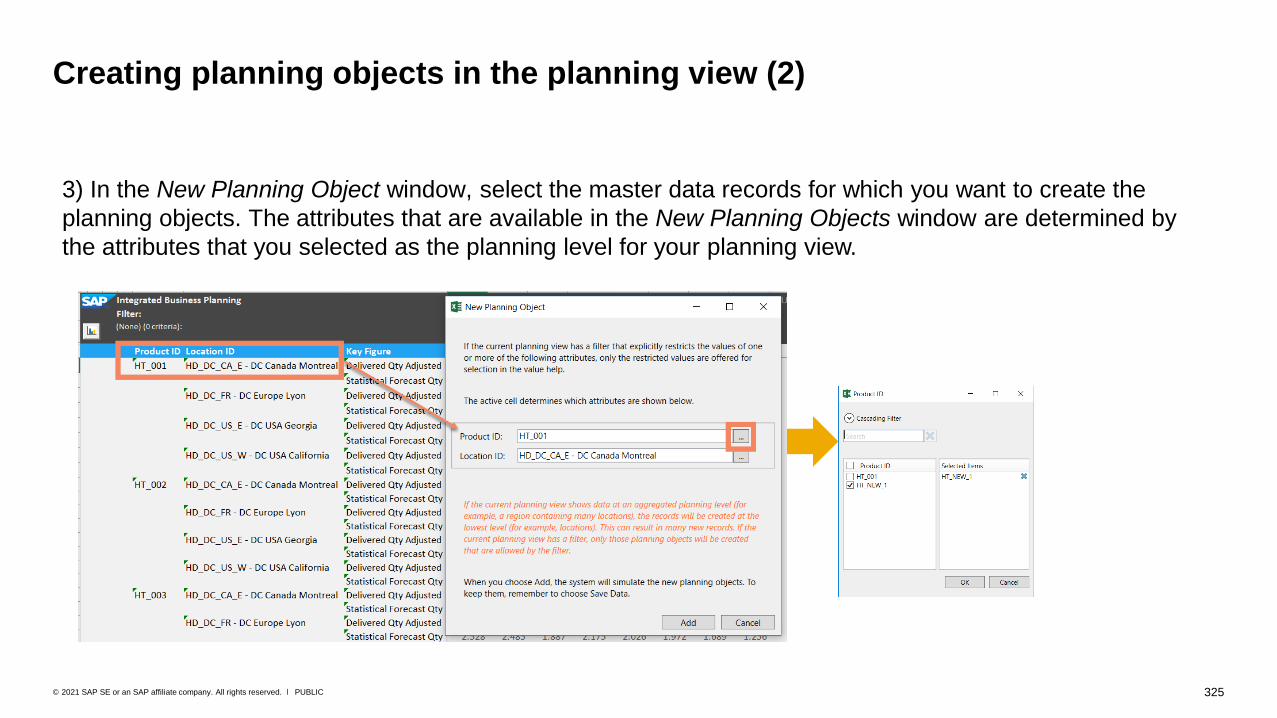
325PUBLIC© 2021 SAP SE or an SAP affiliate company. All rights reserved. ǀ
Creating planning objects in the planning view (2)
3) In the New Planning Object window, select the master data records for which you want to create the
planning objects. The attributes that are available in the New Planning Objects window are determined by
the attributes that you selected as the planning level for your planning view.

326PUBLIC© 2021 SAP SE or an SAP affiliate company. All rights reserved. ǀ
4) Click Add. Please note that the system first simulates the new planning objects and shows the simulation results in the planning view.
5) Review the planning objects to verify the data is correct. Then click Save Data.
Please note that the new planning objects will only be displayed in planning views if key figure values are associated to them. So if you want to immediately use the planning objects in a planning view, please enter key figure values before saving. Otherwise, the planning objects will not be displayed in the planning view.
Creating planning objects in the planning view (3)

327PUBLIC© 2021 SAP SE or an SAP affiliate company. All rights reserved. ǀ
A mass creation of planning objects at a high level is not recommended, as the planning object
records are created at the base level of the key figures (for example, product-location-customer-
days).
Example: You create planning objects at a high level such as brand = SHOES and the key figure
base level is product-location-customer-days. In that case, the system creates planning objects for
all available product-location-customer combinations (where the respective attribute brand =
SHOES), with all locations, and all customers, and all days.
This may result in many new planning objects that are logically wrong because the combination
product New Shoe US / location Rome, Italy / customer Garibaldi (Italy) is never planned since the
new product is only sold in the US market.
Therefore, please create planning objects at the lowest level possible, OR use the SAP
recommended way using Planning Objects with Key Figure Data in the master data
workbook.
Recommendations for creating new planning objects
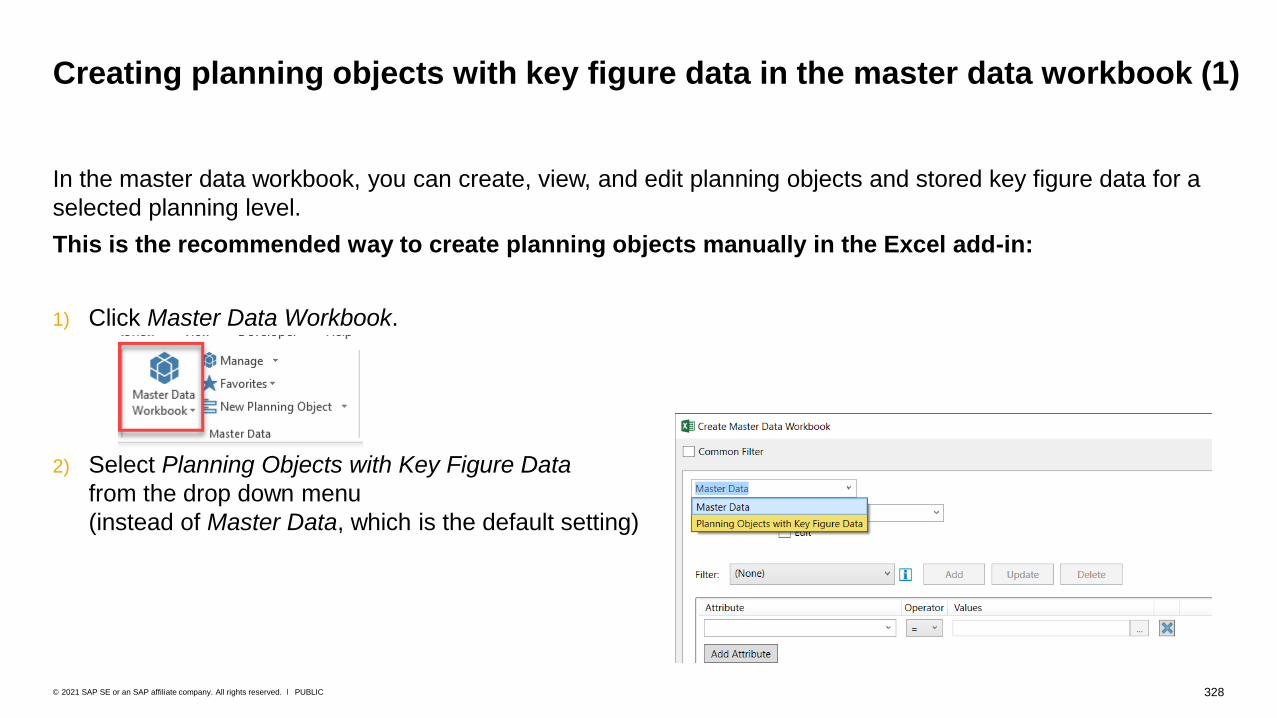
328PUBLIC© 2021 SAP SE or an SAP affiliate company. All rights reserved. ǀ
Creating planning objects with key figure data in the master data workbook (1)
In the master data workbook, you can create, view, and edit planning objects and stored key figure data for a
selected planning level.
This is the recommended way to create planning objects manually in the Excel add-in:
1) Click Master Data Workbook.
2) Select Planning Objects with Key Figure Data
from the drop down menu
(instead of Master Data, which is the default setting)
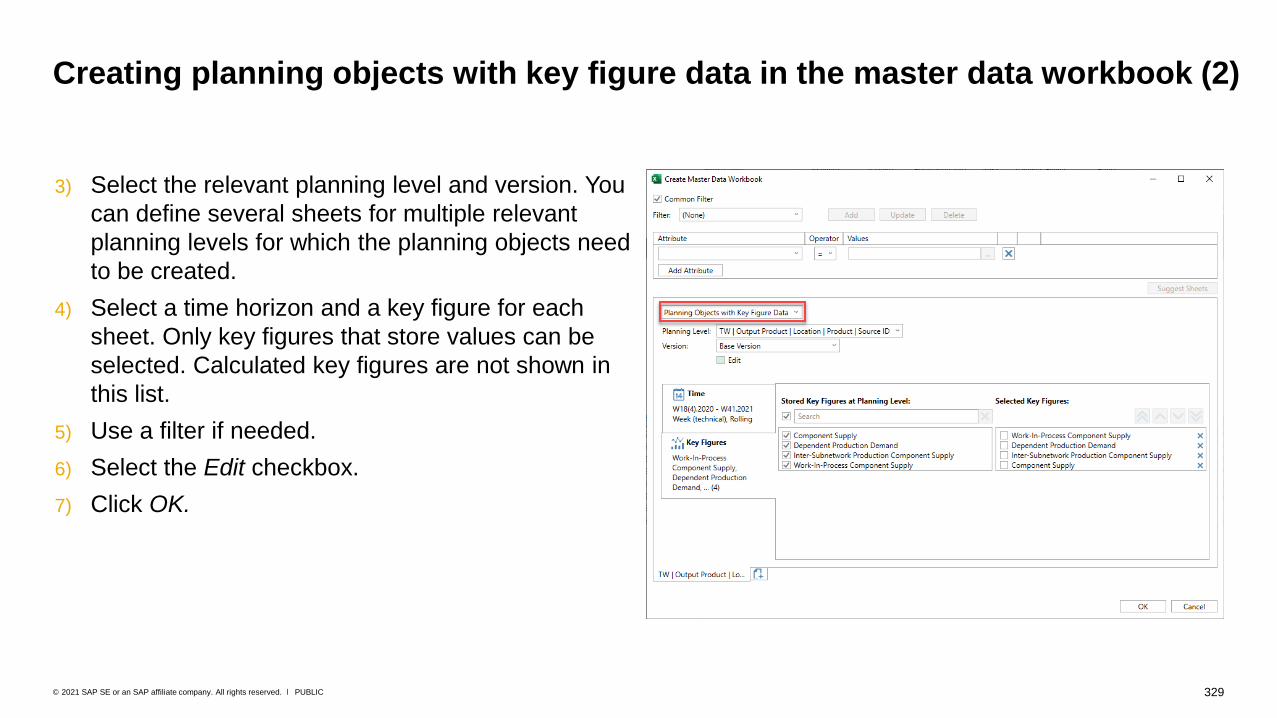
329PUBLIC© 2021 SAP SE or an SAP affiliate company. All rights reserved. ǀ
3) Select the relevant planning level and version. You
can define several sheets for multiple relevant
planning levels for which the planning objects need
to be created.
4) Select a time horizon and a key figure for each
sheet. Only key figures that store values can be
selected. Calculated key figures are not shown in
this list.
5) Use a filter if needed.
6) Select the Edit checkbox.
7) Click OK.
Creating planning objects with key figure data in the master data workbook (2)

330PUBLIC© 2021 SAP SE or an SAP affiliate company. All rights reserved. ǀ
8) The view shows all available planning objects for the selection.
9) Create a new planning object by adding a row or changing data.
10) Click Save Changes.
11) The planning objects are created in the SAP IBP backend. Depending on the data volume, this
task might take some time.
Creating planning objects with key figure data in the master data workbook (3)
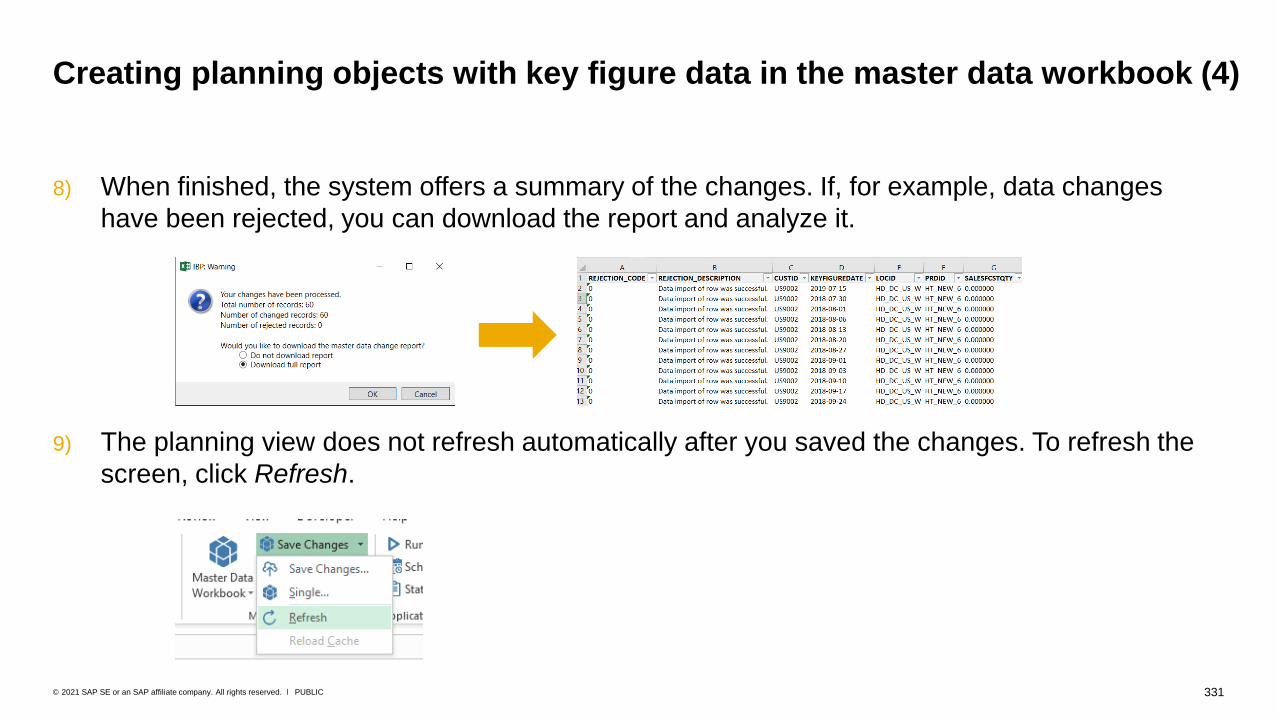
331PUBLIC© 2021 SAP SE or an SAP affiliate company. All rights reserved. ǀ
8) When finished, the system offers a summary of the changes. If, for example, data changes
have been rejected, you can download the report and analyze it.
9) The planning view does not refresh automatically after you saved the changes. To refresh the
screen, click Refresh.
Creating planning objects with key figure data in the master data workbook (4)

332PUBLIC© 2021 SAP SE or an SAP affiliate company. All rights reserved. ǀ
• Edit the master data at base level, for example, overwrite the product ID HT_001 of an existing planning object with the product ID HT_NEW_1 of the new planning object.
• The new product ID must already exist as master data in the SAP IBP backend.
• Click Save Changes.• The system creates the new planning
objects for the new product ID and key figure data using the existing key figure values.
• You need to remove the key figure values if you don’t want them to be copied over to the new planning objects. (Empty cells are copied as NULL values.)
Creating planning objects with key figure data – example (1)
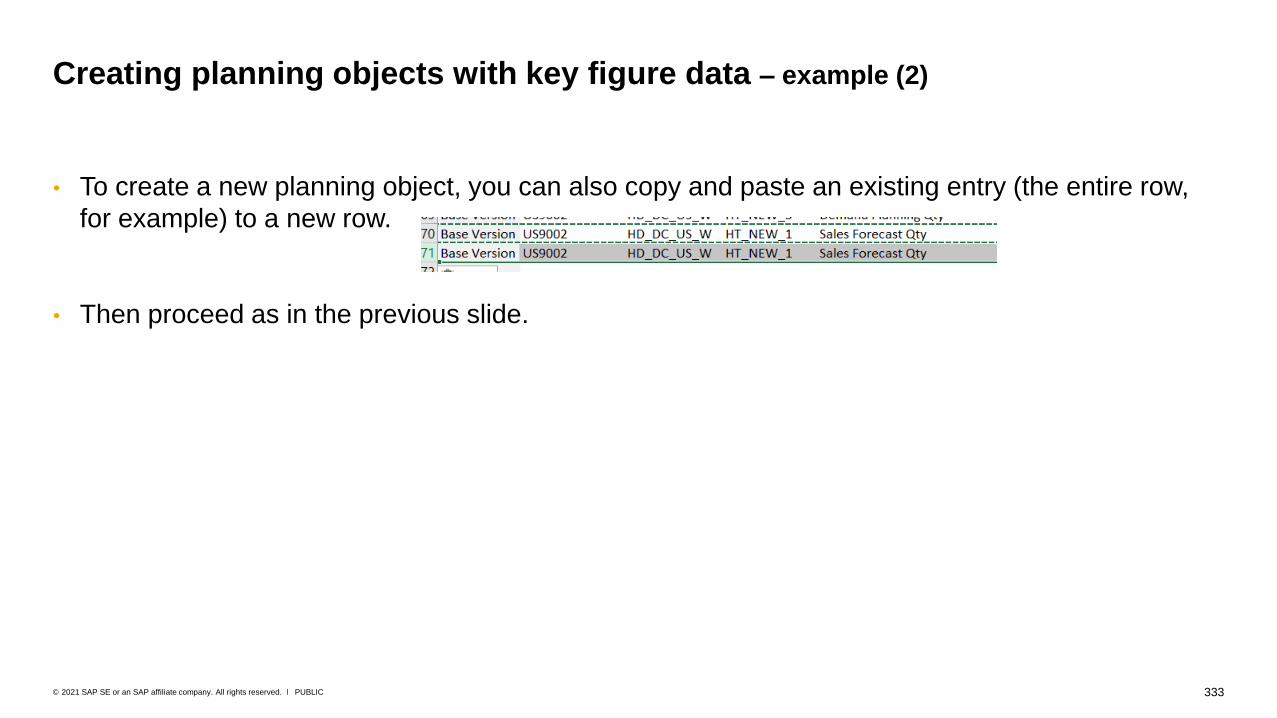
333PUBLIC© 2021 SAP SE or an SAP affiliate company. All rights reserved. ǀ
• To create a new planning object, you can also copy and paste an existing entry (the entire row,
for example) to a new row.
• Then proceed as in the previous slide.
Creating planning objects with key figure data – example (2)

334PUBLIC© 2021 SAP SE or an SAP affiliate company. All rights reserved. ǀ
You can also use the Planning Objects with Key Figure Data view to overwrite the key figure values
for the individual combinations.
Creating planning objects with key figure data – example (3)

Alert Key Figures and Dashboard
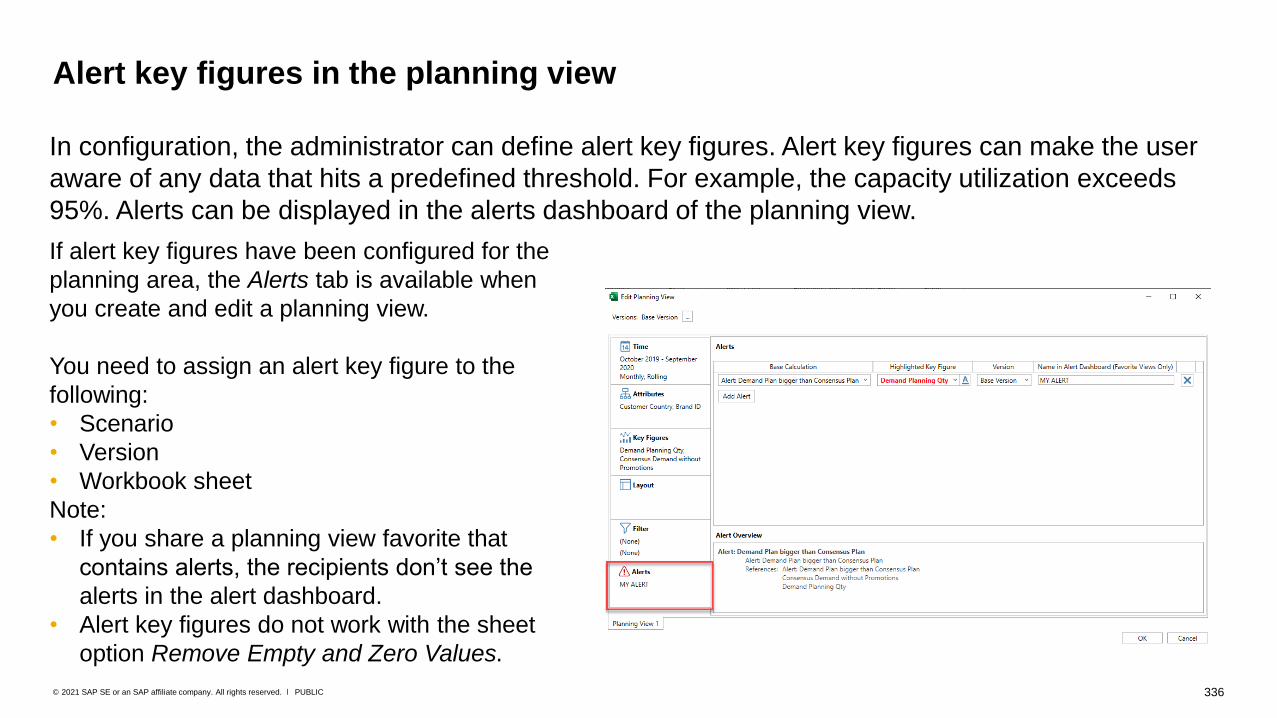
336PUBLIC© 2021 SAP SE or an SAP affiliate company. All rights reserved. ǀ
Alert key figures in the planning view
In configuration, the administrator can define alert key figures. Alert key figures can make the user
aware of any data that hits a predefined threshold. For example, the capacity utilization exceeds
95%. Alerts can be displayed in the alerts dashboard of the planning view.
If alert key figures have been configured for the
planning area, the Alerts tab is available when
you create and edit a planning view.
You need to assign an alert key figure to the
following:
• Scenario
• Version
• Workbook sheet
Note:
• If you share a planning view favorite that
contains alerts, the recipients don’t see the
alerts in the alert dashboard.
• Alert key figures do not work with the sheet
option Remove Empty and Zero Values.
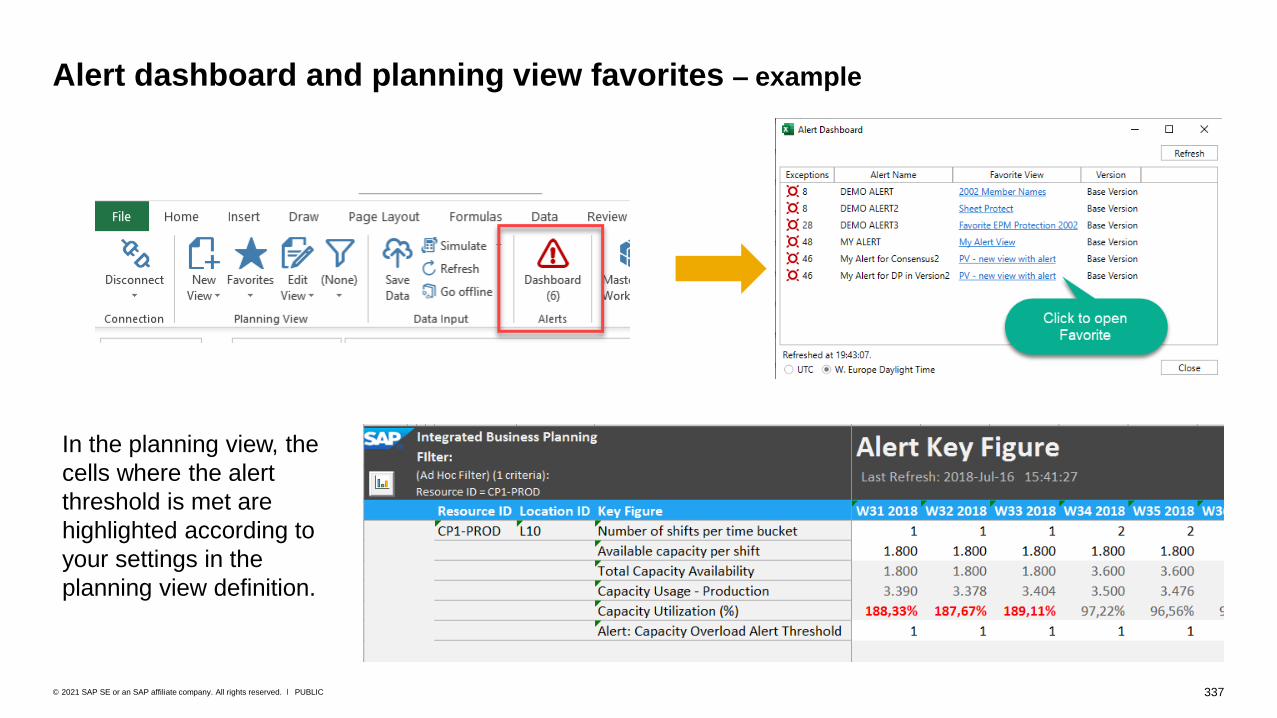
337PUBLIC© 2021 SAP SE or an SAP affiliate company. All rights reserved. ǀ
Alert dashboard and planning view favorites – example
In the planning view, the
cells where the alert
threshold is met are
highlighted according to
your settings in the
planning view definition.

338PUBLIC© 2021 SAP SE or an SAP affiliate company. All rights reserved. ǀ
An alert is only displayed in the alert dashboard if:
1) The planning view which contains the alert key figure definition has been saved as a favorite
planning view.
2) The Name in Alert Dashboard (Favorite Views Only) field has been filled.
Please note that the alerts in the alert dashboard are constantly recalculated by the system. This
can have an impact on the performance.
Alert dashboard
S&OP Task Management

340PUBLIC© 2021 SAP SE or an SAP affiliate company. All rights reserved. ǀ
S&OP task management
• Open tasks that have been assigned
to you as part of an S&OP process
step can be visualized in the Excel
add-in.
• Process, process step details, and
progress can be seen as well.
• You can close tasks in the Excel add-
in.
• Tasks can be grouped and sorted by
the following:
• Process
• Priority
• Due date
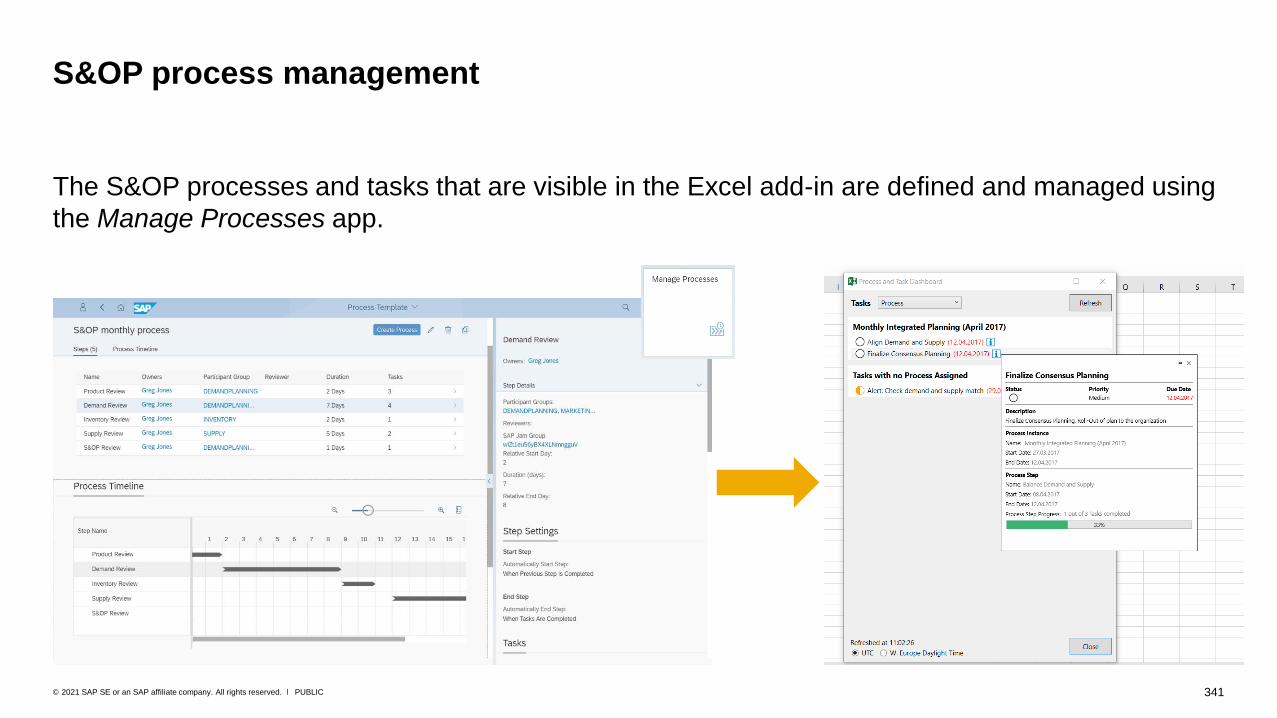
341PUBLIC© 2021 SAP SE or an SAP affiliate company. All rights reserved. ǀ
The S&OP processes and tasks that are visible in the Excel add-in are defined and managed using
the Manage Processes app.
S&OP process management
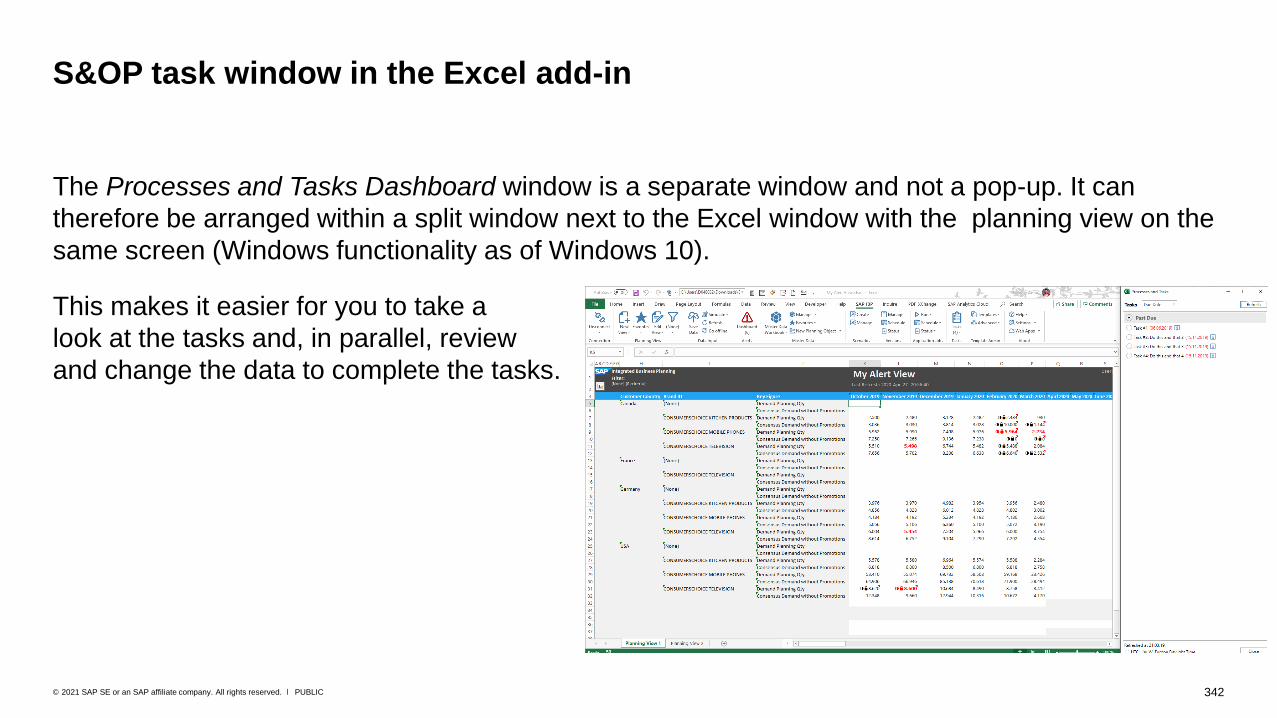
342PUBLIC© 2021 SAP SE or an SAP affiliate company. All rights reserved. ǀ
The Processes and Tasks Dashboard window is a separate window and not a pop-up. It can
therefore be arranged within a split window next to the Excel window with the planning view on the
same screen (Windows functionality as of Windows 10).
This makes it easier for you to take a
look at the tasks and, in parallel, review
and change the data to complete the tasks.
S&OP task window in the Excel add-in

Navigation to Web User Interface (UI)
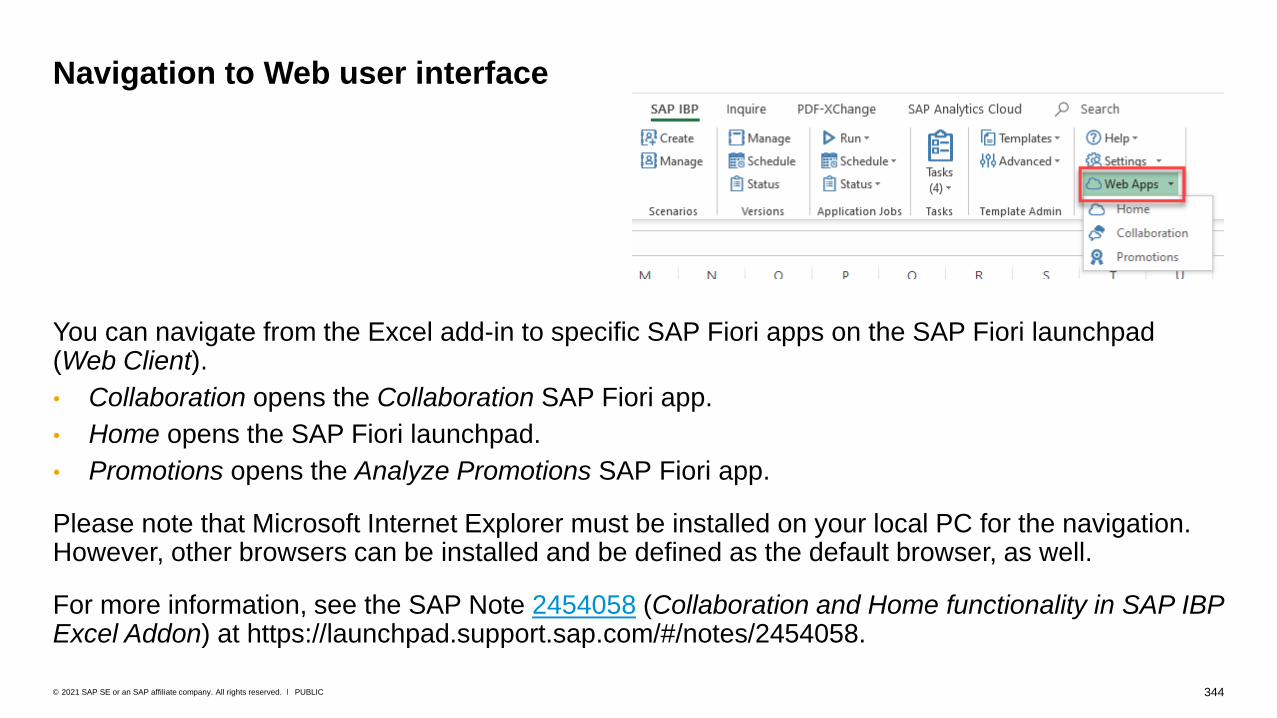
344PUBLIC© 2021 SAP SE or an SAP affiliate company. All rights reserved. ǀ
You can navigate from the Excel add-in to specific SAP Fiori apps on the SAP Fiori launchpad (Web Client).
• Collaboration opens the Collaboration SAP Fiori app.
• Home opens the SAP Fiori launchpad.
• Promotions opens the Analyze Promotions SAP Fiori app.
Please note that Microsoft Internet Explorer must be installed on your local PC for the navigation. However, other browsers can be installed and be defined as the default browser, as well.
For more information, see the SAP Note 2454058 (Collaboration and Home functionality in SAP IBP Excel Addon) at https://launchpad.support.sap.com/#/notes/2454058.
Navigation to Web user interface

Help and Additional Information

346PUBLIC© 2021 SAP SE or an SAP affiliate company. All rights reserved. ǀ
Help
About: Know which Excel add-in
version is installed
Connection Speed: Check the
response times of the server
and the network
Connection Time Out Check:
Checks how long it takes to
reach time out and whether the
network is set up properly.
This feature is designed mainly
for administrators and
consultants.
The About area of the Excel add-in provides help and additional information.

347PUBLIC© 2021 SAP SE or an SAP affiliate company. All rights reserved. ǀ
Log
The SAP IBP log is a technical log that can
be used to perform a more detailed error
analysis.
If you encounter issues with the Excel add-
in, your administrator or the SAP support
team might ask to provide the log file.
To find the location of the log file on your
PC, select Log from the Help menu, and
use the path at the bottom of the window.
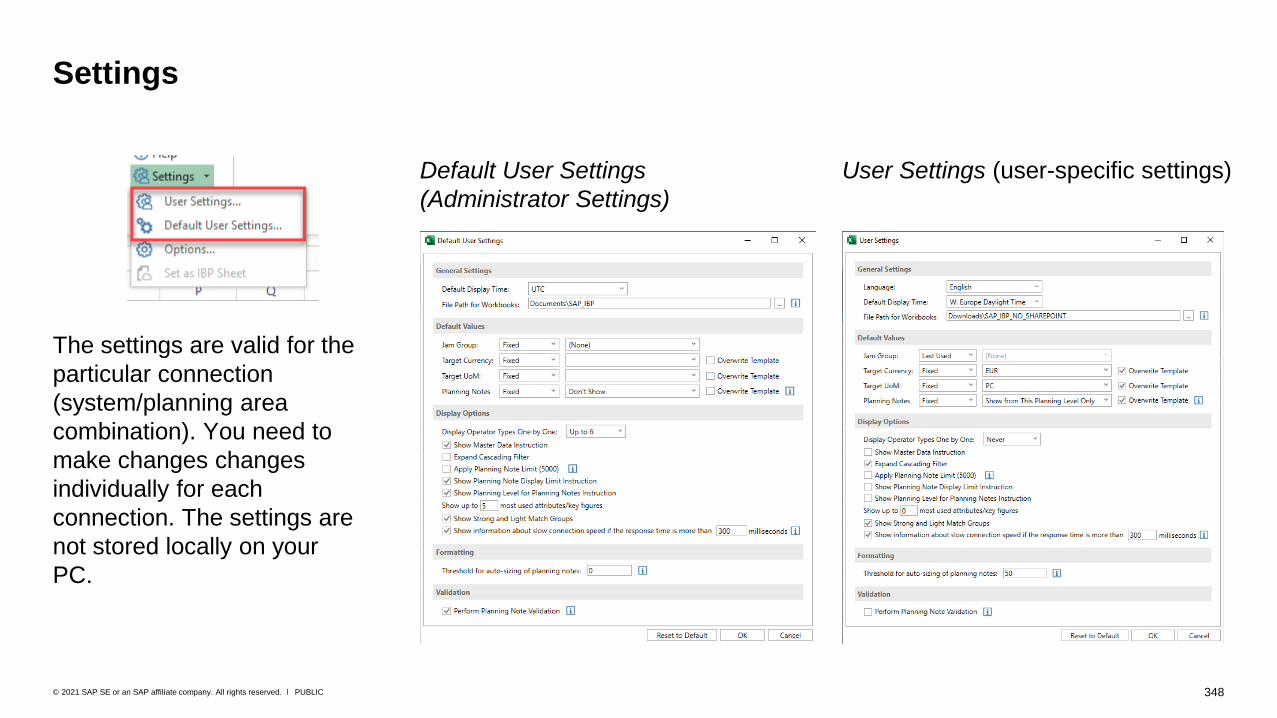
348PUBLIC© 2021 SAP SE or an SAP affiliate company. All rights reserved. ǀ
Settings
Default User Settings
(Administrator Settings)
User Settings (user-specific settings)
The settings are valid for the
particular connection
(system/planning area
combination). You need to
make changes changes
individually for each
connection. The settings are
not stored locally on your
PC.

349PUBLIC© 2021 SAP SE or an SAP affiliate company. All rights reserved. ǀ
Settings – general settings
• Language: You can change the language for the Excel add-in. All Excel add-in controls are
displayed in the selected language.
• Default Display Time: You can decide in which default time zone the dates and times are
shown (in the planning operator logs, for example).
• File Path for Workbooks: When you open a template or favorite planning view, the workbook
is downloaded from the SAP IBP backend and copied to a certain share. From there, it is
opened on your PC. This file path determines the storage location. For performance
considerations, it is recommended that you store the workbook in a folder on your local PC
instead of a network share.
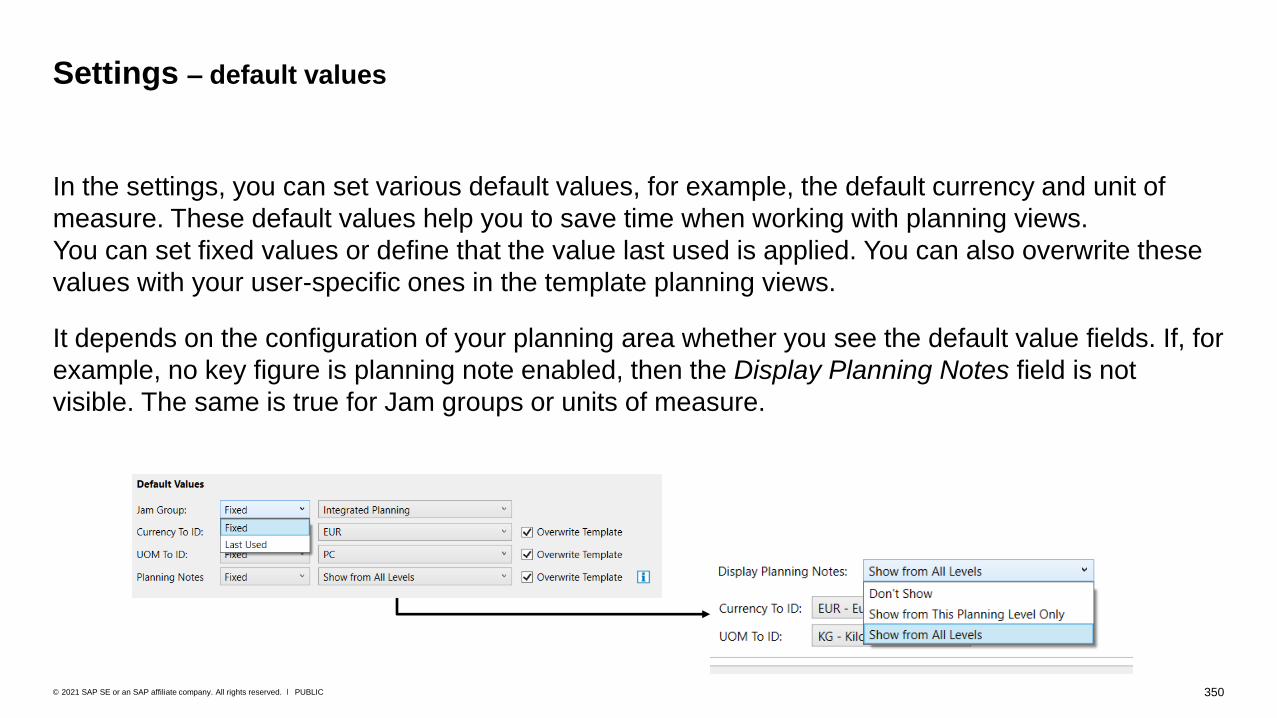
350PUBLIC© 2021 SAP SE or an SAP affiliate company. All rights reserved. ǀ
In the settings, you can set various default values, for example, the default currency and unit of
measure. These default values help you to save time when working with planning views.
You can set fixed values or define that the value last used is applied. You can also overwrite these
values with your user-specific ones in the template planning views.
It depends on the configuration of your planning area whether you see the default value fields. If, for
example, no key figure is planning note enabled, then the Display Planning Notes field is not
visible. The same is true for Jam groups or units of measure.
Settings – default values
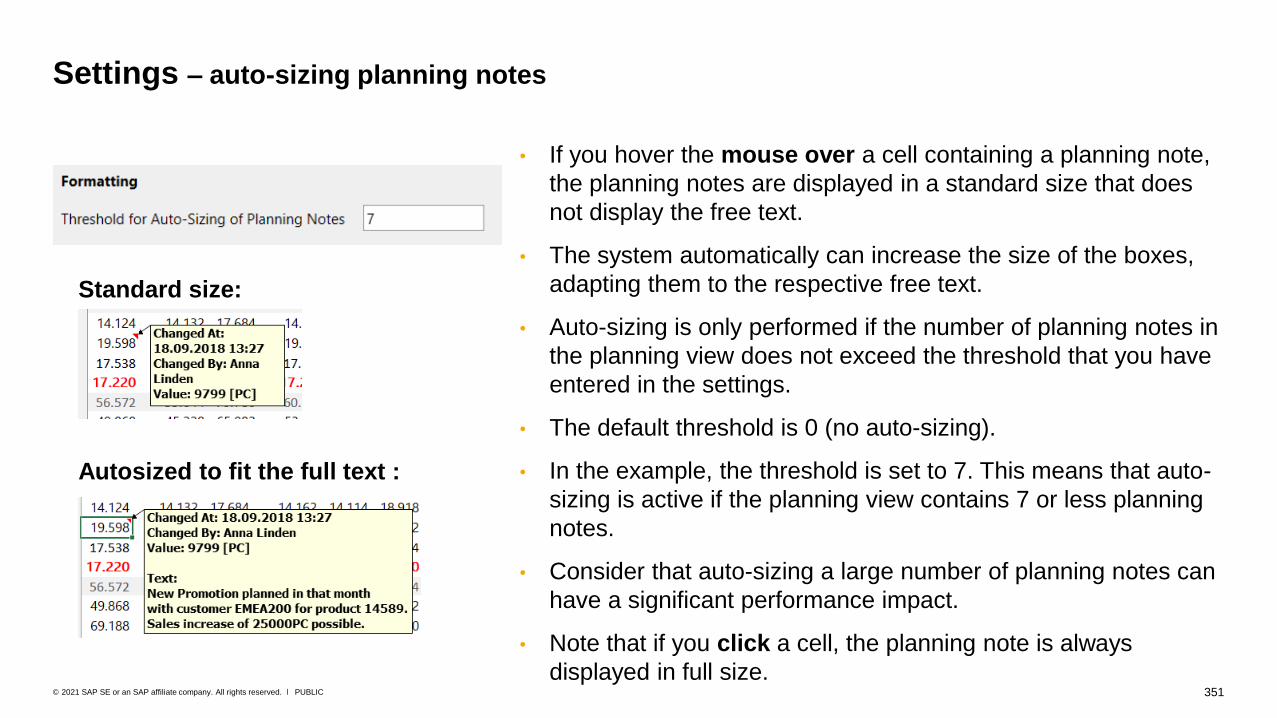
351PUBLIC© 2021 SAP SE or an SAP affiliate company. All rights reserved. ǀ
Settings – auto-sizing planning notes
Standard size:
Autosized to fit the full text :
• If you hover the mouse over a cell containing a planning note,
the planning notes are displayed in a standard size that does
not display the free text.
• The system automatically can increase the size of the boxes,
adapting them to the respective free text.
• Auto-sizing is only performed if the number of planning notes in
the planning view does not exceed the threshold that you have
entered in the settings.
• The default threshold is 0 (no auto-sizing).
• In the example, the threshold is set to 7. This means that auto-
sizing is active if the planning view contains 7 or less planning
notes.
• Consider that auto-sizing a large number of planning notes can
have a significant performance impact.
• Note that if you click a cell, the planning note is always
displayed in full size.
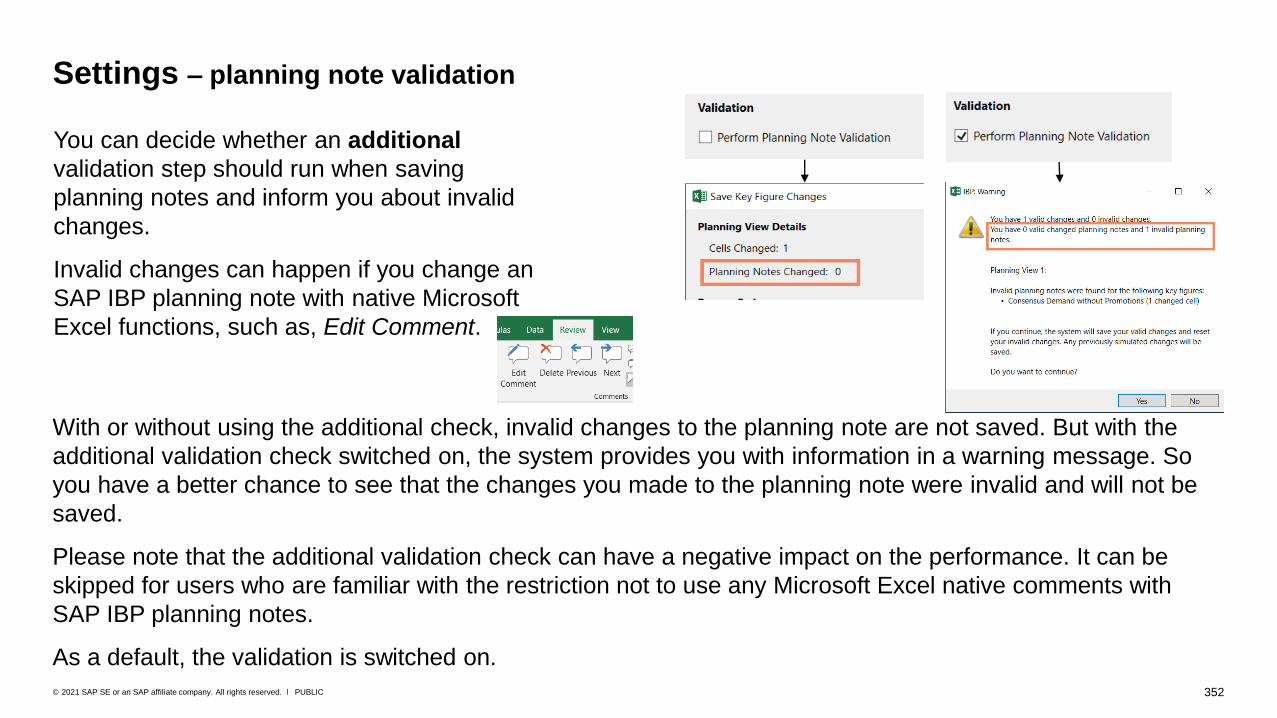
352PUBLIC© 2021 SAP SE or an SAP affiliate company. All rights reserved. ǀ
Settings – planning note validation
You can decide whether an additional
validation step should run when saving
planning notes and inform you about invalid
changes.
Invalid changes can happen if you change an
SAP IBP planning note with native Microsoft
Excel functions, such as, Edit Comment.
With or without using the additional check, invalid changes to the planning note are not saved. But with the
additional validation check switched on, the system provides you with information in a warning message. So
you have a better chance to see that the changes you made to the planning note were invalid and will not be
saved.
Please note that the additional validation check can have a negative impact on the performance. It can be
skipped for users who are familiar with the restriction not to use any Microsoft Excel native comments with
SAP IBP planning notes.
As a default, the validation is switched on.

353PUBLIC© 2021 SAP SE or an SAP affiliate company. All rights reserved. ǀ
Depending on how many planning operators are assigned to your planning area, the list in the
Application Jobs group in the Excel add-in ribbon can get rather long. In the Display Operator Types
One by One field, you can enter how many planning operators or application jobs are listed.
Choose Never if no individual application jobs should be displayed.
Choose, for example, Up to 6 to show up to six individual application jobs:
If more than 6 application jobs are assigned to your planning area, no application jobs are
displayed (same as the Never option).
Settings – display options (1)
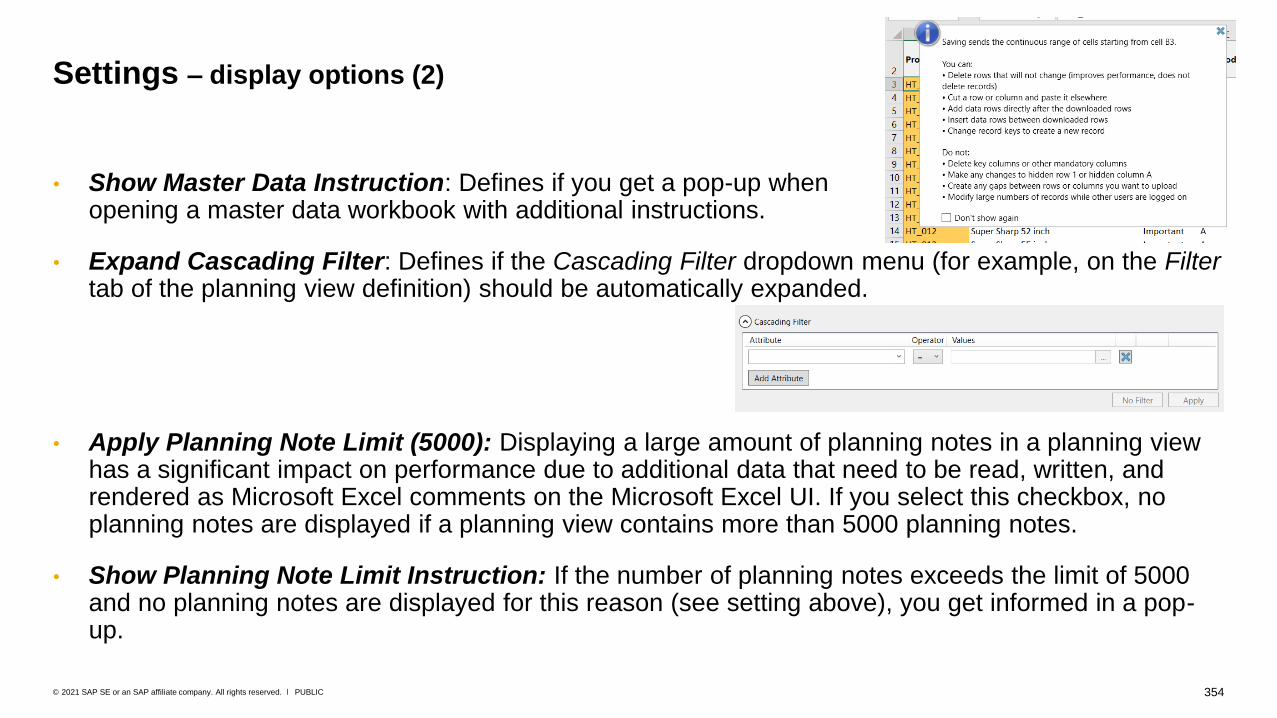
354PUBLIC© 2021 SAP SE or an SAP affiliate company. All rights reserved. ǀ
• Show Master Data Instruction: Defines if you get a pop-up whenopening a master data workbook with additional instructions.
• Expand Cascading Filter: Defines if the Cascading Filter dropdown menu (for example, on the Filtertab of the planning view definition) should be automatically expanded.
• Apply Planning Note Limit (5000): Displaying a large amount of planning notes in a planning view has a significant impact on performance due to additional data that need to be read, written, and rendered as Microsoft Excel comments on the Microsoft Excel UI. If you select this checkbox, no planning notes are displayed if a planning view contains more than 5000 planning notes.
• Show Planning Note Limit Instruction: If the number of planning notes exceeds the limit of 5000 and no planning notes are displayed for this reason (see setting above), you get informed in a pop-up.
Settings – display options (2)
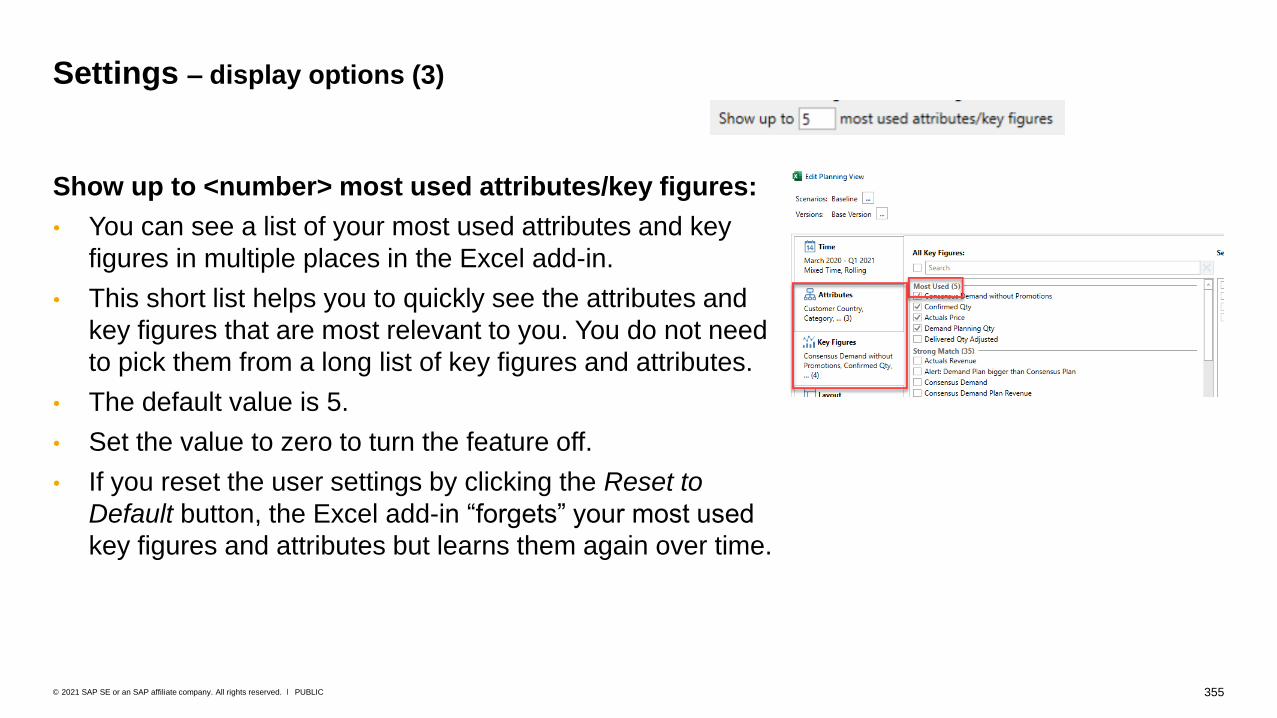
355PUBLIC© 2021 SAP SE or an SAP affiliate company. All rights reserved. ǀ
Show up to <number> most used attributes/key figures:
• You can see a list of your most used attributes and key
figures in multiple places in the Excel add-in.
• This short list helps you to quickly see the attributes and
key figures that are most relevant to you. You do not need
to pick them from a long list of key figures and attributes.
• The default value is 5.
• Set the value to zero to turn the feature off.
• If you reset the user settings by clicking the Reset to
Default button, the Excel add-in “forgets” your most used
key figures and attributes but learns them again over time.
Settings – display options (3)

356PUBLIC© 2021 SAP SE or an SAP affiliate company. All rights reserved. ǀ
If the attributes and key figure list in the planning
view settings should use the strong-match group
and the light-match group, select the Show Strong
and Light Match Groups checkbox.
Settings – display options (4)

357PUBLIC© 2021 SAP SE or an SAP affiliate company. All rights reserved. ǀ
In the message history window, you can see all of
the warning and error messages you’ve received since
your last logon to the SAP IBP system.
This is useful if you closed a
error/warning pop-up, and want to review
the information, or when you face issues
and need to inform your administrator.
In the second case, you can send a
screenshot of the respective
warning/error message for
further analysis.
Message history
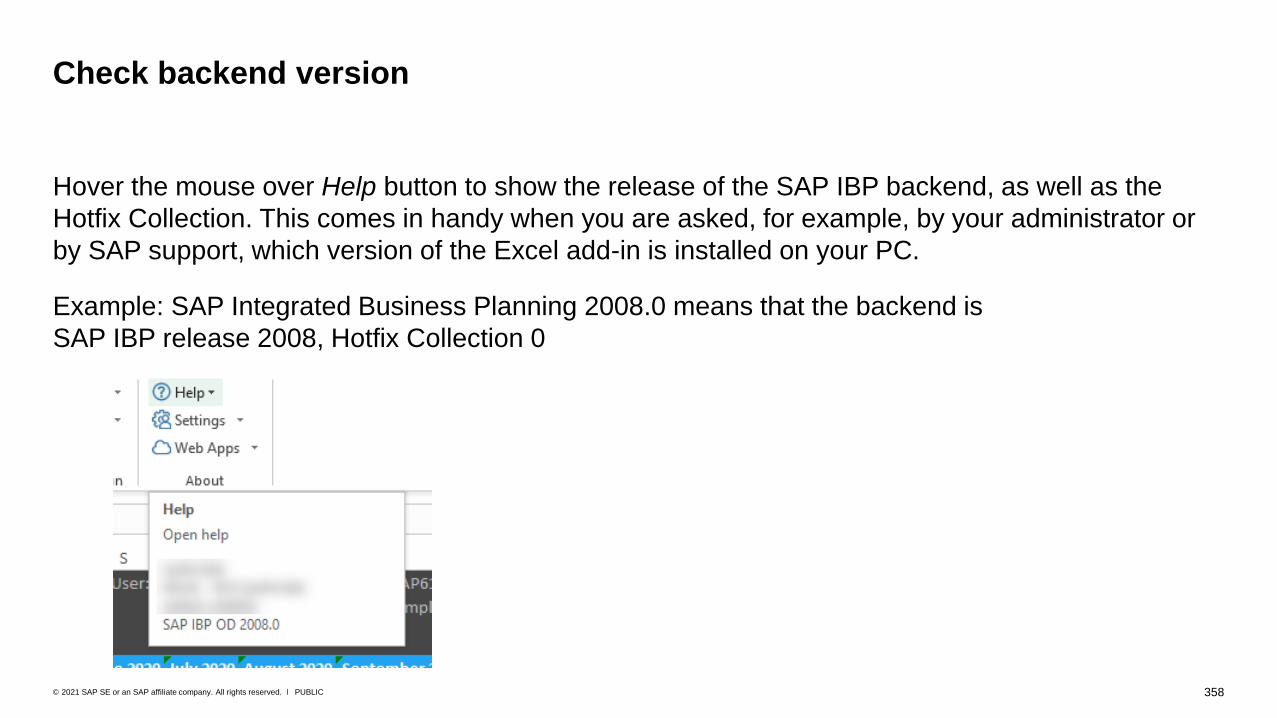
358PUBLIC© 2021 SAP SE or an SAP affiliate company. All rights reserved. ǀ
Hover the mouse over Help button to show the release of the SAP IBP backend, as well as the
Hotfix Collection. This comes in handy when you are asked, for example, by your administrator or
by SAP support, which version of the Excel add-in is installed on your PC.
Example: SAP Integrated Business Planning 2008.0 means that the backend is
SAP IBP release 2008, Hotfix Collection 0
Check backend version

Logging Off and Troubleshooting
Disabled Excel add-ins
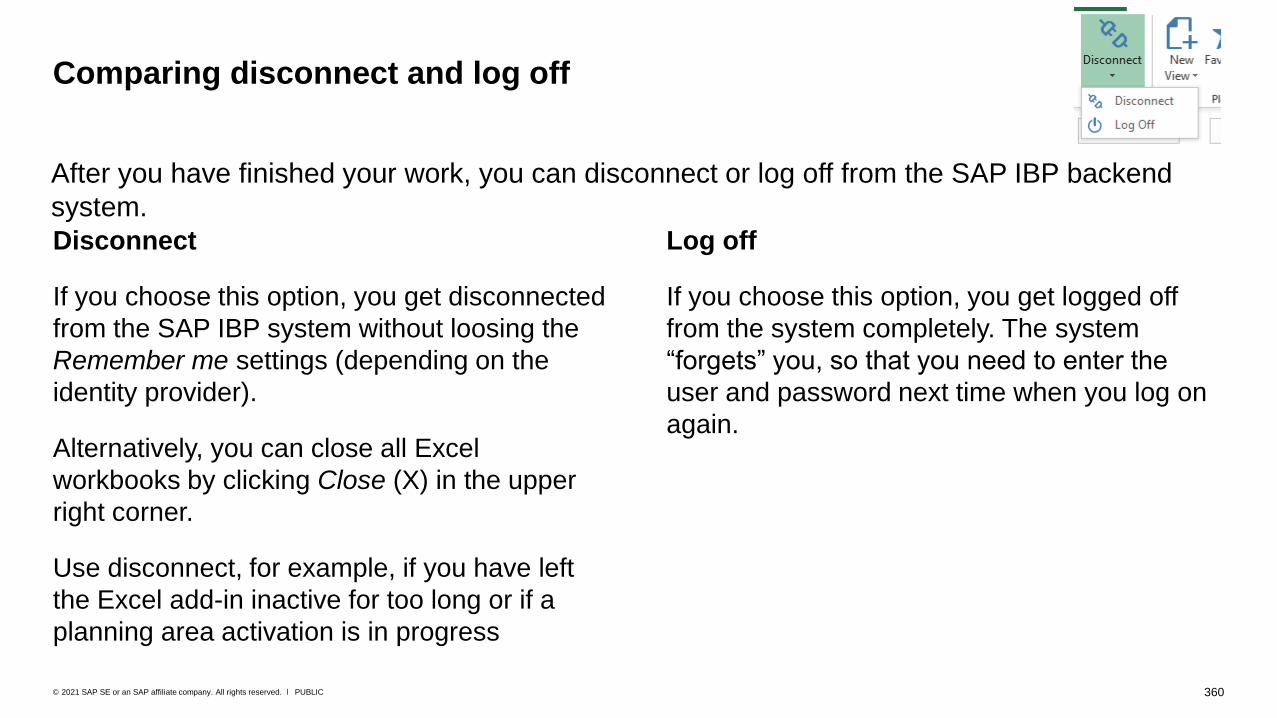
360PUBLIC© 2021 SAP SE or an SAP affiliate company. All rights reserved. ǀ
Log off
If you choose this option, you get logged off
from the system completely. The system
“forgets” you, so that you need to enter the
user and password next time when you log on
again.
Disconnect
If you choose this option, you get disconnected
from the SAP IBP system without loosing the
Remember me settings (depending on the
identity provider).
Alternatively, you can close all Excel
workbooks by clicking Close (X) in the upper
right corner.
Use disconnect, for example, if you have left
the Excel add-in inactive for too long or if a
planning area activation is in progress
After you have finished your work, you can disconnect or log off from the SAP IBP backend
system.
Comparing disconnect and log off
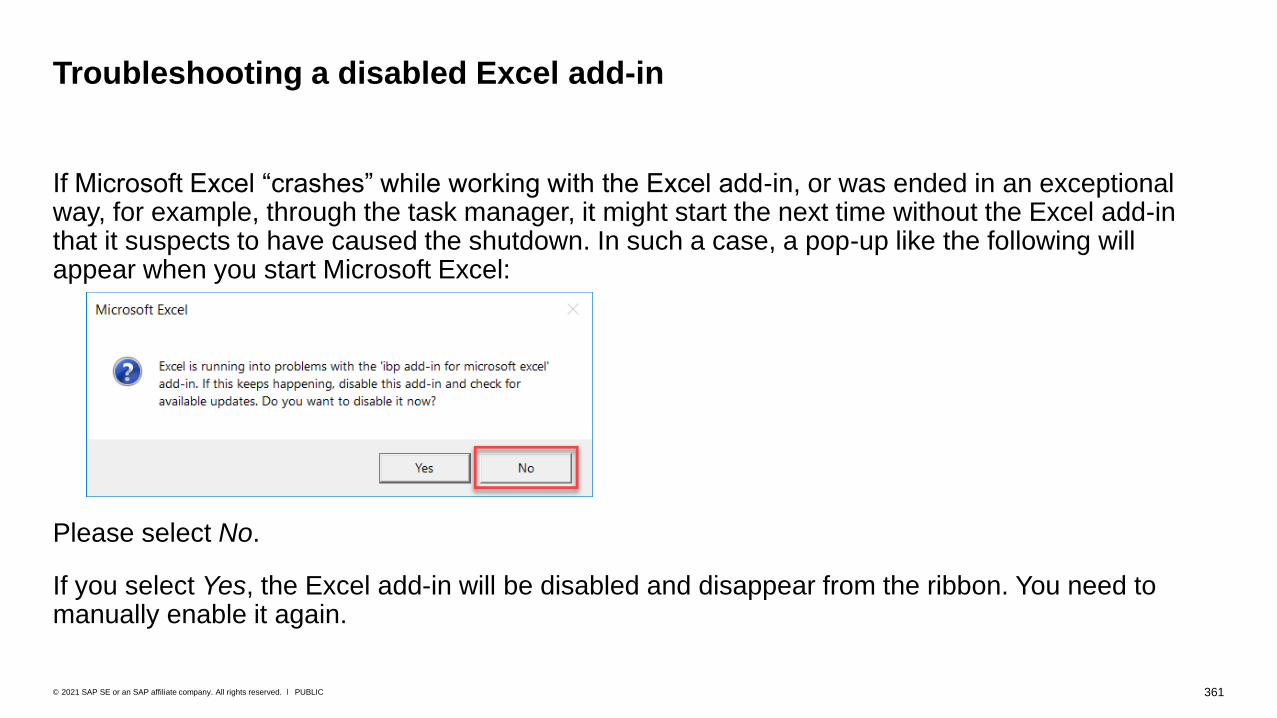
361PUBLIC© 2021 SAP SE or an SAP affiliate company. All rights reserved. ǀ
If Microsoft Excel “crashes” while working with the Excel add-in, or was ended in an exceptional way, for example, through the task manager, it might start the next time without the Excel add-in that it suspects to have caused the shutdown. In such a case, a pop-up like the following will appear when you start Microsoft Excel:
Please select No.
If you select Yes, the Excel add-in will be disabled and disappear from the ribbon. You need to manually enable it again.
Troubleshooting a disabled Excel add-in

362PUBLIC© 2021 SAP SE or an SAP affiliate company. All rights reserved. ǀ
If the SAP IBP menu has disappeared from the Microsoft Excel ribbon, a likely reason is that it has
been disabled.
How to enable the Excel add-in:
• In Microsoft Excel, choose File → Options → Add-Ins.
• Select Manage: COM Add-Ins and choose Go.
• Select SAP IBP, add-in for Microsoft Excel and choose OK.
How to enable the Excel add-in (1)

363PUBLIC© 2021 SAP SE or an SAP affiliate company. All rights reserved. ǀ
Try starting the Excel add-in via the desktop shortcut or the Windows programs.
Please note that this option is only available if your administrator has enabled it.
How to enable the Excel add-in (2)

© 2021 SAP SE or an SAP affiliate company. All rights reserved.
No part of this publication may be reproduced or transmitted in any form or for any purpose without the express permission of
SAP SE or an SAP affiliate company.
The information contained herein may be changed without prior notice. Some software products marketed by SAP SE and its
distributors contain proprietary software components of other software vendors. National product specifications may vary.
These materials are provided by SAP SE or an SAP affiliate company for informational purposes only, without representation or
warranty of any kind, and SAP or its affiliated companies shall not be liable for errors or omissions with respect to the materials.
The only warranties for SAP or SAP affiliate company products and services are those that are set forth in the express warranty
statements accompanying such products and services, if any. Nothing herein should be construed as constituting an additional
warranty.
In particular, SAP SE or its affiliated companies have no obligation to pursue any course of business outlined in this document or
any related presentation, or to develop or release any functionality mentioned therein. This document, or any related presentation,
and SAP SE’s or its affiliated companies’ strategy and possible future developments, products, and/or platforms, directions, and
functionality are all subject to change and may be changed by SAP SE or its affiliated companies at any time for any reason
without notice. The information in this document is not a commitment, promise, or legal obligation to deliver any material, code, or
functionality. All forward-looking statements are subject to various risks and uncertainties that could cause actual results to differ
materially from expectations. Readers are cautioned not to place undue reliance on these forward-looking statements, and they
should not be relied upon in making purchasing decisions.
SAP and other SAP products and services mentioned herein as well as their respective logos are trademarks or registered
trademarks of SAP SE (or an SAP affiliate company) in Germany and other countries. All other product and service names
mentioned are the trademarks of their respective companies.
See www.sap.com/trademark for additional trademark information and notices.
www.sap.com/contactsap
Follow us