emerald_jsma_jsma575195 1..25
TRANSCRIPT

QUERY FORM
JOURNAL: Journal of Strategy and Management
VOL/ISSUE NO: 8/4
ARTICLE NO: 575195
ARTICLE TITLE: Strategic collaboration management between Indian oil marketing and
auto-service companies: an empirical study
AUTHORS: Debabrata Bhattacharjee, Anand Prakash and Rajendra PrasadMohanty
Note to Editors: The queries listed in the table below are for the Author. Please ignore
these queries.
Note to Authors: During the production of your article we came across the following
queries listed in the table below. Please review the queries and insert
your reply or correction at the corresponding line in the PDF proof of
the article which follows this query page.
No. Queries
Q1 Please provide further publication details in reference: Ghosh et al. (2011).
Q2 Please provide the city location of publisher in reference: Tiwari and Herstatt (2014).
Q3 Please confirm the change of authors name from D. Bhattacharjee to Debabrata Bhattacharjeeand from Prof. R. P. Mohanty to Dr Rajendra Prasad Mohanty in author biography section as perthe metadata.
Q4 Please provide the link for “*” and “**” in Table III.
Strategic collaborationmanagement betweenIndian oil marketing
and auto-service companiesAn empirical studyDebabrata Bhattacharjee
Marketing Division, Indian Oil Corporation Limited, Mumbai, IndiaAnand Prakash
School of General Management, NationalInstitute of Construction Management and Research, Pune, India, and
Rajendra Prasad MohantyICFAI Group of Universities, Hyderabad, India
AbstractPurpose – The downstream oil marketing companies (OMCs) have an opportunity to compensatetheir huge under-recovery by increasing non-fuel revenues through strategic planning forcollaboration with organized companies (OCs) of auto-servicing sector, who are experiencing asurge in the demand for auto-servicing. The purpose of this paper is to explore the business need forstrategic collaboration and empirically validate the building mechanism for collaborative capacitiesbetween the two sectors (OMCs and OCs).Design/methodology/approach – The paper is designed to explore the implementationof collaboration using needs analysis, exploratory factor analysis and structural equation modellingprocess for building collaborative capacities between the two sectors.Findings – Although alignment is a necessary condition before allowing for a valid collaborationbetween the two sectors, the external alignment process is highly significant for implementingcollaboration unlike the internal alignment process.Research limitations/implications – Methodological limitations include the use of conveniencesampling and anonymous survey-based research.Practical implications – Selecting the “right” identified factors for collaboration is unquestionablyone of the most important topics in the collaboration literature, which holds vast practical implications.Originality/value – This study provides practical and theoretical insights for implementingcollaboration based on empirical results.Keywords Structural equation modelling, Collaboration, Supply chain management,Strategic management, Auto-service companies, Oil marketingPaper type Research paper
1. IntroductionThe oil and gas sector consists of three segments – upstream, midstream anddownstream. The upstream segment is primarily comprised of companies that areengaged in exploration and production activities, while the midstream segment
Journal of Strategy andManagementVol. 8 No. 4, 2015pp. 1-25©EmeraldGroup Publishing Limited1755-425XDOI 10.1108/JSMA-09-2014-0084
Received 27 September 2014Revised 1 March 201517 April 201521 April 20151 May 2015Accepted 1 May 2015
The current issue and full text archive of this journal is available on Emerald Insight at:www.emeraldinsight.com/1755-425X.htm
The authors express their gratitude to the anonymous reviewers and to Professor NicholasO’Regan, Editor, Journal of Strategy and Management for their insightful comments to make thispaper value adding.
1
JSMA8,4

comprises companies in storage and transportation, and the downstream segmentcomprises companies that are engaged in refining, processing and marketing ofpetroleum products (IBEF, 2013). Public sector oil marketing companies (OMCs) in thedownstream sector in India have experienced a very challenging phase due to policiesof the Government of India (GOI). There is severe under-recovery in regulated andsubsidized prices of diesel, kerosene sold through public distribution system (PDS) anddomestic liquid petroleum gas (LPG) sold by OMCs (Bhattacharjee et al., 2013).Under the financial burden sharing mechanism, the under-recovery incurred by theOMCs is partially compensated by the GOI and by the upstream oil companies. Thoughthe price of diesel is being decontrolled since January 2013 in a phased manner,the prices of kerosene and LPG continue to be subsidized (Bhat, 2014).
This situation led the OMCs to think more innovatively to generate additionalrevenue from non-conventional sources. In the retail arena, it is the business fornon-fuel revenues (NFR) business that is gaining importance day by day. Eachcompany is making efforts to add more services by leasing a part of their premises tocompanies that offer services such as fast food, supermarkets, banking, tyres, batteriesand accessories, pharmacies and many such areas including automobile services.With the entry of private and multinational companies (MNCs), the OMCs have noother option but to compete with these companies by attracting more customers byproviding facilities like automated fuel filling, petro card and other allied services(Kishore and Patel, 2012). With nearly 50,000 petrol pumps across the entire country,this provides a huge opportunity to generate NFR (Rai et al., 2012).
The automobile sector in India is growing steadily. During the last decade thesector has grown at a compounded annual growth rate (CAGR) of nearly 10 per cent(Tiwari and Herstatt, 2014). According to Boston Consultancy Group (BCG, 2013), whilethe current economic conditions have challenged the short term growth scenario ofthe sector, the long term prospects are expected to remain robust owing to strongfundamental demand and supply factors. BCG (2013) report estimates that the Indianautomobile industry size is at US$80 billion. Along with the mammoth increase inthe number of vehicles, and the advancement of vehicle technology, the demand ofprofessional services has increased many fold.
To cope up with the demand, the original equipment manufacturers (OEMs) arerequired to increase their service network. But due to very high real estate cost andhigh involvement of working capital in establishing service centres, the auto-OEMs arefinding it difficult to expand at that desired rate. As a result, most of service businesspertaining to maintenance and repairs is in the hands of unincorporated privateenterprises owned by individuals or households engaged in the sale or production ofgoods and services operated on a proprietary or partnership basis and with less thanten total workers (Sengupta, 2007), we term these as “the unorganized”. There is also agrowing segment of organized service providers aggressively competing for business.
Though huge business potential and a growing demand in professional services inthe auto-service sector exists, there is hardly any synergy found in India between theOMCs and organized companies (OCs) to set up service units at petrol pumps by whichthe OMCs can maximize the NFR and the OCs can increase the reach of their servicenetwork through strategic collaboration between them. Though different collaborationmodels and processes have been prescribed by many researchers, there is no empiricalvalidation of any strategic collaboration model between the two sectors.
This study intends to establish the business need for strategic collaborationbetween OMCs of downstream oil sector and OCs of auto-servicing sector and provides
2
Strategiccollaborationmanagement
direction, purpose and rationale for validating the model of collaboration. To approachthis objective, exploratory factor analysis (EFA) on environmental items in themarketplace responsible for collaboration is carried out in order to make constructiveand valid suggestions on implementable market actions. The study has been limitedto passenger vehicle segment only, as the service buying behaviour is different indifferent segments of vehicles and petrol pumps are preferred locations for autocare services for passenger vehicles all over the world.
2. Sector analysisIt may be worthwhile to explain the two sectors that may be useful for properunderstanding of the problems and the need for strategic collaboration.
2.1 Oil sectorIndian downstream oil sector is predominantly dominated by three Public SectorUndertaking (PSU) companies namely Indian Oil Corporation Ltd, HindustanPetroleum Corporation Ltd and Bharat Petroleum Corporation Ltd. Besides them, Oiland Natural Gas Corporation Ltd, the largest company in upstream sector, is alsopresent in the downstream segment. There are also a few joint venture companies ofPSUs like Mangalore Refinery and Petrochemicals Ltd and Numaligarh Refinery Ltdwho are also present in this segment of oil sector. Among the private players, RelianceIndustries Ltd with their group company Reliance Petroleum Ltd and Essar Oil Ltd arethe major players. All these companies are present in refining and marketing ofpetroleum products in the country. Shell is another private MNC who is present only inretailing of fuels and lubricants. The number of retail outlets, commonly known aspetrol pumps, is one of the yardsticks for showing the presence of these companies inthe country. As these are the primary touch points for the automobiles, this study isfocused only in this area to assess their linkage with OCs of auto-service sector.
To protect the consumer from the impact of a rise in oil prices in the internationalmarket and in view of the domestic inflationary conditions, the GOI continues to modulatethe retail selling prices of diesel, domestic LPG and PDS kerosene at administered priceand the prices of such products are not revised in line with the prices in the internationalmarket, resulting in incurrence of under-recovery to the OMCs on sale of these products(Singh, 2013). The under-recovery figures on sensitive petroleum products set to comedown by 20 per cent to Indian rupees(INR) 1,110 billion in 2014-15 from INR 1398.69 billionduring 2013-2014 owing to the decline in subsidy on diesel and rupee appreciation (IndianOil & Gas, 2014). This situation has prompted the OMCs to generate NFR from the petrolpumps. One of the potential areas for such NFR is auto care services. In most developedeconomies like the USA, France and rest of Europe; the contribution of NFR for thepetroleum retailers are highly significant nearly 39, 25 and 15 per cent respectively(Kotwala, 2005). In UAE, the contribution of NFR averages 12~15 per cent for differentplayers. In India, the contribution of NFR is less than 1 per cent (Kishore and Patel, 2012).
2.2 Auto-service sectorIndia is now the sixth largest passenger vehicle manufacturer in the world (BCG, 2013).On the global map, India has developed as the hub for small car development withpotential as a supply hub for “sport utility vehicles”. In addition to the strong domesticdemand, the OEMs have also been positioning themselves as competitive small carmakers, benefitting from India’s technological capabilities in the manufacturing small cars,economies of scale and a well-established component supplier base (Ghosh et al., 2011).
3
JSMA8,4

There were only four Indian companies in the passenger vehicles segment. Afterthe success of Maruti Udyog Limited, a joint venture with Suzuki, Japan andliberalization of the economy in early 1990s, there has been regular entry of foreignOEMs. As the GOI is allowing 100 per cent foreign direct investment, the growthin investment by MNCs is substantial.
There is huge growth in all segments of the automobile industry. The CAGR duringlast 15 years in passenger vehicles segment is 8.9 per cent (Tiwari and Herstatt, 2014).Though there has been downward trend in the last couple of years, the current politicaland socio-economic condition indicates that the trend will be reversed. The majorgrowth drivers for such exemplary performance in domestic sales of passengervehicles are steady economic growth, favourable demographic profile, rising per capitagross domestic product, rising disposable income levels, relatively low-penetrationlevels, availability of finance at competitive rates and shift of demand scenarioto smaller towns and rural areas (Ghosh et al., 2011).
The services in passenger vehicle segment are categorized into four types – routinemaintenance, minor repairs, major repairs and accident repairers. From the generalmarket survey, it is revealed that the older vehicles mostly do not opt for authorizedrepairers and normally prefer to visit the unorganized sector. But due to advancementin technology, the demand of skilled services is increasing very rapidly. Hence it givesrise to the demand of professional auto-services and to a major opportunity for OCs.In addition, high real estate cost in major cities with high car density, has become themajor obstacle to expanding the service network. The collaboration between OMC andOC can lead to a right synergy towards a win-win situation provided the right modelof collaboration is adopted.
2.3 Trend of collaboration in automobile industryThe automobile industry is witnessing collaborative arrangements such as sharingengines/platforms and distribution and service network. Some of the active alliances inIndia include Fiat-TML “Tata Motors Limited” (manufacturing JV “joint venture” anddistribution sharing arrangement); Renault-Nissan (proposed facility share); SAIC-GM(Indian operation under JV, to bring products from SAIC stable), VW-Suzuki(likely collaboration in small car), Renault-Bajaj (small car). The number and scope ofsuch alliances are expected to increase going forward as OEMs aim to rationalize theirinvestments and maximize reach through alliances spanning technology,manufacturing and distribution (KPMG, 2010). However, there is no establishedcollaboration in auto-service space between the OCs.
3. Review of literatureStrategy needs to evolve, update and change in real time. Through the 1970s and 1980s,the dominant school of strategy was the environmental school, which sees companiesas seeking to protect their competitive advantage through their control of the marketfor their products (Wernerfelt, 1984). Since the early 1990s, the resource-based view(RBV) of the strategy became highly influential. It emphasized the internal capabilitiesof the companies in formulating strategy to achieve and protect their sustainablecompetitive advantage in its markets and industries by building up dynamic resourceswhich would be difficult to imitate (Berney, 1991; Chaharbaghi and Lynch, 1999).Although the classic RBV has an obvious appeal even after common criticism on howresources can develop and change over time, the contemporary research has surfaced
4
Strategiccollaborationmanagement

on resource-based advantage within a broader network context as the extended RBV,which assumes that strategic resources lying beyond the boundaries of the companycan be used to generate “collaboration specific quasi-rents”, emphasizing their relianceon inter-firm relationships.
Traditionally supply chain management (SCM) had been limited to leveragethe supply chain to minimize the cost while assuring supply. However, since the start ofthe twenty-first century, collaboration in supply chains is a commonly examined topicin the SCM literature (Horvath, 2001; McLaren et al., 2002; Holweg et al., 2005;Ajmera and Cook, 2009; Bhattacharjee and Mohanty, 2012). By reviewing the literatureon collaboration during 1988 to 2014 and a compilation made by Ahmad and Asadullah(2013), collaboration can be defined as a process of working together by two or morefirms over a given economic space and time through co-operation, sharing human,financial and technical resources, maximizing resource effectiveness, exchangingcommon planning, management, execution and performance measurementinformation, aligning their supply chain to achieve their separate but complimentarygoals and objectives, to maximize value to end customers and stakeholders andcreating competitive advantage which cannot be achieved by acting alone.Accordingly, collaborative SCM is to be viewed as one SCM strategy that is likely tolead significant benefits, including customer service improvements, cost reduction,efficient use of resources and business process improvement (Udin et al., 2006).
In the context of oil and gas sector, collaborative relationships had beenexceptionally frequent and normal among companies in the upstream (exploration andproduction) (Green and Keogh, 2000). In order to capture new sources of revenue, the oiland gas sector needs to expand its focus downstream from operational excellence tocustomer allegiance, which has eventually received little attention in supply chainresearch (Bhattacharjee and Mohanty, 2012; Guan and Rehme, 2012; Bhattacharjeeet al., 2013). Such collaboration between strategic partners is becoming incrediblyimportant in generating value with collaborating partners both tactically andstrategically (Mohanty and Augustin, 2014). Particularly, key partner managementunderpins the core belief for implementing collaborative relationships strategically(Norris-Tirrell and Clay, 2010). According to Setnikar Cankar and Petkovšek (2013),collaboration between public and private sectors and between private service providersthemselves creates better and more effective public or private services and products.In our research, the OMCs are from the public sector and the OCs are from the privatesector and their collaboration could be a potentially strategic initiative.
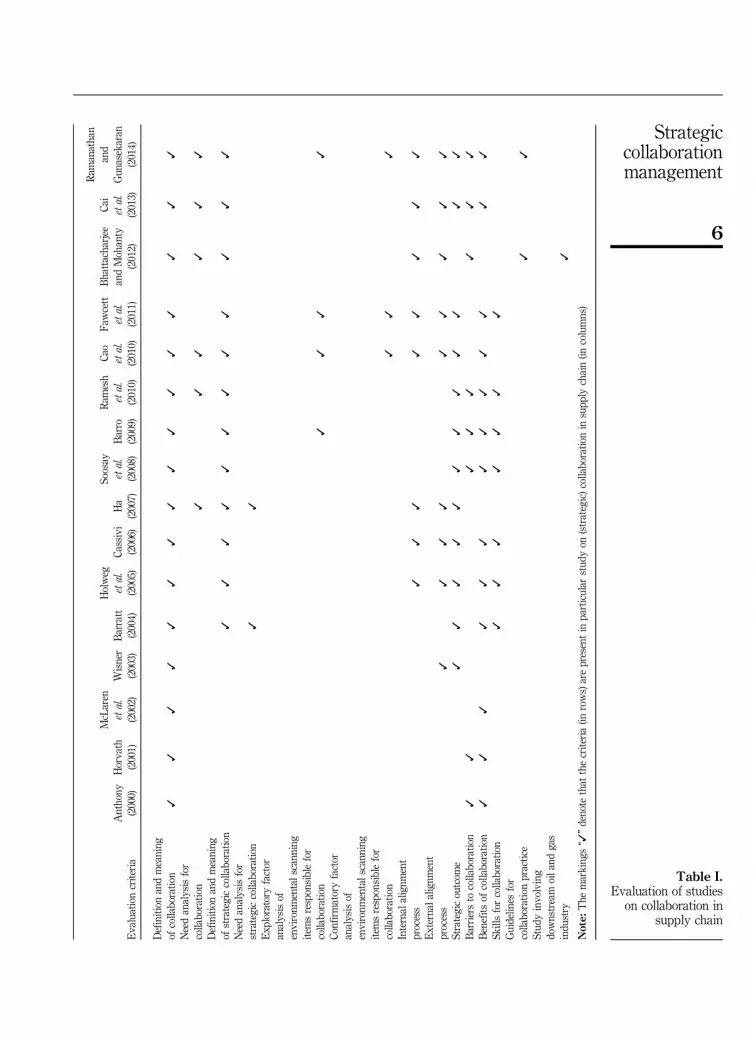
In order to capture the elements of collaboration with an objective to develop amodel, the studies made in this field since 2000 have been critically reviewed bypresenting a comparative evaluation based on essential criteria relating tocollaboration. These criteria have been identified after studying the literature oncollaboration models prescribed by different authors during the period 2000-2014.Table I depicts a comparative evaluation in which the importance of each of thecriterion has been established.
Some of the significant findings from the review of literature are as follow:
• Almost all the studies have attempted to define collaboration, and have viewedcollaboration strategically, but empirical analysis has been rarely carried out.
• Only few studies have reported EFA of environmental scanning itemsresponsible for collaboration. Still fewer studies have reported for confirmatoryfactor analysis of environmental scanning items responsible for collaboration.
5
JSMA8,4
Evaluationcriteria
Anthony
(2000)
Horvath
(2001)
McLaren
etal.
(2002)
Wisner
(2003)
Barratt
(2004)
Holweg
etal.
(2005)
Cassivi
(2006)
Ha
(2007)
Soosay
etal.
(2008)
Barro
(2009)
Ram
esh
etal.
(2010)
Cao
etal.
(2010)
Fawcett
etal.
(2011)
Bhattacharjee
andMohanty
(2012)
Cai
etal.
(2013)
Ram
anathan
and
Gun
asekaran
(2014)
Definition
andmeaning
ofcollaboratio
n✓
✓✓
✓✓
✓✓
✓✓
✓✓
✓✓
✓✓
✓Needanalysisfor
collaboratio
n✓
✓✓
✓✓
✓Definition
andmeaning
ofstrategiccollaboratio
n✓
✓✓
✓✓
✓✓
✓✓
✓✓
✓Needanalysisfor
strategiccollaboratio
n✓
✓Exp
loratory
factor
analysisof
environm
entalscann
ing
itemsresponsiblefor
collaboratio
n✓
✓✓
✓Co
nfirmatoryfactor
analysisof
environm
entalscann
ing
itemsresponsiblefor
collaboratio
n✓
✓✓
Internal
alignm
ent
process
✓✓
✓✓
✓✓
✓✓
Externala
lignm
ent
process
✓✓
✓✓
✓✓
✓✓
✓Strategicoutcom
e✓
✓✓
✓✓
✓✓
✓✓
✓✓
✓Barriersto
collaboratio
n✓
✓✓
✓✓
✓✓
✓Benefits
ofcollaboratio
n✓
✓✓
✓✓
✓✓
✓✓
✓✓
✓✓
Skillsforcollaboratio
n✓
✓✓
✓✓
✓✓
Guidelin
esfor
collaboratio
npractice
✓✓
Stud
yinvolving
downstream
oila
ndgas
indu
stry
✓
Note:
The
marking
s“✓
”denote
that
thecriteria(in
rows)arepresentin
particular
stud
yon
(strategic)collaboratio
nin
supp
lychain(in
columns)
Table I.Evaluation of studies
on collaboration insupply chain
6
Strategiccollaborationmanagement
• Only a few studies have reported internal alignment process for collaboration,while relatively a little more number of studies has reported external alignmentprocess for collaboration.
• Many studies have linked collaboration with strategic outcomes.• Although most studies dealing with collaboration do highlight barriers,
benefits and skills required, but only a few studies have provided guidelinesfor collaboration practice.
• There is only one conceptual paper which deals with collaboration betweendownstream oil sector and auto-service sector (Bhattacharjee and Mohanty, 2012).
Importantly, out of the reviewed articles on collaboration, we find little researchcovering all the criteria for collaboration in the supply chain literature (see Table I).This suggests a dearth of empirical research relating to collaboration in supply chain.
4. Research design processThe research design is the blueprint for fulfilling objectives and answering questions.This section describes procedural design of the research and its choice amongcompeting designs to yield results that are as objective as possible.
4.1 Research design: type and purpose4.1.1 Type. This study has been carried out in two stages. The first stage involvesneed analysis and exploratory research leading to problem identification throughsurvey of literature for determining environmental items of the marketplace forcollaboration between OMCs and OCs to make suggestions on applicable marketactions in particular with respect to repair and maintenance of passenger vehicles.The second stage involves causal research for empirical validation to select the beststrategies for collaborative business between OMCs and OCs using SEM processthrough an independent sample. In order to empirically validate the conceptual model,exploratory factors are first needed, which go through confirmation only with anindependent sample for application of SEM process (Prakash et al., 2011b; Mohantyand Prakash, 2014).
4.1.2 Purpose. In order to define the validated factors for collaboration betweenOMCs of downstream oil sector and OCs of auto-servicing sector, following objectivesare drawn up:
• to assess the need for collaboration between OMCs and OCs;• to understand the need for collaboration between OMCs and OCs;• to explore and define the factors of environment responsible for collaboration
between OMCs and OCs; and• to determine the nature of relationships among variables of collaboration
between OMCs and OCs for appropriate alignment towards desired strategicoutcome and empirical validation using structural equation modelling (SEM).
4.2 Selection of questionnaire: theme, issues and pre-testing4.2.1 Theme. There exists a viable business prospect for collaboration between OMCsand OCs.
7
JSMA8,4

4.2.2 Issues. Collaboration between OMCs and OCs when conceptualizedstrategically can help OCs to leverage the large network of petrol pumps of theOMCs to expand its service network and the same will also help the OMCs toboost NFR.
4.2.3 Pre-testing. Pre-testing was carried out using responses of five managerseach of OMCs, OCs, petrol pump dealers and passenger vehicle dealers in GreaterMumbai region.
4.3 Sampling design: sampling frame, sampling method and sample size4.3.1 Sampling frame. Our sampling frame was the list of known contacts withworking telephone numbers and e-mails for both stages of the study.
4.3.2 Sampling method. We have used non-probability convenience sampling forboth stages of the survey considered in this study using questionnaire posted throughGoogle Drive to known contacts only.
4.3.3 Sample size. The first stage of survey involved 202 respondents for which theχ2 statistic was 18.7686 with p-value as 0.094268 signifying insignificance at po0.05for which two attributes, namely, respondent category and experience, are independentto be adequate for applying independence methods of multivariate analysis techniqueslike EFA. The second stage of independent survey involved 264 respondents for whichthe χ2 statistic was 10.2189 with p-value as 0.596763 signifying insignificance atpo0.05 for which two attributes, namely, respondent category and experience,are independent again as to be adequate for applying independence methods ofmultivariate analysis techniques like confirmatory factor analysis using SEM. Theindependent survey in the second stage was required as the first stage responses haveestablished the factors on which also opinion were to be gathered for confirmatoryfactor analysis.
4.4 Collection of data: administration of questionnaire and interview4.4.1 Administration of questionnaire. The target respondents chosen were among themanagers of OMCs and OCs, petrol pump dealers and passenger vehicle dealers fromdifferent experience categories. Respondents were asked to participate in the surveyvoluntarily. The questions were in five-point Likert scale. The first stage of the surveyquestionnaires was administered during May 2012 and December 2012, while thesecond stage of the survey questionnaires was administered from April 2013 toJanuary 2014.
4.4.2 Interview. Some focus group interviews were conducted with senior managersand their team members from both the sectors and specific comments made were noted.
4.5 Assessment of factors for collaboration: need analysis, EFAThis section is an outcome of the first stage of the study, which is explained in Section 5.
Needs analysis for collaboration between OMCs and OCs was carried out foridentifying feasibility of a range of options of professional services, namely, routinemaintenance, minor repair, major repair and accidental repair for multi-brand carservice outlet if managed by professional groups at petrol pumps.
Thereafter, EFA was carried out to ensure that factors of environment responsiblefor collaboration between OMCs and OCs must behave statistically as expected or theyneed to be refined or deleted based on responses of administered questionnaire.
8
Strategiccollaborationmanagement
4.6 SEM process: examining and selecting the best strategyThis section is an outcome of the second stage of the study. An inventory of likelystrategies for model of collaboration between the two sectors has been proposed forexamination. Using SEM process, a best-fit model has been established from anindependent sample, which validates the multiple-item scale of collaborative factors.It produced the valid goals within the constraints of their resources consistently tofacilitate making proper alignment externally and internally. The SEM processapplicable to this study has been explained in Section 6.
5. Assessment of factors for collaborationThis section intends to discuss a call for action or need that ignites people to act forcollaboration (see Section 5.1). This identified need when understood and refined shouldportray a clear picture of what is hoped to be created, which is similar to shared vision inthe context of strategic planning, which can be a carefully crafted statement capturingthe motivation for the collaboration. Further, EFA on environmental items helps to findout marketing forces applicable to the collaboration process (see Section 5.2).
5.1 Needs analysisRespondents prefer visiting multi-brand car service outlets for availing services of thenature of minor repair and/or routine maintenance with relatively more frequency forminor repair. However, if such multi-brand car service outlet is at petrol pump,respondents would prefer visiting for minor repair and/or routine maintenance withrelatively more frequency for routine maintenance, which emphatically substantiatesthe need for having routine maintenance facility at the petrol pump. This is animportant result, which eventually prompts for the prospective collaboration betweenOMCs and OCs.
5.2 Understanding outcome of needs analysisIn order to understand the need for collaboration between OMCs and OCs, thedevelopment of mission statements is important to capture the shared vision(the direction), unique purpose (what is to be achieved) and the values and beliefs(the motivation) of the collaboration. Accordingly, the direction has to guide an actionplan for implementation of collaboration between OMCs and OCs strategically insystematic manner to sharing ideas to grow together on being connected with othersfor getting rewarded both financially and non-financially, improving customersatisfaction, imbibing trust, and utilizing physical assets and knowledge through skillsdevelopment. Moreover, given the complex community expectations favoring under-recovery of OMCs, and increasing demands of auto-services of OCs constrained bycurrent economic climate of limited resources, it is important that both OMCs and OCslook at collaboration as ways to respond to understandable challenges strategically.This can result in a feasible possibility only if both OMCs and OCs make properalignment externally and internally to realize purposeful strategic outcomes fromcollaboration, which has to be mutually beneficial.
5.3 EFAEFA was used to explore workable data of 202 respondents. This was subjected toprincipal axis factoring with rotation method as varimax with Kaiser normalization.EFA on 11 items of environment for collaboration between OMCs and OCs revealed a
9
JSMA8,4

three-factor structure that explained 60.604 per cent of total variance. The criteria forretaining the three-factors were Eigen values greater than one and the ability todescribe and label each factor. There is the obligatory requirement of 0.60 or above forCronbach’s α coefficient to demonstrate internal consistency of the established scales(Nunnally, 1978). Likewise, the minimum acceptable value of KMO is 0.5 (Prakash et al.,2011a). These statistical tests on results of EFA showed the proposed items anddimensions of the instrument were sound enough to measure the environmentalaspects of collaboration between OMCs and OCs. The first factor is labelled as marketcompetition grouping items, namely, competitor strength, competitor weakness,competitor strategy and market threat. The second factor is labelled as marketinfluence grouping items, namely, consumer influence, government influence and socialinfluence. The third factor is labelled as market opportunity grouping items, namely,business potential, sharing of assets, sharing of knowledge and growth prospect.
6. SEMThis section intends to discuss validation-specific statements of what collaborativepartners intend to do internally and externally for strategic outcome to establishingwell-formed goals. Partners take an inventory of likely strategies and choose those thatare most likely to produce the valid goals within the constraints of their resourcesconsistently. This research section is inspired by the methodology for empiricalvalidation using SEM process as detailed in Prakash et al. (2011b).
The SEM process was carried out in an independent sample, which was the secondstage of the survey, for which the target population was managers of the downstreamOMCs and OCs, petrol pump dealers and passenger vehicle dealers.
With a sample size of as small as 50, the valid results can be obtained. But to getstable maximum likelihood estimation, the recommended minimum sample size is100-250. For larger sample sizes (W400), the process can be very sensitive and anyvariation can be detected. This can make the goodness-of-fit measure to be poor fit.According to Prakash et al. (2011b), a sample size should be 10-20 times of the numberof indicators so that the models generated through SEM process are identified, but thatmay not be sufficient. In this research, with the sample size of 264, SEM models couldbe identified and hence, the sample is considered adequate.
6.1 Define the individual constructThe collaboration process has been conceptualized including in our data set, fourconstructs (environmental scanning, internal alignment, external alignment andstrategic outcome) and 20 indicators (four items of environmental scanning, six itemsof internal alignment, five items of external alignment and five items of strategicoutcome) (Bhattacharjee and Mohanty, 2012). To measure internal alignment, we haveused five indicators, namely, empowered team (EM_TEAM), gap in business processes(GAP_BP), set milestone (SET_MILE), human resource development collaborativeculture (HRD_COLL) and select partner (SEL_PARTNER). To measure externalalignment, we have used four indicators, namely, set common goal (SET_GOAL), shareresources (SH_RESOURCE), roles and responsibilities of partners (ROLE) and setprocesses (SET_PROCESS). Likewise, for measuring strategic outcome (OUTCOME),we have used four indicators, namely, rewards – both financial and non-financial(PROFIT), customer satisfaction (CSAT), trust in the relationship between the partners(TRUST) and utilization of physical assets and knowledge (UTILIZE).
10
Strategiccollaborationmanagement
6.1.1 Measurement and scaling. Each construct has multiple-indicator variables.Each indicator was measured using a five-point Likert scale where respondents have a“neutral” as middle point and where “1” means “very low” and “5” means “very high”for every statement (item) in respect of importance of the item for a successfulcollaboration between OMCs and OCs.
6.1.2 Test reliability for pretested dimensions. For the purpose of carrying out SEM, areliability analysis with selected dimensions for each retained sub-scale items of collaborationprocess was conducted for 264 cases comprising of independent samples based onconvenience sampling using SPSS. The internal consistency (Cronbach’s α) was estimated formarket competition as 0.792, market influence as 0.681, market opportunity as 0.664, internalalignment as 0.622, external alignment as 0.641 and strategic outcome as 0.675 ranging from0.792 to 0.622. Hence, the sub-scale items demonstrate high internal consistency.
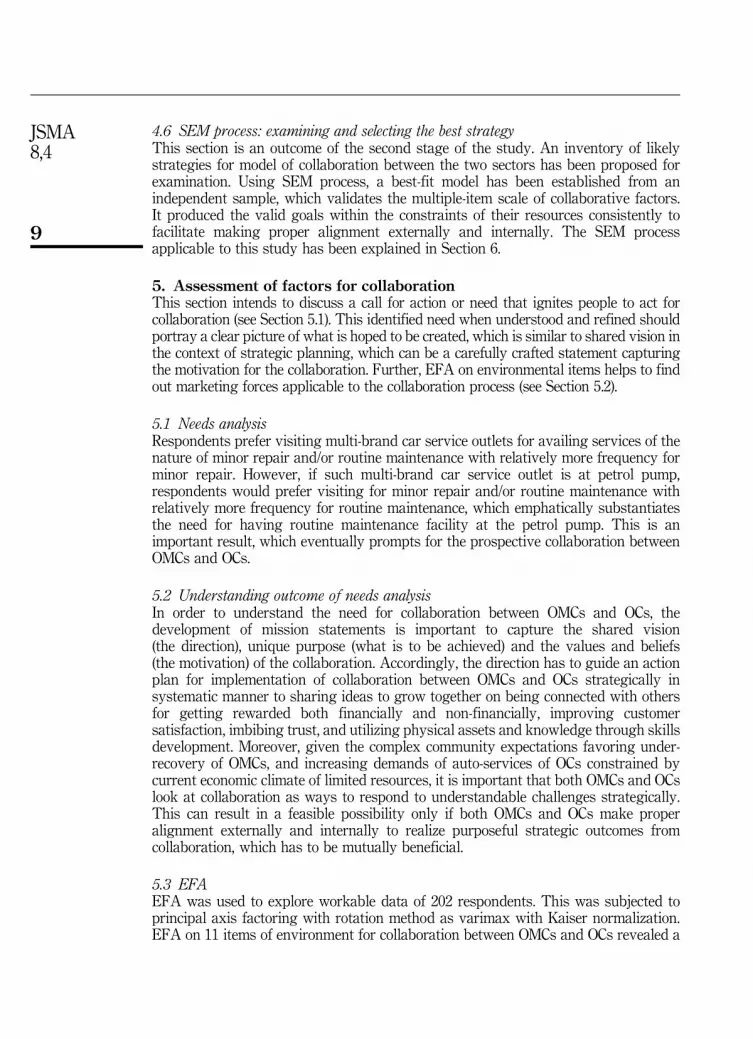
6.2 Specify the measurement modelThe overall measurement model has been planned to be recursive. There are 44variables and 90 parameters in the measurement model. In testing for the measurementmodel, we freely correlated the mentioned four constructs upon fixing the factorloading of each construct to a value of unity. All measured items are allowed to load ononly one construct each, and the error terms are not allowed to correlate with eachother. The measurement model is described in Figure 1.
6.3 Assess the measurement modelThe validity of the measurement model depends on the goodness-of-fit results, evidenceof adequacy of construct validity, especially convergent and discriminant validity(Hair et al., 2006). We now examine the results of testing this measurement modelagainst reality as represented by this sample with respect to overall model fit and thecriteria for construct validity. Our measurement model (n¼ 264) yields the model fitresults. The general rule of thumb suggests that at least one absolute fit index and oneincremental fit index, in addition to the χ2 result should be relied upon. These fit indicescollectively indicate that overall fit of the measurement model is acceptable.
Note that Amos refers to factor loadings as regression weights and their significanceprovide a useful start in assessing the convergent validity of the measurement model(Prakash et al., 2011b). Almost all loadings are highly significant as required foradequacy test of construct validity, which means that variables do correlate well witheach other within their parent factor. This implies that the latent factor is wellexplained by its observed variables.
Further, for fully establishing the convergent validity for latent factors, we findcomposite reliability (CR) greater than 0.7. In addition, we find that the square rootof average variance extracted (AVE) is greater than 0.5, which implies variables donot correlate highly with variables outside their parent factor than with the variableswithin their parent factor. That is, the latent factor is not better explained bysome other variables than by its own observed variables, which establishesdiscriminant validity.
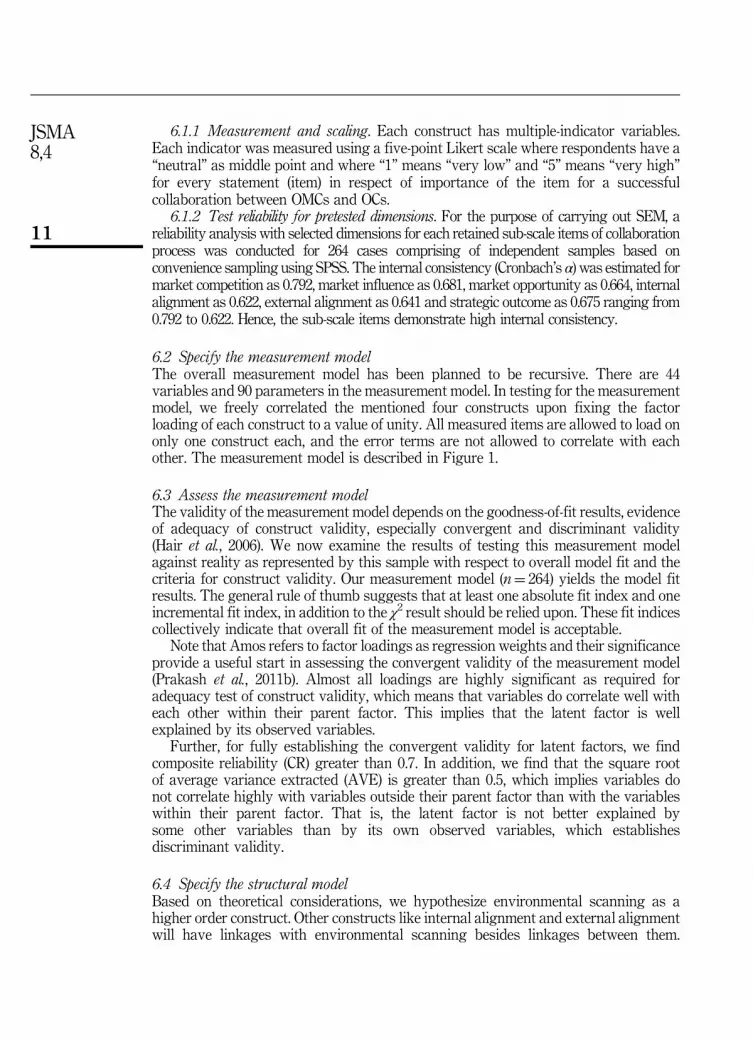
6.4 Specify the structural modelBased on theoretical considerations, we hypothesize environmental scanning as ahigher order construct. Other constructs like internal alignment and external alignmentwill have linkages with environmental scanning besides linkages between them.
11
JSMA8,4
The lowest order construct will be strategic outcome which will have linkages tointernal alignment and external alignment. The entire structural model is testedsimultaneously. There are 47 variables and 92 parameters in the structural model.In testing for the structural model, we free the structural linkages and fix the factorloading of each construct to a value of unity. While the measurement model tests forreliability and validity of the measures, the structural model tests for the structuralrelations in the model. The structural model is described in Figure 2.
6.5 Assess the structural modelThe validity of the structural model depends on the goodness-of-fit results andnomological validity. We estimated the structural model with the same sample(n¼ 264) yielding the satisfactory model fit results. Collectively, these fit indicesindicate that the structural model is acceptable. That is, the second-order model isrobust and theoretically explains the constructs of satisfaction and patronage intention.
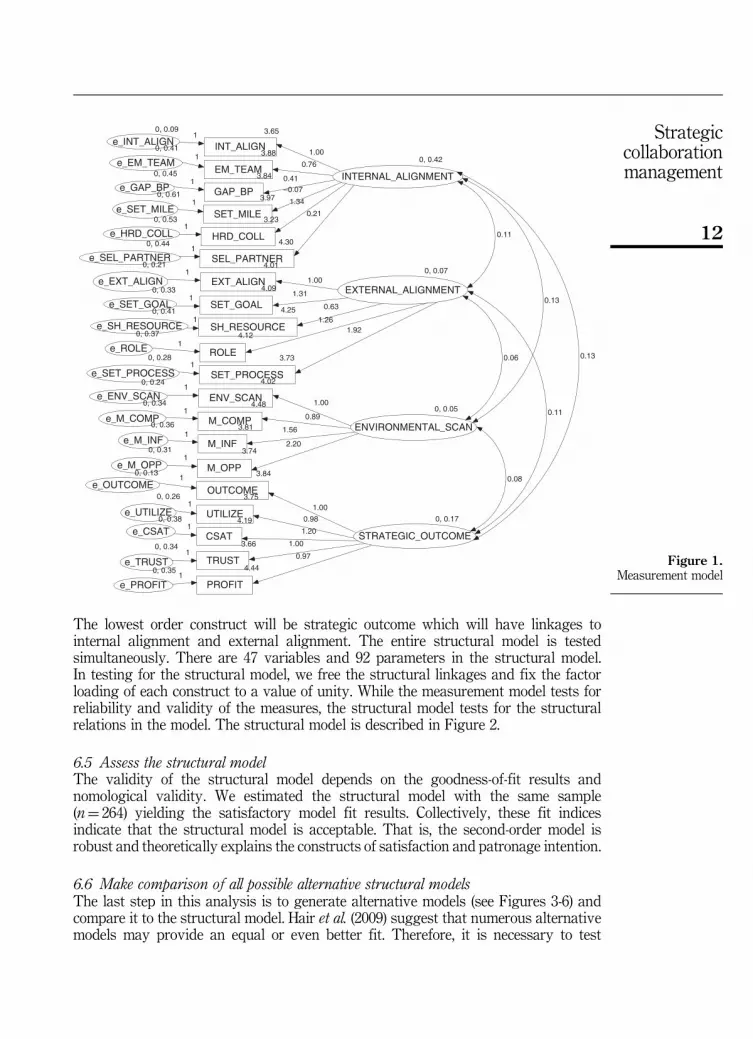
6.6 Make comparison of all possible alternative structural modelsThe last step in this analysis is to generate alternative models (see Figures 3-6) andcompare it to the structural model. Hair et al. (2009) suggest that numerous alternativemodels may provide an equal or even better fit. Therefore, it is necessary to test
4.02
ENV_SCAN4.48
M_COMP3.81
M_INF3.74
M_OPP
3.65
INT_ALIGN
4.01
EXT_ALIGN
3.84
OUTCOME
3.88
EM_TEAM3.84
GAP_BP3.97
SET_MILE3.23
HRD_COLL4.30
SEL_PARTNER
4.09
SET_GOAL4.25
SH_RESOURCE4.12
ROLE3.73
SET_PROCESS
3.75
UTILIZE4.19
CSAT3.66
TRUST4.44
PROFIT
0, 0.41
e_EM_TEAM0, 0.45
e_GAP_BP0, 0.61
e_SET_MILE0, 0.53
e_HRD_COLL0, 0.44
e_SEL_PARTNER
0, 0.33
e_SET_GOAL0, 0.41
e_SH_RESOURCE0, 0.37
e_ROLE0, 0.28
e_SET_PROCESS
0, 0.35
e_PROFIT
0, 0.34
e_TRUST
0, 0.38
e_CSAT
0, 0.26
e_UTILIZE
0, 0.13
e_OUTCOME
0, 0.09
e_INT_ALIGN
0, 0.21
e_EXT_ALIGN
0, 0.24
e_ENV_SCAN0, 0.34
e_M_COMP0, 0.36
e_M_INF0, 0.31
e_M_OPP
1
1
1
1
1
1
1
1
1
1
1
1
1
1
1
1
1
1
1
1
0, 0.42
INTERNAL_ALIGNMENT
0, 0.07
EXTERNAL_ALIGNMENT
0, 0.05
ENVIRONMENTAL_SCAN
0, 0.17
STRATEGIC_OUTCOME
1.00
0.76
0.41
–0.07
1.34
0.21
1.00
1.261.92
1.00
0.89
1.56
2.20
1.00
0.98
1.20
1.00
0.97
0.63
1.31
0.11
0.08
0.06
0.11
0.13
0.13
Figure 1.Measurement model
12
Strategiccollaborationmanagement

4.02
EN
V_S
CA
N 4.48
M_C
OM
P
3.81
M_I
NF
3.74
M_O
PP
3.65
INT
_ALI
GN
4.01
EX
T_A
LIG
N
3.84
OU
TC
OM
E
3.88
EM
_TE
AM
3.84
GA
P_B
P
3.97
SE
T_M
ILE
3.23
HR
D_C
OLL
4.30
SE
L_P
AR
TN
ER
4.09
SE
T_G
OA
L
4.25
SH
_RE
SO
UR
CE
4.12
RO
LE
3.73
SE
T_P
RO
CE
SS
3.75
UT
ILIZ
E 4.19
CS
AT
3.66
TR
US
T
4.44
PR
OF
IT
0, 0
.41
e_E
M_T
EA
M1
0, 0
.45
e_G
AP
_BP
1
0, 0
.61
e_S
ET
_MIL
E1
0, 0
.53
e_H
RD
_CO
LL1
0, 0
.44
e_S
EL_
PA
RT
NE
R1
0, 0
.32
e_S
ET
_GO
AL
0, 0
.41
e_S
H_R
ES
OU
RC
E0,
0.3
6
e_R
OLE
0, 0
.28
e_S
ET
_PR
OC
ES
S
0, 0
.35
e_P
RO
FIT
1
0, 0
.34
e_T
RU
ST
10, 0
.38
e_C
SA
T1
0, 0
.26
e_U
TIL
IZE
1
0, 0
.13
e_O
UT
CO
ME
1
0, 0
.09
e_IN
T_A
LIG
N1
0, 0
.21
e_E
XT
_ALI
GN
0, 0
.25
e_E
NV
_SC
AN
1 0, 0
.34
e_M
_CO
MP
1 0, 0
.36
e_M
_IN
F1
0, 0
.31
e_M
_OP
P1
11
11
1
0, 0
.05
EN
VIR
ON
ME
TA
L_S
CA
N
0
INT
ER
NA
L_A
LIG
NM
EN
T
0
ST
RA
TE
GIC
_OU
TC
OM
E
0
EX
TE
RN
AL_
ALI
GN
ME
NT
1.00
0.90
1.56
2.22
1.00
0.77
0.41
–0.0
61.
340.
21
1.00
1.31
0.62
1.25
1.89
1.21
1.00
0.97
2.90
6.15
–0.2
20,
0.0
3
e_IN
TE
RN
AL_
ALI
GN
ME
NT
0, –
0.10
e_E
XT
ER
NA
L_A
LIG
NM
EN
T
0, –
0.01
e_S
TR
AT
EG
IC_O
UT
CO
ME
1
1.00
0.98
11.
92
–1.6
8
1
Figure 2.Structural model
13
JSMA8,4

4.02
EN
V_S
CA
N 4.48
M_C
OM
P
3.81
M_I
NF
3.74
M_O
PP
3.65
INT
_ALI
GN
4.01
EX
T_A
LIG
N
3.84
OU
TC
OM
E
3.88
EM
_TE
AM
3.84
GA
P_B
P
3.97
SE
T_M
ILE
3.23
HR
D_C
OLL
4.30
SE
L_P
AR
TN
ER
4.09
SE
T_G
OA
L
4.25
SH
_RE
SO
UR
CE
4.12
RO
LE
3.73
SE
T_P
RO
CE
SS
3.75
UT
ILIZ
E 4.19
CS
AT
3.66
TR
US
T
4.44
PR
OF
IT
0, 0
.42
e_E
M_T
EA
M1
0, 0
.40
e_G
AP
_BP
1
0, 0
.61
e_S
ET
_MIL
E1
0, 0
.70
e_H
RD
_CO
LL1
0, 0
.42
e_S
EL_
PA
RT
NE
R1
0, 0
.31
e_S
ET
_GO
AL
0, 0
.41
e_S
H_R
ES
OU
RC
E
0, 0
.35
e_R
OLE
0, 0
.28
e_S
ET
_PR
OC
ES
S
0, 0
.36
e_P
RO
FIT
1
0, 0
.33
e_T
RU
ST
10, 0
.43
e_C
SA
T1
0, 0
.24
e_U
TIL
IZE
1
0, 0
.11
e_O
UT
CO
ME
1
0, 0
.18
e_IN
T_A
LIG
N1
0, 0
.19
e_E
XT
_ALI
GN
0, 0
.24
e_E
NV
_SC
AN
1 0, 0
.35
e_M
_CO
MP
1 0, 0
.40
e_M
_IN
F1
0, 0
.26
e_M
_OP
P1
11
11
1
0, 0
.05
EN
VIR
ON
ME
TA
L_S
CA
N
0
INT
ER
NA
L_A
LIG
NM
EN
T
0
ST
RA
TE
GIC
_OU
TC
OM
E
0
EX
TE
RN
AL_
ALI
GN
ME
NT
1.00
0.77
1.19
2.32
1.00
0.83
0.62
0.12
1.32
0.35
1.00
1.29
0.60
1.23
1.73
1.02
0.95
0.87
2.84
0, –
0.08
e_IN
TE
RN
AL_
ALI
GN
ME
NT
0, 0
.04
e_E
XT
ER
NA
L_A
LIG
NM
EN
T
0, 0
.02
e_S
TR
AT
EG
IC_O
UT
CO
ME
1
1.00
0.97
11.
46
0.37
1
Figure 3.Alternative Model
No. 1 (AM 1)
14
Strategiccollaborationmanagement
4.02
EN
V_S
CA
N 4.48
M_C
OM
P
3.81
M_I
NF
3.74
M_O
PP
4.01
EX
T_A
LIG
N
3.84
OU
TC
OM
E
4.09
SE
T_G
OA
L
4.25
SH
_RE
SO
UR
CE
4.12
RO
LE
3.73
SE
T_P
RO
CE
SS
3.75
UT
ILIZ
E 4.19
CS
AT
3.66
TR
US
T
4.44
PR
OF
IT
0, 0
.29
e_S
ET
_GO
AL
0, 0
.40
e_S
H_R
ES
OU
RC
E
0, 0
.35
e_R
OLE
0, 0
.31
e_S
ET
_PR
OC
ES
S
0, 0
.35
e_P
RO
FIT
1
0, 0
.33
e_T
RU
ST
10, 0
.38
e_C
SA
T1
0, 0
.26
e_U
TIL
IZE
1
0, 0
.13
e_O
UT
CO
ME
1
0, 0
.20
e_E
XT
_ALI
GN
0, 0
.26
e_E
NV
_SC
AN
1 0, 0
.32
e_M
_CO
MP
1 0, 0
.27
e_M
_IN
F1
0, 0
.42
e_M
_OP
P1
11
11
1
0, 0
.03
EN
VIR
ON
ME
TA
L_S
CA
N
0
ST
RA
TE
GIC
_OU
TC
OM
E
0
EX
TE
RN
AL_
ALI
GN
ME
NT
1.00
1.25
2.40
1.82
1.00
1.38
0.65
1.23
1.68
1.20
1.01
0.95
1.61
0, –
0.01
e_E
XT
ER
NA
L_A
LIG
NM
EN
T
0, 0
.00
e_S
TR
AT
EG
IC_O
UT
CO
ME
1
1.00
0.96
11.
47
Figure 4.Alternative ModelNo. 2 (AM 2)
15
JSMA8,4

4.02
EN
V_S
CA
N 4.48
M_C
OM
P
3.81
M_I
NF
3.74
M_O
PP
3.65
INT
_ALI
GN
4.01
EX
T_A
LIG
N
3.84
OU
TC
OM
E
3.88
EM
_TE
AM
3.84
GA
P_B
P
3.97
SE
T_M
ILE
3.23
HR
D_C
OLL
4.30
SE
L_P
AR
TN
ER
4.09
SE
T_G
OA
L
4.25
SH
_RE
SO
UR
CE
4.12
RO
LE
3.73
SE
T_P
RO
CE
SS
3.75
UT
ILIZ
E 4.19
CS
AT
3.66
TR
US
T
4.44
PR
OF
IT
0, 0
.41
e_E
M_T
EA
M1
0, 0
.45
e_G
AP
_BP
1
0, 0
.61
e_S
ET
_MIL
E1
0, 0
.53
e_H
RD
_CO
LL1
0, 0
.44
e_S
EL_
PA
RT
NE
R1
0, 0
.30
e_S
ET
_GO
AL
0, 0
.40
e_S
H_R
ES
OU
RC
E0,
0.3
5
e_R
OLE
0, 0
.30
e_S
ET
_PR
OC
ES
S
0, 0
.35
e_P
RO
FIT
1
0, 0
.34
e_T
RU
ST
10, 0
.41
e_C
SA
T1
0, 0
.25
e_U
TIL
IZE
1
0, 0
.12
e_O
UT
CO
ME
1
0, 0
.09
e_IN
T_A
LIG
N1
0, 0
.20
e_E
XT
_ALI
GN
0, 0
.24
e_E
NV
_SC
AN
1 0, 0
.34
e_M
_CO
MP
1 0, 0
.36
e_M
_IN
F1
0, 0
.31
e_M
_OP
P1
11
11
1
0, 0
.05
EN
VIR
ON
ME
TA
L_S
CA
N
0
INT
ER
NA
L_A
LIG
NM
EN
T
0
ST
RA
TE
GIC
_OU
TC
OM
E
0
EX
TE
RN
AL_
ALI
GN
ME
NT
1.00
0.87
1.50
2.14
1.00
0.75
0.41
–0.0
81.
330.
20
1.00
1.32
0.64
1.23
1.70
1.09
0.97
0.92
2.82
6.73
0, 0
.04
e_IN
TE
RN
AL_
ALI
GN
ME
NT
0, –
0.13
e_E
XT
ER
NA
L_A
LIG
NM
EN
T
0, 0
.01
e_S
TR
AT
EG
IC_O
UT
CO
ME
1
1.00
0.96
11.
47
–1.9
4
1
Figure 5.Alternative Model
No. 3 (AM 3)
16
Strategiccollaborationmanagement
4.02
EN
V_S
CA
N 4.48
M_C
OM
P
3.81
M_I
NF
3.74
M_O
PP
3.65
INT
_ALI
GN
3.84
OU
TC
OM
E
3.88
EM
_TE
AM
3.84
GA
P_B
P
3.97
SE
T_M
ILE
3.23
HR
D_C
OLL
4.30
SE
L_P
AR
TN
ER 3.75
UT
ILIZ
E 4.19
CS
AT
3.66
TR
US
T
4.44
PR
OF
IT
0, 0
.41
e_E
M_T
EA
M1
0, 0
.43
e_G
AP
_BP
1
0, 0
.62
e_S
ET
_MIL
E1
0, 0
.59
e_H
RD
_CO
LL1
0, 0
.43
e_S
EL_
PA
RT
NE
R1
0, 0
.38
e_P
RO
FIT
1
0, 0
.35
e_T
RU
ST
10, 0
.48
e_C
SA
T1
0, 0
.25
e_U
TIL
IZE
1
0, 0
.07
e_O
UT
CO
ME
1
0, 0
.14
e_IN
T_A
LIG
N1
0, 0
.24
e_E
NV
_SC
AN
1 0, 0
.35
e_M
_CO
MP
1 0, 0
.42
e_M
_IN
F1
0, 0
.23
e_M
_OP
P1
0, 0
.05
EN
VIR
ON
ME
TA
L_S
CA
N
0
INT
ER
NA
L_A
LIG
NM
EN
T
0
ST
RA
TE
GIC
_OU
TC
OM
E
1.00
0.75
1.04
2.42
1.00
0.80
0.51
0.01
1.35
0.28
0.83
0.85
0.75
2.85
0.50
0, –
0.04
e_IN
TE
RN
AL_
ALI
GN
ME
NT
0, 0
.14
e_S
TR
AT
EG
IC_O
UT
CO
ME
1
1.00
0.88
1
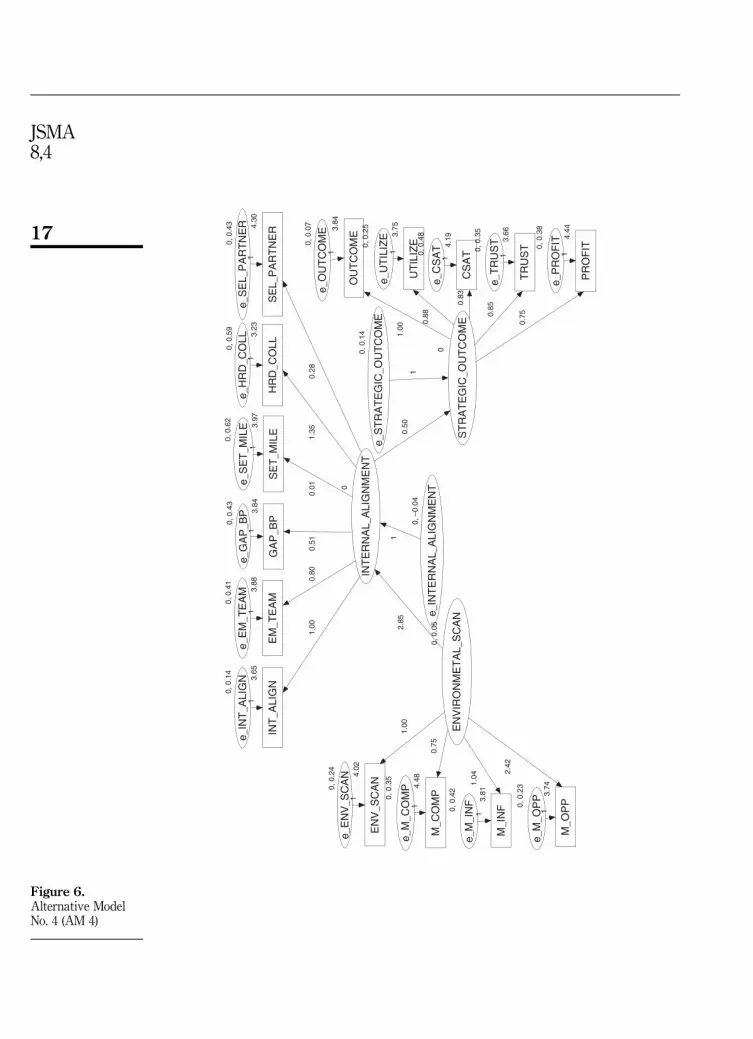
Figure 6.Alternative ModelNo. 4 (AM 4)
17
JSMA8,4
competing models that represent truly different hypothetical alternative structuralrelationships, e.g., AM 1 (see Figure 3), AM 2 (see Figure 4), AM 3 (see Figure 5)and AM 4 (see Figure 6).
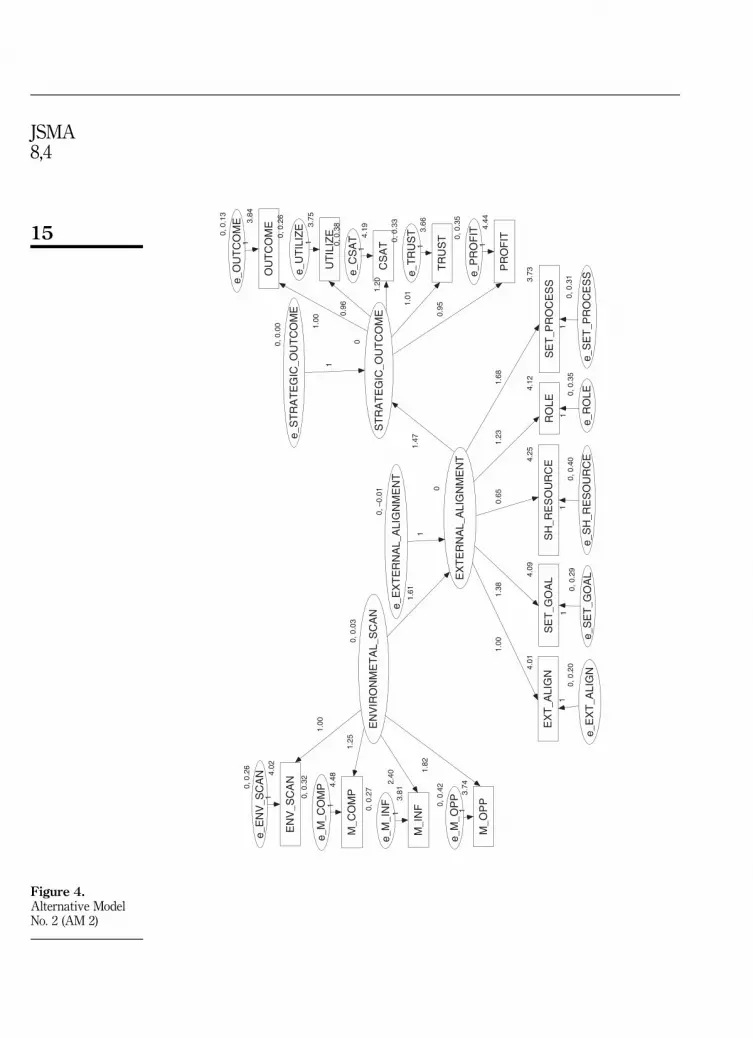
The comparative analysis of fit indices of alternative models (see Table II) depictthat the Alternative Model No. 2 has shown the better fit, and hence, we hypothesize itas the best model of collaboration between downstream oil sector and auto-servicesector. It suggests that environmental scanning is strongly related to externalalignment which leads to strategic outcome or the advantage of collaboration. It is alsoestablished that internal alignment is not necessarily related to external alignment orstrategic outcome.
We find that “AM 2” is the best alternative model to be used for testing the causalrelationship significance, whose coefficients are shown in Table III.
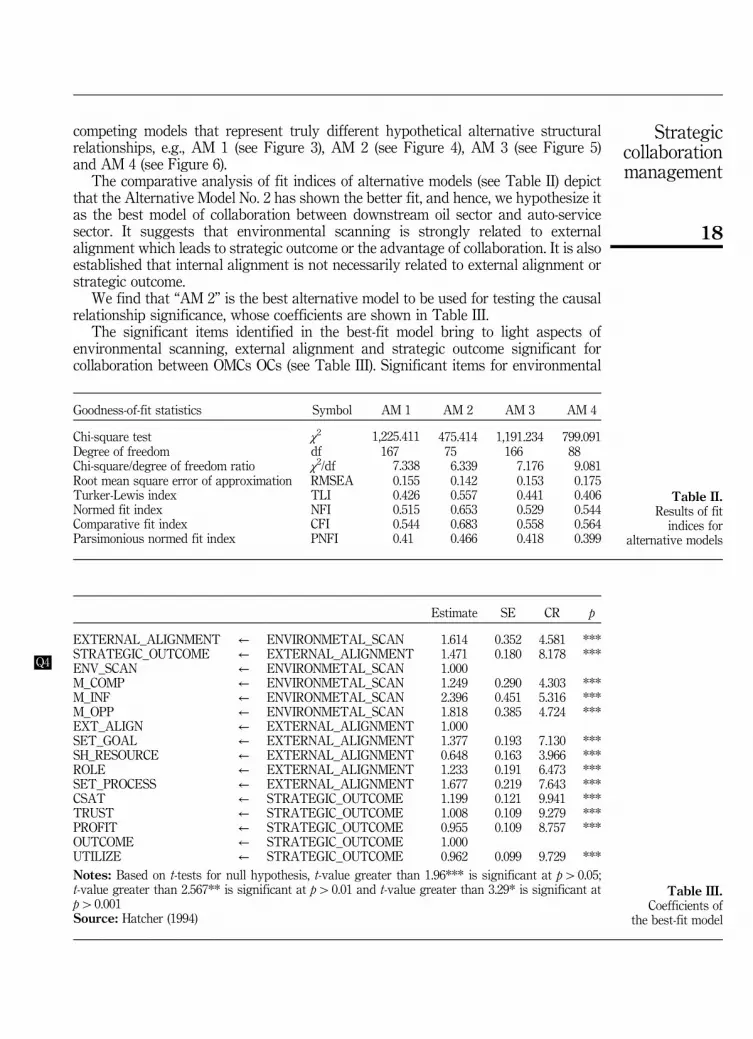
The significant items identified in the best-fit model bring to light aspects ofenvironmental scanning, external alignment and strategic outcome significant forcollaboration between OMCs OCs (see Table III). Significant items for environmental
Goodness-of-fit statistics Symbol AM 1 AM 2 AM 3 AM 4
Chi-square test χ2 1,225.411 475.414 1,191.234 799.091Degree of freedom df 167 75 166 88Chi-square/degree of freedom ratio χ2/df 7.338 6.339 7.176 9.081Root mean square error of approximation RMSEA 0.155 0.142 0.153 0.175Turker-Lewis index TLI 0.426 0.557 0.441 0.406Normed fit index NFI 0.515 0.653 0.529 0.544Comparative fit index CFI 0.544 0.683 0.558 0.564Parsimonious normed fit index PNFI 0.41 0.466 0.418 0.399
Table II.Results of fitindices for
alternative models
Estimate SE CR p
EXTERNAL_ALIGNMENT ← ENVIRONMETAL_SCAN 1.614 0.352 4.581 ***STRATEGIC_OUTCOME ← EXTERNAL_ALIGNMENT 1.471 0.180 8.178 ***ENV_SCANQ4 ← ENVIRONMETAL_SCAN 1.000M_COMP ← ENVIRONMETAL_SCAN 1.249 0.290 4.303 ***M_INF ← ENVIRONMETAL_SCAN 2.396 0.451 5.316 ***M_OPP ← ENVIRONMETAL_SCAN 1.818 0.385 4.724 ***EXT_ALIGN ← EXTERNAL_ALIGNMENT 1.000SET_GOAL ← EXTERNAL_ALIGNMENT 1.377 0.193 7.130 ***SH_RESOURCE ← EXTERNAL_ALIGNMENT 0.648 0.163 3.966 ***ROLE ← EXTERNAL_ALIGNMENT 1.233 0.191 6.473 ***SET_PROCESS ← EXTERNAL_ALIGNMENT 1.677 0.219 7.643 ***CSAT ← STRATEGIC_OUTCOME 1.199 0.121 9.941 ***TRUST ← STRATEGIC_OUTCOME 1.008 0.109 9.279 ***PROFIT ← STRATEGIC_OUTCOME 0.955 0.109 8.757 ***OUTCOME ← STRATEGIC_OUTCOME 1.000UTILIZE ← STRATEGIC_OUTCOME 0.962 0.099 9.729 ***Notes: Based on t-tests for null hypothesis, t-value greater than 1.96*** is significant at pW0.05;t-value greater than 2.567** is significant at pW0.01 and t-value greater than 3.29* is significant atpW0.001Source: Hatcher (1994)
Table III.Coefficients of
the best-fit model
18
Strategiccollaborationmanagement
scanning have been obtained as relating to market for competition, influence andopportunity. Likewise, significant items for undergoing external alignment processhave been obtained as setting common goals, sharing of resources, setting roles andresponsibilities of partners and setting the collaboration process. Similarly, significantitems for strategic outcome happen to be financial and non financial rewards,customer satisfaction, utilization of assets and knowledge and trust on partners.
7. Results and findingsFrom the analysis of the oil sector, it is found that there is a need for generation of NFRby the OMCs and on the other hand, the provisional analysis of auto-service sectorreveals that the current auto-service market in passenger vehicle segment is projectedto be INR440 billion by FY 2017-18 from the current estimate of INR280 billion(Bhattacharjee et al., 2013). The major constraint for expanding the service network byOCs is very high real estate cost while the OMCs can provide the same very easily attheir petrol pumps. While worldwide the share of NFR from petrol pumps is very highin developed countries even up to 39 per cent in USA, in India it is only about 1 per centof the total revenues from this format of the business. This justifies the need ofcollaboration between OMCs and OCs sufficiently.
Theoretically, systematic and structured process for implementing collaboration hasbeen the subject matter of strategic planning. This study has comprehensively andempirically validated this model of collaboration between OMCs of oil sector and OCsof auto-servicing sector. It has involved popular steps of making head start inimplementing collaboration through strategic planning, which can be revisited bypartners at any time.
The best-fit model has been identified as the Alternative Model No. 2 (AM 2) wasmulti-dimensional, which is the empirically justified model for implementingcollaboration as an antecedent of strategic advantage. The best-fit model advises forvalid collaboration between OMCs and OCs. Cumulative resources can be used fruitfullyif and only if internal alignment process is not included for taking full advantage ofcapacity in addressing societal expectations. The omission of internal alignment processmeans identifying gaps in business process, human resource development to bringcollaboration culture in the organization, setting up empowered selection team, selectionof optimum partners and setting internal milestones are insignificant for implementingcollaboration between OMCs and OCs leading ultimately to the strategic outcome.
8. DiscussionsIn the literature survey, it is noted that only the work of Bhattacharjee and Mohanty(2012) describes inter-firm collaboration model which can be adopted for collaborationbetween OMCs and OCs. But the model was not validated based on real life data. It wasbased on evaluation of various other models of collaboration. Other models depict onlylimited collaboration processes. The model of collaboration recommended in thisresearch is an integrated model based on data generated through primary survey andvalidated through SEM process.
Given the economic climate of limited resources, increasing demands and complexsocietal expectations, it is important that collaboration responds to challenges ofexternal alignment process, namely, setting common goal, sharing resources, havingdefined roles and responsibilities of partners and setting processes. That is, theexternal alignment process has to be placed at the heart of implementing collaborationbetween OMCs and OCs for achieving higher economic benefits.
19
JSMA8,4

As implementation of collaboration between OMCs and OCs can be revisited bypartners at any time for development and change of resources over time, this researchhas successfully applied inter-firm relationship for resource-based advantage withina broader framework, which is in agreement with collaborating firms to drive towardsa successful collaboration trailing extended RBV with following importantpractical implications:
• Practical implications for OMCs: the OMCs can improve their bottom-line, whichis hit due to under-recovery in dealing of major fuels through their very largenetwork of petrol pumps in the entire length and breadth of India. Towards theexecution of external alignment process, OMCs may provide the civilinfrastructure like shade, building, land and so on (Wasburn and Crispo, 2006).
• Practical implications for OCs: as multi-brand car service outlet at petrol pump isexpected to be preferred for minor repair and routine maintenance, it gives a verystrong signal to the OCs to increase their service network. The forming theexternal alignment process need to be taken properly by OCs based on theirunderstanding of the collaboration lifecycle intending to strengthen leadershipfor providing equipment, labour, know how and the like dependably (see, e.g.,Wasburn and Crispo, 2006).
• Scientific contribution: though collaboration has been widely researched areain the current century and many models have also been recommended, there ishardly any integrated model featuring all the major collaboration processesexcept that of Bhattacharjee and Mohanty (2012). There is also no empiricalvalidation found of any of the models of collaboration. This study has developedthe composite model and also validated empirically through SEM process.The approach can be referred in any future research on collaboration betweenany two sectors or organizations.
The approach in this research has shown to develop structural model of collaborationfrom measurement model depending on goodness-of-fit results and nomologicalvalidity. The method adopted in building this model can be used for developing andvalidating any other model of collaboration between any two companies in differentsectors. The model can be adopted universally within a sector and across any twosectors. However, the linkages between the different collaboration process stages needsto be established through SEM.
9. Concluding remarksThis paper has explored the OMCs of the downstream Oil Sector and OCs of theauto-servicing sector in terms of their resources engaged in collaborative process.The study is based on factor analysis of environmental scanning items, which helps toestablish well-formed goals relating to marketing forces applicable to the collaboration.It was conjectured that this perspective would throw light on right alignment optionsfor strategic outcome after empirical validation using SEM.
This study has ascertained that a multi-brand car service outlet at petrol pump isexpected to be preferred for minor repair and routine maintenance indicating OCs toincrease their service network, which would eventually help the OMCs to improve theirNFR. This study suffers from the limitation that it tests the fit of the model within thelimits of Indian context only. In addition, it suffers from methodological limitationsassociated with convenience sampling and anonymous survey-based research. We find
20
Strategiccollaborationmanagement

that systematic, structured and validated process of strategic planning forimplementing collaboration does involve following steps for making head start inits implementation:
(1) assessing need for collaboration;
(2) developing the shared vision (the direction), unique purpose (what is to beachieved) and the values and beliefs (the motivation) of the collaboration;
(3) assessing environmental factors of the market for collaborative capacities;
(4) establishing well-formed goals;
(5) examining and selecting best strategies; and
(6) developing a plan of action.
Conclusively it can be mentioned here that companies seeking to survive and thrive inthe competition age must understand the connections between similar or diverse, andseemingly connected operations. They must know how to link apparently connectedelements to create something new to maximize utilities for both. The case exampledescribed in this paper shows ample opportunities for strategic collaboration based oncommon interest. Our goal is to cultivate a collaborative ecology for the two sectors,which is self-sustaining, self-regenerating and adaptable to contemporary economicconditions. Strategic collaboration as depicted in this paper establishes formalinter-organizational relationships and cooperative arrangements between the twosectors represent a new organizational formation that seeks to attain fundamentalobjectives of business such as; profit, growth and survival.
This research included responses from managers of OMCs, managers of OCs, petrolpump dealers and passenger vehicle dealers using non-probability conveniencesampling. The validation of the model of collaboration has been based on primarystatistical survey data. Further, the model tested here does not test the set of sectorlevel specific elements such as; coherent intent, congruent systems and capital forrelationship building and learning; all of which support, reinforce and amplify thecollaboration ecology.
This research has validated model for collaborative capacities between OMCs andOCs statistically through SEM using AMOS. Using longitudinal research with live dataon the strategic outcome, simulations can be performed for making scenario planning.This model can also be validated on the basis of financial feasibility with respect toreturn on investment by conducting a few pilot collaborative projects.
References
Ahmad, S. and Asadullah (2013), “Driving forces of collaboration in supply chain – a review”,Interdisciplinary Journal of Contemporary Research in Business, Vol. 5 No. 7,pp. 39-69.
Ajmera, A. and Cook, J. (2009), “A multi-phase framework for supply chain integration”, SAMAdvanced Management Journal, Vol. 1 No. 1, pp. 37-48.
Anthony, T. (2000), “Supply chain collaboration: success in the new internet economy”, AchievingSupply Chain Excellence through Technology, Vol. 2, Montgomery Research Inc.,San Francisco, CA, pp. 41-42.
Barratt, M. (2004), “Understanding the meaning of collaboration in the supply chain”, SupplyChain Management: An International Journal, Vol. 9 No. 1, pp. 30-42.
21
JSMA8,4

Barro, F. (2009), “Stakeholder theory and dynamics in supply chain collaboration”, InternationalJournal of Operations & Production Management, Vol. 29 No. 6, pp. 591-611.
Berney, J. (1991), “Firms resources and sustained competitive advantage”, Journal ofManagement, Vol. 17 No. 1, pp. 99-120.
Bhat, S.A. (2014), “Oil price shocks and macro-economy in India: an asymmetric approach”,Asian Journal of Research in Banking and Finance, Vol. 4 No. 5, pp. 298-313.
Bhattacharjee, D. and Mohanty, R.P. (2012), “Towards development of composite supply chaincollaboration model”, International Journal of Logistics Systems and Management, Vol. 12No. 2, pp. 123-147.
Bhattacharjee, D., Baul, U. and Mohanty, R.P. (2013), “Collaboration between auto-service sectorand downstream oil sector in supply chain management”, IIIE Industrial EngineeringJournal Vol. VI No. 2, pp. 6-15.
Boston Consultancy Group (BCG) (2013), “Perspectives on importance of automotive industry”,available at: www.bcgindia.com/documents/file157626.pdf (accessed 15 August 2013).
Cai, S., Goh, M., de Souza, R. and Li, G. (2013), “Knowledge sharing in collaborative supply chains:twin effects of trust and power”, International Journal of Production Research, Vol. 51 No. 7,pp. 2060-2076.
Cao, M., Vonderembse, M.A., Zhang, Q. and Ragu-Nathan, T.S. (2010), “Supply chaincollaboration: conceptualisation and instrument development”, International Journal ofProduction Research, Vol. 48 No. 22, pp. 6613-6635.
Cassivi, L. (2006), “Collaboration planning in a supply chain”, Supply Chain Management:An International Journal, Vol. 11 No. 3, pp. 249-258.
Chaharbaghi, K. and Lynch, R. (1999), “Sustainable competitive advantage: towards a dynamicresource-based strategy”, Management Decision, Vol. 37 No. 1, pp. 45-50.
Fawcett, S.E., Wallin, C., Allred, C., Fawcett, A.M. and Magnan, G.M. (2011), “Informationtechnology as an enabler of supply chain collaboration: a dynamic‐capabilitiesperspective”, Journal of Supply Chain Management, Vol. 47 No. 1, pp. 38-59.
Ghosh, A., Ray, S. and Dewan, S. (2011), “IndianQ1 passenger vehicle industry: growth momentumto continue”, Indian Passenger Vehicle Industry: An ICRA Perspective, available at: www.icra.in/Files/ticker/PV-Industry-201103.pdf (accessed 28 February 2014).
Green, R. and Keogh, W. (2000), “Five years of collaboration in the UK upstream oil and gasindustry”, Strategic Change, Vol. 9 No. 4, pp. 249-263.
Guan, W. and Rehme, J. (2012), “Vertical integration in supply chains: driving forces andconsequences for a manufacturer’s downstream integration”, Supply Chain Management:An International Journal, Vol. 17 No. 2, pp. 187-201.
Ha, B.C. (2007), “Strategic collaboration with motor carriers and the effect on managers’perceptions of firm performance”, doctoral dissertation, The George WashingtonUniversity, Washington, DC.
Hair, J.F., Tatham, R.L., Anderson, R.E. and Black, W. (2006), Multivariate Data Analysis, Vol. 6,Pearson Prentice Hall, Upper Saddle River, NJ.
Hair, J.F., Black, W.C., Babin, B.J., Anderson, R.E. and Tatham, R.L. (2009), Multivariate DataAnalysis, 6th ed., Pearson Prentice Hall, New Delhi.
Hatcher, L. (1994), A Step-By-Step Approach to Using the SAS(R) System for Factor Analysis andStructural Equation Modelling, SAS Institute, Cary, NC.
Holweg, M., Disney, S., Holmström, J. and Småros, J. (2005), “Supply chain collaboration:making sense of the strategy continuum”, European Management Journal, Vol. 23 No. 2,pp. 170-181.
22
Strategiccollaborationmanagement
Horvath, L. (2001), “Collaboration: the key to value creation in supply chain management”, SupplyChain Management: An International Journal, Vol. 6 No. 5, pp. 205-207.
IBEF (2013), “The Indian oil and gas sector: recent developments, growth and prospects”, availableat: www.ibef.org/download/Oil-Gas-Sector-040213.pdf (accessed 28 February 2014).
Indian Oil & Gas (2014), “Oil subsidy figures to be down 20% under Modi regime”, available at:www.ipanewspack.com/2014/05/page/4/ (accessed 27 February 2015).
Kishore, K. and Patel, R.P. (2012), “Role of non-fuel retailing services: the face of petro-retailing inIndia”, Journal of Business and Retail Management Research, Vol. 7 No. 1, pp. 48-59.
Kotwala, M. (2005), “Petroleom retailing – future is now (CEDAR view)”, available at: www.cedar-consulting.com/pdf/Petroleum%20Article%20cedar%20view.pdf (accessed 27 February 2015).
KPMG (2010), “The Indian automotive industry: evolving dynamics”, available at: www.kpmg.de/docs/Auto_survey.pdf (accessed 28 February 2014).
McLaren, T., Head, M. and Yuan, Y. (2002), “Supply chain collaboration alternatives: understandingthe expected costs and benefits”, Internet Research, Vol. 12 No. 4, pp. 348-364.
Mohanty, R.P. and Augustin, P. (2014), “Business strategy of automotive and farm equipmentsector of the Mahindra & Mahindra Group of India”, Journal of Strategy and Management,Vol. 7 No. 1, pp. 64-86.
Mohanty, R.P. and Prakash, A. (2014), “Green supply chain management practices in India:a confirmatory empirical study”, Production & Manufacturing Research, Vol. 2 No. 1,pp. 438-456.
Norris-Tirrell, D. and Clay, J.A. (2010), Strategic Collaboration in Public and NonprofitAdministration, American Society for Public Administration, CRC Press, Taylor & FrancisGroup, New York, NY.
Nunnally, J.C. (1978), Psychometric Theory, 2nd ed., McGraw-Hill, New York, NY.
Prakash, A., Mohanty, R.P. and Kallurkar, S.P. (2011a), “Service quality modelling for lifeinsurance business using neural networks”, International Journal of Productivity andQuality Management, Vol. 7 No. 3, pp. 263-286.
Prakash, A., Mohanty, R.P., Kumar, S. and Kallurkar, S.P. (2011b), “Validation of multiple-itemscale for measuring service quality in life insurance business: structural equationmodelling approach”, International Journal of Productivity and Quality Management,Vol. 8 No. 4, pp. 433-458.
Rai, S., Pahwam, M.S. and Razdan, A. (2012), “A study on factors affecting selection of non-fuelretail outlet in India”, Asia-Pacific Marketing Review, Vol. 1 No. 2, pp. 59-67, avaliable at:www.asiapacific.edu (accessed 28 February 2014).
Ramanathan, U. and Gunasekaran, A. (2014), “Supply chain collaboration: impact of success inlong-term partnerships”, International Journal of Production Economics, Vol. 147 No. PB,pp. 252-259.
Ramesh, A., Banwet, D.K. and Shankar, R. (2010), “Modelling the barriers of supply chaincollaboration”, Journal of Modelling in Management, Vol. 5 No. 2, pp. 176-193.
Sengupta, A. (2007), Report On Conditions of Work and Promotion of Livelihoods in theUnorganised Sector. National Commission for Enterprises in the Unorganised Sector,Government of India, New Delhi.
Setnikar Cankar, S. and Petkovšek, V. (2013), “Private and public sector innovation and theimportance of cross-sector collaboration”, Journal of Applied Business Research ( JABR),Vol. 29 No. 6, pp. 1597-1606.
Singh, S.K. (2013), “Impact of fuel price control on finances of Indian public sector oil companies”,Advances In Management, Vol. 6 No. 1, pp. 8-12.
23
JSMA8,4

Soosay, C.A., Hyland, P.W. and Ferrer, M. (2008), “Supply chain collaboration: capabilities forcontinuous innovation”, Supply Chain Management: An International Journal, Vol. 13 No. 2,pp. 160-169.
Tiwari, R. and Herstatt, C. (2014), “ProfileQ2 of India’s automobile industry”, Aiming Big with SmallCars, Springer International Publishing, pp. 105-141.
Udin, Z.M., Khan, M.K. and Zairi, M. (2006), “A collaborative supply chain managementframework: part 1 – planning stage”, Business Process Management Journal, Vol. 12 No. 3,pp. 361-376.
Wasburn, M.H. and Crispo, A.W. (2006), “Strategic collaboration: developing a more effectivementoring model”, Review of Business, Vol. 27 No. 1, pp. 18-25.
Wernerfelt, B. (1984), “A resource-based view of the firm”, Strategic Management Journal, Vol. 5No. 2, pp. 171-180.
Wisner, J.D. (2003), “A structural equation model of supply chain management strategies andfirm performance”, Journal of Business Logistics, Vol. 24 No. 1, pp. 1-26.
About the authorsDebabrata Bhattacharjee is pursuingQ3 his PhD research from the Birla Institute of Technology,Mesra, India in the area of Supply Chain Management. He has graduated as a BE (Mechanical)from the National Institute of Technology, Durgapur, India. He obtained a Post-GraduateCertificate in General Management from the Indian Institute of Management, Calcutta and anMBA from the University of Ljubljana, Slovenia. He has more than 27 years of workingexperience in the downstream oil industry in India.
Dr Anand Prakash is an Assistant Professor at the School of General Management (SOGM),National Institute of Construction Management and Research (NICMAR), Pune, India. He hasmore than 11 years of strong experience in reputed organizations and academics. He is engagedin post-graduate teaching, guidance to research scholars and undertakes projects. He haspublished a number of papers in scholarly peer reviewed international journals. His researchinterest includes service quality (SQ) modelling, supply chain management (SCM) andapplications of statistics and quantitative techniques.
Dr Rajendra Prasad Mohanty is currently the Senior Adviser to ICFAI Group of Universitiesin India and was the Vice Chancellor of Siksha O Anusandhan University, Bhubaneswar, India.He has 38 years of academic experiences in institutes of national (India) importance and in someforeign universities. He has ten years of industry experience in top management positions.He advises academic institutions and industries, supervises research scholars and undertakessponsored research projects. He has published more than 300 papers in scholarly peer reviewedinternational journals and has also authored 12 books. Many professional institutions both inIndia and abroad have honoured him. Dr Rajendra Prasad Mohanty is the corresponding authorand can be contacted at: [email protected]
For instructions on how to order reprints of this article, please visit our website:www.emeraldgrouppublishing.com/licensing/reprints.htmOr contact us for further details: [email protected]
24
Strategiccollaborationmanagement