el color del mar por satélite: indicador de fenómenos oceanográficos en el gran caribe....
TRANSCRIPT
Near-surface phytoplankton distribution in the westernIntra-Americas Sea: The Influence of El Ninoand weather events
Nelson Melo Gonzalez,1 Frank E. Muller-Karger,2 Sergio Cerdeira Estrada,1
Roberto Perez de los Reyes,1 Ivan Victoria del Rıo,1
Pedro Cardenas Perez,3 and Ida Mitrani Arenal3
Abstract. The space-time variation of phytoplankton pigments in the western Intra-Americas Sea (IAS), in the vicinity of the island of Cuba, is examined using digital imagesobtained with the Coastal Zone Color Scanner sensor flown aboard the Nimbus 7 satellitefrom 1978 to 1986. The results are compared to historical in situ hydrographicobservations. A marked seasonality in pigment concentration was observed in watersaround Cuba, with an average of 0.07 mg m23 in summer (April–September) and 0.13 mgm23 during winter (October–March). The range of variation in pigment concentration waslarger in the Gulf of Mexico relative to the western Caribbean Sea. We identified fourbiogeographical areas on the basis of groups of pixels with similar patterns of timevariability. These are area I: southwest of Cuba, Yucatan Channel, and Florida Strait; areaII: central Gulf of Mexico; area III: east of Cuba; and area IV: central Caribbean Sea,south of Jamaica and Hispaniola. Two major meteorological events led to anomalies inthe seasonal cycle of pigment concentrations. During El Nino-Southern Oscillation(ENSO) of 1982–1983, positive anomalies were observed in the pigment concentration inthe western IAS during winter months. This was associated with intense mixing of thewater column by higher-frequency and stronger winds associated with cold fronts. ENSO1982–1983 therefore had a fertilizing effect on the IAS region. Another positive anomalywas observed in 1980–1981, a non-ENSO period that featured higher hurricane andextratropical low-pressure activity.
1. Introduction
There are surprisingly few studies that address patterns inthe abundance of phytoplankton in the Intra-Americas Sea(IAS), which includes the Caribbean and the Gulf of Mexico.Perhaps this is because this semienclosed tropical basin is tra-ditionally considered to be oligotrophic [Margalef, 1969; Corre-dor, 1977]. On the basis of studies of Coastal Zone ColorScanner (CZCS) satellite data, however, we know that the Gulfof Mexico undergoes pronounced seasonal variation in phyto-plankton standing stocks. This seasonality is driven in summerby high stability of the water column (low pigment concentra-tions) and by convective cooling and stronger winds duringwinter (high concentrations) [Muller-Karger et al., 1991; Melo etal., 1995]. The southeastern Caribbean also experiences sea-sonal variability in pigment abundance, with wind-driven up-welling leading to high concentrations along its southern mar-gin during boreal winter and spring. The widespread plumeformed by the discharge of the Orinoco River leads to higherphytoplankton biomass and dissolved organic concentrations
throughout the central-eastern Caribbean during boreal fall[Muller-Karger et al., 1989; Muller-Karger and Aparicio Castro,1994]. There is little information available on the western Ca-ribbean, however. Jromov [1967], on the basis of very fewhistorical observations, concluded that plankton levels thereare very low and seasonally invariant.
One of the most important events that influence global cli-mate is the El Nino-Southern Oscillation (ENSO). AroundCuba, anomalies in atmospheric pressure, rainfall, and air tem-peratures have been linked to ENSO [Cardenas and NaranjoDıaz, 2000a]. Some of the most obvious changes experienced inthe IAS during ENSO are decreases in cyclone activity insummer and increases in extratropical storm systems in winter.CZCS data cover the 1982–1983 ENSO. Here we present ev-idence that maxima in the concentration of pigments in 1982–1983 in the western IAS coincided with this ENSO event,which was classified as one of the strongest of the century[Hanson and Maul, 1991].
2. Materials and Methods
2.1. CZCS Image Processing
The CZCS provides a measure of the solar irradiance re-flected by the surface layer of the sea in several visible bands.These measurements of the color of the sea are empiricallyrelated to the near-surface concentration of phytoplanktonpigments [see Morel and Prieur, 1977; Gordon et al., 1983a, b,1988; Gordon and Wang, 1994; McClain et al., 1995; O’Reilly etal., 1998]. We estimated pigment concentration for the IAS
1Instituto de Oceanologıa, Ministerio de Ciencia, Tecnologıa y Me-dio Ambiente, Havana, Cuba.
2Department of Marine Science, University of South Florida, St.Petersburg.
3Instituto de Meteorologıa, Ministerio de Ciencia, Tecnologıa yMedio Ambiente, Havana, Cuba.
Copyright 2000 by the American Geophysical Union.
Paper number 2000JC900017.0148-0227/00/2000JC900017$09.00
JOURNAL OF GEOPHYSICAL RESEARCH, VOL. 105, NO. C6, PAGES 14,029–14,043, JUNE 15, 2000
14,029

region using the Gordon et al. [1983a, b] algorithms on all theavailable CZCS data (November 1978 through July 1986) usingprograms written for the “dsp” environment developed at theUniversity of Miami. The images were all mapped to a cylin-drical equidistant projection with limits of 188–268N and 738–888W (Figure 1). We then generated 869 daily composite im-ages covering portions of the IAS at 16 km2 pixel resolution (4km 3 4 km). This effort was carried out at the Department ofMarine Science, University of South Florida.
The images contain estimates of the concentration of pig-ments in the first optical depth at each pixel, which in areas oflow concentrations (0.04–0.5 mg m23), represent the averageconcentration to depths of between 1 and ;15 m depending onwater clarity. Areas with no data, land, or clouds or areas withhigh reflectance due to the influence of the bottom or sunglintwere eliminated by masking. In relatively clear oceanic watersthe accuracy of the CZCS product is expected to be of order30–40% of the concentration of pigments [Gordon et al., 1982,1983b]. In coastal areas these concentrations are less reliableand should only be considered qualitatively [Barale et al., 1986].
Given the extensive cloud cover that affected the regionduring the period of the operation of the CZCS, coherentpatterns in concentration of pigment were difficult to observein single or even weekly CZCS composites. Therefore imageswere averaged to derive 92 separate monthly means over theperiod of observation. We also derived mean trimester images(January–March, April–June, July–September, and October–December), incorporating each of the respective trimestersbetween 1978 and 1986 (Plate 1). Average “winter” (October–
March) and “summer” (April–September) images and an over-all mean of all images were also calculated (Plate 2).
To help with visualization of the gradients in pigment con-centration, we defined a palette with 256 colors, which showsmaximum contrast for the range 0.04–2.25 mg m23. Low con-centrations are represented in the images as purple or blue,and areas with higher concentrations appear as green, yellow,orange, or red. Higher values in the IAS region are associatedprimarily with coastal or shallow shelf regions and are repre-sented here in gray scale. The CZCS algorithm may overesti-mate the concentration of pigments on the continental shelvesof Cuba, the Bahamas, and shallow regions near Florida. Fieldobservations suggest that these waters are case II type [cf.Morel and Prieur, 1977]. Missing data or land areas are coloredblack and dark gray.
To evaluate time variability in pigment concentration, wesampled 18 stations in each of the 92 monthly average images(Figure 1 and Table 1). At each station we extracted a 3 pixel 33 pixel matrix of valid data (;12 km 3 12 km). The time seriesprovided pigment concentration mean, standard deviation, andrange range (maximum and minimum) in the region (Table 1).We computed a multiple correlation matrix to study the degreeof similarity between the 18 stations. We used a frequency filter(12 month lag moving average seasonal decomposition filter)on each of the 18 series to remove the seasonal signal in aneffort to examine interannual-scale variations.
Some of our sampling stations showed gappy time series.The gaps were more frequent in summer, probably because ofcloud cover and increased chances of sunglint. An analysis of
Figure 1. Geographical location of the stations used for time series extractions from the Coastal Zone ColorScanner (CZCS) data and regions identified as behaving as distinct zones in their pigment variability. ZoneI is subdivided into areas I-a, I-b, and I-c. The double line outlines a window where sea surface temperatureswere processed.
MELO GONZALEZ ET AL.: INTRA-AMERICAS SEA PHYTOPLANKTON AND EL NINO14,030
cloud cover in the monthly images shows that the clouds’spatial distribution is random over much of the region. How-ever, the Loop Current in the Gulf of Mexico tends to havemore clouds than surrounding waters. We expect, nevertheless,that cloud distribution and lack of scheduled satellite CZCSimage coverage had a minor effect on our conclusions onspatial or temporal patterns.
2.2. In Situ Observations
In situ measurements were collected within 200 nauticalmiles of the coast of Cuba at 80 stations during four cruises ofthe R/V Ulises. Two cruises were carried out during winter(October–November 1988 and February–March 1989), andtwo were carried out during summer (May–June and July1989). Samples for phytoplankton taxonomy and biomass anal-yses were collected at the surface. Taxonomic analyses werebased on 5–12 L samples filtered through nucleopore filters.Only cells .10 mm were identified, using the method proposedby Sorokin [1979]. Pigment concentration (chlorophyll a) wasestimated spectrophotometrically, according to Jeffrey andHumphrey [1975] and as modified by Koblentz-Mishke and Ved-ernikov [1977a, b] [Perez et al., 1990].
Nutrients and physical characteristics of the water between 0and 200 m were also obtained [Fernandez et al., 1990; Victoriaet al., 1990]. The average insolation was calculated from theNew National Atlas of Cuba [Academy Sciences of Cuba (ACC),1989]. Sea surface temperature (SST) and its anomalies be-tween 1978 and 1986 were examined using data from Reynolds[1988], Reynolds and Marsico [1993] and the ComprehensiveOcean-Atmosphere Data Set (available at http://www.cdc.noaa.gov/coads/). The data from Reynolds [1988] and Reynoldsand Marsico [1993] include in situ data, satellite data, and ablended analysis for the subregion outlined within our studyarea in Figure 1. The in situ data include ship and buoy datasummarized in 28 latitude by 28 longitude cells. The blendedanalysis was carried out using a statistical technique suggestedby Oort and Rasmusson [1971]. Meteorological parameters andinformation on hurricanes, cold fronts, and extratropical low-pressure systems were taken from synoptic weather charts andhistorical logs of the Institute of Meteorology of Cuba(INSMET) and from National Oceanic and Atmospheric Ad-ministration buoy 42003 (25.948N, 85.918W) located in theeastern Gulf of Mexico. The occurrence of ENSO events wasdefined on the basis of index postings by the NOAA ClimatePrediction Center and by INSMET [Cardenas and NaranjoDıaz, 2000b].
3. Results and Discussion3.1. Pigment Variability
Our analyses of the CZCS-derived time series of stationsidentify at least four separate regions on the basis of theirvariability in phytoplankton pigment concentration. Wegrouped stations (Figure 1) when the cross-correlation factor rexceeded 0.65. Specifically, the areas identified were area I:western Caribbean (southwest of Cuba), southeastern Gulf ofMexico, Yucatan Channel, and Florida Strait (stations 1, 2, 4,7, 8, and 16); area II: central Gulf of Mexico (stations 8, 9, and10); area III: northwestern Atlantic coasts, Windward Passage,and Mona Passage (stations 3, 5, and 6); and area IV: centralCaribbean (stations 13, 14, and 18). Below we describe the majorpatterns of variability observed within each of these regions.
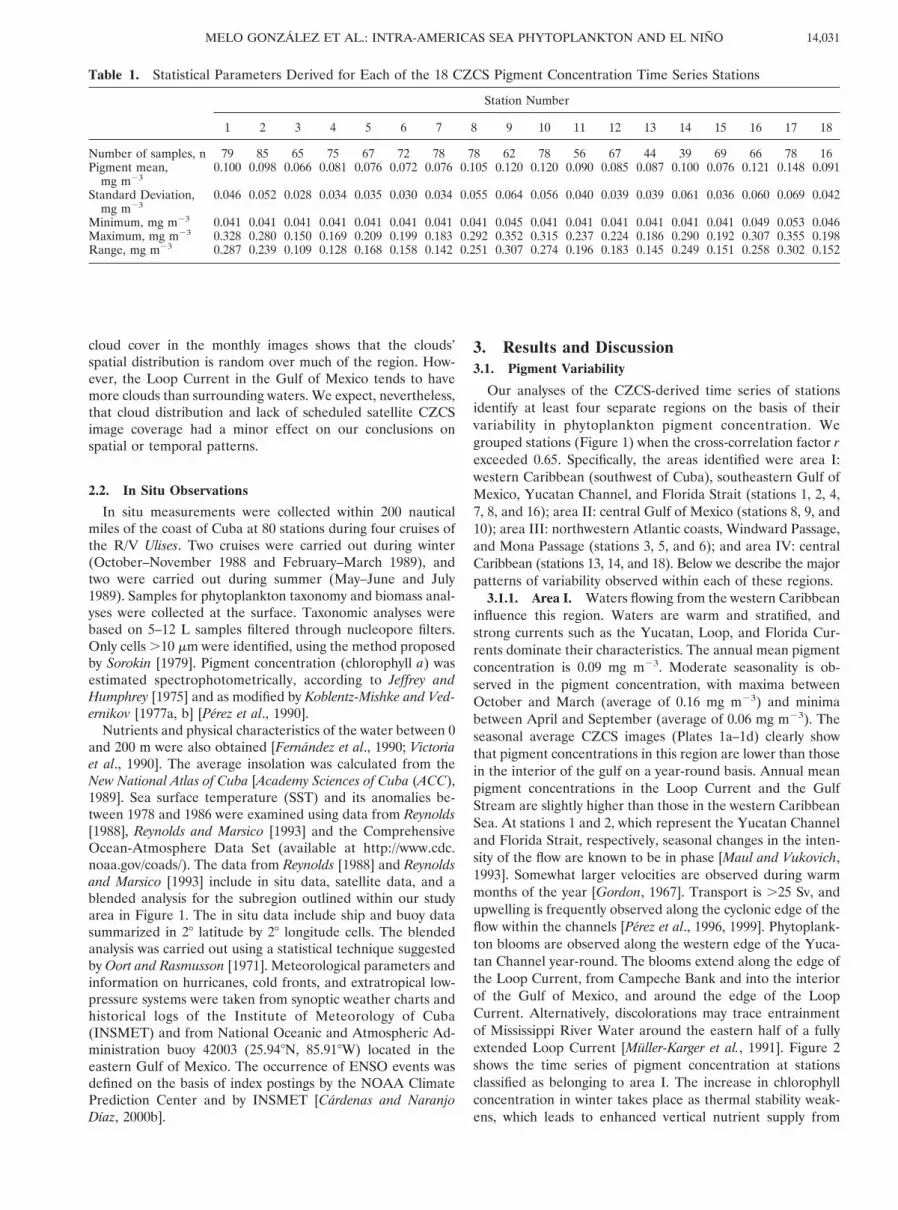
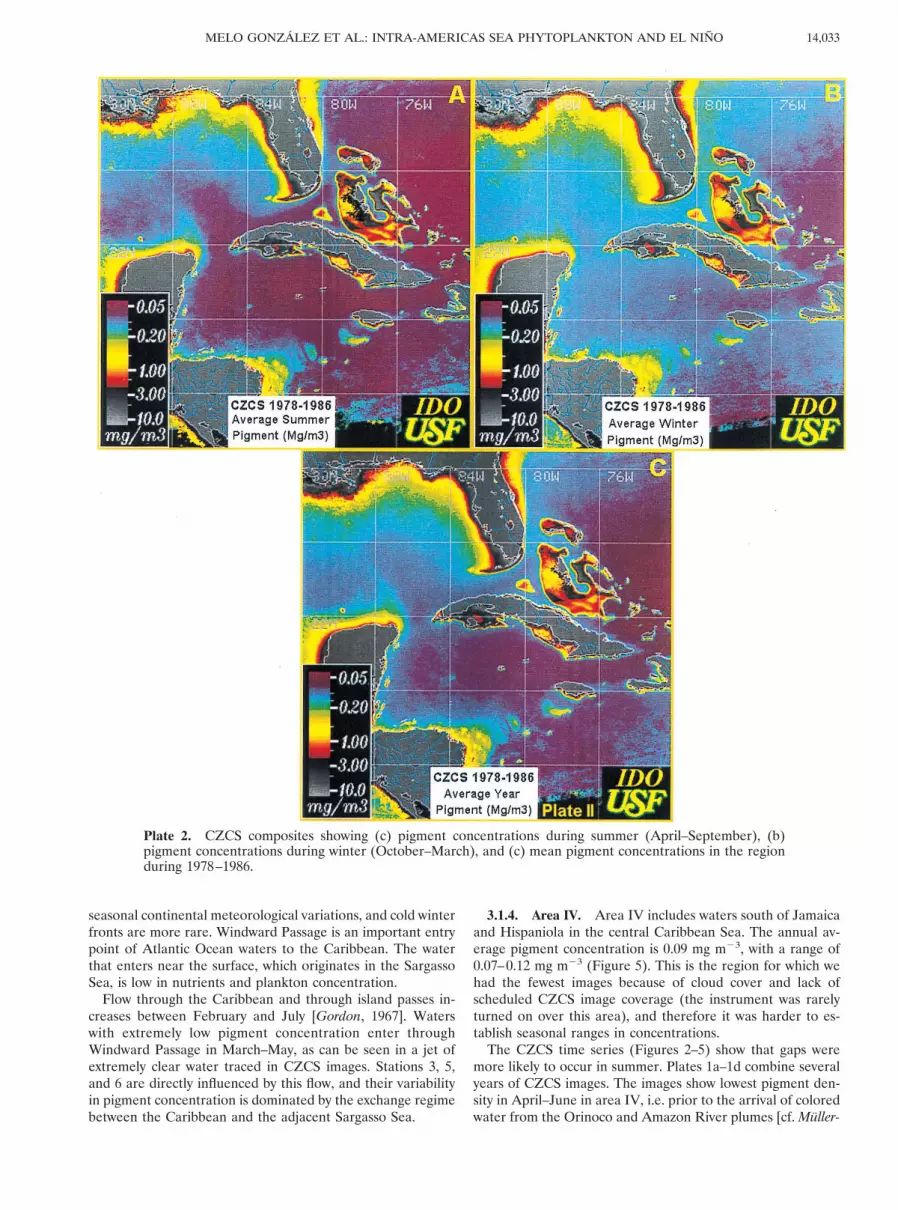
3.1.1. Area I. Waters flowing from the western Caribbeaninfluence this region. Waters are warm and stratified, andstrong currents such as the Yucatan, Loop, and Florida Cur-rents dominate their characteristics. The annual mean pigmentconcentration is 0.09 mg m23. Moderate seasonality is ob-served in the pigment concentration, with maxima betweenOctober and March (average of 0.16 mg m23) and minimabetween April and September (average of 0.06 mg m23). Theseasonal average CZCS images (Plates 1a–1d) clearly showthat pigment concentrations in this region are lower than thosein the interior of the gulf on a year-round basis. Annual meanpigment concentrations in the Loop Current and the GulfStream are slightly higher than those in the western CaribbeanSea. At stations 1 and 2, which represent the Yucatan Channeland Florida Strait, respectively, seasonal changes in the inten-sity of the flow are known to be in phase [Maul and Vukovich,1993]. Somewhat larger velocities are observed during warmmonths of the year [Gordon, 1967]. Transport is .25 Sv, andupwelling is frequently observed along the cyclonic edge of theflow within the channels [Perez et al., 1996, 1999]. Phytoplank-ton blooms are observed along the western edge of the Yuca-tan Channel year-round. The blooms extend along the edge ofthe Loop Current, from Campeche Bank and into the interiorof the Gulf of Mexico, and around the edge of the LoopCurrent. Alternatively, discolorations may trace entrainmentof Mississippi River Water around the eastern half of a fullyextended Loop Current [Muller-Karger et al., 1991]. Figure 2shows the time series of pigment concentration at stationsclassified as belonging to area I. The increase in chlorophyllconcentration in winter takes place as thermal stability weak-ens, which leads to enhanced vertical nutrient supply from
Table 1. Statistical Parameters Derived for Each of the 18 CZCS Pigment Concentration Time Series Stations
Station Number
1 2 3 4 5 6 7 8 9 10 11 12 13 14 15 16 17 18
Number of samples, n 79 85 65 75 67 72 78 78 62 78 56 67 44 39 69 66 78 16Pigment mean,
mg m230.100 0.098 0.066 0.081 0.076 0.072 0.076 0.105 0.120 0.120 0.090 0.085 0.087 0.100 0.076 0.121 0.148 0.091
Standard Deviation,mg m23
0.046 0.052 0.028 0.034 0.035 0.030 0.034 0.055 0.064 0.056 0.040 0.039 0.039 0.061 0.036 0.060 0.069 0.042
Minimum, mg m23 0.041 0.041 0.041 0.041 0.041 0.041 0.041 0.041 0.045 0.041 0.041 0.041 0.041 0.041 0.041 0.049 0.053 0.046Maximum, mg m23 0.328 0.280 0.150 0.169 0.209 0.199 0.183 0.292 0.352 0.315 0.237 0.224 0.186 0.290 0.192 0.307 0.355 0.198Range, mg m23 0.287 0.239 0.109 0.128 0.168 0.158 0.142 0.251 0.307 0.274 0.196 0.183 0.145 0.249 0.151 0.258 0.302 0.152
14,031MELO GONZALEZ ET AL.: INTRA-AMERICAS SEA PHYTOPLANKTON AND EL NINO

below [Muller-Karger et al., 1991; Perez et al., 1990, 1999; Vic-toria et al., 1990; Fernandez et al., 1990].
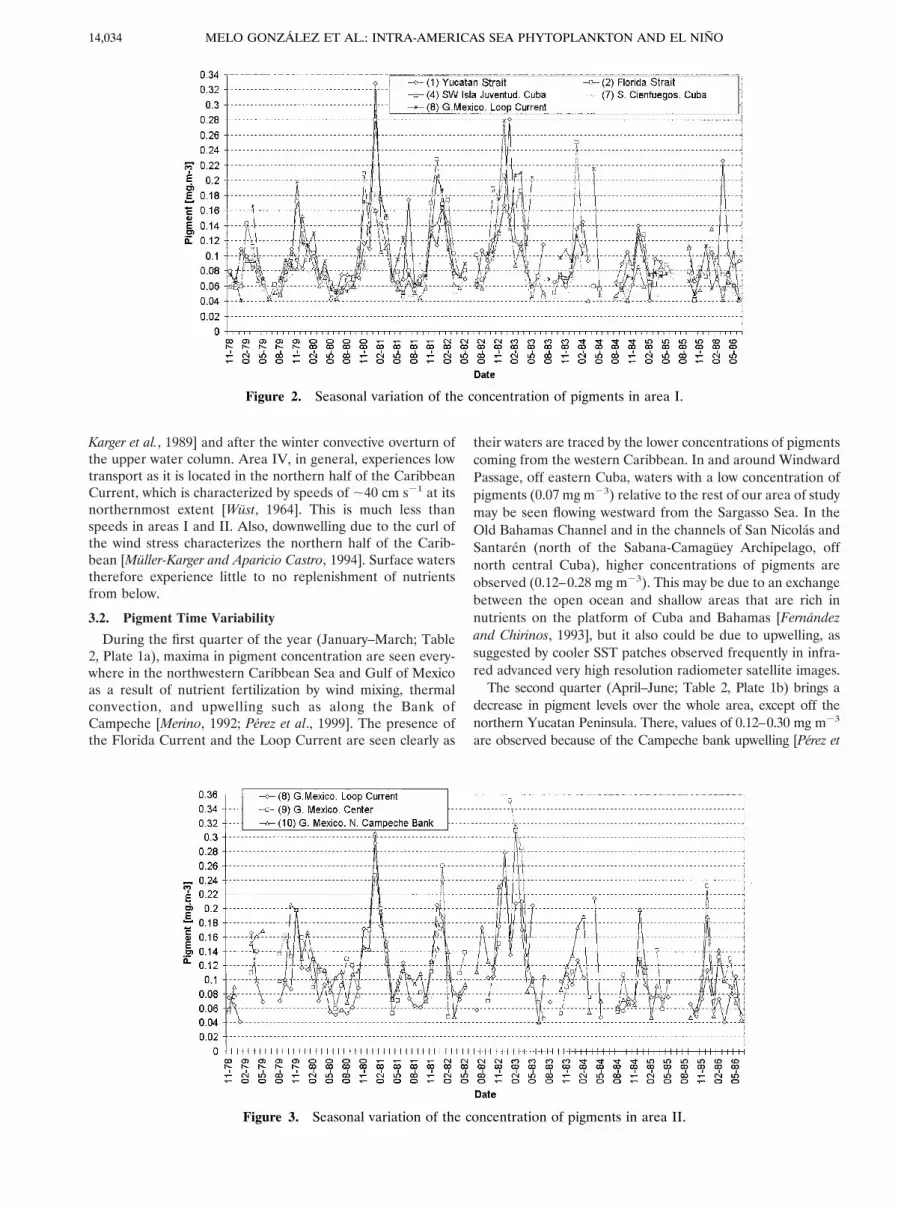
3.1.2. Area II. Area II includes waters of the central Gulfof Mexico and is heavily influenced by the Loop Current andits eddies. Pigment concentration in the three separate stationsbehaves very similarly indeed (Figure 3). Station 8 may beclassified as belonging to area I or area II, depending on theposition of the Loop Current and its rings. The annual meanpigment concentration of area II (0.12 mg m23) is larger thanthat of Area I, but it is also more variable. Figure 3, neverthe-less, shows a remarkable seasonality in the concentration ofpigments, with maxima in winter (average of 0.20 mg m23) andminima in summer (average of 0.08 mg m23). The winterincrease in pigment concentration is due to fertilization of
surface layers by thermal convection and strong winds[Muller-Karger et al., 1991; Victoria et al., 1990]. Frequent andintense cold fronts that carry storms with strong winds and highprecipitation [ACC, 1989] are observed here during winterbecause of the proximity to the continent. The contribution ofthe Mississippi River is also important in raising pigment con-centration because of streamers entrained along the edge ofthe Loop Current [Muller-Karger et al., 1991; Thomas and Sim-mons, 1960].
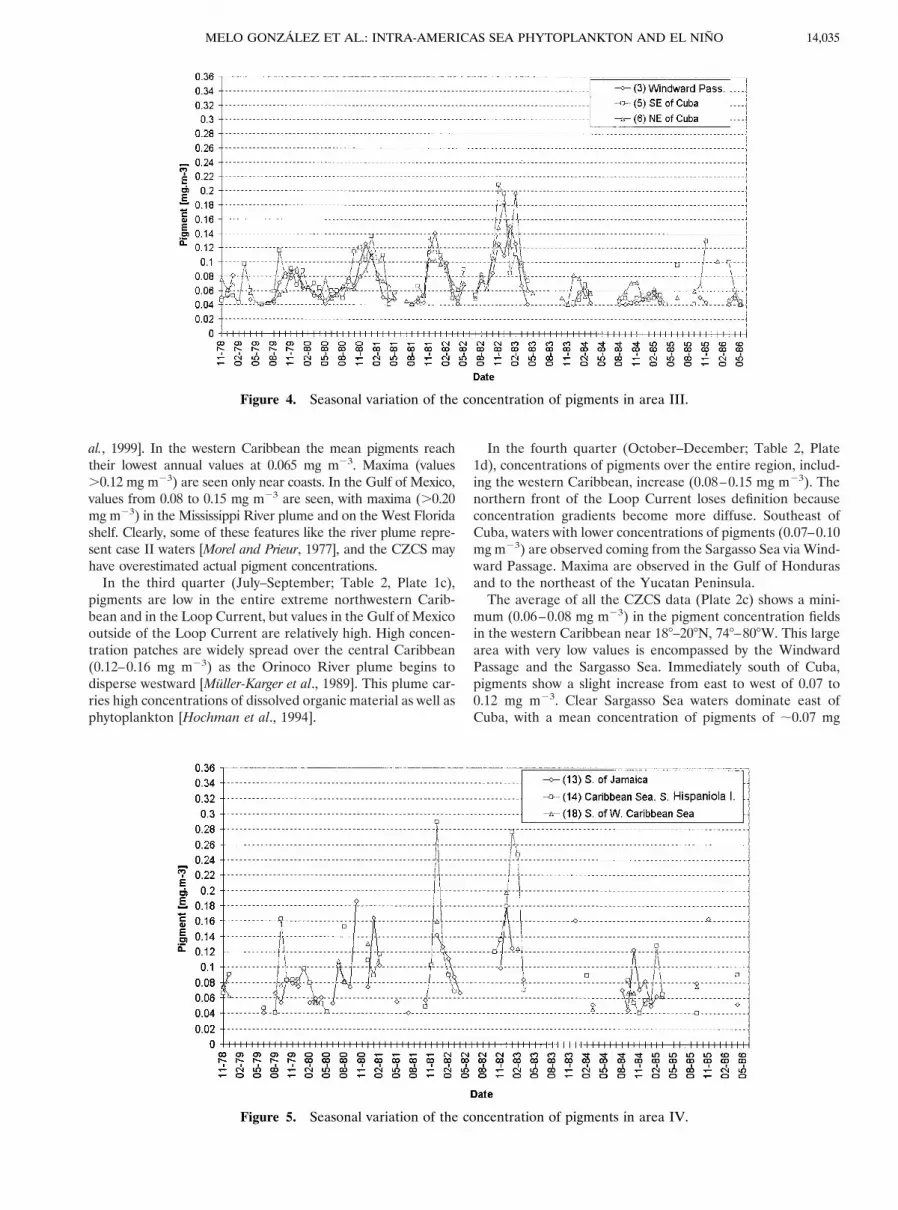
3.1.3. Area III. Waters east of Cuba (area III) have amuch smaller mean and seasonal range in pigment concentra-tion than the other areas. The annual mean here is 0.07 mgm23, with summer values of 0.06 mg m23 and winter values of0.09 mg m23 (Figure 4). This region is less influenced by
Plate 1. CZCS composites showing pigment concentrations during (a) January–March, (b) April–June, (c)July–September, and (d) October–December, 1978–1986.
MELO GONZALEZ ET AL.: INTRA-AMERICAS SEA PHYTOPLANKTON AND EL NINO14,032
seasonal continental meteorological variations, and cold winterfronts are more rare. Windward Passage is an important entrypoint of Atlantic Ocean waters to the Caribbean. The waterthat enters near the surface, which originates in the SargassoSea, is low in nutrients and plankton concentration.
Flow through the Caribbean and through island passes in-creases between February and July [Gordon, 1967]. Waterswith extremely low pigment concentration enter throughWindward Passage in March–May, as can be seen in a jet ofextremely clear water traced in CZCS images. Stations 3, 5,and 6 are directly influenced by this flow, and their variabilityin pigment concentration is dominated by the exchange regimebetween the Caribbean and the adjacent Sargasso Sea.
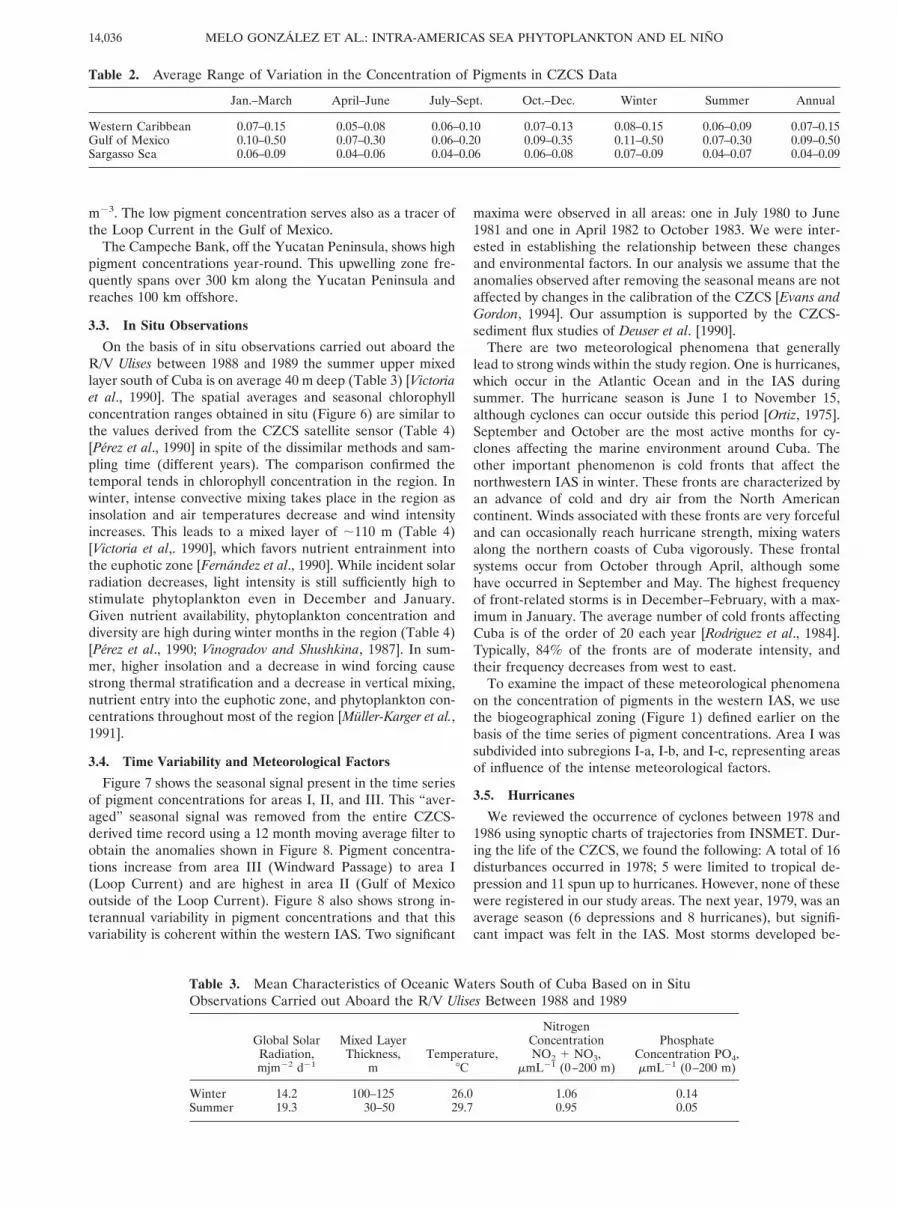
3.1.4. Area IV. Area IV includes waters south of Jamaicaand Hispaniola in the central Caribbean Sea. The annual av-erage pigment concentration is 0.09 mg m23, with a range of0.07–0.12 mg m23 (Figure 5). This is the region for which wehad the fewest images because of cloud cover and lack ofscheduled CZCS image coverage (the instrument was rarelyturned on over this area), and therefore it was harder to es-tablish seasonal ranges in concentrations.
The CZCS time series (Figures 2–5) show that gaps weremore likely to occur in summer. Plates 1a–1d combine severalyears of CZCS images. The images show lowest pigment den-sity in April–June in area IV, i.e. prior to the arrival of coloredwater from the Orinoco and Amazon River plumes [cf. Muller-
Plate 2. CZCS composites showing (c) pigment concentrations during summer (April–September), (b)pigment concentrations during winter (October–March), and (c) mean pigment concentrations in the regionduring 1978–1986.
14,033MELO GONZALEZ ET AL.: INTRA-AMERICAS SEA PHYTOPLANKTON AND EL NINO
Karger et al., 1989] and after the winter convective overturn ofthe upper water column. Area IV, in general, experiences lowtransport as it is located in the northern half of the CaribbeanCurrent, which is characterized by speeds of ;40 cm s21 at itsnorthernmost extent [Wust, 1964]. This is much less thanspeeds in areas I and II. Also, downwelling due to the curl ofthe wind stress characterizes the northern half of the Carib-bean [Muller-Karger and Aparicio Castro, 1994]. Surface waterstherefore experience little to no replenishment of nutrientsfrom below.
3.2. Pigment Time Variability
During the first quarter of the year (January–March; Table2, Plate 1a), maxima in pigment concentration are seen every-where in the northwestern Caribbean Sea and Gulf of Mexicoas a result of nutrient fertilization by wind mixing, thermalconvection, and upwelling such as along the Bank ofCampeche [Merino, 1992; Perez et al., 1999]. The presence ofthe Florida Current and the Loop Current are seen clearly as
their waters are traced by the lower concentrations of pigmentscoming from the western Caribbean. In and around WindwardPassage, off eastern Cuba, waters with a low concentration ofpigments (0.07 mg m23) relative to the rest of our area of studymay be seen flowing westward from the Sargasso Sea. In theOld Bahamas Channel and in the channels of San Nicolas andSantaren (north of the Sabana-Camaguey Archipelago, offnorth central Cuba), higher concentrations of pigments areobserved (0.12–0.28 mg m23). This may be due to an exchangebetween the open ocean and shallow areas that are rich innutrients on the platform of Cuba and Bahamas [Fernandezand Chirinos, 1993], but it also could be due to upwelling, assuggested by cooler SST patches observed frequently in infra-red advanced very high resolution radiometer satellite images.
The second quarter (April–June; Table 2, Plate 1b) brings adecrease in pigment levels over the whole area, except off thenorthern Yucatan Peninsula. There, values of 0.12–0.30 mg m23
are observed because of the Campeche bank upwelling [Perez et
Figure 2. Seasonal variation of the concentration of pigments in area I.
Figure 3. Seasonal variation of the concentration of pigments in area II.
MELO GONZALEZ ET AL.: INTRA-AMERICAS SEA PHYTOPLANKTON AND EL NINO14,034
al., 1999]. In the western Caribbean the mean pigments reachtheir lowest annual values at 0.065 mg m23. Maxima (values.0.12 mg m23) are seen only near coasts. In the Gulf of Mexico,values from 0.08 to 0.15 mg m23 are seen, with maxima (.0.20mg m23) in the Mississippi River plume and on the West Floridashelf. Clearly, some of these features like the river plume repre-sent case II waters [Morel and Prieur, 1977], and the CZCS mayhave overestimated actual pigment concentrations.
In the third quarter (July–September; Table 2, Plate 1c),pigments are low in the entire extreme northwestern Carib-bean and in the Loop Current, but values in the Gulf of Mexicooutside of the Loop Current are relatively high. High concen-tration patches are widely spread over the central Caribbean(0.12–0.16 mg m23) as the Orinoco River plume begins todisperse westward [Muller-Karger et al., 1989]. This plume car-ries high concentrations of dissolved organic material as well asphytoplankton [Hochman et al., 1994].
In the fourth quarter (October–December; Table 2, Plate1d), concentrations of pigments over the entire region, includ-ing the western Caribbean, increase (0.08–0.15 mg m23). Thenorthern front of the Loop Current loses definition becauseconcentration gradients become more diffuse. Southeast ofCuba, waters with lower concentrations of pigments (0.07–0.10mg m23) are observed coming from the Sargasso Sea via Wind-ward Passage. Maxima are observed in the Gulf of Hondurasand to the northeast of the Yucatan Peninsula.
The average of all the CZCS data (Plate 2c) shows a mini-mum (0.06–0.08 mg m23) in the pigment concentration fieldsin the western Caribbean near 188–208N, 748–808W. This largearea with very low values is encompassed by the WindwardPassage and the Sargasso Sea. Immediately south of Cuba,pigments show a slight increase from east to west of 0.07 to0.12 mg m23. Clear Sargasso Sea waters dominate east ofCuba, with a mean concentration of pigments of ;0.07 mg
Figure 4. Seasonal variation of the concentration of pigments in area III.
Figure 5. Seasonal variation of the concentration of pigments in area IV.
14,035MELO GONZALEZ ET AL.: INTRA-AMERICAS SEA PHYTOPLANKTON AND EL NINO
m23. The low pigment concentration serves also as a tracer ofthe Loop Current in the Gulf of Mexico.
The Campeche Bank, off the Yucatan Peninsula, shows highpigment concentrations year-round. This upwelling zone fre-quently spans over 300 km along the Yucatan Peninsula andreaches 100 km offshore.
3.3. In Situ Observations
On the basis of in situ observations carried out aboard theR/V Ulises between 1988 and 1989 the summer upper mixedlayer south of Cuba is on average 40 m deep (Table 3) [Victoriaet al., 1990]. The spatial averages and seasonal chlorophyllconcentration ranges obtained in situ (Figure 6) are similar tothe values derived from the CZCS satellite sensor (Table 4)[Perez et al., 1990] in spite of the dissimilar methods and sam-pling time (different years). The comparison confirmed thetemporal tends in chlorophyll concentration in the region. Inwinter, intense convective mixing takes place in the region asinsolation and air temperatures decrease and wind intensityincreases. This leads to a mixed layer of ;110 m (Table 4)[Victoria et al,. 1990], which favors nutrient entrainment intothe euphotic zone [Fernandez et al., 1990]. While incident solarradiation decreases, light intensity is still sufficiently high tostimulate phytoplankton even in December and January.Given nutrient availability, phytoplankton concentration anddiversity are high during winter months in the region (Table 4)[Perez et al., 1990; Vinogradov and Shushkina, 1987]. In sum-mer, higher insolation and a decrease in wind forcing causestrong thermal stratification and a decrease in vertical mixing,nutrient entry into the euphotic zone, and phytoplankton con-centrations throughout most of the region [Muller-Karger et al.,1991].
3.4. Time Variability and Meteorological Factors
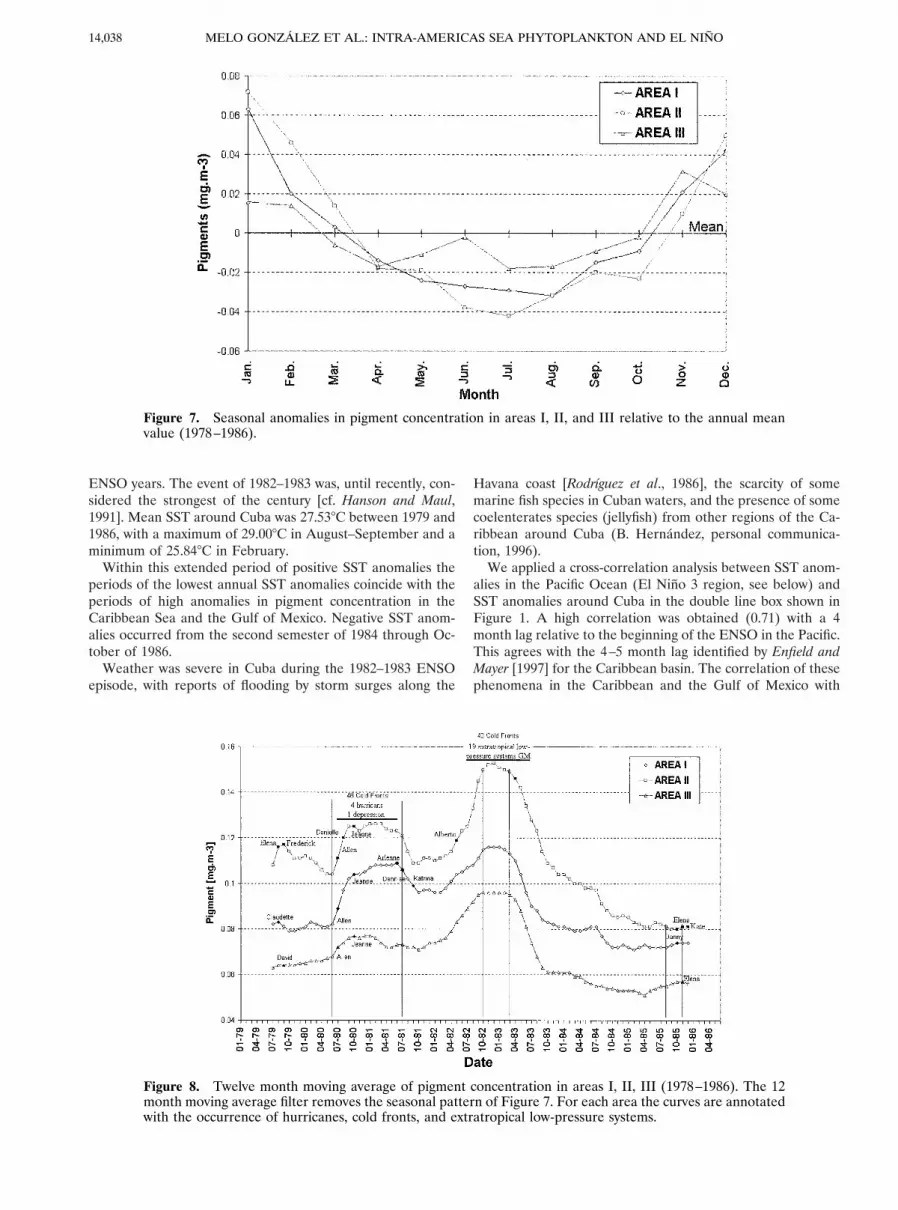
Figure 7 shows the seasonal signal present in the time seriesof pigment concentrations for areas I, II, and III. This “aver-aged” seasonal signal was removed from the entire CZCS-derived time record using a 12 month moving average filter toobtain the anomalies shown in Figure 8. Pigment concentra-tions increase from area III (Windward Passage) to area I(Loop Current) and are highest in area II (Gulf of Mexicooutside of the Loop Current). Figure 8 also shows strong in-terannual variability in pigment concentrations and that thisvariability is coherent within the western IAS. Two significant
maxima were observed in all areas: one in July 1980 to June1981 and one in April 1982 to October 1983. We were inter-ested in establishing the relationship between these changesand environmental factors. In our analysis we assume that theanomalies observed after removing the seasonal means are notaffected by changes in the calibration of the CZCS [Evans andGordon, 1994]. Our assumption is supported by the CZCS-sediment flux studies of Deuser et al. [1990].
There are two meteorological phenomena that generallylead to strong winds within the study region. One is hurricanes,which occur in the Atlantic Ocean and in the IAS duringsummer. The hurricane season is June 1 to November 15,although cyclones can occur outside this period [Ortiz, 1975].September and October are the most active months for cy-clones affecting the marine environment around Cuba. Theother important phenomenon is cold fronts that affect thenorthwestern IAS in winter. These fronts are characterized byan advance of cold and dry air from the North Americancontinent. Winds associated with these fronts are very forcefuland can occasionally reach hurricane strength, mixing watersalong the northern coasts of Cuba vigorously. These frontalsystems occur from October through April, although somehave occurred in September and May. The highest frequencyof front-related storms is in December–February, with a max-imum in January. The average number of cold fronts affectingCuba is of the order of 20 each year [Rodriguez et al., 1984].Typically, 84% of the fronts are of moderate intensity, andtheir frequency decreases from west to east.
To examine the impact of these meteorological phenomenaon the concentration of pigments in the western IAS, we usethe biogeographical zoning (Figure 1) defined earlier on thebasis of the time series of pigment concentrations. Area I wassubdivided into subregions I-a, I-b, and I-c, representing areasof influence of the intense meteorological factors.
3.5. Hurricanes
We reviewed the occurrence of cyclones between 1978 and1986 using synoptic charts of trajectories from INSMET. Dur-ing the life of the CZCS, we found the following: A total of 16disturbances occurred in 1978; 5 were limited to tropical de-pression and 11 spun up to hurricanes. However, none of thesewere registered in our study areas. The next year, 1979, was anaverage season (6 depressions and 8 hurricanes), but signifi-cant impact was felt in the IAS. Most storms developed be-
Table 2. Average Range of Variation in the Concentration of Pigments in CZCS Data
Jan.–March April–June July–Sept. Oct.–Dec. Winter Summer Annual
Western Caribbean 0.07–0.15 0.05–0.08 0.06–0.10 0.07–0.13 0.08–0.15 0.06–0.09 0.07–0.15Gulf of Mexico 0.10–0.50 0.07–0.30 0.06–0.20 0.09–0.35 0.11–0.50 0.07–0.30 0.09–0.50Sargasso Sea 0.06–0.09 0.04–0.06 0.04–0.06 0.06–0.08 0.07–0.09 0.04–0.07 0.04–0.09
Table 3. Mean Characteristics of Oceanic Waters South of Cuba Based on in SituObservations Carried out Aboard the R/V Ulises Between 1988 and 1989
Global SolarRadiation,mjm22 d21
Mixed LayerThickness,
mTemperature,
8C
NitrogenConcentrationNO2 1 NO3,
mmL21 (0–200 m)
PhosphateConcentration PO4,mmL21 (0–200 m)
Winter 14.2 100–125 26.0 1.06 0.14Summer 19.3 30–50 29.7 0.95 0.05
MELO GONZALEZ ET AL.: INTRA-AMERICAS SEA PHYTOPLANKTON AND EL NINO14,036

tween mid-August and mid-September. Two hurricanes af-fected area I-a, two affected area I-b, one affected area I-c, fiveaffected area II, three affected area III, and none affected areaIV. However, 1980 was a very active season in the Atlantic (4depressions and 12 hurricanes). In the study area the followingevents were registered: two in area I-a, two in area I-b, none inarea I-c, three in area II, none in area III, and one in area IV.We experienced Hurricane Allen, one of the most intense ofthe twentieth century, with maximum winds .91 m s21. Allenlasted from August 2 through 11 and crossed areas IV, I-a, I-b,and II. It attained maximum intensity in the Gulf of Mexico.The cooling effect of a hurricane on SST may last up to 20days, and if the hurricane is especially intense, the signal mayremain up to 50 days [Tunegolobes, 1976]. Given that 1980 alsoexperienced a very active cold front winter season, the waterswithin our region were mixed vigorously and repeatedly. Webelieve this to be the reason for the sustained blooming ofphytoplankton detected as the maximum observed in Figure 8starting July 1980 and ending approximately in June 1981.Again, 1981 was a very active season in the Atlantic, with 6depressions and 11 hurricanes. However, the impact on thestudy area was weak, with only three hurricanes in area I-a, onein area I-b, and none in the Areas I-c, II, III, and IV. Theseason began early, in May, with storms that affected area I-a.The 1982 cyclone season was weak, with 4 depressions and 5hurricanes. In the study area a single depression was registeredin June in area I-b of the Gulf of Mexico. An even weakerseason was experienced in 1983 (3 depressions and 3 hurri-canes). In the study area a single case was registered in Augustthat affected areas I-c, I-b, and II. A lot of activity occurred inthe Atlantic in 1984, with 4 depressions and 12 hurricanes, butalmost no activity occurred in the study area. A depressionaffected area I-c. Then 1985 was a very active season (2 de-
pressions and 11 hurricanes), with several hurricanes in theGulf of Mexico. In the study areas none affected area I-a, fouraffected I-b, none affected area I-c, two were observed in areaII, two were in area III, and none were in area IV. Finally, 1986showed weak activity (3 depressions and 6 hurricanes). Onlyone hurricane affected area II.
3.6. Meteorological Frontal Systems
The frontal systems in 1978–1986 were examined using syn-optic weather maps on file at INSMET. From 67 winter sea-sons analyzed the annual average number of cold fronts thataffected Cuba was 19.9. In winters 1980–1981 and 1982–1983the incidence of cold fronts increased above the norm, with 48and 43 cases, respectively. The cold fronts we identified for1979–1986 winters within the biogeographic areas are shown inTable 5.
Although 1980 –1981 had more cold front systems than1982–1983, the latter season showed better defined fronts overthe Gulf of Mexico (areas II and I-b), the straits north of Cuba,and a the northwestern Caribbean (areas I-a and I-c). Frontsalso reached waters southeast of Cuba (area III) in 1982–1983with almost twice the frequency of that of the previous years.Also, between October 1982 and March 1983, 19 extratropicallow-pressure systems formed in the Gulf of Mexico. Thesewinter storms traveled farther to the south than normal, caus-ing high winds in our study areas.
The frequency distribution of cold fronts in 1980 –1981showed a maximum in December–February, but in 1982–1983,peak winter storm activity stretched through March (Figure 9).Even though the number of cold fronts decreased thereafter, inboth cases the season of fronts extended until May. Thereforein 1980–1981 and 1982–1983 the oceanic environment aroundCuba experienced prolonged periods of strong winds. Thesegenerated intense surf and vertical turbulent mixing.
During ENSO events, tropical hurricane formation in theAtlantic is inhibited [Gray and Sheaffer, 1991], but the fre-quency of extratropical low-pressure systems increases in theGulf of Mexico during winter [Cardenas and Naranjo Dıaz,2000a]. We hypothesize that the increased frequency of stormsassociated with such cold fronts led to the high concentrationof pigments observed for these two winter seasons (1980–1981and 1982–1983). The effect is very pronounced in the regiondunging the ENSO event of 1982–1983.
3.7. Variation of the Sea Surface Temperature
On the basis of World Meteorological Organization (WMO)reports [WMO, 1996] the period 1978–1986 was characterizedby positive global SST anomalies [Bottomley et al., 1990]. Forour study area around Cuba (Figure 1), during the CZCSperiod (1978–1986), marked positive anomalies in SST wereobserved in 1980–1983 (;0.108–0.278C; Figure 10). The peri-ods 1977–1978, 1982–1983, and 1986–1987 are classified as
Figure 6. In Situ phytoplankton pigment concentration (mgm23) south of Cuba (a) in summer (Ulises cruises 4 and 5 in1989) and (b) in winter (Ulises cruises 2 and 3 1988 and 1989).The pluses are oceanographic stations.
Table 4. Phytoplankton Data in Surface Waters South ofCuba Based on in Situ Observations Carried out Aboard theR/V Ulises Between 1988 and 1989
Numberof Stations
AverageNumber
of Species
Average ChlorophyllConcentration,
mg m23
Winter 150 73 0.117Summer 153 62 0.074
14,037MELO GONZALEZ ET AL.: INTRA-AMERICAS SEA PHYTOPLANKTON AND EL NINO
ENSO years. The event of 1982–1983 was, until recently, con-sidered the strongest of the century [cf. Hanson and Maul,1991]. Mean SST around Cuba was 27.538C between 1979 and1986, with a maximum of 29.008C in August–September and aminimum of 25.848C in February.
Within this extended period of positive SST anomalies theperiods of the lowest annual SST anomalies coincide with theperiods of high anomalies in pigment concentration in theCaribbean Sea and the Gulf of Mexico. Negative SST anom-alies occurred from the second semester of 1984 through Oc-tober of 1986.
Weather was severe in Cuba during the 1982–1983 ENSOepisode, with reports of flooding by storm surges along the
Havana coast [Rodrıguez et al., 1986], the scarcity of somemarine fish species in Cuban waters, and the presence of somecoelenterates species (jellyfish) from other regions of the Ca-ribbean around Cuba (B. Hernandez, personal communica-tion, 1996).
We applied a cross-correlation analysis between SST anom-alies in the Pacific Ocean (El Nino 3 region, see below) andSST anomalies around Cuba in the double line box shown inFigure 1. A high correlation was obtained (0.71) with a 4month lag relative to the beginning of the ENSO in the Pacific.This agrees with the 4–5 month lag identified by Enfield andMayer [1997] for the Caribbean basin. The correlation of thesephenomena in the Caribbean and the Gulf of Mexico with
Figure 7. Seasonal anomalies in pigment concentration in areas I, II, and III relative to the annual meanvalue (1978–1986).
Figure 8. Twelve month moving average of pigment concentration in areas I, II, III (1978–1986). The 12month moving average filter removes the seasonal pattern of Figure 7. For each area the curves are annotatedwith the occurrence of hurricanes, cold fronts, and extratropical low-pressure systems.
MELO GONZALEZ ET AL.: INTRA-AMERICAS SEA PHYTOPLANKTON AND EL NINO14,038

phenomena in the Pacific is probably due primarily to theconnection effected by variations in the Trade Winds and inthe southern migration of the jet stream. The changes in theaverage speed of the wind affect the temperatures in the mixedlayer [Enfield and Mayer, 1997].
3.8. ENSO Event
The tropical Pacific Ocean has been subdivided, accordingto the SST anomalies associated with ENSO events, as Nino1–2 (for anomalies contained within 08–108S, 808–908W), Nino3 (58N–58S, 908–1508W), Nino 4 (58N–58S, 1608–1508W), andNino 3–4 (58N–58S, 1208–1708W). The Southern Oscillation isdefined by the pressure difference between Darwin (12.48S,1398W) in northern Australia and Tahiti (17.58S, 149.68W) inthe South Pacific [Trenberth, 1984]. In general, an ENSO eventimplies the simultaneous occurrence of the two phenomena: ElNino, of oceanic character, and the Southern Oscillation, ofatmospheric character [Chen, 1990].
Much has been written on the relationship between ENSOand precipitation anomalies in various regions of the globe.Clearly, climatic impact is not limited to the equatorial area ofthe Pacific [see, e.g., Yazunari, 1987; Rassmuson and Carpenter,
1982; Hastenrath and Wolter, 1992]. As for the Intra-AmericasSea, Hanson and Maul [1991] demonstrated that positiveanomalies in precipitation over Florida and El Nino are linked.According to Hanson and Maul [1991], 30% of the interannualvariance in precipitation occurs at frequencies of 5–6 years,similar to the frequency of recurrence of ENSO. Ropelewskiand Halpert [1987] point out that for the northwestern Carib-bean Sea and the Gulf of Mexico, positive anomalies in pre-cipitation extend from October of the ENSO year until Marchof the following year. In the peculiar case of the 1982–1983ENSO; Enfield [1989] and Canby [1984] reported unusuallyhigh precipitation south of the United States and in the north-ern Caribbean.
The 1982–1983 episode is reported to have started as earlyas May 1982 [Cardenas and Naranjo Dıaz, 2000b], but Silva[1988] suggest that it started in November 1982. Wyrtki [1985]suggests that the appearance of positive anomalies in sea level
Figure 9. Number of cold fronts and hurricanes in area II (central Gulf of Mexico) and pigment concen-tration at station 10 (north Campeche Bank, Gulf of Mexico) from 1978 to 1986.
Figure 10. Sea surface temperature (SST) anomaly and SSTanomaly moving average (seasonality removed) in the grid ofCuba (1979–1986).
Table 5. Incidence of Cold Front Systems in the StudiedAreas During Winters 1979–1986
CubaAreaI-a
AreaI-b
AreaI-c
AreaII
AreaIII
AreaIV
1979–1980 20 20 35 33 36 12 31980–1981 48 29 48 44 48 11 61981–1982 16 15 36 36 36 7 21982–1983 43 30 43 42 43 21 31983–1984 25 25 36 34 36 15 51984–1985 20 16 20 20 20 13 61985–1986 18 18 18 18 18 11 3
Maxima were observed in 1980–1981 and in 1982–1983.
14,039MELO GONZALEZ ET AL.: INTRA-AMERICAS SEA PHYTOPLANKTON AND EL NINO

around 5–10 cm in the western Pacific between January andMarch of 1982 mark the initiation. He also reports drasticanomalies in sea level (of up to 117 cm) in the western Pacificin July 1982. This period coincides with the point at whichpigments start rising in the western Caribbean Sea and theGulf of Mexico (Figure 8).
To examine the relationship between variations in the con-centration of pigments in our study area and ENSO, we usedan empirical index (INDI) [Cardenas and Naranjo Dıaz, 2000b]to quantify the correlation between the monthly SST anoma-lies (derived from the National Center of Environmental Pre-dictions data) in the Nino 1–2, Nino 3, Nino 4, and Nino 3–4areas (ANIN12, ANIN3, ANIN4, and ANIN34, respectively),SST anomalies in the North Atlantic (58–208N, 308–608W)(ANNATL), in the South Atlantic (08–208S, 108E–308W)(ANSATL), and in the tropical belt (108S–108N, 08–3608)
Figure 11. Phase lags in the correlation index between (a) the monthly anomaly of pigment concentrationfor areas in the Caribbean Sea and the Gulf of Mexico, the empirical index (INDI) of ENSO occurrence, and(b) the monthly anomaly of SST in El Nino 3 region (ANIN3) in the Pacific Ocean.
Table 6. Correlation Coefficients Between MonthlyPigment Anomalies (PZIJ) in Areas of the Caribbean andthe Gulf of Mexico, the Empirical Index (INDI) ofOccurrence of ENSO, and the SST Anomalies (ATSM) inRegions of the Pacific and the Atlantic
PZ I PZ II PZ III PZ IV
INDI 0.3939a 0.5185a 0.5886a 0.4893a,b
ANIN12 0.3072c 0.3328c 0.4627a 0.3515c
ANIN3 0.4589a,b 0.5250a,b 0.6731a 0.4706a
ANIN4 0.2814c 0.3700a 0.6110a 0.3799c
ANIN34 0.3974a 0.5066a 0.6985a,b 0.4672a
ANNATL 0.1393 0.2359 0.1140 0.0992ANSATL 20.2143 20.2006 20.2866c 20.0781ANTROP 0.4144a 0.4724a 0.6307a 0.4795a
aStatistical significance at a 5 0.001.bHighest correlation.cStatistical significance at a 5 0.01.
MELO GONZALEZ ET AL.: INTRA-AMERICAS SEA PHYTOPLANKTON AND EL NINO14,040

(ANTROP) with the monthly anomalies of pigments (PZIJ)for areas obtained from the CZCS images (Table 6).
INDI 5 2M(AMTSM)M(SOI) M(SOI) , 0
INDI 5 M(AMTSM)M(SOI) M(SOI) . 0,
where AMTSM is the monthly SST anomaly of an area, SOI isthe Southern Oscillation Index, and M is the moving average ofthe last 3 months of each index of occurrence of ENSO.
PZIJ 5 ~PIJ 2 PclIJ!/PclIJ,
where PZIJ is the anomaly of pigments in area I for the monthJ; PIJ is the concentration of pigments in area I in month J;and PclIJ is the climatological average of the concentration ofpigments for area I for every month J between 1978 and 1986.
A significant correlation is observed between pigment in ourarea of study and the SST anomalies in ANIN3 and ANIN34,in ANTROP, and with INDI. Areas I and II are better corre-lated with ANIN3, area III is better correlated with ANIN34,and area IV is better correlated with INDI (Table 6). Thesecorrelations suggest that a relationship exists between ENSOand the concentration of pigments in the western CaribbeanSea and the Gulf of Mexico.
Given the strong relationship between these phenomena andthe desire to forecast effects in our region, we computed timelag correlation functions between the monthly PZ by areas inthe Caribbean and the Gulf of Mexico, the INDI and SOI, andthe AMTSM. Lags of up to 12 months were examined. InFigure 11, the INDI and ANIN3 functions are shown for thePacific.
We found maximum correlation for “0 month lag” betweenthe monthly anomaly of surface pigment concentration forareas in the Caribbean Sea and the Gulf of Mexico and ENSOevents and with the monthly anomaly of SST in ANIN3 in thePacific Ocean. ENSO anomalies may precede the pigmentanomalies in the IAS by at least 3 months (Figure 11).
The pigment concentration anomaly in 1980–1981 seems tobe primarily related to an extended stormy winter season.However, in 1980–1981 we also observed an intensified cycloneseason that included Hurricane Allen (one of the most intensein the century), and this may have initiated the positive pig-ment anomaly. The pigment anomaly of 1982–1983 is relatedto an ENSO of great intensity. Over this period, cold frontsreached the region with almost twice the frequency of previousyears, and more low-pressure systems formed in the Gulf ofMexico and traveled farther to the south than normal, causinghigh winds in our study areas.
Figure 9 shows the relationship between the time variationof pigment concentration at station 10 in the Gulf of Mexicoand the occurrence of intense meteorological phenomena(tropical hurricanes and cold frontal systems). We also com-pared the pigment series to wind speed at National Data BuoyCenter buoy station 42003 in the Gulf of Mexico (Figure 12).The relationship between the wind and pigment concentrationis clear. Hurricanes and cold frontal systems in the regionstimulate brief but intense winds, waves, and rain and there-fore increase the vertical mixing of the photic layer and fertilizeit. The 1982–1983 ENSO event significantly decreased the pri-mary productivity in the oriental Pacific. According to Chavezand Barber [1985] the losses in biomass in the 300 days that theevent lasted were of around a gigaton. The consequences forthe northwestern Caribbean and the Gulf of Mexico were, incontrast, an increase in the pigment concentration (phyto-plankton biomass) of the upper layers.
4. ConclusionsCZCS images confirm the seasonality in phytoplankton con-
centration in the northwestern Caribbean Sea and the Gulf ofMexico, with maxima during winter and minima during sum-mer. The higher concentration of pigments in winter is related
Figure 12. Pigment concentration at station 10 (north Campeche Bank, Gulf of Mexico) and wind speed atNational Oceanic and Atmospheric Administration buoy 42003 (25.948N, 85.918W) in the eastern Gulf ofMexico.
14,041MELO GONZALEZ ET AL.: INTRA-AMERICAS SEA PHYTOPLANKTON AND EL NINO

to the occurrence of meteorological frontal systems that in-crease vertical turbulence and to thermal convective overturn.
Four areas were identified by similarity in temporal variabil-ity. Area I includes waters southwest of Cuba, Yucatan Chan-nel, and Florida Strait; area II includes the central region ofthe Gulf of Mexico; area III covers waters off eastern Cuba,Windward Passage, and the Sargasso Sea; area IV includes thecentral Caribbean to the south of Jamaica and Hispaniola(Figure 1).
The spatial and temporal variability of pigment concentra-tion in the Gulf of Mexico is larger than in the western Carib-bean, increasing from east to west and from south to north.This pattern is due to the difference in thermal stratificationacross the region, which limits vertical mixing of nutrients, theintrusion of nutrient-poor waters from the western Caribbeaninto the Gulf of Mexico, the more intense and frequent occur-rence of cold fronts and extratropical low-pressure systems inthe Gulf of Mexico, which increase vertical mixing, and thenutrient contribution from the Mississippi River (a minorcause).
Two remarkable maxima in the concentration of pigments inthe western Caribbean Sea and the Gulf of Mexico occurred in1980–1981 and in 1982–1983. A relationship exists between thetime variation of these maxima and the occurrence of intensemeteorological phenomena (hurricanes, frontal systems, andextratropical low-pressure systems). These phenomena in theregion stimulate an increase in the wind speed, waves, and rainand thereby increase the vertical mixing of the photic layer andfertilize it. The first maximum, 1980–1981, was affected by anintense hurricane season (including Hurricane Allen, one ofthe most intense in the century) and a very active winter sea-son. The second maximum is related to an ENSO of greatintensity. In this period, cold fronts reached the region withalmost twice the frequency of the previous year, and morelow-pressure systems formed in the Gulf of Mexico. Thesepatterns are indicative of a connection between the ENSO andthe concentration of surface pigments in the western Carib-bean Sea and the Gulf of Mexico.
Acknowledgments. We thank to Isidro Salas Garcıa from the Me-teorology Institute of Cuba and Benigno Hernandez de la Torre fortheir assistance in obtaining and processing data. Support for this studywas derived in part from the Cuban National Global Change StudiesProgram and NASA grant NAGW 3483 to F. E. Muller-Karger, Uni-versity of South Florida.
ReferencesAcademy of Sciences of Cuba, New National Atlas of Cuba, Havana,
Cuba, XXIV.3.4 pp., 1989.Barale, V., C. R. McClean, and P. Malanotte-Rizzol, Space and time
variability of the surface color field in the northern Adriatic Sea, J.Geophys Res., 91, 12,957–12,974, 1986.
Bottomley, M., C. K. Folland, J. Hsiung, R. E. Newell, and D. E.Parker, Global Ocean Surface Temperature Atlas, 20 pp. and 313plates, Dept. of Earth, Atmos., and Planet. Sci., Mass. Inst. of Tech-nol., Cambridge, 1990.
Canby, T. Y., Ei Nino’s ill wind, Natl. Geogr., 165, 144–183, 1984.Cardenas Perez, P. A., and L. R. Naranjo Dıaz, Impacto y modulacion
de efectos del ENOS sobre elementos climaticos en Cuba, Anal. Fıs.Esp., in press, 2000a.
Cardenas Perez, P. A., and L. R. Naranjo Dıaz, Un ındice empırico deoccurrencia de ENOS: Papel en la predictabilidad de elementosclimaticos, Atmosfera, in press, 2000b.
Chavez, F. P., and R. T. Barber, Plankton production during El Nino,in International Conference on the TOGA Scientific Program, WCRPPubl. Ser., vol. 4, pp. 23–32, World Meteorol. Org., Geneva, 1985.
Chen, G., A study of interrelation between El Nino, precipitation andastronomical motion, WMO Tech. Doc. 363, pp. 15–18, World Me-teorol. Org., Geneva, 1990.
Corredor, J. E., Aspects of phytoplankton dynamics in the CaribbeanSea and adjacent regions, in Symposium on Progress in Marine Re-search in the Caribbean and Adjacent Regions, Fish Rep. 200, pp.101–114, Food and Agric. Org., Rome, 1977.
Deuser, W. G., F. E. Muller-Karger, R. H. Evans, O. B. Brown, W. E.Esaias, and G. C. Feldman, Surface-ocean color and deep-oceancarbon flux: How close a connection? Deep Sea Res., Part I, 37,1331–1343, 1990.
Enfield, D. B., El Nino, past and present, Rev. Geophys., 27, 159–187,1989.
Enfield, D. B., and M. A. Mayer, Tropical Atlantic sea surface tem-perature variability and its relation to El Nino/Southern Oscillation,J. Geophys. Res., 102, 929–946, 1997.
Evans, R. H., and H. R. Gordon, CZCS “system calibration”: A ret-rospective examination, J. Geophys. Res., 99, 7293–7307, 1994.
Fernandez, L., and A. Chirinos, Atlas Oceanografico del ArchipielagoSabana-Camaguey, Inst. Cubano de Hidrog., Havana, Cuba, 1993.
Fernandez, M., R. M. Hidalgo, D. Lopez, I. Garcıa, and I. Penie,Caracterizacion hidroquımica de la Fosa del Jagua y la zone eco-nomica exclusive al Sur de Cuba, in Archivo Cientıfico, Inst. deOceanol., Acad. de Cienc. de Cuba, Havana, ACC, 1990.
Gordon, A. L., Circulation of the Caribbean Sea, J. Geophys. Res., 72,6207–6223, 1967.
Gordon, H. R., and M. Wang, Retrieval of water-leaving radiance andaerosol optical thickness over the oceans with SeaWiFS: A prelim-inary algorithm, Appl. Opt., 33, 443–452, 1994.
Gordon, H. R., D. K. Clark, J. W. Brown, O. B. Brown, and R. H.Evans, Satellite measurement of the phytoplankton pigment con-centration in the surface waters of a warm core Gulf Stream ring, J.Mar. Res., 40, 491–502, 1982.
Gordon, H. R., D. K. Clark, J. W. Brown, O. B. Brown, R. H. Evans,and W. W. Broenkow, Phytoplankton pigment concentrations in theMiddle Atlantic Bight: Comparison of ship determinations andCZCS estimates, Appl. Opt., 22, 20–35, 1983a.
Gordon, H. R., J. W. Brown, O. B. Brown, R. H. Evans, and D. K.Clark, Nimbus 7 CZCS: Reduction of its radiometric sensitivity withtime, Appl. Opt., 22, 3929–3931, 1983b.
Gordon, H. R., O. B. Brown, R. H. Evans, J. W. Brown, R. C. Smith,K. S. Baker, and D. K. Clark, A semi-analytic radiance model ofocean color, J. Geophys. Res., 93, 10,909–10,924, 1988.
Gray, W. M., and J. D. Sheaffer, El Nino and QBO influences ontropical cyclone activity, in Telecommunication Linking WorldwideClimate Anomalies, edited by R. W. Katz and N. Nicholls, pp. 257–284, Cambridge Univ., Press, New York, 1991.
Hanson, K., and G. A. Maul, Florida precipitation and the Pacific ElNino 1895–1989. Fla. Sci., 54, 160–168, 1991.
Hastenrath, S., and K. Wolter, Large scale patterns and long-termtrends of circulation variability associated with Sahel rainfall anom-alies, J. Meteorol. Soc. Jpn., 70, 1045–1056, 1992.
Hochman, T. H., F. E. Muller-Karger, and J. Walsh, Interpretation ofthe Coastal Zone Color Scanner signature of the Orinoco RiverPlume, J. Geophys. Res., 99, 7443–7455, 1994.
Jeffrey, S. W., and G. F. Humphrey, New spectrophotometric equa-tions for determining chlorophyll a, b, and c in higher plants, algaeand natural phytoplankton, Biochem. Physiol., 167, 191–194, 1975.
Jromov, N. S., Investigations of the plankton in the Gulf of Mexico andthe Caribbean Sea, in Soviet-Cuban Fishing Investigations (in Rus-sian), vol. 1, pp. 39–57, Pish. Prom., Moscow, 1967.
Koblentz-Mishke, O. I., and V. I. Vedernikov, Primary production,Oceanologia, in Biology of the Ocean (in Russian), vol. 2, pp. 183–209, Nauka, Moscow, 1977a.
Koblentz-Mishke, O. I., and V. I. Vedernikov, Handbook of Methods inAquatic Microbiology (in Russian), Publish, Moscow, 1977b.
Margalef, R., El Ecosistema pelagico del Mar Caribe, Memo. 29, pp.5–36, Fundacion La Salle,” Caracas, Venezuela, 1969.
Maul, G. A., and F. M. Vukovich, The relationship between variationsin the Gulf of Mexico loop current and Strait of Florida volumetransport, J. Phys. Oceanogr., 23, 785–796, 1993.
McClain, C. R., et al., SeaWiFS algorithms, part 1, NASA Tech. Memo.,104566, 38 pp., 1995.
Melo, N., R. Perez, and S. Cerdeira, Variacion espacio-temporal de lospigmentos del fitoplancton en zones del Gran Caribe, a partir deimagenes de satelite Nimbus 7 (CZCS), Avicennia, 3, 103–116, 1995.
MELO GONZALEZ ET AL.: INTRA-AMERICAS SEA PHYTOPLANKTON AND EL NINO14,042

Merino, M., El afloramiento de Yucatan: Estructura y fertilizacion,Ph.D. thesis, Univ. Nacl. Autonoma de Mexico, Mexico City, 1992.
Morel, A., and L. Prieur, Analysis of variations in ocean color, Limnol.Oceanogr., 22, 709–722, 1977.
Muller-Karger, F. E., and R. Aparicio Castro, Mesoscale processesaffecting phytoplankton abundance in the southern Caribbean Sea,Cont. Shelf Res., 14, 199–221, 1994.
Muller-Karger, F. E., J. J. Walsh, R. H. Evans, and M. B. Meyers, Onthe seasonal phytoplankton concentration and sea surface temper-ature cycles of the Gulf of Mexico as determined by satellites, J.Geophys. Res., 96, 12,645–12,665, 1991.
Muller-Karger, F. E., et al., Pigment distribution in the Caribbean Sea:Observations from Space, Prog. Oceanogr., 23, 23–64, 1989.
Oort, A. H., and E. M. Rasmusson, Atmospheric circulation statistics,NOAA Prof. Pap. 5, 323 pp., U.S. Govt. Print. Off., Washington,D. C., 1971.
O’Reilly, J. E., S. Maritorena, B. G. Mitchell, D. A. Siegel, K. L.Carder, S. A. Garver, M. Kahru, and C. McClain, Ocean colorchlorophyll algorithms for SeaWiFS, J. Geophys. Res., 103, 24,937–24,953, 1998.
Ortiz, R., Organismos ciclonicos extemporaneos, in Ser. Meteorol., vol.5, pp. 10–20, Inst. de Meteorol., Acad. de Cienc. de Cuba, Havana,1975.
Perez, R., C. Gil, and S. Loza, Variabilidad espacio-temporal delfitoplancton y sus pigmentos en aguas oceanicas al Sur de Cuba, inArchivo Cientıfico, Inst. de Oceanol., Acad. de Cienc. de Cuba,Havana, 1990.
Perez, R., et al., Reporte de un frente hidrologico al NE de la Penın-sula de Yucatan. Manifestaciones fısicas, quımicas e hidrobiologicas,Bol. Soc. Meteorol. Cuba, 2, pap. ISSN-1025-921X, 1996.
Perez, R., F. E. Muller-Karger, I. Victoria, and N. Melo, Cuban,Mexican, U.S. Researchers probing mysteries of Yucatan currents,Eos Trans. AGU, 80, 153, 158–159, 1999.
Rassmuson, E. M., and I. H. Carpenter, Variations in tropical seasurface temperature and surface wind fields associated with theSouthern Oscillation/El Nino, Mon. Weather Rev., 110, 354–384,1982.
Reynolds, R. W., A real-time global sea surface temperature analysis,J. Clim., 1, 76–86, 1988.
Reynolds, R. W., and D. C. Marsico, An improved real-time seasurface temperature analysis, J. Clim., 6, 114–119, 1993.
Rodrıguez, M., C. Gonzalez, and J. Valdes, Cronologıa de los frentesfrıos que hen afectado a Cuba desde la temporada de 1916–1917haste la temporada de 1982–1983, reporte de investigacion, 15 pp.,Inst. de Meteorol., Acad. de Cienc. de Cuba, Havana, 1984.
Rodrıguez, E., I. Guerra, and J. C. Cardenas, Cronologıa y analisissinoptico de las penetraciones del mar en las provincial habaneras
1970–1986, paper presented at 1er Congreso Internacional sobredesastres naturales, Acad. de Cienc. de Cuba, Havana, 1986.
Ropelewski, C. F., and M. S. Halpert, Global and regional scale pre-cipitation patterns associated with the El Nino Southern Oscillation,Mon. Weather Rev., 115, 1606–1626, 1987.
Silva, N., Condiciones oceanograficas pre-Nino 1982/83, Cienc. Tec.Mar, 12, 3–31, 1988.
Sorokin, Y. I., Methods for phytoplankton concentration determina-tion (in Russian), Guidrobiol. Zh., 15, 71–76, 1979.
Thomas, W. H., and G. Simmons, Phytoplankton production in theMississippi delta, in Recent Sediments, Northwest Gulf of Mexico, pp.103–116, Am. Assoc. of Pet. Geol., Tulsa, Okla., 1960.
Trenberth, K. T., Signal versus noise in the Southern Oscillation, Mon.Weather Rev., 112, 326–332, 1984.
Tunegolobes, V. P., Transformation of the oceanic thermal field in thepath of a tropical hurricane: The example of the hurricane “Tess”1975 (in Russian), Meteorol. Guidrologuia, 2, 60–66, 1976.
Victoria, I., A. Cabal, R. Garcıa, M. Hernandez, and H. Puentes,Caracterısticas oceanograficas de la Fosa de Jagua y de la zoneeconomica exclusive al Sur de Cuba, in Archivo Cientıfico, Inst.Oceanol., Acad. de Cienc. de Cuba, Havana, 1990.
Vinogradov, M. E., and E. A. Shushkina, Operation of the PelagicPlankton Communities of the Ocean, in Russian, 240 pp., Nauka,Moscow, 1987.
World Meteorological Organization (WMO), WMO statement on thestatus of the global climate in 1995, WMO 838, 11 pp., Geneva, 1996.
Wust, G., Stratification and circulation in the Antillean Caribbeanbasins, part 1, Spreading and mixing of the water types, in Oceano-graphic Atlas, Columbia Univ. Press, New York, 1964.
Wyrtki, K., Sea level fluctuations in the Pacific during the 1982/83 ElNino, Geophys. Res. Lett., 12, 125–128, 1985.
Yazunari, T., Global structure of the El Nino/Southern Oscillation,part II, Time evolution, J. Meteorol. Soc. Jpn., 65, 91–102, 1987.
P. Cardenas Perez and I. Mitrani Arenal, INSMET, CITMA, Apdo.17032. Casablanca, Regla, Habana 17, Ciudad de La Habana, Cuba.C.P. 12100.
S. Cerdeira Estrada, N. Melo Gonzalez, R. Perez de los Reyes, andI. Victoria del Rio, IDO, CITMA, Ave. 1 ra. No. 18406 entre 184 y 186.Flores, Playa, Habana 21, La Habana, Cuba. C.P. 12100.
F. Muller-Karger, Department of Marine Science, University ofSouth Florida, 140 Seventh Avenue, St. Petersburg, FL 33701.([email protected])
(Received July 8, 1998; revised November 24, 1999;accepted January 19, 2000.)
14,043MELO GONZALEZ ET AL.: INTRA-AMERICAS SEA PHYTOPLANKTON AND EL NINO

14,044