effluent particle removal by microirrigation system filters
TRANSCRIPT
Introduction
Clogging is one of the main problems when usingeffluents in microirrigation systems; a small numberof plugged emitters can affect distribution uniformityand reduce crop yields. Filtration to retain particlesand reduce emitter clogging is therefore vital (Oron etal., 1979; McDonald et al., 1984).
The type of particles in wastewater depends on thetreatment process (Adin and Elimelech, 1989; Adin et al.,
1989; Tiehm et al., 1999). The properties that influencewhether a particle is retained by a filter include size,shape, surface load, settling velocity and (probably)porosity. Since these properties vary from one type ofparticle to another, the particle size distribution, thevariety of shapes and the density intervals must alsobe considered (Lawler, 1980, 1997). By determining theparticle volume distribution, the volumes of each ofthe main particle sizes that are captured by a filter canbe established (Adin, 1999).
Particle size and volume distribution curves havedifferent shapes. While the particle size curve fallswith particle diameter, particle volume produces a bell-shape since it is a third order power with regard to
Spanish Journal of Agricultural Research (2005) 3(2), 182-191
Effluent particle removal by microirrigation system filters
J. Puig-Bargués1*, G. Arbat1, J. Barragán2 and F. Ramírez de Cartagena1
1 Department of Chemical and Agricultural Engineering and Technology. University of Girona. EPS. Campus Montilivi, s/n. 17071 Girona. Spain
2 Department of Agricultural and Forestry Engineering. University of Lleida. ETSEA. Avda. Rovira Roure, 191. 25198 Lleida. Spain
Abstract
The aim of this work was to determine whether the filters used in microirrigation systems can remove potentiallyemitter-clogging particles. The particle size and volume distributions of different effluents and their filtrates wereestablished, and the efficiency of the removal of these particles and total suspended solids by screen, disc and sandfilters determined. In most of the effluents and filtrates, the number of particles with a diameter > 20 µm was minimal.By analysing the particle volume distribution it was found that particles larger than the disc and screen filter poresappeared in the filtrates. However, the sand filter was able to retain particles larger than the pore size. The filtrationefficiency depended more on the type of effluent than on the filter. It was also found that the particle size distributionfollowed a potential law. Analysis of the β exponents showed that the filters did not significantly modify the particlesize distribution of the effluents.
Additional key words: clogging, drip irrigation, filtration, wastewater.
Resumen
Eliminación de partículas de efluentes en filtros de sistemas de riego localizado
La distribución del número y del volumen de partículas, y la eficiencia de eliminación de las partículas y los sóli-dos en suspensión de diferentes efluentes y sus filtrados, fueron analizadas para estudiar si los filtros más usuales enlos sistemas de riego localizado eliminan las partículas que pueden obturar los goteros. En la mayoría de los efluen-tes y filtrados fue mínimo el número de partículas con diámetros superiores a 20 µm. Sin embargo, al analizar la dis-tribución del volumen de las partículas, en los filtrados aparecieron partículas de dimensiones superiores a la luz delos filtros de anillas y malla, siendo el filtro de arena el que retuvo las partículas de mayor diámetro. La eficiencia delos filtros para retener partículas se debió más al tipo de efluente que al filtro. Se verificó también que la distribucióndel número de partículas sigue una relación de tipo potencial. Analizando el exponente β de la ley potencial, se hallóque los filtros no modificaron significativamente la distribución del número de partículas de los efluentes.
Palabras clave adicionales: agua residual, filtración, obturación, riego localizado.
* Corresponding author: [email protected]: 09-07-04; Accepted: 15-02-05.
All authors are members of SEA.
particle diameter. Thus, the total volume of the particlesof smaller size is less than that of the larger parti-cles, even though the total number of larger sizedparticles is smaller (Adin et al., 1989).
According to Lawler et al. (1980), particle sizedistributions in aqueous suspensions can be expressedas a potential law function:
[1]
where N is the number of particles per volume unit, Dp
is the particle diameter, and α and β are empiricalconstants. The empirical constant α is a coeff icientrelated to the total concentration of particulate solidsin the system. Exponent β results from the interactionbetween different physical processes such as coagu-lation and sedimentation (Lawler et al., 1980). It alsoprovides an estimate of particle diameter. If the valueof β is low, then large diameter particles predominatein the effluent, if it is high, then small particles are inthe majority (Lawler et al., 1980; Adin and Elimelech,1989). The potential law of equation [1] can be appliedwhen the particles have a diameter > 1 µm (Adin, 1999)and a unimodal distribution (Adin and Elimelech, 1989).
Determining the particle size distribution helps inthe assessment of the efficiency of filtration systemssince it can detect problems that other methods cannot(Hatukai et al., 1997; Kobler and Boller, 1997). However,Boller et al. (1997) indicate that particle size distri-bution analysis is not representative of particletransport due to the mixing and formation of prefe-rential channels, although they accept its validity forassessing the differences between the retention of smalland large particles.
The effect of f iltration on effluent particle distri-bution has not been widely studied with the usualfilters used in drip irrigation systems. Some studieswith screen and sand f ilters do, however, stand out(Adin and Alon, 1986; Adin, 1987; Adin and Elimelech,1989; Tajrishy et al., 1994). The main conclusions ofthese studies are that sand filters are more efficientthan screen filters at removing effluent particles thatcommonly plug emitters (10-80 µm in diameter),although the retention of solid particles never surpassed20%, even in the best cases (Adin et al., 1989). One ofthe main problems is that particles retained in the filterare gradually released, mainly due to the pressureincrease during the filtration cycle. This means thataggregates of up to 20 µm could form in the filtrate(Adin, 1999).
The aims of the present work were to characterizethe particle size and volume distributions of differenteffluents used in microirrigation, to determine the effectof different f ilters on the variation of their particledistributions, and to assess the quality of filtration onthe basis of particle retention.
Material and Methods
Filtration experiments
The experimental material included five differenteffluents. Effluent 1, which received only preliminarytreatment, was wastewater from a meat industry. Effluent2 was the effluent produced after wastewater secondarytreatment involving a sludge process at a wastewatertreatment plant (WWTP) in Girona. Effluent 3 was theprevious effluent filtered through a sand filter formicroirrigation systems; its effective grain size (the meshsize that retains 90% of the sand mass) was 0.65 mm andits uniformity coefficient (the ratio between the meshsizes that retain 40% and 90% of the sand) was 1.3.Effluent 4 was the effluent produced after wastewatersecondary treatment involving a sludge process at Castell-Platja d’Aro WWTP. Finally, Effluent 5 was that producedafter tertiary treatment at the same plant. This wasobtained by filtering the secondary effluent through sand(effective grain size of 0.45 mm, uniformity coefficient1.6) and disinfecting the product using ultraviolet lightand chlorination treatments. Table 1 shows the meansand standard deviations of some of the physical andchemical variables of the different effluents used.
dN
dDp
= α ⋅ Dp− β
Effluent particle filtering: filter efficiency 183
Table 1. Means and standard deviations of some physicaland chemical parameters of the different effluents at the filter inlets
EffluentTSS Turbidity Particles
(mg l–1) (NTU) ml–1
1 176 ± 24.8 200 ± 29.0 64,048 ± 41,4792 24.4 ± 14.7 11.3 ± 3.21 50,470 ± 26,3203 8.61 ± 3.94 8.78 ± 6.05 52,900 ± 21,3004 10.6 ± 3.42 4.51 ± 1.92 61,909 ± 32,5165 4.93 ± 1.24 2.66 ± 1.30 37,372 ± 24,899
TSS: total suspended solids. NTU: nephelometric turbidityunits. Effluents: 1, meat industry effluent; 2, Girona WWTP(wastewater treatment plant) secondary effluent; 3, GironaWWTP secondary treatment effluent filtered with sand; 4, Cas-tell-Platja d’Aro WWTP secondary treatment effluent; 5, Cas-tell-Platja d’Aro WWTP tertiary effluent.
The three most common filter types used in micro-irrigation systems —screen, disc and sand— wererepresented in different tests. The f ilters used withEffluents 1 and 2 were: a) three nylon screen filters 50.8mm in diameter, with a total filtration surface of 946 cm2
and pore sizes of 98 µm (S98), 115 µm (S115) and 178µm (S178), b) three disc filters 50.8 mm in diameter witha filtration surface of 953 cm2 and pore sizes of 115 µm(D115), 130 µm (D130) and 200 µm (D200), and c) asand filter 508 mm in diameter with a filtration surfaceof 1,963 cm2, and filled with 175 kg of sand as a singlefiltration layer. The effective diameter and the uniformitycoefficient of the sand were 0.65 mm and 1.3 respec-tively. For Effluent 3, all the previous disc and screenfilters were used, except the sand filter. For effluent 4,an inclined 130 µm nylon screen filter (S130) (50.8 mmin diameter with a filtration surface of 640 cm2) and a130 µm disc filter (D130) (50.8 mm in diameter with afiltration surface of 953 cm2) were tested. For Effluent5, only a screen filter with the same characteristics asthat used with Effluent 4 (S130) was tested.
The aim of the experiments was to determine thehead loss across the filters and the filtrate volume atregular time intervals until the head loss reached avalue of 49 kPa. At this point the filters were cleaned.The screen and disc f ilters were cleaned manuallyusing water under pressure. A backwashing system wasused with the sand filter until the sand was clean. Table 2shows the means and standard deviations of the surfacefiltration velocities. The average pressure at the discand screen filter inlets was 124 kPa, 82 kPa, 61 kPa,225 kPa and 242 kPa when using Effluents 1, 2, 3, 4and 5 respectively. The sand f ilter operated under amean pressure of 163 kPa with Effluent 1, and 80 kPawith Effluent 2.
In each experiment, samples of effluents were takenat the filter entry and exit points at different times. ForEffluents 1, 4 and 5, seven samples were taken at the entry and exit points; ten samples were taken forEffluents 2 and 3.
Particle analysis
The particle size and volume distributions, and thenumber of particles at each sample point, were de-termined using a Galai Cis1 laser analyser (GalaiProduction Inc., Israel). The volume distributions wereobtained at the 95% conf idence level. The particlediameter determination intervals were 5-600 µm forEffluents 1, 2 and 3, and 2-300 µm for Effluents 4 and5. These intervals were f ixed for each effluent inpreliminary trials.
In the particle analyser, a 5 ml cuvette was used inmost cases to hold the effluent sample. A magneticstirrer in this cell provided continuous agitation to avoidsettling. Due to the high turbidity of Effluent 1, sampleswere diluted with distilled water in a proportion of1:6.5. The particle size distributions of the diluted andoriginal samples were very similar, probably becausethe dilution factor used was low. A continuous cuvettewas used with this effluent; the fluid therefore circulatedcontinuously to guarantee a constant and homogeneoussuspension over time.
Efficiency of particle and solid removal
Using the data on particle size distribution and totalsuspended solids (TSS) at the f ilter entry and exit
184 J. Puig-Bargués et al. / Span J Agric Res (2005) 3(2), 182-191
Table 2. Means and standard deviations for the surface filtration velocities of the different filters and effluents
FilterMean surface filtration velocity (l m–2 s–1)
Effluent 1 Effluent 2 Effluent 3 Effluent 4 Effluent 5
D115 11.53 ± 6.08 4.73 ± 2.43 1.40 ± 0.03 — —D130 7.75 ± 5.57 5.11 ± 3.02 1.34 ± 0.10 3.01 ± 0.14 —D200 7.23 ± 5.55 6.42 ± 0.22 1.29 ± 0.07 — —S98 16.17 ± 5.09 2.67 ± 0.96 0.96 ± 0.02 — —S115 11.23 ± 8.54 3.13 ± 3.00 0.91 ± 0.08 — —S130 — — — 4.46 ± 0.34 5.09 ± 0.08S178 6.76 ± 4.04 5.41 ± 2.38 0.92 ± 0.01 — —Sand 3.88 ± 2.47 2.88 ± 0.25 — — —
D115: 115 µm disc filter. D130: 130 µm disc filter. D200: 200 µm disc filter. S98: 98 µm screen filter. S115: 115 µm screen filter;S130: 130 µm screen filter. S178: 178 µm screen filter. Effluents defined in Table 1.
points, the eff iciency (E) of the different f ilters atremoving both was calculated by employing the equation:
[2]
where No and N are the values of the variables in theunfiltered and filtered effluents respectively.
Statistical analysis
The data obtained in the filtration experiments werefitted to equation [1] using the REG procedure of the SASstatistical package (SAS, 1999). This allowed the α andβ exponents of equation [1] to be determined for eacheffluent and filtrate. Duncan’s test was used to comparethe means of α and β as well as the particle and TSSremoval efficiencies. Significance was set at P < 0.05.
Results
Particle size distribution
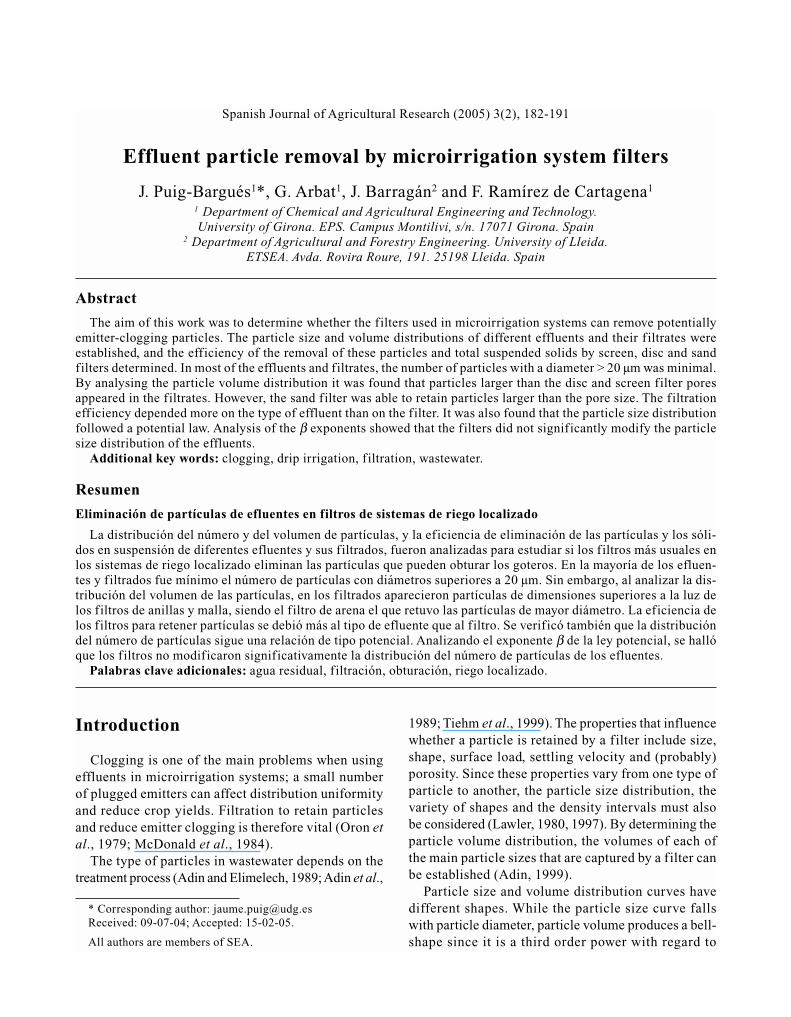
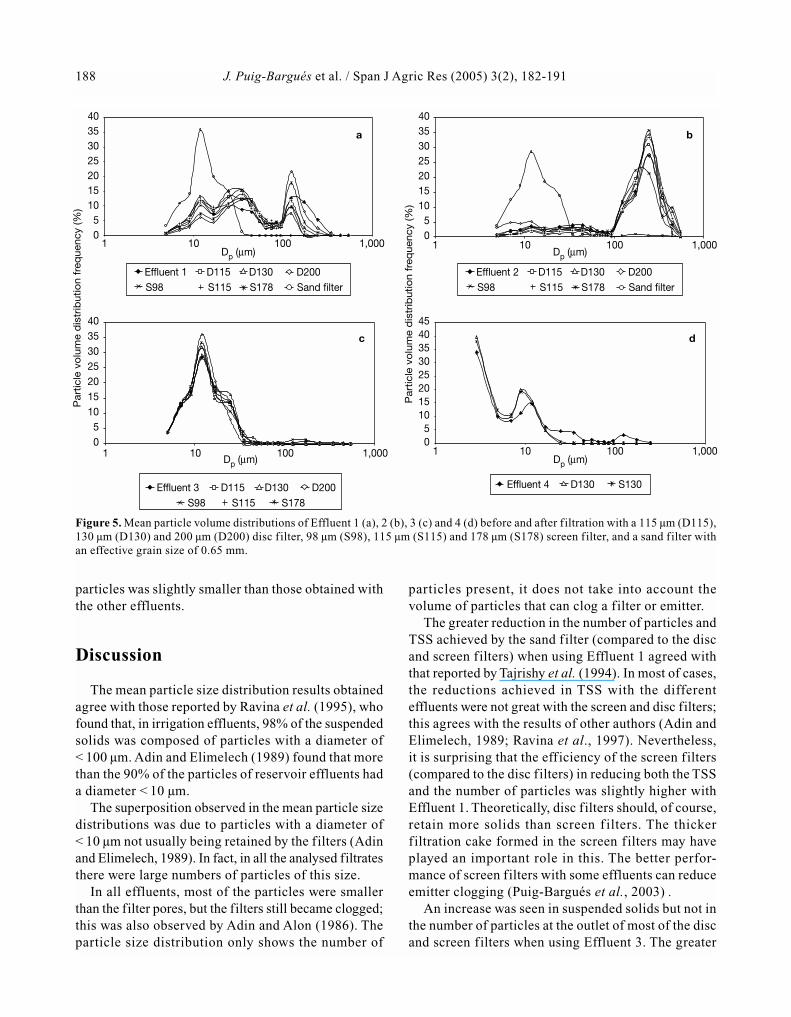
Figure 1 shows the mean particle size distribution ofEffluent 2 before and after filtration. It was similar to thatof the other effluents: unimodal and with small particlesclearly predominating over large particles. Particles witha diameter of < 14 µm made up about 86% of Effluent 1
particles, 94% of Effluent 2 and 3 particles, and 98% ofEffluent 4 and 5 particles. No important differences wereseen in terms of the particle size distribution of theeffluents either before or after filtering.
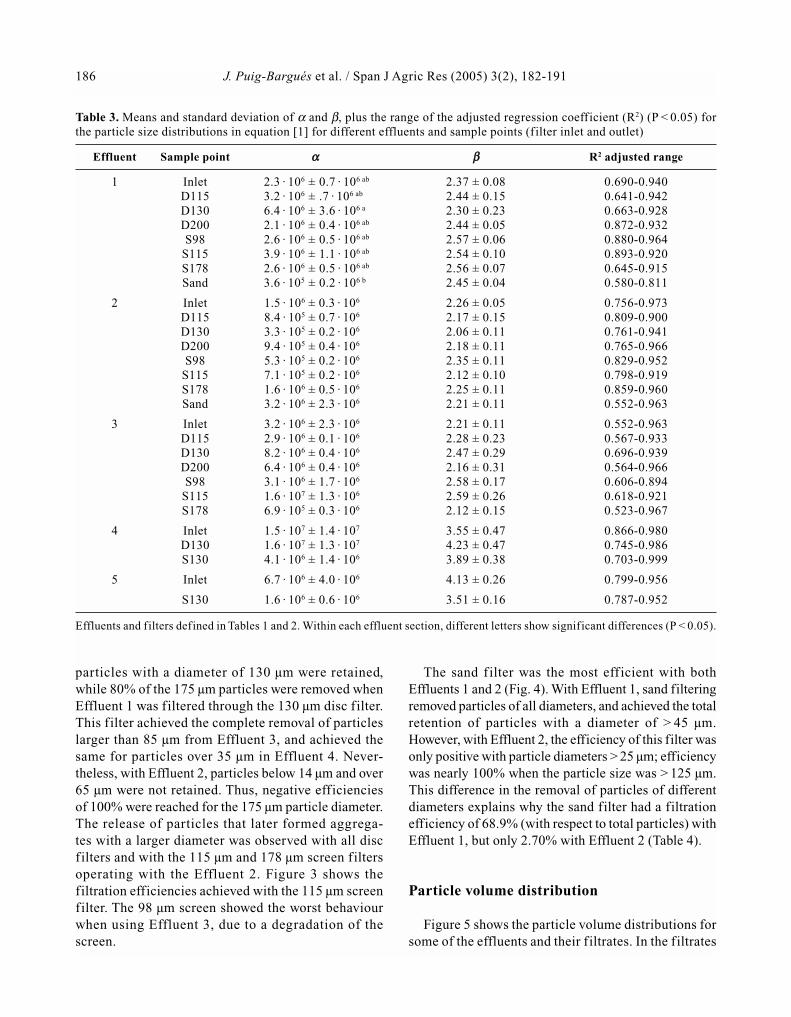
Table 3 shows the fit of the particle size distributionsfor the different effluents and filtrates to the potentiallaw of equation [1]. Despite the variability of theregression coeff icients, all f its were statisticallysignificant (P < 0.05). No significant differences wereseen in the α coefficients or β exponents of the effluentsand their filtrates (except that the α coefficient of thef iltrate produced by the 130 µm disc f ilter wassignificantly greater than that of the sand filter whenEffluent 1 was tested).
Particle and solid removal efficiencies of filters
Since the comparison of the mean particle sizedistributions allowed no testing of the ability of thefilters to retain particles, the total particle and TSSremoval efficiencies were determined using equation[2] (Table 4). Negative efficiencies indicate an increasein particle number and TSS at the filter outlet. The resultswere very variable probably due to the differences inthe composition of the effluents; indeed, the resultsobtained with same filter differed depending on thetest effluent. In some cases, the agreement betweenparticle and TSS removal efficiencies was low.
With Effluent 1 (the poorest quality effluent), onlythe sand filter achieved significant reductions in thenumber of particles and TSS. With Effluent 2, the TSSremoval efficiencies of the sand, disc and screen filterswere the same, although the particle removal efficiencyof the 115 µm disc filter and the 98 µm screen filterwas significantly higher than that achieved with thesand filter. When Effluents 3, 4 and 5 were used, thedisc and screen filters showed no significant differencesin terms of reducing the TSS or number of particles.However, the 115 µm disc filter achieved greater re-ductions in the number of particles than did the 130 or200 µm disc filters when testing with Effluent 3.
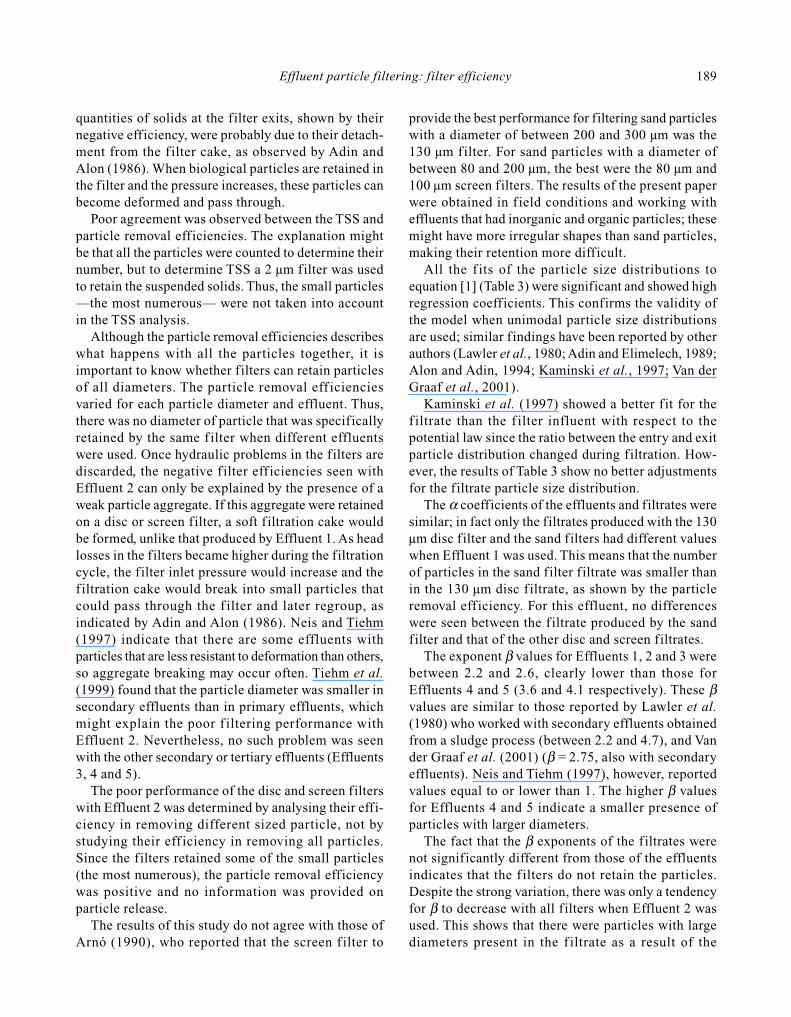
The average removal efficiencies for each particlediameter interval were also analysed. Figure 2 showsthe efficiency of the 130 µm disc filter in relation tothe different effluents. Negative efficiencies were seenfor some particle diameters in all the effluents tested;this means that the number of particles in the filtratewas higher than in the influent. Twenty percent of the
E =No − N
No
Effluent particle filtering: filter efficiency 185
Effluent 2 D115 D130 D200
S98 S115 S178 Sand
0
5
10
15
20
25
30
35
1 10 100 1,000Dp (µm)
Part
icle
siz
e d
istr
ibutio
nfr
eq
uency
(%
)
Figure 1. Mean particle size distributions of the secondary effluent from the Girona wastewater treatment plant (Effluent 2)before and after filtration with 115 µm (D115), 130 µm (D130)and 200 µm (D200) disc filters, 98 µm (S98), 115 µm (S115)and 178 µm (S178) screen filters, and a sand filter with a 0.65mm effective grain size.
particles with a diameter of 130 µm were retained,while 80% of the 175 µm particles were removed whenEffluent 1 was filtered through the 130 µm disc filter.This filter achieved the complete removal of particleslarger than 85 µm from Effluent 3, and achieved thesame for particles over 35 µm in Effluent 4. Never-theless, with Effluent 2, particles below 14 µm and over65 µm were not retained. Thus, negative efficienciesof 100% were reached for the 175 µm particle diameter.The release of particles that later formed aggrega-tes with a larger diameter was observed with all discfilters and with the 115 µm and 178 µm screen filtersoperating with the Effluent 2. Figure 3 shows thefiltration efficiencies achieved with the 115 µm screenfilter. The 98 µm screen showed the worst behaviourwhen using Effluent 3, due to a degradation of thescreen.
The sand f ilter was the most eff icient with bothEffluents 1 and 2 (Fig. 4). With Effluent 1, sand filteringremoved particles of all diameters, and achieved the totalretention of particles with a diameter of > 45 µm.However, with Effluent 2, the efficiency of this filter wasonly positive with particle diameters > 25 µm; efficiencywas nearly 100% when the particle size was > 125 µm.This difference in the removal of particles of differentdiameters explains why the sand filter had a filtrationefficiency of 68.9% (with respect to total particles) withEffluent 1, but only 2.70% with Effluent 2 (Table 4).
Particle volume distribution
Figure 5 shows the particle volume distributions forsome of the effluents and their filtrates. In the filtrates
186 J. Puig-Bargués et al. / Span J Agric Res (2005) 3(2), 182-191
Table 3. Means and standard deviation of α and β, plus the range of the adjusted regression coefficient (R2) (P < 0.05) forthe particle size distributions in equation [1] for different effluents and sample points (filter inlet and outlet)
Effluent Sample point αα ββ R2 adjusted range
1 Inlet 2.3 · 106 ± 0.7 · 106 ab 2.37 ± 0.08 0.690-0.940D115 3.2 · 106 ± .7 · 106 ab 2.44 ± 0.15 0.641-0.942D130 6.4 · 106 ± 3.6 · 106 a 2.30 ± 0.23 0.663-0.928D200 2.1 · 106 ± 0.4 · 106 ab 2.44 ± 0.05 0.872-0.932S98 2.6 · 106 ± 0.5 · 106 ab 2.57 ± 0.06 0.880-0.964
S115 3.9 · 106 ± 1.1 · 106 ab 2.54 ± 0.10 0.893-0.920S178 2.6 · 106 ± 0.5 · 106 ab 2.56 ± 0.07 0.645-0.915Sand 3.6 · 105 ± 0.2 · 106 b 2.45 ± 0.04 0.580-0.811
2 Inlet 1.5 · 106 ± 0.3 · 106 2.26 ± 0.05 0.756-0.973D115 8.4 · 105 ± 0.7 · 106 2.17 ± 0.15 0.809-0.900D130 3.3 · 105 ± 0.2 · 106 2.06 ± 0.11 0.761-0.941D200 9.4 · 105 ± 0.4 · 106 2.18 ± 0.11 0.765-0.966S98 5.3 · 105 ± 0.2 · 106 2.35 ± 0.11 0.829-0.952
S115 7.1 · 105 ± 0.2 · 106 2.12 ± 0.10 0.798-0.919S178 1.6 · 106 ± 0.5 · 106 2.25 ± 0.11 0.859-0.960Sand 3.2 · 106 ± 2.3 · 106 2.21 ± 0.11 0.552-0.963
3 Inlet 3.2 · 106 ± 2.3 · 106 2.21 ± 0.11 0.552-0.963D115 2.9 · 106 ± 0.1 · 106 2.28 ± 0.23 0.567-0.933D130 8.2 · 106 ± 0.4 · 106 2.47 ± 0.29 0.696-0.939D200 6.4 · 106 ± 0.4 · 106 2.16 ± 0.31 0.564-0.966S98 3.1 · 106 ± 1.7 · 106 2.58 ± 0.17 0.606-0.894
S115 1.6 · 107 ± 1.3 · 106 2.59 ± 0.26 0.618-0.921S178 6.9 · 105 ± 0.3 · 106 2.12 ± 0.15 0.523-0.967
4 Inlet 1.5 · 107 ± 1.4 · 107 3.55 ± 0.47 0.866-0.980D130 1.6 · 107 ± 1.3 · 107 4.23 ± 0.47 0.745-0.986S130 4.1 · 106 ± 1.4 · 106 3.89 ± 0.38 0.703-0.999
5 Inlet 6.7 · 106 ± 4.0 · 106 4.13 ± 0.26 0.799-0.956
S130 1.6 · 106 ± 0.6 · 106 3.51 ± 0.16 0.787-0.952
Effluents and filters defined in Tables 1 and 2. Within each effluent section, different letters show significant differences (P < 0.05).
produced by the disc and screen filters working withEffluent 1 and, in particular, Effluent 2, volumes ofparticles with diameters larger than the f ilter poreswere seen. When the sand f ilter was used, no such
result was seen: particles with a diameter of > 45 µmwere not seen in the f iltrate of Effluent 1, nor wereparticles > 450 µm seen in that of Effluent 2.
The screen and disc f ilters only very slightlyattenuated the particle volume distribution of Effluent3 (which was obtained by f iltering Effluent 2 withsand; effective grain size 0.65 mm). Only the filtrateproduced by the 98 µm screen filter showed a largervolume of particles in the 100-200 µm diameter intervalthan that found in the initial effluent. This was alsoobserved when the f iltration eff iciency was studiedwith respect to the particle size distribution.
The 130 µm disc f ilter and 130 µm screen f ilterretained particle volumes from a diameter of 30 µmwhen Effluent 4 was f iltered. This effluent had fewparticles with larger dimensions; the f ilters weretherefore more effective at filtering this effluent thanthe others.
Finally, the 130 µm screen only released a largervolume of particles in the 15-20 µm diameter intervalthan that seen in the original Effluent 5 (data not shown).For the other particle diameters, the volume of filtrate
Effluent particle filtering: filter efficiency 187
Table 4. Means and standard deviations of the f iltration efficiency for TSS, and the number of particles by filter andeffluent
Effluent Filter TSSParticles
ml–1
1 D115 17.7 ± 10.9b 17.6 ± 46.2b
D130 18.5 ± 18.5b 13.3 ± 57.7b
D200 13.7 ± 6.02b 16.7 ± 34.3b
S98 31.6 ± 15.5b 20.6 ± 30.8b
S115 20.7 ± 23.0b 7.56 ± 11.1b
S178 23.1 ± 22.2b 20.2 ± 7.59b
Sand 61.9 ± 11.3a 68.9 ± 8.52a
2 D115 53.7 ± 15.3 38.7 ± 31.6ab
D130 50.9 ± 15.5 35.4 ± 29.6abc
D200 45.5 ± 14.6 8.59 ± 9.83bcd
S98 49.6 ± 20.0 48.4 ± 32.9a
S115 31.8 ± 19.2 19.4 ± 7.70abcd
S178 31.9 ± 17.0 –6.20 ± 21.8d
Sand 49.6 ± 30.0 2.70 ± 42.8cd
3 D115 –7.93 ± 31.7 34.5 ± 26.2a
D130 –4.72 ± 31.7 7.73 ± 22.8b
D200 0.01 ± 2.06 1.49 ± 14.7b
S98 –4.69 ± 10.7 25.5 ± 34.2ab
S115 –1.78 ± 10.2 26.5 ± 27.3ab
S178 –7.48 ± 5.54 25.5 ± 22.5ab
4 D130 24.4 ± 15.5 19.8 ± 28.9S130 27.9 ± 15.6 15.4 ± 29.7
5 S130 –12.4 ± 10.1 12.1 ± 10.4
Effluents and f ilters def ined in Tables 1 and 2. Within each effluent section, different letters show significant differences(P < 0.05).
-100-80-60-40-20
020406080
100
0 25 50 75 100 125 150 175 200 225 250 275 300
DP (µm)
Part
icle
s re
mo
val e
ffic
iency
Effluent 1 Effluent 2 Effluent 3 Effluent 4+
Figure 2. Efficiency of a 130 µm disc filter (D130) at removingdifferent particle sizes (Dp) from effluents.
-100-80-60-40-20
020406080
100
0 25 50 75 100 125 150 175 200 225 250 275 300
DP (µm)
Par
ticle
s re
mo
val e
ffic
iency
Effluent 1 Effluent 2 Effluent 3+
Figure 3. Efficiency of a 115 µm screen filter (S115) at removingdifferent particle sizes (Dp) from effluents.
-100-80-60-40-20
020406080
100
0 25 50 75 100 125 150 175 200 225 250 275 300
Dp (µm)
Part
icle
rem
ova
l eff
icie
ncy
Effluent 1 Effluent 2
Figure 4. Efficiency of sand filter at removing different particlesizes (Dp) from Effluents 1 and 2.
particles was slightly smaller than those obtained withthe other effluents.
Discussion
The mean particle size distribution results obtainedagree with those reported by Ravina et al. (1995), whofound that, in irrigation effluents, 98% of the suspendedsolids was composed of particles with a diameter of< 100 µm. Adin and Elimelech (1989) found that morethan the 90% of the particles of reservoir effluents hada diameter < 10 µm.
The superposition observed in the mean particle sizedistributions was due to particles with a diameter of< 10 µm not usually being retained by the filters (Adinand Elimelech, 1989). In fact, in all the analysed filtratesthere were large numbers of particles of this size.
In all effluents, most of the particles were smallerthan the filter pores, but the filters still became clogged;this was also observed by Adin and Alon (1986). Theparticle size distribution only shows the number of
particles present, it does not take into account thevolume of particles that can clog a filter or emitter.
The greater reduction in the number of particles andTSS achieved by the sand filter (compared to the discand screen filters) when using Effluent 1 agreed withthat reported by Tajrishy et al. (1994). In most of cases,the reductions achieved in TSS with the differenteffluents were not great with the screen and disc filters;this agrees with the results of other authors (Adin andElimelech, 1989; Ravina et al., 1997). Nevertheless,it is surprising that the efficiency of the screen filters(compared to the disc filters) in reducing both the TSSand the number of particles was slightly higher withEffluent 1. Theoretically, disc filters should, of course,retain more solids than screen f ilters. The thickerfiltration cake formed in the screen filters may haveplayed an important role in this. The better perfor-mance of screen filters with some effluents can reduceemitter clogging (Puig-Bargués et al., 2003) .
An increase was seen in suspended solids but not inthe number of particles at the outlet of most of the discand screen filters when using Effluent 3. The greater
188 J. Puig-Bargués et al. / Span J Agric Res (2005) 3(2), 182-191
Par
ticle
vo
lum
e d
istr
ibutio
n f
req
uen
cy (%
)
Par
ticle
vo
lum
e d
istr
ibutio
n f
req
uen
cy (%
)
05
10152025303540
1 10 100 1,000Dp (µm)
Effluent 1 D115 D130 D200S98 S115 S178 Sand filter
05
10152025303540
1 10 100 1,000Dp (µm)
Effluent 2 D115 D130 D200S98 S115 S178 Sand filter
05
1015202530354045
1 10 100 1,000Dp (µm)
Effluent 4 D130 S130
05
10152025303540
1 10 100 1,000Dp (µm)
S98 S115 S178Effluent 3 D115 D130 D200
Figure 5. Mean particle volume distributions of Effluent 1 (a), 2 (b), 3 (c) and 4 (d) before and after filtration with a 115 µm (D115),130 µm (D130) and 200 µm (D200) disc filter, 98 µm (S98), 115 µm (S115) and 178 µm (S178) screen filter, and a sand filter withan effective grain size of 0.65 mm.
a
c d
b
quantities of solids at the filter exits, shown by theirnegative efficiency, were probably due to their detach-ment from the f ilter cake, as observed by Adin andAlon (1986). When biological particles are retained inthe filter and the pressure increases, these particles canbecome deformed and pass through.
Poor agreement was observed between the TSS andparticle removal efficiencies. The explanation mightbe that all the particles were counted to determine theirnumber, but to determine TSS a 2 µm filter was usedto retain the suspended solids. Thus, the small particles—the most numerous— were not taken into accountin the TSS analysis.
Although the particle removal efficiencies describeswhat happens with all the particles together, it isimportant to know whether filters can retain particlesof all diameters. The particle removal eff icienciesvaried for each particle diameter and effluent. Thus,there was no diameter of particle that was specificallyretained by the same f ilter when different effluentswere used. Once hydraulic problems in the filters arediscarded, the negative f ilter eff iciencies seen withEffluent 2 can only be explained by the presence of aweak particle aggregate. If this aggregate were retainedon a disc or screen filter, a soft filtration cake wouldbe formed, unlike that produced by Effluent 1. As headlosses in the filters became higher during the filtrationcycle, the filter inlet pressure would increase and thefiltration cake would break into small particles thatcould pass through the f ilter and later regroup, asindicated by Adin and Alon (1986). Neis and Tiehm(1997) indicate that there are some effluents withparticles that are less resistant to deformation than others,so aggregate breaking may occur often. Tiehm et al.(1999) found that the particle diameter was smaller insecondary effluents than in primary effluents, whichmight explain the poor f iltering performance withEffluent 2. Nevertheless, no such problem was seenwith the other secondary or tertiary effluents (Effluents3, 4 and 5).
The poor performance of the disc and screen filterswith Effluent 2 was determined by analysing their effi-ciency in removing different sized particle, not bystudying their eff iciency in removing all particles.Since the filters retained some of the small particles(the most numerous), the particle removal efficiencywas positive and no information was provided onparticle release.
The results of this study do not agree with those ofArnó (1990), who reported that the screen f ilter to
provide the best performance for filtering sand particleswith a diameter of between 200 and 300 µm was the130 µm filter. For sand particles with a diameter ofbetween 80 and 200 µm, the best were the 80 µm and100 µm screen filters. The results of the present paperwere obtained in f ield conditions and working witheffluents that had inorganic and organic particles; thesemight have more irregular shapes than sand particles,making their retention more difficult.
All the f its of the particle size distributions toequation [1] (Table 3) were significant and showed highregression coefficients. This confirms the validity ofthe model when unimodal particle size distributionsare used; similar findings have been reported by otherauthors (Lawler et al., 1980; Adin and Elimelech, 1989;Alon and Adin, 1994; Kaminski et al., 1997; Van derGraaf et al., 2001).
Kaminski et al. (1997) showed a better f it for thef iltrate than the f ilter influent with respect to thepotential law since the ratio between the entry and exitparticle distribution changed during filtration. How-ever, the results of Table 3 show no better adjustmentsfor the filtrate particle size distribution.
The α coefficients of the effluents and filtrates weresimilar; in fact only the filtrates produced with the 130µm disc filter and the sand filters had different valueswhen Effluent 1 was used. This means that the numberof particles in the sand filter filtrate was smaller thanin the 130 µm disc f iltrate, as shown by the particleremoval eff iciency. For this effluent, no differenceswere seen between the filtrate produced by the sandfilter and that of the other disc and screen filtrates.
The exponent β values for Effluents 1, 2 and 3 werebetween 2.2 and 2.6, clearly lower than those forEffluents 4 and 5 (3.6 and 4.1 respectively). These βvalues are similar to those reported by Lawler et al.(1980) who worked with secondary effluents obtainedfrom a sludge process (between 2.2 and 4.7), and Vander Graaf et al. (2001) (β = 2.75, also with secondaryeffluents). Neis and Tiehm (1997), however, reportedvalues equal to or lower than 1. The higher β valuesfor Effluents 4 and 5 indicate a smaller presence ofparticles with larger diameters.
The fact that the β exponents of the filtrates werenot significantly different from those of the effluentsindicates that the f ilters do not retain the particles.Despite the strong variation, there was only a tendencyfor β to decrease with all filters when Effluent 2 wasused. This shows that there were particles with largediameters present in the f iltrate as a result of the
Effluent particle filtering: filter efficiency 189
aggregation of particles of smaller size (Kaminski etal., 1997; van der Graaf et al., 2001), as mentionedabove for Effluent 2. Nevertheless, the β value increasedfor most of the filtrates of Effluents 1, 3 and 4, showingthat the filters retained the larger diameter particles.
The particle volume distributions showed whetherthe particles larger than the filter pores were presentin the filtrates of Effluents 1, 2 and 3. This gives moreuseful information about the performance of the filtersthan does the particle size distribution alone.
The particle volume distribution was multimodalfor most of the effluents. As reported by Tajrishy et al.(1994), in this multimodal distribution there were twoparticle diameters with the highest particle volumefrequencies. Tajrishy et al. (1994) verif ied that in agranular filtration medium of 0.45 mm effective grainsize, particles of around 40 µm were removed, causingan increase in the 1 µm and 35 µm diameter particlesin the particle size distribution. Although the particlediameter interval considered in the present study waswider, the results obtained with the sand f ilterconfirmed this tendency; with a particle diameter from40 µm upwards, the particle diameter volume decreasedwith respect to the initial effluent. The validity of thisobservation is corroborated by Adin (1999), whoaffirms that, independent of the effective sand grainsize, there is practically no difference in the removalof particles with a diameter 10-60 µm. The removal ofparticles with these diameter intervals is of healthinterest since it could include helminth eggs (diameter20- 80 µm) (Landa et al., 1997).
Acknowledgements
The authors would like to acknowledge the SpanishMinistry of Science and Technology for the f inan-cial support of this work (REN2000-0642/HID andREN2002-00690/HID), and the Consorci de la CostaBrava, Dargisa, Girona WWTP and the Castell-Platjad’Aro WWTP for their assistance.
References
ADIN A., 1987. Clogging in irrigation systems reusing pondeffluents and its prevention. Water Sci Technol 19(12),323-328.
ADIN A., 1999. Particle characteristics: a key factor in effluent treatment and reuse. Water Sci Technol 40(4-5),67-74.
ADIN A., ALON G., 1986. Mechanisms and process para-meters of f ilter screens. J Irrig Drain E-ASCE 112(4),293-304.
ADIN A., ELIMELECH M., 1989. Particle filtration for was-tewater irrigation. J Irrig Drain E-ASCE 115(3), 474-487.
ADIN A., RUBINSTEIN L., ZILBERMAN A., 1989. Parti-cle characterization in wastewater effluents in relation tofiltration and irrigation. Filtr Separat 26, 284-287.
ALON G., ADIN A., 1994. Mathematical modeling of par-ticle size distribution in secondary effluent filtration. Wa-ter Environ Res 66(6), 836-841.
ARNÓ J., 1990. Obturación física en filtros de malla. Com-portamiento hidrodinámico y aplicación a la tecnologíadel riego localizado. Master’s Thesis. Universitat Poli-tècnica de Catalunya, Lleida, 164 pp.
BOLLER M., KOBLER D., KOCH G., 1997. Particle sepa-ration, solids budgets and headloss development in dif-ferent biofilters. Water Sci Technol 36(4), 239-247.
HATUKAI S., BEN-TZUR Y., REBHUN M., 1997. Particlecounts and size distribution in system design for removalof turbidity by granular deep bed f iltration. Water SciTechnol 36(4), 225-230.
KAMINSKI I., VESCAN N., ADIN A., 1997. Particle sizedistribution and wastewater filter performance. Water SciTechnol 36(4), 217-224.
KOBLER D., BOLLER M., 1997. Particle removal in diffe-rent filtration systems for tertiary wastewater treatment -a comparison. Water Sci Technol 36(4), 259-267.
LANDA H., CAPELLA A., JIMÉNEZ B., 1997. Particle si-ze distribution in an effluent from an advanced primarytreatment and its removal during f iltration. Water SciTechnol 36(4), 159-165.
LAWLER D.F., 1997. Particle size distribution in treatmentprocesses: theory and practice. Water Sci Technol 36(4),15-23.
LAWLER D.F., O’MELIA C.R., TOBIASON J.E., 1980. In-tegral water treatment plant design from particle size toplant performance. In: Particulates in water (KavanaughM.C., Leckie J.O., eds). American Chemical Society, Was-hington DC. pp. 353-388.
McDONALD D.R., LAU L.S., WU I.P., GEE H.K., YOUNGS.C.H., 1984. Improved emitter and network system de-sign for wastewater reuse in drip irrigation. Technical Re-port No. 163. Water Resources Research Center, Hono-lulu, Hawaii, 87 pp.
NEIS U., TIEHM A., 1997. Particle size analysis in primaryand secondary waste water effluents. Water Sci Technol36(4), 151-158.
ORON G., SHELEF G., TRUZYNSKI B., 1979. Trickle irri-gation using treated wastewaters. J Irrig Drain Div105(IR2), 175-126.
PUIG-BARGUÉS J., ARBAT G., BARRAGÁN J.,RAMÍREZ DE CARTAGENA F.. 2003. Hydraulic per-formance of drip irrigation subunits using WWTP ef-fluents. Proc. VI Inter-Regional Conference on Environ-ment-Water, Albacete, Spain. September 3-5. pp. 97-98.
RAVINA I., PAZ E., SAGI G., SCHISCHA A., MARCU A.,YECHIELY Z., SOFU Z., LEV Y., 1995. Performance
190 J. Puig-Bargués et al. / Span J Agric Res (2005) 3(2), 182-191
Effluent particle filtering: filter efficiency 191
evaluation of filters and emitters with secondary effluent.Proc. V Intnl Microirrigation Congress, Orlando, Flori-da, April 2-6. pp. 244-249.
RAVINA I., PAZ E., SOFER Z., MARCU A., SCHISCHAA., SAGI G., YECHIALY Z., LEV Y., 1997. Control of clogging in drip irrigation with stored treated municipal effluent. Agric Water Manage 33(2-3), 127-137.
SAS, 1999. SAS/STAT User’s Guide, Version 8. Volumes 1,2 and 3. SAS Institute Inc., Cary, NC, USA, 3848 pp.
TAJRISHY M.A., HILLS D.J., TCHOBANOGLOUS G.,1994. Pretreatment of secondary effluent for drip irriga-tion. J Irrig Drain E-ASCE 120(4), 716-731.
TIEHM A., HERWIG V., NEIS U., 1999. Particle size analy-sis for improved sedimentation and filtration in waste wa-ter treatment. Water Sci Technol 39(8), 99-106.
VAN DER GRAAF J.H.J.M., DE KONING J., TANG J.,2001. Particle size analysis as a tool for performance me-asurements in high rate effluent filtration. Water Sci Tech-nol 43(10), 303-310.